2868 IEICE TRANS. INF. & SYST., VOL.E91–D, NO.12 DECEMBER 2008 PAPER Automatic Tortuosity-Based Retinopathy of Prematurity Screening System Lassada SUKKAEW †a) , Nonmember, Bunyarit UYYANONVARA † , Member, Stanislav S. MAKHANOV † , Sarah BARMAN †† , and Pannet PANGPUTHIPONG ††† , Nonmembers SUMMARY Retinopathy of Prematurity (ROP) is an infant disease characterized by increased dilation and tortuosity of the retinal blood ves- sels. Automatic tortuosity evaluation from retinal digital images is very useful to facilitate an ophthalmologist in the ROP screening and to pre- vent childhood blindness. This paper proposes a method to automatically classify the image into tortuous and non-tortuous. The process imitates ex- pert ophthalmologists’ screening by searching for clearly tortuous vessel segments. First, a skeleton of the retinal blood vessels is extracted from the original infant retinal image using a series of morphological operators. Next, we propose to partition the blood vessels recursively using an adap- tive linear interpolation scheme. Finally, the tortuosity is calculated based on the curvature of the resulting vessel segments. The retinal images are then classified into two classes using segments characterized by the highest tortuosity. For an optimal set of training parameters the prediction is as high as 100%. key words: tortuosity, retinopathy of prematurity, segmentation 1. Introduction Retinopathy of Prematurity (ROP), previously known as retrolental fibroplasia, is a disease of the eye that affects premature infants. When a premature baby is born, the reti- nal blood vessels have not completed their development. In cases of patients with ROP, the blood vessels stop growing and new, abnormal blood vessels grow instead of the normal ones. The most severe complication of this disease is bilat- eral blindness in early childhood. ROP is characterized by an increase of tortuosity and abrupt changes in the growth of blood vessels near the optic disc. It has been estimated that more than 500 infants a year are blinded by retinopathy of prematurity in the U.S. alone [29]. The first step of computer aided detection of the ROP is finding the vessels in the input image. In this paper, math- ematical morphology techniques are chosen because they are efficient and fast [1]. Morphological image processing is in particular useful in extracting image features whose shape is known a priori which is the case for the vascula- ture structures. Morphological processing is also resistant to noise [2]–[7]. Tortuosity evaluation is, however, still an open problem relevant to the clinical perception of the ophthalmologists. Manuscript received January 9, 2008. Manuscript revised July 10, 2008. † The authors are with Sirindhorn International Institute of Technology, Thammasat University, Thailand. †† The author is with Kingston University, United Kingdom. ††† The author is with Mettapracharak Hospital, Thailand. a) E-mail: [email protected] DOI: 10.1093/ietisy/e91–d.12.2868 There exists a variety of methods to measure the tortuos- ity based on calculation of the ratio between the arc length and the chord length [8], [9]. Kylstra et al. [10] measures tortuosity using the relative length variation. His study in- cludes relationships between tortuosity, diameter, and pres- sure that affect the change of the shape of artificial latex vessels. Kaupp et al. [11] proposed to measure the tortuos- ity by using the Fourier analysis. Capowski et al. [12] pro- posed a method of measuring tortuosity by using frequency analysis combined with a detection of changes in the size of the blood vessels. Dougherty and Varro[13] calculated the tortuosity using second derivatives along central axis of the blood vessels. Five new integral estimates of tortuosity have been in- troduced by Smedby et al. [14]. Hart et al. [15] present an- other seven integral estimates of tortuosity based on the cur- vature of the vessels. Bullitt et al. [16] generalized Hart’s estimates to 3D images obtained by means of the MRA for a better accuracy of the tortuosity calculation. Grisan et al. [17] proposed a new method based on partitioning of the blood vessels into segments using turning points, and calcu- lating the tortuosity for each individual segment. However, all the above estimates depend on the curve partition and may not always represent the tortuosity cor- rectly. For example, a circle arc with a large radius is non tortuous although the ratio between arc length and chord length could be very large. We propose a method to measure tortuosity of the ves- sels from retinal images using an adaptive linear interpola- tion procedure characterized by a certain choice of the max- imum allowable interpolation error. The interpolation er- ror controls the number of nodes and the choice of chords involved in the calculation of tortuosity. The interpolation procedure is combined with a tortuosity calculation for a single segment proposed in [17]. 2. Proposed Method This section consists of 5 chapters corresponding to the steps of our algorithm. Section 2.1 deals with vessel skele- ton extraction. Section 2.2 describes how the vessels are partitioned into smaller segments using the maximum al- lowable interpolation error. Section 2.3 explains how a grid search for the best parameters for the partitioning is per- formed. Section 2.4 presents a general formula for tortuosity calculation. Finally, Sect. 2.5 deals with our classification Copyright c 2008 The Institute of Electronics, Information and Communication Engineers

Welcome message from author
This document is posted to help you gain knowledge. Please leave a comment to let me know what you think about it! Share it to your friends and learn new things together.
Transcript

2868IEICE TRANS. INF. & SYST., VOL.E91–D, NO.12 DECEMBER 2008
PAPER
Automatic Tortuosity-Based Retinopathy of Prematurity ScreeningSystem
Lassada SUKKAEW†a), Nonmember, Bunyarit UYYANONVARA†, Member, Stanislav S. MAKHANOV†,Sarah BARMAN††, and Pannet PANGPUTHIPONG†††, Nonmembers
SUMMARY Retinopathy of Prematurity (ROP) is an infant diseasecharacterized by increased dilation and tortuosity of the retinal blood ves-sels. Automatic tortuosity evaluation from retinal digital images is veryuseful to facilitate an ophthalmologist in the ROP screening and to pre-vent childhood blindness. This paper proposes a method to automaticallyclassify the image into tortuous and non-tortuous. The process imitates ex-pert ophthalmologists’ screening by searching for clearly tortuous vesselsegments. First, a skeleton of the retinal blood vessels is extracted fromthe original infant retinal image using a series of morphological operators.Next, we propose to partition the blood vessels recursively using an adap-tive linear interpolation scheme. Finally, the tortuosity is calculated basedon the curvature of the resulting vessel segments. The retinal images arethen classified into two classes using segments characterized by the highesttortuosity. For an optimal set of training parameters the prediction is ashigh as 100%.key words: tortuosity, retinopathy of prematurity, segmentation
1. Introduction
Retinopathy of Prematurity (ROP), previously known asretrolental fibroplasia, is a disease of the eye that affectspremature infants. When a premature baby is born, the reti-nal blood vessels have not completed their development. Incases of patients with ROP, the blood vessels stop growingand new, abnormal blood vessels grow instead of the normalones. The most severe complication of this disease is bilat-eral blindness in early childhood. ROP is characterized byan increase of tortuosity and abrupt changes in the growthof blood vessels near the optic disc. It has been estimatedthat more than 500 infants a year are blinded by retinopathyof prematurity in the U.S. alone [29].
The first step of computer aided detection of the ROPis finding the vessels in the input image. In this paper, math-ematical morphology techniques are chosen because theyare efficient and fast [1]. Morphological image processingis in particular useful in extracting image features whoseshape is known a priori which is the case for the vascula-ture structures. Morphological processing is also resistantto noise [2]–[7].
Tortuosity evaluation is, however, still an open problemrelevant to the clinical perception of the ophthalmologists.
Manuscript received January 9, 2008.Manuscript revised July 10, 2008.†The authors are with Sirindhorn International Institute of
Technology, Thammasat University, Thailand.††The author is with Kingston University, United Kingdom.†††The author is with Mettapracharak Hospital, Thailand.a) E-mail: [email protected]
DOI: 10.1093/ietisy/e91–d.12.2868
There exists a variety of methods to measure the tortuos-ity based on calculation of the ratio between the arc lengthand the chord length [8], [9]. Kylstra et al. [10] measurestortuosity using the relative length variation. His study in-cludes relationships between tortuosity, diameter, and pres-sure that affect the change of the shape of artificial latexvessels. Kaupp et al. [11] proposed to measure the tortuos-ity by using the Fourier analysis. Capowski et al. [12] pro-posed a method of measuring tortuosity by using frequencyanalysis combined with a detection of changes in the size ofthe blood vessels. Dougherty and Varro [13] calculated thetortuosity using second derivatives along central axis of theblood vessels.
Five new integral estimates of tortuosity have been in-troduced by Smedby et al. [14]. Hart et al. [15] present an-other seven integral estimates of tortuosity based on the cur-vature of the vessels. Bullitt et al. [16] generalized Hart’sestimates to 3D images obtained by means of the MRA fora better accuracy of the tortuosity calculation. Grisan etal. [17] proposed a new method based on partitioning of theblood vessels into segments using turning points, and calcu-lating the tortuosity for each individual segment.
However, all the above estimates depend on the curvepartition and may not always represent the tortuosity cor-rectly. For example, a circle arc with a large radius is nontortuous although the ratio between arc length and chordlength could be very large.
We propose a method to measure tortuosity of the ves-sels from retinal images using an adaptive linear interpola-tion procedure characterized by a certain choice of the max-imum allowable interpolation error. The interpolation er-ror controls the number of nodes and the choice of chordsinvolved in the calculation of tortuosity. The interpolationprocedure is combined with a tortuosity calculation for asingle segment proposed in [17].
2. Proposed Method
This section consists of 5 chapters corresponding to thesteps of our algorithm. Section 2.1 deals with vessel skele-ton extraction. Section 2.2 describes how the vessels arepartitioned into smaller segments using the maximum al-lowable interpolation error. Section 2.3 explains how a gridsearch for the best parameters for the partitioning is per-formed. Section 2.4 presents a general formula for tortuositycalculation. Finally, Sect. 2.5 deals with our classification
Copyright c© 2008 The Institute of Electronics, Information and Communication Engineers

SUKKAEW et al.: AUTOMATIC TORTUOSITY-BASED RETINOPATHY OF PREMATURITY SCREENING SYSTEM2869
Fig. 1 (a) The original image, (b) edge detection, (c) Otsu threshold, (d) median axis skeleton,(e) pruning, (f) spurs removal.
Fig. 2 (a) (b) and (c) the original images (d), (e) and (f) the detected vessels skeletons for (a), (b) and(c) respectively.
procedure.
2.1 Extraction of the Vessel Skeleton
Below is a short description of the extraction procedure (seedetails on [1]). The LOG filter [22] is applied to extract theedges from the original, possibly low-contrast retinal image.The results are then thresholded using an optimal thresholdselected by the Otsu algorithm [23]. The edge image is thenskeletonised using the medial axis skeletonisation [24]. It iswell known that skeletonisation often produces short extra-neous spurs. These noises which may occur from the previ-ous step are suppressed by a pruning process [25]. The re-sult is finalized by removing small isolated clusters (islands)of noise using morphological opening. The island removalalgorithm employs erosion followed by dilation [26]–[28].
The algorithm is illustrated in Figs. 1 and 2. The out-put image contains centreline pixels associated with the ex-tracted blood vessels (Fig. 1 (f) and Fig. 2 (d), (e) and (f)).
2.2 Recursive Vessel Partitioning
The curvature of the blood vessel is the most importantparameter that characterizes the tortuosity. However, astraightforward integration of the curvature along the ves-sel is not the best option. This is because on average thecurvature might not be very large, but it can be large alonga certain part of the vessel. Therefore, in this paper, by imi-tating expert ophthalmologists, we understand the tortuosityas high curvature of the blood vessel along a certain seg-ment. However, we do not define the size of this segment inadvance.

2870IEICE TRANS. INF. & SYST., VOL.E91–D, NO.12 DECEMBER 2008
Fig. 3 Evaluation of the curvature by splitting the curve into segments (a) acceptable segment withsmall deviation from the straight line (b) unacceptable segments (c) acceptable segment with higherdeviation from the straight line.
Fig. 4 (a) First step of segmentation, (b) final partition.
In [10] the curve is partitioned into segments using theso called turn points that are the points where the curvaturechanges the sign. As opposed to that, our method is basedon finding a set of chords having approximately the samedeviation from the original curve. We believe that this pro-cedure is close to the way the humans evaluate the curvature.We split the blood vessels into segments using a procedurewhich evaluates the maximum deviation of the curve fromthe straight lines. The proposed partition is based on the in-tuitive understanding that the evaluation of the tortuosity byhumans is based on splitting the curve into segments havingon average the same deviation from the corresponding chordand evaluating the ratio between the length of the chord andthe length of the curve. The chord should not be too close toor too far from the curves (see Fig. 3).
Mathematically it means that each segment S fromblood vessel V is defined using a piecewise linear interpolat-ing function constructed with an adaptive choice of nodes.The nodes are selected using bisection. The first segment isrepresented by the entire blood vessel, that is S = B. It isapproximated by a chord C using the two boundary nodes(see Fig. 3 (a)). The next node is obtained as follows
n0 = arg max |C − S |.In words, the first node is inserted at the point of the
maximum allowable interpolation error of segment S fromchord C. Next, S is split by node n0 into two curves S 1 andS 2. The next node n1 is obtained using the correspondingchords C1 and C2.
n1 = arg max{max |C1 − S 1|,max |C2 − S 2|}.The process runs recursively and it stops when
max |Ci − S i| < T , ∀i, where T is the prescribed thresh-old (maximum interpolation error). Figure 4 illustrates thealgorithm, (a) shows the first step of segmentation and (b)the final partition. Figure 5 displays the partitioned vesselsfrom two different images.
2.3 Grid Search for Maximum Allowable Interpolation Er-ror
We find the best maximum allowable interpolation error bya grid search for T = 6, 10, 15 and 20. In order to train theclassifier we use ground truth expert ophthalmologists withMettapracharuk Hospital in Thailand. We calculate the tor-tuosity for every segment in the image separately and selectfive most tortuous segments as features for classification.The comparison process is explained in detail in Sect. 2.4.The result of the training is T that gives the highest accuracyrate. Two examples of resulting vessel partitioning with dif-ferent maximum allowable interpolation errors are shown inFigs. 6 and 7.
2.4 Tortuosity Calculation
To calculate the tortuosity we use a formula proposed byGaisan [17]
τ(C) =n − 1
length(C)
n∑i=1
[length(S i)length(Ci)
− 1
],

SUKKAEW et al.: AUTOMATIC TORTUOSITY-BASED RETINOPATHY OF PREMATURITY SCREENING SYSTEM2871
Fig. 5 (a) and (b) vessel partitioning from different images.
Fig. 6 Partitioning with varying T .
where i is the segment number and n the total numberthe segments. The tortuosity measure has a dimension of1/length and thus is interpreted as the tortuosity density.
2.5 Classification
In order to classify the retinal images into two classes ofhigh risk and low risk of having ROP, an expert ophthalmol-ogist looks for tortuous sections of vessels on a retina. If
certain segments are found to be tortuous, the expert saysthat this child has a high risk developing ROP.
In this paper we imitate this process by selecting sev-eral most tortuous segments as a set of the classification fea-tures. In order to select tortuous images the following con-dition is used.
m − ασ > τt,
where m is the average tortuosity of the selected images, σ

2872IEICE TRANS. INF. & SYST., VOL.E91–D, NO.12 DECEMBER 2008
Fig. 7 Partitioning with varying T .
Table 1 Classification with T = 10.
is the standard deviation, α is the calibration parameter, andτt the threshold. The above estimate selects images char-acterised by a large average tortuosity and a small standarddeviation.
3. Model Verification
One hundred images (480×460 pixels, 24 bits per pixel, withno compression) were used to test the proposed method.All the images were sent to two expert ophthalmologistsfor the visual classification. The ophthalmologists analyzedeach image as a whole and classified that image as tortuousor non-tortuous based solely on their expertise. If the re-sults from the both experts agreed, they would be used as aground truth in the training and the testing phase. The usualratio 3/7 was used for the testing and training. The training
produced τ′ = 0.25, α = 1 and T = 10.Consider now results of the test classification. Tables 1
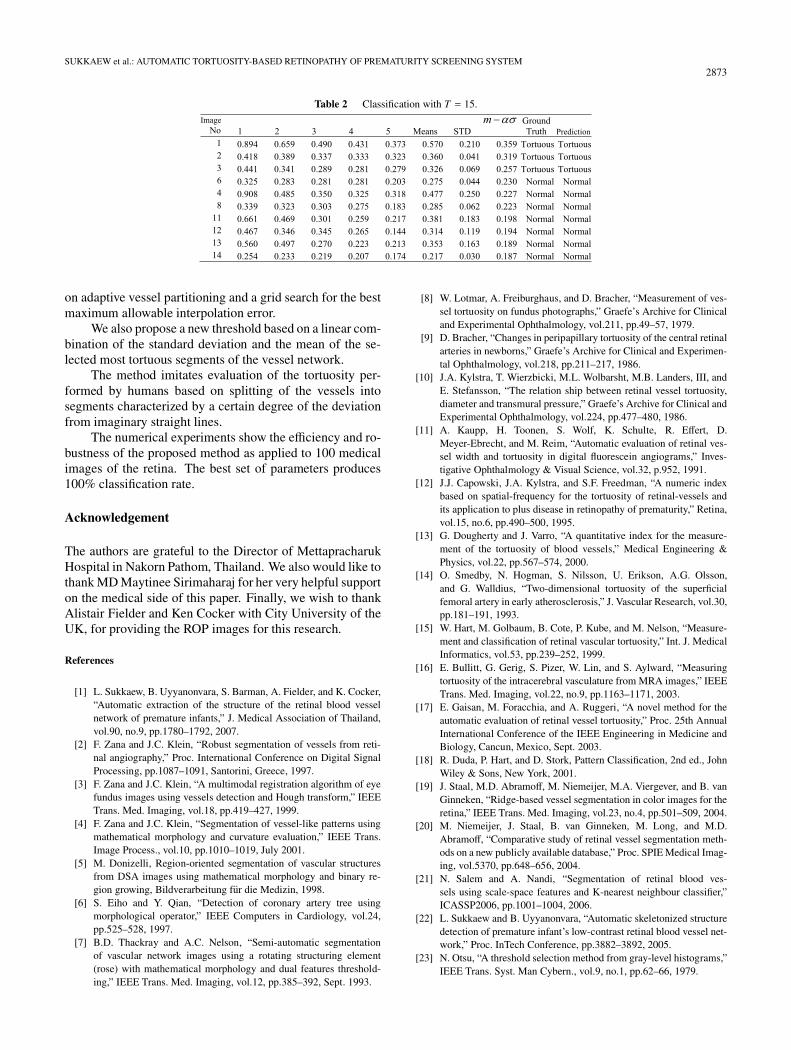
and 2 display the case T = 10 and T 15 respectively.Tables 1 and 2 display characteristics of ten images
with the highest m − ασ. We number the images in the firstTable from 1 to 10 and show the corresponding images inTable 2 with the same numbers. If a new image appears, weassign to it a next consecutive number.
The experiment with 100 images reveals the best Tranging from T = 10 to T = 15. For these values the pre-diction accuracy of 100% is achieved.
4. Conclusion
We present and analyze a simple technique for classificationof the retinal images into tortuous and non tortuous based
SUKKAEW et al.: AUTOMATIC TORTUOSITY-BASED RETINOPATHY OF PREMATURITY SCREENING SYSTEM2873
Table 2 Classification with T = 15.
on adaptive vessel partitioning and a grid search for the bestmaximum allowable interpolation error.
We also propose a new threshold based on a linear com-bination of the standard deviation and the mean of the se-lected most tortuous segments of the vessel network.
The method imitates evaluation of the tortuosity per-formed by humans based on splitting of the vessels intosegments characterized by a certain degree of the deviationfrom imaginary straight lines.
The numerical experiments show the efficiency and ro-bustness of the proposed method as applied to 100 medicalimages of the retina. The best set of parameters produces100% classification rate.
Acknowledgement
The authors are grateful to the Director of MettapracharukHospital in Nakorn Pathom, Thailand. We also would like tothank MD Maytinee Sirimaharaj for her very helpful supporton the medical side of this paper. Finally, we wish to thankAlistair Fielder and Ken Cocker with City University of theUK, for providing the ROP images for this research.
References
[1] L. Sukkaew, B. Uyyanonvara, S. Barman, A. Fielder, and K. Cocker,“Automatic extraction of the structure of the retinal blood vesselnetwork of premature infants,” J. Medical Association of Thailand,vol.90, no.9, pp.1780–1792, 2007.
[2] F. Zana and J.C. Klein, “Robust segmentation of vessels from reti-nal angiography,” Proc. International Conference on Digital SignalProcessing, pp.1087–1091, Santorini, Greece, 1997.
[3] F. Zana and J.C. Klein, “A multimodal registration algorithm of eyefundus images using vessels detection and Hough transform,” IEEETrans. Med. Imaging, vol.18, pp.419–427, 1999.
[4] F. Zana and J.C. Klein, “Segmentation of vessel-like patterns usingmathematical morphology and curvature evaluation,” IEEE Trans.Image Process., vol.10, pp.1010–1019, July 2001.
[5] M. Donizelli, Region-oriented segmentation of vascular structuresfrom DSA images using mathematical morphology and binary re-gion growing, Bildverarbeitung fur die Medizin, 1998.
[6] S. Eiho and Y. Qian, “Detection of coronary artery tree usingmorphological operator,” IEEE Computers in Cardiology, vol.24,pp.525–528, 1997.
[7] B.D. Thackray and A.C. Nelson, “Semi-automatic segmentationof vascular network images using a rotating structuring element(rose) with mathematical morphology and dual features threshold-ing,” IEEE Trans. Med. Imaging, vol.12, pp.385–392, Sept. 1993.
[8] W. Lotmar, A. Freiburghaus, and D. Bracher, “Measurement of ves-sel tortuosity on fundus photographs,” Graefe’s Archive for Clinicaland Experimental Ophthalmology, vol.211, pp.49–57, 1979.
[9] D. Bracher, “Changes in peripapillary tortuosity of the central retinalarteries in newborns,” Graefe’s Archive for Clinical and Experimen-tal Ophthalmology, vol.218, pp.211–217, 1986.
[10] J.A. Kylstra, T. Wierzbicki, M.L. Wolbarsht, M.B. Landers, III, andE. Stefansson, “The relation ship between retinal vessel tortuosity,diameter and transmural pressure,” Graefe’s Archive for Clinical andExperimental Ophthalmology, vol.224, pp.477–480, 1986.
[11] A. Kaupp, H. Toonen, S. Wolf, K. Schulte, R. Effert, D.Meyer-Ebrecht, and M. Reim, “Automatic evaluation of retinal ves-sel width and tortuosity in digital fluorescein angiograms,” Inves-tigative Ophthalmology & Visual Science, vol.32, p.952, 1991.
[12] J.J. Capowski, J.A. Kylstra, and S.F. Freedman, “A numeric indexbased on spatial-frequency for the tortuosity of retinal-vessels andits application to plus disease in retinopathy of prematurity,” Retina,vol.15, no.6, pp.490–500, 1995.
[13] G. Dougherty and J. Varro, “A quantitative index for the measure-ment of the tortuosity of blood vessels,” Medical Engineering &Physics, vol.22, pp.567–574, 2000.
[14] O. Smedby, N. Hogman, S. Nilsson, U. Erikson, A.G. Olsson,and G. Walldius, “Two-dimensional tortuosity of the superficialfemoral artery in early atherosclerosis,” J. Vascular Research, vol.30,pp.181–191, 1993.
[15] W. Hart, M. Golbaum, B. Cote, P. Kube, and M. Nelson, “Measure-ment and classification of retinal vascular tortuosity,” Int. J. MedicalInformatics, vol.53, pp.239–252, 1999.
[16] E. Bullitt, G. Gerig, S. Pizer, W. Lin, and S. Aylward, “Measuringtortuosity of the intracerebral vasculature from MRA images,” IEEETrans. Med. Imaging, vol.22, no.9, pp.1163–1171, 2003.
[17] E. Gaisan, M. Foracchia, and A. Ruggeri, “A novel method for theautomatic evaluation of retinal vessel tortuosity,” Proc. 25th AnnualInternational Conference of the IEEE Engineering in Medicine andBiology, Cancun, Mexico, Sept. 2003.
[18] R. Duda, P. Hart, and D. Stork, Pattern Classification, 2nd ed., JohnWiley & Sons, New York, 2001.
[19] J. Staal, M.D. Abramoff, M. Niemeijer, M.A. Viergever, and B. vanGinneken, “Ridge-based vessel segmentation in color images for theretina,” IEEE Trans. Med. Imaging, vol.23, no.4, pp.501–509, 2004.
[20] M. Niemeijer, J. Staal, B. van Ginneken, M. Long, and M.D.Abramoff, “Comparative study of retinal vessel segmentation meth-ods on a new publicly available database,” Proc. SPIE Medical Imag-ing, vol.5370, pp.648–656, 2004.
[21] N. Salem and A. Nandi, “Segmentation of retinal blood ves-sels using scale-space features and K-nearest neighbour classifier,”ICASSP2006, pp.1001–1004, 2006.
[22] L. Sukkaew and B. Uyyanonvara, “Automatic skeletonized structuredetection of premature infant’s low-contrast retinal blood vessel net-work,” Proc. InTech Conference, pp.3882–3892, 2005.
[23] N. Otsu, “A threshold selection method from gray-level histograms,”IEEE Trans. Syst. Man Cybern., vol.9, no.1, pp.62–66, 1979.

2874IEICE TRANS. INF. & SYST., VOL.E91–D, NO.12 DECEMBER 2008
[24] R. Haralick and L. Shapiro, Computer and Robot Vision, vol.I,pp.233, 348–349, Addison-Wesley Publishing Company, 1992.
[25] R. Gonzalez and R. Woods, Digital Image Processing, pp.540–543,Addison-Wesley Publishing Company, 1993.
[26] R. Jain, R. Kasturi, and B.B. Schunck, Machine Vision, McGrawHill, 1995.
[27] S.E. Umbaugh, Computer Vision and Machine Processing, PHPTR,1998.
[28] J. Serra, Image Analysis and Mathematical Morphology, Academic,London, U.K. 1982.
[29] http://www.nfb.org/images/nfb/Publications/fr/fr5/Issue2/f0502tc.htmlThe National Federation of the Blind Magazine for Parents andTeachers of Blind Children, vol.5, no.2, 1986.
Lassada Sukkaew received the B.B.A de-gree from Rajamangala University of Technol-ogy Thanyaburi, Thailand in 1998, B.Tech de-gree in business information technology fromSukhaothai Thammathirat University Thailandin 2003, and M.Sc. in computer and informa-tion technology from King Mongkut’s Univer-sity of Technology Thonburi, Thailand in 2001.She is currently a Ph.D. student with the Schoolof Information and Computer Technology atSirindhorn International Institute of Technology,
Thammasat University of Thailand. She is also an instructor with Fac-ulty of Business Administration of Rajamangala University of TechnologySrivijaya. Her research interests are medical image processing and imageanalysis.
Bunyarit Uyyanonvara recieved his Ph.D.in Medical Image Analysis from King’s Col-lege, London in 2000 and a B.Sc. of Science (1stClass Honours) from Prince of Songkhla Uni-versity, Thailand. He is now an assistant profes-sor at Sirindhorn International Institute of Tech-nology, Thammasat University, Thailand.
Stanislav S. Makhanov recieved the M.Sc.in Applied Mathematics from Moscow StateUniversity in 1981 and the Dr.Sc. from Com-puting Center of the Russian Academy of Sci-ence in 1988. He is currently Associate Pro-fessor with Sirindhorn International Institute ofTechnology of Thailand (SIIT). He is teachingcourses in Applied Mathematics and ComputerScience. Dr. Makhanov has published about 100research papers and conference proceedings innumerical methods for robotics, image process-
ing and CFD.
Sarah Barman received her Ph.D. in Op-tical Physics from King’s College, London in1996. She obtained an M.Sc. in Applied Op-tics from Imperial College London and a B.Sc.in Physics from Essex University. She is now aSenior Lecturer at the Digital Imaging ResearchCentre in the Faculty of Computing, Informa-tion Systems and Mathematics at Kingston Uni-versity.
Pannet Pangputhipong was born onSeptember 28, 1959 in Bangkok, Thailand. Hefinished medical degree in 1982 at King Chula-longkorn University and Board of Ophthalmol-ogy in 1988 at Rajvithee hospital, Ministry ofPublic Health. He is now working as the Direc-tor of Mettapracharak Hospital and Center forOphthalmology.
Related Documents


![Retinopathy Of Prematurity, Guidelines, Ru[1] Doc](https://static.cupdf.com/doc/110x72/5599c85c1a28abcf6e8b474c/retinopathy-of-prematurity-guidelines-ru1-doc.jpg)

