Welcome message from author
This document is posted to help you gain knowledge. Please leave a comment to let me know what you think about it! Share it to your friends and learn new things together.
Transcript


Authors
Agenzia Italiana del Farmaco Italian Medicines Agency Research & Clinical Trial Unit
Osservatorio nazionale sulla Sperimentazione Clinica dei medicinali (OsSC) National Monitoring Center on Clinical Trials of Drugs
Working Group
Responsible for OsSC’s project: C. Tomino, Head of Research & Clinical Trial Unit – AIFA
Responsible for IT system:
M. De Rosa, Health Care System Department – CINECA
• AIFA, Research & Clinical Trial Unit – Rome
A. Galluccio (OsSC’s Coord.), P. Aita, R. Coppari, S. de Gregori, F. Guglielmi, R. Maione, M. Marchetti, A. Misticoni Consorti, M.E. Russo, L. Scarchilli
• CINECA (Interuniversity Consortium) – Casalecchio di Reno (Bologna)
E. Rinieri (OsSC’s Coord.), G. Contino, E. Fedozzi, L. Pazzi, A. Ramenghi, F. Ronchetti, L. Verri
This Bulletin collects data from 1st January 2004 to 31
st December 2009
and is available on the OsSC’s web site http://oss-sper-clin.agenziafarmaco.it
In reproducing and distributing the contents of the present report, the source must be cited and the integrity of the data maintained.
President: Sergio Pecorelli Director General: Guido Rasi

Bulletin Clinical Trials of Drugs in Italy - 2010
2
Clinical Trials (CTs)
The Bulletin on Clinical Trials of Drugs in Italy analyses the data of the trials registered into the Osservatorio nazionale sulle Sperimentazioni Cliniche dei medicinali – OsSC (National Monitoring Centre on Clinical Trials of Drugs), which have received a favourable opinion by the Ethics Committee of the coordinating site.
Total clinical trials in the period 2000-2009 are 6,787, distributed as follows:
Year CT %
2000 562 8.3
2001 610 9.0
2002 571 8.4
2003 579 8.5
2004 623 9.2
2005 663 9.8
2006 777 11.4
2007 791 11.7
2008 869 12.8
2009 742 10.9
Total 6,787 100.0
The period considered for all following analyses starts on 1st January 2004 (entry into force of the
Legislative Decree 211/2003, transposing European Directive 2001/20/EC into Italian legislation) and ends on 31
st December 2009.
Clinical trials registered in 2004 – 2009 are 4,465.
In 2009 Phase III studies, for the first time, are below 40.0% whilst Phase I and Phase II trials are still growing: in the last year they reached combined 43.5% of the total (Table 1 and Chart 1).
In 2004-2009, 159 Phase I studies were entered into OsSC (3.6% of total clinical trials). They are mainly multicentre and international and sponsored by pharmaceutical companies. Nearly 26% of them (41) are first in human trials (Table 2).
Multicentre trials still represent 80.0% of total clinical trials. Chart 2 shows the distribution of multicentre trials per coordinating country.
Pharmaceuticals companies sponsor 63.5% of Italian clinical trials, whilst the remaining 36.5% is coordinated by no profit entities (Hospitals, Local health units, Universities, etc.) (Table 3).
Oncology is the most investigated therapeutic branch (29.4%), followed by cardiology/vascular diseases (9.6%), neurology (8.9%) and immunology and infectious diseases (8.4%) (Table 4).
In the years 2004-2009, about 260 studies were carried out with “orphan drugs” (as defined in the EC Regulation no. 141/2000), medicinal products that can potentially be of significant benefit to those affected by a “rare disease” (a life-threatening or chronically debilitating disease affecting fewer than 5 per 10,000 people). Their number in OsSC noticeably increased since 2008. They are multicentre, international, Phase II and III clinical trials, for the most part; pharmaceutical companies fund about 80.0% of studies with orphan drugs (Table 10).

Bulletin Clinical Trials of Drugs in Italy - 2010
3
Table 1
Clinical trials per year and phase Total CTs: 4,465
Phase I Phase II Phase III Phase IV Bioeq / Bioav Total Year
CT % CT % CT % CT % CT % CT %
2004 6 1.0 222 35.6 326 52.3 57 9.1 12 1.9 623 100.0
2005 23 3.5 230 34.7 325 49.0 78 11.8 7 1.1 663 100.0
2006 19 2.4 305 39.3 354 45.6 81 10.4 18 2.3 777 100.0
2007 22 2.8 305 38.6 354 44.8 102 12.9 8 1.0 791 100.0
2008 46 5.3 319 36.7 394 45.3 103 11.9 7 0.8 869 100.0
2009 43 5.8 280 37.7 295 39.8 117 15.8 7 0.9 742 100.0
Total 159 3.6 1,661 37.2 2,048 45.9 538 12.0 59 1.3 4,465 100.0
Chart 1
Phase III versus Phase I + II clinical trials
30
40
50
60
2004 2005 2006 2007 2008 2009
%
Phase IIIPhase I + II
Table 2
Phase I - First in human trials per year CTs: 159 out of which 41 (25.8%) First in human
Year First in human
CT % on Phase I
CT (159)
2004 1 16.7
2005 8 34.8
2006 4 21.1
2007 4 18.2
2008 11 23.9
2009 13 30.2
Total 41 25.8

Bulletin Clinical Trials of Drugs in Italy - 2010
4
Chart 2
Multicentre trials per coordinating country
International
Italy coord.
8.1%
National
27.8%
International
other / not spec.
coord.
5.6%
International
USA coord.
19.6%
International
Europe coord.
(except Italy)
38.9%
Table 3
Clinical trials per year and profit / no profit Sponsor Total CTs: 4,465
Profit Sponsors: 360 No profit Sponsors: 211
Profit No profit Total Year
CT % CT % CT %
2004 437 70.1 186 29.9 623 100.0
2005 447 67.4 216 32.6 663 100.0
2006 490 63.1 287 36.9 777 100.0
2007 502 63.5 289 36.5 791 100.0
2008 516 59.4 353 40.6 869 100.0
2009 443 59.7 299 40.3 742 100.0
Total 2,835 63.5 1,630 36.5 4,465 100.0

Bulletin Clinical Trials of Drugs in Italy - 2010
5
Table 4
Clinical trials per therapeutic branch and profit / no profit Sponsor Total CTs: 4,465
Profit No Profit Total Therapeutic branch
CT % CT % CT %
Oncology 729 25.7 585 35.9 1,314 29.4
Cardiology/Vascular diseases 289 10.2 139 8.5 428 9.6
Neurology 280 9.9 116 7.1 396 8.9
Immunology and infectious diseases 276 9.7 100 6.1 376 8.4
Hematology 125 4.4 156 9.6 281 6.3
Endocrinology 175 6.2 57 3.5 232 5.2
Gastroenterology 153 5.4 78 4.8 231 5.2
Respiratory system diseases 150 5.3 34 2.1 184 4.1
Nephrology/Urology 120 4.2 52 3.2 172 3.9
Ophthalmology 72 2.5 52 3.2 124 2.8
Rheumatology 105 3.7 17 1.0 122 2.7
Anesthesiology 16 0.6 85 5.2 101 2.3
Dermatology/Plastic surgery 75 2.6 19 1.2 94 2.1
Musculo-skeletal system diseases 71 2.5 19 1.2 90 2.0
Psychiatry/Psychology 71 2.5 19 1.2 90 2.0
Pediatrics/Neonatology 25 0.9 45 2.8 70 1.6
Gynecology and obstetrics 31 1.1 24 1.5 55 1.2
Genito-urinary system 37 1.3 10 0.6 47 1.1
Traumatology and emergency medicine 13 0.5 10 0.6 23 0.5
Otolaryngology 10 0.4 4 0.2 14 0.3
Pharmacology/Toxicology 8 0.3 5 0.3 13 0.3
Odontology and maxillofacial surgery 4 0.1 4 0.2 8 0.2
Total 2,835 100.0 1,630 100.0 4,465 100.0

Bulletin Clinical Trials of Drugs in Italy - 2010
6
Table 5
Clinical trials per therapeutic classification Total CTs: 4,465 out of which 4,444 (99.5%) with specified ATC of at least one test drug
Therapeutic classification – ATC 1st
level CT % on CT
with spec. ATC (4,444)
L Antineoplastic and immunomodulating agents 1,728 38.9
N Nervous system 521 11.7
J General antiinfectives for systemic use 419 9.4
A Alimentary tract and metabolism 368 8.3
B Blood and blood forming organs 330 7.4
C Cardiovascular system 310 7.0
V Various 257 5.8
H Systemic hormonal preparations, excluding sex hormones 183 4.1
M Musculo-skeletal system 175 3.9
R Respiratory system 149 3.4
G Genito urinary system and sex hormones 105 2.4
S Sensory organs 88 2.0
D Dermatologicals 66 1.5
P Antiparasitic products, insecticides and repellents 10 0.2
The same study can investigate more than one drug in test and therefore can be counted in several ATC classifications.

Bulletin Clinical Trials of Drugs in Italy - 2010
7
Table 6
Clinical trials per profit Sponsors and three-year periods CTs: 2,835
The first 26 out of 360 (7.2%) sponsor 66.2% of clinical trials
Profit Sponsor CT % I period 2004-2006
II period 2007-2009
% II vs I period
1 Novartis 285 10.1 143 142 -0.7
2 Pfizer 207 7.3 103 104 1.0
3 Roche 143 5.0 70 73 4.3
4 GlaxoSmithKline 138 4.9 79 59 -25.3
5 Sanofi-Aventis 117 4.1 64 53 -17.2
6 Bristol Myers Squibb 101 3.6 50 51 2.0
7 Merck Sharp & Dohme 92 3.2 35 57 62.9
8 Lilly 78 2.8 37 41 10.8
9 Boehringer Ingelheim 70 2.5 22 48 118.2
10 AstraZeneca 66 2.3 37 29 -21.6
11 Bayer 65 2.3 24 41 70.8
12 Janssen-Cilag 64 2.3 36 28 -22.2
13 Amgen 61 2.2 32 29 -9.4
14 Schering Plough 51 1.8 25 26 4.0
15 Merck Group 45 1.6 19 26 36.8
16 Abbott Products 40 1.4 18 22 22.2
17 UCB Pharma 37 1.3 20 17 -15.0
18 Astellas 30 1.1 17 13 -23.5
19 Eisai 28 1.0 12 16 33.3
20 Novo Nordisk 26 0.9 11 15 36.4
21 Pierre Fabre 24 0.8 8 16 100.0
22 Sigma-Tau 23 0.8 19 4 -78.9
23 Actelion Pharmaceuticals 22 0.8 13 9 -30.8
24 Servier 22 0.8 13 9 -30.8
25 Bracco 21 0.7 10 11 10.0
26 Chiesi 21 0.7 13 8 -38.5
Sponsors’ names and related clinical trials number take into account companies’ merges, acquisitions and/or incorporations that may have occurred.

Bulletin Clinical Trials of Drugs in Italy - 2010
8
Chart 3
Clinical trials per profit Sponsors and three-year periods - % difference CTs: 2,835
The first 26 out of 360 (7.2%) sponsor 66.2% of clinical trials
-100 -75 -50 -25 0 25 50 75 100 125
Chiesi
Bracco
Servier
Actelion Pharmaceuticals
Sigma-Tau
Pierre Fabre
Novo Nordisk
Eisai
Astellas
UCB Pharma
Abbott Products
Merck Group
Schering Plough
Amgen
Janssen-Cilag
Bayer
AstraZeneca
Boehringer Ingelheim
Lilly
Merck Sharp & Dohme
Bristol Myers Squibb
Sanofi-Aventis
GlaxoSmithKline
Roche
Pfizer
Novartis
% 2nd vs 1st period
(2007-2009 vs 2004-2006)

Bulletin Clinical Trials of Drugs in Italy - 2010
9
Table 7
Clinical trials per no profit Sponsors and three-year periods CTs: 1,630
The first 26 out of 211 (12.3%) sponsor 57.4% of clinical trials
No profit Sponsor CT % I period 2004-2006
II period 2007-2009
% II vs I period
1 AOU Policlinico Gemelli (Rome) 117 7.2 46 71 54.3
2 AOU Policlinico S. Orsola Malpighi (Bologna)
102 6.3 50 52 4.0
3 IRCCS Fondazione S. Raffaele (Milan) 88 5.4 42 46 9.5
4 AOU S. Giovanni Battista (Turin) 71 4.4 36 35 -2.8
5 IRCCS Istituto Europeo Oncologia (Milan) 45 2.8 20 25 25.0
6 AOU Policlinico (Modena) 40 2.5 19 21 10.5
7 IRCCS Istituto Gaslini (Genoa) 39 2.4 19 20 5.3
8 IRCCS Policlinico S. Matteo (Pavia) 39 2.4 13 26 100.0
9 AOU Pisana (Pisa) 36 2.2 5 31 520.0
10 Istituto Mario Negri (Milan) 29 1.8 12 17 41.7
11 AO Ospedali Riuniti (Bergamo) 28 1.7 18 10 -44.4
12 AO of Padua 25 1.5 15 10 -33.3
13 EORTC (Belgium) 25 1.5 16 9 -43.8
14 AO Spedali Civili (Brescia) 24 1.5 6 18 200.0
15 IRCCS Istituto Neurologico Besta (Milan) 24 1.5 10 14 40.0
16 IRCCS Istituto Nazionale cura Tumori (Milan)
24 1.5 10 14 40.0
17 IRCCS Istituti Fisioterapici Ospitalieri (Rome)
22 1.3 13 9 -30.8
18 AOU Senese (Siena) 21 1.3 8 13 62.5
19 IRCCS Fondazione Pascale (Naples) 19 1.2 10 9 -10.0
20 AOU Ospedali Riuniti (Ancona) 18 1.1 11 7 -36.4
21 GIMEMA (Rome) 18 1.1 8 10 25.0
22 Fondazione Neoplasie Sangue (Turin) 17 1.0 4 13 225.0
23 GOIM (Bari) 17 1.0 8 9 12.5
24 AOU S. Luigi Gonzaga (Turin) 16 1.0 11 5 -54.5
25 Federico II University (Naples) 16 1.0 3 13 333.3
26 University of Perugia 16 1.0 7 9 28.6
Sponsors’ names and related clinical trials number take into account companies’ merges, acquisitions and/or incorporations that may have occurred.

Bulletin Clinical Trials of Drugs in Italy - 2010
10
Chart 4
Clinical trials per no profit Sponsors and three-year periods - % difference CTs: 1,630
The first 26 out of 211 (12.3%) sponsor 57.4% of clinical trials
-100 0 100 200 300 400 500 600
University of Perugia
Federico II University (Naples)
AOU S. Luigi Gonzaga (Turin)
GOIM (Bari)
Fondazione Neoplasie Sangue (Turin)
GIMEMA (Rome)
AOU Ospedali Riuniti (Ancona)
IRCCS Fondazione Pascale (Naples)
AOU Senese (Siena)
IRCCS Istituti Fisioterapici Ospitalieri (Rome)
IRCCS Istituto Nazionale cura Tumori (Milan)
IRCCS Istituto Neurologico Besta (Milan)
AO Spedali Civili (Brescia)
EORTC (Belgium)
AO of Padua
AO Ospedali Riuniti (Bergamo)
Istituto Mario Negri (Milan)
AOU Pisana (Pisa)
IRCCS Policlinico S. Matteo (Pavia)
IRCCS Istituto Gaslini (Genoa)
AOU Policlinico (Modena)
IRCCS Istituto Europeo Oncologia (Milan)
AOU S. Giovanni Battista (Turin)
IRCCS Fondazione S. Raffaele (Milan)
AOU Policlinico S. Orsola Malpighi (Bologna)
AOU Policlinico Gemelli (Rome)
% 2nd vs 1st period
(2007-2009 vs 2004-2006)

Bulletin Clinical Trials of Drugs in Italy - 2010
11
Table 8
Clinical trials per involved structure’ Region Total CTs: 4,465
Region CT % on
total CT (4,465)
Health structures
Average CT per health
structure
Coord. CT
% coord. CT/ total
Lombardy 2,672 59.8 145 43 1,373 51.4
Lazio 1,919 43.0 89 38 607 31.6
Emilia-Romagna 1,755 39.3 61 53 603 34.4
Tuscany 1,511 33.8 56 42 444 29.4
Piedmont 1,244 27.9 69 29 284 22.8
Veneto 1,116 25.0 78 21 169 15.1
Liguria 1,032 23.1 71 24 142 13.8
Campania 1,031 23.1 27 47 237 23.0
Sicily 1,003 22.5 71 23 92 9.2
Puglia 766 17.2 61 20 72 9.4
Friuli-Venezia Giulia 721 16.1 23 40 99 13.7
Marche 556 12.5 33 22 75 13.5
Abruzzi 520 11.6 26 24 96 18.5
Umbria 506 11.3 22 27 96 19.0
Sardinia 496 11.1 33 20 32 6.5
Calabria 346 7.7 33 15 6 1.7
Basilicata 174 3.9 10 21 7 4.0
Molise 165 3.7 11 17 24 14.5
Trentino-Alto Adige 133 3.0 15 10 6 4.5
Valle d'Aosta 20 0.4 2 10 0 0.0
Multicentre clinical trials are conducted in more than one health structure and, therefore, the same study is counted in several Regions. The “Health structures” column shows, for each Region, how many health structures participate in clinical trials – considered only once, even if involved in many different studies. Figures in column “Average CT per health structure” represent, for each Region, the average number of trials conducted in every structure, obtained by adding up all studies carried out in a single structure and then dividing by the number of involved structures of the Region itself. The column “Coord. CT” indicates the number of trials for which the coordinating site is located in that Region (the column total equals the national sample size because there is always only one coordinating centre per trial).

Bulletin Clinical Trials of Drugs in Italy - 2010
12
Table 9
Clinical trials per involved structure Total CTs: 4,465
First 25 structures out of 936
Structure CT % on
total CT (4,465)
Coord. CT
% coord. CT/ total
1 A.O. Universitaria Policlinico S. Orsola Malpighi of Bologna
698 15,6 270 38,7
2 IRCCS Fondazione Centro S. Raffaele del Monte Tabor of Milan
642 14,4 277 43,1
3 A.O. Universitaria Policlinico Gemelli of Rome 549 12,3 178 32,4
4 A.O. Universitaria S. Martino of Genoa 521 11,7 85 16,3
5 A.O. Universitaria Careggi of Florence 495 11,1 70 14,1
6 A.O. Universitaria Pisana of Pisa 476 10,7 150 31,5
7 A.O. Universitaria S. Giovanni Battista-Molinette of Turin 473 10,6 138 29,2
8 IRCCS Policlinico S. Matteo of Pavia 471 10,5 120 25,5
9 A.O. of Padua 432 9,7 72 16,7
10 A.O. Universitaria Policlinico of Modena 420 9,4 71 16,9
11 A.O. Universitaria Policlinico Umberto I of Rome 403 9,0 67 16,6
12 A.O. Presidio Spedali Civili of Brescia 385 8,6 65 16,9
13 A.O. Universitaria Consorziale Policlinico of Bari 365 8,2 27 7,4
14 A.O. Ospedale Niguarda Ca' Granda of Milan 357 8,0 52 14,6
15 A.O. Universitaria Federico II of Naples 351 7,9 49 14,0
16 A.O. Ospedali Riuniti of Bergamo 343 7,7 69 20,1
17 A.O. of Perugia 339 7,6 55 16,2
18 A.O. Universitaria S. Maria della Misericordia of Udine 325 7,3 49 15,1
19 A.O. Universitaria S. Luigi Gonzaga of Orbassano (Turin) 274 6,1 65 23,7
20 A.O. Universitaria Senese of Siena 272 6,1 77 28,3
21 IRCCS Istituto Nazionale dei Tumori (INT) of Milan 266 6,0 157 59,0
22 A.O. Universitaria of Parma 258 5,8 40 15,5
23 A.O. S. Camillo - Forlanini of Rome 250 5,6 54 21,6
24 A.O. Arcispedale S. Maria Nuova of Reggio Emilia 247 5,5 28 11,3
25 A.O. Ospedale S. Gerardo of Monza (Monza-Brianza) 246 5,5 42 17,1
Multicentre clinical trials are conducted in more than one health structure and, therefore, the same study can be counted several times in column “CT”. The column “Coord. CT” indicates the number of trials for which the structure itself acts as coordinating site.

Bulletin Clinical Trials of Drugs in Italy - 2010
13
Table 10
Clinical trials with orphan drugs per therapeutic branch CTs: 259
Therapeutic branch CT % cumulative %
Oncology 110 42.5 42.5
Hematology 49 18.9 61.4
Cardiology/Vascular diseases 21 8.1 69.5
Neurology 17 6.6 76.1
Rheumatology 11 4.2 80.3
Endocrinology 11 4.2 84.6
Respiratory system diseases 10 3.9 88.4
Immunology and infectious diseases 8 3.1 91.5
Pediatrics/Neonatology 5 1.9 93.4
Gastroenterology 4 1.5 95.0
Ophthalmology 3 1.2 96.1
Nephrology/Urology 3 1.2 97.3
Musculo-skeletal system diseases 3 1.2 98.5
Dermatology/Plastic surgery 3 1.2 99.6
Gynecology and obstetrics 1 0.4 100.0
Total 259 100.0
Bulletin Clinical Trials of Drugs in Italy - 2010
14
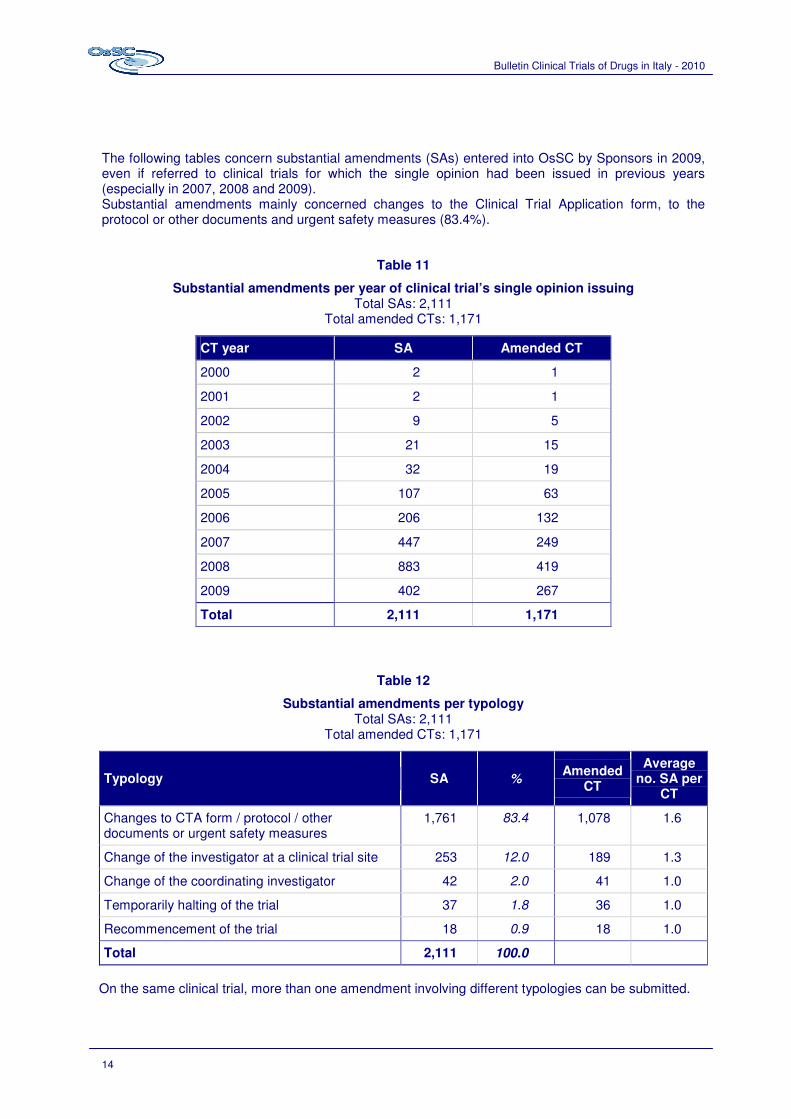
The following tables concern substantial amendments (SAs) entered into OsSC by Sponsors in 2009, even if referred to clinical trials for which the single opinion had been issued in previous years (especially in 2007, 2008 and 2009). Substantial amendments mainly concerned changes to the Clinical Trial Application form, to the protocol or other documents and urgent safety measures (83.4%).
Table 11
Substantial amendments per year of clinical trial’s single opinion issuing Total SAs: 2,111
Total amended CTs: 1,171
CT year SA Amended CT
2000 2 1
2001 2 1
2002 9 5
2003 21 15
2004 32 19
2005 107 63
2006 206 132
2007 447 249
2008 883 419
2009 402 267
Total 2,111 1,171
Table 12
Substantial amendments per typology Total SAs: 2,111
Total amended CTs: 1,171
Typology SA % Amended
CT
Average no. SA per
CT
Changes to CTA form / protocol / other documents or urgent safety measures
1,761 83.4 1,078 1.6
Change of the investigator at a clinical trial site 253 12.0 189 1.3
Change of the coordinating investigator 42 2.0 41 1.0
Temporarily halting of the trial 37 1.8 36 1.0
Recommencement of the trial 18 0.9 18 1.0
Total 2,111 100.0
On the same clinical trial, more than one amendment involving different typologies can be submitted.

Bulletin Clinical Trials of Drugs in Italy - 2010
15
Ethics Committees (ECs)
In 2009, some Regions reorganised their local health system. At present, Ethics Committees operating in Italy are 254 (one every 237,560 inhabitants on average). The Regions with the highest number of Ethics Committees are Lombardy, Lazio, Sicily and Campania.
The OsSC’s data analysis shows that the activity of the Ethics Committees is very intense and concentrated on 60.6% of them. In fact, only 154 gave at least one single opinion (SO) between 2007 and 2009.
An essential parameter used to evaluate the regulatory bodies at an international level is the time: current Italian rules fix precise deadlines for the completion of the assessment procedure. To evaluate this aspect too, the data about the quantity of the opinions given by the Ethics Committees are reported along with the mean period employed to formulate them. Average time taken by Italian Ethics Committees to issue single opinions was 44 days in 2007, 36 days in 2008 and decreased to 26 in 2009.
Table 13
Ethics Committees per Region ECs: 254
Region EC % cumulative %
Lombardy 61 24.0 24.0
Lazio 34 13.4 37.4
Sicily 26 10.2 47.6
Campania 20 7.9 55.5
Puglia 13 5.1 60.6
Tuscany 13 5.1 65.7
Sardinia 11 4.3 70.1
Veneto 11 4.3 74.4
Calabria 10 3.9 78.3
Emilia-Romagna 9 3.5 81.9
Liguria 9 3.5 85.4
Friuli-Venezia Giulia 8 3.1 88.6
Piedmont 7 2.8 91.3
Marche 6 2.4 93.7
Abruzzi 5 2.0 95.7
Basilicata 4 1.6 97.2
Trentino-Alto Adige 3 1.2 98.4
Molise 2 0.8 99.2
Umbria 1 0.4 99.6
Valle d’Aosta 1 0.4 100.0
Total 254 100.0

Bulletin Clinical Trials of Drugs in Italy - 2010
16
Data relating to single opinions issued by the Ethics Committees in the years 2007 – 2009
Total clinical trials evaluated: 2,459 (530 out of which monocentre and 1,929 multicentre) The following cases are excluded from estimation:
- when the date of the application’s receipt by the EC and the EC’s session are the same - when time taken to issue the opinion exceeds 1 year (more than 365 days)
Table 14
Single opinions per outcome and year Total SOs: 2,459
Outcome 2007 2008 2009 Total
Favourable 786 869 742 2,397
Unfavourable 20 16 26 62
Total 806 885 768 2,459
Table 15
Average time taken to issue single opinions per year Total SOs: 2,459 out of which 2,326 (94,6%) issued between 1 and 365 days
Time taken to issue the SO is the difference between the date of the application’s receipt by the EC and the EC’s session during which the final opinion is issued. In case the opinion is suspended, the date of additional information’s receipt (if available) can be considered, instead of the date of the application’s receipt (448 cases out of 2,459).
2007 2008 2009 Total Average time to issue SO (days) Avg
Min- max
Avg Min- max
Avg Min- max
Avg Min- max
Single opinion issuing 44 1-344 36 1-300 26 1-300 36 1-344
on multicentre CTs 41 1-344 34 1-300 26 1-244 34 1-344
on monocentre CTs 55 1-296 44 1-243 25 1-337 41 1-337
The table showing in detail the average time taken to issue the single opinion per Ethics Committee is available on-line in the National Report on Clinical Trials of Drugs in Italy – 2010 (Table 70, in Italian) at the following website address: http://oss-sper-clin.agenziafarmaco.it/dati_pubblicazioni.htm.
Related Documents