ADA 239 398 EFFECT OF THICKNESS AND BRAND OF METAL CERAMIC PORCELAIN ON COLOR AUG*,0; 3*99 AUGO , i- 1 THESIS Presented to the Faculty of The University of Texas Graduate School of Biomedical Sciences at San Antonio in Partial Fulfillment of the Requirements for the Degree of MASTER OF SCIENCE By Douglas Jay Wasson San Antonio, Texas 91-07243 111111 l ill 111 110111 III May, 1991 91 8 07 133

Welcome message from author
This document is posted to help you gain knowledge. Please leave a comment to let me know what you think about it! Share it to your friends and learn new things together.
Transcript

ADA 2 3 9 398
EFFECT OF THICKNESS AND BRAND OF METAL
CERAMIC PORCELAIN ON COLOR
AUG*,0; 3*99
AUGO , i- 1 THESIS
Presented to the Faculty of
The University of Texas Graduate School of Biomedical Sciences
at San Antonio
in Partial Fulfillment
of the Requirements
for the Degree of
MASTER OF SCIENCE
By
Douglas Jay Wasson
San Antonio, Texas 91-07243111111 l ill 111 110111 IIIMay, 1991 91 8 07 133

Form ApprovedREPORT DOCUMENTATION PAGE OMB No. 0704-0188
Public reporting burden for this coliection of information is estimnated to average I hiour per resoonse, including the time for reviewing instruJctions. searching existing diata sources.gathering and maintaining the data needed. and completing and reviewing the collection of information Send comments regrding this burden estimate or any other aspect of tisncollection of information, including suggestion' for reducig this burden. to Washington Headquarters Servic~es, Directorate orinformation Operations and Reports, 121 IeffersonDavis Highway. Suite 1204. Arlington. VA 22202-3 adtthe Ofice ofrvManagement and Budget. Paperwork Rteduction Project (0704.0 188), Washington, DC 20503
1. AGENCY USE ONLY (Leave blank) 2.REPORT DATE (3. REOTTYPE AND DATES COVERED
4. TITLE AND SUBTITLE 5. FUNDING NUMBERSEffect of Thickness and Brand of Metal CeramicPorcelain on Color
6. AUTHOR(S)
Douglas J. Wasson, Captain
7. PERFORMING ORGANIZATION NAME(S) AND ADDRESS(ES) 8. PERFORMING ORGANIZATIONREPORT NUMBER
AFIT Student Attending: University of Texas AFIT/CI/CIA- 91-026
9. SPONSORING/IMONITORING AGENCY NAME(S) AND ADDRESS(ES) 10. SPONSORING /MONITORINGAGENCY REPORT NUMBER
AFIT! CIWright-Patterson AFs OH 45433-6583
11. SUPPLEMENTARY NOTES
1 2a. DISTRIBUTION / AVAILABILITY STATEMENT 12b. DISTRIBUTION CODEApproved for Public Release IAW 190-1Distributed UnlimitedERNEST A. HAYGOOD, 1st Lt, USAFExecutive Officer
13. ABSTRACT (Maximum 200 words)
14. SUBJECT TERMS 15. NUMBE~.?F PAGES
16. PRICE CODE
17. SECURITY CLASSIFICATION 18. SECURITY CLASSIFICATION I19. SECURITY CLASSIFICATION 20. LIMITATION OF ABSTRACT
OF REPORT I OF THIS PAGE OF ABSTRACT
NSN 7540-01-280-5500 Standard Form 298 (Rev 2-89)Pmnscr,b.d by ANSI %to 139-182i '1 t"2
EFFECT OF THICKNESS AND BRAND OFMETAL CERAMIC PORCELAIN ON COLOR
Douglas Jay Wasson
Approved: @
Su ng Professor [I, %
t, .;
Datb.
I !'*,I
Approved:
Dean /
ii
Dedication
To God be the glory through His son Jesus Christ. It is only
by His grace that I draw my next breath.
I wish to dedicate this thesis to my wife, Carmen, and my
children, A.J. and Emily. Their encouragement, patience, prayers,
and sacrifice have made completion of this thesis possible.
iii
Acknowledgements
I would like to thank Dr. Ronald Blackman for serving as my
research committee chairman. His guidance has steered this
investigation.
I would also like to thank Dr. W. Patrick Naylor for many
hours spent patiently providing feedback and guidance. His insight,
editing, statistical interpretation, and thought provoking
questions have proven invaluable.
I am grateful to Dr. Douglas Evans for the encouragement and
aid in color data interpretation.
My appreciation is extended to Dr. Waldemar De Rijk and Dr.
Ramon Baez for serving on my research committee. Their timely
advice kept this investigation moving.
Many thanks to Dr. Terry Yates at the Visual Electrodiagnostic
Laboratory, Brooks AFB, for conducting the color acuity testing.
I am grateful to Dr. Clifford Butzin for his statistical
support and to Dr. Paul David for many hours of demonstration and
advice concerning spreadsheet data manipulation.
In addition, I am grateful to the following individuals and
companies for material support:
Mr. Ron Dudek of Nobelpharma for providing the Microbond porcelain,
Ms. Lisa DiMeglio of Dentsply Inc for supplying the Ceramco II
porcelain, Mr. Ron Dritz of the J.F. Jelenko Co. for supplying the
Jelenko porcelain, and Ms. Marcy Kramer of the J.F. Jelenko Co. for
loaning the Olympia alloy.
iv

EFFECT OF THICKNESS AND BRAND OF METAL
CERAMIC PORCELAIN ON COLOR
Douglas Jay Wasson, M.S.
The University of Texas Graduate School of Biomedical Sciences
at San Antonio
Supervising Professor: Ronald Blackman
An essential aspect of any successful metal ceramic
restoration is to provide an acceptable shade match to adjacent
teeth or restorations. Generally, the dentist will select a shade
from a prefabricated shade guide and write a work order for the lab
to match that shade with the metal ceramic restoration. Two of the
many factors that can affect the ultimate shade of a metal ceramic
restoration are the brand of porcelain and the thickness of dentin
porcelain used in the final restoration.
Some manufacturers claim that new formulations of opaque
porcelains are improved because they are "shade-matched" to the
v

dentin powders to promote a shade match at a decreased porcelain
thickness. These porcelain systems have separate opaque powders for
each shade in contrast to other "non-shade-matched" porcelain
systems that may use the same opaque powder for several shades.
This investigation was designed to examine the effects of
thickness and brand on the shade of dentin porcelain. Two hundred
eighty-eight metal ceramic specimens were made using a custom shade
tab device. Three Vita Lumin shades (A3.5, B1, and C3) of three
commercially available dental porcelains that reportedly use shade-
matched opaques (Microbond, Ceramco II, and Jelenko) and one
commercially available dental porcelain that does not use shade-
matched opaques (Vita VMK 68) were used to make six specimens in
each of four thicknesses (0.3 mm opaque only, and 0.3, 0.6, and 0.9
mm of dentin porcelain).
Y, X and Z tristimulus values were measured using the
HunterLab Colorimeter and converted to CIE L*, a*, and b* color
coordinates for each specimen. Seven observers, who tested normal
for color acuity, made subjective analyses of representative
specimens from each brand-shade-thickness group to rate the level
of shade match to a dentin porcelain shade tab. The following
results and conclusions can be drawn from this investigation:
1. Significant decreases in L* (value) were noted between
thicknesses within most (10/12 or 83%) of the brand-shade
combinations evaluated (p<0.05 ).
2. Only two brand-shade combinations (2/12 or 17%) had few
(Ceramco II shade A3.5) or no (Ceramco II shade C3)
vi

significant changes in L* (value) between thicknesses of
dentin porcelain (p<0.05).
3. Significant differences in a* (red-green) values were
noted between thicknesses depending on brand and shade
(p<0.05).
4. Significant differences in b* (yellow-blue) values were
noted between thicknesses depending on brand and shade
(p<0.05).
5. Based on L*, a*, and b* changes, color constancy with
increasing thickness of dentin porcelain was dependent on
brand and shade. In addition, the porcelain systems that
used shade matched opaques did not exhibit more color
constancy with increasing dentin porcelain thickness.
6. The L*a*b* variability between different thicknesses of
dentin porcelain suggests that manufacturers should
recommend specific dimensions for thickness of dental
porcelain for each shade to achieve adequate shade matching.
7. Subjective observers found that shade-matched opaques
were not more likely to achieve a shade match at thinner
dentin porcelain thicknesses than the system that did not
have shade-matched opaques.
8. For 83% of the brand-shade combinations, the subjective
observers found that 0.3 mm was considered an adequate
thickness of dentin porcelain to achieve a closest match to
the dentin shade tab (for that particular porcelain).
Increased thickness of dentin porcelain will not necessarily
vii

improve and, for at least one brand-shade combination, may impair
shade matching.
viii

Table of Contents
T itle................................
Approval............................ii
Dedication..........................iii
Acknowledgements.......................iv
Abstract............................v
Table of Contents ....................... ix
List of Tables........................xii
List of Figures ....................... xiii
List of Plates........................xiv
I. Introduction.........................1
II. Literature Review.......................7
A. Color Perception.....................7
B. Color Order Scales...................12
C. Color Measurement .................... 16
D. Composition of Metal Ceramic Porcelain ......... 17
E. Factors Affecting Metal Ceramic Porcelain Color . .. 20
F. Summary ........................ 30
III. Materials and Methods...................32
A. Fabrication of the Metal Substructures ......... 33
B. Porcelain Application .................. 34
C. Color Measurement .................... 36
1. Tristimulus Colorimetry ............. 36
2. Subjective Observer Analysis. ........... 37
D. Statistical Analysis..................39
ix

IV. Results .......... ......................... 54
A. L*a*b* Analysis ....... ................... .. 54
1. L* Comparisons Within Brand-Shade Groups . ... 55
2. a* Comparisons Within Brand-Shade Groups .... 55
3. b* Comparisons Within Brand-Shade Groups . ... 56
B. Subjective Observer Analysis .... ........... . 57
1. Interobserver Reliability ... ........... . 57
2. Mean Rank Analysis ..... ............... .. 58
3. Shade A3.5 Mean Rank Analysis Within Brand-
Shade ........ .................... 58
4. Shade B1 Mean Rank Analysis Within Brand-Shade . 59
5. Shade C3 Mean Rank Analysis Within Brand-Shade . 59
6. Mean Rank Analysis Between Brands Within Shade . 59
V. Discussion ......... ........................ . 87
A. L* Comparisons Between Thicknesses Within Brand-
Shade .......... ...................... . 88
1. L* For Shade A3.5 ..... ............... 88
2. L* For Shade B1 ...... ................ 89
3. L* For Shade C3 ...... ................ 89
4. Summary of L* Comparisons ... ........... . 90
B. a* Comparisons Between Thicknesses Within Brand-
Shade ......... ....................... . 91
1. a* Frr Shade A3.5 ..... ............... 91
2. a* For Shade B1 ...... ................ 92
3. a* For Shade C3 ...... ................ 92
4. Summary of a* Comparison .... ............ . 93
x

C. b* Comparisons Between Thickness Within Brand-Shade 94
1. b* For Shade A3.5.................94
2. b* For Shade B..................95
3. b* For Shade C3 ................ 9
4. Summary of b* Comparisons.............96
D. Summary of L*, a*, and b* observations.........96
E. Subjective Observer Rating...............99
1. Subjective Observer Rating of Shade A3.5 . . . 102
2. Subjective observer Rating of Shade Bi . . . 103
3. Subjective Observer Rating for Shade C3 . . . 105
4. Summary of Subjective Observer Rating ...... 106
VI. SUMMARY..........................109
LITERATURE CITED.......................112
Appendix A..........................117
Appendix B..........................118
Appendix C..........................119
AppendixD..........................124
Vita.............................127
xi

List of Tables
Page
Table 1. Mean (Standard Deviation) L*a*b* valuesfor Microbond ..................................... 61
Table 2. Mean (Standard Deviation) L*a*b* valuesfor Ceramco II .................................... 62
Table 3. Mean (Standard Deviation) L*a*b* valuesfor Jelenko ....................................... 63
Table 4. Mean (Standard Deviation) L*a*b* valuesfor Vita VMK 68 ................................... 64
Table 5. Summary Table for Three-Factor Analysis ofVariance of L* .................................... 65
Table 6. Summary Table for Three-Factor Analysis ofVariance of a* .................................... 66
Table 7. Summary Table for Three-Factor Analysis ofVariance of b* .................................... 67
Table 8. Tukey's Studentized Range Test For L* ........... 68
Table 9. Tukey's Studentized Range Test For a* ........... 69
Table 10. Tukey's Studentized Range Test For b* ........... 70
Table 11. Interobserver Reliability by AlphaCoefficient Analysis ............................. 80
Table 12. Summary of Kruskal-Wallis One-Way Analysisof Variance for Thickness ........................ 81
Table 13. Results of Mann-Whitney Rank Sum TestBetween Thickness Within Brands for A3.5 ........ 82
Table 14. Results of Mann-Whitney Rank Sum TestBetween Thickness Within Brands for B1 .......... 83
Table 15. Results of Mann-Whitney Rank Sum TestBetween Thickness Within Brands for C3 .......... 84
Table 16. Summary of Kruskal-Wallis One-Way Analysisof Variance for Brand ........................... 85
Table 17. Results of Mann-Whitney Rank Sum TestBetween Brands Within Shades ..................... 86
xii

List of Figures
Page
Figure 1. Mean L* for shade A3.5 with increasingdentin porcelain thickness ....................... 71
Figure 2. Mean L* for shade Bi with increasingdentin porcelain thickness ....................... 72
Figure 3. Mean L* for shade C3 with increasingdentin porcelain thickness ....................... 73
Figure 4. Mean a* for shade A3.5 with increasingdentin porcelain thickness ....................... 74
Figure 5. Mean a* for shade B1 with increasingdentin porcelain thickness ....................... 75
Figure 6. Mean a* for shade C3 with increasingdentin porcelain thickness ....................... 76
Figure 7. Mean b* for shade A3.5 with increasingdentin porcelain thickness ....................... 77
Figure 8. Mean b* for shade B1 with increasingdentin porcelain thickness ....................... 78
Figure 9. Mean b* for shade C3 with increasingdentin porcelain thickness ...................... 79
xiii

List of Plates
Page
Plate 1. Acetate plastic patterns connected to plasticsprue formers, runner bar, and crucible former... 40
Plate 2. Representative example of metal substructurecastings just prior to removal from the runnerbar ............................................... 41
Plate 3. Specimen numbers inscribed on the handle foridentification ..................................... 42
Plate 4. Four depressions on the undersurface of themetal substructures served as thicknessmeasurement indices ............................... 43
Plate 5. Angled notch on sprue of metal substructureto aid engagement of ligature wire used tohold the specimen in the custom shadetab device ........................................ 44
Plate 6. Representative examples of metal substructuresoxidized in groups of six ......................... 45
Plate 7. Hole placed through center of the custom shadetab device to accommodate ligature wire and thehandle of the specimen ............................ 46
Plate 8. Measurement scale on the side of the Belle deSt. Claire custom shade tab device ............... 47
Plate 9. Ligature wire used to hold the metalsubstructures securely in the custom shade tabdevice. The other end of the ligature wire waswrapped around the investigator's ring finger.... 48
Plate 10. Porcelain placed in the custom shade tab devicewith No. 4 porcelain brush ........................ 49
Plate 11. Porcelain surface smoothed with a dry,
sable brush ....................................... 50
Plate 12. Dial caliper used to measure specimen thickness.. 51
Plate 13. HunterLab Colorimeter D25A-2 Optical Geometry .... 52
Plate 14. Specimens mounted in random arrangementon a neutral gray panel for subjectiveobserver analysis ................................. 53
xiv
I. Introduction
One function of a metal ceramic restoration is that it mimic
the appearance of a natural tooth. That appearance is partially
determined by how light interacts with tooth structure. Some of
this light may actually be transmitted through the various layers
of natural tooth structure (enamel, dentin, and pulp) and not be
reflected back to the observer. In contrast, a metal ceramic
restoration does not permit this complete transmission, because the
underlying metal substructure blocks the passage of light
(Yamamoto, 1985). These differences in light interaction between
a natural tooth and a metal ceramic restoration pose a challenge
to laboratory technicians and clinicians when attempting to create
a natural appearing restoration.
Generally, as light strikes a multilayered object, such as a
natural tooth or a metal ceramic restoration, it can behave in many
different ways. Consequently, it is important to understand the
many terms used to describe light behavior such as: incident light,
reflected light (both specular and diffuse), refraction, and
transmission (both regular and diffuse).
For example, incident light is the light from an external
source, such as sunlight or an incandescent light bulb, that
strikes an object (Yamamoto, 1985). Reflected light is light that
is turned back from the surface of an object. When the angle of
incidence is equal to the angle of reflection of light, as in a
2
mirror, that type of reflection is referred to as specular
reflection (McLean, 1979). However, when that light is scattered at
a variety of angles and in different directions, as from a rough or
matte surface, that type of reflection is described as diffuse
reflection (McLean, 1979).
Refraction, on the other hand, is -Ae change in direction of
light waves as they pass into and out of an object. When light
passes from a vacuum into a material with more density, its
velocity is decreased. The ratio between these velocities is called
the index of refraction. As the wavelength of the light increases,
the index of refraction normally decreases (McLean, 1979).
Transmitted light is the light that passes completely through
an object. This effect is generally manifested in two different
forms: regular and diffuse transmission. Regular light transmission
can only occur if an object is transparent and the light passes
through the object (Clarke, 1982). Diffuse transmission occurs when
light is scattered within an object while allowing a proportion of
this light to pass through the object (Clarke, 1982).
Metal ceramic porcelain can be considered a transparent mass
containing small particles with dissimilar refractive indices.
Light scattering is the combination of reflection and refraction of
light as it passes through such a heterogenous mass. The greatest
light scattering occurs when the refractive indices of the
transparent mass and the small particles (metallic oxides and
grains of differing composition) are most different. Scattering is
also depen(.ent on particle size. Maximum scattering occurs when the

3
particle size is the same as the wavelength magnitude (McLean,
1979).
Opaque porcelain on a metal substructure contains metallic
oxides with a high refractive index that can limit the transmission
of light to the underlying metal surface (Preston, 1988). Any
incident light that reaches this highly reflective opaque porcelain
is generally directed back toward the observer. This high
reflection is undesirable in metal ceramic restorations because
natural teeth allow more light transmission and seldom produce
areas of such high reflectivity (McLean, 1979). In addition, if
the shade of the opaque porcelain does not match the desired dentin
shade, the reflected light may adversely affect the overall
perceived shade of the final restoration.
Since the inception of metal ceramic restorations in the late
1950s, five solutions have been proposed in an effort to resolve
this problem.
First, dental porcelain manufacturers opted to make the low-
fusing dentin porcelain for metal ceramic restorations more opaque,
in contrast to more translucent porcelains used for making all
ceramic crowns. The intent was to reduce the direct reflection from
the highly reflective opaqued metal substructure. It was thought
that if the dentin porcelain were made more opaque and diffused
more light, then the amount of light that actually reached the
opaque porcelain layer would be decreased (Yamamoto, 1985).
Furthermore, any light that reached this opaque layer must again be
diffused through this same layer of dentin porcelain when reflected

4
back. The end result of this diffusion being that less light would
actually reach the observer.
Second, an alternative approach has been to simply increase the
thickness of dentin porcelain overlying the opaque layer (Chiche
and Penault, 1988). The influence of direct reflection from the
opaque porcelain layer decreases as the translucency of dentin
porcelain decreases and its thickness increases (Yamamoto, 1985;
Seghi, Johnston and O'Brien, 1986). However, to reduce the
detrimental effects from the highly reflective opaque porcelain
layer and to provide optimum esthetics, this minimum thickness of
dentin porcelain is believed to require 1.3 to 1.5 millimeters of
tooth reduction (McLean, 1980; Yamamoto, 1985; Dykema, Goodacre,
and Phillips, 1986).
Unfortunately the facial thickness of dentin porcelain is often
limited at the cervical margin as well as at the junction of the
incisal and middle one-thirds. Attempts to obtain an adequate
thickness of dentin porcelain in these two areas often results in
an overcontoured restoration that invariably violates the
principles of proper form and contributes to periodontal pathology
(McLean, 1979; Yamamoto, 1985; Sorensen and Torres, 1988).
Third, modification of the opaque layer has also been suggested
as a method to decrease the adverse effects of this highly
reflective surface (Yamamoto, 1985; Sorensen and Torres, 1988;
Chiche and Pinault, 1988). Opaque modifiers can be used in an
effort to more closely match the desired shade in the cervical and
incisal areas when insufficient thickness of dentin porcelain is

5
available (Sorensen and Torres, 1988).
Fourth, modifications of the dentin porcelain, further
decreasing the translucency of this layer, have been proposed as
another alternative. This technique requires the use of a special
porcelain, opacous or opacious dentin, that has greater opacity and
chroma and reflects more light than conventional dentin porcelain.
The opacous dentins can be blended with conventional dentin
porcelains according to the degree of translucency desired to
achieve a shade match (Sorensen and Torres, 1988). Unfortunately,
decreasing the translucency of the dentin porcelain can result in
a less than natural appearing final restoration.
Finally, the summary of recommendations from a workshop on
color ordering systems in dentistry, held in November of 1984,
contained a fifth possible solution to this problem. That solution
was found in the conference conclusions: "In the case of dental
porcelain itself, opaque dental porcelains should support body
porcelains such that the resultant color is independent of
thickness" (Miller, 1988). Other researchers have indicated that
opaque porcelain with the same shade as the dentin porcelain (at
its optical infinite thickness) will eliminate the effect of
variations in dentin porcelain thickness on the overall color
(O'Brien, 1985; Jacobs et al, 1987). Some porcelain manufacturers
have changed their formulations to match an opaque for each
corresponding dentin porcelain (O'Brien, 1985; Farah and Powers,
1985). Unfortunately, no comprehensive investigations have been
conducted to date to evaluate the efficacy of these reformulated

6
metal ceramic porcelain systems with reportedly matched opaque and
dentin shades.
7
II. Literature Review
A. Color Perception
In 1985 Swepston and Miller outlined a series of factors
involved in selecting a shade and fabricating a matching metal
ceramic restoration. Color perception actually consists of four
basic components; a stimulus (light), an object (reflection of
light), a receptor (human eye), and an interpreter (human brain).
These four factors are discussed at length in other sources
(Hurvich, 1981; Preston, 1982; Yamamoto, 1985) but merit a brief
discussion.
Light serves as the stimulus for color perception. The
wavelengths in the visible electromagnetic spectrum fall between
approximately 400 and 700 nanometers (nm) (Hurvich, 1981).
Sunlight, tungsten lamps, and fluorescent lamps are three common
light sources. Each source emits a specific combination of
wavelengths at variable energy levels. For example, blue sky light
contains a greater proportion of shorter wavelength components
while the light from a tungsten lamp is composed of a greater
proportion of longer wavelength components, or red light (Yamamoto,
1985). Most objects are not themselves sources of light but, when
viewed, reflect light from another source. Consequently, the
spectrum specific energy of the light source will partially
determine the nature of the light that is actually reflected from
objects. Furthermore, objects of different composition may have the
8
same appearance when viewed under one light source but have a
different appearance when viewed under an alternate light source.
This phenomenon is referred to as metamerism.
When light impinges upon a tooth it interacts with all layers
of tooth structure. Some light is reflected from tue surface of
the enamel. So a rough enamel surface will create diffuse
reflection while a smooth enamel surface will produce relatively
more specular reflection (Muia, 1982). Or a portion of the light
may pass from the facial to the lingual surface of the tooth. The
light that is transmitted may have an altered path (diffuse
transmission) or travel through the tooth at a refracted angle
(direct transmission). Where translucent enamel constitutes the
total buccal-lingual width of the tooth, such as in the
interproximal and incisal regions, very little light is reflected
back to an observer. This light is, in fact, directly transmitted
and lost to the oral cavity. In the process, areas of the tooth
that permit this light transmission appear blue, violet or gray
because of the lack of light stimulus reflecting toward the
observer (McLean, 1980). The net result is a variety of visual
range electromagnetic stimuli reflected from the tooth toward the
receptor, the human eye.
The lens structure of the eye serves to focus light stimulus to
the back wall of the eye on the retina. The retina contains a
network of neural cells that respond to light stimulus by producing
an electrical impulse. The receptor cells responsible for color
perception are called cones. Early color mixture studies indicated

9
that three different types of photosensitive materials are
necessary to provide color vision (Judd, 1966). There are now data
from microspectrodensitometry that establish the existence of three
cone photopigments with absorbance peaks at approximately 450 nm,
530 nm, and 560 nm (Hurvich, 1981). These photopigments have been
designated a450, fl530, and y560 (Hurvich, 1981). Light of a given
wavelength can be absorbed by each photopigment in variable
proportions. It is depletion of these photopigments that accounts
for color fatigue after prolonged v'ewing of a colored object. This
phenomenon decreases the viewer's sensitivity to certain colors and
is the basis for the recommendation to use short glances (5 seconds
or less) during shade selection to avoid color fatigue (McLean,
1979).
Other factors in the eye that influence spectral stimulus
reception have been outlined by Hurvich (1981). For example, the
lens is not perfectly transparent to all wavelengths of light. So
450 nm wavelength light is transmitted through the lens only one-
half as much as light of wavelength of 650 nm. Also, as people
age, lenses yellow and transmit less of the short wavelength light.
Finally, an inert yellow material, the Macula pigment, diffusely
covers an area of the retina housing the largest density of cones.
The Macula pigment absorbs more of the short wavelength spectral
light than mid and long wavelength light. The amount and
distribution of this pigment will affect spectral color matching.
Because the Macula pigment varies in amount from one individual to
the next, it accounts for a large source of the interobserver
10
variability in making such color matches.
The light stimulus impacts upon the receptor cells of the
retina, alters the photopigments, and results in nerve
depolarization. This depolarization travels down a pathway through
the retina from the receptor (rods or cones) to the bipolar cells
and eventually to the ganglion cells which form the optic nerve
(Hurvich, 1981). The optic nerves pass through the optic chiasm to
the lateral geniculate bodies where optic fibers terminate. Cells
of the geniculate bodies give rise to fibers which form the optic
radiation to the cortex of the occipital lobes (Clark, 1975).
Unfortunately much is still unknown about how the light stimulus
finally results in perception or consciousness of color in the
cortex of the interpreter's brain. Daw (1987) contends that there
are at least 7 levels known in the processing of color vision from
receptor to cerebral cortex.
The history of the early development of color vision theories
has been summarized by Hurvich (1981) and Zrenner (1983). The early
concepts of color vision can be grouped as either the trichromatic
vision theory or the color opponent theory (Zrenner, 1983). The
trichromatic theory held that the fibers in the optic nerve
responded maximally to three different regions in the spectrum;
red, yellow/green, and blue/violet. As early as 1867 von Helmholtz
wrote that three types of photochemically decomposable substances
are in the end organs of the fibers of the optic nerve each having
a different sensitivity for the different parts of the spectrum
(Zrenner, 1983). Subsequent work with this theory led to modern

11
colorimetry (Zrenner, 1983).
Zrenner (1983) indicated that Hering proposed the opponent
color theory in 1878. Hering theorized that there are six basic
sensations recurring in opponent pairs, red/green, blue/yellow, and
black/white. The opponent color theory would predict the existence
of on-red off-green, off-red on-green, on-yellow off-blue, and off-
yellow on-blue opponent color cells. Present data support the
existence of these cells (Daw, 1987).
As early as 1882, von Kries suggested that both color theories
might have validity. Vision could be trichromatic at the receptor
level while opponent processes occur in the postreceptoral neural
pathways (Zrenner, 1983). Evidence from colorimetric data and
electrophysiological studies of the retina support this integration
of both theories. Absorption of light stimulus in each of the
three photopigments excite the white/black neural system. In
addition, the a450 and y560 excite red in common and the fl530 and
y560 excite yellow in common (Hurvich, 1981). Receptors converge
onto opponent color cells and opponent color cells converge at
higher levels onto double opponent cells. These opponent color
cells have an excitatory input from one type of receptor and an
inhibitory input from another (Daw, 1987).
Another important factor in color perception is the
organization of receptors and their subsequent pathways into
receptive fields. These receptive fields are concentrically
organized cell by cell, on an opponent color basis (Davson, 1980).
The organization of receptive fields is responsible for allowing

12
clear delineation of sharp edges and contours at the cognitive
level (Hurvich, 1981).
In summary, all of the details of human color perception are
not known at this time. The stimulus from the visible
electromagnetic spectrum that is reflected off of an object reaches
the retina of the eye where it impinges on the trichromatic cone
receptors. Action potentials are generated that can both inhibit
and excite a complex neuronal network that culminates as perceived
color at the conscious level.
B. Color Order Scales
In 1931 Clark introduced the application of the Munsell Color
Order System for the description of color in dentistry. Clark
reviewed the three dimensions of color as outlined by Munsell; hue,
brilliance and saturation (Clark, 1931 and 1933; Munsell, 1961).
Hue being that dimension that permits colors to be classified as
reddish, yellowish, greenish or bluish, etc. Brilliance was
defined as the range from darkest (black) to lightest (white) and
has also been called value, brightness, or luminance. Saturation
indicates the strength of the hue as seen in the color that Clark
termed chroma. Neutral gray being zero in the saturation scale,
and the spectrum furnishes a maximum saturation for all hues
(Clark, 1933).
Munsell arranged the attributes of hue, brilliance, and

13
saturation in three dimensional color space with equal steps from
one color to another. In this way, a color could be numerically
defined and the distance in color space between two colors could be
measured. Hunter (1975) outlined the development of as many as 30
color ordering systems. He stated that the development of these
systems had paralleled the formulation of color vision theories.
Another color system of great importance is the C I E
(Commission Internationale de L'Eclairage) standard observer
system. The first major recommendations regarding colorimetric
standards were made by the CIE in 1931 and these formed the basis
of modern colorimetry (Publication CIE No. 15, 1971). The CIE is
a psychophysical system incorporating a standard observer and
coordinate system (Lemire and Burk, 1975). The standard observer
is a mathematical description of the average normal human visual
response to color stimulation based on experiments by W. D. Wright
in 1928 and J. Guild in 1931 (Hunter, 1975). The CIE system also
includes standard illuminants A, B, C, D 5, D65, and D with
specified spectral distribution curves (Clarke, 1982). As more
accurate information has become available, the CIE standards have
been periodically updated (Publication CIE No. 15, 1971).
The basic CIE concept is that colors can be matched by some
mixture of three light primaries; red (X), green (Y), and blue (Z)
(Lemire and Burke, 1975). These X, Y, Z data are called
tristimulus values. Luminance or value is included in only one of
the tristimulus values, Y, and not in either the X or Z quantities.
Furthermore, all of the tristimulus values are linear

14
transformations of the spectral absorption curves of three cone
pigments found in the retina (Clarke, 1982).
One problem with application of the tristimulus X, Y, Z system
to surface color evaluation in industry is the subjective
nonuniformity of the color space (Hunter, 1975). In response to
this problem CIE developed the L* a* b* system based on nonlinear
transformations of the X, Y, Z system (Clarke, 1982). Luminance
(value) is designated by L* values. The a* represents the red-
green axis with negative values indicating green and positive
values indicating red. The b* represents the blue-yellow axis with
negative values indicating blue and positive values indicating
yellow. This CIE L* a* b* system is widely used in science and
industry to express color differences. The distance between any
two colors in this color space (AE) is defined by the following
equation (Hunter, 1975):
AE- (AL*)2 + (Aa*) 2+ (Ab*) 2
Hunter (1975) stated that color differences, as defined by this
equation, are not reliably correlated with visual estimates of
color difference.
Hunter (1975) also outlined three factors proposed by L.F.C.
Friele that would explain why these tristimulus color differences
fail to consistently correlate to visual color estimates. The
first factor was that the magnitude of color difference is more
properly related to the component of the particular difference that
is greatest. Similarly, Preston (1982) pointed out that because

15
the human observer is very sensitive to slight differences in
value, a small change in value could be perceived as equal to a
larger change in hue. The second factor that Friele proposed was
that threshold discrimination differences correspond to minimum
detectable signal-to-noise ratios in the neural signaling system
while estimates of easily seen differences correspond more closely
to the actual signal increments. Basically, small changes in color
are detected less effectively, because they may be confused with
baseline stimuli. The third factor was that the numerical
tristimulus values may be correctly integrated with reception
spectral responses but fail to be valid measurements of post
receptor neural signals. For these reasons many investigators have
evaluated color differences by both subjective observers and
tristimulus colorimeter readings.
An evaluation by Kuehni and Marcus (1979) attempted to
correlate color difference formulas including the CIE L*a*b* (AE)
system with the subjective observer's perception. Observers were
asked to rate colored samples as either an acceptable or not
acceptable color match with a standard. The average total AE for
50% acceptibility was approximately one unit. Of the four color
difference formulas evaluated, each produced the highest
correlation with subjective observers for at least one of the six
sample sets. The authors concluded that additional visual small
color difference data are needed to develop a new formula that
consistently correlates to human visual perception.
Johnston and Kao (1989) compared a United States Public Health

16
Service visual ranking scale used by subjective observers to the
CIE L*a*b* AE formula. The average color difference between
compared teeth rated as a match was 3.7 units. Thus, significant
differences exist in CIE L*a*b* color space that apparently are not
discernible to subjective observers.
The arguments proposed by L.F.C. Friele and the studies by
Kuehni and Marcus (1979) and Johnston and Kao (1989) pointed out
that no direct numerical correlations existed between small color
differvnce formulas and the human perceptual experience.
C. Color Measurement
Two basic types of color measuring instruments are the
spectrophotometer and the tristimulus colorimeter.
Spectrophotometers measure reflectance or transmittance factors one
wavelength at a time while tristimulus colorimeters measure
reflectance or transmittance of three broad wavelengths that are
roughly equivalent to the red, green, and blue response of retina
cone receptors (Hunter, 1975).
Goodkind et al. (1985) compared the ability of a tristimulus
colorimeter and a recording spectrophotometer to predict the
closest color match by subjective observers for 100 extracted human
teeth. Neither instrument was shown to agree significantly more
closely with human observation. Hunter (1975) concluded that
tristimulus colorimeters will give precision in color measurements
of the same order of magnitude as a recording spectrophotometer.
17
In addition, Hunter stated that tristimulus colorimeters and
ref lectometers could provide more precise and less expensive means
for the intercomparisons of small color differences. As early as
1967, Judd and Wyszecki concluded that near white vitreous enamel
specimens could be measured accurately with the Hunter colorimeter.
Other variables controlled by CIE standards are the
illuminating and viewing conditions of the measuring instrument
(Publication CIE No. 15, 1971). The light striking an object may
vary from 00 (normal incidence) to 900 (grazing incidence) or may
strike the object in a diffuse manner from many directions at once
(Clarke, 1982). The four geometries recommended by CIE are: 00
illumination with diffuse reflectance viewing, diffuse illumination
with 00 viewing, 00 illumination with 450 viewing, and 450
illumination with 00 viewing.
Seghi (1990) evaluated the effects of different measuring
geometries on the colorimetric assessments of dental porcelain.
His results indicated that although the values obtained on the
bidirectional instruments were not the same as those obtained on
the diffuse-type reference instruments, the relative values
obtained between the instruments remained consistent. A high
degree of correlation existed between color difference measurements
regardless of the design of the instrument measuring geometry.
D. Composition of Metal Ceramic Porcelain
The composition of metal ceramic porcelains has been described
18
by McLean (1979), Binns (1982), Yamamoto (1985), and Naylor (1986).
Metal ceramic porcelains are alumino silicate glasses composed
primarily of 75-81% feldspar, 15-25% quartz, 0-4% kaolin (if
present), and varying amounts of fluxes (Yamamoto, 1985). Feldspar
is a naturally occurring mineral composed of soda (N20), potash
(K20), alumina (A1203), and silica (SiO2) (Phillips, 1991).
Naylor (1986) has summarized the qualities of the two
naturally occurring feldspars; potash feldspar and sodium feldspar.
Since natural feldspar varies in composition, the ratio of potash
to soda could vary. The characteristics which each imparts to the
porcelain are different and therefore this ratio is controlled by
the manufacturers. Upon melting, the feldspar becomes a vitreous
mass with high viscosity and transparency. Potash enhances the
translucent qualities and increases the viscosity, thus helping to
control the pyroplastic flow of the porcelain during the firing
process. Sodium feldspar lowers the fusion temperature of the
porcelain making it more susceptible to pyroplastic flow. In
addition, sodium feldspar does not contribute to the translucency,
as does the potash form.
Embedded in this vitreous mass is a refractory framework of
quartz (silicic anhydride) that reduces tranulucency and increases
strength (Yamomoto, 1985). Potassium, sodium, calcium and boric
oxides may be added as fluxes to lower the melting range and
decrease viscosity (McLean, 1979).
Metal ceramic porcelain is classified as a low-fusing
porcelain, with firing temperatures between 8000 C and 1,0500 C

19
(McLean, 1979). Compared to high- and medium-fusing porcelains,
these low-fusing porcelains contain higher soda and potash levels
in order to raise their thermal coefficient of expansion and be
physically compatible with a metal substructure (McLean, 1979).
The process for manufacturing dental porcelain powders includes
an initial high temperature sintering of the raw mineral
constituents (feldspar, silica, alumina and other trace
components). A molten glass is formed that is quickly cooled and
shattered into fragments during what has been described as a
fritting process. These colorless particles, or frits, are ground
to specific particle sizes and combined with other frits containing
pigmented metallic oxides. Opacifying agents are added in varying
amounts according to the specific functional or color related role
that is desired (Phillips, 1991). Thus, opaque porcelains contain
the highest levels of opaque oxides and enamel or translucent
porcelains contain the least.
For example, the opaque porcelains that are applied to the
oxidized metal surface contain relatively higher amounts of crystal
phases of the tetravalent metal oxides TiO 2, SnO2, ZrO2, CeO 2, and
zircon (Binns, 1982). These components have relatively high
refractive indices and may be used in amounts as high as 8-10%
(Binns, 1982). Particle sizes vary from 0.4 to 0.8 Am and may be
incorporated into the original fritting process to prevent
segregation and localized concentrations of color and opacity
(McLean, 1979).
20
E. Factors Affecting Metal Ceramic Porcelain Color
Many of the manipulative steps in fabricating a metal ceramic
restoration have been evaluated for their effects on the color
parameters of the final restoration. Some of these factors
include: type of alloy for the metal substrate, surface finish of
the metal substrate, porcelain condensation technique, type of
modeling liquid used, brand of porcelain, thickness of porcelain,
air-firing versus vacuum-firing, firing rate, firing temperature,
and number of firing cycles.
Gettleman and others (1977) spectrophotometrically evaluated
the effect of three metal surface treatments (600 grit finish,
sandblasting with pumice, and the application of a gold flash
conditioning agent) on the masking power of opaque porcelain. They
concluded that samples that were gold flash conditioned required 40
to 60% less opaque porcelain thickness to achieve the same spectral
reflectivity as the specimens that were not gold flash conditioned.
Brewer and others (1985) spectrophotometrically measured the
color of one shade (A2) of Vita VMK 68 porcelain during seven
fabrication steps of firing onto three alloys (palladium-silver,
nickel-chromium-beryllium, and a high gold content alloy). The
mean tristimulus values were significantly different between the
alloys and these differences were most pronounced after the first
dentin firing. The authors concluded that without subjective
observation these quantitative differences yield no indication of
the clinical significance of these results.

21
Jacovides and others (1985) reported on the ability of a 0.1 mm
layer of four opaque porcelains to mask six high palladium alloys.
Quantitative color values were measured with the Chromascan
colorimeter and a limited human visual evaluation was performed.
The authors concluded that substructures produced from some high
palladium alloys would require a thicker layer of opaque to mask
their underlying oxide layer.
Jacobs and others (1987) visually and spectrophotometrically
evaluated color differences between samples fabricated with three
metal ceramic alloys (gold-platinum-palladium, nickel-chromium, and
high-palladium) and three shades (A3, B1, and C4) of Vita VMK 68
porcelain at three dentin porcelain thicknesses (0.5, 1.0, and 1.5
mm). They observed that subtle differences in color were noted
more often with the human eye than with the spectrophotometer.
Significant differences in hue were variable between the three
alloys and were more pronounced with one particular shade, A3.
Furthermore, significant differences in color were noted with
increasing thickness of dentin porcelain and these differences were
more pronounced with two shades of porcelain, A3 and C4. The
authors concluded that when opaque porcelain color more closely
matched the dentin porcelain color (BI), a shade match could be
achieved with less overall porcelain thickness.
Two different alloys (high-gold and base metal) and four
different alloy surface finishes (60, 180, and 600 grit, and 180
grit with surface conditioner) were evaluated by tristimulus
colorimeter, spectrophotometer and human visual observation for

22
color differences after porcelain application in a study by O'Neal
et al. (1987). One shade (69) of Ceramco porcelain was applied at
0.15 mm of opaque and 1.0 mm of dentin porcelains. The authors
concluded that color differences were small and probably not
clinically significant at this porcelain thickness. Most of the
color differences between specimens with different surface finishes
were due to hue and chroma shifts. There was a visually
significant difference in chroma between specimens fabricated with
the two different alloys. The authors postulated that the observed
color differences could be more pronounced at decreased porcelain
thicknesses. Whi'- this is possible it was not substantiated by
their study.
Brewer et al. (1989) evaluated CIE tristimulus color order
differences between metal ceramic coupons fabricated with a high-
gold content alloy and those fabricated with a palladium-silver
alloy. A single shade of two porcelains was used, Vita VMK 68 and
Vita VMK 68 N. The mean tristimulus values were different for
coupons fabricated with different alloys and with different
porcelains. For final color, non-greening Vita VMK 68 N had higher
a* (more red) and lower b* (less yellow) for both metals.
Correlation with human visual perception was not mentioned.
Condensation of porcelain has been shown to effect color
parameters for metal ceramic restorations. Condensation can be
achieved by vibration, spatulation, and brush techniques (Phillips,
1991). Less thorough condensation is thought to result in the
inclusion of more air bubbles in the fired porcelain and a decrease
23
in translucency (Yamamoto, 1985).
Evans (1988) evaluated four condensation methods with one shade
(B2) of four ceramic porcelains (Ceramco II G series, Will-Ceram V
series, Vita VMK 68, and Jelenko) by tristimulus colorimeter and
subjective observers. Porosity was evaluated by measuring the
apparent specific gravity of each specimen and no significant
differences between condensation methods were noted. All four
porcelains exhibited significant differences between condensation
methods for a* and b* color data. Will-Ceram and Vita VMK 68
porcelains exhibited significant differences in color between
condensation methods as measured by subjective observers. While
all four porcelains reportedly were manufactured to match the Vita
B2 shade guide, they were significantly different as measured by
CIE L*a*b* values and subjective observers.
A 1978 study by Barghi and Richardson used six subjective
observers to evaluate color of one porcelain fired on four alloys
(Ceramco R, SMG-2, Bak-On, and Will-Ceram). In addition, color was
assessed for change after 1 through 8 repeated firings. Surfaces of
the finished metal and fired porcelain were evaluated by scanning
electron microscopy. The evaluators reported no color differences
between the porcelain on the four different alloys. Color was
stable for six firings and chroma was reported to increase only
slightly after nine firings. However, the authors did not indicate
how the observers rated the color of the specimens.
Kay and others (1989) spectrophotometrically evaluated CIE
L*a*b* changes of the two shades of five brands of porcelain after

24
one and six firings. Composite disks of opaque (1.05 mm) and body
porcelain (1.00 mm) were fabricated without metal substructures.
The authors concluded that the majority of observers could have
noticed color changes (AE) of 1.74, 1.75, and 3.52 recorded for
three brands of dental porcelain but not the 0.88 for the other two
brands. This finding is not in agreement with the observations of
Johnston and Kao (1989) and no subjective observers were involved
in this evaluation.
Barghi and Goldberg (1977) used subjective observers to
evaluate color changes after repeated firings in both air and under
vacuum using one brand (Ceramco) of dental porcelain on platinum
foil. For the first five firings the observers could not detect any
color differences between and within either air- or vacuum-fired
samples. Between the fifth and tenth firings small decreases in
value were observed for the vacuum-fired porcelain while the air-
fired porcelain exhibited a greater decrease in value with slight
increases in chroma. It was postulated that the greater color
changes for the air-fired porcelain could be attributed to a
decrease in the number and size of air bubbles after repeated
firings.
Then in 1982, Barghi evaluated the effect of additional
firings on the color of four brands of porcelain fused to six
different alloys. The specimens were fired from one to nine times
at glazing temperatures. Seven subjective observers reported some
slight color changes after the fifth through the ninth firings but
the author concluded that these changes were not significant.
25
Lacefield and others (1985) used both subjective observers and
a colorimeter to evaluate color changes in 0.1 mm of opaque and
0.75 mm of body porcelain fused to four high palladium alloys
(palladium-silver, palladium-copper-gallium, palladium-gallium-
cobalt, and gold-palladium) after five firings in addition to the
original firings to fabricate the samples. Statistically
significant decreases in value were recorded by colorimeter for all
four alloys after additional firings. Subjective observers reported
significant color differences between both the palladium-gallium-
cobalt and palladium-copper-gallium alloy-porcelain disks before
and after the additional firings. Energy dispersive spectroscopy
was used to determine the extent of metal diffusion into the
porcelain. The authors concluded that the presence of high
concentrations of certain metals (such as gallium) in the porcelain
may account for the reduction of value after additional firings.
Schultz and others (1989) used a colorimeter to evaluate color
changes affected in dental porcelain (American Thermocraft shade A-
2) by different firing rates of 50OF/min (Group A), 100 0F/min
(Group B), and 2000 F/min (Group C). Statistically significant
differences in AE units were found between all three groups (A-B=
1.74, A-C= 2.02, and B-C= 0.28). However, metal substructures were
not used and the ability of human observers to perceive these
differences was not established.
Hammad and Stein (1991) colorimetrically evaluated color
changes affected by variable firing temperatures (recommended
temperature, recommended temperature plus 350F, and recommended

26
temperature plus 700F), number of firings (5, 7, and 9), alloy type
(Olympia and Talladium), and porcelain brand (Vita VMK 68 and
Ceramco II). There were significant increases in hue and decreases
in value but no changes in chroma when firing temperatures were
increased. There were no significant changes in hue, value, or
chroma when the number of firings were increased from five to nine.
Significant differences were noted in hue, value, and chroma
between the two porcelain brands evaluated. The effect of changing
the alloy type on hue, value, and chroma varied with the porcelain
brand used at a given firing temperature. Again, subjective
observers were not employed and therefore the question of whether
or not these changes could be visually perceived remains
unanswered.
Seghi and others (1986) used a spectrophotometer to evaluate
color differences between three brands (Vita VMK 68, Crystar, and
Biobond) of four shades (Al, B2, C4, and D3) of porcelain. Metal
substructures were not used and the opaque and dentin porcelains
were fired separately in large samples, sectioned, polished, and
placed in optical contact for color analysis. Significant
differences in CIE L*a*b* values were noted between different
brands of the same shade of porcelain. Greater color differences
existed between corresponding shades of opaque porcelains than
between corresponding shades of combined opaque-body porcelains.
The addition of 1 mm of body porcelain in optical contact with the
opaque porcelain compensated to a large extent for the greater
color differences found between the corresponding opaques. The lack

27
of organized subjective observation and the unorthodox method of
sample fabrication make application of these results to the
clinical environment questionable.
Barghi and Lorenzana (1982) used subjective observers to
evaluate color changes affected by variations in opaque porcelain
and dentin porcelain thickness of six shades and of two brands of
metal ceramic porcelain (Vita VMK 68 Al, BI, and Cl; Ceramco shades
59, 61, and 81). The thickness of opaque and body porcelain that
produced optimal shade matching varied between shades and porcelain
systems. Additional opaque porcelain in excess of 0.3 mm had no
discernible effect on the shade of the specimen. Similar results
were also obtained in a study by Terada et al. (1989b). They fused
0.5 mm of Vita VMK 68 shade A2 opaque porcelain to four different
metal ceramic alloys and measured color differences in CIE L*a*b*
color space as the opaque thickness was reduced. Variations in CIE
L*a*b* values were not significant until the opaque thickness was
below 0.3 mm.
A 1988 study by Rosenstiel and Johnston evaluated the effect of
firing temperature, condensation technique, type of modeling
liquid, brand of porcelain, and shade of porcelain on color of
metal ceramic restorations as measured in CIE L*a*b* color space.
Their results indicated that color differences associated with
different modeling liquids, differences in firing temperatures of
300C, and different condensation techniques were not statistically
significant. The authors concluded that the recorded differences
had a AE of 1 or less and were probably not visibly detectable.

28
However, significant differences in AE were noted between different
shades of porcelain as well as between different brands of
porcelain of the same nominal shade.
Terada and others (1989a) evaluated differences in CIE L* a* b*
color space between Vita VMK 68 shade A2 metal ceramic specimens
fabricated with 0.1 mm, 0.2 mm, and 0.3 mm of opaque porcelain with
0.1 mm or 0.5 mm of dentin porcelain fired over the opaque
porcelain. L* decreased in all samples as the thickness of dentin
porcelain increased. Redness (a*) increased for all samples as the
dentin porcelain thickness was increased and yellowness (b*)
increased for most samples as the dentin porcelain thickness was
increased. There were significantly different AE values between
samples having 0.2 and 0.3 mm of opaque porcelain when covered with
each of the thicknesses of dentin porcelain using a nickel-chromium
alloy.
Jorgensen and Goodkind (1979) used a spectrophotometer to
determine hue, chroma, and value differences associated with
repeated firings (2, 5, and 10) and three thicknesses (1, 2, and 3
mm) of dentin porcelain of three shades (A3, B2, and D3) of three
brands of porcelain (Ceramco VT, Vita VMK 68, and Biobond). Opaque
porcelain of 0.1 mm thickness was fused to a gold-palladium-silver
alloy and then covered with 1, 2, or 3 mm of dentin porcelain and
fired again. No statistically significant differences in hue,
chroma, or value were noted for the different thicknesses of dentin
porcelain. Value increased as thickness of dentin porcelain
increased. This is exactly opposite the decrease in value

29
associated with increasing thicknesses found in many other studies
(Moser and Meyer, 1983; Jacobs et al., 1987; and Terada et al.,
1989a). One possible explanation for the observation could be that
this study used only 0.1 mm of opaque over a metal ceramic alloy.
If the alloy oxide layer was dark and the 0.1 mm of opaque was
insufficient to mask this darkness then the value would be low to
begin with. As more porcelain was added to cover the opaque layer
the added reflective properties of the dentin porcelain decreased
the affect of the underlying dark oxide layer on the color
resulting in a net increase in value.
In 1989, Johansen and others evaluated the differences in color
(AE) between an unidentified porcelain fired at three different
glazing temperatures that were increased in increments of 50°F
starting at 1750°F and ending at 18500 F. Statistically significant
differences in AE were noted between the different temperatures.
The authors concluded that with increased temperature of glazing
there was a shift toward the blue-green color axis and overall
darkening. Neither metal substructures nor subjective observers
were employed therefore clinical applicability of the findings are
questionable.
Obregon and others (1981) studied the effects of various
opaque and dentin porcelain surface textures of two shades (A3 and
B1) of Ceramco G porcelain on color as measured by a
spectrophotometer. Changes in dentin porcelain surface texture had
no significant effects on hue and chroma. However, rougher dentin
porcelain surface finish resulted in a slight increase in value for
30
shade A3 and a decrease in value for shade Bi. Yet, there were
significant differences in hue, chroma, and value between glossy
and rough opaque porcelain surface finishes.
F. Summary
Many of the studies evaluating color of metal ceramic
porcelain systems have used methods that preclude an application of
the results to the clinical setting. For example, the study designs
may not have included ceramic specimens with metal substructures,
they may have used thicknesses of porcelain that could not be
achieved in a dental restoration, or the investigators failed to
evaluate color changes with human observers. Other studies have
limited application to clinical settings because only one shade of
porcelain was evaluated.
Some porcelain manufacturers claim that new formulations of
opaque porcelain are improved because they are "shade-matched" to
the dentin porcelain to promote overall restoration shade match at
thinner porcelain thickness. These porcelain systems have separate
opaque porcelain powders for each shade (eg. Microbond, Ceramco II,
and Jelenko) in contrast to other ("non-shade-matched") porcelain
systems that may use the same opaque powder for several shades (eg.
Vita VMK 68).
If this is true, changes with increasing thickness of dentin
porcelain in L*, a*, and b* values for those porcelain systems with
"shade-matched" opaques would be expected to be less than changes

31
for "non-shade-matched" opaques. In addition, it is expected that
human observers would perceive a shade match at less thickness of
dentin porcelain for specimens made with a "shade-matched" opaque
system than specimens made with a "non-shade-matched" opaque
system.
Consequently, this study was undertaken to evaluate the
contention that metal ceramic porcelain systems with "shade-
matched" opaques achieve a shade match with less dentin porcelain
thickness than systems without "shade-matched" opaque porcelains.
32
III. Materials and Methods
Three Vita Lumin shades (A3.5, BI, and C3) of three metal
ceramic porcelains with shade matched opaques (Ceramco II, Ceramco,
Inc., Dentsply International Inc., York, PA; Microbond, Nobelpharma
USA, Inc, Chicago, IL; and Jelenko, J. F. Jelenko and Company,
Penwalt Corp., Armonk, NY) and one metal ceramic porcelain without
shade matched opaques (Vita VMK 68, Vident, Baldwin Park, CA) were
fired to gold-palladium alloy disks in four thicknesses (0.3 mm of
opaque only, and opaque with 0.3, 0.6, and 0.9 mm of dentin
porcelain). Six specimens were made for each brand-thickness-shade
combination for a total of 288 samples. For an objective analysis
of color difference, the color of the specimens was evaluated with
a colorimeter, recorded as Y, X, and Z tristimulus values. CIE
L*a*b* values were then calculated and used for the statistical
analyses. Seven subjective observers rated representative specimens
from each brand-thickness-shade group for color match with a dentin
shade tab to obtain a subjective assessment of color differences
for A3.5, Bl, and C3.
All specimen fabrication and testing procedures were conducted
to closely approximate the actual laboratory construction and
clinical use of metal ceramic restorations. Samples were prepared
in two phases: 1) fabrication of the metal substructure, and 2) the
application and firing of the dental porcelain onto the
substructure.

33
A. Fabrication of the Metal Substructures
The two hundred and eighty eight disks, 10 mm in diameter,
were cut from 0.508 mm thick acetate plastic sheets (Temporary
Splint Material, Buffalo Dental Mfg. Co., Inc., New York, NY). A 10
mm long piece of 10 gauge plastic sprue former (Plastic sprues,
Williams Dental Co. Inc., Amherst, NY) was luted to the center of
one side of each disc and cast to serve as a handle for ease of
manipulation. Eight patterns were connected to a rubber crucible
former on a preformed wax runner bar (Wax Ready sprues, 013117
large, Belle de St. Claire, Chatsworth, CA) (Plate 1). The
specimens were invested with a high-heat, phosphate-bonded casting
investment (Vestra-fine, Unitek Corp./ 3M, Monrovia, CA) using 195
gms of powder with a mixture of 23.25 ml of distilled water and
23.25 ml of Vestra-fine special liquid. The casting rings were
allowed to bench set for one hour and placed in a cool burnout
oven. The oven temperature was raised to 316 0C at a rate of
40C/minute and held for 45 minutes. Then the oven temperature was
raised to 815 0C at the same rate of rise and heat soaked for one
hour. After wax elimination, the substructures were cast with a
high noble gold-palladium alloy (Olympia, 51.5% Au and 38.5% Pd,
Penwalt Jelenko, Armonk, NY).
The castings were divested and cleaned manually (Plate 2),
then cut from the runner bar with silicon carbide separating discs
(Dedeco No. 5178, Dedeco International Inc., Long Eddy, NY). The
top surfaces of the castings were finished sequentially on 240,

34
320, and 400 grit silicon carbide paper strips (Carbimet paper
strips, Buehler Ltd., Lake Bluff, IL) under a water stream in a
surface grinding device (Handimet Grinder, Buehler Ltd, Lake Bluff,
IL). The metal substructures were numbered on the sprue stem for
ease of identification (Plate 3). Also, four equally spaced
depressions were placed on the specimen's undersurface for
thickness measurement indices (Plate 4). An angled notch was cut
approximately 1 mm from the distal end of the sprue stem where
ligature wire could be used to hold the substructure in place
during porcelain condensation (Plate 5). The castings were air-
abraded with 25 micrometer aluminum oxide (Faskut Aluminum Oxide
Abrasive, Dentsply/York Division, York, PA) at 50 psi, and steam
cleaned for 10 seconds.
Finally, the substructures were oxidized in a calibrated
porcelain furnace (Ultramat CDF, Unitek Corp./3M, Monrovia, CA) to
1040 0C in air with no hold time in groups of six. The specimens
were then air-abraded with 25 micrometer aluminum oxide as above
and steam cleaned just prior to porcelain application (Plate 6).
B. Porcelain Application
All four of the metal ceramic porcelain systems used in this
investigation reportedly are matched to the Vita Lumin shade guide
(Vita Zhanfabrik, Bad Sackingen, Germany). For added clinical
relevance, each manufacturer's recommendations were followed for
all porcelain firing sequences (Appendix A).

35
For consistent thickness of porcelain a commercially available
custom shade tab device (Gnathos Shade Tab Former, Belle de St.
Claire, Chatsworth, CA) was modified to accommodate the handle on
the specimen (Plate 7). The custom shade tab device has a scale on
the side to allow for repeatable adjustment of depth (Plate 8). To
provide optimum masking of alloy, the opaque was applied and
sintered in two separate firings to a thickness of approximately
0.3 ± 0.02 mm (Barghi and Lorenzana, 1982; Terada, Sakai, and
Hirayasu, 1989b). The body porcelain was also applied in two
separate applications and firings. The depth of the mold was
adjusted so that the thickness of dentin porcelain measured 0.4,
0.7, or 1.0 mm after firing to allow for a loss of approximately
0.1 mm of dentin porcelain during finishing.
Before each porcelain application the specimens were steam
cleaned for five seconds. The metal substructures were placed in
the mold and 15 gauge ligature wire was passed through the notch in
the sprue stem to hold them firmly in place during porcelain
condensation (Plate 9). Opaque and dentin porcelain were placed in
the mold with a brush (Plate 10), levelled with a spatula,
condensed by vibration with a serrated handle, blotted dry with
facial tissue, and smoothed with a dry brush (Plate 11). Vita
opaque was mixed with Paint-On Liquid (Vident, CA) and Vita dentin
porcelain was mixed with Vita Modelling Liquid (Vident, CA).
Ceramco opaque porcelain was mixed with Opaque Liquid (Dentsply
International Inc., PA) and the Ceramco dentin porcelain was mixed
with Body Liquid (Dentsply International Inc., PA). Microbond and

36
Jelenko porcelains were mixed with distilled water as per the
manufacturer's directions. Before each application of porcelain the
specimens were steam cleaned for 10 seconds. Thicknesses were
recorded for each of the four index sites on every specimen using
a dial caliper accurate to within 0.01 mm (Praecimeter, Pfingst and
Company, Inc., South Plainfield, NJ) (Plate 12) at three
fabrication stages; oxidized metal, final opaque, and final glaze.
All specimens with dentin porcelain were serially finished with
240, 320, and 400 grit silicon carbide paper strips (Carbimet paper
strips, Buehler Ltd., Lake Bluff, IL) under a water stream in a
surface grinding device (Handimet Grinder, Buehler Ltd, Lake Bluff,
IL) to dentin porcelain thicknesses of 0.3, 0.6, or 0.9 ± 0.02 mm.
Before glazing, the specimens with dentin porcelain were again air
abraded with 25-Am aluminum oxide for 10 seconds and again steam
cleaned for 10 seconds.
C. Color Measurement
1. Tristimulus Colorimetry
Color measurements on the samples were made with a tristimulus
colorimeter (HunterLab Colorimeter D25A-2, Hunter Associates
Laboratory, Inc., Reston, VA) and recorded as Y, X, and Z
tristimulus values. The sensitivity of this instrumet. is reported
at 1% for measurement of diffuse reflectance (HunterLab Associates
Laboratory, 1980). Color values are repeatable ± 0.1 and

37
reproducible ± 0.2 scale units. Color values are accurate to a root
mean square deviation of 0.7 scale units (referenced to CIE
illuminant C 1931, 20 observer values assigned to master
reflectance standards) (HunterLab Associates Laboratory, 1980).
The HunterLab D25A-2 Colorimeter features dual beam 450
illumination and 00 viewing (Plate 13). Light from a tungsten
halogen lamp is split into two beams, which are filtered to prevent
infrared sample heating. This light is then reflected onto the
sample in two opposing beams at an angle of approximately 450.
Light reflected from the sample is collected at 00 and directed to
four filters and four photodetectors. The source-filter-detector
combination simulates the CIE 20 standard observer functions under
illuminant C.
Prior to each data gathering session the instrument was
standardized using first black and then white tile standards
(Hunter Associates Laboratory, Inc.). The HunterLab Standards are
traceable to measurements at the National Bureau of Standards
(U.S.A.) and the National Physical Laboratory (Great Britain).
Since Y, X, and Z tristimulus values are not readily described in
human color perception terms, these values were converted to CIE L*
(luminance), a* (red-green), and b* (yellow-blue) notation using
the recommended mathematical formulas (Appendix B).
2. Subjective Observer Analysis
For subjective observer analysis, seven observers (3 female

38
and 4 male) were evaluated at the Visual Electrodiagnostic
Laboratory, Clinical Sciences Division, Brooks AFB, Texas by an
individual with a doctorate degree (PhD) in ocular
electrophysiology. Evaluation included two anomaly tests, the
Pseudoisochromatic Plate (PIP) test and the Anomaloscope Plate Test
(APT 5), and one hue discrimination test, the Farnsworth-Munsell
100 Hue discrimination (FM 100 H) test. All observers had color
vision within normal limits.
A representative sample from each brand-thickness-shade group
was selected by choosing a specimen with L*a*b* values that most
closely approximated the mean L*a*b* values for the group. A single
representative sample was selected to minimize color fatigue of the
subjective observers by reducing the number of color matchings. A
neutral gray mat board was prepared for each shade (3 boards) with
16 equally spaced 10 mm diameter holes. All of the selected
specimens from one shade were randomly picked from a bag and
mounted in the holes on a single panel (Plate 13). Each specimen
was mounted from the back of the panel so that the observers could
not see the thickness of the specimen. The individual observers
made their observations in a room illuminated with artificial,
full-spectrum, color-corrected lighting (Vita-Lite, Duro-test
Corporation, North Bergen, NJ) at a light intensity of
approximately 79 footcandles. Each observer was given a tabulation
sheet and asked to score each sample for its level of matching of
specimen to a dentin shade tab (Vident). The scale used ranged from
1 to 5: 1=sample was not at all the same, 2=somewhat the same, 3=

39
moderately the same, 4=nearly the same, or 5=exactlv '' same.
D. Statistical Analysis
The L*, a*, and b* data were analyzed with a three factor
Analysis of Variance (ANOVA) for each of the color parameters
(Jacobs et al., 1987 and Evans, 1988). The first factor was brand
of porcelain, the second factor was thickness of dentin porcelain,
and the third factor was shade of porcelain. Tukey's Studentized
Range Tests were used to make multiple pairwise comparisons between
thickness of each brand-shade group.
Interrater reliablility was assessed for the subjective
observers by the alpha coefficient analysis. Coefficient alpha is
the expected correlation of one rating with another rating of the
same length when the two tests purport to measure the same thing
(Nunnally, 1967).
The subjective rankings were totalled and a mean rank
determined. A Kruskal-Wallis analysis of the ordinal level rank
order data for both thickness and brand was performed at a
significance level of p< 0.05. Non-parametric multiple pair-wise
comparisons of thickness for each porcelain shade were made using
the Mann-Whitney Rank Sum Test at a significance level of 0.05
(Evans, 1988). Based on the initial comparisons between thickness,
selected mean specimens were compared between brand within each
shade using the Mann-Whitney Rank Sum Test (p<0.05).

40
Plate 1. Acetate plastic patterns connected to plastic sprue
formers, runner bar, and crucible former.
i I

41
Plate 2. Representative example of metal substructure castings
just prior to removal from the runner bar.


42
Plate 3. Specimen numbers inscribed on the handle for
identification.


43
Plate 4. Four depressions on the undersurface of the metal
substructures served as thickness measurement indices.


44
Plate 5. Angled notch on sprue of metal substructure to aid
engagement of ligature wire used to hold the specimen
in the custom shade tab former.

'Raw

45
Plate 6. Representative examples of metal substructures oxidized
in groups of six.


46
Plate 7. Hole placed through center of the custom shade tab
device to accommodate ligature wire and the handle of
the specimen.


47
Plate 8. Measurement scale on the sides of the Belle de St.
Claire custom shade tab device.

AL 4 v
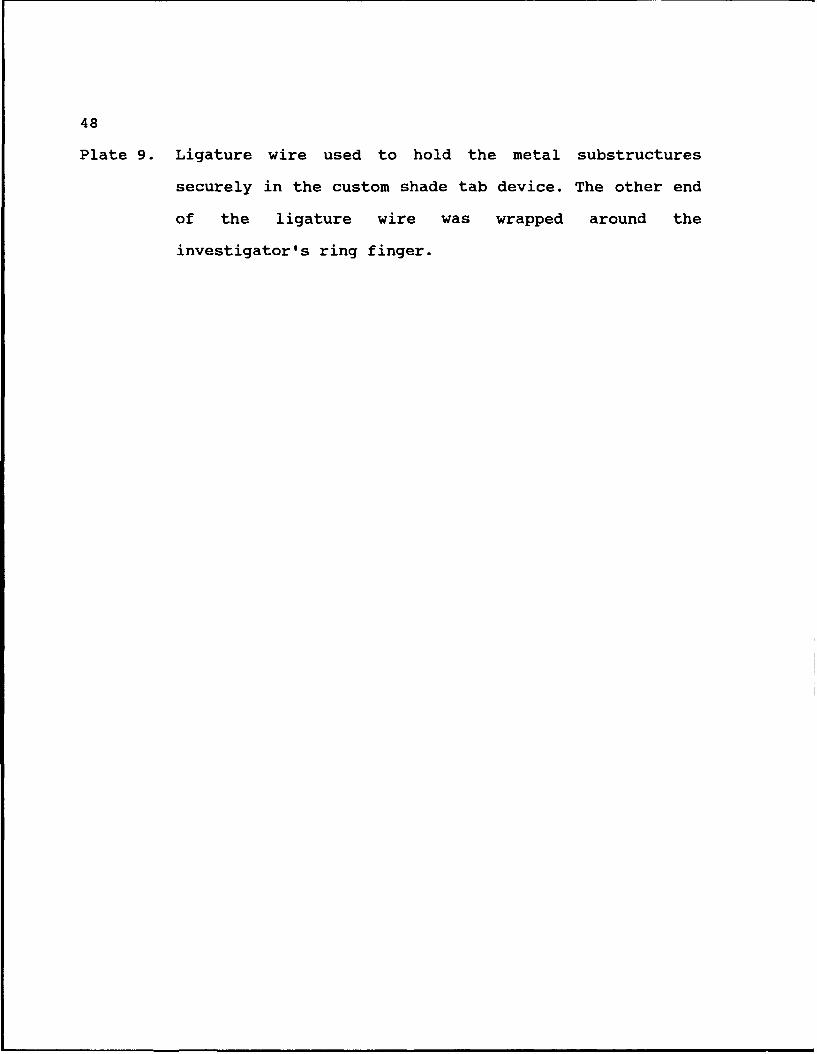
48
Plate 9. Ligature wire used to hold the metal substructures
securely in the custom shade tab device. The other end
of the ligature wire was wrapped around the
investigator's ring finger.

4T
Vw
jr.V
1. 7SF I*F

49
Plate 10. Porcelain placed in the custom shade tab device with a
No. 4 porcelain brush.

FIN

50
Plate 11. Porcelain surface smoothed with a dry, sable
brush.


51
Plate 12. Dial caliper used to measure specimen thickness.

1124
30

52
Plate 13. HunterLab Colorimeter D25A-2 Optical Geometry
(HunterLab D25A-2 Colorimeter Manual, 1980).

C,)a)a)0)U *0
L()'~zI
CI) II
a)Ci)
Q
0a)a)
a)0
a)
0 CI)a)
a)
CI)
0

53
Plate 14. Specimens mounted in random arrangement on a neutral
gray mat panel for subjective observer analysis.

VVS

54
IV. Results
All raw tristimulus color data are contained in Appendix C.
The means and standard deviations of the L*, a*, and b* color data
for each porcelain brand are listed in Tables 1, 2, 3, and 4. The
results of the three-factor analysis of variance (p<0.05) for L*,
a*, and b* means are presented in Tables 5, 6, and 7, respectively.
The results of the Tukey's Studentized Range Test (p<0.05) for L*,
a*, and b* means between thicknesses of each brand-shade
combination are presented in Tables 8, 9, and 10 respectively.
Graphic representations of L* changes in thickness of dentin
porcelain for shades A3.5, BI, and C3 are illustrated in Figures 1,
2, and 3 respectively. Graphic representations of a* changes by
thickness of dentin porcelain for shades A3.5, BI, and C3 are
illustrated in Figures 4, 5, and 6, respectively and b* in Figures
7, 8, and 9, respectively.
A. L*a*b* Analysis
The results of the three-factor analysis of variance for L*,
a*, and b* demonstrated significant differences between brands,
thicknesses, and shades of dental porcelain at the p<0.05 level
(Tables 5, 6, and 7).
55
1. L* Comparisons Within Brand-Shade Groups
Upon comparing the L* means for value differences (Table 8),
significant differences were noted between all thicknesses of all
three shades for Microbond, Jelenko, and Vita VMK 68 porcelains but
only shade B1 for Ceramco II porcelain. However, for Ceramco II
shade A3.5 there were no significant differences between the 0.3
and 0.6 mm thickness groups or between the 0.6 and 0.9 mm thickness
groups. But the L* value difference between the 0.3 and the 0.9 mm
thicknesses we- e statistically significant. Also, for Ceramco II
porcelain shade C3 there were no significant differences for L*
values among the 0.3, 0.6, and 0.9 mm thickness groups.
2. a* Comparisons Within Brand-Shade Groups
When comparing the a* means (Table 9), significant differences
were noted between all thicknesses of shade A3.5 for both Ceramco
II and Jelenko porcelains. The remaining brand-shade combinations
can be characterized as follows: 1) for Microbond shade A3.5 there
wore no significant differences between opaque only and the 0.3 mm
dentin porcelain thickness and between 0.3, 0.6, and 0.9 mm dentin
porcelain thickness. 2) for Microbond shade B1 there were no
significant differences between opaque only and the 0.3 mm dentin
thickness and also between 0.6 and 0.9 mm dentin porcelain
thickness. 3) for Microbond shade C3 there were no significant
differences between 0.3, 0.6, and 0.9 mm dentin porcelain
56
thicknesses. 4) for Ceramco Ii shade B1 there were no significant
differences between opaque only and the 0.3 mm thickness or between
the 0.3, 0.6, and 0.9 mm dentin porcelain thicknesses. 5) for
Ceramco II shade C3 there were no significant differences between
the 0.6 and the 0.9 mm dentin porcelain thicknesses. 6) for Jelenko
shade Bi there were no significant differences between the 0.6 and
the 0.9 mm of dentin porcelain thicknesses. 7) for Jelenko shade C3
there were no significant differences between the 0.3, 0.6, and
0.9 mm dentin porcelain thicknesses. 8) for Vita VMK 68 shades A3.5
and BI there were no significant differences between the 0.6 and
0.9 mm dentin porcelain thicknesses. 9) for Vita VMK 68 shade C3
there were no significant differences between opaque only, the 0.6,
and 0.9 mm dentin porcelain thicknesses.
3. b* Comparisons Within Brand-Shade Groups
Upon comparing the b* means (Table 10), significant
differences were noted between all thicknesses of Jelenko shades
A3.5 and BI. The remaining brand-shade combinations can be
chaiacterized as follows: 1) for Microbond shade A3.5 there were
no significant differences between the 0.3, 0.6, and 0.9 mm dentin
porcelain thicknesses. 2) for Microbond shade B1 there were no
significant differences between the opaque only, the 0.3, and 0.9
mm and between the 0.3 and 0.6 mm dentin porcelain thicknesses. 3)
for Microbond shade C3 there were also no significant differences
between the opaque only, the 0.3, and 0.9 mm and between the 0.3
57
and 0.6 mm dentin porcelain thicknesses. 4) for all three shades of
Ceramco II there were no significant differences between the opaque
only and the 0.3 mm dentin porcelain thicknesses. 5) for Jelenko
shade C3 there were no significant differences between the opaque
only and the 0.6 mm dentin porcelain thickness. 6) for Vita VMK 68
shade A3.5 there were no significant differences between the 0.3
and 0.9 mm dentin porcelain thicknesses. 7) for Vita VMK 68 shade
BI there were no significant differences between the opaque only
and the 0.6 mm of dentin porcelain thickness. 8) for Vita VMK 68
shade C3 there were no significant differences between the 0.3 and
0.6 mm dentin porcelain thicknesses mean b* value.
B. Subjective Observer Analysis
The raw data for subjective observer rankings for each brand-
thickness-shade representative specimen are listed in Appendix D.
1. Interobserver Reliability
The results of interobserver reliability analysis with the
alpha coefficient test appear in Table 11. This test first
determines multiple pairwise correlation coefficients for each
possible pairing of subjective observers. A correlation matrix of
these pairwise comparisons (between observers) appears as item A in
Table 11. One rater (EI) had low correlation coefficients (five out
of six coefficients below 0.4) while the remaining six raters had
58
correlation coefficients ranging from 0.429 to 0.739. The alpha
coefficient for overall interobserver correlation was found to be
0.845. For comparative purposes, alpha coefficients were also
calculated for the data with each individual observer's ratings
omitted from the analysis (Table 11, B).
2. Mean Rank Analysis
The summary of the Kruskal-Wallis one-way analysis of variance
for thickness (using mean subjective observer ranking) is presented
in Table 12. Significant differences (p<0.05) were noted for all
brands of shade A3.5 and for Microbond and Ceramco II shade C3. To
further delineate these differences a post-hoc test for non-
parametric data, the Mann-Whitney Rank Sum Test, was completed
between thicknesses for each brand-shade combination. The results
for shades A3.5, Bl, and C3 are included in Tables 13, 14, and 15,
respectively.
3. Shade A3.5 Mean Rank Analysis Within Brand-Shade
For shade A3.5, there were no significant differences in
ranking between different thicknesses of Microbond porcelain (Table
13). For Ceramco II mean rankings, there were no significant
differences noted between the opaque only and the 0.9 mm and
between the 0.3, 0.6, and 0.9 mm dentin porcelain thicknesses. For
Jelenko, no significant differences were noted between the opaque

59
only, the 0.3, and 0.6 mm and between the opaque only, the 0.6, and
0.9 mm dentin porcelain thicknesses. For Vita VMK 68 there were no
significant differences between the 0.3, 0.6, and 0.9 mm of dentin
porcelain thicknesses.
4. Shade B1 Mean Rank Analysis Within Brand-Shade
Mean rankings for shade B1 were not significantly different
between the four thicknesses of each brand-shade group (Table 14).
5. Shade C3 Mean Rank Analysis Within Brand-Shade
Mean rankings for shade C3 were not significantly different
between the four thicknesses of dentin porcelain (0.0, 0.3, 0.6,
and 0.9) for Jelenko and Vita VMK 68 porcelains (Table 15). For
Microbond, no significant differences were noted in mean rank
between the opaque only, the 0.3, and 0.6 mm dentin porcelain. For
Ceramco II, no significant differences in mean rank were noted
between the opaque only and the 0.3 mm, between the 0.6 and 0.9 mm,
and between the 0.3 and 0.9 mm dentin porcelain thicknesses.
6. Mean Rank Analysis Between Brands Within Shade
Based on the analysis between thicknesses within each brand-
shade group, a specimen was chosen that had the thinnest dentin
porcelain which had no significant differences in mean rank with

60
the specimen that had the highest mean rank for that brand-shade
combination. These specimens were compared to one another within
each shade group between brands. The Kruskal-Wallis one-way
analysis of variance between brands within shades is summarized in
Table 16. Significant differences (p< 0.05) were noted for shades
B1 and C3 but not for Shade A3.5.
A summary of the Mann-Whitney Rank Sum Tests between brands
within shades is listed in Table 17. The only significant
difference in mean rank for shade B1 was between Microbond and
Jelenko porcelains. The only significant difference in mean rank
for shade C3 was between Ceramco II and Jelenko porcelains.

61
Table 1. Mean (Standard Deviation) L*a*b* Values
For Microbond
SHADE A3.5 :7_
Dentin 0.0 mm 0.3 mm 0.6 mm 0.9 mmPorc.
L* 77.14 69.18 64.34 61.28(0.36) (0.36) (0.46) (0.20)
a* 4.26 3.87 3.51 3.40(0.68) (0.16) (0.19) (0.28)
b* 18.71 22.65 23.63 23.52(0.62) (0.54) (0.45) (0.60)
SHADE B1
Dentin 0.0 mm 0.3 mm 0.6 mm 0.9 mmPorc.
L* 83.22 76.21 71.98 68.93(0.22) (0.54) (0.27) (0.15)
a* 1.60 1.47 0.46 0.06(0.12) (1.09) (0.02) (0.18)
b* 14.86 15.59 15.78 15.22(0.28) (0.29) .28) (0.26)
[ -SHADE C3
Dentin 0.0 mm 0.3 mm 0.6 mm 0.9 mmPorc.
L* 73.17 66.42 63.04 60.47(0.24) (0.29) (0.29) (0.29)
a* 1.69 1.35 1.23 1.34(0.18) (0.02) (0.14) (0.16)
18.45 18.82 19.21 18.27(0.32) (0.55) (0.30) (0.44)
62
Table 2. Mean (Standard Deviation) L*a*b* Values
For Ceramco II
(____________SHADE A3.5-Dentin 0.0 mm 0.3 mm 0.6 mm 0.9 mmPorc.
L* 70.56 66.60 65.64 64.78____ (0.22) (0.22) (0.72) (1.67)
a* 4.42 3.35 2.39 1.68____ (0.16) (0.21) (0.13) (0.20)
b*-A 22.86 22.50 19.45 17.62______ 015) (0.35) (0.38) (0.67)
I -_________ SHADE B1 _ _ _ _ - _ _ _ _
Dentin 0.0 mm 0.3 mm 0.6 mm 0.9 mmPorc.
L* 77.00 71.95 69.88 67.65_____ (0.46) (0.24) (0.80) (0.24)
a* -0.11 -0.33 -0.43 -0.38____ (0.19) (0.16) (0.14) (0.18)
b* 14.24 14.11 11.76 10.29____ (0.14) (0.16) (0.32) (0.19)
____ ___ ____ ___ SHADE C3 _ _ _ _ __ _ _ _ _
Dentin 0.0 mm 0.3 mm 0.6 mm 0.9 mmPorc.
L* 68.32 65.26 64.32 63.66(0.08) (0.59) (0.92) (1.72)
a*2.67 1.97 1.36 1.04____ (0.24) (0.23) (0.16) (0.35)
b ,19.63 19.62 16.87 15.62(0.25) (0.70) (0.45) (0.31)

63
Table 3. Mean (Standard Deviation) L*a*b* Values
For Jelenko
- ~SHADE A3.5 ____Dentin 0.0 mm 0.3 mm 0.6 mm 0.9 mmPorc. _____
L* 70.80 66.79 64.78 63.34_____ (0.46) (0.18) (0.32) (0.42)
a* 4.41 3.51 2.99 2.56_____ (0.25) (0.18) (0.00) (0.14)
b* 24.90 25.62 23.54 21.83_____ 0.4) (0.36) (0.30) (0.46)
I - - ~SHADE B1 ____ _ _
Dentin 0.0 mm 0.3 mm 0.6 mm 0.9 mmPorc.
L* 78.99 75.13 71.88 69.38____ (0.04) (0.23) (0.21) (0.19)
a* -0.02 -0.51 -0.79 -0.85_____ (0.19) (0.16) (0.14) (0.17)
b* 14.45 13.77 12.44 11.20______ (.8) (0.41) (0.21) (0.25)
-____ ____ SHADE C3 _ _ _ _ _ _ _ _ _ _
Dentin 0.0 mm U.3 mm 0.6 mm 0.9 mmPorc.
L* 67.92 64.54 62.13 60.71____ (0.36) (0.26) (0.41) (0.64)
a* 1.75 0.96 0.87 0.97____ (0.02) (0.13) (0.19) (0.17)
b* 17.96 19. 22 17.83 16.68L L(0. 38 ) 1(0.34) 1(0.50) 1(0. 58)_

64
Table 4. Mean (Standard Deviation) L*a*b* Values
For Vita VMI( 68
I_____________SHADE A3.5_ ___ ____
Dentin 0.0 mm 0.3 mm 0.6 mm 0.9 numPorc.
L* 75.16 68.59 64.86 62.65_____ (0.32) (0.56) (0.20) (0.19)
a* 1.28 2.10 2.82 3.09____ (0.83) (0.18) (0.19) (0.19)
b* 17.86) 23.84 24.53 23.92S(0. 45) (0.33) (0.27) (0.11)
I - *~~SHADE B1 ___ ___Dentin 0.0 mm 0.3 mm 0.6 mmn 0.9 mmPorc.
L* 78.56 74.92 72.20 70.42_____ (0.48) (0.22) (0.28) (0.20)
a* 1.01 0.49 0.23 0.13____ (0.13) (0.14) (0.12) (0.15)
b* 13.20 13.91 13.27 12.48(0.48) (0.13) (0.09) (0.12)
I___ ___ SHADE C3 _ _Dentin 0.0 mm 0.3 mm 0.6 mm 0.9 mmPorc.
L* 74.38 67.81 64.23 61.78____ (0.36) (0.36) (0.24) (0.22)
a* 1.01 0.67 0.94 1.10____ (0.13) (0.17) (0.14) (0.01)
b*k 17.34 20.40 20.33 19.00(0.27) (0.18) (0.13) (0.16)

65
TABLE 5. SUMMARY TABLE FOR THREE FACTORANALYSIS OF VARIANCE OF L*
SOURCE OF SL DF MS F SigVARIATION of F
Main Effects 7782.925 8 972.866 3751.804 .000Brand 190.057 3 63.352 244.315 .000Thickness 4078.926 3 1359.642 5243.386 .000Shade 3513.941 2 1756.970 6775.661 .000
2 Way Interactions 510.466 21 24.308 93.742 .000Brand-Thick 365.070 9 40.563 156.430 .000Brand-Shade 129.987 6 21.664 83.548 .000Thick-Shade 15.409 6 2.568 9.904 .000
3 Way InteractionsBrand-Thick-Shade 102.904 18 5.717 22.047 .000
Explained 8396.295 47 178.645 688.933 .000
Residual 62.233 240 .259
Total 8458.529 287 29.472

66
TABLE 6. SUMMARY TABLE FOR THREE FACTORANALYSIS OF VARIANCE OF a*
SOURCE OF SS DF MS F SigVARIATION of F
Main Effects 480.361 8 60.045 792.025 .000Brand 26.238 3 8.746 115.365 .000Thickness 28.306 3 9.435 124.457 .000Shade 425.817 2 212.909 2808.367 .000
2 Way Interactions 63.893 21 3.043 40.133 .000Brand-Thick 22.117 9 2.457 32.414 .000Brand-Shade 40.359 6 6.726 88.726 .000Thick-Shade 1.418 6 .236 3.117 .006
3 Way InteractionsBrand-Thick-Shade 29.189 18 1.622 21.39 .000
Explained 573.444 47 12.201 160.936 .000
Residual 18.195 240 .076
Total 591.639 287 2.061

67
TABLE 7. SUMMARY TABLE FOR THREE FACTORANALYSIS OF VARIANCE OF b*
SOURCE OF SS DF MS F SigVARIATION of F
Main Effects 3983.932 8 497.991 3639.516 .000Brand 114.537 3 38.179 279.027 .000Thickness 154.194 3 51.398 375.636 .000Shade 3715.201 2 1857.600 13576.070 .000
2 Way Interactions 589.702 21 28.057 205.053 .000Brand-Thick 366.614 9 40.735 297.706 .000Brand-Shade 165.229 6 27.538 201.260 .000Thick-Shade 57.359 6 9.560 69.867 .000
3 Way Interactions
Brand-Thick-Shade 104.779 18 5.821 42.543 .000
Explained 4677.912 47 99.530 727.405 .000
Residual 32.839 240 .137
Total 4710.751 287 16.414
68
Table 8. Tukey's Studentized Range TestFor L*
Thickness Microbond Ceramco Jelenko Vita VMK
(mm) II 1 68
Shade A3.5
0.0 77.14 70.56 70.80 75.16
0.3 69.18 66.60- 66.79 68.59
0.6 64.34 65.64- 64.78 64.86
0.9 61.28 64.78] 63.34 62.65
Shade B1
0.0 83.22 77.00 78.99 78.56
0.3 76.21 71.95 75.13 74.92
0.6 71.98 69.88 71.88 72.20
0.9 68.93 67.65 69.38 70.42
Shade C3
0.0 73.17 68.32 67.92 74.38
0.3 66.42 65.26- 64.54 67.81
0.6 63.04 64.321 62.13 64.23
0.9 60.47 63.66-1 60.71 61.78
] = No Significant Differences at the p<0.05 level

69
Table 9. Tukey's Studentized Range Test ResultsFor a*
Thickness Microbond Ceramco Jelenko Vita VMK(mm) II 11 68
Shade A3.5
0.0 4.261 4.42- 4.42 1.28
0.3 3.88 3.35 3.51 2.10
0.6 3.51 2.39 3.00 2.82]
0.9 3.39 1.68 2.56 3.09
Shade B1
0.0 1.60] -0.10 0.02 1.01
0.3 1.47- -0.30-- -0.47 0.49
0.6 0.46 -0.38 -0.75- 0.23u0.9 0.061 -0.35 -0.77- 0.13-
Shade C3
0.0 1.69 2.67 1.75 1.01
0.3 1.35- 1.97 0.96- 0.67
0.6 1.22- 1.36] 0.87- 0.94-
0.9 1 .3 4 1 1.04 0.97- 1.10-
] = No Significant Differences at the p<0.05 level
70
Table 10. Tukey's Studentized Range Test ResultsFor b*
Thickness Microbond Ceramco Jelenko Vita VMK(mm) I, I 1 68
Shade A3.5
0.0 18.71 22.861 24.90 17.86
0.3 22.651 22.50- 25.62 23.85.
0.6 23.63- 19.45 23.54 24.53-
0.9 23.52- 17.62 21.83 23.91
Shade B1
0.0 14.86 14.231 14.44 13.20-
0.3 15.59 14.11 13.78 13.91
0.6 15.78 11.76 12.44 13.27-
0.9 15.22 10.30 11.20 12.48
Shade C3
0.0 18.45 19.63- 17.97- 17.34
0.3 18.811- 19.62 19.21 20.40-
0.6 19.21 16.87 17.83- 20.34
0.9 18.27 -- 15.62 16.68 19.00
] = No Significant Differences at the p<0.05 level

71
Figure 1. Mean L* for shade A3.5 with increasing
dentin porcelain thickness.

0CD
(0
a.).
rr w
LL~ Z z0
-Dcc
ce) WU
z00

72
Figure 2. Mean L* for shade B1 with increasing
dentin porcelain thickness.

CC)
C; 0j6Um
ZD 0
~~C)oU 00- 0w
a. <W
I- 0
wj 0v o c C-4 o C)zco c fl- N CC 00

73
Figure 3. Mean L* for shade C3 with increasing
dentin porcelain thickness.

0c)
CYCD
I-
ZW
LL~ Co inZ z
zcC C') 0
00
~7 0; CCC' c
c cc) v N o qt oD 0

74
Figure 4. Mean a* for shade A3.5 with increasing
dentin porcelain thickness.
0o)0* 6
(D w
IC) Z
0 w in
0 zClw
ZEL 0z -J
CIOW

75
Figure 5. Mean a* for shade B1 with increasing
dentin porcelain thickness.
0)6;
CDOD
LL~'Z* z
0-0w
6z 0
uJ +z
0
I 0
LO) It cr) C'~j ~

76
Figure 6. Mean a* for shade C3 with increasing
dentin porcelain thickness.

CYCD
C~)
0 z0 w
IIZ W- oa:
wwczz
0
0a:
C)) C'J -

77
Figure 7. Mean b* for shade A3.5 with increasing
dentin porcelain thickness.

C; )
w
0 LLJ
LLQ Z z
F- 0
00

78
Figure 8. Mean b* for shade B1 with increasing
dentin porcelain thickness.
0)
0 z0
w
00 Z z
I C CC
0c <
w 6i
z00
J~J c~Jc' 1~1~22cc

79
Figure 9. Mean b* for shade C3 with increasing
dentin porcelain thickness.

0)
OD
C~)w
o0m0 C/)Z
0* 6
Wo
090CCY)
00
zo00c
co2 c o>o D ICN M N N V - T -

80
Table 11. Interobserver Reliability by AlphaCoefficient Analysis
A. Correlation Matrix
EI MS RS DR BB SK JB
EI 1
MS .398 1
RS .557 .581 1
DR .007 .509 .436 1
BB .063 .586 .505 .604 1
SK .138 .473 .518 .594 .453 1
JB .044 .473 .429 .579 .739 .511 1
B. Alpha Coefficient Analysis
Rater Corrected Rater Alpha ifTotal Correlation Rater Deleted
EI .247 .871
MS .704 .808
RS .706 .803
DR .633 .815
BB .682 .806
SK .615 .818
JB .645 .812
Overall Standardized Rater Alpha = 0.845

81
Table 12. Summary of Kruskal-Wallis One-Way Analysisof Variance Between Thickness Within Brand
Brand Shade K-W test LOS *
Microbond A3.5 8.14 0.0432 +Ceramco II 11.57 0.0090 +Jelenko 12.20 0.0067 +Vita VMK 68 17.49 0.0006 +
Microbond B1 6.19 0.1026Ceramco II 6.90 0.0753Jelenko 5.37 0.1467Vita VMK 68 5.22 0.1563
Microbond C3 15.22 0.0016 +Ceramco II 15.29 0.0016 +Jelenko 3.74 0.2910Vita VMK 68 3.63 0.3045
* = Level of significance using Chi-square distribution with 3
degrees of freedom and 28 cases in each Brand-Shade group.
+ = Significant differences at the p<0.05 level

82
Table 13. Results of Mann-Whitney Rank Sum TestBetween Thickness Within Brands
Shade A3.5
Brand Thickness (mm) Mean Rating (Standard Dev.)
Microbond 0.0 F 1.57 (0.78)0.3j 3.57 (1.39)0.6 2.86 (1.34)0.9 2.00 (1.41)
Ceramco II 0.0 1.57 (0.78)0.3 3.57 (0.97)0.6 3.43 (0.97)0.9 2.71 (1.11)
Jelenko 0.0 3.71 (1.11)0.3 2.29 (0.95)0.6 3.29 (0.95)0.9 L4.43 (0.53)
Vita VMK 68 0.0 1.00 (0.00)0.3 r 2.71 (1.11)0.6 2.29 (0.48)0.9 1.29 (0.48)
[ = No significant differences at the Alpha< 0.05 level

83
Table 14. Results of Mann-Whitney Rank Sum TestBetween Thickness Within Brands
Shade B1
Brand Thickness (mm) Mean Rating (Standard Dev.)
Microbond 0.0 2.00 (1.15)0.3 1.29 (0.48)0.6 1.00 (0.00)0.9 L1.43 (1.13)
Ceramco II 0.0 3.14 (0.89)0.3 2.29 (1.11)0.6 3.71 (1.38)0.9 L2.14 (1.46)
Jelenko 0.0 [4 .0 0 (0.57)0.3 F3.00 (1.29)0.6 4.29 (0.95)0.9 3.71 (0.75)
Vita VMK 68 0.0 r1 .8 6 (0.89)0.3 -2.29 (0.95)0.6 2.00 (1.00)0.9 1.29 (0.48)
[=No significant differences at the Alpha< 0.05 level

84
Table 15. Results of Mann-Whitney Rank Sum TestBetween Thickness Within Brands
Shade C3
Brand Thickness (mm) Mean Rating (Standard Dev.)
Microbond 0.0 F3.14 (1.21)0.3 3.29 (1.11)0.6 3.43 (0.53)0.9 1.00 (0.00)
Ceramco II 0.0 E1. 7 1 (1.11)0.3 l1.8 6 (0.69)0.6 r4.29 (0.48)0.9 3.86 (1.46)
Jelenko 0.0 r2.29 (0.95)0.3 2.00 (1.29)0.6 3.14 (1.46)0.9 3.00 (1.15)
Vita VMK 68 0.0 F3.29 (1.60)0.3 13.29 (0.95)0.6 3.14 (0.89)0.9 2.14 (1.57)
[ = No significant differences at the Alpha< 0.05 level

85
Table 16. Summary of Kruskal-Wallis One-Way Analysisof Variance for Brand
Shade K-W test LOS *
A3.5 2.36 0.5017
B1 8.19 0.0422 +
C3 11.61 0.0089 +
* = Level of significance using Chi-square distribution with 3degrees of freedom and 28 cases in each Brand-Shade group.
+ = Significant differences at the p<0.05 level

86
Table 17. Results of Mann-Whitney Rank Sum TestBetween Brands Within Shade
Brand Thickness (mm) Shade Mean Rating (Standard Dev.)
Microbond 0.3 A3.5 13.57 (1.39)Ceramco II 0.3 3.57 (0.97)Jelenko 0.6 3.29 (0.95)Vita VMK 68 0.3 2.71 (1.11)
Microbond 0.3 B1 [-1.29 (0.48)Ceramco II 0.3 r2.29 (1.11)Jelenko 0.3 3.00 (1.29)Vita VMK 68 0.3 L12.29 (0.95)
Microbond 0.3 C3 T3.29 (1.11)Ceramco II 0.6 j4.29 (0.48)Jelenko 0.3 2.00 (1.29)Vita VMK 68 0.3 3.29 (0.95)
[ = No significant differences at the Alpha< 0.05 level

87
V. Discussion
The control of color in dental porcelain is critical to the
development of an esthetically successful restoration. Two primary
methods of color analysis have been used to evaluate the color
and/or shade of dental porcelain: colorimetric measurement with an
instrument and subjective observer color analysis.
The HunterLab Colorimeter was used to record Y, X, and Z
tristimulus values because of its simplicity, availability, and
reproducibility needed for this investigation. Although
spectrophotometers are considered to be a more accurate instrument
for broad range color measurement, colorimeters are believed to
yield comparable data for tooth color (Goodkind et al., 1985).
Furthermore, instruments with different viewing geometries have
been shown to give consistent results when changes in color are
evaluated (Seghi, 1990).
The recorded Y, X, and Z tristimulus values were
mathematically converted to L*, a*, and b* values. The CIE L*a*b*
notation is the standard international color ordering system and
the three dimensions (L*, a*, and b*) correlate to interpretable
parameters of color (value, red-green, and blue-yellow,
respectively).
Because there are no specified target L*, a*, and b* values
for a particular shade of dental porcelain, interpretation of these
data can be confusing and even meaningless. In an effort to lend
clinical relevance to this information, subjective observers were

88
used in conjunction with instrumental means to analyze the
specimens (Jacobs et al., 1987). The seven subjective observers
were selected only after they had been tested and found to possess
normal color acuity, because approximately 8% of all men and 0.4%
of all women have some degree of anomalous color vision (Pau,
1988).
The L*a*b* data were used to characterize the color changes
between different thicknesses of dentin porcelain while the
subjective observer data were used to determine the shade matching
ability of the different dentin porcelain thicknesses.
A. L* Comparisons Between Thicknesses Within Brand-Shade
1. L* For Shade A3.5
Graph analysis of change in L* values for shade A3.5 shows
that Ceramco II and Jelenko porcelains have lower value opaques
while Vita VMK 68 and Microbond had the higher value opaques
(Figure 1 and Table 8). While the value level for Ceramco II
porcelain decreased significantly between the opaque layer and the
0.3 mm dentin porcelain thickness, it remained relatively unchanged
between the 0.3 and 0.6 mm dentin porcelain thicknesses. Microbond
porcelain had the largest decrease in value (L*) at each thickness
while the L* value for Jelenko and Vita VMK 68 porcelains decreased
to a lesser extent between each successive thickness of dentin
porcelain. For shade A3.5, only one of the three shade matched
89
opaque systems, Ceramco II, had improved L* (value) constancy with
increasing dentin porcelain thickness. Furthermore, one of the
shade-matched opaque systems (Microbond) had the greatest amount of
L* change with increasing dentin porcelain thickness.
2. L* For Shade B1
Analysis of change in L* values for shade B1 shows that
Ceramco II porcelain has lower L* means for the opaque and all
other dentin porcelain thicknesses while Microbond porcelain has
higher L* opaque values (Figure 2 and Table 8). Ceramco II,
Jelenko, and Vita VMK 68 porcelains followed similar patterns of
gradual decreases in L* means as dentin porcelain thickness is
increased. However, Microbond porcelain has a larger decrease for
each addition of dentin porcelain over these same B1 thicknesses.
For shade Bl, those porcelain systems with shade-matched opaques,
as well as the non-shade-matched opaque system, lacked color
constancy for L* (value) as dentin porcelain thickness increased.
3. L* For Shade C3
Analysis of change in L* values for shade C3 showed that
Ceramco II and Jelenko samples again had lower opaque L* means
while Microbond and Vita VMK 68 specimens had higher opaque L*
means (Figure 3 and Table 8). As with shade A3.5, Ceramco II
remained relatively unchanged between thicknesses of 0.3, 0.6, and

90
0.9 mm of dentin porcelain. Jelenko, Microbond, and Vita VMK 68
porcelains all had significant decreases in L* means as dentin
porcelain became thicker. Microbond and Vita VMK 68 porcelains
followed a near parallel pattern of mean L* decrease with
increasing dentin porcelain thicknesses. For shade C3, only one of
the shade-m:tched opaque porcelain systems, Ceramco II, had
improved L* (value) constancy with increasing dentin porcelain
thickness. Furthermore, the greatest amount of L* change occurred
with one of the shade-matched opaque systems (Microbond).
4. Summary of L* Comparisons
Overall, two shades of one shade-matched opaque porcelain
system, Ceramco II shades A3.5 and C3, had L* values that were
unaffected by increases in dentin porcelain thicknesses past 0.3
mm. This was interpreted to mean that the addition of dentin
porcelain beyond 0.3 mm would not alter the value significantly.
However, all three shades of Microbond, also reported to have
shade-matched opaques, consistently had the greatest decreases in
L* means with increasing dentin porcelain thicknesses. All other
brand-shade combinations fell in between with smaller but
consistent decreases in L* means, than those of Microbond, with
increasing dentin porcelain thicknesses.
The overall decrease in L* means with increasing thickness of
dentin porcelain for all shades of Microbond, Jelenko, and Vita VMK
68 and shade B1 of Ceramco II metal ceramic porcelains is in

91
agreement with previous reports by Moser and Meyer (1983), Jacobs
and others (1987), and Terada and others (1989a). On the other
hand, two shades (A3.5 and C3) of the Ceramco II porcelain had
decreasing L* means with increasing dentin porcelain thickness but
the decreases were not statistically significant. In contrast to
previous studies where L* (value) was found to decrease as dentin
porcelain thickness increased, this investigation has shown that
there are brand-shade combinations where L* does not significantly
change as dentin porcelain thickness increases.
B. a* Comparisons Between Thicknesses Within Brand-Shade
1. a* For Shade A3.5
Graph analysis of a* (red-green) changes for shade A3.5
revealed that Vita VMK 68 began with the lowest mean a* for the
opaques and steadily increased with increasing thicknesses while
Microbond, Ceramco II, and Jelenko had the highest a* means and
these means decreased with increasing thicknesses (Figure 4 and
Table 9). Since these a* mean values were all positive they
represented varying quantities of red coloration. Both Ceramco II
and Jelenko porcelain samples had consistently significant
decreases in a* means for each increase in dentin porcelain
thickness. Microbond porcelain a* means, while decreasing slightly,
were not significantly changed with increasing dentin porcelain
thicknesses after the 0.3 mm level. Vita VMK 68 porcelain a* means

92
levelled off after 0.6 mm of dentin porcelain thickness and did not
significantly change at 0.9 mm.
2. a* For Shade B1
Analysis of the a* means for shade B1 revealed that Microbond
and Vita VMK 68 porcelains had low amounts of red (low +a* means)
that decreased with increasing thicknesses of dentin porcelain
(Figure 5 and Table 9). The a* means for Vita VMK 68 porcelain
decreased between the opaque only, the 0.3, and 0.6 mm dentin
porcelain thicknesses with no significant changes beyond 0.6 mm.
The a* means for Microbond porcelain had a sharp decrease between
the 0.3 and 0.6 mm thicknesses but were not significantly changed
beyond 0.6 mm of dentin porcelain thickness. On the other hand,
Ceramco II and Jelenko porcelains had low amounts of green (low -a*
means) that increased with increasing dentin porcelain thickness
(more negative a* values indicating an increase in green). The a*
means for Ceramco II porcelain levelled off beyond the 0.3 mm
thickness while Jelenko porcelain levelled off beyond the 0.6 mm
dentin porcelain thickness.
3. a* For Shade C3
Analysis of a* means for shade C3 showed that all values were
in the positive range indicating varying amounts of red (Figure 6
and Table 9). Ceramco II porcelain had the highest a* means and
93
these means significantly decreased until the 0.6 mm dentin
porcelain thickness, after which there was no significant change.
Vita VMK 68 porcelain had the lowest a* means that initially
decreased at 0.3 mm dentin porcelain thickness then increased to
levels that were not significantly different from the opaque only
a* mean. Both Microbond and Jelenko porcelains levelled off at the
0.3 mm dentin porcelain thickness and had no significant changes in
a* means with increasing thicknesses.
4. Summary of a* Comparison
Overall, it was clear that the red-green color changes with
increasing dentin porcelain thickness were variable depending on
the brand and shade.
At 0.3 mm of dentin porcelain thickness four brand-shade
combinations achieved a stable a* value (redness) with no
significant change at increased dentin porcelain thicknesses. All
were shade-matched opaque porcelain systems. They were, Micrubond
shades A3.5 and C3, Ceramco II shade BI, and Jelenko shade C3. This
was interpreted to indicate that the red color that is achieved
with these porcelains is optimized at a dentin porcelain thickness
of 0.3 mm. Consequently, there is no further advantage in
increasing dentin porcelain thickness beyond 0.3 mm for this
particular dimension of color.
In the same manner, at 0.6 mm of dentin porcelain thickness
six brand-shade combinations achieved a stable a* value (redness).

94
Three used non-shade-matched opaque (Vita VMK 68 shades A3.5, BI,
and C3), and three used shade-matched opaques (Jelenko shade BI,
Ceramco II shade C3, and Microbond shade BI).
Shade A3.5 of both Ceramco II and Jelenko, both with shade-
matched opaque systems, had significant changes in a* means at each
increase including the 0.9 mm dentin porcelain thickness.
Red-green (a*) color constancy with increasing dentin
porcelain thickness was not more likely to occur with shade-matched
opaque porcelain systems than with the non-shade matched opaque
system.
C. b* Comparisons Between Thickness Within Brand-Shade
Analysis of the b* data revealed that all of the values were
in the positive range indicating various levels of yellow and no
blue (-b*). The b* means were variable with increasing thickness
depending on brand and shade.
1. b* For Shade A3.5
Graph analysis of b* (yellow) for shade A3.5 showed that
Jelenko porcelain had the highest opaque only b* mean (Figure 7 and
Table 10). The Jelenko b* mean significantly changed for each
successive increase in dentin porcelain thickness. Vita and
Microbond porcelains showed similar patterns of increasing b* with
increasing thickness that levelled off beyond 0.3 mm of dentin

95
porcelain thickness. The b* means for Ceramco II porcelain had no
significant change between the opaque only and the 0.3 mm dentin
porcelain but then significantly decreased with successive
increases in dentin porcelain thickness.
2. b* For Shade B1
Graph analysis of b* for shade B1 showed that Microbond
porcelain had the highest means and remained relatively unchanged
for all thicknesses of dentin porcelain (Figure 8 and Table 10).
Ceramco II and Jelenko porcelains were similar with significant
decreases in b* as dentin porcelain thickness increased. Both
Microbond and Vita VMK 68 porcelains had an initial increase in b*
means followed by a decrease to (Microbond) or below (Vita VMK 68)
the opaque only b* mean at 0.9 mm of dentin porcelain thickness.
3. b* For Shade C3
Analysis of the b* data for shade C3 revealed that Microbond
porcelain again remained relatively unchanged with increasing
dentin porcelain thickness (Figure 9 and Table 10). The b* mean for
Vita VMK 68 porcelain increased significantly at 0.3 mm, remained
unchanged at 0.6 mm, and then decreased at 0.9 mm of dentin
porcelain thickness. Ceramco II porcelain remained the same at 0.3
mm, then decreased at 0.6 and 0.9 mm of dentin porcelain thickness.
Jelenko b* reans increased significantly at 0.3 mm then decreased

96
at 0.6 and 0.9 mm of dentin porcelain thickness.
4. Summary of b* Comparisons
The overall b* pattern was dependent both on brand and shade
of porcelain. For example, the Ceramco II b* means were
statistically the same between the opaque only and 0.3 mm but then
decreased (less yellow) at 0.6 and 0.9 mm of dentin porcelain
thickness for all three shades.
With the exception of the opaque only and 0.3 mm thickness for
shade A3.5, Microbond b* means remained relatively constant with
increasing dentin porcelain thickness. This was interpreted to mean
that no advantage in the yellow color space would be obtained by
increasing the dentin porcelain thickness beyond 0.3 mm.
Jelenko and Ceramco II porcelains had the lowest b* means at
0.6 and 0.9 mm of dentin porcelain for all three shades (least
amount of yellow).
Overall, the porcelain systems with shade-matched opaques did
not have better b* (yellow) constancy with increasing dentin
porcelain thickness than the non-shade-matched system.
D. Summary of L*, a*, and b* Observations
Caution should be exercised when comparing the combined L*a*b*
color changes between groups. For example, between 0.3 mm and 0.6

97
mm of dentin porcelain thickness, Ceramco II shade A3.5 had no
significant change in value (L*), a moderate decrease in red (a*)
of about 1.0 unit, and a marked decrease in yellow (b*) of about
3.0 units. The greater decrease in yellow causes a shift in hue
because there is now relatively more red. Since both red and yellow
decreased, chroma also would be expected to decrease. The question
still remains: at what proportion of red-to-yellow does the
specimen match the shade tab? Furthermore, since the human eye is
most sensitive to value (L*) changes, would the relatively non-
significant decrease in L* be seen while the hue and chroma (a* and
b*) changes remain undetected? Presently there is insufficient
information to accurately relate the L*a*b* data to actual human
visual perception (Kuehni and Marcus, 1979).
Nevertheless, L*a*b* data can reveal important characteristics
of color change when dentin porcelain thickness is increased. For
example, if all three color parameters (L*, a* and b*) were
constant and did not significantly change with increasing dentin
porcelain thickness, no further color advantage would be gained by
increasing this thickness. This was not the case for any of the
brand-shade combinations tested in this investigation. At least one
of the L*a*b* parameters changed with successive increases of
dentin porcelain thickness for all brand-shade combinations.
There was only one combination, Microbond shade A3.5, that had
two color parameters (a* and b*) which remained the same beyond 0.3
mm of dentin porcelain thickness. Only two brand-shade combinations
had two color parameters that remained constant beyond 0.6 mm of

98
dentin porcelain thickness, Vita VMK 68 shade A3.5 (a* and b*) and
Ceramco II shade C3 (L* and a*).
Based on L*, a*, and b* changes with increasing dentin
porcelain thickness, the reportedly shade-matched opaque porcelain
systems do not have better color stability than the non-shade-
matched system with increasing dentin porcelain thickness. Color
stability was variable depending on both brand and shade of
porcelain with increasing dentin porcelain thickness.
Jacobs et al. (1987) found that value decreased with
increasing dentin porcelain thickness for two shades (A3 and C4)
and stayed the same for one shade (Bi) of Vita VMK 68 porcelain.
This investigation found that all three shades (A3.5, BI, and C3)
of Vita VMK 68 porcelain decreased in L* or value with increased
dentin porcelain thickness. The fact that the B1 value did not
change in the Jacobs et al. study but decreased in this
investigation could be accounted for by the difference in opaque
thickness. The 0.1 mm of opaque thickness in the Jacobs et al.
study most likely had a lower value, from the influence of
incompletely masking the metal substructure, than the 0.3 mm of
opaque thickness in this investigation so that increased dentin
porcelain thickness did not significantly change the value.
The stability of L* values beyond 0.3 mm of dentin porcelain
thickness for Ceramco II shades A3.5 and C3 in this investigation
is in contrast to the decreased value with increasing thickness of
other investigations (Jacobs et al., 1987; Terada et al., 1989a).
This points out that changes in value with increasing porcelain

99
thickness are dependent on shade and brand of metal ceramic
porcelain.
The changes in a* (red) values in this investigation decreased
or remained unchanged for all brand-shade combinations except for
Vita VMK 68 shade A3.5, which had an increase in a* with increasing
dentin porcelain thickness. Terada et al. (1989a) also found an
increase in a* for Vita VMK 68 shade A2 at increased dentin
porcelain thickness. This difference between the Vita VMK 68 shade
A3.5 and the other three brands of shade A3.5 is most likely
related to the remarkably low positive a* value of the Vita VMK 68
shade A3.5 opaque porcelain.
Changes in b* (yellow) with increasing dentin porcelain
thickness were more variable than either L* or a* depending on
brand and shade.
E. Subjective Observer Rating
The color vision evaluation of the subjective observers was
designed to detect any observers with anomolous color vision so
that such individuals could be excluded from the study if found.
The selection of the appropriate screening tests for color vision
analysis was made by the Chief, Visual Electrodiagnostic
Laboratory, Brooks AFB, Texas. This individual holds a doctoral
degree in ocular electrophysiology.
The PIP test is widely used to screen for congenital
deficiencies in color vision. It is a relatively sensitive screen
100
for red-green deficiencies but does not detect blue-yellow defects
(Romanchuk, 1983). Approximately 4% of individuals with red-green
color vision anomalies will test normal with the PIP test. The APT
5 is also used to screen for congenital red-green color
deficiencies. While approximately 5% of the individuals with red-
green color anomalies will test normal with the APT 5, these
persons generally are not the same as those missed by the PIP test.
By combining these tests, fewer red-green color deficient
individuals escape detection than when the tests are aaministered
individually (Report of working group 41, National Academy of
Sciences, 1981).
While yellow-blue color deficiencies are rare (0.002% of the
population), they can be effectively identified with the FM 100 H
test (Benson, 1989).
Considering the variability in human visual perception, it is
not surprising that 100% interobserver reliability (alpha=l) was
not attained. Culpepper (1970) found wide disagreement between
dentists in shade matching the same tooth. Moreover, individual
dentists could only repeat the same shade selection on different
days 22% of the time.
An overall alpha coefficient of 0.8 or greater is considered
an acceptable level of interrater reliability and the experimental
testing procedure should be reconsidered if the alpha coefficient
is 0.3 or less (Nunnally, 1967). The overall alpha coefficient for
the subjective observers in this study was 0.845, indicating an
acceptable level of reliability.

101
Correlation coefficients between 0.4 and 0.7 indicate fair
interobserver reliability, while values above 0.7 signify good
reliability (SPSS reference guide, 1990). Six of the observers in
this study had fair (0.429) to good (0.739) interobserver
reliability.
The one rater (EI) with the poorest correlation coefficients
was not excluded from the analyses for three reasons. First, this
rater still may represent a valid variation of human color
perception. Second, the overall alpha coefficient did not
dramatically improve when this rater's data was deleted (Table 11-
B). And third, the alpha coefficient was still above 0.8 when this
rater's data are included.
The overall mean rankings of the porcelain specimens were
relatively low. As in the study by Evans (1988), very few specimens
were rated as actually matching the shade tab exactly the same (5)
or nearly the same (4). This finding may be due to three factors.
First, the shade tab standards were 2.2 mm thick and composed
of only dentin porcelain while the test specimens were metal backed
substructures with opaque and dentin porcelains. Granted, it is not
ideal to be matching objects of differing composition for shade
similarity, yet this is the clinical method that is used in
dentistry for many practitioners (Sorensen and Torres, 1988).
Second, differences in surface texture between the shade tab
and the specimens could account for the low number of the specimens
that were rated as closely approximating the shade tab. By
convention, opaque porcelain specimens are not polished or glazed,

102
so that there was a definite surface texture difference. The dentin
porcelain specimens, on the other hand, were polished and glazed to
match the surface texture of the shade tab as closely as possible.
Finally, a third possible reason for the poor match between
the specimens and the shade tabs could be that the porcelains
themselves do not accurately reproduce the shade tab colors. Based
on the variability of L*, a*, and b* values for the same shade of
different brands of porcelain found in this study and other reports
(Seghi et al., 1986; Evans, 1988; Rosenstiel and Johnston, 1988),
it is clear that different brands of porcelain of the same nominal
shade do not equally match the Vita Lumin shade tabs.
1. Subjective Observer Rating of Shade A3.5
Analysis of the subjective observer rankings for shade A3.5
showed that there were not significantly better shade matches
beyond 0.3 mm of dentin porcelain thickness for Microbond, Ceramco
II, or Vita VMK 68 porcelains (Table 13). This finding was
interpreted to mean that the best shade match with these porcelains
was obtained at this thickness and that additional thickness of
A3.5 dentin porcelain did not contribute to improved shade
matching. While the highest mean rank for Jelenko shade A3.5 (4.43
± 0.53) was obtained at 0.9 mm of dentin porcelain thickness, this
was not significantly different from the 0.6 mm mean rank.
Therefore additional thickness of dentin porcelain beyond 0.6 mm
did not significantly improve the shade match for Jelenko A3.5.

103
Overall, the Jelenko A3.5 porcelain had the highest rating or
best shade match for opaque only (3.71 ± 1.11) and 0.9 mm (4.43 ±
0.53) of dentin porcelain. The Vita VMK 68 opaque had the lowest
rank (1.00 ± 0.00) or poorest shade match with all seven observers
ranking it "not at all the same." The specimens with the thinnest
dentin porcelain thickness beyond which no improvement in mean rank
was observed were selected for each brand of shade A3.5 (0.3 mm of
dentin porcelain for Microbond, Ceramco II, and Vita VMK 68
porcelains, and 0.6 mm of dentin porcelain for Jelenko). Comparison
revealed no significant differences in shade matching between these
specimens (Tables 16 and 17).
2. Subjective Observer Rating of Shade B1
Analysis of the mean rank data for all four brands of shade B1
revealed that no significant differences in shade match existed
between thicknesses of dentin porcelain (Table 14). This outcome
was interpreted to mean that dentin porcelain thicknesses beyond
0.3 mm did not improve shade match with the B1 shade tab for any of
the four evaluated porcelains.
The fact that subjective observers could not discriminate
between different thicknesses of shade B1 is consistent with the
results of Jacobs and others (1987). This difficulty with
discrimination of shade B1 occurred for all four brands of
porcelain. Jacobs and others interpreted this to mean that when the
opaque porcelain shade more closely matched the dentin porcelain

104
shade, a shade match would be achieved at thinner dentin porcelain
thicknesses. However, analyses of the L*, a*, and b* means in this
study with increasing thicknesses of dentin porcelain do not
support this contention.
L* means (value) were high and, though they decreased with
increasing dentin porcelain thicknesses for shade BI, they remained
high in comparison to shades A3.5 and C3. There were significant
changes for a* (red-green) and b*(yellow) for some brands of shade
B1, however these absolute values were at low chroma levels. It is
more likely that this low chroma is very near or below the
threshold detection level for visual receptors and, consequently,
color changes at this level are not readily discernible.
Of all of the shade B1 mean subjective rankings, Jelenko had
the highest rating (4.29 ± 0.95) at 0.6 mm while Microbond had the
lowest rating (1.00 ± 0.00) at 0.6 mm of dentin porcelain
thickness. Jelenko had consistently higher mean rankings at all
thicknesses of dentin porcelain for shade B1. Improvement in shade
matching ability was not observed beyond 0.3 mm of dentin porcelain
thickness for shade B1 for any of the four brands evaluated. The
0.3 mm of dentin porcelain Microbond B1 specimen had a
significantly lower mean rank than the 0.3 mm dentin porcelain
Jelenko B1 specimen (Tables 16 and 17). This finding was
interpreted to mean that the observers felt Jelenko porcelain more
closely matched the shade tab.

105
3. Subjective Observer Rating for Shade C3
Analysis of the mean rankings for shade C3 revealed that there
were no significant differences between thicknesses of Jelenko or
Vita VMK 68 porcelains (Table 15). This was interpreted to mean
that no significant improvement in shade match resulted from
increasing the dentin porcelain thickness beyond 0.3 mm. Ceramco II
mean rankings for 0.6 and 0.9 mm were significantly better than the
rankings for 0.3 mm of dentin porcelain thickness. This was
believed to indicate that increasing the dentin porcelain thickness
beyond 0.6 mm would not significantly improve shade match.
Microbond mean rankings for 0.3 and 0.6 mm were significantly
better than the 0.9 mm of dentin porcelain thickness. Apparently,
with this particular porcelain and shade combination, increasing
the thickness of dentin porcelain beyond 0.3 mm would not
significantly improve the shade match. In fact, an increase of
dentin porcelain thickness to 0.9 mm actually was considered
detrimental to the shade match.
The mean rank for Ceramco II at 0.6 mm of dentin porcelain
thickness (4.29 ± 0.48) was the highest or best match and the mean
rank for Microbond at 0.9 mm of dentin porcelain thickness (1.00 ±
0.00) was the lowest or poorest shade match. The Ceramco II 0.6 mm
dentin porcelain mean rank was significantly higher than the
Jelenko 0.3 mm dentin porcelain mean rank (Tables 16 and 17).

106
4. Summary of Subjective Observer Rating
Overall, the porcelain systems that used shade matched opaques
did not achieve their best shade match at thinner dentin porcelain
thicknesses than the non-shade matched opaque system. With only two
exceptions, all brand-shade combinations were selected by
subjective observers to have achieved a best shade match by 0.3 mm
of dentin porcelain thickness. Although some brand-shade
combinations received a higher rating at greater thicknesses of
dentin porcelain, these combinations were usually not statistically
different from the rating at 0.3 mm of dentin porcelain. One
possible conclusion is that overall shade match is not influenced
as much by opaque color or dentin porcelain thickness as it is by
brand (ie. particular composition of the porcelain powder).
Jacobs and others (1987) found that their subjective observers
had difficulty arranging specimens with 1.0 mm and specimens with
1.5 mm of dentin porcelain in order from light to dark. They
concluded that a dentin porcelain thickness of 1.0 mm was of
sufficient bulk to produce a good esthetic result, and it may not
be necessary to use a 1.5 mm thickness. It must be pointed out,
however, that these subjective observers were not comparing the
specimens to a shade tab and that they were ordering them by value,
not by hue or chroma.
The results of this investigation indicated that shade
matching for most of the brand-shade combinations was not
significantly better at thicknesses greater than 0.3 mm of dentin

107
porcelain. Only 17% of the brand-shade combinations (2/12), Jelenko
shade A3.5 and Ceramco II shade C3, required 0.6 mm of dentin
porcelain thickness to achieve the highest shade match. These
findings indicated that, for the vast majority of specimens (10/12,
or 83%), a 0.3 mm thickness of overlying dentin porcelain is
required to achieve a closest match (for that particular porcelain)
to a dentin shade tab. However, the exact thickness for some shades
may be brand and shade dependent.
Generally accepted guidelines for the facial reduction of
tooth structure to provide adequate space for development of
esthetics in a metal ceramic restoration range from 1.2 to 1.5 mm
(McLean, 1979; Yamamoto, 1985). These depths are based on the
requirement of 0.3 mm of metal substructure, 0.2 mm of opaque
porcelain, and a minimum of 0.7 mm of dentin porcelain (McLean,
1979). The results of this study suggest that in vivo testing is
needed to detc. mine if the minimum requirement of 0.7 mm of dentin
porcelain thickness should be reconsidered. It may be that a dentin
porcelain thickness of 0.3 mm may be adequate for many shades and
brands of dentin porcelain.
Future studies regarding the thickness of porcelain should
include clinical evaluation of variable thickness of dentin
porcelain. The intraoral environment may yield different results
because the background and lighting parameters dramatically differ
from evaluation on a neutral gray background with controlled
illumination. In addition, dentin porcelain thicknesses less than
0.3 mm should be evaluated to delineate the minimum requirements of

108
dentin porcelain thickness to provide clinically acceptable shade
matching.
109
VI. SUMMARY
This investigation was designed to examine the effects of
thickness and brand on the shade of dentin porcelain. Two hundred
eighty-eight metal ceramic specimens were made using a custom shade
tab device. Three Vita Lumin shades (A3.5, B1, and C3) of three
commercially available dental porcelains that reportedly use shade-
matched opaques (Microbond, Ceramco II, and Jelenko) and one
commercially available dental porcelain that does not use shade-
matched opaques (Vita VMK 68) were used to make six specimens in
each of four thicknesses (opaque only, and 0.3, 0.6, and 0.9 mm of
dentin porcelain).
Y, X and Z tristimulus values were measured using the
HunterLab Colorimeter and converted to CIE L*, a*, and b* color
coordinates for each specimen. Seven observers, who tested normal
for color acuity, made subjective analyses of representative
specimens from each brand-shade-thickness group to rate the level
of shade match to a dentin porcelain shade tab. The following
results and conclusions can be drawn from this investigation:
1. Significant decreases in L* (value) were noted between
thicknesses within most (10/12 or 83%) of the brand-shade
combinations evaluated (p<0.05).
2. Only two brand-shade combinations (2/12 or 17%) had few
(Ceramco II shade A3.5) or no (Ceramco II shade C3)
significant changes in L* (value) between thicknesseE of
dentin porcelain (p<0.05).

110
3. Significant differences in a* (red-green) values were
noted between thicknesses depending on brand and shade
(p<0.05).
4. Significant differences in b* (yellow-blue) values were
noted between thicknesses depending on brand and shade
(p<0.05).
5. Based on L*, a*, and b* changes, color constancy with
increasing thickness of dentin porcelain was dependent on
brand and shade. In addition, the porcelain systems that
used shade matched opaques did not exhibit more color
constancy with increasing dentin porcelain thickness.
6. The L*a*b* variability between different thicknesses of
dentin porcelain suggests that manufacturers should
recommend specific dimensions for thickness of dental
porcelain for each shade to achieve adequate shade matching.
7. Subjective observers found that shade-matched opaques
were not more likely to achieve a shade match at thinner
dentin porcelain thicknesses than the system that did not
have shade-matched opaques.
8. For 83% of the brand-shade combinations, the subjective
observers found that 0.3 mm was considered an adequate
thickness of dentin porcelain to achieve a closest match to
the dentin shade tab (for that particular porcelain).
Increased thickness of dentin porcelain will not necessarily
improve and, for at least one brand-shade combination, may impair
shade matching.

111
The results of this study indicate that opaque porcelain color
and thickness of dentin porcelain may not have as much effect on
overall shade match as the brand of dental porcelain.
The generally held belief that 0.7 mm of dentin porcelain
thickness is required to provide adequate shade matching has been
called into question. Within the parameters of this study, many
shades and brands of metal ceramic porcelain, 0.3 mm of dentin
porcelain thickness may be adequate to provide a best shade match
for a particular porcelain brand.
112
LITERATURE CITED
Barghi, N.: Color and glaze : effects of repeated firings. JProsthet Dent 47:393, 1982.
Barghi, N. and Goldberg, J.: Porcelain shade stability afterrepeated firings. J Prosthet Dent 37:173, 1977.
Barghi, N. and Lorenzana, R.E.: Optimum thickness of opaque andbody porcelain. J Prosthet Dent 48:429, 1982.
Barghi, N. and Richardson, T.: A study of various factorsinfluencing shade of bonded porcelain. J Prosthet Dent 39:282,1978.
Benson, W.E.: An introduction to color vision, ch. 6 in Duane'sClinical Ophthalmology, Vol. 3. W. Tasman and E.A. Jaeger, editors,Philadelphia, 1989, J.B. Lippincott Company,
Binns, D.B.: The chemical and physical properties of dentalporcelain. From Dental Ceramics Proceedings of the FirstInternational Symposium on Ceramics. J.W. McLean, editor, Chicago,1982, Quintessence Publishing Co., Inc, pp 41-82.
Brewer, J.D., Akers, C.K., Garlapo, D.A. and Sorensen, S.E.:Spectrometric analysis of the influence of metal substrates on thecolor of metal ceramic restorations. J Dent Res 64:74, 1985.
Brewer, J.D., Glennon, J., Garlapo, D.A., Tedesco, L.A. and Lowrie,G.: Spectometric analysis of metal ceramic coupons using Vita's VMK68N porcelain. (Abstract #141) J Dent Res (Special Issue) 68:199,1989.
Chiche, G.J. and Pinault, A.: Essentials of Dental Ceramics.Chicago, 1988, Yearbook Medical Publishers, Inc.
Clark, B.E.: An analysis of tooth color. J Amer Dent Assoc 18:2093,1931.
Clark, B.E.: Tooth color selection. J Amer Dent Assoc 20:1065,1933.
Clark, R.G.: Essentials of Clinical Neuroanatomy andNeurophysiology, 5th edition. Philadelphia, 1975, F.A. Davis Co.
Clarke, F.J.J.: Measurement of color of human teeth. From DentalCeramics Proceedings of the First International Symposium onCeramics. J.W. McLean, editor, Chicago, 1982, QuintessencePublishing Co., Inc, pp 441-489.
Commission Internationale de l'Eclairage, Publication No. 15, 1971
113
Culpepper, W.D.: A comparative study of shade-matching procedures.J Prosthet Dent 24:166, 1970.
Davson, H.: Physiology of the Eve. New York, 1980, Academic Press.
Daw, N.W.: Color vision. From Encyclopedia of Neuroscience , VolumeI, G. Adelman, editor, Boston, 1987, Birk~user, pp 259-260.
Dykema, R.W., Goodacre, C.J. and Phillips, R.W.: Johnston's ModernPractice in Fixed Prosthodontics, Philadelphia, 1986, W.B. SaundersCompany.
Evans, D.B.: The Influence of Condensation Method on Porosity andShade of Body Porcelain, Masters Thesis, 1988, University of TexasHealth Science Center at San Antonio, Texas.
Farah, J.W. and Powers, J.M.: Ceramic metal systems. Dent Advis2:1, 1985.
Gettleman, L., Herzberg, T.W., Webble, R.L. and Moffa, J.P.: Theeffect of metal surface treatment on masking power of opaqueporcelain. From Dental Porcelain: The State of the Art, H.N.Yamada, editor, Los Angeles, 1977, University of SouthernCalifornia, p 358.
Goodkind, R.J., Keenan, K.M. and Schwabacher, W.B.: A comparison ofChromascan and spectrophotometric color measurements of 100 naturalteeth. J Prosthet Dent 53:105, 1985.
Hammad, I.A. and Stein, R.S.: A qualitative study for the bond andcolor of ceramometals, part II. J Prosthet Dent 65:169, 1991.
Hunter, R.S.: The Measurement of Appearance. New York, 1975, JohnWiley and Sons.
HunterLab Colorimeter D25A-2 Instruction Manual. Hunter AssociatesLaboratory, Inc., Reston, Virginia, 1980.
Hurvich, L.M.: Color Vision. Sunderland, 1981, Sinauer andAssociates Inc.
Jacobs, S.H., Goodacre, C.J., Moore, B.K. and Dykema, R.W.: Effectof porcelain thickness and type of metal-ceramic alloy on color, JProsthet Dent 57:138, 1987.
Jacovides, D.C., O'Neal, S.J., Lacefield, W.R. and Compton, R.C.:Ability of various opaque porcelains to mask six high palladiumalloys. (Abstract #639) J Dent Res (Special Issue) 64:246, 1985.
Johansen, R., Brafman, A. and Caine, R.: Porcelain color changesobserved ot three glazing temperatures. (Abstract #143) J Dent Res

114
(Special Issue) 68:199, 1989.
Johnston, W.M. and Kao, E.C.: Assessment of appearance match byvisual observation and clinical colorimetry. J Dent Res 68:819,1989.
Jorgensen, M.W. and Goodkind, R.J.: Spectrophotometric study offive porcelain shades relative to the dimensions of color,porcelain thickness, and repeated firings. J Prosthet Dent 42:96,1979.
Judd, D.B.: Fundamental studies of color vision from 1860 to 1960.Proc Natl Acad Sci USA 55:1313, 1966.
Judd, D.B. and Wyszecki, G.: Color in Business, Science, andIndustry, New York, 1967, John Wiley and Sons, Inc.
Kay, K.S., O'Brien, W.J. and Boenke, K.M.: Color changes onrepeated firings of porcelain. (Abstract #435) J Dent Res (SpecialIssue) 68:236, 1989.
Kuehni, R.G. and Marcus, R.T.: An experiment in visual scaling ofsmall color differences. Color Res Appl 4:83, 1979.
Lacefield, W.R., O'Neal, S.J. and Compton, H.K.: Color changes ofporcelain fused to high palladium alloys after multiple firings.(Abstract #640) J Dent Res (Special Issue) 64:246, 1985.
Lemire, P.A. and Burk, B.: Color in Dentistry. Hartford, 1975, J.M.Ney Co.
McLean, J.W.: The Science and Art of Dental Ceramics, Volume I.Chicago, 1979, Quintessence Publishing Co., Inc.
McLean, J.W.: The Science and Art of Dental Ceramics, Volume II.Chicago, 1980, Quintessence Publishing Co., Inc.
Miller, L.L.: A scientific approach to shade matching, FromPerspectives in Dental Ceramics Proceedings of the FourthInternational Symposium on Ceramics, Chicago, 1988, QuintessencePublishing Co., Inc.
Moser, J.B. and Meyer, J.M.: Color as a function of body porcelainthickness in three porcelain fused to metal systems, (Abstract#388) J Dent Res (Special Issue) 62:692, 1983.
Muia, P.J.: The Four Dimensional Tooth Color System. Chicago, 1982,Quintessence Publishing Co., Inc.
Munsell, A.H.: A Color Notation, 11th edition. Baltimore, 1961,Munsell Color Co., Inc.

115
Naylor, W.P.; Non-gold Base Dental Casting Alloys: Volume II. 1986,United States Air Force School of Aerospace Medicine publicationTR-86-5.
Nunnally, J.C.: Psychometric Theory. New York, McGraw Hill BookCompany, 1967.
O'Brien, W.J.: Double layer effect and other optical phenomena,Dent Clin North Am 29:667, 1985.
O'Neal, S.J., Leinfelder, K.F., Lemons, J.E. and Jamison, H.C.:Effect of metal surfacing on the color characteristics of porcelainveneer, Dent Mater 3:97, 1987.
Obregon, A., Goodkind, R.J. and Schwabacher, W.B.: Effects ofopaque and porcelain surface texture on the color of ceramometalrestorations. J Prosthet Dent 46:330, 1981.
Pau, H.: Differential Diagnosis of Eve Diseases, 2nd edition. NewYork, 1988, Thieme Medical Publishers, Inc.
Phillips, R.W.: Skinner's Science of Dental Materials, 9th edition.Philadelphia, 1991, W.B. Saunders Co.
Preston, J.: The elements of esthetics - application of colorscience. From Dental Ceramics Proceedings of the FirstInternational Symposium on Ceramics. J.W. McLean, editor, Chicago,1982, Quintessence Publishing Co., Inc, pp 491-519.
Preston, J.D., Editor: Perspectives in Dental Ceramics Proceedingsof the Fourth International Symposium on Ceramics, Chicago, 1988,Quintessence Publishing Co., Inc.
Procedures for testing color vision, Report of working group 41.Committee on vision, National Academy of Sciences, Washington D.C.,National Academy Press, 1981.
Romanchuk, K.G.: Color vision, ch.8 in, Orthoptics and OcularExamination Technigues, W.E. Scott, D.D. D'Agostino, and L.W.Lennarson, editors, Baltimore, Williams and Wilkins, 1983.
Rosenstiel, S.F. and Johnston, W.M.: The effects of manipulativevariables on the color of metal ceramic restorations, J ProsthetDent 60:297, 1988.
Schultz, M., Johansen, R. and Sanchelli, P.: Color differences withvariation in firing rates of dental porcelain. (Abstract #144) JDent Res (Special Issue) 68:199, 1989.
Seghi, R.R.: Effects of instrument-measuring geometry oncolorimetric assessments of dental porcelains. J Dent Res 69:1180,1990.
116
Seghi, R.R., Johnston, W.M. and O'Brien, W.J.: Spectrophotometricanalysis of color differences between porcelain systems, J ProsthetDent 56:35, 1986.
Sorensen, J.A. and Torres, T.J.: Improved color matching of metal-ceramic restorations, Part III: Innovations in porcelainapplication. J Prosthet Dent 59:1, 1988.
SPSS Reference Guide, SPSS Inc., Chicago, 1990.
Swepston, J.H. and Miller, A.W.: Esthetic matching. J Prosthet Dent54:623, 1985.
Terada, Y., Maeyama, S. and Hirayasu, R.: The influence ofdifferent thicknesses of dentin porcelain on the color reflectedfrom thin opaque porcelain fused to metal, Int J Prosthodont 2:352,1989a.
Terada, Y., Sakai, T. and Hirayasu, R.: The masking ability of anopaque porcelain: A spectrophotometric study. Int J Prosthodont2:259, 1989b.
Yamamoto, M.: Metal Ceramics, Chicago, 1985, QuintessencePublishing Co., Inc.
Zrenner, E.: Studies of Brain Function, Volume 9:Neurophysiological Aspects of Color Vision in Primates. New York,1983, Springer-Verlag.

117
Appendix APorcelain Firing Temperatures*
Low Temp Entry Vacuum VacuH High Tenp Time at
(00) Time Level Off Temp Rate Temp
(min) (mmHg) (C) (C) (°C/min) (min)
Microbond
Opaque 760 5.0 None - 977 32 0.0
Dentin 760 5.5 720 968 968 32 0. 0
Glaze 760 3.0 None - 968 32 0.5
Ceramco I 1
Opaque 650 5.0 720 930 995 55 0.0
Dentin 621 5.0 720 896 918 72 0.0
Glaze 621 3.0 None - 935 83 1.5
Jetenko
Opaque 593 5.0 720 980 1000 56 0.0
Dentin 593 5.5 720 941 980 56 0.0
Glaze 593 3.0 None - 980 56 1.5
Vita VMK 68
Opaque 650 5.0 720 985 985 32 0.0
Dentin 650 5.5 720 915 915 32 0.0
Glaze 650 3.0 None _ 935 32 1.5
The paa m of he frt n sdmdes vae poed by each po=nn jfat foru se on tn. Lm -CDF mpoxn, fmm

118
Appa'dK B
L* = 24.99 (Y' - 0.64)
a* = 107.72 [(X/0.98041)" -Y"'
b *= 43.09 [Y6 - (Z/1. 18103)'6
119
Appendix C
Tristimulus Color Data
No.= Sample number; B= Brand where 1= Microbond, 2= Ceramco II, 3=Jelenko, and 4= Vita VMK 68; S= Shade where 1= A3.5, 2= B1, and 3=C3; T= Thickness of Dentin Porcelain where 1= No Dentin Porcelain,2= 0.3 mm of Dentin Porcelain, 3= 0.6 mm of Dentin Porcelain, and4= 0.9 mm of Dentin Porcelain.
No. B S T Y X Z L* a* b*1 1 1 1 52.3 52.8 43.4 77.46 3.95 17.882 1 1 1 51.7 52.4 42.0 77.10 4.47 18.823 1 1 1 51.0 51.6 42.0 76.68 4.21 18.104 1 1 1 52.5 52.9 42.4 77.58 3.70 19.205 1 1 1 51.9 52.3 41.6 77.22 3.70 19.486 1 1 1 51.2 52.3 41.6 76.80 5.51 18.767 1 2 1 62.1 61.6 55.7 82.97 1.67 14.958 1 2 1 62.4 61.8 55.9 83.13 1.44 15.049 1 2 1 62.8 62.2 56.3 83.34 1.46 15.0410 1 2 1 62.6 62.1 56.? 83.23 1.68 14.9511 1 2 1 63.3 62.8 57.6 83.60 1.70 14.3012 1 2 1 62.3 61.8 56.0 83.07 1.67 14.8613 1 3 1 45.4 45.0 36.6 73.16 1.40 18.3714 1 3 1 44.9 44.7 35.7 72.83 1.96 18.9215 1 3 1 45.3 45.0 36.5 73.09 1.69 18.3816 1 3 1 46.0 45.7 37.3 73.55 1.71 18.1917 1 3 1 45.3 45.0 36.2 73.09 1.69 18.7518 1 3 1 45.6 45.3 37.0 73.29 1.69 18.1119 2 1 1 41.0 41.6 29.3 70.18 4.27 22.9120 2 1 1 41.8 42.5 30.0 70.73 4.56 22.8821 2 1 1 41.8 42.4 30.1 70.73 4.27 22.7422 2 1 1 41.8 42.4 30.0 70.73 4.27 22.8823 2 1 1 41.4 42.1 29.5 70.46 4.57 23.1124 2 1 1 41.5 42.2 29.9 70.53 4.57 22.6625 2 2 1 51.7 50.6 46.4 77.10 -0.23 14.0426 2 2 1 50.4 49.5 44.8 76.32 0.23 14.3827 2 2 1 50.8 49.8 45.2 76.56 -0.01 14.3828 2 2 1 52.3 51.2 46.9 77.46 -0.20 14.1329 2 2 1 52.1 51.0 46.6 77.34 -0.21 14.2430 2 2 1 51.9 50.8 46.4 77.22 -0.22 14.2431 2 3 1 38.4 38.4 29.6 68.32 2.40 19.2732 2 3 1 38.4 38.4 29.3 68.32 2.40 19.7033 2 3 1 38.5 38.6 29.2 68.39 2.72 19.9734 2 3 1 38.2 38.3 29.3 68.17 2.72 19.4535 2 3 1 38.4 38.5 29.4 68.32 2.72 19.5636 2 3 1 38.5 38.7 29.3 68.39 3.04 19.8337 3 1 1 41.3 41.9 27.8 70.39 4.27 25.4538 3 1 1 41.6 42.4 28.6 70.60 4.86 24.6439 3 1 1 41.5 42.2 28.4 70.53 4.57 24.8140 3 1 1 42.7 43.3 29.2 71.35 4.26 25.0841 3 1 1 41.5 42.1 28.3 70.53 4.27 24.9642 3 1 1 42.8 43.4 29.7 71.42 4.26 24.4843 3 2 1 54.8 53.7 48.6 78.93 -0.07 14.9144 3 2 1 54.9 53.8 49.3 78.98 -0.06 14.2945 3 2 1 55.0 54.0 49.5 79.04 0.20 14.1946 3 2 1 55.0 54.0 49.2 79.04 0.20 14.4947 3 2 1 54.9 53.8 49.0 78.98 -0.06 14.6048 3 2 1 54.9 53.7 49.4 78.98 -0.32 14.1949 3 3 1 37.6 37.4 29.7 67.73 1.74 18.1150 3 3 1 38.3 38.1 30.7 68.24 1.77 17.6051 3 3 1 37.1 36.9 28.9 67.35 1.73 18.6252 3 3 1 38.1 37.9 30.3 68.10 1.76 17.9153 3 3 1 37.7 37.5 29.9 67.80 1.75 17.9654 3 3 1 38.4 38.2 30.8 68.32 1.77 17.5955 4 1 1 48.1 47.7 38.9 74.89 1.50 18.5856 4 1 1 48.8 47.7 40.4 75.33 -0.40 17.5957 4 1 1 48.8 48.5 40.1 75.33 1.79 17.93
120
58 4 1 1 49.2 48.8 41.0 75.58 1.53 17.3359 4 1 1 47.8 47.5 39.0 74.70 1.76 18.1460 4 1 1 48.5 48.1 40.1 75.14 1.51 17.6161 4 2 1 54.3 53.6 49.7 78.64 0.93 13.2962 4 2 1 54.9 54.3 50.7 78.98 1.20 12.8963 4 2 1 55.1 54.4 51.2 79.10 0.96 12.6064 4 2 1 54.2 53.5 49.8 78.58 0.92 13.0965 4 2 1 53.6 52.9 49.0 78.23 0.90 13.2966 4 2 1 52.9 52.3 47.6 77.82 1.13 14.0267 4 3 1 46.5 46.0 38.4 73.87 1.16 17.4268 4 3 1 47.5 46.9 39.6 74.51 0.92 17.1169 4 3 1 47.2 46.6 38.9 74.32 0.91 17.6070 4 3 1 48.1 47.5 40.1 74.89 0.95 17.1871 4 3 1 47.6 47.0 39.2 74.57 0.92 17.6872 4 3 1 46.9 46.4 39.1 74.13 1.18 17.0373 1 1 2 52.4 52.9 41.9 68.90 3.67 22.1574 1 1 2 51.1 51.7 39.7 68.61 3.67 22.9875 1 1 2 51.6 52.2 40.2 69.54 3.98 22.3976 1 1 2 52.1 52.6 40.9 69.26 3.98 23.0677 1 1 2 51.1 51.7 40.0 69.40 3.98 22.0078 1 1 2 51.6 52.2 40.7 69.40 3.98 23.3179 1 2 2 62.7 62.3 56.6 76.38 1.04 15.4780 1 2 2 62.4 62.0 56.5 76.25 1.03 15.5881 1 2 2 62.6 62.0 56.0 76.74 3.69 15.5582 1 2 2 62.6 62.1 56.3 75.20 0.97 16.0083 1 2 2 62.8 62.2 57.3 76.13 1.03 15.1584 1 2 2 63.2 62.6 56.7 76.56 1.05 15.7885 1 3 2 46.6 46.4 39.3 66.75 1.37 18.1586 1 3 2 44.8 44.6 36.3 65.91 1.32 19.3887 1 3 2 45.2 44.9 36.2 66.60 1.36 18.6288 1 3 2 46.0 45.7 37.0 66.29 1.34 19.5989 1 3 2 45.4 45.1 36.8 66.45 1.35 18.5190 1 3 2 45.2 44.9 36.3 66.52 1.36 18.6491 2 1 2 40.7 41.4 29.1 66.52 3.35 22.6192 2 1 2 40.8 41.4 28.9 66.21 3.34 22.5593 2 1 2 40.6 41.2 28.7 66.60 3.35 23.0594 2 1 2 41.3 42.0 29.9 66.83 3.35 22.0495 2 1 2 41.8 42.5 30.2 66.67 3.67 22.5696 2 1 2 41.8 42.4 30.1 66.75 3.02 22.2297 2 2 2 50.1 49.1 44.3 71.62 -0.17 13.9198 2 2 2 49.0 48.0 43.5 71.89 -0.44 14.0199 2 2 2 52.0 51.0 46.0 72.30 -0.11 14.35
100 2 2 2 49.9 48.9 44.3 72.03 -0.43 14.13101 2 2 2 49.7 48.7 44.0 72.10 -0.42 14.24102 2 2 2 50.1 49.1 44.5 71.76 -0.45 14.02103 2 3 2 38.2 38.3 29.2 65.04 2.31 19.59104 2 3 2 38.1 38.2 29.3 66.21 2.01 18.26105 2 3 2 38.6 38.6 29.2 65.52 1.98 20.09106 2 3 2 38.6 38.6 29.2 65.36 1.98 20.13107 2 3 2 38.6 38.6 29.7 64.96 1.96 19.92108 2 3 2 38.8 38.8 29.9 64.49 1.60 19.73109 3 1 2 42.7 43.3 29.9 67.13 3.67 25.41110 3 1 2 41.8 42.3 28.5 66.83 3.35 25.38111 3 1 2 41.9 42.5 29.4 66.67 3.35 25.12112 3 1 2 42.6 43.2 29.1 66.75 3.67 25.91113 3 1 2 42.4 43.0 28.7 66.75 3.67 25.91114 3 1 2 42.5 43.1 29.1 66.60 3.35 25.98115 3 2 2 55.2 54.1 49.7 75.39 -0.39 13.88116 3 2 2 54.5 53.4 48.2 75.20 -0.68 14.43117 3 2 2 54.0 53.0 48.3 75.01 -0.43 13.56118 3 2 2 53.7 52.7 47.9 75.08 -0.42 14.00119 3 2 2 54.4 53.3 49.3 74.76 -0.73 13.34120 3 2 2 54.1 53.0 48.4 75.33 -0.40 13.44121 3 3 2 36.9 36.7 28.8 64.96 0.93 18.67122 3 3 2 37.5 37.4 29.3 64.49 0.90 19.57123 3 3 2 37.7 37.6 29.5 64.57 0.90 19.23124 3 3 2 37.3 37.1 29.2 64.57 0.90 19.08125 3 3 2 37.7 37.5 29.8 64.49 0.90 19.57
'. 3 3 2 37.2 37.1 28.8 64.16 1.23 19.17lk/ 4 1 2 48.0 47.7 39.0 68.10 2.08 23.92128 4 1 2 47.9 47.6 39.0 68.61 2.10 24.04129 4 1 2 49.2 48.8 40.7 68.46 2.09 23.79130 4 1 2 47.9 47.7 38.1 68.24 2.40 24.17

121
131 4 1 2 48.5 48.1 40.0 69.68 1.83 23.21132 4 1 2 48.1 47.8 39.1 68.46 2.09 23.94133 4 2 2 53.0 52.3 48.7 74.76 0.38 13.90134 4 2 2 54.4 53.8 50.3 75.27 0.42 13.77135 4 2 2 54.5 53.8 50.4 75.08 0.41 13.78136 4 2 2 55.1 54.3 50.6 74.76 0.38 14.12137 4 2 2 54.5 53.9 50.1 74.95 0.67 14.00138 4 2 2 54.0 53.4 49.7 74.70 0.66 13.90139 4 3 2 47.0 46.4 39.0 68.17 0.80 20.31140 4 3 2 46.8 46.3 38.9 67.95 0.79 20.51141 4 3 2 47.0 46.5 39.3 68.02 0.47 20.35142 4 3 2 46.9 46.4 39.2 67.20 0.73 20.71143 4 3 2 47.5 46.9 39.5 67.58 0.43 20.31144 4 3 2 47.9 47.2 40.3 67.95 0.79 20.22145 1 1 3 51.0 51.5 39.4 63.92 3.34 23.22146 1 1 3 51.4 51.9 40.7 64.40 3.34 23.38147 1 1 3 52.2 52.7 41.6 65.20 3.68 23.41148 1 1 3 50.9 51.5 39.3 64.00 3.69 24.05149 1 1 3 51.6 52.1 41.0 64.32 3.34 23.41150 1 1 3 51.2 51.8 39.8 64.16 3.69 24.33151 1 2 3 62.9 62.4 56.1 72.30 0.48 15.55152 1 2 3 63.0 62.5 57.6 72.10 0.47 15.32153 1 2 3 63.0 62.4 56.1 71.49 0.42 15.99154 1 2 3 63.1 62.6 56.7 72.10 0.47 15.93155 1 2 3 63.1 62.6 56.6 71.96 0.46 15.94156 1 2 3 63.1 62.6 56.6 71.96 0.46 15.94157 1 3 3 46.2 45.9 37.5 62.76 1.15 19.36158 1 3 3 46.2 45.9 38.1 63.34 1.18 18.89159 1 3 3 46.1 45.7 36.9 63.34 1.18 19.71160 1 3 3 46.1 45.8 37.3 62.93 1.16 18.99161 1 3 3 45.5 45.1 36.2 62.68 1.51 19.05162 1 3 3 46.4 46.1 37.0 63.18 1.17 19.26163 2 1 3 41.1 41.8 29.5 65.52 2.32 19.78164 2 1 3 40.9 41.5 29.4 64.96 2.31 19.61165 2 1 3 41.1 41.7 29.8 66.06 2.34 18.89166 2 1 3 40.6 41.3 29.0 66.37 2.35 19.42167 2 1 3 41.2 41.9 29.5 64.65 2.65 19.85168 2 1 3 41.7 42.4 30.0 66.29 2.35 19.14169 2 2 3 50.4 49.3 44.6 68.97 -0.41 11.90170 2 2 3 51.1 50.1 45.4 69.26 -0.39 12.14171 2 2 3 51.2 50.1 45.7 70.04 -0.62 11.65172 2 2 3 50.7 49.6 45.1 70.80 -0.24 11.3173 2 2 3 51.2 50.1 45.6 70.80 -0.54 11.54174 2 2 3 52.1 51.0 46.3 69.40 -0.37 12.02175 2 3 3 38.3 38.3 29.2 65.28 1.29 16.50176 2 3 3 38.6 38.5 29.6 63.34 1.18 17.45177 2 3 3 38.8 38.8 29.7 63.26 1.54 17.30178 2 3 3 38.5 38.6 29.3 63.92 1.57 17.03179 2 3 3 38.4 38.4 29.5 64.88 1.27 16.56180 2 3 3 38.4 38.4 29.4 65.20 1.29 16.36181 3 1 3 42.1 42.7 29.4 64.65 2.99 23.62182 3 1 3 41.9 42.6 28.8 64.40 2.99 23.21183 3 1 3 42.0 42.6 28.8 64.49 2.99 23.18184 3 1 3 41.4 42.0 28.4 65.04 3.00 23.80185 3 1 3 41.9 42.4 28.4 65.20 3.00 23.91186 3 1 3 42.6 43.2 29.0 64.88 3.00 23.53187 3 2 3 55.1 54.0 49.4 71.62 -1.06 12.60188 3 2 3 55.2 54.1 49.3 71.69 -0.76 12.72189 3 2 3 55.3 54.2 49.7 72.10 -0.71 12.48190 3 2 3 55.4 54.3 49.7 71.76 -0.75 12.13191 3 2 3 55.0 53.9 49.3 72.10 -0.71 12.36192 3 2 3 54.9 53.8 49.3 72.03 -0.72 12.36193 3 3 3 37.9 37.7 30.3 62.17 0.75 18.01194 3 3 3 37.0 36.7 28.9 61.74 0.72 18.61195 3 3 3 38.1 37.9 30.7 62.59 0.77 17.43196 3 3 3 38.3 38.1 30.6 61.66 1.09 18.13197 3 3 3 37.7 37.5 29.9 62.00 0.73 17.39198 3 3 3 37.6 37.4 29.5 62.59 1.14 17.43199 4 1 3 49.4 49.0 41.1 65.12 2.66 24.44200 4 1 3 48.0 47.6 39.3 64.57 2.99 24.16201 4 1 3 48.9 48.5 39.4 64.81 2.99 24.92202 4 1 3 50.0 49.5 41.9 64.81 2.99 24.75203 4 1 3 49.1 48.7 41.0 65.04 2.65 24.48
122
204 4 1 3 48.5 48.1 39.7 64.81 2.65 24.41205 4 2 3 54.5 53.8 49.7 71.89 0.15 13.30206 4 2 3 53.9 53.2 49.5 72.30 0.19 13.17207 4 2 3 54.7 54.1 50.1 72.16 0.47 13.41208 4 2 3 54.4 53.7 50.2 72.70 0.22 13.28209 4 2 3 53.2 52.5 49.1 72.03 0.17 13.18210 4 2 3 54.1 53.4 49.7 72.10 0.17 13.29211 4 3 3 46.3 45.7 38.1 64.16 0.88 20.14212 4 3 3 46.1 45.5 37.7 64.49 0.90 20.37213 4 3 3 47.2 46.7 38.9 63.84 0.85 20.39214 4 3 3 47.3 46.8 39.2 64.24 0.88 20.28215 4 3 3 47.2 46.6 39.2 64.49 0.90 20.53216 4 3 3 47.8 47.2 39.9 64.16 1.23 20.30217 1 1 4 52.4 52.8 42.4 61.48 2.96 23.49218 1 1 4 51.2 51.7 39.8 61.40 3.71 23.72219 1 1 4 51.2 51.7 40.1 61.05 3.33 22.74220 1 1 4 51.4 52.0 39.7 61.48 3.71 23.87221 1 1 4 51.0 51.6 39.3 61.22 3.33 24.36222 1 1 4 51.6 52.2 41.1 61.05 3.33 22.93223 1 2 4 62.6 62.1 56.1 68.97 -0.10 14.96224 1 2 4 62.9 62.4 56.4 68.97 -0.10 15.22225 1 2 4 62.6 62.0 56.1 68.90 0.22 15.09226 1 2 4 62.9 62.4 56.4 68.83 0.21 15.10227 1 2 4 63.0 62.4 56.4 68.75 -0.11 15.24228 1 2 4 63.5 62.9 56.5 69.19 0.24 15.72229 1 3 4 46.1 45.9 37.0 60.61 1.41 17.86230 1 3 4 45.4 45.1 36.5 60.52 1.41 18.40231 1 3 4 45.7 45.4 37.5 60.61 1.41 18.03232 1 3 4 45.4 45.1 36.6 60.61 1.41 18.03233 1 3 4 46.0 45.7 37.8 60.61 1.03 19.08234 1 3 4 45.2 44.9 36.6 59.89 1.38 18.20235 2 1 4 40.7 41.3 28.9 63.84 1.57 18.14236 2 1 4 40.7 41.4 29.1 62.93 1.89 18.34237 2 1 4 41.4 42.0 30.1 65.98 1.67 17.56238 2 1 4 42.0 42.7 30.8 67.05 1.38 16.53239 2 1 4 41.6 42.2 29.6 63.26 1.90 17.94240 2 1 4 41.4 42.0 30.1 65.59 1.65 17.19241 2 2 4 50.5 49.4 44.9 67.50 -0.56 10.63242 2 2 4 49.9 48.9 44.1 67.65 -0.21 10.38243 2 2 4 50.7 49.7 45.0 67.50 -0.56 10.25244 2 2 4 51.3 50.2 45.6 68.10 -0.50 10.14245 2 2 4 51.0 49.8 45.3 67.43 -0.23 10.12246 2 2 4 51.8 50.8 46.1 67.73 -0.21 10.25247 2 3 4 38.1 38.2 29.0 64.40 0.89 15.73248 2 3 4 37.7 37.8 28.8 61.31 1.45 16.03249 2 3 4 38.8 38.9 29.7 62.34 1.50 15.71250 2 3 4 38.4 38.2 28.7 66.29 0.67 15.08251 2 3 4 37.5 37.6 28.5 64.00 0.86 15.64252 2 3 4 39.2 39.2 30.2 63.59 0.84 15.54253 3 1 4 40.7 41.4 27.2 62.68 2.61 21.95254 3 1 4 42.2 42.8 29.0 63.01 2.61 21.66255 3 1 4 41.3 42.0 28.2 63.67 2.63 22.63256 3 1 4 42.4 43.0 29.3 63.51 2.62 21.32257 3 1 4 41.6 42.2 28.4 63.76 2.27 21.92258 3 1 4 41.0 41.7 27.7 63.43 2.62 21.52259 3 2 4 54.9 53.8 49.1 69.33 -0.69 11.53260 3 2 4 55.2 54.1 49.4 69.04 -1.04 11.28261 3 2 4 54.5 53.4 48.6 69.54 -0.99 11.28262 3 2 4 55.2 54.1 49.6 69.33 -0.69 11.28263 3 2 4 55.0 54.0 49.7 69.54 -0.99 10.80264 3 2 4 55.1 54.0 49.6 69.47 -0.68 11.04265 3 3 4 36.4 36.2 28.4 60.34 1.01 16.71266 3 3 4 38.7 38.5 31.4 60.52 0.63 16.67267 3 3 4 37.0 36.8 28.5 60.16 1.00 17.26268 3 3 4 37.8 37.7 29.7 60.43 1.02 16.69269 3 3 4 37.7 37.5 29.8 61.91 1.10 15.62270 3 3 4 37.3 37.1 29.1 60.87 1.04 17.11271 4 1 4 48.2 47.8 39.6 62.51 3.33 23.98272 4 1 4 47.0 46.7 38.2 62.42 2.97 23.83273 4 1 4 49.2 48.8 40.7 62.76 2.97 24.05274 4 1 4 47.7 47.4 38.5 62.51 2.97 23.79275 4 1 4 49.1 48.7 40.3 62.85 2.97 23.83276 4 1 4 48.7 48.3 39.5 62.85 3.33 24.01

123
277 4 2 4 54.0 53.4 49.3 70.11 0.31 12.62278 4 2 4 54.4 53.8 50.0 70.32 0.02 12.38279 4 2 4 55.4 54.8 51.1 70.39 0.03 12.38280 4 2 4 54.2 53.6 50.1 70.66 0.05 12.49281 4 2 4 54.7 54.0 50.7 70.53 0.04 12.37282 4 2 4 54.4 53.7 50.0 70.53 0.34 12.62283 4 3 4 46.8 46.3 38.6 61.48 1.08 18.85284 4 3 4 47.2 46.6 39.1 61.57 1.08 18.83285 4 3 4 47.4 46.9 39.5 61.83 1.10 19.10286 4 3 4 47.6 47.1 40.0 62.00 1.11 19.06287 4 3 4 47.1 46.6 39.1 62.00 1.11 19.23288 4 3 4 47.6 47.1 39.3 61.83 1.10 18.93

124
Appendix D
Subjective Observer Sample RankingsFor Shade A3.5
ObserversSAMPLE BRAND* DENTIN
_____________ EI__ MS__I RS I DR I BB SK __J
2 M 0.0 1 1 2 1 3 1 2
76 M 0.3 2 3 5 2 5 3 5
149 M 0.6 1 1 4 3 3 4 4
221 M 0.9 4 1 4 1 1 2 1
24 C 0.0 1 2 1 1 3 1 2
91 C 0.3 2 3 4 4 4 5 3
163 C 0.6 3 4 4 3 5 3 2
237 C 0.9 1 4 3 3 4 2 2
41 J 0.0 2 3 4 4 5 3 5
112 J 0.3 1 2 3 4 2 2 2
186 J 0.6 2 2 3 4 4 4 4
258 J 0.9 5 4 5 4 4 5 4
60 V 0.0 1 1 1 1 1 1 1
129 V 0.3 1 3 4 2 4 2 3
203 V 0.6 2 2 2 2 3 2 3
273 V 0.9 1 2 2 1 1 1 1
* M= Microbond, C= Ceramco II, J= Jelenko, V= Vita VMK 68

125
Subjective Observer Sample RankingsFor Shade B1
SAMPLE BRAND* DET ObserversSEI] MS as DR BB SKJ JB
10 M 0.0 2 2 1 1 3 1 4
80 M 0.3 2 2 1 1 1 1 1
156 M 0.6 1 1 1 1 1 1 1
224 M 0.9 4 1 1 1 1 1 1
30 C 0.0 2 3 3 3 3 5 3
98 C 0.3 1 3 2 3 1 4 2
173 C 0.6 5 4 4 1 5 4 3
246 C 0.9 1 3 2 1 1 5 2
47 J 0.0 3 4 4 4 4 4 5
118 J 0.3 4 4 4 1 2 2 4
192 J 0.6 3 5 3 4 5 5 5
262 J 0.9 4 4 4 4 4 4 2
64 V 0.0 1 2 1 1 3 2 3
135 V 0.3 2 4 2 2 3 1 2
210 V 0.6 2 2 2 1 1 4 2
279 V 0.9 1 1 1 2 2 1 1
* M= Microbond, C= Ceramco II, J= Jelenko, V= Vita VMK 68

126
Subjective Observer Sample RankingsFor Shade C3
_ ~Observers ..SAMPLE BRAND DENTIN
EI MS RS DR BB SK JB
15 M 0.0 3 3 3 4 3 1 5
90 M 0.3 2 3 4 2 5 3 4
162 M 0.6 3 4 4 3 3 4 3
229 M 0.9 1 1 1 1 1 1 1
35 C 0.0 4 2 2 1 1 1 1
106 C 0.3 2 2 2 1 1 3 2
179 C 0.6 4 4 5 4 4 5 4
251 C 0.9 1 5 3 5 5 4 4
53 J 0.0 2 3 1 3 3 1 3
123 J 0.3 3 3 4 1 1 1 1
193 J 0.6 5 3 5 3 2 3 1
265 J 0.9 4 3 4 1 4 2 3
69 V 0.0 1 2 2 4 4 5 5
140 V 0.3 4 4 4 2 3 2 4
214 V 0.6 4 3 4 2 2 4 3
288 V 0.9 5 3 3 1 1 1 1
* M= Microbond, C= Ceramco II, J= Jelenko, V= Vita VKK 68
Related Documents


