Attract-and-Kill of BMSB: A SARE Project Summary Rob Morrison 1 , A. Nielsen 2 , J.C. Bergh 3 , G. Krawcyzk 4 , B. Blaauw 5 , B. Short 1 , and T.C. Leskey 1 1 Appalachian Fruit Research Station, USDA-ARS, Kearneysville, WV 2 Department of Entomology, Rutgers University, Bridgeton, NJ 3 AREC, Virginia Tech, Winchester, VA 4 Department of Entomology, Penn State, Biglerville, PA 5 Department of Entomology, University of Georgia, Athens, GA

Welcome message from author
This document is posted to help you gain knowledge. Please leave a comment to let me know what you think about it! Share it to your friends and learn new things together.
Transcript
Attract-and-Kill of BMSB: A SARE Project Summary
Rob Morrison1, A. Nielsen2, J.C. Bergh3, G. Krawcyzk4, B. Blaauw5, B. Short1, and T.C. Leskey1
1 Appalachian Fruit Research Station, USDA-ARS, Kearneysville, WV 2 Department of Entomology, Rutgers University, Bridgeton, NJ 3 AREC, Virginia Tech, Winchester, VA
4 Department of Entomology, Penn State, Biglerville, PA 5 Department of Entomology, University of Georgia, Athens, GA
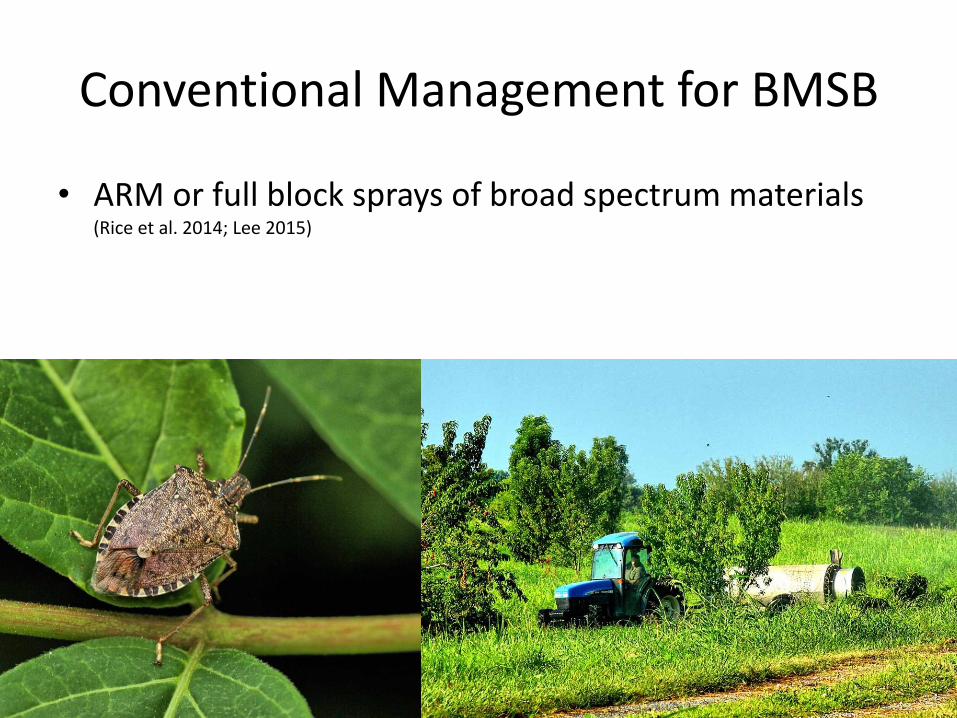
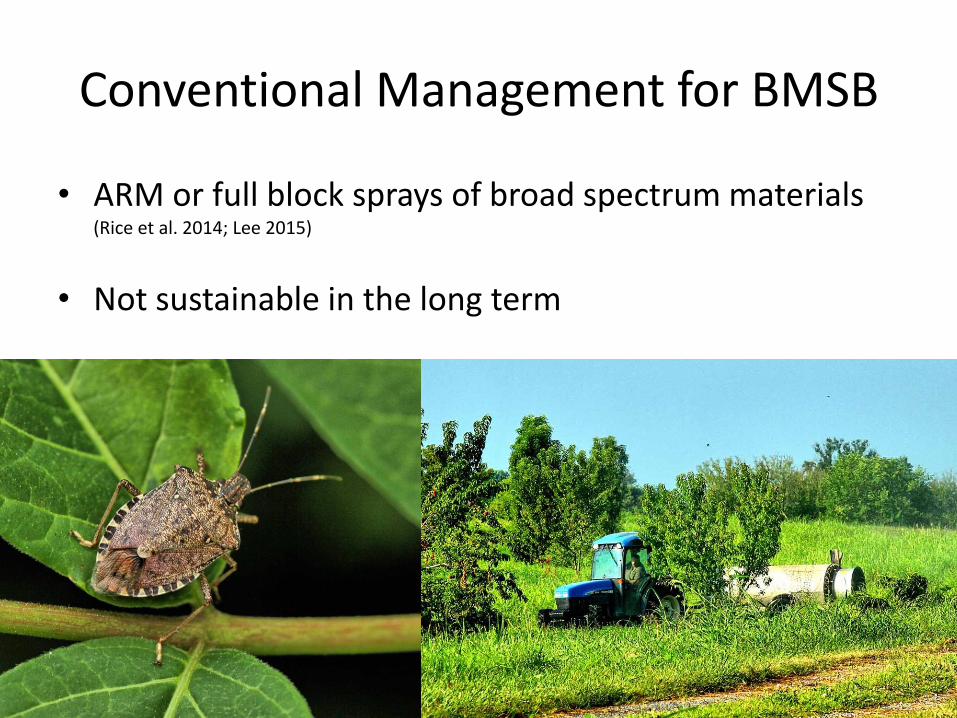
Conventional Management for BMSB
• ARM or full block sprays of broad spectrum materials (Rice et al. 2014; Lee 2015)
Conventional Management for BMSB
• ARM or full block sprays of broad spectrum materials (Rice et al. 2014; Lee 2015)
• Not sustainable in the long term
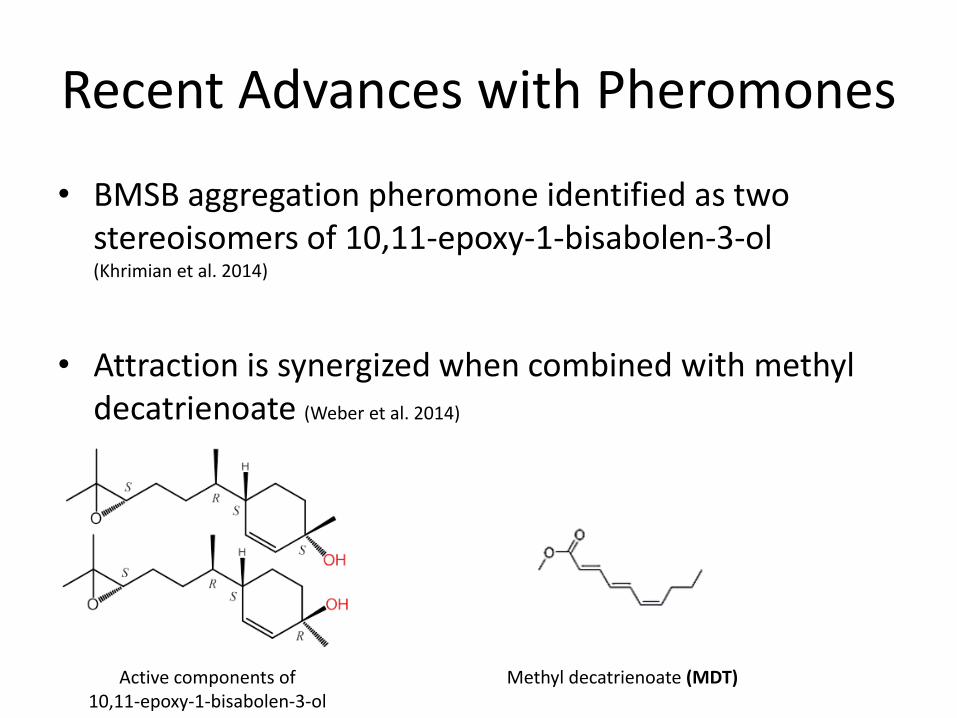
Recent Advances with Pheromones
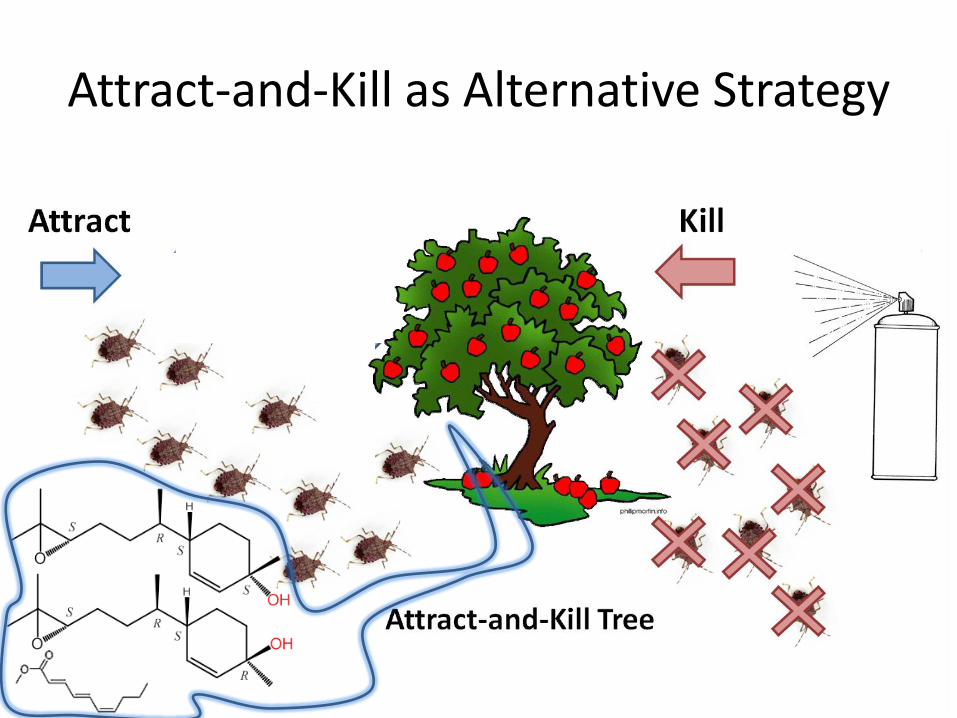
• BMSB aggregation pheromone identified as two stereoisomers of 10,11-epoxy-1-bisabolen-3-ol (Khrimian et al. 2014)
• Attraction is synergized when combined with methyl decatrienoate (Weber et al. 2014)
Methyl decatrienoate (MDT) Active components of 10,11-epoxy-1-bisabolen-3-ol
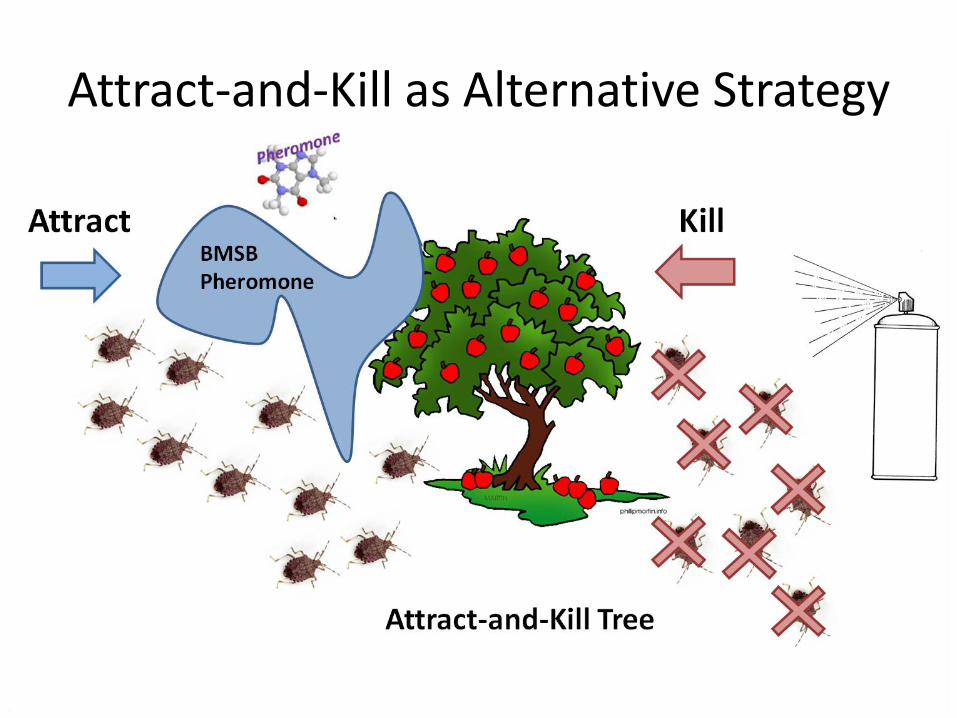
Attract-and-Kill as Alternative Strategy
Attract-and-Kill as Alternative Strategy
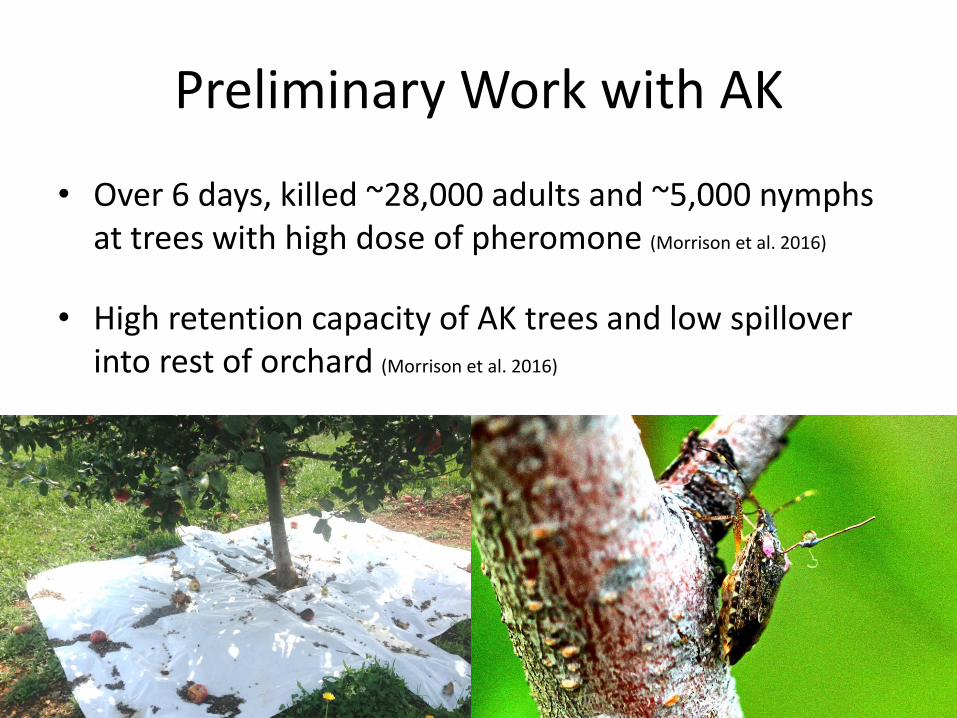
Preliminary Work with AK
• Over 6 days, killed ~28,000 adults and ~5,000 nymphs at trees with high dose of pheromone (Morrison et al. 2016)
• High retention capacity of AK trees and low spillover into rest of orchard (Morrison et al. 2016)

•On 10 farms in 2015 & 2016
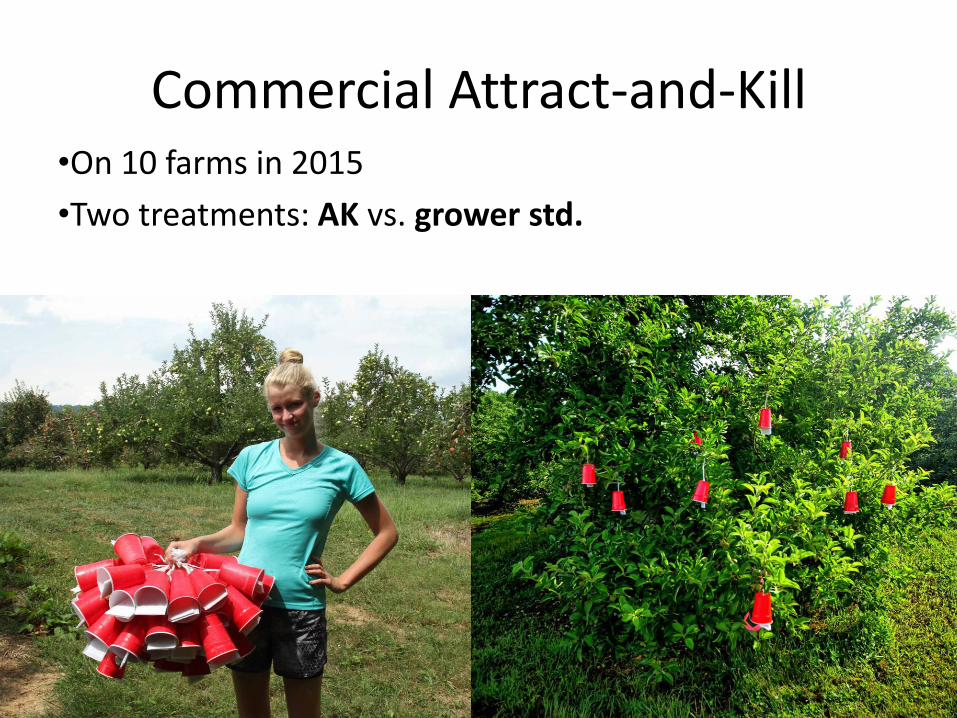
Commercial Attract-and-Kill
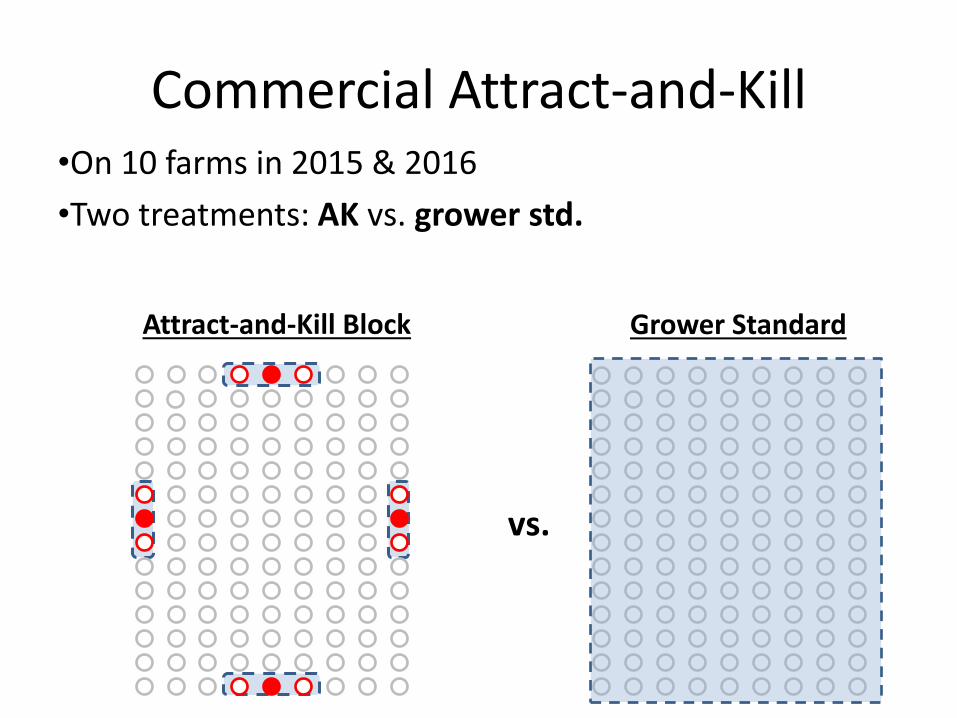
•On 10 farms in 2015 & 2016
•Two treatments: AK vs. grower std.
Commercial Attract-and-Kill
vs.
Grower Standard Attract-and-Kill Block
•On 10 farms in 2015
•Two treatments: AK vs. grower std.
Commercial Attract-and-Kill
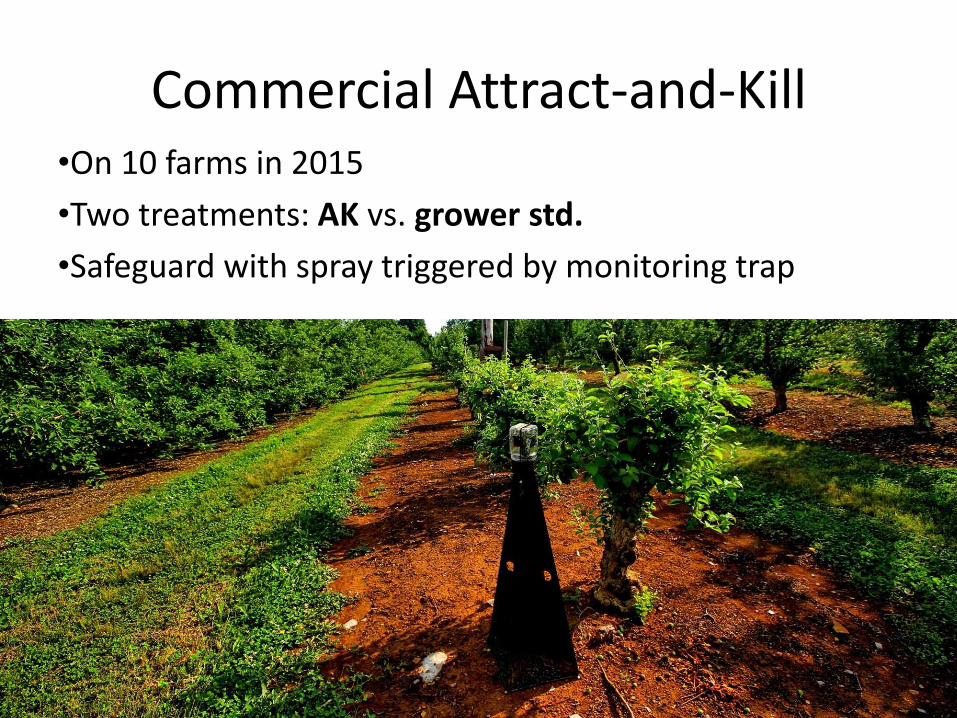
•On 10 farms in 2015
•Two treatments: AK vs. grower std.
•Safeguard with spray triggered by monitoring trap
Commercial Attract-and-Kill
Commercial Attract-and-Kill
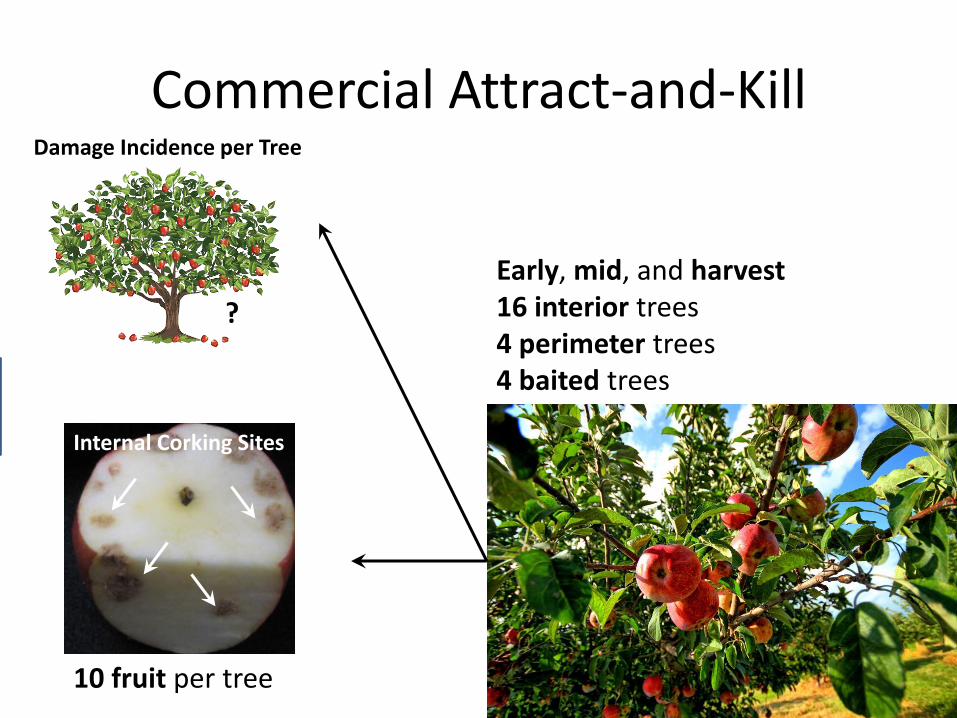
Early, mid, and harvest 16 interior trees 4 perimeter trees 4 baited trees
Internal Corking Sites
10 fruit per tree
Damage Incidence per Tree
?
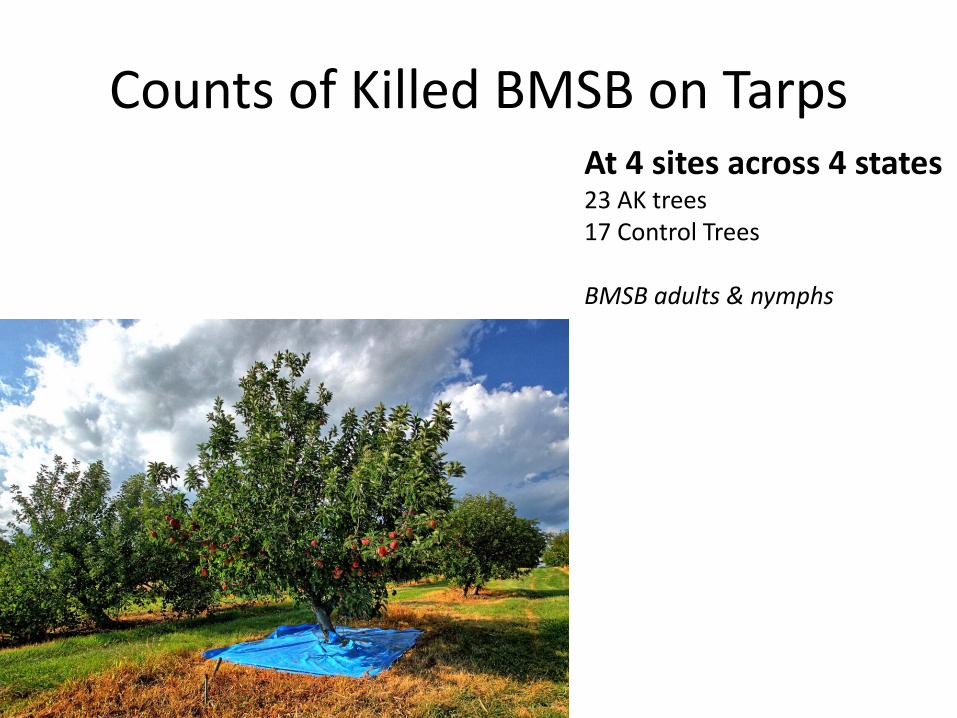
Counts of Killed BMSB on Tarps At 4 sites across 4 states 23 AK trees 17 Control Trees BMSB adults & nymphs
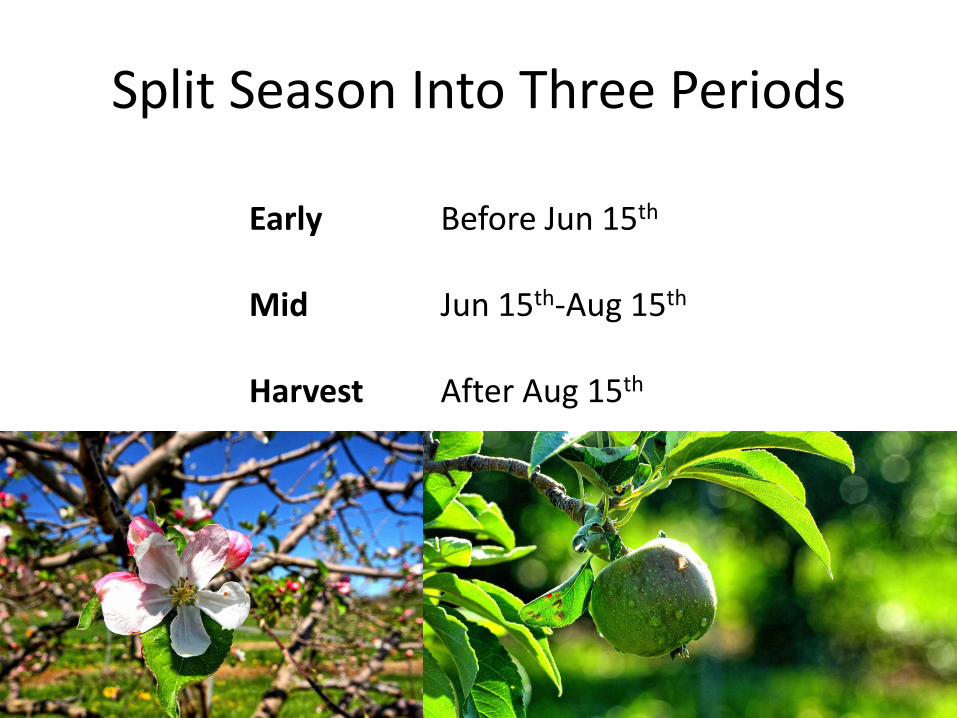
Split Season Into Three Periods
Early Before Jun 15th Mid Jun 15th-Aug 15th Harvest After Aug 15th
2015 Results: Low population year
0
0.2
0.4
0.6
0.8
Perimeter Interior
0
0.2
0.4
0.6
0.8
1
Perimeter Interior
0
0.05
0.1
0.15
0.2
Perimeter Interior
Me
an S
eve
rity
(±
SE)
of
Fru
it D
amag
e
Early
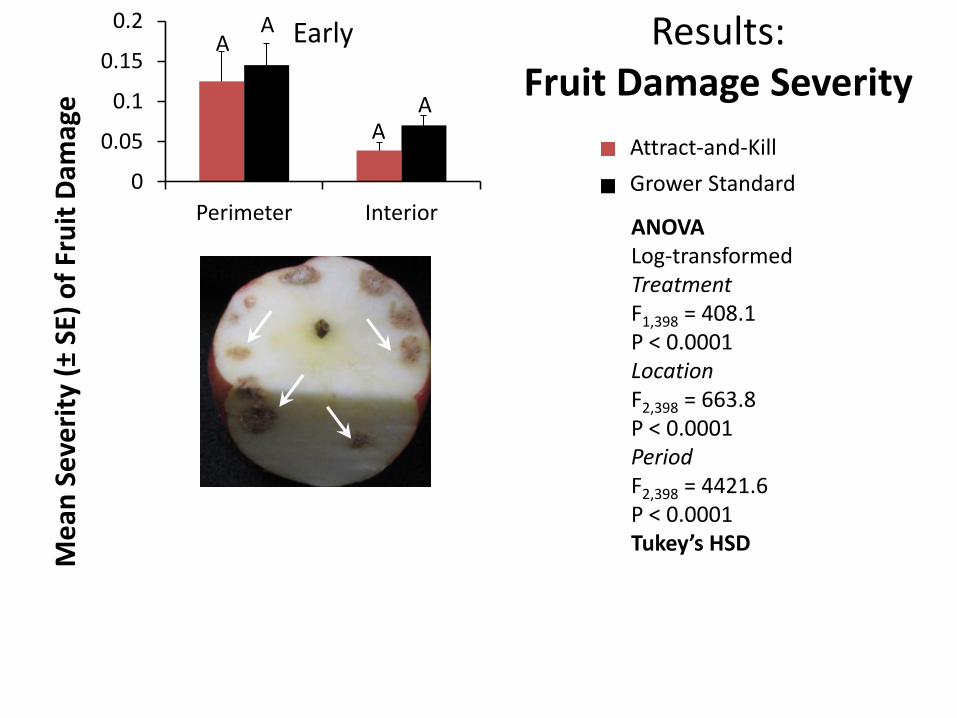
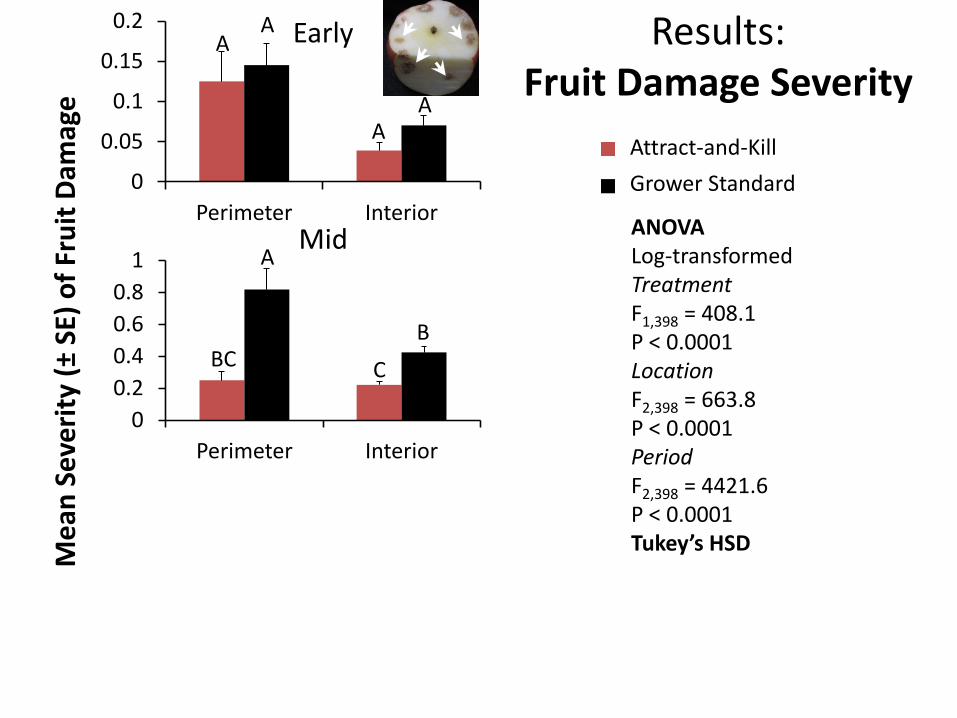
Attract-and-Kill
Grower Standard
Tree Location
Mid
Harvest
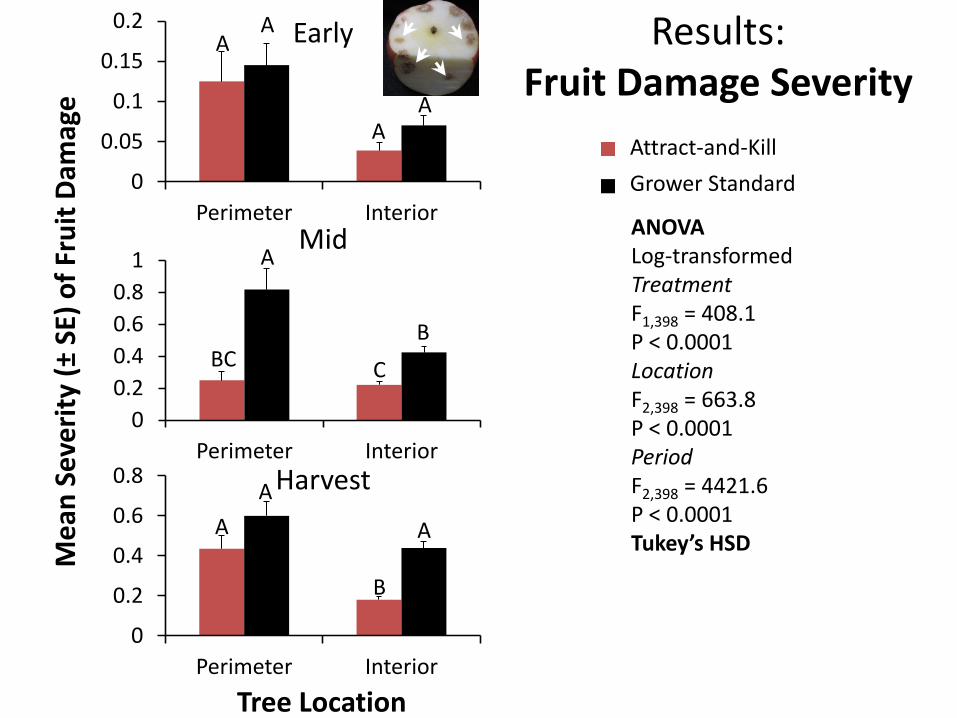
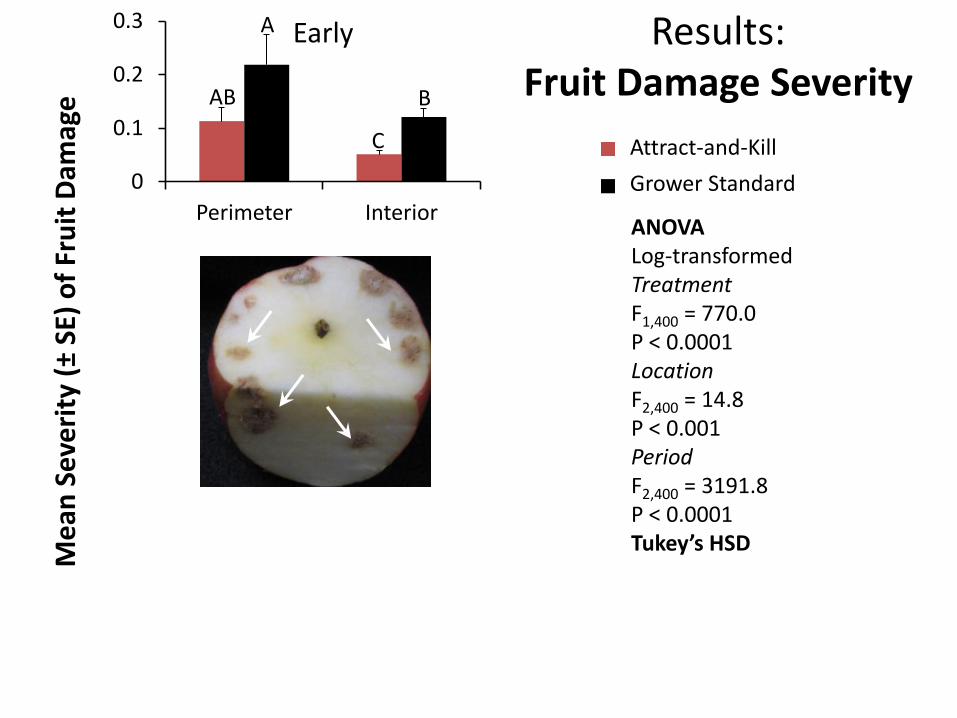
Results: Fruit Damage Severity
A A
A A
A
BC B
C
A
A A
B
ANOVA Log-transformed Treatment F1,398 = 408.1 P < 0.0001 Location F2,398 = 663.8 P < 0.0001 Period F2,398 = 4421.6 P < 0.0001 Tukey’s HSD
0
0.2
0.4
0.6
0.8
Perimeter Interior
0
0.2
0.4
0.6
0.8
1
Perimeter Interior
0
0.05
0.1
0.15
0.2
Perimeter Interior
Me
an S
eve
rity
(±
SE)
of
Fru
it D
amag
e
Early
Attract-and-Kill
Grower Standard
Tree Location
Mid
Harvest
Results: Fruit Damage Severity
A A
A A
A
BC B
C
A
A A
B
ANOVA Log-transformed Treatment F1,398 = 408.1 P < 0.0001 Location F2,398 = 663.8 P < 0.0001 Period F2,398 = 4421.6 P < 0.0001 Tukey’s HSD
0
10
20
30
Perimeter Interior
0
10
20
30
40
Perimeter Interior
0
5
10
15
Perimeter Interior
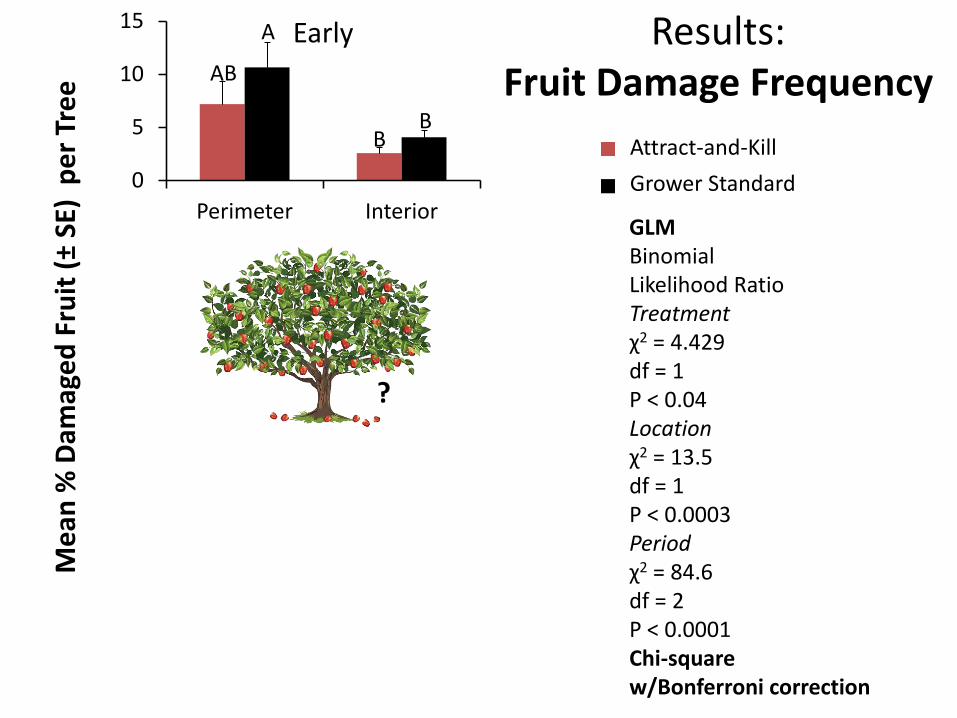
Results: Fruit Damage Frequency
Early M
ean
% D
amag
ed
Fru
it (
± SE
) p
er
Tre
e
Attract-and-Kill
Grower Standard
Tree Location
Mid
Harvest
A
AB
B B
A
B B
B
A A
A
B
GLM Binomial Likelihood Ratio Treatment χ2 = 4.429 df = 1 P < 0.04 Location χ2 = 13.5 df = 1 P < 0.0003 Period χ2 = 84.6 df = 2 P < 0.0001 Chi-square w/Bonferroni correction
?
0
10
20
30
Perimeter Interior
0
10
20
30
40
Perimeter Interior
0
5
10
15
Perimeter Interior
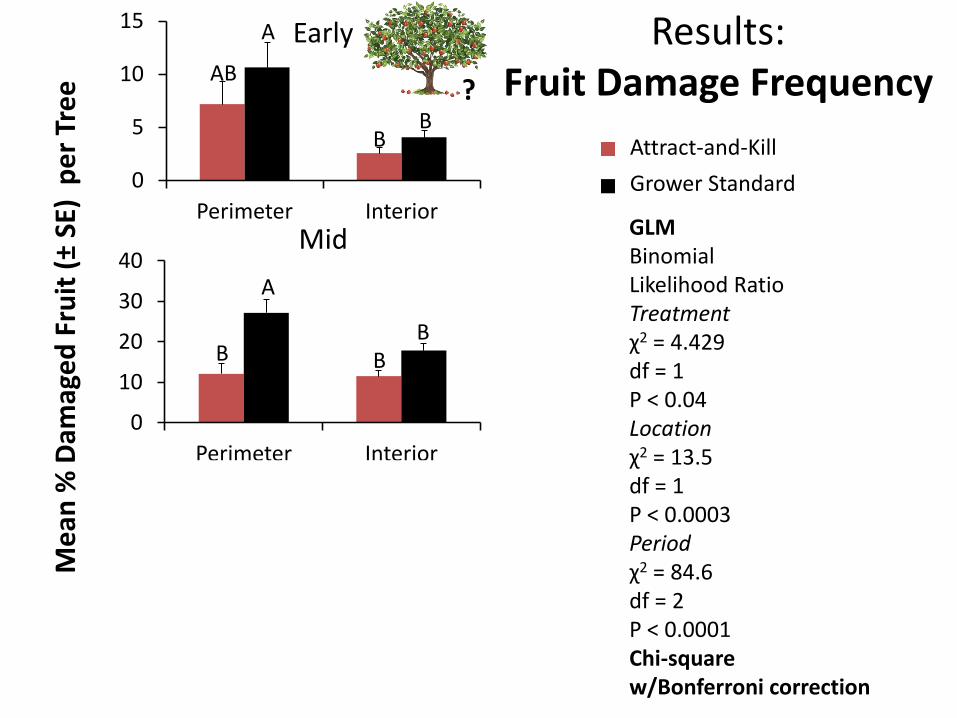
Results: Fruit Damage Frequency
Early M
ean
% D
amag
ed
Fru
it (
± SE
) p
er
Tre
e
Attract-and-Kill
Grower Standard
Tree Location
Mid
Harvest
A
AB
B B
A
B B
B
A A
A
B
GLM Binomial Likelihood Ratio Treatment χ2 = 4.429 df = 1 P < 0.04 Location χ2 = 13.5 df = 1 P < 0.0003 Period χ2 = 84.6 df = 2 P < 0.0001 Chi-square w/Bonferroni correction
?
0
10
20
30
Perimeter Interior
0
10
20
30
40
Perimeter Interior
0
5
10
15
Perimeter Interior
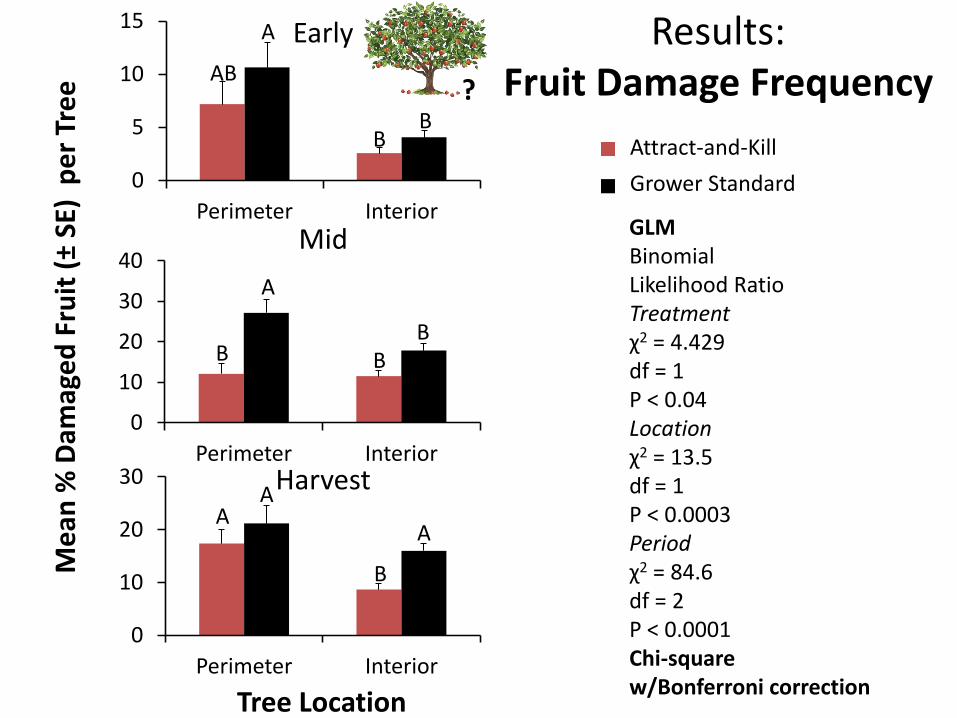
Results: Fruit Damage Frequency
Early M
ean
% D
amag
ed
Fru
it (
± SE
) p
er
Tre
e
Attract-and-Kill
Grower Standard
Tree Location
Mid
Harvest
A
AB
B B
A
B B
B
A A
A
B
GLM Binomial Likelihood Ratio Treatment χ2 = 4.429 df = 1 P < 0.04 Location χ2 = 13.5 df = 1 P < 0.0003 Period χ2 = 84.6 df = 2 P < 0.0001 Chi-square w/Bonferroni correction
?
0
5
10
15
20
AK Control
0
0.5
1
1.5
AK Control
0
1
2
3
4
AK Control
Adults
Nymphs
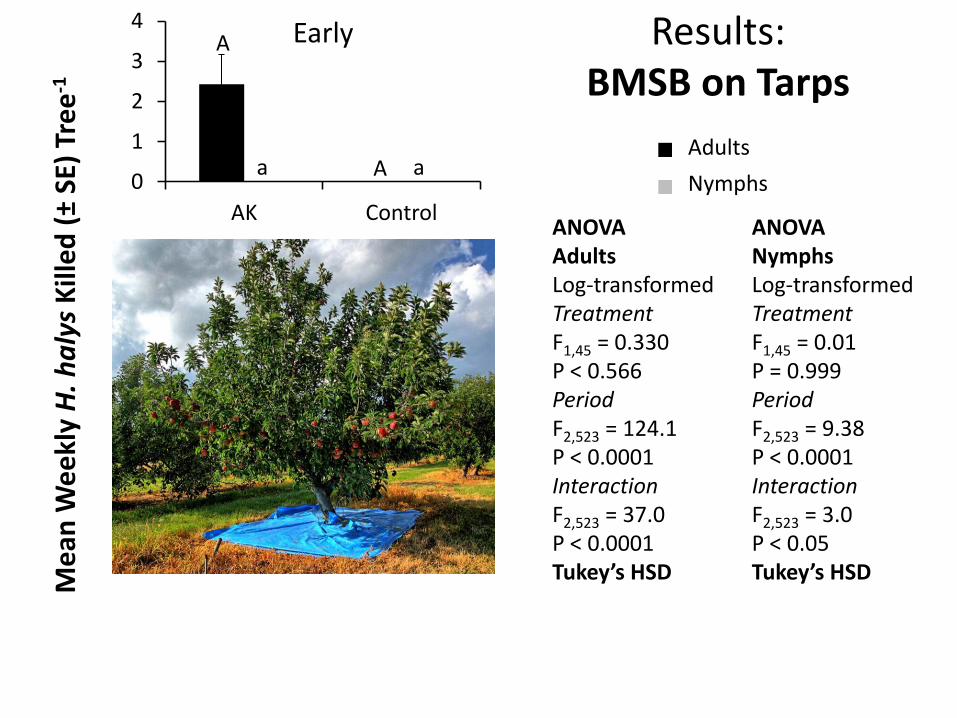
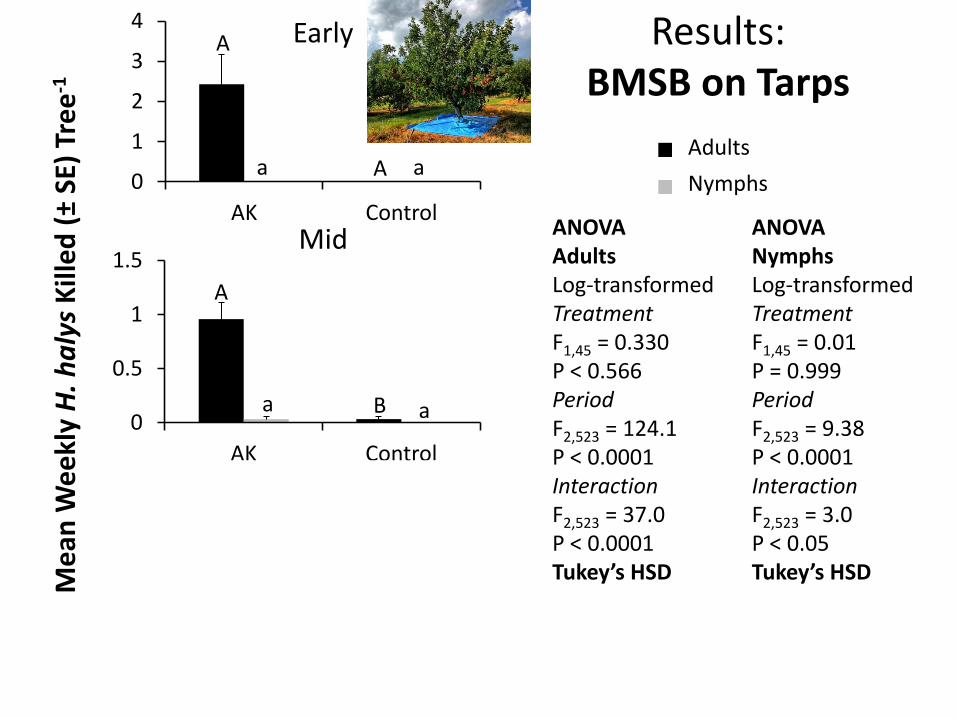
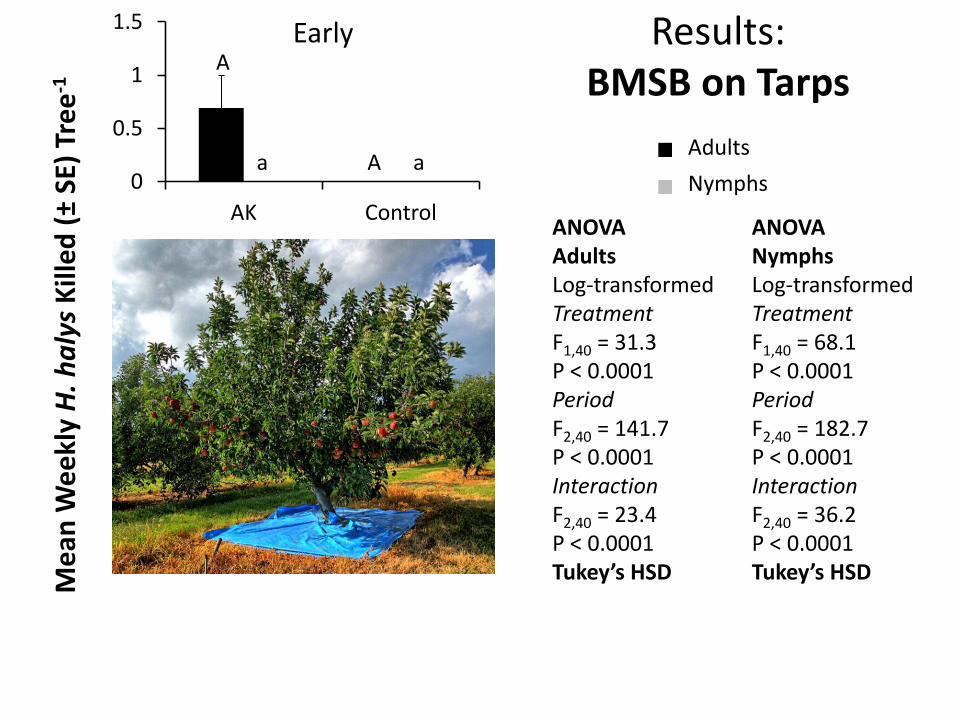
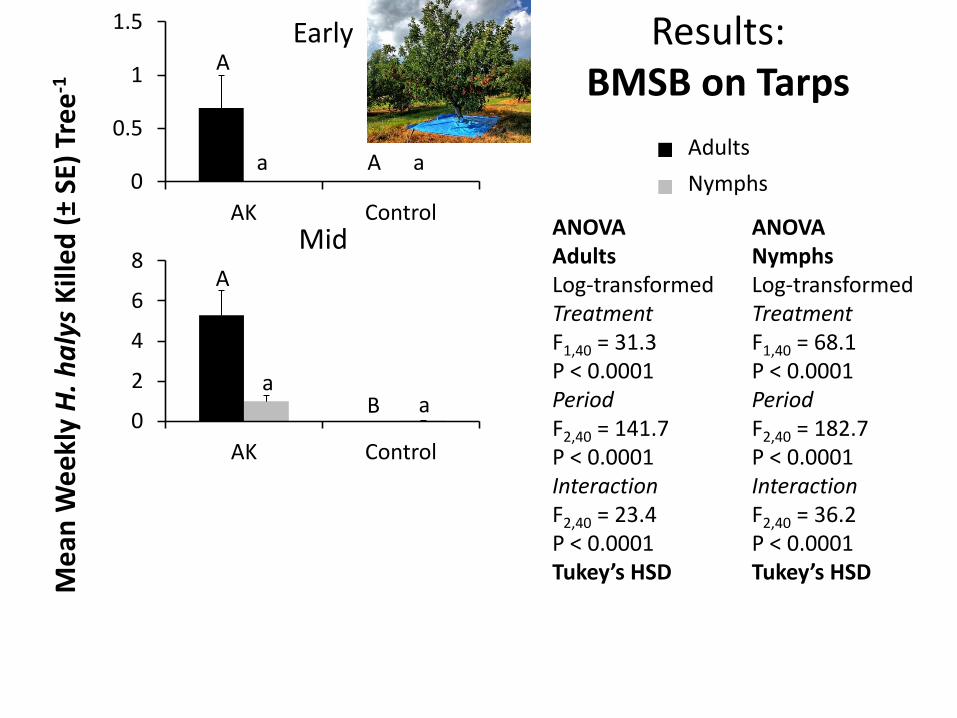
Results: BMSB on Tarps
Early
Treatment
Mid
Harvest
Me
an W
ee
kly
H. h
aly
s K
ille
d (
± SE
) Tr
ee
-1
A
A
A
B
A
B
a a
a a
a b
ANOVA Adults Log-transformed Treatment F1,45 = 0.330 P < 0.566 Period F2,523 = 124.1 P < 0.0001 Interaction F2,523 = 37.0 P < 0.0001 Tukey’s HSD
ANOVA Nymphs Log-transformed Treatment F1,45 = 0.01 P = 0.999 Period F2,523 = 9.38 P < 0.0001 Interaction F2,523 = 3.0 P < 0.05 Tukey’s HSD
0
5
10
15
20
AK Control
0
0.5
1
1.5
AK Control
0
1
2
3
4
AK Control
Adults
Nymphs
Results: BMSB on Tarps
Early
Treatment
Mid
Harvest
Me
an W
ee
kly
H. h
aly
s K
ille
d (
± SE
) Tr
ee
-1
A
A
A
B
A
B
a a
a a
a b
ANOVA Adults Log-transformed Treatment F1,45 = 0.330 P < 0.566 Period F2,523 = 124.1 P < 0.0001 Interaction F2,523 = 37.0 P < 0.0001 Tukey’s HSD
ANOVA Nymphs Log-transformed Treatment F1,45 = 0.01 P = 0.999 Period F2,523 = 9.38 P < 0.0001 Interaction F2,523 = 3.0 P < 0.05 Tukey’s HSD

0
5
10
15
20
AK Control
0
0.5
1
1.5
AK Control
0
1
2
3
4
AK Control
Adults
Nymphs
Results: BMSB on Tarps
Early
Treatment
Mid
Harvest
Me
an W
ee
kly
H. h
aly
s K
ille
d (
± SE
) Tr
ee
-1
A
A
A
B
A
B
a a
a a
a b
ANOVA Adults Log-transformed Treatment F1,45 = 0.330 P < 0.566 Period F2,523 = 124.1 P < 0.0001 Interaction F2,523 = 37.0 P < 0.0001 Tukey’s HSD
ANOVA Nymphs Log-transformed Treatment F1,45 = 0.01 P = 0.999 Period F2,523 = 9.38 P < 0.0001 Interaction F2,523 = 3.0 P < 0.05 Tukey’s HSD
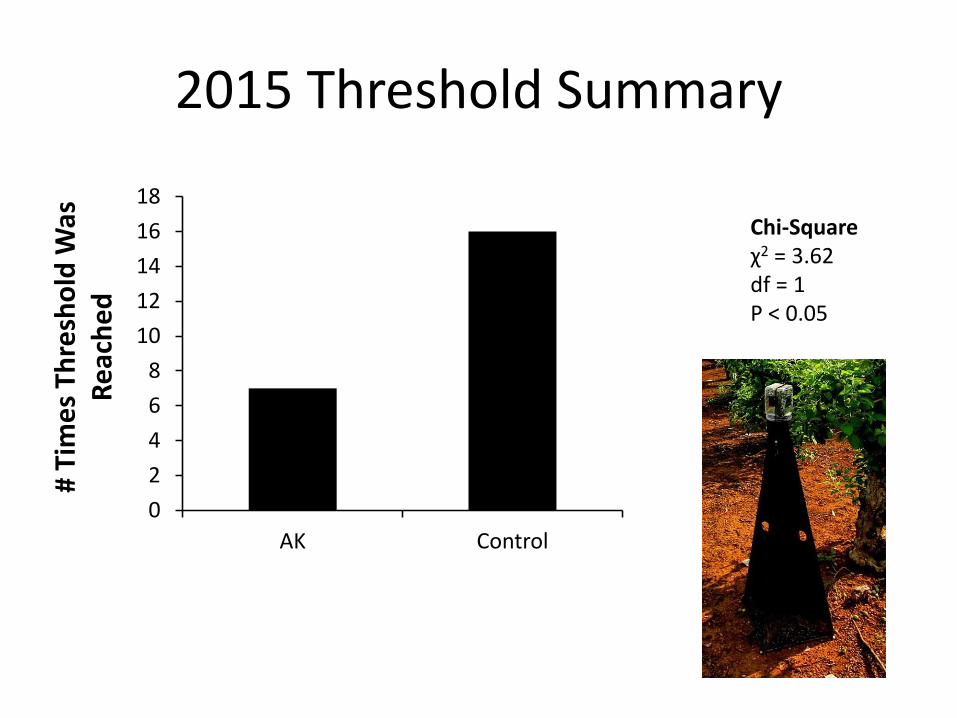
2015 Threshold Summary
0
2
4
6
8
10
12
14
16
18
AK Control
# Ti
me
s Th
resh
old
Was
R
eac
he
d
Chi-Square χ2 = 3.62 df = 1 P < 0.05
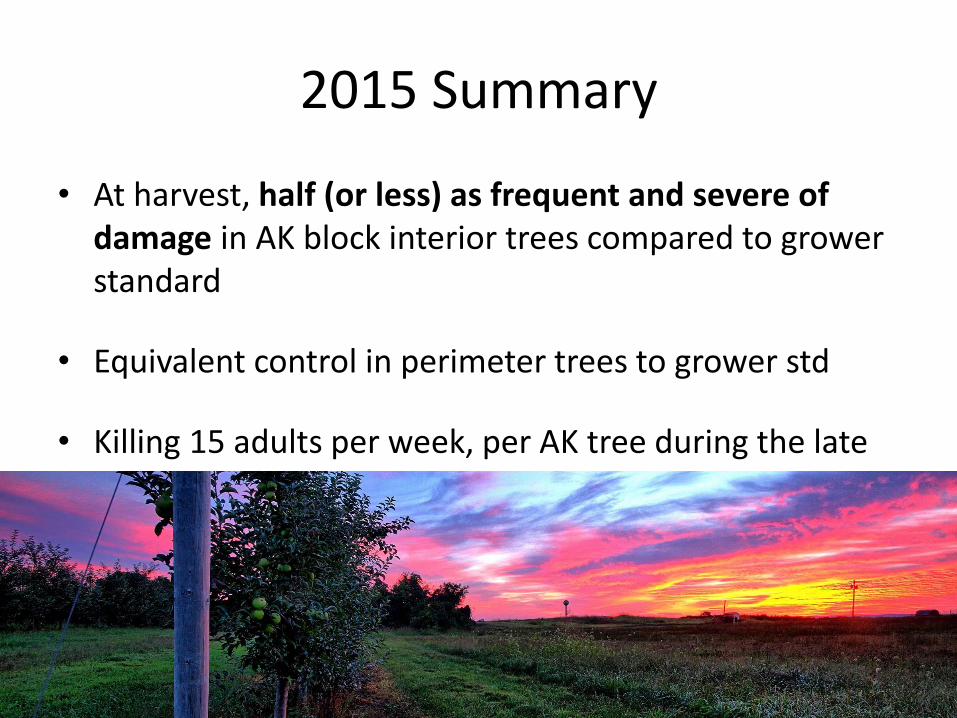
2015 Summary
• At harvest, half (or less) as frequent and severe of damage in AK block interior trees compared to grower standard
• Equivalent control in perimeter trees to grower std
• Killing 15 adults per week, per AK tree during the late season

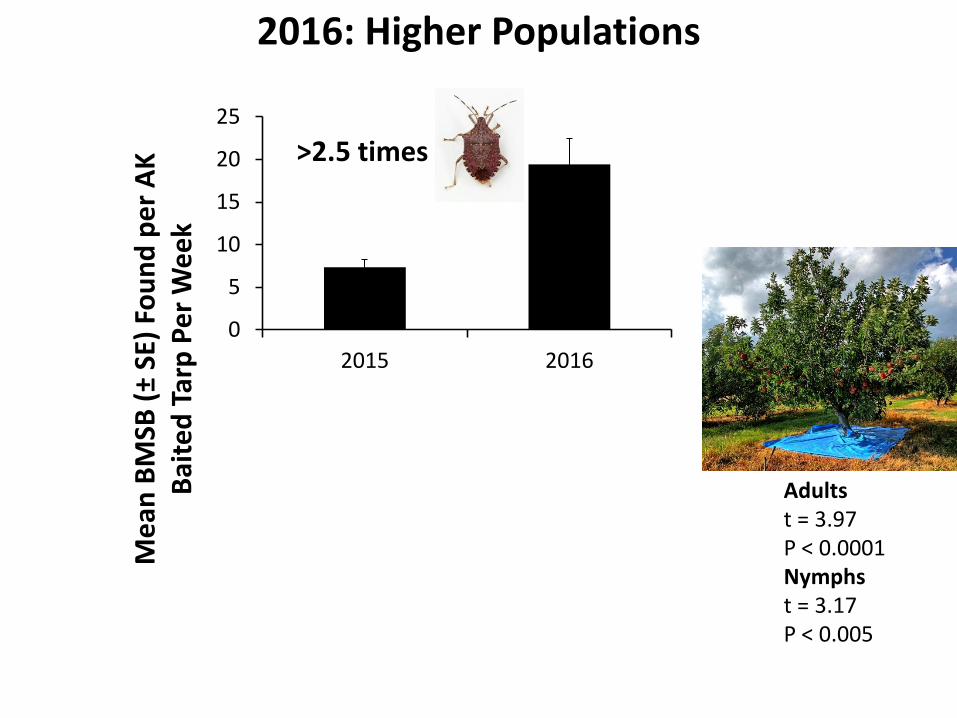
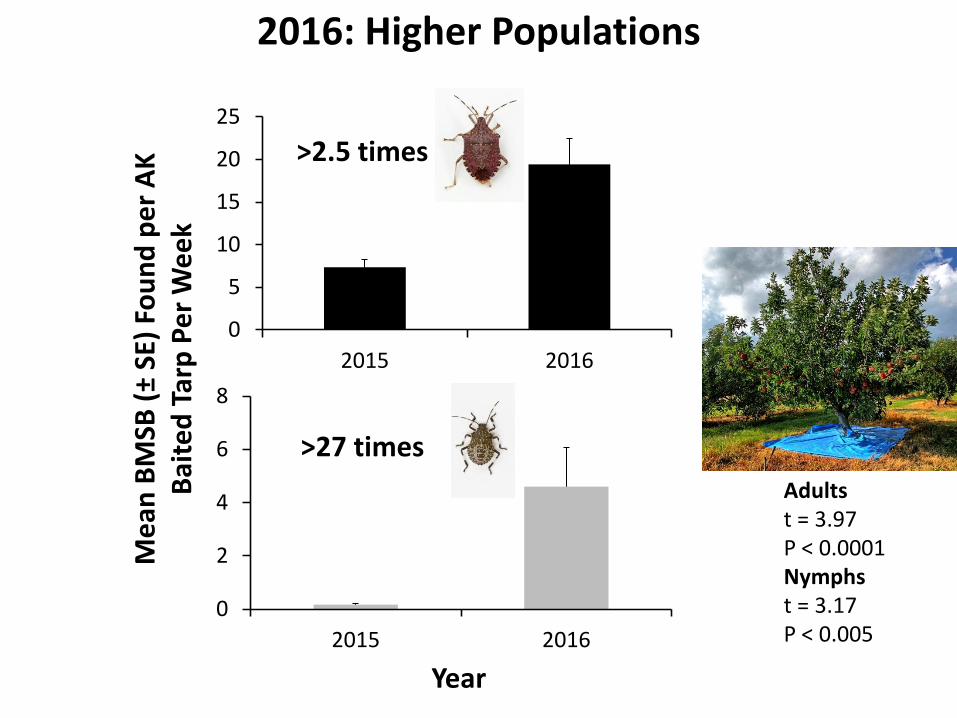
2016 Results: Higher population year
Year
2016: Higher Populations
0
5
10
15
20
25
2015 2016
0
2
4
6
8
2015 2016
Me
an B
MSB
(±
SE)
Fou
nd
pe
r A
K
Bai
ted
Tar
p P
er
We
ek
>2.5 times
>27 times
Adults t = 3.97 P < 0.0001 Nymphs t = 3.17 P < 0.005
2016: Higher Populations
0
5
10
15
20
25
2015 2016
0
2
4
6
8
2015 2016
Me
an B
MSB
(±
SE)
Fou
nd
pe
r A
K
Bai
ted
Tar
p P
er
We
ek
>2.5 times
>27 times
Adults t = 3.97 P < 0.0001 Nymphs t = 3.17 P < 0.005
Year
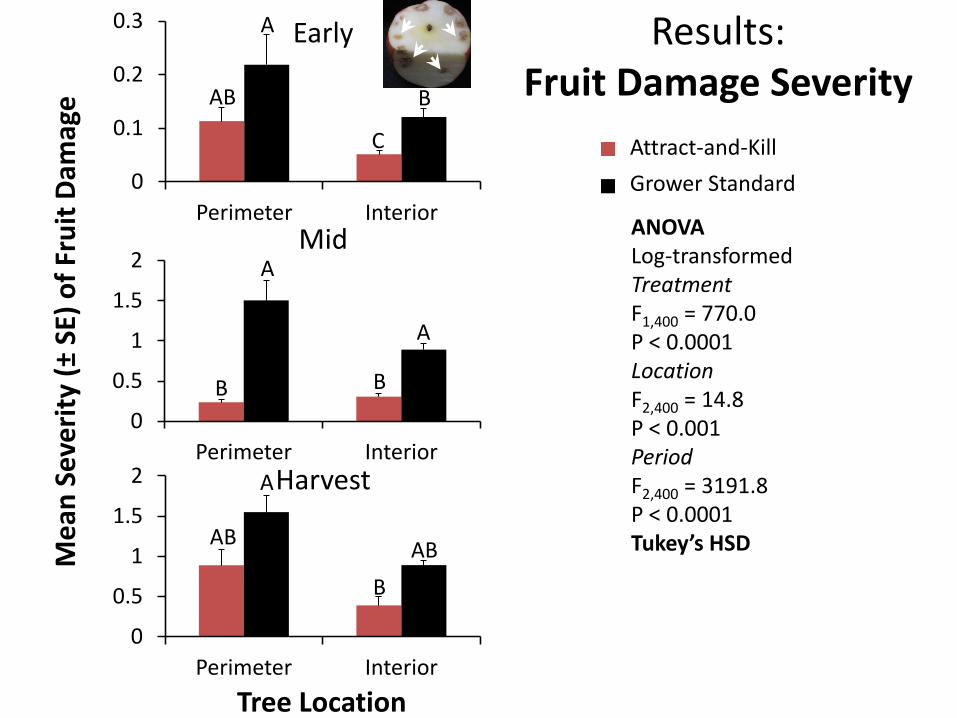
ANOVA Log-transformed Treatment F1,400 = 770.0 P < 0.0001 Location F2,400 = 14.8 P < 0.001 Period F2,400 = 3191.8 P < 0.0001 Tukey’s HSD
A
AB B
C
A
B
A
B
A
AB AB
B
0
0.5
1
1.5
2
Perimeter Interior
0
0.5
1
1.5
2
Perimeter Interior
0
0.1
0.2
0.3
Perimeter Interior
Me
an S
eve
rity
(±
SE)
of
Fru
it D
amag
e
Early
Attract-and-Kill
Grower Standard
Tree Location
Mid
Harvest
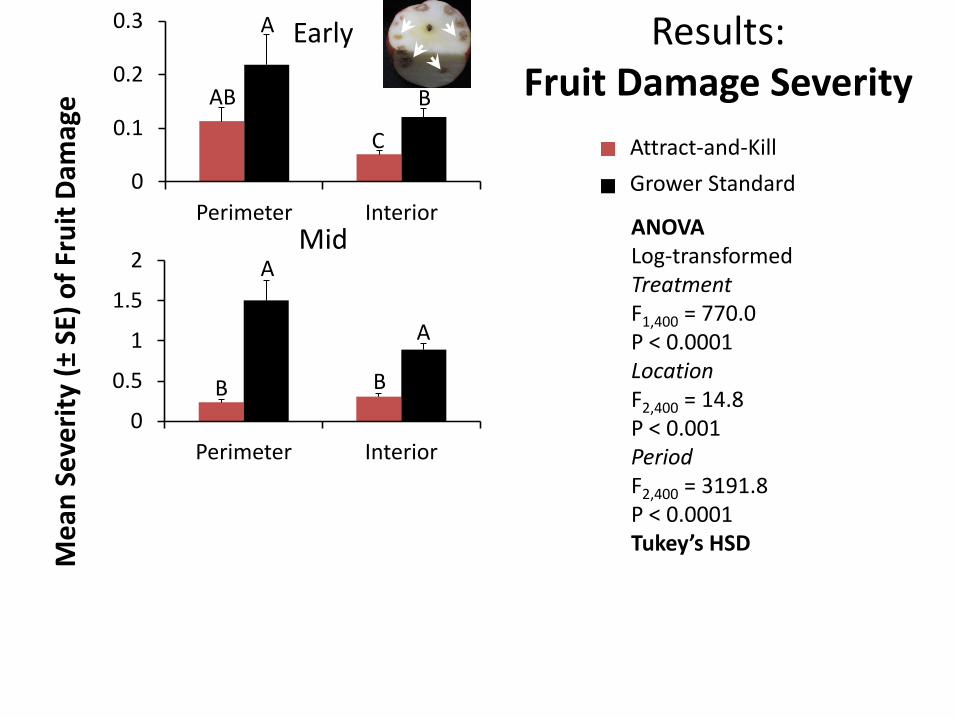
Results: Fruit Damage Severity
A
AB B
C
A
B
A
B
A
AB AB
B
0
0.5
1
1.5
2
Perimeter Interior
0
0.5
1
1.5
2
Perimeter Interior
0
0.1
0.2
0.3
Perimeter Interior
Me
an S
eve
rity
(±
SE)
of
Fru
it D
amag
e
Early
Attract-and-Kill
Grower Standard
Tree Location
Mid
Harvest
Results: Fruit Damage Severity
ANOVA Log-transformed Treatment F1,400 = 770.0 P < 0.0001 Location F2,400 = 14.8 P < 0.001 Period F2,400 = 3191.8 P < 0.0001 Tukey’s HSD
0
0.5
1
1.5
2
Perimeter Interior
0
0.5
1
1.5
2
Perimeter Interior
0
0.1
0.2
0.3
Perimeter Interior
Me
an S
eve
rity
(±
SE)
of
Fru
it D
amag
e
Early
Attract-and-Kill
Grower Standard
Tree Location
Mid
Harvest
Results: Fruit Damage Severity
A
AB B
C
A
B
A
B
A
AB AB
B
ANOVA Log-transformed Treatment F1,400 = 770.0 P < 0.0001 Location F2,400 = 14.8 P < 0.001 Period F2,400 = 3191.8 P < 0.0001 Tukey’s HSD
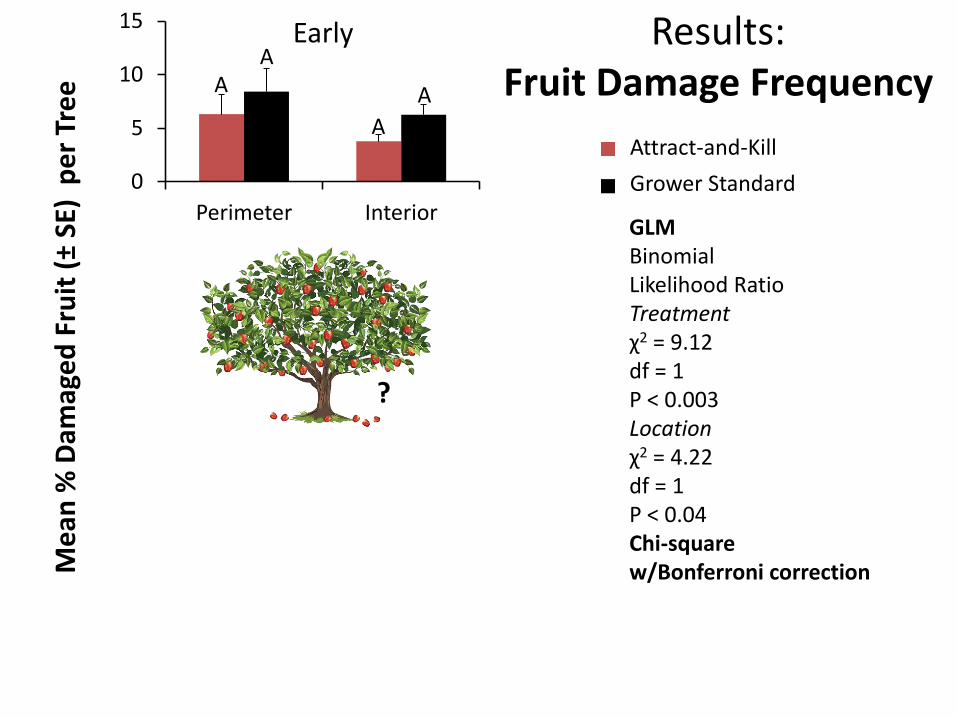
A A A
A
A
B
A
B
A AB
BC
C
0
5
10
15
Perimeter Interior
Early M
ean
% D
amag
ed
Fru
it (
± SE
) p
er
Tre
e
Attract-and-Kill
Grower Standard
0
10
20
30
40
Perimeter Interior
0
10
20
30
40
50
Perimeter Interior
Tree Location
Mid
Harvest
Results: Fruit Damage Frequency
GLM Binomial Likelihood Ratio Treatment χ2 = 9.12 df = 1 P < 0.003 Location χ2 = 4.22 df = 1 P < 0.04 Chi-square w/Bonferroni correction
?
A A A
A
A
B
A
B
A AB
BC
C
0
5
10
15
Perimeter Interior
Early M
ean
% D
amag
ed
Fru
it (
± SE
) p
er
Tre
e
Attract-and-Kill
Grower Standard
0
10
20
30
40
Perimeter Interior
0
10
20
30
40
50
Perimeter Interior
Tree Location
Mid
Harvest
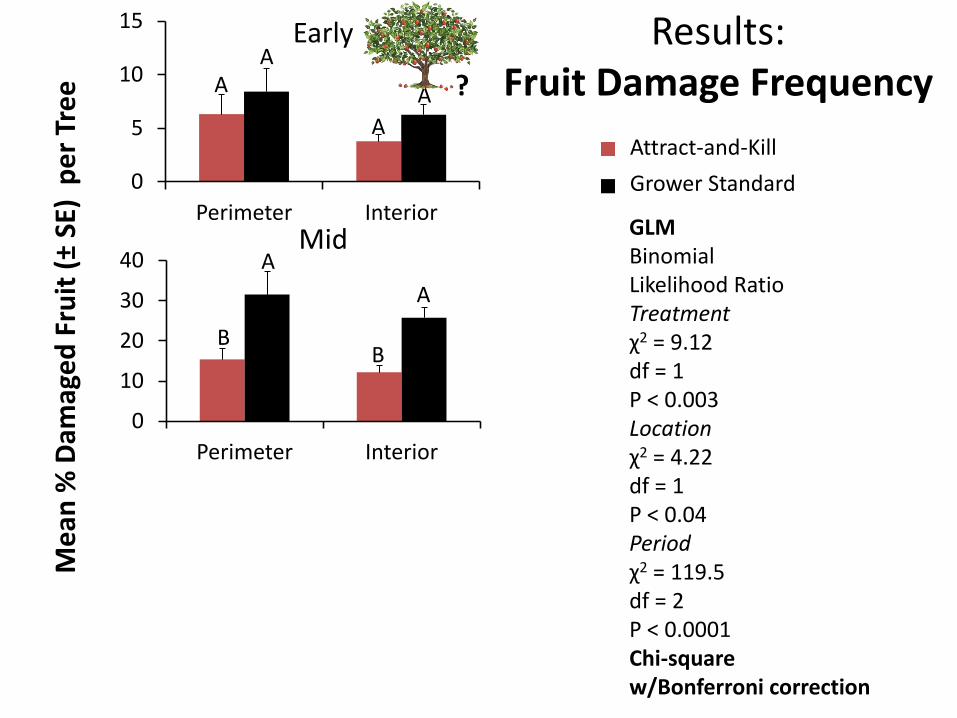
Results: Fruit Damage Frequency
GLM Binomial Likelihood Ratio Treatment χ2 = 9.12 df = 1 P < 0.003 Location χ2 = 4.22 df = 1 P < 0.04 Period χ2 = 119.5 df = 2 P < 0.0001 Chi-square w/Bonferroni correction
?
0
5
10
15
Perimeter Interior
Results: Fruit Damage Frequency
Early M
ean
% D
amag
ed
Fru
it (
± SE
) p
er
Tre
e
Attract-and-Kill
Grower Standard
0
10
20
30
40
Perimeter Interior
Mid
A A A
A
A
B
A
B
0
10
20
30
40
50
Perimeter Interior
Tree Location
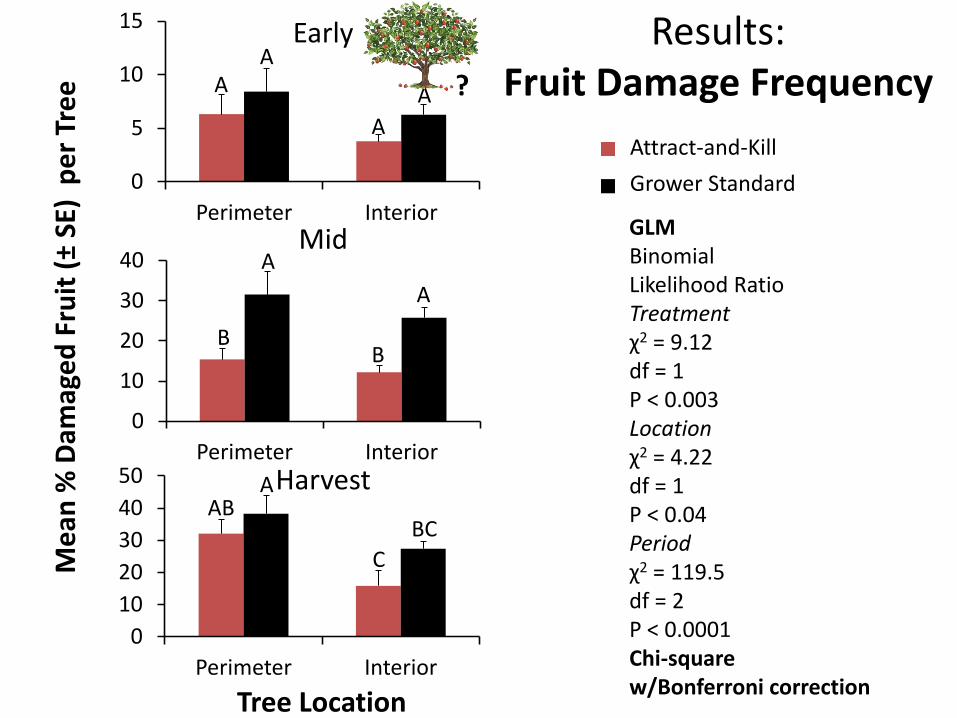
Harvest A AB
BC
C
GLM Binomial Likelihood Ratio Treatment χ2 = 9.12 df = 1 P < 0.003 Location χ2 = 4.22 df = 1 P < 0.04 Period χ2 = 119.5 df = 2 P < 0.0001 Chi-square w/Bonferroni correction
?
0
20
40
60
AK Control
0
2
4
6
8
AK Control
0
0.5
1
1.5
AK Control
Adults
Nymphs
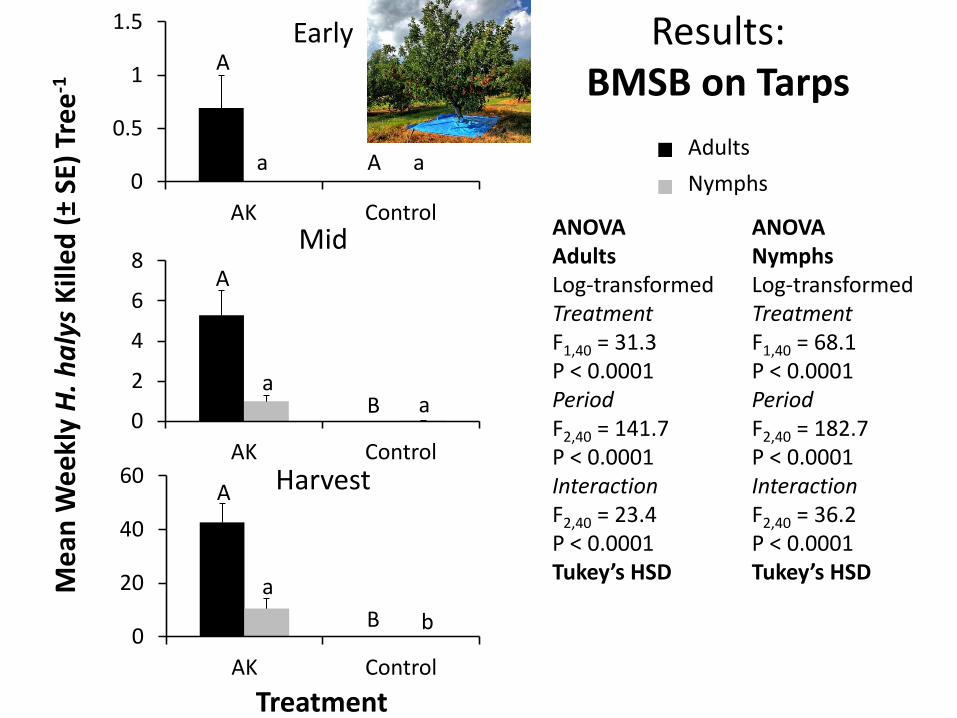
Results: BMSB on Tarps
Early
Treatment
Mid
Harvest
Me
an W
ee
kly
H. h
aly
s K
ille
d (
± SE
) Tr
ee
-1 A
A
A
B
A
B
a a
a a
a
b
ANOVA Adults Log-transformed Treatment F1,40 = 31.3 P < 0.0001 Period F2,40 = 141.7 P < 0.0001 Interaction F2,40 = 23.4 P < 0.0001 Tukey’s HSD
ANOVA Nymphs Log-transformed Treatment F1,40 = 68.1 P < 0.0001 Period F2,40 = 182.7 P < 0.0001 Interaction F2,40 = 36.2 P < 0.0001 Tukey’s HSD
0
20
40
60
AK Control
0
2
4
6
8
AK Control
0
0.5
1
1.5
AK Control
Adults
Nymphs
Results: BMSB on Tarps
Early
Treatment
Mid
Harvest
Me
an W
ee
kly
H. h
aly
s K
ille
d (
± SE
) Tr
ee
-1 A
A
A
B
A
B
a a
a a
a
b
ANOVA Adults Log-transformed Treatment F1,40 = 31.3 P < 0.0001 Period F2,40 = 141.7 P < 0.0001 Interaction F2,40 = 23.4 P < 0.0001 Tukey’s HSD
ANOVA Nymphs Log-transformed Treatment F1,40 = 68.1 P < 0.0001 Period F2,40 = 182.7 P < 0.0001 Interaction F2,40 = 36.2 P < 0.0001 Tukey’s HSD
0
2
4
6
8
10
12
14
16
18
20
AK Control
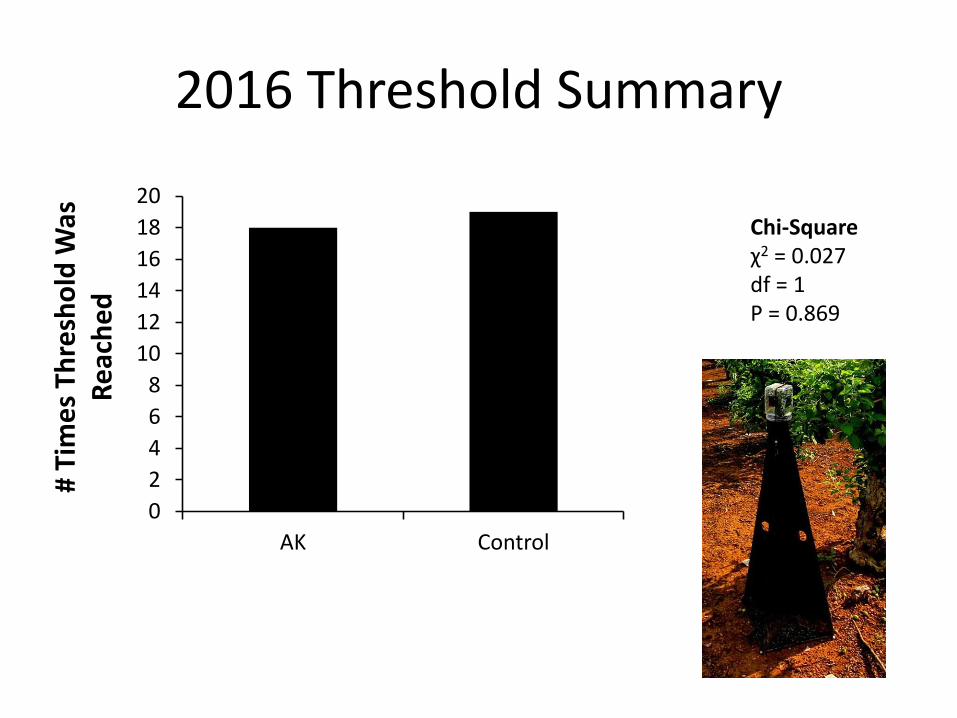
2016 Threshold Summary #
Tim
es
Thre
sho
ld W
as
Re
ach
ed
Chi-Square χ2 = 0.027 df = 1 P = 0.869
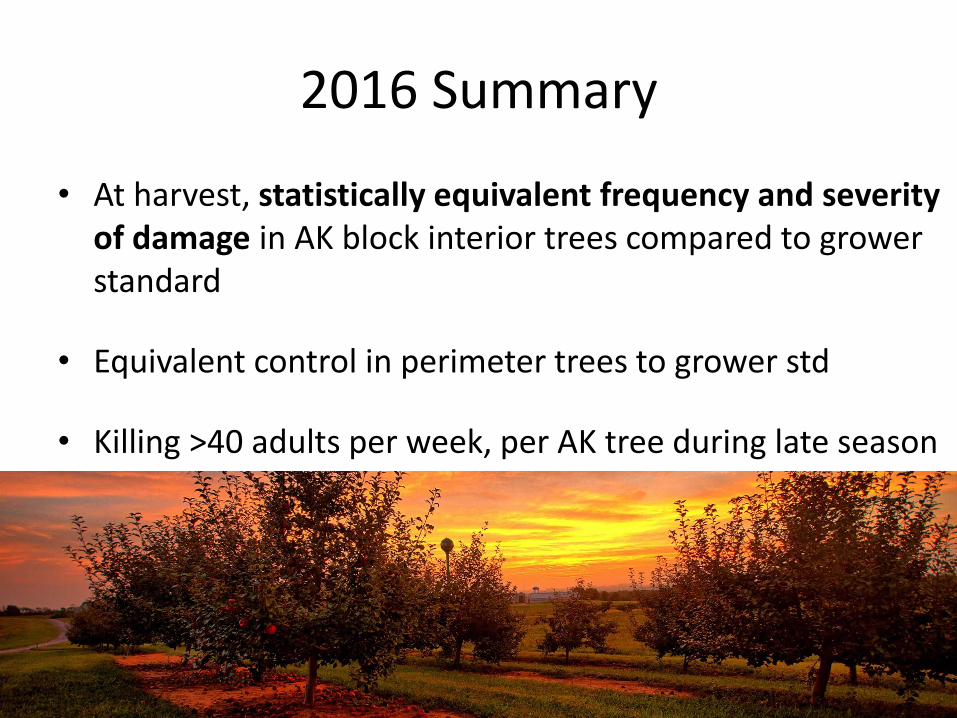
2016 Summary
• At harvest, statistically equivalent frequency and severity of damage in AK block interior trees compared to grower standard
• Equivalent control in perimeter trees to grower std
• Killing >40 adults per week, per AK tree during late season
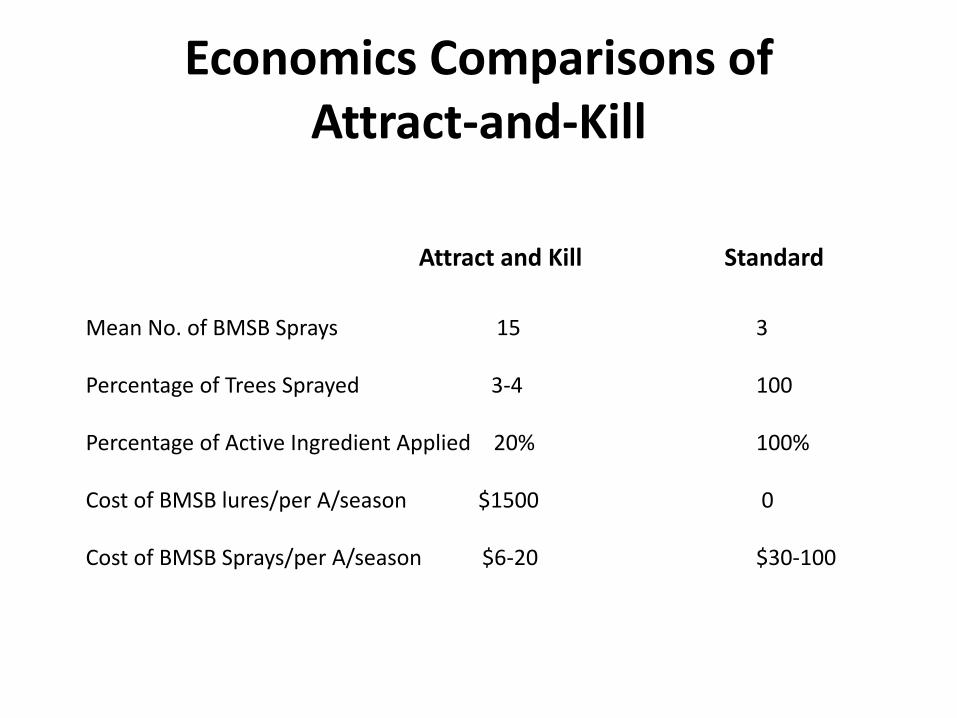
Economics Comparisons of Attract-and-Kill
Mean No. of BMSB Sprays 15 3 Percentage of Trees Sprayed 3-4 100 Percentage of Active Ingredient Applied 20% 100% Cost of BMSB lures/per A/season $1500 0 Cost of BMSB Sprays/per A/season $6-20 $30-100
Attract and Kill Standard
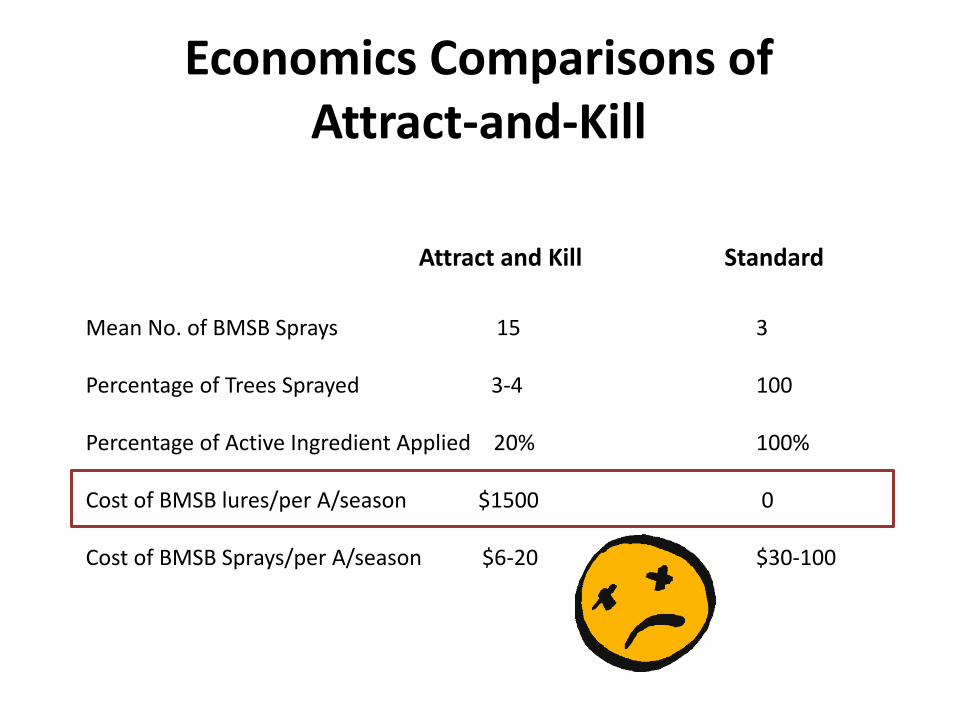
Economics Comparisons of Attract-and-Kill
Mean No. of BMSB Sprays 15 3 Percentage of Trees Sprayed 3-4 100 Percentage of Active Ingredient Applied 20% 100% Cost of BMSB lures/per A/season $1500 0 Cost of BMSB Sprays/per A/season $6-20 $30-100
Attract and Kill Standard
Take Home Messages
• Attract-and-kill is an effective pest management strategy
• But: not cost effective
• Unless lure price or deployment strategy can be significantly altered, no grower will adopt this
Acknowledgements • USDA-ARS, NE SARE
Tracy Leskey
Rob Morrison
Kevin Rice
Kyle Utah
McKenzie Allen
Nate Brandt
Austin Ogden
Torri Hancock
Sharon Jones
Tony Rugh
Lee Carper
Brent Short Chris Hott
John Cullum
Leskey Lab
Thank you for your attention!
In the field one morning…
Related Documents