Reference Document 2009

Welcome message from author
This document is posted to help you gain knowledge. Please leave a comment to let me know what you think about it! Share it to your friends and learn new things together.
Transcript
Reference Document 2009
Ato
s O
rig
in –
Ref
eren
ce D
ocu
men
t 20
09
atosorigin.com
This report utilizes materials (paper, ink, plate and adhesives) that were produced by iso 14001 certified companies and plants. The editing and printing were also done by an imprim’Vert and FsC certified company.

01 . Business profile 01
02 . ceo message 03
03 . Atos origin in 2009 05
04 . Governance 010
05 . Stock market overview 013
06 . Formation of the Group 016
07 . The iT services market 017
08 . Strategy, organisation and 2010 objectives 027
09 . Top program (Total operational performance) 033
10 . consulting 036
11 . Systems integration 039
12 . Managed Services 043
13 . Hi-Tech Transactional Services 046
14 . Medical Bpo 051
15 . Markets strategy 052
16 . Distinctive offerings and innovation 057
17 . The Scientific community: the 2014 journey 063
18 . corporate Social Responsibility 064
19 . Human Resources 071
20 . operational review 077
21 . Financial review 094
22 . Financial statements 100
23 . Risk analysis 180
24 . corporate Governance 186
25 . Resolutions 216
26 . Legal information 218
27 . common stock evolution and share performance 226
28 . Shareholder relations 241
29 . Glossary – definitions 245
30 . persons responsible for the document and the audit of the financial statements 251
31 . AMF cross-reference table 253
32 . Full index 256
33 . contacts 258
34 . Locations 259
Contents
- editing, writting:
- consulting, design & production: www.terredesienne.com
Atos Origin » Annual Report 2009 » 01www.atosorigin.com
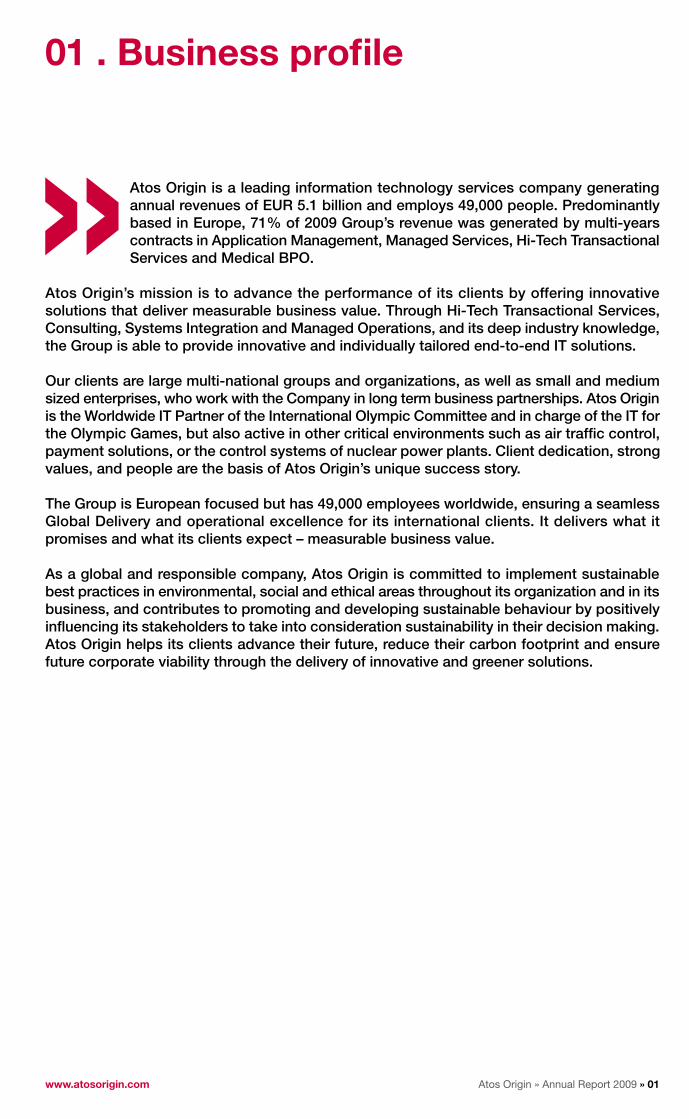
Atos Origin is a leading information technology services company generating annual revenues of EUR 5.1 billion and employs 49,000 people. Predominantly based in Europe, 71% of 2009 Group’s revenue was generated by multi-years contracts in Application Management, Managed Services, Hi-Tech Transactional Services and Medical BPO.
Atos Origin’s mission is to advance the performance of its clients by offering innovative solutions that deliver measurable business value. Through Hi-Tech Transactional Services, Consulting, Systems Integration and Managed Operations, and its deep industry knowledge, the Group is able to provide innovative and individually tailored end-to-end IT solutions.
Our clients are large multi-national groups and organizations, as well as small and medium sized enterprises, who work with the Company in long term business partnerships. Atos Origin is the Worldwide IT Partner of the International Olympic Committee and in charge of the IT for the Olympic Games, but also active in other critical environments such as air traffic control, payment solutions, or the control systems of nuclear power plants. Client dedication, strong values, and people are the basis of Atos Origin’s unique success story.
The Group is European focused but has 49,000 employees worldwide, ensuring a seamless Global Delivery and operational excellence for its international clients. It delivers what it promises and what its clients expect – measurable business value.
As a global and responsible company, Atos Origin is committed to implement sustainable best practices in environmental, social and ethical areas throughout its organization and in its business, and contributes to promoting and developing sustainable behaviour by positively influencing its stakeholders to take into consideration sustainability in their decision making. Atos Origin helps its clients advance their future, reduce their carbon footprint and ensure future corporate viability through the delivery of innovative and greener solutions.
01 . Business profile
Atos Origin » Annual Report 2009 » 02
01 . Business profile
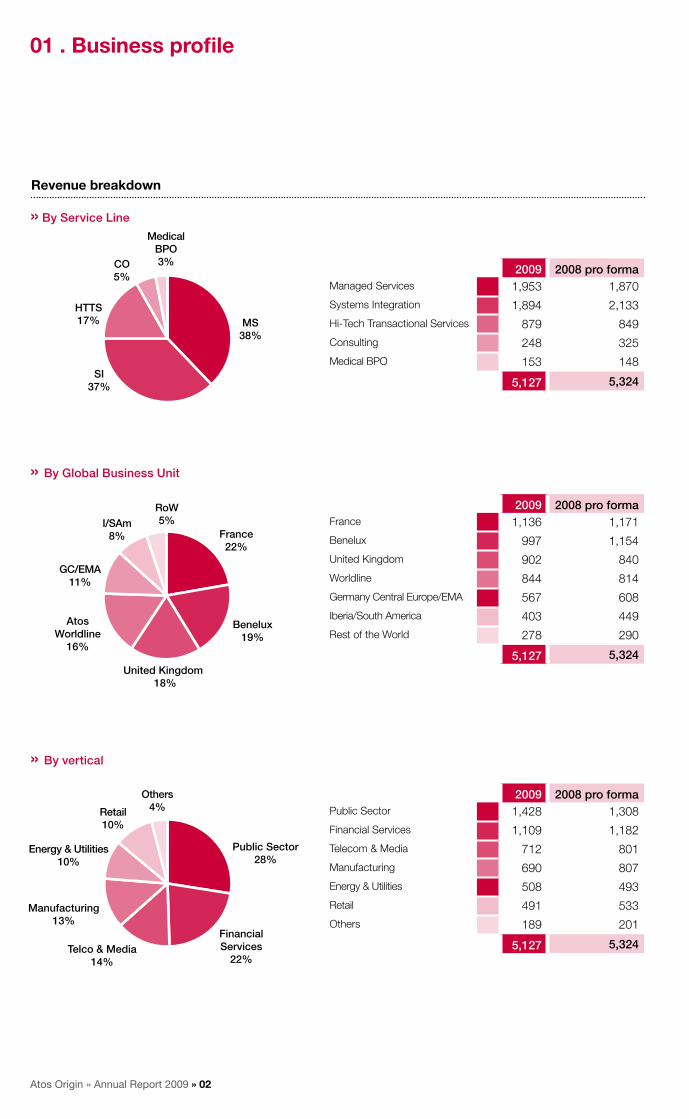
Revenue breakdown
» By Global Business Unit
RoW 5%I/SAm
8%
GC/EMA 11%
Atos Worldline
16%
United Kingdom 18%
Benelux 19%
France 22%
2009 2008 pro formaFrance 1,136 1,171
Benelux 997 1,154
United Kingdom 902 840
Worldline 844 814
Germany Central Europe/EMA 567 608
Iberia/South America 403 449
Rest of the World 278 290
5,127 5,324
» By Service Line
Medical BPO 3%CO
5%
HTTS 17%
SI 37%
MS 38%
2009 2008 pro formaManaged Services 1,953 1,870
Systems Integration 1,894 2,133
Hi-Tech Transactional Services 879 849
Consulting 248 325
Medical BPO 153 148
5,127 5,324
2009 2008 pro formaPublic Sector 1,428 1,308
Financial Services 1,109 1,182
Telecom & Media 712 801
Manufacturing 690 807
Energy & Utilities 508 493
Retail 491 533
Others 189 201
5,127 5,324
Others 4%Retail
10%
Energy & Utilities 10%
Manufacturing 13%
Telco & Media 14%
Financial Services
22%
Public Sector 28%
» By vertical

Atos Origin » Annual Report 2009 » 03www.atosorigin.com
Dear Shareholders,
In 2009, Atos Origin achieved the first stage of its three-year recovery plan, despite one of the most challenging economic environments the IT sector has ever faced.
Our Group increased its profitability by more than 80 basis points to 5.7%, thus reducing the gap with its three-year objective, and improved its cash flow generation to reduce the net debt by EUR 165 million. The organic decline in revenue was limited to -3.7%. These objectives were achieved in spite of a difficult environment, particularly in Germany where the bankruptcy of one of our key customers - the retailer Arcandor - significantly affected the Group’s net income, which in 2009 totalled EUR 32 million.
Overall I am convinced that our credibility in terms of delivering on our commitments is the best argument that we can provide to our clients, our staff and our shareholders to demonstrate our determination to build long-term partnerships that create value for everyone.
Your company continues to demonstrate its expertise and skills in delivering large and complex projects. As an illustration the contract with the International Olympic Committee was renewed in 2009 and extended through to the Rio de Janeiro 2016 Olympic Games in Brazil. Once again, Atos Origin successfully delivered a flawless IT performance for the Vancouver 2010 Olympic Winter Games last February. Through this major sporting event, we demonstrated to a worldwide audience of 3 billion people our outstanding ability to provide the best IT services and expertise to our customers.
To further improve our performance, Atos Origin launched a major transformation program.
We have strengthened our organization so we can operate in the more challenging economic environment and properly execute our transformation program. Following the creation of a new governance structure, with a single Board of Directors and a Chairman & CEO, we have made several new appointments at the Executive Committee level; empowered the Global Support Functions and Global Delivery Lines; created the Global Sales and Market unit and the Strategic International Customers division. This division is responsible for managing centrally the major global accounts of the Group. With this new operational model established in 2009, Atos Origin is now a fully integrated company leveraging on its scale and strengths.
The TOP (Total Operational Performance) Program which was launched at the end of 2008 in order to further improve our operational performance continues and contributed significantly in 2009 to reducing our cost base and increasing cash generation. Among the TOP initiatives, we launched a Lean Management Program to improve our delivery efficiency, the quality of services to our clients, and our staff engagement. At the end of 2009, new TOP initiatives were launched to increase our sales and deliver more global and innovative solutions to our customers. Our Sales force has also been reorganized through the Global Atos Origin Market Alignment (GAMA) project which is based on a market sector-approach in order to better adapt our solutions to the specific needs of our clients.
We also reinforced our commitment to making our IT services “green” in accordance with the best international standards.
Since the beginning of the economic slowdown, the Company’s main priority has been protecting the jobs of its employees and developing their employability. In 2009, Atos Origin hired 4,500 engineers, of which half were graduates. In the medium-term, our ambition is to be recognised as being one of the best companies to work for by anticipating new ways of working and attracting and retaining the most talented engineers. This is the objective of the “Well Being at Work” initiative which was launched in December 2009 within the TOP Program.
02 . CEO message
Thierry BRETOn, Chairman and Chief Executive Officer

Atos Origin » Annual Report 2009 » 04
Even if the crisis is not yet behind us, we need to anticipate what the winning approach will be in the post-crisis IT market. Our clients are facing major ruptures in their business environment (financial, economic, technological, and social) and they expect us, as a technology company, to help them reinvent their growth model. We believe that in the IT sector, the post-crisis landscape will see the co-existence of more industrialized, traditional IT services together with a new type of IT solution focused on business critical services. The differentiator will be innovation which has always been part of Atos Origin’s DNA.
To this extent, our successful Hi-Tech Transactional Services (HTTS) is one way in how we are delivering value to our customers through our own strong IPR and processing assets. HTTS truly differentiates us and has been designed as a new global service line, in order to roll out Atos Worldline offerings for electronic payments, financial markets, e-customers, citizen and community services to all countries where Atos Origin is present. Our ambition is to double HTTS revenue organically in the next four years.
As a commitment to research and innovation, we have created a Scientific Committee comprising the fifty best scientists of our Group, representing eight nationalities. The Group is tasked with identifying the main technology challenges for us and our clients in the next 20 years. With its support, we have decided to present, every three months, distinctive and innovative packaged offerings that match our clients’ expectations. In January 2010, we started by launching Atos Sphere, which brings together all our Cloud solutions from Consulting, Systems Integration and Managed Services. Already a pioneer in Cloud Computing with our Atos Worldline services, our aim is to
be a “Cloud enabler”, supporting our clients achieve their business objectives. We have also launched Ambition Carbon Free, our new Green IT solutions designed to reduce by half the IT carbon footprint of our clients–and even offset it. Our next packaged offerings concern Smart Utilities and Smart Grid, Enterprise Content Management, Collaborative tools, Context Aware computing, Social Computing…
Atos Origin’s main priority in 2010 will be to protect the jobs and the employability of its 49,000 staff. In this respect, we expect to double our training efforts in order to ensure we have the skills and talent to meet the needs of our customers.
We will move one step further in the transformation of our Company, accelerating the TOP Program, implementing the next steps of the GAMA sales organization, further deploying HTTS across the Group and developing “Well Being at Work” initiatives, starting with our new Atos Origin campus and headquarters in Bezons near Paris.
Finally, I strongly believe that if we deliver our commitments semester after semester, proving our ability to execute our transformation plan and to anticipate the new “post crisis” IT environment, Atos Origin undoubtedly has all that is required to achieve its medium-term strategy. For myself and for the Board of Directors our success will be the best way to thank all our stakeholders who contribute to our development and to the fulfilment of our ambitions.
Thierry BRETOn, Chairman and Chief Executive Officer
02 . CEO message

Atos Origin » Annual Report 2009 » 05www.atosorigin.com
3.1 Financial highlights
3.1.1 Income statement
(in EUR million)FY
2009FY
2008 % Change
Statutory revenue 5,127 5,623 -8.8%
Change in perimeter -198
Impact from exchange rates -101
REvEnUE AT COnSTAnT SCOPE AnD ExCHAnGE RATES 5,127 5,324 -3.7%
STATUTORY OPERATInG MARGIn 290.0 266.4 +8.8%
% of revenue 5.7% 4.7% +92 pt
Change in perimeter -2.3
Impact from exchange rates -7.7
OP. MARGIn AT COnSTAnT SCOPE AnD ExCHAnGE RATES 290.0 256.5 +13.1%
% of revenue 5.7% 4.8% +84 pt
nET InCOME GROUP SHARE 31.7 22.6 +40.3%
% of revenue 0.6% 0.4%
ADjUSTED nET InCOME GROUP SHARE (C) 196.0 180.6 +8.5%
% of revenue 3.8% 3.2%
Earnings per share (EPS)
Basic EPS (1) 0.46 0.33
Diluted EPS (2) 0.44 0.33
Adjusted basic EPS (1) (3) 2.85 2.62
Adjusted diluted EPS (2) (3) 2.64 2.62
(1) In euros, based on a weighted average number of shares.(2) In euros, based on a diluted weighted average number of shares.(3) Based on net income (Group share) before unusual, abnormal and infrequent items (net of tax).
03 . Atos Origin in 2009
3.1 Financial highlights 053.2 Company 2009 highlights 08

Atos Origin » Annual Report 2009 » 06
03 . Atos Origin in 2009
10-year gearing and leverage ratio evolution
net debt / OMDA Gearing
0.64
20%
2000 2001 2002 2003 2004 2005 2006 2007 2008 2009
0.0
0.4
0.6
0.8
1.0
1.2
0%
20%
40%
60%
34%
49%
56%
46%
30%
9%
0.67
0.81
0.36
0.56
0.42
1.13
0.77
1.13
20%18%
2000 2001 2002 2003 2004 2005 2006 2007 2008 2009
3.1.2 Financial and operational indicators
10 years net debt and equity evolution
net debt (in EUR million) Equity (in EUR million)
0
500
1,000
1,500
2,000
2,500
139
304338235
114 180
360440
266
492
1,6541,542
1,864
479330
2,027
1,840
784
584
1,635
With: Gearing ratio: Net debt÷Group Equity■■
OMDA: Operating Margin bebore Depreciation and Amortization■■
NB: The figures have been issued under French Accounting standards until Year 2004 included, and under IFRS as of 01/01/2005.
Gearing net debt / OMDA
0.288%

Atos Origin » Annual Report 2009 » 07www.atosorigin.com
03 . Atos Origin in 2009
5-year operating margin performance (in EUR million)
5-year revenue performance (in EUR million)
5-year employees evolution Net debt (in EUR million)
Order entry
2005 2006 2007 2008 2009 2005 2006 2007 2008 2009 2005 2006 2007 2008 2009
Order entry (in EUR million)
Book to bill in %
5,1485,368
6,1995,921
6,649
122%110%
101%106%
98%
Full backlog
Full blacklog (in EUR million)
% revenue (year)
6,8367,443
8,4917,942
7,432
x 1.4
x 1.5
x 1.3
x 1.5x 1.4
Full pipeline
Full pipeline (in EUR million)
% revenue (months)
3,013
2,674
2,1112,166
2,611
x 5.7
x 4.8
x 7.1
x 4.3
x 5.9
NB: 2005 operating margin presented before equity-based compensation.
5,459 5,397
2005
5,855
2006
5,623
2007
5,127
20092008
47,684
180
49,841360
2005 2005
51,704
338
2006 2006
50,975
304
2007 2007
49,036
139
2009 20092008 2008
413
247
2005
272
2006
266
2007
290
20092008

Atos Origin » Annual Report 2009 » 08
The Olympics success story continues
Extensive preparations were undertaken by Atos Origin during 2009 for the Vancouver 2010 Olympic and Paralympic Games, including technical rehearsals and live tests, to ensure a flawless delivery of one of the world’s most complex IT systems that relays results, events and athlete information to spectators and media around the world.
Atos Origin’s special expertise in designing, integrating, managing and securing the different IT systems needed to manage the Games and relay competition results to a world-wide audience of more than three billion people was demonstrated in the Technical Road map it published during 2009 as the Company prepares to deliver a sustainable London 2012 Olympic and Paralympic Games in real time.
Group’s unrivalled experience in consistently running the world’s largest sports-related contract since 2002 led to an extension by the International Olympic Committee of its contract as the Worldwide IT Partner for the Olympic Games and Top Sponsor through to 2016. In addition to the London Olympic Games in 2012, Atos Origin will now cover the Sotchi Olympic Winter Games in 2014 in Russia and the Rio Olympic Summer Games in 2016 in Brazil.
Innovation and leadership bring new wins
Atos Origin ability to lead international projects and its demonstrated expertise and capacity for technological innovation were key factors cited by many of its clients in awarding the company contracts during 2009.
Moreover, Atos Origin’s in-depth understanding of the business drivers in global market sectors also proved decisive in its major wins in 2009. These included new and renewed contracts for its core services of Managed Services, Systems Integration, and Consulting in the Financial Services sector (Royal Liver, KAS Bank, SCB, UVIT and Munich Re), Manufacturing, Retail & Transportation (Brother, Zumtobel, NXP, Toyota Boshoku Europe, Renault Lekkerland, Match Supermarkets, Thalys International, Go-Ahead and Scotrail), and Public Sector & Health (DSM, Univé-VGZ-IZA-Trias, UK Department of Health and Scottish Government).
The specialized Hi-Tech Transactional Services were rolled out during 2009 at the global level, attracting new clients such as GIP e-Bourgogne (e-Community services), and fuelGenie (ePayment services) as well as a contract extension for its card processing with Postbank and renewal of its contract with Travelex.
03 . Atos Origin en 20093.2 Company 2009 highlights
3.2 Company 2009 highlights
» 2009, a year of operational excellence

Atos Origin » Annual Report 2009 » 09www.atosorigin.com
Robust management underpinning operations
To keep apace with the ever-growing global activities of its clients and the need to make swift, effective decisions for the benefit of its global clients, Atos Origin strengthened its organization during 2009 with important new appointments in its Executive Committee: Francis Delacourt (Head of Strategic International Accounts and Deals), Marc-Henri Desportes (Head of Global Innovation Business Development & Strategy), Eric Grall (Head of Global Managed Services), Francis Meston (Head of Global Systems Integration), Hervé Payan (Head of Global Consulting). Philippe Mareine is the General Secretary of the Executive Committee.
Transparent governance and a strong commitment to pursue its ambitious Corporate Social Responsibility program were also highlights for Atos Origin in 2009. Atos Origin was proud to win the Sustainability Star for Carbon Reduction at the Vancouver 2010 Olympic Winter Games and were delighted with its ISO 14001 certification for the environmental performance of all its data centers and buildings in the Netherlands. In a white paper the company set out its global vision of how to tackle sustainability using IT and how to develop the necessary services and solutions to transform how businesses, value chains, networks and society as a whole operate.
Award-winning, best-in-class expertise
The commitment to operational excellence has been enhanced this year by further partnerships with other world class specialist providers such as Microsoft, SAP and Oracle, so Atos Origin can provide the most reliable state of the art solutions for our its clients.
Atos Origin continued to garner plaudits from relevant international and national certification bodies in the form, for example, of ISO/IEC 27001 Certification for its Network & Security Services in France, a renewed Level 1 PCI DSS Certification from Visa and MasterCard for its Secure Payment Platform and certif ication to Run SAP® Methodology to implement end-to-end solution operations standards for clients.
Group’s innovative technological solutions were recognized by a number of industry awards in 2009. These included an award for Atos Worldline’s innovative remote payment solution, the prestigious Novell award “Best EMEA Partner of 2008 for Identity & Security Management”, and Atos Consulting’s Operational Performance in the Public Sector Award by the Management Consultancies Association for cutting hospital waiting times.
03 . Atos Origin en 20093.2 Company 2009 highlights

Atos Origin » Annual Report 2009 » 010
4.1 Group Top Management
The Group Top Management is composed of a Chairman and Chief Executive Officer and two Senior Executive Vice-Presidents.
04 . Governance
Since 10 February 2009, Atos Origin has been incorporated in France as a ”Société Anonyme” (Joint Stock Corporation) with a Board of Directors. Since then, Thierry Breton has been its Chairman and Chief Executive Officer. The change from a Supervisory Board and a Management Board structure to a system with a Board of Directors and Chairman and Chief Executive Officer has simplified and unified the Company’s governance so as to adapt it to its specific situation.
This new governance allows for the necessary proactivity to implement the transformation of the Group (steering of the TOP Program – Total Operational Performance) and to lead all necessary actions to ensure growth and profitability in a difficult economic environment.
name Operational functions Transversal functions
Thierry Breton Chairman and Chief Executive Officer
Charles DehellySenior Executive Vice President in charge of Global Operations
Global Systems Integration & Managed Services, TOP Program, Global Purchasing, Group Business Units
Gilles GrapinetSenior Executive Vice President in charge of Global Functions
Support functions, Global Sales & Markets, Strategic International Customers (SICs), Group Innovation Business Dvpt & Strategy (GIBS), Global Consulting and Hi-Tech Transactional Services
4.1 Group Top Management 0104.2 The Executive Committee 011
4.3 The Board of Directors 0114.4 Persons responsible for the audit
of the financial statements 012
TOP ProgramJacques
Pommeraud
PurchasingEnguerrand de Ponteves
Global Sales & Markets
Hervé Payan
Global Strategic International
Customers (SIC)Francis Delacourt
BOARd OF dIRECTORS
Global ConsultingHervé Payan
Global Systems Int. (including Global
SAP)Francis Meston
Global Managed ServicesÉric Grall
GBU FranceArnaud Ruffat
GBU BeneluxRob Pols
GBU Germany C.E./EMA
Winfried Holz
GBU UKKeith William
GBU IberiaDiego Pavia
GBU South America
Alexandre Gouvéa
GBU Atos Worldline (1)
Didier Dhennin
GBU ROW
Patrick Adiba
FinanceMichel-Alain Proch
GIBS (2)
Marc-Henri Desportes
Human ResourcesJean-Marie Simon
CommunicationMarie-Tatiana Collombert
ITTarek Moustafa
LegalÉric Sandrin
Internal AuditDaniel Milard
Chairmain & CEOThierry Breton
SEVP (4)
Global FunctionsGilles Grapinet
SEVP (4)
Global OperationsCharles Dehelly
(1) Direct report to SEVP Global Functions(2) GIBS: Group Innovation Business Development & Strategy (including M&A)(3) Direct report to SEVP Global Functions for Legal and Audit functions(4) Senior Executive Vice President
General Secretary (3)
Philippe Mareine

Atos Origin » Annual Report 2009 » 011www.atosorigin.com
4.2 The Executive Committee
Since 21 January 2010, the Board of Directors is composed as follows:
The purpose of the Executive Committee is to manage the operational performance of the Group. Its main areas of competence are to assist the Top Management in defining priorities and monitoring operational performance, the enforcement of the TOP Program (Total Operational Performance) and the implementation of action plans. It is an entity dedicated to the operational management of the Group.
The mission of the Executive Committee is to improve interaction and cooperation between the Global Business
Units, the Global Service Lines, Global Sales & Market and Global Functions.
The Executive Committee is composed of members of the Top Management as well as managers from the Global Units, the Global Services Lines, the Chief Financial Officer, the Head of Human Resources, the Head of Global Sales & Markets, the Head of Global Strategic International Customers, the Head of Group Innovation Business Development & Strategy and the Group General Secretary.
4.3 The Board of directors
During the Ordinary and Extraordinary Shareholders Meeting of 10 February 2009, the shareholders approved the new governance structure of the Company and appointed the members of the Board of Directors. Once set up, the Board of Directors appointed Thierry Breton as Chairman
and Chief Executive Officer of the Board of Directors, designated Behdad Alizadeh as Chairman of the Nomination and Remuneration Committee and Jean-Paul Béchat as Chairman of the Audit Committee.
name nationality AgeDate of
appointmentCommittee
memberTerm
of offices (*)
number of shares held
René Abate French 61 2009 2011 1,000
Behdad Alizadeh American 48 2009 N&R 2011 1,000
Nicolas Bazire French 52 2009 N&R 2011 1,000
Jean-Paul Béchat French 67 2009 A 2011 1,000
Thierry Breton French 54 2009 2011 5,000
Ms. Jean Fleming British 40 2009 2011 438
Bertrand Meunier French 53 2009 N&R 2011 1,000
Michel Paris French 52 2009 A 2011 1,000
Pasquale Pistorio Italian 73 2009 A 2011 1,000
Vernon Sankey British 60 2009 A 2011 1,000
Jean-Philippe Thierry French 61 2009 N&R 2011 1,500
Lionel Zinsou - Derlin French and Beninese 55 2010 2011 1,000
A: Audit Committee.N&R: Nomination and Remuneration Committee.(*) Annual General Meeting deciding on the accounts of the year.
04 . Governance4.2 The Executive Committee4.3 The Board of Directors

Atos Origin » Annual Report 2009 » 012
4.4 Persons responsible for the audit of the financial statements
Statutory Auditors Substitute Auditors
Grant ThorntonJean-Pierre Colle and Vincent Frambourt
Cabinet IGEC, 3, rue Léon Jost, 75017 Paris
• Appointed on 12 June 2008 for a term of 6 years.• Term of office expires: at the end of the Annual General
Meeting held to adopt the 2013 financial statements.
• Appointed on 12 June 2008 for a term of 6 years.• Term of office expires: at the end of the Annual General
Meeting held to adopt the 2013 financial statements.
Deloitte & AssociésTristan Guerlain et Christophe Patrier
Cabinet B.E.A.S. 7-9, Villa Houssay 92200 Neuilly-sur-Seine
• Appointed on 23 May 2006 for a term of 6 years.• Term of office expires: at the end of the Annual General
Meeting held to adopt the 2011 financial statements.
• Appointed on 23 May 2006 for a term of 6 years.• Term of office expires: at the end of the Annual General
Meeting held to adopt the 2011 financial statements.
04 . Governance4.4 Persons responsible for the audit of the Financial statements

Atos Origin » Annual Report 2009 » 013www.atosorigin.com
05 . Stock market overview
Atos Origin shares are traded on the Paris Eurolist Market under Euroclear code 5173 ISIN FR0000051732. They were first listed in Paris in 1995. The shares are not listed on any
other stock exchange and Atos Origin SA is the only listed company in the Group.
The free-float of the Group shares is almost 100% today with the first two shareholders named PAI Partners and Pardus
Capital each of them owning respectively 22.6% and 10.0% of the Group share capital on 31 December 2009.
5.1 Trading of shares (Euronext)
5.2 Shareholders breakdown
Number of shares 69,720,462Sector classification Information TechnologyMain index CAC AllSharesOther indices CAC IT, CAC IT20, CAC Next20, Euronext 100, SBF120Market Eurolist segment ATrading place Euronext Paris (France)Tickers ATO (Euronext)Code ISIN FR0000051732Payability PEA/SRD Yes/Yes
The main tickers are:
Source Tickers Source Tickers
Euronext ATO Reuters ATOS.PA
AFP ATO Thomson Finance ATO FR
Bloomberg ATO FP
31 December 2009
Shares % of capital% of voting
rightsnominal value
(in EUR)Book value
(in EUR)
Treasury stock 652,152 0.9 % 652,152 22,778,036
Free float 69,068,310 99.1% 100.0%
TOTAL 69,720,462 100.0% 100.0%
PAI Partners, Pardus Capital, Centaurus Capital, directors and employees of Atos Origin are all classified under free-float (details can be found in the “Common Stock” section of this report - 27).
5.1 Trading of shares (Euronext) 0135.2 Shareholders breakdown 0135.3 Dividends 014
5.4 Contacts 0145.5 Financial calendar 0145.6 Sharetrading performance 015

Atos Origin » Annual Report 2009 » 014
5.3 dividends
5.4 Contacts
5.5 Financial calendar
The objective of the Group is to have a dividend policy which depends on profit increase, excluding extraordinary items. The management’s action is oriented towards the generation of a significant net profit, allowing for the shareholders to draw a profit from their investment. Therefore, given the moderate net profits of 2009, caused
mainly by the winding-up of the Arcandor group (client of the German subsidiary), the Board of Directors of Atos Origin has decided not to submit the payment of a dividend in 2010 on the 2009 fiscal period to the next General Shareholders Meeting.
Institutional investors, financial analysts and individual shareholders may obtain information from Gilles Arditti, Tel: +33 (0) 1 55 91 28 83, [email protected]
Requests for information can also be sent by email to [email protected].
2010 Calendar
14 April 2010 2010 First quarter revenue
27 May 2010 Annual General Meeting (2009 results)
28 July 2010 2010 Half-year results
13 October 2010 2010 Third quarter revenue
16 February 2011 2010 Annual results
During the past three fiscal periods, Atos Origin has paid the following dividends:
Fiscal period Dividend paid per share (in EUR)
2008 0.00
2007 0.40
2006 0.00
5 . Stock market overview5.3 Dividends5.4 Contacts 5.5 Financial calendar

Atos Origin » Annual Report 2009 » 015www.atosorigin.com
5.6 Sharetrading performance
5.6.1 Five-year key figures
2009 2008 2007 2006 2005
High (in EUR) 38.46 40.45 55.29 65.20 62.00
Low (in EUR) 16.51 15.01 32.80 33.50 45.60
Closing (in EUR) 32.09 17.92 35.35 44.90 55.70
Average daily volume processed on Euronext platform (in number of shares) 182,398 395,561 821,106 640,181 438,833
Free-float In % 100% 100% 100% 100% 100%
Market capitalization (in EUR million) 2,237 1,249 2,464 3,095 3,749
Enterprise Value (EV) (in EUR million) 2,376 1,553 2,802 3,524 3,931
EV/revenue 0.46 0.28 0.48 0.64 0.72
EV/OMDA 4.7 3.3 5.5 7.9 7.9
EV/OM 8.2 5.8 10.3 14.3 9.8
P/E (year-end stock price on adjusted EPS) 12.2 6.9 17.4 27.5 14.7
5.6.2 Share performance in comparison with indices (base index 100)
During 2009, most of the exchange markets in Europe and the US reported better performance compared to previous year. Global indices such at CAC 40 or Technology ones as CAC IT, NASDAQ Composite or Dow Jones Stoxx Tech increased in a range of +17% for the Dow Jones up to +44% for the NASDAQ.Atos Origin stock price overperformed strongly the market with an increase of +81% over year 2009. Most of the financial analysts together with investors remained confident
in the capability of Atos Origin to meet its 2009 revenue, operating margin and cash flow objectives provided by the Group early in the year. At the end of 2009, the Atos Origin consensus based on 20 analysts’ estimates was as follows: 50% buy, 44% hold and 6% sell. As far as the target price is concerned, consensus was revised up several times during the period to be at EUR 37.3 at the end of the year compared to EUR 23.3 after the disclosure of 2008 results in February 2009.
5 . Stock market overview5.6 Sharetrading performance
181
144
122117116
100
jan. 09 March 09 May 09 july 09 Sept. 09 Dec. 09
Atos OriginCAC 40DJ Euro Stoxx TechNasdaq COMPXCAC IT 20

Atos Origin » Annual Report 2009 » 016
06 . Formation of the Group
Atos Origin is a leading international IT services company created through series of mergers and acquisitions, starting in 1997.
Atos was formed from the merger in 1997 of two French-based IT services companies – Axime and Sligos – each of which had been established out of earlier mergers. By 2000, Atos employed 11,000 staff and generated annual revenues of approximately EUR 1.1 billion.
Origin was a subsidiary of Royal Philips Electronics, which had been formed in 1996 from the merger of BSO/Origin and Philips Communications. At the time of the merger with Atos in October 2000, Origin employed more than 16,000 staff in 30 countries worldwide and generated annual revenues of approximately EUR 1.6 billion.
KPMG Consulting’s businesses in the United Kingdom and The Netherlands were acquired in August 2002 to establish Atos Consulting. This transaction provided the Group with a major presence in the Consulting segment of the IT services market.
Sema Group was acquired from Schlumberger in January 2004, thereby creating one of the leading European IT services companies. At the time of the acquisition, Sema Group employed 20,000 staff and generated annual revenues of approximately EUR 2.4 billion. Atos Origin employed 26,500 staff, generating annual revenues of more than EUR 3 billion.
19961997
20022000 2004
Revenue evolution since 2004 (in EUR million)
5,4595,249
2004
5,397
2005
5,855
2006
5,623
2007
5,127
20092008
Atos Origin
Atos
Axime Sligos BSO/Origin Philips C&P
Origin KPMG Consulting SEMA Group
Atos Origin » Annual Report 2009 » 017www.atosorigin.com
07 . The IT services market
7.1 Global IT Spending
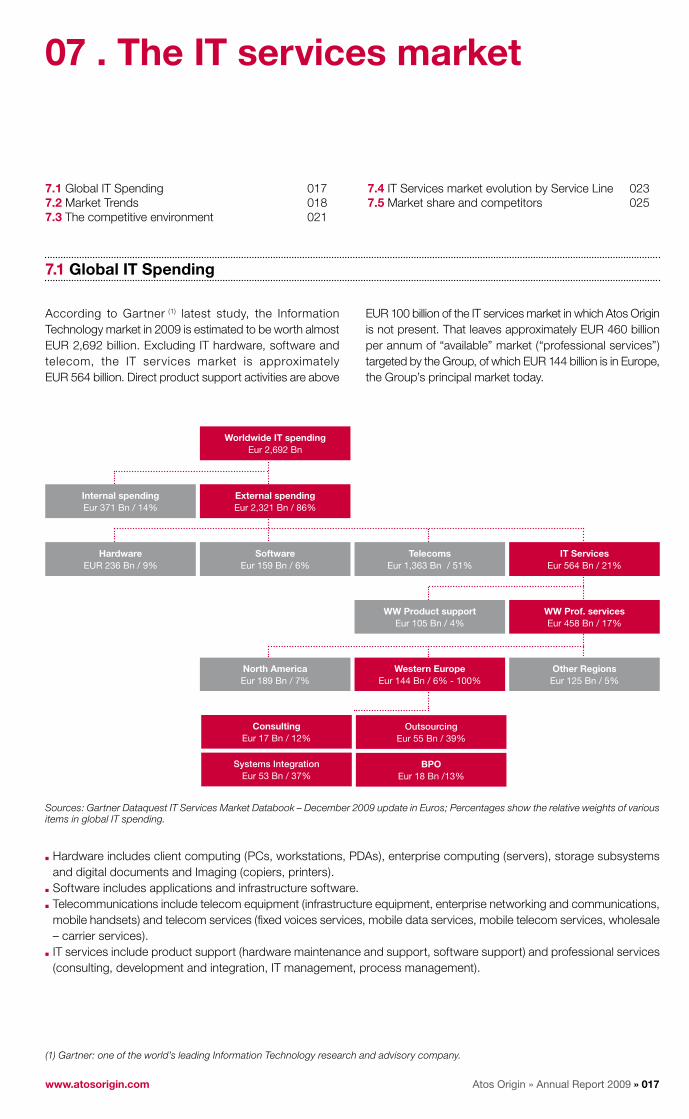
According to Gartner (1) latest study, the Information Technology market in 2009 is estimated to be worth almost EUR 2,692 billion. Excluding IT hardware, software and telecom, the IT services market is approximately EUR 564 billion. Direct product support activities are above
EUR 100 billion of the IT services market in which Atos Origin is not present. That leaves approximately EUR 460 billion per annum of “available” market (“professional services”) targeted by the Group, of which EUR 144 billion is in Europe, the Group’s principal market today.
Hardware includes client computing (PCs, workstations, PDAs), enterprise computing (servers), storage subsystems ■■
and digital documents and Imaging (copiers, printers).Software includes applications and infrastructure software.■■
Telecommunications include telecom equipment (infrastructure equipment, enterprise networking and communications, ■■
mobile handsets) and telecom services (fixed voices services, mobile data services, mobile telecom services, wholesale – carrier services).IT services include product support (hardware maintenance and support, software support) and professional services ■■
(consulting, development and integration, IT management, process management).
(1) Gartner: one of the world’s leading Information Technology research and advisory company.
Worldwide IT spendingEur 2,692 Bn
HardwareEUR 236 Bn / 9%
SoftwareEur 159 Bn / 6%
TelecomsEur 1,363 Bn / 51%
IT ServicesEur 564 Bn / 21%
Internal spendingEur 371 Bn / 14%
External spendingEur 2,321 Bn / 86%
WW Product supportEur 105 Bn / 4%
WW Prof. servicesEur 458 Bn / 17%
North AmericaEur 189 Bn / 7%
Western EuropeEur 144 Bn / 6% - 100%
Other RegionsEur 125 Bn / 5%
ConsultingEur 17 Bn / 12%
OutsourcingEur 55 Bn / 39%
Systems IntegrationEur 53 Bn / 37%
BPOEur 18 Bn /13%
7.1 Global IT Spending 0177.2 Market Trends 0187.3 The competitive environment 021
7.4 IT Services market evolution by Service Line 0237.5 Market share and competitors 025
Sources: Gartner Dataquest IT Services Market Databook – December 2009 update in Euros; Percentages show the relative weights of various items in global IT spending.

Atos Origin » Annual Report 2009 » 018
7.2 Market trends
IT services market is changing quickly and an overall acceleration of the speed of change is taking place. Here under is the summary of the key trends that the Company believes will result in a progressive re-shaping of the market, both on the supply side, with players like Atos Origin, and on the demand side, which concerns the customers or sometimes, customers of customers.
7.2.1 Supply
The growth in multi-sourcing and offshore
Large players have increased their low cost delivery capabilities and large Indian players have made some entries on Continental Europe. The Group is seeing both Western and Indian service providers ultimately heading towards the same delivery model – a network of on-site, onshore, nearshore and offshore – with delivery centers, or delivery partners, in alternative locations around the world. Some analysts are now predicting that labour-intensive service delivery, where increased demand results in increased workforce, will not be sustainable — even though it will continue while labour costs are low. The future success of global delivery networks will depend less on the availability of low-cost resources and more on the quality of skills, tools, methodologies and alliances.
The growth numbers for the ‘Indian-heritage’ IT service providers, such as Wipro, TCS, Infosys or HCL, that was over 25% per annum in last 3 years has slowed but they are still extremely active. After 2009 challenges, namely for those having a strong customer base in the US, manufacturing or banking, the Company anticipates a further slowdown, but still expect them to be leading the growth numbers in 2010. While the market share of the leading “India-heritage” providers is still relatively small in Europe, they are actively pursuing large deals.
Increasing drive for cost effectiveness (industrialisation and Lean techniques)
Most of the IT services companies have launched strong programs aiming at decreasing their cost of operations, on one hand by simplifying their operation and reducing indirect non productive workforce, on the other hand moving to get more with less, i.e. using latest technologies and tooling to become more efficient (automation in infrastructure management, software based solutions to develop code and collect demand from customer with streamlined processes). Lean techniques, developed f irst in manufacturing industries, or 6 Sigma, are now promoted throughout the IT services market, mostly in the managed operation sphere.
Cloud services (Cloud computing and SaaS)
IT services are either the sources or the enablers of the growing number of innovations happening on the markets. Section 16 covers the most innovative events noticed in 2009, from the increasing importance given from what is used in the private life, communities, social networks, and blogs, up to what is widely used in enterprise. The Group believes that the rapid growth of Cloud Computing is the one of the most relevant aspect of change for the IT industry in 2010.
The arrival of Google and Amazon from the mass market to the enterprise illustrates this disruptive change. This evolution is part of the overall “Cloud computing” phenomenon that is now shaping up. Over the first semester, numerous North American providers have announced their plan of developing Cloud services. After developing on the American market, players aim at reaching Europe, where they start to prepare marketing actions.
Gartner describes Cloud Service characteristics as “a style of computing where scalable and elastic IT-related capabilities are provided ‘as a Service’ to external customers using Internet Technologies”.
07 . The IT services market7.2 Market trends

Atos Origin » Annual Report 2009 » 019www.atosorigin.com
For Atos Origin, a Cloud Service is any service delivered to its clients over the Internet on a pay-per-use basis.
Cloud Services is a continuum of existing services, and can be further classified in four functional layers, in which layer 1 describes pure business functions, and layer 4 describes IT infrastructure services:1. Business Process as a Service – service examples
include helpdesk, CRM, and card management;2. Software as a Service – service examples include SAP applications, SalesForce.com and Microsoft BPOS;3. Platform as a Service – service examples include middleware including database and transaction processing platforms, on-demand development environments and Google applications;4. Infrastructure as a Service – service examples include Amazon infrastructure, and typically provide processing, storage and networking on-demand and the Operating System.
Although still maturing, these services are being delivered today, and analysts are predicting that 25% of IT services will be coming from such non-traditional models by 2012.
Business uncertainty has increased demand for utility or on-demand services, and the Company believes that the flexibility of the Cloud Computing solutions are well-suited solutions for its clients’ needs.
Players in the Cloud include the traditional competitors of the Group such as systems integrators and IT services companies. These cover a broad spectrum of companies and include both national and international players, and those who deliver completely offshored service (Cap Gemini, ICL, Fujitsu/Siemens, IBM, HP/EDS, Getronics, TCS, Wipro, etc).
The impact on the competitive landscape of Atos Origin will not be limited to traditional competitors such as systems integrators and IT service companies. As all the value chain has new opportunities to interact with the client, the Group expects further changes:
Software companies: ■■ Large Software vendors have clearly indicated they would offer their software based on these principles, what encourage IT services players to adopt this move. As the consumerisation of IT services has not yet had an impact on the IT services market Atos Origin competes in, this evolution could happen in a near future; ■■ Pure Cloud/Internet players: The “Consumerisation Of Services” trend is the production of low cost, pay per hour, elementary IT services from companies such as Amazon and Google, that has entered in a second phase, targeting mid-markets by Cloud based offerings and SaaS: Amazon, Google, etc – these players offer massive savings
through Cloud Services for any organization that can live with a one-size-fits-all approach. This will be refined rapidly over the next few years; ■■ Telcos: They do not have all the IT, application or the business skills – but they do want to move up the value chain and they do have large customer bases. Dark fiber, and cheap, virtually unlimited bandwidth are also a competitive strength.
With Cloud Services, however, these four tribes are not running a traditional race. Each has skills and resources which the others need in order to deliver the value which the market demands. It is not a straight competition – collaboration and co-operation (covert or declared) will be essential to deliver Cloud Services of value.
Atos Origin believes that the quality of the business relationship with the client, and the correct understanding of its needs will still continue to be the key factors for value creation. Cloud Computing, in its different and complex forms, will be another way to deliver IT services that will need integration with legacy systems and management of the resulting quality of services, security or interoperability, thus creating new business opportunities for IT services companies.
7.2.2 demand
Decrease cost of IT through Smarter Outsourcing
Globalisation, multi-sourcing and industrialisation are well established market trends. Together they have had the biggest overall influence on the re-shaping of the IT services market over recent years.
Whilst Total Contract Value (TCV) has been reducing, customers have also been demanding more sophisticated value propositions, for example, increased flexibility through pay for use pricing and key performance indicators based on business outcomes. This has been coupled with more deals being scoped to cover the IT support of end to end processes, Consulting, Systems Integration and Managed Services capabilities.
Growth of demand for BPO
The initial strong growth of BPO has been fuelled with enterprises outsourcing basic processes, HR, accounting, first in US and UK, but progressively in Continental Europe, asking for labour arbitrage for the clerk work to be added to the traditional value proposition of IT outsourcing.
07 . The IT services market7.2 Market trends
Atos Origin » Annual Report 2009 » 020
The Group sees now two other waves increasing the demand for BPO:
Enterprises widening the scope of the non core processes ■■
up to procurement, finance, CRM, and then to business industry specific processes, such as claim management in the insurance, billing in telecom, etc.Public organizations, facing ageing civil servants, looking ■■
as well to externalize the classic non core processes. The Group believes this emerging trend to grow in the coming years.
Content Management and CollaborationOne of the most visible trends in the IT industry in recent times has been the explosive growth of digital information. Most of the customers are reporting a doubling of their enterprise data every 18 months to 2 years. In the coming years, Atos Origin expects this growth trend will continue and even accelerate requiring additional effort and services to be utilized to both secure as well as store this data.
Information volume is expected to grow tenfold over the next five years, but our ability to read and assimilate it will not. Users clearly need a way to extract relevant information quickly and easily out of this increasing amount of data – much of which is non-essential.
It is commonly accepted that by 2013, more than 25% of the content that information workers see in a day will consist of pictures, video, audio or hybrids of the three plus text. Growing demands for incorporating rich information assets such as digital images and video into enterprise or institutional applications will push strategy, technology and infrastructure requirements forward for cost-effective management.
However, additionally, and more importantly, a parallel trend is developing to manage and leverage this growing volume of information:
to increase worker productivity through greater ■■
collaboration;to respond more effectively to compliancy mandates ■■
through intelligent archiving and legal discovery technologies;to improve enterprise agility through streamlining business ■■
processes and to enhance significantly corporate decision making by ■■
deploying an enterprise wide information strategy.
This will require a more intense scrutiny of existing enterprise information and content management systems and will necessitate new approaches being deployed from the strategic to the architectural level in order to combine both companies structured and unstructured information into one holistic entity. Atos Origin which has had a long and successful history deploying Enterprise Content Management for its customers wants to be in the forefront of this new trend in order to help its customers gain the competitive advantages that effectively managing and leveraging their information can deliver.
Furthermore, Atos Origin is supporting (along with all the application vendors of ECM) the industry’s proposal to adopt the CMIS (Content Management Interoperability Services) standard which will facilitate the sharing of information among disparate content repositories.
The drive for sustainability expanding beyond Green IT
While media hype already led to real action in 2008, Atos Origin saw an even stronger marked upturn in 2009 in interest in “The Drive for Sustainability”. Drivers in the private sector have been mostly cost reduction and pending regulation (Green IT), stakeholder pressure, and brand development. Governance Risk and Compliance (GRC) offerings are becoming popular. They expand to the public sector too, both to comply with the overall agenda of serving in a better environment, less energy consumption, etc., but also due to higher expectations expressed by citizens. Tough economic conditions have accelerated this trend in 2009 as enterprises look for further cost reduction opportunities. A dedicated section in the annual report, section 18, adresses how this trend is handled at Atos Origin.
07 . The IT services market7.2 Market trends
Atos Origin » Annual Report 2009 » 021www.atosorigin.com
7.3 The competitive environment
7.3.1 Classical IT
Consolidation and Globalisation
In 2009, the movement of consolidation with several large transactions was reinforced mainly in the US. HP’s acquisition of EDS in 2008, followed in 2009 by Dell of Perot Systems, Xerox of ACS, then HP of 3Com, and the acquisition of Sun by Oracle have been the major last consolidations happening recently. Ovum has estimated that over USD100 billion have been spent on acquisitions in the past few years by Oracle, IBM, Microsoft, HP and SAP combined.
Oracle acquired Sun Microsystems, at a price that valued ■■
Sun at USD 5.6 billion, after Oracle’s transactions in software such Hyperion BEA, PeopleSoft and Siebel;Dell acquired Perot Systems in 2009 for USD 3.9 billion ■■
in cash;Xerox paid USD 6.4 billion for Affiliated Computer Services ■■
(ACS) and will rank as one of the 20 largest global IT services providers;HP has bought 3Com for USD 2.7 billion.■■
Xerox and Dell now join other hardware vendors such as IBM, HP, Fujitsu and Unisys in the list of the top 20 biggest global IT services providers. This further underlines the increased investment in services by major hardware manufacturers. As a result of this consolidation, the market is now radically different today than it was in 2000, with large players benefiting of a full portfolio and for some of them, across the globe.
Atos Origin believes that this consolidation also creates opportunities for the Group as some clients do not want to concentrate beyond a certain threshold their IT spending and wish to benefit from Consulting or Systems Integration services that are independent from the hardware or software providers.
European Market
IBM is still leading the market with close to 7.8% of market share (IBM Global Services). Based on 2008 revenue, HPS (HP-EDS) is now the third largest IT services company in Europe with 4.6% of market share just behind Accenture with 4.7% but before Cap Gemini. This puts Atos Origin in fifth place with 3.5% market share. Atos Origin expects more consolidation to continue in 2010, not only in the IT services market, but also in the overall IT landscape such as Sun’s acquisition by Oracle.
After the tough conditions of 2009, the European IT services market will continue to be intensely competitive in 2010, with US and European IT services providers restructuring and re-focusing to maintain competitiveness. There will be an increased focus on specialisation and vertical industry capability. If significant business uncertainty continues then enterprises will increasingly seek to reduce risk by turning to service providers they trust. In this environment, service providers that actively manage quality of service will develop a competitive advantage over those that do not.
As mentioned earlier, new players as such Google are now entering the traditional infrastructure service markets with very packaged offers, providing mail, storage, targeting first mid size markets before moving up in the value chain. Salesforce.com continues to meet a fantastic success with more than 30% of market share in the Cloud CRM offering sphere.
07 . The IT services market7.3 The competitive environment
Atos Origin » Annual Report 2009 » 022
Alliances will continue to be an increasing feature of winning new and innovative business – with IT service providers teaming up with industry specialists, technical specialists, or their direct competitors.
Highly competitive, specialist offerings (innovative/good customer fit/good price) will be increasingly important to increase market shares, and maintain growth over the next couple of years.
7.3.2 Payments
SEPA implementation
Nowadays, there’s no denying it is much more complex to process a payment between two states of the Euro zone rather than within the same country. This situation has resulted from the partitioning of national banking activities, and more specifically regarding legal and technical aspects. In order to fix this unsatisfying situation, the European Commission has launched the set up of a new legal framework called the SEPA: Single European Payments Area.
This project aims at creating a European standard for payments, so that anywhere within the zone, Direct Debits, Card or transfer payments can be treated with the same pace, same safety and same billing conditions than for a domestic transaction, by offering European citizens common deposit payment means.
The Banking industry has defined the Core SEPA schemes for transfer payments and Direct Debit. The one regarding Transfers has been successfully launched in January 2008. As from November 2009, banks have gradually implemented SEPA Direct Debit services. For Card transactions, the SEPA framework has been agreed and is in the process of being implemented by banks, card schemes and card processors.
new trends on the Payment Market
Electronic payments enjoy a fantastic growth, facilitated ■■
by a higher penetration of home computing;New channels are quickly adopted, smartphones, PC, ■■
new payments devices;Cross border transactions were limited in the past both ■■
in term of numbers and value; as travel and tourism further develop, international transactions across countries are growing very quickly;Last but not least, comparable to the mobile phone ■■
prepaid success, prepaid payments are becoming very popular (giftcard...).
The dynamics of the payment market are basically around the polarisation of the industry on selected elements of the value chain, and through the intensification of the fierce already competition that was existing only in the past on few markets.
The overall landscape is evolving too: HSBC launched an initiative in 2008 to provide worldwide payment services to UK vendors and Internet merchants; Ingenico announced the acquisition of Easycash in the fourth quarter of 2009, and in November a possible cooperation of Equens with CEDICAM (Crédit Agricole) was revealed.
07 . The IT services market7.3 The competitive environment

Atos Origin » Annual Report 2009 » 023www.atosorigin.com
7.4 IT Services market evolution by Service Line
Gartner has revised its growth forecast for IT Services in Western Europe. Gartner is currently projecting decrease in 2009 of -3.6% in IT services spending in Western Europe while the growth to come in IT Services is expected at +2.9%.
(in EUR million) 2008 2009 2010
IT spending growth %
2009/2008 2010/2009
Consulting 18,769 17,329 17,614 -7.7% +1.6%
Development and integration 56,057 52,892 54,120 -5.6% +2.3%
IT management 55,462 55,428 57,534 -0.1% +3.8%
Process management 18,954 18,174 18,771 -4.1% +3.3%
PROFESSIOnAL SERvICES In WESTERn EUROPE 149,241 143,823 148,038 -3.6% +2.9%
Source: Gartner: IT Services Worldwide Forecast 2000-2013 in USD – December 2009 (estimated figures for 2009) for Professional services only. Exchange rates used: 1 USD=0.72182 in 2009 and 1 USD = 0.68612 in 2010.
Professional services include consulting, development and integration services, IT management (Managed Services for Atos Origin) and process management (On-line Services and BPO for Atos Origin), but exclude product support (hardware and software maintenance and support).
7.4.1 ConsultingCompanies are continuously transforming their business models, processes, organization and IT to address new markets and create competitive advantage. Increasingly, Technologies are a key component of these transformations whether enabling or driving them.
Companies do not move at the same speed for a variety of reasons. Issue for companies is to identify and adopt relevant technologies faster than the competition and, more importantly, to quickly change their business models, processes and the behaviours of their employees, customers and partners, to reap the full benefits of the new technologies. Challenge for Late Majority technology adopters is to implement new technologies faster while early majority technology adopters’ challenge is to change behaviours, business models and processes deeper and faster.
The Consulting market faced tough conditions in 2009. It started already in H2 2008 as large enterprises started to slowdown their discretionary spending to face the crisis; the banking sector, traditionally the largest, was the most difficult market in 2009.
This strong diminution of the demand resulted in a severe decline of the market in Europe but at a pace depending geographies and markets:
North Europe and Spain being the most seriously ■■
impacted;Public bodies and enterprises have focused this year ■■
most of their IT spending in consolidation and projects, enabling them to cross the downturn at best, helping them either to decrease cost of operations by aligning their organization to react quicker, or undertaking some regulatory or compliance works that were mandatory. Consulting in procurement therefore has been a protected area, as purchase departments had to cut their spendings.
Clients’ expectations regarding Consulting Services are changing; the market is driven to a new Consulting business model, in which customers will increasingly:
Make lower difference between business and technology ■■
Consulting, as changes in business models and processes are increasingly driven by technology adoption;Expect a commitment on measurable criteria, through end-■■
to-end transformation services, rather than independent advisory services;Contract on the basis of institutional capabilities rather than ■■
personal relationship;Buy global offerings built on the back of tangible assets ■■
like tools and methodologies, rather than local expertise;Expect providers to be paid as a percentage of delivered ■■
benefits.
07 . The IT services market7.4 IT Services market evolution by service line

Atos Origin » Annual Report 2009 » 024
Atos Origin’s expect Consulting to benefit from two major shifts in 2010:
Business consultancy becoming process oriented;■■
Slowdown of strong pressure coming from the market ■■
in 2010 vs. 2009.
Atos Consulting aims at creating competitive advantage by anticipating Clients’ expectations vis-à-vis Consulting Services, mostly by better leveraging Atos Origin assets and better aligning with Atos Origin other Service Lines. In this respect, three major initiatives were launched in 2009 and will continue over 2010:
Align portfolio of clients (Atos Origin top accounts), in ■■
order to increase value to customers by delivering end-to-end Transformation services, reinforce the intimacy with clients, beyond the CIO to business leaders, and increase the pro-activity and share of wallet with the top accounts through improved consultative-selling.Align portfolio of offerings: 1) move from local capabilities ■■
to structured offerings that can be sold consistently on a global basis: this is a major driver of growth as well as a driver of profitability improvement, 2) to align the Consulting offering portfolio with the global offering portfolio of Atos Origin in order to ensure a full continuum of services. As a result, for all major Systems Integration, Infrastructures services, BPO or HTTS offering, a Consulting solution is being defined. For example, on Cloud computing, Atos Consulting is delivering Cloud opportunity assessment, and on sustainability, proposes Green IT consulting, Intelligent sustainability, Enterprise sustainability assessment (current carbon footprint and CO2 reduction action plan).Align capabilities, to ensure Atos Consulting be the ■■
practice that sets Atos Origin apart when it comes to deliver IT-enabled process innovation and Transformation projects: this building first-class process innovation and Transformation capabilities based on proven tools and methodologies.
7.4.2 Systems IntegrationThe Systems Integration market faced adverse market conditions during the course of 2009. A lot of enterprises across many industries had to cope with significant and sudden revenues decrease. While they did aggressively cut their expenses, their IT budget was significantly revised down and particularly discrete expenses such professional services. Thus numerous IT projects were postponed or cancelled and sometimes even stopped.
Strong pressure on tariffs has been met by Systems Integration players, some contracts having to be renegotiated to meet customer demand for lower TCO .
According to analysts, the Systems Integration market declined in the range of 5% in 2009 with even larger decrease in several core Atos Origin markets such as the Netherlands and Iberia.
Nevertheless, Atos Origin remains convinced that the Systems Integration market will continue to enjoy steady and significant mid and long term growth in the future. Growth will be driven both by an increase in technology usage and the addressable market.
Technology usage and thus requirement for Systems Integration services will be boosted by spread of communities and Web 2.0, context aware computing, mobility, machine to machine, security and identity management. Addressable market size will be boosted by many factors including increase penetration of outsourcing in continental Europe, enhance reliance of public sector, health care domain as well as utilities on IT service providers, and a boost of demand in BRIC countries (Brazil, Russia, India, China). The development of cloud computing will in addition even boost further the addressable market as it will open the SMBs (Small and Medium Business) market to Systems Integrators.
7.4.3 Managed ServicesMarket growth in Europe for IT management services has been estimated at exceeding 3% in 2009 by the research and advisory company Gartner.
Outsourcing tends to grow when the economy is weak. However, outsourcing growth stalls in times of uncertainty. Overall, 2009 and next year 2010 are expected to be good years for IT Outsourcing and BPO in Europe, although decision cycles are likely to be on-hold for some, and many buyers will be looking for faster ROI and increased flexibility. Re-negotiation of existing contracts, to cut costs and increase flexibility, may provide opportunities for consolidating scope and increasing the length of contracts.
07 . The IT services market7.4 IT Services market evolution by service line
(1) TCO: Total Cost of Ownership.

Atos Origin » Annual Report 2009 » 025www.atosorigin.com
These expectations the Group highlighted in the last 2008 Annual Report proved to be true in 2009, with limited number of new large deals, numerous renegotiations and extensions of scope. Notable trends during 2009 included:
More growth coming from “add on” business with existing ■■
customers – protecting the existing customer base will still be critical in 2010;A significant growth of migration to virtual environments, ■■
as a way to offer flexibility & reduce costs;An increase in offshore IT outsourcing;■■
Environmental exigency development, with energy ■■
effectiveness or similar references in most bids;The growth of the interest in sourcing management and ■■
governance continued.
The Group expects these trends to continue in 2010. Overall, cost reduction and skill shortages remain major drivers for outsourcing. However, there is also a demand for service providers to have industry knowledge, to have flexibility and to bring innovation.
In a difficult economical environment, request for “one stop shop” services to transform and operate all or part of an Information System is expected to continue its observed growth.
As clients ask for innovation, industry domain expertise will be paramount to selecting the right outsourcing partner. Some analysts believe the outsourcing market will soon fragment into players focused on domain expertise.
7.5 Market share and competitors
7.5.1 Ranking in Western EuropeAccording to Gartner, Atos Origin was, as in 2008, the fifth largest IT services company in Western Europe in 2008 with a market share of 3.5%.
Source: Company Information – IT Services Worldwide Market Share Gartner: August 2009 in USD with 1 USD = 0.6834 EUR
In EUR million, Professional Services include Consulting Services (Consulting for Atos Origin), Development and Integration Services (Systems Integration for Atos Origin), IT Management (Managed Services for Atos Origin) and Process Management (On-line Services and BPO for Atos Origin), but excluding Product Support (Hardware and Software Maintenance and Support).
07 . The IT services market7.4 IT Services market evolution by service line7.5 Market share and competitors
IT services market share rankings in Western Europe – Revenue in EUR million and market shares in % in 2008
11,6067.8%
6,9754.7%
6,8584.6%
6,8454.6%
4,5413.0%
4,4173.0% 3,831
2.6%3,7472.5% 3,262
2.2%3,0502.0%
5,2223.5%
1 8781,3%
IBM Accenture HP-EDS CapGemini Atos Origin T-Systems British Telecom Siemens Logica CSC Capita Group
12,000
10,000
8,000
6,000
4,000`
2,000
0
(in EUR million)

Atos Origin » Annual Report 2009 » 026
7.5.2 Main competitors in Western Europe
Country Main Competitors
United Kingdom British Telecom, HP EDS, Capita, IBM, Fujitsu, Accenture, Cap Gemini, Logica
Central Europe T-Systems, Siemens IT, IBM, HP EDS, Accenture
France Cap Gemini, IBM, Logica, Accenture, Sopra, Steria
Benelux Cap Gemini, Getronics KPN, IBM, Logica, Ordina
Spain Indra, IBM, Accenture, Telefonica, Fujitsu
Source Gartner: IT Services Worldwide Market Share Gartner August 2009.
7.5.3 Market size and market share in Western Europe According to Gartner, based on latest estimated figures for external IT spending, Professional Services market shares in each main country and service line were as follows:
(in EUR million)
Market size Weight Atos Origin Market share
2008 2009 2009 2008* 2009 2008* 2009
United Kingdom 48,615 43,883 31% 977 902 2.0% 2.1%
Central Europe 31,145 31,036 22% 642 580 2.1% 1.9%
France 19,740 19,631 14% 1,675 1,576 8.5% 8.0%
Benelux 14,805 14,607 10% 1,487 1,303 10.0% 8.9%
Italy 9,112 9,019 6% 54 0.6%
Iberia 10,386 10,321 7% 362 334 3.5% 3.2%
Nordic 14,660 14,558 10%
Rest of Western Europe 778 768 1% 25 19 3.2% 2.5%
WESTERn EUROPE 149,241 143,823 100% 5,222 4,714 3.5% 3.3%
Consulting 18,769 17,329 12% 339 246 1.8% 1.4%
Systems Integration 56,057 52,892 37% 2,014 1,667 3.6% 3.2%
Managed Operations 74,416 73,602 51% 2,869 2,801 3.9% 3.8%
WESTERn EUROPE 149,241 143,823 100% 5,222 4,714 3.5% 3.3%
Source: Gartner: IT Services Worldwide Forecast 2000-2013 in USD – December 2009 (estimated figures for 2009) for Professional services only. 1 USD = 0.72182 in 2009.
(*) In 2008, revenue figure for Atos Origin included Atos Euronext Market Solutions activity, which generated a revenue of EUR 125 million in 2008, and was sold in August 2008.
United Kingdom includes Ireland, Central Europe is composed of Germany, Switzerland and Austria, Benelux includes The Netherlands and Belgium, Italy includes Greece, Spain includes Portugal, Nordic is composed of Sweden, Norway, Finland and Denmark.
07 . The IT services market7.5 Market share and competitors
Atos Origin » Annual Report 2009 » 027www.atosorigin.com
08 . Strategy, organisation and 2010 objectives
8.1 Mission and vision
In a very competitive landscape subject to a strong price pressure, the Group has designed a strategy based on two main streams of actions, aiming at:
Restoring margin and improving the Classical IT business; ■■
Resuming growth and developing differentiation based ■■
on its strengths and strong assets with a first priority to reinforcing Group’s leadership in payments and e-services in Europe.
This vision is supported by a reinforced attention given to the Sales strategy on one hand, via two initiatives GAMA (Global Atos Origin Market Alignment) and Strategic International Customers (SICs), and on the other hand the Group pursues its effort in its ambitious CSR - Corporate Social Responsibility - program.
8.1.1 Restoring margin and improving Group’s Classical IT businessAtos Origin was in the last years behind best competitors in term of margin and the classical IT services provided to customers were mostly done on a domestic basis, disabling its ability to leverage its expertise and scale throughout its overall presence.
Strong actions to improve efficiency, robustness of delivery, leveraging state of art techniques and best in class methods have been undertaken by empowering Global Delivery lines, Global Managed Operations, and Global Systems Integration, to catch back and progressively take the lead on these domains. This is supported by an intensive use of Lean management methods and a strong development of its offshore capabilities to serve its customers at a lower cost of delivery, meeting their demand for lower prices.
In the same time, strong actions to streamline the Group have been launched under the Group Transformation Program, named TOP, Total Operational Performance, to ensure the company optimizes Group indirect functions to support the business, and to increase overall productivity, by implementing Lean techniques, or increasing its Internal IT efficiency.
Professional services, a significant activity of the Group, will benefit of an appropriate go to market to increase reactivity and utilisation of the workforce.
8.1.2 Resuming growth and creating differentiationAtos Origin strategy for growth is clearly focussed on its strengths with the objective to confirm and expand a leadership first in areas of critical business services, in new high growth domains where its specific knowledge makes a difference, and more widely, where Atos Origin has created a historical leadership based on distinctive know-how.
Payments and Hi-Tech Transactional Services (HTTS)
The focus put on payments and e-services in HTTS is at the core of the ambition in the critical business services. The initiative Hi-Tech Transactional Services targets to bring to all geographies where Atos Origin is operating the activities of Atos Worldline, covering the domains of Electronic Payments, e-Community Services, and Financial markets, and beyond these assets, the specifically successful business model which underlies the profitable growth story of Atos Worldline.
The HTTS program has been launched during the Investor days held in Brussels in June 2009. Dedicated teams have been appointed in all priority geographies and the program is now developing full speed.
Other growth and differentiation areas
Differentiation is also strong in numerous activities that include nuclear power plant solutions, major events such as the Olympic Games, smart metering and New Generation Intelligent Networks. The Program named Distinctive Offering is especially designed to ensure profitable growth in these areas: the Group selected a dozen of them and implemented related animations across the Group sales and delivery.
8.1 Mission and vision 0278.2 The Customer at the core of Atos Origin’s
strategy: GAMA, SIC and SGS 028
8.3 CSR – Corporate Social Responsibility 0288.4 Organisation 0298.5 2010 Objectives 032

Atos Origin » Annual Report 2009 » 028
Looking forward, Atos Origin sees a high growth potential in Cloud Computing and Enterprise Content Management (ECM) combined with Collaboration solutions. The Group has developed in the past a position of pioneer and strong know-how that the company wishes to develop further in 2010. In conclusion, its Distinctive Offerings policy will be continued and enlarged to include new solutions such as Cloud Services and Green IT.
8.1.3 Innovation supported by the Group‘s “Scientific Community”Publicly launched by Thierry Breton, the establishment of a Scientific Community highlights the importance of innovation in the dynamic IT services market and the need for a proactive approach to identify and anticipate main changing technologies. The Scientific Community is currently a network of 50 members, representing a mix of all skills and backgrounds, and coming from all geographies where Atos Origin operates.
8.2 The Customer at the core of Atos Origin’s strategy: GAMA, SIC and SGS
8.3 CSR – Corporate Social Responsibility
8.2.1 GAMA (Global Atos Origin Market Alignment)GAMA is a program that will bring Atos Origin in a leading position in respect to Go to Market. The overall sales organization is now consistent across the world, in term of targeted industries and sales skills. With GAMA, in 2010, Atos Origin will organise the GBUs so as to measure the profitability by market.
The Group has selected its five major groups of markets where it will operate: Public & Health, Energy & Utilities, Financial Services, Telecom & Media, Manufacturing/Retail & Transportation.
8.2.2 Strategic International Customers (SIC)In September 2009 a new unit called “Strategic International Customers (SIC) and Strategic Global Sales (SGS)“ was established, to manage the multi-country Clients of the Group and to lead or support all major cross-country deals.
The Strategic International Customer require specific governance and an effective global engagement process. This unit is led by a dedicated SIC Manager and a Client team. SIC has the full empowerment across the GBU’s to optimize the global and local support, realizing maximum client satisfaction and optimal growth. SIC has the objective to explore, align and implement continuously innovation, standardization and industrialization of Group’s services and its Global Factory.
8.2.3 Strategic Global SalesThe Group Strategic Global Sales (SGS) has been established to better address integrated international large deals. Global companies require IT services which have to support in an optimal way their global and local business needs. Integrating and optimizing cross service line offerings (Consulting, Systems Integration, Managed Services and HTTS), enable the provision of best-in-class offerings that meet their global requirements. Strategic Global Sales gathers Sales, Bid management, Strategic Solution Consulting, Costing & Finance to lead or support the largest international deals, amongst many for its Strategic International Customers.
Atos Origin has a long history of social and environmental engagement and in the current market conditions it is even more important to continue the efforts and to strengthen and implement globally the Group vision and strategy for sustainability. CSR is a major program for Atos Origin. The Group has deployed a responsible in-house sustainable policy that is designed to:
Accompanying the clients of the Group on their journey ■■
towards environmental excellence and helping them optimize their environmental efficiency through its sustainable solutions and the use of innovative and green technologies;
Improving its environmental performance, through ■■
ISO 14 000 certification process of the Group data centers and companies sites by 2011 and the reduction of the Green house gas emissions and energy consumption by at least 5% by 2011; Promoting responsible purchasing, Investing in and ■■
developing People of Atos Origin, and Committing to good Corporate Social Responsibility.
For the first time in 2010, Atos Origin will be reporting its actions in terms of Social Responsibility in a specific report, the Corporate Responsibility Report, according to GRI (1) international standards.
08 . Strategy, organisation and 2010 objectives8.1 Mission and vision 8.2 The Customer at the core of Atos Origin’s strategy: GAMA , SIC and SICs
8.3 CSR – Corporate Social Responsibility
(1) GRI: Global Reporting Initiative.
Atos Origin » Annual Report 2009 » 029www.atosorigin.com
8.4 Organisation
8.4.1 PrinciplesOver the last decade Atos Origin has grown into a multinational IT services company with strong local operations worldwide. To keep apace with the trends in the IT industry and with the changes made by global clients of the Group, a new working model has been implemented to empower the company to better succeed in the global market.
This new approach will strengthen the role of the Global Business Units (GBUs) of the Group, moving Atos Origin to a global organization. “The change will enable Atos Origin to work in the so-called ‘glocal’ way, meaning that the company wants the best of both worlds: drawing on the benefits of a real global entity when it is needed while keeping the local market strengths that few, if any, of its competitors can match.”
This was not a move towards becoming a centralized organization: the changes aim at bringing speed and more efficiency to critical issues by giving more power to units, for example, on the global factory, offshore policy or management of the global customers of the Group.
Speaking the global language of the clients is vital, employees are set to benefit from a more effective global resource management that will be ensured through the new ‘glocal’ structure and standardized processes and
tooling. Overall, this is likely to lead to more possibilities for employees to become involved in winning and working on interesting, cross-border projects. This new approach is necessary for Atos Origin and its employees as well as being considered as a best-in-class company by its clients. “The IT sector is more and more global, and so are the clients: The new organization allows the Company to develop the business opportunities with the clients because it will think and act the global way they do today.”
8.4.2 GovernanceFollowing the Extraordinary and Ordinary Shareholders Meeting held on 10 February 2009, a new mode of governance with a Board of Directors chaired by Thierry Breton, Chairman and CEO, has been implemented.
As part as the top Management, two Senior Executive Vice-Presidents report to the Chairman and CEO of the Group:
Charles Dehelly, in charge of the Global Operations; ■■
Gilles Grapinet, in charge of the Global Functions.■■
Charles Dehelly and Gilles Grapinet joined the Company respectively in December 2008 and in January 2009.
8.4.3 Atos Origin organisational model(Please refer to the chart presented here under)
08 . Strategy, organisation and 2010 objectives8.4 Organisation
GBU Benelux
GBUGermany
Central Europe/ EMA
GBU UK
GBU Iberia/ South
America
GBU Atos Worldline
GBU Rest
of the World
GBU France
Global Sales and Markets
Strategic International Customers (SIC)
Global Functions (Innovation, H.R., Finance, Legal, IT, Purchasing, Communication)
CEO
Hi-Tech Transactional Services (HTTS)
Global Delivery Lines (Consulting, Systems Integration, SAP, Managed Services)
Atos Origin » Annual Report 2009 » 030
8.4.4 Top ManagementThe General Management of the Company is composed of:- Thierry Breton, Chairman and CEO of Atos Origin;- Charles Dehelly, Senior Executive Vice President in charge
of the Global Operations;- Gilles Grapinet, Senior Executive Vice President in charge
of the Global Functions.
Thierry Breton■■ : 54 years-old; was elected Chairman and CEO of Atos Origin and a member of the Board of Directors in February 2009. He was previously Executive Managing Director and then Vice Chairman of the Bull Group from 1993 to 1996. He later became Chairman and CEO of Thomson from 1997 to 2002 and of France Telecom from 2002 to 2005. From February 2005 to May 2007, Thierry Breton was the French Minister of Economy, Finance and Industry. A graduate of the Ecole Supérieure d’Electricité of Paris, “Supelec”, and of the Institut des Hautes Etudes de Défense Nationale, he has been honoured with the prestigious awards of “Officier de la Légion d’Honneur” and “Commandeur de l’Ordre National du Mérite”.
■■ Charles Dehelly: 58 years-old; his career began at Thomson, where he held various department management functions, before joining the Bull Group in 1992 as Executive Managing Director. He was then promoted to President of Bull SA, then CEO of Zenith Data System and finally President of Bull Europe. He returned to Thomson in 1998 and was appointed Chief Executive Officer in 2002. In 2005, he was appointed Chairman and Chief Executive Officer of the Equant Group, a role that he held until Equant merged with France Telecom. In 2006, he became Chairman of the Arjowiggins Group. He has a degree in engineering from the École Nationale Supérieure des Arts et Métiers.
■■ Gilles Grapinet: 46 years-old; a graduate of the prestigious Ecole Nationale d’Administration, he joined the French Inspection Générale des Finances in 1992 before moving to the French tax department in 1996 as Head of the Management Control department, later becoming Director of Information Systems and Strategy. Between 2000 and 2002, he was the director of the Copernic program which aimed to implement the e-strategy for the tax department and modernise the tax information systems. In 2003 he joined the private office of the French Prime Minister as advisor for economic and financial affairs and between 2005 and 2007 he was Director of the French economy, finance and industry Minister’s private office. In 2007, Gilles joined the Executive Committee of the international banking Group Credit Agricole SA, where he was Head of Strategy before being appointed director of Payment Systems & Services.
8.4.5 The Executive Committee On top of the General Management of the Group, the Executive Committee is composed of:
■■ Patrick Adiba, Head of Rest of World Group Business Unit and Major Events. Patrick Adiba is also in charge of the Olympic Games. Prior to this position, he served as Vice President Human Resources of SchlumbergerSema, and also Vice President and General Manager of its Latin America Branch, for five years. Patrick holds a degree in Electronic and Telecommunications Engineering from INSA, Lyon and did an Executive MBA at Stanford University in 2001.
■■ Diego Pavia Bardaji, Head of Iberia Group Business Unit, has been CEO of Spain since 2002. Between 2007 and 2009 Diego was also managing Atos Origin’s operations in South America. From 2000 to 2002, working for SchlumbergerSema, Diego was running the Energy Global business unit. Since 2007 Diego is also Chairman of the Spanish Consulting Association. He is a graduate of the Spanish Polytechnic University.
Francis Delacourt■■ , Head of Strategic International Accounts and Deals. Francis Delacourt, 54, joined Atos Origin in 1991. He was in charge of various positions in the outsourcing business and led Managed Operations service line. Previously he worked with Dun and Bradstreet Software, McDonnel Douglas Information Systems and Burroughs-Unisys. He is a graduate from ESSEC business school in Paris.
■■ Marc-Henri Desportes, Head of Global Innovation Business Development & Strategy. Marc-Henri Desportes, 37, was IT Director in BNL, Italian subsidiary of BNP Paribas. From 2005 to 2006, he was in charge of control coordination at BNP Paribas. Previously he was Deputy Program Director of Copernic at the French Ministry of Finance. He is a graduate from Ecole Polytechnique and Ecole des Mines de Paris.
■■ Didier Dhennin, Head of Atos Worldline Group Business Unit, since 2004. He joined Atos Origin in 1984, and was in charge of Multimedia activities that he launched within the Group. He was previously division manager at the CERCI (Compagnie d’Etudes et de Réalisation de Cybernétique Industrielle), a subsidiary of Jeumont Schneider and then of SEMA. Didier Dhennin is an Engineer Arts & Métiers, with a diploma from ICG.
08 . Strategy, organisation and 2010 objectives8.4 Organisation

Atos Origin » Annual Report 2009 » 031www.atosorigin.com
■■ Eric Grall, Head of Global Managed Services. Eric Grall, 48, was President and General Manager at HP with responsibility for outsourcing activities in Europe, Middle East and Africa. Eric Grall has spent his professional career at HP in a number of roles related to outsourcing. He is a graduate from ENSIEG Grenoble and from the University of Brest.
■■ Winfried Holz, Head of Germany Central Europe/EMA Group Business Unit. Winfried Holz has more than 20 years of experience in the IT sector. He began his career in 1984 at Siemens AG Germany, where he held a variety of management positions, including Vice President of Siemens Nixdorf Informationssysteme and President of International Operations at Siemens Medical Solutions. Following his position of Managing Director of Fujitsu Services GmbH, he was appointed CEO of TDS in November 2007. Winfried Holz has a degree in industrial engineering.
■■ Francis Meston, Head of Global Systems Integration appointed in February 2009. Francis Meston, 49, comes from E.D.S French subsidiary where he had been appointed CEO since January 2002. In 1996, he joined AT Kearney as Vice President in charge of EMEA business transformation and strategy practices as well as M1A Global practice. He was previously Vice President of Gemini Consulting where he led the French operations, the EMEA Telecommunication practice and the EMEA business reengineering practice. Francis Meston is a graduate of Ecole Centrale Marseille and holds a MBA in Finance from Purdue.
■■ Hervé Payan, Head of Global Sales and Markets and Global Consulting. Hervé Payan, 43, comes from Steria where he was Deputy CEO of Steria France. Hervé is a graduate from the Ecole Supérieure de Commerce de Paris. After 10 years in Consulting, mostly with Cap Gemini Consulting and AT Kearney, Hervé has been Sales Director at EDS France from 2002 to mid 2005. Before joining Steria in March 2007, he was from mid 2005, Director of the Consulting business at EDS Consulting EMEA, where he led a team of 1,200 consultants in twelve countries.
■■ Rob Pols, Head of Benelux Group Business Unit. Rob Pols has built a considerable track record in the IT services and consultancy market place. Since 2005 he occupied the position of general manager and COO at Fujitsu Services in the Netherlands. Between 2003 and 2005 he was general manager of Adresco BV, an organisation specialised in interim management services. Previously, he was a Member of the ‘Raad van Bestuur’ at Syntegra – part of BT – and director of Syntegra/KPMG Consulting in France.
■■ Michel-Alain Proch, Group CFO. Michel-Alain Proch joined Atos Origin in 2006 as Group Senior Vice-President responsible for Internal Audit and Risk Management. After six years spent at Deloitte & Touche in Paris and London, he held different management positions at Hermès, first in Internal Audit and Controlling and then as CFO for North and South America. As Group CFO since 2007, he heads Finance, Investor Relations, Controlling of commercial offers, Risk Management, and Pensions/Insurance functions. Michel-Alain Proch is a graduate of l’École Supérieure de Commerce de Toulouse and holds a degree in Etudes Supérieures Comptables et Financières.
■■ Arnaud Ruffat, Head of France Group Business Unit. Arnaud Ruffat has more than 20 years experience in IT services. He began his career with Bull in Argentina in 1985. In 1988, he joined Atos Origin, holding various management-level positions within the company, notably finance director and operations director. In 2003, he was appointed head of Atos Origin’s outsourcing business in France. In 2006, he was chosen to head Atos Origin in Italy, where he helped to turn the Group’s operations around.
jean-Marie Simon■■ , Group Human Resources director. Before 2007, he was HR Director France, Germany & Central Europe. Previously, he held various management positions within Schlumberger, as Managing Director in R&D and production centers. He worked in Indonesia, as technical director for Asia, and in Norway and was before CIO for the oil sector of Schlumberger for three years.
■■ Keith Wilman, Head of the United Kingdom Group Business Unit. Keith Wilman joined Atos Origin end 2006. With over 25 years in the information technology field, he joins from Computer Sciences Corporation (CSC), where he was most recently President and Chief Executive Officer (CEO) of CSC’s European Group Northern Region (UK, Ireland and The Netherlands). Prior to joining CSC in 1997, Keith was managing director of Easams Ltd.
Philippe Mareine, Group General Secretary, is the Secretary of the Executive Committee. He was manager in the French Treasury Department’s Inspection Générale des Finances unit and, previously, he was in charge of HR in the public accounts department of the French Ministry for the Budget. From 2005 to 2007, he was technical adviser in charge of employee relations and reform in the office of the French Minister of the Economy, Finance and Industry. He held several managerial positions at the French Tax Administration, after spending the first four years of his career in the Inspection Générale des Finances. He is a graduate from École Poly technique and École Nationale d’Administration.
08 . Strategy, organisation and 2010 objectives8.4 Organisation

Atos Origin » Annual Report 2009 » 032
8.5 2010 Objectives
Priorities of the Group in 2010 will be again to maintain and reinforce staff skills, and to improve operating margin and cash generation as per its three-year plan.
Operating margin■■
As part of its 2009-2011 plan to improve its profitability, the Group confirms its ambition to increase its operating margin by +50 to +100 basis points in 2010.
Cash Flow■■
The Group has the objective to confirm the improvement achieved in 2009 by generating a net operational cash flow in the same range in 2010.
Revenue■■
Due to the Arcandor bankruptcy, the Group expects in 2010 a slight revenue organic decrease, however at a lesser extent than the one achieved in 2009.
08 . Strategy, organisation and 2010 objectives8.5 2010 Objectives

Atos Origin » Annual Report 2009 » 033www.atosorigin.com
09 . TOP Program (Total Operational Performance)
9.1 2009 achievements
9.2 Lean Management
The TOP Program strongly contributed in the Group financial performance in 2009 with an increase of the operating margin rate of +84 basis points and a reduction in the net debt of EUR 165 million. This was achieved by identifying where improvements in the operational and delivery model could be made and then implementing them fast so that the benefits for both Atos Origin and its clients were realised quickly.
The key objective of the TOP Program is to close the performance gap with the best of the industry by ensuring that we deliver the best possible service to our customers.
9.2.1 definition and methodologyAtos Origin has set a Lean methodology which enables the Company to leverage the skills and creativity to operate more efficiently, while improving quality and services delivered to clients. Its continued use across all the operations of the Group will provide competitive advantage to strengthen and grow.
The Company has already started deploying Lean Management through all its main offerings which resulted in an improved quality of service, reduced delivery cost, and increased team morale.
9.2.2 Lean case studies
Improving Global Service Desks (call centers)
In 2009 the Company successfully completed several Lean transformation projects for its global service desks. The first one was in Livingston in Scotland. Over three months, half of the Livingston IT Service Desk Team supporting the Group’s UK clients worked with the TOP team to design changes to the way the company works. This resulted in drastic improvements in the management of the incoming calls together with a reduction of queues.
Improving Infrastructure Services
In 2009, the Company completed two pilots in Eindhoven in the Netherlands and Mumbai in India. The aim of these pilots was to see how the Company can maintain or increase service quality while increasing efficiency at each location.
Following these pilots, Atos Origin has implemented a number of changes including the improvement of the resource capacity management systems and introduced a new process to better plan and allocate non-routine activities. Both these changes have significantly helped the Company to increase the productivity. Thirdly the Company has focussed on tackling the problems that cause incidents. This has reduced the number of new incidents, increased the stability of the environment and ultimately enabled le Group to improve the service to its clients.
9.2.3 Employees quotes about TOP Program
“The Lean pilot has changed the way we work and it is ■■
definitely for the better. Like any changes, at first it seemed that everything was taking us a little bit longer. Now we are used to the new structure and improved processes, it feels more efficient and importantly we are getting good feedback from our clients.” ( Infrastructure services department in Mumbai).
9.1 2009 achievements 0339.2 Lean Management 0339.3 Boosting Offshoring 0349.4 Optimising office space 035
9.5 Supporting innovation 0359.6 Continuation in 2010 035

Atos Origin » Annual Report 2009 » 034
“The mindset of the whole team has changed. Today, ■■
people systematically ask themselves if they are really adding value.” (Infrastructure services department in Mumbai).
“The proactive analysis of figures gives us a sense of ■■
responsibility.” (Call Agent, Atos Worldline).
“My team’s workload is better managed. They don’t ■■
necessarily work harder, they work smarter.” (Head of UK Service Desks).
“Daily meetings help me get the big picture and identify ■■
bottlenecks.” (Project Manager, SAP practice).
“One of the biggest changes for the team is that we can ■■
now all see how we are doing against our targets. Seeing that we are ahead is a good morale booster. Equally, if there is an issue, we all are aware and we pull together to ensure it is resolved as quickly as possible.” (Infrastructure services department in Eindhoven).
“What I notice most is how the team dynamic has ■■
changed thanks to these daily meetings. Everyone tries to collaborate and suggests solutions and new ways of doing things. Personally, I have learnt how to organise, prepare and lead these short meetings.” (Atos Worldline service desk in Brussels).
TOP Program (Total Operational Performance)9.2 Lean Management9.3 Boosting Offshoring
9.3 Boosting Offshoring
In today’s market, off-shoring is mandatory to ensure that costs drop faster than market prices and Atos Origin stays competitive and focused on excellent delivery. For contract renewals and new client wins, off-shoring is a prerequisite, where Atos Origin needs to demonstrate innovation, market knowledge and competitive pricing.
9.3.1 Managed Services
Through the TOP Program, in 2009 the Group strongly increased the size of the teams in offshore locations. This has been achieved by transferring server management and monitoring services progressing well to the four key offshore locations for Managed Services: India, Malaysia, Morocco and Poland. In parallel to transferring services offshore, Atos Origin is also running training schemes to re-skill its onshore staff for other onshore job opportunities.
In Morocco
To meet the increasing demand from its French clients to deliver more services offshore by French speaking technology experts, the Company has further improved and strengthened its offshore centre in Morocco. In September 2009, the Company moved into a brand new, purpose built, technology Campus, “Casa Near-shore”, located close to Casablanca; increased the size of the Group Systems Integration team and its Managed Operations team to serve clients.
9.3.2 Systems Integration
The five step plans has accelerated off-shoring while improving efficiency, service quality and profitability:
1) Speed up roll-out of the Service Delivery Platform standardize processes and tools worldwide, so that the Company can offshore quickly and efficiently;
2) Move to the factory approach – create a catalogue of services at pre-defined tariffs that guarantee delivery and make it easier for Global Business Units to price solutions for their clients. This will replace the previous system where fees were calculated on a pro rata basis;
3) Standardize transition processes from onshore to offshore – manage the transfer of existing long-term business cost effectively and without any disruption to service;
4) Define principles for new operating model in India – benefit from economies of scale and deliver improved service by reorganizing the Indian operations by technologies and/or business domains. For example, there will be teams focussed on the test factory, SAP upgrades and applications, java and.net development, in addition to focus service lines for applications management;
5) Develop sales collateral – help the sales and account teams more effectively to master and manage the offer of offshore in all new deals.

Atos Origin » Annual Report 2009 » 035www.atosorigin.com
TOP Program (Total Operational Performance)9.4 Optimising office space9.5 Supporting innovation9.6 Continuation in 2010
9.4 Optimising office space
9.5 Supporting innovation
9.6 Continuation in 2010
Considerable progress has been made in 2009 to ensure that the Group makes optimal use of its office space.
Focus on Paris
As from summer 2010, Atos Origin headquarters will move to Bezons in a new business district located six-kilometres
west from La Défense. This new Campus aims at bringing more interaction between the entities within the Group.
9.5.1 Globalising the Payment PlatformsIn 2009, Atos Worldline processed almost three billion payment transactions in its domestic markets - Belgium, France and Germany. In order to strengthen its position and to prepare for the SEPA market, Atos Worldline initiated the strategic IT Globalisation Program which in 2009 was incorporated into the TOP Program. It aims to deliver the first truly pan-European payment processing platforms for Acceptance, Acquiring, Issuing and Clearing and Settlement. These global payment processing platforms are designed and developed to meet the requirements of its international customers for cross-border processing, front-and back office, including full regulatory compliance and fraud management.
With these global platforms, the Group aims at significantly increasing the number of processed transactions in the coming years, by growing the business in its existing markets – Belgium, France and Germany – and by expanding the business into other markets where Atos Origin has a strong presence.
9.5.2 Rewarding and investing in innovationAtos Origin is at the forefront of the world’s leading technology projects in the Energy, Public Sector, Telecom and Financial Services market. Through the TOP Program, the Company has used a systematic approach to identify these projects to ensure that they are recognised both internally and externally. It has also enabled the Company to benefit from subsidies granted for innovation in R&D. This together with the improved cash flow has meant Atos Origin has been able to further invest in Research and Development. Below are two examples of the innovation recognised by the Crédit d’Impôt Recherche that the Group is delivering to its clients to further improve and strengthen their operations.
The TOP Program is a three-year Program and will continue through to 2011. At the end of 2009, the Company launched new programs focussed on improving the sales
effectiveness, on employee well-being in particular covering talent management, training, the management and mobile working.
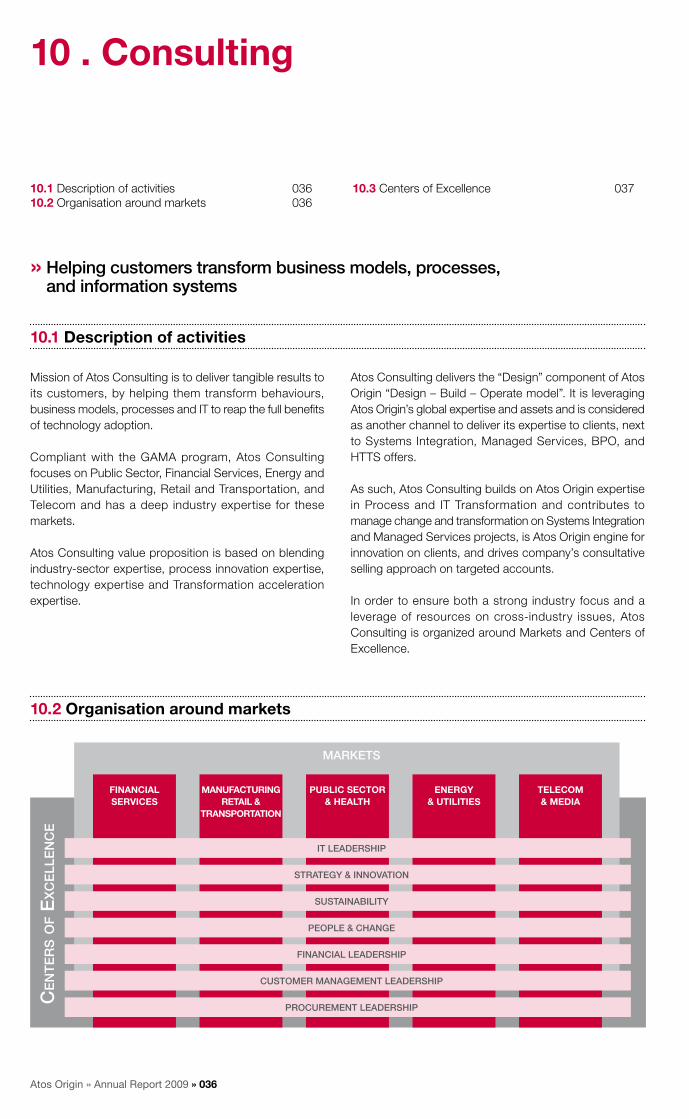
Atos Origin » Annual Report 2009 » 036
10 . Consulting
10.1 Description of activities 03610.2 Organisation around markets 036
10.3 Centers of Excellence 037
» Helping customers transform business models, processes, and information systems
10.1 description of activities
10.2 Organisation around markets
Mission of Atos Consulting is to deliver tangible results to its customers, by helping them transform behaviours, business models, processes and IT to reap the full benefits of technology adoption.
Compliant with the GAMA program, Atos Consulting focuses on Public Sector, Financial Services, Energy and Utilities, Manufacturing, Retail and Transportation, and Telecom and has a deep industry expertise for these markets.
Atos Consulting value proposition is based on blending industry-sector expertise, process innovation expertise, technology expertise and Transformation acceleration expertise.
Atos Consulting delivers the “Design” component of Atos Origin “Design – Build – Operate model”. It is leveraging Atos Origin’s global expertise and assets and is considered as another channel to deliver its expertise to clients, next to Systems Integration, Managed Services, BPO, and HTTS offers.
As such, Atos Consulting builds on Atos Origin expertise in Process and IT Transformation and contributes to manage change and transformation on Systems Integration and Managed Services projects, is Atos Origin engine for innovation on clients, and drives company’s consultative selling approach on targeted accounts.
In order to ensure both a strong industry focus and a leverage of resources on cross-industry issues, Atos Consulting is organized around Markets and Centers of Excellence.
MARKETS
FINANCIAL SERVICES
MANUFACTURING RETAIL &
TRANSPORTATION
PUBLIC SECTOR & HEALTH
ENERGY & UTILITIES
TELECOM & MEdIA
IT LEADERSHIP
STRATEGY & InnOvATIOn
SUSTAInABILITY
PEOPLE & CHAnGE
FInAnCIAL LEADERSHIP
CUSTOMER MAnAGEMEnT LEADERSHIP
PROCUREMEnT LEADERSHIP
Ce
nt
er
s o
f E
xc
ell
en
ce

Atos Origin » Annual Report 2009 » 037www.atosorigin.com
10.3 Centers of Excellence
Centers of Excellence (CoEs) developed seven functional expertise and across-industry verticals offerings. Here is a set of domains of expertise supported by Centers of Excellence in charge of offering development, best practices roll out and knowledge sharing:
IT Leadership ■■ : transforming IT for better alignment with business requirements, lower capital expenditures and maximized operational efficiency. Leveraging the Group IT expertise, Atos Consulting focuses at: IT Strategy, innovation and master planning, Lean IT, IT Transformation (project portfolio prioritization, server infrastructure rationalization and modernization of portfolio of applications), Cloud consulting, Information security and Green IT to help clients reduce IT energy costs and IT-related carbon emission.
Strategy & Innovation■■ : in the current environment of uncertain growth and high turbulence, competitive advantage is created through the ability to reinvent business models and align innovation initiatives (in the form of new product, services or technologies) to the new market realities. The Group helps clients formulate their business and growth strategies under high uncertainty, reinvent their business models and develop
appropriate innovation strategies and sustainable innovation capabilities. Consultants focus on Innovation acceleration, (such as Total, Michelin), Business transformation in Strategy, Operations and Finance, (such as 75 ICT companies in Spain, in a large and pioneering Industry Capacity Building program for the Regional Government of Andalusia), Alliances and partnership management (such as KPN, BASF).
Sustainability■■ : Atos Consulting has developed a full portfolio of offerings to help customers reduce the environmental impact of their business and their IT. For example, our Intelligent Sustainability offering helps customers implement a sustainability dashboard across the whole Enterprise. The Road to Sustainability offering helps customers defining their sustainability roadmap and business case.
People & Change■■ : is about effectiveness of client’s employees by designing and implementing HR processes, organization and IT systems, Change Management approach, Performance of the organisation. Atos Consulting’s strengths are on HR Business Partner Development Program, HR Shared Services Center Customer Care, and Financial HR Tool.
10 . Consulting10.2 Organisation around markets10.3 Centers of Excellence
Market teams developed industry sector expertise and offerings in its selected markets:
Financial services ■■ (Retail and Investment Banking, Insurance), with three areas of focus: Operational Excellence, Regulatory & Compliance, and Software package based Solutions for core processes to help clients migrate their legacy systems to core banking or insurance applications.
Manufacturing, Retail & Transportation■■ : this market includes Aerospace, Automotive, Chemical, Consumer Products, High Tech, Pharmaceuticals and Retail, with a focus on 1) MMT, company’s approach to best practices, benefits of process transformation and implementation with state of the ar t ERP related technology, 2) Manufacturing Execution Systems, 3) Supply Chain.
Public Sector & Health:■■ drawing on its extensive sector knowledge, Atos Consultants help governments improving their costs as well as their services to citizens by leveraging new technologies.
Energy & Utilities:■■ consultants focus on helping their customers reengineer their processes, address deregulation and build smart grids building on Smart Metering and power expertise.
Telecom & Media:■■ Atos Consulting is advising major European Telecom operators, focusing on few offerings: simplifying, standardizing and consolidating processes, Customer Value Management, OSS IP Transformation, Intelligent Networks, Convergent Billing: improvement of billing processes and creation of innovative and flexible billing schemes, Mobile payments.
Atos Origin » Annual Report 2009 » 038
Financial Leadership■■ : adding value, increasing control and delivering cost reduction, such as Finance Strategy and Business Intelligence (Business Warehouse Solutions), Process & Systems Optimisation, Shared Services, Compliance (like International Financial Reporting Standards and Solvency II), Cost Management and Organisational Change.
Customer Management Leadership■■ : effectiveness of Sales, Marketing & Service function by leveraging new technologies and methodologies to transform customer management processes. Focus is on optimizing customer interaction with Web 2.0 and channel integration as well as improving customer intelligence and knowledge management.
The company has delivered bottom line results for many clients including Toyota, NHS (National Health Service), ING, NUON, Santander, Iberia, GDF, Mars, Goodyear and Reuters. Atos Origin’s work in shared services, cost improvement and business intelligence was recognised with the award by CIMA (Chartered Institute of Management Accountants) of Finance Team of the Year within Private Sector in the UK in 2009.
Procurement Leadership■■ : reduction of customer’s costs by improving their procurement practices. The Group can help implement, build and run a professional procurement organization as well as reduce the procurement costs of selected direct and indirect spend categories; consultants focus on Procurement Intelligence, IT procurement, Indirect procurement cost reduction, Supplier Relationship Management.
In conclusion, Atos Consulting aims at creating competitive advantage by anticipating Clients’ expectations vis-à-vis Consulting Services, mostly by better leveraging Atos Origin assets and better aligning with Atos Origin’s other Service Lines. In this respect, it will continue over 2010 to further align portfolio of clients, align portfolio of offerings (Consulting portfolio with the company’s portfolio of Atos Origin, align capabilities, to ensure Atos Consulting be the practice that sets Atos Origin apart when it comes to deliver IT-enabled process innovation and Transformation projects.
10 . Consulting10.3 Offers

Atos Origin » Annual Report 2009 » 039www.atosorigin.com
11 . Systems Integration
11.1 description of activities
As a business value generator through more efficient use of IT, Atos Origin’s Systems Integration services are uniquely positioned to reap the benefits of the expected growth of the Systems Integration market. The Group brings sound added value to its clients through a large number of activities that are either very sector-oriented or transversal. The Group and here more specifically Systems Integration operates at four different levels:
Business critical systems, as market leader by offering ■■
specialist solutions by industry;Transversal offerings across many industries, as regional ■■
leader;
SAP software integration where the Company builds end-■■
to-end capabilities;More generic business application services, where Atos ■■
Origin has a large proven track record in accompanying its clients in their project while generating recurrent business through long-term trustful customer intimacy.
11.1.1 Business critical systemsAtos Origin designs, builds IT solutions which support business critical processes. These are industry-specific solutions requiring both a very deep level of industry knowledge and technology competences. Atos Origin aims at reaching a position of global or regional leadership in these activities, that amounted around 10% of its business in 2009. The Group’s main capabilities are described below:
Energy & Utilities
Atos Origin is a global leader in providing monitoring and ■■
command control systems, as well as simulation and predictive maintenance platforms in the nuclear sector. For instance, Atos Origin has designed, built and deployed the command and control systems of 58 French nuclear plants in operation. China has also retained Atos Origin’s solution for several of its nuclear power plants.
Atos Origin’s Smart Metering solution is an information and ■■
telecommunication system that provides remote automated data acquisition, configuration, maintenance and operation of smart meters, meter data management up to smart grid and consumer information functions. Atos Origin is the architect for the information system and lead manager of ERDF (the distribution branch of EDF, the French Electricity historical incumbent) Smart Metering project aiming at replacing the 35 million electricity meters in France.
Telecom & Media
Atos Origin demonstrates its best-in-class integration ■■
solutions for real-time fully convergent prepaid and post-paid billing, providing telecom operators the means to significantly decrease operating costs, while introducing flexible offerings. Atos Origin has a very large customer base across the world: KPN, Turkcell, Swisscom, E-Plus, Tele2, Vodafone, Mobipay, MTN South Africa.
Atos Origin’s Next Generation Intelligent Networks (NGIN) ■■
enables traditional Value Added Services to be supported in a new networking infrastructure (IMS – IP Multimedia Subsystem/Packet Switched) while facilitating the introduction of new services for residential and Enterprise markets. NGIN services enable telecom operators to become total communications providers, offering convergent voice and data services to mobile, fixed, and IP devices. To date, Atos Origin has six NGIN reference sites in the Vodafone Group (Spain, Czech Republic, Greece, the Netherlands, Germany and Ireland).
11.1 Description of activities 03911.2 Key Systems Integration achievements
in 2009 041
11.3 Looking ahead 042
» Delivering clarity from complexity

Atos Origin » Annual Report 2009 » 040
Manufacturing & Transports
Atos Origin is launching the Integrale offering which is a unique proposition around predicting problems and reducing delays on the train network. As an example, in the United Kingdom:
In 2009, Atos Origin has signed a contract to provide Internet ■■
ticketing (Avantix WebTis) to GoAhead Group (UK-based rail and bus operating company). Atos Origin retained 100% market share of the ”on train” ticketing market by renewing all Operators contracts for Avantix Mobile.
At NetworkRail a new contract to deliver the External ■■
Services Gateway was signed reinforcing the company’s position as a key supplier of business critical systems.
For more than 15 years, Atos Origin has been involved in the development of avionics functions for the A380, A400M, and more recently for the A350. Atos Origin’s expertise and know-how includes:
Air Traffic Control (ATC), communication calculator ■■
between the air and the ground;Central Maintenance System (CMS), maintenance ■■
calculator providing information to pilots and maintenance teams to anticipate interventions;Flight Control and Guidance Unit (FCGU), electric flight ■■
command;Idefix, NSS Integration Tool, testing and simulation tools;■■
ExamTool, tool customizing messages for pilots and ■■
airlines.
Moreover, Atos Origin is Airbus’ preferred partner in the Topcased project, which is a development platform for onboard and critical systems using open source technology. The platform is based on a modelling approach that enables gains in the demand maturation and in the simulation and verification at a very early stage to detect inconsistencies.
Major events
As the Worldwide IT Partner for the Olympic Games and Top sponsor, Atos Origin integrates, manages and secures the vast IT system that relays results, events and athlete information to spectators and media around the world. Atos Origin has developed a strong competency in the management of major events such as the Athens 2004 Olympic Summer Games, the Torino 2006 Olympic Winter Games, the Beijing 2008 Olympic Summer Games or the Vancouver 2010 Olympic Winter Games. It reconducted its contract to the London 2012 Olympic Summer Games.
The Atos Origin contract with the International Olympic Committee (IOC) is the world’s largest sports related IT contract and was recently extended to cover the Sotchi Olympic Winter Games in 2014 in Russia and the Rio Olympic Summer Games in Brazil in 2016.
11.1.2 Transversal offeringsSystems Integration aims at providing cross-industry offerings generating significant volumes for which the Group can establish a regional leadership position. Its portfolio includes Enterprise Content Management (ECM), Testing & Acceptance Management (TAM), Application Management & Modernization (A2M) and SAP. In 2009, these offerings represented close to one third of Systems Integration revenue.
Enterprise Content Management (ECM)ECM is one of the fastest growing IT services, and its average growth rate is estimated at +13% until 2012 (1). ECM refers to the technology, tools and methods used to capture, manage, preserve, and deliver content across the Enterprise. It addresses business issues such as compliance, collaboration, costs and communication. Atos Origin has a pool of 700 dedicated resources and works closely with partners such as EMC-Documentum, IBM-Filenet, Microsoft-Sharepoint and OpenText. In this area, Atos Origin has worked for the French National Library in the implementation of an information-management system to address the long-term availability of electronic publications. Atos Origin provides the Olympic Family with a secure portal containing all the information about activities during the Olympic Games.
Testing & Acceptance Management (TAM)TAM’s scope represents up to 30% of projects budget. It creates a secure, industrialized process for moving from development to production. It is an end-to-end solution as it involves Consulting, Systems Integration and Managed Operations. In this area, the Group has strong references such as ING, Carrefour, Philips, France Telecom, E-plus, Beijing Olympic Games, etc.
Application Management & Modernization (A2M)Through the A2M offer, company’s customers get:
Direct cost reduction: quick and visible reduction of Total ■■
Cost of Ownership (TCO) (typically 50%);Innovation: application modernization and technology ■■
refresh;Transparent, variable pricing: cost linked to measurable ■■
output and performance delivered, measured by Service Level Agreement (SLA);
11 . Systems Integration11.1 Description of activities
(1) Source: Gartner and Ovum 2009.

Atos Origin » Annual Report 2009 » 041www.atosorigin.com
11 . Systems Integration11.1 Description of activities11.2 Key Systems Integration achievements in 2009
Flexibility in service level: customer flexibility in service ■■
level, basic service with add-on options;Long-term quality improvement: measured increase of ■■
applications maintainability.
2009 wins include a 3-year renewal contract with Renault where Atos Origin has expanded its perimeter to functional domain integration, organized a co-governance, and widened the scope from Application Maintenance to Application Development Management.
Global SAPAtos Origin is confident that the current 10% of total IT services revenue generated by SAP will continue to grow in the future. To continue to capture an increasing part of that market, Atos Origin has created a globally integrated SAP service line which brings together its Systems Integration practice on one hand with its Infrastructure Management practice on the other hand at a global level as well as its Consulting services practices.
Atos Origin is able to help customers generate increased value from their SAP investment by both improving the business performance of their processes while reducing the total cost of ownership of their SAP systems. Building on this global SAP practice, Atos Origin is able to construct a global portfolio of SAP services and develop a truly global workforce, while taking advantage of the SAP factory in India and of nearshore capabilities. The Group has a pool of 4,000 SAP (including Business Object acquired by SAP) consultants working on Consulting, Application Management and hosting projects.
The acquisition of Covics increased the company’s SAP workforce by 100 consultants in China. It has SAP references in most of the locations the Group is operating in: ChemChina in China; Argentina continuing to serve PSA, strong Brazilian demand from its larger clients with operations in Brazil, etc.
Business Application ServicesBusiness Application Services represent the largest part of Systems Integration activity with 65% of the Group revenue. While growing in Business Critical Systems and Transversal Offerings, the company wants to consolidate its position in the Business Application Services by continuing to accompany clients in their project. Business Application Services are applicable across all core markets. Business Application Services cover:
Professional Services for which the company provides ■■
resources for mean;Customized and packaged solutions depending on the ■■
clients’ needs. Systems Integration works then closely with selected strategic partners in order to develop, implement and integrate leading technologies and packaged systems.
11.2 Key Systems Integration achievements in 2009
The current economic downturn pushed clients’ CIOs to review their agenda priorities. Cost reduction, productivity and flexibility now appear on the top of their list, while they are still expecting a very good quality in the meantime. They want “more for less”.
11.2.1 GlobalisationAtos Origin is organised around the concept of Distributed Delivery. All the delivery centers and Systems Integration staff have access to the same tools for the seven major Systems Integration processes. These tools enable the company’s workforce to capture business requirements in an optimal way, design and build the software, manage configuration changes and conduct tests in a very cost efficient manner.
Overall, efficiency gain is generated in the Global Factory based in its international delivery centers via standardization, common tools and processes, repeatable processes and solutions, and economies of scale. There are currently 11 factories delivering end-to-end Systems Integration service offering: Java Development & Maintenance Factory, .NET Development & Maintenance Factory, Oracle Development & Maintenance Factory, Mainframe Development & Maintenance Factory, Interactive Marketing Solution Factory, EAI Factory, Telecom Billing Factory, Test Factory, SAP Application Management Factory, SAP Upgrade (MOVE) Factory, Enterprise Infrastructure Factory.
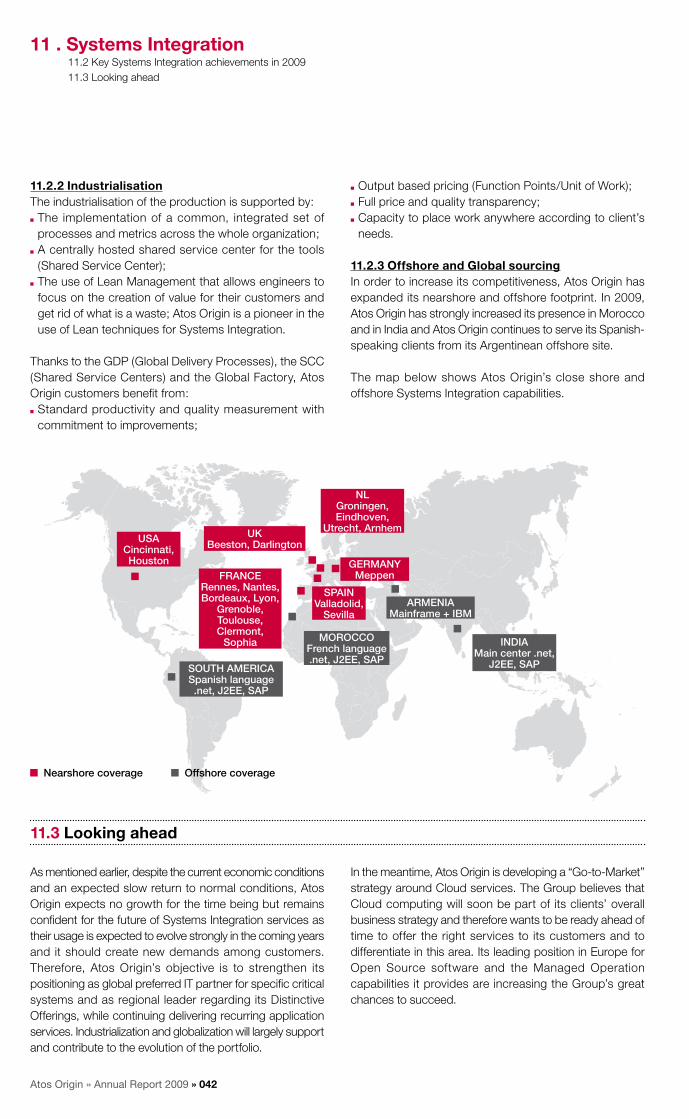
Atos Origin » Annual Report 2009 » 042
11 . Systems Integration11.2 Key Systems Integration achievements in 200911.3 Looking ahead
11.2.2 IndustrialisationThe industrialisation of the production is supported by:
The implementation of a common, integrated set of ■■
processes and metrics across the whole organization;A centrally hosted shared service center for the tools ■■
(Shared Service Center);The use of Lean Management that allows engineers to ■■
focus on the creation of value for their customers and get rid of what is a waste; Atos Origin is a pioneer in the use of Lean techniques for Systems Integration.
Thanks to the GDP (Global Delivery Processes), the SCC (Shared Service Centers) and the Global Factory, Atos Origin customers benefit from:
Standard productivity and quality measurement with ■■
commitment to improvements;
Output based pricing (Function Points/Unit of Work);■■
Full price and quality transparency;■■
Capacity to place work anywhere according to client’s ■■
needs.
11.2.3 Offshore and Global sourcingIn order to increase its competitiveness, Atos Origin has expanded its nearshore and offshore footprint. In 2009, Atos Origin has strongly increased its presence in Morocco and in India and Atos Origin continues to serve its Spanish-speaking clients from its Argentinean offshore site.
The map below shows Atos Origin’s close shore and offshore Systems Integration capabilities.
11.3 Looking ahead
As mentioned earlier, despite the current economic conditions and an expected slow return to normal conditions, Atos Origin expects no growth for the time being but remains confident for the future of Systems Integration services as their usage is expected to evolve strongly in the coming years and it should create new demands among customers. Therefore, Atos Origin’s objective is to strengthen its positioning as global preferred IT partner for specific critical systems and as regional leader regarding its Distinctive Offerings, while continuing delivering recurring application services. Industrialization and globalization will largely support and contribute to the evolution of the portfolio.
In the meantime, Atos Origin is developing a “Go-to-Market” strategy around Cloud services. The Group believes that Cloud computing will soon be part of its clients’ overall business strategy and therefore wants to be ready ahead of time to offer the right services to its customers and to differentiate in this area. Its leading position in Europe for Open Source software and the Managed Operation capabilities it provides are increasing the Group’s great chances to succeed.
nLGroningen,Eindhoven,
Utrecht, ArnhemUKBeeston, Darlington
FRAnCERennes, nantes,Bordeaux, Lyon,
Grenoble,Toulouse, Clermont,
Sophia
USACincinnati,Houston
SOUTH AMERICASpanish language.net, j2EE, SAP
MOROCCOFrench language .net, j2EE, SAP
SPAInvalladolid,
SevillaARMEnIA
Mainframe + IBM
GERMAnYMeppen
InDIAMain center .net,
j2EE, SAP
nearshore coverage Offshore coverage

Atos Origin » Annual Report 2009 » 043www.atosorigin.com
12 . Managed Services
12.1 Description of activities 04312.2 Managed Services Portfolio 044
12.3 Looking ahead 045
12.1 description of activities
Atos Origin specializes in managing and transforming the IT operations of its clients. This includes managing clients’ entire information and data processing systems, covering datacenters, network and desktop support operations, identity access and security systems, application management and implementing processes and tooling that enable clients to benefit from state-of-the-art technology in a flexible environment to gain competitive advantages in their business.
Atos Origin is a leading European outsourcing company as well as having a significant position in the rest of the world. Atos Origin provides 7x24 “follow the sun” infrastructure and application management and support through its global network and have unrivalled experience in major roll-out programs covering complex and multi-site solutions including SAP and CRM applications.
Continuous Service Delivery Methodology (CSDM) is used to provide world-class service delivery, based on ITIL standards and ensures globally consistent processes, tooling and organizations. This methodology is important to guide the client through the process of assessment, planning, implementation, transition, and continuous quality delivery.
In 2009, Managed Operations launched projects to develop its efficiency as part of TOP Program. They address the whole range of its services, and develop the following levers:
Identify and roll out globally best of class practices, from ■■
technical to purchase dimensions;Reduce energy consumption in its datacenters;■■
Develop offshore within a global model of service delivery ■■
& localization;Deploy Lean management, to enhance client-focus ■■
efficiency.
A key driver is the creation in 2009 of a Global Factory, where the local teams delivering shared services to clients were aligned in Global Practices per technology in a matrix model to guarantee technical effectiveness as well as client intimacy. The benefits of this evolution include development of global tools, leverage on investments as well as skills development and sharing.
It was also a booster for the offshore development, reaching at 2009 year end over 1,500 FTE offshore. This increase will be amplified in 2010, supported by a global model of workload split on/offshore. This growth came with careful sustainability in mind. A first example is the definition for each domain of two offshore target locations. A second one is the implementation of Lean projects in offshore as well as onshore. Rolling out the same standards and developing a strong problem management culture contributes to the quality and efficiency of seamless operations.
Atos Origin has continued the cooperation with leading vendors such as Intel, Microsoft, EMC, VMware, Novell, SAP, FSC, Unisys, IBM, HP and Sun with joined innovations such as Cloud Infrastructure Services. The partnership with Microsoft for BPOS resulted in actual delivery. The company has initiated a new innovative distinctive offer gathering its Cloud solutions (Atos Sphere), and met considerable business growth in the existing ones: Identity, Security, Risk Management and Adaptive Workplace.
» Providing customers competitive advantages in business and IT management

Atos Origin » Annual Report 2009 » 044
12.2 Managed Services Portfolio
Atos Origin is one of the few companies that can provide all the ”design, build, and operate” elements of a complete outsourcing solution. The scope includes datacenters- and office-centric services, and ranges from hardware support to business application management.
The company specializes in transforming the IT infrastructure and business operations of its clients to improve efficiency and effectivity. The outsourcing services are supported by proven organizational structures, processes, and tooling, which are ISO 9001 and ISO 27001 accredited, ensuring consistent service-level delivery worldwide.
The main Managed Services portfolio areas are:
Adaptive Workplace■■ : workplace management and end-user support services that deliver a truly adaptive workplace and allow an enterprise to respond quickly to changing business conditions through highly responsive service levels and reduced costs. The services include workplace transformation for continuous improvement and innovation, and Global Service Desk for multi-channel and multi-language IT support, provided on a 7x24 basis.
Cloud Infrastructure Services■■ : Cloud computing services, as part of the overall Atos Sphere offering. Cloud Infrastructure Services are based on a solid track record in developing and delivering on demand services, and is built on a Cloud computing infrastructure hosted in Atos Origin’s own datacenters. It takes onboard all security features, a key asset of Atos Origin. As Cloud Services form a cornerstone in the sustainability portfolio, carbon neutral delivery is offered as a standard option.
Mainframe Services■■ : Managed Services is very well positioned in Mainframe – strong offerings, high quality service delivery from the European Mainframe Hub in Essen, and an excellent track record. Benefits for a customer are numerous: cost savings, continuity improvement, increased flexibility, reduced investment, and risk reduction.
Infrastructure Solutions■■ : infrastructure management and hosting services ranging from remote infrastructure management, secure datacenters hosting to utility services. As cloud related services are very important to Managed Services, these are offered as a separate offering. Proven methodologies for datacenters and server virtualisation and consolidation enable to standardize all IT elements. This approach provides the transparency needed to improve user accountability, control IT resource consumption, and enable regulatory compliance.
Application Hosting■■ : The goal is to combine TCO reduction, regulatory compliance, business continuity, and continuous improvement of customers’ application landscapes. Atos Origin has deployed a unique scalable and flexible growth model. Service delivery is globally standardized, based on the ITIL compliant and globally deployed Continuous Service Delivery Model (CSDM). The Application Hosting portfolio covers the ERP Application Management and Collaborative Application Management with global services based on SAP, Oracle, and Microsoft technologies. Delivery models vary from customer-dedicated solutions to fully flexible on demand concepts (SAAS).
Identity, Security and Risk Management■■ : addressing business risks through the integration of proven information security technology. Identity, Security and Risk Management integrates security solutions into customers’ business and IT service Management to enable controlled business risks, improved operational efficiency and reduced costs. Atos Origin’s end-to-end approach to information security addresses the full threat landscape from people and processes, policies, procedures, technology and operations. Atos Origin leverages its partnership with three leading security technology providers (Novell, EMC/RSA and Microsoft) to integrate proven technology into security solutions that ensure the appropriate level of security for each customer
Infrastructure Professional Services■■ : these services address all customers, whether outsourced or not. The Group provides Technical Consultancy with high skilled consultants on topics like IT Governance, Security or Green IT. The Company also performs ICT Transformation Services, with a particular focus on virtualization projects for servers, desktops and storage.
Each single solution can deliver a measurable ROI and when coupled with other elements of Company’s portfolio can deliver further improvements in efficiency, growth and sustainability. They illustrate Atos Origin’s commitment for quick win solutions, as expected by the market in difficult times.
12 . Managed Services12.2 Managed Services Portfolio

Atos Origin » Annual Report 2009 » 045www.atosorigin.com
Atos Origin is able to deliver Managed Services using various engagement models. This variety of engagement models provides the needed commercial flexibility for making the engagement “fit” with the client. The traditional approach (SLA-based, f ixed-price IT-outsourcing arrangement) is now balanced with different models, like IT-Outsourcing on a pay-per-use basis or at the other extreme, the company being engaged in Joint Ventures with other clients.
Ensuring a worldwide consistent quality level in service delivery is a key success factor for implementing Global Sourcing strategies. The Global Delivery capabilities include offshore service desks and support centers in India, Malaysia, Poland, Surinam, Morocco and Brazil. These complement its existing onshore and nearshore delivery centers. The Global Sourcing Centers operate at the highest levels of ISO 9001: 2000 and the SEI Capability Maturity Model (CMM and CMMI).
12 . Managed Services12.2 Managed Services Portfolio12.3 Looking ahead
12.3 Looking ahead
2010 will be another challenging year due to the economic environment, with improved conditions expected in the second semester. Clients will continue to focus on cost cutting, flexibility and agility, based on added value pricing models. The company will expand the scope of the Global factory and the offshore effort will be accelerated, building on the strong grounds set in 2009.
In the area of Infrastructure Solutions, Application Hosting, and Adaptive Workplace, Atos Origin expects that the demand for cloud-based services will increase.
The importance of a strong integral security approach will remain unaffected by the current economic climate. The company will intensify current partnerships like the Novell engagement to ensure growth in Identity and Access Management.

Atos Origin » Annual Report 2009 » 046
13 . Hi-Tech Transactional Services (HTTS)
13.1 Description of activities 04613.2 Payments services 04713.3 eCs, eServices for Customers, Citizens
and Communities 04713.4 Atos Worldline processing capabilities –
key figures 048
13.5 Hi-Tech Transactional Services: Pillars for Atos Worldline Development 048
13.6 Future developments 050
» Leader in end-to-end services for critical electronic transactions
13.1 description of activities
13.1.1 A unique expertiseAtos Origin’s core expertise in Hi-Tech Transactional Services was until 2009 mostly based on the Atos Worldline Global Business Unit. Leader in end-to-end services for critical electronic transactions, Atos Worldline is specialised in:
Electronic payment services■■ : issuing, acquiring, terminals, card and non card payment solutions & processing;eCS■■ (eServices for Customers, Citizens and Communities): client service processes, messaging, web platforms and digitization, trust and archiving services;Financial Markets■■ : clearing & settlement, brokerage services and asset management.
Atos Worldline has acquired a strong position as a professional European Partner of the banking, telecoms, retail, public sector and healthcare markets.
13.1.2 Processing billions of electronic transactionsAtos Worldline offers strong industrial processing capabilities enabling to process 15 billion electronic transactions per year on its main highly secured datacenters in Europe. Atos Worldline fully interconnected data centers run 24x7 and offer unlimited capacity volumes. Commitment to offering best quality services is demonstrated through strong Service Level Agreement and compliance to ISO 9001 standards.
Atos Worldline offers its clients a unique value proposition and supports them so they can differentiate from the competition:
High quality end-to-end services;■■
Strengthened productivity and cost efficiency through ■■
volume aggregation mainly across Europe; Customized solutions and price per transaction, based ■■
upon clients’ business criteria; Leading edge services through strong R&D focus and ■■
long-term commitment;Successful and unique approach with key clients through ■■
a win-win model, offering to share investments and revenues.
13.1.3 Commitment to continuous innovationAtos Worldline focuses on delivering innovative solutions and services that help its clients advance their business strategies to meet today’s business agility and competitive challenges. Every year Atos Worldline wins prestigious market awards in recognition of its continuous commitment to research and development of leading edge solutions. Awarded solutions cover expertise in areas such as mobile payments, secure IPTV payment, online CRM and paperless solutions.

Atos Origin » Annual Report 2009 » 047www.atosorigin.com
A european leader in electronic payment services
Atos Worldline is a European leader in payment services with over 35 years experience and in-depth expertise of the payment industry in the main European countries. It covers the full value chain of payments, ranging from issuing, acquiring, terminals, card and non-card payment solutions and processing. The company delivers end-to-end payment solutions to support its clients better anticipate the major European regulatory challenges and optimise the performance of their end-to-end electronic transactions.
13.2.1 Payment/AcquiringAtos Worldline develops and processes tailor-made acquiring services for all types of payments. By acquiring, the Group understands: receiving electronic financial data from merchants related to a payment transaction, and processing that data. Atos Worldline expertise includes:
Payment transaction processing including central ■■
acquiring; Visa/MasterCard European commercial acquiring ■■
licence;Remote payments management;■■
Development of payment technology solutions;■■
Authorization servers, data collection management; ■■
Call center: contract, fraud and claim management;■■
Gateways to international card networks;■■
SEPA■■ (1) mandate and direct debit management;
Development, sale, renting, installation of payment ■■
terminals.
13.2.2 Payment/IssuingAtos Worldline develops and processes tailor-made issuing services for all types of payment. Issuing covers: processing and management of cardholders’ transactions. Atos Worldline expertise includes:
Card management system: debit, credit, corporate ■■
cards;Prepaid card, international co-branded cards, fuel cards;■■
Authorization servers; ■■
Call center management for cardholders, Cardstop;■■
Payment solutions dedicated to eCommerce: virtual ■■
cards, top-up accounts, 3D Secure;Contactless, mobile payment;■■
Real time fraud management.■■
13.2.3 Interbanking Payment applicationsAtos Worldline develops state-of-the-art interbanking payments applications, Real Time Gross Settlement and Account Clearing Houses solutions, widely deployed in Europe and worldwide.
13.3 eCS, eServices for Customers, Citizens and Communities
Atos Worldline has more than 30 years experience and expertise in the development of eServices for Customers, Citizens and Communities, including the development of tailor-made Customer Relationship Management (CRM) services fully combined with technology-driven multi-channel solutions (Internet, mobile and voice services).
The trends governing the eCS domain are a continuous appreciation by customers of consumer self-service facilities as they tie up fewer human resources and yet deliver higher user satisfaction. A second generation of tools serving ever new channels is about to be implemented, catering for a coherent, seamless and more engaging consumer experience. Huge quantities of data are created
on e-commerce, community and e-document platforms as well as e-mail systems; the need to store this data in a structured way is becoming more and more essential. Atos Worldline solutions help its clients optimize their client relations through all interaction channels.
13.3.1 Client Service Processes The services provided in this area are geared to improve the customer relationship, hence business performance of customers. They allow clients to interact with their customers across many channels (voice, web, mobile...). They also provide means to retain and up-sell to the most profitable customer segments and cater for business intelligence on user profiles and behaviour.
13 . Hi-Tech Transactional Services (HTTS)13.2 Payments services13.3 eCs, eServices for Customers, Citizens and Communities
13.2 Payments services
(1) SEPA: Single Euro Payments Area.

Atos Origin » Annual Report 2009 » 048
13.3.2 MessagingMessaging solutions represent secure core mail systems for ISPs and Telco and confidential communication channels for public and commercial organizations especially banks, complying with Basel II requirements. Messaging enables convergence of voice and mail channels and support “anytime, anywhere, any device” usage.
13.3.3 Web platformsWeb platforms are based on Web 2.0 internet content management systems on top of which are added dedicated business engines such as e-commerce applications or trading systems. In order to serve the nascent market of mobile internet, those platform functionalities have been extended to mobile devices and guarantee a perfect mobile internet user experience with all handsets available on the market.
13.3.4 digitization, trust and archiving servicesThese services foster the transformation of paper-based processes into e-document workflows (ex: e-Invoices). They offer state-of-the-art technology, compliant with European legislation on strong user authentication and electronic signature based on PKI (1). Storage and complex archiving processes round off the digitization value chain. As Trusted Third Party the company offers these services requiring highest infrastructure security, process expertise and regular certification as external service provider in a cost efficient way.
13.3.5 Financial Markets ServicesAtos Worldline expertise in Financial Markets covers global markets throughout the investment process - asset managers, private bankers, brokers and intermediaries; exchanges; clearing houses, CCPs (Central Counter Parties) and CSDs (Central Securities Depositaries).
The acquisition of the Capital Market and Post-Trade businesses of Atos Euronext Market Solutions in 2008 tremendously increased Atos Worldline’s expertise in order to face new market challenges and offer new solutions to cover the entire lifecycle of securities, investment funds and derivatives.
Based on its in-depth business understanding of the industry dynamics and its leadership towards new collaborative technologies, Atos Worldline turns its capacity for innovation into value-in-use solutions in the following domains:
Real-time market information;■■
Online brokerage and Innovative Front to Back office ■■
Services;Securities and Derivatives Clearing and Central Counter ■■
Parties (CCP) Solutions; Securities Settlement and Depositary Solutions; ■■
Advanced multi-asset Portfolio Management System.■■
13.4 Atos Worldline processing capabilities – key figures
Payment eCS Financial Markets
24 million credit & debit cards transactions 1.6 billion calls (IVR & contact centers)
255 million cleared positions
477,000 terminals
374 million remote payment 59 million e-mail boxes 250 million trade orders
2 billion acquiring transactions
30 million mobile phone prepaid 45 million loyalty cards EUR 400 billion assets under management
(1) PKI : Private Key Infrastructure, arrangement that binds public keys with respective user identities.
13 . Hi-Tech Transactional Services (HTTS)13.3 eCs, eServices for Customers, Citizens and Communities13.4 Atos Worldline processing capabilities – key figures13.5 HTTS : Hi-Tech Transactional Services: Pillars for Atos Worldline Development
13.5 HTTS : Hi-Tech Transactional Services: Pillars for Atos Worldline development
Core to the repositioning of Atos Origin’s growth strategy around its main domains of differentiation and of strong value added, Atos Origin Top Management has decided
to accelerate the development of its Hi-Tech Transactional Services activities, based on the highly differentiating assets and successful business model of Atos Worldline.

Atos Origin » Annual Report 2009 » 049www.atosorigin.com
13 . Hi-Tech Transactional Services (HTTS)13.5 HTTS : Hi-Tech Transactional Services: Pillars for Atos Worldline Development
13.5.1 The HTTS Business Model: a Further Way to deliver IT Value to customersAs previously detailed, Atos Worldline has developed over the years, a strong portfolio of differentiating assets and activities in the three domains of Electronic Payments, eCommunity Services and Financial Markets. A solid track record of sustained growth in these areas is the first pillar of the development ambition.
Furthermore, the profitable development of Atos Worldline since many years is based on its specific and successful business model, based on a strong production model, and innovative revenue model.
The production model is based around three core assets types:
A set of ■■ software assets, standard generic building blocks, common to many services and applications across the various markets, e.g., account and card management, messaging infrastructure, authentication, archiving, rules engine, publishing… A critical aspect of these building blocks is them being built within a common architecture and development framework, allowing interoperability and easy assembly to design more complex applications.A collection of ■■ business knowledge assets, concentrating the market expertise accumulated over the many years of partnering with the Group’s customers. These assets, developed from a base of the above mentioned software assets will be reused and enhanced between the customers and geographies in the specific market sector. Some examples of these business knowledge assets are Card Schemes, Fees Management, Mobile Internet Publishing, Rich Media management, e-Commerce sites.A base of ■■ industrial production asset core to the efficient end-to-end service delivery model of HTTS. Based on the significant effort by Atos Worldline teams into defining the appropriate optimal infrastructure and production architecture for secure, high-volume, scalable and compliant transaction processing, the production assets comprise the dedicated state-of-the-art data centers, associated service help desks, PCI compliant processing environments, with all security and archiving services. As a significant by-product, the industrial production assets have strongly influenced the design of the software assets, in order to ensure the applications developed deliver efficient and cost effective production costs, in a clear Build-to-Run approach specific to the HTTS business model.
The assets of the production model are designed to be able to be combined and recombined to solve the various requirements of its customers, and to be able to deliver additional services and innovation to its clients who are already customers of this model.
Leveraging this production model, Atos Worldline has also defined a specific revenue model, based on key business metrics aligned with the success of the service and of the customer’s activity, establishing thereby a strong partnership with its customers. Since revenues are based on volumes, aligned with the success of the offered services, Atos Origin shares both the risks and the benefits with its clients, and strives to provide low set-up costs for new services. This structuring pushes the Group to really align its services and the day-to-day collaboration of its teams with those of its clients, towards raising the quality and value for end-users, and increasing the user experience in order to create more and more volume every day.
In a nutshell, based on this industrial and yet flexible production model, and a revenue model based on creating a win-win partnership with its clients, the HTTS model is a further way to deliver IT value to Atos Origin’s customers, based on:
The full control on design & architecture of applications ■■
& services delivered; The processing of the services in controlled, self-designed ■■
and mutualised data centers;A strong focus on structured one-time development and ■■
reusability for multiple customer services;A price structured along business metrics relevant to its ■■
customers’ success;A framework of commitments aligned with the joint ■■
success of the delivered service.
13.5.2 Rolling-out HTTSConvinced by the strong growth potential of the HTTS model, the company has presented a solid ambition for its growth, disclosed during the Investor Day of June 12th, 2009. Besides the continued organic development of Atos Worldline in its current geographical footprint (Belgium, France and Germany), the level of ambition for HTTS – to double organically the HTTS activities in a 5-year period – is based on leveraging all the geographies of the Group where Atos Worldline is not operating today, the strong customer relations that have been built over the years by the local Atos Origin operations, and the various assets in payments and beyond which, very close to the successful business model of HTTS, were not yet under the industrial leadership of Atos Worldline.

Atos Origin » Annual Report 2009 » 050
13.6 Future developments
Anticipating the key technology and innovation milestones
For over 35 years, Atos Worldline believes innovation must be embedded in the very DNA of its organization and therefore has been implementing a strong strategy of anticipation of new technologies and uses. The “Worldline Innovation Network” (WIN) fosters innovation-friendly attitudes, perspective making, knowledge sharing and intrapreneurship. Innovations are highlighted and recognized internally through annual Innovation Awards.
Thanks to its sustained investments in R&D, Atos Origin has continuously demonstrated its ability to provide its clients with a reliable vision of the future so that they benefit from the leading-edge technical solutions and platforms. The teams are heavily mobilized to watch and test emerging technologies and to conduct pilot projects together with its customers.
The research covers all major domains related to mass transaction management: from strong security technologies to next generation networks, including human-machine interfaces, advanced internet applications, mobile and contactless devices, machine-to-machine, payment terminals and architectures, machine learning, voice over IP, application specific integrated circuits, natural language processing, social networks, digital identity management and multimedia content processing.
The Solution Centers leverage on the results delivered by the labs to develop and extend future-proof solutions and platforms based on a secure, powerful and highly scalable technical architecture relying on a unique combination of SOA, OOP and MDA approaches.
Since June 2009, several steps have been undertaken and the basic building blocks of rolling out the HTTS offering and business model to the other countries of the Group have been implemented.
In all priority geographies (all major European countries and Asia Pacific), a team responsible to carry HTTS development has been identified and mobilized. At the same time, within Atos Worldline, the support to help all these geographies in their HTTS development efforts has been structured and dedicated resources mobilized. At Group level, the required governance aspects have also been implemented to ensure joint effort and dedication of Atos Worldline and the Country management teams towards this strategic development.
With the support of Atos Worldline business development experts, each of the Atos Origin priority geographies for HTTS has been defining its target development markets and offers, based on its local strengths and current portfolio of HTTS activities. This approach, tuned to the specificities of each of the Atos Origin operations, was chosen to ensure a strong leverage on the existing customer base, and on the local organization, paving the road for future accelerated development after the first local customer successes.
Besides this internal preparation, critical to the future success of the HTTS roll-out, all the Country teams have also obviously been entering into new dialogues with identified prospects, delivering the strong benefits of this additional way to deliver IT benefits.
13 . Hi-Tech Transactional Services (HTTS)13.5 Hi-Tech Transactional Services: Pillars for Atos Worldline Development13.6 Future developments
Atos Origin » Annual Report 2009 » 051www.atosorigin.com
14 . Medical BPO
Medical BPO, a division of Atos Origin, combines the Company’s expertise in Business Consulting, Systems Integration, Managed Operations and Medical Services.
The company has over a decade’s experience of delivering and enabling IT, BPO and leading edge healthcare programs including: efficiency improvement, procurement of specialist health services, computer infrastructure hosting, software development, through to patient primary care, occupational health and disability assessments. Working with an extensive team of consultants, medical and technology professionals, the Group delivers modern healthcare solutions that contribute to the way care is delivered.
Medical BPO services are a central part of the ‘patient first’ approach which is being adopted as part of the program for transforming the UK health service. The investment over the last 10 years in establishing a consistent, high quality global service delivery capability, based on a methodology (ITIl) that ensures services are delivered effectively and reliably. Medical BPO provides increased patient choice and accessibility to the National Health Services (NHS) under the ‘Choose and Book’ program. Since its launch, over 20 million bookings have been made using the system.
Moreover, the company develops and communicates strategy, implements change and drives efficiency and quality improvements with the NHS to deliver sustainable change.
Medical BPO is the UK market leader in occupational health, covering the health and wellbeing of 780,000 employees. The Group’s clients include companies such as Rolls Royce or BP and the UK Government Departments of Health, Work and Pensions, and Justice. As an example of its success in this field in 2009, Royal Mail Group, supported by Medical BPO, won the 2009 BITC Example of Excellence.
Medical BPO is the sole provider of benefits related to disability assessments through the contract with the Department for Work and Pensions. Atos Origin’s DWP practitioners review over 17,000 cases per week.
With a team of more than 2,900 people, Medical BPO also runs a large GP practice and two Walk-in Centres on behalf of the NHS.

Atos Origin » Annual Report 2009 » 052
15 . Markets strategy
15.1 Public Sector & Health 05215.2 Energy & Utilities 05315.3 Financial Services 054
15.4 Telecom & Media 05515.5 Manufacturing, Retail & Transportation 056
15.1 Public Sector & Health
Thanks to the GAMA program, Atos Origin will be more and more developing aligned offerings based on strong industry focus and comprehensive Go-to-Markets, together
with a coordinated management of the business. This section summarizes its key positions and areas of development.
15.1.1 Trends in the Public Sector & Health Market2009 has been a stable, but turbulent year for Public organizations:
Central Government was challenged to support the ■■
Financial institutions; Focus on core activities is leading to smaller ■■
administrations and drive for innovation; Plans for major budget reductions are developed which ■■
will lead to new business models.
We live in a steadily changing world, and the public sector has to meet the challenges resulting from these changes. The proper functioning of the public sector depends on whether new demands can be met early enough and on whether changes made are sufficient. Complexity is the main challenge facing modern public organisations.
The role of the European Union is getting more visible and more important. The Lisbon Treaty provides content and is divided into five points, with a New European Parliament:
Better equipped for today’s challenges; ■■
Having more powers in shaping Europe; ■■
Tighter hold on EU’s purse strings; ■■
Greater say on who runs the EU;■■
Stronger voice for Europe’s citizens.■■
This increasing importance of Europe will significantly impact IT systems of domestic public organizations.
15.1.2 Atos Origin’s position on the Public Sector & Health MarketAtos Origin gets 28% of its Group revenues from Public organizations (Central Government, Local Government, Healthcare, Education and Defence). In Europe, Atos Origin has a strong footprint in the Public Sector Market with a good mix of Consulting, Systems Integration (professional services, projects and management) and Managed Services. The emphasis on the countries is slightly different, but gives a good position to leverage.
In Central Government, Atos Origin focuses mostly on infrastructure and application outsourcing and is a major provider of IT services for ministries in France, Spain, the UK and The Netherlands.
In Local Government, Atos Origin focuses mostly on all e-government related subjects. The solution developed by Atos Consulting is used in many municipalities and provides citizens an easy way to handle rules and legislation and communicate with the local government.
In Education, Atos Origin focuses on the implementation and management of Student Information Systems and introduced the term ‘Olympic Learning’.
In Defence, Atos Origin follows the ‘Defence way of working’ (joint and combined) and focuses on NATO related topics as Network Enabled Capabilities and Security.
In Healthcare, Atos Origin focuses on BPO, Shared Service Centres and Effective Management of the support processes.
15.1.3 Way forwardAs the Public organizations are facing major budget reductions and therefore have to focus on their primary tasks, Atos Origin aims at a growth (above market average), mainly based on its actual position and on its ability to leverage its solutions in the support processes by recognizing and using the influence of the EU. The specific vertical areas of expertise which will benefit in reaching this goal are:
Citizen management with the e-government solution ■■
(e-suite); Public Private Partnership; ■■
Governance and Risk Control for ministries and healthcare ■■
organizations; BPO for subjects as: tax assessment, granting licenses, ■■
granting social benefits.

Atos Origin » Annual Report 2009 » 053www.atosorigin.com
15.2 Energy & Utilities
15.2.1 Trends in the Energy & Utilities Market2009 still was characterized by various forms and levels of utility market deregulation. Some common trends can be drawn regarding challenges faced by utility companies in all geographies:
A strong focus on customer service satisfaction and ■■
customer relationship management;Impacts on the industry of regulatory pressure;■■
Regulations in the area of customer service levels, asset ■■
performance and country specific regulations.
The emergence of new ways of producing energy from solar power through to photovoltaic and wind turbines, together with the ”smarter” consumption of electricity through initiatives like electric cars and energy efficient homes, will drive major change in the market. These developments will force transport operators and distribution electricity networks to adapt their infrastructure and related IT management systems such as the smart grid and command control systems. The key focus will be the energy used and produced by consumers and the impact of that on the overall networks.
Furthermore, oil and gas suppliers are shifting to more remote and unstable locations. At the same time various issues are affecting the industry:
High fuel and labour costs;■■
Environmental pressures;■■
Use of a growing share of Green energies;■■
Volatile political scenarios;■■
Supply security concerns and increasing demand from ■■
developing economies.
All this is expected to produce a sustained focus on operational efficiency and on managing performance to improve productivity in the Energy & Utilities industry. However, this has to be done in an environment of growing competition and price instability.
Consumers have to focus on better managing personal costs because of sustained high energy prices. Large consumers are looking for access to the wholesale grids to services to manage the risks associated with variable energy costs.
15.2.2 Atos Origin’s position in the Energy & Utilities MarketIn mainland Europe, Atos Origin has a market share of 11% and is ranked 6th IT services provider to the Energy & Utilities Market, as more than 10% of Group revenues are coming from these industries.
With more than 2,000 skilled Energy & Utilities experts in dedicated global Centers of Excellence, Atos Origin offers solutions that cover the entire value chain globally. Atos Origin develops and maintains main European Gas hubs and is in charge of control and command systems for all French and some overseas Nuclear power plants.
Atos Origin is a major partner to most large and well established Energy & Utilities companies like EDF, GDF/Suez, Schlumberger, Endesa, Repsol, Total, Nuon, Vattenfall, Petrobras, Shell…
On top of the IT services that one may expect from one of the world’s leading IT services providers, Atos Origin offers very specific market solutions for Energy & Utilities such as Smart Meter Management, Nuclear Power Plant Operations Management, Field Force Management and Digital Oilfield of the Future.
15.2.3 Way forwardSince the expected IT spending growth in the Energy & Utilities market is one of the highest among all Markets, and based on the excellent position that Atos Origin has at a large number of leading, International customers, ambition for 2010 is to outgrow the market. In terms of IT services the company will further focus on Customer Satisfaction; Operational Efficiency; Smart Grid; Alternative Energy and realizing Mobility Strategy. Next to the strong geographical footprint in Europe, Atos Origin will further expand position in Asia Pacific and North and South America.
15 . Markets strategy15.2 Energy & Utilities

Atos Origin » Annual Report 2009 » 054
15.3 Financial Services
15.3.1 Trends in the Financial Services IndustryIn 2009, crisis has seriously damaged the Financial Industry:
credit demand and availability in the private sector has ■■
fallen sharply compared to 2008;credit write-down has exceeded USD 3,000 million on a ■■
global basis;market value of financial institutions has fallen by USD ■■
5,000 million.
While the cost of risks has increased, regulators are creating more prescriptive regulation on Financial Institution transparency, customer demands and the need to innovate are putting more pressure on margins, reflected for example by the rising number of price comparison Websites. Emergence of mobile banking and implementation of Single Euro Payments Area (SEPA) and MiFID are cutting down barriers to entry for new competitors.
As a result, Financial Institutions are focusing their investments to improve risk management and compliance, improve customer relationship and loyalty, better integrate their past acquisitions and local operations, streamline and consolidate their back-office operations and modernize their core IT systems both in Banking and Insurance.
15.3.2 Atos Origin’s position on the Financial Services MarketIn Europe, Atos Origin is the first outsourcing provider and eighth largest IT services provider to Financial Services Market. With 8,000 experts in Financial Services processes and technologies, Atos Origin gets 22% of its Group revenues from Financial Institutions in the Banking and Insurance sub-markets.
For Financial Institutions, Atos Origin manages mission critical systems, such as:
RTGS platforms and 255 million cleared position ■■
yearly;477,000 payment terminals and 2 billion acquiring ■■
transactions every year;Clearing and settlement for the major European equity ■■
and derivatives markets;Systems handling EUR 400 billion in investment assets.■■
In Banking, Atos Origin focuses mostly on Retail Banking and Corporate & Investment Banking and is a major provider of IT services to European leading banks like BNP Paribas, ING, Standard Chartered Bank, Fortis, Crédit Agricole, Commerzbank, Société Générale, Banco Santander, Dexia, La Banque Postale, LCH Clearnet, etc. In Insurance, the Group has reinforced its positions with major customers like Achmea, Manulife, Mass Mutual, UVIT, NFUM, Capita and Willis.
Beyond Outsourcing, Atos Origin provides end-to-end value-added services that successfully deliver innovation, complex transformational change and business outcomes through in areas such as: Target Operating Model design, solution implementation and integration for key business processes functions: eCustomer Services in Banking & Insurance, card payment services, information security, and operate services for business processes, IT applications and platforms.
15.3.3 Way ForwardAs Financial Institutions are still minimizing their IT investments, Atos Origin aims at a development based on the one hand on horizontal expertise in IT outsourcing and on the other hand on five vertical areas of expertise targeted to deliver innovative solutions that address the business challenges of its clients:
Customer management■■ : differentiation, retaining and growing the customer base with Online Services for Banking and Insurance, and Multi-channel platform;Operational excellence■■ : setting new standards in cost/income through use of leading core banking and core insurance systems, coupled with Lean business processes;Risk and compliance■■ : enhancing transparency and achieving compliance with more robust Enterprise Risk Management, meeting Solvency II regulation, improve controls through more effective Enterprise Content Management and information security;Business Process Outsourcing (BPO)■■ : to enhance customer service and deliver cost savings in non-core processes, such as: card payments, credit collection, insurance back-office processing;Financial infrastructure and solutions■■ : enhance business efficiency with robust and scalable solutions such as clearing & settlement, asset management, brokerage back-office solutions.
15 . Markets strategy15.3 Financial Services

Atos Origin » Annual Report 2009 » 055www.atosorigin.com
15.4 Telecom & Media
15.4.1 Trends in the Telecom & Media2009 has been a difficult year for Telecommunications Service Providers, and the Group has identified four major trends:
Mobile usage did further increase in 2009 driving the ■■
need for further network capacity extensions;The Average Revenue Per User (ARPU) remains flat. ■■
Increased focus on value-added services to compensate the continuing decline in voice revenues;Further consolidation of Telecommunication Services ■■
Providers;Globalization of operations (massification) for reducing ■■
production costs.
Flat ARPU while constantly increasing demand in network capacity are putting pressure on margins. Besides, more and more applications (incl. telecommunication application like voice communication) are moving to Internet-based delivery models. That raises the expectation that the underlying basic connectivity as well as communication infrastructure becomes more reliable as well as it enables anytime and everywhere availability of data services. The differentiating levers of a telecommunication service provider do increasingly move out of the core network capabilities into end-user devices/applications with this trend towards ‘IP based communication’. The emergence of wholesale business models and respective technical solutions for basic connectivity as well as basic/’no frill’ telecommunication services are cutting down the barrier to entry for new competitors.
As a result, Telecommunications Service Providers are focusing their investments on network capacity extensions as well as the deployment of next generation network components that allows them to effectively differentiate themselves in the future as well as to streamline and consolidate their operations (especial ly across countries).
15.4.2 Atos Origin’s position on the Telecom & Media MarketIn Western Europe, Atos Origin is one of the Top 3 outsourcing services providers and within in the Top 5 largest IT services providers to the Telecommunications Service Provider Market. With more than 4,000 experts in the processes and technologies of Telecommunications Service Providers, Atos Origin gets around 14% of its Group revenues from Telecom operators.In Telecommunication, Atos Origin focuses mostly on GSM and Fix lines telecommunication service providers and is a major provider of IT services to European leading companies like France Telecom, Vodafone and KPN.
Beyond Outsourcing, Atos Origin provides Telecommunication Services companies with value-added Systems Integration services like OSS deployments (e.g. next generation intelligent network as well as online charging system deployments), BSS deployments (e.g. provisioning and postpaid billing deployments) as well as corporate application deployments (e.g. ERP, CRM and HR systems).
Atos Origin has a particular focus on BPO services for Telecommunication Services companies where it for instance provides cost effective and efficient solutions for Business Processes l ike Voucher or Mai lbox Management.
15.4.3 Way forwardAs Telecommunication Services companies (especially in Western Europe) are still minimizing their IT investments, Atos Origin aims to accompany the market thanks to its horizontal expertise like IT outsourcing and three vertical areas of expertise:
Operational excellence around core processing streams ■■
like Billing and CRM;Deployment excellence for next generation OSS, BSS ■■
and CRM application stacks;Business Process Outsourcing (BPO) for standardised ■■
Business Processes.
15 . Markets strategy15.4 Telecom & Media
Atos Origin » Annual Report 2009 » 056
15.5 Manufacturing, Retail & Transportation
15.5.1 Trends in the Manufacturing, Retail & Transportation MarketFollowing the Banking sector, Manufacturing, Retail & Transportations were hardest hit by the 2009 economic crisis. Fuelled by the collapse of consumer demand, production and global supply chains were heavily impacted, with many coming to a complete halt. Especially manufacturing companies were focused on survival, aggressively reducing not only investments but also fixed costs, wherever possible. At the same time, many companies leveraged the 2009 period to sharpen their capabilities in sustainability, operational efficiency and customer intimacy.
Even in the scenario of a rebound of the economy at the end of 2010, Manufacturers, Retailers and Transportation companies will continue to do ‘more with less’, capitalizing on innovation and on efficiencies gained in the downturn as the fuel for growth and sustainability in the upturn. The fundamental business objectives of profitability and growth will prevail. Focus on cost control, cash management, maintenance of customer loyalty and compliance will broaden again to include a renewed focus on revenue growth and market share. Manufacturers will begin to invest and innovate with discretionary focus on winning new customers, developing new markets, products and services while raising the bar on quality and sustainability.
15.5.2 Atos Origin’s position on the Manufacturing, Retail & Transportation (MRT) MarketAtos Origin revenues from the Manufacturing (Automotive, Aerospace, Hi-Tech, Chemicals, Pharma and Consumer Packaged Goods), Retail ( including wholesale) and Transportation sectors combined, account for 25% of overall revenue. In terms of IT Services market potential, the combination of these sectors represent the largest global market, however its growth rate is quite moderate.
Embracing these economic and environmental challenges, Atos Origin supported its Manufacturing, Retail and Transportation customers in achieving their business objectives, from survival, to cost reduction, to improved operational excellence and increased customer loyalty:
Delivering rapid-fire business value assessments to ■■
identify, develop and prioritize initiatives to deliver immediate business value;Providing innovative Sourcing Solutions to enable ■■
customers reduce and eliminate fixed costs and capital expenditures, transforming them into SLA based pay-as-you-go services;
Enabling customers to sharpen expertise, capabilities ■■
and planning in core disciplines of Global Supply Chain Management, Production & Operational Excellence, Product & Service Innovation and Customer Loyalty & Brand Equity.
To maintain and extend Atos Origin’s leadership position in MRT, 2009 was leveraged to sharpen its expertise in key areas and sources of business value:
Sustainability: jointly with IDC■■ (1), the company published
a study “The Business Case for Environmental Excellence is Real”, and expanded its portfolio for Manufacturers, Retailers and Transportation companies;Manufacturing Execution Systems (MES): Atos Origin ■■
established in March a Center of Excellence, patented M4MES, a proprietary business value delivery methodology, and gained International recognition for thought leadership and expertise;Product Lifecycle Management (PLM): a Global ■■
partnership was signed with PTC in June, a Center of Excellence established in October, On-demand PLM Services launched in December;Supply Chain Management: domain expertise and ■■
proprietary solutions for logistics and warehouse management were further developed;Customer Loyalty & Brand Equity: global sourcing ■■
services (HTTS and Web 2.0) for customer loyalty, and branding programs for Manufacturers, Retailers and Transportation customers were expanded in the third quarter.
15.5.3 Atos Origin Way ForwardIn 2010, Atos Origin, with its unique skilled professionals in Manufacturing, Retail and Transportation systems and operations will continue to serve its world-class clientele including (but not limited to): Adidas, Ahold, Air France/KLM, Akzo Nobel, Alstom, Amadeus, ASML, Auchan, Canon, Paccar/DAF, DSM, EADS, Johnson Controls, L’Oréal, Lufthansa, LVMH, Michelin, NXP, Océ, Philips, PPR, Procter & Gamble, PSA, Renault-Nissan, Rhodia, Safran, and Sanofi-Aventis. The company seeks to maintain and extend its leadership in its core selected industries.
15 . Markets strategy15.5 Manufacturing, Retail & Transportation
(1) IDC: International Data Corporation, advisory and research group.

Atos Origin » Annual Report 2009 » 057www.atosorigin.com
16 . distinctive Offerings and Innovation
16.1 Distinctive Offerings program 05716.2 Offerings overview 058
16.3 Other Innovations 061
16.1 distinctive Offerings program
Atos Origin’s Distinctive Offerings (“DOs“) were launched in 2008. Each offering was carefully chosen as being an innovative and effective solution that reduces cost, adds value and creates a competitive advantage. These offerings continue to form a key part of the Company’s strategy and are selected by a Global Innovation Board. For 2009 a thorough review was carried out and some minor adjustments have been made which are described below.
For each ‘DO’ a global Champion has been appointed, managing the solutions by continuously reviewing the business cases, securing the launch of the offerings on a global basis, looking out for new opportunities, but also the training and collaterals required for the sales force.
In 2009 the Distinctive Offerings program was extensively professionalised and this showed results with a double digit growth, despite the very difficult economic conditions. In 2009, strong performance was realised in offerings such as Adaptive Workplace, Identity and Security Management and Nuclear, and also in countries such as the UK, France, NAM and ASIA. For 2010, the Group ambitions to increase again the part of the business based on Distinctive Offerings.
Both internally and externally, the awareness of the sales community and clients or prospects on the ‘DOs’ has increased significantly, and the company developed a solid communication strategy. The offerings were launched on the corporate website (as Key Solutions) and extensive marketing collateral was developed for each offering as well as many thought leadership articles and whitepapers and a comprehensive internal sales guide.
Training has been another key area in which a lot of time and energy has been spent in order to promote to the sales (and delivery) force about the value of the Distinctive Offerings. Training programs were evaluated as very effective by the participants. Distinctive Offerings workshops have been organized on a six week basis in Germany and Central Europe, Belgium, France, UK and the Netherlands. Overall more that 750 sales people have been successfully trained, using as well e-learning techniques, and the global Distinctive Offerings community is now one of the strongest communities within Atos Origin.
Sustainability will become a strong element of the Distinctive Offerings portfolio of Atos Origin, leveraging the effort to be in line with its own CSR. In 2009, the Company has developed and promoted several new technologies. As a leading IT services company, Atos Origin can also support future developments in areas such as faster processing, lower energy consumption, greater efficiency and miniaturization of components may continue or leverage scientific innovations such as Control and Command for Complex systems (Smart-Grid, energy efficient buildings, and traffic management), Alternative Delivery Models, collaboration and knowledge management, and decision support systems. Therefore the objective is to be a globally performing IT services company and recognised as a credible, trusted and sustainable player.
In April 2009, Atos Origin won the prestigious Novell award “Best EMEA Partner of 2008 for Identity & Security Management (ISM)”. The award was won based on Atos Origin’s consistent quality delivery across the region, proactive support with customer wins and effective implementation of Novell’s Identity & Security Management technology with customers across all market sectors in EMEA.

Atos Origin » Annual Report 2009 » 058
16.2 Offerings overview
This section illustrates the Distinctive Offerings developed by Atos Origin and perspectives.
16.2.1 Nuclear Instrumentation & ControlAtos Origin provides Nuclear & Utilities customers with proven monitoring and command control systems, simulation and predictive maintenance platforms in a design-build-operate of fering, building on strong partnerships with leading players. Here Atos Origin’s solution, ADACS, is the leading on-line computerized command control solution. This approach has been recently recommended by the International Atomic Energy Agency as the state of the art approach for safety procedures.
2009 Achievements: as well as new business in France and the Netherlands, the main focus has been on China: two contracts have been signed for the delivery of two pairs of Digital Control Systems (DCS) to CNPE (China Nuclear Power Engineering) and also for the delivery of two full-scope simulators. The Group has also established the BTPC (Beijing Technology and Projects Center).
16.2.2 Smart Metering Atos Origin’s Smart Metering solution is a real-time, full information system and telecommunication infrastructure providing:
Remote and daily acquisition, configuration, maintenance ■■
and operation of industrial and residential smart meters;Meter data management up to smart grid and consumer ■■
information functions;
2009 Achievements: Atos Origin leads one of the world’s largest Smart Metering projects, for ERDF. In France, the company has delivered the specification documents that will allow ERDF to issue international open tenders to purchase Smart Meters and Smart Concentrators. It will also provide an interoperability test lab for ERDF. In Spain, the Atos Origin consortium won the OpenNode Smart Grid Project for the European Union (7th R&D Framework Program).
16 . distinctive Offerings and Innovationn16.2 Offerings overview
Public Sector & Health
Financial Services
SEPA
Cards Payment
Manufacturing, Retail
& Transportation
SAP MMT
AAM (MES)
Energy & Utilities
nuclear I & C
Smart Metering
Telecom & Media
Billing
nGIn
Enterprise Content Management (ECM)
SAP Move
Adaptive Workplace (AWS)
Testing & Acceptance Management (TAM)
Identity, Security and Risk Management (ISRM)
Consulting, Systems Integration, Managed Services
Atos Origin » Annual Report 2009 » 059www.atosorigin.com
16.2.3 Telecom Billing Atos Origin is unique in providing telecom operators with IT services to design, implement, integrate and operate real-time, pre- as well as post-paid, Customer Care and Billing Systems (CCBS). The innovative unit price-based engagement model by Atos Origin is offered in combination with a strict focus on TCO reduction of the convergent CCBS solution. This makes it a highly tailored value proposition for next generation deployments and legacy consolidation programs.
2009 Achievements: This year Atos Origin deployed its first real-time and convergent rating solution based on standard off-the-shelf IT hardware and software components. The Company also upgraded its refined technical value proposition in the convergent billing domain with an innovative unit price based commercial engagement model.
16.2.4 Next Generation Intelligent Networks (NGIN)Atos Origin provides telecom operators with Next Generation Intelligent Networking platforms that allow traditional Value Added Services to be supported in a both existing GSM infrastructure as well as new networking infrastructure (IMS – IP Multimedia Subsystem) while facilitating the introduction of new services going forward. The NGIN is oriented to enabling Telecom operators to attract new business customers and raise the ARPU from existing customers.
2009 Achievements: The main signature was a contract with a leading telecom company based on its proven track record in five earlier reference sites. Atos Origin has six NGIN customers in the client’s Group covering Spain, Czech Republic, the Netherlands, Greece, Ireland and Germany. The Company also extended its strategic relationship with Ericsson to build a winning solution using advanced service technology.
16.2.5 SAP MMTAs a strategic partner of SAP, Atos Origin’s “Maximize Manufacturing Together” offering assists enterprises in optimizing their business processes to achieve more business value. It does this through IT simplification and flexibility, and by focusing on optimizing and transparency in planning, scheduling, sequencing, executing and monitoring business processes within manufacturing industries. This will lead to higher profits as a result of designing, implementing and operating a SAP landscape. Each sector in Scope, Chemicals, Oil & Gas, Hi-Tech and CPG, is supported by a Centre of Expertise which provides worldwide support. This ‘DO’ now incorporates all the business related to Distinctive Offering SAP MOVE. Based on its experience in 2009, the Company has decided to combine the expertise and capabilities of the SAP MOVE
‘DO’ within the existing SAP MMT ‘DO’. All previous activities will now be strengthened in one offering.
2009 Achievements: a five-year contract with Lekkerland which includes SAP ERP Application Management services and projects. For Novus International Atos Origin is conducting a global SAP ERP Chemicals Best Practice (CBP) Implementation, Organizational Change Management and Hosting Services program. Within MOVE, the major win was an upgrade to SAP ERP 6.0 for a major Telco operator.
16.2.6 Atos Agile Manufacturing (AAM) Formerly Manufacturing Execution Systems (MES), this ‘DO’ was renamed in mid-2009. AAM assists manufacturing clients in reaching their business objectives such as Innovation Excellence, Manufacturing Excellence, and/or Supply Chain Excellence. Based on a unique method, developed within its AAM CoE, solutions like SCE, MES, LIMS, PLM and Asset Data Management are tightly linked to these business objectives making the value directly visible (Business Case approach). The approach also covers the capability to implement, deploy and integrate these Manufacturing IT solutions with a Business IT landscape (incl. ERP).
2009 Achievements: In the UK the Group undertook Consulting & Software Selection for EADS Astrium UK, the first EADS entity to adopt a packaged approach on MES. Other projects included the implementation of Maximo for railway maintenance for Renfe Integria, a product track and trace system for Air Liquide, and the software selection and detailing of requirements for Fokker Aerospace NL in the Netherlands.
16.2.7 Payment Services and SEPA (Bank Payments)Atos Origin assists customers (from retailers to banks) to optimize their payments, via card (issuing and acquiring) and non-card (credit transfer/direct debit) by increasing flexibility and reliability. Its services cover design-build-operate using solutions preferably developed by Atos Origin (mainly Atos Worldline) independently from vendors, but in some cases best of breed packages.
SEPA Distinctive Offering increases Atos Origin’s business and capabilities in the area of bank payments through providing cost effective, innovative solutions that meet customers’ requirements around Compliancy and Control in this domain. The SEPA offering comprises a wide range of bank-related payments solutions to financial institutions, corporate and public administrations. Solutions vary from advisory (Payments Strategy, SEPA CT-DD/PSD Compliance, and Financial Supply Chain) to transaction based solutions and services including SWIFT connectivity, SEPA DD mandate management and its Financial Flows CenterTM model.
16 . distinctive Offerings and Innovation16.2 Offerings overview

Atos Origin » Annual Report 2009 » 060
16.2.8 Enterprise Content Management (ECM)Atos Origin assists large private enterprises or public bodies to address issues related to Compliance, Collaboration, Costs & Communication for all types of multimedia information management needs through a comprehensive set of integrated consult, build or migrate, and operate services. Here several packages are used, based around strong partnerships with EMC-Documentum, IBM-FileNet, and Microsoft-Sharepoint.
2009 Achievements: Atos Origin delivered improved communications between justice institutions and police stations in the UK to enable cases to be concluded much more quickly. This had lead to prisoner management cost reductions. For a leading insurance company, Atos Origin also implemented a solution improving the efficiency of primary processes by 20%.
16.2.9 Adaptive Workplace Adaptive Workplace is the range of solutions that Atos Origin provides to move from any existing workplace environment to an end user-centric managed workplace providing access to any application regardless the way it is delivered (rich client, server based application, SaaS, Online services, hosted virtual desktop or streamed applications) and identity/security related services. Adaptive Workplace flexibility comes from the way Atos Origin delivers the services through picking the modules which are standardised to reduce cost and increase quality. Green Desktop will offer architecture choices that provide the best balance of performance and efficiency, selecting and configuring devices to behave in an efficient way or adopting new operating systems, such as Windows 7 where Microsoft claims savings of up to USD 50 per device each year. Other approaches include unified communications to avoid business travel and areas such as product retirement and disposal must also be considered.
2009 Achievements: a major contract aiming at managing all NXP’s workplaces worldwide. This covers some 16,000 seats, of which around 1,800 are in Asia-Pacific. Here Atos Origin and NXP will work with jointly agreed KPIs including systems availability, continuous service, cost reductions and output performance levels.
16.2.10 Identity, Security and Risk Management (ISRM)Atos Origin’s ISRM offer covers professional services, business consulting, identity & access management capability and managed security services. Atos Origin offers an end-to-end capability and vendor independent approach, even though the Company leverages its strong partnerships with RSA and Novell, Microsoft and SAP. The focus is on integrating security and compliance solutions within the existing enterprise process and technology model. It should be further extended to contain security compliance management, security risk management, security operations management, security perimeter management, identity and access management, security technical advisory and Governance Audit Compliance Risk Management. This will enable Atos Origin to better assist organizations to protect the degree of trust that their customers have in the integrity and reliability of their information based services by integrating information security and regulatory compliance controls into the business and IT environment of its customers.
2009 Achievements: For Network Rail in the UK, Atos Origin provides the secure architecture and ongoing security management for the External Services Gateway (ESG) and is also working with the UK National Biometric Information Service to provide integration and support services which enable the next generation of biometric passports and the National Identification Card. In Germany, the Group works with ITSG to leverage its TrustCentre services to protect the privacy and integrity of data for hundreds of thousands of health insurance customers.
16.2.11 Testing & Acceptance Management (TAM)These services are helping clients at improving the way they perform tests (from business process validation to IT operation tests) through a unique seamless solution including the move from Development to Operation relying on a process-based approach. TAM provides risk identification and mitigation, impact assessment of evolutions, testing and quality application industrialisation & outsourcing of the testing chain: reduced time to market, cost and increase reliability.
2009 Achievements: A Product Assurance Solution for a client’s CRM Information System, involving offshoring to India to deliver the client’s cost reduction target. The company also defined, built and currently runs an internal SAP Testing Centre for a large upgrade program for a French Automotive Group and also concluded some major projects with several customers in Telecom and Finance Markets.
16 . distinctive Offering and Innovation16.2 Offerings overview

Atos Origin » Annual Report 2009 » 061www.atosorigin.com
16.2.12 Cloud servicesFrom now on, Atos Origin promotes the Cloud services as a Distinctive Offering. The Group will provide Cloud services either by hosting Customers on their Private Cloud, or on an Atos Origin shared cloud platform which is scalable on-demand, or by providing secured access to third-party Cloud services providers and integrating them into a customer’s IT then orchestrate and manage the day to day operation. The Group also has and will continue to develop some focused Software as a Service (SaaS) and Business Process as a Service (BPaaS) offering to cover the full scope of Cloud services: Infrastructure as a Service, Platform as a Service, Software as a Service and Business Process as a Service.
Green Cloud Computing■■ will become an integral part of the portfolio: Green Cloud Computing offers IT applications with zero footprint and a consultancy service. Offsetting would be certified by an external partner (i.e. The
Carbon Neutral Company) and the consulting service would look at areas such as Carbon Footprint Abatement Programs, the economic implications and the Business Case.Green Hosting■■ : Applications will be hosted in an environmentally-friendly way. In order to further decrease the carbon emitted by the hosting operations, Infrastructure Transformation projects can improve the carbon footprint by acting on three factors: the direct energy consumption of IT elements, data centre efficiency, and power sourcing. Carbon neutral Hosting■■ : the hosted application contributes to saving more carbon tons than is actually emitted by its hosting operations. This situation can be reached either by assessing and measuring the environmental benefits of the application, or by buying carbon credits to offset the carbon emissions from the application.
16.3 Other Innovations
Passion for Innovation: turning new ideas into real business value.
Global trends have created the need for a new 21st Century operating model where innovation is intrinsic to every process within an organisation. That is why Atos Origin’s innovation process is a continuous process.
The Group’s commitment to Innovation, collaboration and partnerships is a mean of guaranteeing commercial success, sustainable growth, and as a vehicle for conquering new areas and business models with customers, partners and markets: client oriented innovations based on ‘unresolved’ client issues, product innovation, based on client needs, market pull, internal improvements and/or cooperation with technology partners based on their new products and/or services.
Innovation is one of the key missions of GIBS, the new global corporate group in charge of Group Innovation Business Development and Strategy (GIBS). This group is also in charge of managing centrally the relationship with its global business partners and is working very closely with the Scientific Community.
An important part of the innovation process is formed by managerial issues, the ‘governance’ of the innovation process, where sustainable innovation is orchestrated: focus, maximisation of the roll-out of innovative assets, re-use of
knowledge, resources and experiences, sustaining company’s distinctiveness on its portfolio and putting sustainable innovation into motion with the Group’s customers, partners and collaborators locally and globally.
In Atos Origin innovation process, there is a clear route from on-going STEP (Social, Technological, Economic and Political) scouting trends and opportunity recognition, proof of concepts (POCs), to the creation of a solution and its eventual exploitation.
All innovations are recorded and evaluated by standard Atos Origin innovation criteria. These criteria are related to client demand, market developments, business cases, business models and delivery requirements and capabilities. Atos Origin has now a systematic, business-market-oriented approach to innovation, improving capabilities to create new value in new ways, and ensuring that innovation strategy is aligned with corporate strategy and market demands.
Atos Origin launched its Innovation Management Platform 2.0 on October 2009. On this new platform, all employees are invited to share ideas on innovation and other organizational topics. The launch of the platform and the communication and training deployed around this launch will be a significant accelerator to spread the innovation culture throughout Atos Origin in 2010 and the years to come. A strong attention was given during 2009 to improve the overall innovation capabilities of the countries, improve
16 . distinctive Offering and Innovation16.2 Offerings overview16.3 Other Innovations

Atos Origin » Annual Report 2009 » 062
knowledge sharing, establish better ways to collaborate and boost cross-fertilization among all Atos Origin service lines, resulting in a much stronger and inter-connected innovation eco-system.
16.3.1 LOOK OUT, the new thought leadership briefing
Removing the hype and presenting a pragmatic view of the art of the possible
LOOK OUT, launched in May 2008, is a new, annual, international trends report powered by Atos Origin eco-system. It provides an at-a-glance summary of the opportunities and obstacles that businesses can expect to see in the short, medium and long-term. LOOK OUT is compiled by analysing emerging STEP (Social, Technological, Economic and Political) trends to develop a picture of market needs. The findings are ratified by Atos Origin team of experts with clients to verify what is realistic, what is not and what an appropriate level of risk is. LOOK OUT is a single and independent analysis of these trends, helping both Public and Private Sector organisations to make key decisions about their business and especially to drive innovation so that they can gain competitive advantage.
Fully revised each year, the LOOK OUT 2009+ focused on how innovation can deliver true business value even in recession. It revealed how some companies were using such tools as Crowdsourcing (1) and Business Modelling for a fully business-oriented approach to innovation and are moving towards fully embracing SaaS and Cloud Computing.
The fact that Atos Origin can draw on such a large and diverse group of contributors who are willing to share their knowledge, experience, and passion, and who are also in close and regular contact with the real players and decision makers in the market, makes this a particularly valuable research tool.
16.3.2 Customer Innovation Workshops and EventsDuring 2009, Atos Origin has conducted a great number of innovation workshops and events with customers and partners. Those workshops and events, along with proven proofs of concept, are essential success factors for product and service innovations, which also permits lasting relationships with all innovation stakeholders, their incorporation into its innovation eco-system and enables new ideas to be created that will give the Company on-going opportunities for innovation.
Building on the LOOK OUT knowledge, Atos Origin continuously looks to achieve this for clients through normal day-to-day relationships with organizations through to more innovation-focused activities, such as:
Innovation Consulting – helping organizations with ■■
Innovation Strategy, Innovation Management, Innovation Boosting, and building sustainable innovation processes, governing mechanisms, and an effective innovation culture;‘So What?’ Workshops – gaining insight into selected ■■
technology and/or business trends. Find out what it is, what the fuss is all about, what the benefits are, what is really going to happen;Innovation Insights Workshops – stimulate and provoke ■■
thinking around how organizations can leverage emerging technologies and trends. Building scenarios, helping organizations to gain insight into the future of their industry and the impact on their firm. Seeing, sharing, discovering trends in the market and f inding out possible scenarios.
(1) Crowdsourcing : Refers to a high number of contributors.
16 . distinctive Offering and Innovation16.3 Autres innovations

Atos Origin » Annual Report 2009 » 063www.atosorigin.com
17 . The Scientific Community: the 2014 journey
The Scientific Community is currently a network of some 50 members, representing a mix of all skills and backgrounds, and coming from all geographies where Atos Origin operates. Its aim is to help Atos Origin anticipate and craft its vision regarding upcoming technology disruptions and the new challenges facing the industry. By making this vision available to its clients, and by investing on the related findings, Atos Origin intends to help its clients making the most critical choices regarding the future of their solutions. In 2009, the Scientific Community has studied ten key identified challenges for its industry and its clients. In addition, the Community is working on eight building blocks as user interface, process, context, social graph, data brokerage, …, which combined with the ten challenges constitute the five-year vision for Atos Origin called ‘Journey 2014’.
Alternative Delivery Model is reflecting the current trend also called cloud computing and Software as a Service. Initiated with the delivery of commoditized standard applications (mail, collaboration and office tools) the new model will gradually prevail. It will be based upon a service delivery through Internet, paid per use and regulated by service level agreements. Recent announcement by Microsoft and Google may outdate rapidly the conventional model of software licensing and maintenance fees. ERP, CRM and BI will soon follow as well as smart transaction business in all standard processes (payment, e-service, e-commerce, etc.).
The new delivery model will gradually apply to a new generation of applications which will use note books and smart phones as end-user devices. The ubiquitous delivery will facilitate the emergence of context aware applications which can be used either in working or in private environment with ability to know user location to localize him, to know his device type and network capability, and via ambient smart objects.
User Interface in the mean time will gradually take advantage of multi-touch screens, motion capture feature and enhanced graphics using consumer electronics advances in Infotainment and Gaming. In addition to location, Applications will benefit of the knowledge of the Social Networks to which the user belongs; either for Collaboration purpose at work or for grouping Community of interest, the social network will be a major disruption in the way IT experience will be perceived.
In the collaboration context, Business Process Management will gradually become the main vehicle to make sure that Lean business processes (as required by company objectives and practices) can be translated in executable business logics; combined with next generation of user interface, knowledge of user location, context and social network, executable business processes will radically change the user experience related to IT. A specific class of application in collaboration mode will be Decision Support which will enable business groups to take collective decisions respecting agreed procedures while making full use of IT.
Finally, the environmental pressure to reduce carbon footprint will drive towards Green IT in its dual aspects: Green for IT to reduce CO
2 emission due to IT and IT for Green as one of the most significant lever to address climate change.

Atos Origin » Annual Report 2009 » 064
18 . Corporate Social Responsibility
18.1 Making IT work for business and the environment 064
18.2 Confirming a strong commitment to Corporate Sustainability 065
18.3 2009 achievements 066
» 2009 Objectives and achievements
18.1 Making IT work for business and the environment
Atos Origin believes that sustainability and respect for the environment is not simply a matter of fashion. The world in which we all live and work is essential for our collective future and has rightly become a strategic axis of corporate management. A recent study developed jointly with IDC (International Data Corporation) showed that fostering sustainability increases productivity and profits, and that companies with mature sustainability programs enjoy 2% higher profit margins. So sustainability is here to stay, as a priority for individuals, governments and corporations.
Recent reports clearly indicate that Information Communication Technology (ICT) can make a significant contribution to reducing the carbon footprint generated by our own and other sectors. Studies show that currently IT accounts for about 2% of total CO2 emissions globally. At the same time, it is suggested that IT holds one of the major keys to reducing the remaining 98% of CO2 emissions. According to the Global e-Sustainability Initiative, “ICT’s largest influence will be by enabling energy efficiencies in other sectors, an opportunity that could deliver carbon savings five times larger than the total emissions from the entire ICT sector in 2020.”
So the dilemma is two-fold; on the one hand there is a need to reduce CO2 and other greenhouse gas emissions that are created by the IT industry (Green for IT) and that appear to be driving climate change, while at the same time we can use our skills, resources and technologies to help the world become more sustainable (IT for Green). In 2008, The Climate Group estimated that the use of ICT could save up to 15% of CO2 emissions by 2020, which translates into EUR 600 billion of energy cost savings in areas such as
saving energy and material consumption in industrial and business process, energy distribution, vehicle emissions, building controls, and everyday work and living.
Despite the uncertain outcome of the United Nations Climate Change Conference in Copenhagen in December 2009, it is clear that businesses and organisations will have to act now to change their operations and processes in order to reduce carbon emissions and to meet the new agreed targets. The pressure on the IT industry to support sustainability and help future–proof organizations is likely to increase steadily and here technologies have a key role in enabling the transformation to a more sustainable operating model.
Furthermore, energy today is being effectively subsidised. When carbon taxes, the level of tax per ton of CO2 emitted, are agreed, the transaction volume on Global Exchange Markets in London (ECX for future) and in Paris (Blue Next for contracts) are likely to dramatically increase and interest in Green IT will see a quantum leap. Stakeholders expect organizations not only to anticipate and align with the new economics and greener strategies and policies, but also to be a pioneer in bringing about IT enabled transformation and behavioural change in its approach and attitudes to sustainability.
Sustainable development is a growing challenge for all businesses and, as a leading international IT services company, Atos Origin is of course aware that it shares in the responsibility. Service providers such as Atos Origin have an important role to play in two key ways. The
Company can help reduce the impact of its own operations on society and environment, and, through its sustainable and green solutions, enable its clients to aid their own transformation towards sustainability and optimizing their environmental efficiency.

Atos Origin » Annual Report 2009 » 065www.atosorigin.com
18.2 Confirming a strong commitment to Corporate Sustainability
As a world-class Company, Atos Origin is committed to achieving responsible growth within our organisation and in the way Atos Origin serves its clients. This forms an essential part of the Group overall strategy as it involves deploying best ethical practices at business, social and environmental levels within the Group, its operations and among its stakeholders.
Atos Origin’s sustainability vision is based around recognition of major international responsibility charters, policies to reduce its carbon footprint, and innovative product offerings that meet and anticipate the demands of its clients and their desire to improve their own sustainable performance.
The Group believes that all the measures tested in-house are fully transparent and that they enhance its credibility in the marketplace. In all its core competencies – Hi-Tech Transactional Services, Consulting, Systems Integration and Managed Services – the Company performs assignments in which sustainable development issues are increasingly front and center.
18.2.1 Sustainability at the core of Atos Origin’s strategy and Business ProcessesIn early 2009, as part of the Group’s TOP (Total Operational Performance) Program, the Sustainability Project was launched. The program falls under the responsibility of an international team representing countries where the Group operates, its global service lines and corporate functions in order to leverage capabilities, local initiatives and facilitate uniform implementation. Led by the Group’s General Secretary in charge of Corporate Responsibility, the program enabled the Group to formalize its in-house sustainability policy which is designed to allow to:
Operate in compliance with sustainable best practices ■■
and international standards and anticipate new European regulations;Commit to regularly report on sustainability achievements ■■
following international reporting standards;Continue to invest in and develop People (Talent ■■
Management, Diversity schemes);Improve environmental performance, through ISO 14001 ■■
certification process of the Group data centers and company sites by 2012 and the reduction of the Green house gas emissions and energy consumption;
Accompany clients on their journey towards environmental ■■
excellence and help them optimize their environmental efficiency through sustainable and green solutions.
18.2.2 Adhering to and complying with international standards
Global Reporting Initiative Partnership (GRI)
In 2009 Atos Origin decided to join the Global Reporting Initiative (GRI), a first experience for software and computing services company. In 2010 Atos Origin will, for the first time, report globally its sustainability achievements under the world’s de facto standards in sustainability reporting. In this respect, Atos Origin has measured its own carbon footprint and reported to the Carbon Disclosure Project (cf. section 18.3.1). This constitutes a major decision that directly impacts the driving and communication of its work and operations and implies the commitment to a clear policy, the communication of its objectives and ways of acting, and the publication of its work in a clear and quantitative approach.
United nations Global Compact Adherence
Atos Origin operates in accordance with a Code of Ethics and in compliance with the United Nations Global Compact’s ten principles concerning human rights, labour practices, environmental standards and anti-corruption policy. In 2010, the Group will officially join United Nations Global Agreement to reinforce its level of commitment: Atos Origin will have to communicate its achievements annually to the UN, based on the ten key principles of the Agreement.
Membership of Leading Organisations and Think Tanks
Atos Origin’s ambition consists not only in achieving environmental excellence, but also in rallying and prompting its stakeholders to adopt best practices, while developing high expertise level. In support of its goals, Atos Origin is an active member of organizations that take action to promote sustainable development on a national, European or global level. For example, Atos Origin is an active partner of the Green Grid, a consortium of IT manufacturers and users, who have committed to reduce energy consumption in data centers by 10% by 2011.
18 . Corporate Social Responsibility18.1 Making IT work for business and the environment18.2 Confirming a strong commitment to Corporate Sustainability

Atos Origin » Annual Report 2009 » 066
In France, Atos Origin (as a member of Syntec Informatique(1)) participated in the Green IT think tank launched by Christine Lagarde (Minister of Economy, Industry and Employment) and Luc Chatel (Secretary of State for Industry and Consumption) in January 2009. The aim of this group is to encourage the eco-responsible use of ICT.
Since the start of the year, the company has also participated in a project to publish a review on the theme of Green IT in collaboration with Syntec Informatique and
the key players in the ICT market. Atos Origin coordinated the publication of the 1st report focussing on “Green IT & Dematerialization”.
“This IT services giant has a major new focus on sustainability consulting driven by its new CEO. The firm will support clients’ green initiatives and has a showcase engagement as the lead IT provider for the London 2012 Olympic Games, which will have a prominent green hue.” (Forrester)
18.3 2009 achievements
Some of the Group’s activities and achievements are described below. For full details, please refer to our 2009 Corporate Responsibility Report.
18.3.1 Atos Origin’s green transformation results
Assessing the impact of its activities on the environment
In 2009, Atos Origin launched a Global Carbon Footprint Abatement Program (CFAP) at Group level in order, for the 1st time, to measure and report its own carbon footprint to the Carbon Disclosure Project. Direct and indirect CO2
emissions were considered and the Greenhouse Gas (GHG) Protocol (global standard) was used to calculate the Carbon Footprint. The aim of this programme was to:
Get a first inventory of Atos Origin’s Carbon Footprint;■■
Identify the main source of emissions and potential ■■
reduction levers;Set up a corrective action plan to abate CO■■ 2 as from 2010.
As a result of measuring our carbon footprint we decided to lead several targeted carbon audits. For instance, through our partnership with O2 France and the ADEME, in 2009 we established a carbon balance that assessed our datacenter settled in Aubervilliers, Atos Origin being the 1st IT Company in France to do so. This audit showed that our actions have to be focused not only on energy, but also on the carbon footprint of the computing infrastructure. The efficiency of this strategy invites us to widen this approach to other corporate key sites. In the United Kingdom we worked with AECOM and Carbon Trust to measure the carbon assessment of our UK activities.
In order to reduce, as much as possible, its greenhouse gas emissions, the Group is now using more and more renewable source of energy. For instance, in UK, more than 70% of energy-consumption has been green energy since 2008. Atos Origin is now incorporating this green energy approach in its datacenters implementation strategy.
Launching an ISO 14001 Certification Process
Our Environmental Management System program (ISO 14001) is decisive in this process. At the end of 2009, 20 sites were certified, including datacenters. The Company will expand its efforts in 2010 in France, the UK and Germany. For further details, please refer to the Corporate Responsibility Report.
Deploying Sustainable and green Policies worldwide
At Atos Origin, we have also adapted our corporate processes in order to incorporate an environmental approach:
One of the most significant actions is the setting up of a ■■
Responsible Purchasing Policy for the whole Group. This policy integrates sustainable development as a criterion to choose its suppliers (objective: average weight 10%). In collaboration with Ecovadis, the Company has assessed the societal and environmental performance of many of its providers.Green Travel Policy■■ - Atos Origin has implemented a new travel policy which strongly encourages employees to use more environmentally-friendly means of transport such as the train (rather than air transport) or public transport; and limit the number of individual business trips – wherever possible – by using information technology resources, such as videoconferencing, telephone conferences, instant messaging and other collaborative working tools.
18 . Corporate Social Responsibility18.2 2009 – Confirming a strong commitment to Corporate Sustainability18.3 2009 achievements
(1) French association of software and computing services companies.

Atos Origin » Annual Report 2009 » 067www.atosorigin.com
18 . Corporate Social Responsibility18.3 2009 achievements
“Smart” or Green Fleet Car Policy■■ - (reduction of car size and g CO2/km) Legislation on CO2 emissions and associated tax charges are reflected by Atos Origin in the Lease prices available to employees. The company is actively encouraging drivers to use cars with emissions below 120g/km CO2. No car with emission above 120g CO2/km is allowed from 13 February 2010 onwards.Global Waste Management policy■■ - A global waste management policy is being implemented worldwide accompanied by the mobilization of both the employees and the management staff.
Green datacenters
More than half of the greenhouse gas emissions for the Group come from its 50 datacenters, which host tens of thousands of servers. So in 2009, the Group implemented the European Code of Conduct on datacenters Energy Efficiency (called Green Grid) and it continued actions carried out in 2008 to improve its environmental performance, in order to make each datacenters more energy efficient; to optimize the energy consumption of hosted components by implementing low energy-use solutions, eliminating unnecessary redundant servers, identifying under-employed infrastructure and equipment that remains powered up when not in use, and reducing the number of components through virtualization.
In addition to the internal efforts, the company has built new partnerships with strategic companies such as VMware, Intel and soon Schneider Electric. Atos Origin is currently doing everything possible to make its datacenters a model in terms of environmental performances. The Group received a prestigious innovation award ‘EMEA North Partner Award 2008 for most innovative use of virtual infrastructure’ at the 2009 VMworld event in Cannes. This award was given to Atos Origin in recognition of its innovative and sustainable use of VMWare technology across its customer base in Europe.
18.3.2 Contributing to people development and Well Being at Work (1)
At Atos Origin, people are at the heart of business strategy. Value creation for customers is based on knowledge, skills, experience and enthusiasm of its employees. Human Resources strategy aims to create a challenging, innovative environment stimulating personal and professional growth.
At the end of 2009, Atos Origin launched its ‘Well Being at Work’ program at Group level. This is part of the Group’s transformation plan with the objective of imagining the new way of working, intensively using new technologies while matching the social expectations of its employees and the “Y generation” so as to be recognised as one of the best companies to work for by 2012. In 2010, a ‘Well Being at Work’ council will be implemented and the Group will develop an approach that will cover all aspects of the future workplace, from implementing efficiency through processes such as Lean, to delivering the right tools for specific workforce, enabling new levels of collaboration and flexible working, attracting the right talent and rewarding it accordingly.
Corporate Social Responsibility
Valuing DiversityAtos Origin is a global company which respects and values the personal and cultural diversity available to us. Atos Origin is committed to a work environment where employees are all treated with respect and dignity, promoting equal opportunity and prohibiting unfair discrimination and any form of harassment.
Equal job opportunity and non-discrimination are fundamental principles within the Group. Since 2008, Atos Origin has developed several local Diversity Plans in its business activities in accordance with country specific laws such as in France, Brazil or Spain to encourage hiring disabled people into its activities and raise awareness about disabled issues. In France and within the Atos Worldline business, the Group has created a ‘Mission Handicap’ unit with objective to put in place concrete measures in order to facilitate integration of disabled people and secure employability. In 2009, the company focussed on raising employee awareness about these issues (2).
(1) For more details, please refer to the Human Resources section (19), or to the Corporate Responsibility Report.(2) Further information can be fund on its website www.atosorigin-handicap.fr/.

Atos Origin » Annual Report 2009 » 068
Supporting the Community In 2009, Atos Origin continued to encourage its subsidiaries and team members to engage in community or charity work on their own. Many Group employees worldwide, through individual commitment, bring Atos Origin’s sustainable development approach to life. For more details, please refer to the Corporate Responsibility Report.
Communication & Social Link
To truly make a difference, sustainable solutions and strategies have to be fully embraced by an organisation. This requires a behavioural change in both people and organisations through Innovation, Collaboration and Education. In this respect, in 2009 we launched our ‘Make a Difference’ global internal campaign aimed at creating greater internal awareness on sustainable issues and also to encourage green initiatives and individual responsibility. Through many actions, we actively invite our employees to join in the program and contribute to making Atos Origin a more sustainable organisation, through many and often very simple ways.
Atos Origin’s campaign around Sustainability uses our Company logo, a fish which constantly adapts to its natural environment as, we too, are constantly adapting our services to address our clients’ needs. The message reflects that we are a responsible company and sustainability is one of the key pillars of our brand. We have set up an information plan (intranet sections, in-house magazines, country employees’ workshops…) and a skills development program (e-learning module and to be deployed at Group level in 2010).
18.3.3 Accompanying clients in their own sustainable projectsICT has been recognized as an enabler for other sectors such as Transportation, Building, Power and Industry to become sustainable. By providing IT services, mobile communications and broadband, ICT can provide solutions for energy metering and monitoring use, but can also
transform how these businesses operate through transforming processes, value chains, businesses networks and society as a whole. We are also in a position to help businesses identify where, across an organisation, carbon emissions can be reduced.
Helping to Reduce our Clients’ Carbon Footprint
In 2009, Atos Origin provided real leadership and helped its clients from all industry sectors to bring about a real transformation in what is one of the biggest IT transformational issues today – around green for IT and IT for green. Main contributions include:
Sustainable Consulting for Inditex Spain■■ : Atos Consulting in Spain helped the Inditex Group, one of the world’s largest fashion distributors, with their 2010 Environmental Strategic Plan. One area of initial focus was the reduction in their CO2 distribution footprint by 20%, and to achieve this, a pilot scheme was initiated that focused on one brand, Pull&Bear, and the main logistic service provider. The company undertook a detailed analysis of the carbon footprint across logistic operations (primary and capillary routes) throughout the Spanish distribution network of 287 stores and an ‘environmental audit’ resulted in a list of 23 improvement measures, classified into five groups.
50% reduction in carbon emissions for Highways ■■
Agency: The Highways Agency in the UK is responsible for managing, maintaining and improving the strategic road network in England. Atos Origin helped the Agency to look at sustainability from two perspectives: first, how IT could improve its own sustainability performance and second, the opportunities that were available across the Agency’s business and with the travelling public to leverage the power of IT. Based on a diagnosis and a 5 year Roadmap covering their ICT infrastructure and control applications, the Highways Agency is now seeing a 50% reduction in carbon emissions coupled with cost savings of over GPB 4 million per year.
18 . Corporate Social Responsibility18.3 2009 achievements

Atos Origin » Annual Report 2009 » 069www.atosorigin.com
Atos Origin has also assisted enterprises and governments to understand how technologies such as smart metering, command and control systems or electronic services can support the transformation: ERDF, a subsidiary of EDF and the largest electricity distribution network in the European Union, has recently launched a major transformation program that will see the replacement of 35 million electricity meters in France, beginning with a pilot trial of 300,000 meters. ERDF selected Atos Origin as architect for the information system and lead manager of the consortium of technology firms that will conduct the pilot phase.
Contributing to Sustainable and Greener Olympic Games
Atos Origin has committed to helping the IOC and the Organizing Committees to deploy technological solutions to shrink the Games’ carbon footprint. This is happening in many different ways from reducing paper consumption, reducing the amount of hardware and power consumption, and cutting down on travel. For Vancouver 2010, the Company has deployed innovative technology solutions such as vir tualization, remote Info2010, remote Commentator Information System (CIS), Online Volunteer portal and first ever online Accreditation System. As a result Atos Origin was awarded a “Sustainability Star” by the Vancouver Organizing Committee for the 2010 Olympic and Paralympic Winter Games (VANOC) for helping it achieve its sustainability goals.
“We take sustainable development into account in everything we do; from the bid process to become an Olympic city, to construction of sport infrastructure, operational issues and of course information technology. We are very happy to have a partner like Atos Origin who has exactly the same vision and the same goals”. Jacques Rogge, President of the International Olympic Committee
18.3.4 Anticipating tomorrow’s technology evolution – Atos Origin’s leading-edge sustainable solutionsIT will continue to play a key role in helping organisations understand, implement, manage and improve their sustainability programs as well as their business efficiency. This means that energy consuming IT estates are growing, and more resources are being used in the manufacture, distribution, and running of IT equipment. However, organizations must first ensure that their own technology infrastructure is efficiently and smartly managed, with minimum emissions through Green for IT. The four main areas of prospective savings are:
Economy of scale through virtualization by regrouping ■■
more Central Processing and storage Units in the same place;Increase of usage of computing equipment in operation ■■
today (and thereby consuming energy), considered to be at less than 10% of possible usage, to increase by 2020 to 18% for Data Centres, 25% for telecommunications and 57% for PCs;From always on to always available: idle but “on” ■■
computers consume 90% of peak power;Relocation of Computing Centres in regions where ■■
electricity provision is cheaper, or nearer to power production source, or where cooling is less necessary.
With its Green solutions, Atos Origin is focused on accompanying its clients on their journey towards environmental excellence (1).
Atos Origin communicates regularly towards its stakeholders in order to alert, mobilise and create awareness around sustainable development challenges. Furthermore, many of its employees are actively involved in producing whitepapers and thought leadership articles on sustainability issues.
European research published by Atos Origin and IDC ■■
on “The Business Case for Environmental Excellence is Real” – April 6 2009. The research reveals that companies with more mature sustainability programs enjoy higher profit margins, generally a full 2% or higher;
(1) Refer to the Corporate Responsibility Report for further information on these solutions.
18 . Corporate Social Responsibility18.3 2009 achievements

Atos Origin » Annual Report 2009 » 070
White Paper ‘Why Sustainability is Good for Business’■■ – February 2009 In the current difficult economic climate, Sustainability can create new opportunities through innovation whilst helping combat climate change and strengthening our energy security;French client magazine ‘Perspectives’ ■■ – January 2009 This 8th edition of ‘Perspectives’ is dedicated to Green IT and available online in French (1);White Paper ‘IT■■ – The Key to a More Sustainable World’ – December 2009. This white paper explains the vital role of technology in addressing many of the issues surrounding climate change;Other information related to Sustainable Development ■■
are available on the Group’s website.
There is also extensive participation in key working groups & reports, including:
DETIC (Développement Eco-Responsible & TIC) – ‘ICT ■■
lobbying’ and ‘ICT report’ to promote data center and Green IT in France;Contribution to twelve Green Books devoted to Green ■■
IT with Syntec Informatique – 1st book dedicated to Dematerialization and Green IT published in November 2009;Sponsorship of the 1■■
st Green ICT Congress, in collaboration with Asimelec (IT sector association) and strong support of Spanish government.
(1) http://infos.fr.atosorigin.com/perspectives.
18 . Corporate Social Responsibility18.3 2009 achievements

Atos Origin » Annual Report 2009 » 071www.atosorigin.com
19 . Human Resources
19.1 Human Resources fundamentals 07119.2 Talent attraction 07219.3 Talent development 07219.4 Talent rewarding and retention 07319.5 Performance Management
and HR annual review 073
19.6 Managing employee transfer and transition 07419.7 Employee and management shareholding 07419.8 International mobility 07519.9 Pensions 07519.10 Communicating with employees 076
19.1 Human Resources fundamentals
Our employees represent the most precious assets of the Company. With their expertise and their high level of competencies, they are able to provide customers with first class services. They extend the image of excellence of the Group and they substantially contribute to its notoriety, competitiveness and profitability.
With a new top Management since the beginning of 2009, emphasis has been put on employment and employability of all the Group employees. Thus in 2009, 4,500 new engineers have been hired, half of them being young graduates. Regarding employability, a strong care has been given to make sure that employees have the prospect of moving from one technology to another, to move from one service line to another, or to give them the opportunity to learn from other cultures through short or long term assignments abroad. Education and flexibility have been deployed to motivate Atos Origin employees throughout the year and to allow them to achieve great results, despite the economic crisis that the world had to deal with.
Technologies are evolving rapidly and the Group has to address its customers’ future needs. Thus, it is crucial that its employees have the highest levels of know-how on the market. Developing People has been at the heart of the Group operating model in the year 2009.
Regarding attrition management in 2009, Group HR actions, together with HR strategy and programs, have aimed at maintaining the employees’ motivation and development, as well as their retention. Operations and strategy have focused on the motivation of Group’s people and on their federation within the organisation, making them proud of their valued contribution.
From the recruitment of its employees to the end of their career, the HR team, together with Group managers, has the responsibility to accompany these individuals throughout their professional evolution. The objective is to take into account People potential, together with their aspirations, in order to provide them with the professional development they expect.
Based on these fundamentals, the Human Resources team had and has focused on several priorities: develop, promote, motivate, reward and ensure that working with Atos Origin is such a good experience that people will never forget it.
Atos Origin » Annual Report 2009 » 072
19.3 Talent development
Atos Origin substantially increased its training efforts this year to make sure that all its employees in every business unit and function around the world have access to best-practice training. The already successful Atos University was expanded at the beginning of the year to create an umbrella for all training and development activities within the global Atos Origin Group, fully linked to HR. Atos University exists to ensure that employees have the appropriate skills for their discipline and market and to re-skill people with more business-oriented competencies to foster greater mobility and meet the future needs of the organization.
The University comprises a number of global academies- Sales, Project Management, SAP, Lean and Talent Development – that offer learning opportunities in a variety of formats, both classroom-based and online, around these crucial business areas. It also offers a number of other stand-alone programs. All offerings are continually being updated and improved to ensure that they remain in step with and relevant to the marketplace as it continues to evolve.
Within the Lean Academy, a Lean Mindset program was developed to help ingrain Lean management principles into the company culture. The ultimate goal is for everyone to work in accordance with Lean processes. Two thousand seven hundred managers will take part in the program and cascade their learning to colleagues in order to foster the generation of Lean ideas and create continual improvement in the way Atos Origin operates.
The amount of e-learning undertaken by employees at Atos Origin greatly increased over the year with the number of e-learning users having tripled by year end. Some of this success can be explained by the introduction of e-learning modules around Atos Origin’s Distinctive offerings, the solutions that enable Atos Origin to add real value to its clients’ business, and that form a key part of the company’s strategy for the future. There are also more than 5,000 programs available via the Atos University Online platform, covering a myriad of topics that employees can apply to access.
Atos University tested and launched an online English language program to ensure that employees wishing or needing to improve their English-language ability are able to do so. This forms part of the company’s strategic objective of becoming a more integrated company. Speaking the same language across the global organization will enable employees to act globally and better serve the needs of Atos Origin’s international customers.
In September 2009, a global training management system project was initiated, for which Atos Origin is working with a market-leading software vendor. The system makes coordination of effort across the global organization much easier and allows for improved trainer supply management. By reducing its trainer supply base, Atos University is better placed to focus on preferred suppliers and further improve the quality of training its employees enjoy.
19 . Human Resources19.2 Talent attraction19.3 Talent Development
19.2 Talent attraction
Attracting new employees continues to have its importance, even in times of economic downturn, in order to consistently present our employer value, Group strategy and the career opportunities within the Group. The Company has maintained its presence at recruitment fairs and through job boards throughout its main locations.
In particular, the Company has launched the Talent Search Program to provide internships and graduate positions so that new talents have the opportunity to gain work experience and get to know Atos Origin and in this way, bring in new technologies and skills into the Group.
In recruitment, Atos Origin has focused on the centralization of the function within each country and on the implementation of a new global eRecruitment system. This allows candidates to apply directly online and it allows our recruitment service and hiring managers, to manage the end to end process with the candidate online as well.
The Company also benefits from a better view on open positions worldwide and on the availability of candidates that have either applied for a specific position or made a speculative application.
In 2009, almost 4,500 new engineers were hired for ongoing needs as well as meeting the demand from some of key areas of business growth.
Atos Origin » Annual Report 2009 » 073www.atosorigin.com
19.4 Talent rewarding and retention
19.5 Performance Management and HR annual review
Our reward policy aims at recruiting, motivating and engaging key talent needed in competitive markets worldwide to implement our strategy and goals and to achieve individual, team and company performance.
The Company is continuously reviewing its compensation and benefits schemes to ensure our competitiveness in our markets as employee retention is at the heart of our people strategy.
As a result, we regularly benchmark our reward practices with other companies in the ICT ( Information and Communication Technology) and Hi-Tech sector and monitor trends on the labour market. Based on market evolutions and benchmark analysis, we ensure that our compensation and benefits are aligned with market practice.
The compensation package offered by Atos Origin includes a fixed salary, a variable bonus for eligible employees and benefits aligned with market practice. Key senior managers may also receive stock options depending on results achievements.
Targets, both Financial and Personal are set each semester by a process based on cascading top down Group objectives. Objective achievement is reviewed each semester and, along with the achievement of collective targets (global or local depending on the position) will determine the variable payment. Financial results play an important part in determining objectives used at all levels and across all work categories (operational, support) in order to deliver shareholder performance.
19.5.1 Performance Management Employee development is crucial at Atos Origin, both to ensure that we are able to meet clients’ requirements in terms of competencies/skills needed and to respond to the needs of our staff to see their career evolution open to multiple opportunities.
This is the reason why performance appraisal is becoming critical in the people development process. With two performance review cycles per annum, Atos Origin Managers are playing a key role in this process while being fully supported by our HR Business Partner’ team. One of the aims is to identify training needs for each of our employees and build programs that will allow them to further develop.
Every Atos Origin employee worldwide is now appraised according to our performance management cycle. It is made up of four constituent elements: objective setting, mid-year review, annual appraisal and an individual coaching and development plan. This core mechanism is supported by different tools defining and measuring performance, competencies and capabilities.
19.5.2 Human Resources Annual ReviewAnnual HR review is a very important part of our talent management program. Indeed, it presents the opportunity to identify new talents and to build succession plans across the Group. In 2009, an in-depth HR review was carried out with great success. All managers now have potential successors in place. As a result, the reviews provide a critical strategic link between the current and future needs of the business and allow us to provide new career opportunities for our staff.
The people review and succession planning ensure that our strategic and operational business goals are translated into our people processes. It allows the HR team to act as a business partner for the managers and to accompany them in their business development plans.
19 . Human Resources19.4 Talent rewarding and retention19.5 Performance Management and HR annual review

Atos Origin » Annual Report 2009 » 074
19.6 Managing employee transfer and transition
As every year, some deals signed in Outsourcing were concerned with staff transfer. Our skilled and experienced HR Bid and Transition managers have continued to clearly present the client with our staff transfer and transition approach and have focused their activities on creating a welcoming environment to newcomers through outsourcing.
Globally, in 2009 the HR Outsourcing team has continued to develop its HR Outsourcing approach, including the development of satisfaction surveys, collateral and the Web
pages on www.atosorigin.com. Professionalization and skilling has continued through training and awareness sessions for our HR staff.
Atos Origin also continues to share knowledge and best practices through outsourcing networks in which key individuals of Atos Origin share their views on outsourcing and in some cases provide lectures to students.
19.7 Employee and management shareholding
Atos Origin encourages employee and management shareholding in order to reinforce the sense of belonging to one community and develop the entrepreneurial spirit, thereby aligning internal and external stakeholders’ interests.
In 2009, the Group implemented three stock option plans (March 26, 2009; July 3, 2009; September 4, 2009). Each plan is structured in three categories (category 1, category 2 & category 3) that will vest on three vesting dates at three increasing subscription prices. These plans are strongly oriented to financial performance:
Options have subscription prices representing a premium ■■
over the share price of Atos Origin shares calculated at grant date, which constitutes in itself an external performance target to achieve for such options to be in the money.Performance criteria based on key financial indicators ■■
(Operating Margin, Cash Flow) have to be met to vest Category 2 or Category 3.
These plans specifically targeted Top 400 key managers of the Group who are focused on implementing the TOP (Total Operational Performance) Program to deliver the recurring savings that will secure Atos Origin’s sustainable competitiveness.
These plans were approved by the Board of Directors of Atos Origin SA pursuant to the authorization granted in the ninth resolution of Atos Origin shareholders’ meeting dated May 23, 2007 for March 26, 2009 plan and in the nineteenth resolution of Atos Origin shareholders’ meeting date May 26, 2009 for July 3, 2009 & September 4, 2009 plans.
Vesting date for the three plans are the following:July 1■■
st, 2010 for category 1;July 1■■
st, 2011 for category 2;July 1■■
st, 2012 for category 3.
Subscription prices for March 26, 2009 plan are the following:
Category 1: EUR 20.64; ■■
Category 2: EUR 24.57; ■■
Category 3: EUR 29.49.■■
This plan granted 1,835,000 options to 74 participants.
Subscription prices for July 3, 2009 plan are the following:Category 1: EUR 25.00;■■
Category 2: EUR 30.00; ■■
Category 3: EUR 35.00. ■■
This plan granted 1,443,500 options to 438 participants.
Subscription prices for September 4, 2009 plan are the following:
Category 1: EUR 34.28; ■■
Category 2: EUR 40.81; ■■
Category 3: EUR 48.97. ■■
This plan granted 259,000 options to 24 participants.
Overall, as a result of the implementation of these shareholding plans for employees and managers, the employee ownership (mutual funds and corporate savings plans) represented 3.3% of Group Share Capital as at 31 December 2009.
19 . Human Resources19.6 Managing employee transfer and transition19.7 Employee and management shareholding

Atos Origin » Annual Report 2009 » 075www.atosorigin.com
19.8 International mobility
19.9 Pensions
Moving employees internationally, in the context of the globalisation of our customers and the increasing demand for highly skilled international profiles, is, and increasingly so, a key component of our business strategy. Atos Origin is committed to developing its future leaders through international exposure, and effectively, at any one time, several hundred employees get positions abroad on temporary or long-term assignments. The international assignment cycle is designed to enable our employees to broaden their personal and professional understanding of international issues and culture, as well as developing new competencies which are valued assets for our business and customers. For our current and future employees, this
internationality within Atos Origin is also a valued facet of our work culture which adds to the sense of cultural diversity and group belonging.
With this global mobility philosophy, our challenge is to further understand and align organisational and individual motivations. Our HR mobility specialists provide guidance to our business from candidate profiling to international career and reintegration management and, of course, through the assignment administrative process. The dedicated international mobility team also supports the business in the development of adapted international mobility strategies which reflect the constantly changing business landscape.
Atos Origin provides pension benefits in several countries where it operates. These benefits are usually provided by associated pension funds, insurance companies or directly by the Group (book reserves). There are two types of pension benefits that Atos Origin offers to its employees: based on defined contributions and based on defined benefits. Atos Origin has a preference for defined contributions systems which are the more prevalent in its industry sector and provides its employees with the most flexibility. Defined benefits plan that Atos Origin has granted to its employees are recorded in accordance with the international accounting standard IAS19. Pension funds are usually legally separate entities with their own governance structure, independent from Atos Origin. The related assets and liabilities are nevertheless included in Atos Origin financials, as stipulated by IAS 19.
Atos Origin improved its capacity to monitor the risks embedded in associated pension funds, and increase its cooperation with such external bodies, by installing a Global Pension Steering Committee as well as Local Pension Steering Committees in the countries where it has significant plans. In 2007, a Group Pension Investment Committee was established to further develop this governance model. All aspects of the management of pension benefits which are under company control have since been subject to specific Internal Control rules as part of the Group book of Internal Controls.
Atos Origin has a dedicated team in place to supervise its existing pension arrangements with the support of local pension managers, also providing technical expertise to business managers in outsourcing deals. The team also monitors developments worldwide and amends pension arrangements in respect of new legislation and regulations.
In 2009, Atos Origin has pursued its efforts towards harmonizing pension benefits and reducing related financial risks, in cooperation with its independent pension funds.
In the United Kingdom, Atos Origin created effective July 1st, 2009, a single Trustee company to manage its main pension schemes, in order to improve the efficiency of dedicated committees and avoid the duplication of advisers and costs. The new Trustee Board has endorsed and continued the de-risking plans undertaken by previous Trustee companies.
In The Netherlands, following the agreement reached with the Pension Fund on a 5-year recovery plan in July 2009, Atos Origin has continued the collaboration with the various governance bodies of the Pension Fund to review the investment strategy and related processes in order to secure the recovery of the funding ratio.
19 . Human Resources19.8 International mobility19.9 Pensions

Atos Origin » Annual Report 2009 » 076
19 . Human Resources19.10 Communicating with employees
19.10 Communicating with employees
The European Work Council (EWC), created in 2007, is well established and well recognized within the Group. It allows Atos management to share strategy, changes and concerns with the employees’ representatives at European level and bring transparency, cooperation and trust between the participants. It is an opportunity to exchange ideas and very often, to find solutions for global issues. Atos Origin values good labour relations and is used to engage employee representatives where situations require such involvement.
Two face-to-face meetings have been held during the course of 2009 and continuous communication has been maintained between top Management and EWC with its Select Committee throughout the year.

Atos Origin » Annual Report 2009 » 077www.atosorigin.com
20 . Operational review
20.1 Executive summary
20.1 Executive summary 07720.2 Operating performance 07720.3 Revenue 078
20.4 Operating margin and margin rate 08520.5 Human Resources review 090
20.2 Operating performance
Full year 2009 revenue reached EUR 5,127 million, representing an organic decrease of -3.7% compared to EUR 5,324 million for fiscal year 2008 at same perimeter and same exchange rates.
By service line, Consulting and Systems Integration businesses representing 42% of total revenue decreased organically by -12.8% (EUR -315 million) compared to 2008 while in the opposite Managed Operations comprising Managed Services, Hi-Tech Transactional Services and Medical BPO together representing 58% of Group revenue reported an organic growth of +4.1% (EUR +118 million) compared to last year.
Full year 2009 operating margin was EUR 290 million at 5.7% of revenue. On a constant exchange rates basis and excluding the disposals, the organic increase in operating margin reached +13.1% or EUR +33.5 million compared to last year. The operating margin rate at 5.7% of revenue this year was up by +84 basis points compared to the 4.8% achieved in 2008.
The underlying operating performance on the ongoing business is presented within operating margin, while unusual, abnormal and infrequent income or expenses (other operating income/expenses) are separately itemised
and presented below the operating margin, in line with the CNC (Conseil National de la Comptabilité) recommendation n°2009-R-03 (issued on 2 July 2009) regarding the financial statements presentation.
The details from operating margin to operating income and net income are explained in the financial review, in the following chapter.
(in EUR million)
12 months ended
31 Dec. 2009 % margin
12 months ended
31 Dec. 2008 % margin
% change
% organic change (*)
Revenue excl. Italy and AEMS Exchange 5,127 5,479 -6.4% -3.7%
Italy 20
AEMS Exchange 125
STATUTORY REvEnUE 5,127 5,623 -8.8%
Operating margin excl. Italy and AEMS Exchange 290.0 5.7% 260.5 4.8% +11.3% +13.1%
Italy (1.1)
AEMS Exchange 7.0
STATUTORY OPERATInG MARGIn 290.0 5.7% 266.4 4.7% +8.8%
(*) Organic change at 2009 perimeter and exchange rates.

Atos Origin » Annual Report 2009 » 078
20.3 Revenue
20.3.1 Revenue profile evolution Over the period, 71% of the revenue base was recurring (up by +3 points compared to last year at 68%), deriving from multi-year outsourcing contracts (38% of total revenues up by +3 points), and including specialised businesses of Hi-Tech Transactional Services (17% of total revenues in increase of 1 point), and Medical BPO (3% of total revenues, stable), as well as Application Management contracts which are displayed under Systems Integration with recurring revenue representing 13% of total revenues (down by -2 points due to organic decrease).
Europe remains the Group’s main operational base generating 94% of total revenues. The Americas, which represent 3% of total revenue, provide support for the extended operations of the Group’s European clients. Atos Origin also has a strong commitment to specific parts of the Asia Pacific region (3% of total revenues), particularly in Hong Kong together with Mainland China, and in India, where it is expanding its offshore support resources.
The Group’s services and solutions add value across many industry sectors including Public Sector, Financial Services, Telecom & Media, and Manufacturing. These four main industry sectors represent 77% of total revenues and remain at the same level compared to last year.
Two sectors have particularly generated solid organic growth, Public Sector and Energy & Utilities with respectively +9% and +3%. The Public sector represents 28% of the total revenue.
20.3.2 Organic growthExternal revenues for 2009 fiscal year amounted to EUR 5,127 million representing a variation of -8.8% compared to statutory revenue of EUR 5,623 million in 2008. On a constant exchange rates basis which represent a negative impact of EUR -101 million and excluding the disposals for EUR -199 million (including EUR -125 million for AEMS Exchange and EUR -20 million for Italy), organic revenue decrease was -3.7% or EUR -197 million.
(in EUR million) FY 2009 FY 2008 %
STATUTORY REvEnUE 5,127 5,623 (8.8%)
Italy (20)
AEMS Exchange (125)
STATUTORY REvEnUE ExCLUDInG ITALY AnD AEMS ExCHAnGE 5,127 5,479 (6.4%)
Other disposals (54)
Impact from exchange rates (101)
REvEnUE AT COnSTAnT SCOPE AnD ExCHAnGE RATES 5,127 5,324 (3.7%)
20.3.3 disposalsThe disposals made by the Group accounted for EUR 199 million last year and were composed of:
Italy disposed to Engineering in January 2008 which ■■
removed EUR 20 million from the comparative revenue base;AEMS Exchange disposed to NYSE Euronext in July 2008 ■■
with revenue of EUR 125 million for the first seven months in 2008;Technical Automation in The Netherlands disposed at the ■■
end of 2008 with an annual revenue of EUR 22 million;Mexico disposed at the end of 2008 with revenue of ■■
EUR 9 million;Thailand disposed at the end of 2008 with revenue of ■■
EUR 19 million, and AB Consulting Sweden which represented revenue of ■■
EUR 4 million.
20.3.4 Exchange rates effectExchange rates movements resulted in a total negative adjustment of EUR -101 million on a comparable year-on-year basis, mainly from:
The British pound for EUR -106 million;■■
Asian currencies for +8 million;■■
The US dollar for EUR +5 million;■■
South American currencies (Brazil Real) for EUR -5 million;■■
Other currencies of Middle-east and Central Europe for ■■
EUR -3 million.
20 . Operational review20.3 Revenue

Atos Origin » Annual Report 2009 » 079www.atosorigin.com
20.3.5 Revenue evolution per quarterRevenue evolution per quarter illustrated the tough economic environment and an annual organic decrease of -3.7% or EUR -197 million out of which EUR -315 million in Consulting and Systems Integration.
During the first quarter, revenue slightly decreased by -0.6% compared to the same period in the previous year representing a difference of EUR -8 million. In the second quarter, lower working days and higher pressure on prices
led to an organic decrease of -4.0%. As a result, the first six months of 2009 ended at -2.4% compared to the same period of 2008.
The third quarter had the lowest revenue of the year at EUR 1,229 million down by EUR 72 million or -5.6% at same perimeter and same exchange rates compared to the third quarter 2008. At the end of the fourth quarter, the revenue organic change was contained to -4.5% resulting in an organic decrease of -5.0% in the second half of the year.
(in EUR million) FY 2009 FY 2008 Change% organic
change (*)
Quarter 1 1,294 1,302 (8) -0.6%
Quarter 2 1,295 1,350 (54) -4.0%
Quarter 3 1,229 1,301 (72) -5.6%
Quarter 4 1,309 1,372 (62) -4.5%
Half year 1 2,589 2,652 (63) -2.4%
Half year 2 2,538 2,673 (135) -5.0%
REvEnUE AT COnSTAnT SCOPE AnD ExCHAnGE RATES 5,127 5,324 (197) -3.7%
Italy 20
AEMS Exchange 125
Other disposals 54
Impact from exchange rates 101
STATUTORY REvEnUE 5,127 5,623 (496)
(*)Organic change at 2009 scope and exchange rates.
20.3.6 Revenue by Group Business Unit (GBUs)Consistent with IFRS 8, the Group presents the segment information in line with operational management, i.e. by Group Business Unit (GBU) and by geographical area.
The revenue performance by Group Business Unit was as follows:
(in EUR million) FY 2009FY 2008
proforma% organic
growth (*)
2009 revenue
breakdown
France 1,136 1,171 -3.0% 22%
Benelux 997 1,154 -13.6% 19%
United Kingdom 902 840 +7.4% 18%
Atos Worldline 844 814 +3.7% 16%
Germany & Central Europe/EMA 567 608 -6.7% 11%
Iberia/South America 403 449 -10.1% 8%
Rest of the world 278 290 -4.0% 5%
REvEnUE AT COnSTAnT SCOPE AnD ExCHAnGE RATES 5,127 5,324 -3.7% 100%
(*) At 2009 scope and exchange rates.
20 . Operational review20.3 Revenue

Atos Origin » Annual Report 2009 » 080
In France, Consulting was down by EUR -12.8 million compared to last year mainly due to lower projects in Banking and Finance combined to a continuous price pressure which led to a lower average daily rate. In the meantime, revenue derived from the Public sector remained flat, both in volume and price. The utilisation rate remained stable at 66% in 2009.
In Systems Integration, revenue declined by -6.1% compared to last year due to the tough environment in the Automotive sector with ramp-down on contracts with Renault and lower volumes with a major tires manufacturer. Public sector posted a positive growth mainly driven by Social and Health agencies and the French Ministries. The utilisation rate remained strong at 84% flat compared to 2008.
In Managed Services, revenue increased by EUR +19 million or +4.3% thanks to the ramp-up on new projects in the Energy & Utilities sectors and offsetting lower volumes of services in the Banking and the Retail sectors.
In the Benelux, Consulting revenue suffered from price pressure, lower utilisation due to a weaker market and lack of large projects. Throughout the year, companies from the financial services or the manufacturing sectors strongly reduced or even cancelled their demand in Consulting services. Thanks to a strong management, the utilisation rate was stabilised at 60% over the period.
In Systems Integration, revenue in The Netherlands was strongly impacted both by a lower demand and a strong price pressure in time & materials practice which represented two third of Systems Integration revenue. The strong decrease came from large customers such as KPN and ING. As a response to this situation, the Group reinforced the management and the reskilling of its workforce and succeeded in stabilising the utilisation rate at 74%.
In Managed Services, revenue slightly declined by -2.0% following projects postponements or cancellations particularly in Financial Services as well as delays in some transition projects. These effects were partially offset in The Netherlands by new businesses with NXP. In Belgium, revenue decrease was limited to -2.8% compared to 2008.
In the United Kingdom, Consulting revenue faltered by EUR 15.3 million compared to 2008. The service line was mainly affected by a reduction in the volume of assignments both in the Public Sector (NHS) and in the Private sector (Premier Food). Utilisation rate decreased to 52% compared to 58% in 2008.
In Systems Integration, revenue slightly decreased by -1.9% with a differentiated quarterly performance and a positive organic growth in the fourth quarter after a slight decrease YTD September. The Systems Integration division recorded higher revenues in the Public sector thanks to add-on projects with NHS, Highways Agency and Government Gateway. Strong efforts in the management of the workforce materialised in an increase of the average utilisation rate at 79% i.e. +4 points compared to 2008.
In Managed Services, the revenue growth was solid at EUR 79.1 million organic or +22.2%. This performance stemmed from higher revenue with the existing clients base and a strong level of business in the Public sector with Ministry of Justice, Borders Immigration Agency, Train Operating Companies in the Transport sector and Royal Liver Assurance. This increased service revenue was combined with additional requests for purchase for reselling mainly from Ministry of Justice.
In the Medical BPO activity, revenue organic growth was +3.5% with a better performance in the second half (+4.7%) compared to the first one (+2.3%). The overall number of medical assessments, on behalf of the Department for Work and Pensions, increased continuously throughout the year.
Atos Worldline revenue was up +3.7% compared to last year representing EUR 30 million additional revenue.
Atos Worldline Financial Markets was down by -12% as expected. The decline in revenue was mainly due to the end of the Euroclear contract. The Group is investing in new offerings to allow a return to growth in 2011.
Excluding this activity, the revenue derived from payments and e-services improved by +5.8%:
Payments revenue grew by +3.2% at EUR 551 million;■■
E-services grew by +13.7% at EUR 206 million.■■
20 . Operational review20.3 Revenue
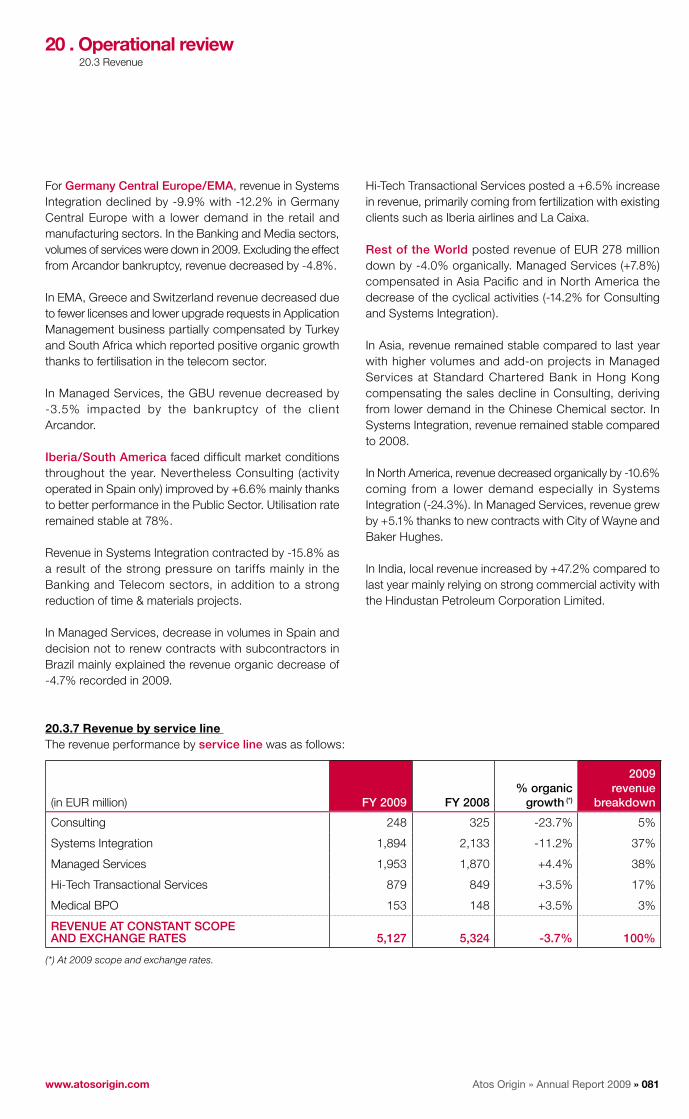
Atos Origin » Annual Report 2009 » 081www.atosorigin.com
For Germany Central Europe/EMA, revenue in Systems Integration declined by -9.9% with -12.2% in Germany Central Europe with a lower demand in the retail and manufacturing sectors. In the Banking and Media sectors, volumes of services were down in 2009. Excluding the effect from Arcandor bankruptcy, revenue decreased by -4.8%.
In EMA, Greece and Switzerland revenue decreased due to fewer licenses and lower upgrade requests in Application Management business partially compensated by Turkey and South Africa which reported positive organic growth thanks to fertilisation in the telecom sector.
In Managed Services, the GBU revenue decreased by -3.5% impacted by the bankruptcy of the client Arcandor.
Iberia/South America faced difficult market conditions throughout the year. Nevertheless Consulting (activity operated in Spain only) improved by +6.6% mainly thanks to better performance in the Public Sector. Utilisation rate remained stable at 78%.
Revenue in Systems Integration contracted by -15.8% as a result of the strong pressure on tariffs mainly in the Banking and Telecom sectors, in addition to a strong reduction of time & materials projects.
In Managed Services, decrease in volumes in Spain and decision not to renew contracts with subcontractors in Brazil mainly explained the revenue organic decrease of -4.7% recorded in 2009.
Hi-Tech Transactional Services posted a +6.5% increase in revenue, primarily coming from fertilization with existing clients such as Iberia airlines and La Caixa.
Rest of the World posted revenue of EUR 278 million down by -4.0% organically. Managed Services (+7.8%) compensated in Asia Pacific and in North America the decrease of the cyclical activities (-14.2% for Consulting and Systems Integration).
In Asia, revenue remained stable compared to last year with higher volumes and add-on projects in Managed Services at Standard Chartered Bank in Hong Kong compensating the sales decline in Consulting, deriving from lower demand in the Chinese Chemical sector. In Systems Integration, revenue remained stable compared to 2008.
In North America, revenue decreased organically by -10.6% coming from a lower demand especially in Systems Integration (-24.3%). In Managed Services, revenue grew by +5.1% thanks to new contracts with City of Wayne and Baker Hughes.
In India, local revenue increased by +47.2% compared to last year mainly relying on strong commercial activity with the Hindustan Petroleum Corporation Limited.
20.3.7 Revenue by service line The revenue performance by service line was as follows:
(in EUR million) FY 2009 FY 2008% organic
growth (*)
2009 revenue
breakdown
Consulting 248 325 -23.7% 5%
Systems Integration 1,894 2,133 -11.2% 37%
Managed Services 1,953 1,870 +4.4% 38%
Hi-Tech Transactional Services 879 849 +3.5% 17%
Medical BPO 153 148 +3.5% 3%
REvEnUE AT COnSTAnT SCOPE AnD ExCHAnGE RATES 5,127 5,324 -3.7% 100%
(*) At 2009 scope and exchange rates.
20 . Operational review20.3 Revenue

Atos Origin » Annual Report 2009 » 082
In Consulting, tough market conditions have pursued throughout the year 2009. With 5% of total Group revenue, the revenue organic decline was -23.7% with an acceleration between first semester (-22.6%) and second semester (-25.0%).
Nevertheless, the Operational transformation offering, which represents one third of Consulting revenue, resisted better to market conditions, by posting a mere -6.6% decrease.
Systems Integration revenue reached EUR 1,894 million (37% of Group revenue), representing an organic decrease of -11.2%. As expected the effects from tariffs pressure and decrease in volumes were stronger in the second half with an organic revenue decrease of -13.1% compared to -9.3% in the first semester of 2009.
While professional services and application management posted a double digit organic decrease, project services showed a better resilience to market conditions with a -6.6% organic decrease thanks to non-ERP activities.
The breakdown of Systems Integration revenue during full year 2009 was as follows: one third in Application Management, one third in Project Services and one third in Professional Services.
In Managed Services, full-year 2009 revenue reached EUR 1,953 million (38% of Group revenue), representing an organic increase of +4.4%.
Managed Services activity was affected by the Arcandor bankruptcy in Germany where revenue decreased from EUR 125 million in 2008 to EUR 109 million in 2009.
Group services offerings cover services desks, desktop and network services (30% of Managed Services revenue), mainframe management (20%), server management (30%) and professional services (20%).
Consulting breakdown by GBU
Systems Integration breakdown by GBU
Managed Services breakdown by GBU
20 . Operational review20.3 Revenue
Rest of the World
1%France 14%
UK 21%
Iberia/South America 22%
Benelux 42%
Rest of the World 7%
Iberia/South America
13%
UK 13%
Ger. Central Europe/EMA
14%
Benelux 19%
France 34%
Rest of the World 7%Iberia/South
America 4%
UK 22%
Ger. Central Europe/EMA
15%
Benelux 28%
France 24%

Atos Origin » Annual Report 2009 » 083www.atosorigin.com
In Hi-Tech Transactional Services, full-year 2009 revenue reached EUR 879 million (17% of Group revenue) representing an organic increase of +3.5%.
At the end of 2009, this service line covers the following countries: France, Belgium, Germany, Spain and United Kingdom.
Hi-Tech Transactional Services comprise the following activities: payment acquiring (37% of HTTS revenue), payment issuing (22%), cheque control (4%), Financial Markets (10%) and CRM & e-Services (27%).
Medical BPO is a service line specific to the United Kingdom (representing 3% of Group revenue). This service line grew by +3.5% to reach EUR 153 million. The overall number of performed medical assessments, on behalf of the main customer Department for Work and Pensions (DWP) increased throughout the year and over-compensated the decrease of revenue in the Primary Care business.
Hi-Tech Transactional Services breakdown by GBU
Medical BPO breakdown by GBU
20.3.8 Revenue by industry sectorThe revenue performance by industry sector was as follows:
(in EUR million) 2009 2008 Growth% organic
growth (*)
2009 revenue
breakdown
Public Sector 1,428 1,308 120 +9.2% 28%
Financial Services 1,109 1,182 (73) -6.2% 22%
Telecoms and Media 712 801 (89) -11.1% 14%
Manufacturing 690 807 (118) -14.6% 13%
Energy and Utilities 508 493 15 +3.0% 10%
Retail 491 533 (41) -7.8% 10%
Other 189 201 (12) -5.9% 4%
REvEnUE AT COnSTAnT SCOPE AnD ExCHAnGE RATES 5,127 5,324 (197) -3.7% 100%
(*) Organic growth at 2009 scope and exchange rates.
20 . Operational review20.3 Revenue
UK 100%
UK 1%Iberia
3%
Atos Worldline 96%

Atos Origin » Annual Report 2009 » 084
The Group is organised in six main industry sectors, which represent 96% of total revenue.
Public sector remained the main market served by the Group with 28% of total revenue, up by +3 points compared to previous period. Revenue in this sector reached EUR 1,428 million for the full year, with a strong growth of +9.2% organic growth. This performance was mainly located in the United Kingdom, in France and in Atos Worldline. The French Ministries, the French Social and Health Institution, the UK Department for Work and Pensions, and UK Department of Justice were the main contributors to this growth.By sub-market, Defence, Government and Healthcare posted a solid growth, while Transport slightly decreased. Top 10 accounts revenue accounted for 57% of the whole public sector representing an increase of +5 points compared to 2008.
The Financial services (22% of total Group revenue, in slight decrease on a yearly basis) remained the second largest sector of the Group this year. In 2009, this sector was the most challenging, strongly impacted by the deterioration of the economic conditions and strong costs cutting programs from clients. This sector standed at EUR 1,109 million, with a decrease of -6.2% compared to previous year in organic. Revenue from the Top 10 accounts reached EUR 540 million representing 49% of the total at same level as in 2008 and decreased in the same proportion as the sector. This performance was achieved despite a 25% decrease in revenue with ING which has been partly compensated with higher volumes with customers such as Standard Chartered Bank in Hong Kong and La Poste in France.
Telecoms and Media represented 14% of total Group revenue at EUR 712 million with an organic decrease of -11.1% due to lower demand. The two first clients of the sectors KPN and France Telecom posted a revenue decrease equivalent to half of the sector decrease. With a strong concentration of the Top 10 at 77% of the Telecom & Media revenue (+3 points compared to 2008), the Group was able to protect its market share and compensated the decrease of the other non tier 1 accounts. KPN, including its Belgium and German subsidiaries, still remained the Group first client with a revenue of EUR 245 million, decreasing by -8%.
Manufacturing revenue (13% of total Group revenue, down by -2 points) reached EUR 690 million, down by -14.6 % organic as a consequence of a very tough year with several postponements on investment decisions from Group clients. The Group main ten accounts in Manufacturing accounted for 51% of the revenue (down by -2 points since 2008) with decrease in sub-sectors such as Automotive, High Technology and Chemicals. Renault and Philips represented the largest decrease of the Top 10. On the opposite, the revenue increased with PSA and EADS.
Energy & Utilities revenue was EUR 508 million posting an organic growth of +3%. This sector accounted for 10% of the Group revenue, up by +1 point compared to last year. Strong growth was achieved in France with EDF, GDF Suez and Total and in The Netherlands with Nuon and Delta. Top 10 accounts reached 73% of the total revenue (+3 points compared to 2008) with an organic revenue growth of +9.5%.
Retail reached a revenue of EUR 491 million representing as last year 10% of total Group revenue and decreased by -7.8%, representing EUR -41 million. Half of this decrease was linked to the Arcandor bankruptcy. Nevertheless, Arcandor remained in 2009 the largest retail customer of the Group with total revenue of EUR 122 million. Top accounts revenue which accounted for 38% of total Retail posted a negative growth of -6.5% organic.
20.3.9 Order entriesTotal order entries in 2009 amounted to EUR 5,148 million excluding full backlog adjustment following Arcandor bankruptcy and representing a book to bill ratio of 100%.
By service line, book to bill ratio was (vs. 2008 at constant scope and exchange rates):
93% in Consulting (vs. 98%);■■
96% in Systems Integration (vs. 98%);■■
105% in Managed Services (vs. 113%);■■
119% in Hi-Tech Trans. Services (vs. 90%).■■
Consulting service line was down in 2009 due to a very tough economic environment and customers’ postponements or delays on transformation program. Nevertheless, the Group was able to conclude a double digit contract with ING.
20 . Operational review20.3 Revenue

Atos Origin » Annual Report 2009 » 085www.atosorigin.com
Systems Integration was mainly driven by new contracts signed with the Olympic Committee for the 2014 and 2016 Olympic Games, SFR for CRM and billing services mostly delivered from Group offshore locations, and Royal Liver Assurance in the United Kingdom equally delivered between Systems Integration and Managed Services. Main renewals were achieved with Renault contract fully redesigned with a new delivery model, Border Immigration Agencies and Brake Bros food in the United Kingdom.
In Managed Services, major contracts were signed with UVIT in The Netherlands for a 6-year period, in France with EDF (RTE) for 4 years and Ministry of Justice in the United Kingdom. Main renewals comprise ING in The Netherlands for a 5-year period and Standard Chartered Bank in Hong Kong for a 3-year period and BNP Paribas for multi-services contracts in France.
Hi-Tech Transactional Services had an intensive commercial activity during 2009 and successfully closed several new contracts such as e-services in Administration platform for the Regional Authorities. In addition, the Group renewed contracts with its major historical clients in all geographies such as LCH Clearnet and Lamy in France, Commerzbank and Deutsche Postbank in Germany and ING.
At the end of 2009, the full backlog was EUR 6.8 billion representing 1.3 time 2009 revenue. This figure has been adjusted from the effect of Arcandor for a total of almost EUR 400 million.
The full qualified pipeline reached EUR 3.0 billion at the end of December 2009, increasing by EUR 371 million or +14% in organic. This solid growth came mainly from Hi-Tech Transactional Services and Medical BPO businesses and accounted for 80% of the increase.
20.4 Operating margin and margin rate
20.4.1 Operating margin performanceThe operating margin performance was as follows:
(in EUR million) FY 2009 FY 2008 % change
Statutory Operating Margin 290.0 266.4 +8.8%
Operating Margin % 5.7% 4.7% +92 pts
Italy 1.1
AEMS Exchange (7.0)
Other disposals 3.6
Impact from exchange rates (7.7)
OP. MARGIn AT COnSTAnT SCOPE AnD ExCHAnGE RATES 290.0 256.5 +13.1%
Operating Margin % 5.7% 4.8% +84 pts
20 . Operational review20.3 Revenue20.4 Operating margin and margin rate

Atos Origin » Annual Report 2009 » 086
Group operating margin in 2009 reached EUR 290 million representing 5.7% of revenue; up by +9% compared to EUR 266.4 million (4.7% of revenue) in 2008. On a constant scope and exchange rates, the operating margin increased by +13% representing EUR +33.5 million over the period and +84 basis points despite the revenue decrease of almost EUR -200 million. This performance was in line with the objective set by the Group at the beginning of 2009, to increase the operating margin rate in a range of +50 to +100 basis points compared to year 2008.
20.4.2 Operating margin by quarterDuring the year 2009, the Group Operating margin rate has regularly improved over the first half from 3.5% in the first quarter to 5.6% of revenue in the second one, maintaining it to 5.2% in the third quarter while absorbing
the negative impact in volume during the summer time, and has finally increased up to a strong 8.3% in the fourth quarter fully benefiting from the significant positive contribution of the TOP Program.
The operating margin rate achieved in the first semester at 4.6% of revenue was in line with the level achieved the same period last year at constant scope and constant exchange rates. This performance was fully in line with half-year objective set by the Group, despite Arcandor bankruptcy which impacted the Group margin by EUR -14.4 million.
As anticipated, the acceleration of the operating margin rate expected in the second half was achieved with 6.8% in that period compared to 5.0% in the second half of 2008 which represented an increase of +174 basis points.
(in EUR million)FY
2009
% Operating
marginFY
2008
% Operating
margin ChangeChange
in OM rate
Quarter 1 45.5 3.5% 52.9 4.1% (7.4) -55 pt
Quarter 2 72.5 5.6% 68.9 5.1% +3.6 +49 pt
Quarter 3 63.7 5.2% 43.8 3.4% +19.9 +182 pt
Quarter 4 108.3 8.3% 90.8 6.6% +17.5 +165 pt
Half year 1 118.0 4.6% 121.8 4.6% (3.8) -4 pt
Half year 2 172.0 6.8% 134.6 5.0% +37.3 +174 pt
OPERATInG MARGIn AT COnSTAnT SCOPE AnD ExCHAnGE RATES 290.0 5.7% 256.5 4.8% +33.5 +84 pt
20.4.3 Operating margin by Group Business UnitThe operating margin performance by Group Business Unit was as follows:
(in EUR million)FY
2009 % marginFY
2008 % margin ChangeChange
in OM rate
France 44.7 3.9% 25.4 2.2% 19.2 +176 pt
Benelux 84.2 8.4% 94.3 8.2% (10.1) +27 pt
United Kingdom 82.1 9.1% 61.3 7.3% 20.8 +181 pt
Atos Worldline 133.2 15.8% 123.3 15.2% 9.8 +62 pt
Germany & Central Europe/EMA 21.7 3.8% 30.6 5.0% (8.9) -121 pt
Iberia/South America 2.5 0.6% 17.1 3.8% (14.6) -318 pt
Rest of the world 18.1 6.5% 11.2 3.9% 6.9 +264 pt
Corporate central (*) (70.1) -1.4% (82.8) -1.6% 12.7 +19 pt
Global Service Lines costs (*) (26.5) -0.5% (24.1) -0.5% (2.4) -6 pt
OP. MARGIn AT COnSTAnT SCOPE AnD ExCHAnGE RATES 290.0 5.7% 256.5 4.8% 33.5 +84 pt
(*) Corporate central costs and Global service lines central costs not allocated to the Group Business Units.
20 . Operational review20.4 Operating margin and margin rate
Atos Origin » Annual Report 2009 » 087www.atosorigin.com
In France, operating margin increased from 2.2% of revenue in 2008 to 3.9% in 2009. As mentioned below, each service line improved its profitability.
Despite strong revenue decrease in Consulting, both in volume and prices, the operating margin has been maintained to the same level as 2008 thanks to a drastic costs savings program.
At the beginning of 2009, the Management implemented a reorganisation and decreased significantly the number of profit centers. This new organisation allowed significant costs savings and reduction of Management layers. Systems Integration in France followed a strict control of the workforce with hiring freeze, reskilling of resources and increasing business transferred to India or Morocco as part of the TOP Program. Thanks to all the actions mentioned herein above, the utilisation rate remained at 84%.
While revenue decreased by EUR -41.5 million (-6.1%), the operating margin in Systems Integration grew from 0.6% in 2008 to 3% of revenue in 2009 representing more than EUR 15 million.
In Managed Services, thanks to revenue increase of +4.3% together with a close management of subcontractors, the operating margin increased by EUR +4.2 million or +70 basis points compared to 2008.
All business units in France benefited from reduction in costs base derived from T8 TOP Program (Optimisation of non-IT spending) and mainly materialised into overhead reduction.
In Benelux, despite the strong decrease in revenue in 2009, the operating margin slightly increased at 8.4% in 2009, compared to 8.2% in 2008.
In The Netherlands, the Group proactively reduced the costs base and staff in order to secure the operational profitability which reached 8.7%, +20 basis points above last year. Despite a revenue decrease in Systems Integration of almost EUR -100 million, the profitability remained significantly above the Group average. The operating margin in Managed Services strongly progressed, thanks to the implementation of Lean pilot (TOP Program T5) in Global Factory. On top of the optimisation of non-IT spending through the T8 program, Benelux implemented an Added Value Analysis (AVA) on indirect functions which materialised into strong reduction of indirect costs. These actions did offset the decrease of margin in the cyclical activities due to the drop in revenue.
In Belgium, the profitability slightly improved whereas the revenue declined by more than EUR -11 million.
In the United Kingdom, in a context of revenue increase, operating margin grew from 7.3% to 9.1%.
In Consulting, operating margin remained positive at EUR 0.2 million despite decreasing revenues. Reduction of personnel costs was the main measure to mitigate a negative top line. In percentage of revenue, operating margin stands at 0.4% compared with -2.8% last year.
In Systems Integration, the operating margin increased from 6.0% in 2008 to 9.8% in 2009 as a result of profit improvement plans started last year, aimed at decreasing the cost base through optimized delivery processes.
In Managed Services, the operating margin increased thanks to additional profit delivered through additional requests for services in projects mainly within the Public sector as well as a continued focus on leveraging the delivery cost base to generate efficiencies.
In Medical BPO, the increased margin has been delivered largely thanks to increased revenue on the Department of Work and Pensions contract.
Atos Worldline operating margin increased from 15.2% in 2008 to 15.8% in 2009 at EUR 133.2 million:
in Belgium, the operating margin improved thanks to ■■
higher card processing revenue as well as a reduction of subcontractors; In Germany, the improvement mainly came from additional ■■
licence revenue and better revenue through volume increase; In France, the ramp-up of the biometric passports and ■■
speed control contracts compensated the fall on checks prevention activities and price pressure with telecom operators; In Financial Markets, despite the revenue decrease, the ■■
unit has been able to improve its operating margin thanks to costs containment.
20 . Operational review20.4 Operating margin and margin rate

Atos Origin » Annual Report 2009 » 088
In Germany Central Europe/EMA, the GBU posted an operating margin down by EUR -8.9 million compared to 2008, including a charge of EUR 14.4 million as a result of the depreciation of Arcandor receivables following its bankruptcy.
In Germany Central Europe, the operating margin reached 3.2% decreasing from 5.4% and fully due to the Arcandor effect. As part of the TOP Program, the GBU has benefited from optimisation programs such as Global Factory, Infrastructure and rationalisation (program T5).
In EMA, operating margin increased from 2.7% in 2008 to 7.6% in 2009. In Turkey, operating profitability was restored after a significant project slippage in 2008 with the client Avea. South Africa also progressed thanks to an enlarged scope of services with MTN contract.
The GBU Iberia/South America (ISAM) had a difficult year with operating margin decreasing from 3.8% in 2008 to 0.6% in 2009, a drop of EUR 14.6 million. Part of this decline came from a -10.1% revenue reduction mainly in the cyclical activities.
In Iberia, Systems Integration compensated partially the revenue fall effect in the operating margin by reducing external subcontractors and direct staff. Price pressure observed during the year was high in time & materials practice. The management implemented a stronger workforce optimisation which resulted in maintaining the utilisation rate at 86% in Systems Integration and also in Consulting at 78%. In Managed Services, Iberia was affected by issues in a desktop contract with a large customer with an effect of EUR 4 million.
In South America, Brazil suffered mainly from revenue decrease as well as one-offs effects in two contracts which impacted by more than EUR 6 million the operating margin in 2009. A new CEO was consequently appointed in South America at the end of the year.
The GBU Rest of the World improved its operating margin from EUR 11.2 million and 3.9% in 2008 to EUR 18.1 million and 6.5% in 2009.
In Asia Pacific, the profitability increased both in Systems Integration and Managed Services through a strong improvement of services delivery absorbing the deterioration in Consulting due to revenue decline. Projects developments were successful in Systems Integration in the finance sector both in banking and in insurance. In Managed Services, the combined effect of additional volumes and costs cutting actions generated margin progression. Quality of service significantly improved throughout the region and in particular in Malaysia.
In North America, the operating margin increased in Managed Services benefiting from the revenue growth. In Systems Integration, the revenue dropped by EUR -12.9 million and -24.3% in organic and despite the efforts made to save costs, the operating margin was down by EUR -2.7 million.
Corporate costs are divided into three categories: Global Service Lines, Global Functions at central level and Equity based compensation costs.
(in EUR million)FY
2009 % margin FY 08 % margin Change
Global Service Lines (26.5) -0.50% (24.1) -0.45% -2.4 -5 pt
Global functions (56.2) -1.10% (69.1) -1.30% 12.9 +20 pt
Equity based compensation (13.8) -0.30% (13.7) -0.26% -0.1 -4 pt
CORPORATE CEnTRAL COSTS (96.6) -1.9% (106.9) -2.0% 10.3 +11 pt
20 . Operational review20.4 Operating margin and margin rate

Atos Origin » Annual Report 2009 » 089www.atosorigin.com
Global Service Lines costs
Global Service Lines central costs (Global Delivery and Global Factory) have increased by EUR -2.4 million over the period. This is the result of three key elements: the build-up of the Global Delivery operations, the reinforcement of the global factories departments, and the roll-out of key transformation projects both in Systems Integration and Managed Services.
Global Service Lines costs are allocated by service line and not by Global Business Unit.
Corporate Global Functions costs
Corporate Global Functions costs have been significantly reduced in 2009 by EUR 12.9 million from 1.3% of revenue in 2008 to 1.1% in 2009. As part of the TOP Program, this reduction derived from the first positive effects of the Global Functions re-engineering, materialising mainly in General Management, Finance, Human Resources and Communication.
Equity based compensation
Equity based compensation costs (stock options, Long Term Incentive plans, Management Investment Plan, employee purchase plan, …) were stable at EUR 13.8 million.
The costs for stock options granted (IFRS2) increased according to the new programs launched in 2009 while the costs for free shares (Long Term Incentive and Management Incentive Plans) were significantly reduced further to the termination of such plans.
As a summary, total corporate central costs were reduced from EUR 106.9 million to EUR 96.6 million thanks to both effective reduction of recurring costs in most of the Global Functions and an increased efficiency in the execution of the transformation projects of the Group.
20.4.4 Operating margin by Service LineThe operating margin performance by service line was as follows:
(in EUR million)FY
2009 % marginFY
2008 % margin ChangeChange
in OM rate
Consulting 3.2 1.3% 15.6 4.8% (12.4) (351 pt)
Systems Integration 94.8 5.0% 87.7 4.1% +7.1 +89 pt
Managed Services 106.8 5.5% 97.2 5.2% +9.7 +27 pt
Hi-Tech Transactional Services 135.6 15.4% 126.1 14.9% +9.5 +58 pt
Medical BPO 19.6 12.8% 12.6 8.5% +7.0 +426 pt
Corporate central (*) (70.1) (1.4%) (82.8) (1.6%) +12.7 +19 pt
OPERATInG MARGIn AT COnSTAnT SCOPE AnD ExCHAnGE RATES 290.0 5.7% 256.5 4.8% +33.5 +84 pt
(*) Corporate central costs exclude the Global service lines costs.
Each Service Line reported an increase of the operating margin in 2009 at the exception of Consulting.
In 2009, the Consulting business line was affected both by a significant price pressure and a lack of demand from large customers which in several cases delayed or cancelled their decisions of investment. Despite efforts on costs, restructuring and workforce management (decrease of staff by -22% to be compared with revenue decrease of -23.7%), the revenue decrease resulted in a drop of the operating margin.
In Systems Integration, the operating margin increased to 5.0% of revenue thanks to the improvement made in all the GBUs except Benelux and Iberia/South America. Actions of workforce management launched at the beginning of the year by freezing recruitments, re-skilling direct staff, drop of subcontractors and restructuring were the main levers of the margin improvement. Total staff has been reduced from 24,400 at the end of 2008 to 23,000 at the end of 2009. Benelux and Iberia suffered from price pressure and lower volumes in time & materials practice which represented around 25% of their Systems Integration activity.
20 . Operational review20.4 Operating margin and margin rate
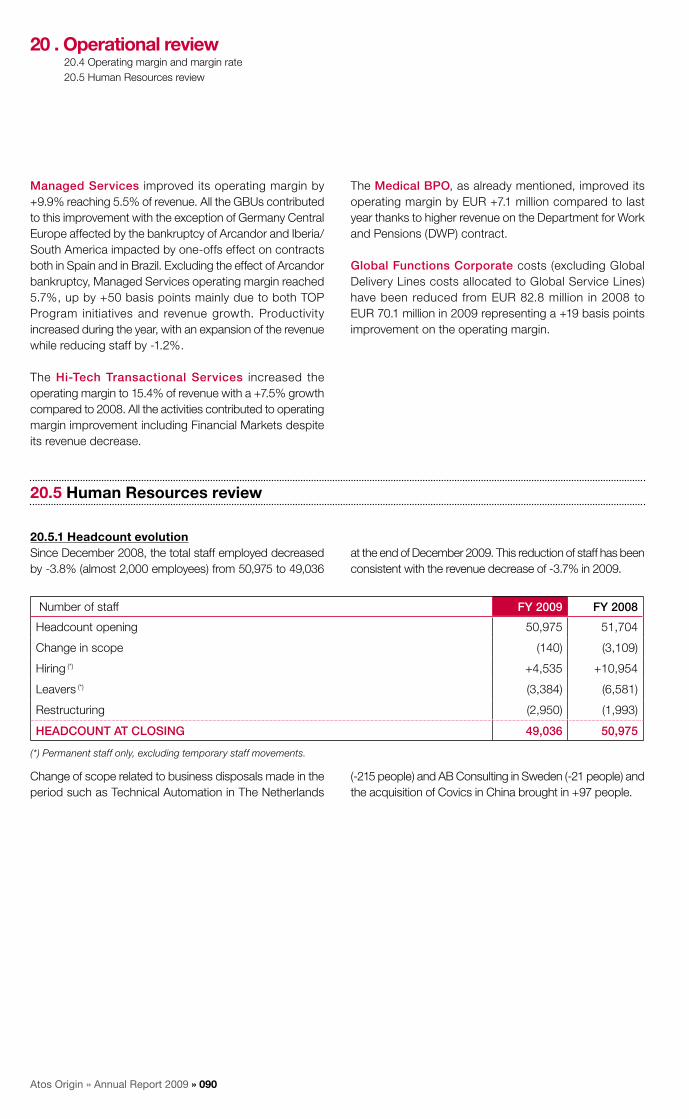
Atos Origin » Annual Report 2009 » 090
Managed Services improved its operating margin by +9.9% reaching 5.5% of revenue. All the GBUs contributed to this improvement with the exception of Germany Central Europe affected by the bankruptcy of Arcandor and Iberia/South America impacted by one-offs effect on contracts both in Spain and in Brazil. Excluding the effect of Arcandor bankruptcy, Managed Services operating margin reached 5.7%, up by +50 basis points mainly due to both TOP Program initiatives and revenue growth. Productivity increased during the year, with an expansion of the revenue while reducing staff by -1.2%.
The Hi-Tech Transactional Services increased the operating margin to 15.4% of revenue with a +7.5% growth compared to 2008. All the activities contributed to operating margin improvement including Financial Markets despite its revenue decrease.
The Medical BPO, as already mentioned, improved its operating margin by EUR +7.1 million compared to last year thanks to higher revenue on the Department for Work and Pensions (DWP) contract.
Global Functions Corporate costs (excluding Global Delivery Lines costs allocated to Global Service Lines) have been reduced from EUR 82.8 million in 2008 to EUR 70.1 million in 2009 representing a +19 basis points improvement on the operating margin.
20.5 Human Resources review
20.5.1 Headcount evolutionSince December 2008, the total staff employed decreased by -3.8% (almost 2,000 employees) from 50,975 to 49,036
at the end of December 2009. This reduction of staff has been consistent with the revenue decrease of -3.7% in 2009.
Number of staff FY 2009 FY 2008
Headcount opening 50,975 51,704
Change in scope (140) (3,109)
Hiring (*) +4,535 +10,954
Leavers (*) (3,384) (6,581)
Restructuring (2,950) (1,993)
HEADCOUnT AT CLOSInG 49,036 50,975
(*) Permanent staff only, excluding temporary staff movements.
Change of scope related to business disposals made in the period such as Technical Automation in The Netherlands
(-215 people) and AB Consulting in Sweden (-21 people) and the acquisition of Covics in China brought in +97 people.
20 . Operational review20.4 Operating margin and margin rate20.5 Human Resources review
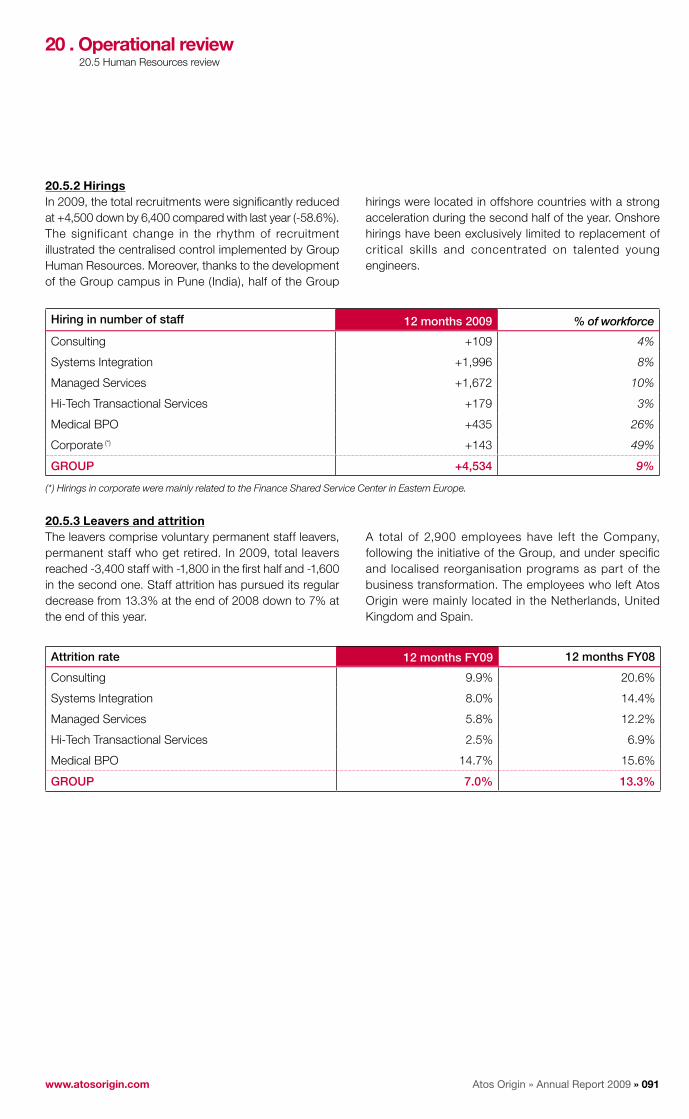
Atos Origin » Annual Report 2009 » 091www.atosorigin.com
20.5.2 HiringsIn 2009, the total recruitments were significantly reduced at +4,500 down by 6,400 compared with last year (-58.6%). The significant change in the rhythm of recruitment illustrated the centralised control implemented by Group Human Resources. Moreover, thanks to the development of the Group campus in Pune (India), half of the Group
hirings were located in offshore countries with a strong acceleration during the second half of the year. Onshore hirings have been exclusively limited to replacement of critical skills and concentrated on talented young engineers.
Hiring in number of staff 12 months 2009 % of workforce
Consulting +109 4%
Systems Integration +1,996 8%
Managed Services +1,672 10%
Hi-Tech Transactional Services +179 3%
Medical BPO +435 26%
Corporate (*) +143 49%
GROUP +4,534 9%
(*) Hirings in corporate were mainly related to the Finance Shared Service Center in Eastern Europe.
20.5.3 Leavers and attritionThe leavers comprise voluntary permanent staff leavers, permanent staff who get retired. In 2009, total leavers reached -3,400 staff with -1,800 in the first half and -1,600 in the second one. Staff attrition has pursued its regular decrease from 13.3% at the end of 2008 down to 7% at the end of this year.
A total of 2,900 employees have left the Company, following the initiative of the Group, and under specific and localised reorganisation programs as part of the business transformation. The employees who left Atos Origin were mainly located in the Netherlands, United Kingdom and Spain.
Attrition rate 12 months FY09 12 months FY08
Consulting 9.9% 20.6%
Systems Integration 8.0% 14.4%
Managed Services 5.8% 12.2%
Hi-Tech Transactional Services 2.5% 6.9%
Medical BPO 14.7% 15.6%
GROUP 7.0% 13.3%
20 . Operational review20.5 Human Resources review

Atos Origin » Annual Report 2009 » 092
20.5.4 Staff by service line and countryThe workforce at the end of December 2009, by service line and Group Business Unit, was as follows:
Headcount31 December
200931 December
2008 Change
Consulting 2,087 2,667 -22%
Systems Integration 23,033 24,402 -6%
Managed Services 16,411 16,610 -1%
Hi-Tech Transactional Services 5,261 5,325 -1%
Medical BPO 1,880 1,680 +12%
Corporate 364 291 +25%
TOTAL 49,036 50,975 -4%
France 12,401 12,737 -3%
Benelux 7,750 9,038 -14%
United Kingdom 6,269 6,313 -1%
Atos Worldline 4,804 4,847 -1%
Germany Central Europe & EMA 3,746 3,838 -2%
Iberia/South America 7,432 8,298 -10%
Rest of the World 6,270 5,613 +12%
Finance Shared service center (Poland) 150 57 +163%
Corporate (*) 214 234 -9%
TOTAL 49,036 50,975 -4%
(*) Corporate Employees include Management, support functions and Service Lines.
As of 31 December 2009, Group total staff were 49,036 down by -4% compared to the end of previous year. The major decrease in number of employees was in the GBUs Benelux and Iberia/South America. The GBUs United Kingdom, Atos Worldline and Germany Central Europe & EMA almost maintained the same level of staff.
In 2009, the Group Finance Shared Service Centre based in Lodz (Poland) has been significantly ramped-up from 57 staff at the end of 2008, to 145 at the end of June 2009 and finally 150 people at the end of 2009. This shared service center has been set up following the transfer of the finance back-office activities from Germany, Belgium/Luxemburg, France and United Kingdom. This implementation of the Finance Shared Service Centre has been fully managed within the T12 project as part of the TOP Program.
The Corporate staff reached 214 at the end of the year, representing a decrease of -9% compared to 2008.
Throughout year 2009, the Group has pursued the strict control of the hirings together with the reorganisation of the Group delivery units. As a result, the internal productive staff have been reduced by -3% (-1,429 staff) at 43,941 at the end of 2009. On the other hand, the total indirect staff has been reduced from 5,605 end of 2008 to 5,094 at the end of 2009, which represents a decrease of -9% in the period equivalent to more than 500 staff.
20 . Operational review20.5 Human Resources review

Atos Origin » Annual Report 2009 » 093www.atosorigin.com
20.5.5 Subcontractors As far as the total number of subcontractors is concerned, in 2009, the Group has carefully followed and monitored the policy whose objective was to strongly reduce the number of non-critical subcontractors. As a result, the total number of subcontractors fell from 3,933 at the end of 2008 to 2,433 at the end of 2009 which represents a net decrease of 1,500 (-38%). This achievement has over-performed the target of 1,000 staff reduction set for the full year 2009.
The monthly evolution of total number of subcontractors in 2009 was as follows:
4,008
Dec. 07
4,469
jun 08
3,933
Dec. 08
2,517
jun 09
2,433
Dec. 09
Q1 09
315
Q2 09
271
Q3 09 Q4 09
1,024
20.5.6 Offshore headcount At the end of 2009, employees in offshore locations reached 5,034 compared to 4,516 at the end of 2008; representing a net increase of +11.5%. More than 70% of offshore employees were in India, for a total of 3,600. Morocco increased its offshore headcounts by +64.4% (i.e. +200 employees) while Poland strongly increased from 170 to almost 400.
Change in the breakdown of offshore headcount between 2008 and 2009
In 2009, the Group accelerated the recruitment in offshore locations, mainly during the second half, with more than 1,500 employees hired.
20 . Operational review20.5 Human Resources review
507
Total : 5,034Total : 4,516
South America
57
South America
125Poland
170Poland
398Malaysia
217
Malaysia 239
Morocco 306
Morocco 503
Others 438
Others 168
India 3,328
India 3,601
■ 2008 ■ 2009

Atos Origin » Annual Report 2009 » 094
21 . Financial review
21.1 Income statement
21.1 Income statement 09421.2 Earnings per share 09721.3 Cash flow 097
21.4 Net debt 09921.5 Financing policy 099
The Group reported a net income (Group share) of EUR 31.7 million for 2009, which represents 0.6% of Group revenues. The adjusted net income before unusual,
abnormal and infrequent items (net of tax) for the period was EUR 196.0 million, representing 3.8% of 2009 Group revenues. It increased by 8.5% compared with last year.
(in EUR million)
12 months ended
31 December 2009 % Margin
12 months ended
31 December 2008 % Margin
Operating margin 290.0 5.7% 266.4 4.7%
Other operating income / (expenses) (220.4) (166.0)
Operating income 69.6 1.4% 100.4 1.8%
Net financial income / (expenses) (24.4) (22.8)
Tax charge (9.4) (48.1)
Minority interests and associates (4.1) (6.9)
net income – Group share 31.7 0.6% 22.6 0.4%
Adjusted net income – Group share (*) 196.0 3.8% 180.6 3.2%
(*) Defined hereafter.
The following table analyses this amount by nature and destination:
(in EUR million)
Group transformation
costsArcandor
bankruptcy impactOther non
recurring items Total
Staff restructuring (110.6) (30.0) - (140.6)
Paris offices rationalisation (36.0) - - (36.0)
Other locations rationalisation (43.4) (6.9) - (50.3)
Non-current and current assets write-off - (15.1) - (15.1)
Goodwill impairment - (31.1) - (31.1)
Dutch pension profit - - 38.9 38.9
Release of OBS provision and others - - 13.8 13.8
TOTAL (190.0) (83.1) 52.7 (220.4)
Analysed as:Cash (154.0) (30.0) - (184.0)
Non cash (36.0) (53.1) 52.7 (36.4)
21.1.1 Operating marginOperating margin represents the underlying operational performance of the on-going business and is explained in the operational review.
21.1.2 Operating incomeOther operating income and expenses relate to income and expenses that are unusual, abnormal and infrequent and represent a net expense of EUR 220.4 million in 2009.
Atos Origin » Annual Report 2009 » 095www.atosorigin.com
The Group has identified three major destinations of costs:The Group transformation costs; ■■
The impact of Arcandor bankruptcy and;■■
Other non recurring items.■■
Group transformation costs (EUR 190.0 million expense)
The Group transformation costs are made of EUR 154.0 million which are cashed out mostly in years 2009 and 2010 (restructuring and rationalisation) and EUR 36.0 million charge which has no cash impact.
This latter amount relates to the remaining lease obligation of the five existing Paris’ sites which are being closed as part of the project to regroup 4,500 staff at the new headquarters of the Group in the city of Bezons, near Paris. This charge is fully financed by the new Group headquarter landlord through a 2 year rental exemption starting 2010.
In term of accounting treatment, the remaining rental obligation net of future sub-rent is fully recorded in year 2009 operating income while all incentives granted by the new landlord (2 year rental exemption and leasehold improvement financing) will be recorded through the operating income spread over the duration of the new lease (12 years).
The EUR 154.0 million are made of EUR 110.6 million for staff restructuring costs and EUR 43.4 million for real estate rationalisation as part of TOP Program (T9 initative).
The EUR 110.6 million charge is the consequence of both the Group workforce adaptation to the effects of the economic recession and the non recurring cost induced by the TOP Programs aimed at improving Group efficiency and productivity. The combination of these two actions affected mainly The Netherlands (EUR 44.2 million), France (EUR 17.4 million), Corporate (EUR 15.6 million), Central Europe excluding restructuring programs due to the bankruptcy of Arcandor Group (EUR 14.1 million), and Iberia (EUR 10.6 million).
Impact of the bankruptcy of Arcandor Group (EUR 83.1 million expense)
In the first semester of 2009, the German operations of the Group have been impacted by the insolvency of their main client, the retail and travel Group Arcandor, formerly known as Karstadt Quelle, announced on 9 June 2009. This insolvency filing related to:
The retail business (supermarkets and department ■■
stores): Karstadt;The catalogue and internet sales’ business Quelle and ■■
Primondo;the in-house IT subsidiary Itellium.■■
Arcandor was then placed under the administration of an Insolvency Administrator.
Consequently, the Group already recorded a provision for bad debt amounting to EUR 14.4 million within its first semester financial statements. This amount represents 95% of the value of the accounts receivable as at insolvency date.
During the second semester however, the Insolvency Administrator made public the following decisions:
The liquidation of the catalogue and internet sales’ business ■■
Quelle and Primondo announced on 19 October 2009;The launch of a Karstadt’s disposal process with the ■■
objective to complete in the first semester 2010.
In this new context, the Group entered in January 2010 into a new 3 year IT services contract with Karstadt based on revised scope and prices as well as a new delivery model. Nevertheless, due to the uncertainties of the disposal both in terms of timing and completion, the Group decided to take a conservative position by depreciating all assets related to the Karstadt contract and implemented a complete office rationalization. These measures were completed in addition to the staff restructuring plan related to the Quelle-Primondo liquidation (300 FTE).
Consequently, in application of IAS 36, the Group has accounted for an impairment of EUR 31.1 million on Germany Central Europe cash generating unit taking into consideration this new business environment.
The future cash impact of this EUR 83.1 million charge is EUR 30.0 million.
21 . Financial review21.1 Income statement

Atos Origin » Annual Report 2009 » 096
Other non-recurring items (EUR 52.7 million profit)
The other non-recurring items are non-cash related. This amount is made of the following items:
Dutch pension assets At the end of 2008, 15% of Dutch pension fund assets were held in hedge funds, asset backed securities and mortgage backed securities. At that time, the value of these assets was extremely difficult to assess due to their lack of liquidity in the context of the financial markets crisis. Consequently, the Group depreciated the fair value of such assets and recorded a EUR 38.9 million impairment of the related Dutch pension prepaid expenses. With the 2009 recovery of some underlying markets, the Dutch pension fund successfully disposed of more than 80% of these assets at transaction or redemption amounts significantly above the book values as depreciated at 31 December 2008. As a result, the EUR 38.9 million depreciation recorded in 2008 has been reversed in other operating income.
Opening balance sheet (OBS) provisionsThe Group released EUR 13.4 million provisions linked to previous acquisitions and related mainly to extinct tax risks in the Group Business Units GCEMA, ISAM and the United Kingdom. This amount is comparable with last year.
21.1.3 Net financial expenseNet financial expense amounted to EUR 24.4 million in 2009, compared with a net expense of EUR 22.8 million in the previous year.
The net cost of financial debt was EUR 13.5 million in 2009 (EUR 28.7 million in 2008). Based on an average net debt of EUR 341.6 million during the period (EUR 518.5 million in 2008), the average cost of borrowing was 3.96%.
Non-operational f inancia l costs amounting to EUR 10.9 million in 2009 were made of a net financial pension charge of EUR 7.4 million and a EUR 3.5 million net charge for other financial items. The net pension charge represents a difference between the expected return on pensions plan assets and the interest costs applicable to pension liabilities.
21.1.4 Corporate taxThe Group effective tax rate is 20.7%. The restated Group effective tax rate is 24.7%. On a midterm basis, the expected effective tax rate is 26-28% on the current scope of the Group, and calculated before the impact of booking the French tax CVAE as income tax (please refer to Note 7).
21.1.5 Minority interestsMinority interests include shareholdings held by joint venture partners and other associates of the Group, mainly in Atos Worldline Processing Services in Germany (42%).
21.1.6 Adjusted net incomeThe Group share of net income before unusual, abnormal and infrequent items (net of tax) was EUR 196.0 million, increasing by 8.5% compared with last year.
(in EUR million)
12 months ended 31 December
2009
12 months ended 31 December
2008
net income - Group share 31.7 22.6
Restructuring (140.6) (98.1)
Rationalisation (86.3) (4.8)
Pensions 40.2 17.4
Release of opening balance sheet provisions no longer needed 13.4 9.8
Capital gains (15.3) 142.5
Impairment losses & Other (31.8) (232.8)
Sum of unusual items (220.4) (166.0)
Tax effect 56.1 8.0
Sum of unusual items – net of tax (164.3) (158.0)
ADjUSTED nET InCOME - GROUP SHARE 196.0 180.6
21 . Financial review21.1 Income statement

Atos Origin » Annual Report 2009 » 097www.atosorigin.com
21.2 Earnings per share
(in EUR million)
12 months ended
31 December 2009 % Margin
12 months ended
31 December 2008 % Margin
net income – Group share 31.7 0.6% 22.6 0.4%
Adjusted net income – Group share 196.0 3.8% 180.6 3.2%
(In EUR)
Basic EPS 0.46 0.33
Diluted EPS 0.44 0.33
Adjusted basic EPS 2.85 2.62
Adjusted diluted EPS 2.64 2.62
Based on a weighted average of 68,772,224 shares in issue during 2009, earnings per share (Group share) was EUR 0.46 compared to EUR 0.33 in 2008.
Based on the adjusted net income of EUR 196.0 million, basic earnings per share (Group share) were EUR 2.85 increasing by 8.8% compared to 2008.
21.3 Cash flow
The Group opened the year 2009 with a net debt of EUR 304.0 million. At the end of December 2009, it decreased to EUR 139.4 million. Consequently, the net cash flow of the Group reached EUR 164.6 million, including EUR 116.8 million of net operational cash flow and EUR 47.8 million portion of bonds convertible in equity.
The EUR 116.8 million of net operational cash flow primarily consisted in:
An OMDA at EUR 500.5 million, representing 9.8% of ■■
revenue (8.5% in 2008);A reduced capital expenditure at EUR 197.5 million ■■
(EUR 233.9 million in 2008) materializing the Group’s strategy to reduce its assets intensity;
A positive change in working capital requirement of ■■
EUR 34.6 million composed of:EUR 83.1 million representing the improvement in DSO -ratio from 63 days end of December 2008 to 57 days end of December 2009 reflecting a strong cash collection over the period and more particularly the decrease of the overdue as part of TOP Program (T18 initiative), and;A one-off cash out of EUR 48.5 million resulting from the -implementation in 2009 of a half year scheme for bonuses instead of yearly scheme in the previous years.
Restructuring and rationalisation expenses were ■■
EUR 135.0 million;Tax paid represented EUR 39.5 million, and the net cost ■■
of financial debt was EUR 13.3 million, strongly reduced compared to 2008, due to the combined effect of average debt reduction (-34%) and lower Euribor rate.
21 . Financial review21.2 Earnings per share21.3 Cash flow

Atos Origin » Annual Report 2009 » 098
(in EUR million)31 December
200931 December
2008
OMDA 500.5 476.9
Net capital expenditures (197.5) (233.9)
Change in working capital requirement 34.6 (86.2)
CFO (Cash from operation) 337.6 156.8
Taxes paid (39.5) (50.4)
Net cost of financial debt paid (13.3) (28.9)
Restructuring & rationalisation in other operating income (135.0) (103.3)
UK pensions plan amendment - (64.5)
Net financial investments (14.1) 208.9
Dividends paid (4.3) (31.9)
Purchase and sale of treasury stock 5.7 (14.9)
Portion of bonds convertible in equity 47.8 -
Other changes (*) (20.3) (37.8)
net cash flow 164.6 34.0
OPEnInG nET DEBT (304.0) (338.0)
CLOSInG nET DEBT (139.4) (304.0)
(*) Other changes include common stock issues, translation differences, profit-sharing amounts payable to French employees transferred to debt, disposal of operational assets, other financial items with cash impact and other operating income with cash impact excluding restructuring and rationalisation and UK pensions plan amendment.
21.3.1 Net Capital expendituresNet capital expenditures amounted to EUR 197.5 million in 2009, representing 3.9% of annual Group revenues as compared to 4.2% of annual Group revenues in 2008.
Over the first six months in 2009, net capital expenditures amounted to EUR 106.6 million. During the second half of 2009, net capital expenditures were reduced to EUR 90.9 million including a EUR 12.5 million investment for mainframe infrastructure in Germany.
Investments in 2009 represented EUR 204.8 million, main countries contributing to these investments are Worldline for EUR 51.3 million (Data Centers improvement for EUR 12.9 million, Automatic radar project for EUR 8.1 million), GCE for EUR 35.7 million (of which Mainframe for EUR 12.5 million and Storage project for EUR 2.5 million), The Netherlands for EUR 31.2 million (one third of it on Storage capacity increase), France for EUR 28.8 million due to new Managed Services contracts in public sector and the United Kingdom for EUR 26.8 million (75% client dedicated, mainly on Government contracts).
In addition, off-balance sheet commitments for operating leases on IT equipments have been further reduced from EUR 23.0 million at the end of December 2008 to EUR 10.2 million at the end of December 2009.
The improvement in 2009 has been achieved with a strong control of the life cycle of industrial assets. It is also resulting from the rationalisation plan of the IT infrastructure as part of the TOP Program (T19 initiative). It is the intent of the Group in 2010 to continue optimizing the financing of long term industrial investments on space capacity with specialised investors so as to reduce the capital intensity of the operations while remaining flexible.
21.3.2 Change in working capital requirementAs already explained above, the change in working capital requirement improved to EUR 34.6 million over 2009 compared to a deterioration of EUR 86.2 million in 2008.
21.3.3 Other changesOther changes include mainly the selling price related to the disposal of operational assets (EUR 6.6 million), other financial expenses with cash impact (EUR 5.3 million), other operating expense with cash impact excluding restructuring and rationalisation (EUR 4.8 million) and profit-sharing amounts payable to French employees transferred to debt (EUR 3.2 million).
21 . Financial review21.3 Cash flow

Atos Origin » Annual Report 2009 » 099www.atosorigin.com
21.4 Net debt
21.5 Financing policy
Overall during the year, the net debt was reduced from EUR 304.0 million to EUR 139.4 million. Net debt increased from EUR 304.0 million on 31 December 2008 to EUR 327.6 million on 30 June 2009, mainly due to working capital seasonal effects. It decreased from EUR 327.6 million on 30 June 2009 to EUR 139.4 million on 31 December 2009
thanks to the reduction of the working capital requirement and capital expenditure as well as the restatement against equity of a part of the convertible bonds (OCEANE) issued on 29 October (more details in Note 20 to the financial statements).
Atos Origin has implemented a strict financing policy which has been reviewed by the Group Audit Committee, with the objective to secure and optimise the Group’s liquidity management. Each decision regarding external financing is approved by the Board of Directors. Under this policy, all Group treasury activities, including cash management, short-term investments, hedging and foreign exchange transactions, as well as off-balance sheet financing through operating leases, are centrally managed through the Group Treasury department. Following a cautious short term financial policy, the Group did not make any short term cash investment in risky assets.
21.5.1 Financing structureAtos Origin’s policy is to cover fully its expected liquidity requirements by long-term committed loans or other appropriate long-term financial instruments. Terms and conditions of these loans include maturity and covenants leaving sufficient flexibility for the Group to finance its operations and expected developments.
On 29 October 2009, Atos Origin issued a convertible bond (OCEANE) of EUR 250.0 million maturing on 1 January 2016. Annual coupon paid to the bond holders is 2.50%. Effective interest rate calculated based on IAS 39 requirements amounted to 6.68%. Please refer to Note 20 of the financial statements. There is no financial covenant in respect with the convertible bond.
Atos Origin signed with a number of major financial institutions on 12 May 2005 a cost efficient EUR 1.2 billion multi-currency revolving facility with six and seven years maturity. The maturity of the multi-currency revolving facility is until 12 May 2011 for EUR 100 million and until 12 May 2012 for EUR 1.1 billion.
Atos Origin securitization program of trade receivables has been renewed for five years on 6 March 2009 with a maximum amount of receivables sold of EUR 500.0 million and a limit of maximum amount of financing of EUR 200.0 million. Financial covenants of the Atos Origin securitization program are aligned with the covenants of the EUR 1.2 billion multi-currency revolving facility.
21.5.2 Bank covenantsThe Group is substantially within its borrowing covenants, with a consolidated leverage ratio (net debt divided by OMDA) of 0.28 at the end of December 2009. The consolidated leverage ratio may not be greater than 2.5 times under the terms of the multi-currency revolving facility.
The consolidated interest cover ratio (operating margin divided by the net cost of financial debt) was 21.48 times in 2009. It may not be less than four times throughout the term of the multi-currency revolving facility.
21.5.3 Investment policyAtos Origin has a policy to lease its office space and data processing centres. Some fixed assets such as IT equipment and company cars may be financed through leases. The Group Treasury department evaluates and approves the type of financing for each new investment.
21.5.4 Hedging policyAtos Origin’s objective is also to protect the Group against fluctuations in interest rates by swapping to fixed rate a portion of the existing floating-rate financial debt. Authorised derivative instruments used to hedge the debt are swap contracts, entered into with leading financial institutions and centrally managed by the Group Treasury Department.
21 . Financial review21.4 Net debt21.5 Financing policy

Atos Origin » Annual Report 2009 » 100
22 . Financial statements
22.1 Statutory Auditors report on the consolidated financial statements for the year ended 31 december 2009
22.1 Statutory Auditors report on the consolidated financial statements for the year ended 31 December 2009 100
22.2 Consolidated financial statements 10222.3 Notes to the consolidated financial statements 106
22.4 Parent company summary financial statements 15522.5 Statutory auditors’s report on annual financial
statements year ended 31 December 2009 17722.6 Statutory auditors’ special report
on agreements involving members of the Board of Directors 178
This is a free translation into English of the statutory auditors’ report on the consolidated financial statements issued in the French language and it is provided solely for the convenience of English speaking users.The statutory auditors’ report includes information specifically required by French law in such reports, whether modified or not. This information is presented below the audit opinion on the consolidated financial statements and includes an explanatory paragraph discussing the auditors’ assessments of certain significant accounting and auditing matters. These assessments were made for the purpose of issuing an audit opinion on the consolidated financial statements taken as a whole and not to provide separate assurance on individual account balances, transactions or disclosuresThis report also includes information relating to the specific verification of information given in the management report and in the document addressed to the shareholders.This report should be read in conjunction with, and is construed in accordance with, French law and professional auditing standards applicable in France.
To the Shareholders,
In compliance with the assignment entrusted to us by your Annual General Meeting, we hereby report to you, for the year ended 31 December 2009, on:
the audit of the accompanying consolidated financial ■■
statements of Atos Origin;the justification of our assessments;■■
the specific verification required by law.■■
These consolidated financial statements have been approved by the Board of Directors. Our role is to express an opinion on these consolidated financial statements based on our audit.
I. Opinion on the consolidated financial statements
We conducted our audit in accordance with professional standards applicable in France. Those standards require that we plan and perform the audit to obtain reasonable assurance about whether the consolidated financial statements are free of material misstatement. An audit involves performing procedures, using sampling techniques or other methods of selection, to obtain audit evidence about the amounts and disclosures in the consolidated financial statements. An audit also includes evaluating the appropriateness of accounting policies used and the reasonableness of accounting estimates made, as well as the overall presentation of the consolidated financial statements. We believe that the audit evidence we have obtained is sufficient and appropriate to provide a basis for our opinion.
In our opinion, the consolidated financial statements give a true and fair view of the assets and liabilities and of the financial position of the Group as at 31 December 2009 and of the results of its operations for the year then ended in accordance with International Financial Reporting Standards as adopted by the European Union.
Without qualifying our opinion, we draw your attention to the matter set out in the note “Basis of preparation and significant accounting policies” of the consolidated financial statements regarding the application of new standards and interpretations from 1 January 2009.
II. Justification of our assessments
In accordance with the requirements of article L. 823-9 of the French Commercial Code (Code de commerce) relating to the justification of our assessments, we bring to your attention the following matters:

Atos Origin » Annual Report 2009 » 101www.atosorigin.com
As specified in the note “Accounting estimates and judgments” to the consolidated financial statements, presented in section “Basis of preparation and significant accounting policies”, the preparation of the consolidated financial statements requires management to make judgments, estimates and assumptions that affect the reported amounts of assets and liabilities, income and expenses in the financial statements and disclosures of contingent assets and liabilities. This note specifies that the estimates, assumptions and judgments may result in a significant adjustment to the carrying amounts of assets and liabilities within the next financial statements. As part of our audit of the consolidated financial statements for the year ended 31 December 2009, we considered that goodwills, revenue, profit or loss on completion relating to long-term contracts and pensions are subject to significant accounting estimates.
The value of goodwills was subject to an impairment test ■■
by the company as described in section “Business combination and goodwill” presented in section “Basis of preparation and significant accounting policies” and in the note “Goodwill” to the consolidated financial statements. As a result of this process, an impairment charge of euros 31.1 million was recorded. Based on the information provided to us, our work consisted on assessing the appropriateness of the methodology applied and the data used to determine the value-in-use, especially to review the cash-flow projections for each cash generating units (“CGU”) and the actual performance against budget, and on verifying the consistency of assumptions with forecasts from each CGU ‘s financial business plan approved by Management.
The note “Revenue recognition” presented in section ■■
“Basis of preparation and significant accounting policies” in the notes to consolidated financial statements outlines the methods applied with respect to revenue recognition.
Based on the information provided to us, our work consisted on assessing the appropriateness of the information provided in the note mentioned above and on ensuring that the accounting methods and principles are correctly applied. In addition, our work consisted on assessing the reasonableness of the accounting estimates used by Management.
As specified in the note “Pensions and similar benefits” ■■
to the consolidated financial statements, presented in section “Basis of preparation and significant accounting policies”, the company uses actuarial methods and actuarial assumptions to evaluate the pension commitments. The value of plan assets is measured on the basis of valuations performed by external actuaries and these assets are subject to additional verifications by Management if necessary. Based on the information provided to us, our work consisted on assessing the appropriateness of the methodology applied and the data used to determine the pension provisions and the plan assets valuation, and on verifying the consistency of assumptions used.
These assessments were made as part of our audit of the consolidated financial statements taken as a whole, and therefore contributed to the opinion we formed which is expressed in the first part of this report.
III. Specific verification
As required by French law, in accordance with professional standards applicable in France, we have also verified the information presented in the Group’s management report. We have no matters to report as to its fair presentation and its consistency with the consolidated financial statements.
neuilly-sur-Seine and Paris, 31 March 2010
The Statutory Auditors
Deloitte & Associés Grant ThorntonFrench member of Grant Thornton International
Tristan Guerlain Christophe Patrier Jean-Pierre Colle Vincent Frambourt
22 . Financial statements22.1 Statutory Auditors report on the consolidated financial statements for the year ended 31 December 2009

Atos Origin » Annual Report 2009 » 102
22.2 Consolidated financial statements
22.2.1 Consolidated income statement
(in EUR million) notes
12 months ended 31 December
2009
12 months ended 31 December
2008Revenue note 2 5,127.0 5,623.5Personnel expenses Note 3 (2,883.2) (3,082.9)Operating expenses Note 4 (1,953.8) (2,274.2)Operating margin 290.0 266.4% of revenue 5.7% 4.7%Other operating income and expenses Note 5 (220.4) (166.0)Operating income 69.6 100.4% of revenue 1.4% 1.8%Net cost of financial debt (13.5) (28.7)Other financial income and expenses (10.9) 5.9Net financial income Note 6 (24.4) (22.8)Tax charge Notes 7-8 (9.4) (48.1)Share of net income from associates - (0.1)
nET InCOME 35.8 29.4Of which:- Group share 31.7 22.6- Minority interests Note 9 4.1 6.8
(in EUR and number of shares)
12 months ended 31 December
2009
12 months ended 31 December
2008
net income-Group share per share Note 10Weighted average number of shares 68,772,224 68,810,885Basic earnings per share 0.46 0.33Diluted weighted average number of shares 74,420,585 68,885,164Diluted earnings per share 0.44 0.33
22.2.2 Consolidated Statement of comprehensive income
(in EUR million)
12 months ended 31 December
2009
12 months ended 31 December
2008
Profit for the period 35.8 29.4Other comprehensive incomeCash flow hedging :- Current period gains / (losses) 2.9 (5.6)- Reclassification to profit or loss 2.5 (1.0)Income tax relating to cash flow hedging (1.2) 1.7Exchange differences on translation of foreign operations 24.4 (150.2)Total Other comprehensive income 28.6 (155.1)TOTAL COMPREHEnSIvE InCOME FOR THE PERIOD 64.4 (125.7)Of which:
- Group share 60.3 (132.2)- Minority interests 4.1 6.5
22 . Financial statements22.2 Consolidated financial statements

Atos Origin » Annual Report 2009 » 103www.atosorigin.com
22.2.3 Consolidated balance sheet
(in EUR million) notes 31 December 2009 31 December 2008
ASSETS
Goodwill Note 11 1,507.6 1,511.1
Intangible assets Note 12 68.9 77.5
Tangible assets Note 13 407.4 454.3
Non-current financial assets Note 14 138.7 68.5
Deferred tax assets Note 8 208.0 208.4
Total non-current assets 2,330.6 2,319.8
Trade accounts and notes receivables Note 15 1,281.3 1,418.0
Current tax assets 26.3 25.4
Other current assets 164.4 177.7
Current financial instruments Note 21 3.8 0.7
Cash and cash equivalents Note 17 534.7 286.1
Total current assets 2,010.5 1,907.9
TOTAL ASSETS 4,341.1 4,227.7
(in EUR million) notes 31 December 2009 31 December 2008
LIABILITIES AnD SHAREHOLDERS’ EQUITY
Common stock 69.7 69.7
Additional paid-in capital 1,329.7 1,329.7
Consolidated reserves 365.6 286.5
Translation adjustments (152.7) (177.1)
Net income for the period 31.7 22.6
Shareholders’ equity – Group share 1,644.0 1,531.4
Minority interests Note 9 10.1 11.0
Total shareholders’ equity 1,654.1 1,542.4
Provisions for pensions and similar benefits Note 18 223.1 221.5
Non-current provisions Note 19 126.6 99.8
Borrowings Note 20 483.4 313.5
Deferred tax liabilities Note 8 61.3 69.8
Non-current financial instruments Note 21 4.3 6.1
Other non-current liabilities 1.1 1.4
Total non-current liabilities 899.8 712.1
Trade accounts and notes payables Note 22 475.3 516.8
Current tax liabilities 28.3 41.2
Current provisions Note 19 135.2 96.2
Current financial instruments Note 21 1.2 3.0
Current portion of borrowings Note 20 190.7 276.6
Other current liabilities Note 23 956.5 1,039.4
Total current liabilities 1,787.2 1,973.2
TOTAL LIABILITIES AnD SHAREHOLDERS’ EQUITY 4,341.1 4,227.7
22 . Financial statements22.2 Consolidated financial statements

Atos Origin » Annual Report 2009 » 104
22.2.4 Consolidated cash flow statement
(in EUR million) notes
12 months ended
31 December 2009
12 months ended
31 December 2008
net income Group share 31.7 22.6
Depreciation of fixed assets Note 4 222.0 241.3
Net release to operating provisions (33.9) (48.4)
Net charge / (release) to financial provisions 7.2 (17.8)
Net charge / (release) to other operating provisions 44.6 (85.0)
Impairment of long – term assets 31.1 226.4
(Gains)/ losses on disposals of fixed assets 5.7 (140.8)
Net charge for equity-based compensation 15.1 14.6
Minority interests and associates Note 9 4.1 6.8
(Gains)/ losses on financial instruments (2.2) 1.5
Net cost of financial debt Note 6 13.5 28.7
Tax charge (including deferred tax) Note 7 9.4 48.1
Cash from operating activities before change in working capital requirement, financial interest and taxes 348.3 298.0Taxes paid (39.5) (50.4)
Change in working capital requirement 34.6 (86.2)
net cash from/ (used in) operating activities 343.4 161.4
Payment for tangible and intangible assets (204.8) (260.9)
Proceeds from disposals of tangible and intangible assets 7.3 27.0
net operating investments (197.5) (233.9)
Amounts paid for acquisitions and long-term investments (17.0) (7.5)
Cash and cash equivalents of companies purchased during the period 1.2 0.3
Proceeds from disposals of financial investments 3.3 291.6
Cash and cash equivalents of companies sold during the period (1.6) (145.4)
net long-term investments (14.1) 139.0
net cash from/ (used in) investing activities (211.6) (94.9)
Common stock issues on the exercise of equity-based compensation 0.1 0.2
Portion of convertible bonds : - in equity Note 20 47.8 -
- in financial liability Note 20 200.7 -
Purchase and sale of treasury stock 5.7 (14.9)
Dividends paid to parent company shareholders - (27.8)
Dividends paid to minority shareholders of subsidiaries (4.3) (4.1)
New borrowings Note 20 33.0 116.4
New Finance lease Note 20 2.3 1.3
Repayment of long and medium-term borrowings Note 20 (132.0) (163.2)
Net cost of financial debt paid (13.3) (28.9)
net cash from/ (used in) financing activities 140.0 (121.0)
Increase/ (decrease) in net cash and cash equivalents 271.8 (54.5)
Opening net cash and cash equivalents 261.9 348.0
Increase/ (decrease) in net cash and cash equivalents Note 20 271.8 (54.5)
Impact of exchange rate fluctuations on cash and cash equivalents (0.8) (31.6)
CLOSInG nET CASH AnD CASH EQUIvALEnTS note 21 532.9 261.9
22 . Financial statements22.2 Consolidated financial statements

Atos Origin » Annual Report 2009 » 105www.atosorigin.com
22.2.5 Consolidated statement of changes in shareholders’ equity
(in EUR million)
number of shares at
period-end (thousands)
Common Stock
Additional paid-in capital
Consolidated reserves
Translation adjustments
Items recognized
directly in equity
net income Group share
Equity – Group
shareMinority interests TOTAL
At 31 December 2007 69,710 69.7 1,329.5 271.9 (27.2) (0.6) 48.2 1,691.5 172.9 1,864.4
* Common stock issued 7 0.2 0.2 0.2
* Appropriation of prior period net income
48.2 (48.2) - -
* Dividends (27.8) (27.8) (4.1) (31.9)
* Equity-based compensation 14.6 14.6 14.6
* Changes in treasury stock (14.9) (14.9) (14.9)
* Other - (164.3) (164.3)
Transactions with owners 7 0.2 20.1 (48.2) (27.9) (168.4) (196.3)
* Net income for the period 22.6 22.6 6.8 29.4
* Other Comprehensive income
(149.9) (4.9) (154.8) (0.3) (155.1)
Total comprehensive income for the period
(149.9) (4.9) 22.6 (132.2) 6.5 (125.7)
At 31 December 2008 69,717 69.7 1,329.7 292.0 (177.1) (5.5) 22.6 1,531.4 11.0 1,542.4
* Common stock issued 3 - -
* Appropriation of prior period net income
22.6 (22.6) - -
* Dividends - (5.0) (5.0)
* Equity-based compensation 15.1 15.1 15.1
* Changes in treasury stock 5.7 5.7 5.7
* Equity portion of compound instrument
31.3 31.3 31.3
* Other 0.2 0.2 0.2
Transactions with owners 3 74.9 (22.6) 52.3 (5.0) 47.3
* Net income for the period 31.7 31.7 4.1 35.8
* Other Comprehensive income
24.4 4.2 28.6 28.6
Total comprehensive income for the period
24.4 4.2 31.7 60.3 4.1 64.4
AT 31 DECEMBER 2009 69,720 69.7 1,329.7 366.9 (152.7) (1.3) 31.7 1,644.0 10.1 1,654.1
22 . Financial statements22.2 Consolidated financial statements

Atos Origin » Annual Report 2009 » 106
22.3 Notes to the consolidated financial statements
2.3.1 General informationAtos Origin, the Group’s parent company, is a Société Anonyme (commercial company) incorporated under French law, whose registered office is located at 18, avenue d’Alsace, Paris La Défense, 92400 Courbevoie, France. It is registered with the Nanterre Register of Commerce and Companies under the reference 323 623 603 RCS Nanterre. Atos Origin shares are traded on the Paris Eurolist Market under Euroclear code 5173 ISIN FR0000051732. The shares are not listed on any other stock exchange and Atos Origin SA is the only listed company in the Group. The Company is administrated by a Board of Directors.
The consolidated financial statements of the Group for the twelve months ended 31 December 2009 comprise the Group and its subsidiaries (together referred to as the “Group”) and the Group’s interests in associates and jointly controlled entities.
These consolidated financial statements were approved by the Board of Directors on 16 February 2010. These consolidated financial statements will become definitive following their adoption by the Annual General Shareholders’ Meeting planned in May 2010.
22.3.2 Basis of preparation and significant accounting policies
Basis of preparation
Pursuant to European Regulation No. 1606/2002 of 19 July 2002, the consolidated financial statements for the twelve months ended 31 December 2009 have been prepared in accordance with the applicable international accounting standards, as endorsed by the European Union and of mandatory application as at 31 December 2009. The international standards comprise the International Financial Reporting Standards (IFRS), the International Accounting Standards (IAS), the interpretations of the Standing Interpretations Committee (SIC) and the International Financial Reporting Interpretations Committee (IFRIC).
Accounting policies applied by the Group comply with those standards and interpretations, which can be found at: http://ec.europa.eu/internal_market/accounting/ias/index_fr.htm
The following standards, interpretations and amendments to existing standards that have been published are mandatory for the Group’s accounting period beginning on or after 1 January 2009:
IAS 1 (revised) – Presentation of financial statements;■■
IAS 23 (revised) – Borrowing Costs;■■
IAS 1 and IAS 32 – Amendments relating to Puttable ■■
Financial Instruments and Obligations Arising on Liquidation;IAS 39 and IFRIC 9 – Amendments relating to Embedded ■■
Derivatives;IFRS 1 and IAS 27 – Amendments relating to Cost of an ■■
Investment in a Subsidiary, Jointly Controlled Entity or Associate;IFRS 2 – Amendment relating to vesting conditions and ■■
cancellations;IFRS 7 – Improving Disclosures about Financial ■■
Instruments;IFRS 8 – Operating Segments;■■
IFRIC 11 – Group and Treasury Share transactions;■■
IFRIC 14 – IAS 19 – The Limit on a Defined Benefit Asset, ■■
Minimum Funding Requirements and their Interaction;Annual improvements to IFRS, issued by the IASB in May ■■
2008 (excluding IFRS 5 amendments).
IFRIC 14 had been applied by anticipation by the Group in 2008.
The effect of IFRS 8 is disclosed in Note 2.
As required by IAS 1 revised, the Group has elected to include a “Statement of Comprehensive Income” alongside the income statement, comprising net income for the year and income and expenses recognised directly in equity.
The impact of the other changes in standards, interpretations and amendments on the Group’s Financial Statements is limited.
The consolidated financial statements do not take into account:
Draft standards that are still at the exposure draft stage ■■
of the International Accounting Standards Board (IASB).New standards, interpretations and amendments to ■■
existing standards not yet approved by the European Union. This notably concerns:
IAS 24 (Revised) – Related Party Disclosures -IFRS 2 – Amendment relating to Group Cash-settled -Share-based Payment Transactions;IFRS 9 – Financial Instruments; -
22 . Financial statements22.3 Notes to the consolidated financial statements

Atos Origin » Annual Report 2009 » 107www.atosorigin.com
IFRIC 14 – Amendment relating to Prepayments of a -Minimum Funding Requirement;IFRIC 19 – Extinguishing Financial Liabilities with Equity -Instruments; Annual improvements to IFRS, issued by the IASB in -April 2009.
Standards, amendments or interpretations published by ■■
the IASB and endorsed by the European Union, which are applicable to fiscal years beginning after January 1, 2009. This notably concerns:
IFRS 1 (Revised) – First time adoption of IFRS; -IFRS 3 (revised) – Business Combinations; -IAS 27 (revised) – Consolidated and Separate Financial -Statements;IAS 39 – Amendments relating to Financial Instruments, -recognition and measurement: Eligible hedged ItemsIAS 32 – Amendment relating to Classification of Right -Issues;IFRS 5 Amendments from Annual Improvements to IFRS -issued by the IASB in May 2008;IFRIC 12 Service Concession Arrangements; -IFRIC 15 Agreements for the Construction of Real -Estate;IFRIC 16 Hedges of a Net Investment in a Foreign -Operation;IFRIC 17 Distributions of Non-cash Assets to Owners; -IFRIC 18 – Transfers of Assets from Customers. -
The potential impact of these standards, amendments and interpretations on the consolidated financial statements is currently being assessed.
The policies set out below have been consistently applied to all years presented.
Accounting estimates and judgments
The preparation of consolidated financial statements requires management to make judgments, estimates and assumptions that affect the reported amounts of assets and liabilities, income and expense in the financial statements and disclosures of contingent assets and liabilities. The estimates, assumptions and judgments that may result in a significant adjustment to the carrying amounts of assets and liabilities within the next financial statements are essentially related to:
Impairment testsThe Group tests at least annually whether goodwill has suffered any impairment, in accordance with the accounting policy stated below. The recoverable amounts of cash generating units are determined based on value-in-use calculations. These calculations require the use of estimates as described in Note 11.
Revenue recognition and associated costs on long-term contractsRevenue recognition and associated costs, including forecast losses on completion are measured according to policy stated below. Total projected contract costs are based on various operational assumptions such as forecast volume or variance in the delivery costs and have a direct influence on the level of revenue and eventual forecast losses on completion that are recognized.
PensionsThe Group uses actuarial assumptions and methods to measure pension liabilities and costs. The value of plan assets is determined based on valuations provided by the external custodians of pension funds and following complementary investigations carr ied-out when appropriate. The estimation of pensions liabilities, as well as valuations of plan assets requires the use of estimates and assumptions.
Consolidation methods
SubsidiariesSubsidiaries are entities controlled directly or indirectly by the Group. Control is defined by the ability to govern the financial and operating policies generally, but not systematically, combined with a shareholding of more than 50% of the voting rights. The existence and effect of potential voting rights that are currently exercisable or convertible, the power to appoint the majority of the members of the governing bodies and the existence of veto rights are considered when assessing whether the Group controls another entity. Subsidiaries are fully consolidated from the date on which control is transferred to the Group. They are de-consolidated from the date on which control ceases.
Joint venturesThe Group’s interests in jointly controlled entities are accounted for by proportionate method. Operating and shareholders’ agreements are considered when assessing the joint control.
AssociatesAssociates are entities over which the Group has significant influence but not control or joint control, generally, but not systematically, accompanying a shareholding of between 20 and 50% of the voting rights. Investments in associates are accounted for by the equity method.
22 . Financial statements22.3 Notes to the consolidated financial statements

Atos Origin » Annual Report 2009 » 108
Segment reporting
According to IFRS 8, reported operating segments profits are based on internal management reporting information that is regularly reviewed by the chief operating decision maker, and is reconciled to Group profit or loss. The chief operating decision maker assesses segments profit or loss using a measure of operating profit. The chief operating decision maker, who is responsible for allocating resources and assessing performance of the operating segments, has been identified as the company CEO and chairman of the Board of Directors who makes strategic decisions.
The internal management reporting is designed on two axes: Global Business Units and Service Lines (Consulting, Systems Integration and Managed Operations). Global Business Units has been determined by the Group as key by the Chief operating decision maker. As a result and for IFRS 8 requirements, the Group discloses Global Business Units as operating segments.
A GBU is defined as a geographical area or the aggregation of several geographical areas- except for the Worldline activities - which contains one or several countries, without taking into consideration the activities operated in each country. Each GBU are managed by dedicated members of the Executive Committee.
The measurement policies that the Group uses for segments reporting under IFRS 8 are the same as those used in its financial statements. Corporate entities are not presented as an operating segment. Therefore, their financial statements are used as a reconciling item (refer to Note 2 of the financial statements). Corporate assets which are not directly attributable to the business activities of any operating segments are not allocated to a segment, which primarily applies to the Group’s headquarters. Shared assets such as the European mainframe are allocated to the GBU where physically located whereas used by several GBUs.
Presentation rules
Current and non-current assets and liabilitiesAssets and liabilities classified as current are expected to be realised, used or settled during the normal cycle of operations, which can extend beyond 12 months following the period-end. All other assets and liabilities are classified as non-current. Current assets and liabilities, excluding the current portion of borrowings, financial receivables and provisions represent the Group’s working capital requirement.
Assets and liabilities held for sale or discontinued operationsShould there be assets and liabilities held for sale or discontinued operations they would be presented on separate lines in the Group’s balance sheet, without restatements for previous periods. They are measured at the lower of their carrying amount and fair value less costs to sell. Non-current assets and liabilities are classified as held for sale if their carrying amount will be recovered principally through a sale transaction rather than through continuing use. This condition is regarded as met only when the sale is highly probable and the assets and liabilities are available for immediate sale in their present condition.
Should these assets and liabilities represent either a complete business line or a GBU, the profit or loss from these activities are presented on a separate line of the income statement, and is restated in the cash flow statement and the income statement over all published periods.
Translation of financial statements denominated in foreign currencies
The balance sheets of companies based outside the euro zone are translated at closing exchange rates. Income statement items are translated based on average exchange rate for the period. Balance sheet and income statement translation adjustments arising from a change in exchange rates are recognized as a separate component of equity under Translation adjustments.
Goodwill and fair value adjustments arising on the acquisition of a foreign entity have been treated as assets and liabilities of that foreign entity and translated into euros at the closing date.
The Group does not consolidate any entity operating in a hyperinflationary economy.
22 . Financial statements22.3 Notes to the consolidated financial statements
Atos Origin » Annual Report 2009 » 109www.atosorigin.com
Translation of transactions denominated in foreign currencies
Foreign currency transactions are translated into the functional currency using the exchange rate prevailing at the dates of the transactions. Foreign exchange gains and losses resulting from the settlement of such transactions and from the translation at year-end exchange rates of monetary assets and liabilities denominated in foreign currencies are recognized in the income statement under the heading Other financial income and expenses, except where hedging accounting is applied as explained in the paragraph Financial assets – Derivative f inancial instruments.
Business combination and goodwill
A business combination may involve the purchase of another entity, the purchase of all the net assets of another entity or the purchase of some of the net assets of another entity that together form one or more businesses.
Major services contracts involving staff and asset transfers that enable the Group to develop or improve significantly its competitive position within a business or a geographical sector are considered for business combination accounting. Goodwill represents the excess of the cost of a business combination, including transaction expenses directly attributable to the business combination in accordance with IFRS 3, over the Group’s interest in the fair value of assets, liabilities and contingent liabilities acquired at the acquisition date.
Goodwill is allocated to Cash Generating Units (CGU) for the purpose of impairment testing. Goodwill is allocated to those CGU that are expected to benefit from synergies of the related business combination and represent the lowest level within the Group at which management monitors goodwill. A CGU is defined as the smallest identifiable group of assets that generates cash inflows that are largely independent of the cash inflows from other assets or group of assets. CGUs correspond to geographical areas where the Group has operations – except for the Worldline activities. The recoverable value of a CGU is based on the higher of its fair value less costs to sell and its value in use determined using the discounted cash-flows method. When this value is less than its carrying amount, an impairment loss is recognized in the operating income. The impairment loss is first recorded as an adjustment of the carrying amount of the goodwill allocated to the CGU and the remainder of the loss, if any, is allocated pro rata to the other long term assets of the unit.
The Cash Generating Units used for the impairment test are not larger than operating segments determinated in accordance with IFRS 8 Operating segments.
Goodwill is not amortised and is subject to an impairment test performed at least annually by comparing its carrying amount to its recoverable amount at the closing date based on December actuals and latest 3 year plan, or more often whenever events or circumstances indicate that the carrying amount could not be recoverable. Such events and circumstances include but are not limited to:
Significant deviance of economic performance of the ■■
asset when compared with budget;Signif icant worsening of the asset’s economic ■■
environment;Loss of a major client;■■
Significant increase in interest rates.■■
Intangible assets other than goodwill
Intangible assets other than goodwill consist primarily of software and user rights acquired directly by the Group, software and customer relationships acquired in relation with a business combination as well as internally developed software, provided that the following conditions are satisfied:
The costs can be attributed to the identified software ■■
and measured reliably;The technical feasibility of the software has been ■■
demonstrated;The Group has the intention and the capability to complete ■■
the software development and to use or sell it; andIt is probable that future economic benefits will flow to ■■
the Group.
Once all these criteria are reached, the majority of software development costs have been already incurred and consequently, most of software developments costs are expensed when incurred. In specific Business Process Outsourcing (BPO) cases where developments and adapting software costs are engaged only once agreements with clients are signed, those costs are capitalised and amortised in operating expenses over the term of the contract.
Intangible assets are amortised on a straight-line basis over their expected useful life, generally not exceeding five to seven years for software and ten years for customer relationships acquired in a business combination; their related depreciation are recorded in operating expenses.
22 . Financial statements22.3 Notes to the consolidated financial statements

Atos Origin » Annual Report 2009 » 110
Tangible assets
Tangible assets are recorded at acquisition cost. They are depreciated on a straight-line basis over the following expected useful lives:
Buildings 20 years■■
Fixtures and fittings 5 to 10 years■■
Computer hardware 3 to 5 years■■
Vehicles 4 years■■
Office furniture and equipment 5 to 10 years■■
Leases
Asset leases where the Group has substantially all the risks and rewards of ownership are classified as finance leases. Finance leases are capitalised at the lease’s inception at the lower of the fair value of the leased asset and the present value of the minimum lease payments. Assets acquired under finance lease are depreciated over the shorter of the assets’ useful life and the lease term.
Leases where the lessor retains substantially all the risks and rewards of ownership are classified as operating leases.
Impairment of assets other than goodwill
Assets that are subject to amortisation are tested for impairment whenever events or circumstances indicate that the carrying amount may not be recoverable. An impairment loss is recognized for the amount by which the asset’s carrying value exceeds its recoverable value.
Financial assets
Financial assets are accounted for at trade date.
Investments in non-consolidated companiesThe Group holds shares in companies without exercising significant influence or control. Investments in non-consolidated companies are treated as assets available for sale and recognized at their fair value. For listed shares, fair value corresponds to the share price at closing date. In the absence of an active market for the shares, the investments in non-consolidated companies are carried at historical cost. An impairment charge is recognized when there is objective evidence of a permanent or significant impairment in value. The most common financial criteria used to determine fair value are equity and earnings outlooks. Gains and losses arising from variation in the fair value of available for sale assets are recognized as “items recognized directly in equity”. If there is evidence that an asset is permanently impaired, the cumulative loss is written off in the income statement under “other financial income and expense”.
Loans, trade accounts and notes receivableLoans are part of non-current financial assets. Loans, trade accounts and notes receivable are recorded initially at their fair value and subsequently at their amortised value. The nominal value represents usually the initial fair value for trade accounts and notes receivable. In case of deferred payment over one year, where the effect is significant on fair value, trade accounts and notes receivables are discounted. Where appropriate, a provision is raised on an individual basis to take likely recovery problems into account.
Certain service arrangements might qualify for treatment as lease contracts if they convey a right to use an asset in return for payments included in the overall contract remuneration. If service arrangements contain a lease, the Group is considered to be the lessor regarding its customers. Where the lease transfers the risks and rewards of ownership of the asset to its customers, the Group recognizes assets held under finance lease and presents them as “Trade accounts and notes receivable” for the part that will be settled within 12 months, and “Non-current financial assets” for the part beyond 12 months.
Assets securitisationAssets securitisation programs, in which the Group retains substantially all the risks and rewards of ownership of the transferred assets, do not qualify for de-recognition. A financial liability for the consideration received is recognized. The transferred assets and the financial liability are valued at their amortised costs.
Derivative financial instruments Derivative instruments are recognized as financial assets or liabilities at their fair value. Any change in the fair value of these derivatives is recorded in the income statement as a financial income or expense, except when they are eligible for hedge accounting, whereupon:
For fair value hedging of existing assets or liabilities, the ■■
hedged portion of an instrument is measured on the balance sheet at its fair value. Any change in fair value is recorded as a corresponding entry in the income statement, where it is offset simultaneously against changes in the fair value of hedging instruments. For cash flow hedging, the effective portion of the change ■■
in fair value of the hedging instrument is directly offset in shareholders’ equity as “items recognized directly in equity”. The change in value of the ineffective portion is recognized in “Other financial income and expenses”. The amounts recorded in net equity are transferred to the income statement simultaneously to the recognition of the hedged items.
22 . Financial statements22.3 Notes to the consolidated financial statements

Atos Origin » Annual Report 2009 » 111www.atosorigin.com
Cash and cash equivalents
Cash and cash equivalents include cash at bank and money market securities that are convertible into cash at very short notice and are not exposed to any significant risk of impairment. Money market securities are recognized at their fair value. Changes in fair value are recorded in the income statement under “Other financial income and expenses”.
Cash and cash equivalents are measured at fair value through profit and loss.
Treasury stock
Atos Origin shares held by the parent company are recorded at their acquired cost as a deduction from consolidated shareholders’ equity. In the event of a disposal, the gain or loss and the related tax impacts are recorded as a change in consolidated shareholders’ equity.
Pensions and similar benefits
Employee benefits are granted by the Group through defined contribution and defined benefit plans. Defined contribution costs are recognized in the income statement based on contributions paid or due in respect of the accounting period when the related services have been accomplished by beneficiaries.
The valuation of Group commitments in respect of defined benefit plans is based on a single actuarial method known as the “projected unit credit method”. This method relies in particular on projections of future benefits to be paid to Group employees, by anticipating the effects of future salary increases. Its implementation further includes the formulation of specific assumptions, detailed in note 18, which are periodically updated, in close liaison with external actuaries used by the Group.
Plan assets usually held in separate legal entities are measured at their fair value, determined at closing.
The value of plan assets is determined based on valuations provided by the external custodians of pension funds and following complementary investigations carried-out when appropriate.
From one accounting period to the other, any difference between the projected and actual amounts of commitments in respect of pension plans and their related assets is cumulated at each benefit plan’s level to form actuarial differences. These actuarial differences may result either from changes in actuarial assumptions used, or from experience adjustments generated by actual developments differing, in the accounting period, from assumptions determined at the end of the previous accounting period.
Group final option in terms of recognition method for actuarial differences has not been elected yet, since an option has been introduced under IAS 19 to recognize these actuarial differences through equity. By application of the “corridor” method, the Group therefore continues to recognize in its profit and loss account only the portion of cumulated actuarial differences which is above a normative fluctuation margin of 10% of the greater, at closing, of plan commitments and their related assets. This portion is amortised over the remaining active life of the beneficiaries of each particular benefit plan.
Benefit plans costs are recognized in the Group’s operating income, except for interest costs on obligations, net of expected returns on plans assets, which are recognized in other financial income.
Provisions
Provisions are recognized when: The Group has a present legal, regulatory, contractual ■■
or constructive obligation as a result of past events; It is probable that an outflow of resources embodying ■■
economic benefits will be required to settle the obligation, and The amount has been reliably quantified.■■
Provisions are discounted when the time value effect is material. Changes in discounting effects at each accounting period are recognized in financial expenses.
22 . Financial statements22.3 Notes to the consolidated financial statements

Atos Origin » Annual Report 2009 » 112
Borrowings
Borrowings are recognized initially at fair value, net of debt issuance costs. Borrowings are subsequently stated at amortised costs. The calculation of the effective interest rate takes into account interest payments and the amortisation of the debt issuance costs.
Debt issuance costs are amortised in financial expenses over the life of the loan. The residual value of issuance costs for loans repaid in advance is expensed in the year of repayment.
Bank overdrafts are recorded in the current portion of borrowings.
Convertible bond OCEANE (bond convertible into and/or exchangeable for new or existing shares of Atos Origin)OCEANE are financial instruments defined as “compound financial instrument” composed of both a liability and an equity component, which have to be valued and recorded separately.
In order to evaluate the split between the liability and an equity component, the carrying amount of the liability component is determined in the first place by measuring the fair value of a similar liability (including any embedded non-equity derivative features) that does not have an associated equity component. The carrying amount of the equity instrument represented by the option to convert the instrument into ordinary shares is then determined by deducting the fair value of the financial liability from the fair value of the compound financial instrument as a whole.
Borrowing costsBorrowing costs primarily comprise interest on the Group’s borrowings.
Borrowing costs directly attributable to the acquisition, construction or production of a qualifying asset are capitalized during the period of time that is necessary to complete and prepare the asset for its intended use or sale.
Other borrowing costs are expensed in the period in which they are incurred and reported as financial expense.
Minority interests purchase commitments
Firm or conditional commitments under certain conditions to purchase minority interests are similar to a purchase of shares and are recorded in borrowings with an offsetting reduction of minority interests. When the cost of the purchase exceeds the amount of minority interests, the Group chooses to recognize the balance as goodwill. Any
further change in the fair value of the minority interests purchase commitment will also be recorded in goodwill.
Revenue Recognition
The Group provides information technology (IT) and business process outsourcing (BPO) services. Depending on the structure of the contract, revenue is recognized accordingly to the following principles:
Variable or fixed price contracts considerationsRevenue based on variable IT work units is recognized as the services are rendered.
Where the outcome of fixed price contracts such as Consulting and Systems Integration contracts can be estimated reliably, revenue is recognized using the percentage-of-completion (POC) method. Under the POC method, revenue is recognized based on the costs incurred to date as a percentage of the total estimated costs to fulfil the contract. Revenue relating to these contracts is recorded in the Consolidated Balance Sheet under “Trade accounts and notes receivable” for services rendered in excess of billing, while billing exceeding services rendered is recorded as deferred income under “Other current liabilities”. Where the outcome of a fixed price contract cannot be estimated reliably, contract revenue is recognized to the extent of contracts costs incurred that are likely to be recoverable.
Revenue for long-term fixed price Managed Operations services is recognized when services are rendered.
If circumstances arise, that change the original estimates of revenues, costs, or extent of progress toward completion, then revisions to the estimates are made. The Group performs ongoing profitability analyses of its services contracts in order to determine whether the latest estimates of revenue, costs and profits, require updating. If, at any time, these estimates indicate that the contract will be unprofitable, the entire estimated loss for the remainder of the contract is recorded immediately through a provision for estimated losses on completion.
Principal and agent considerationsRevenue is reported net of supplier costs when the Group is acting as an agent between the client and the supplier. Factors generally considered to determine whether the Group is a principal or an agent, are most notably whether it is the primary obligor to the client, it assumes credit and delivery risks, or it adds meaningful value to the supplier’s product or service.
22 . Financial statements22.3 Notes to the consolidated financial statements
Atos Origin » Annual Report 2009 » 113www.atosorigin.com
Multiple-element arrangements considerationsThe Group may enter into multiple-element arrangements, which may include combinations of different services. Revenue is recognized for the separate elements when they have been subject to a separate negotiation, the contractor and customer have been able to accept or reject that part of the contract relating to each component, and, each component’s costs and revenues can be identified. A group of contracts is combined and treated as a single contract when that group of contracts is negotiated as a single package and the contracts are so closely interrelated that they are, in effect, part of a single project with an overall profit margin, and the contracts are performed concurrently or in a continuous sequence.
Upfront payments considerationsUpfront payments to clients incurred at contract inception are recorded in “Other current assets” and spread as a reduction of revenue over the term of the contract. Upfront payments received from clients at contract inception are recorded in “Other current liabilities” and spread as an increase in revenue over the term of the contract.
Transition costs
Costs related to delivering Managed Operations services are generally expensed as incurred. However, certain transition costs incurred in the initial phases of outsourcing contracts can be deferred and expensed over the contract term, provided that they will be recovered. Capitalised transition costs are classified in “Trade accounts and notes receivable” of the Consolidated Balance Sheet and amortisation expense is recorded in “Operating expenses” in the Consolidated Income Statement.In case the contract turns out to be loss-making, capitalised transition costs are impaired for the related forecasted loss, before recognising an additional provision for estimated losses on completion when necessary.
Other operating income and expenses
“Other operating income and expenses” covers income or expense items that are unusual, abnormal and infrequent. They are presented below the operating margin.
Classification of charges to (or release from) restructuring and rationalisation provisions in the income statement depends on the nature of the plan:
Restructuring plans directly in relation with operations ■■
are classified within the Operating Margin;Restructuring plans related to business combinations or ■■
qualified as unusual, infrequent and abnormal are classified in the Operating Income;
If a restructuring plan qualifies for Operating income, the ■■
related real estate rationalisation expenses regarding premises and buildings is also presented in Operating income.
When accounting for business combinations, the Group may record provisions for risks, litigations, etc. in the opening balance sheet for a period of 12 months beyond the business combination date. After the 12-month period, unused provisions arising from changes in circumstances are released through the Income Statement under “Other operating income and expenses”.
“Other operating income and expenses” also include major litigations, and non-recurrent capital gains and losses on the disposal of tangible and intangible assets, significant impairment losses on assets other than financial assets, or any other item that is infrequent, unusual and abnormal.
Equity-based compensation
Stocks options are granted to management and certain employees at regular intervals. These equity-based compensations are measured at fair value at the grant date using the binomial option-pricing model. Changes in the fair value of options after the grant date have no impact on the initial valuation. The fair value of share options is recognized in “Personnel expenses” on a straight-line basis over the period during which those rights vest, using the straight-line method, with the offsetting credit recognized directly in equity.
In some tax jurisdictions, Group’s entities receive a tax deduction when stock options are exercised, based on the Group share price at the date of exercise. In those instances, a deferred tax asset is recorded for the difference between the tax base of the employee services received to date (being the future tax deduction allowed by local tax authorities) and the current carrying amount of this deduction, being nil by definition. Deferred tax assets are estimated based on the Group’s share price at each closing date, and are recorded in income tax provided that the amount of tax deduction does not exceed the amount of the related cumulative stock option expenses to date. The excess, if any, is recorded directly in the equity.
22 . Financial statements22.3 Notes to the consolidated financial statements

Atos Origin » Annual Report 2009 » 114
Employee Share Purchase Plans offer employees the opportunity to invest in Group’s shares at a discounted price. Shares are subject to a five-year lock-up period restriction. Fair values of such plans are measured taking into account:
The strike price based on the average opening share ■■
prices quoted over the 20 trading days preceding the date of grant;The 20% discount granted to employees;■■
The consideration of the five-year lock-up restriction to ■■
the extent it affects the price that a knowledgeable, willing market participant would pay for that share;The grant date: date on which the plan and its term and ■■
conditions, including the strike price, is announced to employees.
Fair values of such plans are fully recognized in “Personnel expenses” at the end of the subscription period.
The Group has also granted to management and certain employees’ free shares plans. The fair value of those plans corresponds to the value of the shares at the grant date and takes into account the employee turnover during the vesting period as well as the value of the lock-up period restriction when applicable. Free share plans result in the recognition of a personal expense spread over the rights vesting period.
Corporate income tax
The income tax charge includes current and deferred tax expenses. Deferred tax is calculated wherever temporary dif ferences occur between the tax base and the consolidated base of assets and liabilities, using the liability method. Deferred tax is valued using the enacted tax rate at the closing date that will be in force when the temporary differences reverse.
Deferred tax assets and liabilities are netted off at the taxable entity level, when there is a legal right to offset. Deferred tax assets corresponding to temporary differences and tax losses carried forward are recognized when they are considered to be recoverable during their validity period, based on historical and forecast information.
Deferred tax liabilities for taxable temporary differences relating to goodwill are recognized, to the extent they do not arise from the initial recognition of goodwill.
Deferred tax assets are tested for impairment at least annually at the closing date based on December actuals, business plans and impairment test data.
Earnings per share
Basic earnings per share are calculated by dividing the net income (Group share) by the weighted average number of ordinary shares outstanding during the period. Treasury shares deducted from consolidated equity are not taken into account in the calculation of basic or diluted earnings per share.
Diluted earnings per share are calculated by dividing the net income (Group share), adjusted for the financial cost (net of tax) of dilutive debt instruments, by the weighted average number of ordinary shares outstanding during the period, plus the average number of shares which, according to the share buyback method, would have been outstanding had all the issued dilutive instruments been converted (stock options and convertible debt).
The dilutive impact of each convertible instrument is determined in order to maximise the dilution of basic earnings per share. The dilutive impact of stock options is assessed based on the average price of Atos Origin shares over the period.
Related party transactions
Related party transactions include in particular transactions with:
Entities that directly, or indirectly through one or more ■■
intermediaries controls, has an interest in or has joint control over the Group;Key management personnel of the Group as defined as ■■
persons who have the authority and responsibility for planning, directing and controlling the activity of the Group, including members of the Board of Directors, Supervisory Board and Management Board, as well as the Executive Senior Vice Presidents.
22.3.3 Financial risk managementThe Group’s activities expose it to a variety of financial risks including liquidity risk, cash flow interest rate risk, credit risk and currency risk. Financial risk management is carried out by the Global Treasury Department and involves minimising potential adverse effects on the Group’s financial performance.
22 . Financial statements22.3 Notes to the consolidated financial statements

Atos Origin » Annual Report 2009 » 115www.atosorigin.com
Liquidity risk
Liquidity risk management involves maintaining sufficient cash and marketable securities and the availability of funding through an adequate amount of committed credit facilities.
Atos Origin’s policy is to cover fully its expected liquidity requirements by long-term committed loans or other appropriate long-term financial instruments. Terms and conditions of these loans include maturity and covenants leaving sufficient flexibility for the Group to finance its operations and expected developments.
Credit facilities are subject to financial covenants that are carefully followed by Group Treasury Department.
Maturity analysis of financial liabilities is disclosed in Note 21.
Cash flow interest rate risk
Cash flow interest rate risk arises mainly from borrowings. The management of exposure to interest rate risk encompasses two types:
A price risk on fixed-rate financial assets and liabilities. ■■
For example, by contracting a fixed-rate liability, the Group is exposed to potential opportunity losses should interest rates fall. A change in interest rates would impact the market value of fixed-rate financial assets and liabilities. However, this loss of opportunity would not impact financial income and expenses as reported in the Consolidated Income Statement and, as such, future net income of the Group up to maturity of these assets.A cash-flow risk on floating-rate financial assets and ■■
liabilities should interest rates increase.
The main objective of managing overall interest rate on the Group’s debt is to minimise the cost of debt and to protect the Group against fluctuations in interest rates by swapping to fixed rate a portion of the floating-rate financial debt. Authorised derivative instruments used to hedge the debt are swap contracts entered with leading financial institutions.
Credit risk
The Group has no significant concentrations of credit risk. The client selection process and related credit risk analysis is fully integrated within the global risk assessment project conducted throughout the life cycle of a project. Derivative counterparties and cash transactions are limited to high-credit quality financial institutions.
Currency risk
The Group’s financial performance is not materially influenced by fluctuations in exchange rate since a significant portion of the business takes place within the euro zone and costs and revenues are generally denominated in the same currency. The main residual exposures are primarily in British pounds, Indian rupees and US dollars.
The Group has established a policy for managing foreign exchange positions resulting from commercial and financial transactions denominated in currencies different from the local currency of the relevant entity. According to this policy, any material exposure must be hedged as soon as it occurs. In order to hedge its foreign exchange rate exposure, the Group uses a variety of financial instruments, mainly forward contracts and foreign currency swaps.
Price risk
The Group has no material exposure to the price of equity securities, nor is it exposed to commodity price risks.
22 . Financial statements22.3 Notes to the consolidated financial statements

Atos Origin » Annual Report 2009 » 116
22.3.4 Foreign currency translation rates
Country
31 December 2009 31 December 2008
Average rate Closing rate Average rate Closing rate
Argentina (ARS) ARS 100 = EUR 19.379 18.340 21.604 20.770
Brazil (BRL) BRL 100 = EUR 36.069 40.010 37.761 30.052
Chile (CLP) CLP 1000 = EUR 1.285 1.374 1.323 1.140
China (CNY) CNY 100 = EUR 10.533 10.164 9.817 10.438
Columbia (COP) COP 10000 = EUR 3.342 3.399 3.491 3.261
Hong Kong (HKD) HKD 100 = EUR 9.290 8.952 8.765 9.213
India (INR) INR 100 = EUR 1.486 1.491 1.580 1.487
Japan (JPY) JPY 10000 = EUR 76.958 75.838 66.106 78.958
Malaysia (MYR) MYR 100 = EUR 20.397 20.239 20.472 20.502
Mexico (MXN) MXN 100 = EUR 5.328 5.406 6.163 5.366
Middle-East (SAR) SAR 100 = EUR 19.187 18.551 18.201 19.020
Poland (PLN) PLN 100 = EUR 23.140 24.033 28.605 24.472
Singapore (SGD) SGD 100 = EUR 49.462 49.368 48.198 49.502
South Africa (ZAR) ZAR 100 = EUR 8.565 9.242 8.365 7.422
Sweden (SEK) SEK 100 = EUR 9.414 9.619 10.438 8.904
Switzerland (CHF) CHF 100 = EUR 66.232 67.168 62.954 66.476
Taiwan (TWD) TWD 100 = EUR 2.176 2.152 2.163 2.160
Thailand (THB) THB 100 = EUR - - 2.084 2.063
Turkey (TRY) TRY 100 = EUR 46.268 46.410 52.817 46.920
UAE (AED) AED 100 = EUR 19.594 18.953 18.587 19.434
United Kingdom (GBP) GBP 1 = EUR 1.122 1.109 1.264 1.053
USA (USD) USD 100 = EUR 72.006 69.420 68.248 71.403
Venezuela (VEB) VEB 10000 = EUR 3.353 3.241 3.181 3.325
22 . Financial statements22.3 Notes to the consolidated financial statements

Atos Origin » Annual Report 2009 » 117www.atosorigin.com
22.3.5 Notes to the consolidated financial statements
note 1 Changes of scope of consolidationSince January 1st 2009, there has been no significant change of scope.
note 2 Segment informationThe Group applies IFRS 8 for the first time in 2009 the adoption of IFRS 8 has changed the presentation of operating segments compared to the operating segments as defined by IAS 14. The main change that occurred when compared to previous years is the reporting of the Worldline activities as an operating segment.
The requirements of IFRS 8 are applied retrospectively and comparatives figures restated.
The Group operates in seven main Global Business Units as detailed below:
Operating segments Activities
France■■ Consulting, Systems Integration and Managed Services in France and Morocco.
Benelux■■ Consulting, Systems Integration and Managed Services in The Netherlands and Belux.
United Kingdom■■
Consulting, Systems Integration, Managed Services and business process outsourcing in the United Kingdom and Sweden.
Worldline■■ Hi-Tech Transactional Services (HTTS) in France, Belgium and Germany.
GCEMA■■
Systems Integration and Managed Services in Germany, Switzerland, Poland, Austria, Greece, Turkey and South Africa.
ISAM■■
Consulting, Systems Integration and Managed Services in Spain, Portugal, Andorra, Argentina, Brazil, Chile and Colombia.
Rest of the World■■
Consulting, Systems Integration and Managed Services in United States of America, Mexico, China, Taiwan, Japan, Malaysia, Singapore, Thailand, Indonesia, India, Italy and Atos Euronext Market Solutions (AEMS) activities.
Inter-segment transfers or transactions are entered into under the normal commercial terms and conditions that would also be available to unrelated third parties.
22 . Financial statements22.3 Notes to the consolidated financial statements

Atos Origin » Annual Report 2009 » 118
The operating segment information for the periods is as follows:
(in EUR million) France
Morocco BeneluxUnited
Kingdom Worldline GCEMA ISAM
Rest of the World
Total Operating segments
Global Delivery
LinesOther
Corporate EliminationTotal
Group
12 months ended 31 December 2009
External revenue by segment 1,133.6 996.9 901.9 843.9 566.9 403.5 278.3 5,125.0 1.0 1.0 5,127.0
% 22.1% 19.4% 17.6% 16.5% 11.1% 7.9% 5.4% 100.0% 100.0%
Inter-segment revenue 64.3 30.1 6.1 11.1 42.8 7.6 67.5 229.5 (229.5) 0.0
Total revenue 1,197.9 1,027.0 908.0 855.0 609.7 411.1 345.8 5,354.5 1.0 1.0 (229.5) 5,127.0
Segment operating margin
44.7 84.2 82.1 133.2 21.7 2.5 18.1 386.5 (26.4) (70.1) 290.0
% 3.9% 8.4% 9.1% 15.8% 3.8% 0.6% 6.5% 7.5% 5.7%
Total segment assets 676.3 698.4 688.7 598.2 349.2 292.5 230.5 3,533.8 38.3 3,572.1
Other Information on income statement
Depreciation of fixed assets (25.9) (39.7) (31.0) (43.2) (44.1) (4.9) (28.5) (217.3) (4.7) (222.0)
Other Informations
Year end headcount 12,401 7,750 6,269 4,804 3,746 7,432 6,270 48,672 364 49,036
Capital expenditure 28.8 31.5 26.8 51.3 35.6 4.5 17.3 195.8 9.0 204.8
Net debt 12.8 35.7 199.6 65.2 (55.7) 35.0 (71.9) 220.7 (81.3) 139.4
12 months ended 31 December 2008
External revenue by segment 1,170.8 1,175.4 950.2 813.8 610.3 453.6 449.4 5,623.5 5,623.5
% 20.8% 20.9% 16.9% 14.5% 10.9% 8.1% 8.0% 100.0% 100.0%
Inter-segment revenue 54.3 40.3 9.0 32.0 34.3 8.9 68.6 247.4 1.3 (248.7) 0.0
Total revenue 1,225.1 1,215.7 959.2 845.8 644.6 462.5 518.0 5,870.9 1.3 (248.7) 5,623.5
Segment operating margin
25.4 95.7 69.5 123.3 30.3 17.2 11.8 373.2 (24.1) (82.7) 266.4
% 2.2% 8.1% 7.3% 15.2% 5.0% 3.8% 2.6% 6.6% 4.7%TOTAL SEGMEnT ASSETS 712.7 664.7 673.3 630.6 398.8 338.3 250.1 3,668.5 39.3 3,707.8
Other Information on income statement
Depreciation of fixed assets (27.1) (38.9) (32.6) (45.0) (44.6) (5.4) (43.7) (237.3) (4.0) (241.3)
Other Informations
Year end headcount 12,737 9,038 6,313 4,847 3,838 8,298 5,613 50,684 291 50,975
Capital expenditure 35.1 38.1 35.1 35.4 46.3 6.5 53.7 250.2 10.7 260.9
Net debt (87.1) 52.5 192.7 107.7 30.0 37.3 (49.4) 283.7 20.3 304.0
The Group recorded a profit in the United Kingdom related to a settlement reached with Schlumberger regarding pension matters for EUR 8.3 million.
.
22 . Financial statements22.3 Notes to the consolidated financial statements

Atos Origin » Annual Report 2009 » 119www.atosorigin.com
22 . Financial statements22.3 Notes to the consolidated financial statements
The reportable assets are reconciled to total assets as follows:
(in EUR million) 12 months ended
31 December 2009
12 months ended 31 December 2008
Total segment assets 3,572.1 3,707.8
Tax Assets 234.3 233.8
Cash & Cash Equivalents 534.7 286.1
TOTAL ASSETS 4,341.1 4,227.7
The Group’s revenues from external customers are split into the following service lines:
(in EUR million) ConsultingSystems
IntegrationManaged Services HTTS *
Business Process
Outsourcing Unallocated Total Group
12 months ended 31 December 2009
External revenue by segment
247.9 1,893.1 1,953.1 878.8 153.1 1.0 5,127.0
% 4.8% 36.9% 38.1% 17.1% 3.0% - 100.0%
12 months ended 31 December 2008
External revenue by segment
349.5 2,216.0 2,116.1 775.4 166.5 - 5,623.5
% 6.2% 39.4% 37.6% 13.8% 3.0% - 100.0%
(*) HTTS Hi-Tech Transactional Services.
note 3 Personnel expenses
(in EUR million)
12 months ended 31 December
2009 % Revenue
12 months ended 31 December
2008 % Revenue
Wages and salaries (*) (2,205.3) 43.0% (2,359.2) 42.0%
Social security charges (658.4) 12.8% (667.6) 11.9%
Staff recruitment fees (**) (5.0) 0.1% (19.3) 0.3%
Tax, training, profit-sharing (50.0) 1.0% (66.0) 1.2%
Equity-based compensation (14.0) 0.3% (13.7) 0.2%
Net charge to provisions for staff expenses
1.3 0.0% 0.4 0.0%
Difference between pension contributions and net pension expense (***)
48.2 -0.9% 42.5 -0.8%
TOTAL (2,883.2) 56.2% (3,082.9) 54.8%
(*) of which EUR 1.8 million for restructuring in December 2009 compared to EUR 4.6 million in December 2008.(**) in the annual report 2008, staff recruitment fees were included in operating expenses detailed in Note 4.(***) difference between total cash contributions made to the pensions funds and the net pension expense under IAS19.

Atos Origin » Annual Report 2009 » 120
22 . Financial statements22.3 Notes to the consolidated financial statements
Equity-based compensation
The EUR 14.0 million charge recorded within operating margin for equity based compensation (EUR 13.7 million in 2008) is made of:
EUR 5.9 million related to the Management Incentive ■■
Plans (MIP) and Long-Term Incentive plans (LTI ) implemented in 2008 and in 2007, and of;EUR 8.1 million related to the stock option plans granted ■■
in 2009 and in previous years.
An additional EUR 1.1 million expense was recorded as other operating expense following the restructuring of certain beneficiaries.
Free share plansNo new free share plan was set up in 2009.■■
Most of the LTI 2007 plan has been vested in May 2009. ■■
Performance achieved was 104% of target performance and IFRS2 expense has been adjusted accordingly.LTI 2008 plan has been interrupted at the end of the first ■■
year (at 66% payout) and replaced by a stock options plan (cf. details below).2009 expense related to former LTI and MIP plans has ■■
been updated taking into account the number of free shares void following the departure of some beneficiaries from the Group.
Total expense in operating margin related to free share plans during the year is as follows:
(in EUR million) Year ended 31 December 2009 Year ended 31 December 2008
LTI 2008 1.1 2.2
MIP 2008 3.7 2.3
LTI 2007 0.1 2.2
MIP 2007 1.0 3.8
TOTAL 5.9 10.5
Stock option plansThe Group recognized a total expense of EUR 8.1 million on stock options (EUR 3.2 million in 2008). The 2009 expense comprises:
EUR 1.7 million related to plans granted in previous years and ■■
EUR 6.4 million related to plans launched in March, July and September 2009 as detailed below:■■
Date of grant number of shares initially granted 2009 expense (in EUR million)
26 March 2009 (*) 1,850,000 3.4
3 July 2009 1,443,500 2.5
4 September 2009 259,000 0.5
TOTAL 3,552,500 6.4
(*) Of which 15,000 shares were cancelled at inception of the plan.
Stock option plan - 26 March 2009 grant
The Board of Directors has decided on 26 March 2009 to propose to the beneficiaries of the LTI 2008 plan to interrupt the plan as at 31 December 2008 (subject to their formal approval) and to replace the free shares thereby cancelled by stock options to be granted in two separate plans in March and July 2009.
Consequently, the Group has granted stock options for a total of 1,850,000 options on 26 March 2009 to members of the Executive Committee and some other key managers.
This grant represents a total expense of EUR 8.0 million, of which EUR 3.4 million in 2009. Expected expense for 2010 is EUR 3.1 million.
The vesting period is gradual: options vest on successive equal portions over 3 years.
Each of these portions has a different strike price: EUR 20.64 for the first portion (vested in July 2010);■■
EUR 24.57 for the second portion (vested in July 2011);■■
EUR 29.49 for the third portion (vested in July 2012).■■

Atos Origin » Annual Report 2009 » 121www.atosorigin.com
22 . Financial statements22.3 Notes to the consolidated financial statements
Stock option plan – 3 July 2009 grant
On 3 July 2009, the Group has granted stock options for a total of 1,443,500 options to key managers. This grant represents a total expense of EUR 7.5 million, of which EUR 2.5 million in 2009. Expected expense for 2010 is EUR 3.4 million.
The vesting period is gradual: options vest on successive equal portions over 3 years.
Each of these portions has a different strike price: EUR 25.00 for the first portion (vested in July 2010);■■
EUR 30.00 for the second portion (vested in July 2011);■■
EUR 35.00 for the third portion (vested in July 2012).■■
Stock option plan – 4 September 2009 grant
On 4 September 2009, the Group has also granted stock options for a total of 259,000 options to other key managers. This grant represents a total expense of EUR 1.8 million, of which EUR 0.5 million in 2009. Expected expense for 2010 is EUR 1.0 million.
The vesting period is gradual: options vest on successive equal portions over 3 years.
Each of these portions has a different strike price: EUR 34.28 for the first portion (vested in July 2010);■■
EUR 40.81 for the second portion (vested in July 2011);■■
EUR 48.97 for the third portion (vested in July 2012).■■
Common features to the 2009 stock option plans
For each of these plans, the vesting of stock options related to portions 2 and 3 is subject to the realization of Group internal performance conditions. The assumption used for the computation of related costs is a 100% realisation of the performance conditions. Options are forfeited if the employee leaves the Group before the options vest, other than in exceptional circumstances.
Equity-based compensation has been determined based on the following hypothesis:
4 September 2009 3 july 2009 26 March 2009
Share price at grant date 33.86 25.16 20.70
Strike price 34.28/40.81/48.97 25/30/35 20.64/24.57/29.49
Expected volatility 30.93% 31.07% 30.10%
Expected life 60 months 60 months 60 months
Risk free rate 2.705% 2.738% 2.826%
Expected dividend yield 1% except 0% for 2009 1% except 0% for 2009 1% except 0% for 2009
Expected employee turnover 4% per year 4% per year 4% per year
Fair value of options granted 9.80/7.74/5.81 7.50/5.89/4.65 6.02/4.74/3.54
Expected volatility was determined in 2009 based on the smoothed historical volatility of the Group’s share price observed over a period consistent with the expected life of the option. Because of the atypical volatility observed recently on equity markets, this smoothing technique has been used as suggested by IFRS 2, and has led to the elimination, in the calculation of the annualized historical
volatility, of daily variations greater than 5%. The expected life used in the model has been adjusted based on management’s best estimate, for the effects of non-transferability, exercise restrictions and behavioural considerations.

Atos Origin » Annual Report 2009 » 122
22 . Financial statements22.3 Notes to the consolidated financial statements
Stock option plan granted in previous years
Main characteristics of stock options plans granted in previous years are detailed below:
23 December 2008
10 March 2008 29 March 2006
French plan
Foreign plan
French plan
Foreign plan
Share price at grant date 17.60 33.32 33.32 60.95 60.95
Strike price 18.4/22.0/26.4 34.7255 34.7255 59.99 59.99
Expected volatility 29.7% 31.0% 33.0% 25.0% 25.0%
Expected life 60 months 60 months 48 months 60 months 48 months
Risk free rate 2.78% 3.79% 3.74% 3.56% 3.42%
Expected dividend yield 1% 1% 1% 0% 0%
Fair value of options granted 4.5/3.5/2.5 9.66 9.06 18.3 16.0
ExPEnSE RECOGnIzED In 2009 (In EUR MILLIOn) 2.6 0.1 -1.0 (*)
(*) Total expense of the 29 March 2006 plan has been adjusted taking into account the number of stock option void following the departure of some beneficiaries from the Group.
Details of share options outstanding at the end of year were as follows:
12 months ended31 December 2009
12 months ended31 December 2008
numberof share options
Weighted average
strike pricenumber
of share options
Weighted average
strike price
Outstanding at the beginning of the year
7,153,540 53.4 5,982,272 62.2
Granted during the year 3,537,500 28.2 1,575,500 23.8
Forfeited during the year (142,555) 32.3 (182,033) 40.3
Exercised during the year (3,009) 25.9 (7,299) 25.9
Expired during the year (234,700) 132.0 (214,900) 94.2
Outstanding at the end of the year 10,310,776 43.3 7,153,540 53.4
Exercisable at the end of the year, below year-end stock price (*)
432,499 25.9 - -
(*) Year-end stock price: EUR 32.09 at 31 December 2009 and EUR 17.78 at 31 December 2008.
Options outstanding at the end of the year have a weighted average remaining contractual life of 6.4 years (2008: 5.8 years).

Atos Origin » Annual Report 2009 » 123www.atosorigin.com
22 . Financial statements22.3 Notes to the consolidated financial statements
note 4 Operating expenses
(in EUR million)
12 months ended
31 December 2009 % Revenue
12 months ended
31 December 2008 % Revenue
Subcontracting costs direct (572.1) 11.2% (765.9) 13.6%
Purchase hardware and software (158.3) 3.1% (128.1) 2.3%
Maintenance costs (253.8) 5.0% (271.1) 4.8%
Rent & Lease expenses (215.0) 4.2% (261.6) 4.7%
Telecom costs (114.9) 2.2% (120.5) 2.1%
Travelling expenses (117.7) 2.3% (148.4) 2.6%
Company cars (75.3) 1.5% (80.8) 1.4%
Professional fees (82.1) 1.6% (120.8) 2.1%
Taxes & Similar expenses (17.6) 0.3% (22.9) 0.4%
Others expenses (124.6) 2.4% (138.5) 2.5%
Subtotal expenses (1,731.4) 33.8% (2,058.6) 36.6%
Depreciation of fixed assets (222.0) 4.3% (241.3) 4.3%
Net charge to provisions (15.5) 0.3% 5.4 -0.1%
Gains / (Losses) on Disp of Assets (2.0) 0.0% (1.8) 0.0%
Trade Receivables write-off (6.5) 0.1% (3.5) 0.1%
Capitalized Production 23.6 -0.5% 25.6 -0.5%
Subtotal other expenses (222.4) 4.3% (215.6) 3.8%
TOTAL (1,953.8) 38.1% (2,274.2) 40.4%
note 5 Other operating income and expenses
(In EUR million)
12 months ended
31 December 2009
12 months ended
31 December 2008
Restructuring (140.6) (98.1)
Rationalisation (86.3) (4.8)
Pensions 40.2 17.4
Release of opening balance sheet provisions no longer needed 13.4 9.8
Capital gains and losses on disposal of assets (15.3) 142.5
Impairment gains / (losses) on long-term assets and other (31.8) (232.8)
TOTAL (220.4) (166.0)

Atos Origin » Annual Report 2009 » 124
Other operating income and expenses relate to income and expenses that are unusual, abnormal and infrequent and represent a net expense of EUR 220.4 million in 2009.
The following table analyses this amount by nature and destination:
(in EUR million)Group transformation
costs
Arcandor bankruptcy
impactOther non
recurring items Total
Staff restructuring (110.6) (30.0) - (140.6)
Paris offices rationalisation (36.0) - - (36.0)
Other locations rationalisation (43.4) (6.9) - (50.3)
Non-current and current assets write-off - (15.1) - (15.1)
Goodwill impairment - (31.1) - (31.1)
Dutch pension profit - - 38.9 38.9
Release of OBS provision and others - - 13.8 13.8
TOTAL (190.0) (83.1) 52.7 (220.4)
Analysed as:
Cash (154.0) (30.0) - (184.0)
Non cash (36.0) (53.1) 52.7 (36.4)
22 . Financial statements22.3 Notes to the consolidated financial statements
The Group has identified three major destinations of costs:The Group transformation costs; ■■
The impact of Arcandor bankruptcy and;■■
Other non recurring items.■■
Group transformation costs (EUR 190.0 million expense)The Group transformation costs are made of EUR 154.0 million which are cashed out mostly in years 2009 and 2010 (restructuring and rationalisation) and EUR 36.0 million charge which has no cash impact.
This latter amount relates to the remaining lease obligation of the five existing Paris’ sites which are being closed as part of the project to regroup 4,500 staff at the new headquarters of the Group in the city of Bezons, near Paris. This charge is fully financed by the new Group headquarter landlord through a 2 year rental exemption.
In term of accounting treatment, the remaining rental obligation net of future sub-rent is fully recorded in year 2009 operating income while all incentives granted by the new landlord (2 year rental exemption and leasehold improvement financing) will be recorded through the operating income spread over the duration of the new lease (12 years).
The EUR 154.0 million are made of EUR 110.6 million for staff restructuring costs and EUR 43.4 million for real estate rationalisation as part of TOP Program (T9 initiative).
The EUR 110.6 million charge is the consequence of both the Group workforce adaptation to the effects of the economic recession and the non recurring cost induced by the TOP Programs aimed at improving Group efficiency and productivity. The combination of these two actions affected mainly The Netherlands (EUR 44.2 million), France (EUR 17.4 million), Corporate (EUR 15.6 million), Central Europe excluding restructuring programs due to the bankruptcy of Arcandor Group (EUR 14.1 million), and Iberia (EUR 10.6 million).
Impact of the bankruptcy of Arcandor Group (EUR 83.1 million expense)In the first semester of 2009, the German operations of the Group have been impacted by the insolvency of their main client, the retail and travel Group Arcandor, formerly known as Karstadt-Quelle announced on 9 June 2009. This insolvency filing related to:
The retail business (supermarkets and department ■■
stores): Karstadt;The catalogue and internet sales’ business Quelle and ■■
Primondo;The in-house IT subsidiary Itellium.■■

Atos Origin » Annual Report 2009 » 125www.atosorigin.com
22 . Financial statements22.3 Notes to the consolidated financial statements
Arcandor was then placed under the administration of an Insolvency Administrator.
Consequently, the Group already recorded a provision for bad debt amounting to EUR 14.4 million within its first semester financial statements. This amount represents 95% of the value of the accounts receivable as at insolvency date.
During the second semester however, the Insolvency Administrator made public the following decisions:
The liquidation of the catalogue and internet sales’ business ■■
Quelle and Primondo announced on 19 October 2009;The launch of a Karstadt’s disposal process with the ■■
objective to complete in the first semester 2010.
In this new context, the Group entered in January 2010 into a new 3 year IT services contract with Karstadt based on revised scope and prices as well as a new delivery model. Nevertheless, due to the uncertainties of the disposal both in terms of timing and completion, the Group decided to take a conservative position by depreciating all assets related to the Karstadt contract and implemented a complete office rationalization. These measures were completed in addition to the staff restructuring plan related to the Quelle-Primondo liquidation (300 FTE).
Consequently, in application of IAS 36, the Group has accounted for an impairment of EUR 31.1 million on Germany Central Europe cash generating unit taking into consideration this new business environment. The comments on this charge are described in Note 11.
The future cash impact of this EUR 83.1 million charge is EUR 30.0 million.
Other non-recurring items (EUR 52.7 million profit)The other non-recurring items are non-cash related. This amount is made of the following items:
Dutch pension assets At the end of 2008, 15% of Dutch pension fund assets were held in hedge funds, asset backed securities and mortgage backed securities. At that time, the value of these assets was extremely difficult to assess due to their lack of liquidity in the context of the financial markets crisis. Consequently, the Group depreciated the fair value of such assets and recorded a EUR 38.9 million impairment of the related Dutch pension prepaid expenses. With the 2009 recovery of some underlying markets, the Dutch pension fund successfully disposed more than 80% of these assets at transaction or redemption amounts significantly above the book values as depreciated at 31 December 2008. As a result, the EUR 38.9 million depreciation recorded in 2008 has been reversed in other operating income.
Opening balance sheet (OBS) provisionsThe Group released EUR 13.4 million provisions linked to previous acquisitions and related mainly to extinct tax risks in the Group Business Units GCEMA, ISAM and the United Kingdom. This amount is comparable with last year.
note 6 net financial income
Net cost of financial debt
(in EUR million)
12 months ended
31 December 2009
12 months ended
31 December 2008
Net interest expenses (13.9) (31.2)
Interest on obligations under finance leases (0.4) (1.0)
Gain/(loss) on disposal of cash equivalents 0.8 2.5
Gain/(loss) on interest rate hedges of financial debt - 1.0
nET COST OF FInAnCIAL DEBT (13.5) (28.7)
The average net debt during the year 2009 was EUR 341.6 million. The average net cost of financial debt amounted to 3.96%.

Atos Origin » Annual Report 2009 » 126
Other financial income and expenses
(in EUR million)
12 months ended
31 December 2009
12 months ended
31 December 2008
Foreign exchange expense (1.9) (4.1)
Fair value gain/(loss) on forward exchange contracts held for trading 1.6 (1.8)
Other financial (expense) / income (10.1) 13.2
Discounting financial expenses (0.5) (1.4)
OTHER FInAnCIAL InCOME AnD ExPEnSES (10.9) 5.9
The Other financial expense for EUR 10.1 million relates mainly to pension expense for EUR 7.4 million, which represents the difference between the interests cost and
the expected return on plan assets (EUR 20.1 million profit in 2008). Please refer to Note 18 Pensions for further explanation.
note 7 Income tax expenses
Current and deferred taxes
(in EUR million)
12 months ended
31 December 2009
12 months ended
31 December 2008
Current taxes (27.0) (36.7)
Deferred taxes 17.6 (11.4)
TOTAL (9.4) (48.1)
Effective tax rate
The difference between the French standard rate of tax and the effective tax rate is shown as follows:
(in EUR million)
12 months ended
31 December 2009
12 months ended
31 December 2008
Net income before tax 45.2 77.6
French standard rate of tax 34.4% 34.4%
Theoretical tax charge at French standard rate (15.6) (26.7)
Impact of permanent differences 1.0 (3.3)
Differences in foreign tax rates 15.7 26.2
Unrecognised tax assets (15.8) (4.2)
Capital gains and goodwill impairment (0.6) (39.1)
Other 5.9 (1.0)
Group tax charge (9.4) (48.1)
EFFECTIvE TAx RATE 20.7% 62.0%
The Group effective tax rate is 20.7%.
Unrecognized tax assets negative var iation of EUR 15.8 million mainly relates to new unrecognized tax losses in Germany (EUR 9.7 million).
The line other (EUR 5.9 million) included in particular the permanent difference arising from the French Tax Credit, tax holidays benefits and unused withholding taxes.
22 . Financial statements22.3 Notes to the consolidated financial statements

Atos Origin » Annual Report 2009 » 127www.atosorigin.com
Restated effective tax rate
(in EUR million) 12 months ended
31 December 2009
Profit before tax 45.2Restructuring (140.6)Rationalisation (86.3)Pensions 40.2Release of opening balance sheet provisions no longer needed 13.4Capital gains (15.3)Impairment losses & Other (31.8)Profit before tax excluding unusual items 265.6Tax effect on unusual items 56.1Group tax charge 9.4Total of tax excluding unusual items 65.5RESTATED EFFECTIvE TAx RATE 24.7%
After restating the elements of the other operating income, the restated profit before tax is EUR 265.5 million, the restated tax charge is EUR 65.5 million and the restated effective tax rate is 24.7%.
In France, regarding the CVAE (Cotisation sur la Valeur Ajoutée des Entreprises) part of the new CET (Contribution
Economique Territoriale) set up by the 2010 Finance Bill, the Group has decided to qualify it as an Income tax in line with the accounting treatment followed for similar taxes in other countries. The Group has booked a net deferred tax liability of EUR 1.5 million for the timing differences on CVAE as at 31 December 2009.
note 8 Deferred taxes
(in EUR million)12 months ended
31 December 200912 months ended
31 December 2008
Deferred tax assets 208.0 208.4
Deferred tax liabilities 61.3 69.8
nET DEFERRED TAx 146.7 138.6
Breakdown of deferred tax assets and liabilities by nature
(in EUR million)Tax losses
carry forward Fixed assets Pensions Other Total
At 1 january 2008 42.2 41.7 81.3 13.3 178.5Charge to profit or loss for the year 12.6 7.5 (25.4) (6.1) (11.4)Charge to goodwill 0.9 - - 2.1 3.0Change of scope - 1.0 1.1 (3.7) (1.6)Charge to equity - - - 4.3 4.3Reclassification 4.1 (2.0) (2.6) 0.7 0.2Exchange differences (0.5) (10.4) (9.7) (13.8) (34.4)At 31 December 2008 59.3 37.8 44.7 (3.2) 138.6Charge to profit or loss for the year (0.9) 5.4 (29.4) 42.5 17.6Charge to goodwill - - - - -Change of scope - - - - -Charge to equity - - - (17.7) (17.7)Reclassification (0.2) - 0.4 (0.2) 0.0Exchange differences - 1.9 1.3 5.0 8.2AT 31 DECEMBER 2009 58.2 45.1 17.0 26.4 146.7
22 . Financial statements22.3 Notes to the consolidated financial statements
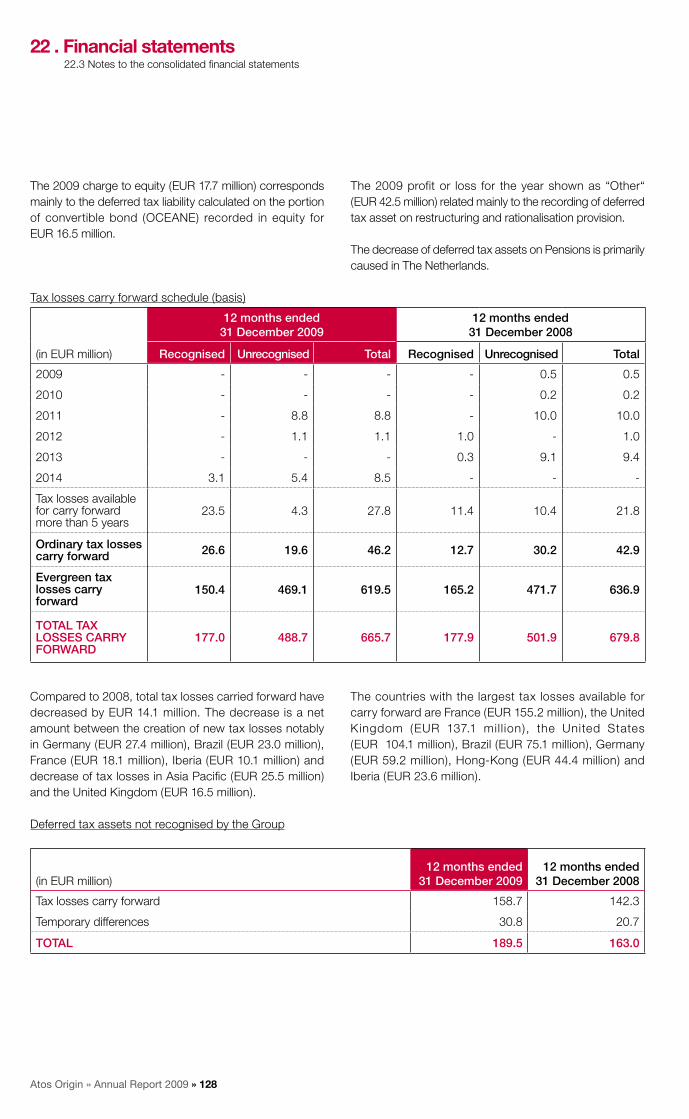
Atos Origin » Annual Report 2009 » 128
The 2009 charge to equity (EUR 17.7 million) corresponds mainly to the deferred tax liability calculated on the portion of convertible bond (OCEANE) recorded in equity for EUR 16.5 million.
The 2009 profit or loss for the year shown as “Other“ (EUR 42.5 million) related mainly to the recording of deferred tax asset on restructuring and rationalisation provision.
The decrease of deferred tax assets on Pensions is primarily caused in The Netherlands.
Tax losses carry forward schedule (basis)
(in EUR million)
12 months ended 31 December 2009
12 months ended 31 December 2008
Recognised Unrecognised Total Recognised Unrecognised Total
2009 - - - - 0.5 0.5
2010 - - - - 0.2 0.2
2011 - 8.8 8.8 - 10.0 10.0
2012 - 1.1 1.1 1.0 - 1.0
2013 - - - 0.3 9.1 9.4
2014 3.1 5.4 8.5 - - -
Tax losses available for carry forward more than 5 years
23.5 4.3 27.8 11.4 10.4 21.8
Ordinary tax losses carry forward 26.6 19.6 46.2 12.7 30.2 42.9
Evergreen tax losses carry forward
150.4 469.1 619.5 165.2 471.7 636.9
TOTAL TAx LOSSES CARRY FORWARD
177.0 488.7 665.7 177.9 501.9 679.8
Compared to 2008, total tax losses carried forward have decreased by EUR 14.1 million. The decrease is a net amount between the creation of new tax losses notably in Germany (EUR 27.4 million), Brazil (EUR 23.0 million), France (EUR 18.1 million), Iberia (EUR 10.1 million) and decrease of tax losses in Asia Pacific (EUR 25.5 million) and the United Kingdom (EUR 16.5 million).
The countries with the largest tax losses available for carry forward are France (EUR 155.2 million), the United Kingdom (EUR 137.1 mil l ion), the United States (EUR 104.1 million), Brazil (EUR 75.1 million), Germany (EUR 59.2 million), Hong-Kong (EUR 44.4 million) and Iberia (EUR 23.6 million).
Deferred tax assets not recognised by the Group
(in EUR million)12 months ended
31 December 200912 months ended
31 December 2008
Tax losses carry forward 158.7 142.3
Temporary differences 30.8 20.7
TOTAL 189.5 163.0
22 . Financial statements22.3 Notes to the consolidated financial statements

Atos Origin » Annual Report 2009 » 129www.atosorigin.com
note 9 Minority interests
(in EUR million)31 December
2008 2009 Income Others31 December
2009
Atos Worldline Processing GmbH 6.6 3.7 (3.3) 7.0
Others 4.4 0.4 (1.7) 3.1
TOTAL 11.0 4.1 (5.0) 10.1
(in EUR million)31 December
2007 2008 Income Others31 December
2008
Atos Euronext Market Solutions 163.0 2.1 (165.1) -
Atos Worldline Processing GmbH 5.7 3.2 (2.3) 6.6
Others 4.2 1.5 (1.3) 4.4
TOTAL 172.9 6.8 (168.7) 11.0
note 10 Earnings per share
Basic and diluted earnings per share are reconciled in the table below. Potential dilutive instruments comprise stock options and convertible bonds (equivalent to 5,414,771 shares). The convertible bonds are the only one which generates a restatement of net income used for the diluted EPS calculation. The restatement corresponds to the
interest expenses relating to the liability component net of deferred tax (EUR 0.8 million). The average number of stock options not exercised in 2009 amounted to 8,887,006 shares, out of which 233,590 have a dilutive effect on earnings per share.
(In EUR million and shares)31 December
200931 December
2008
net income - Group share [a] 31.7 22.6
net income restated of dilutive instruments - Group share [b] 32.5 22.6
Weighted average number of shares outstanding [c] 68,772,224 68,810,885
Impact of dilutive instruments [d] 5,648,361 74,279
Diluted weighted average number of shares [e]=[c]+[d] 74,420,585 68,885,164
Earnings per share in EUR [a]/[c] 0.46 0.33
Diluted earnings per share in EUR [b]/[e] 0.44 0.33
note 11 Goodwill
(in EUR million)31 December
2008Acquisitions / Depreciations Others
Exchange rate fluctuations
31 December 2009
Gross value 1,995.7 3.4 (1.5) 40.6 2,038.2
Impairment loss (484.6) (31.1) 1.1 (16.0) (530.6)
CARRYInG AMOUnT 1,511.1 (27.7) (0.4) 24.6 1,507.6
(in EUR million)31 December
2007Acquisitions / Depreciations Others
Exchange rate fluctuations
31 December 2008
Gross value 2,196.1 2.0 (8.0) (194.4) 1,995.7
Impairment loss (328.3) (226.4) - 70.1 (484.6)
CARRYInG AMOUnT 1,867.8 (224.4) (8.0) (124.3) 1,511.1
22 . Financial statements22.3 Notes to the consolidated financial statements

Atos Origin » Annual Report 2009 » 130
22 . Financial statements22.3 Notes to the consolidated financial statements
Goodwill are allocated to cash generating units (CGUs) that are then part of one of the operating segments disclosed in Note 2 Segment information as per IFRS 8 requirements. The adoption of IFRS 8 in replacement of IAS 14 as of 1 January 2009 did not trigger any reallocation of goodwill between CGUs.A summary of the carrying amounts of goodwill allocated by CGUs or grouping of CGUs is presented hereafter.
Overall, goodwill was reduced from EUR 1,511.1 million to EUR 1,507.6 million mainly due to the impairment charge of the year for EUR 31.1 million on Germany Central Europe CGU and by the effect of foreign exchange rates variations for EUR 24.6 million (The United Kingdom for EUR 21.2 million). Please refer to Note 5 Other operating income that explains the context in which this impairment was booked.
(In EUR million) 31 December 2009 31 December 2008
France & Morocco 178.8 178.8
The Netherlands 292.1 292.1
Belux 9.0 9.0
The United Kingdom 419.8 398.9
Worldline 301.5 301.5
GCEMA 101.8 132.5
ISAM 112.7 107.1
Rest of the world 91.9 91.2
TOTAL 1,507.6 1,511.1
The recoverable amount of a CGU is determined based on value-in-use calculations. These calculations use cash flow projections based on financial business plans approved by management, covering a three-year period. They are also based on the following assumptions:
Terminal value is calculated after the three-year period, ■■
using an estimated perpetuity growth rate of 2.5 % (as last year) consistent with forecasts from industry analysts;
Discount rates are applied by CGU based on the Group’s ■■
weighted average cost of capital and adjusted to take into account specific tax rates and country risks relating to each geographical area. As last year, the Group considers that the weighted average cost of capital should be determined based on an historical equity risk premium of 5.3%, in order to reflect the long-term assumptions factored in the impairment tests.
As a result, the discount rates used are presented hereafter, with the indication of corresponding pre-tax discount rates:
2009 Discount rate
Corresponding pre-tax Discount rate
2008 Discount rate
France & Morocco 9.6% 13.0% 9.6%
The Netherlands 9.7% 12.1% 9.7%
Belux 9.6% 13.2% 9.6%
The United Kingdom 9.7% 12.5% 9.7%
Worldline 9.6% 13.2% 9.6%
GCEMA Between 9.6% and 9.7% Between 11.7% and 12.0% 9.7%
ISAM Between 9.6% and 10.8% Between 12.5% and 14.4% Between 9.6% and 12.7%
Rest of the world Between 9.6% and 10.4% Between 11.5% and 13.2% Between 9.6% and 11.1%

Atos Origin » Annual Report 2009 » 131www.atosorigin.com
22 . Financial statements22.3 Notes to the consolidated financial statements
The Group has conducted a sensitivity analysis on the key assumptions used, mainly the discount rates and the perpetuity growth. The changes in impairment expense that would result from a change in hypothesis are presented below:
Change in impairment expense Maintain of discount ratesIncrease of discount rate
by 0.5 point
Maintain of perpetuity growth assumption Not applicable (17.8)
Decrease of perpetuity growth assumption by 0.5 point
(14.5) (38.4)
note 12 Intangible assets
(In EUR million) Gross value Amortisation net value
31 December 2007 242.1 (167.3) 74.9
Additions / charges 42.1 (42.1) -
Disposals / reversals (0.3) 0.3 -
Disposals of subsidiaries (0.7) 7.8 7.1
Exchange differences (18.6) 15.2 (3.4)
Impairment - (3.4) (3.4)
Others 16.3 (14.0) 2.3
31 December 2008 280.9 (203.4) 77.5
Additions / charges 18.6 (35.2) (16.6)
Disposals / reversals (12.8) 12.5 (0.3)
Impact of business combinations
0.6 - 0.6
Exchange differences 3.1 (2.6) 0.5
Impairment - (2.4) (2.4)
Others 34.1 (24.5) 9.6
31 DECEMBER 2009 324.5 (255.6) 68.9
Intangible assets dedicated to the client Arcandor have been impaired following its bankruptcy for EUR 1.7 million.
The impairment test shows that for two CGUs (Iberia and South America), the recoverable amount of assets is close to their book values. The recoverable amount of these assets would equal their book value should the discount
rate increase by 0.4 point for Iberia (from 9.6% to 10.0%) and South America (from 10.8% to 11.2%).

Atos Origin » Annual Report 2009 » 132
22 . Financial statements22.3 Notes to the consolidated financial statements
note 13 Tangible assets
(in EUR million)Land and buildings IT equipments Other assets Total
Gross value At 1 january 2009 256.6 907.4 78.6 1,242.6
Additions 24.8 95.1 41.2 161.1
Disposals (14.0) (71.3) (2.5) (87.8)
Exchange differences 3.2 3.6 0.2 7.0
Others 22.0 (34.8) (37.1) (49.9)
AU 31 DECEMBER 2009 292.6 900.0 80.4 1,273.0
Accumulated depreciationAt 1 january 2009 (132.1) (622.6) (33.5) (788.2)
Depreciation charge for the year (25.7) (144.5) (4.8) (175.0)
Eliminated on disposal 10.8 64.1 1.8 76.7
Exchange differences (1.7) (2.4) (0.2) (4.3)
Impairment (8.7) - (1.2) (9.9)
Others (0.2) 34.2 1.1 35.1
AT 31 DECEMBER 2009 (157.6) (671.2) (36.8) (865.6)
net valueAt 1 january 2009 124.5 284.8 45.0 454.3
AT 31 DECEMBER 2009 135.0 228.8 43.6 407.4
(in EUR million)Land and buildings IT equipments Other assets Total
Gross value At 1 january 2008 266.5 800.5 77.0 1,144.0
Additions 23.7 178.5 32.7 234.9
Disposals (24.0) (57.0) (9.7) (90.7)
Impact of business combinations 0.1 0.1 0.1 0.3
Disposal of subsidiaries (0.9) (8.4) (1.3) (10.6)
Exchange differences (16.5) (21.0) (1.4) (38.9)
Others 7.7 14.7 (18.8) 3.6
At 31 December 2008 256.6 907.4 78.6 1,242.6
Accumulated depreciationAt 1 january 2008 (129.0) (540.7) (37.2) (706.9)
Depreciation charge for the year (27.2) (152.8) (6.2) (186.2)
Eliminated on disposal 14.5 55.6 7.2 77.3
Exchange differences 8.6 13.5 0.9 23.0
Disposal of subsidiaries 1.0 4.7 0.2 5.9
Impairment - - - -
Others - (2.9) 1.6 (1.3)
At 31 December 2008 (132.1) (622.6) (33.5) (788.2)
net valueAt 1 january 2008 137.4 259.8 39.8 437.0
At 31 December 2008 124.5 284.8 45.0 454.3

Atos Origin » Annual Report 2009 » 133www.atosorigin.com
22 . Financial statements22.3 Notes to the consolidated financial statements
The tangible assets of the Group include mainly IT equipments used in the production centers, in particular the datacenters and the software factories. Moreover, Atos Origin’s policy is to rent its premises. Therefore, the land and buildings items include mainly technical infrastructure of our datacenters.
Acquisitions in 2009 represented a cash out for EUR 204.8 million, main countries contributing to these investments are Worldline for EUR 51.3 million (Data Centers improvement for EUR 12.9 million, Automatic radar project for EUR 8.1 million), GCE for EUR 35.7 million (of which Mainframe for EUR 12.5 million and Storage project for EUR 2.5 million), The Netherlands for EUR 31.2 million (one
third of it on Storage capacity increase), France for EUR 28.8 million due to new Managed Services contracts in public sector and the United Kingdom for EUR 26.8 million (75% client dedicated, mainly on Government contracts).
Fixed assets dedicated to the client Arcandor have been impaired following the bankruptcy for EUR 9.6 million.
Finance leasesTangible assets held under finance leases had a net carrying value of EUR 3.4 million. Future minimum lease payments under non-cancellable leases amounted to EUR 3.9 million at year-end.
(in EUR million)
2009 2008
Minimum lease payments Interest Principal
Minimum lease payments Interest Principal
Less than one year 3.3 (0.4) 2.9 8.6 (1.0) 7.6
Between one and five years
0.6 (0.1) 0.5 3.9 (0.6) 3.3
More than five years - - - - - -
TOTAL 3.9 (0.5) 3.4 12.5 (1.6) 10.9
note 14 non-current financial assets
(in EUR million) notes 31 December 2009 31 December 2008
Pension prepayments Note 18 114.4 36.5
Non-current financial instruments Note 21 1.1 1.0
Other (*) 23.2 31.0
TOTAL 138.7 68.5
(*) “Other” include Loans, Deposits, Guarantees, investments in associates accounted for under the equity method and non consolidated investments.

Atos Origin » Annual Report 2009 » 134
22 . Financial statements22.3 Notes to the consolidated financial statements
The average credit period on sale of services is between 30 and 60 days depending on the countries.
For balances outstanding for more than 60 days as compared to agreed payment terms, the Group considers the need for an impairment loss on a case-by-case basis through a quarterly review of its balances.
Atos Origin securitisation program has been renewed for 5 years on 6 March 2009 with a maximum amount of receivables sold of EUR 500.0 million and a limit of maximum amount of financing of EUR 200.0 million. As of 31 December 2009, the Group has sold EUR 394.7 million receivables for which EUR 145.6 million were received in cash. The sale is with recourse, thus re-consolidated in the balance sheet.
Ageing of net receivables past due
(in EUR million) 31 December 2009 31 December 2008
0-30 days overdues 48.9 140.2
30-60 days overdues 17.2 39.9
Beyond 60 days overdues 14.1 58.3
TOTAL 80.2 238.4
This improvement in total overdues is the result of a strong cash collection throughout the year as part of the TOP Program (T18 initiative).
Movement in the provision for doubtful debts
(in EUR million) 31 December 2009 31 December 2008
Balance at beginning of the year (27.3) (23.2)
Impairment losses recognised (32.3) (20.2)
Amounts written off as uncollectible 6.5 3.5
Impairment losses reversed 2.4 7.0
Others (*) (2.5) 5.6
BALAnCE AT EnD OF YEAR (53.2) (27.3)
(*) Scope variation, reclassification and exchange difference.
Following the bankruptcy of Arcandor Group in Germany, the Group recorded a provision for bad debt amounting to EUR 14.4 million in the first semester.
note 15 Trade accounts and notes receivable
(in EUR million) 31 December 2009 31 December 2008
Gross value 1,298.5 1,420.9
Transition costs 36.0 24.4
Provision for doubtful debts (53.2) (27.3)
net asset value 1,281.3 1,418.0
Prepayments (11.0) (14.0)
Deferred income and upfront payments received (292.8) (259.0)
net accounts receivable 977.5 1,145.0
nUMBER OF DAYS’ SALES OUTSTAnDInG 57.0 63.0

Atos Origin » Annual Report 2009 » 135www.atosorigin.com
note 16 Breakdown of assets and liabilities by financial categories
The book value of financial assets corresponds to their fair value.
As of 31 December 2009, the analysis of assets was the following:
(in EUR million)Loans and
receivables
Available-for-sale
financial assets
Financial assets held for trading
(carried at fair value through profit or loss)
Derivatives designated as
cash flow hedging instruments (carried
at fair value)
Non-current financial assets - 137.6 - 1.1
Trade accounts and notes receivables 1,281.3 - - -
Other current assets 164.4 - - -
Current financial instruments - - 0.6 3.2
Cash and cash equivalents 534.7 - - -
TOTAL 1,980.4 137.6 0.6 4.3
As of 31 December 2008, the analysis of assets was the following:
(in EUR million)Loans and
receivables
Available-for-sale
financial assets
Financial assets held for trading
(carried at fair value through profit or loss)
Derivatives designated as
cash flow hedging instruments (carried
at fair value)
Non-current financial assets - 67.5 - 1.0
Trade accounts and notes receivables 1,418.0 - - -
Other current assets 177.7 - - -
Current financial instruments - - - 0.7
Cash and cash equivalents 286.1
Total 1,881.8 67.5 - 1.7
As of 31 December 2009, the analysis of liabilities was the following:
(in EUR million)
Financial Liabilities designated at fair value
through profit or loss
Financial Liabilities –
Measurement at amortised cost
Derivatives designated as
cash flow hedging instruments (carried
at fair value)
Borrowings - 483.4 -
Non-current financial liabilities - - 4.3
Trade accounts and notes payables and Other current liabilities
1,431.8 - -
Current portion of borrowings - 190.7 -
Current financial instruments 0.1 - 1.1
TOTAL 1,431.9 674.1 5.4
22 . Financial statements22.3 Notes to the consolidated financial statements

Atos Origin » Annual Report 2009 » 136
note 17 Cash and cash equivalents
(in EUR million) 31 December 2009 31 December 2008
Cash in hand and short-term bank deposit 429.0 285.8
Money Market funds 105.7 0.3
TOTAL 534.7 286.1
Depending on market conditions and short-term cash flow expectations, Atos Origin from time-to-time invests in Money Market funds or bank deposit with a maturity period not exceeding three months.
note 18 Pensions
The total amount recognized in the Group balance sheet in respect of pension plans and associated benefits was EUR 108.7 million at 31 December 2009. It was EUR 185.0 million at 31 December 2008.
The Group’s commitments are located predominantly in the United Kingdom (53% of Group total obligations), The Netherlands (37%), Germany (4%) and France (3%). In the UK, these commitments are generated by legacy defined benefit plans, the majority of which have been closed to further accrual in 2008. Defined benefit arrangements have
been maintained only for the purpose of complying with outsourcing requirements in the public sector in which case appropriate financial compensation is sought with customers. In The Netherlands, the pension plan is a hybrid defined contribution/defined benefit plan. Only the defined benefit component (capped at a certain level of salary) gives rise to a valuation of long term commitments for the Group, after deduction of applicable limitations and ceilings. These plans are externally funded through separate and independent legal entities, which receive employer and employee contributions.
Group commitments are also generated, but to a lesser extent, by legal or collectively bargained end of service or end of career benefit plans. Group commitments in respect of post-employment healthcare benefits are not significant (less than 0.5% of total Group pension obligations).
As of 31 December 2008, the analysis of liabilities was the following:
(in EUR million)
Financial Liabilities designated at fair value
through profit or loss
Financial Liabilities –
Measurement at amortised cost
Derivatives designated as
cash flow hedging instruments (carried
at fair value)
Borrowings - 313.5 -
Non-current financial liabilities - - 6.1
Trade accounts and notes payables and Other current liabilities
1,556.2 - -
Current portion of borrowings - 276.6 -
Current financial instruments - - 3.0
TOTAL 1,556.2 590.1 9.1
22 . Financial statements22.3 Notes to the consolidated financial statements
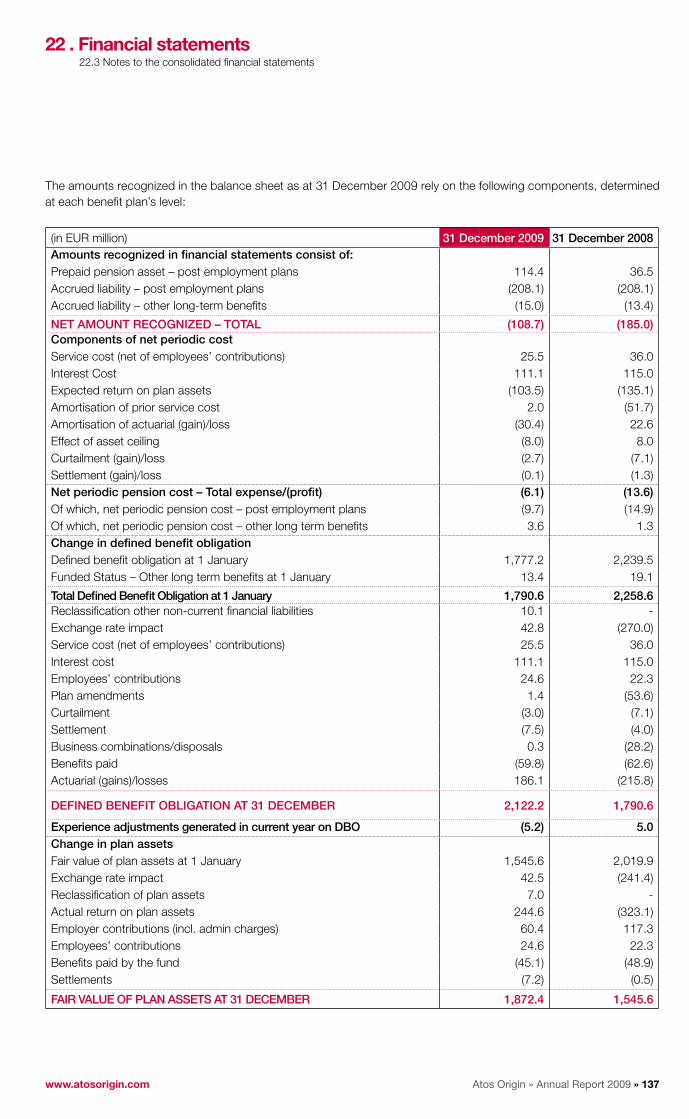
Atos Origin » Annual Report 2009 » 137www.atosorigin.com
22 . Financial statements22.3 Notes to the consolidated financial statements
The amounts recognized in the balance sheet as at 31 December 2009 rely on the following components, determined at each benefit plan’s level:
(in EUR million) 31 December 2009 31 December 2008Amounts recognized in financial statements consist of:Prepaid pension asset – post employment plans 114.4 36.5Accrued liability – post employment plans (208.1) (208.1)Accrued liability – other long-term benefits (15.0) (13.4)
nET AMOUnT RECOGnIzED – TOTAL (108.7) (185.0)Components of net periodic cost Service cost (net of employees’ contributions) 25.5 36.0Interest Cost 111.1 115.0Expected return on plan assets (103.5) (135.1)Amortisation of prior service cost 2.0 (51.7)Amortisation of actuarial (gain)/loss (30.4) 22.6Effect of asset ceiling (8.0) 8.0Curtailment (gain)/loss (2.7) (7.1)Settlement (gain)/loss (0.1) (1.3)net periodic pension cost – Total expense/(profit) (6.1) (13.6)Of which, net periodic pension cost – post employment plans (9.7) (14.9)Of which, net periodic pension cost – other long term benefits 3.6 1.3Change in defined benefit obligationDefined benefit obligation at 1 January 1,777.2 2,239.5Funded Status – Other long term benefits at 1 January 13.4 19.1
Total Defined Benefit Obligation at 1 january 1,790.6 2,258.6Reclassification other non-current financial liabilities 10.1 -Exchange rate impact 42.8 (270.0)Service cost (net of employees’ contributions) 25.5 36.0Interest cost 111.1 115.0Employees’ contributions 24.6 22.3Plan amendments 1.4 (53.6)Curtailment (3.0) (7.1)Settlement (7.5) (4.0)Business combinations/disposals 0.3 (28.2)Benefits paid (59.8) (62.6)Actuarial (gains)/losses 186.1 (215.8)
DEFInED BEnEFIT OBLIGATIOn AT 31 DECEMBER 2,122.2 1,790.6
Experience adjustments generated in current year on DBO (5.2) 5.0Change in plan assets Fair value of plan assets at 1 January 1,545.6 2,019.9Exchange rate impact 42.5 (241.4)Reclassification of plan assets 7.0 -Actual return on plan assets 244.6 (323.1)Employer contributions (incl. admin charges) 60.4 117.3Employees’ contributions 24.6 22.3Benefits paid by the fund (45.1) (48.9)Settlements (7.2) (0.5)
FAIR vALUE OF PLAn ASSETS AT 31 DECEMBER 1,872.4 1,545.6

Atos Origin » Annual Report 2009 » 138
The obligations in respect of benefit plans which are partially or totally funded through external funds (pension funds) were EUR 2,004.5 million at 31 December 2009 and EUR 1,680.2 million at 31 December 2008, representing more than 94% of Group total obligations.
Sensitivity analysis show that the DBO as at the end of the year would increase by 5.3% as a result of a 30 basis point decrease in discount rate.
Plan assets
Plan assets, which do not include Atos Origin securities or any assets used by the Group, were invested as follows:
31 December 2009 31 December 2008
Equity 30% 30%
Bonds 59% 41%
Real Estate 1% Not material
Cash and Cash equivalent 10% 14%
Other Not material 15%
“Other” assets are mostly hedge funds, asset backed securities and interest rates swaps held by the Dutch Pension Fund as part of its diversification or hedging strategy.
Due to liquidity issues and other valuation uncertainties prevailing at 31 December 2008, Atos Origin prudently depreciated the fair value of hedge funds and asset backed securities.
More than 80% of the hedge funds previously held by the Dutch Pension Fund have been redeemed in the first half of 2009, showing transaction or redemption values significantly above the fair values as depreciated at 31 December 2008, due to the recovery of some underlying markets. Moreover, liquidity for asset back securities and similar fixed income investments has significantly improved throughout 2009.
Consequently, Atos Origin has reversed its prior impairments of the fair value of the underlying assets.
22 . Financial statements22.3 Notes to the consolidated financial statements
(in EUR million) 31 December 2009 31 December 2008
Reconciliation of prepaid/(accrued) Benefit cost (all plans)Funded status – post employment plans (234.8) (231.7)Funded status – other long term benefit plans (15.0) (13.4)Unrecognized actuarial (gain)/loss 131.2 58.8Unrecognized past service cost 9.9 9.3Any other amount not recognized (asset ceiling limitation) - (8.0)
PREPAID/(ACCRUED) PEnSIOn COST (108.7) (185.0)Of which provision for pension and similar benefits (223.1) (221.5)Non-current financial assets 114.4 36.5Reconciliation of net amount recognized (all plans)net amount recognized at beginning of year (185.0) (387.2)Reclassification other current liabilities (2.4) 2.1Net periodic pension cost – post employment plans 9.7 14.9Benefits paid by employer – post employment plans 11.2 8.8Employer contributions – post employment plans 60.4 117.3Business combinations/disposals (0.3) 29.2Other (other long-term benefit, exchange rate) (2.3) 29.9
nET AMOUnT RECOGnIzED AT EnD OF YEAR (108.7) (185.0)

Atos Origin » Annual Report 2009 » 139www.atosorigin.com
22 . Financial statements22.3 Notes to the consolidated financial statements
Prepaid pension situations on balance sheet
As a result of the above described investment events, the EUR 38.9 million depreciations recorded in 2008 have been reversed in other operating income, and the net asset of EUR 77.4 million recorded on the company balance sheet in respect of the Dutch pension fund is no longer subject to any further limitations.
The net asset of EUR 36.2 million in respect of two UK schemes are supported by appropriate refund expectations, as requested by IFRIC 14.
Situation of the UK pension funds and impact on contributions for 2010
The company expects to contribute EUR 27.7 million to its UK schemes next year versus EUR 30.7 million in 2009 of which EUR 20.5 million being recovery payments in respect of deficits calculated before 2008.
Situation of the Dutch pension fund and impact on contributions for 2010
Atos Origin has finalized a 5 year recovery plan with its Dutch Pension Fund, an independent legal entity managing the assets segregated from the company’s assets to secure the provision of future pensions as requested by legislation.
Previous contractual agreement committed Atos Origin to ensure a permanent 110% funding of local pension obligations, as appreciated under local solvency rules.
Under the agreement signed on 15 July 2009, the 110% clause is suspended for 5 years, and Atos Origin has committed to the following recovery payments:
Contributions (currently shared 55%-45% between Atos ■■
Origin and its employees) will be increased from 23% to 26% between 2010 and 2013 (additional cost for Atos Origin will be between EUR 3.5 to 6.5 million per year depending on the part borne by employees);Three cash injections of EUR 10.0 million will be made ■■
by Atos Origin in 2011, 2012 and 2013;Atos Origin will grant a loan to the Pension Fund in three ■■
instalments of EUR 7.5 million each, payable in 2011, 2012 and 2013, its reimbursement being subordinated to a recovery of the funding ratio of the Pension Fund.
If the funding ratio was to fall below a trajectory leading to a 105% funding ratio at 31 December 2013, then payments would be increased by up to a maximum of EUR 9.0 million per year between 2010 and 2013. Similarly, these payments (except EUR 15.0 million of cash injections) can be reduced if the funding ratio follows a trajectory leading to a funding ratio above 117.5% at 31 December 2013.
At 31 December 2009, the indicative funding ratio of the Dutch Pension Fund was 92.8% (96.6% minus 3.8% representing the likely impact of the new mortality table issued by Dutch Statistical Bureau in January 2010). This ratio of 92.8% remains above the 87.3% milestone as at 31/12/2009 of the 105% trajectory agreed between Sponsor (Atos Origin Netherlands) and Dutch pension fund. Consequently this shall not trigger any additional contributions as explained above.
As a result, the company expects to contribute EUR 32.0 million to its Dutch pension plan next year versus EUR 27.4 million in 2009.
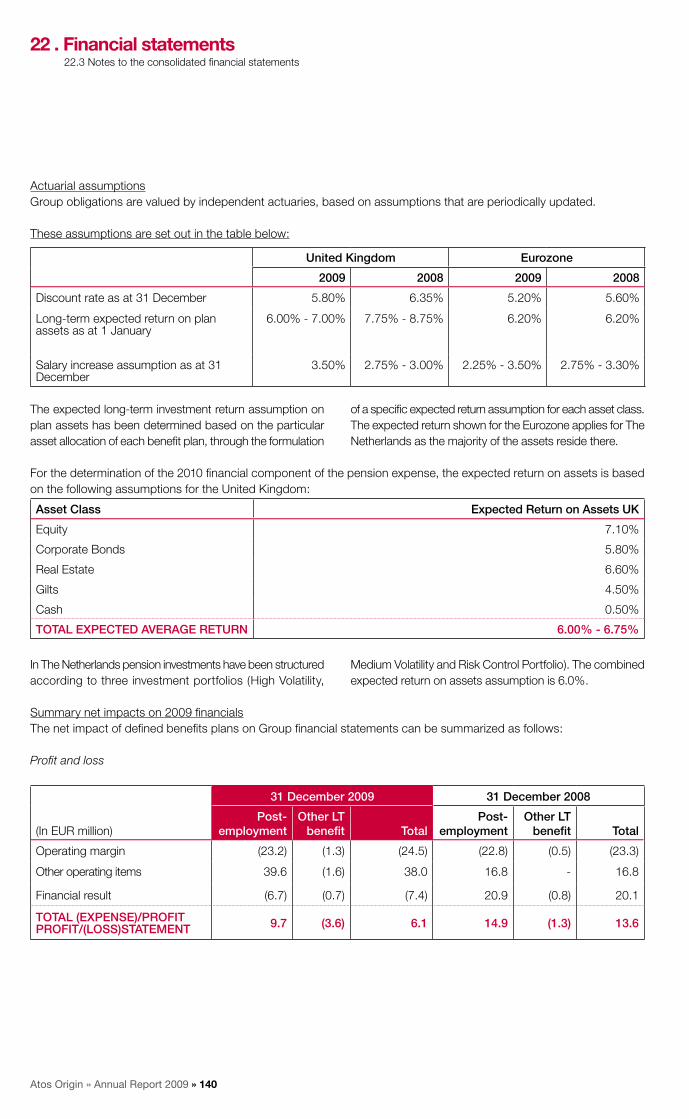
Atos Origin » Annual Report 2009 » 140
The expected long-term investment return assumption on plan assets has been determined based on the particular asset allocation of each benefit plan, through the formulation
of a specific expected return assumption for each asset class. The expected return shown for the Eurozone applies for The Netherlands as the majority of the assets reside there.
For the determination of the 2010 financial component of the pension expense, the expected return on assets is based on the following assumptions for the United Kingdom:
Asset Class Expected Return on Assets UK
Equity 7.10%
Corporate Bonds 5.80%
Real Estate 6.60%
Gilts 4.50%
Cash 0.50%
TOTAL ExPECTED AvERAGE RETURn 6.00% - 6.75%
In The Netherlands pension investments have been structured according to three investment portfolios (High Volatility,
Medium Volatility and Risk Control Portfolio). The combined expected return on assets assumption is 6.0%.
Summary net impacts on 2009 financialsThe net impact of defined benefits plans on Group financial statements can be summarized as follows:
Profit and loss
(In EUR million)
31 December 2009 31 December 2008
Post- employment
Other LT benefit Total
Post- employment
Other LT benefit Total
Operating margin (23.2) (1.3) (24.5) (22.8) (0.5) (23.3)
Other operating items 39.6 (1.6) 38.0 16.8 - 16.8
Financial result (6.7) (0.7) (7.4) 20.9 (0.8) 20.1
TOTAL (ExPEnSE)/PROFIT PROFIT/(LOSS)STATEMEnT 9.7 (3.6) 6.1 14.9 (1.3) 13.6
22 . Financial statements22.3 Notes to the consolidated financial statements
Actuarial assumptionsGroup obligations are valued by independent actuaries, based on assumptions that are periodically updated.
These assumptions are set out in the table below:
United Kingdom Eurozone
2009 2008 2009 2008
Discount rate as at 31 December 5.80% 6.35% 5.20% 5.60%
Long-term expected return on plan assets as at 1 January
6.00% - 7.00% 7.75% - 8.75% 6.20% 6.20%
Salary increase assumption as at 31 December
3.50% 2.75% - 3.00% 2.25% - 3.50% 2.75% - 3.30%

Atos Origin » Annual Report 2009 » 141www.atosorigin.com
Other Operating Items
Other operating income recorded in 2009 (EUR 38.0 million) relates mainly to the release of the impairment recorded in 2008 on the Dutch pension fund prepaid pension cost, as explained in Note 5.
Cash impacts of pensions in 2009
The cash impact of pensions is mainly composed of cash contributions to the pension funds for EUR 60.4 million (including EUR 1.8 million of administration costs), the remaining part being benefit payments directly made by the Group to the beneficiaries.
The cash contributions to the pension funds are made of ongoing contributions in respect of services rendered in the year (usually expressed as a percentage of salary), as well as past deficits repayment contributions spread over a 10 to 15 years period as agreed with the respective trustees (fixed yearly amount).
22 . Financial statements22.3 Notes to the consolidated financial statements
(in EUR million) 31 December 2009 31 December 2008
Ongoing contributions 39.5 39.6
Deficits repayment other than New Deal one off lump sum 20.5 12.7
Total contributions included in OMDA 60.0 52.3
Direct Benefit payments 13.2 13.6
Cash compensation received - -
nET OMDA IMPACT 73.2 65.9
New Deal contributions (UK) - 64.5
Direct benefit payments 2.3 -
Total cash impact in other operating items 2.3 64.5
TOTAL CASH IMPACT 75.5 130.4
In 2008, a specific contribution of EUR 64.5 million was paid to the two UK pension schemes concerned by benefit changes, as an acceleration of the recovery of past deficits.
Below table shows the historic development of the DBO, the Fair Value of Plan Assets, The Funded Status and the Experience Adjustments:
(in EUR million)
31 December
2009 2008 2007 2006 2005
DBO 2,122 1,791 2,259 2,490 2,382
Fair Value of Plan Assets 1,872 1,546 2,020 1,993 1,739
Funded Status (250) (245) (239) (497) (643)
Experience Adjustments (5) 5 (11) 72 (38)
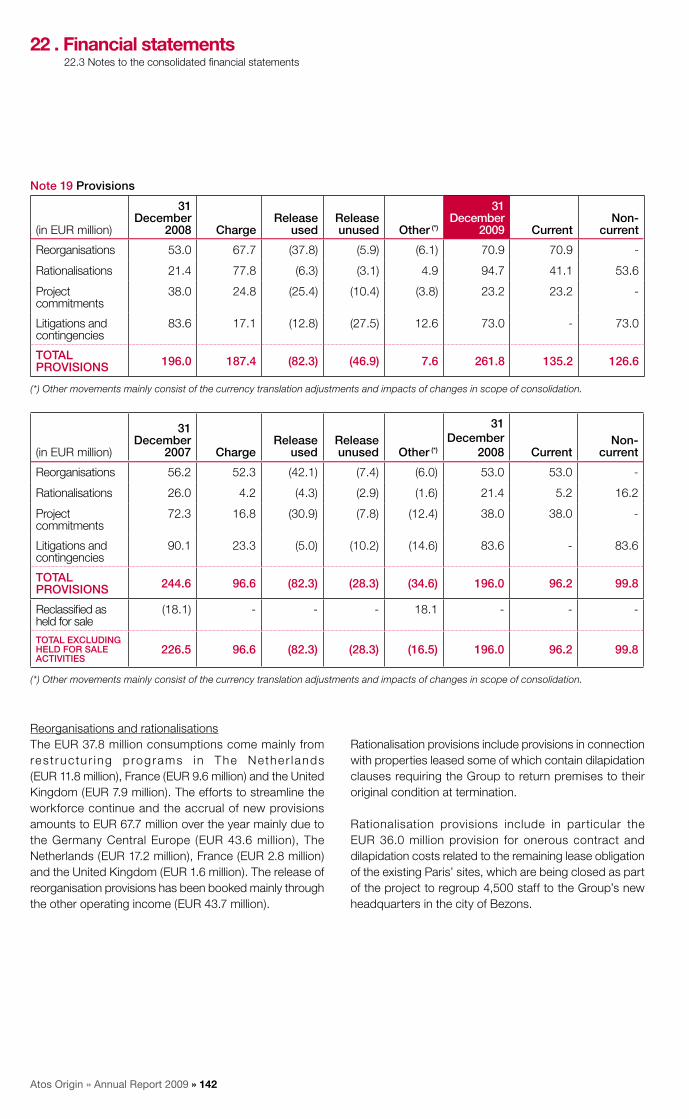
Atos Origin » Annual Report 2009 » 142
note 19 Provisions
(in EUR million)
31 December
2008 ChargeRelease
usedRelease unused Other (*)
31 December
2009 Currentnon-
current
Reorganisations 53.0 67.7 (37.8) (5.9) (6.1) 70.9 70.9 -
Rationalisations 21.4 77.8 (6.3) (3.1) 4.9 94.7 41.1 53.6
Project commitments
38.0 24.8 (25.4) (10.4) (3.8) 23.2 23.2 -
Litigations and contingencies
83.6 17.1 (12.8) (27.5) 12.6 73.0 - 73.0
TOTAL PROvISIOnS 196.0 187.4 (82.3) (46.9) 7.6 261.8 135.2 126.6
(*) Other movements mainly consist of the currency translation adjustments and impacts of changes in scope of consolidation.
(in EUR million)
31 December
2007 ChargeRelease
usedRelease unused Other (*)
31 December
2008 Currentnon-
current
Reorganisations 56.2 52.3 (42.1) (7.4) (6.0) 53.0 53.0 -
Rationalisations 26.0 4.2 (4.3) (2.9) (1.6) 21.4 5.2 16.2
Project commitments
72.3 16.8 (30.9) (7.8) (12.4) 38.0 38.0 -
Litigations and contingencies
90.1 23.3 (5.0) (10.2) (14.6) 83.6 - 83.6
TOTAL PROvISIOnS 244.6 96.6 (82.3) (28.3) (34.6) 196.0 96.2 99.8
Reclassified as held for sale
(18.1) - - - 18.1 - - -
TOTAL ExCLUDInG HELD FOR SALE ACTIvITIES
226.5 96.6 (82.3) (28.3) (16.5) 196.0 96.2 99.8
(*) Other movements mainly consist of the currency translation adjustments and impacts of changes in scope of consolidation.
22 . Financial statements22.3 Notes to the consolidated financial statements
Reorganisations and rationalisationsThe EUR 37.8 million consumptions come mainly from res t ruc tu r ing programs in The Nethe r lands (EUR 11.8 million), France (EUR 9.6 million) and the United Kingdom (EUR 7.9 million). The efforts to streamline the workforce continue and the accrual of new provisions amounts to EUR 67.7 million over the year mainly due to the Germany Central Europe (EUR 43.6 million), The Netherlands (EUR 17.2 million), France (EUR 2.8 million) and the United Kingdom (EUR 1.6 million). The release of reorganisation provisions has been booked mainly through the other operating income (EUR 43.7 million).
Rationalisation provisions include provisions in connection with properties leased some of which contain dilapidation clauses requiring the Group to return premises to their original condition at termination.
Rationalisation provisions include in particular the EUR 36.0 million provision for onerous contract and dilapidation costs related to the remaining lease obligation of the existing Paris’ sites, which are being closed as part of the project to regroup 4,500 staff to the Group’s new headquarters in the city of Bezons.

Atos Origin » Annual Report 2009 » 143www.atosorigin.com
Project commitmentsCompared with the end of December 2008, the project commitments provisions have decreased by EUR 14.8 million. The overall decrease of the projects commitments reflects the stronger control of the delivery of the projects.
Litigations and contingenciesContingency provisions of EUR 73.0 million include a number of long-term litigation issues, such as tax
contingencies and social disputes, guarantees given on disposals and other disputes with clients and suppliers. The legal department continues to manage these situations with a view to minimising the ultimate liability.Most of the provisions released as unused concerned provision booked as fair value adjustment following mergers and acquisitions for which the risk is now extinct.
note 20 Borrowings
(in EUR million)
31 December 2009 31 December 2008
Currentnon-
current Total Currentnon-
current Total
Finance leases 2.9 0.5 3.4 7.6 3.3 10.9
Bank loans 0.3 268.3 268.6 4.5 294.8 299.3
Securitisation 145.0 - 145.0 198.7 - 198.7
Convertible bonds 1.1 199.6 200.7 - - -
Other borrowings 41.4 15.0 56.4 65.8 15.4 81.2
TOTAL BORROWInGS 190.7 483.4 674.1 276.6 313.5 590.1
Non-current borrowings maturity
(in EUR million) 2010 2011 2012 2013 2014 > 2014 Total
Bonds - - - - - 250.0 250.0
Finance leases - 0.5 - - - - 0.5
Bank loans - 0.2 260.8 0.8 0.8 5.7 268.3
Other borrowings - 4.3 4.7 3.5 2.5 - 15.0
As at 31 December 2009 long-term debt - 5.0 265.5 4.3 3.3 255.7 533.8
Bonds - Financial fees and discounting effect
- - - - - (50.4) (50.4)
As at 31 December 2009 long-term debt excluding bonds - financial fees and discounting effect
- 5.0 265.5 4.3 3.3 205.3 483.4
22 . Financial statements22.3 Notes to the consolidated financial statements

Atos Origin » Annual Report 2009 » 144
(in EUR million) 2009 2010 2011 2012 2013 > 2013 Total
Bonds - - - - - - -
Finance leases - 2.8 0.5 - - - 3.3
Bank loans - 0.1 0.3 290.5 0.5 3.4 294.8
Other borrowings - 2.9 4.3 4.8 3.5 - 15.4
AS AT 31 DECEMBER 2008 LOnG-TERM DEBT - 5.8 5.1 295.2 4.0 3.4 313.5
Hypothesis retained regarding the presentation of the maturity of non-current borrowingsThe evaluation of financial liabilities has been conducted based on:
Exchange rates prevailing as at 31 December 2009;■■
Interest rates presented hereafter.■■
Borrowings in currenciesThe carrying amounts of the Group’s borrowings were denominated in the following currencies:
(in EUR million) EUR Other currencies Total
31 December 2009 668.2 5.9 674.1
31 December 2008 571.3 18.8 590.1
Fair value and effective interest rate of financial debtThe fair value of bank loans, which are primarily composed of variable interest rate loans, are considered as being the same as their carrying value. For other elements of borrowings, carrying value is considered the best estimate of fair value, the difference between the fair value and the carrying value being not material.
On 29 October 2009 the Group has issued EUR 250.0 million of bonds convertible into and/or exchangeable for new or existing shares (OCEANE) of Atos Origin maturing on 1 January 2016. The OCEANE is considered as a compound
instrument and contains both a liability and an equity component, which should be classified separately in the balance sheet. On initial recognition, the financial instrument (net of fees for EUR 3.8 million) is split between financial liability for EUR 198.4 million and equity for EUR 47.8 million (including the issuer call option valued at EUR 1.6 million). Consequently, the effective interest rate of the convertible bonds (6.68%) differs from the annual coupon paid in cash to the bond holders (2.50%).
At the end of December 2009, the fair value of the liability component is EUR 200.7 million.
The effective interest rates in 2009 were as follows:
(in EUR million) Carrying value Fair value Effective interest rate
Finance leases 3.4 3.4 4.90%
Bank loans 268.6 268.6 1.67%
Securitisation 145.0 145.0 1.81%
Convertible bonds 200.7 200.7 6.68%
Other borrowings 56.4 56.4 -
TOTAL BORROWInGS 674.1 674.1 3.35%
22 . Financial statements22.3 Notes to the consolidated financial statements
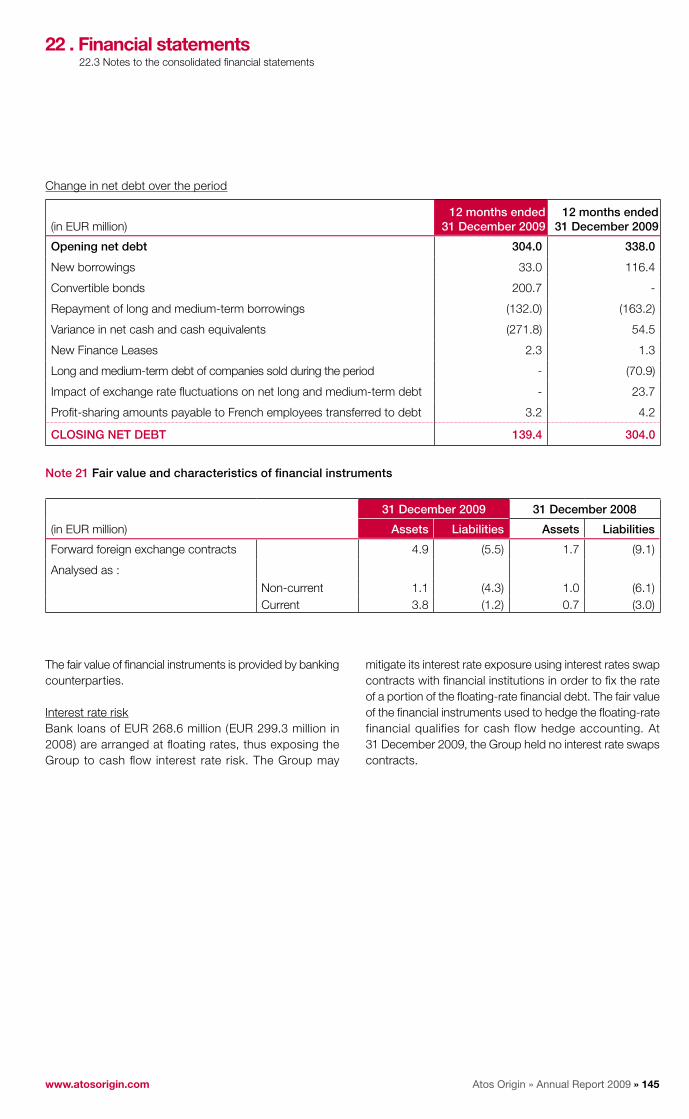
Atos Origin » Annual Report 2009 » 145www.atosorigin.com
Change in net debt over the period
(in EUR million)12 months ended
31 December 200912 months ended
31 December 2009
Opening net debt 304.0 338.0
New borrowings 33.0 116.4
Convertible bonds 200.7 -
Repayment of long and medium-term borrowings (132.0) (163.2)
Variance in net cash and cash equivalents (271.8) 54.5
New Finance Leases 2.3 1.3
Long and medium-term debt of companies sold during the period - (70.9)
Impact of exchange rate fluctuations on net long and medium-term debt - 23.7
Profit-sharing amounts payable to French employees transferred to debt 3.2 4.2
CLOSInG nET DEBT 139.4 304.0
note 21 Fair value and characteristics of financial instruments
(in EUR million)
31 December 2009 31 December 2008
Assets Liabilities Assets Liabilities
Forward foreign exchange contracts 4.9 (5.5) 1.7 (9.1)
Analysed as :
Non-current 1.1 (4.3) 1.0 (6.1) Current 3.8 (1.2) 0.7 (3.0)
The fair value of financial instruments is provided by banking counterparties.
Interest rate riskBank loans of EUR 268.6 million (EUR 299.3 million in 2008) are arranged at floating rates, thus exposing the Group to cash flow interest rate risk. The Group may
mitigate its interest rate exposure using interest rates swap contracts with financial institutions in order to fix the rate of a portion of the floating-rate financial debt. The fair value of the financial instruments used to hedge the floating-rate financial qualifies for cash flow hedge accounting. At 31 December 2009, the Group held no interest rate swaps contracts.
22 . Financial statements22.3 Notes to the consolidated financial statements
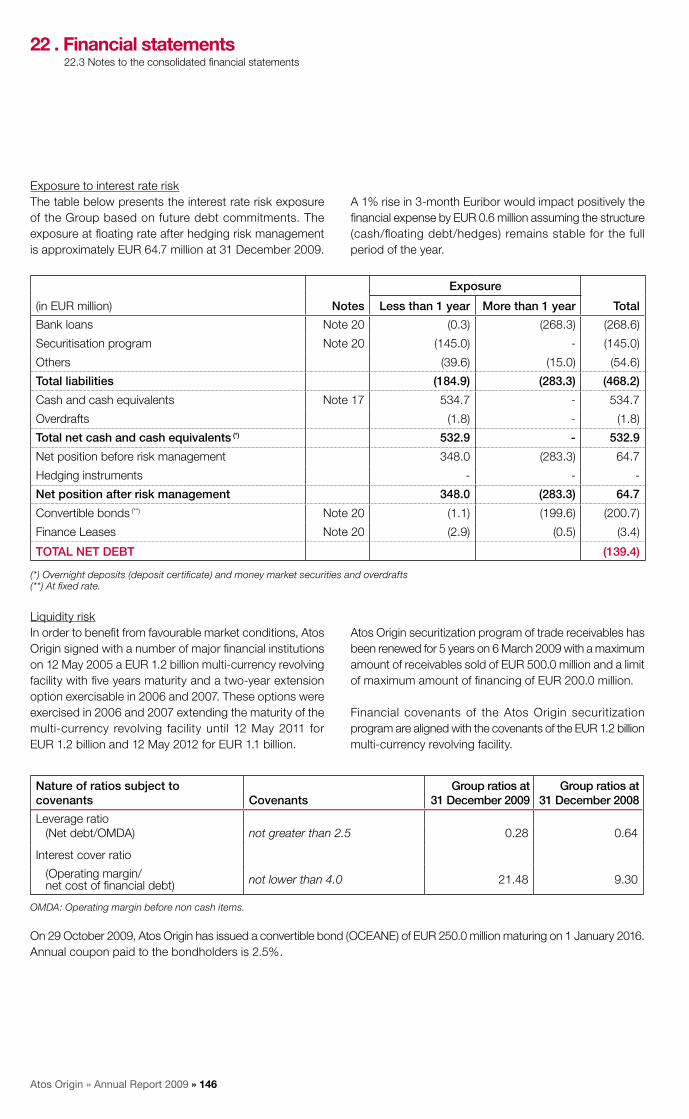
Atos Origin » Annual Report 2009 » 146
Exposure to interest rate riskThe table below presents the interest rate risk exposure of the Group based on future debt commitments. The exposure at floating rate after hedging risk management is approximately EUR 64.7 million at 31 December 2009.
A 1% rise in 3-month Euribor would impact positively the financial expense by EUR 0.6 million assuming the structure (cash/floating debt/hedges) remains stable for the full period of the year.
(in EUR million) notes
Exposure
TotalLess than 1 year More than 1 year
Bank loans Note 20 (0.3) (268.3) (268.6)
Securitisation program Note 20 (145.0) - (145.0)
Others (39.6) (15.0) (54.6)
Total liabilities (184.9) (283.3) (468.2)
Cash and cash equivalents Note 17 534.7 - 534.7
Overdrafts (1.8) - (1.8)
Total net cash and cash equivalents (*) 532.9 - 532.9
Net position before risk management 348.0 (283.3) 64.7
Hedging instruments - - -
net position after risk management 348.0 (283.3) 64.7
Convertible bonds (**) Note 20 (1.1) (199.6) (200.7)
Finance Leases Note 20 (2.9) (0.5) (3.4)
TOTAL nET DEBT (139.4)
(*) Overnight deposits (deposit certificate) and money market securities and overdrafts(**) At fixed rate.
Liquidity riskIn order to benefit from favourable market conditions, Atos Origin signed with a number of major financial institutions on 12 May 2005 a EUR 1.2 billion multi-currency revolving facility with five years maturity and a two-year extension option exercisable in 2006 and 2007. These options were exercised in 2006 and 2007 extending the maturity of the multi-currency revolving facility until 12 May 2011 for EUR 1.2 billion and 12 May 2012 for EUR 1.1 billion.
Atos Origin securitization program of trade receivables has been renewed for 5 years on 6 March 2009 with a maximum amount of receivables sold of EUR 500.0 million and a limit of maximum amount of financing of EUR 200.0 million.
Financial covenants of the Atos Origin securitization program are aligned with the covenants of the EUR 1.2 billion multi-currency revolving facility.
nature of ratios subject to covenants Covenants
Group ratios at31 December 2009
Group ratios at31 December 2008
Leverage ratio (Net debt/OMDA) not greater than 2.5 0.28 0.64
Interest cover ratio
(Operating margin/ net cost of financial debt) not lower than 4.0 21.48 9.30
OMDA: Operating margin before non cash items.
On 29 October 2009, Atos Origin has issued a convertible bond (OCEANE) of EUR 250.0 million maturing on 1 January 2016. Annual coupon paid to the bondholders is 2.5%.
22 . Financial statements22.3 Notes to the consolidated financial statements

Atos Origin » Annual Report 2009 » 147www.atosorigin.com
Currency exchange riskAtos Origin operates in 40 countries. However, in most cases, Atos Origin invoices in the country where the Group renders the service, thus limiting the foreign exchange risk.
Where this is not the case, the Group generally uses hedging instruments such as forward contracts or foreign currency swaps to minimise the risk.
The carrying amount of the Group’s foreign currency denominated monetary assets and monetary liabilities at the reporting date are as follows:
(in EUR million)
2009 2008 2009 2008 2009 2008
EUR GBP USD
Assets 23.7 46.4 2.0 5.7 13.8 15.2Liabilities 21.6 24.7 0.1 0.3 2.5 24.9Foreign exchange impact before hedging 2.1 21.7 1.9 5.4 11.3 (9.7)Hedged amounts - (3.7) - - (9.3) (6.2)FOREIGn ExCHAnGE IMPACT AFTER HEDGInG 2.1 18.0 1.9 5.4 2.0 (15.9)
Foreign currency sensitivity analysisThe Group is mainly exposed to the EUR, GBP and the USD.
The following table details the Group’s sensitivity to a 5% increase and decrease of the sensitive currency against the
relevant functional currency of each subsidiary. The sensitivity analysis includes only outstanding foreign currency denominated monetary items and adjusts their translation at the period end for a 5% increase in foreign currency rates.
(in EUR million)
2009 2008 2009 2008 2009 2008
EUR GBP USD
Income Statement 0.1 0.9 0.1 0.3 0.1 (0.8)
Hedge accountingThere is no material deviation between the maturity of the financial instruments and the period in which the cash flows are expected to occur.
At December 2009, derivatives are all allocated to the hedge of some transactional risks (foreign exchange currency risks). From an accounting point of view, most of the derivatives were considered as cash flow hedge instruments.
Breakdown of the designation of the instruments per currency is as follow:
Instruments
31 December 2009 31 December 2008
Fair value notional Fair value notionalCash flow hedge
Foreign exchangeForward contracts USD 0.9 25.4 (1.3) 35.0Option contracts USD 0.2 0.9 1.4 16.7Forward contracts CAD 0.7 5.7 (0.2) 11.8Forward contracts GBP (3.1) 21.8 (5.7) 24.0Option contracts GBP 0.3 14.4 0.3 13.3Forward contracts INR (1.1) 45.4 (1.9) 38.6Forward contracts PLN 0.6 9.3 - -Forward contracts CNY 0.4 5.6 - -
Trading Foreign exchangeForward contracts USD 0.2 8.7 - 1.9Forward contracts INR 0.3 12.7 - -
The net amount of cash flow hedge reserve at 31 December 2009 was EUR (1.3) million (net of tax), with a positive variation of EUR 4.2 million (net of tax) over the year.
22 . Financial statements22.3 Notes to the consolidated financial statements

Atos Origin » Annual Report 2009 » 148
note 22 Trade accounts and notes payable
(In EUR million) 31 December 2009 31 December 2008
Trade payables 472.0 500.8
Amounts payable on tangible assets 3.3 16.0
TOTAL DISCLOSED On THE BALAnCE SHEET 475.3 516.8
Trade accounts and notes payable are expected to be paid within one year.
note 23 Other current liabilities
(In EUR million) 31 December 2009 31 December 2008
Advances and down payments received on clients orders 11.0 14.0Employee-related liabilities 246.8 302.7Social security and other employee welfare liabilities 177.5 206.8VAT payable 159.0 177.8Deferred income 244.1 227.8Other operating liabilities 118.1 110.3TOTAL DISCLOSED On THE BALAnCE SHEET 956.5 1,039.4
Other current liabilities are expected to be settled within one year, excepted for deferred income that is released over the particular arrangement of the corresponding contract.
note 24 Off-balance sheet commitmentsContractual commitmentsThe table below illustrates the minimum future payments for firm obligations and commitments over the coming years. Amounts indicated under the long-term borrowings and finance leases are posted on the Group balance sheet.
(in EUR million)
Maturing
31 December 2008
31 December 2009
Up to 1 year
1 to 5 years
Over 5 years
Convertible Bonds 200.7 1.1 - 199.6 -Bank loans 268.6 0.3 262.6 5.7 299.3Finance leases 3.4 2.9 0.5 - 10.9Recorded on the balance sheet 472.7 4.3 263.1 205.3 310.2Operating leases: land. buildings. fittings 423.3 113.9 239.7 69.7 461.3Operating leases: IT equipment 10.2 7.7 2.5 - 23.0Operating leases: other fixed assets 89.8 38.2 51.6 - 125.1Non-cancellable purchase obligations (>5 years) 16.1 12.7 3.4 - 21.2Commitments 539.4 172.5 297.2 69.7 630.6TOTAL 1,012.1 176.8 560.3 275.0 940.8
Commercial commitments
(In EUR million) 31 December 2009 31 December 2008
Bank guarantees 64.1 85.8Performance guarantees 1,182.3 1,232.7Pledges 0.2 -TOTAL 1,246.6 1,318.5
22 . Financial statements22.3 Notes to the consolidated financial statements

Atos Origin » Annual Report 2009 » 149www.atosorigin.com
For various large long term contracts, the Group provides performance guarantees to its clients. These guarantees amount to EUR 1,182.3 million as of 31 December 2009, compared with EUR 1,232.7 million in 2008. These guarantees represent a total contracts value of EUR 1,629.7 million for 2009.
In the framework of the contract for the provision of IT services signed by Atos Origin IT Services UK Limited with the International Olympic Committee (IOC), Atos Origin SAE (Spain) has granted a full performance guarantee to the IOC by which it commits to perform the contract in case the signing entity (or any other affiliate to whom the signing entity could have assigned all or part of the rights and obligations under the contract) is unable to provide services required under the contract.
In relation to the multi-currency revolving facility, Atos Origin SA issued a parental guarantee to the benefit of the consortium of banks represented by BNP Paribas, in order to cover up to EUR 440.0 million the obligations of its subsidiary, Atos Origin Telco Services B.V.
Atos Origin SA has given a EUR 120.0 million guarantee to the Stichting Pensionfonds Atos Origin. This guarantee is provided to secure the payment obligations of Atos Origin Nederland under the cover ratio mechanism in case of its failure to pay associated sums.
Subsequent to the Cellnet disposal in July 2004, Atos Origin SA has still one outstanding guarantee with Schlumberger related to Citicorp for a total amount of USD 75.7 million, which is fully counter-guaranteed by the acquirer of Cellnet, “Cellnet Holdings Corp”.
In relation to its subsidiary Atos Worldline Belgium operating in the commercial acquiring of card transactions, Atos Origin Group has guaranteed directly or indirectly, its partners Visa International and MasterCard in case of default of payment resulting from its role of intermediary between the payment issuer and the beneficiary, or any major breaches to their rules. These guarantees are estimated for a maximum amount of USD 66.5 million. The effective risk is considered as very low.
In addition, Atos Origin SA has granted a EUR 26.4 million guarantee to Chartis Europe SA for the performance of the duties of its reinsurer St Louis Re. The Guarantee could only be exercised in the very unlikely event that St Louis Re was unable to meet all of its reinsurance obligations to Chartis Europe SA.
Finally, Atos Origin SA or Atos Origin BV have given for various subsidiaries guarantees of general financial support at the request of auditors or to comply with local regulations.
Group contributions expectations regarding pension funds
The Group expects to contribute for:EUR 27.7 million to its UK schemes next year versus ■■
EUR 30.7 million in 2009 of which EUR 20.5 million being recovery payments in respect of deficits calculated before 2008. EUR 32.0 million to its Dutch pension plan next year ■■
versus EUR 27.4 million in 2009.
note 25 Related party transactions
Transactions between Atos Origin and its subsidiaries, which are related parties of the Group, have been eliminated on consolidation and are not disclosed in this note.
Following the Ordinary and Extraordinary Shareholders Meeting held on 10 February 2009, the shareholders approved the transformation of the governance mode of the Group, from a Supervisory board and Management Board governance model to company governed by a Board of Directors.
Related party transactions include in particular transactions with:
Entities that directly, or indirectly through one or more ■■
intermediaries controls, has an interest in or has joint control over the Group;Key management personnel of the Group as defined as ■■
persons who have the authority and responsibility for planning, directing and controlling the activity of the Group, including members of the Board of Directors, Supervisory Board or Management Board, as well as Senior Executive Vice Presidents.
In the course of 2009, no transaction between the Group and such entities or key management personnel occurred, except from the compensation recorded with members of the Management Board and Supervisory Board (until 10 February 2009) and Board of Directors (from 11 February 2009) as detailed hereafter.
22 . Financial statements22.3 Notes to the consolidated financial statements

Atos Origin » Annual Report 2009 » 150
22 . Financial statements22.3 Notes to the consolidated financial statements
Compensation of members of the Management Board and Supervisory Board (until 10 February 2009) and Board of Directors (from 11 February 2009) as well as Senior Executive Vice Presidents
The remuneration of the main members of the management during the year was as follows:
(in EUR million)12 months ended
31 December 2009 12 months ended
31 December 2008
Short-term benefits 6.4 6.7
Post-employment benefits 1.4 0.1
Termination benefits - 2.6
Equity-based compensation: stock options and free shares 2.4 2.5
TOTAL 10.2 11.9
The remuneration of the main members of the management is determined by the Remuneration Committee according to the performance of individuals and the Group’s financial achievements.
Short-term benefits include salaries, bonuses and fringe benefits. Bonuses correspond to the total charge in income statement including the bonuses effectively paid during the year, the charge in accruals relating to current year and the release in accruals relating to previous year.
During the year, the Group has neither granted nor received guarantees from any of its Board members.
Claim from one former Management Board MemberOn 24 June 2009, the Group was notified of a claim filed by counsel to Mr. Philippe Germond with the Commercial Court of Nanterre.
Mr. Germond alleges that his mandate was wrongfully terminated, which would, in his opinion, trigger a right to payment of an indemnity amounting to EUR 3.9 million.As already disclosed in the 2008 Reference Document, the Supervisory Board decided on 11 December 2008 to reject Mr. Germond’s request to an indemnity after an in depth assessment of the situation and based on legal opinions obtained from external counsels. Accordingly, no provision has been accrued in the Group’s 2009 accounts.
A court hearing is expected to be held.
note 26 Subsequent events
There were no subsequent events.
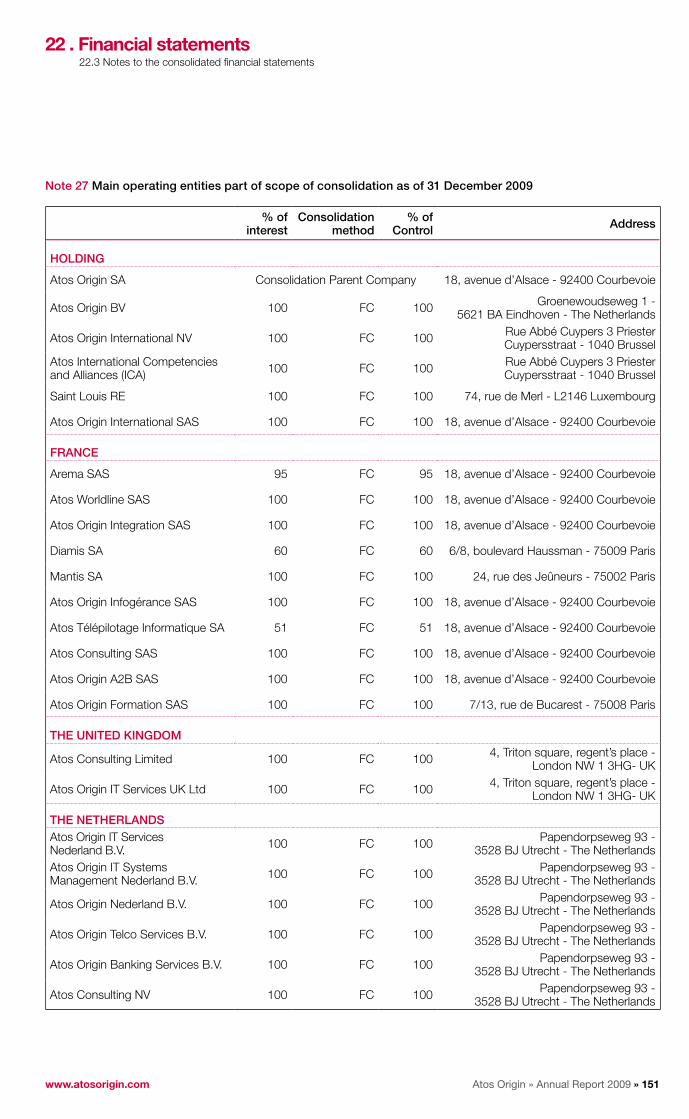
Atos Origin » Annual Report 2009 » 151www.atosorigin.com
22 . Financial statements22.3 Notes to the consolidated financial statements
note 27 Main operating entities part of scope of consolidation as of 31 December 2009
% of interest
Consolidation method
% of Control Address
HOLDInG
Atos Origin SA Consolidation Parent Company 18, avenue d’Alsace - 92400 Courbevoie
Atos Origin BV 100 FC 100 Groenewoudseweg 1 - 5621 BA Eindhoven - The Netherlands
Atos Origin International NV 100 FC 100 Rue Abbé Cuypers 3 Priester Cuypersstraat - 1040 Brussel
Atos International Competencies and Alliances (ICA) 100 FC 100 Rue Abbé Cuypers 3 Priester
Cuypersstraat - 1040 Brussel
Saint Louis RE 100 FC 100 74, rue de Merl - L2146 Luxembourg
Atos Origin International SAS 100 FC 100 18, avenue d’Alsace - 92400 Courbevoie
FRAnCE
Arema SAS 95 FC 95 18, avenue d’Alsace - 92400 Courbevoie
Atos Worldline SAS 100 FC 100 18, avenue d’Alsace - 92400 Courbevoie
Atos Origin Integration SAS 100 FC 100 18, avenue d’Alsace - 92400 Courbevoie
Diamis SA 60 FC 60 6/8, boulevard Haussman - 75009 Paris
Mantis SA 100 FC 100 24, rue des Jeûneurs - 75002 Paris
Atos Origin Infogérance SAS 100 FC 100 18, avenue d’Alsace - 92400 Courbevoie
Atos Télépilotage Informatique SA 51 FC 51 18, avenue d’Alsace - 92400 Courbevoie
Atos Consulting SAS 100 FC 100 18, avenue d’Alsace - 92400 Courbevoie
Atos Origin A2B SAS 100 FC 100 18, avenue d’Alsace - 92400 Courbevoie
Atos Origin Formation SAS 100 FC 100 7/13, rue de Bucarest - 75008 Paris
THE UnITED KInGDOM
Atos Consulting Limited 100 FC 100 4, Triton square, regent’s place - London NW 1 3HG- UK
Atos Origin IT Services UK Ltd 100 FC 100 4, Triton square, regent’s place - London NW 1 3HG- UK
THE nETHERLAnDSAtos Origin IT Services Nederland B.V. 100 FC 100 Papendorpseweg 93 -
3528 BJ Utrecht - The NetherlandsAtos Origin IT Systems Management Nederland B.V. 100 FC 100 Papendorpseweg 93 -
3528 BJ Utrecht - The Netherlands
Atos Origin Nederland B.V. 100 FC 100 Papendorpseweg 93 - 3528 BJ Utrecht - The Netherlands
Atos Origin Telco Services B.V. 100 FC 100 Papendorpseweg 93 - 3528 BJ Utrecht - The Netherlands
Atos Origin Banking Services B.V. 100 FC 100 Papendorpseweg 93 - 3528 BJ Utrecht - The Netherlands
Atos Consulting NV 100 FC 100 Papendorpseweg 93 - 3528 BJ Utrecht - The Netherlands
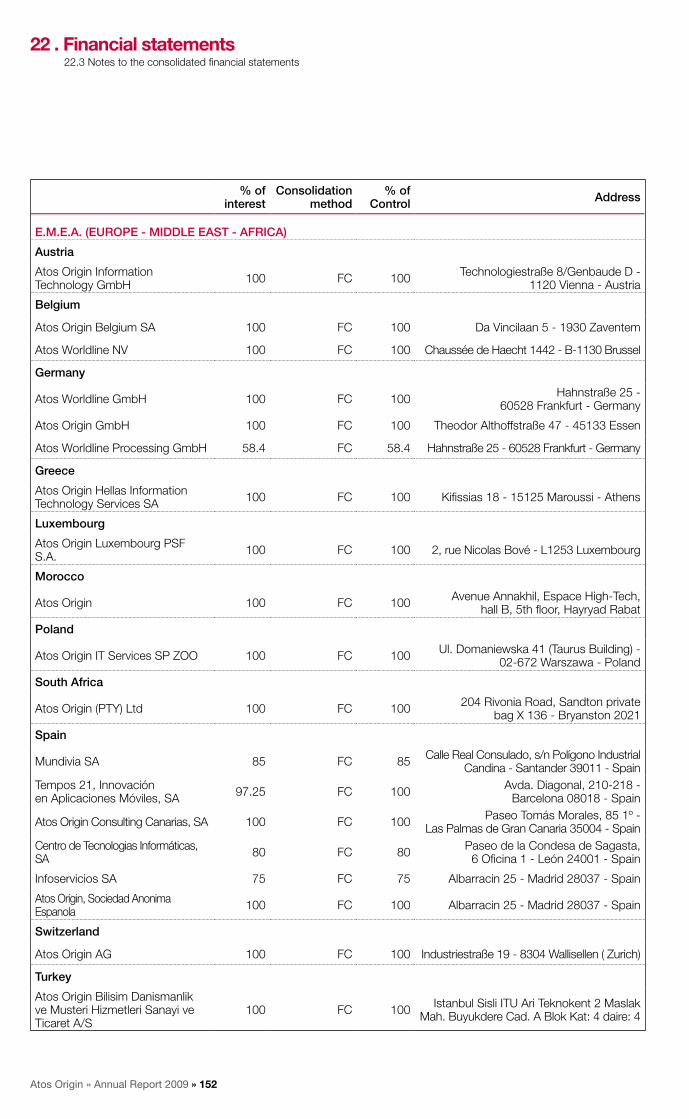
Atos Origin » Annual Report 2009 » 152
22 . Financial statements22.3 Notes to the consolidated financial statements
% of interest
Consolidation method
% of Control Address
E.M.E.A. (EUROPE - MIDDLE EAST - AFRICA)
Austria
Atos Origin Information Technology GmbH 100 FC 100 Technologiestraße 8/Genbaude D -
1120 Vienna - Austria
Belgium
Atos Origin Belgium SA 100 FC 100 Da Vincilaan 5 - 1930 Zaventem
Atos Worldline NV 100 FC 100 Chaussée de Haecht 1442 - B-1130 Brussel
Germany
Atos Worldline GmbH 100 FC 100 Hahnstraße 25 - 60528 Frankfurt - Germany
Atos Origin GmbH 100 FC 100 Theodor Althoffstraße 47 - 45133 Essen
Atos Worldline Processing GmbH 58.4 FC 58.4 Hahnstraße 25 - 60528 Frankfurt - Germany
Greece
Atos Origin Hellas Information Technology Services SA 100 FC 100 Kifissias 18 - 15125 Maroussi - Athens
Luxembourg
Atos Origin Luxembourg PSF S.A. 100 FC 100 2, rue Nicolas Bové - L1253 Luxembourg
Morocco
Atos Origin 100 FC 100 Avenue Annakhil, Espace High-Tech, hall B, 5th floor, Hayryad Rabat
Poland
Atos Origin IT Services SP ZOO 100 FC 100 Ul. Domaniewska 41 (Taurus Building) - 02-672 Warszawa - Poland
South Africa
Atos Origin (PTY) Ltd 100 FC 100 204 Rivonia Road, Sandton private bag X 136 - Bryanston 2021
Spain
Mundivia SA 85 FC 85 Calle Real Consulado, s/n Polígono Industrial Candina - Santander 39011 - Spain
Tempos 21, Innovación en Aplicaciones Móviles, SA 97.25 FC 100 Avda. Diagonal, 210-218 -
Barcelona 08018 - Spain
Atos Origin Consulting Canarias, SA 100 FC 100 Paseo Tomás Morales, 85 1º - Las Palmas de Gran Canaria 35004 - Spain
Centro de Tecnologias Informáticas, SA 80 FC 80 Paseo de la Condesa de Sagasta,
6 Oficina 1 - León 24001 - Spain
Infoservicios SA 75 FC 75 Albarracin 25 - Madrid 28037 - Spain
Atos Origin, Sociedad Anonima Espanola 100 FC 100 Albarracin 25 - Madrid 28037 - Spain
Switzerland
Atos Origin AG 100 FC 100 Industriestraße 19 - 8304 Wallisellen ( Zurich)
Turkey
Atos Origin Bilisim Danismanlik ve Musteri Hizmetleri Sanayi ve Ticaret A/S
100 FC 100 Istanbul Sisli ITU Ari Teknokent 2 Maslak Mah. Buyukdere Cad. A Blok Kat: 4 daire: 4

Atos Origin » Annual Report 2009 » 153www.atosorigin.com
22 . Financial statements22.3 Notes to the consolidated financial statements
% of interest
Consolidation method
% of Control Address
ASIA PACIFIC
China
Atos Covics Business Solutions Ltd 100 FC 100 No. 1 Building, No. 99, Qinjiang Rd-Shanghai-China
Atos Origin Information Technology (China) Co. Ltd 100 FC 100
502 -505 Lido Commercial Bulding, Lido Place, Jichang Road- Chaoyang District- Beijing
Atos Origin (Hong Kong) Ltd 100 FC 100Units 3B & 05-10, 18/F.,
Exchange Tower, 33 Wang Chiu Road, Kowloon Bay-Kowloon-Hong Kong
India
Atos Origin India Private Limited 100 FC 100 Unit 126/127, SDF IV, SEEPZ - Andheri (East) - 400 096 Bombay
Atos Origin IT Services Private Ltd 100 FC 100C-63, 6th Floor, Himalaya House,
23 Kasturba Gandhi Marg, New Delhi - 110 001
japan
Atos Origin KK 100 FC 10020 F, Shinjuku ParkTower -
Nishi Shinjuku 3 - 7 -1 - Shinjuku - ku - Tokyo - Japan
Malaysia
Atos Origin (Malaysia) SDN BHD 100 FC 10016-A (1st Floor), Jalan Tun Sambanthan
3, Brickfields, 50470 Kuala Lumpur, Malaysia
Singapore
Atos Origin (Asia Pacific) Pte Ltd 100 FC 100 620A Lorong 1 Toa Payoh, TP4 Level 5-Singapore 319762
Taiwan
Atos Origin (Taiwan) Ltd 100 FC 100 5F, No.100, Sec.3, Min Sheng E. Road, Taipei 105-Taiwan-R.O.C.
AMERICAS
Argentina
Atos Origin Argentina SA 100 FC 100Nicolás de Vedia 3892, PB -
Ciudad Autónoma de Buenos Aires - C 1430DAL - Argentina
Brazil
Atos Origin Brasil Ltda 100 FC 100Avenida Maria Coelho Aguiar, n° 215 - 5° andar - Bloco E – Jardim São Luís -
São Paulo SP CEP 05805-904
Atos Origin Serviços de Tecnologia da Informação do Brasil Ltda 100 FC 100
Avenida Maria Coelho Aguiar N° 215 - 7° andar -Bloco E – Bairro Jardim São
Luis - Sao Paulo -SP - CEP 05805-904
The United States of America
Atos Origin Inc 100 FC 100 5599 San Felipe, Suite 300 Houston - Texas 77056 - 2724 - USA
The complete list of entities part of Atos Origin Group is available on our internet site www.atosorigin.com
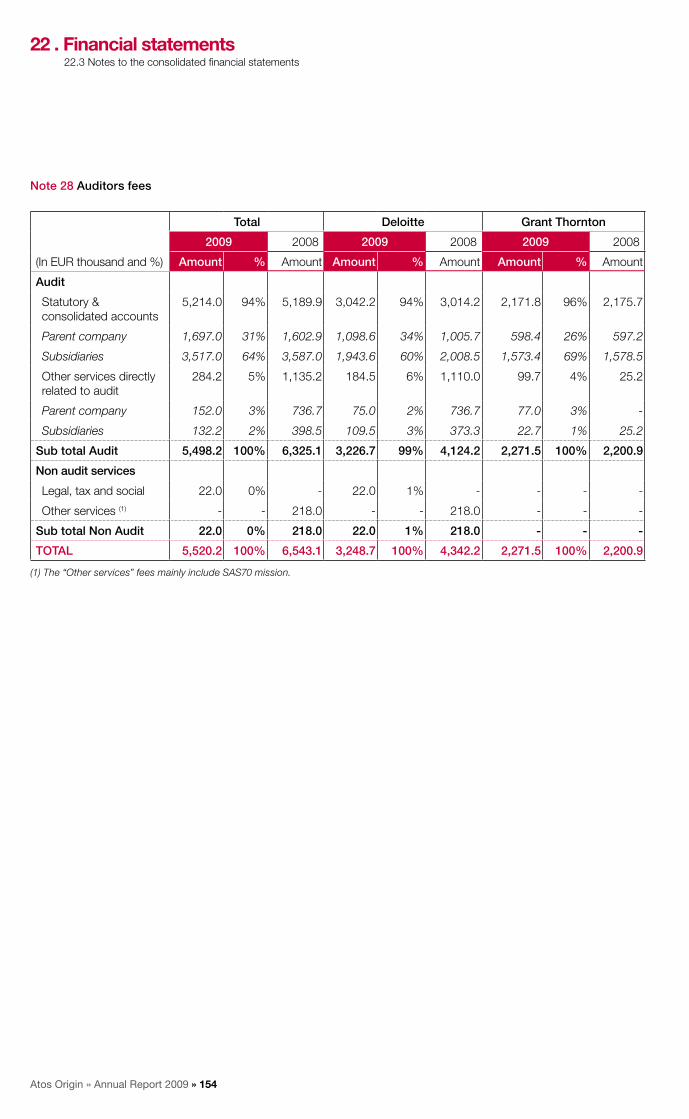
Atos Origin » Annual Report 2009 » 154
22 . Financial statements22.3 Notes to the consolidated financial statements
note 28 Auditors fees
(In EUR thousand and %)
Total Deloitte Grant Thornton
2009 2008 2009 2008 2009 2008
Amount % Amount Amount % Amount Amount % Amount
Audit
Statutory & consolidated accounts
5,214.0 94% 5,189.9 3,042.2 94% 3,014.2 2,171.8 96% 2,175.7
Parent company 1,697.0 31% 1,602.9 1,098.6 34% 1,005.7 598.4 26% 597.2
Subsidiaries 3,517.0 64% 3,587.0 1,943.6 60% 2,008.5 1,573.4 69% 1,578.5
Other services directly related to audit
284.2 5% 1,135.2 184.5 6% 1,110.0 99.7 4% 25.2
Parent company 152.0 3% 736.7 75.0 2% 736.7 77.0 3% -
Subsidiaries 132.2 2% 398.5 109.5 3% 373.3 22.7 1% 25.2
Sub total Audit 5,498.2 100% 6,325.1 3,226.7 99% 4,124.2 2,271.5 100% 2,200.9
non audit services
Legal, tax and social 22.0 0% - 22.0 1% - - - -
Other services (1) - - 218.0 - - 218.0 - - -
Sub total non Audit 22.0 0% 218.0 22.0 1% 218.0 - - -
TOTAL 5,520.2 100% 6,543.1 3,248.7 100% 4,342.2 2,271.5 100% 2,200.9
(1) The “Other services” fees mainly include SAS70 mission.
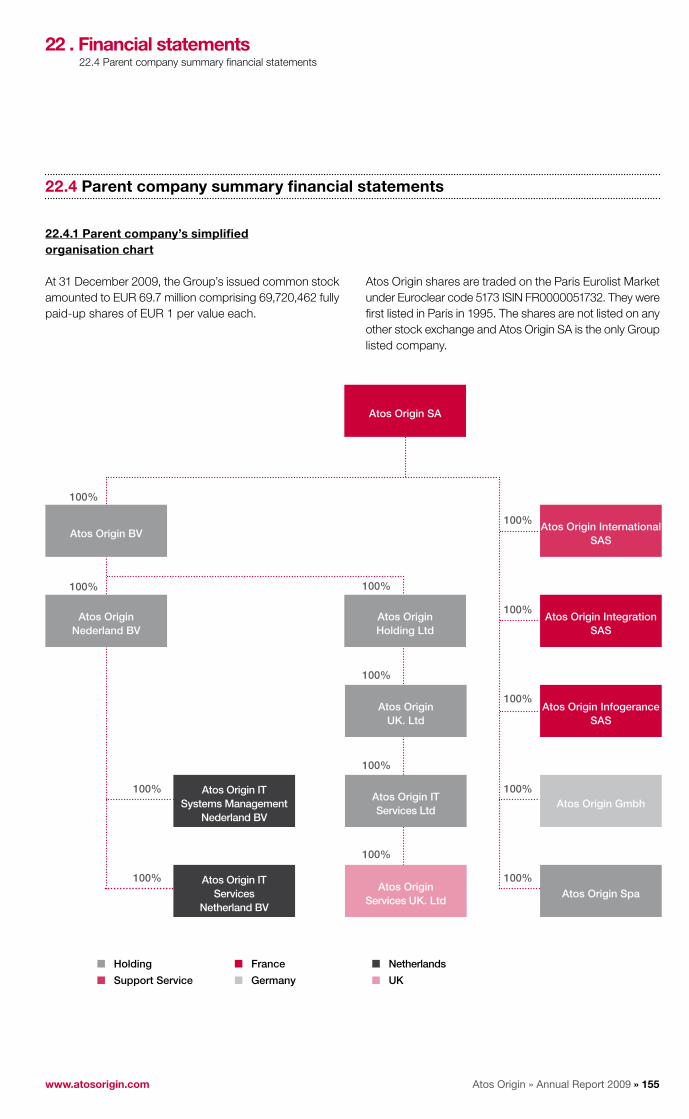
Atos Origin » Annual Report 2009 » 155www.atosorigin.com
22 . Financial statements22.4 Parent company summary financial statements
22.4 Parent company summary financial statements
22.4.1 Parent company’s simplified organisation chart
At 31 December 2009, the Group’s issued common stock amounted to EUR 69.7 million comprising 69,720,462 fully paid-up shares of EUR 1 per value each.
Atos Origin shares are traded on the Paris Eurolist Market under Euroclear code 5173 ISIN FR0000051732. They were first listed in Paris in 1995. The shares are not listed on any other stock exchange and Atos Origin SA is the only Group listed company.
Atos Origin SA
Atos Origin International SAS
Atos Origin Integration SAS
Atos Origin Infogerance SAS
Atos Origin Gmbh
Atos Origin Spa
Atos Origin ITSystems Management
nederland Bv
Atos Origin ITServices
netherland Bv
100%
100%
100%
100%
100%
100%
100%
100%
100%
100%
100%
100%
100%
Atos Origin Holding Ltd
Atos Origin UK. Ltd
Atos Origin ITServices Ltd
Atos Origin Services UK. Ltd
Atos Origin Bv
Atos Origin nederland Bv
Holding
Support Service
France
Germany
netherlands
UK

Atos Origin » Annual Report 2009 » 156
22 . Financial statements22.4 Parent company summary financial statements
22.4.2 -Statutory financial statement
Balance sheet
(in EUR thousand) notes 31 December 2009 31 December 2008
ASSETSIntangible fixed assets Note 1 99,389 72,544Tangible fixed assets Note 2 320 426Participating interests Note 3 2,322,012 2,252,346Other financial investments Note 3 380,023 233,267Total fixed assets 2,801,744 2,558,583Trade accounts and notes receivable Note 4 4,119 3,714Other receivables Note 4 325,873 130,107Cash and cash equivalent Note 5 298,269 256,179Total current assets 628,261 390,000Prepayments, deferred expenses and unrecognized exchange losses Note 6 4,783 2,133
TOTAL ASSETS 3,434,788 2,950,716
(in EUR thousand) notes 31 December 2009 31 December 2008
LIABILITIES AnD SHAREHOLDERS’EQUITY Common stock 69,720 69,717Additional paid-in capital 1,409,936 1,409,861Legal reserves 6,972 6,971Other reserves and retained earnings 157,209 118,565Net income for the period 128,712 38,301Shareholders’ equity Note 7 1,772,549 1,643,415Provisions for contingencies and losses Note 8 22,327 39,379Borrowings Note 9 849,731 679,590Trade accounts payable Note 10 8,653 17,620Other liabilities Note 10 781,010 570,712Total liabilities 1,639,394 1,267,922Unrecognized exchange gains 518 0TOTAL LIABILITIES AnD SHAREHOLDERS' EQUITY 3,434,788 2,950,716
Profit and loss
(in EUR thousand) notes 31 December 2009 31 December 2008
Revenue Note 11 42,357 44,755Other income 10 7,376Total operating income 42,367 52,131Cost of sales (11,190) (19,586)Taxes (219) (212)Depreciation amortisation and provisions (1,093) (11,157)Other expenses Note 12 (19,773) (16,317)Total operating expenses (32,275) (47,272)Operating margin 10,092 4,859Net financial result Note 13 108,578 14,627net income on ordinary activities 118,670 19,486Non-recurring items Note 14 (1,189) 6,822Corporate income tax Note 15 11,231 11,993
nET InCOME FOR THE PERIOD 128,712 38,301

Atos Origin » Annual Report 2009 » 157www.atosorigin.com
22 . Financial statements22.4 Parent company summary financial statements
22.4.3 Notes to the statutory Financial Statements
Atos Origin SA activity
Atos Origin SA main activities are:The management of the Atos Origin trademark;■■
The management of Group participating interests;■■
The management of Group financing activities.■■
Revenue included trademark fees received from Group subsidiaries.
The company Atos Origin SA is the parent company of the Atos Origin Group and consequently establishes consolidated financial statements.
2009 Atos Origin SA Highlights
Change of Status ■■
On 10 February 2009, the shareholders approved the transformation of the governance mode of the Group, from a Supervisory Board and Management Board governance model to company governed by a Board of Directors.
Issuing of a convertible bond (OCEAnE)■■
In order to address the financing needs of the Company and the Group (including the financing of potential external growth transactions), in order also to diversify the sources of funding and to lengthen its debt maturity profile (first reimbursement in May 2011), the Company issued bond
convertible into and/or exchangeable for new existing share (OCEANE) on 29 October 2009 for an amount of EUR 250.0 million. The par value of each bond was EUR 46.17 representing an issue premium of 38% over the reference price of the Atos Origins share. The bonds will be bear interest at an annual rate of 2.50 % and will be redeemed at par, or EUR 46.17 per bond, on 1 January 2016.
Impairment losses and provision on investments■■
A charge for provision for EUR 27.2 million was booked for various French subsidiaries and for EUR 1.3 million for the Brazilian entity.
A release of impairment on goodwill of French activities was recorded for an amount of EUR 27.3 million.
Rules and accounting methodsGeneral conventions were applied, in the respect of:
Principle of prudence;■■
Principle of going concern;■■
Permanence of the accounting methods from one fiscal ■■
period to another;Cut-off principle.■■
As a principle, items are booked in the accountancy based on the historical cost method.The annual accounts are established and presented in thousands of euros.
Notes on Assets
note 1 Intangible assets
net value of intangible fixed assets■■
(in EUR thousand)31 December
2008Acquisitions/
chargesDisposals/
Release 31 December
2009
Intangible assets 183,539 - - 183,539
Amortisation (7,365) (513) - (7,878)
Depreciation (103,630) (1,883) 29,241 (76,272)
Total of amortisation and depreciation (110,995) (2,396) 29,241 (84,150)
Of which: - operating (20) - - financial (1,883) 29,241 - non-recurring items (493) -
nET vALUE 72,544 (2,396) 29,241 99,389

Atos Origin » Annual Report 2009 » 158
The intangible assets are mainly composed of a goodwill (“merger deficit”) resulting from the transfer of assets and liabilities from Atos Investissement 6 to Atos Origin SA. The Company applied the regulation CRC 2004-01 relating to the accounting treatment of mergers and similar operations. As a result, a goodwill of EUR 173,579 thousand was booked in intangible assets in 2004. As required by this regulation, this goodwill was allocated to the various assets brought to allow a proper follow-up and is broken down as follows:
France EUR 40,826 thousand; ■■
Spain EUR 63,132 thousand; ■■
Sweden EUR 69,621 thousand. ■■
This goodwill follows the rules applied in the consolidated financial statements for goodwill as follows:
No depreciation;■■
Annual impairment test.■■
The annual impairment test on intangible assets was made by comparing for each subsidiary of the Company the sum of the merger deficit (if any) and the gross value of the financial investments with the enterprise value.
The enterprise value is computed on the basis of expected three year future cash flow through assumptions approved by the management of the Company.
As a result, a release was recorded for an amount of EUR 29.2 million on Atos Origin Integration SAS, and a charge for EUR 1.9 million was recorded on Atos Consulting France.
The other merger deficit amounting EUR 9.7 million in gross value are depreciated over a maximum 20 years period.
The tangible fixed assets (buildings/fittings) are booked at their acquisition value excluding any financial expenses.
Tangible fixed assets include land and buildings for a gross value of EUR 1,717 thousands and, fixtures and fittings for a gross value of EUR 967 thousands.
The methods applied for depreciation calculation are based on the straight-line method and over the useful life of the assets, as follows:Buildings 20 years straight-line method;Fixtures and fittings 5 to 10 years straight-line method.
note 3 Financial fixed assets
The gross value of the participating interests and other financial investments represents their acquisition costs.
The accounting value of the shares corresponds to the value-in-use for the Company, determined as follows:
For the operational subsidiaries, the value-in-use is ■■
determined on the basis of impairment test described above;For the holding subsidiaries, the value-in-use is calculated ■■
with the restated percentage of equity and the profitability expectations.
Impairment charge is booked when the accounting value thus defined is lower than the acquisition costs.
1,293 Atos Origins’ shares held by the Company and not part of the liquidity contract are registered in investments. This accounting treatment is in line with the intent of the owner, as those shares are held neither as a stock price adjustment nor as grants of free shares plan or stock options plan. The accounting value is calculated based on the weighted average market price of Atos Origins stock in December 2009. As a result, the value was EUR 30.89 at 31 December 2009.
note 2 Tangible fixed assets
net value of tangible fixed assets■■
(in EUR thousand)31 December
2008Acquisitions/
chargesDisposals/
Release 31 December
2009
Tangible fixed assets 2,690 - (6) 2,684
Depreciation of tangible fixed assets (2,264) (106) 6 (2,364)Of which:- operating (106) 6
nET vALUE 426 (106) - 320
22 . Financial statements22.4 Parent company summary financial statements

Atos Origin » Annual Report 2009 » 159www.atosorigin.com
Change in financial fixed assets – Impairment ■■
(in EUR thousand)31 December
2008 Depreciation Release31 December
2009Investments in consolidated companies (116,785) (28,455) 54 (145,186)Investments in non consolidated companies
(112) - - (112)
Treasury stock (70) - 18 (52)Other investments (85) - - (85)TOTAL (117,052) (28,455) 72 (145,435)Of which:- financial (28,455) 72
Changes in financial fixed assets - Gross value■■
(in EUR thousand)31 December
2008 Acquisitions Decrease31 December
2009Investments in consolidated companies 2,369,082 98,101 (52) 2,467,131Investments in non consolidated companies 139 - - 139Treasury stock 92 - - 92Other investments 85 - - 85Total Investments 2,369,398 98,101 (52) 2,467,447Loans and accrued interests 139,267 39,795 (48,149) 130,913Other 94,000 249,110 (94,000) 249,110Total Other financial assets 233,267 288,905 (142,149) 380,023TOTAL 2,602,665 387,006 (142,201) 2,847,470
The charge of the period related to:French entity Atos Origin International SAS for ■■
EUR 22.4 million;
Atos Participation 2 for EUR 3.2 million;■■
Atos Consulting for EUR 1.6 million; ■■
Atos ITS do Brazil for EUR 1.3 million.■■
net value of the financial fixed assets■■
(in EUR thousand)
31 December 2009
Gross value Depreciation net valueInvestments in consolidated companies 2,467,131 (145,186) 2,321,945Investments in non consolidated companies 139 (112) 27Treasury stock 92 (52) 40Other investments 85 (85) - Loans and accrued interests 130,913 - 130,913Other 249,110 - 249,110TOTAL 2,847,470 (145,435) 2,702,035
Maturity of loans and other financial fixed assets ■■
(in EUR thousand)
Gross value31 December
2009 Up to 1 year 1 to 5 yearsLoans and accrued interests 130,913 130,913 - Other 249,110 249,110 -TOTAL 380,023 380,023 -
22 . Financial statements22.4 Parent company summary financial statements
Acquisitions of shares related mainly to capital increase of several subsidiaries:
Atos Origin GMBH for EUR 50.0 million;■■
Atos Origin International for EUR 28.5 million;■■
Atos Origin ITS do Brazil for EUR 12.5 million; ■■
Atos Investment 10 for EUR 6.1 million.■■
Loans were refunded for:Atos Investissement 10 for EUR 6.1 million;■■
Atos Origin Pty (South Africa) for EUR 2.3 million.■■
Other financial fixed assets correspond to the deposit granted under the securitisation program.

Atos Origin » Annual Report 2009 » 160
22 . Financial statements22.4 Parent company summary financial statements
Main subsidiaries and investments■■
(in EUR thousand)Gross value
31 December 2009net value
31 December 2009 % interest
Common stock/Additional
paid-in capital
Reserves and
retained earnings
Outstanding loans and advances
granted by the company
Guarentees given by the
company
Revenue 31 December
2009
net income 31 December
2009Dividends received
during the period
I – Detailed informations
A- Subsidiaries (50% or more of common stock)
France
Atos Worldline 110,015 110,015 100% 98,974 8,009 - 20,950 359,356 18,271 24,500
Atos Investissement 5 618,681 618,681 100% 618,681 2,309 - - - 81,394
Atos Origin Infogérance 101,776 101,776 92% 31,143 84 - 79,163 537,485 (3,093) 85,088
Atos Origin Formation 2 2 100% 437 51 - 12 328 975 687
Atos Origin Intégration 59,906 59,906 92% 44,919 8,084 - - 680,118 (29,354)
Atos Consulting 16,139 14,568 100% 7,131 (4,135) - - 44,522 (3 303)
Atos Origin Participation 2 30,616 27,371 100% 15,552 1,745 - - - 747
Atos Origin International 30,878 6,126 100% 16,003 223 - 87 387 118,011 (10,100) -
Atos Investissement 10 11,140 11,140 100% 7,451 - - - - (108) -
Atos Origin Management France 40 - 100% 40 (940) - - 34,155 (766) -
Atos Investissement 12 40 40 100% 40 (3) - - - (2) -
Atos Investissement 18 37 37 100% 37 - - - - - -
Atos Meda 40 - 100% 40 (2,004) - - 7,668 (4,693) -
Italy
Atos Multimédia 68 68 100% 52 119 - - - - -
Atos SPA 57,183 - 100% 100 460 - - 2,315 (673) -
Benelux
St Louis RE 2,139 2,139 100% 2,140 - - 26 328 - - -
Spain
Atos Origin SAE 53,389 53,389 100% 41,261 5,715 - 45 000 304,359 349 2,000
GTI 751 751 100% 60 335 - - 594 62
Germany
Atos Origin GMBH 160,750 160,750 100% 161,926 120 - 199,015 498,495 (71,440)
Sema GMBH 50,637 - 100% 50,993 (52,902) - - 12 (104)
The Netherlands
Atos Origin BV 1,139,608 1,139,608 100% 995,761 (527 685) 127,979 - 6,655 11,020
Brazil
Atos IT Servicios do Brazil LTDA 23,285 15,578 55% 37,980 (23,610) - 4,001 46,382 (4,029) -
II – Global informations
Others participations 150 26 - - - - - - - -
TOTAL 2,467,270 2,321,971 - - - 127,979 461,844 2,652,455 (14,847) 112,275

Atos Origin » Annual Report 2009 » 161www.atosorigin.com
22 . Financial statements22.4 Parent company summary financial statements
Main subsidiaries and investments■■
(in EUR thousand)Gross value
31 December 2009net value
31 December 2009 % interest
Common stock/Additional
paid-in capital
Reserves and
retained earnings
Outstanding loans and advances
granted by the company
Guarentees given by the
company
Revenue 31 December
2009
net income 31 December
2009Dividends received
during the period
I – Detailed informations
A- Subsidiaries (50% or more of common stock)
France
Atos Worldline 110,015 110,015 100% 98,974 8,009 - 20,950 359,356 18,271 24,500
Atos Investissement 5 618,681 618,681 100% 618,681 2,309 - - - 81,394
Atos Origin Infogérance 101,776 101,776 92% 31,143 84 - 79,163 537,485 (3,093) 85,088
Atos Origin Formation 2 2 100% 437 51 - 12 328 975 687
Atos Origin Intégration 59,906 59,906 92% 44,919 8,084 - - 680,118 (29,354)
Atos Consulting 16,139 14,568 100% 7,131 (4,135) - - 44,522 (3 303)
Atos Origin Participation 2 30,616 27,371 100% 15,552 1,745 - - - 747
Atos Origin International 30,878 6,126 100% 16,003 223 - 87 387 118,011 (10,100) -
Atos Investissement 10 11,140 11,140 100% 7,451 - - - - (108) -
Atos Origin Management France 40 - 100% 40 (940) - - 34,155 (766) -
Atos Investissement 12 40 40 100% 40 (3) - - - (2) -
Atos Investissement 18 37 37 100% 37 - - - - - -
Atos Meda 40 - 100% 40 (2,004) - - 7,668 (4,693) -
Italy
Atos Multimédia 68 68 100% 52 119 - - - - -
Atos SPA 57,183 - 100% 100 460 - - 2,315 (673) -
Benelux
St Louis RE 2,139 2,139 100% 2,140 - - 26 328 - - -
Spain
Atos Origin SAE 53,389 53,389 100% 41,261 5,715 - 45 000 304,359 349 2,000
GTI 751 751 100% 60 335 - - 594 62
Germany
Atos Origin GMBH 160,750 160,750 100% 161,926 120 - 199,015 498,495 (71,440)
Sema GMBH 50,637 - 100% 50,993 (52,902) - - 12 (104)
The Netherlands
Atos Origin BV 1,139,608 1,139,608 100% 995,761 (527 685) 127,979 - 6,655 11,020
Brazil
Atos IT Servicios do Brazil LTDA 23,285 15,578 55% 37,980 (23,610) - 4,001 46,382 (4,029) -
II – Global informations
Others participations 150 26 - - - - - - - -
TOTAL 2,467,270 2,321,971 - - - 127,979 461,844 2,652,455 (14,847) 112,275
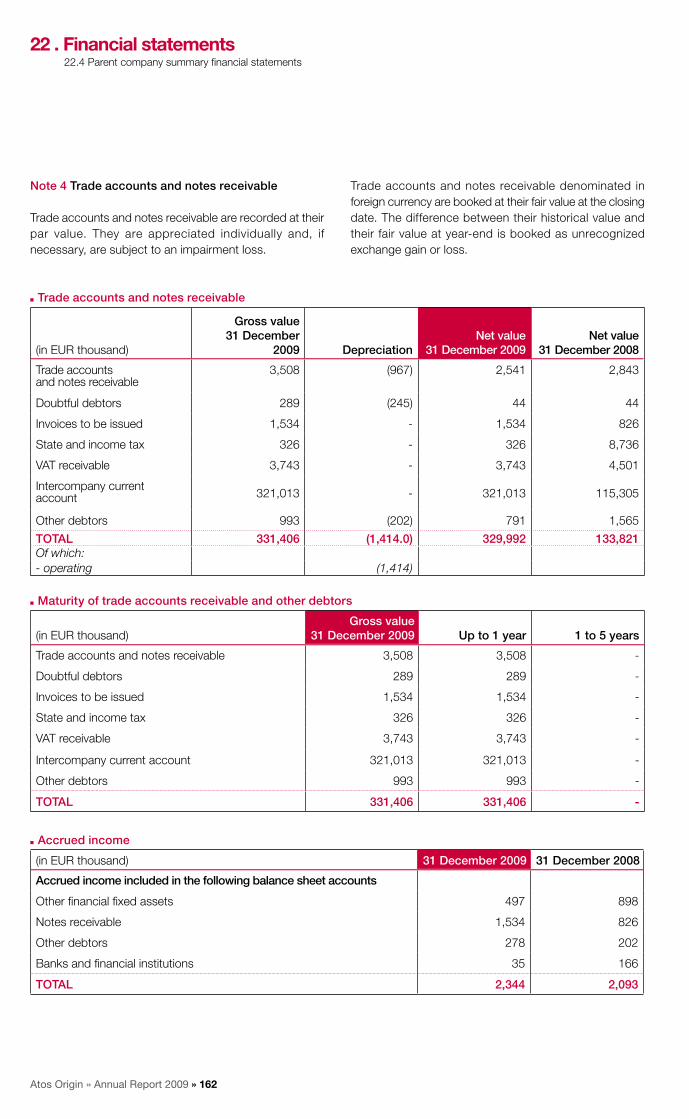
Atos Origin » Annual Report 2009 » 162
22 . Financial statements22.4 Parent company summary financial statements
note 4 Trade accounts and notes receivable
Trade accounts and notes receivable are recorded at their par value. They are appreciated individually and, if necessary, are subject to an impairment loss.
Trade accounts and notes receivable denominated in foreign currency are booked at their fair value at the closing date. The difference between their historical value and their fair value at year-end is booked as unrecognized exchange gain or loss.
Trade accounts and notes receivable■■
(in EUR thousand)
Gross value31 December
2009 Depreciationnet value
31 December 2009net value
31 December 2008
Trade accounts and notes receivable
3,508 (967) 2,541 2,843
Doubtful debtors 289 (245) 44 44
Invoices to be issued 1,534 - 1,534 826
State and income tax 326 - 326 8,736
VAT receivable 3,743 - 3,743 4,501
Intercompany current account 321,013 - 321,013 115,305
Other debtors 993 (202) 791 1,565
TOTAL 331,406 (1,414.0) 329,992 133,821Of which:- operating (1,414)
Maturity of trade accounts receivable and other debtors■■
(in EUR thousand)Gross value
31 December 2009 Up to 1 year 1 to 5 years
Trade accounts and notes receivable 3,508 3,508 -
Doubtful debtors 289 289 -
Invoices to be issued 1,534 1,534 -
State and income tax 326 326 -
VAT receivable 3,743 3,743 -
Intercompany current account 321,013 321,013 -
Other debtors 993 993 -
TOTAL 331,406 331,406 -
Accrued income■■
(in EUR thousand) 31 December 2009 31 December 2008
Accrued income included in the following balance sheet accounts
Other financial fixed assets 497 898
Notes receivable 1,534 826
Other debtors 278 202
Banks and financial institutions 35 166
TOTAL 2,344 2,093

Atos Origin » Annual Report 2009 » 163www.atosorigin.com
22 . Financial statements22.4 Parent company summary financial statements
note 5 Cash and cash equivalents Cash and cash equivalents■■
(in EUR thousand)Gross value
31 December 2009 Depreciationnet value
31 December 2009net value
31 December 2008
Treasury stock - liquidity contract
2,412 - 2,412 4,698
Mutual funds 5,610 - 5,610 23
Treasury stock - owned share 5,478 (2,443) 3,035 365
Treasury stock for share based payments
17,291 - 17,291 29,537
Cash in transit 230,027 - 230,027 153
Cash at bank 39,894 - 39,894 221,403
TOTAL 300,712 (2,443) 298,269 256,179Of which:- financial (2,443)
The 80,000 shares acquired within the framework of the contract of liquidity are accounted in Treasury stock – liquidity contract. The 570,859 own shares acquired within the framework of the plans of profit-sharing 2007 and 2008 Long Term Incentive Plan (LTI) and Management Investment Plan (MIP) are accounted in Treasury stock for share based payments.
The depreciations on owned shares were valued on the weighted average stock price in December 2009. As a result, the value was EUR 30.89 at 31 December 2009.
436,554 shares to be granted for the MIP and LTI plans are valued at the purchase price for those bought in 2008, and at the net book value as at 31 December 2007 for the others, further to the accounting method changes into 2008 in application of:
The CNC guideline n°2008-17;■■
The CRC regulation n°08-15, art 6;■■
The recommendation of the CNC n° 2009-R-01 of 5 ■■
February 2009.
note 6 Prepayments, deferred expenses and unrecognized exchange losses
(in EUR thousand) 31 December 2009 31 December 2008
Prepaid expenses 110 460
Deferred expenses 4,673 1,495
Unrecognized exchange losses - 179
TOTAL 4,783 2,133
The deferred expenses relate exclusively to the costs for issuing borrowings. Those costs are recognized over the duration of the borrowings on a straight-line basis. The significant increase
over the period corresponds to the expenses related to the issue of OCEANE for EUR 3.8 million.
Notes on Liabilities and Shareholders’ equity
note 7 Shareholder’s equity
Common stock■■
31 December 2009 31 December 2008
Number of shares 69,720,462 69,717,453
Nominal value (in EUR) 1 1
COMMOn STOCK (In EUR THOUSAnD) 69,720 69,717
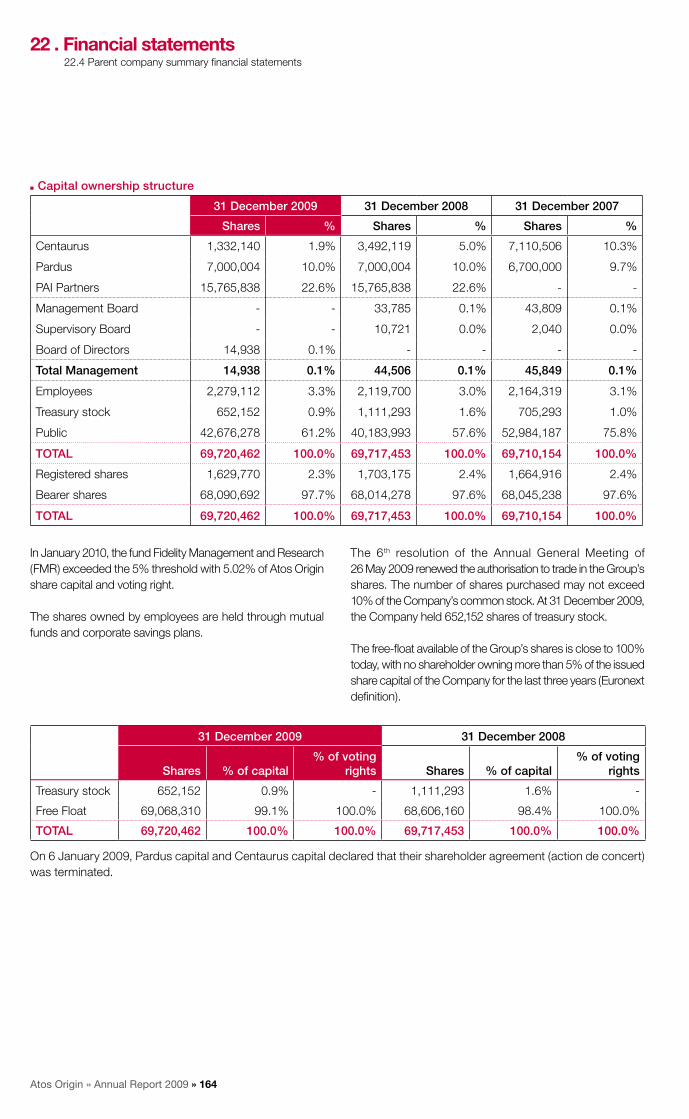
Atos Origin » Annual Report 2009 » 164
Capital ownership structure■■
31 December 2009 31 December 2008 31 December 2007
Shares % Shares % Shares %
Centaurus 1,332,140 1.9% 3,492,119 5.0% 7,110,506 10.3%
Pardus 7,000,004 10.0% 7,000,004 10.0% 6,700,000 9.7%
PAI Partners 15,765,838 22.6% 15,765,838 22.6% - -
Management Board - - 33,785 0.1% 43,809 0.1%
Supervisory Board - - 10,721 0.0% 2,040 0.0%
Board of Directors 14,938 0.1% - - - -
Total Management 14,938 0.1% 44,506 0.1% 45,849 0.1%
Employees 2,279,112 3.3% 2,119,700 3.0% 2,164,319 3.1%
Treasury stock 652,152 0.9% 1,111,293 1.6% 705,293 1.0%
Public 42,676,278 61.2% 40,183,993 57.6% 52,984,187 75.8%
TOTAL 69,720,462 100.0% 69,717,453 100.0% 69,710,154 100.0%
Registered shares 1,629,770 2.3% 1,703,175 2.4% 1,664,916 2.4%
Bearer shares 68,090,692 97.7% 68,014,278 97.6% 68,045,238 97.6%
TOTAL 69,720,462 100.0% 69,717,453 100.0% 69,710,154 100.0%
In January 2010, the fund Fidelity Management and Research (FMR) exceeded the 5% threshold with 5.02% of Atos Origin share capital and voting right.
The shares owned by employees are held through mutual funds and corporate savings plans.
The 6th resolution of the Annual General Meeting of 26 May 2009 renewed the authorisation to trade in the Group’s shares. The number of shares purchased may not exceed 10% of the Company’s common stock. At 31 December 2009, the Company held 652,152 shares of treasury stock.
The free-float available of the Group’s shares is close to 100% today, with no shareholder owning more than 5% of the issued share capital of the Company for the last three years (Euronext definition).
31 December 2009 31 December 2008
Shares % of capital% of voting
rights Shares % of capital% of voting
rights
Treasury stock 652,152 0.9% - 1,111,293 1.6% -
Free Float 69,068,310 99.1% 100.0% 68,606,160 98.4% 100.0%
TOTAL 69,720,462 100.0% 100.0% 69,717,453 100.0% 100.0%
On 6 January 2009, Pardus capital and Centaurus capital declared that their shareholder agreement (action de concert) was terminated.
22 . Financial statements22.4 Parent company summary financial statements

Atos Origin » Annual Report 2009 » 165www.atosorigin.com
Changes in shareholders’ equity■■
(in EUR thousand)31 December
2008 Dividends
Appropriation of prior period
net income
Common Stock Issue
net Income for the period
31 December 2009
Common stock 69,717 - - 3 - 69,720
Additional paid-in capital 1,409,861 - - 75 - 1,409,936
Legal reserve 6,971 - - - - 6,972
Other reserves 25,511 - - - - 25,511
Retained earnings 93,054 343 38,301 - - 131,698
Net income for the period 38,301 - (38,301) - 128,712 128,712
TOTAL OF THE SHAREHOLDERS’ EQUITY 1,643,415 343 - 78 128,712 1,772,549
22 . Financial statements22.4 Parent company summary financial statements
Potential common stock■■
Based on 69,720,462 shares issued, the common stock could be increased by 15,725,547 new shares, representing an increase of 22.6%, vesting:
Stock-options granted to employees;■■
Convertible bonds into new shares according to OCEANE.■■
Out of the 10, 310,776 granted, 3,876,101 stock options were at a strike price above EUR 50.0.
(in Units)31 December
200931 December
2008 Change
31 December 2009
% of dilution
number of shares outstanding 69,720,462 69,717,453 3,009
Convertible bonds 5,414,771 - 5,414,771
Stock-options 10,310,776 7,153,540 3,157,236 12,1%
TOTAL POTEnTIAL COMMOn STOCK 85,446,009 76,870,993 8,575,016
If all 15,725,547 new shares are vested, the common stock will increase by EUR 15.7 million.
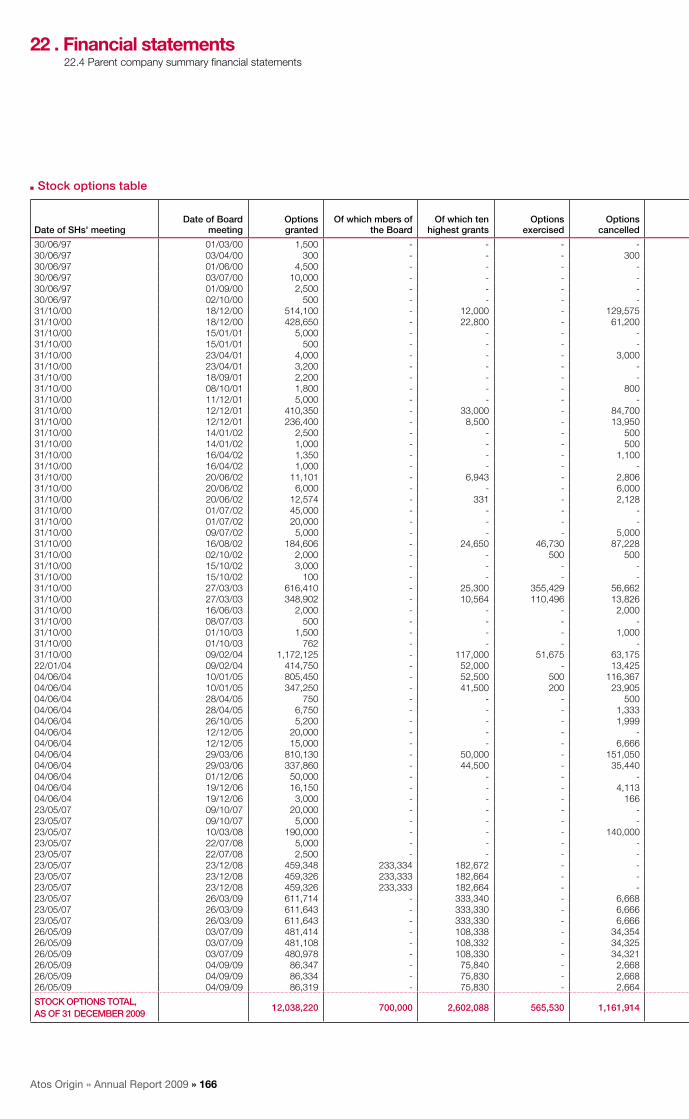
Atos Origin » Annual Report 2009 » 166
22 . Financial statements22.4 Parent company summary financial statements
Stock options table■■
Date of SHs' meetingDate of Board
meetingOptions granted
Of which mbers of the Board
Of which ten highest grants
Options exercised
Options cancelled
Closing 31/12/09
Of which mbers of the Board
numbers of beneficiaries
Exercise period start date
Exercise period end
dateStrike Price
(EUR)Cash
(EUR million)
30/06/97 01/03/00 1,500 - - - - 1,500 - 2 01/03/05 01/03/10 159.94 0.230/06/97 03/04/00 300 - - - 300 - - 1 03/04/05 03/04/10 153.82 -30/06/97 01/06/00 4,500 - - - - 4,500 - 5 01/06/04 01/06/10 110.15 0.530/06/97 03/07/00 10,000 - - - - 10,000 - 1 03/07/04 03/07/10 106.67 1.130/06/97 01/09/00 2,500 - - - - 2,500 - 2 01/09/04 01/09/10 109.50 0.330/06/97 02/10/00 500 - - - - 500 - 1 02/10/04 02/10/10 112.97 0.131/10/00 18/12/00 514,100 - 12,000 - 129,575 384,525 - 385 18/12/03 18/12/10 78.27 30.131/10/00 18/12/00 428,650 - 22,800 - 61,200 367,450 - 479 18/12/04 18/12/10 78.27 28.831/10/00 15/01/01 5,000 - - - - 5,000 - 2 15/01/04 15/01/11 76.23 0.431/10/00 15/01/01 500 - - - - 500 - 1 15/01/05 15/01/11 76.23 -31/10/00 23/04/01 4,000 - - - 3,000 1,000 - 3 23/04/04 23/04/11 84.33 0.131/10/00 23/04/01 3,200 - - - - 3,200 - 3 23/04/05 23/04/11 84.33 0.331/10/00 18/09/01 2,200 - - - - 2,200 - 1 18/09/05 18/09/11 80.71 0.231/10/00 08/10/01 1,800 - - - 800 1,000 - 3 08/10/04 08/10/11 74.06 0.131/10/00 11/12/01 5,000 - - - - 5,000 - 1 11/12/04 11/12/11 79.36 0.431/10/00 12/12/01 410,350 - 33,000 - 84,700 325,650 - 774 12/12/04 12/12/11 79.04 25.731/10/00 12/12/01 236,400 - 8,500 - 13,950 222,450 - 522 12/12/05 12/12/11 79.04 17.631/10/00 14/01/02 2,500 - - - 500 2,000 - 2 14/01/05 14/01/12 75.17 0.231/10/00 14/01/02 1,000 - - - 500 500 - 2 14/01/06 14/01/12 75.17 -31/10/00 16/04/02 1,350 - - - 1,100 250 - 3 16/04/05 16/04/12 87.51 -31/10/00 16/04/02 1,000 - - - - 1,000 - 1 16/04/06 16/04/12 87.51 0.131/10/00 20/06/02 11,101 - 6,943 - 2,806 8,295 - 815 20/06/05 20/06/12 63.06 0.531/10/00 20/06/02 6,000 - - - 6,000 - - 4 20/06/05 20/06/12 63.06 -31/10/00 20/06/02 12,574 - 331 - 2,128 10,446 - 1,536 20/06/06 20/06/12 63.06 0.731/10/00 01/07/02 45,000 - - - - 45,000 - 4 01/07/05 01/07/12 62.32 2.831/10/00 01/07/02 20,000 - - - - 20,000 - 2 01/07/06 01/07/12 62.32 1.231/10/00 09/07/02 5,000 - - - 5,000 - - 3 09/07/06 09/07/12 61.49 -31/10/00 16/08/02 184,606 - 24,650 46,730 87,228 50,648 - 146 16/08/05 16/08/12 41.52 2.131/10/00 02/10/02 2,000 - - 500 500 1,000 - 4 02/10/05 02/10/12 41.52 -31/10/00 15/10/02 3,000 - - - - 3,000 - 1 15/10/05 15/10/12 26.02 0.131/10/00 15/10/02 100 - - - - 100 - 1 15/10/06 15/10/12 26.02 -31/10/00 27/03/03 616,410 - 25,300 355,429 56,662 204,319 - 1,447 01/01/05 27/03/13 25.92 5.331/10/00 27/03/03 348,902 - 10,564 110,496 13,826 224,580 - 3,444 27/03/07 27/03/13 25.92 5.831/10/00 16/06/03 2,000 - - - 2,000 - - 2 16/06/07 16/06/13 30.88 -31/10/00 08/07/03 500 - - - - 500 - 1 08/07/06 08/07/13 31.81 -31/10/00 01/10/03 1,500 - - - 1,000 500 - 2 01/10/06 01/10/13 49.87 -31/10/00 01/10/03 762 - - - - 762 - 1 01/10/07 01/10/13 49.87 -31/10/00 09/02/04 1,172,125 - 117,000 51,675 63,175 1,057,275 - 1,220 01/01/06 09/02/14 54.14 57.222/01/04 09/02/04 414,750 - 52,000 - 13,425 401,325 - 686 09/02/08 09/02/14 54.14 21.704/06/04 10/01/05 805,450 - 52,500 500 116,367 688,583 - 803 10/01/08 10/01/15 49.75 34.304/06/04 10/01/05 347,250 - 41,500 200 23,905 323,145 - 567 10/01/09 10/01/15 49.75 16.104/06/04 28/04/05 750 - - - 500 250 - 1 28/04/08 28/04/15 49.98 -04/06/04 28/04/05 6,750 - - - 1,333 5,417 - 5 28/04/09 28/04/15 49.98 0.304/06/04 26/10/05 5,200 - - - 1,999 3,201 - 3 26/10/09 26/10/15 58.04 0.204/06/04 12/12/05 20,000 - - - - 20,000 - 1 12/12/08 12/12/15 57.07 1.104/06/04 12/12/05 15,000 - - - 6,666 8,334 - 1 12/12/09 12/12/15 57.07 0.504/06/04 29/03/06 810,130 - 50,000 - 151,050 659,080 - 828 29/03/09 29/03/16 59.99 39.504/06/04 29/03/06 337,860 - 44,500 - 35,440 302,420 - 420 29/03/10 29/03/16 59.99 18.104/06/04 01/12/06 50,000 - - - - 50,000 - 1 01/12/10 01/12/16 43.87 2.204/06/04 19/12/06 16,150 - - - 4,113 12,037 - 24 19/12/09 19/12/16 43.16 0.504/06/04 19/12/06 3,000 - - - 166 2,834 - 6 19/12/10 19/12/16 43.16 0.123/05/07 09/10/07 20,000 - - - - 20,000 - 1 09/10/10 09/10/17 40.35 0.823/05/07 09/10/07 5,000 - - - - 5,000 - 1 09/10/11 09/10/17 40.35 0.223/05/07 10/03/08 190,000 - - - 140,000 50,000 - 3 10/03/14 10/03/18 34.73 1.723/05/07 22/07/08 5,000 - - - - 5,000 - 1 22/07/11 22/07/18 34.72 0.223/05/07 22/07/08 2,500 - - - - 2,500 - 1 22/07/12 22/07/18 34.72 0.123/05/07 23/12/08 459,348 233,334 182,672 - - 459,348 233,334 24 01/04/10 31/03/18 18.40 8.523/05/07 23/12/08 459,326 233,333 182,664 - - 459,326 233,333 24 01/04/11 31/03/18 22.00 10.123/05/07 23/12/08 459,326 233,333 182,664 - - 459,326 233,333 24 01/04/12 31/03/18 26.40 12.123/05/07 26/03/09 611,714 - 333,340 - 6,668 605,046 - 74 01/07/10 30/06/18 20.64 12.523/05/07 26/03/09 611,643 - 333,330 - 6,666 604,977 - 74 01/07/11 30/06/18 24.57 14.923/05/07 26/03/09 611,643 - 333,330 - 6,666 604,977 - 74 01/07/12 30/06/18 29.49 17.826/05/09 03/07/09 481,414 - 108,338 - 34,354 447,060 - 438 01/07/10 30/06/18 25.00 11.226/05/09 03/07/09 481,108 - 108,332 - 34,325 446,783 - 438 01/07/11 30/06/18 30.00 13.426/05/09 03/07/09 480,978 - 108,330 - 34,321 446,657 - 438 01/07/12 30/06/18 35.00 15.626/05/09 04/09/09 86,347 - 75,840 - 2,668 83,679 - 24 01/07/10 30/06/18 34.28 2.926/05/09 04/09/09 86,334 - 75,830 - 2,668 83,666 - 24 01/07/11 30/06/18 40.81 3.426/05/09 04/09/09 86,319 - 75,830 - 2,664 83,655 - 24 01/07/12 30/06/18 48.97 4.1
STOCK OPTIOnS TOTAL, AS OF 31 DECEMBER 2009
12,038,220 700,000 2,602,088 565,530 1,161,914 10,310,776 700,000 446.0

Atos Origin » Annual Report 2009 » 167www.atosorigin.com
22 . Financial statements22.4 Parent company summary financial statements
Stock options table■■
Date of SHs' meetingDate of Board
meetingOptions granted
Of which mbers of the Board
Of which ten highest grants
Options exercised
Options cancelled
Closing 31/12/09
Of which mbers of the Board
numbers of beneficiaries
Exercise period start date
Exercise period end
dateStrike Price
(EUR)Cash
(EUR million)
30/06/97 01/03/00 1,500 - - - - 1,500 - 2 01/03/05 01/03/10 159.94 0.230/06/97 03/04/00 300 - - - 300 - - 1 03/04/05 03/04/10 153.82 -30/06/97 01/06/00 4,500 - - - - 4,500 - 5 01/06/04 01/06/10 110.15 0.530/06/97 03/07/00 10,000 - - - - 10,000 - 1 03/07/04 03/07/10 106.67 1.130/06/97 01/09/00 2,500 - - - - 2,500 - 2 01/09/04 01/09/10 109.50 0.330/06/97 02/10/00 500 - - - - 500 - 1 02/10/04 02/10/10 112.97 0.131/10/00 18/12/00 514,100 - 12,000 - 129,575 384,525 - 385 18/12/03 18/12/10 78.27 30.131/10/00 18/12/00 428,650 - 22,800 - 61,200 367,450 - 479 18/12/04 18/12/10 78.27 28.831/10/00 15/01/01 5,000 - - - - 5,000 - 2 15/01/04 15/01/11 76.23 0.431/10/00 15/01/01 500 - - - - 500 - 1 15/01/05 15/01/11 76.23 -31/10/00 23/04/01 4,000 - - - 3,000 1,000 - 3 23/04/04 23/04/11 84.33 0.131/10/00 23/04/01 3,200 - - - - 3,200 - 3 23/04/05 23/04/11 84.33 0.331/10/00 18/09/01 2,200 - - - - 2,200 - 1 18/09/05 18/09/11 80.71 0.231/10/00 08/10/01 1,800 - - - 800 1,000 - 3 08/10/04 08/10/11 74.06 0.131/10/00 11/12/01 5,000 - - - - 5,000 - 1 11/12/04 11/12/11 79.36 0.431/10/00 12/12/01 410,350 - 33,000 - 84,700 325,650 - 774 12/12/04 12/12/11 79.04 25.731/10/00 12/12/01 236,400 - 8,500 - 13,950 222,450 - 522 12/12/05 12/12/11 79.04 17.631/10/00 14/01/02 2,500 - - - 500 2,000 - 2 14/01/05 14/01/12 75.17 0.231/10/00 14/01/02 1,000 - - - 500 500 - 2 14/01/06 14/01/12 75.17 -31/10/00 16/04/02 1,350 - - - 1,100 250 - 3 16/04/05 16/04/12 87.51 -31/10/00 16/04/02 1,000 - - - - 1,000 - 1 16/04/06 16/04/12 87.51 0.131/10/00 20/06/02 11,101 - 6,943 - 2,806 8,295 - 815 20/06/05 20/06/12 63.06 0.531/10/00 20/06/02 6,000 - - - 6,000 - - 4 20/06/05 20/06/12 63.06 -31/10/00 20/06/02 12,574 - 331 - 2,128 10,446 - 1,536 20/06/06 20/06/12 63.06 0.731/10/00 01/07/02 45,000 - - - - 45,000 - 4 01/07/05 01/07/12 62.32 2.831/10/00 01/07/02 20,000 - - - - 20,000 - 2 01/07/06 01/07/12 62.32 1.231/10/00 09/07/02 5,000 - - - 5,000 - - 3 09/07/06 09/07/12 61.49 -31/10/00 16/08/02 184,606 - 24,650 46,730 87,228 50,648 - 146 16/08/05 16/08/12 41.52 2.131/10/00 02/10/02 2,000 - - 500 500 1,000 - 4 02/10/05 02/10/12 41.52 -31/10/00 15/10/02 3,000 - - - - 3,000 - 1 15/10/05 15/10/12 26.02 0.131/10/00 15/10/02 100 - - - - 100 - 1 15/10/06 15/10/12 26.02 -31/10/00 27/03/03 616,410 - 25,300 355,429 56,662 204,319 - 1,447 01/01/05 27/03/13 25.92 5.331/10/00 27/03/03 348,902 - 10,564 110,496 13,826 224,580 - 3,444 27/03/07 27/03/13 25.92 5.831/10/00 16/06/03 2,000 - - - 2,000 - - 2 16/06/07 16/06/13 30.88 -31/10/00 08/07/03 500 - - - - 500 - 1 08/07/06 08/07/13 31.81 -31/10/00 01/10/03 1,500 - - - 1,000 500 - 2 01/10/06 01/10/13 49.87 -31/10/00 01/10/03 762 - - - - 762 - 1 01/10/07 01/10/13 49.87 -31/10/00 09/02/04 1,172,125 - 117,000 51,675 63,175 1,057,275 - 1,220 01/01/06 09/02/14 54.14 57.222/01/04 09/02/04 414,750 - 52,000 - 13,425 401,325 - 686 09/02/08 09/02/14 54.14 21.704/06/04 10/01/05 805,450 - 52,500 500 116,367 688,583 - 803 10/01/08 10/01/15 49.75 34.304/06/04 10/01/05 347,250 - 41,500 200 23,905 323,145 - 567 10/01/09 10/01/15 49.75 16.104/06/04 28/04/05 750 - - - 500 250 - 1 28/04/08 28/04/15 49.98 -04/06/04 28/04/05 6,750 - - - 1,333 5,417 - 5 28/04/09 28/04/15 49.98 0.304/06/04 26/10/05 5,200 - - - 1,999 3,201 - 3 26/10/09 26/10/15 58.04 0.204/06/04 12/12/05 20,000 - - - - 20,000 - 1 12/12/08 12/12/15 57.07 1.104/06/04 12/12/05 15,000 - - - 6,666 8,334 - 1 12/12/09 12/12/15 57.07 0.504/06/04 29/03/06 810,130 - 50,000 - 151,050 659,080 - 828 29/03/09 29/03/16 59.99 39.504/06/04 29/03/06 337,860 - 44,500 - 35,440 302,420 - 420 29/03/10 29/03/16 59.99 18.104/06/04 01/12/06 50,000 - - - - 50,000 - 1 01/12/10 01/12/16 43.87 2.204/06/04 19/12/06 16,150 - - - 4,113 12,037 - 24 19/12/09 19/12/16 43.16 0.504/06/04 19/12/06 3,000 - - - 166 2,834 - 6 19/12/10 19/12/16 43.16 0.123/05/07 09/10/07 20,000 - - - - 20,000 - 1 09/10/10 09/10/17 40.35 0.823/05/07 09/10/07 5,000 - - - - 5,000 - 1 09/10/11 09/10/17 40.35 0.223/05/07 10/03/08 190,000 - - - 140,000 50,000 - 3 10/03/14 10/03/18 34.73 1.723/05/07 22/07/08 5,000 - - - - 5,000 - 1 22/07/11 22/07/18 34.72 0.223/05/07 22/07/08 2,500 - - - - 2,500 - 1 22/07/12 22/07/18 34.72 0.123/05/07 23/12/08 459,348 233,334 182,672 - - 459,348 233,334 24 01/04/10 31/03/18 18.40 8.523/05/07 23/12/08 459,326 233,333 182,664 - - 459,326 233,333 24 01/04/11 31/03/18 22.00 10.123/05/07 23/12/08 459,326 233,333 182,664 - - 459,326 233,333 24 01/04/12 31/03/18 26.40 12.123/05/07 26/03/09 611,714 - 333,340 - 6,668 605,046 - 74 01/07/10 30/06/18 20.64 12.523/05/07 26/03/09 611,643 - 333,330 - 6,666 604,977 - 74 01/07/11 30/06/18 24.57 14.923/05/07 26/03/09 611,643 - 333,330 - 6,666 604,977 - 74 01/07/12 30/06/18 29.49 17.826/05/09 03/07/09 481,414 - 108,338 - 34,354 447,060 - 438 01/07/10 30/06/18 25.00 11.226/05/09 03/07/09 481,108 - 108,332 - 34,325 446,783 - 438 01/07/11 30/06/18 30.00 13.426/05/09 03/07/09 480,978 - 108,330 - 34,321 446,657 - 438 01/07/12 30/06/18 35.00 15.626/05/09 04/09/09 86,347 - 75,840 - 2,668 83,679 - 24 01/07/10 30/06/18 34.28 2.926/05/09 04/09/09 86,334 - 75,830 - 2,668 83,666 - 24 01/07/11 30/06/18 40.81 3.426/05/09 04/09/09 86,319 - 75,830 - 2,664 83,655 - 24 01/07/12 30/06/18 48.97 4.1
STOCK OPTIOnS TOTAL, AS OF 31 DECEMBER 2009
12,038,220 700,000 2,602,088 565,530 1,161,914 10,310,776 700,000 446.0

Atos Origin » Annual Report 2009 » 168
22 . Financial statements22.4 Parent company summary financial statements
note 8 Provisions for losses and contingencies
The amount of the provisions is based on the best estimate of the outflow of resources necessary to extinguish the underlying obligation.
Provisions■■
(in EUR thousand)31 December
2008 Charges Release usedRelease unused
31 December 2009
Currency risk 179 - - (179) -
Subsidiary risk 23,900 1,179 - (15,586) 9,493
Contingencies 14,805 5,943 (8,108) (300) 12,340
Litigations 494 - - - 494
TOTAL 39,379 7,122 (8,108) (16,065) 22,327
Of which: - operating - - - - -- financial 38,884 7,122 (8,108) (16,065) 21,833- tax 494 - - - 494
Following the capital increase of Atos Origin International SAS, the 2008 provision booked as “subsidiary risk” has been fully released for EUR 12,300 thousand. Further to the evaluation of the participating interests, a provision has been released for EUR 3,300 thousand related to the subsidiary Atos Meda.
A provision for contingencies amounting to EUR 5,943 thousand was booked in 2009 and related free share grants and stock options plans. This amount will be spread over the vesting period according to the application of:
the CNC guideline n°2008-17;■■
the CRC regulation n°08-15, art 6;■■
the recommendation of the CNC n° 2009-R-01 of 5 ■■
February 2009.This amount mainly related to 2008 MIP/LTI plans.
The grant for shares 2007 LTI/MIP for the two year plans led to the release of EUR 8.1 million already provisioned.
note 9 Financial borrowings
Closing net debt■■
(in EUR thousand) Up to 1 year 1 to 5 years
Gross value31 December
2009
Gross value31 December
2008
Long and medium term borrowings - 250,000 250,000 -
Bank overdraft 306,103 - 306,103 568,226
Other borrowings 293,628 - 293,628 111,364
BORROWINGS 599,731 250,000 849,731 679,590
CASH AT BANK 39,894 - 39,894 221,403
CLOSInG nET DEBT 559,837 250,000 809,837 458,187

Atos Origin » Annual Report 2009 » 169www.atosorigin.com
22 . Financial statements22.4 Parent company summary financial statements
Financial borrowings included:Profit-sharing for a total amount of EUR 17,900 thousand. ■■
Intercompany loans for EUR 275,600 thousand.■■
The convertible bond (OCEANE) issued on 29 October 2009 amounted to EUR 250.0 million.
On top of OCEANE, the change in net debt is explained by the increase of borrowings granted to the Swiss subsidiary Telco Services for EUR 180,000 thousand and the increase of the debt with St-Louis-Ré for EUR 4,400 thousand.
■■ Structure of the syndicated loan (2005-2012)On 12 May 2005, Atos Origin signed with a number of major financial institutions a EUR 1.2 billion multi-currency revolving facility. With an initial term of five years, this facility was extended twice of an additional year. As of 31 December 2009, Atos Origin SA has not used this multi-currency revolving facility.
■■ SecuritizationOn 6 March 2009, Atos Origin renewed its pan-European securitisation program for a maximum amount for assignment of receivable of EUR 500.0 million and a maximum amount for financing of EUR 200.0 million. On 31 December 2009, Atos Origin SA received EUR 145.6 million for this program (compared to EUR 198.7 million in 2008).
note 10 Trade accounts, notes payable and other liabilities
Maturity of trade accounts, notes payable and other liabilities ■■
(in EUR thousand)
Gross value31 December
2009 Up to 1 year 1 to 5 years
Accounts payable 8,166 8,166 -
Social security and other employee welfare liabilities 350 350 -
VAT payable 62 62 -
State. income tax 75 75 -
Intercompany current account liabilities 780,441 780,441 -
Other liabilities 568 568 -
TOTAL 789,662 789,662 -
Terms of payment■■ The general terms of purchases are sixty days as from the date of issuance of the invoice except lawful or agreed contrary provisions between the parties.
The breakdown of accounts payable at the end of the financial year is the following:
(in EUR thousand)31 December
2009Associated companies Others
Invoices aged before
2009
Invoices due at 31st December
2009
Invoices non due at 31st December
2009
Accounts payable and liabilities 8,166 5,018 3,148 204 91 7,871
In % 100.0% 2.5% 1.1% 96.4%
Accounts payable 1,983 1,458 525 204 91 1,688
Invoice to be received 6,183 3,560 2,623 - - 6,183

Atos Origin » Annual Report 2009 » 170
Deferred Expenses■■
(in EUR thousand) 31 December 2009 31 December 2008
Deferred Expenses included in the following balance sheet accounts
Borrowings and other liabilities 3,100 2,174
Trade accounts and notes payable 6,182 3,565
Other liabilities 407 492
State and employee related liabilities 76 75
Accrued interests on overdraft 130 1,109
TOTAL 9,895 7,415
Notes of the income statement
note 11 Revenue and Activity
Revenue split■■
Year ended 31 December 2009 Year ended 31 December 2008
(in EUR thousand) % (in EUR thousand) %
Trademark fees 38,905 91.9% 41,696 93.2%
Re-invoicing 987 2.3% 743 1.7%
Parental guarantees 2,465 5.8% 2,316 5.2%
TOTAL REvEnUE BY nATURE 42,357 100.0% 44,755 100.0%
France 16,351 38.6% 17,102 38.2%
Foreign countries 26,006 61.4% 27,653 61.8%
TOTAL REvEnUE BY GEOGRAPHICAL AREA 42,357 100.0% 44,755 100.0%
The revenue mainly includes trademark fees received from Group companies for a total amount of EUR 38,905 thousand, decrease compared to 2008, according to the revenue evolution of the Group.
note 12 Operating and other expenses
Expenses■■
(in EUR thousand)Year ended
31 December 2009Year ended
31 December 2008
Expenses incurred in the interest of Atos Origin SA (19,240) (15,140)
Directors’ fees (421) (567)
Others (112) (610)
TOTAL (19,773) (16,317)
Expenses detailed above mainly include marketing, communication, investor relations and human resources expenses invoiced by Atos Origin International SAS and other holdings subsidiaries to the Company including fees paid to the International Olympic Committee.
22 . Financial statements22.4 Parent company summary financial statements

Atos Origin » Annual Report 2009 » 171www.atosorigin.com
22 . Financial statements22.4 Parent company summary financial statements
Accruals■■
Depreciation and provision amounted to EUR 1,100 thousand.
note 13 Financial result
(in EUR thousand)Year ended
31 December 2009Year ended
31 December 2008
Dividends received 112,275 105,165
Intercompany current account interests 4,093 6,917
Other financial assets income 4,919 9,073
Reversal of provisions on investments in consolidated companies 44,881 21,800
Reversal of other financial provisions 22,700 -
Disposal of short-term investment 530 51
Foreign exchange gains 733 16,770
Other financial income 9,628 12,685
TOTAL OF THE FInAnCIAL InCOME 199,759 172,461
Interests on borrowings (2,732) (8,985)
Securitisation interests (2,886) (8,892)
Intercompany loans interests (6,706) (7,791)
Intercompany current accounts interests (3,340) (6,823)
Provision for goodwill depreciation (1,883) (34,009)
Provision for depreciation on investments in consolidated companies (28,455) (8,990)
Provision for depreciation of treasury stocks (1,118) (6,188)
Other financial provisions (8,118) (24,394)
Loss on receivables held by participating investments (10,623) (12,582)
Short term borrowing interests (4,016) (17,651)
Foreign exchange losses (1,709) (11,812)
Other financial expenses (19,595) (9,715)
TOTAL OF THE FInAnCIAL ExPEnSES (91,181) (157,833)
nET FInAnCIAL RESULT 108,578 14,627
The financial income is mainly related to dividends received for EUR 112,275 thousand, and the release of provision for risk from Atos Origin International SAS for EUR 12,300 thousand, the release of goodwill impairment on French activities for EUR 29,200 thousand.
The Company received dividends from Atos Origin Infogerance EUR 84,100 thousand, from Atos Worldline EUR 24,500 thousand and from Atos Origin SAE in Spain EUR 2,000 thousand.
Other financial income amounted EUR 9,600 thousand related to the reinvoicing to the Company subsidiaries of free shares granted in 2007 MIP/LTI plans.
Financial expenses for EUR 91,181 thousand mainly relate to the following items:
Depreciation of Atos Origin International SAS shares for ■■
EUR 22,400 thousand;Grant of free shares for 2007 MIP/LTI plans for ■■
EUR 12,000 thousand (included above in the line other financial expenses); andWaiver of interest in the Brazilian subsidiary for ■■
EUR 8,800 thousand.
Interests on borrowings include the interest related to the coupon paid to OCEANE holders for EUR 1,100 thousand.

Atos Origin » Annual Report 2009 » 172
22 . Financial statements22.4 Parent company summary financial statements
note 14 non recurring items
The non recurring income and expenses include the non recurring items of ordinary activities and extraordinary items.
Non recurring items coming from ordinary activities are those whose realization is not related to the current operations of the Company due to their unusual, abnormal and infrequent nature.
(in EUR thousand)Year ended
31 December 2009Year ended
31 December 2008
Selling price from disposal of financial assets - 35,462
Reversal of provision - 1,650
TOTAL OF nOn RECURRInG InCOME - 37,112
Amortisation of goodwill (492) (492)
Net book value of financial assets sold (67) (20,031)
Other expenses (630) (9,766)
TOTAL OF nOn RECURRInG ExPEnSES (1,189) (30,290)
nOn RECURRInG ITEMS (1,189) 6,822
note 15 Tax
Decrease and increase of the future tax charge of Atos Origin taxed separately■■
At December 2009, decrease and increase of the future tax charge are broken down as follows:
(in EUR thousand) Basis decrease Basis increase
Non deductible provisions from timing differences 6,319 -
TOTAL 6,319 -
No related deferred tax assets nor income have been recognized.
■■ Breakdown between net income on ordinary activities and non recurring items
(in EUR thousand) Before tax Computed tax net amount
Net income on ordinary activities 118,670 - 118,670
Non recurring items (1,189) - (1,189)
Tax credit - 11,231 11,231
TOTAL 117,481 11,231 128,712
At December 2009, there is no risk of repayment of the tax credit booked in the frame of the French Tax Consolidation as per the French Tax Consolidation Agreement.
The difference between the tax booked in the accounts and the tax that would have been booked in the absence of French Tax Consolidation is EUR 12.2 million.

Atos Origin » Annual Report 2009 » 173www.atosorigin.com
22 . Financial statements22.4 Parent company summary financial statements
Tax consolidation agreement
As per the article 223-A from the French Fiscal Code, Atos Origin SA signed an agreement of Group tax consolidation with a certain number of its French subsidiaries with effect as of 1 January 2001.
Atos Origin as parent company of the Group is designated as the only liable entity for the corporate tax of the Group formed by itself and the companies indicated below:
Company name Form Capital(in EUR thousand) Registered office RCS
Atos Worldline SAS 78,805 18 Avenue d’Alsace92400 Courbevoie
378 901 946RCS Nanterre
Mantis SA 40 27, rue des Jeuneurs75002 Paris
352 188 601RCS Nanterre
Atos Origin Infogérance SAS 832 18 Avenue d’Alsace92400 Courbevoie
064 502 636RCS Nanterre
Atos Origin Intégration SAS 4,205 18 Avenue d’Alsace92400 Courbevoie
408 024 719RCS Nanterre
Atos Origin International SAS 1,003 18 Avenue d’Alsace92400 Courbevoie
412 190 977RCS Nanterre
Atos Origin Participation 2 SA 525 18 Avenue d’Alsace92400 Courbevoie
552 149 502RCS Nanterre
Atos Origin Formation SAS 430 7-13, rue de Bucarest75008 Paris
343 358 115RCS Paris
Atos Investissement 5 SAS 618,681 18 Avenue d’Alsace92400 Courbevoie
440 221 679 RCS Nanterre
Atos Investissement 10 SAS 5,040 18 Avenue d’Alsace92400 Courbevoie
480 055 680RCS Nanterre
Atos Origin Management France SAS 40 18 Avenue d’Alsace92400 Courbevoie
480 055 664RCS Nanterre
Atos Investissement 12 SAS 40 18 Avenue d’Alsace92400 Courbevoie
480 055 797RCS Nanterre
Atos Consulting SAS 70 18 Avenue d’Alsace92400 Courbevoie
410 333 223RCS PARIS
Atos Meda SA 40 18 Avenue d’Alsace92400 Courbevoie
448 686 154RCS Nanterre
Atos Origin A2B SAS 416 18 Avenue d’Alsace92400 Courbevoie
413 573 013 RCS Nanterre
Santeos SA 1,500 18 Avenue d’Alsace92400 Courbevoie
419 300 678 RCS Nanterre
Atos Participation 1 SA 146 18 Avenue d’Alsace92400 Courbevoie
341 596 294 RCS Nanterre
Atos Worldline Financial Markets SAS 12,225 18 Avenue d’Alsace92400 Courbevoie
501 710 719RCS Nanterre
The principal methods of the Agreement are:Each subsidiary records in its accounts the amount of ■■
tax that it would have paid on a stand-alone basis;Tax savings related to the use of the tax losses of the Tax ■■
Consolidation members will be only temporary since the subsidiaries concerned will still be able to use them. Consequently the tax savings are booked as liabilities towards those subsidiaries;
Atos Origin SA is the only liable for any additional tax to ■■
be paid in the event of an exit of the subsidiaries from the French Tax Consolidation.

Atos Origin » Annual Report 2009 » 174
22 . Financial statements22.4 Parent company summary financial statements
Other information
Commercial commitments
(in EUR thousand) 31 December 2009
Performance Guarantees 1,152,003
Bank guarantees 196
TOTAL 1,152,199
In relation to the multi-currency revolving facility contracted in May 2005, Atos Origin SA issued a parental guarantee to the benefit of the consortium of banks represented by BNP Paribas, in order to cover up to EUR 440.0 million the obligations of its subsidiary, Atos Origin Telco Services B.V.
In the normal course of business of its subsidiaries, Atos origin SA has given financial guarantees for a total of EUR 388.9 million to banks, lessors and real estate owners.
Atos Origin SA has given a EUR 120.0 million guarantee to the Stichting Pensionfonds Atos Origin. This guarantee is provided to secure the payment obligations of Atos Origin Nederland under the cover ratio mechanism in case of its failure to pay associated sums.
Subsequent to the Cellnet disposal in July 2004, Atos Origin SA has still one outstanding guarantee with Schlumberger related to Citicorp for a total amount of USD 75.7 million, which is fully counter-guaranteed by the acquirer of Cellnet, “Cellnet Holdings Corp”.
In addition, Atos Origin SA has granted a EUR 26.4 million guarantee to Chartis Europe SA for the performance of the duties of its reinsurer St Louis Re. The Guarantee could only be exercised in the very unlikely event that St Louis Re was unable to meet all of its reinsurance obligations to Chartis Europe SA.
Finally, Atos Origin SA has given for various subsidiaries guarantees of general financial support at the request of auditors or to comply with local regulations.
Risk analysis
Market risks: Fair value of financial instrumentsCash at bank and short-term deposits, trade accounts ■■
receivable, bank overdraft and trade accounts payable
Due to the short term nature of these instruments, the Group considers that the accounting value constitutes a reasonable estimate of their market value as at 31 December 2009.
Long and medium term liabilities■■
On 31 December 2009, Atos Origin SA presents no long and medium term liabilities related to the syndicated loan. Liquidity risk
Syndicated loan■■
The major financing tool of Atos Origin is a EUR 1.2 billion multi-currency revolving facility signed on 12 May 2005 with the major financial institutions; it includes a five year maturity and a two-year extension option exercisable in 2006 and 2007. These options were exercised in 2006 and 2007 extending the maturity of the multi-currency revolving facility until 12 May 2011 for EUR 1.2 billion and 12 May 2012 for EUR 1.1 billion.
Bank covenants are the following:The consolidated leverage ratio (net debt divided by ■■
Operating Margin before Depreciation and Amortization) may not be greater than 2.5 times under the multi-currency revolving facility.The consolidated interest cover ratio (operating margin ■■
divided by the net cost of financial debt) may not be less than four times throughout the term of the multi-currency revolving facility.
Securitization program■■
In March 2009, Atos Origin has renewed his securitization program with Ester Finances, a subsidiary of CALYON rated AA- by Standard & Poors and Aa2 by Moodys for 5 years. The maximum amount of the program is EUR 200.0 million.
The trade account receivables of certain entities of Atos Origin based in the Netherlands, in France, in England and Germany are transferred on a recurring basis to this financing institution. This transaction is financed through the issue of commercial notes rated A1P1. This rate is granted due to an underlying deposit made by Atos Origin. The deposit amount is calculated every month and is based on various criteria such as the dilution ratio, the days sales outstanding (DSO), losses, etc.

Atos Origin » Annual Report 2009 » 175www.atosorigin.com
22 . Financial statements22.4 Parent company summary financial statements
On 31 December 2009, the total amount of the trade accounts receivable transferred to Ester Finances amounted to EUR 394.7 million.
The Group aligned its contractual obligations under this program on the most favourable conditions of the renewable multicurrency credit facilities described above.
OCEAnE■■
On 29 October 2009, Atos Origin issued a convertible bond in share (OCEANE) for an amount of EUR 250.0 million expiring on 1 January 2016 and an annual coupon of 2.5%.
Liquidity risk at 31 December 2009■■
Instruments Fix / variableLine
(in EUR million) Maturity
Syndicated loan (*) Variable 1,100 May 2012
Securitization programm (**) Variable 200 March 2014
OCEANE Fix 250 January 2016
(*) EUR 260 million used at 31 December 2009, including EUR 260 million for the Swiss branch of Atos Origin Telco Services B.V.(**) EUR 145,6 million financed at 31 December 2009.
Credit riskThe Group has a fully-integrated process concerning credit risk. In its trade relations, the Group manages its credit risk with a portfolio of diversified customers and follow-up tools.
Financial wise, the Group monitors the credit risk on its investments and its market operations by rigorously selecting leading financial institutions and by using several banking partners. The Group thus considers its credit exposure as being limited. Market riskMonetary assets of the Group comprise receivables and loans, securities investments and cash at bank. Monetary liabilities comprise financial, operating and other liabilities.
Interest rate riskThe exposure to interest risk encompasses two types of risks:
A price risk on fixed-rate financial assets and liabilities. ■■
For example, by contracting a fixed-rate liability, the Company is exposed to potential opportunity losses should interest rates fall. A change in interest rates would
impact the market value of fixed-rate financial assets and liabilities. However, this loss of opportunity would not impact financial income and expenses as reported in the Company’s Income Statement and, as such, future net income of the Company up to maturity of these assets.
A cash flow risk on floating-rate financial assets and ■■
liabilities should interest rates increase. The Group considers that a variation in rates would have little incidence on floating-rate financial assets and liabilities.
Year-end headcount by category
Atos Origin SA had no employee in 2009 and in 2008.
Compensation of Board membersThe global amount of compensation and incentives of ■■
any nature to the members of the Management Board and Supervisory Board of Atos Origin from 1 January to 10 February 2009 was EUR 32 thousand. The total amount of directors’ fees to the members of ■■
the Board of Directors of Atos Origin from 11 February to 31 December 2009 was EUR 421 thousand.
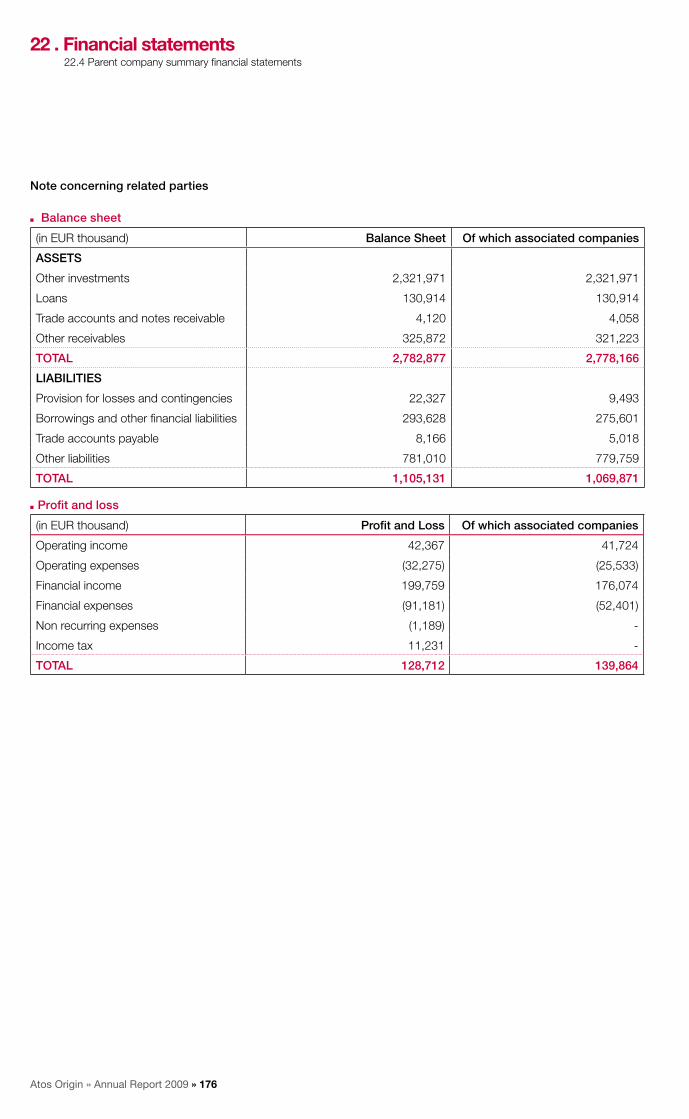
Atos Origin » Annual Report 2009 » 176
note concerning related parties
Balance sheet■■
(in EUR thousand) Balance Sheet Of which associated companies
ASSETS
Other investments 2,321,971 2,321,971
Loans 130,914 130,914
Trade accounts and notes receivable 4,120 4,058
Other receivables 325,872 321,223
TOTAL 2,782,877 2,778,166
LIABILITIES
Provision for losses and contingencies 22,327 9,493
Borrowings and other financial liabilities 293,628 275,601
Trade accounts payable 8,166 5,018
Other liabilities 781,010 779,759
TOTAL 1,105,131 1,069,871
Profit and loss■■
(in EUR thousand) Profit and Loss Of which associated companies
Operating income 42,367 41,724
Operating expenses (32,275) (25,533)
Financial income 199,759 176,074
Financial expenses (91,181) (52,401)
Non recurring expenses (1,189) -
Income tax 11,231 -
TOTAL 128,712 139,864
22 . Financial statements22.4 Parent company summary financial statements

Atos Origin » Annual Report 2009 » 177www.atosorigin.com
22 . Financial statements22.5 Statutory auditors’s report on annual financial statements year ended 31 December 2009
22.5 Statutory auditors’s report on annual financial statements year ended 31 december 2009
This is a free translation into English of the statutory auditors’ report on the annual financial statements issued in the French language and is provided solely for the convenience of English speaking users.The statutory auditors’ report includes information specifically required by French law in such reports, whether modified or not. This information is presented below the audit opinion on the financial statements and includes an explanatory paragraph discussing the auditors’ assessments of certain significant accounting and auditing matters. These assessments were made for the purpose of issuing an audit opinion on the annual financial statements taken as a whole and not to provide separate assurance on individual account balances, transactions or disclosures.This report also includes information relating to the specific verifications of information given in the management report and in the document addressed to the shareholders.This report should be read in conjunction with, and is construed in accordance with, French law and professional auditing standards applicable in France.
To the Shareholders,
In compliance with the assignment entrusted to us by your Annual General Meeting, we hereby report to you, for the year ended 31 December 2009, on:
the audit of the accompanying financial statements of ■■
Atos Origin;the justification of our assessments;■■
the specific verifications and information required by law.■■
These financial statements have been approved by the Board of Directors. Our role is to express an opinion on these financial statements based on our audit.
I. Opinion on the financial statementsWe conducted our audit in accordance with professional standards applicable in France. Those standards require that we plan and perform the audit to obtain reasonable assurance about whether the financial statements are free of material misstatement. An audit involves performing procedures, using sampling techniques or other methods of selection, to obtain audit evidence about the amounts and disclosures in the financial statements. An audit also includes evaluating the appropriateness of accounting policies used and the reasonableness of accounting estimates made, as well as the overall presentation of the financial statements. We believe that the audit evidence we have obtained is sufficient and appropriate to provide a basis for our opinion.
In our opinion, the financial statements give a true and fair view of the assets and liabilities, of the financial position of the Company as at 31 December 2009 and of the results of its operations for the year then ended in accordance with the accounting rules and principles applicable in France.
II. justification of our assessmentsIn accordance with the requirements of article L.823-9 of the French Commercial Code (Code de commerce) relating to the justification of our assessments, we bring to your attention the following matter:
Participating interests, with a net book value of EUR 2,322,012 ■■
thousands in the balance sheet as at 31 December 2009, are valued at acquisition cost and depreciated based on its value-in-use according to the principles described in the note 3 “Financial fixed assets” to the financial statements. Our work consisted on appreciating the data and assumptions on which these estimations are based, especially the cash-flow projections prepared by Atos Origin Management, reviewing the calculations performed by the entity and scrutinising the approval procedure of these estimations by Management.
These assessments were made as part of our audit of the financial statements of Atos Origin as at 31 December 2009, taken as a whole and therefore contributed to the opinion we formed which is expressed in the first part of this report.
III. Specific verifications and informationWe have also performed the specific verifications required by French law in accordance with professional standards applicable in France.
We have no matters to report regarding the fair presentation and the consistency with the financial statements of the information given in the management report of the Board of Directors and in the documents addressed to the shareholders with respect to the financial position and the financial statements.
Concerning the information given in accordance with the requirements of Article L.225-102-1 of the French Commercial Code (Code de commerce) relating to remunerations and benefits received by the directors and any other commitments made in their favor, we have verified its consistency with the financial statements, or with the underlying information used to prepare these financial statements and, when applicable, with the information obtained by your company from companies controlling your company or controlled by it. Based on this work, we attest the accuracy and fair presentation of this information.
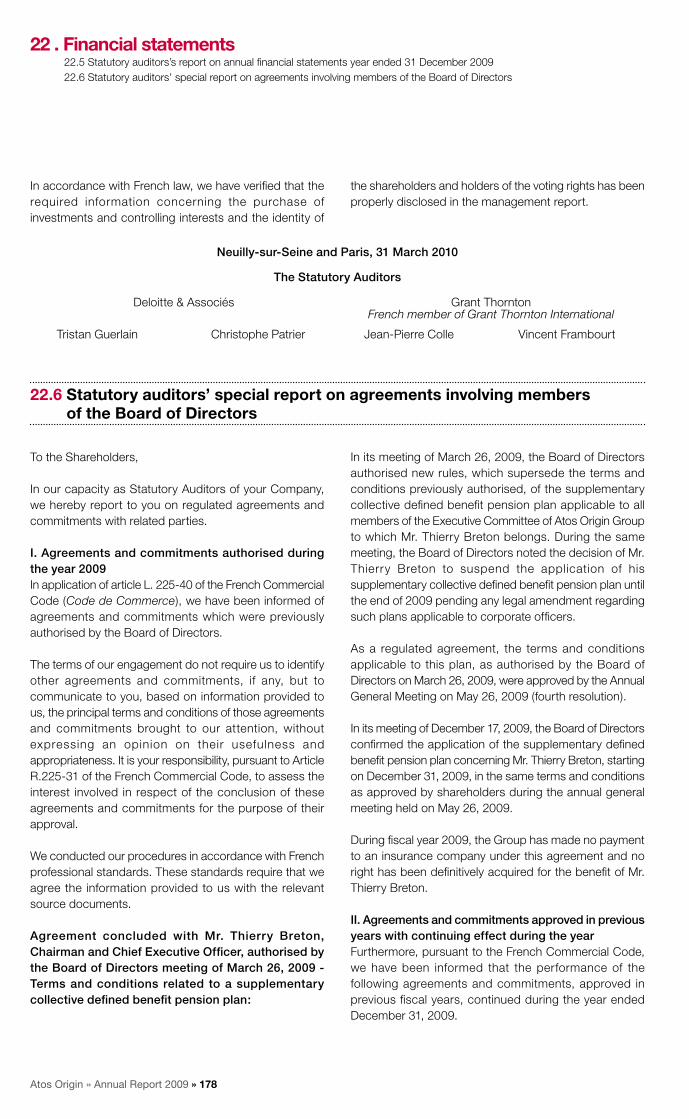
Atos Origin » Annual Report 2009 » 178
22.6 Statutory auditors’ special report on agreements involving members of the Board of directors
To the Shareholders,
In our capacity as Statutory Auditors of your Company, we hereby report to you on regulated agreements and commitments with related parties.
I. Agreements and commitments authorised during the year 2009In application of article L. 225-40 of the French Commercial Code (Code de Commerce), we have been informed of agreements and commitments which were previously authorised by the Board of Directors.
The terms of our engagement do not require us to identify other agreements and commitments, if any, but to communicate to you, based on information provided to us, the principal terms and conditions of those agreements and commitments brought to our attention, without expressing an opinion on their usefulness and appropriateness. It is your responsibility, pursuant to Article R.225-31 of the French Commercial Code, to assess the interest involved in respect of the conclusion of these agreements and commitments for the purpose of their approval.
We conducted our procedures in accordance with French professional standards. These standards require that we agree the information provided to us with the relevant source documents.
Agreement concluded with Mr. Thierry Breton, Chairman and Chief Executive Officer, authorised by the Board of Directors meeting of March 26, 2009 - Terms and conditions related to a supplementary collective defined benefit pension plan:
In its meeting of March 26, 2009, the Board of Directors authorised new rules, which supersede the terms and conditions previously authorised, of the supplementary collective defined benefit pension plan applicable to all members of the Executive Committee of Atos Origin Group to which Mr. Thierry Breton belongs. During the same meeting, the Board of Directors noted the decision of Mr. Thierry Breton to suspend the application of his supplementary collective defined benefit pension plan until the end of 2009 pending any legal amendment regarding such plans applicable to corporate officers.
As a regulated agreement, the terms and conditions applicable to this plan, as authorised by the Board of Directors on March 26, 2009, were approved by the Annual General Meeting on May 26, 2009 (fourth resolution).
In its meeting of December 17, 2009, the Board of Directors confirmed the application of the supplementary defined benefit pension plan concerning Mr. Thierry Breton, starting on December 31, 2009, in the same terms and conditions as approved by shareholders during the annual general meeting held on May 26, 2009.
During fiscal year 2009, the Group has made no payment to an insurance company under this agreement and no right has been definitively acquired for the benefit of Mr. Thierry Breton.
II. Agreements and commitments approved in previous years with continuing effect during the year Furthermore, pursuant to the French Commercial Code, we have been informed that the performance of the following agreements and commitments, approved in previous fiscal years, continued during the year ended December 31, 2009.
22 . Financial statements22.5 Statutory auditors’s report on annual financial statements year ended 31 December 200922.6 Statutory auditors’ special report on agreements involving members of the Board of Directors
In accordance with French law, we have verified that the required information concerning the purchase of investments and controlling interests and the identity of
the shareholders and holders of the voting rights has been properly disclosed in the management report.
neuilly-sur-Seine and Paris, 31 March 2010
The Statutory Auditors
Deloitte & Associés Grant ThorntonFrench member of Grant Thornton International
Tristan Guerlain Christophe Patrier Jean-Pierre Colle Vincent Frambourt

Atos Origin » Annual Report 2009 » 179www.atosorigin.com
22 . Financial statements22.6 Statutory auditors’ special report on agreements involving members of the Board of Directors
Commitment concluded with Management Board members with respect to compensation due to a termination of duties:In connection with the status of Management Board members (agreement authorised by the Supervisory Board meeting held on 16 December 2005, amended on July 31, 2007 and approved by the shareholders, during the annual general meetings held on 23 May 2006 and June 12, 2008), the following commitment, with respect to compensation due to a termination of duties, concluded with each Management Board member, and representing remuneration, compensation or benefits likely to be payable due to the termination of duties, or subsequent thereto, continued during the year 2009 and ended as of January 22, 2009. This commitment did not generate any charge or payment of compensation during the fiscal year 2009.
Agreement concluded with two shareholders of the Company having voting rights above 10%:The agreement authorised by the Supervisory Board on May 25, 2008, and concluded between Atos Origin, Centaurus Capital (i.e the Centaurus Alpha Master Fund Limited and the Green Way Managed Account Series Ltd (Portfolio E) and Pardus Capital (i.e. the Pardus Special Opportunities Master Fund L.P.), which includes the nomination of the Supervisory Board, and procedures for the delegation granted to Management Board to increase the Company’s share capital without preferred subscription rights continued until January 30, 2009, date when the agreement was cancelled.
neuilly-sur-Seine and Paris, 31 March 2010
The Statutory Auditors
Deloitte & Associés Grant ThorntonFrench member of Grant Thornton International
Tristan Guerlain Christophe Patrier Jean-Pierre Colle Vincent Frambourt
Atos Origin » Annual Report 2009 » 180
23 . Risk analysis
23.1 Business risks
23.1 Business risks 18023.2 Market risks 18323.3 Assurance 184
23.4 Claims and litigation 18423.5 Countries 185
23.1.1 The marketThe economic downturn starting in September 2008 affected the financial sector first, with consequences on both stock market performance and IT services activity. From Q4 2008, the downturn started to impact manufacturing and ultimately all industry-sectors. In this respect, the telecom/media sector, while among the best performers in the past years, is now under pressure, due to various drastic cost reduction programs implemented from 2008 by all the main actors worldwide. At this stage, the downturn is limited as regards the Energy and Utilities sector. Similarly, the public sector is still performing well with a sustained level of investment from clients which translated into a solid backlog for Atos Origin.
In this context, Atos Origin’s customers are facing significant pressure on their costs structure and profitability. As a result they seek to optimize their IT costs by ramping down Time & Material resources, renegotiating existing contracts to get lower prices and postponing projects, especially large ERP related projects. These potential adverse effects are mitigated by the broad-based spread of Atos Origin’s contracts and services. In that regard, circa two thirds of the Group’s revenues are generated under multi-year recurring revenue contracts.
23.1.2 Clients The Group’s top 30 customers generate more than 45% of total Group revenues (a one-point increase compared to the previous year). The five largest clients in 2009 represented 15% of the Group’s total revenues. No single client generated more than 5% of total revenues. This represents only a modest exposure since all of these clients are large national or multinational groups, with a limited risk of insolvency.
However, in a context of an economic downturn, solvency might become an issue for some of our customers. To mitigate that risk, we are continuously reviewing our exposure with assistance from a specialized service provider, and have built a watch list of customers that are closely monitored at Group level. In addition, specific monitoring and precise follow-up processes have been implemented in respect of transactions with customers in all sectors that are more severely affected by the current crisis (e.g., Financial Service, Manufacturing).
Customer relationship management is critical to ensure proper delivery of services, renewal of contracts and mitigation of the risks of early termination. In this respect, the Group has implemented detailed contract management processes and created a global team to directly manage our largest global accounts. Global account managers liaise with global key clients so as to make sure the standards of the services delivered are sustained.
As a result of the Sarbanes-Oxley and similar legislation, customers increasingly request that services rendered to them be certified. As a result, the Group has developed and implemented a number of audit and certification processes and has adjusted its standard contract terms to properly address these requirements.
The customer selection process and risk analysis is fully integrated within the global risk assessment process throughout the life cycle of a project. Credit risks are assessed on an individual basis and, where appropriate, provision is made to take into account likely recovery problems.
Regarding the impact of any change in the control of the company, and in particular the takeover of Atos Origin by a competitor of the client, it should be noted that the policy of the Group is to minimise such clauses. Siituation are strictly reviewed on a case by case basis where the client rejects the integration of Atos Origin’s standard clauses on the matter. There are however a few customer contracts which could be challenged in case of change in control, in particular in case of takeover by a competitor of the client.
23.1.3 Legal risksThe IT services provided to customers are a critical element for them to be able to perform their commercial activities. Oftentimes IT solutions also play a key role in the development of their businesses. Any inadequate implementation of sensitive IT systems or any deficiency in the performance of services, either related to delays or to unsatisfactory level of services, may result in significant prejudicial consequences to the clients of the service provider and may result in penalty claims or liability of the Group.

Atos Origin » Annual Report 2009 » 181www.atosorigin.com
In particular, Systems Integration frequently involves products (software, hardware, standard or adapted or specifically developed for customized requirements) designed and developed by third parties which, by definition, the service provider cannot control. In addition, particular requirements from certain clients who wish for specific functionalities may disrupt the operation of the product or generate significant delays or difficulties in providing the services.
It is a practice of the IT sector to enter into certain contracts on a fixed price basis, whereas other contracts are invoiced according to the service provided. On 31 December 2009, the split of revenue for Systems Integration was the following: one third in applications management, one third in fixed price projects and one third in management. For fixed price contracts, an under assessed scope of the provided services or dedicated resources to a specific project may trigger an exceeding of the budget or agreed timeframe, and lead to an operating loss, by exceeding budget or payment of penalties for late performance.
The Group seeks to minimise the risks described above through a rigorous review process right from the offer stage. A dedicated specific process is in place called Atos Rainbow, under which contract offers are reviewed, with a risk register kept for tracking purposes. This allows the Group to take any mitigating action where appropriate and follow up on outstanding actions.
In 2009, the Atos™ Rainbow process has been extended to the performance phase of the contract, including updates to the risk register. Periodical risk reviews are performed on major contracts with a view to enhancing control over any excess for projects and to following up all types of possible delivery and performance issues.
23.1.4 SuppliersAtos Origin relies on a limited number of key suppliers, in particular for the supply of software used in the design, implementation and running of IT systems. While there are alternative sources for most software and the Group has long-term licences and agreements with a range of qualified suppliers, the possible failure of those suppliers to continue producing innovative software, or the inability to renew agreements on acceptable terms, may have an adverse impact on Atos Origin’s operations.
Major risks with key IT suppliers are managed centrally by the Group Purchasing department. This department is responsible for relationships with suppliers, including their identification and selection, contract negotiation and the management and resolution of claims and litigations.
Regarding the ranking of the main suppliers for Atos Origin, the most important one weights for 4.8% of Group purchase in 2009, the five biggest represent 16.3% of the total and the first ten amounted to 22.3%.
At the end of 2009, there was no commitment taken by the Group on future Capital Expenditure with an amount above EUR 5 million, except the works to be realised in the future headquarters of Bezons, near Paris, for an amount close to EUR 20 million.
23.1.5 Partnerships and subcontractorsFrom time to time Atos Origin relies on partnerships and subcontractors to deliver services in particular contexts. Having recourse to third parties is a common practice in the industry but represents a business risk that must be managed carefully. Partnerships may be formed or subcontractors may be used in areas where the Group does not have specific expertise necessary to fulfil the terms of a particular contract or requires such skills for a limited period of time only, or to comply with local legislation. All requests to enter into partnerships or use subcontractors are initiated locally by the operational team evaluating the proposal or in specific case at Group level.
Recourse to subcontractors is managed by GBU based Buyers from Global Purchasing departments and subject to the same purchasing processes and policies as all other categories. At the end of 2009, the Group had approximately used 2,000 full-time equivalents subcontractors either for their specific skills or for volume requirements. This flexible resource will also allow Atos Origin to manage capacity in the 2010 tough economic conditions.
23.1.6 Technology and IT risksIT system breakdowns could be critical both for the internal operations of the Group and for its customers’ needs in respect of the services provided. The Group has implemented specific programmes and procedures to ensure the proper management of IT risks, covering security and back-up systems and effective insurance coverage.
23 . Risk analysis23.1 Business risks
Atos Origin » Annual Report 2009 » 182
IT production sites, offshore development, maintenance centers and data-centers are specifically subject to high technical procedures for safeguarding and monitoring, covering physical and IT system access, energy supply breakdown or disruption, fire, regulation of extreme temperature change, data storage and back-up, contingency and disaster recovery plans.
23.1.7 Employees
Dependence on qualified personnel
In today’s IT services market, providers remain dependant on the skills, the experience and the performance of its staff and the key members of its management teams. The success of organizations in this field of play depends on the ability to retain key qualified staff and to use their competences for the benefit of the customers. Atos Origin is focused on providing challenging career opportunities and job content. Over the reporting period, Atos Origin has been able to further develop the workforce management and to offer better career perspective supported by competency development through the Atos University programs.
Employee attrition
To enhance our ability to attract and retain staff, the Human Resources department has developed competitive rewarding structures. In addition it has strengthened the internal offerings for training and development programs through the Atos University. During 2009, specific attention was given to critical competencies, such as Sales, Project Management, SAP, Lean and Talent Development; resulting in lower attrition in the targeted groups of people. Meanwhile, wider distance learning opportunities have been made available for thousands of employees on English language, as well as IT and business topics.
These programs allowed faster adaptation of people to clients’ needs and greater mobility, which also balanced attrition.
Offshoring
Atos Origin increasingly fulfils its client contracts using closeshore, nearshore and offshore facilities in order to optimize its cost structure. Offshoring is used by the main countries of the Group in Systems Integration and Managed Operations. To keep up with increasing demand, the Group developed its nearshore/offshore capacity with more than 5,034 staff at the end of December 2009. The combination of insourcing and offshoring for the delivery of projects led
the Group to adapt and to optimize the insourced resources to other contracts. Given our ongoing need to attract and to deploy human resources, the Group made sure it was able to optimize resource utilization rate. The Group processes in this area are mature and the offshore facilities of the Company are certified. Atos Origin is therefore well positioned and ready in any case of business risk associated to offshoring.
23.1.8 Business risk assessment and managementAtos Origin has a robust business risk management approach reinforced during the last two years, based on two critical processes.
Risk Management System
The Group operates a risk management system that facilitates the analysis and treatment of business risks throughout the life cycle of a project. This process is integrated with the control and approval process when entering into new contracts. The objective is to ensure that the Group only bids for projects that are capable of being delivered effectively and to provide an early warning system for any project that encounters problems or diverges from its original targets. Specifically, the risk management process:
identifies potential exposures, including both technical ■■
and financial risks that could have an impact during the life cycle of the project;evaluates, both qualitatively and quantitatively, the ■■
significance and materiality of any such exposures;ensures that appropriate and cost-effective risk control ■■
or risk mitigation measures are taken to reduce the likelihood and impact of negative outcomes on the project; and,manages residual exposure through a combination of ■■
external risk transfer instruments and internal contingency reserves in order to optimise the use of exposed capital.
Risk Management and Rainbow management – the control and approval process governing the bidding and contracting activities – report into one Group Vice President, ensuring the capturing and ongoing tracking of risks identified at the bidding stage throughout the delivery cycleRisk Management reports directly to the Group Chief financial Officer, with the risk managers in the countries and the Global Service Lines reporting directly into the Group Vice President Risk and Rainbow Management, shortening lines of command.Since 2007, new metrics have been implemented. Country management is measured on actual write-offs and losses vs. targets set upfront.
23 . Risk analysis23.1 Business risks

Atos Origin » Annual Report 2009 » 183www.atosorigin.com
23 . Risk analysis23.1 Business risks23.2 Market risks
Group risk management Committee
A Group Risk Management Committee, established in 2004, convenes on a monthly basis to review the most significant contracts and the difficult ones (concerned by deviation in gross margin, specific commitments on transition or technical deliveries, contracts with liquidity risks). The Committee is chaired the Group CFO and lead by the Risk Management Vice President. Permanent members of the Committee include the Executive Vice
Presidents in charge of the Global Service Lines and several representatives from Global Functions, including Finance, Legal, and Internal Audit departments. In addition, local risk managers are invited to attend any contract reviews related to their respective geographic areas. Once a year, the Audit Committee conducts every quarter a thorough review of all the major contracts considered at risk in the context of the preparation of the closing. There is then a follow-up either by the service line or the Risk Management Committee.
23.2 Market risks
Atos Origin has not been affected by the liquidity crisis that has impacted the financial markets over the year 2008.
Atos Origin’s policy is to cover fully its expected liquidity requirements by long-term committed loans or other appropriate long-term financial instruments. Terms and conditions of these loans include maturity and covenants leaving sufficient flexibility for the Group to finance its operations and expected developments.
Atos Origin signed with a number of major financial institutions on 12 May 2005 a cost efficient EUR 1.2 billion multi-currency revolving facility with six and seven years maturity. The available amount until 12 May 2011 is EUR 1.2 billion and EUR 1.1 billion until 12 May 2012.
Atos Origin has renewed its trade receivables securitization program on 6 March 2009 for a period of 5 years with a maximum amount of EUR 500 million marketable debt and a maximum of EUR 200 million funding amount. Securitization program financial covenants are in line with those of the EUR 1.2 billion multi-currency credit facility.
On 29 October 2009 Atos Origin issued a convertible bonds exchangeable into new and/or existing shares (OCEANE) due on 1 January 2016 with an aggregate principal amount of EUR 250 million. The annual coupon paid to the holders of bonds amounted to 2.5%.
More details on liquidity risk, cash flow interest rate risk, currency risk, market value of financial instruments, price risk and credit risk are described within the Financial Report section in this document.
The risk on shares is limited to self-held shares.
Atos Origin » Annual Report 2009 » 184
23.3 Insurance
Global insurance policies are placed with reliable international insurance companies, providing the Group with appropriate insurance coverage for its worldwide operations. The total cost of these policies in 2009 represented circa 0.20% of total Group revenue.
The most important global insurance programmes are bought and managed centrally at renewal on 1st January each year. In 2009 the Property Damage and Business Interruption policy and Professional Indemnity policy were both renewed for limits of EUR 150 million each. Several additional policies cover insurable business risks such as general liabilities, automobiles, employees, directors and officers and are maintained at cover limits commensurate with the Group’s size and risk exposures. Deductible retentions are used both to promote good risk management practices and to control the quantity of claims and level of premiums.
Each country also contracts insurance policies in accordance with local regulations, customs and practice. These include employers’ liability, workers compensation and employee travel. A variety of other employee-related insurance policies are maintained, with a view to both protecting and incentiving employees as part of employee benefits programmes.
Atos Origin’s wholly-owned reinsurance company provides insurance for some layers of the property policy and for the professional indemnity policy, which are the most critical policies for the Group operations. For damages covered by the property policy, the first EUR 0.5 million are covered (per claim) and total annual losses of EUR 2 million. The maximal net retention after reinsurance
is therefore EUR 2 million, on top of the applicable deductibles which vary between EUR 25 000 and EUR 75 000 per site, and as long as the EUR 150 million limit is not reached. For claims under the professional indemnity policy the Atos Origin reinsurance company would cover the first EUR 10 million as well as a quota share of the upper layers in case of a catastrophe claim. Maximum net retention after reinsurance is therefore EUR 23 million in aggregate on top of the applicable deductible of EUR 2 million per claim, and as long as the EUR 150 million limit is not reached.
Insurable losses are not a frequent occurrence, with an overall loss ratio (claims verses premiums) of about 30% over the last five years (with the bulk of that attributable to one sole loss in 2004). This is partly due to quality risk management processes deployed at all key locations to protect assets from fire and other unexpected events as well as ensuring business continuity in the event of damage or loss. In offers and contracts a uniform and mandatory process of risk management is used whenever the contract value is in excess of EUR 1 million. This process encompasses authorisation rules, a risk register and a monthly reporting to the Group risk management Committee, which is under the responsibility of the Group CFO.
Risks are also monitored by the Underwriting Committee of the Atos Origin reinsurance company who maintains adequate net equity and technical reserves commensurate with the level of insured risks, and ensures a satisfying diversification of external reinsurer. The Underwriting Committee also carries out regular surveys and analysis to monitor the relevance of Atos Origin insurance cover.
23 . Risk analysis23.3 Insurance23.4 Claims and litigation
23.4 Claims and litigation
The Atos Origin Group is a global business operating in some 40 countries. In most of the countries where the Group operates there are no claims, and in many others there are only a very small number of claims. Having regards to the Group’s size and turnover, the level of claims is low.
The low level of claims and litigation is attributable in part to self-insurance incentives and the vigorous promotion of service quality and a fully dedicated Risk Management department, which ef fectively monitors contract management from offering through delivery and provides early warning on potential issues and claims. All potential and active claims are carefully monitored and managed. In 2009, the most significant claims made against the Group were successfully resolved in favourable terms.

Atos Origin » Annual Report 2009 » 185www.atosorigin.com
23 . Risk analysis23.4 Claims and litigation23.5 Countries
1) Tax claims
The Group is involved in a number of routine tax claims, audits and litigations.
A significant number of the tax claims are in Brazil, where Atos Origin is a defendant in some cases and a plaintiff in others. Such claims are typical for companies operating in this region. Proceedings in this jurisdiction usually take a long time to be resolved in court. In other jurisdictions, such matters are normally resolved by simple non contentious administrative procedures. The largest claim in Brazil is for taxes and penalties arising out of the alleged treatment of employees as contractors, and the Brazilian tax authorities have agreed to resolve this dispute for less than 25% of the amount originally claimed.
Following the decision in a recently reported test case in the UK there is substantial court claim against the UK tax authorities for a tax (Stamp Duty) re-imbursement of over EUR 9 million.
The total provision for tax claims as at 31 December 2009 was EUR 37.2 million.
2) Commercial claims
There are a very small number of commercial claims across the Group.
Some claims were made in 2006 by a company for services allegedly supplied to the Group in the past. A thorough investigation into the matter showed that the claims were not legitimate. Accordingly, no payment was made, and all claims are disputed before various courts.
In 2009, in the UK, a dispute arose over a contract resulting in a claim against Atos Origin which is being defended. This matter is expected to be resolved in 2010.
The total provision for commercial claims as at 31 December 2009 was EUR 13.9 million.
3) Labour claims
There are over 49,000 employees in the Group and relatively few labour claims. In most jurisdictions there are no or very few claims. South America is the only area where there is a significant number of claims but such claims are usually of low value and typical for companies operating in this region.In France, Brazil and the UK there are small number of higher value labour claims but these mostly have little or no merit and are provisioned accordingly.
There are 14 claims against the Group where the claims exceed EUR 300,000. The provision for these claims as at 31 December 2009 was EUR 1.5 million.
4) Representation & Warranty claims
There are no Representation & Warranty claims known or pending arising out of any acquisitions or dispositions.
All claims are monitored carefully and duly reported. Top Management considers that adequate provision against all such claims has been made. All litigations inherited from the Sema Group were resolved successfully.
As of 31 December 2009, provisions recorded by the Group to cover litigation and claims identified in litigation dockets amounted to EUR 44.9 million including tax.
To the knowledge of the Company, there are no other governmental, judicial, or arbitral proceedings, including any proceedings known to the Company, which are pending or to which the Company is liable, likely to have or having had significant consequences over the past twelve months on the Company’s and the Group’s financial situation or profitability.
23.5 Countries
Atos Origin operates in approximately forty countries. Some countries are more exposed than others to political or economic risks that may affect the Group’s business and profitability. A substantial proportion of Atos Origin’s business is in Western Europe, with limited exposure to dramatic economic recession in the USA or Asia.
The Group makes a periodic Strategic Operational Review of its activities in order to fully revisit all options in respect of portions of the business with a lower operational margin as well as activities considered as being non core business. A project leader is assigned to this task, supported by the legal, tax, and finance departments.

Atos Origin » Annual Report 2009 » 186
24 . Corporate Governance
24.1 Report by the Chairman of the Board of directors on Corporate Governance and Internal Control
Dear Shareholders,
Pursuant to article L. 225-37 of the French Commercial Code, as Chairman of the Board of Directors of Atos Origin (hereinafter the “Company”), let me present first of all the preparation and organisation conditions of the work of the Board of Directors since its setup on 10 February 2009, and secondly, the Internal Control procedures set up within the Group.
The Board of Directors approved this Report during its meeting of 18 March 2010.
24.1.1 Corporate GovernanceOn 10 February 2009, the General Shareholders Meeting of the Company decided to modify the Company’s corporate governance. The Company kept its legal form (“société anonyme”) but replaced its existing Supervisory Board with a Board of Directors.
This new governance structure, which is more tailored to the Group’s situation, allows for the necessary reactivity to implement the transformation and necessary actions to ensure growth and profitability in a difficult economic environment.
The Board decided not to separate the offices of Chairman of the Board and Chief Executive Officer in order to comply with its announced commitments to the shareholders when transforming the Company’s governance. The powers of the Chairman of the Board and Chief Executive Officer are described in the “Provisions of the articles of association” section of the Annual Report.
Pursuant to the “reflexion paths” mentioned by the AMF in its “2009 Report on corporate governance and Internal Control” of 8 December 2009, the Board of Directors, upon suggestion by the Nomination and Remuneration Committee, appointed Jean-Philippe Thierry as referent director (meeting of 17 December 2009).
French legislation and rules published by market regulatory authorities apply to the Company’s governance. The Company deems that the implementation of its corporate governance principles is adequate and in conformity with related applicable French best practices.
The Company refers to the recommendations set out in the Corporate Governance Code of listed companies issued by the Afep and the Medef in December 2008 and has decided to use the code as a reference in terms of corporate governance. This Code is available on the website: www.code-afep-medef.com
During its meeting of 19 November 2009, one year after having subscribed to the new recommendations issued by the Afep and the Medef on 6 October 2008, the Board of Directors ensured that the Company correctly implemented the provisions of the code and confirmed the subscription by the Company to these recommendations.
In particular, during the 2009 financial year, upon suggestion by the Chairman of the Board of Directors, the agenda regularly contained points on the corporate governance of the Company. The Board therefore regularly discussed such issues pursuant to the Chairman’s wishes and to the Company’s commitment to implement good corporate governance principles under the responsibility of the Board of Directors. The Board has consistently expressed its will to take into account, and sometimes anticipate, recommendations from various bodies working on the improvement of corporate governance for listed companies whenever such recommendations are in line with the interests of the Company and of its shareholders.
Therefore, many such systems have already been put in place by the Board of Directors upon the Chairman’s request. Such systems include putting an end to “golden parachutes” in the Company, the deferral to 31 December 2009 of the benefit of the top-up pension of the Company for the Chairman of the Board and Chief Executive Officer as well as the capping of his variable remuneration, even where the Company has exceeded its performance in 2009 and 2010.
24.1 Report by the Chairman of the Board of Directors on Corporate Governance and Internal Control 186
24.2 Internal Control 19224.3 Statutory Auditors’ Report, prepared
in accordance with article L. 225-235 of the French Commercial Code on the report
prepared by the Chairman of the Board of Directors of Atos Origin with respect to the Internal Control procedures for the preparation and treatment of financial and accounting information 199
24.4 Codes and Charts 20024.5 Executive compensation and stock ownership 203

Atos Origin » Annual Report 2009 » 187www.atosorigin.com
In the same spirit, the Board also noted that since the publication of the Afep-Medef recommendations, an international consensus has built around the will to better integrate the durability of companies’ operational success within differed remuneration systems, as proven this year in particular and for example at the G20 Summit in Pittsburgh.
In order to take into account the Company’s will to adapt such mechanisms to an ever-evolving regulatory environment which is only just starting to stabilize and generate consistent interpretations, the Chairman and the Senior Executive Vice Presidents suggested to the Board to toughen in time the terms and conditions of the stock option plan to which they are beneficiaries. The Board welcomed this suggestion and consequently adjusted the plan, aiming at reinforcing the exercise conditions of the plan to which the Top Management is a beneficiary in order to comply with the most demanding requirements of corporate governance. In addition, the Company has obtained an opinion from Towers Perrin (specialized firm in director compensation) which concluded that the stock option plan is in conformity with the recommendations of the Afep-Medef Code of December 2008.
The rules and principles according to which the Company has determined the remuneration and interests of directors and legal representatives are described in the 24.5 section of the Annual Report “Executive compensation and stock ownership”.
The rules pertaining to the participation by shareholders to the General Shareholders Meetings are described in the 26 section of the Annual Report - “Legal Information”.
Factors which may influence take-over bids are described in the 26 section of the Annual Report - “Legal Information”.
24.1.2 Composition and functioning of the Board of directorsOn 31 December 2009, the Board of Directors is composed of eleven members: Thierry Breton (Chairman of the Board and Chief Executive Officer), René Abate, Behdad Alizadeh, Nicolas Bazire, Jean-Paul Béchat, Ms. Jean Fleming (director representing employee shareholders, appointed during the Ordinary and Extraordinary General Shareholders Meeting of 26 May 2009), Bertrand Meunier, Dominique Mégret, Michel Paris, Pasquale Pistorio, Vernon Sankey and Jean-Philippe Thierry.
NB: The following table mentions Dominique Mégret who resigned as from 17 December 2009:
name nationality AgeDate of
appointmentCommittee
memberTerm
of offices (*)
number of shares held
René Abate French 61 2009 2011 1 000
Behdad Alizadeh American 48 2009 N&R 2011 1 000
Nicolas Bazire French 52 2009 N&R 2011 1 000
Jean-Paul Béchat French 67 2009 A 2011 1 000
Thierry Breton French 54 2009 2011 5 000
Ms. Jean Fleming (**) British 40 2009 2011 438
Dominique Mégret French 62 2009 2011 1 000
Bertrand Meunier French 53 2009 N&R 2011 1 000
Michel Paris French 52 2009 A 2011 1 000
Pasquale Pistorio Italian 73 2009 A 2011 1 000
Vernon Sankey British 60 2009 A 2011 1 000
Jean-Philippe Thierry French 61 2009 N&R 2011 1 500
A: Audit Committee.N&R: Nomination and Remuneration Committee.(*) Annual General Meeting deciding on the accounts of the year.(**) Director representing employee shareholders.
24 . Corporate Governance24.1 Report by the Chairman of the Board of Directors on Corporate Governance and Internal Control

Atos Origin » Annual Report 2009 » 188
Pursuant to the articles of association, each director must own at least 1,000 shares. This rule however does not apply to the director representing employee shareholders (1).
The Internal Rules govern the work of the Board of Directors. They specify the rules on composition, functioning and the role of the Board, remuneration of directors, evaluation of the work of the Board, information of directors, the role and competence of the Committees of the Board – the Audit Committee and the Nomination and Remuneration Committee, the specific missions which can be granted to a director and the confidentiality obligations imposed on directors.
As soon as appointed, a copy of the Internal Rules as well as the Charter of the Board of Directors and the Guide to the Prevention of Insisder Dealing are given to the directors who subscribe to these documents. The content of these documents is described more specifically in the 24.4 section of the present Annual Report, named “Codes and Charts”.
The mission of the Board of Directors is to determine the strategy and the trends of the Company’s activity and to oversee their implementation. Moreover, the Board of Directors decides on the separation of the offices of Chairman of the Board and Chief Executive Officer, appoints managing legal representatives and rules on the independence of directors on a yearly basis, eventually imposes limitations on the powers of the Chief Executive Officer, approves the Chief Executive Officer Report, convenes the General Meetings and decides on the agenda, undertakes controls and verifications which it deems opportune, the control and audit of the sincerity of the accounts, the review and approval of the accounts, the communication to the shareholders and to the market of high quality information.
24.1.3 definition of an “independent member” of the Board of directorsThe Corporate Governance Code of the Afep and the Medef of December finds a director as independent where “he or she has no relationship of any kind whatsoever with the corporation, its group or the management of either that is such as to colour his or her judgment”. The Afep-Medef Code also determines that a certain number of criteria must be reviewed in order to determine the independence of a director:
“Not to be an employee or executive director of the ■■
corporation, or an employee or director of its parent or a company that it consolidates, and not having been in such a position for the previous five years;
Not to be an executive director of a company in which ■■
the corporation holds a directorship, directly or indirectly, or in which an employee appointed as such or an executive director of the corporation (currently in office or having held such office going back five years) is a director;Not to be a customer, supplier, investment banker or ■■
commercial banker that is material for the corporation or its group or for a significant part of whose business the corporation or its group accounts;Not to be related by close family ties to an executive ■■
director;Not to have been an auditor of the corporation within the ■■
previous five years;Not to have been a director of the corporation for more ■■
than twelve years.”
As regards directors representing significant shareholders of the corporation or its parent, these may be considered as being independent, provided that they do not take part in control of the corporation. In excess of a 10% holding of stock or votes, the Board, upon a report from the Nomination and Remuneration Committee, should systematically review the qualification of a director as an independent director, having regard to the make-up of the corporation’s capital and the existence of a potential conflict of interest.
The Board of Directors, with the support of the Nomination and Remuneration Committee, has led a specific review on the independent status of each of its members, relying on the above-mentioned criteria. On this basis, five out of the twelve members of the Board are not considered as independent, namely Behdad Alizadeh, Dominique Mégret, Bertrand Meunier and Michel Paris because of their function as managers (employees) of significant shareholders of the Company (more than 22% for PAI Partners, represented by Dominique Mégret, Bertrand Meunier and Michel Paris, and more than 10% for Pardus, represented by Behdad Alizadeh), as well as Ms. Jean Fleming as representative of employee shareholders and employee of a subsidiary of the Company.
The Board of Directors focused more precisely on the status of Nicolas Bazire, given his mandate as member of the Supervisory Board of Rothschild & Cie Bank, and the punctual business relations the Company may have entered into with this corporate bank. The Board of Directors has deemed that, in this case, Nicolas Bazire should be qualified as an independent member.
(1) According to section 16 of the articles of association.
24 . Corporate Governance24.1 Report by the Chairman of the Board of Directors on Corporate Governance and Internal Control

Atos Origin » Annual Report 2009 » 189www.atosorigin.com
24.1.4 Meetings of the Board of directorsPursuant to the articles of association and the Internal Rules, the Board of Directors has met as often as necessary. During the 2009 financial year, the Board of Directors has met sixteen times. Attendance of directors at these meetings was an average of 89.25%.
The Board of Directors met to discuss the following topics:
Review and approval of the budget;■■
Review of quarterly results and forecast;■■
Review of financial presentations and press releases;■■
Review of and approval of consolidated half year and ■■
yearly accounts;Review of strategic trends of the Group;■■
Review and approval of new governance documents ■■
(Internal Rules, Charter of the Board of Directors, Guide to the Prevention of Insider Trading);Review of the adaptation of the Group’s organisation and ■■
transformation plan;Review and approval of stock option plans set up to ■■
develop the loyalty of the Group’s management and key employees;Review of off-balance commitments and risks;■■
Review of certain strategic contracts;■■
Optimisation of the Group’s financing sources and the ■■
issuance of bonds convertible into and/or exchangeable for new or existing shares (OCEANE).
Certain members of the Board also focused on particular corporate governance issues within two permanent committees:
The Audit Committee; and■■
The Nomination and Remuneration Committee.■■
The members of these Committees are appointed by the Board of Directors from among its members. The competences of these Committees are governed by the Internal Rules of the Board of Directors. The Committees are solely advisory in preparing the works of the Board which is the only decisive and liable entity. They report to the Board of Directors. Their recommendations are discussed at length during the meetings, where applicable, on the basis of the documentation generated by the Committees.
24.1.5 The Audit CommitteeThe mission of the Audit Committee is to prepare and facilitate the work of the Board of Directors. It provides assistance to the Board of Directors in its analysis of the exactness and sincerity of the Company’s accounts and consolidated financial accounts. The Audit Committee also looks to the quality of Internal Controls and the information given to shareholders and to the market. In order to fulfil its mission, the Audit Committee is periodically informed of major risks, including litigation and off-balance commitments.
During the 2009 financial year, the Audit Committee was composed of 4 members (3 out of the 4 members, including the Chairman of the Committee being independent members): Jean-Paul Béchat (Chairman), Vernon Sankey, Michel Paris and Pasquale Pistorio. Pursuant to the 8 December 2008 Decree, the Audit Committee has at least one member, including its Chairman, with financial or accounting qualifications, acquired through professional experience.
In 2009, the Audit Committee met seven times. Attendance of members to the meetings exceeded 80%.
The statutory auditors, the Senior Executive Vice-president in charge of Global Functions, the Group Chief Financial Officer, the Head of Accounting, the Head of Internal Audit, the Head of Risk Management and the Group General Counsel attended certain of these meetings depending on the issues discussed.The Audit Committee reviewed the quarterly Group financial reporting package addressed to the Board. It was regularly informed of the Group’s financial strategy and its implementation. It was informed on the terms and conditions of significant contracts (including the risk management aspect of such contracts). It also regularly reviewed the status of the major existing contracts (on the basis of approvals delivered under the risk management programs as previously described). The Audit Committee examined the accounting and financial documents to be submitted to the Board. It also received reports from the statutory auditors on the conclusions of their work. A specific session was held, as it is each year, in addition to ordinary meetings, in order to review specific contractual commitments, major contracts, risks and losses declared.
24 . Corporate Governance24.1 Report by the Chairman of the Board of Directors on Corporate Governance and Internal Control
Atos Origin » Annual Report 2009 » 190
During its seven meetings held in 2009, the Audit Committee reviewed both recurring and specific matters, as listed hereafter:
Recurring matters:■■
Quarterly financial information to the Board of Directors -Statutory external auditors reports on audit and Internal -Control planInternal Control audit plans and recommendations -Risk management reports for existing and new contracts -Material claims and litigation (including tax audits). -
Specific matters:■■
Follow up of the renegotiation of the Dutch pension -fundsFollow up of credit management -Follow up of the risks relating to the bankruptcy -proceedings against Arcandor (customer of the German subsidiary of the Group)Full review of tax structure and exposure of the Group. -
24.1.6 The Nomination and Remuneration CommitteeThe mission of the Nomination and Remuneration Committee is to prepare and facilitate the decisions of the Board of Directors in the areas which fall within its scope.
With regard to nominations, the general scope of the Nomination and Remuneration Committee is to assist, review and, where applicable, submit to the Company all applications to the General Shareholders Meeting for the appointment as member of the Board of Directors or, if called upon for such purpose, to review an application for manager, and to advise or issue recommendations to the Board of Directors on such applications.
The Nomination and Remuneration Committee reviews significant operations which could create a potential conflict of interest between the Company and the members of the Board. The qualification of “independent” director is prepared every year within the Nomination and Remuneration Committee and reviewed and discussed by the Board of Directors prior to the publication of the Annual Report on a yearly basis.
With regard to remuneration, the mission of the Nomination and Remuneration Committee is to make suggestions on the overall, total and fixed remuneration as well as the applicable criteria for variable remuneration of the Chairman of the Board and Chief Executive Officer.
The Nomination and Remuneration Committee also partakes in the analysis of the principles of the Company’s and its subsidiaries’ profit-sharing plan for employees. Its mission is also to make suggestions on decisions to grant stock-subscription option rights of the Company’s shares for the
legal representatives and all or part of the employees of the Company and its subsidiaries.
With regard to the members of the Board of Directors, the Committee suggests each year the amount of the envelope for directors fees which will be submitted to the approval of the General Shareholders Meeting, as well as the conditions of distribution of the fees among directors. The Committee takes into account the attendance of the directors to the various meetings of the Board and the Committees of which they are members but also the level of responsibility endorsed by the directors, as well as the time they dedicate to their function.
The Committee also makes recommendations on the pensions, benefits and financial rights of the legal representatives of the Company and its subsidiaries.
During the 2009 financial year, the Nomination and Remuneration Committee was composed of 4 members (2 out of the 4 members being independent members): Behdad Alizadeh (Chairman), Jean-Philippe Thierry, Nicolas Bazire and Bertrand Meunier.
In 2009, the Nomination and Remuneration Committee met five times. Attendance of members to the meetings was an average of 90%.
The Head of Human Resources and the Group General Counsel also attended the meetings.
During its five meetings held in 2009, the Nomination and Remuneration Committee particularly focused on the review, in order to assist the Board in its decisions, of the following topics:
Conditions of distribution of the directors fees;■■
Determination of the variable remuneration of the ■■
Chairman of the Board and Chief Executive Officer for 2009 and the definition of performance objectives;Determination of the variable remuneration for the members ■■
of the Management Board for 2008 and 2009;Determination of the performance conditions for the stock ■■
option plans;Grant of stock options to managers and employees of ■■
the Group;Review of the derogatory participation plan set up in France ■■
pursuant to the Afep-Medef recommendations;Results of the LTI 2007 and LTI 2008;■■
Supplementary pension plan of the members of the ■■
Executive Committee and the Chairman of the Board and Chief Executive Officer;Conditions to the appointment of a director representing ■■
shareholder employees;Determination of independent members of the Board.■■
24 . Corporate Governance24.1 Report by the Chairman of the Board of Directors on Corporate Governance and Internal Control

Atos Origin » Annual Report 2009 » 191www.atosorigin.com
24.1.7 Assessment of the work of the Board of directorsThe Board of Directors has to assess its capacity to meet the expectations of the shareholders by periodically analysing its composition, organization and functioning, as well as the composition, organization and functioning of its Committees. In particular, it shall analyse the methods by which the Board of Directors and its Committees function, consider the desired balance of their composition, periodically reflect upon whether their tasks are appropriate to their organization and functioning, ensure that the important questions have been suitably prepared and discussed, and measure the actual contribution of each director to the work of the Board of Directors and its Committees, according to his or her skills and involvement in the discussions.
For this purpose, the Internal Rules of the Board of Directors provide that, once a year, the Board of Directors shall devote one item on its agenda to the discussion of its functioning and inform the shareholders each year, in the annual report, of the conducting of these assessments and the subsequent follow-up.
In 2006, the Company carried out a formal assessment of the work of its Supervisory Board. This assessment had been entrusted to an external counsel. For the 2007 and 2008 financial years, on the basis of a questionnaire circulated to the directors, the Board carried out a self-assessment of its work. The outcome of these assessments was recorded in the reference document of the Company.
In order to ensure both the compliance of its governance practices with the Afep-Medef recommendations and the adequacy of its work to its mission and the expectations of the shareholder, the Board, during its meeting of 17 December 2009, decided to complete the assessment of the governance practices of the Company performed during its meeting of 19 November 2009 by a formalized assessment of its work under the supervision of its referent director, Jean-Philippe Thierry.
The formalized assessment lead in 2009 included the following points:
Institutional diagnosis: appreciation of the transcription ■■
of the corporate governance in the institutional documents of the Company (compliance with the recommendations and codes, functioning of the Board, specialized Committees of the Board, remuneration of directors, relations with the shareholders)Assessment of the work of the Board strictly speaking: ■■
evaluation of the stakes and actual means of functioning of the Board and its Committees by integrating the points of view of various governance stakeholders (procedures of the Board, work of the Board, relations with management/Executive Committee)
On the first point, the Board carried out an exhaustive review of the governance practices of the Company. It dedicated a specific meeting on these questions (meeting of the Board of 19 November 2009) in order to assess the compliance of the Company’s practices with the relevant recommendations, and more particularly:
the principle of a yearly review by the Board of the ■■
compliance of its governance principles, in particular relating to the remuneration of directors, with the Afep-Medef recommendations;validation of the Company’s subscription to the ■■
Afep-Medef recommendations;approval of the document relating to this subscription;■■
approval of the press release on the Board’s review of ■■
the compliance of its governance principles with the Afep-Medef recommendations one year after their implementation.
The outcome of this assessment has been published by way of a press release on 20 November 2009.
On the second point, the review was carried out on the basis of the following three points:
statistical analysis of the participation of the directors to ■■
the work of the Board and its two Committees;individual interviews between the referent director and ■■
the directors;a questionnaire circulated to the directors on issues ■■
relating to the functioning of the Board as well as on its focus on corporate governance issues.
The following points emerged from the interviews by the referent director of all the directors:
on the issues pertaining to corporate governance, all ■■
directors appreciate the focus given to the strictest respect of good corporate governance rules both by the practice of the management of the Company and by the work of the Board. The directors highlighted the frequency of the meetings of the Board, the attention given to corporate governance issues in general, as well as the will to inform and associate the Board on significant projects;on the functioning of the Board, the directors have ■■
highlighted the significant progress made in circulating useful documentation prior to discussions, as compared to preceding years, which is an issue that had been raised during previous assessments. On other matters, the directors appreciate the existing exchange of point of views between the management of the Company and the Board. More specifically, during the meeting of the Audit Committee reviewing the information allowing for the drafting of the annual accounts, the quality of the information and the transparency of the Company towards the directors and the auditors were highlighted.
24 . Corporate Governance24.1 Report by the Chairman of the Board of Directors on Corporate Governance and Internal Control

Atos Origin » Annual Report 2009 » 192
on issues discussed by the Board on topics of interest ■■
shared by the management of the Company, the directors have expressed the wish to be given comparative sectorial studies though they acknowledge that the weight of Atos Worldline in the Group impairs any global comparison. To this end, the directors wish that the efforts made in 2009, with a specific yearly meeting of the Board dedicated to a detailed review of strategic options of the Company (meeting of 17 December 2009), be made permanent during the year 2010.
The information collected during the assessment of the work of the Board, both after the individual interviews lead by the referent director and by the questionnaires filled by the directors, allows to draw the following conclusions:
the dynamic functioning of the Board allows it to fully ■■
undertake its role pursuant to applicable legislation;the Company and the Board share a significant interest ■■
on issues pertaining to corporate governance;
the flow of information from the Company to the Board ■■
has been sensibly improved over the past year, allowing for the improvement of the working conditions of the Board; the directors wish for an effort from the Company in ■■
transmitting a yearly sectorial documentation.
With regard to the conclusions drawn from the assessment of the work of the Board, the following actions are suggested, with a follow-up from the referent director:
ensure that at least one yearly meeting of the Board shall ■■
be exclusively on the strategical options of the Company, preferably during the second semester;during this meeting, present the Board with a full sectorial ■■
benchmark;during the meetings of the Board on the review of half-■■
year and annual accounts, compare the main sectorial performance indicators whenever available.
24.2 Internal Control
The Internal Control system whose definition is stated in section 24.2.1 below and designed within Atos Origin relied on the Internal Control reference framework prescribed by the AMF (Autorité des Marchés Financiers).
The “general principles” section of the AMF framework has been used to describe in a structured manner the components of the Internal Control system of Atos Origin — section 24.2.2. Specific attention has been given to the Internal Control system relating to accounting and financial information — section 24.2.3, in compliance with the application guide of the AMF.
Internal Control players are described in section 24.2.4.
The Chairman of the Board of Directors had entrusted the preparation of the section of the Report from the Chairman of the Board of Directors on Internal Control procedures to the Group Internal Audit Department. This preparation has been reviewed by the Group Finance Director and the Executive Director in charge of Global Functions. The information reported below has been extracted from this preparation.
24.2.1 Internal Control definition and objectivesInternal Control system designed throughout the parent company and its subsidiaries (together referred to as the “Group” or the “Company”) aim to ensure:
compliance with applicable laws and regulations;■■
application of instructions and directional guidelines ■■
settled by General Management;correct functioning of company’s internal processes ■■
particularly those implicating the safeguarding of its assets;reliability of financial information.■■
One of the objectives of Internal Control procedures is to prevent and control risks of error and fraud, in particular in the accounting and financial areas. As for any Internal Control system, this mechanism can only provide reasonable assurance and in no event gives an absolute guarantee against these risks.
24.2.2 Components of Internal Control systemThe Internal Control system within Atos Origin is a combination of closely related components that are detailed hereafter.
Organization/control environment
The organisation, competencies, systems and policies (methods, procedures and practices) represent the ground layer of the Internal Control system and the fundamentals of the Group in the matter. The main components are presented in this section.
24 . Corporate Governance24.1 Report by the Chairman of the Board of Directors on Corporate Governance and Internal Control24.2 Internal Control

Atos Origin » Annual Report 2009 » 193www.atosorigin.com
Matrix organisation: Atos Origin runs a matrix organisation structure that combines Operational Management (Countries) and Functional Management (Service lines, Sales and Markets and Support Functions). This constitutes a source of control with a dual view on all operations (Country/Service line).
Policies and procedures: The Group has designed and implemented over the last years several policies and procedures in order to establish common practices and standardised methods. These policies and procedures are reviewed when necessary to be in line with the objectives of the Group. Some of these key policies and procedures included:
The Code of Ethics:■■ As Atos Origin has pays a particular attention to compliance with ethical rules in connection with the conduct of its operations, a Code of Ethics established and adopted by the Management Board sets out the principles applicable to conflicts of interest, insider trading and business ethics (cf. 24.4.1 specific section — “Code of Ethics”).Delegation of Authority:■■ A formal policy sets out the authorisation of officers of subsidiaries to incur legal commitments on behalf of the Group with clients, suppliers and other third parties. The intention of these rules is to ensure efficient and effective management control from the country level to General Management level. The delegation of authority policy was rolled-out under the supervision of the Group Legal department.Segregation of Duties:■■ Updated rules for segregation of duties have been implemented in the organisation. A program is managed to follow-up the improvement of segregation of duties, including functional review of segregation of duties and review of procedures for profiles attribution. Tooling has been used to perform automatic assessments of those rules in the systems. Atos Rainbow■■
TM: Rainbow is a set of procedures and tools that provides a formal and standard approach to bid management, balancing sales opportunities and risk management for all types of opportunities, as well as continuous guidance and control for the decision-making process. Rainbow is the means by which Atos Origin’s management is involved in controlling and guiding the acquisition of the Group’s contracts. Above specific thresholds Rainbow reviews are performed at General Management level.Operational policies and procedures■■ have also been implemented in all departments. The main impacting policies and procedures in terms of Internal Control (regarding authorizations and ethics) include “Payment & Treasury Security Rules”, “Purchasing Code of Conduct”, “Pension Governance”, “Investment Committee”, “Legal Handbook” and “Credit Risk Policy”.
Human Resource Management: A Group Human Resource management policy has been designed through the Global Capability Model (GCM) which is a standard for categorising jobs by experience and expertise across the Group. It helps employees in to be aware of their responsibility through job description; it helps managers in recruitment and rewarding; and it helps the Operations in resourcing and budgeting. A Group Policy on bonus scheme completes this organisation by setting additional incentives.
Information Systems: Group Business Process and Internal IT department are in place to provide common internal IT infrastructures and applications for Atos Origin staff worldwide. It supports functions like Finance (accounting and reporting applications), Human Resources (resourcing tool, corporate directory) or Communication (Group websites and intranet). In 2009, a new Purchase requisition tool (Spring) has been deployed in the main countries in order to strengthen and streamline the internal authorization process regarding external purchases; it is interfaced with the Group ERP system.Security and access to these infrastructures and applications as well as their reliability and performance are managed by this department and benefit from the core expertise and resources from the Group.
Communication of relevant and reliable informationSeveral processes are in place to ensure that relevant and reliable information is communicated on a timely manner to relevant players within Atos Origin.
A shared ERP system is deployed and used in the main countries of the Group. With India, Singapore, Malaysia and Hong Kong adopting this system in 2009, all main countries are now using the same ERP, enabling easier exchange of operational information.
Formal information reporting lines have been defined, following the operational and the functional structures. This formal reporting, based on standard formats, concerns both financial and non financial information. Communication of relevant information is also organized in the Group through several specialised escalation processes that define criteria to raise issues to the appropriate level of management, up to General Management for the most important ones. This covers a wide range of topics like operational risks (through Risk Management Committees), treasury (with Payment and Treasury Security Committee), or financial restructuring (Equity Committee).
24 . Corporate Governance24.2 Internal Control

Atos Origin » Annual Report 2009 » 194
This bottom-up communication is accompanied by top-down instructions, issued regularly, and especially for budgeting and financial reporting sessions.
A dedicated intranet site is accessible to all employees which facilitates the sharing of knowledge and issues raised by the Atos Origin internal communities. This global knowledge management system promotes collaboration and allows efficient and effective information transfer.
System for risk managementRisk management refers to means deployed in Atos Origin to identify and analyse risks. Although risk management is part of a manager’s day to day decision making process, specific formal initiatives have been led concerning risk management:
The risk mapping has been updated in 2009, in order to identify and assess risks that may impact the objectives of the Group. The selected methodology involved the managers of the Group TOP 400 through interviews and questionnaires, to collect their perception of the main risks that may impact Atos Origin objectives, their potential impact and likelihood. This assessment has covered potential risks related to our environment (stakeholders, natural disasters), the transformation & business development (evolution, culture, market positioning), our operations (clients, people, IT, processes) and the information used for decision making (financial and operational).Results have to be shared with General Management, to ensure that appropriate measures are deployed to manage the main risks, and presented to the Audit Committee.
The Risk Analysis (as detailed in the 23rd section of the document – named “Risks”) presents the Group’s vision of the main business risks, as well as the way those risks are managed. This includes the contracting of several insurance policies to cover primary insurable risks including the protection of Group assets (production sites and datacenters) and people. Operational risks on projects have previously been managed by the Risk Management function (including a Group Risk Management Committee who met monthly to review the most significant and challenging contracts. Control activities have also been implemented (through the Book of Internal Control), on the basis of main risks identified, as described next section related to “control activities”.
Control activitiesAtos Origin’s key control activities are described in the Book of Internal Control (BIC). This document, sent out to all entities by the General Management, complements the different procedures by addressing the key control objectives of each process to achieve a convenient level of Internal Control. For each control objective, one or more control activities (including control activities’ description, evidences, owners and periodicity) have been identified in order to formalize Group’s expectations in terms of control.The Book of Internal Control covers not only the financial processes, but also delivery processes (like contract management), support processes ( including legal, purchasing, HR or IT) and some management processes (Mergers and Acquisitions):
HR and Pensions’ Management:■■ control activities have been designed regarding identification and management of evolutions of Labour laws in countries where the Group operates, treatment of payroll, control of employment contracts, recruitment and termination processes, etc...;Legal:■■ on top of the Delegation of Authority mentioned above, control activities have been designed on rules for customer contracts, trademarks, patents and domain names registration, insurance and corporate law;Delivery cycle:■■ from bidding to post-delivery, on top of the Bid Management process and Risk Management mentioned above, control activities have been designed on the handover from bidding to delivery, follow-up of risk register and action plans, resource management control, project financial review, monitoring of project execution and termination process for a project;Purchasing:■■ control activities have been designed on purchasing request authorisation process, key steps of procurement flow and ethics for buyers;Internal IT:■■ control activities have been designed around protection and confidentiality of data and information including disaster recovery plans, security and access to the systems and networks;Communication:■■ designed control activities are related to internal communication of key messages as well as procedures and policies, preparation and disclosure of announcement, public relations, communication crisis plan, financial communication, and investor relations.Mergers & Acquisitions:■■ control activities aim at ensuring that the proper authorizations have been obtained at each step of the process, and proper tools and resources employed to secure operations.Finance and Treasury:■■ the control activities are described in section 24.2.3.
24 . Corporate Governance24.2 Internal Control
Atos Origin » Annual Report 2009 » 195www.atosorigin.com
A new version of the Book of Internal Control has been communicated throughout the Group in August 2009 in order to take into account some improvements in terms of content and layout. This framework will continue to evolve, according to evolving maturity of processes and emerging risks.
A specific action has also been led with regards to “SAS70” reports.
SAS70 (Statement on Auditing Standards no.70) defines the American professional standards usually implemented in other countries within the framework of an auditor’s report on Internal Control of a service to a third party. Activities of Atos Origin typically have an impact on the control environment of its clients (through information systems), which may require the issuance of “SAS70 reports” for the controls ensured by Atos Origin.A control framework has been defined, detailing control activities related to client service. This framework has been built on the basis of the ITGI model ( IT Governance Institute’s publication titled IT Control Objectives for Sarbanes-Oxley, 2nd Edition).
MonitoringMonitoring of Internal Control system includes the analysis of results of controls (identification and treatment of incidents) and the assessment of controls to ensure controls are relevant and appropriate with control objectives. This monitoring is the responsibility of the Group and Local Management, and is also supported by Internal Audit missions.
Self assessments have been conducted for the main functional processes (Finance, HR, IT and Purchasing) by Group process owners, in order to evaluate the level of maturity of Internal Control in the different countries and process areas. This has been performed through questionnaires, filled locally and challenged and analysed at Group level. Evaluation is performed against a maturity scale (from “unreliable” to “monitored”) for each control objective. Actions plans are defined where gaps are identified with desired target.
Monitoring of specific areas has also been performed periodically to measure improvements or deviations of controls. For example, a periodic dashboard has been issued in 2009 to report on Segregation of Duties status, and distributed to Group managers.
In parallel, Internal Audit has been responsible to assess the functioning of Internal Control system. Internal Audit has carried out reviews to ensure that the Internal Control procedures are properly applied and supports the development of Internal Control procedures. Internal Audit also defined, in partnership with Group and Local management, action plans for continuously improving Internal Control processes.
In 2009, Internal Audit carried out a total of 60 audit assignments assessing the functioning of Internal Control system: 30 in the domain of support functions (Finance, Human Resources, Purchasing and Internal IT) and 30 related to Operations/core business (mainly focus on Worldline activities). All assignments have been finalised by the issuance of an audit report including action plans to be implemented by the related division or country. Among the audit assignments achieved in 2009:
Post-implementation audits of Group ERP system were ■■
completed for the UK and India.Human resources as well as Finance shared service ■■
centers, implemented recently, were audited through a review of all processes transferred and of the control environment.4 main countries were subject to an audit of their ■■
recruitment process (including the use of a common system recently deployed throughout the Group). Assessment of their supervision structure and piloting process at Group level were also performed.Follow-up of actions plans defined during 2008 notably ■■
regarding purchasing savings process, consolidation process, or general computer controls were carried outThree particular investigation audits took place.■■
Internal Audit has also performed an organizational review ■■
of control, risk, quality and security functions, in order to understand the existing assurance and control system within the Group, and to measure in this context how to extend Internal Audit’s scope to operational risks. Operational processes and risks review is already performed for Atos Worldline activities.As Atos Worldline provides high-tech transactional services ■■
within a highly regulated environment, Internal Audit is an important pillar for evaluation and sustainability of the effective Internal Control environment and adequate operational risk management. The main audit missions executed within Atos Worldline in 2009 concerned: Identity and Access Management audits, security audits for critical applications managing sensitive and confidential information, compliance audits with regard to payment services provided to bank clients, internal fraud prevention audits, audits on controls managing the financial flows for credit card processing, investigations on operational incidents.
24 . Corporate Governance24.2 Internal Control
Atos Origin » Annual Report 2009 » 196
24.2.3 Internal Control system related to the accounting and financial informationProcesses contributing to the accounting and financial information, referred as “financial processes”, are in line with the Internal Control system of Atos Origin, and are subject to specific attention due to their sensitivity.
Local and Group financial organisationThe financial processes have relied on finance teams in each country. Country CFOs had a dual reporting to local management and to Group CFO until February 2009. Since this date, country CFOs have a direct reporting line exclusively to Group CFO.Direct reporting to Group Function, as for the other support functions, reinforces the integration of the financial function and contributes to the full alignment of key processes and provides an appropriate support to operational entities of the Group.Piloting was ensured by Group CFO assisted by the Group Finance Executive Committee that included main country chief financial officers and Group Finance functions. This committee met on a regular basis and was in charge of the overall monitoring of the process of preparation of the financial information. Significant accounting issues, as well as potential Internal Control deficiencies, were reported to this committee, which decided corrective actions to be carried out.
Group Finance Department was in charge of piloting the financial processes, especially through the financial consolidation, the monitoring of compliance matters, the supply of expertise and the control of the reported financial information.In 2009, the Financial System Alignment initiative has been launched to reinforce alignment between countries in terms of indicators and processes, as well as to streamline IT tools and reporting demand.
Group finance policies & proceduresGroup Finance has drawn up a number of Group policies and procedures to control how financial information is processed in the subsidiaries. These policies and procedures were discussed with the statutory auditors before issuance and included the following main elements:
Financial accounting policies include a Group reporting and accounting principles handbook applicable to the preparation of financial information, including off-balance sheet items. The handbook sets out how financial information must be prepared, with common presentation and valuation standards. It also specifies the accounting principles to be implemented by Atos Origin entities in order to prepare budget, forecast and actual financial reporting required for Group consolidation purposes. Group reporting definitions and internal guidelines for IFRS, and particularly accounting rules applicable in the Operations, are regularly updated. An IFRS knowledge center is in place at Group level to assist and support local operations. Training and information sessions are organised regularly in order to circulate these policies and procedures within the Group. A dedicated intranet site is accessible to all accounting staff, which facilitates the sharing of knowledge and issues raised by members of the Atos Origin financial community.
Instructions and timetable: Financial reporting including budget, forecast and financial information by subsidiary is carried out in a standard format and within a timetable defined by specific instructions and procedures. Group Finance liaised with statutory auditors to coordinate the annual and half-year closing process.
Information systemsInformation systems have played a key role in the control system related to the accounting and financial information, as they have both strongly structured the processes and provided automated preventive controls, but have also provided monitoring and analysis capabilities.
An integrated ERP system has supported the production of accounting and financial information in the main countries.
A unified reporting and consolidation tool has been used since the beginning of 2007 for financial information (operational reporting and statutory figures). Each subsidiary reported its financial statements on a standalone basis in order to be consolidated at Group level. There was no intermediary consolidation level and all accounting entries linked to the consolidation remain under the direct control of Group Finance. Off balance sheet commitments were reported as part of the mainstream financial information and are examined by Group Finance.
24 . Corporate Governance24.2 Internal Control

Atos Origin » Annual Report 2009 » 197www.atosorigin.com
Monitoring and controlIn addition to the financial processes defined, monitoring and control processes have aimed to ensure that accounting and financial information complies with rules and instructions.
The Closing File (included in the Book of Internal Control) is deployed at local level since 2008. It was required for each subsidiary to elaborate on a quarterly basis, a standard closing file formalising key Internal Controls performed over financial cycles and supporting closing positions.
Functional reviews were performed by Group financial support functions on significant matters relating to financial reporting, such as tax issues, pensions, litigations, off balance sheet items or business performance and forecast.
Operational and financial reviews: Group controlling is supporting Operations and General Management in the decision making process through monthly reviews and by establishing a strong link with country management in financial analysis & monitoring, enhancing control & predictability of operations and improving the accuracy & reliability of information reported to the Group;
Representation letters: During the annual and half-year accounts preparation, the management and financial head of each subsidiary was required to certify in writing that they have complied with the Group’s accounting rules and policies and that, to the best of their knowledge, there was, within their scope of responsibility, no major deficiency in the control systems in place within their respective subsidiary.
Internal Audit Department: The review of the Internal Control procedures linked to the processing of financial information was a component of the reviews conducted by the Internal Audit Department. The Internal Audit Department worked together with Group Finance to identify the main risks and to focus its audit plan consequently as effectively as possible.
24.2.4 Internal Control playersThe main bodies involved in the implementation of Internal Control procedures at Atos Origin are as follows:
Board of Directors supported by Audit Committee
The Board of Directors prepares governance rules detailing the Board’s role supported by its committees. Those committees play a key role to enlighten the Board as to the Internal Control system through their review and monitoring duties in a number of areas. The Audit Committee, in particular, is informed of the content and the implementation of Internal Control procedures used to ensure the reliability and accuracy of financial information and stays informed about the proper implementation of the Internal Control System.
General Management and Executive Committee
General Management is responsible for the management of the Group’s business and focuses on strategic aspects to develop the Group. As part of its role, General Management defines the framework of the system of Internal Control.The Executive Committee leads the operational performance of the Group. Its main tasks are to define and review business priorities, review Atos Origin operational performance and define corrective action plans. Management at dif ferent levels is responsible for implementing and monitoring the Internal Control system within their respective areas of responsibility.
Risk Management
Risk Management monitors, reviews and inspects the bidding, engaging in and the execution of contracts to achieve an optimum balance between risk and reward and identifies improvements in our operational processes, including controls where applicable.
Internal Control
Internal Control function is to ensure the coordination of the Internal Control system, like the implementation of the Book of Internal Control and its continuous improvement within the Group. Internal Control coordinates also all other initiatives of Internal Control.
24 . Corporate Governance24.2 Internal Control

Atos Origin » Annual Report 2009 » 198
Internal Audit
The Internal Audit organisation is centralized which enables a global working practice following one Group audit plan and a consistent audit methodology. Internal Audit operating principles are defined in the Group Internal Audit Charter, which was validated by General Management. The Audit Committee also received regular reports on the Internal Audit work plan, objectives of assignments, and associated results and findings. The internal audit department liaises with the statutory auditors to ensure an appropriate co-ordination between internal and external control.
24.2.5 Outlook and related new procedures to be implementedIn 2010, the Top Program, as largely detailed, will pursue its effects to improve and streamline processes, with benefits for the Internal Control System.Initiatives identified through the risk mapping will be monitored to ensure that proper attention is given to those topics.
The Internal Audit Department will pursue the internal review programme initiated in 2009. In line with the planned development of the Internal Control system of the Group, Internal Audit plans to pursue its focus on the implementation of the Book of Internal Control and Top program. In parallel with the continuation of the self-assessment process on financial Internal Controls, the Internal Audit team will continue to reinforce control and verification of financial information.
ConclusionBased on the above, we have no other observation with regard to Internal Control and procedures implemented by the Group. However, it should be noted that Internal Control cannot provide an absolute guarantee that the Group’s goals in this respect will be achieved and that all risks will have been completely eliminated.
Thierry BRETOn,Chairman of the Board of Directors
24 . Corporate Governance24.2 Internal Control
Atos Origin » Annual Report 2009 » 199www.atosorigin.com
24 . Corporate Governance24.3 Statutory Auditors’ Report, prepared in accordance with article L. 225-235 of the French Commercial Code
on the report prepared by the Chairman of the Board of Directors of Atos Origin with respect to the Internal Control procedures for the preparation and treatment of financial and accounting information
24.3 Statutory Auditors’ Report, prepared in accordance with article L. 225-235 of the French Commercial Code on the report prepared by the Chairman of the Board of directors of Atos Origin with respect to the Internal Control procedures for the preparation and treatment of financial and accounting information
This is a free translation into English of the statutory auditors’ report issued in French prepared in accordance with Article L.225-235 of French company law on the report prepared by the Chairman of the Board of Directors on the Internal Control procedures relating to the preparation and processing of accounting and financial information issued in French and is provided solely for the convenience of English speaking users. This report should be read in conjunction with, and is construed in accordance with, French law and professional auditing standards applicable in France.
To the Shareholders,
In our capacity as Statutory Auditors of Atos Origin and in accordance with Article L.225-235 of French company law (Code de Commerce), we hereby report on the report prepared by the Chairman of your company in accordance with Article L. 225-37 of French company law (Code de Commerce) for the year ended 31 December 2009.It is the Chairman’s responsibility to prepare, and submit to the Board of Directors for approval, a report on the Internal Control and risk management procedures implemented by the company and containing the other disclosures required by Article L.225-37 of French company law (Code de Commerce), particularly in terms of corporate governance.
It is our responsibility:to report to you on the information contained in the ■■
Chairman’s report in respect of the Internal Control procedures relating to the preparation and processing of the accounting and financial information, and to attest that this report contains the other disclosures ■■
required by Article L. 225-37 of French company law (Code de commerce), being specified that we are not responsible for verifying the fairness of these disclosures.
We conducted our work in accordance with professional standards applicable in France.
Information on the Internal Control procedures relating to the preparation and processing of accounting and financial information
The professional standards require that we perform the necessary procedures to assess the fairness of the information provided in the Chairman’s report in respect of the Internal Control procedures relating to the preparation and processing of the accounting and financial information. These procedures consisted mainly in:
obtaining an understanding of the Internal Control ■■
procedures relating to the preparation and processing of the accounting and financial information on which the information presented in the Chairman’s report is based and the existing documentation;obtaining an understanding of the work involved in the ■■
preparation of this information and the existing documentation;determining if any significant weaknesses in the Internal ■■
Control procedures relating to the preparation and processing of the accounting and financial information that we would have noted in the course of our engagement are properly disclosed in the Chairman’s report.
On the basis of our work, we have nothing to report on the information in respect of the company’s Internal Control procedures relating to the preparation and processing of accounting and financial information contained in the report prepared by the Chairman of the Board of Directors in accordance with Article L.225-37 of French company law (Code de Commerce).
Other disclosures
We hereby attest that the Chairman’s report includes the other disclosures required by Article L. 225-37 of French company law (Code de commerce).
neuilly-sur-Seine and Paris, 31 March 2010
The Statutory Auditors
Deloitte & Associés Grant ThorntonFrench member of Grant Thornton International
Tristan Guerlain Christophe Patrier Jean-Pierre Colle Vincent Frambourt

Atos Origin » Annual Report 2009 » 200
24.4 Codes and Charts
24.4.1Code of Ethics Atos Origin is committed to conducting its business in an ethical manner. Accordingly, it has issued a Code of Ethics to all employees, requiring them to act honestly, fairly and with integrity in their day-to-day work and in accordance with the legal framework in force in each country where Atos Origin is conducting business.
All members of the Board of Directors, senior managers and key employees are required to disclose in writing to the Group any shareholding or financial interest in the affairs of its suppliers, associates or competitors. The aim of this policy is to avoid conflicts of interest and to protect the Group and its management. All management and key personnel are required to accept the Code of Ethics in writing.
Conflicts of interest
The Code of Ethics is designed to prevent employees (or members of their family) from benefiting indirectly from transactions or associations with third parties.
Bribery and corruption
Atos Origin will not tolerate any form of bribery or corruption. Bribery is defined as the giving of money or some other form of benefit in order to obtain a commercial advantage. Corruption occurs where a dishonest or illegal practice undermines Atos Origin’s business integrity or its assets.
General business integrity
The basic principles of Atos Origin’s ethical business policy are that:
All Atos Origin employees should be treated equally on ■■
the basis of their merits and qualifications, regardless of race, nationality, sex, age, handicap or any other distinctive trait. All Atos Origin employees should abide by the laws and ■■
regulations of the countries in which the Group operates.No employee should improperly influence a political ■■
candidate, elected official or government official in the exercise of his/her functions. No employee should take part in an agreement that could ■■
contravene the applicable laws and regulations concerning anti-competitive practices.
24.4.2 Insider information and insider tradingThe unauthorised use or publication of inside or confidential information can distort the market for Atos Origin securities. Accordingly, in order to ensure that there is a fair and open market in Atos Origin securities, the Company’s goal is also to publish material information to investors and shareholders regarding its activities immediately when it becomes known and under conditions that are equal for all. The Group requires all senior managers or employees having access to critical information (“relevant employees”) to follow insider trading rules and regulations.
24.4.3 Insider trading Inside information is classified as information having an impact on a decision of whether to buy, sell or retain any Atos Origin securities, therefore distorting the market. The unauthorised use or communication of inside information is strictly prohibited and constitutes a legal offence. Such offences are liable to criminal, regulatory (Autorité des Marchés Financiers, the french exchange commission) and civil sanctions. Accordingly, no employee may discuss or divulge any inside information to third parties or deal in Atos Origin securities when he/she is in possession of any inside information.
24.4.4 dealings during closed periods“Relevant employees” may not deal in Atos Origin securities, whether directly or indirectly, during any “closed period”, which is defined as six weeks prior to the publication of Atos Origin’s annual financial statements and four weeks prior to publication of Atos Origin’s first and third quarter revenues.
“Relevant employees” include (i) all directors and/or officers and/or managers of companies within the Atos Origin Group and their direct subordinates and assistants who have access to inside information; (ii) any key employee specifically designated as such by the Board of Directors to sign the Code of Ethics; and (iii) any employee who is likely to be in possession of unpublished price-sensitive information concerning Atos Origin SA and its subsidiaries. The above limitation on dealing in Atos Origin securities does not apply to the exercise by employees of stock options granted by Atos Origin in the course of their employment. The limitation does apply however to the sale of resulting shares.
24 . Corporate Governance24.4 Codes and Charts

Atos Origin » Annual Report 2009 » 201www.atosorigin.com
24 . Corporate Governance24.4 Codes and Charts
Dealings in Atos Origin options
Employees are forbidden to negotiate any protection against fluctuations in the potential capital gain to be obtained from Atos Origin stock options or free shares granted by Atos Origin to an individual in the course of their employment (whether through a call, a put or otherwise), except if expressly authorised by the Board of Directors.
Clearance to deal
Even outside closed periods, relevant employees may not deal in Atos Origin securities, whether directly or indirectly, without obtaining the prior approval of the Chairman of the Board of Directors or any person to which he/she shall have delegated such powers. This does not apply to the exercise (not followed by a sale) by employees of stock options granted by Atos Origin in the course of their employment.
24.4.5 Internal rules of the Board of directors and Charter of the Atos Origin Board of directorsThe Board of Directors has approved Internal Rules to which is attached a Charter of the Atos Origin Board of Directors and a Guide to the Prevention of Insider Dealing. The Charter of the Board of Directors summarises the mission and obligations of the members of the Board of Directors. The Charter covers in particular the following points: prohibition to hold a corporate office and an employee contract, company interests, attendance, diligence, loyalty, independence, confidentiality, trading in the Group’s shares, conflicts of interest, information of members.
Appointment
Before accepting their mandate, each director must declare that he/she have understood the obligations binding upon them. He/she must also acknowledge the applicable laws and regulations, the Articles of Association of the Company, the Internal Rules of the Board of Directors, the Charter of the Board of Directors and the Guide to the Prevention of Insider Dealing. Directors must own in their own name at least one thousand nominee shares and, if they do not own such shares at appointment, they must acquire them within three months of their date of appointment.
Directorship and Employment are mutually exclusive
A director who becomes a legal representative of the Company shall undertake to terminate his or her employment contract with the Company ( if such employment contract exists), either by contractual termination or by resignation. This provision obviously does not apply to the director representing the employee shareholders.
Defending the interests of the Company
Each director represents all shareholders and must act at all times in their interest and in the interest of the Company. He/she must alert the Board of Directors of any event brought to his or her attention which he/she deems could affect the interests of the Company.
Conflicts of interest
The Atos Origin “Code of Ethics” prohibits any director or staff member from having a conflict of interest between their personal and corporate responsibilities. Directors must inform the Board of Directors of any actual or potential conflict of interest of which they are aware. The director must then participate in a review of that conflict by the Board as a whole, but must abstain from taking part in any vote taken on the subject. A conflict of interest arises when a director or a member of his or her family could personally benefit from the way the Company’s business is conducted, or could maintain a relationship of any kind with the Company, its affiliates or its management that could compromise the director’s judgment (particularly as a client, supplier, business banker, legal representative).
Attendance – Diligence
By accepting their mandate, each director agrees to spend the necessary amount of time and care in performing their duties and must comply with legal regulations applying to the number of director mandates. Except in unavoidable circumstances, each director must attend all Board meetings and the meetings of all Board Committees to which they belong. He or she shall keep informed about the work and specifics of the Company, including its stakes and values, by inquiring, if necessary, its Management. He or she shall make a point of keeping updated on the knowledge that enables him or her to perform his or her functions.

Atos Origin » Annual Report 2009 » 202
Loyalty
Each director is under an obligation of loyalty towards the Company. He or she shall not take any initiative that could harm the interests of the Company or other companies or entities within the Group and shall act in good faith in all circumstances.He or she shall not take on any responsibilities on a personal basis in any company or business practicing any activities in direct competition with those of Atos Origin without prior approval of the President of the Board of Directors and of the President of the Nomination and Remuneration Committee.
Independence
The director carries out his or her functions in complete independence. He or she undertakes to preserve in all circumstances, his or her independence of analysis, judgment, decision and action. He or she does not tolerate being influenced by any factor outside of the corporate interest, which he or she undertakes to protect. He or she commits to informing the Board of any known issue which appears to be of such a nature as to affect the interests of the Company.
Confidentiality
The Directors are required to uphold professional secrecy, which exceeds the mere obligation of discretion provided for in the law, in regards to any information gathered during or outside of the Board of Directors’ meetings. They commit to keep strictly confidential any information that has not been publicly disclosed, of which they have been informed or become aware during their mandate, as well as the contents of discussions and votes of the Board of Directors and of its committees.
Inside information and trading in the Group’s shares
Directors may not trade in the Group’s shares other than within the limits of the ”Guide to the Prevention of Insider Dealing” approved by the Board of Directors. The Group prohibits trading in its shares especially during closed periods prior to the announcement of its annual and half-year results and quarterly revenue performance. Board members must inform the Group of any dealings in the shares of the Group within five days of executing the transactions, in order that the Group may comply with its relevant filing requirements, notably to the French stock exchange regulatory authority - the Autorité des Marchés Financiers.
Information of Board members
The Company shall be required to provide its directors with any information necessary for the efficient participation in the work of the Board of Directors in such a way as to enable them to carry out their mandate under appropriate conditions. The same shall apply at any time in the life of the Company where the importance or urgency of the information so requires. This permanent information shall include any relevant information, including critical information, concerning the Company and particularly articles in the press and financial analysis reports.
A director may request from the chairman any complementary information that he or she deems necessary for the full accomplishment of his or her tasks, particularly in view of the agenda of the meetings. Should a director consider that he or she has not been put in a position that enables him or her to discuss with full knowledge of the facts, it is his or her duty to indicate such to the Board and to require that he or she be provided with the indispensable information.
24 . Corporate Governance24.4 Codes and Charts

Atos Origin » Annual Report 2009 » 203www.atosorigin.com
24 . Corporate Governance24.5 Executive compensation and stock ownership
24.5 Executive compensation and stock ownership
24.5.1 director’s FeesDirector’s fees paid to the members of the Supervisory Board/Board of Directors
FY 2008 FY 2009
Jean-Philippe Thierry (compensation for Chairman of Supervisory Board) - 133,115
René Abate - 18,750
Behdad Alizadeh - -
Nicolas Bazire - -
Benoît d’Angelin - 19,750
Jean-Paul Béchat - -
Jean-François Cirelli - 18,750
Michel Combes - 18,750
Ms. Jean Fleming - -
Dominique Mégret - -
Bertrand Meunier - 18,750
Ms. Colette Neuville - 19,750
Michel Paris - 18,750
Pasquale Pistorio - -
Didier Cherpitel (compensation for Chairman of Supervisory Board) 150,000 -
Didier Cherpitel 63,392 18,750
Diethart Breipohl 40,416 18,750
Dominique Bazy 54,523 18,750
Jan P. Oosterveld 51,904 18,750
Vernon Sankey 36,696 37,500
Michel Soublin 47,648 37,500
Jean-François Théodore 5,357 -
Didier Cherpitel, whose annual compensation as Chairman of the Supervisory Board in 2007, amounted to EUR 450,000 (1), was compensated until 12 June 2008 when he was replaced by Jean-Philippe Thierry, whose 2008 annual remuneration of EUR 240,000 was paid on a pro rata temporis basis in 2009, or the sum of EUR 133,115.
Pursuant to a resolution passed by the shareholders at the Mixed Shareholders Meeting on 10 February 2009, the annual budget set for director’s fees was EUR 500,000 for members of the Board of Directors. The director’s fees paid in 2008 were for the 2007 exercise and the fees paid in 2009 were for the 2008 exercise, which is why the new elected members of the Board of Directors did not receive director’s fees in 2009. They will be paid in 2010.
Thierry Breton and Behdad Alizadeh have declined to accept a director’s fee.
24.5.2 Executive and associate corporate officers compensationFollowing the publication and analysis of the Afep-Medef Corporate Governance Code, Atos Origin has issued the following with regard to the company Directors compensation. These items were approved by the Board of Directors on 19 November 2009.
(1) Directors fees excluded.

Atos Origin » Annual Report 2009 » 204
In 2008, the Group was operating with a governing structure comprised of a Management Board and a Supervisory Board. This structure was modified in a Board of Directors meeting subsequent to the Mixed General Shareholders Assembly held on 10 February 2009.
Thierry Breton was appointed Chairman of the Management Board on 16 November 2008 and Chairman of the Board and Chief Executive Officer on 10 February 2009. Éric Guilhou was a member of the Management Board for the entire year of 2008 and until 10 February 2009.
Charles Dehelly, Senior Executive Vice President in charge of Operations since 1 December 2008 and Gilles Grapinet, Senior Executive Vice President in charge of Global Functions since 22 December 2008, are listed here as Employees.
With the exception of Eric Guilhou, the annual compensation for the individuals listed below is presented as a pro rata temporis sum in 2008, depending on their presence in the Company.
Thierry Breton, Chairman of the Management Board from 16 november 2008 to 10 February 2009, Chairman of the Board and Chief Executive Officer since 10 February 2009
The gross annual remuneration is EUR 2.4 million, of which half, (EUR 1.2 million) is fixed and the other half is conditional on meeting the objectives fixed by the Board of Directors.
Thierry Breton, Chairman of the Management Board from 16 November 2008 to 10 February 2009,Chairman of the Board and Chief Executive Officer as of 10 February 2009
Thierry Breton (in EUR)
2008 2009
Amounts due Amounts paid Amounts due Amounts paid
Fixed compensation 153,846 153,846 1,200,000 1,200,000
Variable compensation (*) 123,000 - 1,048,600 723,000
Exceptional compensation
Atos Origin SA director’s fees
Fringe benefits 5,337 5,337
TOTAL 276,846 153,846 2,253,937 1,928,337
(*) Thierry Breton’s variable compensation is conditional. It is paid in totality only if the quantitative objectives set by the Board of Directors are met. In 2008, 82% of the annual objectives were achieved and the variable compensation was pro-rated. The financial objectives were overachieved in the first semester of 2009, thus the variable compensation obtained for that semester is the maximum compensation of 100%. The objectives were 74.8% achieved in the second semester. In 2009, the annual variable compensation owed to Thierry Breton was therefore 87.4% of his target variable compensation, thus a decote of 12.6%.
Charles Dehelly, Senior Executive vice President in charge of Operations since 1 December 2008
The gross fixed annual compensation is EUR 450,000 and the variable target compensation for 100% achieved objecti-ves is equal to his base salary but can go to 169% in the event of overperformance (i.e. EUR 760.500).
Charles dehelly, Senior Executive Vice President in charge of Operations since 1 december 2008
Charles Dehelly (in EUR)
2008 2009
Amounts due Amounts paid Amounts due Amounts paid
Fixed compensation 37,500 37,500 450,000 450,000
Variable compensation 33,742 0 456,583 327,885
Exceptional compensation
Atos Origin SA director’s fees
Fringe benefits 3,854 3,854
TOTAL 910,437 781,739
24 . Corporate Governance24.5 Executive compensation and stock ownership

Atos Origin » Annual Report 2009 » 205www.atosorigin.com
Gilles Grapinet, Senior Executive Vice President in charge of Global Functions since 22 december 2008
The gross fixed annual compensation is EUR 450,000 and the variable target compensation for 100% achieved objectives is equal to his base salary but can go to 169% in the event of overperformance (i.e. EUR 760,500).
Gilles Grapinet, Senior Executive Vice President in charge of Global Functions since 22 december 2008
Gilles Grapinet (in EUR)
2008 2009
Amounts due Amounts paid Amounts due Amounts paid
Fixed compensation (*) 3,461 3,461 435,380 435,380
Variable compensation 0 465,646 303,207
Exceptional compensation
Atos Origin SA director’s fees
Fringe benefits 9,238 9,238
TOTAL 3,461 3,461 910,264 747,825
(*) Gilles Grapinet worked one day per week until 14 January 2009 inclusive and his compensation was pro-rated.
Eric Guilhou, Member of the Board until 10 February 2009
The gross fixed annual compensation is EUR 650,000 and the annual nominal variable compensation is EUR 650,000 and can reach EUR 975,000.
Eric Guilhou, Member of the Board until 10 February 2009
Eric Guilhou (in EUR)
2008 2009
Amounts due Amounts paid Amounts due Amounts paid
Fixed compensation 650,000 650,000 73,125 73,125
Variable compensation (*) 709,800 1,325,000 81,250 81,250
Exceptional compensation
Atos Origin SA director’s fees
Fringe benefits (**) 6,912 6,912 1,186 1,186
TOTAL 1,366,712 1,981,912 155,561 155,561
(*) Eric Guilhou’s variable compensation is based on 60% financial objectives and 40% qualitative objectives. In 2008, the financial objectives were 82% achieved and 150% of the qualitative were reached. The variable compensation amount for 2009 was determined based on the pro-rated target bonus.
(**) Includes provision of a company vehicle.
In 2009, Eric Guilhou received no free shares, no options for Company stock subscription or purchase. On 17 May 2009, he acquired 6,266 free shares as part of the “Long Term Incentive Plan 2007” and 10,956 free shares on 18 June 2009 for the “Management Investment Plan 2007”.
24 . Corporate Governance24.5 Executive compensation and stock ownership

Atos Origin » Annual Report 2009 » 206
24 . Corporate Governance24.5 Executive compensation and stock ownership
24.5.3 Option plan for stock subscription and free share plansIn 2009, M. Thierry Breton did not receive any Company stock options or free shares.
In view of the modifications made to the 23 December 2008 stock option plan rules by rulings of the Board of Directors on 5 October and 17 December 2009, in order
to strenghten the performance conditions the following items should be noted:
The three-year value of stock options was calculated based on a binomial model used for the Group’s consolidated financial statement. This value reflects the performance conditions differentiated for the three separate tranches (first, second and third tranche).
Stock option plan issued in 2008 to the Chairman of the Board and Chief Executive Officer
Chairman of the Board and Chief Executive Officer Date of plan
Type of options
valuation of the options using consolidated
statement model (in EUR)
number of
options
Strike price in % above
reference price (*)
Exercise period
Thierry Breton 23 December 2008
1st tranche
Subscription 1,054,670 233,334 5% 01/08/2010-31/03/2018
Thierry Breton 23 December 2008
2nd tranche
Subscription 809,666 233,333 25% 01/04/2011-31/03/2018
Thierry Breton 23 December 2008
3rd tranche
Subscription 590,332 233,333 50% 01/04/2012-31/03/2018
(*) Reference price at EUR 17.60.
Stock option plan issued in 2008 to the Senior Executive vice Presidents
In 2009, Charles Dehelly and Gilles Grapinet did not receive any Company stock options or free shares.
Senior Executive vice President Date of plan
Type of options
valuation of the options using consolidated
statement model (in EUR)number
of options
Strike price in % above
reference price (*)
Exercise period
Charles Dehelly 23 December 2008
1st tranche
Subscription 352,560 78,000 5% 01/08/2010-31/03/2018
Charles Dehelly 23 December 2008
2nd tranche
Subscription 270,660 78,000 25% 01/04/2011-31/03/2018
Charles Dehelly 23 December 2008
3rd tranche
Subscription 197,340 78,000 50% 01/04/2012-31/03/2018
(*) Reference price at EUR 17.60.
Senior Executive vice President Date of plan
Type of options
valuation of the options using consolidated
statement model (in EUR)number
of options
Strike price in % above
reference price (*)
Exercise period
Gilles Grapinet 23 December 2008
1st tranche
Subscription 352,560 78,000 5% 01/08/2010-31/03/2018
Gilles Grapinet 23 December 2008
2nd tranche
Subscription 270,660 78,000 25% 01/04/2011-31/03/2018
Gilles Grapinet 23 December 2008
3rd tranche
Subscription 197,340 78,000 50% 01/04/2012-31/03/2018
(*) Reference price at EUR 17.60.

Atos Origin » Annual Report 2009 » 207www.atosorigin.com
24 . Corporate Governance24.5 Executive compensation and stock ownership
InITIATIOn AnD TERMS OF THE STOCK SUBSCRIPTIOn OPTIOn PLAn ISSUED In 2008
The management team at Atos Origin was changed in late 2008 and, as part of the authorisations granted by the General Shareholders Assemblies on 23 May 2007 and 26 May 2009, this change also included granting a global stock option plan for the new team and managing directors. A three-year stock option plan was initiated in December 2008. Performance conditions were clarified over the course of 2009. It is reiterated that no other long term incentive plan (Stock Options or Free shares) was granted to the management team in 2009.
Issuance on 23 December 2008
On 23 December 2008, the Atos Origin Supervisory Board authorised a three-year plan for 1,378,000 stock options. They were intended for the key members of the company’s new General Management, who are: Thierry Breton, Chairman of the Management Board (he was planned to become Chairman of the Board and Chief Executive Officer of the company after the announced modification of the governance structure of the Company), the two newly appointed Senior Executive Vice Presidents, Charles Dehelly and Gilles Grapinet, who are also associated with 21 newly appointed project managers for the Company’s structural improvement scheme for operational performance launched by the new management team, named “TOP”.
This plan was structured so as to include commitments that would guarantee the company’s operational performance is both recovered and improved durably, along the three-year period of the TOP Program.
Therefore, the options were granted in three consecutive tranches and one-third of them may be exercised (under conditions of performance and presence), respectively, as of 1 April or 1 August 2010 (depending on the beneficiary), the second third (under conditions of performance and presence) as of 1 April 2011 and the remainder (under conditions of performance and presence) as of 1 April 2012.
The Supervisory Board, and then the Board of Directors (in 2009 when the operational performance criteria were being defined once the budget objectives had been set), used the services of professional advisors while the general market positions were changing to ensure the compliance of the plan with the Afep-Medef recommendations (specifically, the percentage of accounting valuation of the “average” annualized options of comparable companies and “not disproportionate” to the total compensation,
“serious and demanding” in terms of the performance conditions, stock option plan on the exercise date so the company is not required to purchase shares beforehand, limit any possible “windfall effects” by tightening the internal and external performance conditions, disclosure of the percentage of stock granted to the corporate officer compared to all securities issued annually, etc.).
Performance Conditions
The operational performance criteria (associated with continuous improvement year over year over the entire period of the company’s financial profile) that apply to the stock option plan for Atos Origin directors were determined by the company’s Board of Directors in its meetings on 17 February and 5 October 2009, following the advice of the Remuneration Committee. The Board of Directors deemed these criteria to comply with the Afep-Medef recommendations of December 2008 (prior to this, in December 2008, the Supervisory Board had received professional advice from a firm specialized in these matters).
For the three-year period of the plan, the Board of Directors retained the measurable progress indicators that reflected the priorities given to the management: improve the operating margin, the net cash flow and the share price, and on this point for each of the three tranches to have a strike price higher than the reference price with a sliding threshold set for each tranche. These criteria were preferred above all other comparison criteria – for example, stock market or indicial comparison criteria – which were considered less relevant to the company’s current phase, particularly in light of its situation, but also its present scope (which makes it a sideline player in IT services, primarily due to the weight, in electronic payments, of Atos Worldline’s businesses).
The recommendations of the Corporate Governance Code of Listed Corporations published by the Afep-Medef in December 2008 and cited in the AMF report on 9 July 2009 stipulate that: “the exercise by Executive Directors of all of the options and the acquisition of the shares must be related to performance conditions that are to be met over a period of several consecutive years. These conditions must be serious and demanding and combine internal and/or external performance requirements, i.e. they must be related to the performance of other industries, a benchmark sector, etc.” In view of these benchmark conditions cited, the options are thereby subject to the following performance conditions:

Atos Origin » Annual Report 2009 » 208
For the 1st tranche (for which the initial exercise period begins on 1 April 2010 and was delayed until 1 August 2010 for members of general management):
The strike price for the options was set at an amount higher than the share price on the date of grant, representing 5% above the reference price (reminder: reversing the downward trend and then recovering the quoted stock price were the utmost priority when the new team took their posts).
The only stock options issued to the general management team (Thierry Breton – Corporate Officer – and the two Senior Executive Vice Presidents), for which the start of the exercise period was delayed until 1 August 2010, were subjected to the following additional performances conditions that must be achieved for at least three of the four semesters (the reference period being a semester) ending 31 December 2008, 30 June 2009, 31 December 2009 and 30 June 2010:
1) Net cash flow before dividends and excluding acquisitions and transfers equal to at least 85% of the budget for the semesters in question, or 10% more than the results for the previous year’s corresponding semester (N-1); and2) Operating margin equal to at least 85% of the budget for the semesters in question, or 10% more than the results for the previous year’s corresponding semester (N-1).
For the 2nd tranche (for which the initial exercise period begins on 1 April 2011):
The strike price for the options was set at an amount higher than the share price on the date of grant, representing 25% above the reference price.
The following performance conditions must be achieved for the two years (the reference period being a year) prior to the start of the exercise period:
1) Net cash flow before dividends and excluding acquisitions and transfers equal to at least 80% of the budget for the year, or 10% more than the previous year’s results; and2) Operating margin equal to at least 80% of the budget for the year, or 10% more than the previous year’s results.
For the 3rd tranche (for which the initial exercise period begins on 1 April 2012):
The strike price for the options was set at an amount higher than the share price on the date of grant, representing 50% above the reference price.
The following performance conditions must be achieved for the two years (the reference period being a year) prior to the start of the exercise period:
1) Net cash flow before dividends and excluding acquisitions and transfers equal to at least 80% of the budget for the year, or 10% more than the previous year’s results; and2) Operating margin equal to at least 80% of the budget for the year, or 10% more than the previous year’s results. Computation and Deferment of Exercise
The value of the indicators for the internal performance conditions for each of the three tranches is determined by the Board of Directors for each reference period (year or semester) and sent to the beneficiaries.
In case performance conditions are not met for one of the reference periods associated to the different tranches, the beneficiary would lose the options for the tranche in question:
1) Unless, during two reference periods of the stock option tranche in question (or in at least three reference periods for options in the 1st tranche), at least one of the two internal performance conditions was met. In this case, the beneficiary is still eligible to exercise said options of the tranche in question if the performance conditions are met in the reference period immediately following the last reference period of the tranche in question.
2) Unless the Board of Directors rules otherwise, pursuant to article L. 225-177 of the French Commercial Code.
24 . Corporate Governance24.5 Executive compensation and stock ownership
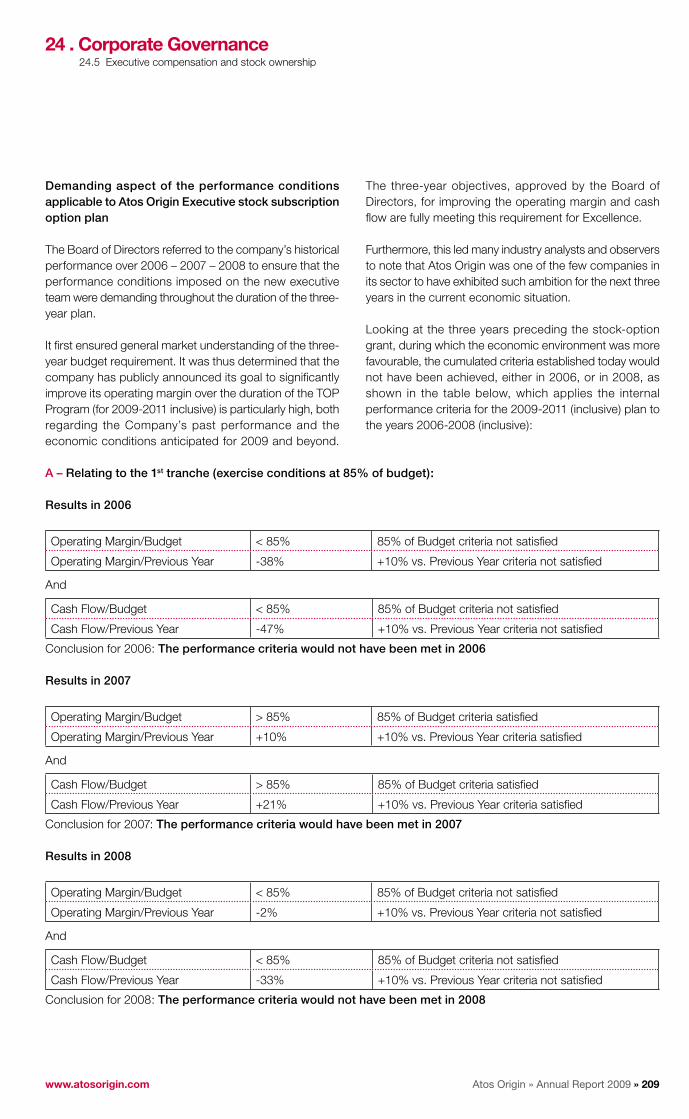
Atos Origin » Annual Report 2009 » 209www.atosorigin.com
Demanding aspect of the performance conditions applicable to Atos Origin Executive stock subscription option plan
The Board of Directors referred to the company’s historical performance over 2006 – 2007 – 2008 to ensure that the performance conditions imposed on the new executive team were demanding throughout the duration of the three-year plan.
It first ensured general market understanding of the three-year budget requirement. It was thus determined that the company has publicly announced its goal to significantly improve its operating margin over the duration of the TOP Program (for 2009-2011 inclusive) is particularly high, both regarding the Company’s past performance and the economic conditions anticipated for 2009 and beyond.
The three-year objectives, approved by the Board of Directors, for improving the operating margin and cash flow are fully meeting this requirement for Excellence.
Furthermore, this led many industry analysts and observers to note that Atos Origin was one of the few companies in its sector to have exhibited such ambition for the next three years in the current economic situation.
Looking at the three years preceding the stock-option grant, during which the economic environment was more favourable, the cumulated criteria established today would not have been achieved, either in 2006, or in 2008, as shown in the table below, which applies the internal performance criteria for the 2009-2011 (inclusive) plan to the years 2006-2008 (inclusive):
A – Relating to the 1st tranche (exercise conditions at 85% of budget):
Results in 2006
Operating Margin/Budget < 85% 85% of Budget criteria not satisfied
Operating Margin/Previous Year -38% +10% vs. Previous Year criteria not satisfied
And
Cash Flow/Budget < 85% 85% of Budget criteria not satisfied
Cash Flow/Previous Year -47% +10% vs. Previous Year criteria not satisfied
Conclusion for 2006: The performance criteria would not have been met in 2006
Results in 2007
Operating Margin/Budget > 85% 85% of Budget criteria satisfied
Operating Margin/Previous Year +10% +10% vs. Previous Year criteria satisfied
And
Cash Flow/Budget > 85% 85% of Budget criteria satisfied
Cash Flow/Previous Year +21% +10% vs. Previous Year criteria satisfied
Conclusion for 2007: The performance criteria would have been met in 2007
Results in 2008
Operating Margin/Budget < 85% 85% of Budget criteria not satisfied
Operating Margin/Previous Year -2% +10% vs. Previous Year criteria not satisfied
And
Cash Flow/Budget < 85% 85% of Budget criteria not satisfied
Cash Flow/Previous Year -33% +10% vs. Previous Year criteria not satisfied
Conclusion for 2008: The performance criteria would not have been met in 2008
24 . Corporate Governance24.5 Executive compensation and stock ownership

Atos Origin » Annual Report 2009 » 210
B – Relating to the 2nd and 3rd tranches (exercise conditions at 80% of budget):
Results in 2006
Operating Margin/Budget < 80% 80% of Budget criteria not satisfied
Operating Margin/Previous Year -38% +10% vs. Previous Year criteria not satisfied
And
Cash Flow/Budget < 80% 80% of Budget criteria not satisfied
Cash Flow/Previous Year -47% +10% vs. Previous Year criteria not satisfied
Conclusion for 2006: The performance criteria would not have been met in 2006
Results in 2007
Operating Margin/Budget > 80% 80% of Budget criteria satisfied
Operating Margin/Previous Year +10% +10% vs. Previous Year criteria satisfied
And
Cash Flow/Budget > 80% 80% of Budget criteria satisfied
Cash Flow/Previous Year +21% +10% vs. Previous Year criteria satisfied
Conclusion for 2007: The performance criteria would have been met in 2007
Results in 2008
Operating Margin/Budget > 80% 80% of Budget criteria satisfied
Operating Margin/Previous Year -2% +10% vs. Previous Year criteria not satisfied
And
Cash Flow/Budget < 80% 80% of Budget criteria not satisfied
Cash Flow/Previous Year -33% +10% vs. Previous Year criteria not satisfied
Conclusion for 2008: The performance criteria would not have been met in 2008
The Board of Directors estimated, when the criteria were validated, and notwithstanding the poor economic environment, that the defined criteria for the plan 2009 – 2011 satisfy the “strict and demanding” conditions and meet the Afep-Medef recommendations.
24.5.4 Allocation of free shares in 2009 for the Chairman of the Board/CEO and Senior Executive Vice Presidents
In 2009, Thierry Breton, Charles Dehelly, and Gilles Grapinet did not receive any allocation of company free shares.
24 . Corporate Governance24.5 Executive compensation and stock ownership

Atos Origin » Annual Report 2009 » 211www.atosorigin.com
24.5.5 Benefits to the executive directors
The table shows the Chairman of the Board/CEO, the member of the Management Board until 10 February 2009, and the Senior Executive Directors.
Employment Contract
Supplementary Pension Plan
Payment or Benefits effectively
or potentially due in the event
of terminating or changing function
non-Compete Clause payment
Executive/Corporate Officer YES nO YES nO YES nO YES nO
Thierry Breton NO YES NO NOChairman of the Management Board16 Nov. 2008 – 10 Feb. 2009
Chairman/CEO
10 Feb. 2009 – present
Charles Dehelly YES YES NO NOSenior Executive Vice President of Operations1 Dec. 2008 – present
Gilles Grapinet YES YES NO NOSenior Executive Vice President in charge of Global Functions 22 Dec. 2008 – present
Eric Guilhou YES NO (*) NO NO
Management Board Member
Jan. 2006 – 10 Feb. 2009
Thierry Breton does not have an employment contract and will not receive any severance payment at the end of his mandate. The terms of the supplementary pension plan are described in 24.5.7 “Compliance of global executive compensation with Afep-Medef recommendations”.
Thierry Breton will not receive compensation related to a non-compete clause.
(*) As of 30 September 2009, Eric Guilhou is no longer employed by the Group. He has therefore lost the entire additional pension plan benefit.
24.5.6 Comparative of global compensation for executive directors (2006–2009)
The Supervisory Board ensured that the theoretical global compensation of the Chairman of the Board/Chief Executive Officer, Thierry Breton, is less than or equal to that of its predecessors, both in total cash compensation and in total annualized compensation including long term incentives, all the while incorporating different implementation principles and in accordance with the objectives assigned to management by the Board. This data is presented in the tables below:
a) Theoretical annualized total cash compensation
(in EUR million)
B. Bourigeaud Chairman of the
Management Board
(1997-2007)
P. Germond Président
Chairman of the Management
Board(2007-2008)
T. BretonChairman and CEO(2008 - )
Total annual cash compensation (fixed + variable)- fixed part 1.16 (1) 0.9 1.2 (2)
- variable part 0.9 1.1 1.2- additional variable part (3) 0.45 0.5 0
TOTAL AnnUAL CASH COMPEnSATIOn (FIxED + vARIABLE) 2.51 2.5 2.4
(1) Including benefits worth approximately EUR 260,000 (lease of home …).(2) Fixed part of compensation taking into account the duties of the Chairman and CEO (the former Chairman received EUR 0.51 million for this alone).(3) In the event of overperformance.
24 . Corporate Governance24.5 Executive compensation and stock ownership

Atos Origin » Annual Report 2009 » 212
b) Annual Long-Term Incentive total compensation (accounting value) in EUR million
(in EUR million)
B. Bourigeaud Chairman of the
Management Board
(1997-2007)
P. Germond Président
Chairman of the Management
Board(2007-2008)
T. BretonChairman and
CEO(2008 - )
Long term incentive Annualized Compensation (accounting value)- stock options 0.5 0.87 0.82 (1)
- free shares 0.45 0.52 (2) 0
AnnUALIzED LOnG-TERM InCEnTIvE TOTAL COMPEnSATIOn (ACCOUnTInG vALUE (3)) 0.95 1.39 0.82
(1) One-year valuation of the three-year plan.(2) Accounting valuation used in the 2008 annual report.(3) “Black and Scholes” method for stocks options.
c) Additional items
B. Bourigeaud Chairman of the
Management Board
(1997-2007)
P. Germond Président
Chairman of the Management
Board(2007-2008)
T. BretonChairman and
CEO(2008 - )
Additional itemsSupplementary pension Yes Yes Deferred (1)
Severance payment Yes (EUR 4.5 million) In dispute (2) No
(1) To 31st December 2009.(2) P. Germond claims a severance payment of EUR 3.9 million, which the Company disputes both in terms of principle and in the amount.
d) Total compensation paid (in cash)
Year Chairman/CEO Amount paid (in EUR)
2006 Bernard Bourigeaud 3,106,591
2007 Bernard Bourigeaud (1) 2,507,144,(2)
2008 Philippe Germond (3) 3,154,067
2009 Thierry Breton 1,928,337
(1) 9 months to 1/10/07 as Chairman of the Management Board, 3 months as member of the Management Board.(2) Sum to which one should add severance payment (EUR 4.5 million).(3) 10.5 months to 16/11/08. Excluding a severance payment of EUR 3.9 million claimed by P. Germond which the company disputes.
24 . Corporate Governance24.5 Executive compensation and stock ownership

Atos Origin » Annual Report 2009 » 213www.atosorigin.com
24.5.7 Compliance of global executive compensation with Afep-Medef recommendations
The Board ensured the compliance of the total compensation of the Chairman/CEO with the Afep-Medef recommendations published in December 2008 and accepted by the AMF in its “AMF Report on Compensation for Executives of Listed Companies and on the Implementation of Afep-Medef Recommendations”, dated 9 July 2009.
a) Governance: On 10 February 2009, the Extraordinary General Meeting decided to change the corporate governance by adopting the status of a Public Company with a Board of Directors. This tighter governance was determined to be better suited to the economic environment. The Board decided to combine the duties of the Chairman and CEO, electing a Chairman and CEO as announced at the General Meeting. In a particularly uncertain economic environment, and sharing the Board’s objectives, the new Chairman wished to further strengthen the ties between the Board and Company management. As a result, the Board met 16 times during 2009.
b) Employment contract: Because he was never an employee of the company, the Chairman/CEO is not bound by any employment contract.
c) Fixed compensation: To set the Chairman/CEO’s fixed compensation at EUR 1.2 million per year, the Board took into account the cumulative duties of the Chairman and CEO. It should be noted that the fixed compensation previously allocated to the Chairman of the Management Board – alone – was EUR 0.9 million per year and previously allocated to the Chairman of the Supervisory Board – alone – was EUR 0.450 million per year in 2007 and EUR 0.240 million per year in 2008. In addition, the Chairman/CEO will not receive any directors’ fees.
d) variable compensation: In 2009, the maximum amount for the variable compensation was capped at 100% of the fixed part. Demanding and clear operating performance criteria were established and documented to condition the obtaining of the variable part on achieving objectives. For the second half of 2009, for example, the performance criteria were based on the target budget objectives: one third for the operating margin, another third for the generation of free cash flow, and the last third for turnover growth. In order to more closely monitor the Company’s performance and to establish a responsive way to follow its improvement plan, the objectives are set on a half-year basis.
e) Severance payment: There is no severance payment of any kind (golden parachute, non-compete clauses, etc.) either for the Chairman/CEO, or for the two Senior Executive Vice Presidents.
f) Supplementary pension plan: The Chairman/CEO benefits from the supplementary pension plan reserved for the members of the Group’s executive committee, however, he requested to postpone the benefit to 31 December 2009 due to the ongoing parliamentary debate on this issue and its outcome. The following points are noteworthy with regard to the Afep-Medef recommendations. The beneficiary group is wider than just the inner circle of corporate officers since it applies to, not only the three members of senior management team, but also to the 14 members of the executive committee, a total of 17 people. To benefit from the scheme, one must retire while maintaining a contractual link or corporate/administrative office with the Group or one of its entities. The pension paid by the company is the difference between a) a maximum, based on years of contribution, of 60% of the reference salary based on the average of the past 5 years of only the fixed salary (excluding the variable compensation and any additional compensation) preceding retirement, and b) the pension paid by other legal or conventional plans (including applicable defined contribution plans). A minimum of 10 years of cumulated seniority is required to receive benefits under the plan, with a maximum of 15 years, it hereby being noted that a newcomer to the plan who is over 50 (ex. 50+n years old) benefits automatically from n years of contributions, up to a maximum of 5 years. Each contribution year can vest a percentage of potential rights, limited to fixed compensation (4% of fixed salary, or 2% of the total fixed plus variable salary). Using only the fixed salary is preferred over using the total salary in order to avoid windfall and provide for exact visibility over the amounts to be funded. It should be noted that the potential retirement rights represent only a small percentage of the overall compensation of the beneficiaries.
g) Performance shares: The Board has decided to ban the grant of performance-based shares (free shares), as such an arrangement was, in the current period and during the implementation phase of the recovery/growth plan, too costly for shareholders (need for the company to acquire shares) and contrary to the desired entrepreneurial spirit (guaranteed profit with free shares once the acquisition terms are met, regardless of changes in the share price). The Board of Directors reserves the right to modify its position at a later date, should this be in the interest of the company.
24 . Corporate Governance24.5 Executive compensation and stock ownership
Atos Origin » Annual Report 2009 » 214
h) Stock subscription options: As noted above, considering both the Company’s position in the context of its three-year plan and the alignment of shareholder interests with management interests for the period, the Board decided that the long-term retention/performance of the total compensation for 2009-2011 would operate exclusively in the form of granting stock subscriptions options (stock options) under a three-year plan covering all of these objectives.
i) Allocated volumes: The “volumetric” analysis obviously requires an accounting valuation of the allocated options (Black and Scholes method), as required by IFRS standards and accounting, to have a relevant basis of comparison.
Several considerations have been taken into account in validating the volumes granted:
First, there is a three-year plan organized into three equal ■■
tranches, with 233,333 options each. Therefore, it is advisable to use an annual basis averaged over three years for any relevant comparison. The Board wanted to ensure that allocated volumes produce an annual accounting value for options around the level commonly used in the sector, and therefore, concerning stock options only, to the one granted on an annual basis to the predecessor of the current executive/corporate officer (who received an annual allocation of options equivalent to 110% of his fixed compensation, or face value of EUR 990,000 per year for the executive or recorded as EUR 869,400 for the company – See 2008 Annual Report).
Second (although not relevant considering that there will ■■
no longer be an allocation in 2009-2011), the scheme results in that the total volume is consistent with the average posted by the main issuers in 2008, which represents roughly 50% of the theoretical total compensation. This ratio, used to ensure that “the valuation of allocated options is not disproportionate to the total compensation” is confirmed by the AMF in its report, dated 9 July 2009, which states (page 43/57) that, “the options and shares allocated by the 44 companies that made allocations in 2008 represent an average of 48% of global compensation (fixed compensation, variable compensation, director’s fees, fringe benefits, stock options and free shares)”. For the Chairman/CEO of Atos Origin, whose total maximum compensation (fixed + variable + fringe benefits) is EUR 2.405 million, this means that the maximum posted amount must be around EUR 2.405 million (thus representing 50% of total compensation) in order to determine the total volume of benefits allocated over three years, if complying with this ratio at the time of posting the total benefit in the company’s financial records.
The 700,000 options that are subject to the performance ■■
conditions indicated above therefore comply with this last constraint because they result in a posted 2008 accounting value for the three tranches, respectively, of EUR 1,054,670 for the first tranche, EUR 809,666 for the second, and EUR 590,332 for the third, for a total of EUR 2,454,668 (which represents 50.5% of total compensation, as defined above). The plan also complies with the first constraint because, on an annual basis, it corresponds to a three-year allocation of EUR 2,454,668 ÷ 3 = EUR 818,223 per year, which is below the EUR 869,400 cap specified above.It is hereby reminded that the predecessor of the executive/corporate officer also received an additional annual allocation of free shares with a face value of EUR 540,000 per year.
The Board therefore found that the volume of the allocation fully respects the objectives of an accounting valuation of annualized options that is “in the average” of comparable companies and “not dispropor tionate” to total compensation.
j) Percentage of securities allocated to the executive/corporate officer: Because securities were granted to the executive/corporate officer in 2008, accounting should compare the percentage with respect to all of the securities allocated in 2008, including those before his arrival in November, even if the matter of consistency with this comparison could be raised since a managerial change occurred. However, on an annualized basis in 2008, and therefore on a comparable basis, the percentage of securities allocated to the executive/corporate officer represents 6.3% of all securities granted over the year (options, free shares translated into equivalent stock options). We here add that a complementary derogatory profit sharing scheme (“participation”) was implemented for all 15 000 employees present in France.
k) Reduced impact of potential windfall: The Board then tried to reduce the impact of a potential windfall effect resulting from the fact that the plan was carried out in a very bleak economic environment, with an uncertain duration and without full perspective of the general economic conditions and those of Atos Origin’s sector, particularly in the medium term. Thus, the Board of Directors decided that, in addition to the performance conditions described above, the third tranche of the plan would involve a +50% premium compared to the reference price and the second tranche would have a +25% premium (see above). Following the 1st half of 2009 results issuance, Atos Origin’s share price rose significantly (+30% over two months, only to drop back down later), as its volatility increased. Thus, for the first tranche (which had no other
24 . Corporate Governance24.5 Executive compensation and stock ownership

Atos Origin » Annual Report 2009 » 215www.atosorigin.com
performance conditions than the strike, with a +5% premium), the Board decided to add reinforced operational performance conditions to be met, setting the performance requirement level at 85% achievement of the budgeted net cash flow and operating margin, compared to 80% for tranches 2 and 3. This tranche also has conditions to be satisfied, not only for the two full years, but for at least three out of four of the semesters during the period. The exercise date for tranche 1 has therefore been pushed back to account for this. In doing this, the Board expressed the importance that it attached to this, from the first phase of the three-year plan, to the continued operational success of the company over time, semester after semester. The first tranche is therefore more conditioned that the other two on this success.
l) Hedging instruments: The use of any option-hedging instruments is formally prohibited for the beneficiaries of stock option plans.
m) Retention of a percentage of shares from exercised stock options: The Board decided that, if options are exercised, the executive/company officer would retain at least 5% of the acquired shares, while still part of the company. This simple and documented mechanism is preferred over any other more sophisticated scheme (percentage of the capital gain from sale, percentage of the fixed, variable, or total salary, etc.), which may be more relevant for other companies than for Atos Origin during this period, given the specific challenges presented by the execution of this three-year plan.
n) Public notice on compensation accorded to the executive/corporate officer: In the interests of transparency and open market communication, all of the elements characterising the various components of the executive/corporate officer’s total compensation are made public, once adopted by the Board. Similarly, the Board ensured that this was done before 31 December 2008 so that they could be included in the 2008 Annual Report when it is was published.
In conclusion, the analysis of the above items led the Board, at its 19 november 2009 meeting, to deem the total compensation of the executive/corporate officer to be compliant with the recommendations of the December 2008 Afep-Medef Code, approved by the AMF in its report dated 9 july 2009. A complete press release was communicated to the market the same day including in particular all the elements cited above.
24 . Corporate Governance24.5 Executive compensation and stock ownership

Atos Origin » Annual Report 2009 » 216
25 . Resolutions
25.1 Proposed resolutions to be submitted to the Annual General Meeting
25.2 Board of directors’ reports to the Annual General Meeting pursuant to article L. 225-184 of the French Commercial Code
25.1 Proposed resolutions to be submitted to the Annual General Meeting 216
25.2 Board of Directors’ reports to the Annual General Meeting pursuant to article L. 225-184 of the French Commercial Code 216
25.3 Board of Director’s report to the Annual General Meeting (pursuant to the 2006-05 instruction of 3 February 2006 on transactions made on the shares of the company) 217
25.4 Board of Directors’ Report to the Annual General Meeting (pursuant to section L. 225-197-4 of the French Commercial Code) 217
Resolutions submitted to the shareholders’ vote will be published in the Bulletin des Annonces Légales Obligatoires (official legal gazette for listed companies) and will be
posted on the Atos Origin website (“Investors” section), as required by applicable laws and regulations (i.e. at least 35 days before the shareholders’ meeting).
Dear Shareholders,
We hereby inform you that no stock subscription options were granted to legal representatives during the 2009 fiscal year.
There were no shares subscribed or shares bought following the exercise of stock options by the legal representatives during the 2009 fiscal year.
The total number, the balanced average price and the exercise dates of the stock options or free share grants given, during the year 2009, by the Company or a company or economic interest group linked to the Company as per section L. 225-180 of the French Commercial Code, to each of ten non-legal representative employees of the Company which have received the highest amount of options are the following:
number of stock options granted
Average balanced price in Euros Exercise dates
1st tranche 333,340 20.64 01/07/2010 – 30/06/2018
2nd tranche 333,330 24.57 01/07/2011 – 30/06/2018
3rd tranche 333,330 29.49 01/07/2012 – 30/06/2018
TOTAL 1, 000,000 24.90
The total number and the balanced average price of the shares which were subscribed or bought during the year 2009 by way of exercising one or more owned options on the Company or a company or economic interest group linked to the Company as per section L. 225-180 of the French Commercial Code, by each of ten non-legal representative employees of the Company which have received the highest amount of option are the following:
number of stock options exercised Average balanced price in Euros
3,009 25.92

Atos Origin » Annual Report 2009 » 217www.atosorigin.com
The total number, the balanced average price and the exercise dates of the stock options or free share grants given, during the year 2009, by the Company or a company or economic interest group linked to the Company as per section L. 225-180 of the French Commercial Code, to all employee beneficiaries, the number of such beneficiaries, and the distribution of the grants according to the categories of beneficiaries are the following:
Date of the stock option plans
number of stock options
granted
Average balanced price
in Euros Exercise dates
03/07/2009 1st tranche 481,414 25.00 01/07/2010 – 30/06/2018
2nd tranche 481,108 30.00 01/07/2011 – 30/06/2018
3rd tranche 480,978 35.00 01/07/2012 – 30/06/2018
TOTAL 1,443,500 30.00
04/09/2009 1st tranche 86,347 34.28 01/07/2010 – 30/06/2018
2nd tranche 86,334 40.81 01/07/2011 – 30/06/2018
3rd tranche 86,319 48.97 01/07/2012 – 30/06/2018
TOTAL 259,000 41.35
OvERALL TOTAL 1,702,500 31.73
25.3 Board of director’s report to the Annual General Meeting (pursuant to the 2006-05 instruction of 3 February 2006 on transactions made on the shares of the company)
Dear Shareholders,
We hereby inform you that the following transactions have been made on the shares of the Company by its legal representatives during the year 2009:
name number of shares bought Date Purchase price in Euros
Pasquale Pistorio 1,000 19/03/2009 20.53
Nicolas Bazire 1,000 11/05/2009 23.69
Former legal representative
Dominique Mégret 1,000 18/02/2009 20.01
25.4 Board of directors’ Report to the Annual General Meeting (pursuant to section L. 225-197-4 of the French Commercial Code)
Dear Shareholders,
We hereby inform you that no free shares have been granted to either the legal representatives or the employees of the Company or a company or economic interest group linked to the Company in the terms set out in section L.225-197-2 of the French Commercial Code during the year 2009.
25 . Resolutions25.2 Board of Directors’ reports to the Annual General Meeting pursuant to article L. 225-184 of the French Commercial Code25.3 Board of Director’s report to the Annual General Meeting (pursuant to the 2006-05 instruction of 3 February 2006
on transactions made on the shares of the company)25.4 Board of Director’s report to the Annual General Meeting (pursuant to section L. 225-197-4 of the French Commercial Code)

Atos Origin » Annual Report 2009 » 218
26 . Legal information
26.1 Corporate form and purpose
26.2 Provisions of the articles of association
26.1 Corporate form and purpose 21826.2 Provisions of the articles of association 218
26.3 Board of Directors 221
Company name (article 3 of the articles of association): ■■
Atos OriginLegal form (article 1 of the articles of association): Limited ■■
Liability Company (Société Anonyme) with a Management Board and a Supervisory Board until February 9, 2009, then with a Board of Directors, governed by Articles 225 et seq. of the French Commercial Code.Corporate purpose (article 2 of the articles of association): ■■
The Company’s purpose in France and elsewhere is as follows:
the processing of information, systems engineering, -studies, advice and assistance notably in the finance and banking sectors,the research into, study, realisation and sale of products -or services which help in promoting or developing the automation and broadcasting of information and notably: the design, application and implementation of software, computer, on-line and office automation systems,it can also operate, either by itself or using any other -method, without any exception, or create any company, make all contributions to existing companies, merge or create alliances therewith, subscribe to, purchase or
resell all shares and ownership rights, take all interests in a partnership and grant all loans, credits and advances,and more generally any commercial, industrial, real- -estate, movable property or financial transactions, either directly or indirectly related to one of the above mentioned purposes.
Nationality: French.■■
Registered office and principal place of business (article ■■
4 of the articles of association): 18 avenue d’Alsace – 92 400 Courbevoie, France.Registered in Nanterre under Siren number 323 623 603.■■
Business identification code (NAF code): 7010Z.■■
Date of incorporation: 1982.■■
Term: up to 2 March 2081.■■
Fiscal year (article 36 of the articles of association): ■■
1 January to 31 December.Common stock as at 31 December 2009: The Group’s ■■
common stock amounted to EUR 69,720,462 divided into the same number of shares ■■
with a par value of EUR 1 each.
26.2.1 Board of directorsThe Company is managed by a Board of Directors. The term of office of directors is three years. Each Board member is required to own at least 1,000 Company’s shares during the term of his or her office (article 15 of the bylaws – this rule however does not apply to the director representing employee shareholders).
26.2.2 ChairmanThe Board of Directors elects from among its members a Chairman. The Chairman represents the Board of Directors. He organizes and directs the Board’s activities, on which he reports at Shareholders’ Meetings. He oversees the proper functioning of the Company’s bodies and makes sure, in particular, that the directors are able to carry out their assignments.
26.2.3 Chief Executive OfficerAs a function of the choice made by the Board of Directors, the general management is handled either by the Chairman, or by an individual appointed by the Board of Directors who has the title of Chief Executive Officer. The Chief Executive Officer has the broadest powers to act in all circumstances in the name of the Company. He exercises these powers within the limits of the company purpose and what the law and these Articles expressly assign to the General Meetings of shareholders or the Board of Directors. The Chief Executive Officer represents the Company in its relationship with third parties.
On 10 February 2009 the Shareholders approved new articles of association. This resulted in the corporation changing its governance mechanisms from one structure
with a Management Board and a Supervisory Board to one with a Board of Directors, which is the structure in place as of the date of issuance of this Annual Report.

Atos Origin » Annual Report 2009 » 219www.atosorigin.com
26.2.4 decisions of the Board of directorsNotice of Board meetings is sent to Directors by the Chairman. If no Board meeting is called for over two months, at least one-third of the Directors are empowered to ask the Chairman to call a meeting in order to handle the specific matters included on the agenda. The Chief Executive Officer is also empowered to ask the Chairman to call a Board meeting in order to discuss specific matters included on the agenda. Decisions are taken in accordance with the quorum and majority rules provided for by law. In the event of a tie in the voting, the Chairman will have the casting vote.
26.2.5 Powers of the Board of directorsThe Board of Directors sets the orientations of the Company’s business and monitors their implementation. With the exception of powers expressly assigned to General Meetings of shareholders and within the limits of the company’s purpose, it handles all matters involving the proper functioning of the Company and settles matters through its deliberations.The transfer of fixed assets, the total or partial transfer of holdings and the constitution of securities on company assets requires the prior authorization of the Board of Directors.
26.2.6 Related-party agreementsAny agreement entered into (directly, indirectly or through an intermediary) between the Company and its Chief Executive Officer, one of the Senior Executive Vice Presidents, any of the members of the Board of Directors or one of its shareholders holding a fraction of the voting rights greater than 10 % or, if it is a Company shareholder, the company that controls it in the meaning of Article L. 233-3 of the Commercial Code, must receive the prior authorization of the Board of Directors. Conventions between the Company and another company, if the Chief Executive Officer, one of the Senior Executive Vice Presidents or one of the directors of the Company is an owner, indefinitely responsible partner, manager, director, member of the Board of Directors or, in general, a director of this company, are also subject to prior authorization. Such prior approval does not apply to conventions covering standard operations that are concluded in normal conditions.
26.2.7 directors’ compensationThe aggregate amount of directors fees ( jetons de présence) of the Board of Directors is determined at the ordinary general meeting of the shareholders. The Board of Directors then divides this aggregate amount up among its members, by a simple majority vote. In addition, exceptional compensation may be granted to directors in particular for special assignments in committees.
26.2.8 directors’ Age LimitsThe number of Directors who have reached 70 years of age may not exceed one-third of the total number of Directors in office at any time.
26.2.9 Rights, privileges and restrictions attached to shares
voting rights
Each shareholder is entitled to one vote per share at any shareholders’ meeting. No shares carry double voting rights.
Attendance at shareholders’ meetings
All shareholders may participate in general meetings either in person or by proxy. Shareholders may vote in person, by proxy or by mail.
The right of shareholders to participate in general meetings is subject to the recording of their shares on the third business day, zero hour (Paris time), preceding the general meeting: (i) for holders of registered shares in the registered shareholder account held by the Company or on its behalf by an agent appointed by it; and (ii) for holders of bearer shares in the bearer shareholder account held by the accredited financial intermediary with whom such holders have deposited their shares (such financial intermediaries shall deliver to holders of bearer shares a shareholding certificate enabling them to participate in the general meeting).
All shareholders are bound by the decisions of shareholders’ meetings made in accordance with applicable laws and the bylaws.
Information concerning the identity of holders of bearer shares (article 9.3 of the bylaws)
The Group is entitled, at any time, to request central depository to disclose the identity of holders of bearer shares.
Changes to shareholders’ rights
Any amendment to the bylaws, which set out the rights attached to the shares, must be approved by a two-thirds majority at an extraordinary shareholders’ meeting. A unanimous shareholder vote is required to increase the liabilities of shareholders.
26 . Legal information26.2 Provisions of the articles of association

Atos Origin » Annual Report 2009 » 220
Conditions governing the means for calling annual shareholders’ meetings and extraordinary shareholders’ meetings, including the conditions for admission to such meetings (Articles 34 and 35 of the bylaws)
Shareholders’ meetings are considered to be “Extraordinary” when the decisions relate to a change in the bylaws or Company’s nationality or where required by law, and “Ordinary” in all other cases.
Shareholders’ meetings are called and conducted in accordance with the terms and conditions of French law.
Meetings are held at the corporate headquarters or at any other place
Shareholders’ meetings are chaired by the Chairman of the Board of Directors, or, in his absence by a Director specially appointed for this purpose by the Board of Directors. Failing all of the above, the Shareholders’ Meeting can elect its own Chairman.
Article of associations’ provisions setting the threshold above which any shareholding must be disclosed (notices that must be made to the company - Article 10 of the bylaws)
In addition to the thresholds defined by applicable laws and regulations, all private individuals and legal entities, acting alone or in concert, who acquire or cease to hold, directly or indirectly, a fraction of the share capital equal to or greater than 2% or, following a shareholding of 2%, a multiple of 1% are required to inform the Company, by registered letter with return receipt requested, within 5 days from the date on which one of these thresholds is crossed, of the total number of shares held directly, indirectly or in concert.
Failure to comply with the above requirements results in rescission of the voting rights attached to those shares relating to the unreported fraction at all Shareholders’ Meetings held during a two-year period following the date or filing of the aforementioned notice. Application of this penalty is subject to a request by one or more shareholders holding at least 5% of the Company’s share capital.
The same information obligation applies, within the same delays and same conditions, each time fraction of the share capital or voting rights of a shareholder decreases to less than one of the above-mentioned thresholds.
26.2.10 Financial statements
Legal Reserve
5% of the unconsolidated statutory net profit for each year has to be allocated to the legal reserve fund before dividends may be paid with respect to that year. Funds must be allocated until the amount in the legal reserve is equal to 10% of the aggregate par value of the issued and outstanding share capital.
Approval of dividends
Dividend payments are approved by general shareholders’ meeting, in accordance with articles L. 232-12 to 232-18 of the French Commercial Code.
26.2.11 Other commitmentsPotential commitments with shareholders are described in the “Common stock evolution and performance” of this report.
26.2.12 Control of the issuerNo provisions in the Articles of association, or in any charter or regulations of the Compagny allow for the delay, the deferral or prevention of a change of control of the Company.
26 . Legal information26.2 Provisions of the articles of association

Atos Origin » Annual Report 2009 » 221www.atosorigin.com
26.3 Board of directors
Since 10 February 2009, the Company operates as a ”Société Anonyme” with a Board of Directors.
Chairman and Chief Executive Officer Thierry BretonAppointed: Board of Directors meeting of 10 February 2009Term expires: Annual General Meeting deciding on the accounts of the year 2011
Background: Graduate of the Ecole Supérieure ■■
d’Electricité “Supelec” of Paris and of the Institut des Hautes Etudes de Défense Nationale (IHEDN)
Other directorships (at 31 December 2009):■■
General Manager of the Simplified Joint Stock -Company Atos Origin International (France)Director of Carrefour (France) -
Positions held during the last five years:■■
Chairman and Chief Executive Officer of France -Telecom (France)Chairman of the Board of Orange S.A., TSA -(previously Thomson SA)Member of the Supervisory Board of Equant NV, Axa -Director of Thomson (previously Thomson -Multimedia), Schneider Electric, TSA, DEXIA Banque (Belgium)Minister of Economy, Finance and Industry -
Member of the Board of Directors jean-Paul BéchatAppointed: General Meeting of 10 February 2009Term expires: Annual General Meeting deciding on the accounts of the year 2011
Background: Graduated of the Ecole Polytechnique – ■■
Master in Science from Stanford University (USA)
Other positions (as of 31 December 2009):■■
Director of Arsco private company -Director of Alstom and of Sogepa -Member of the Supervisory Board of IMS -Honorary President and member of the GIFAS -Council (Groupement des Industries Françaises Aéronautiques et Spatiales)
Positions held during the last five years:■■
Chairman and Chief Executive Officer of Snecma -Chairman of the Management Board of Safran -Director of Aéroports de Paris (ADP) and of Natexis -
Member of the Board of Directors(representing employee shareholders)Ms. jean FlemingAppointed: General Meeting of 26 May 2009Term expires: Annual General Meeting deciding on the accounts of the year 2011
Background: MSc Human resources (South Bank ■■
University, London) and Business Administration (Hons) in Brunnel University (United Kingdom)
Position held (as of 31 December 2009):■■
Human Resources Director at Atos Origin -in the United Kingdom
Member of the Board of Directorsjean-Philippe ThierryAppointed: General Meeting of 10 February 2009Term expires: Annual General Meeting deciding on the accounts of the year 2011
Background: Master in Politics and Economy (I.E.P. Paris), ■■
Master of Business Administration in Economy (Paris)
Other positions (as of 31 December 2009):■■
Chairman of Allianz France SA -Chairman of Allianz Holding France SAS -Chairman of the Supervisory Board of Euler Hermès -(France) and Mondial Assistance AG (Switzerland)Director of Société Financière Foncière -et de Participations (FFP), PPR (France), Tocqueville Finance SA (France), Tocqueville Finance SAS (France) and Concordia SASCensor of Baron Philippe de Rothschild SA, Eurazeo, -Paris Orleans and Compagnie Financière Saint-Honoré (France)
Positions held during the last five years:■■
Member of the Management Board of Allianz SE -(Germany) Chairman and CEO of AGF Holding (France) -Chairman of AGF Vie, AGF IART, Tocqueville Finance -SA (France), SC Holding SAS, Chateau Larose Trintaudon (France)
26 . Legal information26.3 Board of Directors
Atos Origin » Annual Report 2009 » 222
Chairman of Allianz Holding France SAS -and Tocqueville Finance Holding SASChairman of the Supervisory Board of Atos Origin -(France), Euler Hermès (France), GIE AGF Informatique (France) and Mondial Assistance AG (Switzerland)Chief Executive Officer of AGF SA (France) -Director of AGF RAS Holding (The Netherlands), -Société Financière Foncière et de Participations (FFP), PPR (France), Allianz Global Corporate & Specialty AG (Germany), Allianz Seguros y Reaseguros (Spain)Member of the Supervisory Board of Compagnie -Financière Saint-Honoré (France), Groupe Taittinger, Allianz Nederland Groep (The Netherlands) Censor of Rue Impériale (France) -
Member of the Board of Directors René AbateAppointed: General Meeting of 10 February 2009Term expires: Annual General Meeting deciding on the accounts of the year 2011
Background: Graduate of the “École nationale ■■
des Ponts et Chaussées” and of the Harvard Business School
Other positions (as of 31 December 2009):■■
Member of the Board of Directors of Carrefour -(France) and of LFB (Laboratoire Français du Fractionnement et des Biotechnologies)Board member of L’École Nationale des Ponts -et Chaussées and of “L’ENVOL pour les enfants européens”, non profit associationManaging partner of Delphen Sarl -Senior advisor of The Boston Consulting Group -
Positions held during the last five years:■■
Senior vice-president of Boston Consulting Group, -Chairman of the Group for EuropeMember of the World Executive Committee -
Member of the Board of Directors Behdad AlizadehAppointed: General Meeting of 10 February 2009Term expires: Annual General Meeting deciding on the accounts of the year 2011
Background: MBA from Columbia University – Bachelor ■■
of Science from New York University
Other positions (as of 31 December 2009):■■
President of Pardus Europe SAS -Director of Valeo (France) -Member of the Board of the Governor’s Committee -on Scholastic Achievement
Positions held during the last five years:■■
Managing Director and Head of Merchant Banking -at the Bank of New-YorkDirector of Caliber Collsion Centers and of Mid West -Wholesale Distribution
Member of the Board of Directorsnicolas BazireAppointed: General Meeting of 10 February 2009Term expires: Annual General Meeting deciding on the accounts of the year 2011
Background: Degree from the Naval Academy ■■
and from the French Institute in Political Science in Paris, former student at the Ecole National d’Administration (ENA)
Other positions (as of 31 December 2009):■■
Member of the Supervisory Board of Montaigne -Finance SAS, Semyrhamis SAS, Rothschild & Cie BankVice President of the Supervisory Board -of Les Echos SASManaging Director of Group Arnault SAS -Executive Vice President of Finance Agache SA and -Permanent Representative of Group Arnault SAS, Director of the Financière Agache SADirector of LVMH Moët Hennessy Louis Vuitton SA, -Agache Developpement SA, Europatweb SA, Financiere Agache Private Equity SA, Groupe les Echos SA, LVMH Fashion Group SA, Louis Vuitton for Creation Foundation (Company Foundation), Suez Environnement, Carrefour Group, Tajan SA in France and Go Invest SA (Belgium)
26 . Legal information26.3 Board of Directors
Atos Origin » Annual Report 2009 » 223www.atosorigin.com
Positions held during the last five years:■■
Chairman of Invry SAS, La Tour du Pin SAS, -Société Financière Saint-Nivard SASChairman of the Supervisory Board of LVMH Fashion -Group SAMember of the Supervisory Board of Lyparis SAS, -Sifanor SASExecutive Vice President of Montaigne Participations -et Gestion SADirector of Amec, Ipsos SA, Marignan -Investissements SA
Permanent Representative of:■■
Sifanor SA, director of Agache Developpement SA -Eurofinweb, director or Europatweb France SA -Montaigne Participations et Gestion SA, Chairman -of Gasa Developpement SASMontaigne Participations et Gestion SA, member -of the Supervisory Board of Paul Doumer Automobiles SAS
Member of the Board of Directors Bertrand MeunierAppointed: General Meeting of 10 February 2009Term expires: Annual General Meeting deciding on the accounts of the year 2011
Background: Graduated from the Ecole Polytechnique ■■
- Master degree in Mathematics
Other positions (as of 31 December 2009):■■
Chairman of Financière Le Play SAS -
Positions held during the last five years:■■
Director of Chr. Hansen (Denmark), Gruppo Coin, -Saeco (Italy), Kaufman & Broad, Spie and Yoplait (France), Monier, Xella (Germany), PAI Europe III General Partner, PAI Europe IV General Partner, PAI Europe V General Partner, PAI Syndication GP (Guernsey), PAI Partners (Spain), Perstorp (Sweden), PAI Europe IV UK, United Biscuits (UK)
Member of the Board of Directors Michel ParisAppointed: General Meeting of 10 February 2009Term expires: Annual General Meeting deciding on the accounts of the year 2011
Background: Graduate from Ecole Centrale of Lyon ■■
and from Ecole Supérieure de Commerce de Reims
Other positions (as of 31 December 2009):■■
Director of Gruppo Coin (Italy), Monier, Xella (Germany), -Cortefiel (Spain), Speedy 1 Ltd (UK)
Positions held during the last five years:■■
Director of Saur, Vivarte, Elis (France) -
Member of the Board of DirectorsPasquale PistorioAppointed: General Meeting of 10 February 2009Term expires: Annual General Meeting deciding on the accounts of the year 2011
Background: Graduated in Electrical Engineering from ■■
the Polytechnic School of Turin
Other positions (as of 31 December 2009):■■
Honorary Chairman of SGS-THOMSON -Microelectronics (STMicroelectronics) (Switzerland), Honorary Chairman of ST Foundation (charity organisation) (Switzerland) and of the Kyoto Club (charity organisation) (Italy)Chairman of Sagem Wireless (France) -Independent director of Accent (Luxembourg), -Fiat S.p.A. and Brembo S.p.A (Italy)
Positions held during the last five years:■■
Director, then Chairman of Telecom Italia -Vice-president of Confindustria for innovation -and researchDirector of the Chartered Semiconductor -Manufacturing Ltd (Singapore)
26 . Legal information26.3 Board of Directors

Atos Origin » Annual Report 2009 » 224
Member of the Board of Directors vernon SankeyAppointed: General Meeting of 10 February 2009Term expires: Annual General Meeting deciding on the accounts of the year 2011
Background: Master of Arts in Modern Languages, ■■
Oriel College, Oxford (UK)
Other positions (as of 31 December 2009):■■
Chairman, previously Director, of Firmenich SA -(Switzerland) Chairman, former director, of Harrow School -Entreprises LtdDirector of Zurich Financial Services AG (Switzerland) -Advisory Board member of GLP Llp (UK) -Member of Pi Capital (private equity investment -group) (UK)
Positions held during the last five years:■■
Chairman of Photo-Me International plc (UK), -The Really Effective Development Company Ltd (UK)Deputy Chairman of Beltpacker plc (UK) -Director of Pearson plc (UK), Firmenich (Switzerland), -Zurich Financial Services AG (Switzerland), Cofra AG (Switzerland), Taylor Woodrow Plc (UK), Vividas Group Plc (UK)Board member of Food Standards Agency (FSA) (UK) -Member of Pi Capital (private equity investment -group) (UK)Advisory Board member of GLP Llp (UK), -Proudfoot UK, Korn/Ferry International (US)
Member of the Board of Directors Lionel zinsou-DerlinCoopted by the Board of Directors on 21 january 2010/To be ratified by the General Meeting of 27 May 2010Term expires: Annual General Meeting deciding on the accounts of the year 2011
Background: Professor in Economy and Social ■■
Science – École des Sciences Politiques de Paris graduate – Master in economy History, Bachelor’s degree in Humanities and History – École Normale Supérieure (Ulm) in Humanities
Other positions (as of 31 December 2009):■■
Chairman of the Executive Committee -of PAI Partners SASDirector of PAI Europe III General Partner, PAI Europe -IV General Partner, PAI Europe V General Partner Ltd (Guernesey), Sodima, Yoplait France, Yoplait Marques International and Yoplait SAS (France), CHR Hansen Holding A/S (Denmark) and Kaufman & Broad (France)Manager of Capucine Investissements -and Financière Capucine 3
Positions held during the last five years:■■
Member of the Executive Committee -of PAI Partners SASChairman of Rothschild Middle East Dubaï, -Associate manager of Rothschild & Cie corporate bank
26 . Legal information26.3 Board of Directors
Atos Origin » Annual Report 2009 » 225www.atosorigin.com
Declarations related to the members of the Board of Directors
To the knowledge of Atos Origin, there have been no official public incrimination and/or sanctions taken by statutory or regulatory authorities (including designated professional organisms) against any of the members of the Board of Directors. No court has, over the course of the past five years prevented the members of the Board of Directors from acting as member of an administrative, managing or supervisory body of an issuer or of from participating in the management or oversight of an issuer’s business.
Declarations related to the potential interest and agreements
To the knowledge of Atos Origin, there are no existing service agreements between the members of the Board of Directors and Atos Origin or one of its subsidiaries which would provide for advantages.
To the knowledge of Atos Origin, there are no arrangements, or any type of agreement with the shareholders, clients, service providers or other by which one of the members of the Board of Directors was selected as member of an administrative, managing or supervisory organ or as a member of the general management of Atos Origin.
To the knowledge of Atos Origin, there are no parental relationships between any of the legal representatives of the Company.
26 . Legal information26.3 Board of Directors

Atos Origin » Annual Report 2009 » 226
27 . Common stock evolution and share performance
27.1 Trading of shares (Euronext)
27.1 Trading of shares (Euronext) 22627.2 Common stock 227
27.3 Dividends 23627.4 Share trading performance 237
Number of shares 69,720,462Sector classification Information TechnologyMain index CAC AllSharesOther indices CAC IT, CAC IT20, CAC Next20, Euronext 100, SBF120Market Eurolist segment ATrading place Euronext Paris (France)Tickers ATO (Euronext)Code ISIN FR0000051732Payability PEA/SRD Yes/Yes
The main tickers are:
Source Tickers Source Tickers
Euronext ATO Reuters ATOS.PA
AFP ATO Thomson Finance ATO FR
Bloomberg ATO FP
The Euronext sector classification is as follows:
Euronext: sector classification Industry Classification Benchmark (ICB)9000 AEX Technology9530 AEX Software and Computer services9533 Computer Services
The shares are also components of the following indices:
Indice Type Code ISIn Market PlaceEurolist (segment 1) Global Europe Paris-Amsterdam-Brussels-LisbonEuronext CAC 70 Global Europe Paris-Amsterdam-Brussels-LisbonEuronext 100 Global Europe FR0003502079 Paris-Amsterdam-Brussels-LisbonCAC Next 20 Global QS0010989109 Paris CN20SBF 80 Global FR0003999473 Paris PX8SBF 120 Global FR0003999481 Paris PX4SBF 250 Global FR0003999499 Paris PX5CAC IT20 Sector QS0010989091 Paris CIT20CAC IT Sector FR0003501980 Paris PXTDJ Euro Stoxx Techno Sector EUR0009658541 Germany-Xetra SX8ECAC Technology Sector QS0011017827 ParisCAC Software & Computer Services Sector FR0000051732 ParisASPI Europe, Europa EMP 100 Europa CAP 100, ECPI Ethical Index Euro: Sustainable Development
Atos Origin shares are traded on the Paris Eurolist Market under Euroclear code 5173 ISIN FR0000051732. They were first listed in Paris in 1995. The shares are not listed on any
other stock exchange and Atos Origin SA is the only listed company in the Group.

Atos Origin » Annual Report 2009 » 227www.atosorigin.com
27.2 Common stock
27.2.1 Common stock at 31 december 2009At 31 December 2009, the Group’s issued common stock amounted to EUR 69.7 million, comprising 69,720,462 fully paid-up shares of EUR 1.00 per value each.
After the issuing of 3,009 new shares which resulted from the exercise of stock subscription options, the common stock of the Company remained stable at 31 December 2009 compared to the end of 2008.
Transactionsnumber
of shares issuedCommon stock (in EUR million)
Additional paid-in capital
(in EUR million)Total
(in EUR million)
At 31 December 2008 69,717,453 69.7 1,409.7 1,479.5
Exercise of stock options 3,009 - 0.1 0.1
At 31 December 2009 69,720,462 69.7 1,409.8 1,479.5
27.2.2 Common stock during the last five years
YearChanges in Common stock Date new shares
Total number
of shares
Common stock
Additional paid-in capital
new Common
stock
In millions of euros
2005 Exercise of stock options 31/03/2005 222,499 67,160,753 0.2 7.2 67.2
Exercise of stock options 30/06/2005 78,260 67,239,013 0.1 1.9 67.2
Exercise of stock options 30/09/2005 91,253 67,330,266 0.1 2.6 67.3
Exercise of stock options 31/12/2005 33,199 67,363,465 - 1.0 67.4
2006 Exercise of stock options 31/03/2006 144,022 67,507,487 0.1 5.3 67.5
Exercise of stock options 30/06/2006 31,645 67,539,132 - 0.9 67.5
Exercise of stock options 30/09/2006 85,844 67,624,976 0.1 2.1 67.6
Stock purchase plan 20/12/2006 1,230,757 68,855,733 1.2 42.0 68.9
Exercise of stock options 31/12/2006 25,232 68,880,965 - 1.0 68.9
2007 Exercise of stock options 31/03/2007 23,624 68,904,589 - 0.6 68.9
Exercise of stock options 30/06/2007 79,229 68,983,818 0.1 2.0 69.0
Exercise of stock options 30/09/2007 21,753 69,005,571 - 0.5 69.0
Stock purchase plan 20/12/2007 693,439 69,699,010 0.7 21.9 69.7
Exercise of stock options 31/12/2007 11,144 69,710,154 - 0.3 69.7
2008 Exercise of stock options 31/03/2008 1,708 69,711,862 - - 69.7
Exercise of stock options 30/06/2008 2,746 69,714,608 - 0.1 69.7
Exercise of stock options 31/12/2008 2,845 69,717,453 - 0.1 69.7
2009 Exercise of stock options 31/12/2009 3,009 69,720,462 - 0.1 69.7
A total of 3,009 stock options were exercised during the period, representing 0.04% of the total number of stock options at 31 December 2008.
27 . Common stock evolution and share performance27.2 Common stock

Atos Origin » Annual Report 2009 » 228
27 . Common stock evolution and share performance27.2 Common stock
27.2.3 Share ownership structurePrincipal changes in the ownership of the Group’s shares in the past three years have been as follows:
In shares
31 December 2009 31 December 2008 31 December 2007
Shares % Shares % Shares %
PAI Partners 15,765,838 22.6% 15,765,838 22.6% - -
Pardus 7,000,004 10.0% 7,000,004 10.0% 6,700,000 9.6%
Centaurus 1,332,140 1.9% 3,492,119 5.0% 7,110,506 10.2%
Management Board - - 33,785 0.0% 43,809 0.1%
Supervisory Board - - 10,721 0.0% 2,040 0.0%
Board of Directors 14,938 0.0% - - - -
Total Directors 14,938 0.0% 44,506 0.1% 45,849 0.1%
Employees 2,279,112 3.3% 2,119,700 3.0% 2,164,216 3.1%
Treasury stock 652,152 0.9% 1,111,293 1.6% 705,293 1.0%
Public 42,676,278 61.2% 40,183,993 57.6% 52,984,290 76.0%
TOTAL 69,720,462 100.0% 69,717,453 100.0% 69,710,154 100.0%
Registered shares 1,629,770 2.3% 1,703,175 2.4% 1,664,916 2.4%
Bearer shares 68,090,692 97.7% 68,014,278 97.6% 68,045,238 97.6%
TOTAL 69,720,462 100.0% 69,717,453 100.0% 69,710,154 100.0%
The share ownership of the Group’s Board of Directors at 31 December 2009 is detailed in section 24.1 (“Report by the Chairman of the Board of Directors on Corporate Governance and Internal Control”) in the Corporate Governance section of the Annual Report (i.e. 24). The Group’s shares which are owned by employees are mainly managed by mutual funds and a corporate savings plan, the other part represents the grant of performance options which are unavailable during a period of two years.
The treasury stock evolution is explained hereafter under ”Treasury stock and liquidity contract”.
The free-float of the Group’s shares is almost 100% today, with no shareholder owning more than 5% of the issued capital of the Group, for the last three years and whose position has not moved by one percentage point or more (Euronext definition).
In shares
31 December 2009 31 December 2008
Shares % of capital % of voting rights Shares % of capital % of voting rights
Treasury stock 652,152 0.9% 1,111,293 1.6%
Free float 69,068,310 99.1% 100.0% 68,606,160 98.4% 100.0%
TOTAL 69,720,462 100.0% 100.0% 69,717,453 100.0% 100.0%
Over the year 2009, the Group has been advised of several share movements downwards from Centaurus Capital. PAI Partners, Pardus Capital, Centaurus Capital, Directors and employees ownership are all classified under free-float.

Atos Origin » Annual Report 2009 » 229www.atosorigin.com
27 . Common stock evolution and share performance27.2 Common stock
27.2.4 disclosure of interestsDuring 2009, the Group has been advised of downwards share movements from Centaurus Capital which held 5.01% of share capital as at 6 January 2009 reducing its ownership down to 1.91% of share capital as at 31 December. On 18 January 2010, Fidelity Investments advised the Group that its ownership of the company’s share capital amounted to 5.02%.
Date of statement Shares % interest (a) % voting rights (b)
Centaurus Capital LP (downwards) 06/01/2009 3,493,119 5.01% 5.01%
Centaurus Capital LP (downwards) 31/03/2009 3,459,358 4.96% 4.96%
Centaurus Capital LP (downwards) 09/04/2009 2,785,604 3.99% 3.99%
Centaurus Capital LP (downwards) 22/04/2009 1,982,296 2.84% 2.84%
Centaurus Capital LP (downwards) 21/05/2009 1,332,140 1.91% 1.91%
Fidelity Investments (upwards) 18/01/2010 3,498,744 5.02% 5.02%
(a) On the basis of the capital at this date. (b) On the basis of the capital excluding treasury stock at this date.
The Group has not been advised of any share movement since this date.
27.2.5 Voting rightsVoting rights are in the same proportion as shares held. No shares carry double voting rights.
27.2.6 Shareholder agreementsThe Group has not received notice of any shareholder agreements for filing with the stock exchange authorities and, to the best knowledge of the Group Management, no other “Action de Concert” (shareholder agreements) or similar agreements exist.
To the knowledge of the Group, there are no other agreements capable of having a material effect on the share capital of the Group.
27.2.7 Treasury stock and liquidity contractAtos Origin entrusted to Rothschild & Cie Banque the implementation of a liquidity contract through an agreement dated 13 February 2006, for a one-year duration with automatic renewal, in conformity with the ethics charter of the AMAFI (Association Française des Marchés Financiers) – former AFEI - approved by the instruction of the Commission des Opérations de Bourse (COB) dated 10 April 2001.
In shares 31/12/08March
2009April 2009
May 2009
june 2009
july 2009
August 2009
October 2009
november 2009
December 2009
Buy (Year-to-date)
925 5,925 15,925 31,925 52,017 53,517 53,517 116,017 133,517
Sell (Year-to-date)
(71,425) (71,425) (102,425) (210,017) (211,517) (241,517) (251,517) (331,517)
Net (Year-to-date)
925 (65,500) (55,500) (70,500) (158,000) (158,000) (188,000) (135,500) (198,000)
Net in the month 925 (66,425) 10,000 (15,000) (87,500) (30,000) 52,500 (62,500)
LTI / MIP (in the month)
(92,605) (168,125) (411)
Treasury stock 1,111,293 1,112,218 1,045,793 1,055,793 948,188 692,563 692,563 662,152 714,652 652,152
Common stock 69,717,453 69,717,453 69,717,453 69,717,453 69,717,453 69,717,453 69,719,177 69,719,177 69,719,437 69,720,462
% 1.59% 1.60% 1.50% 1.51% 1.36% 0.99% 0.99% 0.95% 1.03% 0.94%

Atos Origin » Annual Report 2009 » 230
For the implementation of this contract, EUR 15 million were allocated to the liquidity account at the beginning.
At 31 December 2009, the Group held 652,152 shares as treasury out of which 80,000 shares are related to the liquidity contract and the remaining 572,152 shares correspond to the LTI and MIP plans engagements. The risk on common stock is limited to treasury stock.
On average, in 2009, the transaction stock prices have amounted to:- EUR 26.36 per stock for the purchase of treasury stock;- EUR 27.24 per stock for the sale of treasury stock.
At 31 December 2009, treasury stock held by the Group amounted to 652,152 shares with nominal value of EUR 1.00 per share, representing. 0.9% of the common stock, with a book value of EUR 22,778,036.
The 6th resolution of the Annual General Meeting of 26 May 2009 renewed the authorisation to trade in the Group’s shares. The number of shares purchased may not exceed 10% of the share capital existing at the moment of the date of the Annual General Meeting ( i.e. 6,971,745 shares, or 10% of the existing share capital on 26 May 2009). These purchases could be carried out by virtue of any allocation permitted by law,az with the a ims of th is share repurchase programme being:
to maintain them or subsequently use them for payment ■■
or exchange within the context of possible external growth operations, in observance of the market practices accepted by the AMF, to promote liquidity of transactions and the regularity of ■■
prices of the company’s shares or to avoid price discrepancies not justified by the market trend within the context of a liquidity contract concluded with an investment service provider in complete independence, in observance of the market practices accepted by the AMF and the AMAFI (formerly AFEI) business ethics charter dated 1 October 2008 regarding liquidity contracts,
to attribute these to the representatives or employees of ■■
the Company and/or companies within its group, under the conditions and according to the procedures established by the legal and regulatory provisions applicable within the context (i) of the participation in the benefits of expansion of the company, (ii) of the share option regime established by articles L. 225-179 and seq. of the Commercial Code, (iii) of the free share issuance regime established by articles L. 225-197-1 to L. 225-197-3 of the Commercial Code and (iv) of a company savings plan, as well as to carry out all hedging operations relating to these operations, under the conditions established by market authorities and during periods when the board of directors or person acting as its representative so decides, to tender these at the time of exercise of the rights ■■
attached to securities giving the right, whether immediate or deferred, by reimbursement, conversion, exchange, presentation of a warrant or any other form of attribution of the shares of the Company, as well as to carry out all hedging operations with regard to the issuance of such securities, under the conditions established by market authorities and during periods when the board of directors or person acting as its representative so decides, orto cancel them as a whole or in part through a reduction ■■
of the share capital by way of application of the twelfth resolution of the mixed general meeting of shareholders of 3 June 2005.
The maximum purchase price may not exceed EUR 31.05 (net of fees) per share.
The Board of Directors may nevertheless adjust the aforementioned purchase pr ice in the event of incorporation of premiums, reserves or profits, giving rise either to an increase in the nominal value of the shares or to the creation and attribution of free shares, as well as in the event of division of the nominal value of the share or regrouping of the shares to take account of the effect of these operations on the value of the share.This authorisation is given for a period of eighteen months, starting from 26 May 2009.
Legal documents relating to trading in the Group’s shares may be viewed at the Group’s registered office (Legal Department) by prior appointment and are available through the AMF database.
27 . Common stock evolution and share performance27.2 Common stock

Atos Origin » Annual Report 2009 » 231www.atosorigin.com
27.2.8 Potential common stock
Potential dilution
Based on 69,720,462 shares in issue, the common stock of the Group could be increased by 10,310,776 new shares, representing 12.9% of the common stock after dilution. This dilution can occur only through the exercise of stock subscription options granted to employees, as such:
In shares31 December
200931 December
2008 Change % dilution EUR million
number of shares outstanding 69,720,462 69,717,453 3,009
Stock subscription options 10,310,776 7,153,540 3,157,236 12.9% 446.0
Total employees 10,310,776 7,153,540 3,157,236 12.9% 446.0
TOTAL POTEnTIAL COMMOn STOCK 80,031,238 76,870,993 3,160,245
The exercise of all the options would have the effect of increasing total shareholders’ equity by EUR 446.0 million and common stock by EUR 10.3 million.
However, 56% of the total number of stock options granted to employees has a strike price that exceeds the stock market price as at 31 December 2009 (EUR 32.09).
Stock options evolution
During the period, 3,537,500 new stock subscription options were granted to employees at a share price of EUR 28.18.
number of stock subscription options at 31 Dec. 2008 7,153,540
Stock subscription options granted in 2009 +3,537,500
Stock subscription options exercised in 2009 -3,009
Stock subscription options forfeited in 2009 -142,555
Stock subscription options expired in 2009 -234,700
nUMBER OF STOCK SUBSCRIPTIOn OPTIOnS AT 31 DEC. 2009 10,310,776
A total of 377,255 stock subscription options were cancelled (i.e. forfeited or expired) in 2009 and 3,009 were exercised.
27 . Common stock evolution and share performance27.2 Common stock
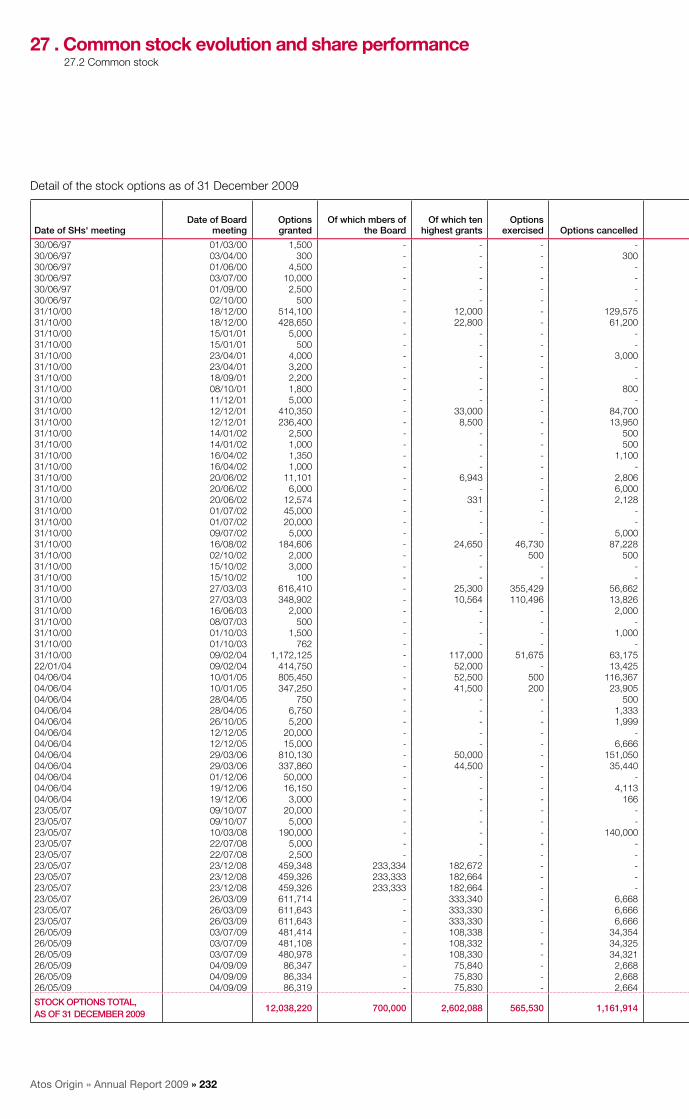
Atos Origin » Annual Report 2009 » 232
27 . Common stock evolution and share performance27.2 Common stock
Detail of the stock options as of 31 December 2009
Date of SHs' meetingDate of Board
meetingOptions granted
Of which mbers of the Board
Of which ten highest grants
Options exercised Options cancelled
Closing 31/12/09 Of which mbers of the Board
numbers of beneficiaries
Exercise period start date
Exercise period end
dateStrike Price
(EUR)Cash
(EUR million)
30/06/97 01/03/00 1,500 - - - - 1,500 - 2 01/03/05 01/03/10 159.94 0.230/06/97 03/04/00 300 - - - 300 - - 1 03/04/05 03/04/10 153.82 -30/06/97 01/06/00 4,500 - - - - 4,500 - 5 01/06/04 01/06/10 110.15 0.530/06/97 03/07/00 10,000 - - - - 10,000 - 1 03/07/04 03/07/10 106.67 1.130/06/97 01/09/00 2,500 - - - - 2,500 - 2 01/09/04 01/09/10 109.50 0.330/06/97 02/10/00 500 - - - - 500 - 1 02/10/04 02/10/10 112.97 0.131/10/00 18/12/00 514,100 - 12,000 - 129,575 384,525 - 385 18/12/03 18/12/10 78.27 30.131/10/00 18/12/00 428,650 - 22,800 - 61,200 367,450 - 479 18/12/04 18/12/10 78.27 28.831/10/00 15/01/01 5,000 - - - - 5,000 - 2 15/01/04 15/01/11 76.23 0.431/10/00 15/01/01 500 - - - - 500 - 1 15/01/05 15/01/11 76.23 -31/10/00 23/04/01 4,000 - - - 3,000 1,000 - 3 23/04/04 23/04/11 84.33 0.131/10/00 23/04/01 3,200 - - - - 3,200 - 3 23/04/05 23/04/11 84.33 0.331/10/00 18/09/01 2,200 - - - - 2,200 - 1 18/09/05 18/09/11 80.71 0.231/10/00 08/10/01 1,800 - - - 800 1,000 - 3 08/10/04 08/10/11 74.06 0.131/10/00 11/12/01 5,000 - - - - 5,000 - 1 11/12/04 11/12/11 79.36 0.431/10/00 12/12/01 410,350 - 33,000 - 84,700 325,650 - 774 12/12/04 12/12/11 79.04 25.731/10/00 12/12/01 236,400 - 8,500 - 13,950 222,450 - 522 12/12/05 12/12/11 79.04 17.631/10/00 14/01/02 2,500 - - - 500 2,000 - 2 14/01/05 14/01/12 75.17 0.231/10/00 14/01/02 1,000 - - - 500 500 - 2 14/01/06 14/01/12 75.17 -31/10/00 16/04/02 1,350 - - - 1,100 250 - 3 16/04/05 16/04/12 87.51 -31/10/00 16/04/02 1,000 - - - - 1,000 - 1 16/04/06 16/04/12 87.51 0.131/10/00 20/06/02 11,101 - 6,943 - 2,806 8,295 - 815 20/06/05 20/06/12 63.06 0.531/10/00 20/06/02 6,000 - - - 6,000 - - 4 20/06/05 20/06/12 63.06 -31/10/00 20/06/02 12,574 - 331 - 2,128 10,446 - 1,536 20/06/06 20/06/12 63.06 0.731/10/00 01/07/02 45,000 - - - - 45,000 - 4 01/07/05 01/07/12 62.32 2.831/10/00 01/07/02 20,000 - - - - 20,000 - 2 01/07/06 01/07/12 62.32 1.231/10/00 09/07/02 5,000 - - - 5,000 - - 3 09/07/06 09/07/12 61.49 -31/10/00 16/08/02 184,606 - 24,650 46,730 87,228 50,648 - 146 16/08/05 16/08/12 41.52 2.131/10/00 02/10/02 2,000 - - 500 500 1,000 - 4 02/10/05 02/10/12 41.52 -31/10/00 15/10/02 3,000 - - - - 3,000 - 1 15/10/05 15/10/12 26.02 0.131/10/00 15/10/02 100 - - - - 100 - 1 15/10/06 15/10/12 26.02 -31/10/00 27/03/03 616,410 - 25,300 355,429 56,662 204,319 - 1,447 01/01/05 27/03/13 25.92 5.331/10/00 27/03/03 348,902 - 10,564 110,496 13,826 224,580 - 3,444 27/03/07 27/03/13 25.92 5.831/10/00 16/06/03 2,000 - - - 2,000 - - 2 16/06/07 16/06/13 30.88 -31/10/00 08/07/03 500 - - - - 500 - 1 08/07/06 08/07/13 31.81 -31/10/00 01/10/03 1,500 - - - 1,000 500 - 2 01/10/06 01/10/13 49.87 -31/10/00 01/10/03 762 - - - - 762 - 1 01/10/07 01/10/13 49.87 -31/10/00 09/02/04 1,172,125 - 117,000 51,675 63,175 1,057,275 - 1,220 01/01/06 09/02/14 54.14 57.222/01/04 09/02/04 414,750 - 52,000 - 13,425 401,325 - 686 09/02/08 09/02/14 54.14 21.704/06/04 10/01/05 805,450 - 52,500 500 116,367 688,583 - 803 10/01/08 10/01/15 49.75 34.304/06/04 10/01/05 347,250 - 41,500 200 23,905 323,145 - 567 10/01/09 10/01/15 49.75 16.104/06/04 28/04/05 750 - - - 500 250 - 1 28/04/08 28/04/15 49.98 -04/06/04 28/04/05 6,750 - - - 1,333 5,417 - 5 28/04/09 28/04/15 49.98 0.304/06/04 26/10/05 5,200 - - - 1,999 3,201 - 3 26/10/09 26/10/15 58.04 0.204/06/04 12/12/05 20,000 - - - - 20,000 - 1 12/12/08 12/12/15 57.07 1.104/06/04 12/12/05 15,000 - - - 6,666 8,334 - 1 12/12/09 12/12/15 57.07 0.504/06/04 29/03/06 810,130 - 50,000 - 151,050 659,080 - 828 29/03/09 29/03/16 59.99 39.504/06/04 29/03/06 337,860 - 44,500 - 35,440 302,420 - 420 29/03/10 29/03/16 59.99 18.104/06/04 01/12/06 50,000 - - - - 50,000 - 1 01/12/10 01/12/16 43.87 2.204/06/04 19/12/06 16,150 - - - 4,113 12,037 - 24 19/12/09 19/12/16 43.16 0.504/06/04 19/12/06 3,000 - - - 166 2,834 - 6 19/12/10 19/12/16 43.16 0.123/05/07 09/10/07 20,000 - - - - 20,000 - 1 09/10/10 09/10/17 40.35 0.823/05/07 09/10/07 5,000 - - - - 5,000 - 1 09/10/11 09/10/17 40.35 0.223/05/07 10/03/08 190,000 - - - 140,000 50,000 - 3 10/03/14 10/03/18 34.73 1.723/05/07 22/07/08 5,000 - - - - 5,000 - 1 22/07/11 22/07/18 34.72 0.223/05/07 22/07/08 2,500 - - - - 2,500 - 1 22/07/12 22/07/18 34.72 0.123/05/07 23/12/08 459,348 233,334 182,672 - - 459,348 233,334 24 01/04/10 31/03/18 18.40 8.523/05/07 23/12/08 459,326 233,333 182,664 - - 459,326 233,333 24 01/04/11 31/03/18 22.00 10.123/05/07 23/12/08 459,326 233,333 182,664 - - 459,326 233,333 24 01/04/12 31/03/18 26.40 12.123/05/07 26/03/09 611,714 - 333,340 - 6,668 605,046 - 74 01/07/10 30/06/18 20.64 12.523/05/07 26/03/09 611,643 - 333,330 - 6,666 604,977 - 74 01/07/11 30/06/18 24.57 14.923/05/07 26/03/09 611,643 - 333,330 - 6,666 604,977 - 74 01/07/12 30/06/18 29.49 17.826/05/09 03/07/09 481,414 - 108,338 - 34,354 447,060 - 438 01/07/10 30/06/18 25.00 11.226/05/09 03/07/09 481,108 - 108,332 - 34,325 446,783 - 438 01/07/11 30/06/18 30.00 13.426/05/09 03/07/09 480,978 - 108,330 - 34,321 446,657 - 438 01/07/12 30/06/18 35.00 15.626/05/09 04/09/09 86,347 - 75,840 - 2,668 83,679 - 24 01/07/10 30/06/18 34.28 2.926/05/09 04/09/09 86,334 - 75,830 - 2,668 83,666 - 24 01/07/11 30/06/18 40.81 3.426/05/09 04/09/09 86,319 - 75,830 - 2,664 83,655 - 24 01/07/12 30/06/18 48.97 4.1
STOCK OPTIOnS TOTAL, AS OF 31 DECEMBER 2009
12,038,220 700,000 2,602,088 565,530 1,161,914 10,310,776 700,000 446.0

Atos Origin » Annual Report 2009 » 233www.atosorigin.com
27 . Common stock evolution and share performance27.2 Common stock
Date of SHs' meetingDate of Board
meetingOptions granted
Of which mbers of the Board
Of which ten highest grants
Options exercised Options cancelled
Closing 31/12/09 Of which mbers of the Board
numbers of beneficiaries
Exercise period start date
Exercise period end
dateStrike Price
(EUR)Cash
(EUR million)
30/06/97 01/03/00 1,500 - - - - 1,500 - 2 01/03/05 01/03/10 159.94 0.230/06/97 03/04/00 300 - - - 300 - - 1 03/04/05 03/04/10 153.82 -30/06/97 01/06/00 4,500 - - - - 4,500 - 5 01/06/04 01/06/10 110.15 0.530/06/97 03/07/00 10,000 - - - - 10,000 - 1 03/07/04 03/07/10 106.67 1.130/06/97 01/09/00 2,500 - - - - 2,500 - 2 01/09/04 01/09/10 109.50 0.330/06/97 02/10/00 500 - - - - 500 - 1 02/10/04 02/10/10 112.97 0.131/10/00 18/12/00 514,100 - 12,000 - 129,575 384,525 - 385 18/12/03 18/12/10 78.27 30.131/10/00 18/12/00 428,650 - 22,800 - 61,200 367,450 - 479 18/12/04 18/12/10 78.27 28.831/10/00 15/01/01 5,000 - - - - 5,000 - 2 15/01/04 15/01/11 76.23 0.431/10/00 15/01/01 500 - - - - 500 - 1 15/01/05 15/01/11 76.23 -31/10/00 23/04/01 4,000 - - - 3,000 1,000 - 3 23/04/04 23/04/11 84.33 0.131/10/00 23/04/01 3,200 - - - - 3,200 - 3 23/04/05 23/04/11 84.33 0.331/10/00 18/09/01 2,200 - - - - 2,200 - 1 18/09/05 18/09/11 80.71 0.231/10/00 08/10/01 1,800 - - - 800 1,000 - 3 08/10/04 08/10/11 74.06 0.131/10/00 11/12/01 5,000 - - - - 5,000 - 1 11/12/04 11/12/11 79.36 0.431/10/00 12/12/01 410,350 - 33,000 - 84,700 325,650 - 774 12/12/04 12/12/11 79.04 25.731/10/00 12/12/01 236,400 - 8,500 - 13,950 222,450 - 522 12/12/05 12/12/11 79.04 17.631/10/00 14/01/02 2,500 - - - 500 2,000 - 2 14/01/05 14/01/12 75.17 0.231/10/00 14/01/02 1,000 - - - 500 500 - 2 14/01/06 14/01/12 75.17 -31/10/00 16/04/02 1,350 - - - 1,100 250 - 3 16/04/05 16/04/12 87.51 -31/10/00 16/04/02 1,000 - - - - 1,000 - 1 16/04/06 16/04/12 87.51 0.131/10/00 20/06/02 11,101 - 6,943 - 2,806 8,295 - 815 20/06/05 20/06/12 63.06 0.531/10/00 20/06/02 6,000 - - - 6,000 - - 4 20/06/05 20/06/12 63.06 -31/10/00 20/06/02 12,574 - 331 - 2,128 10,446 - 1,536 20/06/06 20/06/12 63.06 0.731/10/00 01/07/02 45,000 - - - - 45,000 - 4 01/07/05 01/07/12 62.32 2.831/10/00 01/07/02 20,000 - - - - 20,000 - 2 01/07/06 01/07/12 62.32 1.231/10/00 09/07/02 5,000 - - - 5,000 - - 3 09/07/06 09/07/12 61.49 -31/10/00 16/08/02 184,606 - 24,650 46,730 87,228 50,648 - 146 16/08/05 16/08/12 41.52 2.131/10/00 02/10/02 2,000 - - 500 500 1,000 - 4 02/10/05 02/10/12 41.52 -31/10/00 15/10/02 3,000 - - - - 3,000 - 1 15/10/05 15/10/12 26.02 0.131/10/00 15/10/02 100 - - - - 100 - 1 15/10/06 15/10/12 26.02 -31/10/00 27/03/03 616,410 - 25,300 355,429 56,662 204,319 - 1,447 01/01/05 27/03/13 25.92 5.331/10/00 27/03/03 348,902 - 10,564 110,496 13,826 224,580 - 3,444 27/03/07 27/03/13 25.92 5.831/10/00 16/06/03 2,000 - - - 2,000 - - 2 16/06/07 16/06/13 30.88 -31/10/00 08/07/03 500 - - - - 500 - 1 08/07/06 08/07/13 31.81 -31/10/00 01/10/03 1,500 - - - 1,000 500 - 2 01/10/06 01/10/13 49.87 -31/10/00 01/10/03 762 - - - - 762 - 1 01/10/07 01/10/13 49.87 -31/10/00 09/02/04 1,172,125 - 117,000 51,675 63,175 1,057,275 - 1,220 01/01/06 09/02/14 54.14 57.222/01/04 09/02/04 414,750 - 52,000 - 13,425 401,325 - 686 09/02/08 09/02/14 54.14 21.704/06/04 10/01/05 805,450 - 52,500 500 116,367 688,583 - 803 10/01/08 10/01/15 49.75 34.304/06/04 10/01/05 347,250 - 41,500 200 23,905 323,145 - 567 10/01/09 10/01/15 49.75 16.104/06/04 28/04/05 750 - - - 500 250 - 1 28/04/08 28/04/15 49.98 -04/06/04 28/04/05 6,750 - - - 1,333 5,417 - 5 28/04/09 28/04/15 49.98 0.304/06/04 26/10/05 5,200 - - - 1,999 3,201 - 3 26/10/09 26/10/15 58.04 0.204/06/04 12/12/05 20,000 - - - - 20,000 - 1 12/12/08 12/12/15 57.07 1.104/06/04 12/12/05 15,000 - - - 6,666 8,334 - 1 12/12/09 12/12/15 57.07 0.504/06/04 29/03/06 810,130 - 50,000 - 151,050 659,080 - 828 29/03/09 29/03/16 59.99 39.504/06/04 29/03/06 337,860 - 44,500 - 35,440 302,420 - 420 29/03/10 29/03/16 59.99 18.104/06/04 01/12/06 50,000 - - - - 50,000 - 1 01/12/10 01/12/16 43.87 2.204/06/04 19/12/06 16,150 - - - 4,113 12,037 - 24 19/12/09 19/12/16 43.16 0.504/06/04 19/12/06 3,000 - - - 166 2,834 - 6 19/12/10 19/12/16 43.16 0.123/05/07 09/10/07 20,000 - - - - 20,000 - 1 09/10/10 09/10/17 40.35 0.823/05/07 09/10/07 5,000 - - - - 5,000 - 1 09/10/11 09/10/17 40.35 0.223/05/07 10/03/08 190,000 - - - 140,000 50,000 - 3 10/03/14 10/03/18 34.73 1.723/05/07 22/07/08 5,000 - - - - 5,000 - 1 22/07/11 22/07/18 34.72 0.223/05/07 22/07/08 2,500 - - - - 2,500 - 1 22/07/12 22/07/18 34.72 0.123/05/07 23/12/08 459,348 233,334 182,672 - - 459,348 233,334 24 01/04/10 31/03/18 18.40 8.523/05/07 23/12/08 459,326 233,333 182,664 - - 459,326 233,333 24 01/04/11 31/03/18 22.00 10.123/05/07 23/12/08 459,326 233,333 182,664 - - 459,326 233,333 24 01/04/12 31/03/18 26.40 12.123/05/07 26/03/09 611,714 - 333,340 - 6,668 605,046 - 74 01/07/10 30/06/18 20.64 12.523/05/07 26/03/09 611,643 - 333,330 - 6,666 604,977 - 74 01/07/11 30/06/18 24.57 14.923/05/07 26/03/09 611,643 - 333,330 - 6,666 604,977 - 74 01/07/12 30/06/18 29.49 17.826/05/09 03/07/09 481,414 - 108,338 - 34,354 447,060 - 438 01/07/10 30/06/18 25.00 11.226/05/09 03/07/09 481,108 - 108,332 - 34,325 446,783 - 438 01/07/11 30/06/18 30.00 13.426/05/09 03/07/09 480,978 - 108,330 - 34,321 446,657 - 438 01/07/12 30/06/18 35.00 15.626/05/09 04/09/09 86,347 - 75,840 - 2,668 83,679 - 24 01/07/10 30/06/18 34.28 2.926/05/09 04/09/09 86,334 - 75,830 - 2,668 83,666 - 24 01/07/11 30/06/18 40.81 3.426/05/09 04/09/09 86,319 - 75,830 - 2,664 83,655 - 24 01/07/12 30/06/18 48.97 4.1
STOCK OPTIOnS TOTAL, AS OF 31 DECEMBER 2009
12,038,220 700,000 2,602,088 565,530 1,161,914 10,310,776 700,000 446.0

Atos Origin » Annual Report 2009 » 234
The weighted average strike price of the above-mentioned options is summarised in the table below:
31 December
2009
Weighted average strike
price (EUR)value
(EUR million)
% total stock
options
Strike price from 10€ to 20€ 459,348 18.40 8.5 4%
Strike price from 20€ to 30€ 3,612,711 24.86 89.8 35%
Strike price from 30€ to 40€ 1,035,119 32.77 33.9 10%
Strike price from 40€ to 50€ 1,327,497 48.35 64.1 13%
Strike price from 50€ to 60€ 2,451,635 56.47 138.3 24%
Strike price from 60€ to 70€ 83,741 62.49 5.2 1%
Strike price from 70€ to 80€ 1,314,075 78.58 103.3 13%
Strike price from 80€ to 90€ 7,650 83.81 0.7 0%
Strike price from 90€ to 100€ - - - -
Strike price from 100€ to 110€ 12,500 107.24 1.4 0%
Strike price from 110€ to 120€ 5,000 110.43 0.6 0%
Strike price from 120€ to 130€ - - - -
Strike price from 130€ to 140€ - - - -
Strike price from 140€ to 150€ - - - -
Strike price from 150€ to 160€ 1,500 159.94 0.2 0%
TOTAL STOCK OPTIOnS 10,310,776 43.26 446.0 100%
31 December
2009
Weighted average strike
Price (EUR)value
(EUR million)
% total stock
options
Already exercisable end of 2009 5,088,522 58.20 296.1 49%
Exercisable in 2010 1,970,387 28.55 56.3 19%
Exercisable in 2011 1,604,752 26.27 42.2 16%
Exercisable in 2012 1,597,115 31.17 49.7 15%
Exercisable in 2013 - - - -
Exercisable in 2014 50,000 34.73 1.7 0%
TOTAL STOCK OPTIOnS 10,310,776 43.26 446.0 100%
At the end of 2009, 56% of the total number of stock options granted to employees had a strike price that exceeds the stock market price (EUR 32.09).
27 . Common stock evolution and share performance27.2 Common stock
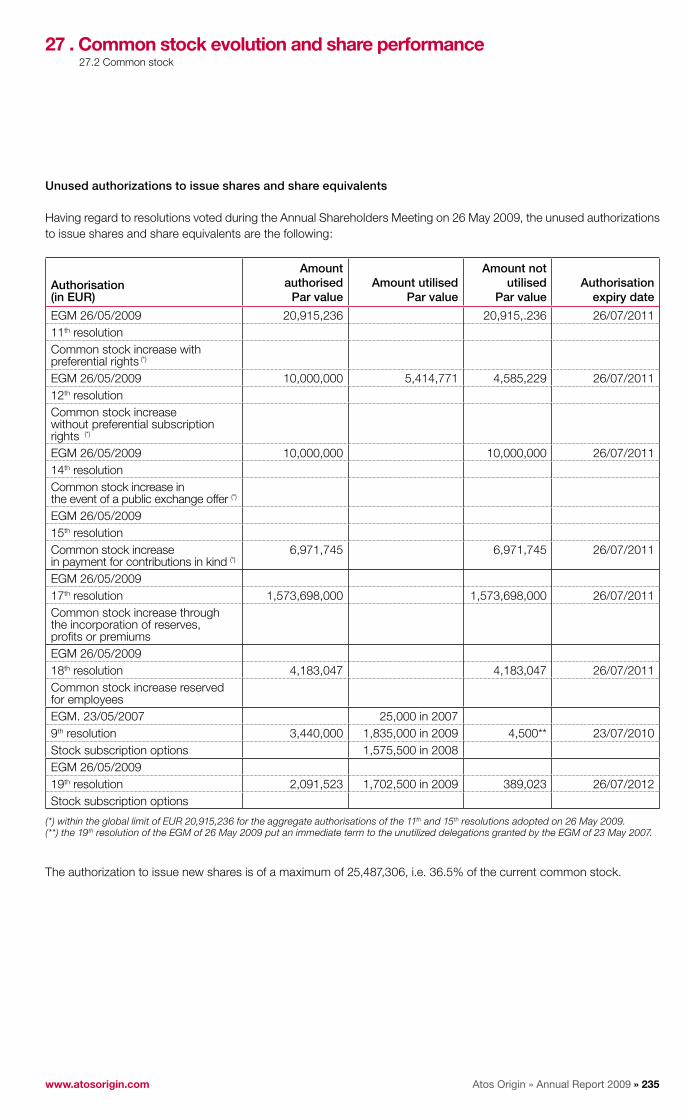
Atos Origin » Annual Report 2009 » 235www.atosorigin.com
27 . Common stock evolution and share performance27.2 Common stock
Unused authorizations to issue shares and share equivalents
Having regard to resolutions voted during the Annual Shareholders Meeting on 26 May 2009, the unused authorizations to issue shares and share equivalents are the following:
Authorisation (in EUR)
Amount authorised
Par valueAmount utilised
Par value
Amount not utilised
Par valueAuthorisation
expiry date
EGM 26/05/2009 20,915,236 20,915,.236 26/07/201111th resolutionCommon stock increase with preferential rights (*)
EGM 26/05/2009 10,000,000 5,414,771 4,585,229 26/07/201112th resolutionCommon stock increase without preferential subscription rights (*)
EGM 26/05/2009 10,000,000 10,000,000 26/07/201114th resolutionCommon stock increase in the event of a public exchange offer (*)
EGM 26/05/200915th resolutionCommon stock increasein payment for contributions in kind (*)
6,971,745 6,971,745 26/07/2011
EGM 26/05/200917th resolution 1,573,698,000 1,573,698,000 26/07/2011Common stock increase through the incorporation of reserves, profits or premiumsEGM 26/05/200918th resolution 4,183,047 4,183,047 26/07/2011Common stock increase reserved for employeesEGM. 23/05/2007 25,000 in 20079th resolution 3,440,000 1,835,000 in 2009 4,500** 23/07/2010Stock subscription options 1,575,500 in 2008EGM 26/05/200919th resolution 2,091,523 1,702,500 in 2009 389,023 26/07/2012Stock subscription options
(*) within the global limit of EUR 20,915,236 for the aggregate authorisations of the 11th and 15th resolutions adopted on 26 May 2009.(**) the 19th resolution of the EGM of 26 May 2009 put an immediate term to the unutilized delegations granted by the EGM of 23 May 2007.
The authorization to issue new shares is of a maximum of 25,487,306, i.e. 36.5% of the current common stock.

Atos Origin » Annual Report 2009 » 236
27 . Common stock evolution and share performance27.2 Common stock27.3 Dividends
The following authorisation to cancel shares corresponded to 10% of the issued common stock at 3 June 2005 :
Autorisation (in EUR)
Amount authorised
Par valueAmount utilised
Par valueAmount not
Par valueAuthorisation
expiry date
EGM 03/06/2005 6,716,075 6,716,075 AGM approving 2009 statutory
accounts 12th resolutionShare cancellationCOMMOn STOCK 6,716,075
Bonds convertible into and or exchangeable for new or existing shares (OCEAnE)
On 21 October 2009, Atos Origin issued 5,414,771 bonds convertible into and or exchangeable for new or existing Atos Origin shares (OCEANE) with a six-year and two-month term, for a total amount of EUR 249,999,977.07.
These bonds have a nominal share value of EUR 46.17 (1). The bonds will be redeemed on 1st January 2016. The annual interest rate is 2.5% payable on January 1st of each year as from 1st January 2010. The conversion period for the bonds stretches from 29 October 2009 to 8 January 2013.
As of 31 December 2009, no bonds have been converted into shares.
27.3 dividends
The objective of the Group is to have a dividend policy which depends on income increase, excluding extraordinary items. The management’s action is oriented towards the generation of a significant net profit, allowing for the shareholders to reap profit from their investment. Therefore,
given the low net profits of 2009, caused mainly by the winding-up of the Arcandor group (client of the German subsidiary), the Board of Directors has decided not to suggest the payment of a dividend on the 2009 exercise.
During the past three fiscal periods, Atos Origin has paid the following dividends:
Fiscal period Dividend paid per share (in EUR)
2008 0.00
2007 0.40
2006 0.00
(1) As of 31 December 2009, none of those bonds had been convert into shares.

Atos Origin » Annual Report 2009 » 237www.atosorigin.com
27 . Common stock evolution and share performance27.4 Share trading performance
27.4 Share trading performance
27.4.1 Five-year key figures
2009 2008 2007 2006 2005
High (in EUR) 38.46 40.45 55.29 65.20 62.00
Low (in EUR) 16.51 15.01 32.80 33.50 45.60
Closing (in EUR) 32.09 17.92 35.35 44.90 55.70
Average daily volume processed on Euronext platform (in number of shares) 182,398 395,561 821,106 640,181 438,833
Free-float In % 100% 100% 100% 100% 100%
Market capitalization (in EUR million) 2,237 1,249 2,464 3,095 3,749
Enterprise Value (EV) (in EUR million) 2,376 1,553 2,802 3,524 3,931
EV/revenue 0.46 0.28 0.48 0.64 0.72
EV/OMDA 4.7 3.3 5.5 7.9 7.9
EV/OM 8.2 5.8 10.3 14.3 9.8
P/E (year-end stock price on adjusted EPS) 12.2 6.9 17.4 27.5 14.7
27.4.2 Market and free-float capitalisation Based on a closing share price of EUR 32.09 at the end of December 2009 and 69,720,462 shares in issue, the market capitalisation of the Group at 31 December 2009 was EUR 2,237 million up by +79% compared to EUR 1,249 million at the end of December 2008.
In terms of market capitalisation, Atos Origin is ranked 79th (vs. 85th in 2008) within the Eurolist index, which includes the largest companies by market capitalisation on the Paris exchange. The Group’s market capitalisation by quarter since listing in Paris in 1995 has been as follows:
0.3
0.50.5
0.4
0.6
1.0 1.0
1.11.1 1.1
1.3
1.0
1.2
1.7 1.6
2.32.3
1.8
2.22.1 2.1
2.2 2.2
2.6
2.9
3.53.5
2.8 2.8
2.42.42.42.5
2.52.5
3.53.5 3.5
3.5 3.53.5
3.3 3.3
3.0
3.7
3.4
3.2
3.9
2.9
3.1 3.2
3.7
4.14.0
1.21.3
1.7
Dec. 95 jun 97 Dec. 98 jun 97 Dec. 01 jun 03 Dec. 04 jun 06 Dec. 07 jun 09
Market capitalisation from 1995 to december 2009 (in EUR billion)

Atos Origin » Annual Report 2009 » 238
French indices have shifted to free-float weightings in 2004. This is in line with the general trend for major market indices, which are based on free-float capitalisation instead of total market capitalisation. The change is intended to ensure a closer match between the actual market position of component
stocks and the index. It also reduces the risk of peaks in volatility that may result from an excessive discrepancy between the weighting of a stock in the index and the number of shares actually available to the market.
The Group’s actual free-float of shares increased from 39% to 100% between January 2004 and December 2009. The free-float capitalisation since the acquisition of Sema Group in January 2004 has been as follows:
27.4.3 Share performance in comparison with indices (base index 100)During 2009, most of the exchange markets in Europe and the US reported better performance compared to previous year. Global indices such at CAC 40 or Technology ones as CAC IT, NASDAQ Composite or Dow Jones Stoxx Tech increased in a range of +17% for the Dow Jones up to +44% for the NASDAQ.
Atos Origin stock overperformed strongly the market with an increase of +81% of the stock price. Most of the financial analysts together with investors remained confident in the capability of Atos Origin to meet its 2009 revenue, operating margin and cash flow objectives provided by the Group early in the year. At the end of 2009, the Atos Origin consensus based on 20 analysts’ estimates was as follows: 50% buy, 44% hold and 6% sell. As far as the target price is concerned, consensus was revised up several times during the period to be at EUR 37.3 at the end of the year compared to EUR 23.3 after the disclosure of 2008 results in February 2009.
27 . Common stock evolution and share performance27.4 Share trading performance
Free-float capitalisation since 2004 (in EUR billion)
1.5
2.4 2.42.4 2.4 2.4 2.4
2.12.2
1.2
1.3
1.72.0
2.8 2.82.9
3.0
3.9
3.7 3.4
2.93.1
3.4
3.2
4.1
181
144
122117116
100
jan. 09 March 09 May 09 july 09 Sep. 09 Dec. 09
jan. 04 Sep. 04 jun 05 March 06 Sep. 07Dec. 06 jun 08 March 09 Dec. 09
Atos OriginCAC 40DJ Euro Stoxx TechNasdaq COMPXCAC IT 20
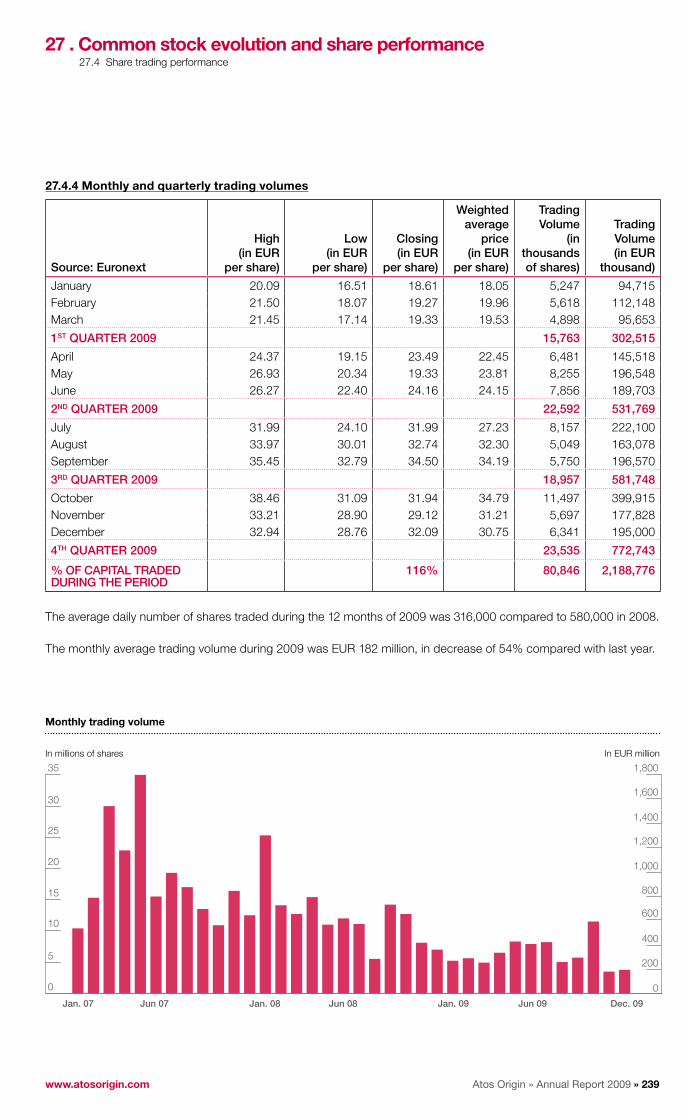
Atos Origin » Annual Report 2009 » 239www.atosorigin.com
27.4.4 Monthly and quarterly trading volumes
Source: Euronext
High (in EUR
per share)
Low (in EUR
per share)
Closing (in EUR
per share)
Weighted average
price (in EUR
per share)
Trading volume
(in thousandsof shares)
Trading volume (in EUR
thousand)
January 20.09 16.51 18.61 18.05 5,247 94,715February 21.50 18.07 19.27 19.96 5,618 112,148March 21.45 17.14 19.33 19.53 4,898 95,653
1ST QUARTER 2009 15,763 302,515
April 24.37 19.15 23.49 22.45 6,481 145,518May 26.93 20.34 19.33 23.81 8,255 196,548June 26.27 22.40 24.16 24.15 7,856 189,703
2nD QUARTER 2009 22,592 531,769
July 31.99 24.10 31.99 27.23 8,157 222,100August 33.97 30.01 32.74 32.30 5,049 163,078September 35.45 32.79 34.50 34.19 5,750 196,570
3RD QUARTER 2009 18,957 581,748
October 38.46 31.09 31.94 34.79 11,497 399,915November 33.21 28.90 29.12 31.21 5,697 177,828December 32.94 28.76 32.09 30.75 6,341 195,000
4TH QUARTER 2009 23,535 772,743
% OF CAPITAL TRADED DURInG THE PERIOD
116% 80,846 2,188,776
The average daily number of shares traded during the 12 months of 2009 was 316,000 compared to 580,000 in 2008.
The monthly average trading volume during 2009 was EUR 182 million, in decrease of 54% compared with last year.
27 . Common stock evolution and share performance27.4 Share trading performance
0
400
1,000
1,600
1,800
800
600
200
1,400
1,200
0
10
35
5
30
25
20
15
Monthly trading volume
jan. 07 jan. 08 jan. 09jun 07 jun 08 jun 09 Dec. 09
In millions of shares In EUR million
Atos Origin » Annual Report 2009 » 240
27 . Common stock evolution and share performance27.4 Share trading performance
27.4.5 Key trading dates in 2009 and post-closingAs of 6 January 2009, Centaurus Capital declared owning 5.01% of Group share capital and voting rights and the end of the Action de Concert with Pardus Capital.
On 31 March 2009, Centaurus Capital crossed below the 5% threshold in the share capital and voting rights of the company. The fund declared owning 4.96% of the Company’s share capital.
On 9 April 2009, Centaurus Capital crossed below the 4% threshold in the share capital and voting rights of the company. The fund declared owning 3.99% of the Company’s share capital.
On 22 April 2009, Centaurus Capital crossed below the 3% threshold in the share capital and voting rights of the company. The fund declared owning 2.84% of the Company’s share capital.
On 21 May 2009, Centaurus Capital crossed below the 2% threshold in the share capital and voting rights of the company. The fund declared owning 1.91% of the Company’s share capital.
On 8 January 2010, Fidelity Management and Research exited the threshold of 5% and declared owning 5.02% of Atos Origin shares and voting rights.
27.4.6 Share value for French wealth tax (“ISF”) purposes
The closing share price on 31 December 2009 was ■■
EUR 32.09. The average closing share price over the last 30 stock ■■
market trading days of 2009 was EUR 30.75 compared to EUR 17.21 for the same period in 2008.
27.4.7 Purchase or sale by the Group of its own sharesThe Group purchased or sold its own shares in 2009 as described within the 27.2.7 section “Treasury Stock and Liquidity Contract”. At 31 December 2009, the Group held 652,152 shares as treasury stock.

Atos Origin » Annual Report 2009 » 241www.atosorigin.com
28 . Shareholder relations
28.1 Communication
28.1 Communication 24128.2 Contacts 24128.3 Shareholder documentation 241
28.4 Registrar 24128.5 Financial calendar 24128.6 Update of documents issued 242
The Group aims to provide regular and clear information to all its shareholders, whether private individuals or institutions. We ensure the uniformity and transparency of information through the distribution of formal financial documents, the Group’s web site and personal meetings.
28.2 Contacts
Institutional investors, financial analysts and individual shareholders may obtain information from :
Gilles Arditti, Senior Vice President Investor Relations and Financial CommunicationTel: +33 (0) 1 55 91 28 83, [email protected]
Requests for information can also be sent by email to [email protected]
28.3 Shareholder documentation
In addition to the Annual Report, which is published in English and French, the following information is available to shareholders:
A half year report ■■
Quarterly revenue and trading update announcements■■
The Group’s informational website at www.atosorigin.com■■
Regular press releases, available through the web site or via the AMF database■■
Legal documents relating to the Group Articles of Association, minutes of Shareholder Meetings, Auditors’ reports, etc. may be viewed at the Group’s registered office (Legal Department) by prior appointment.
28.4 Registrar
The Group’s share registrar and paying agent is Société Générale.
28.5 Financial calendar
2010 Calendar
14 April 2010 2010 First quarter revenue
27 May 2010 Annual General Meeting (2009 results)
28 July 2010 2010 Half-year results
13 October 2010 2010 Third quarter revenue
16 February 2011 2010 Annual results

Atos Origin » Annual Report 2009 » 242
28.6 Update of documents issued
The following list includes all financial information published or made available since 1 January 2007.
This document is a full free translation of the original French text.
Document Date of issue Source
Financial reports
Annual report 2009 01/04/10 website Atos Origin/website AMF
Half-year report 2009 31/07/09 website Atos Origin/website AMF
Annual report 2008 09/04/09 website Atos Origin/website AMF
Half-year report 2008 29/07/08-28/08/08 website Atos Origin/website AMF
Annual report 2007 29/02/08-09/04/08 website Atos Origin/website AMF
Half-year report 2007 01/08/07-28/08/07 website Atos Origin/website AMF
Annual report 2006 28/02/07-06/04/07 website Atos Origin/website AMF
Financial press releases
Annual results 2009 17/02/10 website Atos Origin/website AMF
Half-year results 2009 29/07/09 website Atos Origin/website AMF
Annual results 2008 18/02/09 website Atos Origin/website AMF
Half-year results 2008 29/07/08 website Atos Origin/website AMF
Annual results 2007 15/02/08 website Atos Origin/website AMF
Half-year results 2007 01/08/07 website Atos Origin/website AMF
Annual results 2006 28/02/07 website Atos Origin/website AMF
Third quarter revenue 2009 16/10/09 website Atos Origin/website AMF
First quarter revenue 2009 15/04/09 website Atos Origin/website AMF
Fourth quarter revenue 2008 05/02/09 website Atos Origin/website AMF
Third quarter revenue 2008 31/10/08 website Atos Origin/website AMF
Second quarter revenue 2008 29/07/08 website Atos Origin/website AMF
First quarter revenue 2008 30/04/08 website Atos Origin/website AMF
Fourth quarter revenue 2007 31/01/08 website Atos Origin/website AMF
Third quarter revenue 2007 15/11/07 website Atos Origin/website AMF
Second quarter revenue 2007 01/08/07 website Atos Origin/website AMF
First quarter revenue 2007 14/05/07 website Atos Origin/website AMF
Fourth quarter revenue 2006 05/02/07 website Atos Origin/website AMF
Financial presentations
Full-year 2009 results 17/02/10 website Atos Origin
Half-year 2009 results 29/07/09 website Atos Origin
Full-year 2008 results 18/02/09 website Atos Origin
Half-year 2008 results 29/07/08 website Atos Origin
Full-year 2007 results 15/02/08 website Atos Origin
Half-year 2007 results 01/08/07 website Atos Origin
Operational 2006 results and transformation plan 05/02/07 website Atos Origin
Full-year 2006 results 28/02/07 website Atos Origin
Other financial communications
Offering by Atos Origin of bonds convertible into and/or exchangeable for new or existing shares (OCEANE) 21/10/09-23/10/09 website Atos Origin/website AMF
Description of trading programme of Company's shares 25/06/09 website Atos Origin/website AMF
Description of trading programme of Company's shares 03/07/08 website Atos Origin/website AMF
Description of trading programme of Company's shares 30/05/07 website Atos Origin/website AMF
28 . Shareholder relations28.6 Update of documents issued

Atos Origin » Annual Report 2009 » 243www.atosorigin.com
Document Date of issue Source
Shareholders’ meetings
Shareholders' meeting presentation 2009 27/05/10 website Atos Origin
Shareholders' meeting presentation 2008 26/05/09 website Atos Origin
Shareholders' meeting presentation 2007 12/06/08 website Atos Origin
Shareholders' meeting presentation 2006 23/05/07 website Atos Origin
Minutes of the 2008 AGM (full text of resolutions and results of vote) 26/05/09 Company’s registered office
Minutes of the 2007 AGM (full text of resolutions and results of vote) 12/06/08 Company’s registered office
Minutes of the 2006 AGM (full text of resolutions and results of vote) 23/05/07 Company’s registered office
Financial statements
Consolidated financial statements 2009 17/02/10-01/04/10 Company’s registered office/ Commercial court/Document de Référence
Parent company financial statements 2009 01/04/10 Company’s registered office/ Commercial court/Document de Référence
Condensated consolidated financial statements for the first half 2009 31/07/09 Company’s registered office/
Commercial court/Half-year report
Consolidated financial statements 2008 18/02/09-09/04/09 Company’s registered office/ Commercial court/Document de Référence
Parent company financial statements 2008 09/04/09 Company’s registered office/ Commercial court/Document de Référence
Condensated consolidated financial statements for the first half 2008 29/07/08-28/08/08 Company’s registered office/
Commercial court/Half-year report
Consolidated financial statements 2007 29/02/08-09/04/08 Company’s registered office/ Commercial court/Document de Référence
Parent company financial statements 2007 29/02/08-09/04/08 Company’s registered office/ Commercial court/Document de Référence
Condensated consolidated financial statements for the first half 2007 01/08/07-28/08/07 Company’s registered office/
Commercial court/Half-year report
Consolidated financial statements 2006 28/02/07 Company’s registered office/ Commercial court/Document de Référence
Parent company financial statements 2006 28/02/07 Company’s registered office/ Commercial court/Document de Référence
Auditors reports
Auditors’ report on the consolidated financial statements 2009 01/04/10 Company’s registered office/Commercial
court/Document de Référence
Auditors’ report on the parent company financial statements 2009 01/04/10 Company’s registered office/Commercial
court/Document de Référence
Auditors' special report on regulated agreements 2009 01/04/10 Company’s registered office/ Document de Référence
Auditors' special report on the report prepared by the Chairman of the Board of Directors 2009 01/04/10 Company’s registered office/
Document de Référence
Auditors’ letter regarding the information given in the Document de Reference 2009 01/04/10 Company’s registered office
Auditors’ letter regarding the information given in the half-year report 2009 31/07/09 Company’s registered office
Auditors’ review report on the first half-year financial information 2009 31/07/09 Company’s registered office/Commercial
court/Document de Référence
Auditors’ report on the consolidated financial statements 2008 08/04/09 Company’s registered office/Commercial
court/Document de Référence
Auditors’ report on the parent company financial statements 2008 08/04/09 Company’s registered office/Commercial
court/Document de Référence
Auditors' special report on regulated agreements 2008 08/04/09 Company’s registered office/ Document de Référence
28 . Shareholder relations28.6 Update of documents issued
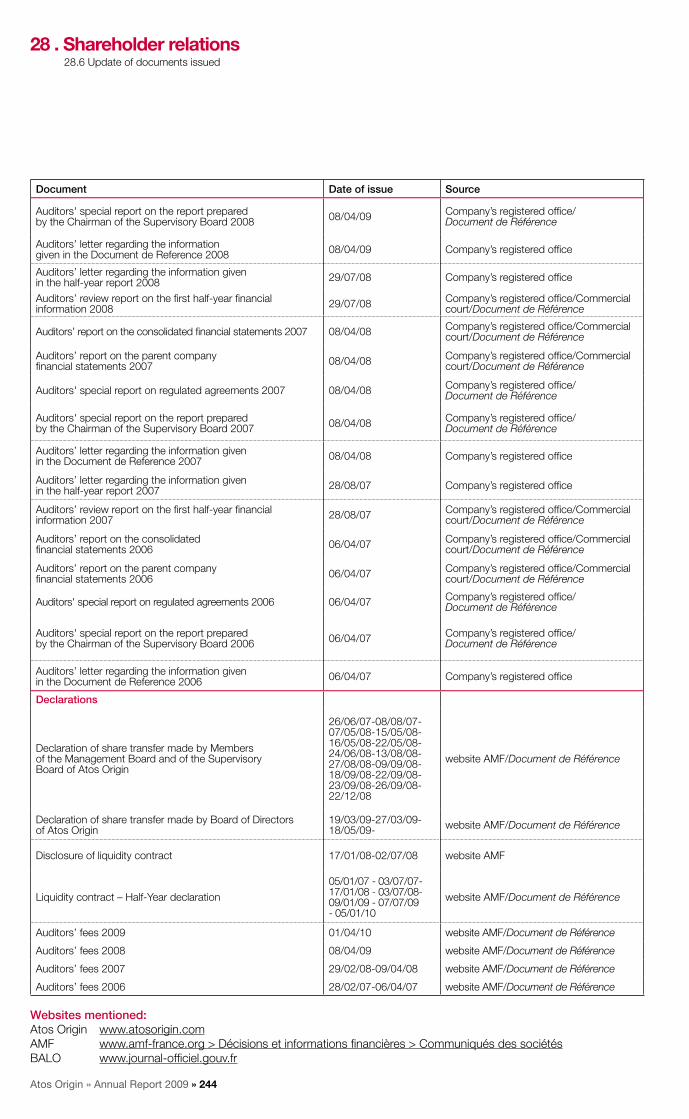
Atos Origin » Annual Report 2009 » 244
Document Date of issue Source
Auditors' special report on the report prepared by the Chairman of the Supervisory Board 2008 08/04/09 Company’s registered office/
Document de Référence
Auditors’ letter regarding the information given in the Document de Reference 2008 08/04/09 Company’s registered office
Auditors’ letter regarding the information given in the half-year report 2008 29/07/08 Company’s registered office
Auditors’ review report on the first half-year financial information 2008 29/07/08 Company’s registered office/Commercial
court/Document de Référence
Auditors’ report on the consolidated financial statements 2007 08/04/08 Company’s registered office/Commercial court/Document de Référence
Auditors’ report on the parent company financial statements 2007 08/04/08 Company’s registered office/Commercial
court/Document de Référence
Auditors' special report on regulated agreements 2007 08/04/08 Company’s registered office/ Document de Référence
Auditors' special report on the report prepared by the Chairman of the Supervisory Board 2007 08/04/08 Company’s registered office/
Document de Référence
Auditors’ letter regarding the information given in the Document de Reference 2007 08/04/08 Company’s registered office
Auditors’ letter regarding the information given in the half-year report 2007 28/08/07 Company’s registered office
Auditors’ review report on the first half-year financial information 2007 28/08/07 Company’s registered office/Commercial
court/Document de Référence
Auditors’ report on the consolidated financial statements 2006 06/04/07 Company’s registered office/Commercial
court/Document de Référence
Auditors’ report on the parent company financial statements 2006 06/04/07 Company’s registered office/Commercial
court/Document de Référence
Auditors' special report on regulated agreements 2006 06/04/07 Company’s registered office/ Document de Référence
Auditors' special report on the report prepared by the Chairman of the Supervisory Board 2006 06/04/07 Company’s registered office/
Document de Référence
Auditors’ letter regarding the information given in the Document de Reference 2006 06/04/07 Company’s registered office
Declarations
Declaration of share transfer made by Members of the Management Board and of the Supervisory Board of Atos Origin
26/06/07-08/08/07-07/05/08-15/05/08-16/05/08-22/05/08-24/06/08-13/08/08-27/08/08-09/09/08-18/09/08-22/09/08-23/09/08-26/09/08-22/12/08
website AMF/Document de Référence
Declaration of share transfer made by Board of Directors of Atos Origin
19/03/09-27/03/09-18/05/09- website AMF/Document de Référence
Disclosure of liquidity contract 17/01/08-02/07/08 website AMF
Liquidity contract – Half-Year declaration
05/01/07 - 03/07/07- 17/01/08 - 03/07/08-09/01/09 - 07/07/09 - 05/01/10
website AMF/Document de Référence
Auditors’ fees 2009 01/04/10 website AMF/Document de Référence
Auditors’ fees 2008 08/04/09 website AMF/Document de Référence
Auditors’ fees 2007 29/02/08-09/04/08 website AMF/Document de Référence
Auditors’ fees 2006 28/02/07-06/04/07 website AMF/Document de Référence
Websites mentioned:Atos Origin www.atosorigin.comAMF www.amf-france.org > Décisions et informations financières > Communiqués des sociétésBALO www.journal-officiel.gouv.fr
28 . Shareholder relations28.6 Update of documents issued
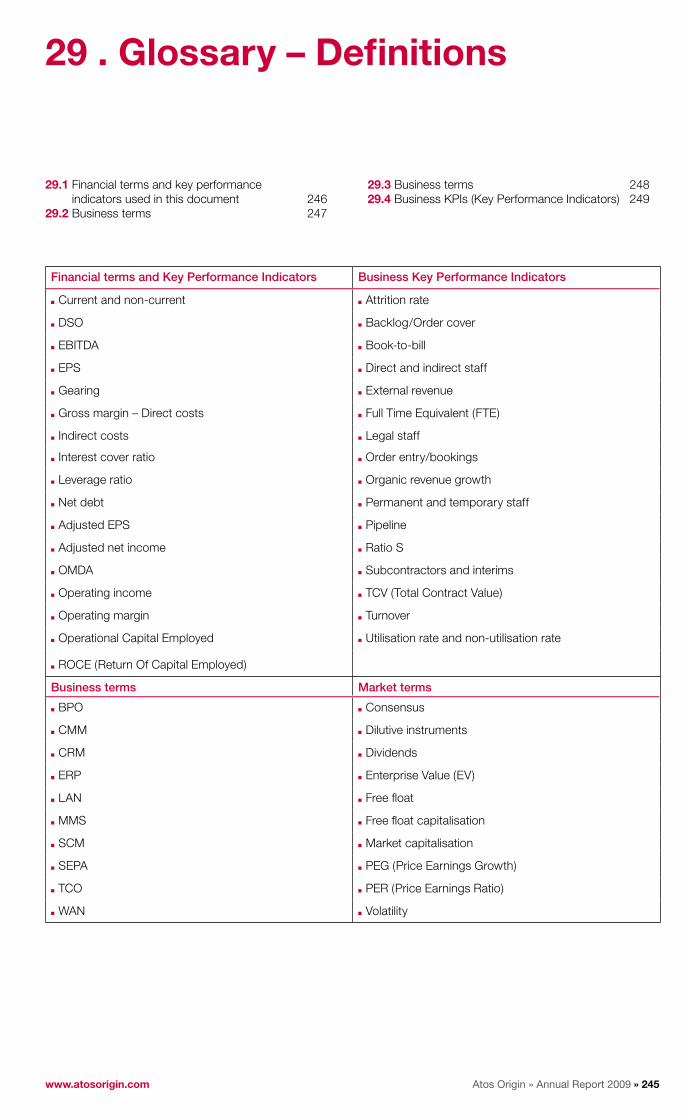
Atos Origin » Annual Report 2009 » 245www.atosorigin.com
29 . Glossary – definitions
Financial terms and Key Performance Indicators Business Key Performance Indicators
Current and non-current■■ Attrition rate■■
DSO■■ Backlog/Order cover■■
EBITDA■■ Book-to-bill■■
EPS■■ Direct and indirect staff■■
Gearing■■ External revenue ■■
Gross margin – Direct costs■■ Full Time Equivalent (FTE)■■
Indirect costs■■ Legal staff■■
Interest cover ratio■■ Order entry/bookings■■
Leverage ratio■■ Organic revenue growth■■
Net debt■■ Permanent and temporary staff■■
Adjusted EPS■■ Pipeline■■
Adjusted net income■■ Ratio S■■
OMDA■■ Subcontractors and interims■■
Operating income■■ TCV (Total Contract Value)■■
Operating margin■■ Turnover■■
Operational Capital Employed■■ Utilisation rate and non-utilisation rate■■
ROCE (Return Of Capital Employed)■■
Business terms Market terms
BPO■■ Consensus■■
CMM■■ Dilutive instruments ■■
CRM■■ Dividends ■■
ERP■■ Enterprise Value (EV)■■
LAN■■ Free float ■■
MMS■■ Free float capitalisation■■
SCM■■ Market capitalisation■■
SEPA■■ PEG (Price Earnings Growth) ■■
TCO■■ PER (Price Earnings Ratio) ■■
WAN■■ Volatility■■
29.1 Financial terms and key performance indicators used in this document 246
29.2 Business terms 247
29.3 Business terms 24829.4 Business KPIs (Key Performance Indicators) 249
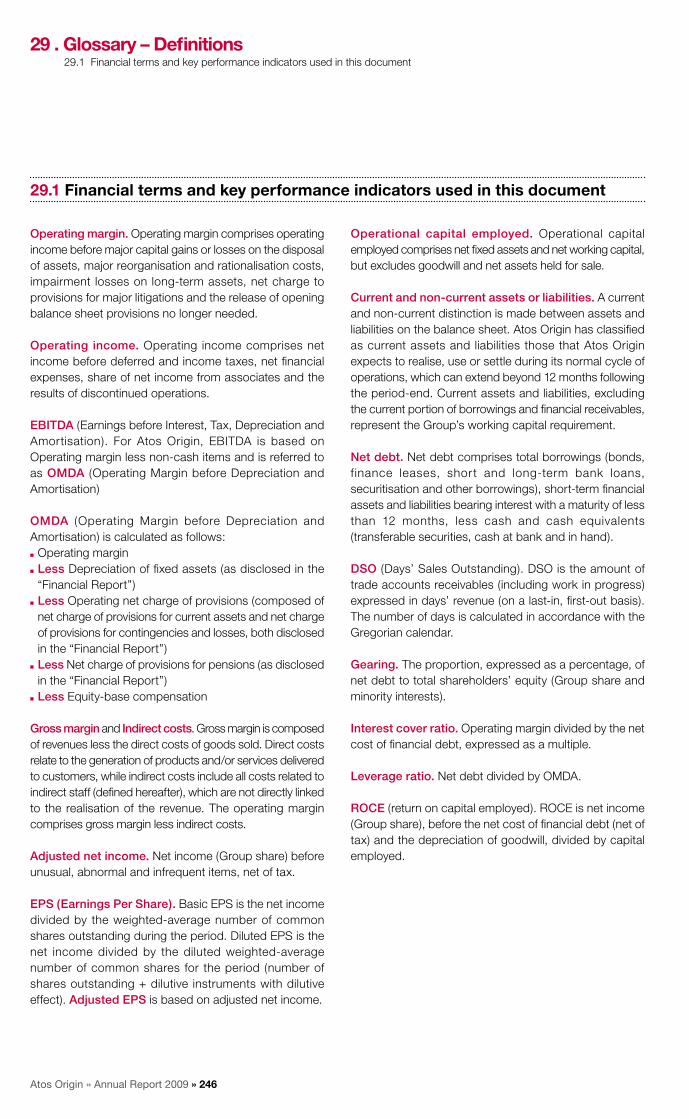
Atos Origin » Annual Report 2009 » 246
29.1 Financial terms and key performance indicators used in this document
Operating margin. Operating margin comprises operating income before major capital gains or losses on the disposal of assets, major reorganisation and rationalisation costs, impairment losses on long-term assets, net charge to provisions for major litigations and the release of opening balance sheet provisions no longer needed.
Operating income. Operating income comprises net income before deferred and income taxes, net financial expenses, share of net income from associates and the results of discontinued operations.
EBITDA (Earnings before Interest, Tax, Depreciation and Amortisation). For Atos Origin, EBITDA is based on Operating margin less non-cash items and is referred to as OMDA (Operating Margin before Depreciation and Amortisation)
OMDA (Operating Margin before Depreciation and Amortisation) is calculated as follows:
Operating margin ■■
Less■■ Depreciation of fixed assets (as disclosed in the “Financial Report”) Less■■ Operating net charge of provisions (composed of net charge of provisions for current assets and net charge of provisions for contingencies and losses, both disclosed in the “Financial Report”)Less■■ Net charge of provisions for pensions (as disclosed in the “Financial Report”)Less■■ Equity-base compensation
Gross margin and Indirect costs. Gross margin is composed of revenues less the direct costs of goods sold. Direct costs relate to the generation of products and/or services delivered to customers, while indirect costs include all costs related to indirect staff (defined hereafter), which are not directly linked to the realisation of the revenue. The operating margin comprises gross margin less indirect costs. Adjusted net income. Net income (Group share) before unusual, abnormal and infrequent items, net of tax.
EPS (Earnings Per Share). Basic EPS is the net income divided by the weighted-average number of common shares outstanding during the period. Diluted EPS is the net income divided by the diluted weighted-average number of common shares for the period (number of shares outstanding + dilutive instruments with dilutive effect). Adjusted EPS is based on adjusted net income.
Operational capital employed. Operational capital employed comprises net fixed assets and net working capital, but excludes goodwill and net assets held for sale.
Current and non-current assets or liabilities. A current and non-current distinction is made between assets and liabilities on the balance sheet. Atos Origin has classified as current assets and liabilities those that Atos Origin expects to realise, use or settle during its normal cycle of operations, which can extend beyond 12 months following the period-end. Current assets and liabilities, excluding the current portion of borrowings and financial receivables, represent the Group’s working capital requirement.
net debt. Net debt comprises total borrowings (bonds, f inance leases, short and long-term bank loans, securitisation and other borrowings), short-term financial assets and liabilities bearing interest with a maturity of less than 12 months, less cash and cash equivalents (transferable securities, cash at bank and in hand).
DSO (Days’ Sales Outstanding). DSO is the amount of trade accounts receivables (including work in progress) expressed in days’ revenue (on a last-in, first-out basis). The number of days is calculated in accordance with the Gregorian calendar.
Gearing. The proportion, expressed as a percentage, of net debt to total shareholders’ equity (Group share and minority interests).
Interest cover ratio. Operating margin divided by the net cost of financial debt, expressed as a multiple.
Leverage ratio. Net debt divided by OMDA.
ROCE (return on capital employed). ROCE is net income (Group share), before the net cost of financial debt (net of tax) and the depreciation of goodwill, divided by capital employed.
29 . Glossary – definitions29.1 Financial terms and key performance indicators used in this document
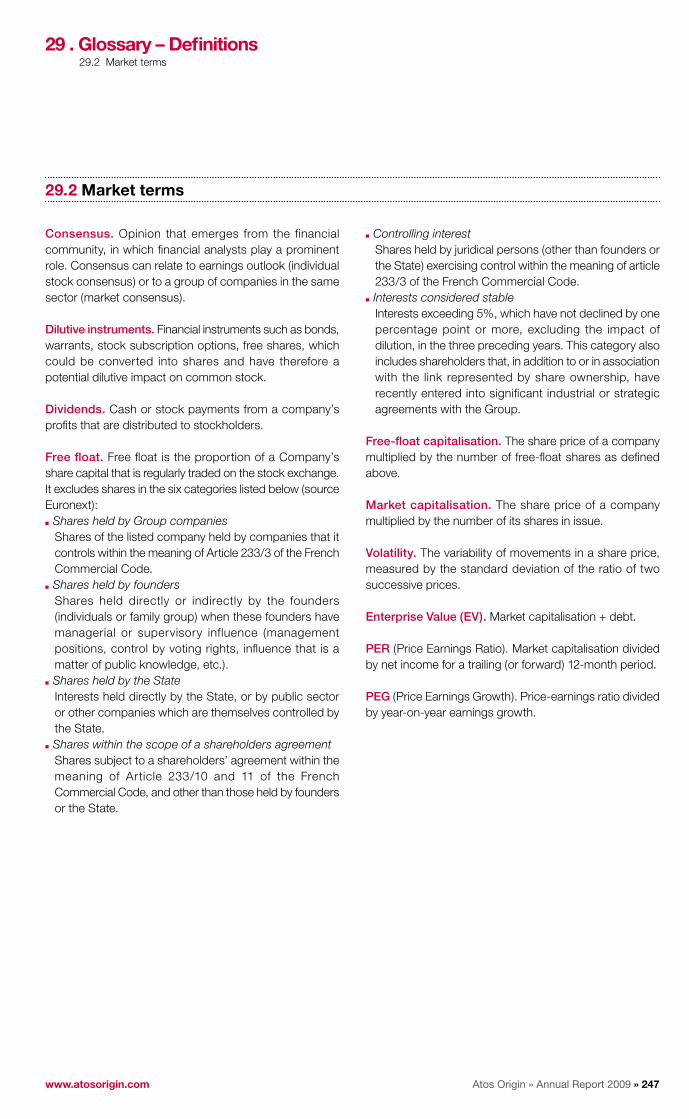
Atos Origin » Annual Report 2009 » 247www.atosorigin.com
29.2 Market terms
Consensus. Opinion that emerges from the financial community, in which financial analysts play a prominent role. Consensus can relate to earnings outlook (individual stock consensus) or to a group of companies in the same sector (market consensus).
Dilutive instruments. Financial instruments such as bonds, warrants, stock subscription options, free shares, which could be converted into shares and have therefore a potential dilutive impact on common stock.
Dividends. Cash or stock payments from a company’s profits that are distributed to stockholders.
Free float. Free float is the proportion of a Company’s share capital that is regularly traded on the stock exchange. It excludes shares in the six categories listed below (source Euronext):
Shares held by Group companies■■
Shares of the listed company held by companies that it controls within the meaning of Article 233/3 of the French Commercial Code.Shares held by founders■■
Shares held directly or indirectly by the founders (individuals or family group) when these founders have managerial or supervisory influence (management positions, control by voting rights, influence that is a matter of public knowledge, etc.).Shares held by the State■■
Interests held directly by the State, or by public sector or other companies which are themselves controlled by the State.Shares within the scope of a shareholders agreement■■
Shares subject to a shareholders’ agreement within the meaning of Article 233/10 and 11 of the French Commercial Code, and other than those held by founders or the State.
Controlling interest■■
Shares held by juridical persons (other than founders or the State) exercising control within the meaning of article 233/3 of the French Commercial Code.Interests considered stable■■
Interests exceeding 5%, which have not declined by one percentage point or more, excluding the impact of dilution, in the three preceding years. This category also includes shareholders that, in addition to or in association with the link represented by share ownership, have recently entered into significant industrial or strategic agreements with the Group.
Free-float capitalisation. The share price of a company multiplied by the number of free-float shares as defined above.
Market capitalisation. The share price of a company multiplied by the number of its shares in issue.
volatility. The variability of movements in a share price, measured by the standard deviation of the ratio of two successive prices.
Enterprise value (Ev). Market capitalisation + debt.
PER (Price Earnings Ratio). Market capitalisation divided by net income for a trailing (or forward) 12-month period.
PEG (Price Earnings Growth). Price-earnings ratio divided by year-on-year earnings growth.
29 . Glossary – definitions29.2 Market terms

Atos Origin » Annual Report 2009 » 248
29.3 Business terms
BPO (Business Process Outsourcing). Outsourcing of a business function or process, e.g. administrative functions such as accounting, HR management, call centers, etc.
CMM (Capability Maturity Model). CMM is a method for evaluating and measuring the competence of the software development process in an organisation on a scale of 1 to 5.
CMMI. Capability Maturity Model Integration.
CRM (Customer Relationship Management). Managing customer relationships (after–sales service, purchasing advice, utilisation advice, customer loyalty) has become a strategic component of a company’s successful operation. Not only does CRM facilitate efficiency, it also leads to higher sales by building customer loyalty.
ERP (Enterprise Resource Planning). An ERP system is an integrated management software system built in modules, which is capable of integrating sales, manufacturing, purchasing, accounting and human resources systems into an enterprise-wide management information system.
IPO (Information Technology Outsourcing). Refers to the process of subcontracting part or total of IT management to a third-party.
LAn (Local Area Network). A local network that connects a number of computers within a single building or unit.
MMS (Multimedia Message Service). A message capable of carrying text, sounds, fixed or animated colour images, generally sent to a mobile phone.
SCM (Supply Chain Management). A system designed to optimise the logistics chain, aimed at improving cost management and flexibility.
SEPA (Single Euro Payments Area). Regulating initiative from European countries involving the creation of a specific zone where all transactions will be considered as domestic in terms of billing (no longer cross-border electronic payments surcharge).
TCO. Total Cost of Ownership.
WAn (Wide Area Network). A long–distance network that generally comprises several local networks and covers a large geographical area.
29 . Glossary – definitions29.3 Business terms

Atos Origin » Annual Report 2009 » 249www.atosorigin.com
29.4 Business KPIs (Key Performance Indicators)
229.4.1 RevenueExternal revenue. External revenue represents Atos Origin sales to third parties (excluding VAT, nil margin pass-through revenue). Book-to-bill. A ratio expressed in percentage terms based on order entry in the period divided by revenue of the same period.
Order entry/bookings. The total value of contracts (TCV), orders or amendments signed during a defined period. When an offer is won (contract signed), the total contract value is added to the backlog and the order entry is recognized.
TCv (Total Contract value). The total value of a contract at signature (prevision or estimation) over its duration. It represents the firm order and contractual part of the contract excluding any clause on the decision of the client, as anticipated withdrawal clause, additional option or renewal.
Backlog/Order cover. The value of signed contracts, orders and amendments that remain to be recognized over their contract lives.
Pipeline. The value of revenues that may be earned from outstanding commercial proposals issued to clients. Qualified pipeline applies an estimated percentage likelihood of proposal success.
Organic growth. Organic growth represents the % growth of a unit based on a constant scope and exchange rates basis.
29.4.2 Human resourcesLegal staff. The total number of employees under Atos Origin employment contracts at the end of the period. Legal staff includes those on long sickness or long absence, apprentices, trainees, and employees on maternity leave, but excludes subcontractors and interims.
FTE (Full-time equivalent) staff). The total number of staff calculated using information from time sheets on the basis of working time divided by standard contractual workable time per employee. In general, a person working on a full time contract is considered as one FTE, whereas a person working on a part time contract would be less considered than one FTE.
Calculations are based on contractual working time (excluding overtime and unpaid holidays) with potential workable time (in hours or days) = nominal time + overtime balance – unpaid vacation. For subcontractors and interims, potential workable hours are based on the number of hours billed by the supplier to Atos Origin.
Subcontractors. External subcontractors are third-party suppliers. Outsourced activities (e.g. printing or call center activities) and fixed price subcontracting are excluded from the recorded number of subcontractors or interims.
Interims. Staff from an agency for temporary personnel. Interims are usually used to cover seasonal peaks or for situations requiring staff for a short period of time.
Direct Staff. Direct staff includes permanent staff and subcontractors, whose work is billable to a third party.
Indirect staff. Indirect staff includes permanent staff or subcontractors, who are not billable to clients. Indirect staff is not directly involved in the generation of products and/or services delivered to clients.
Permanent staff. Permanent staff members have a contract for an unspecified period of time.
29 . Glossary – definitions29.4 Business kpis (Key Performance Indicators)

Atos Origin » Annual Report 2009 » 250
Temporary staff. Temporary staff has a contract for a fixed or limited period of time.
Ratio S. Measures the number of indirect staff as a percentage of total FTE staff, including both own staff and subcontractors.
Staff turnover and attrition rate (for legal staff). Turnover and attrition rates measure the proportion of legal staff that has left the Group (voluntary and/or involuntary) in a defined period.
Turnover measures the percentage of legal staff that has left the business in a defined period.
Attrition measures the percentage of legal permanent staff that has voluntarily left the business in a defined period. Attrition rate is a ratio based on total voluntary leavers in the period on an annual basis divided by the average number of permanent staff in the period.
Utilisation rate and non-utilisation rate. Utilisation rate + non-utilisation rate = 100% of workable time for direct FTE, which excludes legal vacations, long-term sickness, long-term sabbaticals and parental leave. Workable time is composed of billed time, inactivity that is billable but not billed (exceptional holidays, sickness, on the bench which is between two assignments, other inactivity as delegation), and non-billable time (pre-sales, training, management meetings, research and development and travel).
Utilisation rate measures the proportion of workable time (hours or days) of direct FTE (own staff excluding subcontractors) that is billed to customer. The ratio is expressed in percentage terms based on billed hours divided by workable hours excluding vacations. Non-utilisation rate measures the workable time (hours or days) of direct FTE (own staff excluding subcontractors) that is not billed or is non-billable to clients.
29 . Glossary – definitions29.4 Business kpis (Key Performance Indicators)
Atos Origin » Annual Report 2009 » 251www.atosorigin.com
30 . Persons responsible for the document and the audit of the financial statements
30.1 Person responsible for the Reference Document 251
30.2 Person responsible for the accuracy of the Reference Document 251
30.3 Persons responsible for the audit of the financial statements 252
30.1 Person responsible for the Reference document
30.2 Person responsible for the accuracy of the Reference document
Thierry BRETON,Chairman and Chief Executive Officer
I hereby declare that, having taken all reasonable care to ensure that such is the case, the information contained in the Reference Document is, to the best of my knowledge, in accordance with the facts and contains no omission likely to affect its import.
I hereby declare that, to the best of my knowledge, the financial statements have been prepared in accordance with the applicable accounting standards and give a true and fair view of the assets, liabilities, financial position and results of the Company and all the other companies included in the scope of consolidation, and that the Management Report here attached gives a fair description of the material events, results and financial position of the Company and all the other companies included in the scope of consolidation, as well as a description of the main risks and contingencies with which the Company may be confronted.
I obtained a statement from the Statutory Auditors at the end of their engagement affirming that they have read the whole of the Reference Document and examined the information in respect of the financial position and the accounts contained herein.
The Statutory Auditors produced their reports on the Consolidated and the Annual Financial Statements of 2009 shown respectively from page 100 to 101 and from page 177 to 178 of this Reference Document.
Without qualifying their opinion, the Statutory Auditors, in their report on the Consolidated Statements, drew the attention to the matter set out in the note “Basis of preparation and significant accounting policies” of the consolidated financial statements regarding the application of new standards and interpretations from 1 January 2009.
The Consolidated and the Annual Financial Statements for the year ended 31 December 2008 presented in the Reference Document filed with the AMF on 9 April 2009 under number D.09-251 have been subject to a report from the Statutory Auditors shown respectively from pages 79 to 80 and from page 153 to 154 of that document.
Without qualifying their opinion, the Statutory Auditors, in their report on the Consolidated Statements, drew the attention to the matter set out in the note “Goodwill” to the consolidated financial statements regarding the impairment charge on goodwill recorded as of 31 December 2008.Without qualifying their opinion, the Statutory Auditors, in their report on the Annual Financial Statements, drew the attention to the change in accounting principles regarding the application as from 1st January 2008 of Regulation n°2008-15 of the Comité de la Réglementation Comptable on stock options plans and free share plans.
Thierry BRETON, Chairman and Chief Executive Officer
Paris-La Défense, 31st March 2010

Atos Origin » Annual Report 2009 » 252
30.3 Persons responsible for the audit of the financial statements
Appointment and term of offices
Statutory Auditors Substitute Auditors
Grant ThorntonJean-Pierre Colle and Vincent Frambourt
Cabinet IGEC, 3, rue Léon Jost, 75017 Paris
• Appointed on 12 June 2008 for a term of 6 years.• Term of office expires: at the end of the Annual General
Meeting held to adopt the 2013 financial statements.
• Appointed on 12 June 2008 for a term of 6 years.• Term of office expires: at the end of the Annual General
Meeting held to adopt the 2013 financial statements.
Deloitte & AssociésTristan Guerlain et Christophe Patrier
Cabinet B.E.A.S. 7-9, Villa Houssay 92200 Neuilly-sur-Seine
• Appointed on 23 May 2006 for a term of 6 years.• Term of office expires: at the end of the Annual General
Meeting held to adopt the 2011 financial statements.
• Appointed on 23 May 2006 for a term of 6 years.• Term of office expires: at the end of the Annual General
Meeting held to adopt the 2011 financial statements.
30 . Persons responsible for the document and the audit of the financial statements30.3 Responsables du Contrôle des comptes

Atos Origin » Annual Report 2009 » 253www.atosorigin.com
31 . AMF Cross-reference table
31.1 Cross-reference table of the reference document 253
31.2 Cross-reference table of the financial report 255
31.1 Cross-reference table of the Reference document
This document is a full free translation of the original French text. The original document has been filed with the Autorité des Marchés Financiers (AMF) on 1 April 2010 under the number D.10-0199, in accordance with article 212-13 of the AMF’s general regulations. After filing, this document as a Reference Document could be used to support a financial operation if accompanied by a prospectus duly approved by the AMF.
The cross-reference table below refers to the main articles of Commission Regulation (CE) n° 809-2004 implementing the Prospectus Directive.
Chapiter Information Section
1 PERSOnS RESPOnSIBLE1.1 Persons responsible 301.2 Declaration by those responsible 302 STATUTORY AUDITORS2.1 Auditors’ information 302.2 Changes Non-applicable3 SELECTED FInAnCIAL InFORMATIOn3.1 Historical financial information 33.2 Interim periods Non-applicable4 RISK FACTORS 235 InFORMATIOn ABOUT THE ISSUER5.1 History and development of the issuer 1-65.2 Investments 21-226 BUSInESS OvERvIEW6.1 Principal activities 10 to 146.2 Principal markets 56.3 Principal markets (continue)6.4 Dependency 236.5 Competitive position 77 ORGAnISATIOnAL STRUCTURE7.1 Group 4-87.2 Subsidiaries 228 PROPERTY, PLAnTS AnD EQUIPMEnT8.1 Material tangible fixed assets 228.2 Environmental issues9 OPERATInG AnD FInAnCIAL REvIEW 189.1 Financial condition9.2 Operating results 2110 CAPITAL RESOURCES 2010.1 Capital resources10.2 Cash flows 21-2210.3 Funding structure 21-2210.4 Restrictions 21-2210.5 Sources of funds 2111 RESEARCH AnD DEvELOPMEnT, PATEnTS AnD LICEnCES 21-22

Atos Origin » Annual Report 2009 » 254
Chapiter Information Section
12 TREnD InFORMATIOn12.1 Trends 7-2012.2 Material effect 7-2013 PROFIT FORECASTS OR ESTIMATES13.1 Assumptions Non-applicable13.2 Report Non-applicable13.3 Comparison Non-applicable13.4 Update Non-applicable14 ADMInISTRATIvE, MAnAGEMEnT, AnD SUPERvISORY BODIES
AnD SEnIOR MAnAGEMEnT14.1 Members’ information 4 – 24 – 2614.2 Conflicts of interests 2415 REMUnERATIOn AnD BEnEFITS15.1 Remuneration 2415.2 Pension, retirement or similar benefits 2416 BOARD PRACTICES16.1 Term of office 2416.2 Service contracts 2416.3 Committees 2416.4 Compliance 2417 EMPLOYEES17.1 Employees’ information 1917.2 Shareholdings and stock options 2717.3 Employees’ shareholding 2718 MAjOR SHAREHOLDERS18.1 Shareholders 2718.2 Voting rights 2718.3 Ownership and control 2718.4 Arrangements related to control 2719 RELATED PARTY TRAnSACTIOnS 2220 FInAnCIAL InFORMATIOn COnCERnInG THE ISSUER’S ASSETS
AnD LIABILITIES, FInAnCIAL POSITIOn AnD PROFITS AnD LOSSES20.1 Historical financial information 3 – 2220.2 Pro forma financial information Non-applicable20.3 Financial statements 2220.4 Auditing of historical annual financial information 2220.5 Age of latest financial information 2220.6 Interim and other financial information Non-applicable20.7 Dividend policy 2720.8 Legal and arbitration proceedings 2620.9 Significant change in the issuer’s financial or trading position Non-applicable21 ADDITIOnAL InFORMATIOn21.1 Share capital 26-2721.2 Memorandum and Articles of Association 2622 MATERIAL COnTRACTS 2323 THIRD-PARTY InFORMATIOn AnD STATEMEnT BY ExPERTS
AnD DECLARATIOnS OF AnY InTEREST23.1 Declaration of interest Non-applicable23.2 Confirmation Non-applicable24 DOCUMEnTS On DISPLAY 2825 InFORMATIOn On HOLDInGS 22
31 . AMF Cross-reference table31.1 Cross-reference table of the reference document

Atos Origin » Annual Report 2009 » 255www.atosorigin.com
31.2 Cross-reference table of the financial report
The present reference document includes all the items of the financial report, in accordance with article L.451-1-2 of Monetary and Financial Code (“Code Monétaire et Financier”), as required by article 222-3 of AMF’s general regulations. The cross-reference table below refers to the main articles of the financial report:
Information Paragraphs
Company financial statements 22.4
Consolidated financial statements 22.2 to 22.3
Annual Report 20.1 to 20.5
Certificate of the Annual Financial Report responsible 24.1
Statutory auditors’ report on financial statements year ended 31 December 2009 22.5
Statutory auditors’ report on the financial statements for the year ended 31 December 2009 22.1
Statutory auditors fees 22.3
Report of the Chairman of the Board of Directors on Corporate Governance and Internal Control 24.2
Statutory auditors’ report, on the report prepared by the Chairman of the Board of Directors, in accordance with article L.225-235 of French Commercial Code (Code de Commerce)
24.3
In accordance with the requirements of Article 28 of EC regulation n° 809-2004 dated 29 April 2004 relating to documents issued by issuers listed on markets of states members of the European Union (“Prospectus Directive”), the following elements are enclosed by reference:
the consolidated accounts for the year ended ■■
31 December 2008 under IFRS, the related statutory auditors’ reports and the Group management report presented within the registration document (“document de reference”) n° D.08-218 filed with the Autorité des Marchés Financiers (AMF) on 9 April 2009;the consolidated accounts for the year ended ■■
31 December 2007 under IFRS, the related statutory auditors’ reports and the Group management report presented within the registration document (“document de reference”) n° D.08-218 filed with the Autorité des Marchés Financiers (AMF) on 9 April 2008;the consolidated accounts for the year ended ■■
31 December 2006 under IFRS, the related statutory auditors’ reports and the Group management report presented within the registration document (“document de reference”) n° D.07-302 filed with the Autorité des Marchés Financiers (AMF) on 6 April 2007;
the consolidated accounts for the year ended ■■
31 December 2005 under IFRS, the related statutory auditors’ reports and the Group management report presented within the registration document (“document de reference”) n° D.06-402 filed with the Autorité des Marchés Financiers (AMF) on 15 May 2006; the consolidated accounts for the year ended 31 December ■■
2004 under French accounting principles, the related statutory auditors’ reports and the Group management report presented within the registration document (“document de reference”) n° D.05-0800 filed with the Autorité des Marchés Financiers (AMF) on 30 May 2005;
The chapters of the registration documents 2007, 2006, 2005 and 2004 not mentioned above either do not apply to investors or are covered in another part of the present registration document.
31 . AMF Cross-reference table31.2 Cross-reference table of the financial report

Atos Origin » Annual Report 2009 » 256
32 . Full index
01 . Business profile 0102 . CEO message 0303 . Atos Origin in 2009 05
3.1 Financial highlights 053.2 Company 2009 highlights 08
04 . Governance 0104.1 Group Top Management 0104.2 The Executive Committee 0114.3 The Board of Directors 0114.4 Persons responsible for the audit of the Financial statements 012
05 . Stock market overview 0135.1 Trading of shares (Euronext) 0135.2 Shareholders breakdown 0135.3 Dividends 0145.4 Contacts 0145.5 Financial calendar 0145.6 Share trading performance 015
06 . Formation of the Group 01607 . The IT services market 017
7.1 Global IT Spending 0177.2 Market trends 0187.3 The competitive environment 0217.4 IT Services market evolution by Service Line 0237.5 Market share and competitors 025
08 . Strategy, organisation and 2010 objectives 027
8.1 Mission and vision 0278.2 The Customer at the core of Atos Origin’s
strategy: GAMA, SIC and SGS 0288.3 CSR – Corporate Social Responsibility 0288.4 Organisation 0298.5 2010 objectives 032
09 . TOP Program (Total Operational Performance) 033
9.1 2009 achievements 0339.2 Lean Management 0339.3 Boosting Offshoring 0349.4 Optimising office space 0359.5 Supporting innovation 0359.6 Continuation in 2010 035
10 . Consulting 03610.1 Description of activities 03610.2 Organisation around markets 03610.3 Offers 037
11 . Systems Integration 03911.1 Description of activities 03911.2 Key systems integration achievements
in 2009 04111.3 Looking ahead 042
12 . Managed Services 04312.1 Description of activities 04312.2 Managed Services portfolio 04412.3 Looking ahead 045
13 . Hi-Tech Transactional Services (HTTS) 046
13.1 Description of activities 04613.2 Payments services 04713.3 eCs, eServices for Customers,
Citizens and Communities 04713.4 Atos Worldline processing capabilities –
key figures 04813.5 Hi-Tech Transactional Services:
Pillars for Atos Worldline development 04813.6 Future developments 050
14 . Medical BPO 05115 . Markets strategy 052
15.1 Public & Health Sector 05215.2 Energy & Utilities 05315.3 Financial Services 05415.4 Telecom & Media 05515.5 Manufacturing, Retail & Transportation 056
16 . distinctive Offering and innovation 057
16.1 Distinctive Offerings program 05716.2 Offerings overview 05816.3 Other Innovations 061
17 . The Scientific Community: the 2014 journey 063
18 . Corporate Social Responsibility 06418.1 Making IT work for business
and the environment 06418.2 2009 – Confirming a strong commitment
to Corporate Sustainability 06518.3 2009 achievements 066
19 . Human Resources 07119.1 Human Resources fundamentals 07119.2 Talent attraction 07219.3 Talent Development 07219.4 Talent rewarding and retention 07319.5 Performance Management
and HR annual review 07319.6 Managing employee transfer and transition 07419.7 Employee and management shareholding 07419.8 International mobility 07519.9 Pensions 07519.10 Communicating with employees 076
20 . Operational review 07720.1 Executive summary 07720.2 Operating performance 07720.3 Revenue 07820.4 Operating margin and margin rate 08520.5 Human Resources review 090

Atos Origin » Annual Report 2009 » 257www.atosorigin.com
32 . Full index
21 . Financial review 09421.1 Income statement 09421.2 Earnings per share 09721.3 Cash flow 09721.4 Net debt 09921.5 Financing policy 099
22 . Financial statements 10022.1 Statutory Auditors report
on the consolidated financial statements for the year ended 31 December 2009 100
22.2 Consolidated financial statements 10222.3 Notes to the consolidated
financial statements 10622.4 Parent company summary
financial statements 15522.5 Statutory auditors’s report
on annual financial statements year ended 31 December 2009 177
22.6 Statutory auditors’ special report on agreements involving members of the Board of Directors 178
23 . Risk analysis 18023.1 Business risks 18023.2 Market risks 18323.4 Claims and litigation 18423.3 Insurance 18423.5 Countries 185
24 . Corporate Governance 18624.1 Report by the Chairman of the Board
of Directors on Corporate Governance and Internal Control 186
24.2 Internal Control 19224.3 Statutory Auditors’ Report, prepared
in accordance with article L. 225-235 of the French Commercial Code on the report prepared by the Chairman of the Board of Directors of Atos Origin with respect to the Internal Control procedures for the preparation and treatment of financial and accounting information 199
24.4 Codes and Charts 20024.5 Executive compensation
and stock ownership 203
25 . Resolutions 21626 . Legal information 218
26.1 Corporate form and purpose 21826.2 Provisions of the articles of association 21826.3 Board of Directors 221
27 . Common stock evolutionand share performance 226
27.1 Trading of shares (Euronext) 22627.2 Common stock 22727.3 Dividends 23627.4 Share trading performance 237
28 . Shareholder relations 24128.1 Communication 24128.2 Contacts 24128.3 Shareholder documentation 24128.4 Registrar 24128.5 Financial calendar 24128.6 Update of documents issued 242
29 . Glossary – definitions 24529.1 Financial terms and key performance
indicators used in this document 24629.2 Market terms 24729.3 Business terms 24829.4 Business KPIs (Key Performance Indicators) 249
30 . Persons responsible for the document and the audit of the financial statements 251
30.1 Person responsible for the Reference Document 251
30.2 Person responsible for the accuracy of the Reference Document 251
30.3 Persons responsible for the audit of the financial statements 252
31 . AMF Cross-reference table 25331.1 Cross-reference table of the reference document 25331.2 Cross-reference table of the financial report 255
32 . Full index 25633 . Contacts 258
31.1 Headquaters 25831.1 Corporate functions 25831.1 Global organisation 258
34 . Locations 259

Atos Origin » Annual Report 2009 » 258
33 . Contacts
33.1 Headquarters 25833.2 Corporate functions 258
33.3 Global organisation 258
31.1 Headquarters
31.1 Corporate functions
31.1 Global organisation
Tour Les Miroirs - Bat C18, avenue d’Alsace92926 Paris La Défense 3 cedexTel: +33 (0)1 55 91 20 00Fax: +33 (0)1 55 91 20 05
FinanceMichel-Alain Proch +33 (0)1 55 91 25 16
Human ResourcesJean-Marie Simon +33 (0)1 55 91 24 27
LegalÉric Sandrin +33 (0)1 55 91 24 35
Internal AuditDaniel Milard +33 (0)1 55 91 29 56
Group Innovation Business Development & StrategyMarc-Henri Desportes +33 (0)1 55 91 23 09
Communication Marie-Tatiana Collombert +33 (0)1 55 91 26 33
Information TechnologyTarek Moustafa +33 (0)1 55 91 24 72
Global PurchasingEnguerrand de Pontevès +33 (0)1 55 91 25 51
Global Consulting, Global Sales and MarketsHervé Payan +33 (0)1 55 91 26 26
Global Systems IntegrationFrancis Meston +33 (0)1 55 91 21 43
Global Managed ServicesÉric Grall +33 (0)1 55 91 27 18
Atos WorldlineDidier Dhennin +33 (0)1 49 00 93 98
Strategic International CustomersFrancis Delacourt +33 (0)1 55 91 26 01
Atos Origin has offices worldwide in order to support its customers. The addresses, phone and fax numbers of our main offices can be found on the Locations page on our website www.atosorigin.com.
Details of current job opportunities can be found in our Careers pages.An email address for general questions and comments about our Internet site can be found at the bottom of the page.

Atos Origin » Annual Report 2009 » 259www.atosorigin.com
34 . Locations
Argentina Vedia 3892 P.B.C1430 DAL - Buenos AiresTel: +54 11 6315 8800
AustriaTechnologiestraße 8/Gebäude DA-1120 WienTel: +43 1 605430
Belgium Da Vincilaan 5B-1935 ZaventemTel: +32 2 690 28 00
Global Consulting & Systems Integration (Global C&SI)Da Vincilaan 5B-1935 ZaventemTel: +32 2 690 28 00
Atos Worldline BelgiumChaussée de Haecht 1442 Haachtsesteenweg 1130 BrusselsTel: +32 (0)2 727 61 11
Brazil Avenida Maria Coelho Aguiar, 215 - Bloco E - 5º andar Cep: 05804-900 - Jardim São Luis - São Paulo – SPTel: +55 11 2183-2344
Rua da Candelária, 65 - 22º andar Cep. 20091-906 – Centro-Rio de Janeiro - RJTel: +55 21 3265-9200
China 5th Floor, Lido Commercial CenterJichang RoadBeijing 100004Tel: +86 10 6437 6668
Hong KongExchange Tower,33 Wang Chiu Road Kowloon Bay, Kowloon, Hong Kong
France
HeadquartersTour les Miroirs - Bât C18, avenue d’Alsace92926 Paris La Défense CedexTel: +33 1 55 91 20 00
Atos Worldline FranceTour Manhattan5-6 place de l’Iris92926 Paris La Défense CedexTel: +33 1 49 00 90 00
Managed ServicesTour Horizon64, rue du 8 Mai 194592025 NanterreTel: +33 1 46 14 50 00
Systems IntegrationTour les Miroirs - Bât C 18, Avenue d’Alsace92926 Paris La Defense CedexTel: +33 1 55 91 20 00
Atos ConsultingTour Manhattan5-6 place de l’Iris92926 Paris La Défense Cedex
GermanyTheodor-Althoff-Str. 47D-45133 EssenTel: +49 (0) 20 14 3050
Atos Worldline GermanyHahnstraße 25D-60528 Frankfurt/MainTel: +49 (0) 69 66 5710
Greece18 Kifisias Avenue151 25 AthensTel +30 210 688 9016
IndiaSDF-IV, Units 126/127SEEPZ, Andheri (east) Mumbai 400 096Tel: +91 22 28 29 0743
IndonesiaWisma Kyoei Prince, #1707Jalan Jenderal Sudirman Kav. 3Jakarta, 10220Tel: +62 21 572 4373
japan20/F Shinjuku Park Tower, 3-7-1Nishi-shinjuku, Shinjuku-ku, Tokyo 163-1020 Tel: +81 3 3344 6631
LuxembourgRue Nicolas Bové 2a1253 LuxembourgTel.: +352 31 36 37 1
Malaysia Suite F01, 1st Floor2310 Century SquareJalan Usahawan63000 CyberjayaSelangor Darul EhsanMalaysiaTel.: +60 3 8318 6100
MoroccoAvenue Annakhil – Espace High Tech Hall B – 5e étageHay Ryad Rabat Tel: +212 (0)5 37 57 79 79
Nearshore Park – Shore 71100, boulevard El Qods – Quartier Sidi MaâroufCasablancaTel: +212 (0)5 29 04 45 29
Polandul. Domaniewska 4102-672 Warszawa (budynek Taurus)Tel: +48 22 606 1900
Singapore 620A Toa Payoh Lorong 1TP4 Level 5Singapore 319762 Tel: +65 6496 3888
South Africa204 Rivonia Road, SandtonPrivate Bag X136Bryanston 2021Tel: +27 11 895 2000
SpainAlbarracín, 2528037 MadridTel: +34 91 440 8800
Atos ConsultingAlbarracín, 2728037 MadridTel: +34 91 214 9500
SwitzerlandIndustriestrasse 198304 WallisellenTel: +41 44 877 6969
Taiwan5F, No.100, Sec.3,Min-Sheng E.Road,Taipei, Taiwan, R.O.C.Tel: +886 - 2 - 2514 2500
The netherlandsPapendorpseweg 933528 BJ UtrechtTel: +31 (0) 88 265 5555
Atos ConsultingPapendorpseweg 933528 BJ UtrechtTel: +31 (0) 88 265 5555
TurkeyKisikli Caddesi N°37Aksel Is Merkezi 2 KatAltunizade 34 662IstanbulTel: +90 216 531 7383
United Kingdom1 Triton SquareRegent’s PlaceLondon NW1 3HGTel: +44 20 7830 4444
USA 5599 San FelipeSuite 300Houston TX, 77056 Tel: +1 713 513 3000

Atos Origin » Annual Report 2009 » 260
This document is a full free translation of the original French text. The original document has been filed with
the Autorité des Marchés Financiers (AMF) on 1 April 2010 under the number D.10-0199, in accordance with
article 212-13 of the AMF’s general regulations. After filing, this document as a Reference Document could
be used to support a financial operation if accompanied by a prospectus duly approved by the AMF.

01 . Business profile 01
02 . ceo message 03
03 . Atos origin in 2009 05
04 . Governance 010
05 . Stock market overview 013
06 . Formation of the Group 016
07 . The iT services market 017
08 . Strategy, organisation and 2010 objectives 027
09 . Top program (Total operational performance) 033
10 . consulting 036
11 . Systems integration 039
12 . Managed Services 043
13 . Hi-Tech Transactional Services 046
14 . Medical Bpo 051
15 . Markets strategy 052
16 . Distinctive offerings and innovation 057
17 . The Scientific community: the 2014 journey 063
18 . corporate Social Responsibility 064
19 . Human Resources 071
20 . operational review 077
21 . Financial review 094
22 . Financial statements 100
23 . Risk analysis 180
24 . corporate Governance 186
25 . Resolutions 216
26 . Legal information 218
27 . common stock evolution and share performance 226
28 . Shareholder relations 241
29 . Glossary – definitions 245
30 . persons responsible for the document and the audit of the financial statements 251
31 . AMF cross-reference table 253
32 . Full index 256
33 . contacts 258
34 . Locations 259
Contents
- editing, writting:
- consulting, design & production: www.terredesienne.com

Reference Document 2009
Ato
s O
rig
in –
Ref
eren
ce D
ocu
men
t 20
09
atosorigin.com
This report utilizes materials (paper, ink, plate and adhesives) that were produced by iso 14001 certified companies and plants. The editing and printing were also done by an imprim’Vert and FsC certified company.
Related Documents