Atomistic Simulations of the Surface Coverage of Large Gold Nanocrystals Takieddine Djebaili, † Johannes Richardi,* ,† Ste ́ phane Abel, ‡ and Massimo Marchi ‡ † Laboratoire des Maté riaux Me ́ soscopiques et Nanome ́ triques (LM2N), UMR CNRS 7070, Universite ́ Pierre et Marie Curie, bâ t F, BP 52, 4 Place Jussieu, 75252 Paris Cedex 05, France ‡ Commissariat a ̀ l’Energie Atomique et aux Energies Alternatives, DSV/iBiTEC-S/SB2SM/LBMS & CNRS UMR 8221, Saclay, France * S Supporting Information ABSTRACT: Here, the adsorption of alkanethiols (from ethane to dodecanethiol) on icosahedral gold nanocrystals with diameters up to 10 nm is studied by molecular dynamics simulations in a vacuum. The surface coverage of the nanocrystals obtained in the simulations is in good agreement with experimental data. We show that the average surface per adsorbed thiol does not markedly depend on the nanocrystal size and ligand and is only about 10% lower than the value observed on a flat Au(111) surface. We observe two different molecular organizations of the thiolates on the edges and in the centers of the nanocrystal facets. The incompatibility between both organizations explains the fact that the formation of self-assembled monolayers usually observed on flat Au(111) surfaces is hindered for nanocrystals smaller than 6 nm. We also show that the organization of thiolates on the edges is at the origin of the lower average surface per adsorbed thiol found for the nanocrystal. 1. INTRODUCTION Because of their unique size-tunable properties, gold nano- crystals (AuNC) are currently studied for various applications including catalysis, electronic and photonic devices, and biomedical sensors. 1−4 Thus, their good biocompatibility lets them also be good candidates for therapeutic drug delivery in cancer diagnostics and therapy. 3 To prevent the aggregation of the AuNC, organic ligands are used to stabilize them. 1 Among these ligands, we can cite alkanethiols, amines, and phosphines. These ligands are able to form compact monolayers at the nanoparticle surface due to the high affinity between the NC gold atoms and the ligand head groups. The formation of these ligand monolayers on solid gold surfaces has been widely studied in the literature. 5−10 It was found that these monolayers are usually highly ordered molecular films called self-assembled monolayers (SAM) (see Figure 1). Figure 1A shows that the thiol head groups form a hexagonal overlayer structure denoted by (√3 × √3)R30°. The alkane chains are tilted by an angle of about 30° with respect to the surface normal. 5 DFT calculations and STM experiments 11,12 have shown that the adsorbed thiolates are between the three gold atoms, but the geometry of adsorption is better described by a shifted bridge position. Classical simulations often yield a hollow position as preferred positions for the thiol atoms (see Figure 1), which is a drawback of the interaction model we use. Several theoretical and experimental studies 7,13−20 have shown the importance of surface reconstruction for the formation of SAMs with the presence of adatoms and vacancies. A very recent simulation study allowing surface reconstruction 9 indicates that the vacancies and adatoms may form islands and we might obtain a slightly perturbed (√3 × √3)R30° lattice. However, one has to be very careful with these first results, which have to be confirmed in the future. Experiments have shown significant differences between the monolayers of alkanethiols formed on gold nanocrystals (NCs) and flat surfaces. 21−27 Elemental analysis using transmission electron microscopy for alkanethiol-derivated gold clusters with diameters of 2 nm gives a lower average surface per adsorbed Received: April 8, 2013 Revised: July 12, 2013 Published: July 24, 2013 Figure 1. Self-assembled monolayer on a flat Au(111) surface (A) and on the edge of NC facets (B) as obtained by classical simulations: Positions of the SH groups of the alkanethiols are shown by yellow spots. Article pubs.acs.org/JPCC © 2013 American Chemical Society 17791 dx.doi.org/10.1021/jp403442s | J. Phys. Chem. C 2013, 117, 17791−17800

Welcome message from author
This document is posted to help you gain knowledge. Please leave a comment to let me know what you think about it! Share it to your friends and learn new things together.
Transcript
Atomistic Simulations of the Surface Coverage of Large GoldNanocrystalsTakieddine Djebaili,† Johannes Richardi,*,† Stephane Abel,‡ and Massimo Marchi‡
†Laboratoire des Materiaux Mesoscopiques et Nanometriques (LM2N), UMR CNRS 7070, Universite Pierre et Marie Curie, bat F,BP 52, 4 Place Jussieu, 75252 Paris Cedex 05, France‡Commissariat a l’Energie Atomique et aux Energies Alternatives, DSV/iBiTEC-S/SB2SM/LBMS & CNRS UMR 8221, Saclay,France
*S Supporting Information
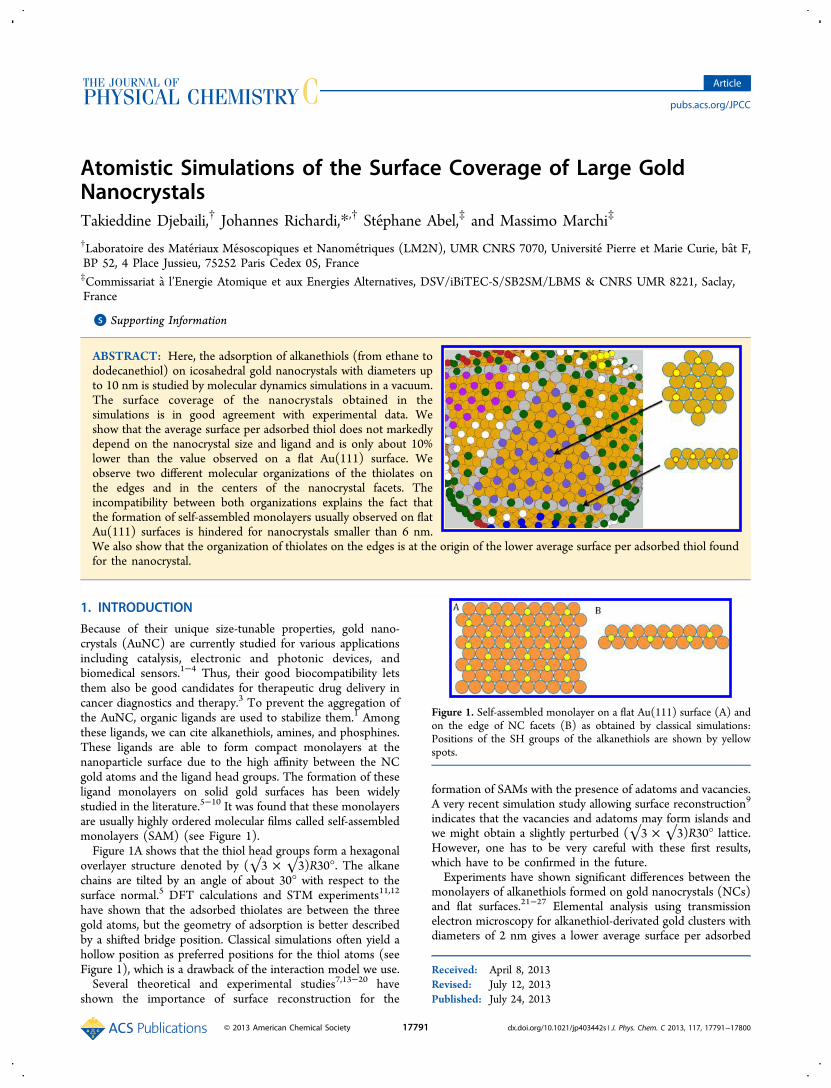
ABSTRACT: Here, the adsorption of alkanethiols (from ethane tododecanethiol) on icosahedral gold nanocrystals with diameters upto 10 nm is studied by molecular dynamics simulations in a vacuum.The surface coverage of the nanocrystals obtained in thesimulations is in good agreement with experimental data. Weshow that the average surface per adsorbed thiol does not markedlydepend on the nanocrystal size and ligand and is only about 10%lower than the value observed on a flat Au(111) surface. Weobserve two different molecular organizations of the thiolates onthe edges and in the centers of the nanocrystal facets. Theincompatibility between both organizations explains the fact thatthe formation of self-assembled monolayers usually observed on flatAu(111) surfaces is hindered for nanocrystals smaller than 6 nm.We also show that the organization of thiolates on the edges is at the origin of the lower average surface per adsorbed thiol foundfor the nanocrystal.
1. INTRODUCTION
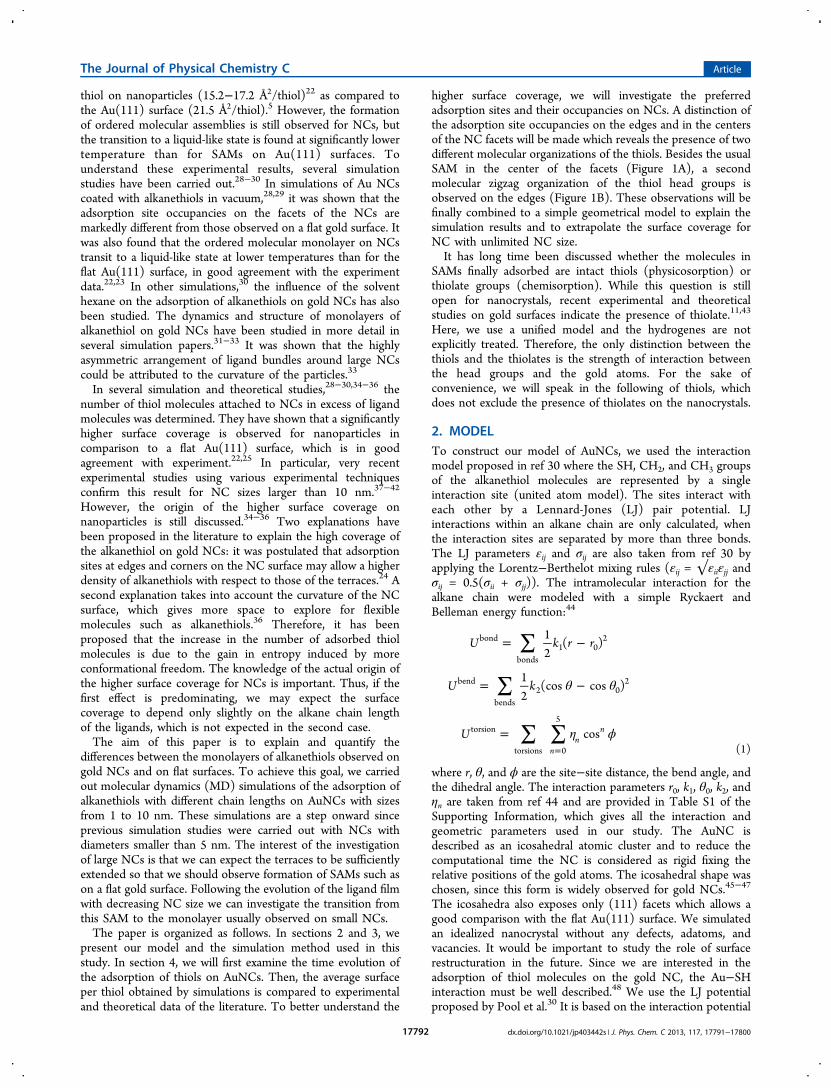
Because of their unique size-tunable properties, gold nano-crystals (AuNC) are currently studied for various applicationsincluding catalysis, electronic and photonic devices, andbiomedical sensors.1−4 Thus, their good biocompatibility letsthem also be good candidates for therapeutic drug delivery incancer diagnostics and therapy.3 To prevent the aggregation ofthe AuNC, organic ligands are used to stabilize them.1 Amongthese ligands, we can cite alkanethiols, amines, and phosphines.These ligands are able to form compact monolayers at thenanoparticle surface due to the high affinity between the NCgold atoms and the ligand head groups. The formation of theseligand monolayers on solid gold surfaces has been widelystudied in the literature.5−10 It was found that these monolayersare usually highly ordered molecular films called self-assembledmonolayers (SAM) (see Figure 1).Figure 1A shows that the thiol head groups form a hexagonal
overlayer structure denoted by (√3 × √3)R30°. The alkanechains are tilted by an angle of about 30° with respect to thesurface normal.5 DFT calculations and STM experiments11,12
have shown that the adsorbed thiolates are between the threegold atoms, but the geometry of adsorption is better describedby a shifted bridge position. Classical simulations often yield ahollow position as preferred positions for the thiol atoms (seeFigure 1), which is a drawback of the interaction model we use.Several theoretical and experimental studies7,13−20 have
shown the importance of surface reconstruction for the
formation of SAMs with the presence of adatoms and vacancies.A very recent simulation study allowing surface reconstruction9
indicates that the vacancies and adatoms may form islands andwe might obtain a slightly perturbed (√3 × √3)R30° lattice.However, one has to be very careful with these first results,which have to be confirmed in the future.Experiments have shown significant differences between the
monolayers of alkanethiols formed on gold nanocrystals (NCs)and flat surfaces.21−27 Elemental analysis using transmissionelectron microscopy for alkanethiol-derivated gold clusters withdiameters of 2 nm gives a lower average surface per adsorbed
Received: April 8, 2013Revised: July 12, 2013Published: July 24, 2013
Figure 1. Self-assembled monolayer on a flat Au(111) surface (A) andon the edge of NC facets (B) as obtained by classical simulations:Positions of the SH groups of the alkanethiols are shown by yellowspots.
Article
pubs.acs.org/JPCC
© 2013 American Chemical Society 17791 dx.doi.org/10.1021/jp403442s | J. Phys. Chem. C 2013, 117, 17791−17800
thiol on nanoparticles (15.2−17.2 Å2/thiol)22 as compared tothe Au(111) surface (21.5 Å2/thiol).5 However, the formationof ordered molecular assemblies is still observed for NCs, butthe transition to a liquid-like state is found at significantly lowertemperature than for SAMs on Au(111) surfaces. Tounderstand these experimental results, several simulationstudies have been carried out.28−30 In simulations of Au NCscoated with alkanethiols in vacuum,28,29 it was shown that theadsorption site occupancies on the facets of the NCs aremarkedly different from those observed on a flat gold surface. Itwas also found that the ordered molecular monolayer on NCstransit to a liquid-like state at lower temperatures than for theflat Au(111) surface, in good agreement with the experimentdata.22,23 In other simulations,30 the influence of the solventhexane on the adsorption of alkanethiols on gold NCs has alsobeen studied. The dynamics and structure of monolayers ofalkanethiol on gold NCs have been studied in more detail inseveral simulation papers.31−33 It was shown that the highlyasymmetric arrangement of ligand bundles around large NCscould be attributed to the curvature of the particles.33
In several simulation and theoretical studies,28−30,34−36 thenumber of thiol molecules attached to NCs in excess of ligandmolecules was determined. They have shown that a significantlyhigher surface coverage is observed for nanoparticles incomparison to a flat Au(111) surface, which is in goodagreement with experiment.22,25 In particular, very recentexperimental studies using various experimental techniquesconfirm this result for NC sizes larger than 10 nm.37−42
However, the origin of the higher surface coverage onnanoparticles is still discussed.34−36 Two explanations havebeen proposed in the literature to explain the high coverage ofthe alkanethiol on gold NCs: it was postulated that adsorptionsites at edges and corners on the NC surface may allow a higherdensity of alkanethiols with respect to those of the terraces.24 Asecond explanation takes into account the curvature of the NCsurface, which gives more space to explore for flexiblemolecules such as alkanethiols.36 Therefore, it has beenproposed that the increase in the number of adsorbed thiolmolecules is due to the gain in entropy induced by moreconformational freedom. The knowledge of the actual origin ofthe higher surface coverage for NCs is important. Thus, if thefirst effect is predominating, we may expect the surfacecoverage to depend only slightly on the alkane chain lengthof the ligands, which is not expected in the second case.The aim of this paper is to explain and quantify the
differences between the monolayers of alkanethiols observed ongold NCs and on flat surfaces. To achieve this goal, we carriedout molecular dynamics (MD) simulations of the adsorption ofalkanethiols with different chain lengths on AuNCs with sizesfrom 1 to 10 nm. These simulations are a step onward sinceprevious simulation studies were carried out with NCs withdiameters smaller than 5 nm. The interest of the investigationof large NCs is that we can expect the terraces to be sufficientlyextended so that we should observe formation of SAMs such ason a flat gold surface. Following the evolution of the ligand filmwith decreasing NC size we can investigate the transition fromthis SAM to the monolayer usually observed on small NCs.The paper is organized as follows. In sections 2 and 3, we
present our model and the simulation method used in thisstudy. In section 4, we will first examine the time evolution ofthe adsorption of thiols on AuNCs. Then, the average surfaceper thiol obtained by simulations is compared to experimentaland theoretical data of the literature. To better understand the
higher surface coverage, we will investigate the preferredadsorption sites and their occupancies on NCs. A distinction ofthe adsorption site occupancies on the edges and in the centersof the NC facets will be made which reveals the presence of twodifferent molecular organizations of the thiols. Besides the usualSAM in the center of the facets (Figure 1A), a secondmolecular zigzag organization of the thiol head groups isobserved on the edges (Figure 1B). These observations will befinally combined to a simple geometrical model to explain thesimulation results and to extrapolate the surface coverage forNC with unlimited NC size.It has long time been discussed whether the molecules in
SAMs finally adsorbed are intact thiols (physicosorption) orthiolate groups (chemisorption). While this question is stillopen for nanocrystals, recent experimental and theoreticalstudies on gold surfaces indicate the presence of thiolate.11,43
Here, we use a unified model and the hydrogenes are notexplicitly treated. Therefore, the only distinction between thethiols and the thiolates is the strength of interaction betweenthe head groups and the gold atoms. For the sake ofconvenience, we will speak in the following of thiols, whichdoes not exclude the presence of thiolates on the nanocrystals.
2. MODELTo construct our model of AuNCs, we used the interactionmodel proposed in ref 30 where the SH, CH2, and CH3 groupsof the alkanethiol molecules are represented by a singleinteraction site (united atom model). The sites interact witheach other by a Lennard-Jones (LJ) pair potential. LJinteractions within an alkane chain are only calculated, whenthe interaction sites are separated by more than three bonds.The LJ parameters εij and σij are also taken from ref 30 byapplying the Lorentz−Berthelot mixing rules (εij = √εiiεjj andσij = 0.5(σii + σjj)). The intramolecular interaction for thealkane chain were modeled with a simple Ryckaert andBelleman energy function:44
∑
∑
∑ ∑
θ θ
η ϕ
= −
= −
==
U k r r
U k
U
12
( )
12
(cos cos )
cosn
nn
bond
bonds1 0
2
bend
bends2 0
2
torsion
torsions 0
5
(1)
where r, θ, and ϕ are the site−site distance, the bend angle, andthe dihedral angle. The interaction parameters r0, k1, θ0, k2, andηn are taken from ref 44 and are provided in Table S1 of theSupporting Information, which gives all the interaction andgeometric parameters used in our study. The AuNC isdescribed as an icosahedral atomic cluster and to reduce thecomputational time the NC is considered as rigid fixing therelative positions of the gold atoms. The icosahedral shape waschosen, since this form is widely observed for gold NCs.45−47
The icosahedra also exposes only (111) facets which allows agood comparison with the flat Au(111) surface. We simulatedan idealized nanocrystal without any defects, adatoms, andvacancies. It would be important to study the role of surfacerestructuration in the future. Since we are interested in theadsorption of thiol molecules on the gold NC, the Au−SHinteraction must be well described.48 We use the LJ potentialproposed by Pool et al.30 It is based on the interaction potential
The Journal of Physical Chemistry C Article
dx.doi.org/10.1021/jp403442s | J. Phys. Chem. C 2013, 117, 17791−1780017792
between a Au(111) surface and the SH and CHx groups ofalkanethiols derived by Hautman and Klein49 from quantumchemical calculations. Within the Hautman−Klein model, theAu(111) plane is handled as a flat surface. To carry outatomistic simulations, Pool et al.30 described the Au(111) slabas an assembly of gold atoms and fitted the parameters of aposition averaged LJ interaction to the Hautman−Kleinpotential. Because of the Boltzmann factor applied during theaveraging, the energies and, thus, the LJ parameters depend onthe temperature. So we used the values of εij and σij obtained at300 K. Please note that the Morse potential for the Au−SHinteraction used in former simulations28,29,50 yields anattraction almost twice as strong compared to the Hautman−Klein potential.30 All LJ potentials are truncated at a cutoffdistance of 12.0 Å.
3. SIMULATION METHOD
To set up the simulation systems and do the analysis of thetrajectories, we used the simulation code NATOMOSdeveloped in our laboratory. This program was initially writtento carry out simple molecular dynamics and Monte Carlosimulations of small molecular system (including metallic NCs,flexible ligands, solvents). Since in this work, we simulate largeAuNCs (up to 60 000 atoms), we decided to use the highlyoptimized GROMACS 4.5.5 MD package51 to carry out thesimulations with a large number of computer cores. Within thestatistical accuracy of the methods NATOMOS and GRO-MACS yield the same energetical and structural results asshown in Figure S1 of the Supporting Information.To study the adsorption of alkanethiols, a bare gold NC was
put in the center of the simulation box. Then, the box was filled
with a number of thiol molecules significantly larger than theone obtained from average surface per thiol usually found forNCs (16−18 Å2). After each simulation it was checked that anexcess of nonadsorbed thiol molecules was in the box. Thesystem was allowed to evolve at 300 K. To avoid interactionsbetween periodic images of the NCs, a sufficiently large box hasbeen chosen. A time step of 1.0 fs is applied, and thetemperature is kept constant using a Nose−Hoover thermo-stat51 with the time constant of 0.4 ps. The equilibration takesmuch time, and a sufficiently long simulation run of 30 to 180ns is necessary to obtain a stable number of thiols adsorbed onthe gold NC, in particular for long alkane chains and large NCs.We have checked that the number of adsorbed thiols and allderived properties are well stabilized. In particular, transitionsof head groups from one adsorption site to another are veryrare events, but we have controlled that they occur severaltimes during our simulations.To check the dependence of the results with the excess of
thiol molecules, simulations were carried out with different thiolconcentrations. We did not observe a significant variation of thesimulation results as a function of the thiol number. In Table S2of the Supporting Information, the parameters of simulatedsystems discussed in the following such as the number of goldatoms and thiols and the box size are given. For this work, weexamine the adsorption of ethane, butane, octane, anddodecanethiol. For ethane and butanethiols all available NCsizes for closed icosahedra up to 10 nm were studied, whereasfor the two longer alkanethiols we restricted the simulations toAuNCs with diameters of 1.7, 2.6, 3.6, 5.0, 6.8, and 10.1 nm. Asummary of all the simulations carried out in this study is givenin Table S2. The structural results were obtained and averaged
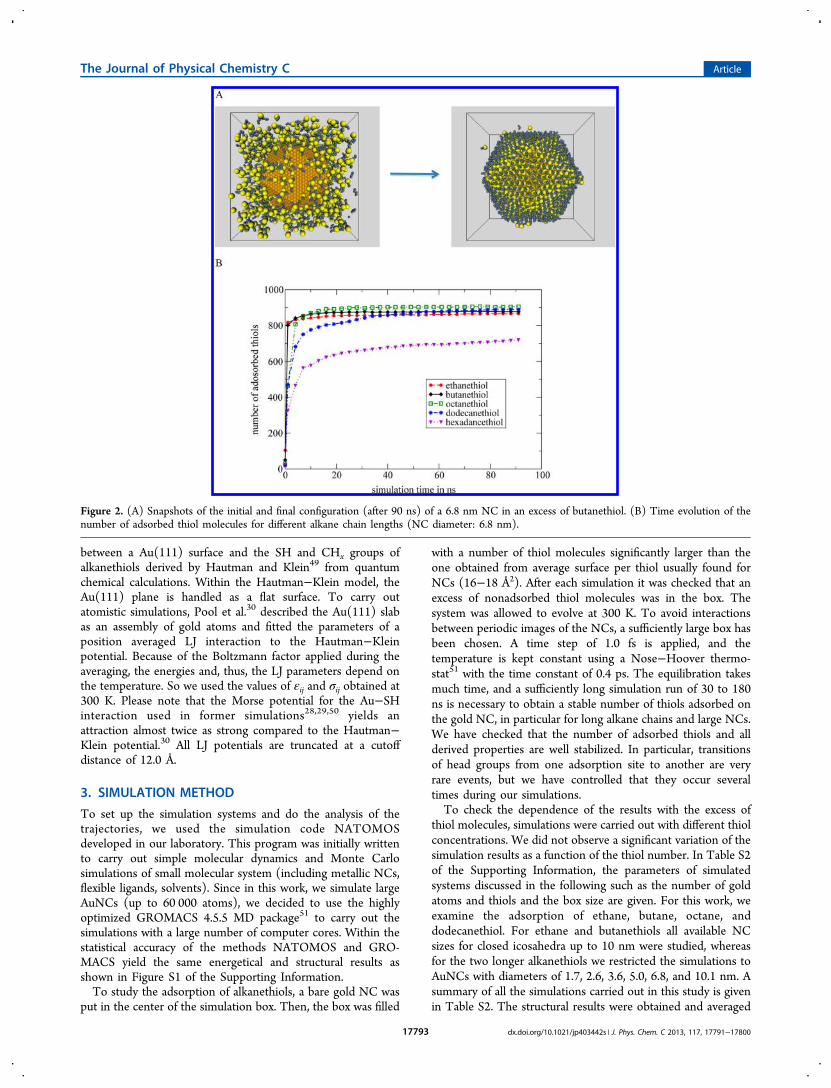
Figure 2. (A) Snapshots of the initial and final configuration (after 90 ns) of a 6.8 nm NC in an excess of butanethiol. (B) Time evolution of thenumber of adsorbed thiol molecules for different alkane chain lengths (NC diameter: 6.8 nm).
The Journal of Physical Chemistry C Article
dx.doi.org/10.1021/jp403442s | J. Phys. Chem. C 2013, 117, 17791−1780017793

from the last 3 ns of each simulation and are given in TablesS3−S5.
4. RESULTS AND DISCUSSION4.1. Time Evolution of the Adsorption of Thiols on
NCs. Figure 2A shows typical initial and final configurations fora gold nanocrystal of 6.8 nm in an excess of butanethiols. InFigure 2B, we present the number of thiol molecules adsorbedon the NC surface as a function of the simulation time for fivealkanethiols and a NC diameter of 6.81 nm as an example. Athiol molecule is counted as adsorbed whenever the distancebetween the SH group and a gold atom on the NC surface issmaller than the equilibrium distance of the LJ potential within10% (1.1 26 σSH,Au = 3.27 Å). Please note that the results arenot sensible to the choice of this limit whenever it is larger than3.27 Å. Figure 2B shows that the adsorption process can beseparated into two processes. A first very rapid process thattakes ∼5 ns when a large number of thiol molecules adsorb onthe NC surface. This process is followed by a second step thattakes more than 30 ns, where the reorganization of thealkanethiol monolayer takes place. During this process thenumber of adsorbed thiols gradually increases to reach asaturation value around 900. For ethane and butanethiol thisprocess takes about 30 ns, whereas for dodecanethiol only afterapproximately 90 ns the saturation is reached. One can remarkthat for hexadecanethiol even after 90 ns the number ofadsorbed thiols increases. We can explain this longer time bythe fact that adsorption is hindered due to the fact that the longalkane chains form bundles which is not observed for theshorter thiols. These bundles hinder the access of thiol on theNC surface. Therefore, we restrict our study to alkane chainssmaller than hexadecane.4.2. Determination of the Average Surface Per
Adsorbed Thiol and Comparison with Experimentsand Theories. In Figure 3, the average number of adsorbed
thiol molecules is plotted as a function of the NC size for thedifferent alkanethiols. The figure shows that the number ofadsorbed thiols depends only slightly on the alkane chainlength. For larger NCs on increasing the alkane chain lengthfrom ethanethiol to octanethiol the number of adsorbed thiolbecomes slightly larger, while it decreases for dodecanethiol.The increase of the number of adsorbed thiol with the alkane
chain length may be explained by more favorable van der Waalsinteraction or an entropy increase induced by more conforma-tional freedom. We cannot exclude that the smaller number ofdodecanethiol adsorbed is related to a very slow saturation ofthe monolayer for this thiol as observed in Figure 2B. Pleasenote that in all the figures hereafter results for identicalalkanethiols are always labeled by the same symbols. Ourresults for small NC (<4 nm diameter) are in good agreementwith those obtained in the literature using the same interactionmodel.25 In Figure S2, the ratios between the number ofadsorbed thiols and the surface gold atoms are compared toresults from simulations using other interaction model.28,35 Theresults are in agreement within 10%, which shows that theinteraction model may have an influence on the number ofadsorbed thiols.The surface coverage of thiol molecules on NC surfaces is
often experimentally determined by assuming a spherical shapeof the particles and estimating its surface from the NC diametermeasured e.g. by transmission electron microscopy.22 In orderto compare our results with the experimental values, thesimulation data have been analyzed in the same way. The goldNC surface is taken from that of a sphere where its radius iscalculated as the square root of the average square distancesbetween the center and the surface atoms including one van derWaals radius of gold (1.66 Å). For any NC size and coating, thesurfaces obtained in this way are then divided by the number ofadsorbed thiol molecules. In Figure 4A, we plot the averagesurface per adsorbed thiol obtained in this way as a function ofthe AuNC diameter for each alkanethiol. The average surfaceper thiol increases with NC size except for NC < 1 nm but isalways significantly smaller than 21.5 Å2/thiol observed for flatAu(111) surfaces. At a NC size around 2 nm we obtain asurface coverage of 16 Å2/thiol, in reasonable agreement withthe values of 17.2 ± 0.4 and 15.2 ± 0.4 Å2/thiol found byexperiments for tetradecane and hexadecanethiol, respec-tively.22 To our mind, the experimental accuracy given in ref22 is small, since the error of the measured data involved in thedetermination of the surface coverage is rather large such as themeasured NC radii. Moreover, the NC shape in theexperiments is usually better described by a truncatedoctahedron than an icosahedron, which may influence thesurface coverage. To compare our data with the experimentalresults obtained by thermogravimetry in ref 25, we havecalculated the mass percentage of the organic ligand for thedodecanethiol-coated NCs. The results are shown in Figure S3.The experimental results markedly fluctuate for a given NCsize, but they are again in reasonable agreement with thesimulations.A molecular mean-field theory was recently used to predict
the average surface per thiol.36 For octanethiol, the theoreticalresults increase from 17 to 19 Å2/thiol when the NC diametergrows from 5 to 10 nm. Such an increase is not observed in oursimulations. The surface per thiol for dodecanethiol is about 2Å2 larger than for octanethiol, which is also not found in oursimulations. The disagreement between the mean-field theoryapproach and our simulation results may be due to theassumption of a spherical shape within the mean-field theory. Ina recent simulation study,34 the average surface per thiol wascalculated modeling the nanoparticles as perfect spheres. ForNC diameters between 1.4 and 4.4 nm, the computed surfaceper thiol increases from 10 to 14 Å2, which is significantlysmaller than the values between 15 and 16 Å2 observed in our
Figure 3. Number of adsorbed thiol molecules as a function of the NCsize and ligand. The pink circles show the results obtained in ref 30.The lines connecting the symbols only serve to better see theevolution of the values.
The Journal of Physical Chemistry C Article
dx.doi.org/10.1021/jp403442s | J. Phys. Chem. C 2013, 117, 17791−1780017794

simulations. This may show that the description of nano-particles as spherical particles influences the surface coverage.To better understand the actual origin of the difference in
surface coverage between nanoparticles and flat gold surfaces,the nanoparticles will now be more correctly analyzed as acrystal made of facets, edges, and corners and not as a spherical
object. For that, the NC surface Sacc accessible for theadsorption of the thiols is estimated as follows. This accessiblesurface corresponds to that of an icosahedron which envelopsthe nanocrystal and on the surface of which the SH groups aresitting. The distance between the SH groups on this outericosahedron and the closest gold atoms on the NC surface maybe approximated as the equilibrium SH−Au distance ( 26 σSH,Au= 2.97 Å). To correctly determine the size of the outericosahedron, an icosahedron made of 12 SH groups on thevertices is constructed. The distance between the SH groupsand the closest gold atoms on the vertices of the NC is fixed at
26 σSH,Au By a geometrical analysis of this icosahedron, it maybe shown that its surface can be calculated from
=S l203
4acc NC2
(2)
where the edge length of the icosahedron is calculated from lNC= nAu × 2.88 Å + 3.13 Å and nAu is the number of gold atoms onthe NC edge.In Figure 4B, the average surface per adsorbed thiol obtained
in this way is plotted for the different NC sizes and coatings. Itis markedly larger than the one found in Figure 4A modelingthe NC as a sphere, but it is still about 10% smaller than thesurface per thiol observed on Au(111) surfaces. Moreover, thesurface coverage surprisingly only slightly varies with NC sizesfor diameters larger than 1 nm. This leads to an easy equationfor the number of adsorbed thiol molecules valid for NC sizesfrom 2 to 10 nm: 19 Å2 × Sacc.
4.3. Preferred Adsorption Sites and Their Occupation.To better understand what happens on the NC surface, wehave to know the sites on the NC where thiol moleculespreferentially adsorb. As explained in ref 30 and shown inFigure 1A, the surface of the gold NCs is described as acorrugated surface made of gold atoms. On Au(111) surfaces,the head groups of the thiols occupy the hole sites made bythree gold atoms (see Figure 1A). The snapshot of thepositions of the SH groups on NC facets in Figure 5A indicatesthat also for NCs these sites are preferred. Note that in Figure5A the gold atoms on the facet edges are colored in gray. Also,the SH groups on the edges and centers are shown in differentcolors. To calculate the occupation frequency of the adsorptionsites, we used the same distance criterion such as in section 4.1.Figure 6 shows that the adsorption sites made of three gold
Figure 4. Average surface per adsorbed thiol: in (A), the NC ismodeled as a metallic sphere for which the surface area is calculatedfrom the van der Waals radius, whereas in (B), NC surface is describedas a icosahedron (see main text for details).
Figure 5. Snapshot of the facet of a NC taken at the end of the simulation for AuNC with a diameter of 6.8 nm. The gold atoms on the edges of theNC are in gray. (A) The positions of the adsorbed SH groups are shown in yellow (on the facet center) and orange (on the edges). (B) SAManalysis of the thiol monolayer on the NC. The same color marks SH groups belonging to the same SAM. SH groups in dark green do notparticipate in any SAMs.
The Journal of Physical Chemistry C Article
dx.doi.org/10.1021/jp403442s | J. Phys. Chem. C 2013, 117, 17791−1780017795
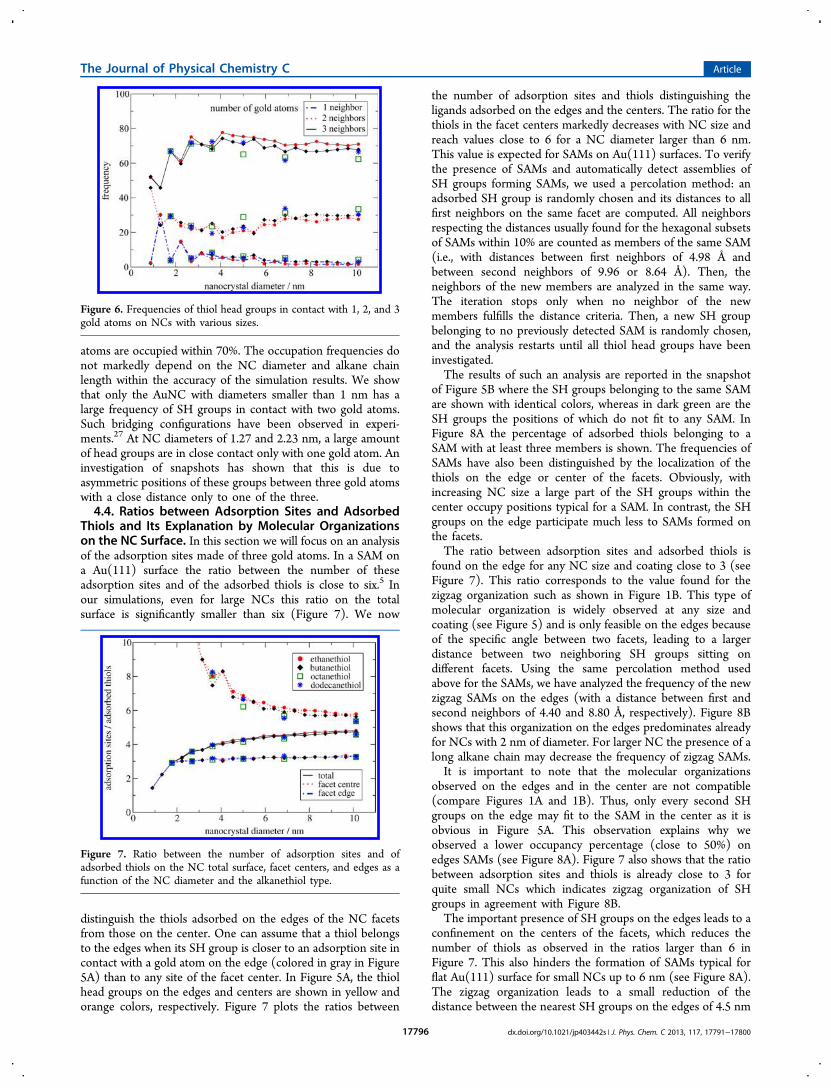
atoms are occupied within 70%. The occupation frequencies donot markedly depend on the NC diameter and alkane chainlength within the accuracy of the simulation results. We showthat only the AuNC with diameters smaller than 1 nm has alarge frequency of SH groups in contact with two gold atoms.Such bridging configurations have been observed in experi-ments.27 At NC diameters of 1.27 and 2.23 nm, a large amountof head groups are in close contact only with one gold atom. Aninvestigation of snapshots has shown that this is due toasymmetric positions of these groups between three gold atomswith a close distance only to one of the three.4.4. Ratios between Adsorption Sites and Adsorbed
Thiols and Its Explanation by Molecular Organizationson the NC Surface. In this section we will focus on an analysisof the adsorption sites made of three gold atoms. In a SAM ona Au(111) surface the ratio between the number of theseadsorption sites and of the adsorbed thiols is close to six.5 Inour simulations, even for large NCs this ratio on the totalsurface is significantly smaller than six (Figure 7). We now
distinguish the thiols adsorbed on the edges of the NC facetsfrom those on the center. One can assume that a thiol belongsto the edges when its SH group is closer to an adsorption site incontact with a gold atom on the edge (colored in gray in Figure5A) than to any site of the facet center. In Figure 5A, the thiolhead groups on the edges and centers are shown in yellow andorange colors, respectively. Figure 7 plots the ratios between
the number of adsorption sites and thiols distinguishing theligands adsorbed on the edges and the centers. The ratio for thethiols in the facet centers markedly decreases with NC size andreach values close to 6 for a NC diameter larger than 6 nm.This value is expected for SAMs on Au(111) surfaces. To verifythe presence of SAMs and automatically detect assemblies ofSH groups forming SAMs, we used a percolation method: anadsorbed SH group is randomly chosen and its distances to allfirst neighbors on the same facet are computed. All neighborsrespecting the distances usually found for the hexagonal subsetsof SAMs within 10% are counted as members of the same SAM(i.e., with distances between first neighbors of 4.98 Å andbetween second neighbors of 9.96 or 8.64 Å). Then, theneighbors of the new members are analyzed in the same way.The iteration stops only when no neighbor of the newmembers fulfills the distance criteria. Then, a new SH groupbelonging to no previously detected SAM is randomly chosen,and the analysis restarts until all thiol head groups have beeninvestigated.The results of such an analysis are reported in the snapshot
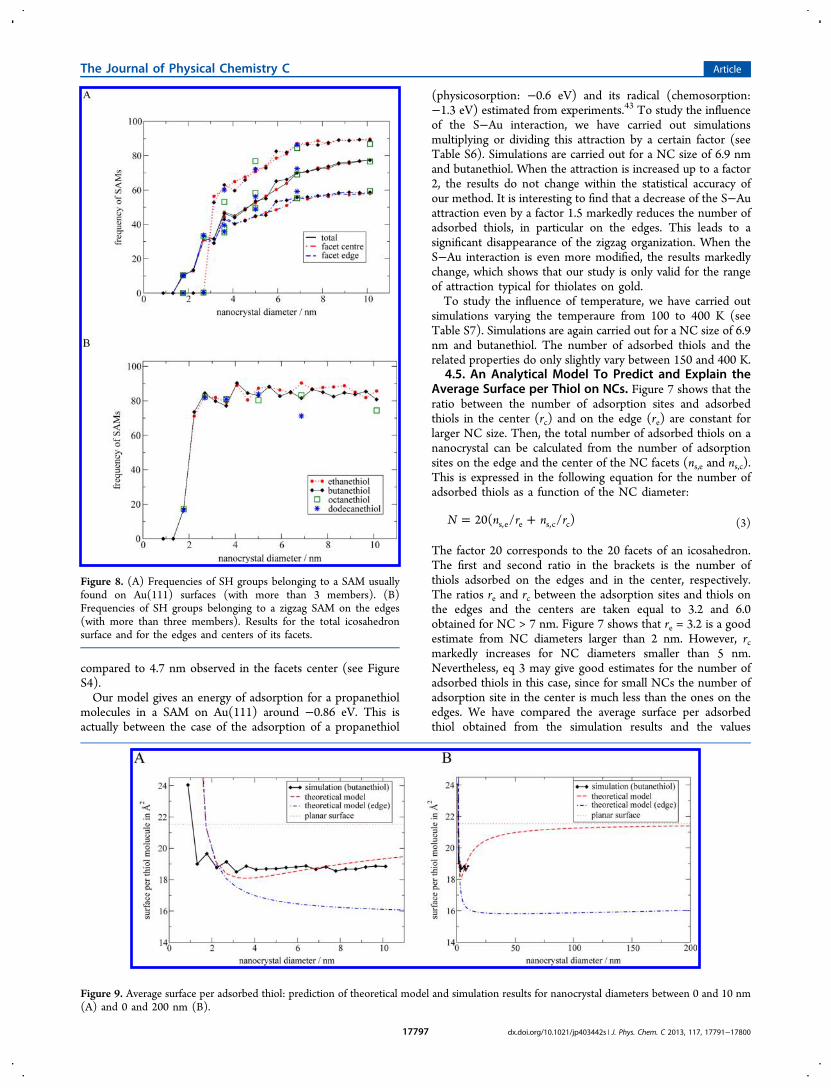
of Figure 5B where the SH groups belonging to the same SAMare shown with identical colors, whereas in dark green are theSH groups the positions of which do not fit to any SAM. InFigure 8A the percentage of adsorbed thiols belonging to aSAM with at least three members is shown. The frequencies ofSAMs have also been distinguished by the localization of thethiols on the edge or center of the facets. Obviously, withincreasing NC size a large part of the SH groups within thecenter occupy positions typical for a SAM. In contrast, the SHgroups on the edge participate much less to SAMs formed onthe facets.The ratio between adsorption sites and adsorbed thiols is
found on the edge for any NC size and coating close to 3 (seeFigure 7). This ratio corresponds to the value found for thezigzag organization such as shown in Figure 1B. This type ofmolecular organization is widely observed at any size andcoating (see Figure 5) and is only feasible on the edges becauseof the specific angle between two facets, leading to a largerdistance between two neighboring SH groups sitting ondifferent facets. Using the same percolation method usedabove for the SAMs, we have analyzed the frequency of the newzigzag SAMs on the edges (with a distance between first andsecond neighbors of 4.40 and 8.80 Å, respectively). Figure 8Bshows that this organization on the edges predominates alreadyfor NCs with 2 nm of diameter. For larger NC the presence of along alkane chain may decrease the frequency of zigzag SAMs.It is important to note that the molecular organizations
observed on the edges and in the center are not compatible(compare Figures 1A and 1B). Thus, only every second SHgroups on the edge may fit to the SAM in the center as it isobvious in Figure 5A. This observation explains why weobserved a lower occupancy percentage (close to 50%) onedges SAMs (see Figure 8A). Figure 7 also shows that the ratiobetween adsorption sites and thiols is already close to 3 forquite small NCs which indicates zigzag organization of SHgroups in agreement with Figure 8B.The important presence of SH groups on the edges leads to a
confinement on the centers of the facets, which reduces thenumber of thiols as observed in the ratios larger than 6 inFigure 7. This also hinders the formation of SAMs typical forflat Au(111) surface for small NCs up to 6 nm (see Figure 8A).The zigzag organization leads to a small reduction of thedistance between the nearest SH groups on the edges of 4.5 nm
Figure 6. Frequencies of thiol head groups in contact with 1, 2, and 3gold atoms on NCs with various sizes.
Figure 7. Ratio between the number of adsorption sites and ofadsorbed thiols on the NC total surface, facet centers, and edges as afunction of the NC diameter and the alkanethiol type.
The Journal of Physical Chemistry C Article
dx.doi.org/10.1021/jp403442s | J. Phys. Chem. C 2013, 117, 17791−1780017796
compared to 4.7 nm observed in the facets center (see FigureS4).Our model gives an energy of adsorption for a propanethiol
molecules in a SAM on Au(111) around −0.86 eV. This isactually between the case of the adsorption of a propanethiol
(physicosorption: −0.6 eV) and its radical (chemosorption:−1.3 eV) estimated from experiments.43 To study the influenceof the S−Au interaction, we have carried out simulationsmultiplying or dividing this attraction by a certain factor (seeTable S6). Simulations are carried out for a NC size of 6.9 nmand butanethiol. When the attraction is increased up to a factor2, the results do not change within the statistical accuracy ofour method. It is interesting to find that a decrease of the S−Auattraction even by a factor 1.5 markedly reduces the number ofadsorbed thiols, in particular on the edges. This leads to asignificant disappearance of the zigzag organization. When theS−Au interaction is even more modified, the results markedlychange, which shows that our study is only valid for the rangeof attraction typical for thiolates on gold.To study the influence of temperature, we have carried out
simulations varying the temperaure from 100 to 400 K (seeTable S7). Simulations are again carried out for a NC size of 6.9nm and butanethiol. The number of adsorbed thiols and therelated properties do only slightly vary between 150 and 400 K.
4.5. An Analytical Model To Predict and Explain theAverage Surface per Thiol on NCs. Figure 7 shows that theratio between the number of adsorption sites and adsorbedthiols in the center (rc) and on the edge (re) are constant forlarger NC size. Then, the total number of adsorbed thiols on ananocrystal can be calculated from the number of adsorptionsites on the edge and the center of the NC facets (ns,e and ns,c).This is expressed in the following equation for the number ofadsorbed thiols as a function of the NC diameter:
= +N n r n r20( / / )s,e e s,c c (3)
The factor 20 corresponds to the 20 facets of an icosahedron.The first and second ratio in the brackets is the number ofthiols adsorbed on the edges and in the center, respectively.The ratios re and rc between the adsorption sites and thiols onthe edges and the centers are taken equal to 3.2 and 6.0obtained for NC > 7 nm. Figure 7 shows that re = 3.2 is a goodestimate from NC diameters larger than 2 nm. However, rcmarkedly increases for NC diameters smaller than 5 nm.Nevertheless, eq 3 may give good estimates for the number ofadsorbed thiols in this case, since for small NCs the number ofadsorption site in the center is much less than the ones on theedges. We have compared the average surface per adsorbedthiol obtained from the simulation results and the values
Figure 8. (A) Frequencies of SH groups belonging to a SAM usuallyfound on Au(111) surfaces (with more than 3 members). (B)Frequencies of SH groups belonging to a zigzag SAM on the edges(with more than three members). Results for the total icosahedronsurface and for the edges and centers of its facets.
Figure 9. Average surface per adsorbed thiol: prediction of theoretical model and simulation results for nanocrystal diameters between 0 and 10 nm(A) and 0 and 200 nm (B).
The Journal of Physical Chemistry C Article
dx.doi.org/10.1021/jp403442s | J. Phys. Chem. C 2013, 117, 17791−1780017797
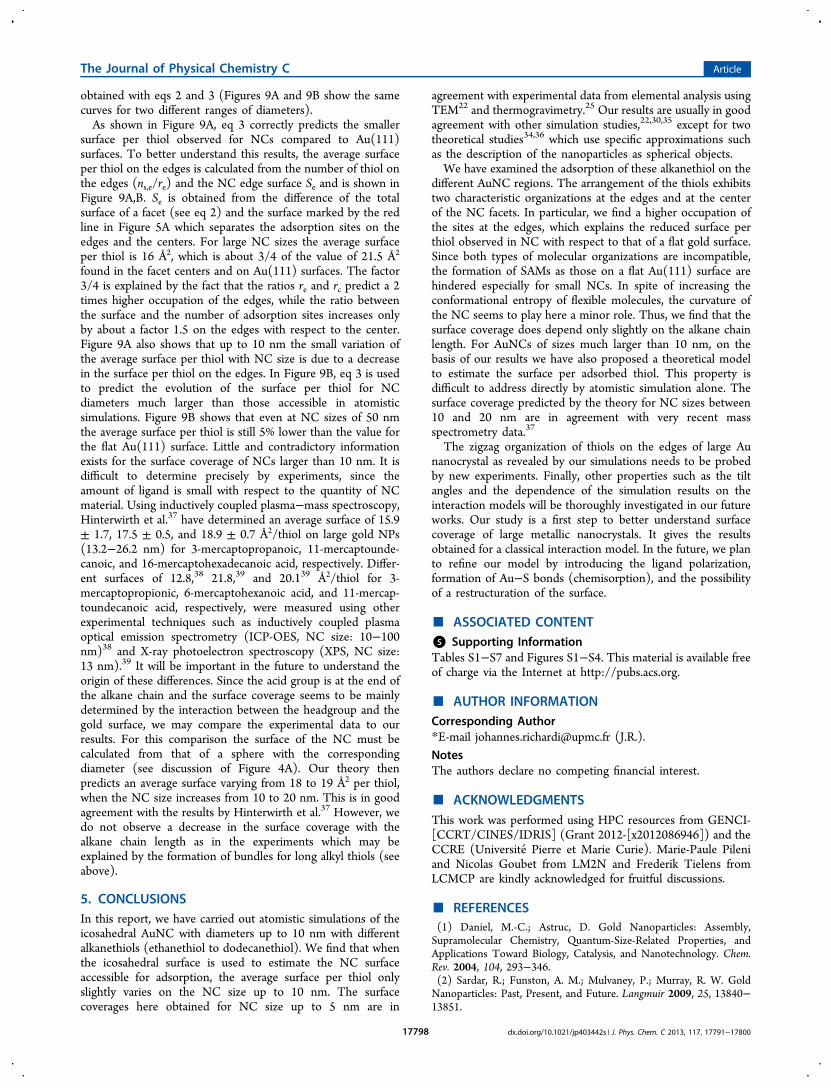
obtained with eqs 2 and 3 (Figures 9A and 9B show the samecurves for two different ranges of diameters).As shown in Figure 9A, eq 3 correctly predicts the smaller
surface per thiol observed for NCs compared to Au(111)surfaces. To better understand this results, the average surfaceper thiol on the edges is calculated from the number of thiol onthe edges (ns,e/re) and the NC edge surface Se and is shown inFigure 9A,B. Se is obtained from the difference of the totalsurface of a facet (see eq 2) and the surface marked by the redline in Figure 5A which separates the adsorption sites on theedges and the centers. For large NC sizes the average surfaceper thiol is 16 Å2, which is about 3/4 of the value of 21.5 Å2
found in the facet centers and on Au(111) surfaces. The factor3/4 is explained by the fact that the ratios re and rc predict a 2times higher occupation of the edges, while the ratio betweenthe surface and the number of adsorption sites increases onlyby about a factor 1.5 on the edges with respect to the center.Figure 9A also shows that up to 10 nm the small variation ofthe average surface per thiol with NC size is due to a decreasein the surface per thiol on the edges. In Figure 9B, eq 3 is usedto predict the evolution of the surface per thiol for NCdiameters much larger than those accessible in atomisticsimulations. Figure 9B shows that even at NC sizes of 50 nmthe average surface per thiol is still 5% lower than the value forthe flat Au(111) surface. Little and contradictory informationexists for the surface coverage of NCs larger than 10 nm. It isdifficult to determine precisely by experiments, since theamount of ligand is small with respect to the quantity of NCmaterial. Using inductively coupled plasma−mass spectroscopy,Hinterwirth et al.37 have determined an average surface of 15.9± 1.7, 17.5 ± 0.5, and 18.9 ± 0.7 Å2/thiol on large gold NPs(13.2−26.2 nm) for 3-mercaptopropanoic, 11-mercaptounde-canoic, and 16-mercaptohexadecanoic acid, respectively. Differ-ent surfaces of 12.8,38 21.8,39 and 20.139 Å2/thiol for 3-mercaptopropionic, 6-mercaptohexanoic acid, and 11-mercap-toundecanoic acid, respectively, were measured using otherexperimental techniques such as inductively coupled plasmaoptical emission spectrometry (ICP-OES, NC size: 10−100nm)38 and X-ray photoelectron spectroscopy (XPS, NC size:13 nm).39 It will be important in the future to understand theorigin of these differences. Since the acid group is at the end ofthe alkane chain and the surface coverage seems to be mainlydetermined by the interaction between the headgroup and thegold surface, we may compare the experimental data to ourresults. For this comparison the surface of the NC must becalculated from that of a sphere with the correspondingdiameter (see discussion of Figure 4A). Our theory thenpredicts an average surface varying from 18 to 19 Å2 per thiol,when the NC size increases from 10 to 20 nm. This is in goodagreement with the results by Hinterwirth et al.37 However, wedo not observe a decrease in the surface coverage with thealkane chain length as in the experiments which may beexplained by the formation of bundles for long alkyl thiols (seeabove).
5. CONCLUSIONSIn this report, we have carried out atomistic simulations of theicosahedral AuNC with diameters up to 10 nm with differentalkanethiols (ethanethiol to dodecanethiol). We find that whenthe icosahedral surface is used to estimate the NC surfaceaccessible for adsorption, the average surface per thiol onlyslightly varies on the NC size up to 10 nm. The surfacecoverages here obtained for NC size up to 5 nm are in
agreement with experimental data from elemental analysis usingTEM22 and thermogravimetry.25 Our results are usually in goodagreement with other simulation studies,22,30,35 except for twotheoretical studies34,36 which use specific approximations suchas the description of the nanoparticles as spherical objects.We have examined the adsorption of these alkanethiol on the
different AuNC regions. The arrangement of the thiols exhibitstwo characteristic organizations at the edges and at the centerof the NC facets. In particular, we find a higher occupation ofthe sites at the edges, which explains the reduced surface perthiol observed in NC with respect to that of a flat gold surface.Since both types of molecular organizations are incompatible,the formation of SAMs as those on a flat Au(111) surface arehindered especially for small NCs. In spite of increasing theconformational entropy of flexible molecules, the curvature ofthe NC seems to play here a minor role. Thus, we find that thesurface coverage does depend only slightly on the alkane chainlength. For AuNCs of sizes much larger than 10 nm, on thebasis of our results we have also proposed a theoretical modelto estimate the surface per adsorbed thiol. This property isdifficult to address directly by atomistic simulation alone. Thesurface coverage predicted by the theory for NC sizes between10 and 20 nm are in agreement with very recent massspectrometry data.37
The zigzag organization of thiols on the edges of large Aunanocrystal as revealed by our simulations needs to be probedby new experiments. Finally, other properties such as the tiltangles and the dependence of the simulation results on theinteraction models will be thoroughly investigated in our futureworks. Our study is a first step to better understand surfacecoverage of large metallic nanocrystals. It gives the resultsobtained for a classical interaction model. In the future, we planto refine our model by introducing the ligand polarization,formation of Au−S bonds (chemisorption), and the possibilityof a restructuration of the surface.
■ ASSOCIATED CONTENT*S Supporting InformationTables S1−S7 and Figures S1−S4. This material is available freeof charge via the Internet at http://pubs.acs.org.
■ AUTHOR INFORMATIONCorresponding Author*E-mail [email protected] (J.R.).
NotesThe authors declare no competing financial interest.
■ ACKNOWLEDGMENTSThis work was performed using HPC resources from GENCI-[CCRT/CINES/IDRIS] (Grant 2012-[x2012086946]) and theCCRE (Universite Pierre et Marie Curie). Marie-Paule Pileniand Nicolas Goubet from LM2N and Frederik Tielens fromLCMCP are kindly acknowledged for fruitful discussions.
■ REFERENCES(1) Daniel, M.-C.; Astruc, D. Gold Nanoparticles: Assembly,Supramolecular Chemistry, Quantum-Size-Related Properties, andApplications Toward Biology, Catalysis, and Nanotechnology. Chem.Rev. 2004, 104, 293−346.(2) Sardar, R.; Funston, A. M.; Mulvaney, P.; Murray, R. W. GoldNanoparticles: Past, Present, and Future. Langmuir 2009, 25, 13840−13851.
The Journal of Physical Chemistry C Article
dx.doi.org/10.1021/jp403442s | J. Phys. Chem. C 2013, 117, 17791−1780017798
(3) Lim, Z.-Z. J.; Li, J.-E. J.; Ng, C.-T.; Yung, L.-Y. L.; Bay, B.-H. GoldNanoparticles in Cancer Therapy. Acta Pharmacol. Sin. 2011, 32, 983−990.(4) Maeda, K.; Okabayashi, N.; Kano, S.; Takeshita, S.; Tanaka, D.;Sakamoto, M.; Teranishi, T.; Majima, Y. Logic Operations ofChemically Assembled Single-Electron Transistor. ACS Nano 2012,6, 2798−2803.(5) Ulman, A. Formation and Structure of Self-AssembledMonolayers. Chem. Rev. 1996, 96, 1533−1554.(6) Schreiber, F. Structure and Growth of Self-assemblingMonolayers. Prog. Surf. Sci. 2000, 65, 151−257.(7) Luque, N. B.; Santos, E.; Andres, J.; Tielens, F. Effect of Coverageand Defects on the Adsorption of Propanethiol on Au(111) Surface: ATheoretical Study. Langmuir 2011, 27, 14514−14521.(8) Tielens, F.; Costa, D.; Humblot, V.; Pradier, C.-M. Character-ization of ω-Functionalized Undecanethiol Mixed Self-AssembledMonolayers on Au(111): A Combined Polarization ModulationInfrared Reflection−Absorption Spectroscopy/X-ray PhotoelectronSpectroscopy/Periodic Density Functional Theory Study. J. Phys.Chem. C 2008, 112, 182−190.(9) Longo, G. S.; Bhattacharya, S. K.; Scandolo, S. A MolecularDynamics Study of the Role of Adatoms in SAMs of Methylthiolate onAu(111): A New Force Field Parameterized from Ab InitioCalculations. J. Phys. Chem. C 2012, 116, 14883−14891.(10) Love, J. C.; Estroff, L. A.; Kriebel, J. K.; Nuzzo, R. G.;Whitesides, G. M. Self-Assembled Monolayers of Thiolates on Metalsas a Form of Nanotechnology. Chem. Rev. 2005, 105, 1103−1170.(11) Tielens, F.; Santos, E. AuS and SH Bond Formation/Breakingduring the Formation of Alkanethiol SAMs on Au(111): A TheoreticalStudy. J. Phys. Chem. C 2010, 114, 9444−9452.(12) Maksymovych, P.; Sorescu, D. C.; Yates, J. T. MethanethiolateAdsorption Site on Au(111): A Combined STM/DFT Study at theSingle-Molecule Level. J. Phys. Chem. B 2006, 110, 21161−21167.(13) Woodruff, D. P. The Interface Structure of N-alkylthiolate Self-assembled Monolayers on Coinage Metal Surfaces. Phys. Chem. Chem.Phys. 2008, 10, 7211−7221.(14) Roper, M. G.; Skegg, M. P.; Fisher, C. J.; Lee, J. J.; Dhanak, V.R.; Woodruff, D. P.; Jones, R. G. Atop Adsorption Site of SulphurHead Groups in Gold-thiolate Self-assembled Monolayers. Chem. Phys.Lett. 2004, 389, 87−91.(15) Cossaro, A.; Mazzarello, R.; Rousseau, R.; Casalis, L.; Verdini,A.; Kohlmeyer, A.; Floreano, L.; Scandolo, S.; Morgante, A.; Klein, M.L.; et al. X-ray Diffraction and Computation Yield the Structure ofAlkanethiols on Gold(111). Science 2008, 321, 943−946.(16) Mazzarello, R.; Cossaro, A.; Verdini, A.; Rousseau, R.; Casalis,L.; Danisman, M. F.; Floreano, L.; Scandolo, S.; Morgante, A.; Scoles,G. Structure of a CH3-S Monolayer on Au(111) Solved by theInterplay Between Molecular Dynamics Calculations and DiffractionMeasurements. Phys. Rev. Lett. 2007, 98, 016102.(17) Maksymovych, P.; Sorescu, D. C.; Yates, J. T. Gold-Adatom-Mediated Bonding in Self-Assembled Short-Chain AlkanethiolateSpecies on the Au(111) Surface. Phys. Rev. Lett. 2006, 97, 146103.(18) Kondoh, H.; Iwasaki, M.; Shimada, T.; Amemiya, K.; Yokoyama,T.; Ohta, T.; Shimomura, M.; Kono, S. Adsorption of Thiolates toSingly Coordinated Sites on Au(111) Evidenced by PhotoelectronDiffraction. Phys. Rev. Lett. 2003, 90, 066102.(19) Torres, E.; Blumenau, A. T.; Biedermann, P. U. Mechanism forPhase Transitions and Vacancy Island Formation in alkylthiol/Au(111) Self-assembled Monolayers Based on Adatom and Vacancy-induced Reconstructions. Phys. Rev. B 2009, 79, 075440.(20) Wano, H.; Uosaki, K. In Situ Dynamic Monitoring ofElectrochemical Oxidative Adsorption and Reductive DesorptionProcesses of a Self-Assembled Monolayer of Hexanethiol on aAu(111) Surface in KOH Ethanol Solution by Scanning TunnelingMicroscopy. Langmuir 2005, 21, 4024−4033.(21) Terrill, R. H.; Postlethwaite, T. A.; Chen, C.; Poon, C.-D.;Terzis, A.; Chen, A.; Hutchison, J. E.; Clark, M. R.; Wignall, G.Monolayers in Three Dimensions: NMR, SAXS, Thermal, and
Electron Hopping Studies of Alkanethiol Stabilized Gold Clusters. J.Am. Chem. Soc. 1995, 117, 12537−12548.(22) Badia, A.; Singh, S.; Demers, L.; Cuccia, L.; Brown, G. R.;Lennox, R. B. Self-Assembled Monolayers on Gold Nanoparticles.Chem.Eur. J. 1996, 2, 359−363.(23) Badia, A.; Cuccia, L.; Demers, L.; Morin, F.; Lennox, R. B.Structure and Dynamics in Alkanethiolate Monolayers Self-Assembledon Gold Nanoparticles: A DSC, FT-IR, and Deuterium NMR Study. J.Am. Chem. Soc. 1997, 119, 2682−2692.(24) Hostetler, M. J.; Stokes, J. J.; Murray, R. W. InfraredSpectroscopy of Three-Dimensional Self-Assembled Monolayers: N-Alkanethiolate Monolayers on Gold Cluster Compounds. Langmuir1996, 12, 3604−3612.(25) Hostetler, M. J.; Wingate, J. E.; Zhong, C.-J.; Harris, J. E.;Vachet, R. W.; Clark, M. R.; Londono, J. D.; Green, S. J.; Stokes, J. J.;Wignall, G. D.; et al. Alkanethiolate Gold Cluster Molecules with CoreDiameters from 1.5 to 5.2 Nm: Core and Monolayer Properties as aFunction of Core Size. Langmuir 1998, 14, 17−30.(26) Pradeep, T.; Sandhyarani, N. Structure and Dynamics ofMonolayers on Planar and Cluster Surfaces. Pure Appl. Chem. 2002,74, 1593−1607.(27) Jadzinsky, P. D.; Calero, G.; Ackerson, C. J.; Bushnell, D. A.;Kornberg, R. D. Structure of a Thiol Monolayer-Protected GoldNanoparticle at 1.1 Å Resolution. Science 2007, 318, 430−433.(28) Luedtke, W. D.; Landman, U. Structure, Dynamics, andThermodynamics of Passivated Gold Nanocrystallites and TheirAssemblies. J. Phys. Chem. 1996, 100, 13323−13329.(29) Luedtke, W. D.; Landman, U. Structure and Thermodynamicsof Self-assembled Monolayers on Gold Nanocrystallites. J. Phys. Chem.B 1998, 102, 6566−6572.(30) Pool, R.; Schapotschnikow, P.; Vlugt, T. J. H. Solvent Effects inthe Adsorption of Alkyl Thiols on Gold Structures: A MolecularSimulation Study. J. Phys. Chem. C 2007, 111, 10201−10212.(31) Rapino, S.; Zerbetto, F. Dynamics of Thiolate Chains on a GoldNanoparticle. Small 2007, 3, 386−388.(32) Ghorai, P. K.; Glotzer, S. C. Molecular Dynamics SimulationStudy of Self-Assembled Monolayers of Alkanethiol Surfactants onSpherical Gold Nanoparticles. J. Phys. Chem. C 2007, 111, 15857−15862.(33) Lane, J. M. D.; Grest, G. S. Spontaneous Asymmetry of CoatedSpherical Nanoparticles in Solution and at Liquid-Vapor Interfaces.Phys. Rev. Lett. 2010, 104, 235501.(34) Jimenez, A.; Sarsa, A.; Blazquez, M.; Pineda, T. A MolecularDynamics Study of the Surfactant Surface Density of Alkanethiol Self-Assembled Monolayers on Gold Nanoparticles as a Function of theRadius. J. Phys. Chem. C 2010, 114, 21309−21314.(35) Olmos-Asar, J. A.; Rapallo, A.; Mariscal, M. M. Development ofa Semiempirical Potential for Simulations of Thiol-gold Interfaces.Application to Thiol-protected Gold Nanoparticles. Phys. Chem. Chem.Phys. 2011, 13, 6500−6506.(36) Tambasco, M.; Kumar, S. K.; Szleifer, I. Quantitatively Modelingthe Equilibrium Properties of Thiol-Decorated Gold Nanoparticles.Langmuir 2008, 24, 8448−8451.(37) Hinterwirth, H.; Kappel, S.; Waitz, T.; Prohaska, T.; Lindner,W.; Lammerhofer, M. Quantifying Thiol Ligand Density of Self-Assembled Monolayers on Gold Nanoparticles by Inductively CoupledPlasma−Mass Spectrometry. ACS Nano 2013, 7, 1129−1136.(38) Elzey, S.; Tsai, D.-H.; Rabb, S. A.; Yu, L. L.; Winchester, M. R.;Hackley, V. A. Quantification of Ligand Packing Density on GoldNanoparticles Using ICP-OES. Anal. Bioanal. Chem. 2012, 403, 145−149.(39) Ivanov, M. R.; Haes, A. J. Anionic Functionalized GoldNanoparticle Continuous Full Filling Separations: Importance ofSample Concentration. Anal. Chem. 2012, 84, 1320−1326.(40) Techane, S. D.; Gamble, L. J.; Castner, D. G. MultitechniqueCharacterization of Self-Assembled Carboxylic Acid-TerminatedAlkanethiol Monolayers on Nanoparticle and Flat Gold Surfaces. J.Phys. Chem. C 2011, 115, 9432−9441.
The Journal of Physical Chemistry C Article
dx.doi.org/10.1021/jp403442s | J. Phys. Chem. C 2013, 117, 17791−1780017799

(41) Lanterna, A. E.; Coronado, E. A.; Granados, A. M. WhenNanoparticle Size and Molecular Geometry Matter: Analyzing theDegree of Surface Functionalization of Gold Nanoparticles with SulfurHeterocyclic Compounds. J. Phys. Chem. C 2012, 116, 6520−6529.(42) Xia, X.; Yang, M.; Wang, Y.; Zheng, Y.; Li, Q.; Chen, J.; Xia, Y.Quantifying the Coverage Density of Poly(ethylene Glycol) Chains onthe Surface of Gold Nanostructures. ACS Nano 2012, 6, 512−522.(43) Lavrich, D. J.; Wetterer, S. M.; Bernasek, S. L.; Scoles, G.Physisorption and Chemisorption of Alkanethiols and Alkyl Sulfideson Au(111). J. Phys. Chem. B 1998, 102, 3456−3465.(44) Dubbeldam, D.; Calero, S.; Vlugt, T. J. H.; Krishna, R.; Maesen,T. L. M.; Smit, B. United Atom Force Field for Alkanes inNanoporous Materials. J. Phys. Chem. B 2004, 108, 12301−12313.(45) Marks, L. D. Experimental Studies of Small Particle Structures.Rep. Prog. Phys. 1994, 57, 603.(46) Ascencio, J. A.; Gutierrez-Wing, C.; Espinosa, M. E.; Marín, M.;Tehuacanero, S.; Zorrilla, C.; Jose-Yacaman, M. Structure Determi-nation of Small Particles by HREM Imaging: Theory and Experiment.Surf. Sci. 1998, 396, 349−368.(47) Wang, Y.; Teitel, S.; Dellago, C. Melting and Equilibrium Shapeof Icosahedral Gold Nanoparticles. Chem. Phys. Lett. 2004, 394, 257−261.(48) Hakkinen, H. The Gold-sulfur Interface at the Nanoscale. Nat.Chem. 2012, 4, 443−455.(49) Hautman, J.; Klein, M. Simulation of a Monolayer of Alkyl ThiolChains. J. Chem. Phys. 1989, 91, 4994−5001.(50) Lal, M.; Plummer, M.; Richmond, N. J.; Smith, W. Solvation ofMetal Nanoparticles in a Subcritical−Supercritical Fluid: A ComputerSimulation Study. J. Phys. Chem. B 2004, 108, 6052−6061.(51) Hess, B.; Kutzner, C.; Spoel, D.; van der Lindahl, E. GROMACS4: Algorithms for Highly Efficient, Load-Balanced, and ScalableMolecular Simulation. J. Chem. Theory Comput. 2008, 4, 435−447.
The Journal of Physical Chemistry C Article
dx.doi.org/10.1021/jp403442s | J. Phys. Chem. C 2013, 117, 17791−1780017800
Related Documents