ATOMISTIC MODELLING AND PREDICTION OF GLASS FORMING ABILITY IN BULK METALLIC GLASSES By Sina Sedighi A thesis submitted in conformity with the requirements for the degree of Masters of Applied Science Materials Science and Engineering University of Toronto © Copyright by Sina Sedighi 2015

Welcome message from author
This document is posted to help you gain knowledge. Please leave a comment to let me know what you think about it! Share it to your friends and learn new things together.
Transcript

ATOMISTIC MODELLING AND PREDICTION OF
GLASS FORMING ABILITY IN
BULK METALLIC GLASSES
By
Sina Sedighi
A thesis submitted in conformity with the requirements for the degree of Masters of Applied Science
Materials Science and Engineering University of Toronto
© Copyright by Sina Sedighi 2015

ii
ATOMISTIC MODELLING AND PREDICTION OF GLASS
FORMING ABILITY IN BULK METALLIC GLASSES
Sina Sedighi
Masters of Applied Science
Materials Science and Engineering
University of Toronto
2015
Abstract
Atomistic modeling was conducted to investigate kinetics, thermodynamics, structure, and
bonding in Ni-Al and Cu-Zr metallic glasses. This work correlates GFA with the nature of
atomic-level bonding and vibrational properties, with results potentially extensible to the
Transition Metal – Transition Metal and Transition Metal – Metalloid alloy classes in general.
As a first step in the development of a liquid-only GFA tuning approach, an automated tool
based on molecular dynamics has also been created for the broad compositional sampling of
liquid and glassy phase properties in multicomponent alloy systems. Its application to the Cu-Zr
alloy system shows promising results, including the successful identification of the two highest
GFA compositions, Cu50Zr50 and Cu64Zr36. Overall, the findings of this work highlight the
critical importance of incorporating more complex alloy-specific information regarding the
nature of bonding and ordering at the atomic level into such an approach.

iii
Acknowledgments
First and foremost, I’d like to extend my thanks and gratitude to Professors Chandra Veer Singh,
Steven J. Thorpe, and Donald W. Kirk for their persistent guidance, mentorship, and support
throughout the duration of my graduate studies. The work of this thesis and my experience
throughout its completion would not have been possible, nor as fulfilling, without their unified
supervision and active involvement.
Further thanks are due to Gedex chief technology officer, Dr. Kieran Carrol, co-founder and
chief scientist, Dr. Barry French, and senior simulation engineer, Dr. Donald McTavish, for their
continual feedback and support throughout the duration of this project.
I’d also like to thank the Department of Materials Science and Engineering, Natural Sciences and
Engineering Research Council of Canada (NSERC), Ontario Graduate Scholarship (OGS), and
industrial partner Gedex Inc. for their funding and support. Acknowledgements are also due to
Compute Canada for computational resources provided on the GPC supercomputer at the SciNet
HPC Consortium.
Last but not least, I’d like to thank my family and friends for their loving support.
iv
Table of Contents
Acknowledgments.......................................................................................................................... iii
Table of Contents ........................................................................................................................... iv
List of Tables ................................................................................................................................ vii
List of Figures .............................................................................................................................. viii
List of Appendices ......................................................................................................................... xi
List of Acronyms and Symbols .................................................................................................... xii
1 Introduction ...............................................................................................................................1
1.1 Background ..........................................................................................................................1
1.2 Motivation ............................................................................................................................2
1.3 Thesis Objectives .................................................................................................................3
1.4 Thesis Organization .............................................................................................................4
2 A Review of Glass Formation and Crystallization Kinetics Theory ....................................5
2.1 Thermodynamic Stability, Metastability, and Instability ....................................................5
2.2 Energy Landscape Theory ...................................................................................................7
2.3 Supercooling Thermodynamics from an Energy Landscape Perspective ..........................10
2.4 Transport Properties and Kinetics in the Liquid and Supercooled Domains .....................12
2.5 Crystallization Kinetics ......................................................................................................14
2.5.1 Nucleation Kinetics ................................................................................................15
2.5.2 Growth Kinetics .....................................................................................................19
2.5.3 Critical Cooling Rate .............................................................................................21
2.6 Predictive Indicators of Glass Forming Ability .................................................................22
2.6.1 Interface Stability and the Liquid-Crystal Interfacial Free Energy .......................24
2.6.2 Liquid and Amorphous Phase Packing Efficiency ................................................25
2.6.3 Icosahedral Short-range Ordering ..........................................................................25

v
2.6.4 Compositional Short-Range Ordering and Complexity .........................................26
3 Methodology and Computational Details .............................................................................28
3.1 Molecular Dynamics ..........................................................................................................28
3.2 Model Generation ..............................................................................................................30
3.3 Calculation of Thermodynamic and Bulk Physical Properties ..........................................31
3.4 Calculation of Transport Properties and Fragility .............................................................33
3.5 Calculation of Structural Properties ...................................................................................37
4 Investigating the Atomic-Level Influences of Glass Forming Ability in Ni-Al and Cu-
Zr Metallic Glasses ..................................................................................................................39
4.1 Introduction ........................................................................................................................39
4.2 Computational Details .......................................................................................................42
4.3 Results and Discussion ......................................................................................................43
4.3.1 Bulk Thermodynamic and Physical Properties ......................................................44
4.3.2 Transport and Kinetic Properties ...........................................................................46
4.3.3 Structural Analysis .................................................................................................52
4.3.4 Inspection of Nearest-Neighbour Structural Relaxation Properties .......................58
4.3.5 Local Structure-Energy and Coordination-Energy Correlations ...........................60
4.3.6 Investigating the Connections between the Vibrational Properties, Fragility,
and Glass Forming Ability of Alloys .....................................................................66
4.3.7 A More Detailed Investigation of Short-Range Ordering at the Interface .............71
4.4 Summary ............................................................................................................................74
5 Development of a Broad-Compositional Search and Analysis Tool ...................................77
5.1 A Broad-Compositional Investigation of Short-range Ordering, Fragility, and Glass
Forming Ability in the Cu-Zr System ................................................................................78
5.1.1 Transport and Kinetic Properties ...........................................................................79
5.1.2 Chemical and Topological Short-Range Ordering ................................................80
5.1.3 Summary ................................................................................................................82

vi
6 Conclusions and Future Work ...............................................................................................83
6.1 Summary and Main Contributions .....................................................................................84
6.2 Implications of Results and Future Avenues of Research .................................................86
Bibliography .................................................................................................................................87

vii
List of Tables
Table 4.1: Summary of thermodynamic and bulk physical property results ............................... 45
Table 4.2: Viscosity VFT Fit and Fragility Results ..................................................................... 47
Table 4.3: Fractional liquid-crystal density difference at Tg and Tm ......................................... 49
Table 4.4: Ratio of first and second partial radial distribution peak intensities ........................... 53
Table A.1: Summary of relevant thermodynamic ensembles and state functions …...………....96
Table D.1: Disordered phase correlators relevant to GFA prediction …...……………............103
Table E.1: Summary of various GFA predictive indicators evaluated for equimolar Ni-Al and
Cu-Zr alloys. Values are presented in ‘green’ or ‘red’ color if in accordance or
contradiction with expected trends based on the significantly higher GFA of the Cu-
Zr alloy.…...……………………………………………………………………......104

viii
List of Figures
Figure 2.1: A simplified depiction of the potential energy landscape in multidimensional
configuration space (taken from Stillinger [13]) .................................................... 8
Figure 2.2: Cooling rate and temperature dependence of a typical liquid melt’s enthalpy and
volume at constant pressure. Inset illustrations on the right depict typical local
potential energy landscape environments experienced at various stages of the
quench. Fictive temperatures, Tf, and glass transition temperatures, Tg, are also
presented for both fast and slowly quenched glasses. Tm is the melting point
temperature, and TMC is the mode coupling temperature...................................... 11
Figure 3.1: Visual overview of the simulated melt and quench process used for metallic glass
model generation ................................................................................................... 30
Figure 3.2: Demonstration of the stability and stationarity of thermodynamic properties in the
high temperature Cu50Zr50 liquid melt after equilibration .................................... 31
Figure 3.3: Initial decay of Cu-Zr 900K stress autocorrelation function................................. 35
Figure 4.1: Gibbs Free Energy profiles for liquid/amorphous and B2 crystalline phase Cu-Zr
(left) and Ni-Al (right) calculated from 2PT modeling. Vertical dashed lines
correspond to respective Tg values. Melting points (Tm) are identified by the
intersection of liquid/amorphous and crystalline phases. ..................................... 44
Figure 4.2: Constant pressure heat capacity, Cp, of Ni-Al and Cu-Zr amorphous phases.
Harmonic approximations are used to partially account for low temperature Cp
quantum contributions through the subtraction of 3kB. ....................................... 45
Figure 4.3: Viscosity and atomic self-diffusivities for Ni50Al50 and Cu50Zr50 alloys over the
quench regime ......................................................................................................... 46
Figure 4.4: Atomic diffusivities scaled by respective atomic radii squared in Ni50Al50 and
Cu50Zr50 alloys over the quench regime .............................................................. 48

ix
Figure 4.5: Percent density difference between the liquid/glassy and B2 crystalline phase for
Ni-Al and Cu-Zr alloys over the quench regime ................................................... 50
Figure 4.6: Second order thermodynamic properties and resultant Gruneisen Parameters for
Ni50Al50 and Cu50Zr50 amorphous phases over the quench regime ................. 51
Figure 4.7: Pair Correlation Functions evaluated for Ni50Al50 and Cu50Zr50 melts at
temperature T ≈ 2 ∗ Tg ≈ Tm .............................................................................. 52
Figure 4.8: Top 25 most frequent Voronoi polyhedra types in Ni-Al and Cu-Zr low
temperature glasses at 300K .................................................................................. 54
Figure 4.9: Partial and Total Coordination Number Distribution for atoms in Ni-Al and Cu-Zr
Glasses at 300K ..................................................................................................... 54
Figure 4.10: Frequency evolution of the 7 most frequent Voronoi Polyhedra types found in Ni-
Al and Cu-Zr Glasses. Purple and blue dashed lines are presented to indicate glass
transition and melt temperatures respectively (Note: legend indexed in decreasing
order from top to bottom with respect to polyhedral fractions in low temperature
glass). ..................................................................................................................... 56
Figure 4.11: Temperature evolution of mean partial coordination numbers for species in Ni-Al
and Cu-Zr alloys over the quench ......................................................................... 57
Figure 4.12: Evolution of local compositional ordering over the quench for Cu-Zr and Ni-Al
alloys. The Warren-Cowley parameter is a simple metric quantifying the deviation
of the local composition (first coordination shell) from the bulk stoichiometric
concentration. ........................................................................................................ 57
Figure 4.13: Total and partial bond correlation functions for Ni-Al and Cu-Zr alloys in the
liquid and supercooled domain. Dashed lines in the partial bond correlation
function plots correspond to 900K, with solid lines corresponding to 1200K. ..... 60
Figure 4.14: Mishin’s EAM embedding energy functions for Ni and Al atoms in the
equilibrium B2-Ni-Al phase [35] .......................................................................... 61

x
Figure 4.15: Mean potential energies for central atoms in various sampled cluster types at
1200K .................................................................................................................... 63
Figure 4.16: Local coordination-frequency and local coordination-energy correlations for Cu
and Zr centered atoms ........................................................................................... 64
Figure 4.17: Local coordination-frequency and local coordination-energy correlations for Ni
and Al centered atoms ........................................................................................... 65
Figure 4.18: Vibrational DOS Spectra for elemental components in Cu-Zr and Ni-Al B2-
crystalline and Glassy phases ................................................................................ 66
Figure 4.19: Phonon dispersion curve for a model 1-dimensional diatomic chain with bond-
stiffness, k, between components A and B of mass, MA and MB, and reduced mass
μ ............................................................................................................................. 68
Figure 4.20: reduced vibrational density of states spectra for the display of low frequency
boson peaks ........................................................................................................... 70
Figure 4.21: A molecular dynamics snapshot of the simulated Ni-Al B2(100) interface after
relaxation at 1900K ............................................................................................... 73
Figure 4.22: Mean per-atom potential energies and chemical density distribution profiles away
from the B2(110)-Crystal interface ....................................................................... 74
Figure 5.1: Compositional dependencies of the glass transition temperature and key kinetic
properties ............................................................................................................... 80
Figure 5.2: Compositional Dependencies of chemical short-range ordering and fractions of
key polyhedral types .............................................................................................. 81

xi
List of Appendices
Appendix A: Background Information on Classical Statistical Mechanics...………….……..91
Appendix B: An In-Depth Overview of Energy Landscape Theory……..………...….…...…97
Appendix C: Additional Information on Model Generation and Reproducibility....…..……102
Appendix D: Summary of GFA Influences and Correlators……………..……….......…..…103
Appendix E: Comparative Summary of Ni-Al and Cu-Zr GFA Predictive Indicator
Results…………………………………………………………………………104

xii
List of Acronyms and Symbols
Acronym Description
BMG Bulk metallic glass
GFA Glass forming ability
MD Molecular dynamics
IS Inherent structure
GIS Generalized inherent structure
CNT Classical nucleation theory
CFM Coupled flux model
TM-TM Transition Metal – Transition Metal
TM-M Transition Metal – Metalloid
NVE Constant particle number, volume, and energy
NVT Constant particle number, volume, and temperature
NPT Constant particle number, pressure, and temperature
µVT Constant chemical potential, volume, and temperature
CN Coordination number
Symbol Units [SI] Description
kB J K-1
Boltzmann constant
h J s Plank’s constant
β J-1
Thermodynamic beta (inverse temperature)
σE J2 Energy variance under thermodynamic fluctuations
Cv J T-1
Constant volume heat capacity
Cp J T-1
Constant pressure heat capacity
αT m3 T
-1 Isothermal expansion coefficient
BT Pa Bulk Modulus
γ - Gruneisen parameter
N - Number of atoms
V m3 Volume
T K Temperature
P Pa Pressure
G J Gibbs free energy
A J Helmholtz free energy
E J Internal energy
S J/K Entropy
Ω - Microcanonical (NVE) Partition Function (Multiplicity)
Z - Canonical (NVT) Partition Function
∆ - Isothermal-Isobaric (NPT) Partition function

xiii
Ξ - Grand Canonical Partition Function
Q - Canonical Configurational Partition Function
Sc J K-1
Configurational entropy
H(x(6N)
) J Classical Hamiltonian Function
Φ(𝐫(𝟑𝐍)) J potential energy function
𝐫(N) m 3N-dimensional atomic coordinates
𝐩(N) kg m s-1
3N-dimensional atomic momenta
x(6N)
- 6N-dimensional phase space coordinate
𝐯 m s-1
3-dimensional atomic velocity
𝐅 N 3-dimensional atomic force
m Kg Atomic mass
𝐫α(N)
- Stable packing configuration in 3N-dimensional space
Rα - Quench regions / basins / inherent structures
λD m De-Broglie wavelength
β∗ s-1
Growth-rate for critically sized clusters
Zf - Zeldovich factor
f - Fill-fraction
ΔG∗ J Nucleation free energy barrier
n∗ - Critical nuclei size
σl,s J m-2
Liquid-crystal interfacial free energy
Iss s-1
V-1
Steady-state nucleation rate per unit volume of liquid
Yss m s-1
Steady-state crystal planar-growth velocity
g(ω) - Vibrational density of states
v m3 Specific volume
Δμl,c J mol-1
Liquid-crystal partial molar Gibbs free energy difference
Δhl,c J mol-1
Liquid-crystal partial molar enthalpy difference
Δsl,c J K-1
mol-1
Liquid-crystal partial molar entropy difference
txss s Time for crystallization up to cutoff crystal fraction x
Tnose K Nose temperature in T-T-T crystallization profile
Tm K Melting point
Tl K Liquidus temperature
Tg K Glass transition temperature
Trg - Reduced glass transition temperature
TMC K Mode coupling temperature
γ′ - Gamma value
ΔTx K Temperature difference between glass transition and onset
crystallization (from below)
m - Kinetic fragility parameter
D* - VFT Strength Parameter
B K VFT effective activation energy
xiv
T0 K VFT divergence temperature
η Pa s Viscosity
D m2 s
-1 Atomic Diffusivity
τ s Relaxation time
Ρ moles m-3
molar density
PSD m2 s
-1 Velocity power spectral density
Pαβ Pa m-3
Symmetrized traceless Virial stress tensor
σαβ Pa m-3
Virial stress tensor
gαβ(r) - Partial radial distribution function
αp - Warren-Cowley parameter
(Δμ)Tg J mol-1
Liquid-crystal partial-molar free energy difference at Tg
ω s-1
Vibrational frequency
q m-1
Wave-vector
k m Interatomic force-constant (spring-constant)
Cαβ - Bond correlation function
ρi moles m-3
Mean local electron density
ρsj moles m-3
Electron density function
φsisj J EAM pair-interaction potential
Fsi J EAM embedding energy

1
Chapter 1
1 Introduction
Unlike conventional crystalline alloys, bulk metallic glasses exhibit little to no long range
structural order at the atomic level, with structures essentially consisting of random, tightly
packed clusters of atoms. The first experimental evidence of metallic glasses arose in 1959 when
Klement, Wiliams, and Duwez were able to fabricate Au75Si25 metallic glass by splat quenching
the metallic liquid melt onto a cold plate, resulting in rapid quenching at a rate of 105 − 106 K
s−1 and thereby inhibiting crystallization [1]. While such methods provided a proof of concept,
widespread application of amorphous metals on a consumer level was largely confined to thin
films due to the kinetic demands of rapid heat transfer. As of today, a number of metallic glasses
have been discovered which allow for fabrication methods involving far lower critical cooling
rates [2], and thus can be formed in much larger dimensions. These bulk metallic glasses
(BMGs) often share the common characteristics of being multi-component alloys, rich with
transition metals (and noble metal - metalloid species) at or near deep eutectic compositions.
1.1 Background
BMGs are now being considered for use in a number of consumer and specialty device
applications, with interest peaked by their unique set of mechanical and magnetic properties
[3][4][5]. Currently under investigation is the application of BMGs for use in the pivot-flexure
component of orthogonal quadrupole responders in Gedex Inc.’s next generation room
temperature airborne gravity gradiometers (used for mining and mineral exploration purposes).
The appeal of specific BMG’s being the high strength, high linear elastic deflection limits, low
loss coefficients, and low magnetic susceptibilities characteristic of some glassy alloys operating
at room temperature. While the disordered nature of BMGs is ultimately responsible for their
unique set of mechanical and magnetic properties, an unfortunate byproduct of said disorder is an
increased degree of complexity and general lack of simplifying assumptions for the modeling
and prediction of underlying compositional dependencies. Slight variations in composition (often
as little as a single atomic percent) and processing conditions (cooling rate, impurity and oxygen
content, melt duration and degree of overheating, mold surface smoothness, suction/extrusion

2
rates etc.) can dramatically alter underlying thermodynamic, kinetic, structural, and physical
properties of multicomponent melts and glasses. Of particular importance is the significant
compositional sensitivity of glass forming ability and crystallization kinetics. Currently, a key
focal point of BMG research is the search and discovery of key parameters influencing glass
forming ability, identifying how they are reflected in structural, thermodynamic, and kinetic
properties, and studying how these properties can subsequently be tuned in a controlled manner.
Many approaches have been proposed for the compositional tuning of BMGs [6-12], however as
of yet, a robust method capable of fine compositional tuning for the optimization of glass
forming ability (GFA) in multicomponent alloys has not been reported.
1.2 Motivation
Despite significant recent advances in the field of glass sciences, a clear-cut design approach for
the compositional tuning of glass forming ability in BMGs has yet to be identified. The vast
compositional spaces needed to be explored, in conjunction with the fine compositional
sensitivity observed in many multicomponent alloy systems makes the experimental
identification of high GFA alloys an incredibly arduous task. Current computational and analytic
tuning methods are severely limited in their applicability due to a number of non-trivial factors.
Many of the identified GFA indicators and influencing factors are not single phase properties and
often depend on properties of the disordered and crystallizing phases and/or the interface
between the two. In complex multi-component systems, the crystalizing phase is rarely known
before hand, with the crystallization pathway leading to the final equilibrium phase more often
than not being a multi-step process involving several (also likely unknown) intermediate
(polymorphic) metastable phases. Without detailed knowledge of equilibrium and non-
equilibrium phase diagrams, these considerations raise the important question of whether
fundamental limitations exist on the practicality of a computational (or experimental) method
capable of rapid, accurate, and compositionally robust GFA tuning. Many of the existing GFA
tuning methods and predictive indicators (even those relying upon only single phase properties)
exhibit a significant lack of robustness, with their efficacy often being highly dependent upon the
alloy class in question, or otherwise being restricted to specific compositional domains. These
issues can to a great extent be attributed to a general lack of understanding of underlying bonding
differences at the atomic level.

3
With the improvement of interatomic potentials and the steady advancement of molecular
dynamics techniques, current simulations methods allow for the sampling of liquid, supercooled,
and glassy phase (albeit, rapidly quenched) properties of multicomponent alloys with little to no
prior knowledge of the underlying system. Since general correlations between glass forming
ability and simple parameters such as the atomic size ratio, amorphous phase packing efficiency,
and liquid fragility exist, the development of a rapid and compositionally robust tuning approach
reliant upon disordered phase properties alone may be possible. For this advance, the
identification of GFA indicators and influencing factors relying solely upon properties of the
disordered phase is of utmost importance. Equally important is the investigation of the inherent
limitations of existing GFA predictive indicators, the underlying causes for their breakdown in
certain alloy systems or beyond certain compositional domains, and potential methods for
accounting or correcting for these factors. This requires a detailed understanding of the nature of
bonding in different alloy classes, and how these general differences are subsequently reflected
in the degree and nature of short and medium-range ordering, in the energy landscape and
structural relaxation properties, and ultimately the mechanisms through which crystal nucleation
and growth occur. Ideal in this respect is the investigation of the atomic level factors influencing
the rapid crystal nucleation and growth rates of the Transition Metal – Metalloid (TM-M)
Ni50Al50 system in comparison to the Transition Metal – Transition Metal (TM-TM) Cu50Zr50
alloy, an apparently anomalous result which largely persists to be a source of confusion in the
BMG community.
1.3 Thesis Objectives
In this thesis, the underlying bulk and atomic level influences of glass forming ability in
multicomponent metallic glasses, and the prospect of a rapid and robust computational tuning
approach using molecular dynamics simulation methods are explored. Accordingly, the
following thesis objectives are presented:
1) Explore and identify the key influencing factors and predictive indicators of glass
forming ability in multicomponent alloy systems
2) Investigate the atomic-level influencing factors of glass forming ability in Cu-Zr and Ni-
Al metallic glasses

4
3) Investigate compositional dependencies of short-range ordering, transport properties, and
glass forming ability in the Cu-Zr system
4) Develop an automated computational tool for the broad-compositional search and
analysis of thermodynamic, kinetic, and structural properties in multicomponent glasses
1.4 Thesis Organization
Chapter 2 outlines the fundamental theory of supercooling thermodynamics, the glass formation
process, the evolution of transport properties, and crystallization kinetics, ending with a literature
review of the best identified predictive indicators for glass forming ability in multicomponent
alloys. In Chapter 3, methodology and computational details regarding molecular dynamics
simulations and property extraction methods utilized in this study are presented. Chapter 4
provides a detailed analysis of thermodynamic, kinetic, and structural properties of equimolar
Ni-Al and Cu-Zr metallic glasses, with a primary focus being the investigation of GFA
anomalies, the evaluation of the predictive efficacy of various indicators, and the exploration of
underlying connections to atomic-level bonding, ordering, and vibrational properties. In Chapter
5, the development and capabilities of an automated glass analysis tool are summarized, with
results of its application to the investigation of broad-compositional trends in underlying short-
range structural properties, the kinetic fragility parameter, and glass forming ability in the Cu-Zr
system being presented. Lastly, overall results and conclusions of this work are summarized in
Chapter 6.

5
Chapter 2
2 A Review of Glass Formation and Crystallization Kinetics Theory
In order to understand the fundamental factors influencing glass forming ability, it’s important to
first gain a deep physical understanding of the supercooling process and the nature of the glassy
state. The rapid quenching process underlying glass formation adds great complexity to the
problem at hand, resulting in general property dependencies of the liquid melt and glassy phases
on both composition and thermal history. In contrast to the thermally stable high temperature
liquid phase or the low temperature equilibrium crystalline phase, this underlying thermal history
dependence can be seen to reflect the fundamentally non-equilibrium nature of the glassy state.
The supercooled liquid phase exists in a state of metastable equilibrium at small to moderately
undercooled temperatures. Considering the intrinsic connection between glass forming ability
and the thermodynamic phase stability of the liquid and glassy phases, it is vital that these
concepts are concretely defined and well understood.
2.1 Thermodynamic Stability, Metastability, and Instability
At a fundamental level, a phase or macrostate can be understood to encompass some
characteristic sub-volume of configurational space, with its respective thermal stability being
determined by its total corresponding occupation probability under random state sampling of the
equilibrium ensemble. With this in mind, the identification of the most thermodynamically
stabile (equilibrium) state/phase of a system can be equivalently framed in terms of a problem of
probability maximization, or alternatively, one of Free Energy minimization. From this
perspective, the standard thermodynamic condition for process spontaneity (a negative
Helmholtz free energy change, ∆𝐴1→2 < 0) under NVT operating conditions can be viewed to be
a simple statement that spontaneous processes evolve to other more probabilistically favoured,
lower free energy states. The equilibria of two distinct states or phases can similarly be
interpreted in terms of the condition of equal system occupational probabilities or free energies.
Under different operating conditions, the identification of the most thermodynamically stable
state/phase can similarly be framed in terms of probability maximization under the various
thermodynamic ensembles, or alternatively, in terms of entropy (S) maximization under NVE

6
conditions, Gibbs Free Energy (G) minimization under NPT/µVT conditions, or even in terms of
Internal Energy (E) minimization under NVS isentropic conditions.
In order to apply the above principles to the understanding of phase equilibria and transitions in
general, it is important to introduce the concept of an order parameter as a means of
distinguishing between different phases. By definition, an order parameter can be any
thermodynamic average ⟨𝑋(𝒓(𝑁), 𝒑(𝑁), 𝑉)⟩ (corresponding to some physical observable property)
which serves to distinguish two distinct phases, which may be as simple as the total system
density, for example, or perhaps related to more complex symmetry properties of the underlying
system. First order phase transitions such as the liquid-to-crystal phase transition experienced
near the melting point Tm of metallic alloys are fundamentally characterized by the presence of
some latent heat, translating to a discontinuity in some standard thermodynamic physical
observable (or order parameter) such as the internal energy, E. A discontinuity in E or some other
standard first order thermodynamic physical observables (such as volume) can be seen to
correspond to a discontinuity in a first order partial derivative of the free energy or Partition
Function (i.e. see (A.9) in the appendices), hence the “first order” classification of the solid-
liquid phase transition. Truly discontinuous phase transitions occur strictly under equilibrium
conditions at the thermodynamic limit (𝑁 → ∞) where kinetics is not a factor. In practice,
however, first order phase transformations (such as the solid-liquid phase transition occurring
during crystallization from the liquid melt) occur over some finite time duration, with kinetics
often being limited by the requirement for large length-scale chemical diffusion and the
occurrence of statistically rare structural re-ordering events. With this in mind, the phase
transformation process in general is seen to extend over some finite temperature window below
the equilibrium melting temperature. In certain cases, the phase transformation process may be
bypassed all together, with the liquid existing in a state of metastable equilibrium within the
supercooled liquid domain.
The condition of metastable thermodynamic equilibrium can be understood to require local phase
stability with respect to small (local and global) perturbations in underlying system properties
and parameters. Expressing the system free energy G at temperature T and pressure P in terms of
some additional structural or chemical order parameter(s), ⟨𝑿⟩, which effectively differentiate the

7
liquid and crystalline phases, say with ⟨𝑿⟩𝑙𝑖𝑞𝑢𝑖𝑑 = 𝑿𝑙, and ⟨𝑿⟩𝑐𝑟𝑦𝑠𝑡𝑎𝑙 = 𝑿𝑐, metastability of the
supercooled liquid phase at minimum requires:
∂2G(𝐗)
∂𝐗2|𝐗=𝐗l
> 0 with G(𝐗l) > G(𝐗c) (2.1)
In this respect, the supercooled liquid can be viewed to exist in a state of a local, but not global,
free energy minimum. In practice, the additional requirement of a large free energy barrier:
∆Gl→c∗ = G(𝐗∗) − G(𝐗l) (2.2)
existing at some intermediate transition state, 𝑿∗, is required in order to prevent the system from
freely transitioning to the crystalline phase under random equilibrium fluctuations at the given
temperature and pressure. As will be discussed in the following sections, in conjunction with the
thermally activated nature of crystal nucleation and growth, transport and structural relaxation
properties of supercooled liquids experience a significant kinetic slowdown upon extended
undercooling, allowing certain alloy systems possessing sufficiently slow crystallization rates to
be kinetically “frozen” into an atomically disordered solid state, e.g. a metallic glass.
2.2 Energy Landscape Theory
The energy landscape perspective is considered to be one of the best conceptual frameworks for
understanding the equilibrium and non-equilibrium properties of liquids and glasses. Under this
formulism, the 3N dimensional potential energy landscape ϕ(𝐫𝟏, 𝐫𝟐, 𝐫𝟑, . . . , 𝐫𝐍) is partitioned
about a discrete set of stable packing configurations, 𝐫α(N)
, where the potential energy lies at a
local minimum with respect to all atomic coordinates. Within this context, system dynamics and
evolution can be broadly separated into independent contributions associated with anharmonic
intra-basin vibrations about local potential energy minima, and more in-frequent larger scale
“basin hopping” transitions across potential energy saddle-points leading into nearby thermally
accessible basins [13] (as illustrated schematically in Figure 2.1).

8
Figure 2.1: A simplified depiction of the potential energy landscape in multidimensional
configuration space (taken from Stillinger [13])
Conceptually, this partitioning of configurational space can be understood by considering the
first-order evolution equations, for which steepest decent paths are characterized by:
𝐫.(N) = ∇𝐫(N)ϕ(𝐫
(N)) (2.3)
Following first-order steepest decent paths, it can be shown [14] that any point in configurational
space (with the exception of a discrete volume of zero measure corresponding to the set of
“saddle-points” and other generalized critical points) maps to a corresponding stable packing
configuration in the discrete set of 𝐫α(N)
. All associated elements of configurational space
mapping to minima rα define sub-regions, R(𝐫α(N)), known as the “quench regions”, “basins”, or
“inherent structures”. All inherent structure energies, ϕ(𝐫α(N)) = ϕα, can be seen to lie
somewhere in the range of ϕo ≤ ϕα ≤ ϕu, where ϕo denotes the lowest potential energy
(crystalline) stable packing configuration, and ϕu the highest. Re-expressing the configurational
partition function integral as a sum over individual inherent structures, defining configurational
entropy:
Sc(ϕ) = k𝐵lnN(ϕ) (2.4)
9
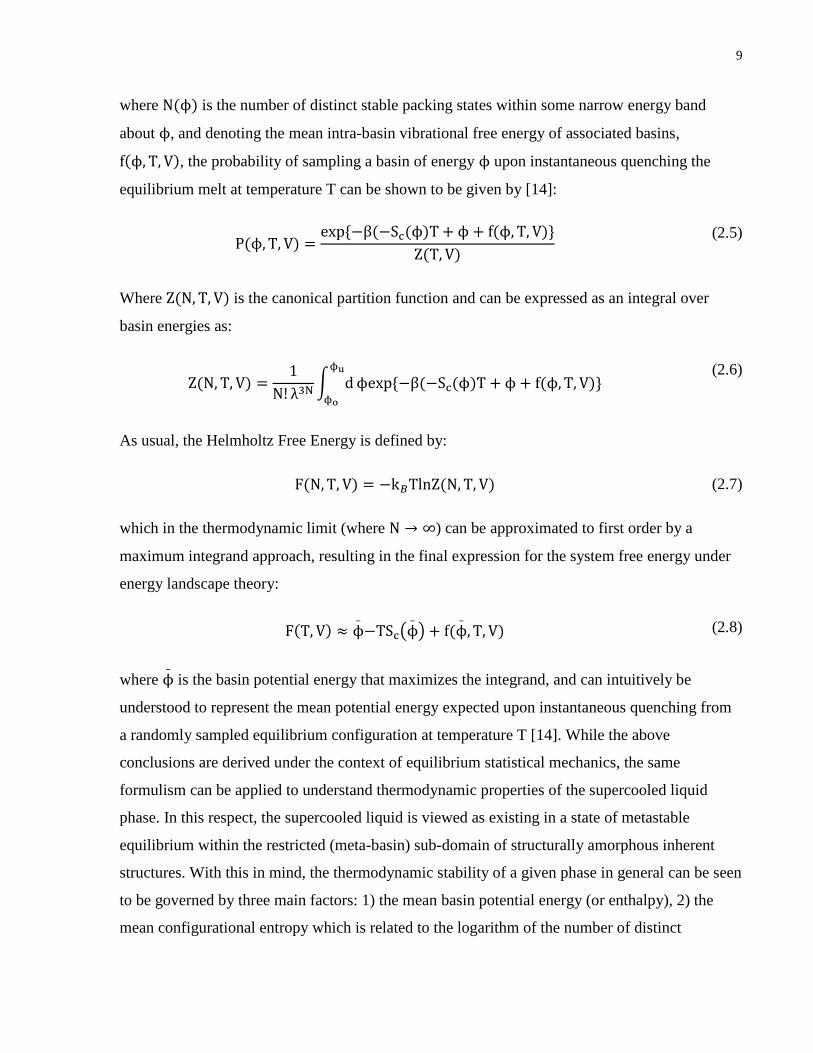
where N(ϕ) is the number of distinct stable packing states within some narrow energy band
about ϕ, and denoting the mean intra-basin vibrational free energy of associated basins,
f(ϕ, T, V), the probability of sampling a basin of energy ϕ upon instantaneous quenching the
equilibrium melt at temperature T can be shown to be given by [14]:
P(ϕ, T, V) =
exp−β(−Sc(ϕ)T + ϕ + f(ϕ, T, V)
Z(T, V)
(2.5)
Where Z(N, T, V) is the canonical partition function and can be expressed as an integral over
basin energies as:
Z(N, T, V) =
1
N! λ3N∫ dϕu
ϕo
ϕexp−β(−Sc(ϕ)T + ϕ + f(ϕ, T, V) (2.6)
As usual, the Helmholtz Free Energy is defined by:
F(N, T, V) = −k𝐵TlnZ(N, T, V) (2.7)
which in the thermodynamic limit (where N → ∞) can be approximated to first order by a
maximum integrand approach, resulting in the final expression for the system free energy under
energy landscape theory:
F(T, V) ≈ ϕ_
−TSc(ϕ_
) + f(ϕ_
, T, V) (2.8)
where ϕ_
is the basin potential energy that maximizes the integrand, and can intuitively be
understood to represent the mean potential energy expected upon instantaneous quenching from
a randomly sampled equilibrium configuration at temperature T [14]. While the above
conclusions are derived under the context of equilibrium statistical mechanics, the same
formulism can be applied to understand thermodynamic properties of the supercooled liquid
phase. In this respect, the supercooled liquid is viewed as existing in a state of metastable
equilibrium within the restricted (meta-basin) sub-domain of structurally amorphous inherent
structures. With this in mind, the thermodynamic stability of a given phase in general can be seen
to be governed by three main factors: 1) the mean basin potential energy (or enthalpy), 2) the
mean configurational entropy which is related to the logarithm of the number of distinct

10
accessible basins, and 3) the mean intra-basin vibrational free energy, at the given temperature
and pressure. For a more in-depth overview and derivation of these results, see Appendix B.
2.3 Supercooling Thermodynamics from an Energy Landscape Perspective
Studies examining the temperature dependencies of inherent structures through energy landscape
sampling have revealed that higher temperature liquid phase inherent structures are generally
shallower (wider curvature, with lower transition barriers for escape) and possess higher
potential energies on average than those sampled at lower temperatures [15][16]. In conjunction
with a gradual reduction in thermal energy and the gradual evolution to deeper, lower energy
inherent structures at lower temperatures, an underlying topological (continuous) phase transition
is found to occur in the potential energy landscape at the Mode Coupling temperature, TMC (often
lying somewhere between the Tg and TM of many liquid melts) [17][18]. Above this critical
temperature, the nearest stationary points or generalized inherent structures (GIS) visited through
means of steepest descent energy minimization are found to correspond to saddle points
(potential energy Hessian at critical point possesses at least one negative eigenvalue),
subsequently, diffusion and atomic transport in this region predominately occurs along unstable
directions of saddles[46]. Below TMC, a topological phase transition occurs to a phase space
domain whose nearest stationary points correspond to local potential energy minima (all positive
energy Hessian eigenvalues). Consequently, dynamics are seen to become increasingly activated
upon cooling, with phonon-like vibrational modes predominating in this low temperature phase
while being absent in the high temperature phase above TMC. These underlying topological
changes in the potential energy landscape have huge impacts on transport properties and
structural relaxation times which are directly related to the ease at which the liquid can explore
nearby configurations, eventually leading to a divergence in underlying relaxation times in the
heavily undercooled domain. These concepts are crucial to the understanding of the evolution of
transport properties, the glass transition phenomena, and the cooling rate dependence of
thermodynamic and physical properties in supercooled liquids and metallic glasses.
11
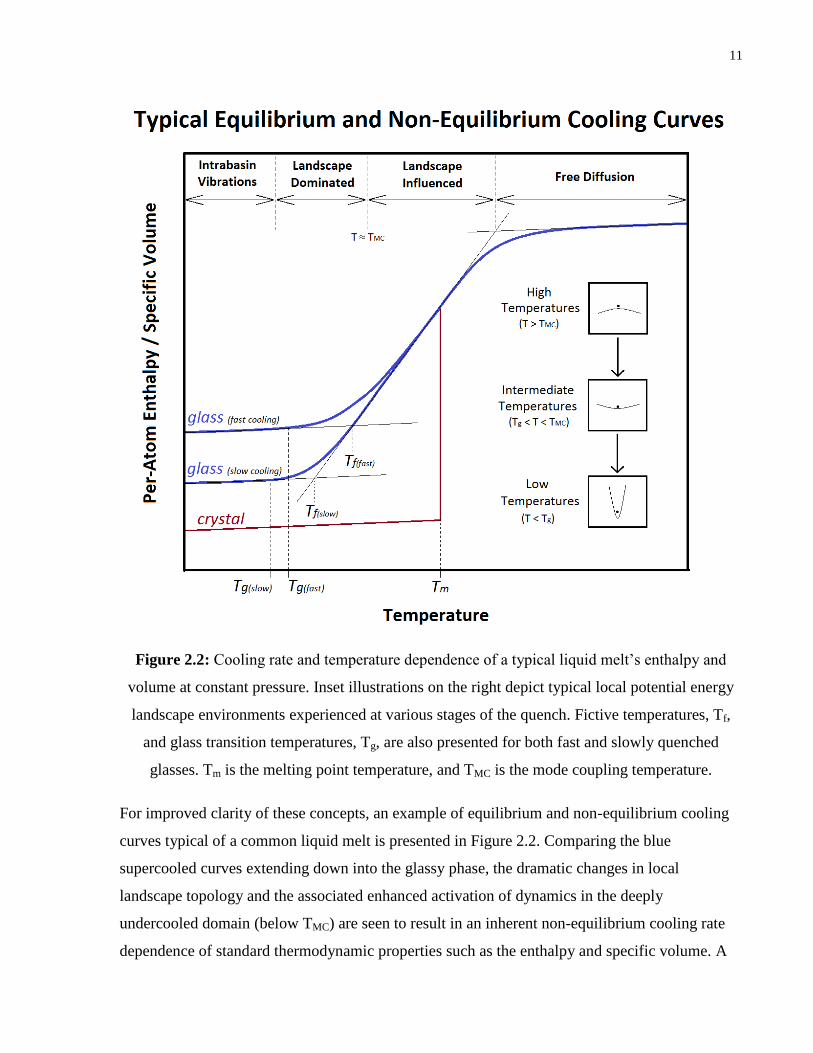
Figure 2.2: Cooling rate and temperature dependence of a typical liquid melt’s enthalpy and
volume at constant pressure. Inset illustrations on the right depict typical local potential energy
landscape environments experienced at various stages of the quench. Fictive temperatures, Tf,
and glass transition temperatures, Tg, are also presented for both fast and slowly quenched
glasses. Tm is the melting point temperature, and TMC is the mode coupling temperature.
For improved clarity of these concepts, an example of equilibrium and non-equilibrium cooling
curves typical of a common liquid melt is presented in Figure 2.2. Comparing the blue
supercooled curves extending down into the glassy phase, the dramatic changes in local
landscape topology and the associated enhanced activation of dynamics in the deeply
undercooled domain (below TMC) are seen to result in an inherent non-equilibrium cooling rate
dependence of standard thermodynamic properties such as the enthalpy and specific volume. A

12
more rapid quenching process can be viewed to prematurely “freeze” the supercooled liquid into
a less thermodynamically relaxed, higher energy subset of amorphous inherent structures. In this
respect, the fictive temperature, Tf, of a glass is defined as the temperature at which the
theoretical (metastable) equilibrium liquid would be expected to occupy the same subset of
configurational space (basins) in which the glass is frozen into, which in practice is determined
by the intersection of extrapolated glass and equilibrium liquid property lines. Consistent with
these notions, more rapidly quenched glasses are seen to possess higher fictive and glass
transition temperatures (as illustrated in Figure 2.2, with Tf,(fast) > Tf,(slow) and Tg,(fast) > Tg,(slow)).
The process of glass formation can subsequently be understood as a non-equilibrium process,
intrinsically linked to the competition between internal (structural, enthalpic, etc.) relaxation
times and experimental timescales governed by the cooling rate. At the glass transition
temperature, internal shear/enthalpic relaxation times 𝜏𝑖𝑛𝑡 become comparable in magnitude to
experimental/observational timescales (𝜏𝑖𝑛𝑡 ≈ 𝜏𝑜𝑏𝑠). Considering that shear viscosity is
proportionally dependent upon underlying shear relaxation times (𝜂~ 𝜏𝑟𝑒𝑙), this condition is
generally satisfied for most liquids under standard experimental operating conditions when
viscosities are on the order of 1012 Pa-s. Hence the standard rheological definition for the glass
transition temperature: 𝜂(𝑇𝑔) = 1012 Pa-s. Bringing everything together, when cooling the liquid
below the melting/liquidus point under equilibrium conditions, sufficient time is provided for the
system to explore a representative volume of configurational space and to eventually reach an
“entrance pathway” leading to the low energy, thermodynamically favorable crystalline phase.
Under highly non-equilibrium cooling conditions (i.e. rapid quenching), insufficient time is
provided for the system to transition to lower energy crystalline basins, with crystallization
effectively being bypassed.
2.4 Transport Properties and Kinetics in the Liquid and Supercooled Domains
In the high temperature equilibrium liquid melt regime (T >> TM), the availability of excess
thermal energy largely overrides underlying potential energy landscape influences on dynamics,
resulting in transport properties well described by the free diffusion of spherical particles. With
this in mind, simple hydrodynamic treatments of particle dynamics in accordance with the Stoke-
Einstein relations predict a simple inverse law relationship between shear viscosities and

13
diffusivities in this regime, which is largely found to hold well down into the minimally
undercooled regime for the majority of liquid melts [19]:
D(T) =
k𝐵T
6πbη(T)~𝑐
𝑇
η(T)
(2.9)
where D(T) and η(T) is the self-diffusivity and shear viscosity at temperature T, and b is the
effective hydrodynamic atomic radius. As per the standard Maxwell fluid model (or more
concretely under the Green-Kubo relations in the framework of linear response theory and non-
equilibrium statistical mechanics), the shear viscosity is directly related to underlying shear
relaxation times, η(T)~τshear(T). At very high temperatures, linear transport properties and
corresponding relaxation times display an approximate Arrhenius law temperature dependencies
under a singular effective activation energy, 𝐸𝑎:
τ(T) ~ exp(
EakBT
) (2.10)
However, as system dynamics become increasingly landscape influenced upon further cooling, a
departure from an Arrhenius form of temperature dependency is expected in most systems.
Instead, the temperature dependence of underlying relaxation and transport properties in the
lower temperature liquid and supercooled melt domain is more generally described by the Vogel-
Tamman-Fulcher (VFT) functional form [19]:
η(T), τshear(T), τthermal(T), D
−1(T) ≈ Aexp[B
T − To]
(2.11)
where A, B, and To are temperature independent constants. The classification of liquids as
“strong” or “fragile” serves as a useful metric quantifying the adherence of viscosity and
relaxation times to the Arrhenius law functionality, with fragile liquids displaying more marked
deviations from the Arrhenius form. Fragile glasses can be understood to experience a more
dramatic and abrupt viscous slow-down process on approach to the glass transition temperature
in the deeply undercooled liquid domain, a concept which is more clearly illustrated by the more
linear Tg-scaled log-viscosity profile (known as Angell plots [20]) observed in strong glasses. In
practice, the kinetic fragility parameter, m, and strength parameter, 𝐷∗, serve to quantify the

14
fragility of liquids (both defined below), with lower kinetic fragilities and higher strength
parameters being reflective of less fragile / stronger liquids.
m = (
∂log10η(T)
∂(Tg/T))T=Tg
(2.12)
D∗ = B/T0 (2.13)
2.5 Crystallization Kinetics
Many of the concepts discussed in the previous sections have been concerned with properties of
supercooled liquids, with the implicit assumption that the disordered liquid phase exists in a state
of metastable equilibrium. The metastability of the supercooled liquid phase requires the
presence of a significant free energy barrier, ∆𝐺𝑙→𝑐∗ , located at some intermediate transition state
, ⟨𝑿⟩𝑡𝑟𝑎𝑛𝑠𝑖𝑡𝑖𝑜𝑛 = 𝑿∗, which effectively separates the landscape sub-domains of “Amorphous” and
“Crystalline” inherent structures, thereby inhibiting the free transitioning of the system to the
lower free energy crystalline phase. Recalling that the probability, P, of sampling a microstate
corresponding to the macrostate, 𝑿∗, is directly related to the system free energy:
P(𝐗∗)~exp −
H(𝐗∗) − TS(𝐗∗)
kBT = exp −
G(𝐗∗)
kBT
(2.14)
the free energy barrier ∆𝐺𝑙→𝑐∗ can be understood to quantify the relative statistical improbability
of sampling “entrance pathways” (generalized transition states) leading to the crystalline phase,
which itself can be expressed in terms of the transition state enthalpy, 𝐻(𝑿∗), and entropy,
S(𝑿∗):
H(𝐗∗) =< E + PV >𝐗=𝐗∗
S(𝐗∗) = kBlnN(N, E, V|𝐗∗)
(2.15)
where 𝑁(, , |𝑿∗) is the total number of distinct states within some narrow particle number,
energy, and volume band about the barrier state 𝑿∗. Physically, the large free energy barrier to
crystallization is reflective of the statistical rarity of the initial nucleation event corresponding to
the formation of a small localized cluster of ordered atoms. Cluster stability is ensured beyond
some critical nuclei size, with crystal growth subsequently seen to occur spontaneously.

15
2.5.1 Nucleation Kinetics
Viewed from a local equilibrium fluctuations based perspective, nucleation kinetics can be
understood to depend on three main factors: 1) the probability of randomly sampling a critically
sized cluster of atoms of appropriate structure and composition (which initially may even deviate
from that of the bulk crystallizing phase) in the parent (metastable) liquid, 2) the kinetics of
elementary ordering and chemical attachment processes at the interface, and 3) diffusive
transport rates and the relative availability/concentrations of chemical species at the interface
required for initial growth and stabilization. In the situation that the composition of the
nucleating crystalline phase deviates significantly from that of the parent liquid phase (for
instance in the non-polymorphic crystallization of a distant intermetallic), the nucleation process
is generally time-dependent and highly complex in nature, with kinetics depending on the
relative competition between all three factors. The combined influence of lower critical cluster
sampling probabilities associated with the significant compositional mismatch, in addition to
lower availabilities of chemical species at the interface and the requirement for larger length-
scale diffusive transport from the bulk parent liquid result in significant barriers for nucleation
and subsequent growth. Without the absence of any limiting assumptions on the nucleation
process, a general analytic description of nucleation kinetics in such situations is currently
unavailable. Taking the simplified approach of the Coupled-Flux Model (CFM) [23], however,
such cases can be numerically modelled by considering the time-dependent fluxes of chemical
species between three generalized regions: namely, the cluster, the immediate region around the
cluster (describing some chemically depleted zone in the neighbourhood of the interface), and
the parent liquid phase (which subsequently surrounds the shell).
In the case of interface controlled kinetics (i.e. in polymorphic crystallization processes where
the liquid and crystal phase possess identical compositions, or when chemical diffusion rates are
significantly higher than surface attachment rates), the steady state homogeneous nucleation rate
(Iss) is predicted under Classical Nucleation Theory (CNT) to be of the form [21][22]:
Iss(T) = A(T)e
−ΔG∗(T)kBT
(2.16)
→ Nnuclei(t) ≈ ∫ Iss ∗ Vliquiddt
t
0

16
where ΔG∗(T) is the Gibbs free energy barrier for nucleation, and A(T) is a temperature
dependent kinetic pre-factor. The explicit functional dependencies of these two factors can be
understood by first considering that the nucleating cluster size probability distribution, P(n), is
directly related to the is directly related to the minimum reversible work of cluster formation,
ΔG(n), in the metastable equilibrium supercooled liquid (essentially by choosing crystalline
cluster size n as an order parameter) [21]:
ΔG(n) = G(n) − 𝑛μl (2.17)
where μl is the parent liquid partial molar Gibbs free energy. The equilibrium concentration of
ordered clusters of size n, C(n), in the liquid is therefore expected to be given by:
P(n) ∝ e
−ΔG(n)kBT → C(n) = C1e
−ΔG(n)kBT
(2.18)
where C1 ≈ 1 is the fraction of atomic sites available for cluster growth and is effectively taken
to be every atomic site in the system (assuming thermal equilibrium for monomers in the liquid
where P(1) ≫ ∑ 𝑃(𝑛)𝑛>1 for n < n∗) [22]. The approximation of a sharp interfacial boundary
separating the ordered (spherical) crystalline nuclei and the surrounding disordered liquid phase
allows the simplified expression of ΔG(n) as the combined interaction of two independent terms:
1) a positive surface area dependent destabilizing contribution (proportional to the total nuclei
surface area, 4𝜋𝑟𝑛2 , or equivalently to (36𝜋)1/32/3𝑛2/3 where is the specific volume)
associated with energetic and entropic penalties linked to the creation of an interface, and 2) a
negative volume dependent stabilizing contribution (proportional to the total nuclei
volume, 4
3𝜋𝑟𝑛
3, or to the total number of atoms n in the nuclei) associated with the lower free
energy of the bulk crystalizing phase. Denoting the partial molar enthalpy and entropy difference
between the liquid and crystalline phase, Δhl,c and Δsl,c the partial-molar free energy difference
driving crystallization is subsequently given by:
Δμl,c = Δhl,c − TΔsl,c (2.19)
Denoting, 𝜎𝑙,𝑐, the liquid-crystal interfacial free energy, ΔG(n) is simply expressed as [23]:
ΔG(n) = nΔμl,c + (36π)1/3v2/3n2/3σl,c (2.20)
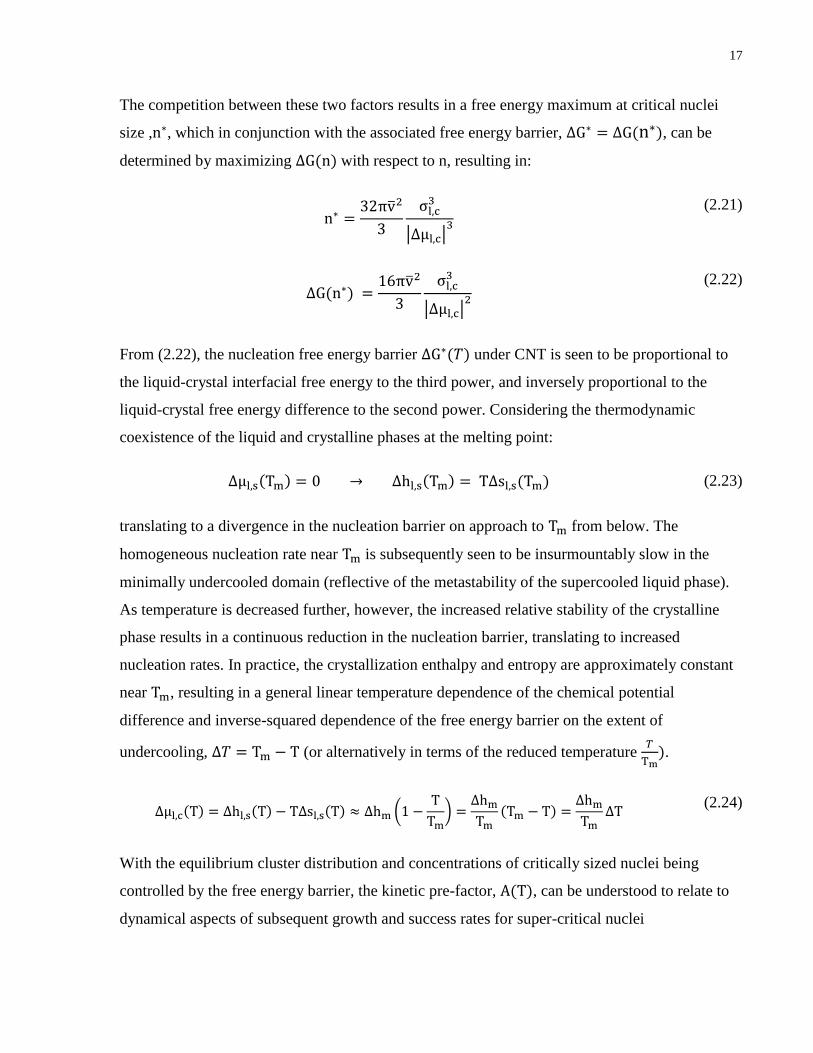
17
The competition between these two factors results in a free energy maximum at critical nuclei
size ,n∗, which in conjunction with the associated free energy barrier, ΔG∗ = ΔG(n∗), can be
determined by maximizing ΔG(n) with respect to n, resulting in:
n∗ =
32πv2
3
σl,c3
|Δμl,c|3
(2.21)
ΔG(n∗) =
16πv2
3
σl,c3
|Δμl,c|2
(2.22)
From (2.22), the nucleation free energy barrier ΔG∗(𝑇) under CNT is seen to be proportional to
the liquid-crystal interfacial free energy to the third power, and inversely proportional to the
liquid-crystal free energy difference to the second power. Considering the thermodynamic
coexistence of the liquid and crystalline phases at the melting point:
Δμl,s(Tm) = 0 → Δhl,s(Tm) = TΔsl,s(Tm) (2.23)
translating to a divergence in the nucleation barrier on approach to Tm from below. The
homogeneous nucleation rate near Tm is subsequently seen to be insurmountably slow in the
minimally undercooled domain (reflective of the metastability of the supercooled liquid phase).
As temperature is decreased further, however, the increased relative stability of the crystalline
phase results in a continuous reduction in the nucleation barrier, translating to increased
nucleation rates. In practice, the crystallization enthalpy and entropy are approximately constant
near Tm, resulting in a general linear temperature dependence of the chemical potential
difference and inverse-squared dependence of the free energy barrier on the extent of
undercooling, ∆𝑇 = Tm − T (or alternatively in terms of the reduced temperature 𝑇
Tm).
Δμl,c(T) = Δhl,s(T) − TΔsl,s(T) ≈ Δhm (1 −
T
Tm) =
ΔhmTm
(Tm − T) =ΔhmTm
∆T (2.24)
With the equilibrium cluster distribution and concentrations of critically sized nuclei being
controlled by the free energy barrier, the kinetic pre-factor, A(T), can be understood to relate to
dynamical aspects of subsequent growth and success rates for super-critical nuclei

18
formation[21][22][23]. Under the ballistic steady-state approximation (where only the forward
reaction-rates need to be considered), the kinetic pre-factor is given by:
A(T) = ρβ∗(T)Z𝑓(T) (2.25)
Where ρ is the liquid density, 𝛽∗ is the growth-rate for critically-sized clusters, and Zf is the
Zeldovich factor, which is related to the curvature of the free energy profile at the top of the free
energy barrier:
Z𝑓(T) = (
1
2πkBT
∂2ΔG
∂n2|n∗)
1/2
= (|Δμl,s|
6πkBTn∗)1/2
(2.26)
The Zeldovich factor (often on the order of 0.01 ≪ 𝑍 ≪ 0.1 [48]) corrects for the relative
depletion of larger sized clusters at steady-state, as well as the fact that not all clusters of critical
size will successfully proceed to become larger (stable) crystallites, with some stagnating near
critical sizes and others re-dissolving under standard thermodynamic fluctuations. The relative
flatness of the free energy profile near the top of the barrier (which to second order is controlled
by 𝜕2ΔG
𝜕𝑛2|n∗
) effectively translates to cluster sizes fluctuating with jump frequency, 𝛽∗, according
to a Brownian random walk [24] within a size interval, ∆𝑛, of the critical size where free energy
differences are within ~ 𝑘𝐵𝑇 from the maximum. With these corrections made through the
inclusion of the Zeldovich factor, the only parameter remaining is the growth-rate of critically-
sized nuclei, 𝛽∗(𝑇).
In the case of interface-controlled crystal growth for which growth is not rate-limited by the
long-range diffusion of chemical species to the interface, the surface attachment (𝑟𝑎) and
detachment (𝑟𝑑) rates associated with the bimolecular monomer addition/subtraction (or
attachment/detachment) reactions can be generally expressed under the framework of transition
state theory. The attachment or detachment of a single monomer from the crystal surface can be
viewed to require the bypass of some elementary activation barrier 𝛿𝑔∗ associated with some
intermediate configurational transition state. Defining 𝑣 as the elementary attempt frequency
(which is on the order of the mean atomic vibrational frequency), the forward molecular
attachment rate 𝑟𝑎 can subsequently be expressed as [24]:

19
ra = ve
−δg∗
kBT (2.27)
Considering only the forward molecular attachment rates (with corrections included in the
Zeldovich factor), and factoring in that approximately 4𝑛∗2/3 available attachment sites exist at
the surface of the spherical nuclei [24], the growth-rate 𝛽∗ for critically sized nuclei is given by:
β∗(T) = 4n∗2/3ve−δg∗/kBT (2.28)
However, with each elementary monomer addition step corresponding to the thermally activated
“hopping” of an atom across a distance 𝑎0 approximately equal to the atomic spacing, 𝛽∗(𝑇) is
more commonly expressed in terms of the atomic diffusivity:
6D(T)
a02 ≈ ve
−δg∗
kBT → β∗(T) =24D(T)n∗2/3
a02
(2.29)
Thus, in conjunction with the initial rise in the steady-state homogeneous nucleation rate
expected due to the decreasing tendency of the free energy barrier with undercooling, a later
decay of the nucleation rate is further predicted at extended degrees of undercooling due to the
dramatic slowdown of atomic mobilities in the lower temperature domain.
2.5.2 Growth Kinetics
Once a sufficient quantity (which may be as few as one) of supercritical sized clusters have
nucleated in the bulk liquid, crystallization kinetics is primarily dictated by the subsequent
growth-rates of existing nuclei. The time and temperature dependence of growth-velocities,
𝑌𝑡(𝑇), is highly dependent upon whether the underlying process is inherently diffusion (short-
range or long-range) or interface limited [24]. In the case of long-range diffusion controlled
growth processes, significant compositional mismatch between the liquid and crystallizing phase
can be understood to result in the development of a “depletion zone” surrounding the crystal
nucleus for which concentrations of required chemical species are significantly depleted relative
to the bulk liquid [24]. With each successive layer of crystal growth resulting in a proportional
increase in the width of the depletion zone (∆𝑥), and growth-rates being limited by the time
required for chemical diffusion from the bulk to the interface, crystal growth-rates are observed
to follow:

20
tdiffusion ≈
∆x2
6D → Yt(T) ∝
d∆x
dt≈ √
6D
t
(2.30)
Crystal growth-rates in long-range diffusion limited systems are subsequently seen to be severely
stunted in accord to an inverse-square-root time dependence, and with the inclusion of a constant
pre-factor, 𝑘𝑐𝑖(𝑇), the (planar) growth-rate generally follows:
Yt(T) = kci√D(T)
t
(2.31)
→ rnuclei(t) ≈ ∫ Ytdt =t
0
kci2√Dt
With the exception of long-range diffusion controlled processes described above, crystal growth
is well described under a single (time-independent) steady-state growth-velocity, 𝑌𝑠𝑠(𝑇). In
specific, the steady-state isothermal (planer) growth-velocity expected under interfacial-control
is generally given by [24]:
Yss(T) =
fD(T)
a0[1 − e
−Δμl,c(T)
kBT ] (2.32)
→ rnuclei(t) ≈ ∫ Yssdt =
t
0
Ysst
where 0 < 𝑓 < 1 is the fraction of available sites for attachment, and is generally dependent
upon the surface structure and surface-reaction mechanism. Viewing equation 2.18 above, the
isothermal (steady-state) growth-velocity is seen to possess a similar temperature profile as the
nucleation rate, with rates being zero at the limits of low and high degrees of undercooling. In
contrast, however, the exponential dependence of steady-state growth-rate on the liquid-crystal
free energy difference results in a much more rapidly increasing linear temperature dependency
in the minimally undercooled domain.

21
2.5.3 Critical Cooling Rate
From a theoretical standpoint, thermodynamic forces driving crystallization can be inhibited in
any alloy system should the cooling rate be sufficiently high. Imposing a cutoff crystalline
fraction (often determined by standard detection limits of 10−6 or 0.0001 percent crystalline), the
associated critical cooling rate Rc is a natural metric for glass forming ability. As discussed in the
previous sections, the dependencies of the critical cooling rate can be separated into two main
factors: 1) the rate or frequency at which new crystalline nuclei spontaneously form in the
metastable equilibrium liquid, 𝐼𝑡(𝑇), and 2) the growth-rate or growth-velocity of existing crystal
nuclei, 𝑌𝑡(𝑇). Taking the simplifying assumption of a steady-state nucleation and growth
process, with isothermal nucleation rate per unit volume of liquid, 𝐼𝑠𝑠(T), and steady-state
isothermal growth-velocity, 𝑌𝑠𝑠(𝑇), the expected crystal volume fraction , 𝑋𝑐𝑟𝑦𝑠𝑡𝑎𝑙(𝑡), can be
approximated in the initial stages of crystallization where crystal volume fractions are minimal,
i.e for small time, t, when:
Xcrystal =
Vcrystal
V≈Vcrystal
Vliquid≈ 0
(2.33)
First, considering that the radius of a single nuclei, 𝑟𝑛𝑢𝑐𝑙𝑒𝑖(𝑡), after time t of nucleating is
approximately equal to 𝑌𝑠𝑠 ∗ 𝑡, the corresponding volume of the single spherical crystallite is
given by:
Vnuclei(t) =
4
3πr3(t) ≈
4
3π(Ysst)3 =
4π
3Yss3t3
(2.34)
Using this expression, the total crystallized volume after time t can be estimated by integrating
over the volumes of all individual crystals nucleated since time t = 0.
Vcrystal(t) ≈ ∫ I
ss(t′) ∗ Vliquid(t′) ∗
t
0
Vnuclei(t − t′)dt′
(2.35)
In the steady state approximation, 𝐼𝑠𝑠 and 𝑉𝑙𝑖𝑞𝑢𝑖𝑑 ≈ 𝑉 are effectively time independent,
therefore:
22
Xcrystal(t) =
Vcrystal(t)
V≈ Iss∫
4π
3Yss3(t − t′)3
t
0
dt′ =π
3IssYss3t4
(2.36)
With this in mind, the time required for crystallization up to cutoff crystalline fraction x (which
may for example be imposed by instrumental detection limits) under isothermal conditions at
temperature T, 𝑡𝑥𝑠𝑠(𝑇) is:
txss(T) = (
3x
πIss(T)Yss(T)3)
14
(2.37)
The isothermal crystallization rate can therefore be seen to be controlled by the weighted product
of the nucleation rate and growth-velocity. With the free energy barrier diverging to infinity in
the minimally undercooled domain and gradually decreasing upon extended undercooling, the
nucleation rate is generally observed to peak at significantly higher extents of undercooling
relative to the growth-velocity. These considerations, in conjunction with the higher weighting of
the growth-velocity (by a power of 3) on the isothermal crystallization rate, are seen to result in
peak isothermal crystallization rates in the high temperature supercooled domain. This is most
evident upon analysis of Time-Temperature-Transformation (T-T-T) diagrams of common glass
forming alloys, for which the nose temperature (determined by the tangent intersection of the
linear cooling rate curve starting at 𝑇𝑚 with the T-T-T curve is often found to lie near:
Tnose ≈ 0.9Tm (2.38)
While the quenching process involved in glass formation is inherently non-isothermal, the slope
(dT/dt) of the tangent linear cooling curve intersecting at the nose temperature is often a good
upper-bound/conservative estimate of the critical cooling rate, 𝑅𝑐(𝑥).
2.6 Predictive Indicators of Glass Forming Ability
Due to the complex functional dependencies of glass forming ability on a host of thermal history
dependent and compositionally sensitive parameters, in conjunction with the vast compositional
spaces inherent to multicomponent BMG systems, predictive optimization methods for the
identification of new high GFA alloys possess severe limitations in practicality and scope.
Lately, significant effort has been placed on the identification of simple and easily extractable

23
(either through modeling, simulation, or experiment) parameters that strongly correlate with high
glass forming ability in general, with the greater goal of using said parameters for predictive
compositional tuning purposes.
In line with these notions, heuristic guidelines first introduced by Inoue [25] identify three key
features of the stabilized supercooled phase: 1) multicomponent systems, with a generally
monotonic improvement in stability as number of components is increased, 2) presence of
significant atomic size ratios greater than 12 percent, and 3) large negative heats of mixing.
Based on considerations of local topological stability of short-range packing structures in
multicomponent mixtures, Egami [26] added two additional conditions favorable for bulk
metallic glass formation in higher order ternary and quaternary systems: 4) increased interaction
between small and large elemental components, and 5) decreased interaction and/or repulsive
interactions between smaller elemental components. Combined, these guidelines serve to
illustrate the complex interplay between compositional ordering, short-range topological stability
and interactions, and global phase stability of the melt. In the absence of explicit relationships
outlining the interdependencies of these different factors and their connections to GFA, it has
proven difficult to translate these heuristic guidelines into useful GFA predictors.
While empirical in nature and requiring more detailed knowledge of the physical system in
question, thermos-physical properties such as the reduced glass transition temperature Trg, the
temperature difference between glass transition and onset crystallization (from below), ΔTx, the
gamma value, γ, and the viscous fragility parameter, m, are found to correlate well with glass
forming ability in general.
Trg = Tg/Tl (2.39)
ΔTx = Tx − Tg (2.40)
γ = Tx/(Tg − Tl) (2.41)
m = (
∂log10η(T)
∂(Tg/T))T=Tg
(2.12)

24
The reduced glass transition temperature can be understood to quantify the extent of
undercooling required for glass formation in a normalized fashion, with larger values expected
for higher GFA alloys near deep eutectics. ΔTx is reflective of devitrivication kinetics and
crystallization rates in the highly undercooled liquid, a largely diffusion controlled domain. The
liquid fragility parameter further serves to differentiate “strong” and “fragile” glasses based on
how abrupt the viscous slowdown process is on approach to the glass transition temperature, with
lower fragilities being generally indicative of lower atomic mobilities in the supercooled domain
and high GFA. Each of these parameters serve to quantify key influencing factors governing
crystallization kinetics in general, the thermodynamic forces driving crystallization, and the
kinetic factors inhibiting nucleation and growth.
2.6.1 Interface Stability and the Liquid-Crystal Interfacial Free Energy
Due to the interfacial free energies’ influence on the nucleation barrier and role in dictating
nucleation kinetics, significant effort has been placed on the investigation of its key influencing
factors and prediction. Turnbull [27] revealed the strong correlation between the gram-atomic
(molar) interfacial free energy, σl,sM , and the latent heat of fusion, Δhs,l = Δss,l/𝑇𝑚, for a range of
elemental metals:
σl,sM = σl,sρ
−2/3NA = αΔhs,l =Δss,lTm
(2.42)
where ρ−2/3 is the density of atoms on the crystal interface, NA is Avogadro’s number, and α is
the Turnbull coefficient which is dependent upon the structure and orientation of the crystal at
the interface, ranging between 0.45 for closely packed structures (e.g. fcc or hcp), and 0.33 for
more open structures (such as the diamond cubic). Correlations to the latent entropy of fusion
suggest an intrinsic connection between the interfacial free energy and the extent of
configurational mismatch between the liquid and crystal phase. Recent experimental
determinations of Turnbull coefficients [28] and liquid-crystal interfacial energies in the Cu-Zr
system were highly successful in predicting trends in critical casting diameters, further enforcing
the importance of interfacial properties and the general controlling nature of the nucleation
barrier on glass forming ability. Unfortunately, without exact knowledge of the structure and
associated optimal crystal cluster geometries and orientations at the liquid-crystal interface, the
direct simulation and calculation of interfacial free energies over a broad range of compositions

25
in multicomponent alloy systems is largely unfeasible. Surprisingly, however, molecular
dynamics investigations conducted by Kang et al. [28] of glass-glass interfacial energies were
similarly successful in predicting trends in critical casting diameters in the Cu-Zr system (over
the 30-54 percent copper compositional range). Simulation methods involved cutting and
separating the supercooled liquids along an arbitrary plane, relaxing the structures, and
calculating the difference in system energies after the recombination of the two separate faces.
Considering the observed predictive success of this method while completely neglecting to
consider crystalline phase properties, these findings further suggest that glass forming ability,
and interfacial properties in general, are strongly controlled by the short-range chemi-topological
ordering and bonding properties of the disordered liquid phase.
2.6.2 Liquid and Amorphous Phase Packing Efficiency
Amorphous phase packing efficiency and the extent of free volume in the liquid melt has been
identified to be one of the best single indicators of glass forming ability. In accordance with these
notions, amorphous phase densities have been observed to strongly correlate with underlying
compositional dependencies of glass forming ability in the Cu-Zr system over a broad
compositional range [29]. Li et al.’s investigation of compositional dependencies of fractional
density changes (or excess free volume) upon crystallization showed direct correspondence with
critical casting thicknesses, with experimental results indicating minimal density changes
(minimal free volumes) for high GFA compositions of Cu64Zr36, Cu56Zr44, and Cu50Zr50.
Considering correlations between liquid free-volume, viscosities at the liquidus/melting
temperature [11], and the kinetic fragility parameter [30], these results suggest that enhanced
atomic mobility constraints associated with more efficient liquid-state atomic packing in these
select compositions are the root of their higher glass forming ability. Further consistent with
these notions is the general success of the Miracle Glass model in predicting high glass forming
compositions based on simple considerations of ideal atomic-size ratios for the attainment of
optimal short-range cluster packing efficiencies[9][10].
2.6.3 Icosahedral Short-range Ordering
Owing to their greater topological and energetic stability as isolated units, as well as their
respective 12-point group symmetry which is generally incompatibility with translationally
symmetric structures, icosahedral ordering has been argued to play a critical role in the

26
stabilization of supercooled melts [31][32]. Recent findings have shown a general exponential
dependence of structural relaxation times with the medium-range connectivity of icosahedral
clusters in the Copper-Zirconium metallic liquids [32], linking the formation of large-scale
icosahedral networks with slower liquid state dynamics. In addition to the general influence of
icosahedral ordering on slowing atomic transport properties, topological aspects regarding
icosahedral structures are arguably just as (if not more) important. Despite the inability to form
translationally periodic structures, the icosahedral coordination is topologically close-packed
(containing only tetrahedral interstices). Moreover, icosahedral packing of distorted polyhedra
produces highly globally efficient packing structures [33]. With the interfacial free energy being
strongly related to the extent of short-range structural similarity between the liquid and crystal
boundary, and based on the general chemical and topological short-range incompatibility of the
icosahedra with that of common crystalline and near crystalline states, one would expect high
fractions of icosahedral clusters to inhibit crystallization kinetics. In cases where low free energy
crystalline polymorphs exist with compatible symmetries and structures, however, high degrees
of icosahedral short-range ordering may have the destabilizing effect of lowering the interfacial
free energy. Such an example is evident in the primary nucleation of the metastable quasi-
crystalline Icosahedral (-i) phase in Zr59Ti3Cu20Ni8Al1, where nucleation measurements
indicated interfacial free energies of σlc = 0.01 ± 0.004Jm−2 [31], a remarkably low value
relative to other crystalline phases. Nonetheless, in complex multicomponent systems where
crystallization is often diffusion limited, decreased melt free volume and higher melt viscosities
attributed to increased icosahedral short-range ordering has been found to largely outweigh
associated destabilizing effects on interfacial free energies [33].
2.6.4 Compositional Short-Range Ordering and Complexity
The general enhancement of supercooled melt stability observed in BMGs under increasing
number of components, as well as the emphasis on the presence of significant atomic size ratios
(>12%) between constituent alloy elements can be understood to reflect the intricate connection
between GFA and the degree/complexity of chemical short-range ordering in the disordered
phase. With the likelihood of the primary nucleating crystalline phase possessing identical bulk
compositions to that of the parent melt becoming increasingly low as the number of components
increase, and with greater atomic size-mismatch between constituent elements reducing the
stability of less compositionally constrained solid solution phases while simultaneously allowing

27
for more efficient packing in the disordered phase through enhanced preferential ordering of
chemical species and the filling of interstitial sites, crystal nucleation and growth kinetics can
subsequently be seen to become heavily (short and long-range) diffusion-limited processes. The
increased compositional complexity that is likely to exist in the crystallizing phase further
inhibits crystallization kinetics due to the requirement for longer length-scale chemical transport
and rarer structural reordering events for the initial nucleation and subsequent growth to occur.
Dynamic decoupling associated with the broad range of atomic mobilities expected among larger
and smaller chemical species adds further constraints on crystallization rates, with diffusion
limitations primarily being controlled by the slowest, least mobile components.

28
Chapter 3
3 Methodology and Computational Details
3.1 Molecular Dynamics
Many body molecular dynamics (MD) simulations conducted in this work for the investigation
of structural, bonding, and kinetic property evolution in the liquid and glassy domains were
performed using the Large-scale Atomic/Molecular Massively Parallel Simulator (LAMMPS)
[34]. In particular, atomic interactions for the binary alloys simulated in this study are described
using empirically derived Embedded Atom Method (EAM) interatomic potentials. In the EAM
model, the total system potential energy, 𝑉𝑡𝑜𝑡, is expressed by the following expression [35]:
𝑉𝑡𝑜𝑡 =
1
2∑𝜑𝑠𝑖𝑠𝑗(𝑟𝑖𝑗) +∑𝐹𝑠𝑖(𝜌)
𝑖𝑖≠𝑗
(3.1)
The first term in this expression is the sum of all pair interactions between atoms in the system,
where 𝜑𝑠𝑖𝑠𝑗(𝑟𝑖𝑗) is the pair-interaction potential between atom i of chemical-type 𝑠𝑖, and atom j
of chemical-type 𝑠𝑖, as a function of their spatial separation 𝑟𝑖𝑗. Many-body contributions to
atomic interactions are accounted for in the second term of this expression involving sums over
individual atom embedding energies, 𝐹𝑠𝑖, which itself is dependent upon the mean local electron
density experienced by host atom i, 𝜌, as induced by all other atoms in the system. The mean
local electron density as experienced by host atom i is subsequently given as a sum over
individual atom electron density functions, 𝜌𝑠𝑗(𝑟𝑖𝑗), as:
𝜌 =∑𝜌𝑠𝑗(𝑟𝑖𝑗)
𝑖≠𝑗
(3.2)
Simulations of atomic trajectories under the NVE microcanonical ensemble can subsequently be
understood to follow from discrete numerical time integration of the classical (Hamiltonian)
evolution equations, with atomic forces, 𝑭𝑖, directly calculated through the evaluation of the
three-dimensional potential energy gradient with respect to atomic positions, 𝒓𝑖:

29
𝑭𝑖 =
𝜕𝒑𝑖𝜕𝑡
= −∇𝒓𝑖𝑉𝑡𝑜𝑡 (3.3)
Assigning initial atomic coordinates, 𝒓𝑖(0), according to some known crystal structure or phase,
velocities, 𝒗𝑖(0) = 𝒑𝑖(0)/𝑚𝑖, are initialized by appropriate sampling (ensuring that net system
momentum is zero) of the Maxwell-Boltzmann distribution:
𝑓(𝑣) = (
𝑚
2𝜋𝑘𝐵𝑇)1/2
𝑒−𝑚𝑣2/2𝑘𝐵𝑇
(3.4)
With initial atomic coordinates and momenta configured, subsequent time evolution of atomic
coordinates and velocity/momenta under discrete time-step, ∆𝑡 (on the order of 1fs), following
the iterative NVE velocity Verlet time-integration algorithm used in this work is expressed
through the simple three-step procedure:
1) 𝒑𝑖 → 𝒑𝑖 +∆𝑡
2𝑭𝑖
2) 𝒓𝑖 → 𝒓𝑖 + ∆𝑡𝒑𝑖
𝑚𝑖
𝑅𝑒𝑐𝑎𝑙𝑐𝑢𝑙𝑎𝑡𝑒 𝐹𝑜𝑟𝑐𝑒𝑠
3) 𝒑𝑖 → 𝒑𝑖 +∆𝑡
2𝑭𝑖
(3.5)
System temperature and pressure control for use in more generalized NVT or NPT operating
conditions are conducted through modified evolution equations ensuring correct statistical
ensemble properties. In this work, standard Nose-Hoover temperature thermostats and pressure
barostats were used.
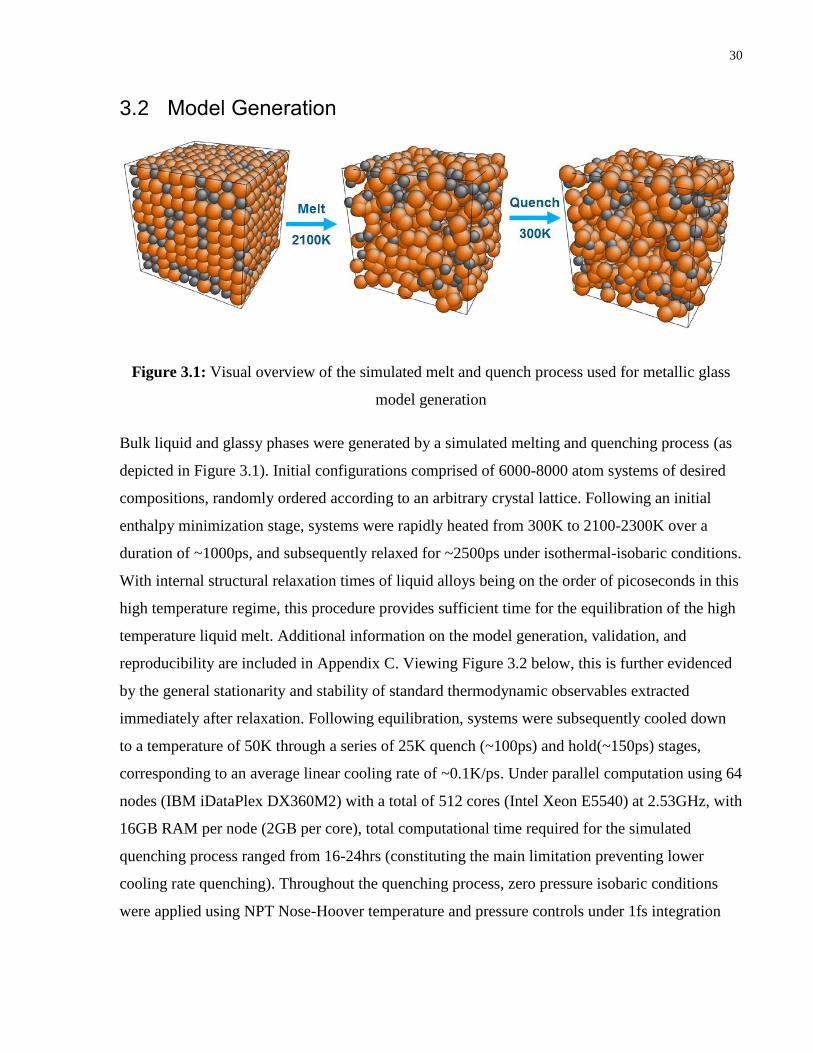
30
3.2 Model Generation
Figure 3.1: Visual overview of the simulated melt and quench process used for metallic glass
model generation
Bulk liquid and glassy phases were generated by a simulated melting and quenching process (as
depicted in Figure 3.1). Initial configurations comprised of 6000-8000 atom systems of desired
compositions, randomly ordered according to an arbitrary crystal lattice. Following an initial
enthalpy minimization stage, systems were rapidly heated from 300K to 2100-2300K over a
duration of ~1000ps, and subsequently relaxed for ~2500ps under isothermal-isobaric conditions.
With internal structural relaxation times of liquid alloys being on the order of picoseconds in this
high temperature regime, this procedure provides sufficient time for the equilibration of the high
temperature liquid melt. Additional information on the model generation, validation, and
reproducibility are included in Appendix C. Viewing Figure 3.2 below, this is further evidenced
by the general stationarity and stability of standard thermodynamic observables extracted
immediately after relaxation. Following equilibration, systems were subsequently cooled down
to a temperature of 50K through a series of 25K quench (~100ps) and hold(~150ps) stages,
corresponding to an average linear cooling rate of ~0.1K/ps. Under parallel computation using 64
nodes (IBM iDataPlex DX360M2) with a total of 512 cores (Intel Xeon E5540) at 2.53GHz, with
16GB RAM per node (2GB per core), total computational time required for the simulated
quenching process ranged from 16-24hrs (constituting the main limitation preventing lower
cooling rate quenching). Throughout the quenching process, zero pressure isobaric conditions
were applied using NPT Nose-Hoover temperature and pressure controls under 1fs integration

31
time-steps. Further property analysis at relevant temperatures of interest was conducted
following additional 300ps NPT/NVT/NVE relaxation runs.
Figure 3.2: Demonstration of the stability and stationarity of thermodynamic properties in the
high temperature Cu50Zr50 liquid melt after equilibration
3.3 Calculation of Thermodynamic and Bulk Physical Properties
Thermodynamic properties (entropies, free energies) were obtained using the 2PT method of Lin,
Blanco, and Goddard [36][37]. The method allows for the accurate calculation of thermodynamic
properties in complex multicomponent systems, requiring short MD simulations of (32ps used in
this study) for the extraction of the atomic vibrational density of states through the Fourier
transform of atomic velocity autocorrelation functions. System thermodynamic contributions are
separated into two components; a harmonically vibrating solid phase, and a diffusive hard sphere
phase accounting for inherent anharmonicities. The method hinges upon the appropriate
decomposition of the vibrational density of states (DOS) for each component in the mixture into
a diffusive gas-like contribution, Sg(ν), and a harmonically vibrating solid component, Ss(ν).
Once the phase contributions are decomposed, analytic relationships for the thermodynamic

32
properties of the quantum harmonic solid, and the diffusive hard-sphere mixture (based on
Enskog theory) are utilized for the calculation of total system properties (See references [36] and
[37] for a more detailed description of the 2PT methodology).
In cases where the primary crystalline phase is known a priori, melting points (Tm) of respective
systems were estimated based on the phase equilibrium condition of equal Gibbs Free Energy for
liquid and crystal phases. Following the work of Zhang, An, and Goddard , Δμ(Tg) is utilized in
this work as a common metric for evaluating phase stabilities of respective
amorphous/supercooled phases, with glass transition temperatures (Tg) estimated by the common
intersection point of polynomial fits to low temperature and high temperature enthalpy data(see
Zhang et al. [38], 2011, and Mendelev et al., 2009 [39]).
Second order thermodynamic properties (constant volume/pressure heat capacities and thermal
expansion coefficient) were calculated through two different methods: direct calculation of
enthalpy/energy and volume temperature derivatives through symmetric finite differencing of
cooling curve data, and secondly, through the fluctuations approach as expressed in the following
relations:
Cp ≡ (
∂H
∂T)P =
1
kBT2< δH2 >
NPT
(3.6)
Cv ≡ (
∂U
∂T)V =
1
kBT2< δU2 >
NVT
(3.7)
αT ≡ (
∂V
∂T)P =
1
kBT2< δV2 >
NPT
(3.8)
Similarly, the fluctuations approach was utilized for the calculation of isothermal
compressibility, βT (or inverse bulk moduli, BT):
βT = BT
−1 ≡ −1
V(∂V
∂T)T =
1
kBT
< δV2 >NPT
< V >NPT
(3.9)
Utilizing these results, (pseudo) Gruneisen parameters were extracted through the following
relation:

33
γ =
αTB
Cvρ
(3.10)
While the two calculation methods yielded consistent results, values obtained through the
fluctuation method were found to generally exhibit more noise. Subsequently, for the calculation
of (pseudo) Gruneisen parameters, heat capacities and thermal expansion coefficients
corresponding to those directly obtained from cooling curve data were used.
3.4 Calculation of Transport Properties and Fragility
Equilibrium Green-Kubo methods were used for the calculation of atomic diffusivities and shear
viscosities in both systems under study. Under the Green-Kubo formalism, atomic diffusivities
are directly related to the velocity autocorrelation function through the following relation:
D =1
3∫ <
∞
0
v(t + t′) ⋅ v(t) > dt′ (3.11)
Denoting the velocity power spectral density as P(ν), the diffusion coefficient can be
equivalently expressed in terms of the zero frequency power spectral density:
P(0) = ∫ <
∞
−∞
v(t + t′) ⋅ v(t) > e−2iπ(0)dt′ = 2∫ <
∞
0
v(t + t′) ⋅ v(t) > dt′ = 2D (3.12)
⇒ D = P(0)/2
An initial 300ps relaxation run, followed by a 32ps velocity sampling run under NVT conditions
was found to be sufficient for proper convergence of diffusivities.
Similarly, viscosities are directly related to the stress autocorrelation functions < Pαβ(t)Pαβ(0) >
through the following relation:
η =
V
kT∫ ∑ <
αβ
∞
0
Pαβ(t)Pαβ(0) > dt (3.13)
where Pαβ is the symmetrized traceless portion of the stress tensor σαβ, defined as:

34
σαβ =
1
V∑[pi,αpi,β
mi+ (ri,α)(Fi,β)]
(3.14)
Pαβ =
1
2(σαβ + σβα) −
1
3δαβ(∑σyy
𝑦
) (3.15)
The above formulation averages over the five independent components of the traceless stress
tensor Pxy, Pyz, Pzx, 1
2(Pxx − Pyy), and
1
2(Pyy − Pzz) (with the last two being equivalently to the
first three by rotational invariance [40]), allowing for improved autocorrelation function
statistics. In order to acquire sufficient convergence of stress autocorrelation functions,
simulation runs ranged from 1000-3000ps (under 1fs time-steps), ensuring sampling times of at
least 50 times underlying relaxation times.
Viewing the initial decay of the Cu50Zr50 (900K) stress autocorrelation function plotted below in
Figure 3.3, these conditions can be seen to hold well down into the moderately undercooled
liquid regime. Estimated relaxation times are seen to be on the order of τ𝑠ℎ𝑒𝑎𝑟 ≈ 5ps (5000fs),
with total simulation times of 2000ps (2000000fs) corresponding to about 400 τ (which is well
above the 50X lower bound). Viscosity calculations were however limited to temperatures in the
range 𝑇 > 𝑇𝑔 + 125𝐾, largely due to computational limitations and associated convergence
issues encountered at lower temperatures (higher viscosities).

35
Figure 3.3: Initial decay of Cu-Zr 900K stress autocorrelation function
Kinetic fragility (m) and strength parameter (D∗) were extracted through viscosity fitting to the
VFT form:
η(T) = η0exp(
D∗T0(T − T0)
) (3.16)
Where η0 is the high temperature viscosity limit, T0 is the divergent temperature (often close in
value to the Kauzmann temperature TK), and D∗ is the strength parameter, a common fragility
metric with larger D∗ indicative of stronger glasses. The above VFT form was fit to viscosity
data collected in 25K intervals over a temperature range of 1.2 − 1.8Tg. Once the VFT fit
parameters were extracted, the kinetic fragility parameter, m, was also determined through the
following relation:
m = (
∂log10η(T)
∂(Tg/T))T=Tg =
Tg ∗ D∗T0
log(10)
1
(Tg − T0)2
(3.17)
However, due to the significantly higher cooling rates experienced under the simulated quench,
the standard rheological definition for the glass transition temperature based on viscosities
equaling 1012Pa ⋅ s is not appropriate for arriving at consistency with the calorimetric Tg
-25000
25000
75000
125000
175000
225000
275000
325000
0 5000 10000 15000 20000 25000 30000
<Pαβ(t
)Pαβ(0
)>
Lags [fs]
Stress Autocorrelation Function CuZr 900K

36
extracted from the thermodynamic cooling curve results, nor for obtaining representative
estimates of liquid fragilities using the above relation (for which fragilities will be artificially
over-valued). In order to partially account for associated cooling rate effects, a rescaling of the
rheological condition for the glass transition temperature from η(Tg) = 1012Pa ⋅ s to η(Tg) =
103Pa ⋅ s was implemented in the present study.
The physical basis for this rescaling can be understood by first considering that the process of
glass formation is intrinsically linked to the competition between underlying internal (structural,
enthalpic, etc.) relaxation times (τint) governing equilibration kinetics, and
experimental/observational timescales (τobs) acting to limit the extent of relaxation and
configurational sampling possible. With experimental timescales being inversely proportional to
the cooling rate (β =dT
dt) at any given temperature and pressure along the quench, system
dynamics are seen to be effectively frozen out below temperature Tg where τint(Tg) ≈ τobs.
Considering that viscosities governing bulk shear/structural relaxation are proportionally
dependent upon underlying shear relaxation times ( η ∝ τshear), this condition is generally
satisfied for the majority of liquid melts under standard experimental operating conditions
(where τobs ≈ 102 − 103s) when viscosities are on the order of 1012Pa ⋅ s, hence the standard
rheological condition for the glass transition temperature: η(Tg) = 1012Pa ⋅ s. Based on these
fundamental principles underlying the glass transition phenomena in general, one arrives at the
following scaling law for viscosities at Tg under simulated cooling rates:
η(Tg) ∝ τshear(Tg) ≈ τobs ∝1
β
→ η(Tg)|βsimη(Tg)|βexp
=τsimτexp
=βexp
βsim
(3.18)
With η(Tg)|βexp = 1012Pa ⋅ s corresponding to standard experimental operating conditions
where cooling rates are on the order of βexp ≈ 102K/s, and with simulated cooling rates utilized
in this study being βsim = 1011K/s, the previously stated rescaled viscosity condition can be
reconciled:

37
→ η(Tg)|βsim = (10
12Pa ⋅ s) ∗(102K/s)
(1011K/s)= 103Pa ⋅ s
(3.19)
In order to differentiate between the calorimetric Tg estimated from cooling curve data in the
remainder of this paper, the rheological glass transition temperature defined by this rescaled
viscosity condition will be denoted: Tgη=103Pa⋅s
.
3.5 Calculation of Structural Properties
Partial radial distribution functions (gαβ) are calculated through standard binning techniques
formally expressed in the following relation:
gαβ(r) =V
NαNβ<∑
niβ(r)
4πr2Δr
Nα
i=1
>
(3.20)
0.1A bin sizes were used (Δr = 0.1A), and in order to improve statistics, PRDF results were
averaged over 5 separate snapshots (taken over a 32ps duration).
Short-range ordering and structure is primarily investigated through the analysis of radical
Voronoi tessellation results. Voronoi tessellation involves the decomposition of the system into a
finite number of polyhedra centered about the various atomic sites, with volumes encompassed
by each polyhedra consisting of the set of all points closer to that given atomic center than any
other. In standard Voronoi tessellation, polyhedra edges correspond to the intersection of planes
positioned at the perpendicular bisector connecting neighbouring atomic centers, with faces
corresponding to the common area shared by both atoms. Radical Voronoi tessellation
generalizes the above framework to poly-disperse systems by scaling plane positions according
to the ratios of atomic radii. Polyhedra types are subsequently differentiated according to their
Voronoi indices < n3, n4, n5, n6, . . . n10 >, where ni denotes the number of i-edged faces
possessed by the given Voronoi polyhedron (with i ranging from 3-10 due to geometrical
constraints). As each face corresponds to a “bond” between the central and corresponding atomic
neighbour, coordination number (CN) can be determined by summing the total number of faces,
or CN = ∑ ni𝑖 . In this study, radical Voronoi tessellation is conducted through the Voro++

38
package [41]. System snapshots are taken every 512 time-steps over a sampling duration of 32ps
allowing for improved cluster statistics.
Atomic nearest-neighbour information extracted from Voronoi tessellation was further utilized
for the investigation of local compositional ordering through calculation of the Warren-Cowley
parameter [42]. Denoting < CN > as the mean total coordination number (or mean number of
nearest-nearest neighbours), < CNij > the mean coordination of species j atoms about species i
central atoms, and ci the bulk stoichiometric concentration of species i, the Warren-Cowley
parameter, αp, is calculated through the following relation:
αp =
ci < CN > −< CNji >
ci < CN >=cj < CN > −< CNij >
cj < CN >
(3.21)
The Warren-Cowley parameter serves to quantify the average deviation of local compositions
(comprised of atoms in the first coordination shell) from that of the bulk (stoichiometric
composition) in a normalized fashion. Greater local compositional deviations from bulk
stoichiometry are a signature of enhanced compositional short-range ordering (CSRO) in the
amorphous phase [42].

39
Chapter 4
4 Investigating the Atomic-Level Influences of Glass Forming Ability in Ni-Al and Cu-Zr Metallic Glasses
Sections of this chapter have been published in “The Journal of Chemical Physics” under the
title of “Investigating the atomic level influencing factors of glass forming ability in NiAl and
CuZr metallic glasses” [43]. Text and figures have been reproduced with permission from the
American Institute of Physics.
4.1 Introduction
The high glass forming ability of zirconium-copper based multicomponent alloys makes the
binary Cu-Zr system a prime focal point for analysis. Recently, independent studies investigating
the compositional dependencies of glass forming ability in the Cu-Zr system have uncovered a
number of influencing factors that inhibit crystal nucleation and growth [28][29]. Li et al.’s [29]
investigation of compositional dependencies of percent density changes (or excess free volume)
upon crystallization (ρc − ρliq)/ρc showed a direct correspondence with critical casting
thicknesses, with experimental results indicating minimal density changes (minimal free
volumes) for high GFA compositions of Cu64Zr36, Cu56Zr44, and Cu50Zr50. In accordance with
free-volume theories for diffusive motion [44] and observed correlations between density change
upon crystallization and viscosities at the liquidus/melting temperature [11], these results suggest
that enhanced atomic mobility constraints associated with more efficient liquid-state atomic
packing in these select compositions are the cause of their higher glass forming ability.
Consistent with these notions, Russew et al’s [30] experimental investigations into compositional
dependencies of melt fragility in the Cu-Zr alloy system found a strong correlation between melt
fragility and glass forming ability, with findings showing a clear minimum at the high GFA
composition Cu64Zr36. On a parallel front, experimentally determined Turnbull coefficients and
liquid-crystal interfacial energies, as well as molecular dynamics calculations of glass-glass
interfacial energies were similarly successful in predicting trends in critical casting diameters in
the Cu-Zr system [28]. With this in mind, Kang et al. proposed a nucleation barrier controlling
nature dictating the glass forming ability of Cu-Zr alloys, with results of glass-glass interfacial
40
energy calculations suggesting an underlying link to compositional and topological short-range
ordering [28].
Unlike Cu-Zr, the Ni-Al system has recently been the focus of study due to its anomalously high
crystallization rate for an equimolar binary alloy. While both systems possess similar atomic size
ratios, similar atomic mobilities throughout the quench regime, and identical primary nucleating
crystal phases (B2 phase), the equimolar Ni50Al50 alloy possesses critical cooling rates orders of
magnitude higher than Cu50Zr50, with crystal nucleation even being accessible under molecular
dynamics timescales. Tang and Harowell’s [45] molecular dynamics investigation of Ni50Al50’s
anomalously low unidirectional crystal growth-rates in comparison to Cu50Zr50 uncovered
striking differences in the extent of chemical ordering present at the liquid-crystal interface.
Large amplitude and long length-scale density correlations extending well into Ni-Al’s parent
liquid phase were observed at the interface, while in contrast, correlations in the Cu-Zr parent
phase rapidly decayed away from the boundary, with little indication of induced ordering beyond
a few atomic layers [45]. Understanding the underlying factors controlling the susceptibility for
ordering at the interface may thus be key to understanding glass forming ability in general. It is
likely that the differences observed are linked to more intrinsic differences in the nature of short-
range chemical and topological ordering between the two systems.
Recent analysis of glass pair-correlation functions for a number of different alloy systems have
identified “hidden” topological differences between poor and ideal glass formers [46]. It was
found that scaled peak positions in the pair distribution function of glassy systems can roughly be
decomposed into those corresponding to fcc or bcc crystal structures. Higher GFA alloys were
found to exhibit a higher degree of intermixing between these corresponding fcc and bcc “hidden
orders”, suggesting greater geometric frustration in these alloys inhibited crystallization [46].
While not discussed by Wu et al., a greater extent of topological entanglement of hidden orders
and thus medium-range geometric frustration in the Cu-Zr system may be a major constraining
force on the degree and length-scales of induced crystalline ordering at the interface.
Furthermore, considering the similar compositional trends observed for interfacial free energies,
extent of free volume, compositional/polytetrahedral short-range ordering, and compositional
ordering at the interface, it is possible that a connection exists to some more fundamental
underlying property at the bonding level. Currently, limited information is available regarding

41
underlying bonding, short-range ordering, transport, and structural relaxation properties of the
Ni-Al and Cu-Zr amorphous phases, largely hindering the ability to concretely investigate such
underlying connections.
Despite these significant advances, a clear-cut design approach for the compositional tuning of
glass forming ability in BMGs a priori has yet to be identified. Current computational and
analytic tuning methods are severely limited in their applicability due to a number of non-trivial
factors. Many of the identified GFA indicators and influencing factors (including the majority of
those discussed above) are not single phase properties, and often are related to properties of the
disordered and crystallizing phases and/or the interface between the two. In complex multi-
component systems, the equilibrium crystalline phase is rarely known before hand, with the
crystallization pathway leading to the final equilibrium phase more often than not being a multi-
step process involving several (also likely unknown) intermediate metastable phases. These
considerations would then suggest the potential existence of severe limitations on the practicality
of a computational (or experimental) method capable of rapid, accurate, and compositionally
robust GFA tuning. Assuming an accurate inter-atomic potential is available, current molecular
dynamics simulations methods readily allow for the sampling of liquid, supercooled, and glassy
phase (albeit, rapidly quenched) properties over vast compositional spaces with little to no prior
knowledge of the underlying systems. In this respect, the identification of GFA indicators and
influencing factors relating solely to properties of the amorphous phase is of utmost importance.
Many of the proposed GFA tuning methods and indicators (even those relying only upon single
phase properties) exhibit a significant lack of robustness, with their efficacy often being highly
dependent upon the alloy class in question, or being limited to specific compositional domains.
These issues can largely be tied to a general neglect of said indicators to consider underlying
bonding differences.
In this work, a comprehensive comparative analysis of kinetic, thermodynamic, and structural
properties in the Cu50Zr50 and Ni50Al50 alloy systems is conducted using molecular dynamics
simulation methods. A key focus of this study is the investigation of underlying connections
between the nature of atomic level bonding, short and medium range ordering, and the evolution
of structure and transport properties as the two model systems are quenched from the high
temperature molten liquid state. While the two alloys under investigation possess similar atomic
size ratios and have previously been shown to possess comparable diffusive transport rates in the

42
liquid and supercooled domains, they nonetheless belong to two separate classes of alloys; the
transition metal - transition metal (TM-TM) and transition metal - metalloid (TM-M) classes
respectively. As such, the combined analysis of Cu50Zr50 and Ni50Al50 alloys provides the ideal
setting to explore fundamental limitations of the various existing GFA indicators and
compositional tuning methods, and to potentially facilitate in the identification of new predictive
parameters and influencing factors.
4.2 Computational Details
Molecular dynamics simulations were performed using the Large-scale Atomic/Molecular
Massively Parallel Simulator (LAMMPS [34]) software package, with atomic interactions
described using many-body embedded atom method (EAM) interatomic potentials developed by
Mendelev [47] and Mishin [35] for Cu-Zr and Ni-Al alloys respectively. Bulk liquid and glassy
phases were generated by first heating randomly ordered systems of 8000 atoms from 300K to
2300K over a duration of 1000ps, followed by a 2000ps relaxation stage allowing for the proper
equilibration of the high temperature liquid melt. Following equilibration, systems were
subsequently cooled down to a temperature of 50K through a series of 25K quench(100ps) and
hold(150ps) stages, corresponding to an average linear cooling rate of 0.1K/ps. Throughout the
quenching process, zero pressure isobaric conditions were applied using NPT Nose-Hoover
temperature and pressure controls under 1fs integration time-steps. Bulk crystalline phases for
both systems were generated and relaxed (similarly under zero pressure barostatic conditions
with a 1fs time-step) at relevant temperatures according to a B2 structured supercell containing
8470 atoms or 35x11x11 unit cells (following Tang and Harrowell [45]). For both phases in
question, property extraction was conducted following further system relaxation at relevant
temperatures of interest. Analysis of molecular dynamics simulations results were conducted
externally in PYTHON, allowing for the calculation of transport, thermodynamic, and structural
properties. More specifically, detailed thermodynamic modeling techniques were used to
establish melt/liquidus temperatures and relative phase stabilities throughout the supercooled
domain. Using this information, GFA indicators commonly used to quantify the relative phase
stability of the amorphous phase such as the reduced glass transition temperature, Trg, and the
liquid-crystal free energy difference at glass transition, (Δμ)Tg, were extracted. Furthermore,
volumetric data collected for the crystalline and disordered phases were used to investigate free

43
volume content through the calculation of fractional density differences between the respective
phases, (ρc − ρliq)/ρc. Viscous and diffusive transport properties were also sampled along the
quenching process, allowing for the assessment of the kinetic fragility parameter, m, and strength
parameter, D∗, both of which are common GFA indicators serving to differentiate between
“strong” and “fragile” glasses based on how abrupt the viscous slowdown is on approach to Tg.
Each of these bulk system properties and parameters serve to quantify key influencing factors
governing crystallization kinetics in general, the thermodynamic forces driving crystallization,
and the kinetic factors controlling the rates of crystal nucleation and growth. On the atomic level,
short and medium-range chemical and topological ordering was assessed over the quench
domain through radical Voronoi tessellation and partial radial distribution function analysis. The
evolutions of underlying bond anharmonicity and bulk stiffness properties were also investigated
in order to assess underlying bonding differences that may elucidate underlying structure-
property trends and GFA anomalies. In conjunction, vibrational density of states spectra were
calculated in each system, allowing for a detailed analysis of underlying vibrational properties at
the atomic level. Lastly, in an attempt to further connect local bonding differences with observed
property trends, short-range cluster statistics were analyzed from a local energy perspective.
4.3 Results and Discussion
Molecular dynamics simulations of amorphous and B2 crystalline phases for both Ni-Al and Cu-
Zr systems were conducted and sampled along the various temperatures of interest. Liquid and
glassy phases were generated through rapid quenching of initial equilibrated melts at
temperatures of 2100K and 2300K respectively for Cu-Zr and Ni-Al respectively (roughly
encompassing a temperature domain up to 3Tg for both systems). Thermodynamic, physical,
transport, and structural properties were subsequently sampled (following 300ps relaxation runs)
in 25K intervals as the system was quenched down to 50K, with results presented in the
following sections.

44
4.3.1 Bulk Thermodynamic and Physical Properties
Figure 4.1: Gibbs Free Energy profiles for liquid/amorphous and B2 crystalline phase Cu-Zr
(left) and Ni-Al (right) calculated from 2PT modeling. Vertical dashed lines correspond to
respective 𝐓𝐠 values. Melting points (𝐓𝐦) are identified by the intersection of liquid/amorphous
and crystalline phases.
Gibbs free energy curves for the amorphous and crystalline phases are presented in Figure 4.1.
Based on the point of intersection of liquid and crystal phase free energy curves, melting points
are calculated to be 1557K and 1355K for the Ni-Al and Cu-Zr systems respectively. For quick
validation of the 2PT modeling, these values seen to be in close agreement with Tang and
Harrowell’s [45] estimates of 1535K and 1340K obtained through the condition of equilibrated
coexistence for liquid and crystal phases in planar contact. Glass transition temperatures (Tg) of
740K and 676K for Ni-Al and Cu-Zr systems were extracted using enthalpy cooling curve data
(see computational details). While experimental Tg values for the Ni-Al system are unavailable
due its rapid crystallization rate, Cu-Zr’s computed Tg value is seen to be in direct agreement
with Russew’s [30] experimentally determined Tg value of 676K based on viscosity data.
Utilizing these results, reduced glass transition temperatures (Trg) and liquid-crystal free energy
differences at Tg, Δμ(Tg), were evaluated, yielding values of 0.48 and -0.116eV/atom for Cu-Zr,
and 0.50 and -0.135eV/atom for Ni-Al. Comparison of these results (summarized in Table 4.1)
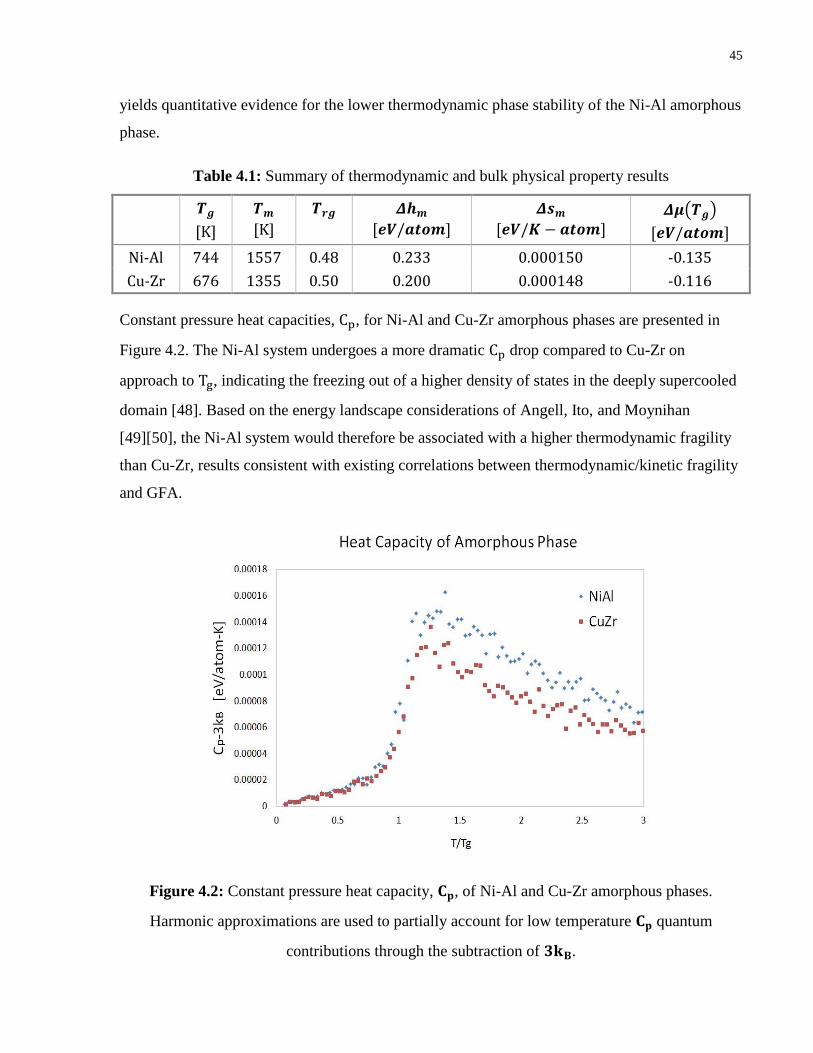
45
yields quantitative evidence for the lower thermodynamic phase stability of the Ni-Al amorphous
phase.
Table 4.1: Summary of thermodynamic and bulk physical property results
𝑻𝒈
[K]
𝑻𝒎
[K]
𝑻𝒓𝒈 𝜟𝒉𝒎
[𝒆𝑽/𝒂𝒕𝒐𝒎]
𝜟𝒔𝒎
[𝒆𝑽/𝑲 − 𝒂𝒕𝒐𝒎] 𝜟𝝁(𝑻𝒈)
[𝒆𝑽/𝒂𝒕𝒐𝒎]
Ni-Al 744 1557 0.48 0.233 0.000150 -0.135
Cu-Zr 676 1355 0.50 0.200 0.000148 -0.116
Constant pressure heat capacities, Cp, for Ni-Al and Cu-Zr amorphous phases are presented in
Figure 4.2. The Ni-Al system undergoes a more dramatic Cp drop compared to Cu-Zr on
approach to Tg, indicating the freezing out of a higher density of states in the deeply supercooled
domain [48]. Based on the energy landscape considerations of Angell, Ito, and Moynihan
[49][50], the Ni-Al system would therefore be associated with a higher thermodynamic fragility
than Cu-Zr, results consistent with existing correlations between thermodynamic/kinetic fragility
and GFA.
Figure 4.2: Constant pressure heat capacity, 𝐂𝐩, of Ni-Al and Cu-Zr amorphous phases.
Harmonic approximations are used to partially account for low temperature 𝐂𝐩 quantum
contributions through the subtraction of 𝟑𝐤𝐁.

46
4.3.2 Transport and Kinetic Properties
Figure 4.3: Viscosity and atomic self-diffusivities for 𝐍𝐢𝟓𝟎𝐀𝐥𝟓𝟎 and 𝐂𝐮𝟓𝟎𝐙𝐫𝟓𝟎 alloys over the
quench regime
Results of calculated atomic diffusivities and shear viscosities are presented in Figure 4.3. In
order to quantitatively assess kinetic fragilities, viscosity data were fit to the Vogel-Fulcher-
Tammann (VFT) form:
η(T) = η0exp(
D∗T0(T − T0)
) (3.16)
Where η0 is the high temperature viscosity limit, T0 is the divergence temperature (often close in
value to the Kauzmann temperature TK), and D∗ is the strength parameter. Kinetic fragility
parameters ((3.17)) were further estimated by interpolating viscosities down to a rheological
glass transition temperature Tgη=103Pa⋅s
identified by the rheological condition that η(Tg) =
103Pa ⋅ s (see Methodology and Computational Details Section 3.4 for a detailed discussion of
the physical basis for using this alternative viscosity condition instead of the standard rheological
condition of η(Tg) = 1012Pa ⋅ s which applies under experimental conditions). These results, in
conjunction with estimated rheological glass transition temperatures (Tgη=103Pa⋅s
), are
summarized in Table 4.2 below.
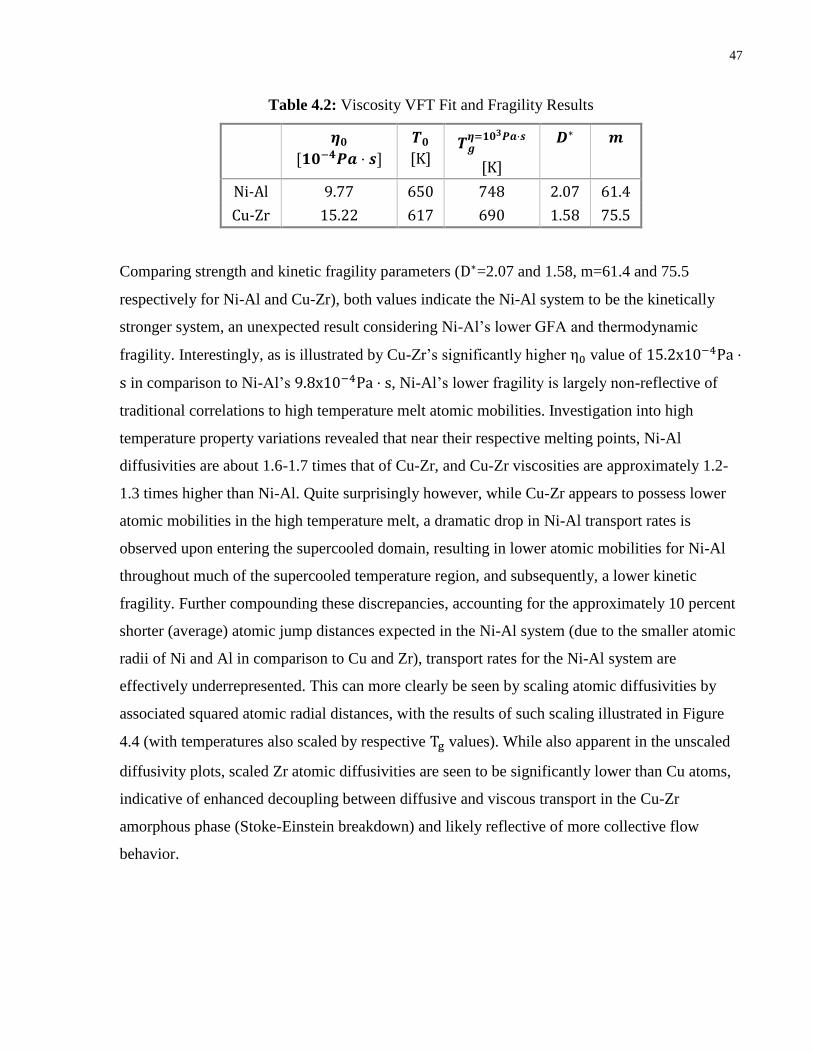
47
Table 4.2: Viscosity VFT Fit and Fragility Results
𝜼𝟎
[𝟏𝟎−𝟒𝑷𝒂 ⋅ 𝒔]
𝑻𝟎
[K] 𝑻𝒈𝜼=𝟏𝟎𝟑𝑷𝒂⋅𝒔
[K]
𝑫∗ 𝒎
Ni-Al 9.77 650 748 2.07 61.4
Cu-Zr 15.22 617 690 1.58 75.5
Comparing strength and kinetic fragility parameters (D∗=2.07 and 1.58, m=61.4 and 75.5
respectively for Ni-Al and Cu-Zr), both values indicate the Ni-Al system to be the kinetically
stronger system, an unexpected result considering Ni-Al’s lower GFA and thermodynamic
fragility. Interestingly, as is illustrated by Cu-Zr’s significantly higher η0 value of 15.2x10⁻⁴Pa ⋅
s in comparison to Ni-Al’s 9.8x10⁻⁴Pa ⋅ s, Ni-Al’s lower fragility is largely non-reflective of
traditional correlations to high temperature melt atomic mobilities. Investigation into high
temperature property variations revealed that near their respective melting points, Ni-Al
diffusivities are about 1.6-1.7 times that of Cu-Zr, and Cu-Zr viscosities are approximately 1.2-
1.3 times higher than Ni-Al. Quite surprisingly however, while Cu-Zr appears to possess lower
atomic mobilities in the high temperature melt, a dramatic drop in Ni-Al transport rates is
observed upon entering the supercooled domain, resulting in lower atomic mobilities for Ni-Al
throughout much of the supercooled temperature region, and subsequently, a lower kinetic
fragility. Further compounding these discrepancies, accounting for the approximately 10 percent
shorter (average) atomic jump distances expected in the Ni-Al system (due to the smaller atomic
radii of Ni and Al in comparison to Cu and Zr), transport rates for the Ni-Al system are
effectively underrepresented. This can more clearly be seen by scaling atomic diffusivities by
associated squared atomic radial distances, with the results of such scaling illustrated in Figure
4.4 (with temperatures also scaled by respective Tg values). While also apparent in the unscaled
diffusivity plots, scaled Zr atomic diffusivities are seen to be significantly lower than Cu atoms,
indicative of enhanced decoupling between diffusive and viscous transport in the Cu-Zr
amorphous phase (Stoke-Einstein breakdown) and likely reflective of more collective flow
behavior.

48
Figure 4.4: Atomic diffusivities scaled by respective atomic radii squared in 𝐍𝐢𝟓𝟎𝐀𝐥𝟓𝟎 and
𝐂𝐮𝟓𝟎𝐙𝐫𝟓𝟎 alloys over the quench regime
Investigating thermal stabilities through a kinetic perspective, fractional density differences
((ρc − ρliq)/ρc) between respective amorphous and crystalline phases are calculated over
relevant temperatures of interest and plotted in Figure 4.5. Based on free volume theory, one
would expect the higher atomic mobilities observed for Ni-Al in the high temperature melt
regime to correspond with poorer atomic packing efficiencies and higher free volume content.
These notions are consistent with the fractional density differences calculated, with results
revealing the presence of anomalously large volume differences between the Ni-Al amorphous
and crystalline phase. Summarized in Table 4.3, fractional liquid-crystal density differences
observed for the Ni-Al system range from 7 − 11% along the quench, corresponding to values 2-
3 times that of the Cu-Zr system. The 10% volume change observed at Tm in the Ni-Al system
marks a significant departure from the 0 − 3% volume change characteristic of good glass
forming systems [33][51]. With that said, these results are suggestive of primarily kinetic origins
to Ni-Al’s poor GFA, likely associated with underlying bond frustration and packing
inefficiencies in the amorphous phase.
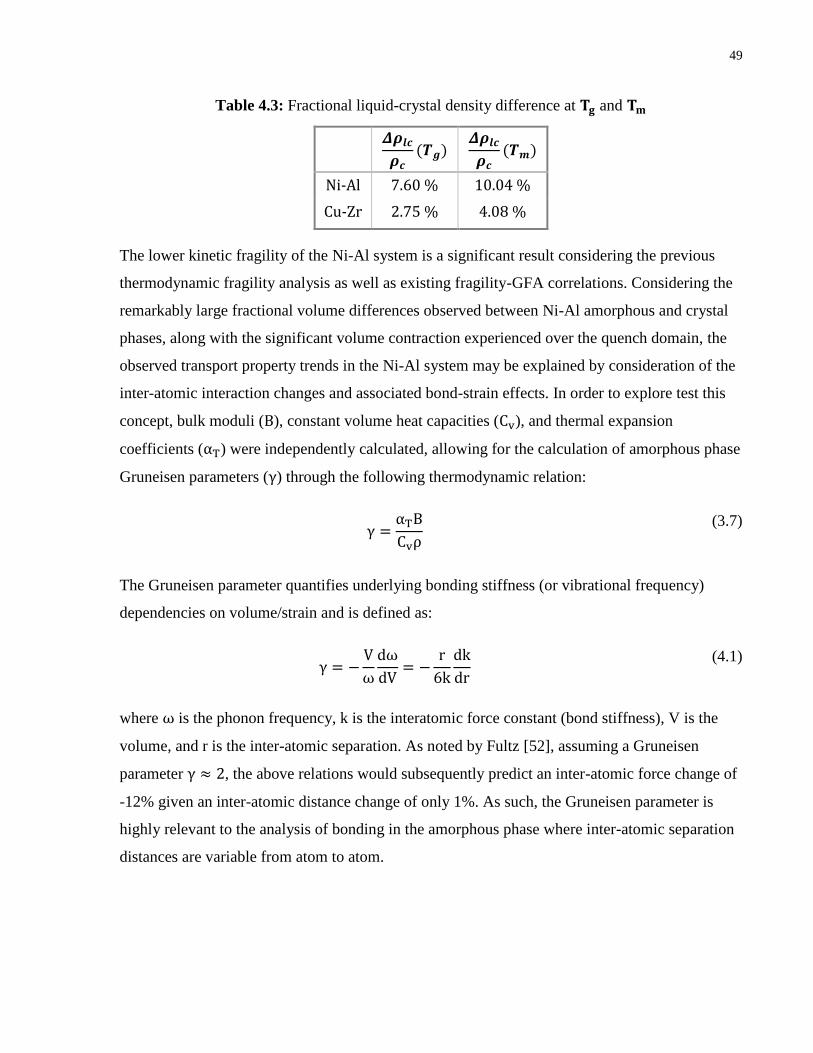
49
Table 4.3: Fractional liquid-crystal density difference at 𝐓𝐠 and 𝐓𝐦
𝜟𝝆𝒍𝒄𝝆𝒄
(𝑻𝒈) 𝜟𝝆𝒍𝒄𝝆𝒄
(𝑻𝒎)
Ni-Al 7.60 % 10.04 %
Cu-Zr 2.75 % 4.08 %
The lower kinetic fragility of the Ni-Al system is a significant result considering the previous
thermodynamic fragility analysis as well as existing fragility-GFA correlations. Considering the
remarkably large fractional volume differences observed between Ni-Al amorphous and crystal
phases, along with the significant volume contraction experienced over the quench domain, the
observed transport property trends in the Ni-Al system may be explained by consideration of the
inter-atomic interaction changes and associated bond-strain effects. In order to explore test this
concept, bulk moduli (B), constant volume heat capacities (Cv), and thermal expansion
coefficients (αT) were independently calculated, allowing for the calculation of amorphous phase
Gruneisen parameters (γ) through the following thermodynamic relation:
γ =
αTB
Cvρ
(3.7)
The Gruneisen parameter quantifies underlying bonding stiffness (or vibrational frequency)
dependencies on volume/strain and is defined as:
γ = −
V
ω
dω
dV= −
r
6k
dk
dr
(4.1)
where ω is the phonon frequency, k is the interatomic force constant (bond stiffness), V is the
volume, and r is the inter-atomic separation. As noted by Fultz [52], assuming a Gruneisen
parameter γ ≈ 2, the above relations would subsequently predict an inter-atomic force change of
-12% given an inter-atomic distance change of only 1%. As such, the Gruneisen parameter is
highly relevant to the analysis of bonding in the amorphous phase where inter-atomic separation
distances are variable from atom to atom.

50
Figure 4.5: Percent density difference between the liquid/glassy and B2 crystalline phase for Ni-
Al and Cu-Zr alloys over the quench regime
First focusing on resultant property variations in the liquid and supercooled domains (see Figure
4.6), Cu-Zr Gruneisen parameters are found to undergo a near monotonic decay from the high
temperature value of γ ≈ 1.65, down to a value of γ ≈ 1.35 at the glass transition temperature.
Such a monotonically decreasing profile would be expected should the underlying structural and
chemical reordering taking place over the quench be conducive to the improvement of atomic
level bonding and packing configurations (thereby leading to reduced bond strain and
anharmonicity). In contrast, the Ni-Al system experiences the opposite Gruneisen parameter
trends. Ni-Al Gruneisen parameters are seen to increase from γ ≈ 2.0 up to a maximum of
approximately 2.5-3.0 just above Tg, followed by a sudden drop to a value of ≈ 2.05 at Tg. These
differences continue down into the low temperature glassy domains where the monotonically
decreasing Gruneisen profile observed in the Cu-Zr melt domain is observed to continue down to
minimum of γ ≈ 0.9, while Ni-Al Gruneisen parameters more or less persist at a constant value
of γ ≈ 2.0. Interestingly, clear differences are also observed upon comparison of respective bulk
moduli profiles. Nearly identical Ni-Al and Cu-Zr bulk moduli are observed down to
temperatures of about 1.3Tg, upon which a sudden departure is observed among the two systems.
Near T ≈ 1.3Tg, a sudden bulk moduli increase persisting down to Tg is observed in the Ni-Al
system, indicative of substantial changes in underlying stiffness and bonding properties. It is
apparent that 1.3Tg also corresponds to peak thermal expansion coefficients, and thus to the
region of greatest volumetric temperature sensitivity and contraction. Combined, these results

51
suggest a strong connection between relaxation properties and underlying mechanical ordering
associated with bond anharmonicity and strain-volume dependencies in the Ni-Al system. In
accordance with the large Gruneisen parameters observed in the Ni-Al system, the large volume
contraction observed over the supercooled domain would have the side effect of substantial bond
stiffness increases, ultimately reflected through higher structural relaxation times near Tg and a
correspondingly lower fragility. In the high temperature melt, the Ni-Al system likely
experiences significant local bond strain and mismatch as evidenced by fractional liquid-crystal
volume differences in excess of 10%, in contrast to volume differences 2-3 times lower in the
Cu-Zr system.
Figure 4.6: Second order thermodynamic properties and resultant Gruneisen Parameters for
𝐍𝐢𝟓𝟎𝐀𝐥𝟓𝟎 and 𝐂𝐮𝟓𝟎𝐙𝐫𝟓𝟎 amorphous phases over the quench regime
Cu-Zr and Ni-Al systems belong to two separate classes of alloys, so the question arises as to
whether the observed anharmonicity and bonding differences can be generalized to be attributes
of TM-TM and TM-M bonding as a whole, or whether they are specific to the given alloys in
question. A reasonable expectation would be for the observed differences in bonding, transport,
and kinetic properties to be reflected in the nature and evolution of short and medium range

52
structure over the quench. To test this hypothesis, an in-depth investigation of short/medium-
range chemical and topological ordering is conducted in the following section, largely aimed at
the search for key structural signatures of underlying bonding differences.
4.3.3 Structural Analysis
Figure 4.7: Pair Correlation Functions evaluated for 𝐍𝐢𝟓𝟎𝐀𝐥𝟓𝟎 and 𝐂𝐮𝟓𝟎𝐙𝐫𝟓𝟎 melts at
temperature 𝐓 ≈ 𝟐 ∗ 𝐓𝐠 ≈ 𝐓𝐦
In order to assess medium-range ordering differences, pair correlation functions were computed
for both systems, with results evaluated near respective melt temperatures (1400K and 1600K for
Cu-Zr and Ni-Al respectively) presented in Figure 4.7. Analyzing the figures, density
correlations extending from the nearest-neighbour to next-nearest-neighbour coordination shells
are seen to much more rapidly decay in the Ni-Al system, most notably apparent upon
comparison of the ratio of first and second peak heights (summarized in Table 4.4) for Ni-Al and
Cu-Zr pair-correlation functions (3.05 and 2.50 respectively). In conjunction with these
observations, the high first peak intensities and large extent of bond-length shortening observed
suggest significantly more pronounced Ni-Al nearest-neighbour level interactions. Looking
beyond the first peak, relatively weak Ni-Ni, Ni-Al, and Al-Al density correlations with nearly
identical profiles are observed, indicating a low degree of medium-range compositional ordering.
In contrast, longer-ranged next-nearest-neighbour interactions appear much more pronounced in
the Cu-Zr system, with strong and largely non-overlapping density correlations extending well
into the 2nd, 3rd, and even 4th coordination shells.

53
Table 4.4: Ratio of first and second partial radial distribution peak intensities
𝒈𝑨𝑨(𝒓𝟏)/𝒈𝑨𝑨(𝒓𝟐) 𝒈𝑨𝑩(𝒓𝟏)/𝒈𝑨𝑩(𝒓𝟐) 𝒈𝑩𝑩(𝒓𝟏)/𝒈𝑩𝑩(𝒓𝟐)
Ni-Al 1.78 3.05 1.92
Cu-Zr 1.70 2.50 1.92
These observations are consistent with metal-metal (TM-TM) and metal-metalloid (TM-M)
bonding in general. Belonging to the TM-TM alloy class (and associated with copper’s noble
metal electronic state), Cu-Zr bonding would be expected to be longer-ranged and less
directional. In contrast, TM-M bonding is characteristically more covalent/short-ranged and
directional, consistent with the observed Ni-Al bond-length shortening, pronounced nearest-
neighbour level interactions, and weak next-nearest-neighbour interactions. Thus, a simple
phenomenological explanation for the observed Gruneisen and bulk moduli anomalies in the Ni-
Al system can be formulated based on these expected bonding differences. Mismatch between
underlying strain-stiffness dependencies of Ni-Al, Ni-Ni, and Al-Al partial bonds inhibits bulk
structural relaxation to globally efficient packing structures in the high temperature Ni-Al melt.
Subsequently, the high temperature Ni-Al melt exhibits high free volume content and high
diffusive and viscous transport rates. As the system is cooled, associated volume contraction
results in significantly increased interactions among previously “non-bonded” or poorly bonded
Ni-Al atoms, translating to a sudden spike in bulk stiffness properties (bulk moduli), viscosities,
and ultimately to a lower kinetic fragility. Bonding in the Cu-Zr system is longer-ranged, less
directional, and highly metallic in character, translating to minimal short-range bonding
constraints, and promoting global structural relaxation (through more cooperative flow
rearrangements) to lower free volume packing configurations. While the Ni-Al system exhibits a
lower kinetic fragility than Cu-Zr, it is largely an artifact of the underlying volume-strain and
bond-stiffness dependencies. As previously noted by Suranarayana and Inoue [53], the efficacy
of the fragility parameter as a direct measure of GFA is highly dependent upon the respective
alloy class in question. While the fragility (strength) parameter D∗ has been identified to act as a
direct measure of GFA in BMGs with purely metallic components [54][55], it largely breaks
down as a reliable GFA indicator in systems containing metalloid species.

54
Figure 4.8: Top 25 most frequent Voronoi polyhedra types in Ni-Al and Cu-Zr Glasses at 300K
Figure 4.9: Partial and Total Coordination Number Distribution for atoms in Ni-Al and Cu-Zr
Glasses at 300K

55
Results of radical Voronoi tessellation analysis of short-range topological and compositional
ordering in the two systems were similarly found to be reflective of such underlying bonding
differences. Starting with nearest-neighbour cluster/polyhedra and coordination number
distributions in respective Ni-Al and Cu-Zr glasses at 300K, results are presented in Figure 4.8
and Figure 4.9. At first glance, cluster and coordination distributions in respective glassy phases
appear strikingly similar. However, further inspection reveals a number of differences reflective
of the short-range versus long-range bonding properties of Ni-Al and Cu-Zr systems. Higher
icosahedral ordering is observed in the Cu-Zr system (a signature of longer-ranged interactions
and enhanced thermal stability of the amorphous phase), with higher fractions of < 0,0,12,0 >,
< 0,2,8,2 >, and < 0,2,8,1 > clusters. The coordination distributions in the Cu-Zr system are
also seen to be more tightly distributed among CN=12 for Cu, and CN=16 for Zr atoms, with less
respective coordination overlap and CN=14 clusters overall in comparison to the Ni-Al system.
Considering the B2 crystal phase is entirely composed of CN=14 short-range clusters, these
observations are suggestive of enhanced compositional ordering in the Cu-Zr system, with
greater short-range structural overlap between the amorphous and crystal phases in the Ni-Al
system.
Further inspection of resultant frequency distributions indicates that the top 7 most frequent
polyhedra comprise a significant fraction of the total population (approximately 34% and 35% of
the Al and Zr centered distributions, and about 45% and 55% of the Ni and Cu centered
distributions respectively). Subsequently, short-range structural evolution over the transition
from the high temperature melt down to the low temperature glassy phase was investigated by
tracking the 7 most frequent polyhedra types found in the respective glassy phases. Viewing the
results of this analysis (presented in Figure 4.10), an abrupt and dramatic increase in icosahedral-
type clusters <0,0,12,0>, <0,2,8,1>, and <0,2,8,2> is observed upon entering the supercooled
domain for Cu-centred clusters. In both systems, the temperature onset for short-range structural
reordering towards increased polytetrahedral cluster-types (i.e. polyhedra with high fractions of
5-edged faces) appears to strongly correlate with respective melting temperatures Tm. These
observations are consistent with the similarly dramatic increase in the fraction of <0,0,12,0>
polyhedral observed between liquidus and glass transition temperatures in Cu45Zr47Al7, Cu46Zr54,
and Cu45Zr47Al7 liquid alloys [31]. The nature of this correlation is likely tied to universal
changes in the energy landscape topology occurring near the mode-coupling temperature of

56
liquid alloys. Combined, these considerations raise the possibility of rapidly estimating
liquidus/melting temperatures of arbitrary multicomponent alloys based on short-range structural
considerations alone, which if deemed to be viable, could yield immense value to GFA
compositional tuning through the rapid estimation of predictive indicators such as the reduced
glass transition temperature.
Figure 4.10: Frequency evolution of the 7 most frequent Voronoi Polyhedra types found in Ni-
Al and Cu-Zr Glasses. Purple and blue dashed lines are presented to indicate glass transition and
melt temperatures respectively (Note: legend indexed in decreasing order from top to bottom
with respect to polyhedral fractions in low temperature glass).

57
Figure 4.11: Temperature evolution of mean partial coordination numbers for species in Ni-Al
and Cu-Zr alloys over the quench
Figure 4.12: Evolution of local compositional ordering over the quench for Cu-Zr and Ni-Al
alloys. The Warren-Cowley parameter is a simple metric quantifying the deviation of the local
composition (first coordination shell) from the bulk stoichiometric concentration.

58
Moving onto the analysis of the evolutions of mean local compositional environments of Ni, Al,
Cu, and Zr centered atoms over the quench domain, results are presented in Figure 4.11. In
contrast to the Ni-Al system, an apparent tendency towards enhanced Cu-Zr and Zr-Cu
coordination in the Cu-Zr liquid melt is observed upon quenching down towards Tg. Further
investigating compositional short-range ordering (CSRO), the evolution of the Warren-Cowley
parameter [42] has been evaluated in both systems over the quench domain, with results
presented in Figure 4.12. The Warren-Cowley parameter serves as a common metric for CSRO,
with large (negative) values being indicative of significant deviations of local compositions from
bulk stoichiometry (see section Methodology and Computational details: Structural Property
Calculations as well as reference [42] for further details on the Warren-Cowley parameter).
Significantly enhanced CSRO is apparent in the Cu-Zr system. While associated chemical
reordering taking place in the Cu-Zr system is seen to freeze out at Tg as expected, the
corresponding freeze-out temperature in the Ni-Al system is seen to occur near 950-1000K or
≈ 1.3Tg. Referring to Figure 4.6, it is apparent that the observed Ni-Al CSRO freeze-out
temperature coincides instead with the bulk moduli departure temperature (as well as the
temperature domain associated with peak expansivity). Subsequently, the strong bond strain-
stiffness dependencies previously identified in the Ni-Al system are seen to have the negative
side-effect of inhibiting compositional short-range ordering in the amorphous phase, a likely
contributing factor to Ni-Al’s lower GFA.
4.3.4 Inspection of Nearest-Neighbour Structural Relaxation Properties
In order to further inspect relative interaction strengths between A-A, A-B, and B-B nearest-
neighbour bonds in the two systems (A = Cu, Ni; B = Zr, Al), a bond correlation function Cα,β(t)
is introduced which tracks the probability that a nearest-neighbour bond between atoms of type α
and type β will maintain after a duration of time t. In order to calculate Cα,β(t), positions were
sampled periodically over a duration of 130ps, and at each time-step t, Voronoi tessellation was
used to obtain the adjacency matrix A(t) which contains connectivity information between all N
atoms in the system:
A(t) =
(
a1,1(t) a1,2(t) ⋯ a1,N(t)
a2,1(t) a2,2(t) ⋯ a2,N(t)⋮ ⋮ ⋱ ⋮
aN,1(t) aN,2(t) ⋯ aN,N(t))
where ai,j(t) = 1 𝑖𝑓 𝑎𝑡𝑜𝑚𝑠 𝑖, 𝑗 𝑎𝑟𝑒 𝑛𝑒𝑖𝑔ℎ𝑏𝑜𝑢𝑟𝑠0 𝑖𝑓 𝑖, 𝑗 𝑎𝑟𝑒 𝑛𝑜𝑡 𝑛𝑒𝑖𝑔ℎ𝑏𝑜𝑢𝑟𝑠

59
Cαβ(t) is then calculated by summing ai,j(t) ⋅ ai,j(0) over all i,j elements with atoms i belonging
to type α and atoms j to type β:
Cαβ(t) =
∑ ∑ ai,jj∈βi∈α (t) ⋅ ai,j(0)
∑ ∑ ai,jj∈βi∈α (0) ⋅ ai,j(0)
(4.2)
Results for total and partial bond correlation functions for Ni-Al and Cu-Zr alloys in the liquid
and supercooled domain are presented in Figure 4.13. Visually inspecting the results, standard
stretched exponential relaxation profiles are evident for both systems, with a general divergence
of mean relaxation times upon cooling into the heavily undercooled domain. In both systems,
bond correlations for the smallest species elements (Cu-Cu and Ni-Ni) show the most rapid
decay, suggesting weaker interactions between the smaller species. In the Ni-Al system, Ni-Al
partial bond correlations appear to show the slowest decay rates, signifying stronger nearest-
neighbour level interactions relative to Ni-Ni and Al-Al bonds. In the Cu-Zr system, one can see
nearly identical partial bond correlations for Zr-Zr and Cu-Zr bonds, with Zr-Zr partial
correlations displaying a marginally slower decay rate. As can be seen through the evolution of
mean coordination environments plotted in Figure 4.11, the Cu-Zr system exhibits less Cu-Cu
and more Cu-Zr nearest-neighbours as compared to Ni-Ni and Ni-Al coordination in the Ni-Al
system. Interestingly, as the Cu-Zr system is cooled, significant chemical reordering is evident
towards increased fractions of the “stronger”(longer relaxation time for bond-breaking) bonding
species, which can be seen through reordering towards lesser Cu-Cu and higher Cu-Zr/Zr-Cu
nearest neighbour bonding. The relative ratios of Ni-Ni, Ni-Al/Al-Ni, and Al-Al nearest
neighbour bonds is much more constant during temperature evolution of the Ni-Al system, with a
more controlling trend towards reduced total coordination being evident (likely in connection to
the significant degree of volume contraction experienced in the Ni-Al system).

60
Figure 4.13: Total and partial bond correlation functions for Ni-Al and Cu-Zr alloys in the liquid
and supercooled domain. Dashed lines in the partial bond correlation function plots correspond
to 900K, with solid lines corresponding to 1200K.
4.3.5 Local Structure-Energy and Coordination-Energy Correlations
Interestingly, viewing Mishin’s [35] EAM embedding functions (reproduced below in Figure
4.14) for Ni and Al atoms, the Ni embedding function is seen to exhibit a minima near mean
electron densities (as defined in (3.4)) in accordance with the traditional convex parabolic shaped
profile characteristic of metallic elements. In contrast, at mean electron densities, the Al
embedding energy function is seen to exhibit a maximum, with an apparent minima present in
the low density regime, and a sharp decreasing profile observed in the higher density regime.
These observations further elucidate underlying bonding differences, and are suggestive of
highly variable bonding/stiffness properties of Al depending on bond strain and local
coordination/compositions. The Al embedding function minima present in the lower density
regime is likely to be the source of the poor amorphous phase packing efficiencies observed in
the Ni-Al system, with the bulk moduli spike observed being associated with volume/strain

61
contraction linked to the sharp decreasing energy profile in the higher local electron density
domain. Considering the previous analysis of structural, kinetic, and bonding property
differences in the two systems, Ni-Al bond-length shortening and mismatch between underlying
strain-stiffness dependencies of Ni-Al, Ni-Ni, and Al-Al partial bonds introduce significant local
bonding constraints which act to inhibit bulk structural relaxation and the attainment of globally
efficient packing structures in the amorphous phase. The more metallic (non-directional, longer-
ranged) bonding properties of the Cu-Zr system promote more collective relaxation behavior and
drive topological and chemical reordering towards locally and globally efficient packing
configurations. An interesting question is whether such bonding differences are discernible
through the analysis of local, per-atom potential energies. Probing the degree at which local
energetics influences short-range structural ordering in the two systems, statistics on the local
atomic potential energies of atoms were collected and analyzed at various temperatures of
interest along the quench. Subsequently, mean (local atomic) potential energies for central atoms
belonging to the various Voronoi polyhedra types sampled were evaluated, and correlations with
Voronoi polyhedra occupation probabilities (cluster distributions) were assessed.
Figure 4.14: Mishin’s EAM embedding energy functions for Ni and Al atoms in the equilibrium
B2-Ni-Al phase [35]

62
Viewing the results of this analysis for Ni, Al, Cu, and Zr centered clusters at 1200K presented in
Figure 4.15 above (other temperatures displayed similar results), a number of notable
differences/features are apparent. Firstly, overall short-range cluster distributions appear to
follow a Boltzmann distribution, with the probability of an atom being attributed to a cluster of
Voronoi type <n3,n4,n5,...>, P<n3,n4,n5,...>, being exponentially dependent upon the mean potential
energy, PE <n3,n4,n5,...>, of central atoms in respective clusters:
P<n3,n4,n5,...> ∝ exp (
−PE <n3,n4,n5,...>
k𝐵T)
(4.3)
Significantly greater scatter is evident for the Cu-Zr system in comparison to the Ni-Al system.
Ni short-range cluster probabilities also appear heavily influenced by local energies, with
significant energetic differences observed between the highest and lowest probability cluster
types. While not conclusive, these differences support previous bonding considerations. The
more short-range/covalent character of Ni-Al partial bonds and underlying mismatch between
strain-stiffness dependencies of Ni-Al, Ni-Ni, and Al-Al partial bonds are expected to largely
constrain local bonding configurations, with certain local geometric configurations being highly
favorable (low-energy) and others unfavorable (high-energy). In contrast, longer-ranged
interactions in the Cu-Zr system would be expected to result in a higher relative influence of
next-nearest-neighbour atomic configurations on local atomic potential energies. The more
metallic, non-directional bonding properties of the Cu-Zr system would likely promote more
collective rearrangement and relaxation behavior, further weakening the correlations between
local cluster energies and probabilities.

63
Figure 4.15: Mean potential energies for central atoms in various sampled cluster types at
1200K
Relative sampling frequencies for different local coordination sets [CNA, CNB] about central
atoms of type A and B were also collected for both Ni-Al and Cu-Zr systems at 300K in the
glassy phase. In addition, mean potential energies for central atoms in clusters of various
coordination environments were calculated, allowing for further analysis of local energy
correlations (with results presented in Figure 4.16 and Figure 4.17). A number of interesting
observations can be made which further elucidate underlying bonding differences in the two
systems. Firstly, significantly less overlap is observed between coordination-set domains of high
frequency and those of low mean potential energy for Cu and Zr species in the Cu-Zr system
relative to Ni and Al atoms in Ni-Al. This is particularly apparent upon comparison of Cu’s
frequency distribution and coordination-energy plots for which the minimal energy coordination
region is located about [CNCu = 12, CNZr = 0], while the associated Cu coordination-energy plot
is centred far away, broadly about [CNCu = 8, CNZr = 5]. Examination of the Zr coordination-
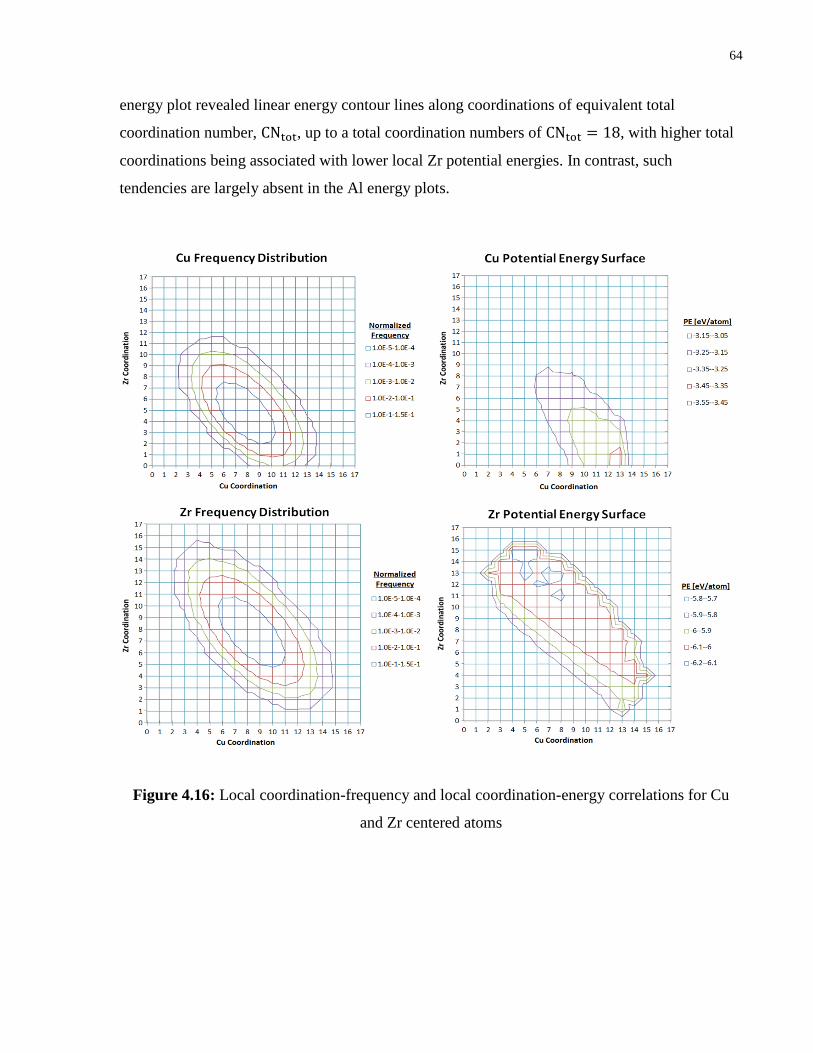
64
energy plot revealed linear energy contour lines along coordinations of equivalent total
coordination number, CNtot, up to a total coordination numbers of CNtot = 18, with higher total
coordinations being associated with lower local Zr potential energies. In contrast, such
tendencies are largely absent in the Al energy plots.
Figure 4.16: Local coordination-frequency and local coordination-energy correlations for Cu
and Zr centered atoms

65
Figure 4.17: Local coordination-frequency and local coordination-energy correlations for Ni and
Al centered atoms
While the previous Voronoi analysis of short-range structure and compositional ordering in the
two systems indicates relatively similar short-range cluster and coordination distributions, one
see that the two systems exhibit strikingly different local energetics. Overall, it is apparent that
ordering in the Cu-Zr system is much less constrained by local bonding configurations,
geometry, or coordination. Under the presence of significantly less nearest-neighbour bonding
constraints, and the strong favorability of Zr towards higher total coordinations, ordering in the
Cu-Zr system is seen to be much more controlled by larger scale energetics, likely driving the
system toward lower free-volume amorphous packing configurations. Within this context,
entropic factors (such as mixing disorder) and atomic size mismatch are likely to play a much
more significant role in dictating crystal nucleation and growth kinetics in the Cu-Zr system,

66
potentially explaining the huge disparity in glass forming ability observed with respect to the Ni-
Al system.
4.3.6 Investigating the Connections between the Vibrational Properties,
Fragility, and Glass Forming Ability of Alloys
Reflecting upon the significant overlap in Voronoi short-range cluster distributions observed in
the Cu-Zr and Ni-Al amorphous systems, it is clear that the stability of the amorphous phase is to
a large degree dependent upon the nature of larger scale ordering/packing, and more importantly,
atomic level bonding properties including next-nearest-neighbour and other longer-ranged
bonding/ordering interactions. The inability of nearest neighbour structural analysis methods
(such as Voronoi tessellation) from inferring the strength or degree at which nearest-neighbour
atoms are bonded can therefore be seen to be a serious deficiency limiting the ability to infer
global amorphous phase stability, particularly in cases where local bonding properties are heavily
compositionally or geometrically dependent (as is the case for Ni-Al or other systems with
similar covalent bonding character). While the previously discussed Gruneisen parameter
temperature variation trends, RDF analysis, and local cluster-energy correlations provided
significant evidence for this, further insight into the nature of these underlying bonding
differences can be gained through the analysis of vibrational properties in the two systems.
Calculated vibrational density of states (VDOS) spectra are presented below (see Figure 4.18) for
further analysis of bonding and stiffness properties in the amorphous and B2 crystalline phases.
Figure 4.18: Vibrational DOS Spectra for elemental components in Cu-Zr and Ni-Al B2-
crystalline and Glassy phases

67
Firstly, a clear band-gap is observed in the Ni-Al B2-crystal phase VDOS, with Al atoms
primarily occupying the higher frequency (optical) bands, and Ni atoms primarily occupying the
lower frequency (acoustic) bands. In contrast, the band gap is largely absent in the Cu-Zr VDOS,
and significantly more pronounced Cu and Zr vibrational spectra overlap is displayed. Similar
segregation of Al to higher frequency vibrational modes and Ni to lower frequency vibrational
modes is evident in the Ni-Al amorphous phase, with even more pronounced overlap being
observed between Cu and Zr vibrational spectra in the Cu-Zr amorphous phase. At least in the
case of the Ni-Al system, the observed segregation of Ni and Al atoms into well separated
acoustic and optical bands can largely be understood by considering the simple analogy to the
linear diatomic chain model. Denoting the A-B bond stiffness (or spring constant), k, the atomic
lattice spacing, a, the mass of type A and B atoms, MA and MB, and the reduced mass, μ:
μ = 1/(
1
MA+1
MB)
(4.4)
Resultant phonon dispersion curves ω(q) (where q = 2π/λ is the wavevector) for the 1-d
diatomic chain are plotted below in Figure 4.19 for the case of MA = MNi = 58.68u, and
MB = MAl = 26.98u. For the simplistic case of a 1d Ni-Al diatomic chain with only nearest-
neighbour interactions, the large mass difference between Ni and Al can be seen to result in two
well separated branches: the acoustic branch which goes to zero at small wave-vectors (ω(q) →
0 as q → 0), and the higher frequency optical branch for which ω(0) ≠ 0. Modes at the brillouin
zone (q = 𝜋/𝑎) can simply be interpreted to involve the movement of only one out of two atoms
in the sublattice, thereby resulting in a vibrational frequency of either √(2k/MA) or √(2k/MB).
Similarily, the motion of atoms for vibrational modes at small q (q → 0) are nearly identical
(exactly identical for q=0) from unit cell to unit cell, and can be interpreted to describe the
dispersion-free propagation of sound waves for the acoustic branch, or the vibration of heavy (A)
and light (B) atoms in an identical fashion for each unit cell in the optical branch (which can be
further reduced to a vibrating atom of reduced mass, μ, with force-constant, 2k). Considering the
cubic B2 crystal unit cell with atoms of type B at the corner edges and A in the center, it can be
seen that such an analogy is exact for wave-vectors pointed in the (111) directions where nearest
neighbour atoms alternate in an ABAB fashion. In this sense, the segregation of Al atoms to high
frequency optical bands, and Ni to lower frequency acoustic bands is further suggestive of
strong/stiff short-ranged nearest-neighbour Ni-Al interactions. Interestingly, while one would
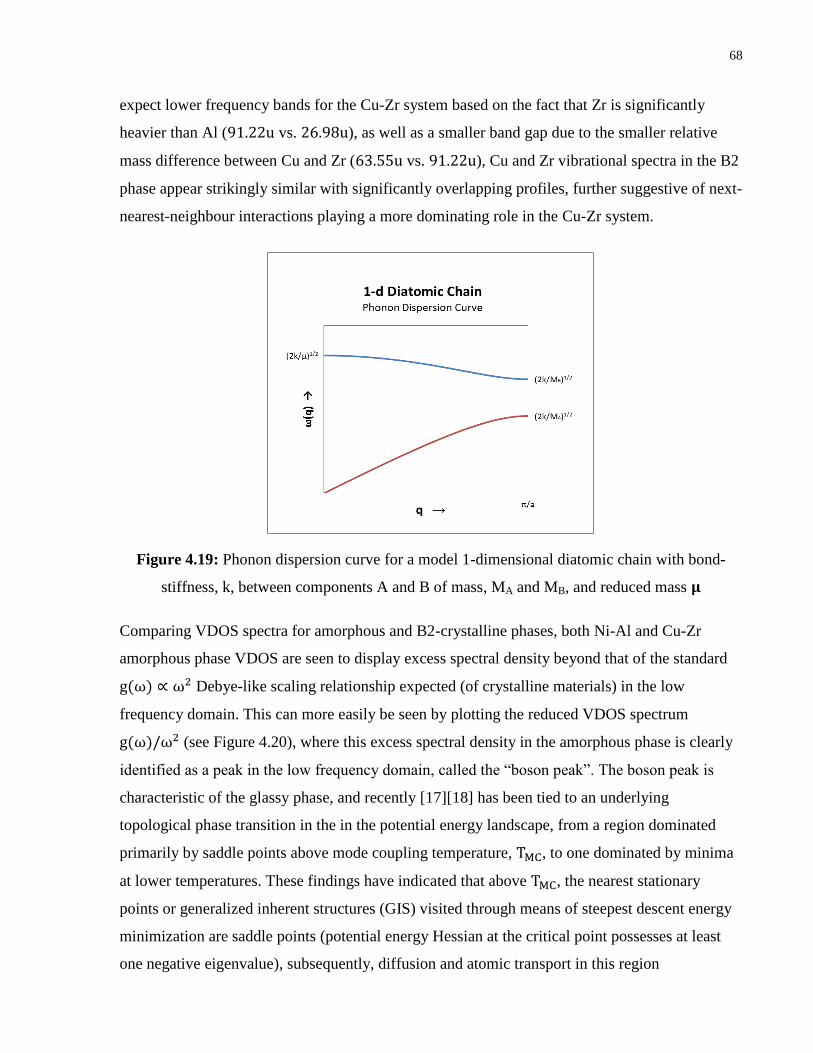
68
expect lower frequency bands for the Cu-Zr system based on the fact that Zr is significantly
heavier than Al (91.22u vs. 26.98u), as well as a smaller band gap due to the smaller relative
mass difference between Cu and Zr (63.55u vs. 91.22u), Cu and Zr vibrational spectra in the B2
phase appear strikingly similar with significantly overlapping profiles, further suggestive of next-
nearest-neighbour interactions playing a more dominating role in the Cu-Zr system.
Figure 4.19: Phonon dispersion curve for a model 1-dimensional diatomic chain with bond-
stiffness, k, between components A and B of mass, MA and MB, and reduced mass 𝛍
Comparing VDOS spectra for amorphous and B2-crystalline phases, both Ni-Al and Cu-Zr
amorphous phase VDOS are seen to display excess spectral density beyond that of the standard
g(ω) ∝ ω2 Debye-like scaling relationship expected (of crystalline materials) in the low
frequency domain. This can more easily be seen by plotting the reduced VDOS spectrum
g(ω)/ω2 (see Figure 4.20), where this excess spectral density in the amorphous phase is clearly
identified as a peak in the low frequency domain, called the “boson peak”. The boson peak is
characteristic of the glassy phase, and recently [17][18] has been tied to an underlying
topological phase transition in the in the potential energy landscape, from a region dominated
primarily by saddle points above mode coupling temperature, TMC, to one dominated by minima
at lower temperatures. These findings have indicated that above TMC, the nearest stationary
points or generalized inherent structures (GIS) visited through means of steepest descent energy
minimization are saddle points (potential energy Hessian at the critical point possesses at least
one negative eigenvalue), subsequently, diffusion and atomic transport in this region

69
predominately occurs along unstable directions of saddles. Below TMC, a topological phase
transition occurs to a phase space domain whose nearest stationary points correspond to local
potential energy minima (all positive energy Hessian eigenvalues), with phonons predominating
in this low temperature phase while being absent in the high temperature phase above TMC.
Within this context, the boson peak appears in the VDOS spectrum as a signature of a transition
from the low temperature phonon phase exhibiting a Debye g(ω) ∝ ω2 scaling, to a g(ω) ∝ ωγ
(γ < 2) phase associated with the softening of acoustic modes on approach to the phonon-saddle
transition at TMC [17][18]. Boson peak positions, ωBP, are predicted to shift to lower frequencies
as the critical point is approached according to a simple, ωBP ∝ ∆−ρ, scaling relationship, where
Δ = TMC − T (or equivalently Δ = ec − eIS where ec represents the mean equilibrium inherent
structure energy eIS sampled at mode coupling temperature TMC). Boson peak heights, g(ωBP),
are similarly predicted to follow a simple scaling law as a function of the distance away from the
critical point, g(ωBP)/ω2 ∝ ∆−β. Amazingly, the phonon-to-saddle transition in metallic glasses
belong to a greater universality class of critical phenomena, and as such, are predicted to share a
common set of critical exponents, with ρ ≈ 1, γ ≈ 3/2, and β ≈ 1/2. Interestingly, further
investigations of the nature of the lowest 1% frequency vibrational modes in glasses have
revealed strong connections with localized soft-spots, localized structural rearrangements, beta-
relaxations, and shear transformation zones. Ding et. al’s [56] investigation of the participation
fraction of central atoms in various Voronoi cluster types in the Cu64Zr36 system revealed
significant short-range structural variation between different polyhedra types, with certain
geometrically unfavorable motifs (GUMs) highly contributing, while other cluster types such as
the icosahedral <0,0,12,0> and the Kasper polyhedra provided significant structural rigidity with
minimal participation fractions. Considering the significant short-range cluster/coordination-
energy correlation differences observed in the Ni-Al and Cu-Zr systems, it is likely that many of
the geometrically favorable motifs contributing to structural rigidity in one system may in fact be
unfavorable in the other, further outlining the importance of considering fundamental bonding
properties at the atomic level.

70
Figure 4.20: reduced vibrational density of states spectra for the display of low frequency boson
peaks
Comparing amorphous phase VDOS spectra, one can note significantly higher boson peak
heights as well as as lower frequency peak positions, ωBP, in the Cu-Zr system. While not
conclusive, it is possible that these results are reflective of the Cu-Zr glassy phase being frozen
into a state in closer proximity to the critical point, or alternatively, a significantly smaller
temperature difference, Δ =TgTMC − Tg. Partial spectra for Cu and Zr species are also seen to
display significantly greater similarity relative to Ni and Al in the Ni-Al system, likely due to the
greater atomic mass mismatch in the Ni-Al system. These observations raise a number of
interesting questions that may potentially have long reaching implications in the field of
compositional tuning and glass forming ability. For one, the mode coupling temperature TMC of
alloy melts is often correlated with melting temperature Tm in many alloy systems. Considering
the correlations observed between glass forming ability, reduced glass transition temperature
Trg = Tg/Tm, and fragility m, an interesting prospect is the use of energy landscape sampling for
the direct estimation of TMC for use in an alternative correlator (which can be called the “reduced
Mode Coupling temperature”) Trmc = Tg/TMC. Should such a parameter correlate with GFA
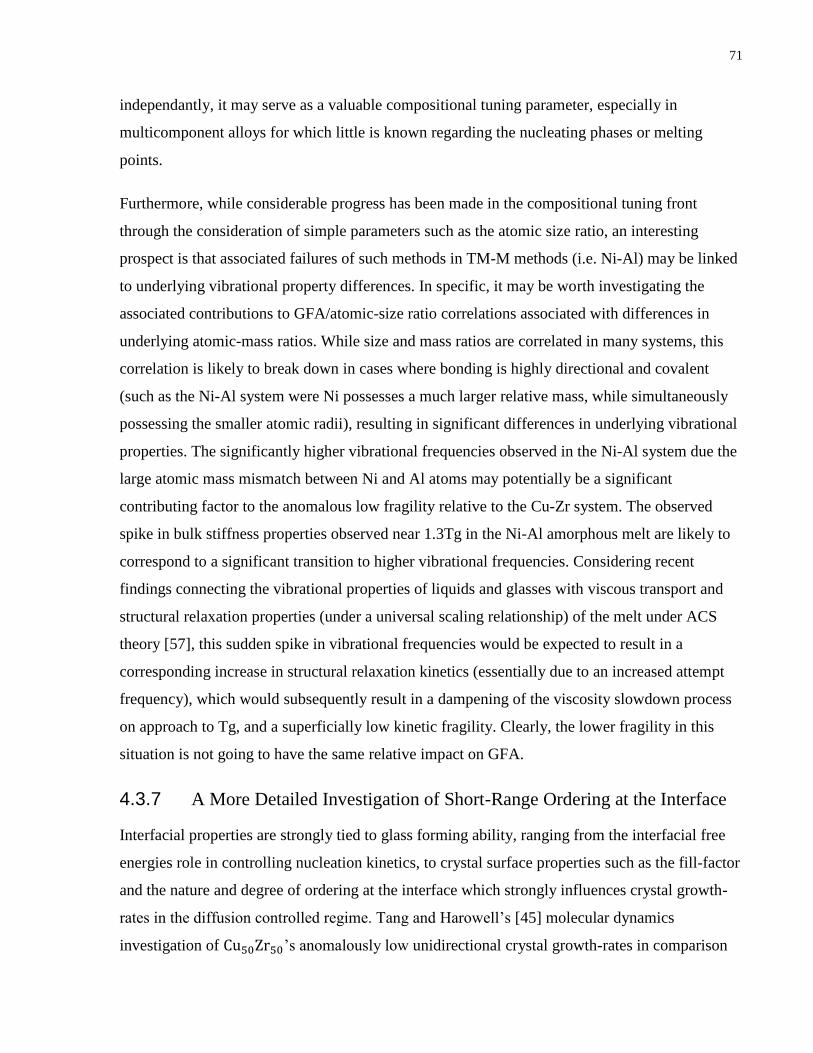
71
independantly, it may serve as a valuable compositional tuning parameter, especially in
multicomponent alloys for which little is known regarding the nucleating phases or melting
points.
Furthermore, while considerable progress has been made in the compositional tuning front
through the consideration of simple parameters such as the atomic size ratio, an interesting
prospect is that associated failures of such methods in TM-M methods (i.e. Ni-Al) may be linked
to underlying vibrational property differences. In specific, it may be worth investigating the
associated contributions to GFA/atomic-size ratio correlations associated with differences in
underlying atomic-mass ratios. While size and mass ratios are correlated in many systems, this
correlation is likely to break down in cases where bonding is highly directional and covalent
(such as the Ni-Al system were Ni possesses a much larger relative mass, while simultaneously
possessing the smaller atomic radii), resulting in significant differences in underlying vibrational
properties. The significantly higher vibrational frequencies observed in the Ni-Al system due the
large atomic mass mismatch between Ni and Al atoms may potentially be a significant
contributing factor to the anomalous low fragility relative to the Cu-Zr system. The observed
spike in bulk stiffness properties observed near 1.3Tg in the Ni-Al amorphous melt are likely to
correspond to a significant transition to higher vibrational frequencies. Considering recent
findings connecting the vibrational properties of liquids and glasses with viscous transport and
structural relaxation properties (under a universal scaling relationship) of the melt under ACS
theory [57], this sudden spike in vibrational frequencies would be expected to result in a
corresponding increase in structural relaxation kinetics (essentially due to an increased attempt
frequency), which would subsequently result in a dampening of the viscosity slowdown process
on approach to Tg, and a superficially low kinetic fragility. Clearly, the lower fragility in this
situation is not going to have the same relative impact on GFA.
4.3.7 A More Detailed Investigation of Short-Range Ordering at the Interface
Interfacial properties are strongly tied to glass forming ability, ranging from the interfacial free
energies role in controlling nucleation kinetics, to crystal surface properties such as the fill-factor
and the nature and degree of ordering at the interface which strongly influences crystal growth-
rates in the diffusion controlled regime. Tang and Harowell’s [45] molecular dynamics
investigation of Cu50Zr50’s anomalously low unidirectional crystal growth-rates in comparison
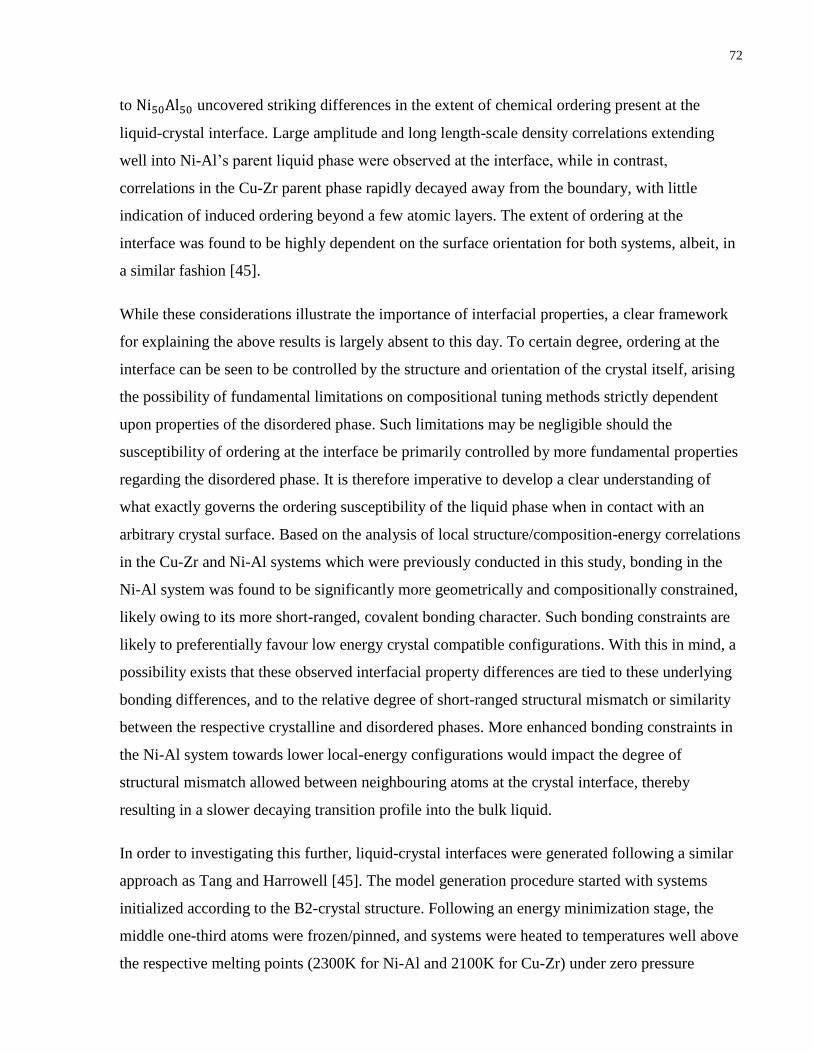
72
to Ni50Al50 uncovered striking differences in the extent of chemical ordering present at the
liquid-crystal interface. Large amplitude and long length-scale density correlations extending
well into Ni-Al’s parent liquid phase were observed at the interface, while in contrast,
correlations in the Cu-Zr parent phase rapidly decayed away from the boundary, with little
indication of induced ordering beyond a few atomic layers. The extent of ordering at the
interface was found to be highly dependent on the surface orientation for both systems, albeit, in
a similar fashion [45].
While these considerations illustrate the importance of interfacial properties, a clear framework
for explaining the above results is largely absent to this day. To certain degree, ordering at the
interface can be seen to be controlled by the structure and orientation of the crystal itself, arising
the possibility of fundamental limitations on compositional tuning methods strictly dependent
upon properties of the disordered phase. Such limitations may be negligible should the
susceptibility of ordering at the interface be primarily controlled by more fundamental properties
regarding the disordered phase. It is therefore imperative to develop a clear understanding of
what exactly governs the ordering susceptibility of the liquid phase when in contact with an
arbitrary crystal surface. Based on the analysis of local structure/composition-energy correlations
in the Cu-Zr and Ni-Al systems which were previously conducted in this study, bonding in the
Ni-Al system was found to be significantly more geometrically and compositionally constrained,
likely owing to its more short-ranged, covalent bonding character. Such bonding constraints are
likely to preferentially favour low energy crystal compatible configurations. With this in mind, a
possibility exists that these observed interfacial property differences are tied to these underlying
bonding differences, and to the relative degree of short-ranged structural mismatch or similarity
between the respective crystalline and disordered phases. More enhanced bonding constraints in
the Ni-Al system towards lower local-energy configurations would impact the degree of
structural mismatch allowed between neighbouring atoms at the crystal interface, thereby
resulting in a slower decaying transition profile into the bulk liquid.
In order to investigating this further, liquid-crystal interfaces were generated following a similar
approach as Tang and Harrowell [45]. The model generation procedure started with systems
initialized according to the B2-crystal structure. Following an energy minimization stage, the
middle one-third atoms were frozen/pinned, and systems were heated to temperatures well above
the respective melting points (2300K for Ni-Al and 2100K for Cu-Zr) under zero pressure

73
isobaric conditions, thereby melting unpinned atoms and forming two separate liquid-crystal
interfaces. After a long equilibration stage, systems were subsequently cooled down to
temperatures of interest for further property sampling. For both Ni-Al and Cu-Zr systems in
question, both B2(100)-liquid and B2(110)-liquid interfaces were generated, with a sample
snapshot of the Ni-Al B2(100) interface relaxed at 1900K presented in Figure 4.21.
Figure 4.21: A molecular dynamics snapshot of the simulated Ni-Al B2(100) interface after
relaxation at 1900K
Preliminary results of this investigation have revealed subtle but potentially significant
differences in local potential energy profiles away from Ni-Al and Cu-Zr interfaces. Viewing
Figure 4.22 below, extracted Ni-Al/Cu-Zr density correlations and mean per-atom potential
energy profiles as a function of distance away from the B2(100)-liquid interface is presented (at
approximately equivalent superheated temperatures). Firstly, viewing the Cu and Zr density
correlations, a clear mismatch is observed with Zr correlations being slightly shifted to further
distances away from the interface. The reduced bond-strain and mismatch observed in the Ni-Al
system is likely tied to previous observations of Ni-Al bond-length shortening and covalent
character as seen in partial radial distribution function analysis of the Ni-Al system. Interestingly,
even more dramatic mismatch is observed with respect to the relative positions of local energy
minima of respective Cu and Zr energy profiles. Clear and well-defined energy minima
consistent with density/distribution function profiles are observed in the Ni-Al system. In
contrast, energy minima in the Cu-Zr system are much wider (less stiff), and in particular for Zr,
display less correspondence with distribution function profiles. The less stiff and less defined
local energy profiles may be reflective of the more metallic bonding character of the Cu-Zr
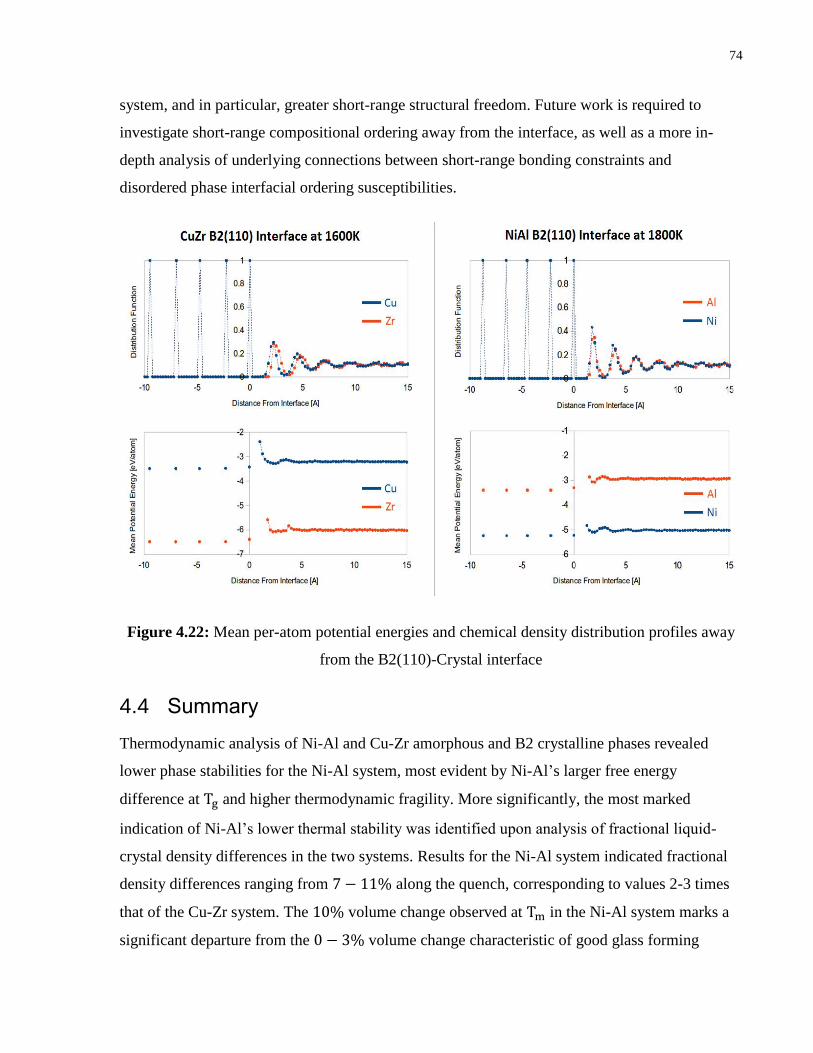
74
system, and in particular, greater short-range structural freedom. Future work is required to
investigate short-range compositional ordering away from the interface, as well as a more in-
depth analysis of underlying connections between short-range bonding constraints and
disordered phase interfacial ordering susceptibilities.
Figure 4.22: Mean per-atom potential energies and chemical density distribution profiles away
from the B2(110)-Crystal interface
4.4 Summary
Thermodynamic analysis of Ni-Al and Cu-Zr amorphous and B2 crystalline phases revealed
lower phase stabilities for the Ni-Al system, most evident by Ni-Al’s larger free energy
difference at Tg and higher thermodynamic fragility. More significantly, the most marked
indication of Ni-Al’s lower thermal stability was identified upon analysis of fractional liquid-
crystal density differences in the two systems. Results for the Ni-Al system indicated fractional
density differences ranging from 7 − 11% along the quench, corresponding to values 2-3 times
that of the Cu-Zr system. The 10% volume change observed at Tm in the Ni-Al system marks a
significant departure from the 0 − 3% volume change characteristic of good glass forming

75
systems. These results suggest an inherently kinetic origin to Ni-Al’s rapid crystallization rates.
Surprisingly, the Ni-Al system was also identified to be the kinetically stronger system based on
calculated strength and kinetic fragility parameters (D∗=2.07 and 1.58, m=21.92 and 25.01
respectively for Ni-Al and Cu-Zr), an unexpected result considering Ni-Al’s lower GFA and
thermodynamic fragility. These anomalies were further elucidated upon by investigations of
Gruneisen parameter, bulk stiffness, and structural relaxation properties in the two systems.
Large Gruneisen parameters and a sudden spike in bulk stiffness properties were identified near
1.3Tg in the Ni-Al amorphous phase, largely suggestive of the lower kinetic fragility being an
artifact of underlying volume-strain and bond-stiffness dependencies. These findings provide
detailed evidence that the poor efficacy of the kinetic fragility parameter as a GFA indicator in
alloy systems containing metalloid species in general is largely connected with the short-
range/covalent character of TM-M bonding and underlying anharmonicity effects.
Mismatch between underlying strain-stiffness dependencies of Ni-Al, Ni-Ni, and Al-Al partial
bonds are likely an inhibiting force preventing bulk structural relaxation to globally efficient
packing structures in the high temperature Ni-Al melt. Subsequently, the high temperature Ni-Al
melt exhibits high free volume content and high diffusive and viscous transport rates. As the
system is cooled, associated volume contraction results in significantly increased interactions
among previously “non-bonded” or poorly bonded Ni-Al atoms, translating to a sudden spike in
bulk stiffness properties (bulk moduli), viscosities, and ultimately to a lower kinetic fragility. In
contrast, bonding in the Cu-Zr system is longer-ranged, less directional, and highly metallic in
character, translating to minimal short-range bonding constraints, and promoting global
structural relaxation (through more cooperative flow rearrangements) to lower free volume
packing configurations. Structural evidence for the above included the more rapid decay density
correlations extending from the nearest-neighbour to next-nearest-neighbour coordination shells
in the Ni-Al system, most notably apparent upon comparison of the ratio of first and second peak
heights (summarized in Table 4.4) for Ni-Al and Cu-Zr pair-correlation functions (3.05 and 2.50
respectively). In conjunction with these observations, the high first peak intensities and large
extent of bond-length shortening observed suggest significantly more pronounced Ni-Al nearest-
neighbour level interactions. In contrast, longer-ranged next-nearest-neighbour interactions
appear much more pronounced in the Cu-Zr system, with strong and largely non-overlapping
density correlations extending well into the 2nd, 3rd, and even 4th coordination shells indicative

76
of more pronounced long-range ordering. Furthermore, Voronoi analysis revealed higher
icosahedral ordering in the Cu-Zr system (a signature of longer-ranged interactions and higher
thermal stability of the amorphous phase) with higher fractions of < 0,0,12,0 >, < 0,2,8,2 >,
and < 0,2,8,1 > clusters, as well as the presence of significantly enhanced compositional short-
range ordering. Analysis of chemical reordering along the quench was suggestive of the strong
bond strain-stiffness dependencies previously identified in the Ni-Al system having the
additional negative side-effect of inhibiting compositional short-range ordering in the amorphous
phase, a likely contributing factor to Ni-Al’s lower GFA. The large atomic-mass mismatch
between Ni and Al was further observed to result in significant mismatch in respective
vibrational spectra, with Al partial frequency spectra extending to almost double the frequencies
of Cu, Ni, or Zr. In contrast, Cu and Zr partial spectra were found to overlap with nearly identical
profiles. These findings further illustrate the large extending impacts that simple bonding
differences at the atomic level can have on a whole range of properties.
A comparative summary of GFA influencing factors evaluated for these two systems is presented
in Appendix E. In addition, Appendix D tabulates the major influencing factors for GFA and
their subsequent correlators.

77
Chapter 5
5 Development of a Broad-Compositional Search and Analysis Tool
The fine compositional sensitivity and the vast compositional space inherent to multi-component
bulk metallic glassy systems makes the experimental compositional tuning and optimization of
material properties a very taxing process, both in terms of labor and monetary costs. With the
advent of large supercomputing facilities and advanced molecular dynamics techniques,
computational materials engineering and discovery is becoming an ever more appealing and
practical alternative (or supplement) to in-lab experimental materials exploration. In particular,
the sampling of liquid, supercooled, and glassy phase (albeit, rapidly quenched) properties over
vast temperature and compositional spaces with little to no prior knowledge of underlying
systems is currently feasible utilizing molecular dynamics simulations techniques.
With this in mind, an automated and simple to use tool has been developed for the broad
compositional surveying of material properties in binary, ternary, and quaternary alloy systems.
PYTHON scripts have been developed which appropriately initialize LAMMPS input scripts and
system configuration files for the simulated quenching and glass formation of metallic glasses
based on user input information regarding the number of atoms, elemental base components,
compositional ranges, sampling interval, and temperature domain to be explored. Respective
simulations and property analysis scripts are automatically configured and organized into
independent directories for each respective alloy composition. Provided access to
supercomputing facilities, Bash job submission scripts (written for scheduling around the Cluster
Resources Moab Workload Manager) have also been prepared which iteratively move through
each compositional directory and submit requested jobs into the scheduling queue, allowing for
the rapid processing of multi-composition, multi-temperature simulations in parallel.
Beyond automating the metallic glass model generation and simulation process, an array of
PYTHON scripts have been prepared which process simulation output data for the external
calculation of a large array of system properties, including the glass transition temperature, bulk
moduli, pseudo-Gruneisen Parameters, thermodynamic properties, transport properties

78
(viscosities, diffusivities, and fragility), vibrational properties (vibrational density of states,
vibrational entropy), and structural properties (total and partial radial distribution function and
structure factors). C++ radical Voronoi tessellation packages (using the Voro++ library) in
conjunction with PYTHON processing scripts have also been prepared, allowing for the
automated collection of short-range cluster statistics and the analysis of structural reordering
over the entirety of the quench domain. Extracted properties are output and saved into local files
and directories in an easy to read and presentable text format, with key results plotted for quick
viewing. In order to assess compositional trends and correlations between various properties of
interest (potentially for compositional tuning applications), PYTHON scripts are further included
which search through each individual compositional directory and extract relevant property
results. These results are output and automatically plotted for viewing purposes. Post-analysis
scripts described were all written in a modular format, making any future required modifications
simple and straight forward. More detailed instructions for the use of this toolkit are available in
the provided user manual.
5.1 A Broad-Compositional Investigation of Short-range Ordering, Fragility, and Glass Forming Ability in the Cu-Zr System
In the following sections of this chapter, results of a broad-compositional investigation into the
kinetic, and structural properties of the CuxZr(100-x) alloy system over a range of 35-85% Cu
sampled at 5% composition intervals is presented. Due to the strong correlations between
polytetrahedral and compositional short-range ordering, the fragility parameter, and glass
forming ability, a combined analysis of their broad compositional variations in the Cu-Zr system
is of interest. For all compositions simulated, bulk liquid and glassy phases were generated by
first heating randomly ordered systems of 6000 atoms from 300K to 2100K over a duration of
1000ps, followed by a 2000ps relaxation stage allowing for the proper equilibration of the high
temperature liquid melt. Following equilibration, systems were subsequently cooled down to a
temperature of 100K through a series of 25K quench(100ps) and hold(200ps) stages,
corresponding to an average linear cooling rate of ~0.1K/ps. Throughout the quenching process,
zero pressure isobaric conditions were applied using NPT Nose-Hoover temperature and pressure
controls under 2fs integration time-steps. In contrast to Chapter 2, however, the 2007 Cu-Zr

79
Mendelev [58] interatomic potential was used for simulations in this section due to the broader
range of compositional data used in its functional fitting during development.
5.1.1 Transport and Kinetic Properties
Melt viscosities were assessed over a temperature range of 1.2-1.8Tg in 50K intervals for each
simulated Cu-Zr composition. In order to quantitatively assess kinetic fragilities in each system,
viscosity data were fit to the Vogel-Fulcher-Tammann (VFT) form:
η(T) = η0exp(
D∗T0(T − T0)
) (3.16)
Where η0 is the high temperature viscosity limit, T0 is the divergence temperature (often close in
value to the Kauzmann temperature TK), and D∗ is the strength parameter. Kinetic fragility
parameters (3.17) were further estimated by interpolating viscosities down to a rheological glass
transition temperature Tgη=103Pa⋅s
identified by the rheological condition that η(Tg) = 103Pa ⋅ s
(see “Transport Property and Fragility Calculations” in methodology and computational details
for a detailed discussion of the physical basis for using this alternative viscosity condition instead
of the standard rheological condition of η(Tg) = 1012Pa ⋅ s which applies under experimental
conditions). Specifically relevant to glass forming ability are strength parameter, D∗, fragility
parameter, m, and effective activation energy parameter, B = D∗/𝑇0, which are all reflective of
overall transport properties in the supercooled domain, and possess significant correlation with
glass forming ability. Compositional trends for these parameters, in conjunction with extracted
glass transition temperatures from cooling curve data are plotted below in Figure 5.1.
Viewing the results, significant compositional sensitivity is apparent for all three kinetic
parameters of interest. Considering that larger D∗ parameters and smaller kinetic fragility
parameters m are positively correlated with GFA, the compositional trends observed about 50%
and 65% Cu content are indicative of high glass forming ability. Interestingly, clear
correspondence between these preliminary results based on kinetics alone with two out of three
of the best identified GFA compositions [29] in the Cu-Zr system of Cu64Zr36, Cu56Zr44, and
Cu50Zr50 is evident. Surprisingly, however, the Cu50Zr50 system is substantially less fragile
relative to Cu65Zr35, while the glass forming ability of the two systems in practice is fairly

80
similar (critical thicknesses of glass formation determined by Li et al. [29] are about 1.15mm,
1.00, and 1.15mm for Cu64Zr36, Cu56Zr44, and Cu50Zr50 respectively).
Figure 5.1: Compositional dependencies of the glass transition temperature and key kinetic
properties
5.1.2 Chemical and Topological Short-Range Ordering
Atomic nearest-neighbour information extracted from Voronoi tessellation were utilized for the
investigation of local compositional ordering through calculation of the Warren-Cowley
Parameter. Denoting < CN > as the mean total coordination number (or mean number of
nearest-nearest neighbours), < CNij > the mean coordination of species j atoms about species i
central atoms, and ci the bulk stoichiometric concentration of species i, the Warren-Cowley
parameter αp is calculated through the following relation:

81
αp =
ci < CN > −< CNji >
ci < CN >=cj < CN > −< CNij >
cj < CN >
(3.21)
viewing the relation above, the Warren-Cowley parameter serves to quantify the average
deviation of local compositions (comprised of atoms in the first coordination shell) from that of
the bulk (stoichiometric composition) in a normalized fashion. Greater local compositional
deviations from bulk stoichiometry are a signature of enhanced compositional short-range
ordering (CSRO) in the amorphous phase.
In addition, copper, zirconium, and total system polyhedra fractions for perfect icosahedral
clusters <0,0,12,0> (also equivalent to the CN=12 Kasper polyhedra), the coordination 16 Kasper
polyhedra <0, 0, 12, 4>, and geometrically unfavorable motifs (GUMs) identified by Ding et al.
[56] as active localized fluid domains in the Cu64Zr36 system were further calculated along the
quench. Results of this analysis at reference temperature Tg are plotted below in Figure 5.2.
Figure 5.2: Compositional Dependencies of chemical short-range ordering and fractions of key
polyhedral types

82
Viewing the results of the short-range topological and compositional ordering analysis presented
in the figure below, enhanced CSRO is apparent for the Cu50Zr50 (corresponding to a clear
minima in the Warren-Cowley parameter), while in contrast, the Cu65Zr35 composition is
observed to exhibit optimal icosahedral fractions. Little notable features are apparent about the
Cu55Zr45 composition with regards to CSRO or icosahedral ordering. Interestingly, the Cu50Zr50
which was previously identified to possess the lowest fragility out of the three compositions also
exhibits the largest extent of compositional short-range ordering, while simultaneously
possessing maximum GUM fractions. On the other extreme, the Cu65Zr35 appears to exhibit the
least degree of compositional short-range ordering (with near Warren-Cowley parameters closest
to zero), while simultaneously appearing to possess the highest degree of short-range icosahedral
ordering with high fractions of perfect icosahedra (<0,0,12,0>) for Copper central atoms, and
Kasper CN=16 polyhedra (<0,0,12,4>) for Zirconium central atoms. These result therefore
appear to indicate that a higher degree of polytetrahedral ordering in the Cu65Zr35 counter-acts
the higher underlying fragility relative to Cu50Zr50 (despite also possessing lesser CSRO),
resulting in nearly identical glass forming abilities in the two systems.
5.1.3 Summary
The successful prediction of the two highest GFA compositions Cu50Zr50, and Cu64Zr36 through
purely kinetic and structural considerations of the disordered phase supports the concept of
developing a liquid-only MD-based compositional tuning approach. The general absence of any
interesting or anomalous features (maxima/minima) in any singular predictive indicator near the
third best GFA composition, Cu56Zr44, suggests that its high GFA may be attributed to a more
complex combination of effects or due to other variables unaccounted for in this study. The
development of a combined performance index incorporating all of these factors may be a
potential solution for the prediction of high GFA alloys in such situations. Additional sampling
points about the Cu50Zr50 compositional domain are needed however in order to more
conclusively substantiate these notions. With the Li et al [29] analysis of fractional density
changes upon crystallization indicating low extents of free volume in the Cu56Zr44, however,
these findings further enforce the notion that the extent of free volume in the disordered phase is
the single best predictive indicator for glass forming ability.

83
Chapter 6
6 Conclusions and Future Work The computational search and discovery of high GFA alloys is currently limited to the use of
GFA indicators which neglect to account for underlying differences in bonding properties or
even the alloy class in question. After conducting a thorough analysis of GFA influencing factors
and predictive indicators (see Appendix D), Ni-Al and Cu-Zr metallic glasses were simulated
using molecular dynamics techniques with the overall aim of investigating underlying
connections to more fundamental properties at the atomic level. The efficacies of various
predictive indicators of GFA were assessed through direct computation (see Table E.1 in
Appendix E for a summary of these results), and in cases of their subsequent failures to infer
GFA, detailed investigations of bulk and atomic-level properties were conducted with the intent
of uncovering underlying causes. Utilizing knowledge and tools developed during this work, an
automated MD-based package was created for the broad-compositional surveying and analysis of
amorphous phase properties relevant to GFA in multicomponent alloy systems. Broad
compositional sampling and analysis of kinetic and structural properties in the Cu-Zr system was
subsequently conducted. Reflecting upon the original aims of this work:
1) Explore and identify the key influencing factors and predictive indicators of glass
forming ability in multicomponent alloy systems
o Status: Complete
2) Investigate the atomic-level influencing factors of glass forming ability in Cu-Zr and Ni-
Al metallic glasses
o Status: Complete
3) Investigate compositional dependencies of short-range ordering, transport properties, and
glass forming ability in the Cu-Zr system
o Status: Complete
4) Develop an automated computational tool for the broad-compositional search and
analysis of thermodynamic, kinetic, and structural properties in multicomponent glasses
o Status: Complete
84
6.1 Summary and Main Contributions
In Chapters 2 and 3, a detailed review of the supercooling process underlying glass formation,
the fundamental influencing factors governing crystallization kinetics, the key predictive
indicators of glass forming ability in multicomponent alloys, and lastly, the methodology
underlying simulation and property extraction techniques used for their subsequent investigation
in this study were presented. With crystal nucleation and growth kinetics tending to be severely
diffusion limited processes in high GFA alloys, the key predictive indicators of GFA are
identified to be high disordered (liquid and glassy) phase packing efficiency, low melt fragility
and overall transport properties throughout the supercooled domain, enhanced dynamic
decoupling between the atomic mobilities of constituent elemental species (and a greater extent
of Stoke-Einstein breakdown), enhanced compositional short-range order and complexity in the
disordered (and crystal phase), and enhanced short-range icosahedral and polytetrahedral (close-
packed) order. Considering that all of these properties are intrinsically associated with the
disordered phase, the prospect of a rapid and robust compositional tuning approach reliant upon
disordered phase properties alone is deemed to be possible.
Underlying differences in the nature of atomic level bonding are reflected through more general
differences in the degree and nature of short and medium-range ordering, energy landscape and
structural relaxation properties, and ultimately the mechanisms through which crystal nucleation
and growth occur. Consistent with these notions is the rapid crystal nucleation and growth rates
observed in the Ni50Al50 system in comparison to Cu50Zr50, an apparently anomalous result
which largely persists to be a source of confusion in the BMG community. Investigations of
thermodynamic, kinetic, and structural properties in the equimolar Ni-Al and Cu-Zr systems
conducted in Chapter 4 of this work revealed a number of fundamental differences in the nature
of bonding and interactions in respective amorphous phases. The short-range directional bonding
and reduced atomic size mismatch (due to the significant bond-length shortening) between
constituent Ni and Al elements in the Ni-Al system lead to less chemically preferential short-
range ordering, a reduced tendency towards high coordination and topologically close packed
icosahedral short-range clusters, increased bulk structural stability with respect to local defects in
the crystal phase and to free volume in the disordered phase (due to less medium-range
connectivity and reduced collective flow behavior associated with the stiffer and more
constrained/directional short-ranged bonding) and a subsequently increased stability of the

85
crystalizing phase to local compositional variations and the formation of a less chemically
constrained solid-solution. These factors all contribute toward the destabilization of the Ni-Al
supercooled melt, resulting in a high free volume, thermodynamically unstable disordered phase
with a highly interface-controlled crystallization pathway possessing minimal short-range or
long-range diffusion kinetic limitations. Large atomic-mass differences lead to significantly
higher vibrational frequencies for lighter Al atoms when bonded to heavier Ni atoms, and
increased overall atomic vibrational mismatch and variability in the disordered phase. This
vibrational mismatch and variability, in conjunction with enhanced anharmonicity and strain-
stiffness dependencies associated with the short-range covalent character of Ni-Al bonding lead
to significant structural relaxation and transport property dependencies on temperature and
chemical reordering in the undercooled melt domain. The anomalously low melt fragility of the
Ni-Al system can therefore be seen to be an artifact of these underlying dependencies.
Lastly, as a first step in the development of a “liquid-only” simulations-based GFA tuning
approach, an automated tool has been created for the broad compositional sampling and analysis
of liquid and glassy phase properties in multicomponent (binary, ternary, quarternary) alloy
systems, with initial work on the Cu-Zr system presented in Chapter 5 showing very promising
results. The successful prediction of the two highest GFA compositions, Cu50Zr50 and Cu64Zr36,
through purely kinetic (melt fragility) and short-range chemi-topological (icosahedral fractions
and CSRO) considerations of the disordered phase further supports the viability of a liquid-only
MD-based compositional tuning method. The next step in the development of such an approach
is the incorporation of other disordered phase predictive GFA indicators, and subsequent testing
on ternary or quarternary alloy systems. The overall findings of the Ni-Al and Cu-Zr GFA
investigations, however, demonstrate the critical importance of incorporating more complex
alloy-specific information regarding the nature of bonding and ordering at the atomic level into
such an approach.
86
6.2 Implications of Results and Future Avenues of Research
Implications of this work relevant to the advancement of compositional tuning methods, and
potential future avenues of research are:
• Traditional free volume frameworks for diffusive motion and transport are likely to break
down in alloys containing high concentrations of metalloid species due to the short-
ranged/directional covalent character of TM-M bonding
• The poor efficacy of the fragility index as a GFA indicator in TM-M alloy systems is likely
tied to underlying vibrational an-harmonicity effects and bond strain-stiffness dependencies
associated with the mismatch between short-ranged/covalent TM-M bonding, and longer-
ranged/metallic TM-TM bonding
• The atomic mass-ratio may be an important parameter of interest independent of the atomic
size-ratio, with key connections to underlying vibrational mismatch between constituent
elements, the melt fragility, and subsequently, the overall GFA
• Base BMG components should ideally be larger metallic species so as to ensure longer-
ranged interactions and lesser nearest-neighbour bonding constraints, which together
contribute to enhance medium-range chemical ordering, connectivity, and collective flow
behavior, as well as driving the formation of more topologically close packed, icosahedral
short-range order in the disordered phase
• Liquid-crystal density difference is the single most effective GFA indicator, however,
proposed free volume theory based explanations provide at most a partial explanation for
said efficacies. It is likely that in systems containing high fractions of metalloid species, a
complete explanation requires consideration of induced stress fields at the liquid-crystal
interface tied to underlying liquid-crystal density differences, bond an-harmonicity effects
in the amorphous phase, and higher stiffness properties of the crystalline phase.
• A potential avenue for future research is the modification of common GFA indicators such
as the fragility index to account for underlying bonding and vibrational property differences,
potentially through the addition of terms accounting for an-harmonicity and bonding/mass
mismatch. In conjunction, cross-compositional analysis of (pseudo)Gruneisen parameters
along the quenching domain may be worthwhile for the search of improved GFA indicators.

87
Bibliography
[1] W. Klement, R. H. Willens, and P. Duwez. Non-crystalline structure in solidified gold-silicon alloys. Nature, 187:869-870, September 1960.
[2] A. Inoue, T. Zhang, and T. Masumoto. Glass-forming ability of alloys. Journal of Non-Crystalline Solids, 156-158:473-480, May 1993.
[3] A. Inoue and A. Takeuchi. Recent development and application products of bulk glassy alloys. Acta Materialia, 59:2243-2267, April 2011. [4] J. Schroers. Bulk metallic glasses. Physics Today, 66:32-47, February 2013. [5] A. Inoue and N. Nishiyama. New bulk metallic glasses for applications as magnetic-sensing, chemical, and structural materials. MRS Bulletin, 32:651-658, August 2007. [6] D. Turnbull. Under what conditions can a glass be formed? Contemporary Physics, 10:473-488, September 1969. [7] G. Ghosh. Integrated design of Nb-based superalloys: Ab initio calculations, computational thermodynamics and kinetics, and experimental results. Acta Materialia, 55:3281-3301, June 2007. [8] A. Inoue. Stabilization of metallic supercooled liquid and bulk amorphous alloys. Acta Materialia, 48:279-306, January 1999. [9] D. Miracle, W. Sanders, and O. N. Senkov. The influence of efficient atomic packing on the constitution of metallic glasses. Philosophical Magazine, 83:2409-2428, July 2003. [10] D. B. Miracle. The efficient cluster packing model – An atomic structural model for metallic glasses. Acta Materialia, 54:4317-4336, September 2006. [11] S. Mukherjee, J. Schroers, Z. Zhou, W. L. Johnson, and W. K. Rhim. Viscosity and specific volume of bulk metallic glass-forming alloys and their correlation with glass forming ability. Acta Materialia, 52:3689-3695, July 2004. [12] H. B. Yu, K. Samwer, W. H. Wang, and H. Y. Bai. Chemical influence on beta-relaxations and the formation of molecule-like metallic glasses. Nature Communications, 4:2204-2210, July 2013.
[13] F. H. Stillinger. A topographic view of supercooled liquids and glass formation. American Association for the Advancement of Science, 267:1935-1939, March 1995.
[14] F. H. Stillinger and T. A. Weber, Bell Laboratories, and Murray Hill. Hidden structure in liquids. Physical Review A, 25(2):978–989, 1982.

88
[15] P. G. Debenedetti and F. H. Stillinger. Supercooled liquids and the glass transition. Nature, 410:259–267, March 2001.
[16] F. Sciortino, W. Kob, P. Tartaglia, Dipartimento Fisica, Istituto Nazionale, and Roma La. Inherent Structure Entropy of Supercooled Liquids. Physical Review Letters, 83(16):16– 19, 1999.
[17] T. S. Grigera, V. Martin-Mayor, G. Parisi, and P. Verrocchio. Phonon interpretation of the ‘boson peak’ in supercooled liquids. Nature, 422:289-292, March 2003.
[18] T. S. Grigera, V. Martin-Mayor, G. Parisi, and P. Verrocchio. Vibrations in glasses and Euclidian random matrix theory. arXiv[cond-mat], 0110441:1-11, October 2001.
[19] F. H. Stillinger. A topographic view of supercooled liquids and glass formation. American Asscociation for the Advancement of Science, 267(5206):1935–1939, 1995.
[20] C. A. Angell. Perspective on the glass transition. Journal of Physical Chemistry of Solids, 49:863–871, November 1988.
[21] K. F. Kelton. Crystal Nucleation in Liquids and Glasses. Solid State Physics, 45:75-177, November 1991.
[22] D. U. Furrer, S. L. Semiatin. Fundamentals of Modeling for metals processing. ASM Handbook, 22A:203-219, January 2010.
[23] K. F. Kelton. Crystal nucleation in supercooled liquid melts. Int. J. Microgravity Sci. Appl., 30(1):11-18, 2013.
[24] R. J. Kirkpatrick. Crystal growth from the melt: a review. Am. Mineral. 60:798-814, 1975.
[25] A. Inoue and A. Takeuchi. Recent development and application products of bulk glassy alloys. Acta Materialia, 59(6):2243–2267, April 2011.
[26] T. Egami. Atomistic mechanism of bulk metallic glass formation. Journal of Non-Crystalline Solids, 317(1-2):30–33, March 2003.
[27] D. Turnbull. Formation of Crystal Nuclei in Liquid Metals. Journal of Applied Physics, 21(10):1022-1028, October 1950.
[28] D.-H. Kang, H. Zhang, H. Yoo, H. H. Lee, S. Lee, G. W. Lee, H. Lou, X. Wang, Q. Cao, D. Zhang, and J. Jiang. Interfacial free energy controlling glass-forming ability of Cu-Zr alloys. Scientific Reports, 4(1):5167-5172, June 2014.
[29] Y. Li, Q. Guo, and J. A. Kalb. Matching glass-forming ability with the density of the amorphous phase. Scientific Reports, 322:1816-1819, December 2008.
[30] K. Russew, L. Stojanova, S. Yankova, E. Fazakas, and L. K. Varga. Thermal behavior and melt fragility number of Cu100-x Zrx glassy alloys in terms of crystallization and viscous flow. Journal of Physics: Conference Series, 144:012094, 2009.

89
[31] K. F. Kelton. Crystal Nucleation in Supercooled Liquid Metals. Int. J. Microgravity Sci. Appl., 30(1):11–18, 2013.
[32] Z. W. Wu, M. Z. Li, W. H. Wang, and K. X. Liu. Correlation between structural relaxation and connectivity of icosahedral clusters in Cu-Zr metallic glass-forming liquids. Physical Review B, 88(054202):1–5, 2013.
[33] S. Mukherjee. Ph.D. thesis. California Institute of Technology, 2014.
[34] S. Plimpton. Fast parallel algorithms for short-range molecular dynamics. Journal of Computational Physics, 117(1):1-19, March 1995. [35] Y. Mishin, M. Mehl, and D. Papaconstantopoulos. Embedded-atom potential for B2-Ni-Al. Physical Review B, 65(22414):1-14, June 2002.
[36] S.-T. Lin, M. Blanco, and W. A. Goddard. The two-phase model for calculating thermodynamic properties of liquids from molecular dynamics: Validating for the phase diagram of Lennard-Jones fluids. The Journal of Chemical Physics, 119(22):11792-11805, 2003.
[37] P.-K. Lai, C.-M. Hsieh, and S.-T. Lin. Rapid determination of entropy and free energy of mixtures from molecular dynamics simulations with the two-phase thermodynamic model. Physical Chemistry Chemical Physics, 14(43):15206-15213, 2012.
[38] Y. Zhang, N. Mattern, and J. Eckert. Atomic structure and transport properties of Cu50Zr45Al5 metallic liquids and glasses: Molecular dynamics simulations. Journal of Applied Physics, 110(9):093506, November 2011.
[39] M. Mendelev, M. Kramer, R. Ott, and D. Sordelet. Molecular dynamics simulation of diffusion in supercooled Cu-Zr alloys. Philosophical Magazine, 89(2):109-126, January 2009.
[40] P. J. Daivis and D. J. Evans. Comparison of constant pressure and constant volume nonequilibrium simulations of sheared model decane. Journal of Chemical Physics, 100(1):541-547, January 1994.
[41] C. H. Rycroft, Voro++: A three-dimensional Voronoi cell library in C++. Chaos, 19:041111, 2009. [42] A. S. Roik, A. V. Anikeenko, and N. N. Medvedev. Polytetrahedral order and chemical short-range order in metallic melts. Journal of Structural Chemistry, 54(2):332-340, 2013.
[43] S. Sedighi, D. W. Kirk, C. V. Singh, and S. J. Thorpe. Investigating the atomic level influencing factors of glass forming ability in NiAl and CuZr metallic glasses. The Journal of Chemical Physics, 143:114509, September 2015.
[44] D. Turnbull. On the free-volume model of liquid-glass transition. The Journal of Chemical Physics, 52:3038-3041, 1970.
[45] C. Tang and P. Harrowell. Anomalously slow crystal growth of the glass-forming alloy Cu-Zr. Nature Materials, 12:507-511, April 2013.

90
[46] Z. W. Wu, M. Z. Li, W. H. Wang, and K. X. Liu. Hidden topological order and its correlation with glass-forming ability in metallic glasses. Nature Communications, 6:6035, January 2015.
[47] M. Mendelev, M. Kramer, R. Ott, D. Sordelet, D. Yagodin, and P. Popel. Development of suitable interatomic potentials for simulation of liquid and amorphous Cu-Zr alloys. Philosophical Magazine, 89(11):967-987, April 2009.
[48] J. C. Mauro, R. J. Loucks, A. K. Varshneya, and P. K. Gupta. Enthalpy landscapes and the glass transition. Scientific Modeling and Simulation, 15:241-281, 2008.
[49] C. A. Angell. Entropy and fragility in supercooling liquids. Journal of Research of the National Institute of Standards and Technology, 102(2):171-185, 1997.
[50] K. Ito, C. T. Moynihan, and C. A. Angell. Thermodynamic determination of fragility in liquids and a fragile-to-strong liquid transition in water. Nature, 398:492-495, January 1999.
[51] T. D. Shen, U. Harms, and R. B. Schwarz. Correlation between the volume change during crystallization and the thermal stability of supercooled liquids. Applied Physics Letters, 83(22):4512, December 2003.
[52] B. Fultz. Vibrational thermodynamics of materials. Progress in Materials Science, 55(4):247-352, May 2010.
[53] C. Suryanarayana and A. Inoue, Bulk Metallic Glasses, Taylor & Francis Group (Boca Raton, FL, 2011) pp. 124–124.
[54] R. Busch. The thermophysical properties of bulk metallic glass-forming liquids. Jom-J Min. Met. Mat. Soc., 52:39-42, 2000. [55] T. Waniuk, R. Busch, a. Masuhr, and W. Johnson. Equilibrium viscosity of the Zr41.2Ti13.8Cu12.5Ni10Be22.5 bulk metallic glass-forming liquid and viscous flow during relaxation, phase separation, and primary crystallization. Acta Materialia, 46(15):5229-5236, 1998. [56] J. Ding, S. Patinet, M. L. Falk, Y. Cheng, and E. Ma. Soft spots and their structural signature in a metallic glass. Proceedings of the National Academy of Sciences, 111(39):14052-14056, August 2014.
[57] L. Larini, A. Ottochian, C. De Michele, and D. Leporini. Universal scaling between structural relaxation and vibrational dynamics in glass-forming liquids and polymers. Nature Physics, 4:42-45, December 2008.
[58] M. I. Mendelev, D. J. Sordelet, C. A. Becker. Using atomistic computer simulations to analyze x-ray diffraction data from metallic glasses. Journal of Applied Physics, 102:043501, 2007

91
Appendix A. Background Information on Classical Equilibrium Statistical Mechanics
Classically, the state of a physical system can be fully described given complete knowledge of
atomic/particle positions, r(N)
= (r1, r2,…, rN), and momenta, p
(N) =
(p1, p2,…, pN), (often further
condensed into a single 6N dimensional phase space coordinate, x(6N)
= ( r(N)
, p(N)
), with
evolution following under the relations of Hamiltonian/Newtonian mechanics. Within this
context, the system energy (or Hamiltonian function) can be decomposed into components of
either kinetic or potential energy, for which the potential energy is often taken to be only a
function of the relative atomic positions:
𝐻(𝒙(𝑁)) = 𝐾𝐸 + 𝑃𝐸 = ∑𝒑𝑖 ⋅ 𝒑𝑖2𝑚𝑖
+ 𝜙(𝒓(𝑁))
𝒓 =𝜕𝐻
𝜕𝒑𝑖=
𝒑𝑖
𝑚𝑖
𝑖 = −𝜕𝐻
𝜕𝒓𝑖= −
𝜕𝜙(𝒓(𝑁))
𝜕𝒓𝑖
(A.1)
In practice, exact knowledge of the microscopic state of a physical system is never known (nor
possible to be known), with available information often limited to coarse-grained bulk-averaged
observables (i.e. density, net magnetism, phase, etc.). With this in mind, at the heart of
equilibrium statistical mechanics is the goal of predicting and understanding thermodynamic
properties of bulk physical systems through the probabilistic consideration of the underlying
microscopic state space (configurations) and energetics. In essence, this is done by averaging
system observable properties B(𝒓(𝑁), 𝒑(𝑁)) over a representative distribution in phase space
f(𝒓(𝑁), 𝒑(𝑁), 𝑡) which is appropriately weighted to quantify the probability of the system
occupying different configurational volumes, i.e.:
Probability of sampling microstate in ensemblewith coordinates in range
(𝐫(N), 𝐫(N) + d𝐫(N)) and (𝐩(N), 𝐩(N) + d𝐩(N)) at time t
= 𝑓(𝒓(𝑁), 𝒑(𝑁), 𝑡)dr(N)
dp(N)
(A.2)

92
With the expectation value of macroscopic observables (at a given instance in time)
corresponding to an ensemble average over all accessible phase space:
𝐵(𝑡) = ∫𝑑𝒓(𝑁) 𝑑𝒑(𝑁)𝑓(𝒓(𝑁), 𝒑(𝑁), 𝑡)𝐵(𝒓(𝑁), 𝒑(𝑁))
(A.3)
The key problem is then transferred to the identification of the appropriate distribution function
for weighting different configurations. Under the framework of equilibrium statistical mechanics,
a constrained maximum entropy axiomatic approach is taken, with the key caveat being the
requirement for the conditions of ergodicity, stationarity, and subsequently equilibrium to be
met. The requirement of stationarity imposes time translational invariance to the distribution
function with the additional requirement for ergodicity imposing equal weighting to all
accessible microstates of identical number of particles, volume, and energy, resulting in the
constant weight microcanonical NVE ensemble (distribution function):
f(𝐱(N)) =
1
Ω(N, V, E) if 𝐸 < 𝐻(𝐱(N)) < 𝐸 + 𝛿𝐸
0 else
(A.4)
An additional consequence of the ergodic hypothesis is the equivalence of time and ensemble
averaging, with the expected duration of time spent by a system in a region of accessible phase
space being directly proportional to the associated volume of that region.
𝐵(𝑡) =
1
𝜏∫𝐵(𝒓(𝑁)(𝑡 + 𝜖), 𝒑(𝑁)(𝑡 + 𝜖))𝑑𝜖
𝜏
0
≈1
Ω(N, V, E)∫𝑑𝒓(𝑁)𝑑𝒑(𝑁)𝐵(𝒓(𝑁), 𝒑(𝑁)) = < 𝐵 >
(A.5)
Informally speaking, this axiomatic approach assumes that measurement timescales are long
enough (in comparison to underlying relaxation processes) to allow for sufficient sampling of
phase space. The observed macroscopic properties of an isolated system are then seen to
correspond to the macroscopic state associated with the greatest number of accessible
microstates, and thus, that which is the most “disordered” or possesses maximal entropy. By
defining the statistical entropy as the logarithm of the total number of independent microstates
(Ω or 𝑚𝑢𝑙𝑡𝑖𝑝𝑙𝑖𝑐𝑖𝑡𝑦) accessible at that given volume, particle number, and total energy, the
connection between the statistical and thermodynamic entropy S is realized through the relations:
93
𝑆 = 𝑘𝐵𝑙𝑛Ω(𝑁, 𝑉, 𝐸) where kB is the Boltzmann Constant
Ω(N, V, E) =1
N! h3N∫ d𝐫(N)d𝐩(N)
𝐸<𝐻(𝐫(N),𝐩(N))<𝐸+𝛿𝐸
(A.6)
(Note: the 1
N!h3N pre-factor and integration over states existing within a finite energy band 𝛿𝐸 is
required for consistency with quantum statistics and uncertainty)
While no mention has been made till now with respect to system boundary conditions or the
degree/nature of coupling with the surroundings, such considerations can be incorporated as
additional optimization constraints for the determination of the appropriate distribution function,
forming the basis for the various thermodynamic ensembles (microcanical/NVE, canonical/NVT,
grand-canonical/µVT, isothermal-isobaric/NPT and so on). While the microcanonical ensemble
formed under the assumption of complete isolation (with constant energy, volume, and particle
number) is the most fundamental, a significant disadvantage lies in the fact that experiments are
rarely conducted under such operating conditions. Relaxing constraints from the condition of
constant energy to constant temperature instead is much more reflective of commonly
encountered experimental conditions. In such instances, it can be shown that the canonical
(NVT) ensemble is the appropriate distribution function, with occupation probabilities weighted
exponentially according to system energy H(x(N)):
f(x(N)) =
1
N! h3Nexp−βH(x(N))
Z(N, V, T)
(A.7)
where 𝛽 =1
𝑘𝐵𝑇 denotes the inverse temperature, 𝑍(𝑁, 𝑉, 𝑇), is the Canonical Partition Function.
Beyond ensuring proper normalization, the Canonical Partition Function contains all information
of the system, and can be seen to provide a direct connection to the thermodynamic state function
Helmoltz Free Energy (A):
Z(N, V, T) =
1
N! h3N∫ dx(N)exp−βH(x(N))
A = E − TS = −β−1ln (Z(N, V, T))
(A.8)

94
Importantly, macroscopic thermodynamic observables are directly relatable to the partition
function. For instance, evaluation of the mean system energy, , through explicit ensemble
averaging of the system Hamiltonian, H(x(N)), reveals its connection to the partition function as
a first order partial derivative with respect to 𝛽:
E = ⟨H(x(N))⟩ =1
N!h3N∫ dx(N)exp−βH(x(N))H(x(N)) = −
∂lnZ
∂β =
∂(βA)
∂β (A.9)
Moreover, energy fluctuations/variance for systems operating under NVT conditions can
explicitly be evaluated in terms of a second order partial derivative of the partition function and
shown to be directly related to the constant volume heat capacity, 𝐶𝑣:
𝜎𝐸2 = ⟨H(x(N))2⟩ − ⟨H(x(N))⟩2 = −
∂2lnZ
∂β2= 𝜕E
𝜕𝛽= 𝑘𝐵𝑇
2𝐶𝑣 (A.10)
As presented in Section 3.3, similar statistical identities can be derived relating other second
order thermodynamic properties to fluctuations in corresponding first order thermodynamic
properties, forming the basis for the fluctuation method used in this work for the extraction of
heat capacities, isothermal expansion coefficients, and bulk moduli through MD simulation.
Thermodynamic stability and more fundamental questions regarding the connection between
statistical mechanics and classical thermodynamics can be further elucidated by analyzing the
associated probability of sampling a macroscopic state of total energy, E1, from a system
operating under NVT conditions:
𝑃(𝐸1) = ⟨𝛿(𝐸1 −𝐻(𝒙(𝑁))⟩𝑁𝑉𝑇
=1
N! h3N𝑍(𝑁, 𝑉, 𝑇)∫dx(N) exp−βH(x(N)) 𝛿 (𝐸1 − H(x
(N)))
=exp−β𝐸1Ω(E1)
𝑍(𝑁𝑉𝑇)
(A.11)
From (A.6), the multiplicity of states of energy E1, Ω(E1), can be expressed in terms of the
corresponding entropy, 𝑆(𝐸1), resulting in:

95
𝑃(𝐸1)~ exp −
𝐸1𝑘𝐵𝑇
exp 𝑆(𝐸1)
𝑘𝐵
= exp −𝐸1 − 𝑇𝑆(𝐸1)
𝑘𝐵𝑇
= exp −𝐴(𝐸1)
𝑘𝐵𝑇
(A.12)
We see that the probability of capturing the system in a state of energy, E1, is directly related to
the corresponding Helmholtz Free Energy, A(E1) = E1-TS(E1), with lower Helmholtz Free
Energies translating to higher occupation probabilities and thermal stability. The relative stability
of the energy macrostate, E1, with respect to, E2, can similarly be expressed in terms of the
Helmholtz Energy difference, ∆𝐴12 = 𝐴(𝐸1) − 𝐴(𝐸2):
𝑃(𝐸1)
𝑃(𝐸2)=exp −
𝐸1 − 𝑇𝑆(𝐸1)𝑘𝐵𝑇
exp −𝐸2 − 𝑇𝑆(𝐸2)
𝑘𝐵𝑇= exp −
∆𝐸12 − 𝑇∆𝑆12
𝑘𝐵𝑇 = exp −
∆𝐴12
𝑘𝐵𝑇
(A.13)
While the above discussion is restricted to the use of total energy E as the thermodynamic
observable property for characterizing different macrostates, the main results apply in general.
Namely, the identification of the most thermodynamically stabile (equilibrium) state/phase of a
system can be equivalently framed in terms of probability maximization under the ensemble
distribution, or alternatively, one of free energy minimization. From this perspective, the
standard thermodynamic condition for process spontaneity (∆𝐴1→2 < 0) under NVT operating
conditions can be viewed to be a simple statement that spontaneous processes evolve toward
more probabilistically favourable, lower free energy states. Furthermore, the equilibria of two
distinct states or phases can be interpreted in terms of the condition of equal system occupational
probabilities or Free Energies. Under different operating conditions, the identification of the
most thermodynamically stable state/phase can similarly be framed in terms of probability
maximization, or alternatively, in terms of Entropy (S) maximization under NVE conditions,
Gibbs free energy (G) minimization under NPT/ µVT conditions, or even in terms of internal
energy (E) minimization under NVS isentropic conditions. Viewing Table A.1, distribution

96
functions, partition functions, and associated thermodynamic potentials (or state functions) for
systems operating under various standard conditions are summarized.
Table A.1: Summary of relevant thermodynamic ensembles and state functions
Ensemble Distribution Function Partition Function Thermodynamic
Potential
Microcanonical
(NVE) f(x(N)) =
1
Ω(N, V, E) if H(x(N)) == E
0 else
Ω(N, V, E) =1
N!h3N∫ dx(N)
H(x(N)) = 𝐸
S(N, V, E) = kBlnΩ(N, V, E)
Canonical
(NVT)
f(x(N)) =1
N!h3Nexp−β(H(x(N)))
Z(N, V, T) Z(N, V, T) =
1
N!h3N∫ dx(N)exp−βH(x(N))
A(N, V, T) = −kBTlnZ(N, V, T)
A(N, V, T) = E − TS
Isothermal-
Isobaric (NPT)
f(x(N), V) =1
N!h3Nexp−β(H(x(N)) + PV))
∆(N, P, T) ∆(N, P, T) = ∫ dV Z(N, V, T)exp (−βPV)
∞
V=0
G(N, P, T) = −kBTln∆(N, P, T)
G(N, P, T) = μN = E − TS + PV
Grand
Canonical (µVT)
f(x(N), N) =1
N! h3Nexp−β(H(x(N)) − μN))
Ξ(μ, V, T) Ξ(μ, V, T) = ∑ Z(N,V, T)exp (βμN)
∞
N=0
G(μ, V, T) = −kBTlnΞ(μ, V, T)
G(μ, V, T) = μN = E − TS + PV

97
Appendix B. An In-Depth Overview of Energy Landscape Theory
Under the energy landscape formulism [13-15], the 3N dimensional potential energy landscape
ϕ(𝐫1, 𝐫2, 𝐫3, . . . , 𝐫N) is partitioned about a discrete set of configurations, 𝐫α(N)
, known as
“basins” or “inherent structures” where the potential energy lies at a local minima with respect to
all atomic coordinates (and thus is in a state of local dynamical equilibrium, experiencing zero
force). Within this context, system dynamics and evolution in the supercooled domain can be
characterized by the combined contributions of an-harmonic intra-basin vibrations about local
potential energy (basin) minima, and more larger-scale and in-frequent “basin hopping”
transitions across potential energy saddle-points to nearby thermally accessible basins. In order
to understand the basis of such configurational partitioning, first recall that the canonical
partition function is expressed as a 6N-dimensional integral over configurational and momenta
space (while NVT operating condition are assumed here for brevity, the same overall results
apply under the isothermal-isobaric NPT ensemble where partitioning occurs in the 3N+1
dimensional (zero temperature) enthalpy landscape instead of the 3N dimensional potential
energy landscape [48]):
Z(N, V, T) =
1
N! h3N∫ d𝐱(N)exp−βH(𝐱(N))
=1
N! h3N∫ d𝐫(N)d𝐩(N)exp −β(∑
𝐩i ⋅ 𝐩i2mi
+ ϕ(𝐫(N)))
=1
N! h3N∫ d𝐩(N)exp−β∑
𝐩i ⋅ 𝐩i2mi
∫ d𝐫(N)exp−βϕ(𝐫(N))
(B.1)
The separable nature of the Hamiltonian into kinetic and potential energy components allows for
momenta contributions to be evaluated independently, amounting to standard Gaussian integrals
(from –infinity to +infinity) which can be calculated explicitly and shown to be given by:
∫ d𝐩(N)exp−β∑𝐩i ⋅ 𝐩i2mi
= (2πmk𝐵T)3N/2
(B.2)
98
The Configurational Partition Function, Q(N, V, T), containing all interaction and configurational
energy influences can therefore be defined as:
Q(T, V) = ∫ d𝐫(N)exp−βϕ(𝐫(N)) (B.3)
Defining the thermal De-broglie wavelength, λ𝐷:
λ𝐷 = (h2
2πmkT)
12
(B.4)
the decomposition of the full Partition Function in terms of the configurational partition function
can be simply expressed as:
Z(N, T, V) =
1
N!(2πmkT
h2)3N2 Q(T, V) =
1
N! λ𝐷3NQ(T, V)
(B.5)
As stated earlier, the partition function can further be partitioned in configurational space about a
discrete set of potential energy minima. Conceptually, this can be understood by considering
classical system evolution following under Hamiltonian/Newtonian dynamics which is governed
by:
𝐫..(N) = ∇𝐫(N)ϕ(𝐫
(N)) (B.6)
By neglecting dynamics and only considering the first-order evolution equations, steepest decent
paths are characterized by:
𝐫.(N) = ∇𝐫(N)ϕ(𝐫
(N)) (B.7)
It can be shown [13-15] that following the governing first-order steepest decent path, any point
in configurational space (with the exception of a discrete volume of zero measure) maps to a
corresponding local minimum in the discrete set of 𝐫α(N)
. All elements of configurational space
mapping to minima 𝐫α define sub-regions, R(𝐫α(N)), known as the “quench regions”, “basins”, or
“inherent structures”. The configuration integral can thus be expressed as a sum over the
individual quench regions or basins:
99
Q(T, V) =∑Qα
α
=∑∫ dR(𝐫α
(N))α
𝐫(N)exp−βϕ(𝐫(N)) (B.8)
Where Qα is the Configurational Partition function for the individual and distinct basin, R(𝐫α(N)).
Expressing the Potential energy, ϕ(𝐫(N)), in terms of its difference with respect to the local
minima energy at 𝐫α(N)
, Δ ϕrα(N) (𝐫(N)), thermal/vibrational contributions can be effectively
separated, allowing Qα to be expressed as:
Qα(T, V) = exp−βϕ(rα
(N))∫ d
R(rα(N))
r(N)exp−βΔ ϕrα(N) (r(N))
(B.9)
Averaging over all basins of equivalent inherent structure (minima) energies, one can define the
mean partition coefficient, Q(ϕ, T, V), and mean vibrational free energy, f(ϕ, T, V), for inherent
structures of energy ϕ:
Q(ϕ, T, V) =
∑ δϕ,ϕαα Qα∑ δϕ,ϕαα
= exp−βϕ < ∫ dR(ϕ)
r(N)exp−βΔ ϕrα(N) (r(N)) >
(B.10)
f(ϕ, T, V) ≡ −β−1ln< ∫ d
R(ϕIS)r(N)exp−βΔ ϕ
rα(N) (r(N)) >
λ3N
(B.11)
f(ϕ, T, V) can be interpreted as the (vibrational) free energy should the system be completely
confined to the average inherent structure of depth ϕ. The number of distinct basins of potential
energy ϕ, Ω(ϕ), is further given by:
Ω(ϕ) =∑δϕ,ϕαα
(B.12)
Coarse graining Ω(ϕ), a density of states, N(ϕ), can be defined as:
N(ϕ)δϕ = ∫ d
ϕ+δϕ
ϕ
ϕ′Ω(ϕ′) ≈ Ω(ϕ)δϕ (B.13)

100
and the configurational entropy, Sc, can be defined as:
Sc(ϕ) = k𝐵ln[Ω(ϕ)δϕ] (B.14)
Denoting the lowest potential energy (crystalline state), ϕo, and the highest energy stable
packing state, ϕu, it is apparent that basin energies associated with all other stable packings lie
somewhere in the range of ϕo ≤ ϕα ≤ ϕu. The Configurational Partition function can thus be
expressed as an integral over inherint structure energies:
Q(T, V) = ∫ d
ϕu
ϕo
ϕΩ(ϕ)Q(ϕ, T, V)
= ∫ dϕu
ϕo
ϕexpβSc(ϕ)T exp−βϕ exp−βf(ϕ, T, V)
= ∫ dϕu
ϕo
ϕexp−β(−Sc(ϕ)T + ϕ + f(ϕ, T, V)
(B.15)
with the full Partition Function therefore being expressed as:
Z(N, T, V) =
1
N! λ3N∫ dϕu
ϕo
ϕexp−β(−Sc(ϕ)T + ϕ+ f(ϕ, T, V) (B.16)
and resulting in the probability of quenching to an inherent structure of energy, ϕ, at
temperature, T:
P(ϕ, T, V) =
exp−β(−Sc(ϕ)T + ϕ + f(ϕ, T, V)
Z(N, T, V)
(B.17)
As usual, the Helmholtz Free Energy, A, is given by:
A(N, T, V) = −kTlnZ(N, T, V) (B.18)
In the thermodynamic limit where N → ∞, this can be approximated to first order by taking a
maximum integrand approach [13-15], resulting in the final expression for the system free
energy:

101
A(T, V) ≈ ϕ_
−TSc(ϕ_
) + f(ϕ_
, T, V) (B.19)
where ϕ_
is the basin potential energy that maximizes the integrand, and can intuitively be
understood to represent the mean potential energy expected upon instantaneous quenching from
an equilibrium configuration randomly selected at temperature T [13]. Importantly, while the
above conclusions have been derived under the context of equilibrium statistical mechanics, the
same formulism can be applied to understand thermodynamic properties of the supercooled
liquid phase. In this respect, the supercooled liquid is viewed as existing in a state of metastable
equilibrium within the restricted domain of structurally amorphous inherent structures. In
summary, the thermodynamic stability of given phase can be seen to be decomposed into three
main components: namely, 1) the mean basin potential energy (or enthalpy), 2) the
configurational entropy which is given by the logarithm of the number of distinct accessible
basins, and 3) the mean intra-basin vibrational free energy, at the given temperature and
operating conditions.

102
Appendix C. Additional Information on Model Generation, Validation, and Reproducibility
The validity of the liquid and glass model generation methodology summarized in Section 3.2
largely hinges upon whether thermodynamic and physical properties are reproducible from run to
run, and whether time integration and temperature/pressure control parameters are appropriately
configured. In order to test these various factors, a number of runs were conducted testing the
sensitivity and stability of thermodynamic properties (system energies, enthalpies,
volumes/densities, etc.) for Cu-Zr, Ni-Al, and Zr-Cu-Ni-Al systems under various numbers of
atoms (ranging from 1000-10000 atoms), initial configurations (randomly permuted atoms in the
pre-melted crystal state) and velocities (various seeds for random sampling of the Maxwell-
Boltzmann velocity distribution), time-steps, melt times, and temperature/pressure damping
parameters for NVT/NPT thermostats.
Results of this analysis indicated that the stability and reproducibility of melt properties is well
insured beyond system sizes of ~5000 atoms. Structural, kinetic, and thermodynamic properties
were found to possess little to no dependencies below time-steps of ~2 femtoseconds and melt
times greater than ~2 million femtoseconds, with melt times conducted under these settings
being well in excess of underlying (structural, ethalpic, etc.) relaxation times of liquid alloy melts
in general. Under these conditions, choosing the standard condition for temperature damping
constants to be ~100 times the time-step, and pressure damping constants of ~1000 times the
time-step were found to be sufficient for insuring stable temperatures and pressures under
minimal fluctuations.

103
Appendix D. Summary of GFA Influences and Correlators
The main influencing factors governing GFA can broadly be categorized as being related to
either: 1) atomic mobility and transport, 2) chemical order and complexity, 3) topological order
and complexity, and 3) thermodynamics and energetics. Disordered phase correlators relevant to
each of these general factors are summarized in Table D.1 below.
Table D.1: Disordered phase correlators relevant to GFA prediction
Atomic Mobility
and Transport
Chemical Order
and Complexity
Topological Order
and Complexity
Thermodynamics
and Energetics
kinetic and
thermodynamic
fragility
number of elemental
components
free-volume /
packing-efficiency
Configurational /
mixing entropy
free-volume /
packing-efficiency
Configurational /
mixing entropy
icosahedral short-
range ordering
binary and total
enthalpies of mixing
atomic mobility
mismatch and
dynamic
decoupling
atomic-size
mismatch
(>12%)
tetrahedral close
packing
free energy of mixing
and partial de-mixing
dynamic
heterogeneity
short-range chemical
ordering (Warren-
Cowley parameter)
medium-range
chemical ordering and
entanglement
glass-glass / liquid-
liquid interface energy
dynamic-crossover
temperature and
stoke-Einstein
breakdown
medium-ranged
chemical ordering
and entanglement
medium-range
topological ordering
and connectivity
metastability with
respect to
compositional
fluctuations (Spinodal
decomposition)
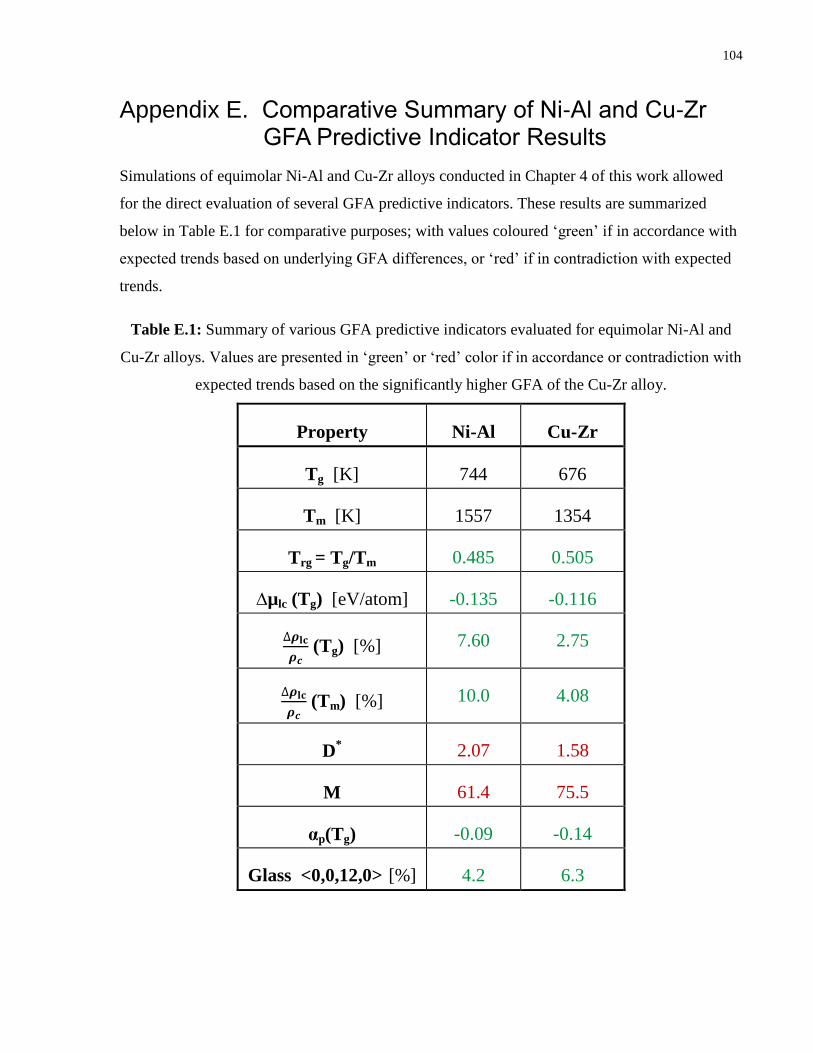
104
Appendix E. Comparative Summary of Ni-Al and Cu-Zr GFA Predictive Indicator Results
Simulations of equimolar Ni-Al and Cu-Zr alloys conducted in Chapter 4 of this work allowed
for the direct evaluation of several GFA predictive indicators. These results are summarized
below in Table E.1 for comparative purposes; with values coloured ‘green’ if in accordance with
expected trends based on underlying GFA differences, or ‘red’ if in contradiction with expected
trends.
Table E.1: Summary of various GFA predictive indicators evaluated for equimolar Ni-Al and
Cu-Zr alloys. Values are presented in ‘green’ or ‘red’ color if in accordance or contradiction with
expected trends based on the significantly higher GFA of the Cu-Zr alloy.
Property Ni-Al Cu-Zr
Tg [K] 744 676
Tm [K] 1557 1354
Trg = Tg/Tm 0.485 0.505
∆µlc (Tg) [eV/atom] -0.135 -0.116
∆𝝆𝐥𝐜
𝝆𝒄 (Tg) [%] 7.60 2.75
∆𝝆𝐥𝐜
𝝆𝒄 (Tm) [%] 10.0 4.08
D* 2.07 1.58
M 61.4 75.5
αp(Tg) -0.09 -0.14
Glass <0,0,12,0> [%] 4.2 6.3
Related Documents