December 2006 , published 8 , doi: 10.1098/rspa.2006.1746 462 2006 Proc. R. Soc. A G.P Potirniche, M.F Horstemeyer, P.M Gullett and B Jelinek dislocation structuring in FCC crystals Atomistic modelling of fatigue crack growth and References html#ref-list-1 http://rspa.royalsocietypublishing.org/content/462/2076/3707.full. This article cites 47 articles Email alerting service here the box at the top right-hand corner of the article or click Receive free email alerts when new articles cite this article - sign up in http://rspa.royalsocietypublishing.org/subscriptions go to: Proc. R. Soc. A To subscribe to on March 12, 2014 rspa.royalsocietypublishing.org Downloaded from on March 12, 2014 rspa.royalsocietypublishing.org Downloaded from

Welcome message from author
This document is posted to help you gain knowledge. Please leave a comment to let me know what you think about it! Share it to your friends and learn new things together.
Transcript
December 2006, published 8, doi: 10.1098/rspa.2006.1746462 2006 Proc. R. Soc. A
G.P Potirniche, M.F Horstemeyer, P.M Gullett and B Jelinek dislocation structuring in FCC crystalsAtomistic modelling of fatigue crack growth and
Referenceshtml#ref-list-1http://rspa.royalsocietypublishing.org/content/462/2076/3707.full.
This article cites 47 articles
Email alerting service herethe box at the top right-hand corner of the article or click Receive free email alerts when new articles cite this article - sign up in
http://rspa.royalsocietypublishing.org/subscriptions go to: Proc. R. Soc. ATo subscribe to
on March 12, 2014rspa.royalsocietypublishing.orgDownloaded from on March 12, 2014rspa.royalsocietypublishing.orgDownloaded from
on March 12, 2014rspa.royalsocietypublishing.orgDownloaded from
Atomistic modelling of fatigue crack growthand dislocation structuring in FCC crystals
BY G. P. POTIRNICHE1,*, M. F. HORSTEMEYER
1,2, P. M. GULLETT1,3
AND B. JELINEK1
1Center for Advanced Vehicular Systems, 2Department of MechanicalEngineering, and 3Department of Civil Engineering, Mississippi State
University, PO Box 5405, Mississippi State, MS 39762, USA
Fatigue damage in face-centred cubic crystals by dislocation substructuring and crackgrowthwas computationally simulated at the atomic scale. Single-crystal copper specimenswith approximately 200 000 atoms and an initial crack were subjected to fatigue loadingwith a constant strain amplitude of 3maxZ0.01 and a load ratio of RZ3min/3maxZ0.75.Cyclic plastic deformation around the crack tip is the main influencing factor for thepropagationmechanisms of nanocracks.Themain crack-propagationmechanisms occurredeither by void nucleation in the high-density region near the crack tip or by fatigue cleavageof the atomic bonds in the crack plane. Fatigue crack growth at grain boundaries was alsostudied. For high misorientation angle grain boundaries, the crack path deviated whilemoving from one grain to another. For low crystal misorientations, the crack did notexperience any significant out-of-plane deviation. For a large crystal misorientation, voidswere observed to nucleate at grain boundaries in front of the crack tip and link backwith themain crack. During fatigue loading, dislocation substructures were observed to developthroughout the atomic lattices. Fatigue crack growth rates for nanocracks were computedand compared with growth rates published in the literature for microstructurally smallcracks (micron range) and long cracks (millimetre range). The computed growth rates fornanocracks were comparable with those for small cracks at the same stress intensity rangesand they propagated below the threshold for long cracks.
Keywords: molecular dynamics; fatigue; FCC crystal; crack
*A
RecAcc
1. Introduction
The early stage of fatigue damage in face-centred cubic (FCC) metals ischaracterized by two interrelated phenomena, cyclic hardening and fatigue cracknucleation. Cyclic hardening in copper single crystals has been studied intenselyand attributed to the ease of dislocation nucleation (Mughrabi 1979a). Plasticstrain accumulation in fatigue occurs by cyclic motion inducing crystallographicslip in which dislocations may experience a permanent multiplication orannihilation. Cyclic loading at plastic strain ranges above 10K4 can lead to theformation of microstructures with two distinct regions in an FCC crystal, the
Proc. R. Soc. A (2006) 462, 3707–3731
doi:10.1098/rspa.2006.1746
Published online 5 July 2006
uthor for correspondence ([email protected]).
eived 6 March 2006epted 18 May 2006 3707 q 2006 The Royal Society
G. P. Potirniche and others3708
on March 12, 2014rspa.royalsocietypublishing.orgDownloaded from
matrix and persistent slip bands (PSBs). In the matrix, dislocations arrange them-selves in bundles or vein-like structures. Inside these vein structures, the density ofdislocations can vary from low- to high-density regions. The veins occupyapproximately 50% of the volume of the matrix, whereas in the PSBs, thedislocations are organized in cell walls, filling about 10%of the volume. In thePSBs,dislocations arrange themselves in ladder-like structures, with intense nucleationand annihilation of dislocations at the cell walls. PSBs are the most commonphenomena in fatigue of single crystals and represent the main cause of fatiguecrack nucleation. The existence of a plastic strain amplitude limit, below which thedissolution of vein structures and PSB formation occurs, is regarded as animportant element that defines the existence of fatigue crack thresholds (Campbell1976; Bhat & Laird 1978; Mughrabi 1979b). In copper single crystals, PSBs wereshown to be bulk phenomena (Mughrabi 1979a). However, in polycrystallinematerials, PSBs were observed only in surface grains (Mughrabi 1978), and thisadds importance to the study of PSBs at the nanoscale, especially in thin films.
Besides the plastic strain range, the crystal orientation plays a major role indetermining the particular type of structure that a single crystal will experienceat saturation. For single-slip orientations (Ackermann et al. 1984; Ma & Laird1988; Zhang et al. 2001; Kaneko & Hashimoto 2003), sharp PSB formationsembedded in a matrix of vein-like dislocation arrangements were observed.Orientations, such as [100] or [111], resulting in multiple slip exhibiteddislocation structures different from the single-slip orientations (Lepisto et al.1984; Kaneko & Hashimoto 2003). The [100] orientation produced a dislocationstructure called ‘labyrinth structure’ (Jin & Winter 1984), while the [111]orientation resulted in sinusoidal dislocation walls perpendicular to the loadingdirection (Lepisto et al. 1984; Kaneko & Hashimoto 2003).
The study of the cyclic behaviour of single crystals and the resultingdislocation structures are fundamental in explaining the fatigue resistance ofsingle crystals. This is especially true because dislocation structures are directlylinked to the crack nucleation phenomenon (Ackermann et al. 1984; Ma & Laird1988; Zhang et al. 2001).
Small microstructural stage I cracks nucleate on the leading edge of the interfacebetween the soft PSBs and the harder matrix material, parallel with the primaryslip plane. The slip offset at the interface between the PSBs and thematrix, and theannihilation of dislocations within the slip bands have been proposed as the leadingfactors in nucleating small fatigue cracks (Essmann et al. 1981). Other modelsconsider the impact of vacancy-type dipoles on surface stresses (Antonopoulouset al. 1976) and on internal stresses (Brown&Ogin 1985). Random slip in the PSBsleads to sites with preferentially larger slip offset and localization, creating a surfacestepwith amaximumheight, which iswhere crack nucleationwas observed to occur(Cheng & Laird 1981). PSBs were shown to have a saw-tooth profile and wereoriented approximately 20–308 with respect to the loading axis (Neumann &Tonnessen 1986).
Numerous accounts exist to sustain the idea of irregular crack propagation insingle crystals (Neumann 1969, 1974; Carlson & Koss 1978) with a highly non-planar fracture surface due to the frequently changing crack direction. Neumann(1969, 1974) indicated that the irregular nature of the fracture surface of cracksholds true except for one case, where the specimen was loaded in bending andoriented in the [100] family of planes.
Proc. R. Soc. A (2006)
3709Atomistic modelling in FCC crystals
on March 12, 2014rspa.royalsocietypublishing.orgDownloaded from
Fatigue crack growth modelling by the discrete dislocation method has beenperformed by Deshpande et al. (2002, 2003). The method has been applied to bothlong cracks in plane strain conditions and to small crack growth. In their model, theplastic deformation results from edge dislocation motion through the material.Nucleation and annihilation of dislocations are operative plasticity mechanisms atthe crack tip. In the case of long fatigue cracks, Deshpande et al. (2002) obtained acrack growth rate versus applied stress intensity factor range for both the thresholdandParis regimes.For the small fatigue cracks, they show that the fatigue thresholddecreaseswithdecreasing crack length, and they associate this phenomenonwith anincrease in the internal stress under cyclic loading (Deshpande et al. 2003).
To studymechanical properties at very small length-scales, such as the nanoscale,one needs to use a non-continuum modelling framework. During the past twodecades, atomistic models have employed molecular statics (MS), moleculardynamics (MD) or Monte Carlo (MC) methods. To analyse nanostructures anddislocation motion, MD integrates Hamilton’s equations of motion to describe theinstantaneous positions of a collection of atoms whose interaction is governed by acontinuous potential functional (Goldstein 1980). The continuous potential functiondescribes the total energy of a system from which the mechanical properties of amaterial can be derived.
The embedded atom method (EAM) potential was devised to solve practicalproblems in metals with many-body bonding properties (Daw&Baskes 1983; Dawet al. 1993). EAM treats each individual atom as an embedded particle in a hostaggregate composed of all the other atoms. The embedding energy contributes tothe total energy of the system through the local electrondensitywhere an individualatom is located. TheEAMtheory is based on local-density functional principles andits central idea is that the cohesive energy of a system can be described as the energyprovided by an atomic system during the embedding process of each constituentatom in that particular system, as given in the equation
E ZXi
Gi
Xjsi
raj ðRijÞ !
C1
2
Xi;jðisjÞ
UijðRijÞ; ð1:1Þ
whereG is the embedding energy, ra is the average electrondensity,Rij is the distancebetween the atoms i and j and U is the energy due to the electrostatic interactionbetween two atoms (Daw et al. 1993). As shown by equation (1.1), an importantassumption is that the embedding energy of any atom (which can be viewed as animpurity) is a function of the electron density of the host before the atom is added.The functionsGi andUij are calculated from experimental curve fitting of the latticeparameter, elastic constants and sublimation and vacancy formation energies(Daw & Baskes 1983).
An improvement to the EAM is the modified embedded atom method(MEAM) potential (Baskes 1992, 1997). In the MEAM, the electron density isgiven by two terms, the linear superposition of the electron densities from theneighbouring atoms and a correction term that takes into account the angularityof the atomic bonds correlated to the shear modulus (Baskes 1997). The specificform of the atom density function in the MEAM (Baskes 1992) is given by
rai ZXjsi
raðRijÞKaXjsi
ksi
ð1K3 cos2qjikÞraðRijÞraðRikÞ; ð1:2Þ
Proc. R. Soc. A (2006)
G. P. Potirniche and others3710
on March 12, 2014rspa.royalsocietypublishing.orgDownloaded from
where Rij is the distance between atoms i and j, a is the angularity parametercalculated by correlation with the shear modulus and qjik is the angle between theatoms i, j and k. The form in equation (1.2) was chosen to minimize thedistortional energy. The MEAM was shown by Baskes (1992) to work well formetals and for other types of materials (semiconductors and diatomic gases).
The study of mechanical properties of metals at the nanoscale is becoming animportant component of the multiscale-engineering endeavour. For example,copper nanocrystals are now being used in electronic applications for electricalinterconnections so their properties are currently being evaluated. Their lowelectrical resistance enables high-frequency communications and their highthermal conductivity allows good heat transfer between the components andsubstrates (Heino 2000). Thermal stresses induced in electronic packages cancause mechanical failure at interconnections. To characterize, several researchstudies reported that cyclic behaviour of copper at the submicron size differsfrom that of bulk copper single crystals (Read 1998; Schwaiger 2001; Kraft et al.2002; Schwaiger et al. 2003; Zhang et al. 2003). In bulk materials, cyclicbehaviour in thin films involves the formation of intrusions/extrusions, PSBs anddislocation walls and cell structures. However, recent studies suggest that thesize of extrusions and the presence of dislocation arrangements are clearlydependent on the film thickness (Schwaiger 2001).
A recent study by Farkas et al. (2005) investigated fatigue crack growthmechanisms in nanocrystalline nickel using computational atomistic methods.They concluded that the chief mechanism for crack advance is the nucleation ofnanovoids in front of the crack tip. Farkas et al. (2005) also quantified crack growthrates obtained from MD and MS as a function of the stress intensity factoramplitude during fatigue cycling. Fatigue simulations in a-Fe using MD have alsobeen performed by Nishimura & Miyazaki (2004). Their study concluded that inthe initial stage of fatigue loading, phase transformation and emission ofedge dislocations occurred at the crack tip. In addition, with the progress of fatiguecycles, dislocation pile-up at the grain boundary is observed. Vacancies areobserved to form in the near crack-tip region. The main crack propagationmechanism is by coalescence of cracks with the nanovoids and vacancies ahead ofthe crack tip.Chang&Fang (2003) have studied the cyclic stress versus the numberof cycles for nanoscale copper and obtained a fatigue limit at 105 cycles.
A previous study (Potirniche et al. 2005) by the authors showed the cyclicstress–strain curves and the total crack length versus the number of cycles at thenanoscale. In this paper, we plan to shed light on some of the properties thatgovern fatigue behaviour of nanocrystalline copper. Our goal is to betterunderstand nanoscale fatigue crack growth mechanisms and growth rates forcracks in single crystals and in the vicinity of a grain boundary. We shall alsoillustrate various dislocation structures arising from different crystallographicorientations that formed during cyclic loading.
2. Atomistic models setup
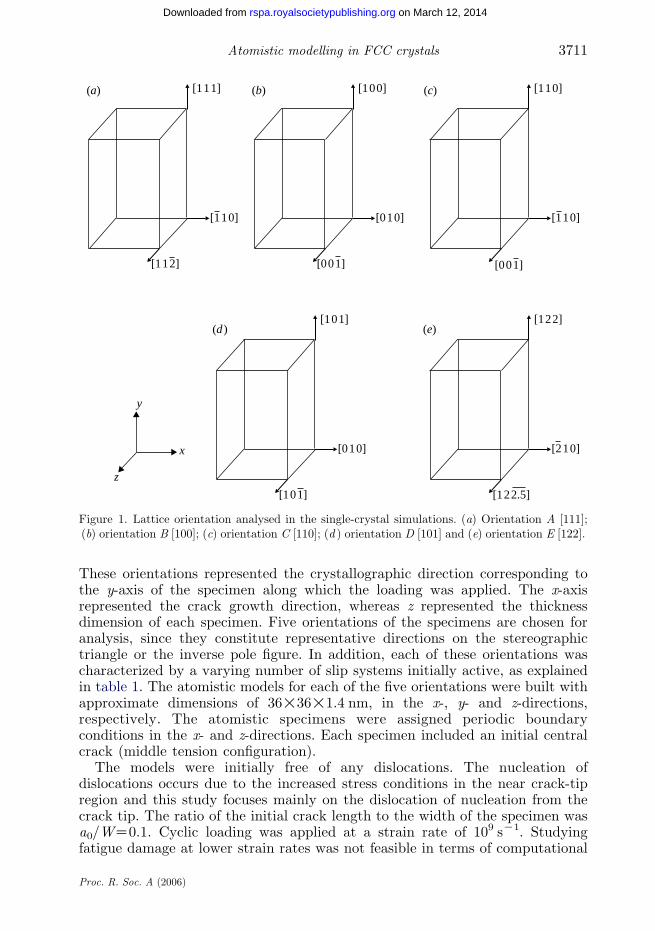
In order to study nanoscale fatigue crack growth in copper single crystals, fivespecimens with different crystal orientations were considered. These orien-tations, shown in figure 1, are [111], [100], [110], [101] and [122], respectively.
Proc. R. Soc. A (2006)
[110]
[111](a) (b) (c)
(d ) (e)
[112]
[010]
[100]
[001]
[110]
[110]
[001]
[010]x
y
z
[101]
[101]
[210]
[122]
[122.5]
Figure 1. Lattice orientation analysed in the single-crystal simulations. (a) Orientation A [111];(b) orientation B [100]; (c) orientation C [110]; (d ) orientation D [101] and (e) orientation E [122].
3711Atomistic modelling in FCC crystals
on March 12, 2014rspa.royalsocietypublishing.orgDownloaded from
These orientations represented the crystallographic direction corresponding tothe y-axis of the specimen along which the loading was applied. The x-axisrepresented the crack growth direction, whereas z represented the thicknessdimension of each specimen. Five orientations of the specimens are chosen foranalysis, since they constitute representative directions on the stereographictriangle or the inverse pole figure. In addition, each of these orientations wascharacterized by a varying number of slip systems initially active, as explainedin table 1. The atomistic models for each of the five orientations were built withapproximate dimensions of 36!36!1.4 nm, in the x-, y- and z-directions,respectively. The atomistic specimens were assigned periodic boundaryconditions in the x- and z-directions. Each specimen included an initial centralcrack (middle tension configuration).
The models were initially free of any dislocations. The nucleation ofdislocations occurs due to the increased stress conditions in the near crack-tipregion and this study focuses mainly on the dislocation of nucleation from thecrack tip. The ratio of the initial crack length to the width of the specimen wasa0/WZ0.1. Cyclic loading was applied at a strain rate of 109 sK1. Studyingfatigue damage at lower strain rates was not feasible in terms of computational
Proc. R. Soc. A (2006)
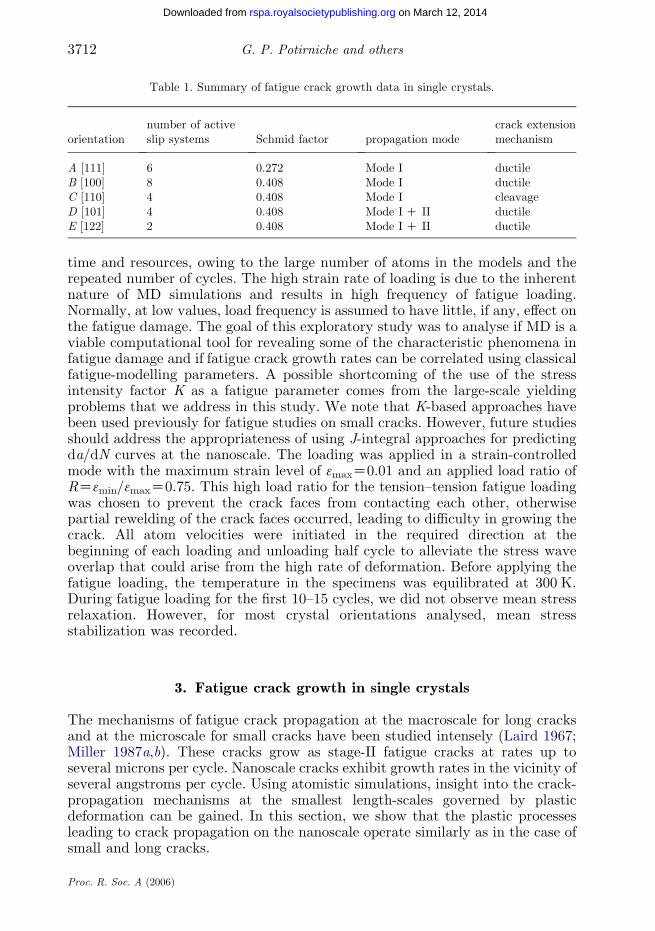
Table 1. Summary of fatigue crack growth data in single crystals.
orientationnumber of activeslip systems Schmid factor propagation mode
crack extensionmechanism
A [111] 6 0.272 Mode I ductileB [100] 8 0.408 Mode I ductileC [110] 4 0.408 Mode I cleavageD [101] 4 0.408 Mode IC II ductileE [122] 2 0.408 Mode IC II ductile
G. P. Potirniche and others3712
on March 12, 2014rspa.royalsocietypublishing.orgDownloaded from
time and resources, owing to the large number of atoms in the models and therepeated number of cycles. The high strain rate of loading is due to the inherentnature of MD simulations and results in high frequency of fatigue loading.Normally, at low values, load frequency is assumed to have little, if any, effect onthe fatigue damage. The goal of this exploratory study was to analyse if MD is aviable computational tool for revealing some of the characteristic phenomena infatigue damage and if fatigue crack growth rates can be correlated using classicalfatigue-modelling parameters. A possible shortcoming of the use of the stressintensity factor K as a fatigue parameter comes from the large-scale yieldingproblems that we address in this study. We note that K-based approaches havebeen used previously for fatigue studies on small cracks. However, future studiesshould address the appropriateness of using J-integral approaches for predictingda/dN curves at the nanoscale. The loading was applied in a strain-controlledmode with the maximum strain level of 3maxZ0.01 and an applied load ratio ofRZ3min/3maxZ0.75. This high load ratio for the tension–tension fatigue loadingwas chosen to prevent the crack faces from contacting each other, otherwisepartial rewelding of the crack faces occurred, leading to difficulty in growing thecrack. All atom velocities were initiated in the required direction at thebeginning of each loading and unloading half cycle to alleviate the stress waveoverlap that could arise from the high rate of deformation. Before applying thefatigue loading, the temperature in the specimens was equilibrated at 300 K.During fatigue loading for the first 10–15 cycles, we did not observe mean stressrelaxation. However, for most crystal orientations analysed, mean stressstabilization was recorded.
3. Fatigue crack growth in single crystals
The mechanisms of fatigue crack propagation at the macroscale for long cracksand at the microscale for small cracks have been studied intensely (Laird 1967;Miller 1987a,b). These cracks grow as stage-II fatigue cracks at rates up toseveral microns per cycle. Nanoscale cracks exhibit growth rates in the vicinity ofseveral angstroms per cycle. Using atomistic simulations, insight into the crack-propagation mechanisms at the smallest length-scales governed by plasticdeformation can be gained. In this section, we show that the plastic processesleading to crack propagation on the nanoscale operate similarly as in the case ofsmall and long cracks.
Proc. R. Soc. A (2006)
3713Atomistic modelling in FCC crystals
on March 12, 2014rspa.royalsocietypublishing.orgDownloaded from
Figures 2–6 show fatigue crack growth in the specimens indicated infigure 1a–e. These figures show contour plots of the plastic deformation aroundthe crack tip at various loading cycles for all five orientations considered. Inthese plots, we use the centrosymmetry parameter defined by Kelchner et al.(1998) to highlight the dislocations in the specimen. This parameter for eachatom is given by
P ZXi
jRi CRiC6j2; ð3:1Þ
where Ri and RiC6 are the vectors corresponding to the six pairs of nearestopposite neighbours in the FCC lattice. Thus, PZ0 in an undisturbed portionof the lattice and P becomes large near dislocations or free surfaces. Thecentrosymmetry parameter is a metric introduced to quantify nanoscale defects.For example, a vacancy represents a situation where only individual atoms aredisplaced from their original equilibrium position, while the surrounding latticeremains intact. A dislocation in the atomistic model represents a continuousline of atoms with modified centrosymmetry parameters.
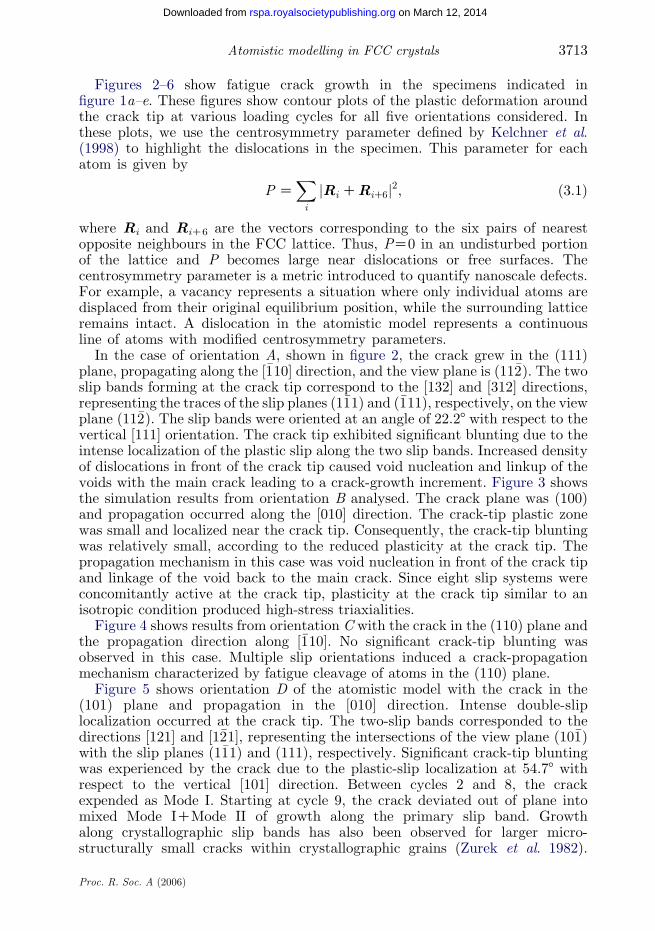
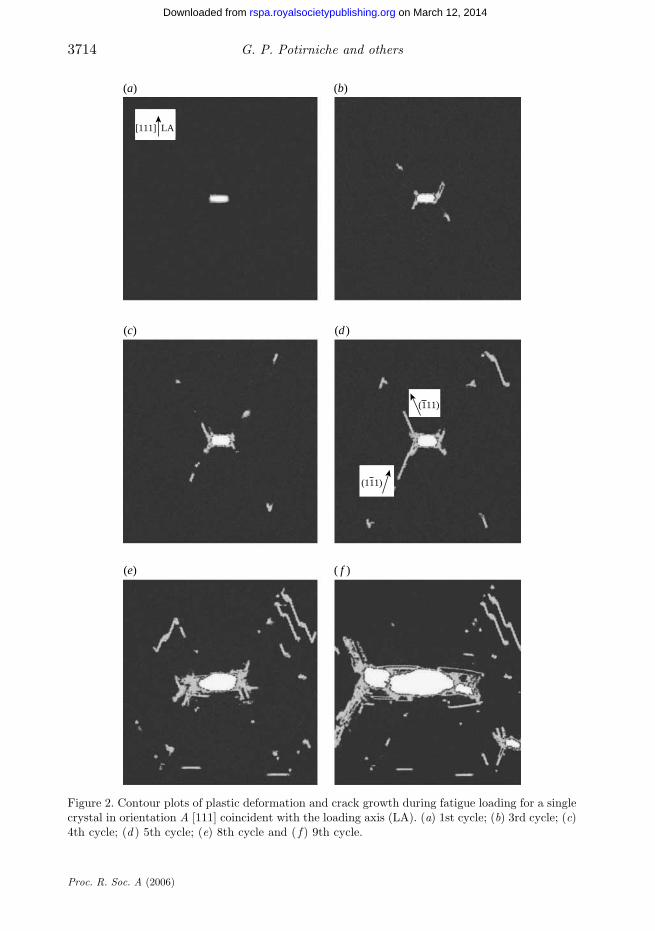
In the case of orientation A, shown in figure 2, the crack grew in the (111)plane, propagating along the ½�110� direction, and the view plane is ð11�2Þ. The twoslip bands forming at the crack tip correspond to the [132] and [312] directions,representing the traces of the slip planes ð1�11Þ and ð�111Þ, respectively, on the viewplane ð11�2Þ. The slip bands were oriented at an angle of 22.28 with respect to thevertical [111] orientation. The crack tip exhibited significant blunting due to theintense localization of the plastic slip along the two slip bands. Increased densityof dislocations in front of the crack tip caused void nucleation and linkup of thevoids with the main crack leading to a crack-growth increment. Figure 3 showsthe simulation results from orientation B analysed. The crack plane was (100)and propagation occurred along the [010] direction. The crack-tip plastic zonewas small and localized near the crack tip. Consequently, the crack-tip bluntingwas relatively small, according to the reduced plasticity at the crack tip. Thepropagation mechanism in this case was void nucleation in front of the crack tipand linkage of the void back to the main crack. Since eight slip systems wereconcomitantly active at the crack tip, plasticity at the crack tip similar to anisotropic condition produced high-stress triaxialities.
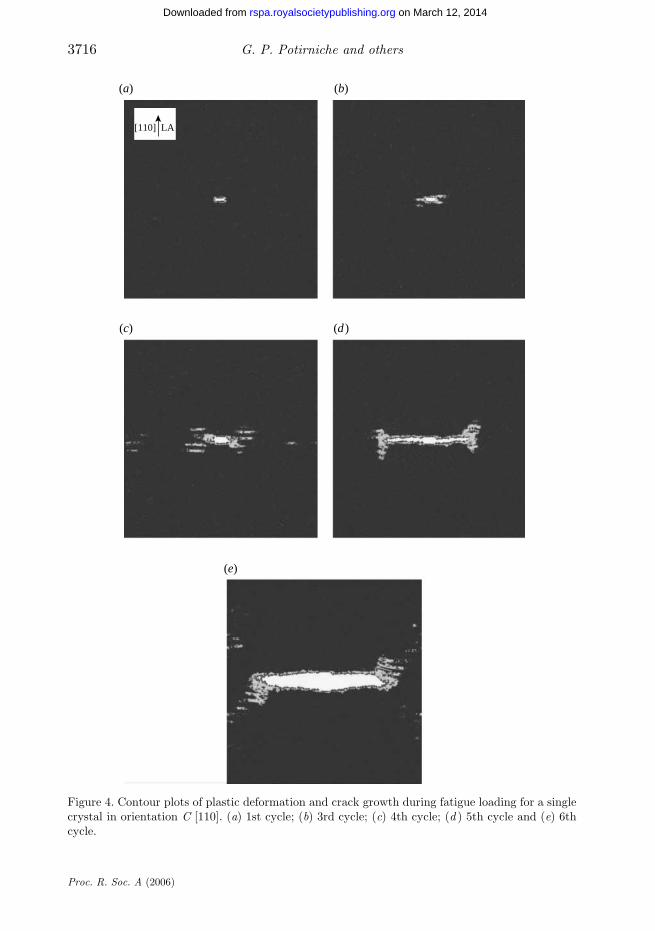
Figure 4 shows results from orientation C with the crack in the (110) plane andthe propagation direction along ½�110�. No significant crack-tip blunting wasobserved in this case. Multiple slip orientations induced a crack-propagationmechanism characterized by fatigue cleavage of atoms in the (110) plane.
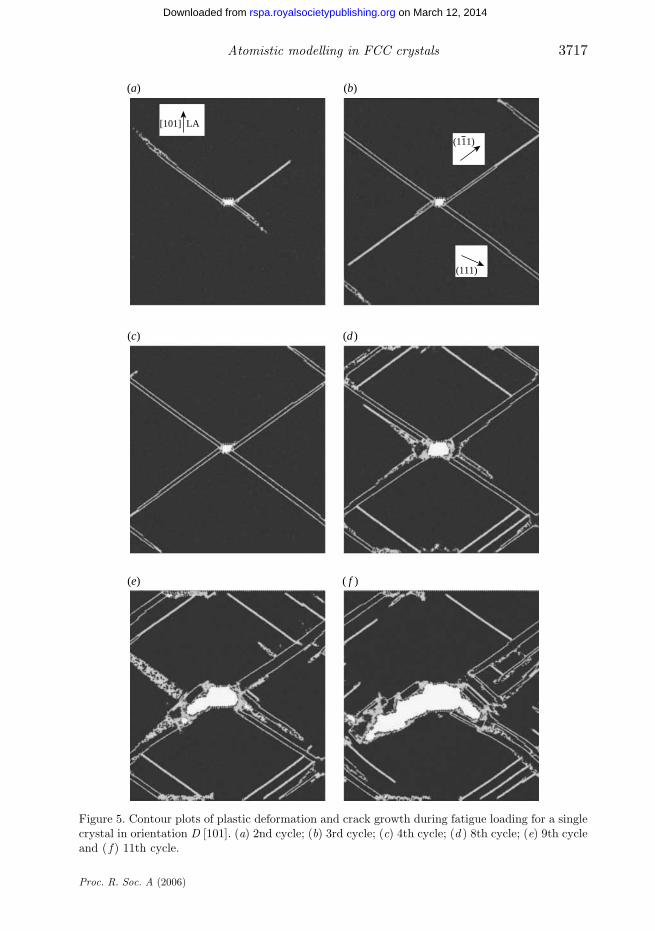
Figure 5 shows orientation D of the atomistic model with the crack in the(101) plane and propagation in the [010] direction. Intense double-sliplocalization occurred at the crack tip. The two-slip bands corresponded to thedirections [121] and ½1�21�, representing the intersections of the view plane ð10�1Þwith the slip planes ð1�11Þ and (111), respectively. Significant crack-tip bluntingwas experienced by the crack due to the plastic-slip localization at 54.78 withrespect to the vertical [101] direction. Between cycles 2 and 8, the crackexpended as Mode I. Starting at cycle 9, the crack deviated out of plane intomixed Mode ICMode II of growth along the primary slip band. Growthalong crystallographic slip bands has also been observed for larger micro-structurally small cracks within crystallographic grains (Zurek et al. 1982).
Proc. R. Soc. A (2006)
[111] LA
(111)
(111)
(a) (b)
(c) (d )
(e) ( f )
Figure 2. Contour plots of plastic deformation and crack growth during fatigue loading for a singlecrystal in orientation A [111] coincident with the loading axis (LA). (a) 1st cycle; (b) 3rd cycle; (c)4th cycle; (d ) 5th cycle; (e) 8th cycle and ( f ) 9th cycle.
G. P. Potirniche and others3714
Proc. R. Soc. A (2006)
on March 12, 2014rspa.royalsocietypublishing.orgDownloaded from
(a) (b)
[100] LA
(c)
Figure 3. Contour plots of plastic deformation and crack growth during fatigue loading for a singlecrystal in orientation B [100]. (a) 1st cycle; (b) 8th cycle and (c) 9th cycle.
3715Atomistic modelling in FCC crystals
on March 12, 2014rspa.royalsocietypublishing.orgDownloaded from
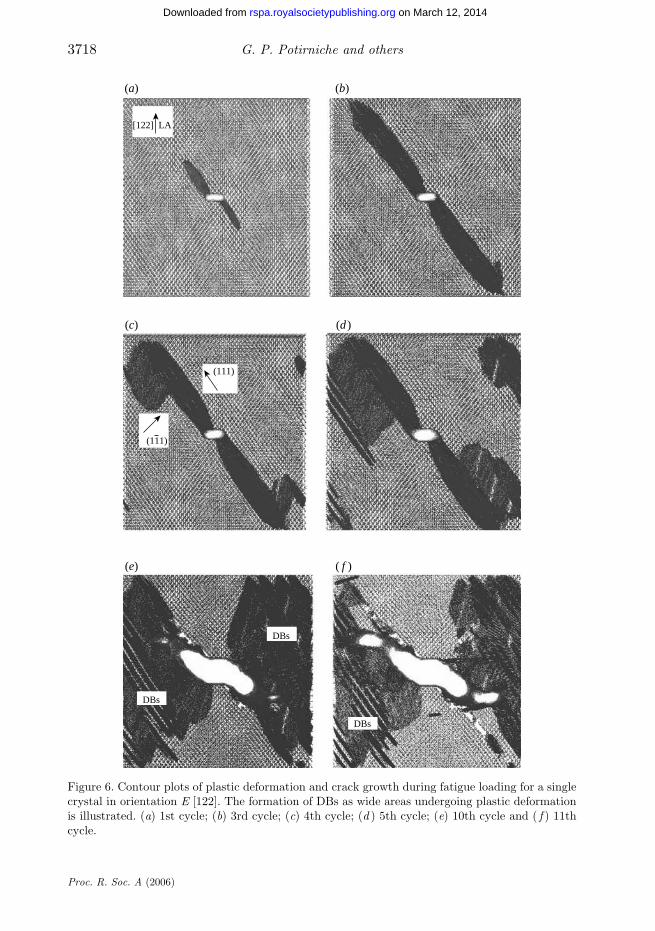
Orientation E results shown in figure 6 had a crack located in the (122) planepropagating in the ½�210� direction. A single slip band formed at the crack tipalong the primary slip direction [971], which is the trace of the (111) slip planewith the view plane ð122:5Þ. Plastic shear occurred along the secondary slipsystem in the [176] direction, which is the intersection between the ð1�11Þ slipand the view planes. The angle between the slip line [971] and the vertical axis[122] was geometrically calculated to be 43.28. Crack-tip blunting occurredsimilar to orientation D as shown in figure 1d. In addition, similar deviation ofthe crack was observed, from a Mode I growth to a mixed Mode ICMode IIgrowth along the primary slip band. Deformation bands (DBs) are observed tocover a wide area of the specimen with even distribution of dislocations, asopposed to the slip bands where the majority of plastic deformation is limitedto a narrow band. Usually, DBs are highly deformable regions extending overa large portion of the specimen surface and dominate the cyclic deformationin FCC single crystals (Buque 2001; Zhang et al. 2001). A summary of themain findings from the fatigue crack growth simulations in single crystals isshown in table 1.
Proc. R. Soc. A (2006)
[110] LA
(a) (b)
(c)
(e)
(d )
Figure 4. Contour plots of plastic deformation and crack growth during fatigue loading for a singlecrystal in orientation C [110]. (a) 1st cycle; (b) 3rd cycle; (c) 4th cycle; (d ) 5th cycle and (e) 6thcycle.
G. P. Potirniche and others3716
Proc. R. Soc. A (2006)
on March 12, 2014rspa.royalsocietypublishing.orgDownloaded from
(a) (b)
[101] LA
(111)
(111)
(c) (d )
(e) ( f )
Figure 5. Contour plots of plastic deformation and crack growth during fatigue loading for a singlecrystal in orientation D [101]. (a) 2nd cycle; (b) 3rd cycle; (c) 4th cycle; (d ) 8th cycle; (e) 9th cycleand ( f ) 11th cycle.
3717Atomistic modelling in FCC crystals
Proc. R. Soc. A (2006)
on March 12, 2014rspa.royalsocietypublishing.orgDownloaded from
[122] LA
(111)
DBs
DBs
DBs
(111)
(a) (b)
(c) (d )
(e) ( f )
Figure 6. Contour plots of plastic deformation and crack growth during fatigue loading for a singlecrystal in orientation E [122]. The formation of DBs as wide areas undergoing plastic deformationis illustrated. (a) 1st cycle; (b) 3rd cycle; (c) 4th cycle; (d ) 5th cycle; (e) 10th cycle and ( f ) 11thcycle.
G. P. Potirniche and others3718
Proc. R. Soc. A (2006)
on March 12, 2014rspa.royalsocietypublishing.orgDownloaded from
1×10⁻⁶
1×10⁻⁷
1×10⁻⁸
1×10⁻⁹
1×10⁻¹⁰
1×10–11
1×10–12
0.01 0.1 1 10 100
stress intensity factor range ∆K (MPa-m1/2)
crac
k gr
owth
rat
e da
/dN
(m
/cyc
le)
nanoscale cracks-[111]
small cracks-eappl =1.25 × 10⁻³ [47]small cracks-eappl = 4.5 × 10⁻⁴ [47]small cracks-eappl = 2 × 10⁻⁴ [47]small cracks-eappl= 7 × 10⁻⁵ [47]long cracks- Cu single crystal [46]long cracks- Cu polycrystal-120 µm [44]long cracks- Cu polycrystal-12 µm [44]long cracks- annealed Cu, R = 0.7 [44]long cracks- Quarter-Hard Cu, R = 0.7 [45]
nanoscale cracks-[100]nanoscale cracks-[110]nanoscale cracks-[101]nanoscale cracks-[122]
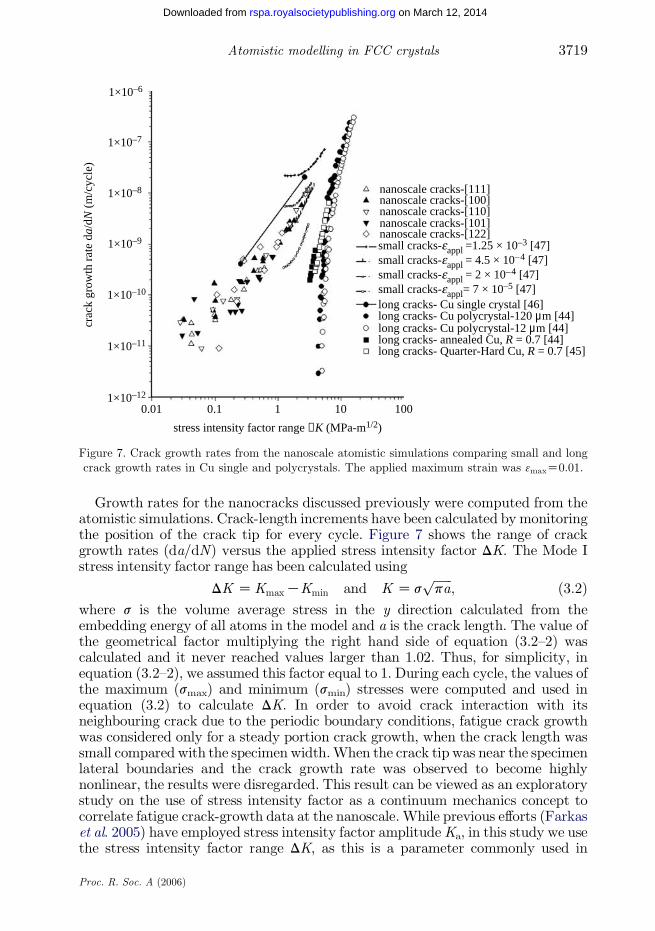
Figure 7. Crack growth rates from the nanoscale atomistic simulations comparing small and longcrack growth rates in Cu single and polycrystals. The applied maximum strain was 3maxZ0.01.
3719Atomistic modelling in FCC crystals
on March 12, 2014rspa.royalsocietypublishing.orgDownloaded from
Growth rates for the nanocracks discussed previously were computed from theatomistic simulations. Crack-length increments have been calculated by monitoringthe position of the crack tip for every cycle. Figure 7 shows the range of crackgrowth rates (da/dN) versus the applied stress intensity factor DK. The Mode Istress intensity factor range has been calculated using
DK ZKmaxKKmin and K Zsffiffiffiffiffiffipa
p; ð3:2Þ
where s is the volume average stress in the y direction calculated from theembedding energy of all atoms in the model and a is the crack length. The value ofthe geometrical factor multiplying the right hand side of equation (3.2–2) wascalculated and it never reached values larger than 1.02. Thus, for simplicity, inequation (3.2–2), we assumed this factor equal to 1. During each cycle, the values ofthe maximum (smax) and minimum (smin) stresses were computed and used inequation (3.2) to calculate DK. In order to avoid crack interaction with itsneighbouring crack due to the periodic boundary conditions, fatigue crack growthwas considered only for a steady portion crack growth, when the crack length wassmall compared with the specimen width.When the crack tip was near the specimenlateral boundaries and the crack growth rate was observed to become highlynonlinear, the results were disregarded. This result can be viewed as an exploratorystudy on the use of stress intensity factor as a continuum mechanics concept tocorrelate fatigue crack-growth data at the nanoscale. While previous efforts (Farkaset al. 2005) have employed stress intensity factor amplitudeKa, in this study we usethe stress intensity factor range DK, as this is a parameter commonly used in
Proc. R. Soc. A (2006)
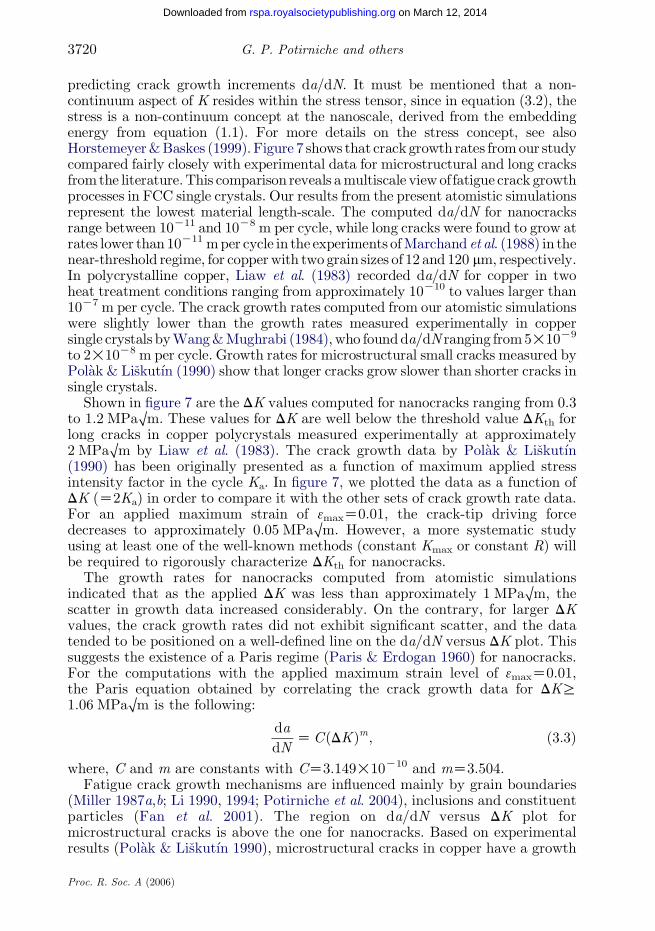
G. P. Potirniche and others3720
on March 12, 2014rspa.royalsocietypublishing.orgDownloaded from
predicting crack growth increments da/dN. It must be mentioned that a non-continuum aspect of K resides within the stress tensor, since in equation (3.2), thestress is a non-continuum concept at the nanoscale, derived from the embeddingenergy from equation (1.1). For more details on the stress concept, see alsoHorstemeyer&Baskes (1999). Figure 7 shows that crack growth rates fromour studycompared fairly closely with experimental data for microstructural and long cracksfromthe literature.This comparison reveals amultiscale view offatigue crack growthprocesses in FCC single crystals. Our results from the present atomistic simulationsrepresent the lowest material length-scale. The computed da/dN for nanocracksrange between 10K11 and 10K8 m per cycle, while long cracks were found to grow atrates lower than 10K11 mper cycle in the experiments ofMarchand et al. (1988) in thenear-threshold regime, for copperwith two grain sizes of 12 and 120 mm, respectively.In polycrystalline copper, Liaw et al. (1983) recorded da/dN for copper in twoheat treatment conditions ranging from approximately 10K10 to values larger than10K7 m per cycle. The crack growth rates computed from our atomistic simulationswere slightly lower than the growth rates measured experimentally in coppersingle crystals byWang&Mughrabi (1984),who foundda/dN ranging from5!10K9
to 2!10K8 m per cycle. Growth rates for microstructural small cracks measured byPolak & Liskutın (1990) show that longer cracks grow slower than shorter cracks insingle crystals.
Shown in figure 7 are the DK values computed for nanocracks ranging from 0.3to 1.2 MPaOm. These values for DK are well below the threshold value DKth forlong cracks in copper polycrystals measured experimentally at approximately2 MPaOm by Liaw et al. (1983). The crack growth data by Polak & Liskutın(1990) has been originally presented as a function of maximum applied stressintensity factor in the cycle Ka. In figure 7, we plotted the data as a function ofDK (Z2Ka) in order to compare it with the other sets of crack growth rate data.For an applied maximum strain of 3maxZ0.01, the crack-tip driving forcedecreases to approximately 0.05 MPaOm. However, a more systematic studyusing at least one of the well-known methods (constant Kmax or constant R) willbe required to rigorously characterize DKth for nanocracks.
The growth rates for nanocracks computed from atomistic simulationsindicated that as the applied DK was less than approximately 1 MPaOm, thescatter in growth data increased considerably. On the contrary, for larger DKvalues, the crack growth rates did not exhibit significant scatter, and the datatended to be positioned on a well-defined line on the da/dN versus DK plot. Thissuggests the existence of a Paris regime (Paris & Erdogan 1960) for nanocracks.For the computations with the applied maximum strain level of 3maxZ0.01,the Paris equation obtained by correlating the crack growth data for DKR1.06 MPaOm is the following:
da
dNZCðDKÞm; ð3:3Þ
where, C and m are constants with CZ3.149!10K10 and mZ3.504.Fatigue crack growth mechanisms are influenced mainly by grain boundaries
(Miller 1987a,b; Li 1990, 1994; Potirniche et al. 2004), inclusions and constituentparticles (Fan et al. 2001). The region on da/dN versus DK plot formicrostructural cracks is above the one for nanocracks. Based on experimentalresults (Polak & Liskutın 1990), microstructural cracks in copper have a growth
Proc. R. Soc. A (2006)
3721Atomistic modelling in FCC crystals
on March 12, 2014rspa.royalsocietypublishing.orgDownloaded from
rate between 5!10K10 and approximately 2!10K8 m per cycle for the sameapplied values of DK. The largest length-scale for fatigue cracks is represented bylong cracks, larger than 1 mm. For this type of crack, the only governingmechanism is the plastic deformation in the wake and at the crack tip. Thegrowth of long cracks is observed usually for DK values larger thanapproximately 2 MPaOm. As DK is increased, the crack growth of a long crackcan be represented by a Paris law type equation.
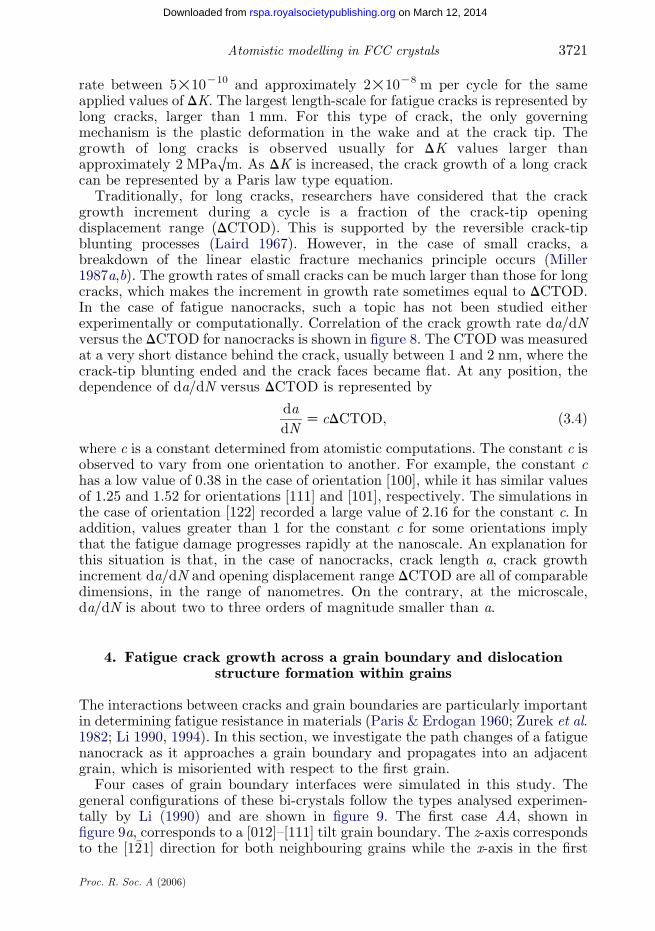
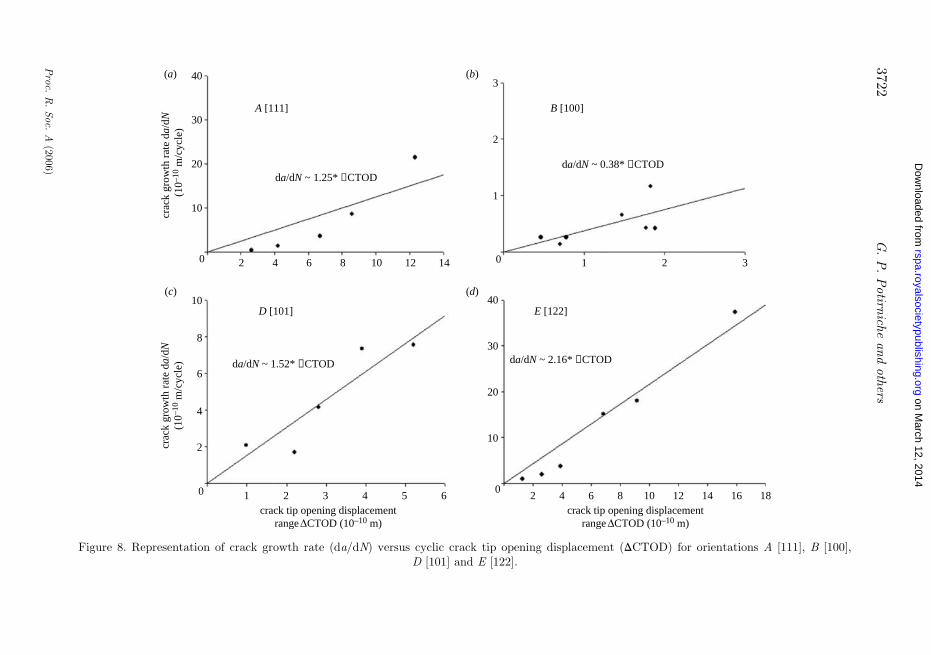
Traditionally, for long cracks, researchers have considered that the crackgrowth increment during a cycle is a fraction of the crack-tip openingdisplacement range (DCTOD). This is supported by the reversible crack-tipblunting processes (Laird 1967). However, in the case of small cracks, abreakdown of the linear elastic fracture mechanics principle occurs (Miller1987a,b). The growth rates of small cracks can be much larger than those for longcracks, which makes the increment in growth rate sometimes equal to DCTOD.In the case of fatigue nanocracks, such a topic has not been studied eitherexperimentally or computationally. Correlation of the crack growth rate da/dNversus the DCTOD for nanocracks is shown in figure 8. The CTOD was measuredat a very short distance behind the crack, usually between 1 and 2 nm, where thecrack-tip blunting ended and the crack faces became flat. At any position, thedependence of da/dN versus DCTOD is represented by
da
dNZ cDCTOD; ð3:4Þ
where c is a constant determined from atomistic computations. The constant c isobserved to vary from one orientation to another. For example, the constant chas a low value of 0.38 in the case of orientation [100], while it has similar valuesof 1.25 and 1.52 for orientations [111] and [101], respectively. The simulations inthe case of orientation [122] recorded a large value of 2.16 for the constant c. Inaddition, values greater than 1 for the constant c for some orientations implythat the fatigue damage progresses rapidly at the nanoscale. An explanation forthis situation is that, in the case of nanocracks, crack length a, crack growthincrement da/dN and opening displacement range DCTOD are all of comparabledimensions, in the range of nanometres. On the contrary, at the microscale,da/dN is about two to three orders of magnitude smaller than a.
4. Fatigue crack growth across a grain boundary and dislocationstructure formation within grains
The interactions between cracks and grain boundaries are particularly importantin determining fatigue resistance in materials (Paris & Erdogan 1960; Zurek et al.1982; Li 1990, 1994). In this section, we investigate the path changes of a fatiguenanocrack as it approaches a grain boundary and propagates into an adjacentgrain, which is misoriented with respect to the first grain.
Four cases of grain boundary interfaces were simulated in this study. Thegeneral configurations of these bi-crystals follow the types analysed experimen-tally by Li (1990) and are shown in figure 9. The first case AA, shown infigure 9a, corresponds to a [012]–[111] tilt grain boundary. The z-axis correspondsto the ½1�21� direction for both neighbouring grains while the x-axis in the first
Proc. R. Soc. A (2006)
40
A [111]
D [101] E [122]
B [100]
da/dN ~ 1.25* ∆CTOD
da/dN ~ 1.52* ∆CTOD da/dN ~ 2.16* ∆CTOD
da/dN ~ 0.38* ∆CTOD
30
20
10
0 2 4 6 8 10 12 14
crack tip opening displacementrange CTOD (10–10 m)
crack tip opening displacementrange CTOD (10–10 m)
crac
k gr
owth
rat
e da
/dN
(1
0–10
m/c
ycle
)cr
ack
grow
th r
ate
da/d
N(1
0–10
m/c
ycle
)
3
2
1
0 1 2 3
2
4
6
8
10
0 1 2 3 4 5 6
40
30
20
10
02 4 6 8 10 12 14 16 18
(a) (b)
(c) (d)
Figure 8. Representation of crack growth rate (da/dN) versus cyclic crack tip opening displacement (DCTOD) for orientations A [111], B [100],D [101] and E [122].
G.P.Potirn
icheandothers
3722
Proc.
R.Soc.
A(2006)
on March 12, 2014
rspa.royalsocietypublishing.orgD
ownloaded from
[101]
[111]
(111)
(111)
Y[012]
[521]
[121]
X
Z
[715]
[3 4 5]
[121]
(111)
[012]
[521]
(111)
[521][121]
(111)
[012]
[521]
(111)
[012]
[121]
[521]
[012]
[121]
(111)
[121]
[521]
[012]
(111)
(a) (b)
(c) (d)
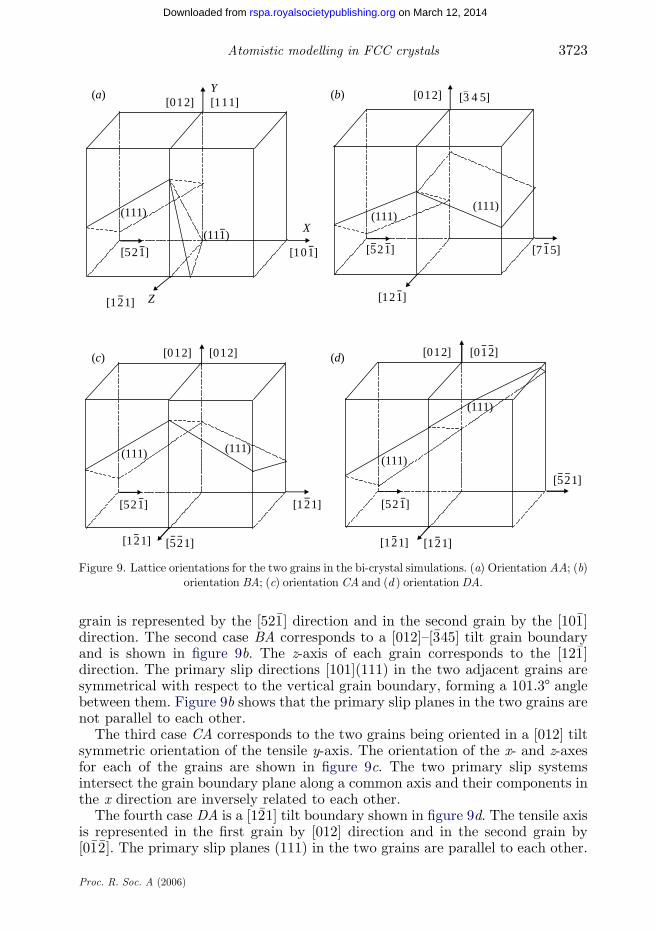
Figure 9. Lattice orientations for the two grains in the bi-crystal simulations. (a) Orientation AA; (b)orientation BA; (c) orientation CA and (d ) orientation DA.
3723Atomistic modelling in FCC crystals
on March 12, 2014rspa.royalsocietypublishing.orgDownloaded from
grain is represented by the ½52�1� direction and in the second grain by the ½10�1�direction. The second case BA corresponds to a [012]–½�345� tilt grain boundaryand is shown in figure 9b. The z-axis of each grain corresponds to the ½12�1�direction. The primary slip directions [101](111) in the two adjacent grains aresymmetrical with respect to the vertical grain boundary, forming a 101.38 anglebetween them. Figure 9b shows that the primary slip planes in the two grains arenot parallel to each other.
The third case CA corresponds to the two grains being oriented in a [012] tiltsymmetric orientation of the tensile y-axis. The orientation of the x- and z-axesfor each of the grains are shown in figure 9c. The two primary slip systemsintersect the grain boundary plane along a common axis and their components inthe x direction are inversely related to each other.
The fourth case DA is a ½1�21� tilt boundary shown in figure 9d. The tensile axisis represented in the first grain by [012] direction and in the second grain by½0�1�2�. The primary slip planes (111) in the two grains are parallel to each other.
Proc. R. Soc. A (2006)
grainboundary
grain 1 grain 2
(111)
(111)
veins
void nucleationgrain
substructures
(a) (b)
(c) (d)
(e) ( f )
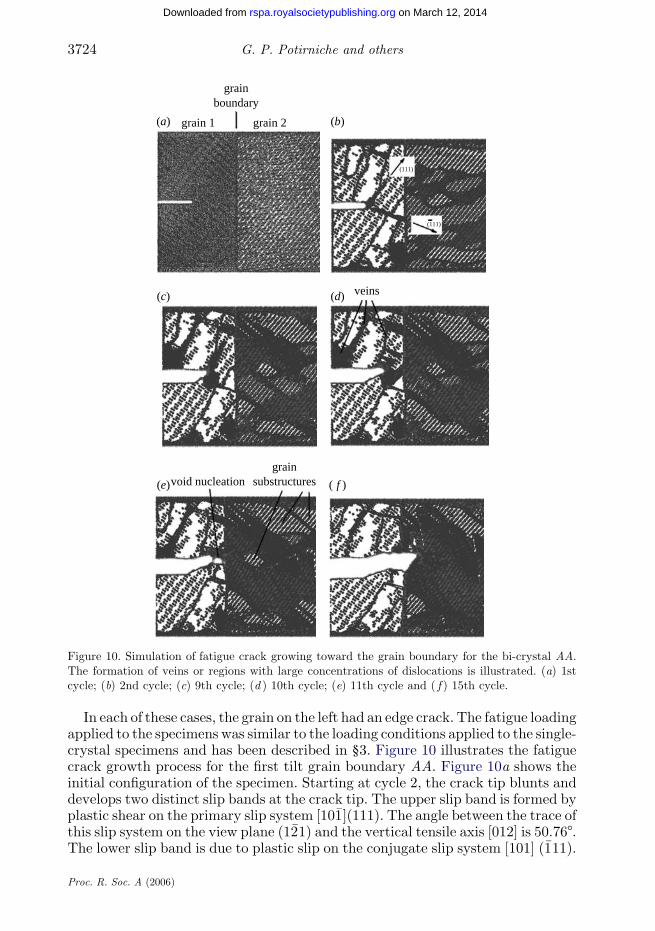
Figure 10. Simulation of fatigue crack growing toward the grain boundary for the bi-crystal AA.The formation of veins or regions with large concentrations of dislocations is illustrated. (a) 1stcycle; (b) 2nd cycle; (c) 9th cycle; (d ) 10th cycle; (e) 11th cycle and ( f ) 15th cycle.
G. P. Potirniche and others3724
on March 12, 2014rspa.royalsocietypublishing.orgDownloaded from
In each of these cases, the grain on the left had an edge crack. The fatigue loadingapplied to the specimens was similar to the loading conditions applied to the single-crystal specimens and has been described in §3. Figure 10 illustrates the fatiguecrack growth process for the first tilt grain boundary AA. Figure 10a shows theinitial configuration of the specimen. Starting at cycle 2, the crack tip blunts anddevelops two distinct slip bands at the crack tip. The upper slip band is formed byplastic shear on the primary slip system ½10�1�(111). The angle between the trace ofthis slip system on the view plane ð1�21Þ and the vertical tensile axis [012] is 50.768.The lower slip band is due to plastic slip on the conjugate slip system [101] ð�111Þ.
Proc. R. Soc. A (2006)
SBsvacancies
(111)
(111)
(a) (b)
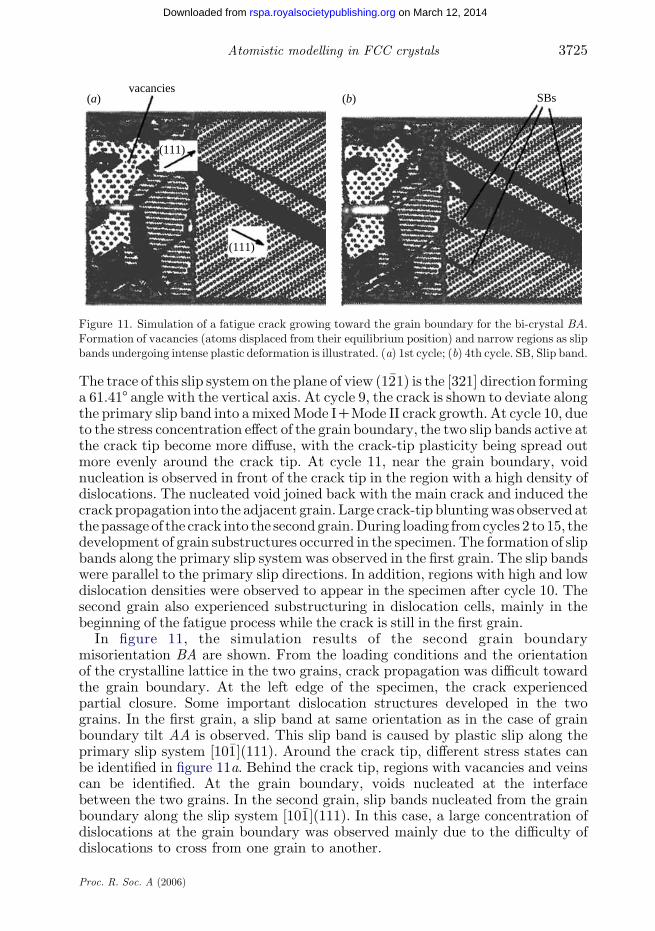
Figure 11. Simulation of a fatigue crack growing toward the grain boundary for the bi-crystal BA.Formation of vacancies (atoms displaced from their equilibrium position) and narrow regions as slipbands undergoing intense plastic deformation is illustrated. (a) 1st cycle; (b) 4th cycle. SB, Slip band.
3725Atomistic modelling in FCC crystals
on March 12, 2014rspa.royalsocietypublishing.orgDownloaded from
The trace of this slip system on the plane of view ð1�21Þ is the [321] direction forminga 61.418 angle with the vertical axis. At cycle 9, the crack is shown to deviate alongthe primary slip band into amixedMode ICMode II crack growth. At cycle 10, dueto the stress concentration effect of the grain boundary, the two slip bands active atthe crack tip become more diffuse, with the crack-tip plasticity being spread outmore evenly around the crack tip. At cycle 11, near the grain boundary, voidnucleation is observed in front of the crack tip in the region with a high density ofdislocations. The nucleated void joined back with the main crack and induced thecrack propagation into the adjacent grain. Large crack-tip bluntingwas observed atthepassage of the crack into the secondgrain.During loading fromcycles 2 to 15, thedevelopment of grain substructures occurred in the specimen. The formation of slipbands along the primary slip system was observed in the first grain. The slip bandswere parallel to the primary slip directions. In addition, regions with high and lowdislocation densities were observed to appear in the specimen after cycle 10. Thesecond grain also experienced substructuring in dislocation cells, mainly in thebeginning of the fatigue process while the crack is still in the first grain.
In figure 11, the simulation results of the second grain boundarymisorientation BA are shown. From the loading conditions and the orientationof the crystalline lattice in the two grains, crack propagation was difficult towardthe grain boundary. At the left edge of the specimen, the crack experiencedpartial closure. Some important dislocation structures developed in the twograins. In the first grain, a slip band at same orientation as in the case of grainboundary tilt AA is observed. This slip band is caused by plastic slip along theprimary slip system ½10�1�(111). Around the crack tip, different stress states canbe identified in figure 11a. Behind the crack tip, regions with vacancies and veinscan be identified. At the grain boundary, voids nucleated at the interfacebetween the two grains. In the second grain, slip bands nucleated from the grainboundary along the slip system ½10�1�(111). In this case, a large concentration ofdislocations at the grain boundary was observed mainly due to the difficulty ofdislocations to cross from one grain to another.
Proc. R. Soc. A (2006)
grainboundary
veins
SBs veins
(111)
(a) (b)
(c) (d )
(e) ( f )
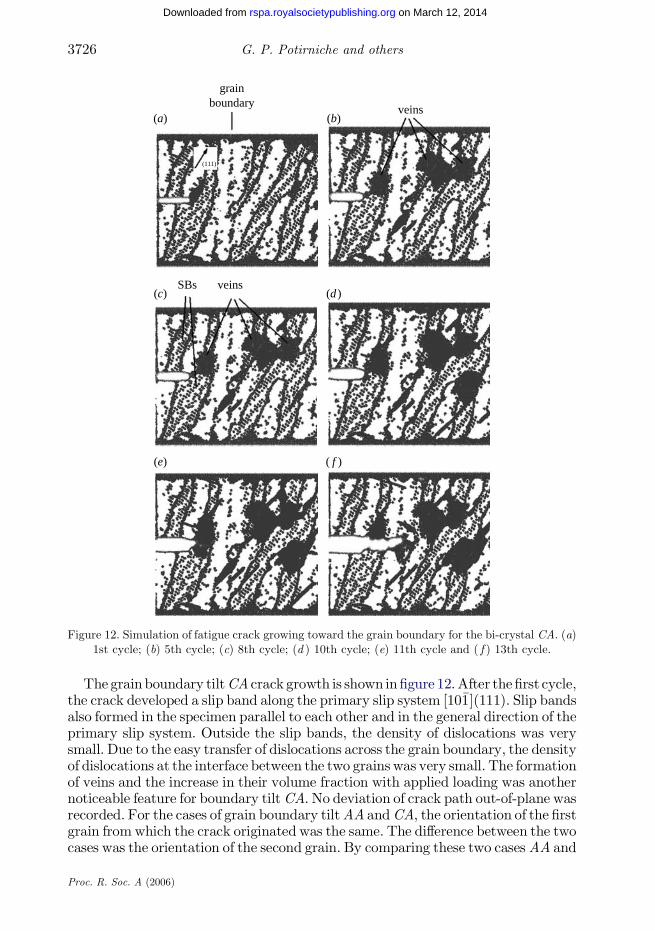
Figure 12. Simulation of fatigue crack growing toward the grain boundary for the bi-crystal CA. (a)1st cycle; (b) 5th cycle; (c) 8th cycle; (d ) 10th cycle; (e) 11th cycle and ( f ) 13th cycle.
G. P. Potirniche and others3726
on March 12, 2014rspa.royalsocietypublishing.orgDownloaded from
Thegrain boundary tiltCA crack growth is shown in figure 12.After the first cycle,the crack developed a slip band along the primary slip system ½10�1�(111). Slip bandsalso formed in the specimen parallel to each other and in the general direction of theprimary slip system. Outside the slip bands, the density of dislocations was verysmall. Due to the easy transfer of dislocations across the grain boundary, the densityof dislocations at the interface between the two grains was very small. The formationof veins and the increase in their volume fraction with applied loading was anothernoticeable feature for boundary tiltCA. No deviation of crack path out-of-plane wasrecorded. For the cases of grain boundary tiltAA andCA, the orientation of the firstgrain fromwhich the crack originated was the same. The difference between the twocases was the orientation of the second grain. By comparing these two casesAA and
Proc. R. Soc. A (2006)
gainboundary
(111)
(111)
(a) (b)
(c) (d )
(e) ( f )
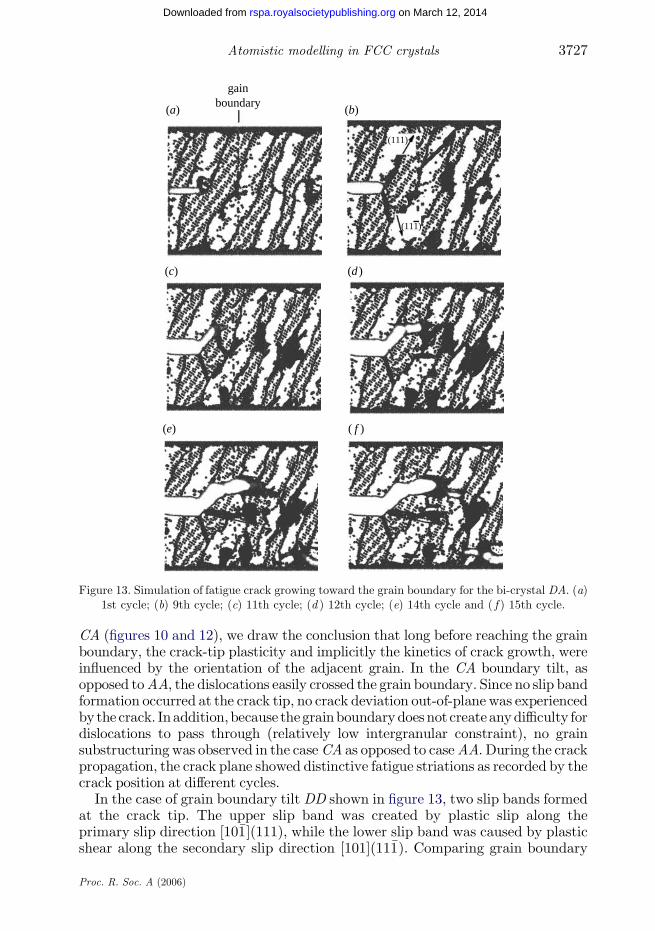
Figure 13. Simulation of fatigue crack growing toward the grain boundary for the bi-crystal DA. (a)1st cycle; (b) 9th cycle; (c) 11th cycle; (d ) 12th cycle; (e) 14th cycle and ( f ) 15th cycle.
3727Atomistic modelling in FCC crystals
on March 12, 2014rspa.royalsocietypublishing.orgDownloaded from
CA (figures 10 and 12), we draw the conclusion that long before reaching the grainboundary, the crack-tip plasticity and implicitly the kinetics of crack growth, wereinfluenced by the orientation of the adjacent grain. In the CA boundary tilt, asopposed toAA, the dislocations easily crossed the grain boundary. Since no slip bandformation occurred at the crack tip, no crack deviation out-of-plane was experiencedby the crack. Inaddition,because thegrainboundarydoesnot createanydifficulty fordislocations to pass through (relatively low intergranular constraint), no grainsubstructuringwas observed in the caseCA as opposed to caseAA. During the crackpropagation, the crack plane showed distinctive fatigue striations as recorded by thecrack position at different cycles.
In the case of grain boundary tilt DD shown in figure 13, two slip bands formedat the crack tip. The upper slip band was created by plastic slip along theprimary slip direction ½10�1�(111), while the lower slip band was caused by plasticshear along the secondary slip direction [101]ð11�1Þ. Comparing grain boundary
Proc. R. Soc. A (2006)
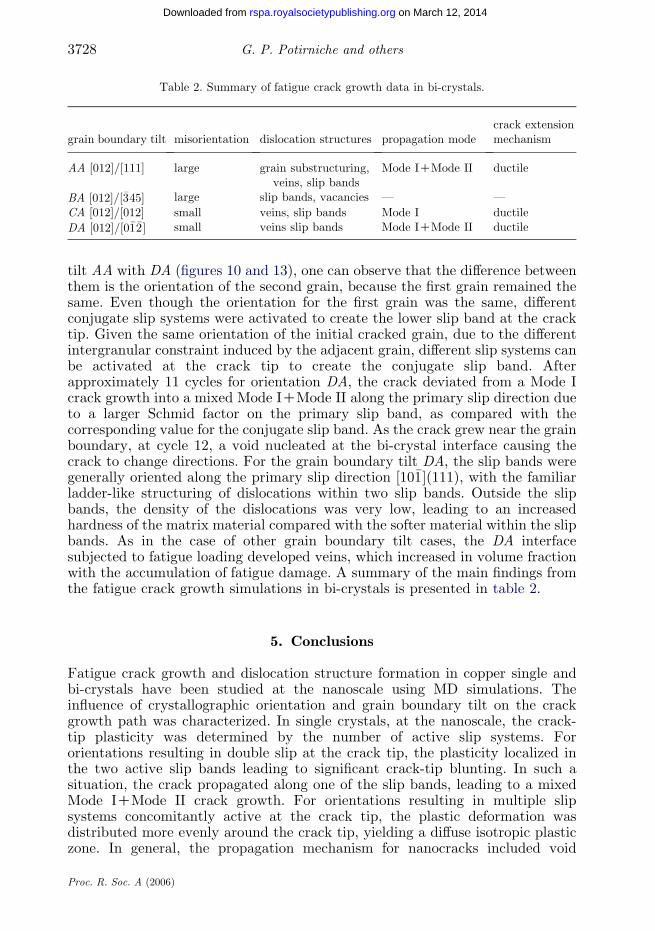
Table 2. Summary of fatigue crack growth data in bi-crystals.
grain boundary tilt misorientation dislocation structures propagation modecrack extensionmechanism
AA [012]/[111] large grain substructuring,veins, slip bands
Mode ICMode II ductile
BA [012]/½�345� large slip bands, vacancies — —
CA [012]/[012] small veins, slip bands Mode I ductile
DA [012]/½0�1�2� small veins slip bands Mode ICMode II ductile
G. P. Potirniche and others3728
on March 12, 2014rspa.royalsocietypublishing.orgDownloaded from
tilt AA with DA (figures 10 and 13), one can observe that the difference betweenthem is the orientation of the second grain, because the first grain remained thesame. Even though the orientation for the first grain was the same, differentconjugate slip systems were activated to create the lower slip band at the cracktip. Given the same orientation of the initial cracked grain, due to the differentintergranular constraint induced by the adjacent grain, different slip systems canbe activated at the crack tip to create the conjugate slip band. Afterapproximately 11 cycles for orientation DA, the crack deviated from a Mode Icrack growth into a mixed Mode ICMode II along the primary slip direction dueto a larger Schmid factor on the primary slip band, as compared with thecorresponding value for the conjugate slip band. As the crack grew near the grainboundary, at cycle 12, a void nucleated at the bi-crystal interface causing thecrack to change directions. For the grain boundary tilt DA, the slip bands weregenerally oriented along the primary slip direction ½10�1�(111), with the familiarladder-like structuring of dislocations within two slip bands. Outside the slipbands, the density of the dislocations was very low, leading to an increasedhardness of the matrix material compared with the softer material within the slipbands. As in the case of other grain boundary tilt cases, the DA interfacesubjected to fatigue loading developed veins, which increased in volume fractionwith the accumulation of fatigue damage. A summary of the main findings fromthe fatigue crack growth simulations in bi-crystals is presented in table 2.
5. Conclusions
Fatigue crack growth and dislocation structure formation in copper single andbi-crystals have been studied at the nanoscale using MD simulations. Theinfluence of crystallographic orientation and grain boundary tilt on the crackgrowth path was characterized. In single crystals, at the nanoscale, the crack-tip plasticity was determined by the number of active slip systems. Fororientations resulting in double slip at the crack tip, the plasticity localized inthe two active slip bands leading to significant crack-tip blunting. In such asituation, the crack propagated along one of the slip bands, leading to a mixedMode ICMode II crack growth. For orientations resulting in multiple slipsystems concomitantly active at the crack tip, the plastic deformation wasdistributed more evenly around the crack tip, yielding a diffuse isotropic plasticzone. In general, the propagation mechanism for nanocracks included void
Proc. R. Soc. A (2006)
3729Atomistic modelling in FCC crystals
on March 12, 2014rspa.royalsocietypublishing.orgDownloaded from
nucleation in the region near the crack tip with a high density of dislocationsand linkage of these voids back to the main crack. In other situations, crackpropagation mechanisms involved only fatigue cleavage of atomic bonds in thecrack plane leading to crack extension. The measured crack growth rates fornanocracks compared well with the growth rates for small and long cracks.Nanocracks were found to grow at DK values well below the generally acceptedthreshold for long cracks DKthZ2 MPaOm.
Analysis of crack growth at grain boundaries revealed that for highmisorientation angles, the crack path was deviated at the grain boundary. Forhigh misorientation angles between the active (111) planes, grain boundariesacted as barriers, which trapped dislocations. For no misorientation of the active(111) planes in the two grains, the dislocations easily crossed the grain boundary.In this case, the grain boundary became almost indistinctive from thesurrounding grains, the prevalent features being dislocation structures.
The atomistic simulations revealed the formation of different dislocationstructures, such as slip bands and vein structures, based on crystallographicorientation. In addition, vacancy formation was observed during fatiguesimulations. Due to the different stress regions created at the crack tip and theintergranular constraint between the two adjacent grains, we observed theformation of dislocation cells and walls. The atomistic simulations also clearlyrevealed that, according to different tilt angles of the grain boundaries, differentslip systems could be activated at the same time. In general, the nanocrackfollows the slip band path with the highest resolved shear stress. In the vicinity ofthe grain boundary, the crack growth mechanism was governed by the voidnucleation and slip band formation.
The authors wish to thank the Center for Advanced Vehicular Systems at Mississippi StateUniversity for funding this work.
References
Ackermann, F., Kubin, L. P., Lepinoux, J. & Mughrabi, H. 1984 Dependence of dislocationmicrostructure on plastic strain amplitude in cyclically strained copper single crystals. ActaMetall. 32, 715–725. (doi:10.1016/0001-6160(84)90145-7)
Antonopoulous, J. G., Brown, L. M. & Winter, A. T. 1976 Vacancy dipoles in fatigued copper.Philos. Mag. 34, 549–563.
Baskes, M. I. 1992 Modified embedded-atom potentials for cubic materials and impurities. Phys.Rev. B 46, 2727–2733. (doi:10.1103/PhysRevB.46.2727)
Baskes, M. I. 1997 Determination of modified embedded atom method parameters for nickel.Mater. Chem. Phys. 50, 152–158. (doi:10.1016/S0254-0584(97)80252-0)
Bhat, S. P. & Laird, C. 1978 Cyclic stress–strain curves in monocrystalline and polycrystallinemetals. Scripta Metall. 12, 687–692. (doi:10.1016/0036-9748(78)90308-3)
Brown, L. M. & Ogin, S. L. 1985 Role of internal stresses in the nucleation of fatigue cracks. InFundamentals of deformation and fracture (ed. B. A. Bilby, K. J. Miller & J. R. Willis),pp. 501–528. Cambridge, UK: Cambridge University Press.
Buque, C. 2001 Dislocation structures and cyclic behavior of [011] and ½11�1�-oriented nickel singlecrystals. Int. J. Fatigue 23, 671–678. (doi:10.1016/S0142-1123(01)00032-9)
Campbell, L. 1976 Fatigue limits in metals. Mater. Sci. Eng. 22, 231–236. (doi:10.1016/0025-5416(76)90159-2)
Carlson, J. A. & Koss, D. A. 1978 Fatigue fracture and slip processes in b.c.c. Ti–V alloy singlecrystals. Acta Metall. 26, 123–132. (doi:10.1016/0001-6160(78)90208-0)
Proc. R. Soc. A (2006)
G. P. Potirniche and others3730
on March 12, 2014rspa.royalsocietypublishing.orgDownloaded from
Chang, W.-J. & Fang, T.-H. 2003 Influence of temperature on tensile and fatigue behavior of
nanoscale copper using molecular dynamics simulation. J. Phys. Chem. Solids 64, 1279–1283.
(doi:10.1016/S0022-3697(03)00130-6)
Cheng, A. S. & Laird, C. 1981 Fatigue life behavior of copper single crystals. Part I: observations of
crack nucleation. Fatigue Eng. Mater. Struct. 4, 331–341.
Daw, M. S. & Baskes, M. I. 1983 Semiempirical, quantum, mechanical calculation of hydrogen
embrittlement in metals. Phys. Rev. Lett. 50, 1285–1288. (doi:10.1103/PhysRevLett.50.1285)
Daw, M. S., Foiles, S. M. & Baskes, M. I. 1993 The embedded-atom method: a review of theory and
applications. Mater. Sci. Rep. 9, 251–310. (doi:10.1016/0920-2307(93)90001-U)
Deshpande, V. S., Needleman, A. & Van der Giessen, E. 2002 Discrete dislocation modeling of
fatigue crack propagation. Acta Mater. 50, 831–846. (doi:10.1016/S1359-6454(01)00377-9)
Deshpande, V. S., Needleman, A. & Van der Giessen, E. 2003 Discrete dislocation plasticity
modeling of short cracks in single crystals. Acta Mater. 51, 1–15. (doi:10.1016/S1359-
6454(02)00401-9)
Essmann, U., Gosele, U. & Mughrabi, H. 1981 A model of extrusions and intrusions in fatigued
metals. I. Point-defect production and the growth of extrusions. Philos. Mag. A 44, 405–426.
Fan, J., McDowell, D. L., Horstemeyer, M. F. & Gall, K. 2001 Computational micromechanics
analysis of cyclic crack-tip behavior for microstructurally small cracks in dual-phase Al–Si
alloys. Eng. Fract. Mech. 68, 1687–1706. (doi:10.1016/S0013-7944(01)00064-9)
Farkas, D., Willemann, M. & Hyde, B. 2005 Atomistic mechanisms of fatigue in nanocrystalline
metals. Phys. Rev. Lett. 94, 165 502. (doi:10.1103/PhysRevLett.94.165502)
Goldstein, H. 1980 Classical mechanics, 2nd edn. Reading, MA: Addison-Wesley.
Heino, P. 2000 Strength of nanoscale copper under shear. J. Vac. Sci. Technol., Part A: Vacuum,
Surf. Films 18, 1202–1206. (doi:10.1116/1.582325)
Horstemeyer, M. F. & Baskes, M. I. 1999 Atomistic finite deformation simulations: a discussion on
length scale effects in relation to mechanical stresses. Trans. ASME 121, 114–119.
Jin, N. Y. & Winter, A. T. 1984 Dislocation structures in cyclically deformed [001] copper crystals.
Acta Metall. 32, 1173–1176. (doi:10.1016/0001-6160(84)90123-8)
Kaneko, Y. & Hashimoto, S. 2003 Observation of dislocation structures of fatigued metallic
materials by scanning electron microscopy. JEOL News 38, 20–23.
Kraft, O., Wellner, P., Hommel, M., Schwaiger, R. & Arzt, E. 2002 Fatigue behavior of
polycrystalline thin copper films. Mater. Res. Adv. Tech. 93, 392–400.
Kelchner, C. L., Plimpton, S. J. & Hamilton, J. C. 1998 Dislocation nucleation and defect structure
during surface indentation. Phys. Rev. B 58, 11 085–11 088. (doi:10.1103/PhysRevB.58.11085)
Laird, C. 1967 The influence of metallurgical structure on the mechanisms of fatigue crack
propagation. Fatigue crack propagation, vol. STP 415, pp. 131–168. Philadelphia, PA: ASTM.
Lepisto, T., Kuokkala, V.-T. & Kettunen, P. 1984 The PSB structure in multiple-slip oriented
copper single crystals. Scripta Metall. 18, 245–248. (doi:10.1016/0036-9748(84)90516-7)
Li, C. 1990 On the interaction among stage I short crack, slip band and grain boundary: a FEM
analysis. Int. J. Fract. 43, 227–239. (doi:10.1007/BF00018344)
Li, C. 1994 On crystallographic crack transfer across interfaces in four types of aluminum bicrystal.
Mater. Sci. Eng. A183, 23–30.
Liaw, P. K., Leax, T. R. & Logsdon, W. A. 1983 Near-threshold fatigue crack growth behavior in
metals. Acta Metall. 31, 1581–1587. (doi:10.1016/0001-6160(83)90155-4)
Ma, B.-T. & Laird, C. 1988 Dislocation structures of copper single crystals for fatigue tests under
variable amplitudes. Mater. Sci. Eng. 102, 247–258. (doi:10.1016/0025-5416(88)90580-0)
Marchand, N. J., Bailon, J.-P. & Dickson, J. I. 1988 Near-threshold fatigue crack growth in copper
and alpha-brass: grain-size and environmental effects. Metall. Trans. A 19A, 2575–2587.
Miller, K. J. 1987a The behavior of short fatigue cracks and their initiation Part I-a review of two
recent books. Fatigue Fract. Eng. Mater. Struct. 10, 75–91.
Miller, K. J. 1987b The behavior of short fatigue cracks and their initiation Part II-a general
summary. Fatigue Fract. Eng. Mater. Struct. 10, 93–113.
Proc. R. Soc. A (2006)

3731Atomistic modelling in FCC crystals
on March 12, 2014rspa.royalsocietypublishing.orgDownloaded from
Mughrabi, H. 1978 The cyclic hardening and saturation behavior of copper single crystals. Mater.Sci. Eng. 33, 207–223. (doi:10.1016/0025-5416(78)90174-X)
Mughrabi, H., 1979a Microscopic mechanisms of metal fatigue. In Strength of metals and alloys (ed.Haasen, P., Gerold, V. & Kostorz, G.). Proc. 5th Int. conf., Aachen, Federal Republic ofGermany, pp. 1615–1638. Oxford, UK: Pergamon Press.
Mughrabi, H. 1979b Plateaus in the cyclic stress–strain curves of single- and polycrystalline metals.Scripta Metall. 13, 479–484. (doi:10.1016/0036-9748(79)90073-5)
Neumann, P. 1969 Coarse slip model of fatigue. Acta Metall. 17, 1219–1225. (doi:10.1016/0001-6160(69)90099-6)
Neumann, P. 1974 New experiments concerning the slip processes at propagating fatigue cracks.Acta Metall. 22, 1155–1165. (doi:10.1016/0001-6160(74)90071-6)
Neumann, P. & Tonnessen, A. 1986 Fatigue crack formation in copper. Metall. Soc. AIME, 41–47.Nishimura, K. & Miyazaki, N. 2004 Molecular dynamics simulation of crack growth under cyclic
loading. Comput. Mater. Sci. 31, 269–278.Paris, P. C. & Erdogan, F. 1960 A critical analysis of crack propagation laws. J. Basic Eng. 85,
528–534.Polak, J. & Liskutın, P. 1990 Nucleation and short crack growth in fatigued polycrystalline copper.
Fatigue Fract. Eng. Mater. Struct. 13, 119–133.Potirniche, G. P., Daniewicz, S. R. & Newman Jr, J. C. 2004 Simulating small crack growth
behavior using crystal plasticity theory and finite element analysis. Fatigue Fract. Eng. Mater.Struct. 27, 59–71. (doi:10.1111/j.1460-2695.2004.00720.x)
Potirniche, G. P., Horstemeyer, M. F., Jelinek, B. & Wagner, G. J. 2005 Fatigue damage in nickeland copper nanocrystals. Int. J. Fatigue 27, 1179–1185. (doi:10.1016/j.ijfatigue.2005.06.015)
Read, D. T. 1998 Tension–tension fatigue of copper thin films. Int. J. Fatigue 20, 203–209. (doi:10.1016/S0142-1123(97)00080-7)
Schwaiger, R. 2001 Fatigue behavior of sub-micron silver and copper films. Ph.D. dissertation,Sttutgart University, December.
Schwaiger, R., Dehm, G. & Kraft, O. 2003 Cyclic deformation of polycrystalline Cu films. Philos.Mag. 83, 693–710. (doi:10.1080/0141861021000056690)
Wang, R. & Mughrabi, H. 1984 Fatigue of copper single crystals in vacuum and in air: II—fatiguecrack propagation. Mater. Sci. Eng. 65, 235–243. (doi:10.1016/0025-5416(84)90085-5)
Zhang, Z. F., Wang, Z. G. & Sun, Z. M. 2001 Evolution and microstructural characteristics ofdeformation bands in fatigued copper single crystals. Acta Mater. 49, 2875–2886. (doi:10.1016/S1359-6454(01)00219-1)
Zhang, G. P., Schwaiger, R., Volkert, C. A. & Kraft, O. 2003 Effect of film thickness and grain sizeon fatigue-induced dislocation structures in Cu thin films. Philos. Mag. Lett. 83, 477–483.(doi:10.1080/0950083031000151383)
Zurek, A. K., James, M. R. & Morris, W. L. 1982 The effect of grain size on fatigue growth of shortcracks. Metall. Mater. Trans. 14A, 1697–1705.
Proc. R. Soc. A (2006)
Related Documents