Atomic Emission Atomic Emission Spectroscopy Spectroscopy Yongsik Lee Yongsik Lee May 14, 2004 May 14, 2004

Welcome message from author
This document is posted to help you gain knowledge. Please leave a comment to let me know what you think about it! Share it to your friends and learn new things together.
Transcript

Atomic Emission Atomic Emission SpectroscopySpectroscopy
Yongsik LeeYongsik Lee
May 14, 2004May 14, 2004
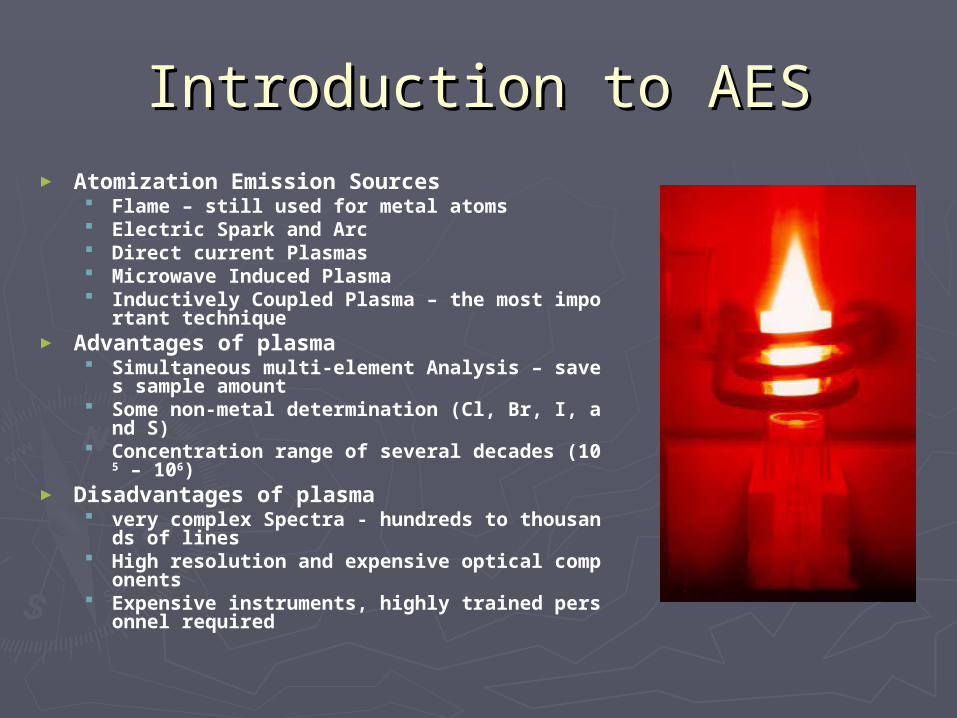
Introduction to AESIntroduction to AES► Atomization Emission Sources
Flame – still used for metal atoms Electric Spark and Arc Direct current Plasmas Microwave Induced Plasma Inductively Coupled Plasma – the most important te
chnique► Advantages of plasma
Simultaneous multi-element Analysis – saves sample amount
Some non-metal determination (Cl, Br, I, and S) Concentration range of several decades (105 – 106)
► Disadvantages of plasma very complex Spectra - hundreds to thousands of lin
es High resolution and expensive optical components Expensive instruments, highly trained personnel req
uired

10A Plasam Source AES10A Plasam Source AES
►Plasma an electrically conducting gaseous mixture conta
ining significant concentrations of cations and electrons.
►Three main types Inductively Coupled Plasma (ICP) Direct Current Plasma (DCP) Microwave Induced Plasma (MIP)

ICP► Inductively Coupled Plasma (ICP)
Plasma generated in a device called a Torch
Torch up to 1" diameter Ar cools outer tube, defines plasma shape Rapid tangential flow of argon cools outer q
uartz and centers plasma Rate of Argon Consumption 5 - 20 L/Min Radio frequency (RF) generator 27 or 41 M
Hz up to 2 kW Telsa coil produces initiation spark
► Ions and e- interact with magnetic field and begin to flow in a circular motion.
► Resistance to movement (collisions of e- and cations with ambient gas) leads to ohmic heating.
► Sample introduction is analogous to atomic absorption.

Sample introductionSample introduction
►NebulizerNebulizer►Electrothermal vaporizerElectrothermal vaporizer
►Table 8-2 methods of sample introductonTable 8-2 methods of sample introducton

Nebulizer
► convert solution to fine spray or aerosol
►Ultrasonic nebulizer uses ultrasound waves t
o "boil" solution flowing across disc
► Pneumatic nebulizer uses high pressure gas
to entrain solution

Electro-thermal vaporizer Electro-thermal vaporizer ETVETV
► Electrothermal vaporizer (ETV) electric current rapidly h
eats crucible containing sample
sample carried to atomizer by gas (Ar, He)
only for introduction, not atomization

Plasma structurePlasma structure
►Brilliant white core Ar continuum and lines
► Flame-like tail up to 2 cm
► Transparent region where measurements are m
ade (no continuum)

Plasma Plasma characteristics
► Hotter than flame (10,000 K) - more complete atomization/ excitation
► Atomized in "inert" atmosphere► Ionization interference small due to
high density of e- ► Sample atoms reside in plasma for
~2 msec and► Plasma chemically inert, little oxide
formation► Temperature profile quite stable an
d uniform.

DC plasmaDC plasma
► First reported in 1920s► DC current (10-15 A) flows
between C anodes and W cathode
► Plasma core at 10,000 K, viewing region at ~5,000 K
► Simpler, less Ar than ICP - less expensive
► Less sensitive than ICP► Should replace the carbon
anodes in several hours

Atomic Emission Spectrometer
► May be >1,000 visible lines (<1 Å) on continuum► Need
higher resolution (<0.1 Å) higher throughput low stray light wide dynamic range (>1,000,000) precise and accurate wavelength calibration/intensities stability computer controlled
► Three instrument types: sequential (scanning and slew-scanning) Multichannel - Measure intensities of a large number of elements (5
0-60) simultaneously Fourier transform FT-AES

Desirable properties of an AE Desirable properties of an AE spectrometerspectrometer

Sequential vs. multichannelSequential vs. multichannel► Sequential instrument
PMT moved behind aperture plate, or grating + prism moved to focus new l on exit slit Pre-configured exit slits to detect up to 20 lines, slew scan
► characteristics Cheaper Slower
► Multichannel instrument Polychromators (not monochromator) - multiple PMT's Array-based system
► charge-injection device/charge coupled device► characteristics
Expensive ( > $80,000) Faster

Sequential vs. multichannelSequential vs. multichannel
Sequential monochromatorSequential monochromator
►Slew-scan spectrometers even with many lines, much spectrum contains n
o information rapidly scanned (slewed) across blank regions (b
etween atomic emission lines)►From 165 nm to 800 nm in 20 msec
slowly scanned across lines►0.01 to 0.001 nm increment
computer control/pre-selected lines to scan

Slew scan spectrometerSlew scan spectrometer
► Two slew-scan Two slew-scan gratingsgratings
► Two PMTs for Two PMTs for VIS and UVVIS and UV
►Most use holographic grating

Scanning echelle spectrometerScanning echelle spectrometer► PMT is moved to monitor signal from slotted aperture.
About 300 photo-etched slits 1 second for moving one slit
► Can be used as multi channel spectrometer► Mostly with DC plasma source
AES instrument typesAES instrument types
►Three instrument types: sequential (scanning and slew-scanning) Multichannel - Measure intensities of a large nu
mber of elements (50-60) simultaneously Fourier transform FT-AES

Multichannel polychromator AESMultichannel polychromator AES
• Rowland circle• Quantitative det. 20 more elementsWithin 5 minutes
In 10 minutes

Applications of AES
► AES relatively insensitive small excited state population at moderate temperature
► AAS still used more than AES less expensive/less complex instrumentation lower operating costs greater precision
► In practice ~60 elements detectable 10 ppb range most metals Li, K, Rb, Cs strongest lines in IR Large # of lines, increase chance of overlap
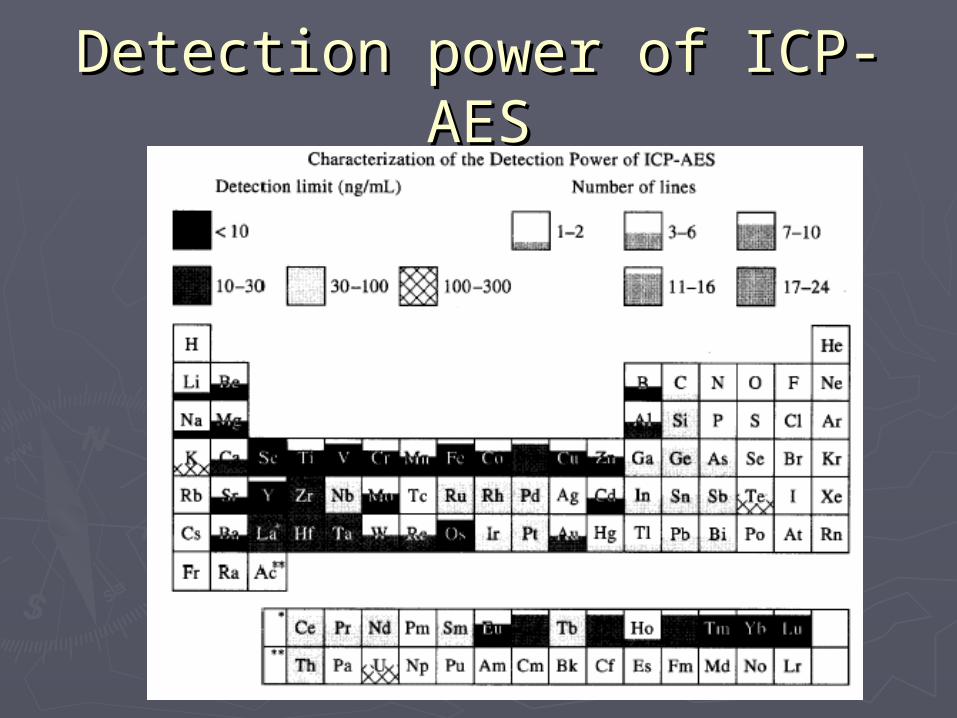
Detection power of ICP-AESDetection power of ICP-AES

ICP/OES INTERFERENCES► Spectral interferences:
caused by background emission from continuous or recombination phenomena,
stray light from the line emission of high concentration elements, overlap of a spectral line from another element, or unresolved overlap of molecular band spectra.
► Corrections Background emission and stray light compensated for by subtracting backgr
ound emission determined by measurements adjacent to the analyte wavelength peak.
Correction factors can be applied if interference is well characterized Inter-element corrections will vary for the same emission line among instru
ments because of differences in resolution, as determined by the grating, the entrance and exit slit widths, and by the order of dispersion.

Physical interferences of ICP
► cause effects associated with the sample nebulization and transport proce
sses. Changes in viscosity and surface tension can cause significant inac
curacies, ► especially in samples containing high dissolved solids ► or high acid concentrations.
Salt buildup at the tip of the nebulizer, affecting aerosol flow rate and nebulization.
► Reduction by diluting the sample or by using a peristaltic pump, by using an internal standard or by using a high solids nebulizer.

Interferences of ICPInterferences of ICP
►Chemical interferences: include molecular compound formation, ionizatio
n effects, and solute vaporization effects. Normally, these effects are not significant with t
he ICP technique. Chemical interferences are highly dependent on
matrix type and the specific analyte element.

Memory interferences:
► When analytes in a previous sample contribute to the signals measured in a new sample.
► Memory effects can result from sample deposition on the uptake tubing to the nebulizer from the build up of sample material in the plasma torch and spray
chamber. ► The site where these effects occur is dependent on the ele
ment and can be minimized by flushing the system with a rinse blank between samples.
► High salt concentrations can cause analyte signal suppressions and confuse interference tests.

Typical Calibration ICP curvesTypical Calibration ICP curves

Calibration curves of ICP-AESCalibration curves of ICP-AES

10B. Arc and Spark AES10B. Arc and Spark AES
►Arc and Spark Excitation Sources: Limited to semi-quantitative/qualitative
analysis (arc flicker) Usually performed on solids Largely displaced by plasma-AES
►Electric current flowing between two C electrodes

Carbon electrodesCarbon electrodes
► Sample pressed into electrode or mixed with Cu powder and pressed - Briquetting (pelleting)
► Cyanogen bands (CN) 350-420 nm occur with C electrodes in air -He, Ar atmosphere
► Arc/spark unstable each line measured >20 s needs multichannel detectio
n

Arc and Spark spectrographArc and Spark spectrograph
spectrographspectrograph
►Beginning 1930s►photographic film
Cheap Long integration times Difficult to develop/analyze Non-linearity of line "darkness“
►Gamma function►Plate calibration
Multichannel photoelectric spectromeMultichannel photoelectric spectrometerter
►multichannel PMT instruments for rapid determinations (<20 lines) but not vers
atile For routine analysis of solids
►metals, alloys, ores, rocks, soils portable instruments
►Multichannel charge transfer devicesMultichannel charge transfer devices Recently on the marketRecently on the market Orignally developed for plasma sourcesOrignally developed for plasma sources

HomeworkHomework
►10-1, 10-2, 10-5, 10-710-1, 10-2, 10-5, 10-7
Related Documents