................BM-BME CM YK Bengaluru Chennai Coimbatore Hubballi Hyderabad Kochi Kolkata Madurai Malappuram Mangaluru Mumbai Noida Thiruvananthapuram Tiruchirapalli Tirupati Vijayawada Visakhapatnam FRIDAY • MAY 13, 2022 MUMBAI ₹10 • Pages 10 • Volume 29 • Number 132 DATA FOCUS Around 78 per cent of India’s e-waste not being collected or disposed by the government p2 GAIN ETHANOL GETS MORE The Centre has approved a ₹23 a litre increase in the price of ethanol produced from damaged foodgrains p8 NORMS FOR ITR REASSESSMENT The Central Board of Direct Taxes has come out with detailed guidelines for reassessment of income-tax returns p3 OUR BUREAU New Delhi, May 12 Retail inflation based on the Consumer Price Index (CPI) surged to near 8-year high in April to 7.79 per cent. The pre- vious high was recorded in May 2014, when retail infla- tion rate touched 8.33 per cent. The continuous fuel price hike predictably had a spiralling effect on the final price of various products. Also, surging global prices of com- modities impacted price movement. April witnessed double-digit inflation in oils and fats (edible oil), vegetable, spices, footwear and fuel and light. The apprehension now is that prices will continue to remain high. Experts say with the current surge, another round of policy interest rate hike by the Mon- etary Policy Committee (MPC) is certain which, in turn, will further push EMI on loans such as housing. DK Srivastava, Chief Policy Advisory with EY India, said that given the trends in infla- tion rate, the RBI may consider increasing the policy rate fur- ther by 50 basis points or more in one or two steps. Though he apprehends higher interest rates and an adverse effect on investment and growth, he feels there may also be a positive spin-off due to higher growth in taxes linked to higher nominal growth. Fiscal space to cut excise Gross GST collections hit an all time high of ₹1.68-lakh crore. Direct tax mop-up also surged 49 per cent in FY22. “This addi- tional fiscal capacity may be partly used to reduce the union excise duty on petro- leum products with a view to containing inflation and partly to frontloading infra- structure investments in the initial months of FY23 to sup- port growth,” he said. Swati Arora, Economist with HDFC Bank, expects inflation to stay above 7 per cent until September/October. In the second half, inflation (aver- age) is expected to ease to 6.3- 6.5 per cent. At this point, there are more risks to infla- tion than one. Prolonged sup- ply disruptions, higher food prices (due to lingering geo- political tensions, Indonesia’s export ban of vegetable oil, in- creased transportation costs and heatwave impacting crops), higher commodity prices, and a depreciation of the rupee are likely to weigh on the inflation print. On the policy front, we expect the RBI to deliver a rate hike to the tune of 25 bps in its June policy,” she said. IIP grows 1.9% in March Industrial growth based on the Index of Industrial Produc- tion (IIP) grew 1.9 per cent in March though on a high base. The output of manufacturing, the largest component of IIP, grew at 0.9 per cent and min- ing and electricity at 4 per cent and 6.1 per cent, respectively. According to a note pre- pared by Sunil Kumar Sinha and Paras Jasrai of India Rat- ings & Research, as the geopol- itical situation is unlikely to get better in the near term in view of the Russia-Ukraine conflict, Ind-Ra believes the ongoing industrial recovery will continue to face head- winds and will require more policy support. “Ind-Ra ex- pects the IIP growth to remain in low single digits in the near term,” the note said. At 7.79%, retail inflation surges to near 8-year high in April Mainly due to pricier fuel, edible oils; another round of policy interest rate hike certain DALIP SINGH New Delhi, May 12 A Special CBI court on Thursday denied bail to former NSE CEO Chitra Ramkrishna and the bourse’s former Group Operating Of- ficer-cum Advisor Anand Sub- ramanian due to the “gravity, seriousness, enormity and magnitude” of the charges levelled against them by the CBI and noted that the duo “ran the affairs of the NSE akin to that of a private club”. The Special CBI Judge San- jeev Aggarwal noted various irregularities in the appoint- ment of favoured persons in key positions to manage the co-location structure and thereby damaged investor confidence. In his exhaustive 42-page order, the Judge said Ramkrishna, who joined the NSE as Joint Managing Dir- ector in 2009 and remained CEO and MD from April 2013 till December 2, 2016, ran the bourse like a private club and appointed favourites, such as Muralidharan Natarajan, CTO of NSETECH, a subsidiary of NSE, who was responsible for putting in place the co-loca- tion structure. Observing their running of the NSE, the Judge quoted No- bel Laureate Bob Dylan to sig- nify the state of affairs: “Money doesn’t talk, it swears”. The song, part of the album ‘Alright Ma I’m only Bleeding’ released in 1964, de- notes the running of the NSE under Ramkrishna and Sub- ramanian, observed the Judge. Investment climate hit Rejecting their plea that the charges against them consti- tute administrative malfunc- tioning which is civil in nature and that the CBI can- not prove a criminal offence, the court said their actions had damaged the investment climate in the country. “The present scam may also impact the investment scen- ario in the country vis-a-vis foreign institutional in- vestors , who are always look- ing for fair, transparent and clean stock exchange to trade with... the present case has shaken the financial con- scious of every investor, whether retail, institutional or otherwise, which needs mending to restore confid- ence of public at large,” said the Judge. CBI chargesheet The CBI’s Special Public Pro- secutor VK Pathak’s apprehen- sion that the two accused may try to tamper with evidence and influence the witnesses was also taken into account by Judge Agarwal to keep the accused confined in Tihar Jail. The CBI has chargesheeted the duo for criminal conspir- acy under Section 120 B of the Indian Penal Code and for in- dulging in criminal miscon- duct to abuse official position under Section 13(1)(d) of the Prevention of Corruption Act. Also, turning down defence plea that the NSE was not a public authority and hence they cannot be treated as pub- lic servants, the court said that the regulator is a stat- utory body and a “state” within the meaning of Article 12 of the Constitution. The CBI chargesheet ac- cused Ramkrishna of abusing her official position to “illeg- ally” and “arbitrarily” appoint inexperienced Subramanian first as chief strategic advisor and then re-designating him as GOO and advisor to her at an “exorbitant salary” which was arbitrarily increased from time to time. Ramkrishna is alleged to have delegated substantial powers to run the exchange and did not take the approval of NSE’s Nomination and Re- muneration Committee (NRC) and board for Sub- ramanian’s re-designation as GOO on April 1, 2015, and his remuneration of ₹4.21 crore. “This granted him huge finan- cial benefits,” the CBI charged. According to court papers, NRC report of November 22, 2017, and an NSE letter of September 14, 2018 addressed to SEBI reveal that the board had told the former CEO that Subramanian should imme- diately step down because he did not have relevant experi- ence and that his elevation and hike in salary had not been approved by them. Also read p3 Judge says the duo ‘ran the affairs of the NSE like a private club’ Chitra Ramkrishna NSE Co-lo scam: CBI court denies bail to Chitra Ramkrishna, Subramanian Tata Motors Q4 loss narrows to ₹992 crore Mumbai, May 12 Tata Motors, India’s largest automotive company, posted a consolidated net loss of ₹992 crore during the March quarter of FY22 due to supply chain disruptions, commodity cost pressures, shutdown in parts of China and an exceptional charge taken for the pause in sales in Russia. The company had posted a consolidated net loss of ₹7,585 crore in the same quarter of FY21. The Mumbai-headquartered company, which owns Jaguar and Land Rover (JLR), has cautioned that the June quarter earnings will also see commodity cost pressures and supply-chain challenges. p2 L&T Q4 net up 8% on better order execution Mumbai, May 12 L&T reported that its net profit in the March quarter was up 8 per cent at ₹4,138 crore against ₹3,820 crore in the same period last year, on higher order execution. Revenue from operations increased 10 per cent to ₹52,851 crore (₹48,088 crore). Total tax expenses decreased 25 per cent to ₹1,555 crore (₹2,087 crore) boosting its profitability. The board of the company has recommended a dividend of ₹22 per share. Net profit in the financial year ended March was down 19 per cent at ₹10,419 crore (₹12,921 crore) as the profit last year was boosted by sale of non-core asset. p2 Ranil Wickremesinghe is new PM of Sri Lanka Colombo, May 12 Sri Lankan President Gotabaya Rajapaksa on Thursday appointed former PM Ranil Wickremesinghe as the Premier, in a bid to restore stability in the island-nation. This is the sixth time Wickremesinghe, 73, has been appointed to the office — he has never finished a full term. Gotabaya’s older brother Mahinda Rajapaksa resigned as Prime Minister on Monday, hours after his supporters violently attacked anti- government protesters. p10 Crypto m-cap dips 21% as panic grips investors Chennai, May 12 There was a virtual blood-bath in cryptocurrencies on Thursday. Investors were spooked by the crash in stablecoin Luna and the high inflation reading in the US. Ongoing turbulence in global equity, bonds and currency markets seems to have affected the sentiment, too. Most cryptocurrencies slid helplessly with bitcoin losing around 11 per cent, ethereum 20 per cent, dogecoin and polkadot losing around 23 per cent. The total cryptocurrency market cap declined from $1.4 trillion on May 11 to $1.18 trillion on May 12, down 21 per cent in just one session. p10 INSIDE OUR BUREAU Mumbai, May 12 Indian financial and equity markets were hit with the US inflation surging to 8.30 per cent in April against market ex- pectations of 8.10 per cent. The likelihood of the US Fed ramp- ing up interest rates more ag- gressively has increased, push- ing FPIs to sell their holdings in emerging markets, including India. The rupee touched an all- time intraday low of 77.6250 per dollar on Thursday before recouping some of the losses on RBI’s strong intervention. The rupee closed at 77.4150, about 17 paise lower versus the previous close of 77.24. The equity market too took a hit on Thursday, with the Sen- sex losing 1,158 points to close at 52,930 and Nifty dropping 359 points to 15,808. Adding to the woes, cryptocurrencies also crashed erasing more than $200 billion in a single day. Details p6 Rupee, equities take a beating Regd. TN/ARD/14/09-11, RNI No. 55320/94

Welcome message from author
This document is posted to help you gain knowledge. Please leave a comment to let me know what you think about it! Share it to your friends and learn new things together.
Transcript

................BM-BMECMYK
Bengaluru Chennai Coimbatore Hubballi Hyderabad Kochi Kolkata Madurai Malappuram Mangaluru Mumbai Noida Thiruvananthapuram Tiruchirapalli Tirupati Vijayawada Visakhapatnam
FRIDAY • MAY 13, 2022
MUMBAI
₹�10 • Pages 10 • Volume 29 • Number 132
DATA FOCUS
Around 78 per cent of India’s
ewaste not being collected or
disposed by the government p2
GAIN ETHANOL GETS MORE
The Centre has approved a ₹�23 a litre
increase in the price of ethanol produced
from damaged foodgrains p8
NORMS FOR ITR REASSESSMENT
The Central Board of Direct Taxes has come
out with detailed guidelines for
reassessment of incometax returns p3
OUR BUREAU
New Delhi, May 12
Retail infl�ation based on theConsumer Price Index (CPI)surged to near 8year high inApril to 7.79 per cent. The previous high was recorded inMay 2014, when retail infl�ation rate touched 8.33 per cent.
The continuous fuel pricehike predictably had aspiralling eff�ect on the fi�nalprice of various products. Also,surging global prices of commodities impacted pricemovement. April witnesseddoubledigit infl�ation in oilsand fats (edible oil), vegetable,spices, footwear and fuel andlight. The apprehension nowis that prices will continue toremain high.
Experts say with the currentsurge, another round of policyinterest rate hike by the Monetary Policy Committee (MPC)is certain which, in turn, willfurther push EMI on loanssuch as housing.
DK Srivastava, Chief PolicyAdvisory with EY India, saidthat given the trends in infl�ation rate, the RBI may considerincreasing the policy rate further by 50 basis points ormore in one or two steps.Though he apprehends higherinterest rates and an adverseeff�ect on investment and
growth, he feels there mayalso be a positive spinoff� dueto higher growth in taxeslinked to higher nominalgrowth.
Fiscal space to cut exciseGross GST collections hit an alltime high of ₹�1.68lakh crore.Direct tax mopup also surged49 per cent in FY22. “This addi
tional fi�scal capacity may bepartly used to reduce theunion excise duty on petroleum products with a view tocontaining infl�ation andpartly to frontloading infrastructure investments in theinitial months of FY23 to support growth,” he said.
Swati Arora, Economist withHDFC Bank, expects infl�ation
to stay above 7 per cent untilSeptember/October. In thesecond half, infl�ation (average) is expected to ease to 6.36.5 per cent. At this point,there are more risks to infl�ation than one. Prolonged supply disruptions, higher foodprices (due to lingering geopolitical tensions, Indonesia’sexport ban of vegetable oil, increased transportation costsand heatwave impactingcrops), higher commodityprices, and a depreciation ofthe rupee are likely to weighon the infl�ation print. On thepolicy front, we expect the RBIto deliver a rate hike to thetune of 25 bps in its Junepolicy,” she said.
IIP grows 1.9% in MarchIndustrial growth based onthe Index of Industrial Production (IIP) grew 1.9 per cent inMarch though on a high base.The output of manufacturing,the largest component of IIP,grew at 0.9 per cent and mining and electricity at 4 per centand 6.1 per cent, respectively.
According to a note prepared by Sunil Kumar Sinhaand Paras Jasrai of India Ratings & Research, as the geopolitical situation is unlikely toget better in the near term inview of the RussiaUkraineconfl�ict, IndRa believes theongoing industrial recoverywill continue to face headwinds and will require morepolicy support. “IndRa expects the IIP growth to remainin low single digits in the nearterm,” the note said.
At 7.79%, retail inflation surgesto near 8-year high in AprilMainly due to
pricier fuel, edible
oils; another roundof policy interest
rate hike certain
DALIP SINGH
New Delhi, May 12
A Special CBI court onThursday denied bail toformer NSE CEO ChitraRamkrishna and the bourse’sformer Group Operating Offi�cercum Advisor Anand Subramanian due to the “gravity,seriousness, enormity andmagnitude” of the chargeslevelled against them by theCBI and noted that the duo“ran the aff�airs of the NSE akinto that of a private club”.
The Special CBI Judge Sanjeev Aggarwal noted variousirregularities in the appointment of favoured persons inkey positions to manage thecolocation structure andthereby damaged investorconfi�dence.
In his exhaustive 42pageorder, the Judge saidRamkrishna, who joined theNSE as Joint Managing Director in 2009 and remainedCEO and MD from April 2013till December 2, 2016, ran thebourse like a private club andappointed favourites, such asMuralidharan Natarajan, CTO
of NSETECH, a subsidiary ofNSE, who was responsible forputting in place the colocation structure.
Observing their running ofthe NSE, the Judge quoted Nobel Laureate Bob Dylan to signify the state of aff�airs:“Money doesn’t talk, itswears”. The song, part of thealbum ‘Alright Ma I’m onlyBleeding’ released in 1964, denotes the running of the NSEunder Ramkrishna and Subramanian, observed theJudge.
Investment climate hitRejecting their plea that thecharges against them constitute administrative malfunctioning which is civil innature and that the CBI cannot prove a criminal off�ence,the court said their actionshad damaged the investmentclimate in the country.
“The present scam may alsoimpact the investment scenario in the country vis-a-visforeign institutional investors , who are always looking for fair, transparent andclean stock exchange to tradewith... the present case hasshaken the fi�nancial conscious of every investor,whether retail, institutionalor otherwise, which needsmending to restore confi�d
ence of public at large,” saidthe Judge.
CBI chargesheetThe CBI’s Special Public Prosecutor VK Pathak’s apprehension that the two accused maytry to tamper with evidenceand infl�uence the witnesseswas also taken into accountby Judge Agarwal to keep theaccused confi�ned in Tihar Jail.
The CBI has chargesheetedthe duo for criminal conspiracy under Section 120 B of theIndian Penal Code and for indulging in criminal misconduct to abuse offi�cial positionunder Section 13(1)(d) of thePrevention of Corruption Act.Also, turning down defenceplea that the NSE was not apublic authority and hencethey cannot be treated as public servants, the court said
that the regulator is a statutory body and a “state”within the meaning of Article12 of the Constitution.
The CBI chargesheet accused Ramkrishna of abusingher offi�cial position to “illegally” and “arbitrarily” appointinexperienced Subramanianfi�rst as chief strategic advisorand then redesignating himas GOO and advisor to her atan “exorbitant salary” whichwas arbitrarily increasedfrom time to time.
Ramkrishna is alleged tohave delegated substantialpowers to run the exchangeand did not take the approvalof NSE’s Nomination and Remuneration Committee(NRC) and board for Subramanian’s redesignation asGOO on April 1, 2015, and hisremuneration of ₹�4.21 crore.“This granted him huge fi�nancial benefi�ts,” the CBI charged.
According to court papers,NRC report of November 22,2017, and an NSE letter ofSeptember 14, 2018 addressedto SEBI reveal that the boardhad told the former CEO thatSubramanian should immediately step down because hedid not have relevant experience and that his elevationand hike in salary had notbeen approved by them.
Also read p3
Judge says the
duo ‘ran the
affairs of the NSE
like a private club’
Chitra Ramkrishna
NSE Co-lo scam: CBI court denies bailto Chitra Ramkrishna, Subramanian
Tata Motors Q4 lossnarrows to ₹�992 croreMumbai, May 12
Tata Motors, India’s largest
automotive company, posted a
consolidated net loss of ₹�992
crore during the March quarter
of FY22 due to supply chain
disruptions, commodity cost
pressures, shutdown in parts of
China and an exceptional
charge taken for the pause in
sales in Russia. The company
had posted a consolidated net
loss of ₹�7,585 crore in the same
quarter of FY21. The
Mumbaiheadquartered
company, which owns Jaguar
and Land Rover (JLR), has
cautioned that the June quarter
earnings will also see
commodity cost pressures and
supplychain challenges. p2
L&T Q4 net up 8% onbetter order executionMumbai, May 12
L&T reported that its net profi�t
in the March quarter was up 8
per cent at ₹�4,138 crore against
₹�3,820 crore in the same period
last year, on higher order
execution. Revenue from
operations increased 10 per
cent to ₹�52,851 crore (₹�48,088
crore). Total tax expenses
decreased 25 per cent to ₹�1,555
crore (₹�2,087 crore) boosting its
profi�tability. The board of the
company has recommended a
dividend of ₹�22 per share. Net
profi�t in the fi�nancial year
ended March was down 19 per
cent at ₹�10,419 crore (₹�12,921
crore) as the profi�t last year was
boosted by sale of noncore
asset. p2
Ranil Wickremesingheis new PM of Sri LankaColombo, May 12
Sri Lankan
President
Gotabaya
Rajapaksa on
Thursday
appointed
former PM
Ranil
Wickremesinghe as the Premier,
in a bid to restore stability in the
islandnation. This is the sixth
time Wickremesinghe, 73, has
been appointed to the office —
he has never fi�nished a full
term. Gotabaya’s older brother
Mahinda Rajapaksa resigned as
Prime Minister on Monday,
hours after his supporters
violently attacked anti
government protesters. p10
Crypto mcap dips 21%as panic grips investorsChennai, May 12
There was a virtual bloodbath
in cryptocurrencies on
Thursday. Investors were
spooked by the crash in
stablecoin Luna and the high
infl�ation reading in the US.
Ongoing turbulence in global
equity, bonds and currency
markets seems to have
affected the sentiment, too.
Most cryptocurrencies slid
helplessly with bitcoin losing
around 11 per cent, ethereum
20 per cent, dogecoin and
polkadot losing around 23 per
cent. The total cryptocurrency
market cap declined from $1.4
trillion on May 11 to $1.18
trillion on May 12, down 21 per
cent in just one session. p10
INSIDE
OUR BUREAU
Mumbai, May 12
Indian fi�nancial and equitymarkets were hit with the USinfl�ation surging to 8.30 percent in April against market expectations of 8.10 per cent. Thelikelihood of the US Fed ramping up interest rates more aggressively has increased, pushing FPIs to sell their holdings inemerging markets, includingIndia.
The rupee touched an alltime intraday low of 77.6250
per dollar on Thursday beforerecouping some of the losseson RBI’s strong intervention.The rupee closed at 77.4150,about 17 paise lower versus theprevious close of 77.24.
The equity market too took ahit on Thursday, with the Sensex losing 1,158 points to closeat 52,930 and Nifty dropping359 points to 15,808. Adding tothe woes, cryptocurrenciesalso crashed erasing more than$200 billion in a single day.
Details p6
Rupee, equities take a beating
Regd. TN/ARD/14/09-11, RNI No. 55320/94
OUR BUREAU
Mumbai, May 12
Tata Motors, India’s largestautomotive company, posteda consolidated net loss of₹�992 crore during the Marchquarter of FY22 due to supplychain disruptions, commodity cost pressures, shutdownin parts of China and an exceptional charge taken for thepause in sales in Russia.
The company had posted aconsolidated net loss of₹�7,585 crore in the samequarter of FY21.
The Mumbaibased company, which owns Jaguar andLand Rover (JLR), has cautioned that the June quarterearnings will also see commodity cost pressures andsupply chain challenges.
While the markets of Russiaand Ukraine, which accountfor 2.5 per cent of worldwidesales of JLR, are closed for thetwo brands, the companyclaims to have an order bookof 1,68,000 units for both thebrands, which is an increasefrom 1,55,000 units it claimedin Q3 FY22.
‘Monitoring situation’PB Balaji, Chief Financial Offi�cer, Tata Motors, said, “Thesupply chain has been impacted due to shut down inparts of China. We are managing the situation to the bestof our abilities and it is one ofthe reasons why we need to
watch out for Q1 in terms ofavailability of supplies coming from China. We are monitoring the situation and takingactions accordingly.”
Cost of slump sale of passenger vehicle undertaking of₹�301 crore was also added tothe exceptional items. TataMotors took an exceptionalcharge ₹�429 crore in the business operations in Russia during the reporting quarter.
“We have taken a charge onthe operations we have in Russia and that’s the net assetvalue of the business we havewritten down. And until clarity emerges in terms of ourability to do business there,this is a conservative view wehave taken on that,” Balaji added.
Tata Motors clocked a con
solidated revenue of ₹�77,857crore, during the reportingquarter down 11.29 per centcompared to ₹�87,772 croreposted in the same quarter inFY21. EBITDA for the quarterstood at 11.2 per cent at theconsolidated level, down 320basis points compared to Q4FY21.
The company informedthat it has received the fi�rsttranche of ₹�7,500 primary investment by TPG Rise Climatein Tata Passenger Electric Mobility which is ₹�3,750 crore.The company closed theMarch quarter with an EV penetration of 7.4 per cent.
Tata Motors added that EVbusiness will drive up penetration and further acceleratesales. “The business is expected to deliver strong improvement in margins and profi�tability in FY23. The businesswill continue to stepup newproduct launches and enhance capacities to cater to increasing demand,” Tata Motors added.
To increase PV outputThe auto maker is increasingcapital expenditure to ₹�5,5006,000 crore for FY23 at thestandalone level. It had linedup a capex of ₹�3,500 crore forFY22. Balaji added that TataMotors would look at debottlenecking of production processes to make way for increased output for thepassenger vehicle category.
“The focus on debottlenecking continues and thereforeour intention is to get as closeto 50,000 (per month) as possible and all other options wewill continue as it comesthrough,” Balaji added.
Supply chain
disruptions, costpressures among
factors that weigh
on numbers
Tata Motors Q4 lossnarrows to ₹�992 crore
The supply chain hasbeen impacted dueto shut down inparts of China. Wehave also taken anexceptional chargeon the operations wehave in Russia.
PB BALAJIChief Financial Officer,
Tata Motors
................BM-BMECMYK
MUMBAI
2 BusinessLine FRIDAY • MAY 13 • 2022NEWS
BusinessLineDisclaimer: Readers are requested to verify& make appropriate enquiries to satisfythemselves about the veracity of anadvertisement before responding to anypublished in this newspaper. THGPUBLISHING PVT LTD., the Publisher &Owner of this newspaper, does not vouchfor the authenticity of any advertisementor advertiser or for any of the advertiser’sproducts and/or services. In no event canthe Owner, Publisher, Printer, Editor,Director/s, Employees of thisnewspaper/company be heldresponsible/liable in any mannerwhatsoever for any claims and/or damagesfor advertisements in this newspaper.
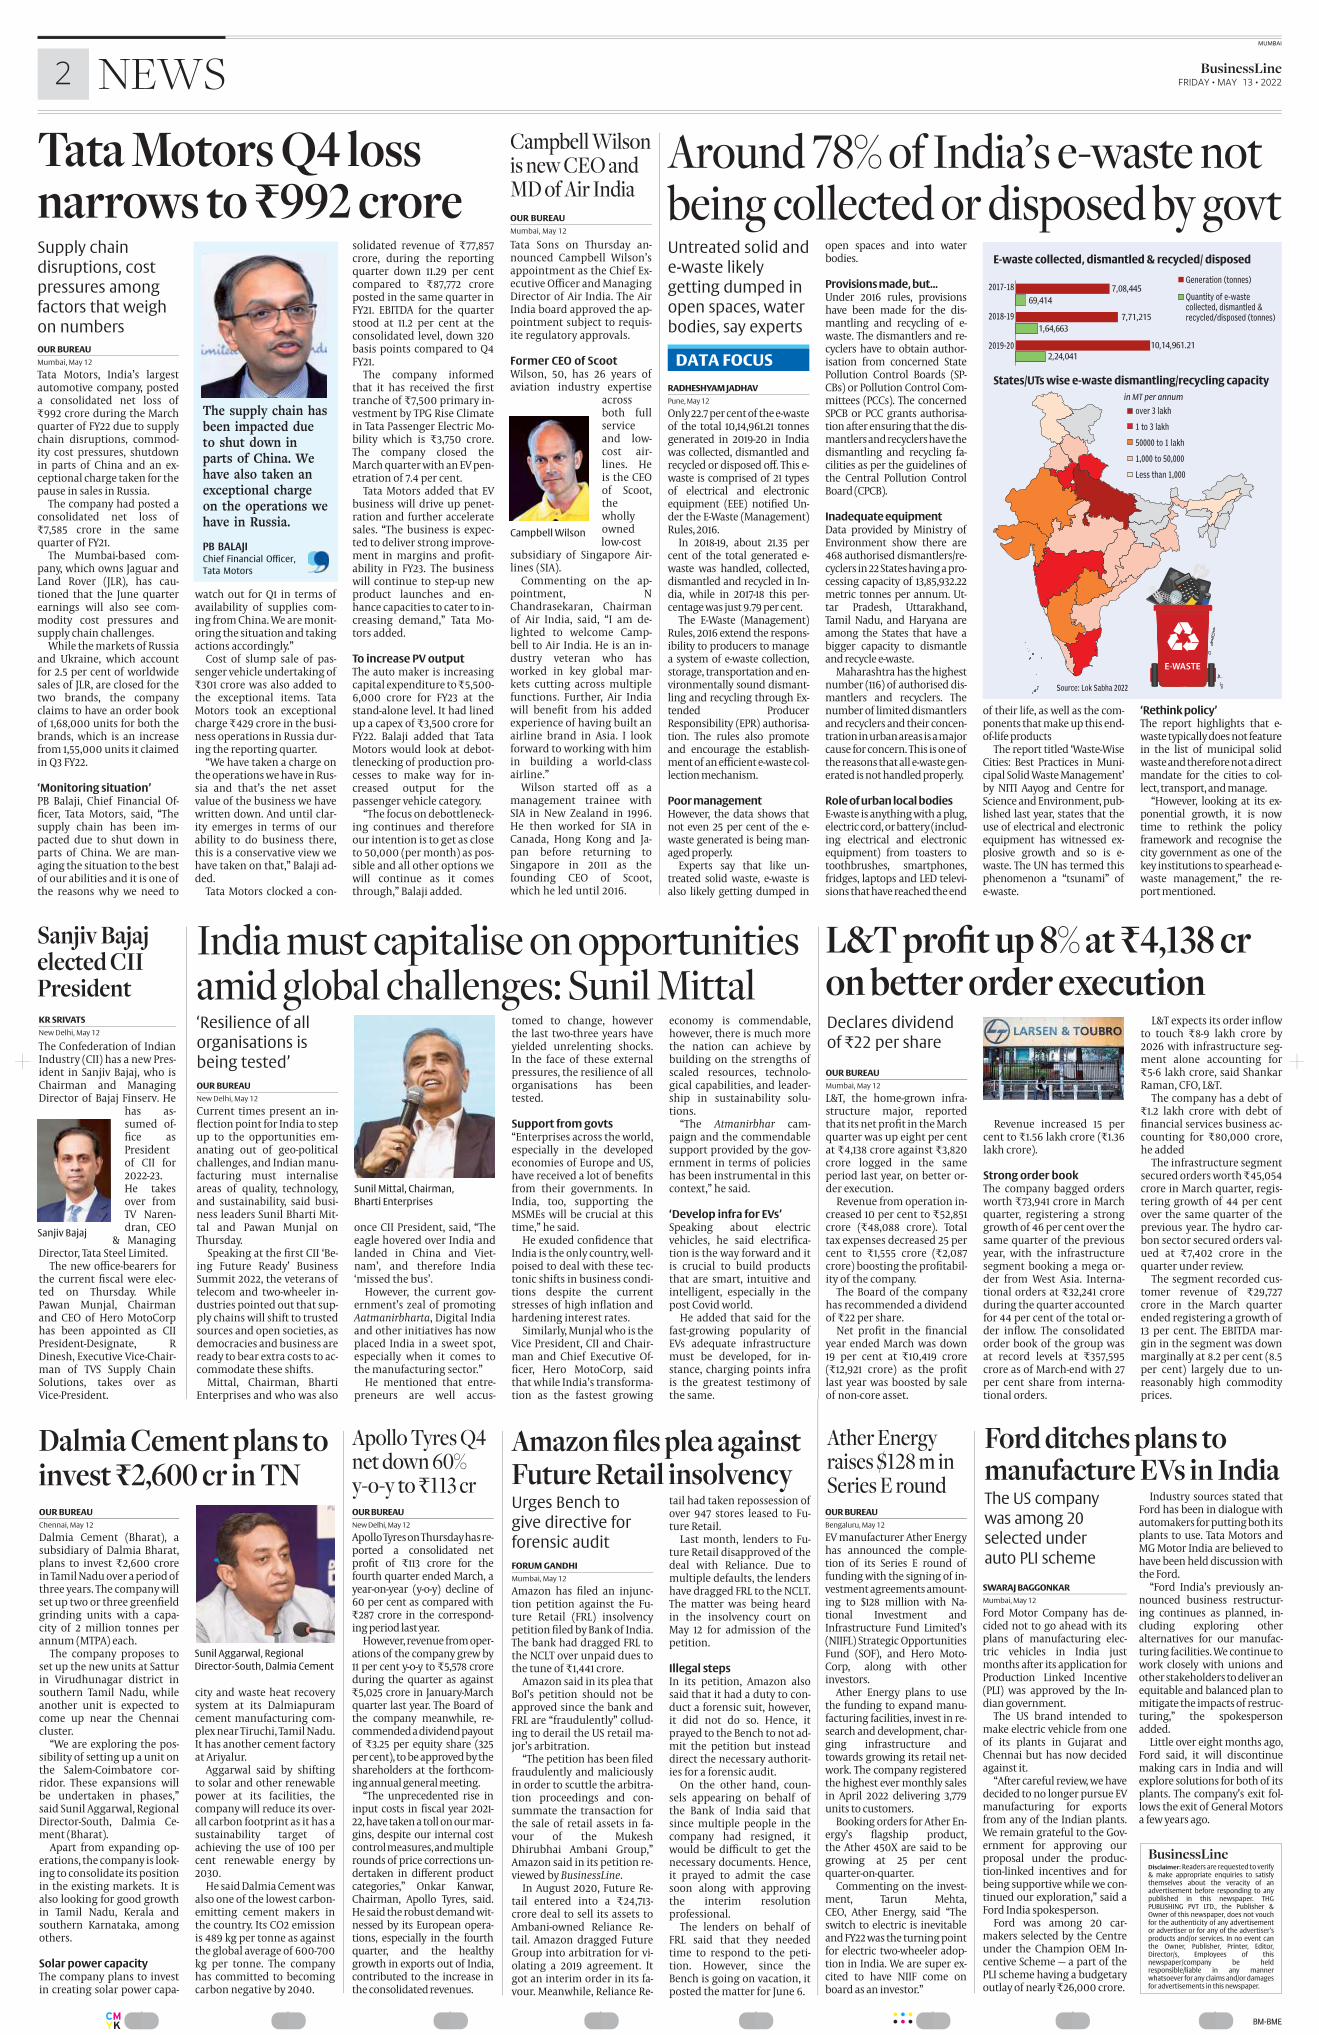
RADHESHYAM JADHAV
Pune, May 12
Only 22.7 per cent of the ewasteof the total 10,14,961.21 tonnesgenerated in 201920 in Indiawas collected, dismantled andrecycled or disposed off�. This ewaste is comprised of 21 typesof electrical and electronicequipment (EEE) notifi�ed Under the EWaste (Management)Rules, 2016.
In 201819, about 21.35 percent of the total generated ewaste was handled, collected,dismantled and recycled in India, while in 201718 this percentage was just 9.79 per cent.
The EWaste (Management)Rules, 2016 extend the responsibility to producers to managea system of ewaste collection,storage, transportation and environmentally sound dismantling and recycling through Extended ProducerResponsibility (EPR) authorisation. The rules also promoteand encourage the establishment of an effi�cient ewaste collection mechanism.
Poor managementHowever, the data shows thatnot even 25 per cent of the ewaste generated is being managed properly.
Experts say that like untreated solid waste, ewaste isalso likely getting dumped in
open spaces and into waterbodies.
Provisions made, but...Under 2016 rules, provisionshave been made for the dismantling and recycling of ewaste. The dismantlers and recyclers have to obtain authorisation from concerned StatePollution Control Boards (SPCBs) or Pollution Control Committees (PCCs). The concernedSPCB or PCC grants authorisation after ensuring that the dismantlers and recyclers have thedismantling and recycling facilities as per the guidelines ofthe Central Pollution ControlBoard (CPCB).
Inadequate equipmentData provided by Ministry ofEnvironment show there are468 authorised dismantlers/recyclers in 22 States having a processing capacity of 13,85,932.22metric tonnes per annum. Uttar Pradesh, Uttarakhand,Tamil Nadu, and Haryana areamong the States that have abigger capacity to dismantleand recycle ewaste.
Maharashtra has the highestnumber (116) of authorised dismantlers and recyclers. Thenumber of limited dismantlersand recyclers and their concentration in urban areas is a majorcause for concern. This is one ofthe reasons that all ewaste generated is not handled properly.
Role of urban local bodies Ewaste is anything with a plug,electric cord, or battery (including electrical and electronicequipment) from toasters totoothbrushes, smartphones,fridges, laptops and LED televisions that have reached the end
of their life, as well as the components that make up this endoflife products
The report titled ‘WasteWiseCities: Best Practices in Municipal Solid Waste Management’by NITI Aayog and Centre forScience and Environment, published last year, states that theuse of electrical and electronicequipment has witnessed explosive growth and so is ewaste. The UN has termed thisphenomenon a “tsunami” ofewaste.
‘Rethink policy’The report highlights that ewaste typically does not featurein the list of municipal solidwaste and therefore not a directmandate for the cities to collect, transport, and manage.
“However, looking at its exponential growth, it is nowtime to rethink the policyframework and recognise thecity government as one of thekey institutions to spearhead ewaste management,” the report mentioned.
Untreated solid and
ewaste likely
getting dumped in
open spaces, water
bodies, say experts
Around 78% of India’s ewaste notbeing collected or disposed by govt
DATA FOCUS
Revenue increased 15 percent to ₹�1.56 lakh crore (₹�1.36lakh crore).
Strong order bookThe company bagged ordersworth ₹�73,941 crore in Marchquarter, registering a stronggrowth of 46 per cent over thesame quarter of the previousyear, with the infrastructuresegment booking a mega order from West Asia. International orders at ₹�32,241 croreduring the quarter accountedfor 44 per cent of the total order infl�ow. The consolidatedorder book of the group wasat record levels at ₹�357,595crore as of Marchend with 27per cent share from international orders.
OUR BUREAU
Mumbai, May 12
L&T, the homegrown infrastructure major, reportedthat its net profi�t in the Marchquarter was up eight per centat ₹�4,138 crore against ₹�3,820crore logged in the sameperiod last year, on better order execution.
Revenue from operation increased 10 per cent to ₹�52,851crore (₹�48,088 crore). Totaltax expenses decreased 25 percent to ₹�1,555 crore (₹�2,087crore) boosting the profi�tability of the company.
The Board of the companyhas recommended a dividendof ₹�22 per share.
Net profi�t in the fi�nancialyear ended March was down19 per cent at ₹�10,419 crore(₹�12,921 crore) as the profi�tlast year was boosted by saleof noncore asset.
L&T expects its order infl�owto touch ₹�89 lakh crore by2026 with infrastructure segment alone accounting for₹�56 lakh crore, said ShankarRaman, CFO, L&T.
The company has a debt of₹�1.2 lakh crore with debt offi�nancial services business accounting for ₹�80,000 crore,he added
The infrastructure segmentsecured orders worth ₹�45,054crore in March quarter, registering growth of 44 per centover the same quarter of theprevious year. The hydro carbon sector secured orders valued at ₹�7,402 crore in thequarter under review.
The segment recorded customer revenue of ₹�29,727crore in the March quarterended registering a growth of13 per cent. The EBITDA margin in the segment was downmarginally at 8.2 per cent (8.5per cent) largely due to unreasonably high commodityprices.
Declares dividend
of ₹�22 per share
L&T profi�t up 8% at ₹�4,138 cr on better order execution
OUR BUREAU
Mumbai, May 12
Tata Sons on Thursday announced Campbell Wilson’sappointment as the Chief Executive Offi�cer and ManagingDirector of Air India. The AirIndia board approved the appointment subject to requisite regulatory approvals.
Former CEO of ScootWilson, 50, has 26 years ofaviation industry expertise
acrossboth fullserviceand lowcost airlines. Heis the CEOof Scoot,thewhollyownedlowcost
subsidiary of Singapore Airlines (SIA).
Commenting on the appointment, NChandrasekaran, Chairmanof Air India, said, “I am delighted to welcome Campbell to Air India. He is an industry veteran who hasworked in key global markets cutting across multiplefunctions. Further, Air Indiawill benefi�t from his addedexperience of having built anairline brand in Asia. I lookforward to working with himin building a worldclassairline.”
Wilson started off� as amanagement trainee withSIA in New Zealand in 1996.He then worked for SIA inCanada, Hong Kong and Japan before returning toSingapore in 2011 as thefounding CEO of Scoot,which he led until 2016.
Campbell Wilsonis new CEO and MD of Air India
Campbell Wilson
OUR BUREAU
Bengaluru, May 12
EV manufacturer Ather Energyhas announced the completion of its Series E round offunding with the signing of investment agreements amounting to $128 million with National Investment andInfrastructure Fund Limited’s(NIIFL) Strategic OpportunitiesFund (SOF), and Hero MotoCorp, along with otherinvestors.
Ather Energy plans to usethe funding to expand manufacturing facilities, invest in research and development, charging infrastructure andtowards growing its retail network. The company registeredthe highest ever monthly salesin April 2022 delivering 3,779units to customers.
Booking orders for Ather Energy’s fl�agship product,the Ather 450X are said to begrowing at 25 per centquarteronquarter.
Commenting on the investment, Tarun Mehta,CEO, Ather Energy, said “Theswitch to electric is inevitableand FY22 was the turning pointfor electric twowheeler adoption in India. We are super excited to have NIIF come onboard as an investor.”
Ather Energyraises $128 m inSeries E round
SWARAJ BAGGONKAR
Mumbai, May 12
Ford Motor Company has decided not to go ahead with itsplans of manufacturing electric vehicles in India justmonths after its application forProduction Linked Incentive(PLI) was approved by the Indian government.
The US brand intended tomake electric vehicle from oneof its plants in Gujarat andChennai but has now decidedagainst it.
“After careful review, we havedecided to no longer pursue EVmanufacturing for exportsfrom any of the Indian plants.We remain grateful to the Government for approving ourproposal under the productionlinked incentives and forbeing supportive while we continued our exploration,” said aFord India spokesperson.
Ford was among 20 carmakers selected by the Centreunder the Champion OEM Incentive Scheme — a part of thePLI scheme having a budgetaryoutlay of nearly ₹�26,000 crore.
Industry sources stated thatFord has been in dialogue withautomakers for putting both itsplants to use. Tata Motors andMG Motor India are believed tohave been held discussion withthe Ford.
“Ford India’s previously announced business restructuring continues as planned, including exploring otheralternatives for our manufacturing facilities. We continue towork closely with unions andother stakeholders to deliver anequitable and balanced plan tomitigate the impacts of restructuring,” the spokespersonadded.
Little over eight months ago,Ford said, it will discontinuemaking cars in India and willexplore solutions for both of itsplants. The company’s exit follows the exit of General Motorsa few years ago.
The US company
was among 20
selected under
auto PLI scheme
Ford ditches plans tomanufacture EVs in India
OUR BUREAU
New Delhi, May 12
Current times present an infl�ection point for India to stepup to the opportunities emanating out of geopoliticalchallenges, and Indian manufacturing must internaliseareas of quality, technology,and sustainability, said business leaders Sunil Bharti Mittal and Pawan Munjal onThursday.
Speaking at the fi�rst CII ‘Being Future Ready’ BusinessSummit 2022, the veterans oftelecom and twowheeler industries pointed out that supply chains will shift to trustedsources and open societies, asdemocracies and business areready to bear extra costs to accommodate these shifts.
Mittal, Chairman, BhartiEnterprises and who was also
once CII President, said, “Theeagle hovered over India andlanded in China and Vietnam’, and therefore India‘missed the bus’.
However, the current government’s zeal of promotingAatmanirbharta, Digital Indiaand other initiatives has nowplaced India in a sweet spot,especially when it comes tothe manufacturing sector.”
He mentioned that entrepreneurs are well accus
tomed to change, howeverthe last twothree years haveyielded unrelenting shocks.In the face of these externalpressures, the resilience of allorganisations has beentested.
Support from govts“Enterprises across the world,especially in the developedeconomies of Europe and US,have received a lot of benefi�tsfrom their governments. InIndia, too, supporting theMSMEs will be crucial at thistime,” he said.
He exuded confi�dence thatIndia is the only country, wellpoised to deal with these tectonic shifts in business conditions despite the currentstresses of high infl�ation andhardening interest rates.
Similarly, Munjal who is theVice President, CII and Chairman and Chief Executive Offi�cer, Hero MotoCorp, saidthat while India’s transformation as the fastest growing
economy is commendable,however, there is much morethe nation can achieve bybuilding on the strengths ofscaled resources, technological capabilities, and leadership in sustainability solutions.
“The Atmanirbhar campaign and the commendablesupport provided by the government in terms of policieshas been instrumental in thiscontext,” he said.
‘Develop infra for EVs’Speaking about electricvehicles, he said electrifi�cation is the way forward and itis crucial to build productsthat are smart, intuitive andintelligent, especially in thepost Covid world.
He added that said for thefastgrowing popularity ofEVs adequate infrastructuremust be developed, for instance, charging points infrais the greatest testimony ofthe same.
‘Resilience of all
organisations is
being tested’
Sunil Mittal, Chairman,
Bharti Enterprises
India must capitalise on opportunities amid global challenges: Sunil Mittal
KR SRIVATS
New Delhi, May 12
The Confederation of IndianIndustry (CII) has a new President in Sanjiv Bajaj, who isChairman and ManagingDirector of Bajaj Finserv. He
has assumed offi�ce asPresidentof CII for202223.He takesover fromTV Narendran, CEO
& ManagingDirector, Tata Steel Limited.
The new offi�cebearers forthe current fi�scal were elected on Thursday. WhilePawan Munjal, Chairmanand CEO of Hero MotoCorphas been appointed as CIIPresidentDesignate, RDinesh, Executive ViceChairman of TVS Supply ChainSolutions, takes over asVicePresident.
Sanjiv Bajajelected CIIPresident
Sanjiv Bajaj
OUR BUREAU
Chennai, May 12
Dalmia Cement (Bharat), asubsidiary of Dalmia Bharat,plans to invest ₹�2,600 crorein Tamil Nadu over a period ofthree years. The company willset up two or three greenfi�eldgrinding units with a capacity of 2 million tonnes perannum (MTPA) each.
The company proposes toset up the new units at Satturin Virudhunagar district insouthern Tamil Nadu, whileanother unit is expected tocome up near the Chennaicluster.
“We are exploring the possibility of setting up a unit onthe SalemCoimbatore corridor. These expansions willbe undertaken in phases,”said Sunil Aggarwal, RegionalDirectorSouth, Dalmia Cement (Bharat).
Apart from expanding operations, the company is looking to consolidate its positionin the existing markets. It isalso looking for good growthin Tamil Nadu, Kerala andsouthern Karnataka, amongothers.
Solar power capacityThe company plans to investin creating solar power capa
city and waste heat recoverysystem at its Dalmiapuramcement manufacturing complex near Tiruchi, Tamil Nadu.It has another cement factoryat Ariyalur.
Aggarwal said by shiftingto solar and other renewablepower at its facilities, thecompany will reduce its overall carbon footprint as it has asustainability target ofachieving the use of 100 percent renewable energy by2030.
He said Dalmia Cement wasalso one of the lowest carbonemitting cement makers inthe country. Its CO2 emissionis 489 kg per tonne as againstthe global average of 600700kg per tonne. The companyhas committed to becomingcarbon negative by 2040.
Dalmia Cement plans toinvest ₹�2,600 cr in TN
Sunil Aggarwal, Regional
Director-South, Dalmia Cement
OUR BUREAU
New Delhi, May 12
Apollo Tyres on Thursday has reported a consolidated netprofi�t of ₹�113 crore for thefourth quarter ended March, ayearonyear (yoy) decline of60 per cent as compared with₹�287 crore in the corresponding period last year.
However, revenue from operations of the company grew by11 per cent yoy to ₹�5,578 croreduring the quarter as against₹�5,025 crore in JanuaryMarchquarter last year. The Board ofthe company meanwhile, recommended a dividend payoutof ₹�3.25 per equity share (325per cent), to be approved by theshareholders at the forthcoming annual general meeting.
“The unprecedented rise ininput costs in fi�scal year 202122, have taken a toll on our margins, despite our internal costcontrol measures, and multiplerounds of price corrections undertaken in diff�erent productcategories,” Onkar Kanwar,Chairman, Apollo Tyres, said.He said the robust demand witnessed by its European operations, especially in the fourthquarter, and the healthygrowth in exports out of India,contributed to the increase inthe consolidated revenues.
Apollo Tyres Q4net down 60%yoy to ₹�113 cr
FORUM GANDHI
Mumbai, May 12
Amazon has fi�led an injunction petition against the Future Retail (FRL) insolvencypetition fi�led by Bank of India.The bank had dragged FRL tothe NCLT over unpaid dues tothe tune of ₹�1,441 crore.
Amazon said in its plea thatBoI’s petition should not beapproved since the bank andFRL are “fraudulently” colluding to derail the US retail major’s arbitration.
“The petition has been fi�ledfraudulently and maliciouslyin order to scuttle the arbitration proceedings and consummate the transaction forthe sale of retail assets in favour of the MukeshDhirubhai Ambani Group,”Amazon said in its petition reviewed by BusinessLine.
In August 2020, Future Retail entered into a ₹�24,713crore deal to sell its assets toAmbaniowned Reliance Retail. Amazon dragged FutureGroup into arbitration for violating a 2019 agreement. Itgot an interim order in its favour. Meanwhile, Reliance Re
tail had taken repossession ofover 947 stores leased to Future Retail.
Last month, lenders to Future Retail disapproved of thedeal with Reliance. Due tomultiple defaults, the lendershave dragged FRL to the NCLT.The matter was being heardin the insolvency court onMay 12 for admission of thepetition.
Illegal stepsIn its petition, Amazon alsosaid that it had a duty to conduct a forensic suit, however,it did not do so. Hence, itprayed to the Bench to not admit the petition but insteaddirect the necessary authorities for a forensic audit.
On the other hand, counsels appearing on behalf ofthe Bank of India said thatsince multiple people in thecompany had resigned, itwould be diffi�cult to get thenecessary documents. Hence,it prayed to admit the casesoon along with approvingthe interim resolutionprofessional.
The lenders on behalf ofFRL said that they neededtime to respond to the petition. However, since theBench is going on vacation, itposted the matter for June 6.
Amazon fi�les plea againstFuture Retail insolvency Urges Bench to give directive forforensic audit
................BM-BMECMYK
MUMBAI
BusinessLineFRIDAY • MAY 13 • 2022 3NEWS
OUR BUREAU
New Delhi, May 12
The ongoing RussiaUkrainewar and the rise in global pricesof commodities, includingcrude, along with other factorswill chart the infl�ation path inthe coming months, said a report by the Finance Ministry.
According to the monthlyeconomic review (MER), prepared by the Economic Aff�airsDepartment, through the channel of imports, elevated globalcrude and edible oil prices nowhave a signifi�cant impact on India’s infl�ation outlook. Government measures to keep theprices in check, along with therecent hike in policy rates by theRBI, are expected to temper infl�ationary pressures.
Retail infl�ation is already overthe benchmark level of 6 per
cent for months. Following this,the Monetary Policy Committeeheld anoff� cycle meeting anddecided to raise repo rate andcash reserve ration to 4.40 percent and 4.5 per cent, respectively. Now, the indication is thatthe repo rate could be hikedfurther.
“Rising food and energyprices are a global phenomenonand even several advanced nations have higher infl�ation ratesthan India. The RBI has signalledits determination to combat infl�ation and that too, will sustain
macroeconomic stability andgrowth,” the MER said.
‘Relatively better placed’The report also expressed optimism that India is unlikely tobe aff�ected much by the currentglobal development. “Notwithstanding the turbulence associated with monetary tighteningin advanced economies, the ongoing geopolitical confl�ict, lockdowns in parts of China and thesupplyside disruptions that arelikely in their wake, India is relatively better placed than most
other nations to weather thestorm and achieve steadygrowth during the current fi�nancial year,” the report said.
Further, it said despite theheadwinds emerging from geopolitical developments and infl�ationary pressures, gradualand steady recovery in privateconsumption and robust exports have induced a healthy investment environment in theeconomy. It coincides with increased capacity utilisation inthe manufacturing sector asseen in the RBI’s quarterly orderbooks, inventory and capacityutilisation survey for Q3 FY22.
Strong growth momentumThe report said lending credence to projections by the IMFworld economic outlook April2022, FY23 has begun with astrong growth momentum ineconomic activity as indicatedby the robust performance of eway bill generation, ETC toll collection, electricity consumptionand PMI manufacturing andservices.
Efforts by govt and
RBI expected to
temper inflation:
FinMin report
The report also expressed optimism that India is unlikely to be
affected much by the current global development
‘Geopolitical situation, commodityprices to impact infl�ation in a big way’
OUR BUREAU
New Delhi, May 12
The Central Board of DirectTaxes (CBDT), the policy making body for incometax andcorporate tax, has come outwith detailed guidelines forreassessment of IncomeTaxReturns. The developmentcomes after the SupremeCourt held reassessment order issued under Section 148of the IncomeTax Act as valid.
There are approximately90,000 such notices. Section148 deals with the issue of notices where income has escaped assessment while itwas substituted by a new section (which came into eff�ectfrom April 1, 2021) 148A.
Now, the apex court hassaid all the reassessment notices issued u/s 148 of the Acton/after April 1, 2021, will bedeemed to have been issuedunder Section 148A.
What it saysAs per the guidelines, any casewhere notice u/s 148 has been
issued pursuant to search,seizure and survey action onor after April 1, 2021, will be selected for compulsory scrutiny. Notice will be served forfaceless assessment. The selection will be completed byMay 31, while the notice willbe served by June 30.
Similarly, search andseizure cases under other sections (153A, 153C and 1433)will also be selected for compulsory scrutiny. Section 153Aprescribes time limit for completion of assessment, reassessment and recomputation, 153C deals withassessment of income of anyother person, and 143(3) talksabout computation and related demand or refund.
The guidelines say the casespertaining to survey u/s 133Awill be picked up for compulsory scrutiny. Cases, wherebooks of accounts, documents etc. not impounded orreturned income is not lessthan returned income of preceding assessment year, will
not be excluded from scrutiny. Section 133A deals withthe power of survey.
Addition to earlier yearsIn cases involving addition inearlier assessment year(s) ona recurring issue of law orfact, the assessing offi�cers willprepare a list of such casesand notice will be issued forfaceless assessment. Similarly,for casesrelated to specifi�c information on tax evasion, alist will be prepared and notice issued.
Earlier this month, a Division Bench of the SupremeCourt said all notices issuedunder the old Section 148 willbe deemed to have been issued under Section 148A andthe present order will be applicable panIndia. This ruling was made on the specialreview petition fi�led by theCentre after three of the HighCourts – Delhi, Allahabad andRajasthan – quashed the notices while the ChattishgarhHigh Court held themcorrect.
CBDT’s move follows SC ruling that upheld
order issued under Sec 148 of I-T Act
Norms issued for ITR reassessmentCompulsory scrutiny
■ Any case where notice u/s
148 has been issued
pursuant to search, seizure
and survey action on or
after April 1, 2021, will be
selected for compulsory
scrutiny
■ Search and seizure cases
under other sections (153A,
153C and 143-3) will also be
selected for compulsory
scrutiny
■ Cases pertaining to survey u/s 133A will be picked up for
compulsory scrutiny
OUR BUREAU
New Delhi, May 12
Central Board of IndirectTaxes and Customs (CBIC)Chairman Vivek Johri onThursday expected averagemonthly GST collection of₹�1.301.35lakh crore in thecurrent fi�scal.
Speaking at ‘In Conversation Series’, organised by FICCI’s committee against smuggling and counterfeitingactivities destroying the economy (CASCADE), Johri saidGST collections have beenconsistently higher than theGDP growth rate.
‘Bounce-back’There is a bounceback in theeconomy, and the infl�ationand boil in oil prices havehelped. Revenues will be under pressure on the Customsside because of rising com
modity prices. Excise will takea hit because of the duty cut.“But to continue revenuebuoyancy, we have to changeour strategy. One possible wayto continue revenue stream isto rationalise the tax rates tolet refunds and credits fl�owfreely, reverse the inversions,”he said.
Tackling illicit trade“At CBIC, we are going aggressively against illicit tradein these goods. In 202122, weseized 92,000 kg of narcoticsworth ₹�17,400 crore; we alsoseized 14 crore cigarettesticks,” said Johri.
He added that artifi�cial intelligence and data analytics
have signifi�cantly helped dealwith the growing menace ofillicit trade.
“CBIC is trying to overcomethese challenges in a systemicway, and has ramped up theuse of technology in their operations with 22 cargo scanners at 16 locations to ensure100 per cent scanning of allcontainers coming into thecountry through gatewayports,” said Johri.
Anil Rajput, Chairman,FICCI CASCADE, said illicittrade is increasingly hurtingthe Indian economy. Immediate steps are required, both inthe form of policy intervention and awareness generation, to address the menace.
“It is indeed heartening tosee how CBIC is using AI,blockchain, machine learning to strengthen the enforcement agencies in detectingsuch malpractices. Complimenting the GST council andCBIC for a wellbalanced taxpolicy and maintaining equalthrust on revenue augmentation and strict handling of taxevaders,” he said, while highlighting how this has led to effective compliance and recordbreaking collections.
Says mop up
consistently higher
than GDP rate;
ramping up
technology to deal
with illicit trade
Vivek Johri, Chairman, CBIC
CBIC chief expects average GSTcollection of ₹�1.35lakh cr this fi�scal
MEENAKSHI VERMA AMBWANI
New Delhi, May 12
TV ad volumes in the Marchquarter of this year clocked a20 per cent growth over thecorresponding quarter in2020, as per the latest data released by the Broadcast Audience Research Council (BARC)India.
Ad volumes stood at 443 million seconds across all TV channels and was almost at par withthe numbers of 2021 Marchquarter (456 million seconds).
‘Strong opening quarter’“Q1 2022 was a strong openingquarter for the year given theupward growth in January, February and March. The number
of advertisers and brands thatcontinued to engage with television viewers is also higher inQ1 2022 over Q1 2021. Televisions consistent growth in advolumes in the fi�rst quarter of2022 reaffi�rms the reach of themedium,” said Aaditya Pathak,Head – Client Partnership andRevenue Function, BARC India.
The total number of advertisers on TV in the quarter stoodat 4,259 which was higher compared to the same period in2021 (4,175). Nearly 49 per centof the advertisers in this periodwere either new or returningadvertisers on television andJanuary 2022 registered thehighest number of advertisersfor the quarter with 2,769 ad
vertisers, BARC India added. Advolumes for ecommerce grewby 40 per cent compared to Q12021; and categories like corporate brand Image, telecomproducts and education alsosaw “exponential” growth.
FMCG category saw thehighest number of advertisersat 835 on TV, while personal accessories has seen the highest
growth (17 per cent) in thenumber of advertisers. Education had the highest share (64per cent) of new and returningadvertisers, the report added.
Regional languagesIn terms of languages, advolumes on Hindi, Telugu,Oriya and English channelsclocked growth over Q1 2021.Oriya channels witnessed thehighest growth at 10 per centin terms of ad volumes compared to Q1 2021; and Bhojpurichannels registered highestgrowth (60 per cent) compared to Q1 2020.
“Tamil channels have thehighest share of exclusive advertisers at 54 per cent andHindi has the highest share ofnew and returning advertisersat 48 per cent,” the reportadded.
The FMCG category saw the highest
number of TV advertisers at 835
Bhojpuri channels registered
60% growth in ad volumes in
Q1 2022 compared to Q1 2020
TV ad volumes grow 20% in Q1 2022 overprepandemic levels: BARC India report
DALIP SINGH
New Delhi, May 12
The National Stock Exchange(NSE), during former CEOChitra Ramkrishna’s regime,allegedly favoured a brokerage fi�rm by leaking a tradingdate which allowed it to develop and accrue undue advantage from the software,the CBI probe into the largerconspiracy of rigging of colocation facility has revealed.
The exchange gave a trading date to M/s Infotech Financial Services which wasmisused for developing algorithm for tradingproducts for the securitiesmarket participants, saidSanjeev Aggarwal, special CBIcourt judge, in his Thursday’sorder denying bail to formerCEO and Group Operating Offi�cer, Anand Subramanian.
“This software was in turn,sold to various trading members, thereby giving themundue advantage,” the courtorder read.
Violation of provisionsAccording to the CBI, SEBIwholetime member SK Mo
hanty has stated that boththe accused persons —Ramkrishna and Subramanian — along with others, have violated provisionsof the SEBI Act, 1992, by off�ering dark fi�bre and leased lineconnectivity to certain stockbrokers.
The agency has apprisedthe court that its probe intothe main allegations of thecolocation scam is at a crucial stage and analysis of digital data, and examinationof witnesses was on.
Later, a supplementarychargesheet will be fi�led onsuspected preferential accessgranted to certain brokers byNSE offi�cials and undue gainsmade out of it during and before the former CEO’sregime.
‘Continued favouritism’The CBI had fi�rst fi�lled an FIRin 2018 against Sanjay Gupta,Aman Kokrady, Ajay Narottam Shah, M/s OPG SecuritiesPvt Ltd and unknown offi�cials of SEBI and NSE. However, about four years later, itstarted the probe against the
two former top functionariesof NSE after after receivingrequest from the FinanceMinistry to look into theSEBI’s February order on Subramanian’s appointment.
Between 2010 and 2014, theNSE’s server architecture(tickbytick) was abused, enabling OPG Securities Pvt Ltdto log in fi�rst to the server ofthe exchange and get thedata splitsecond faster. Besides, the brokerage fi�rm waspermitted to connect to thebackup servers which hadvery less load and therefore,were given “far better andfaster access to market feed”.
While the CBI has allegedthat the original accused per
sons had bribed some offi�cials of SEBI to get favourablereport to hide wrongdoings,the favouritism continuedduring Ramkrishna’s timetoo, as per the bail order. TheCBI is probing why OPG Securities had connected to thesecondary POP server on 670trading days in the futuresand options segment.
‘Frankenstein’s monster’Under glare is also the chargethat Ramkrishna exercisedundue infl�uence on subordinates at the NSE to “manipulate replies sent to queriesof SEBI and the secretarialauditor”, CBI Special PublicProsecutor VK Pathak had
contended to counter thebail pleas of the accused.Pulling up the NSE, the judgeobserved that the exchange“rather than burying skeletons which may later turn outto be Frankenstein’s monster, it should take the rightpath to restore its glory”,since the FIIs are waiting forthe bourse to redeem itself toinvest more in the country.
On the former CEO’s interaction with the mysterious“Himalayan guru”, the CBIsaid it has been establishedthat Subramanian had created the email ID —[email protected]— on March 10, 2013. And itwas used to communicateand seek guidance on theNSE matters to further thescam. The CBI has soughtmetadata and content heldin the email ID from Microsoft Inc headquarters inthe United States.
However, to seek Subramanian’s bail, his counselstated the CBI has not established any link or nexusbetween his appointment atthe NSE and sharing ofemails and information bybrokers which could point toalleged commission ofcrimes with regard to colocation scam.
Pulling up the NSE, the special court
judge observed that the exchange ‘must
take the right path to restore its glory’
Agency has apprised that its probe into allegations is at a crucial stage
Co-lo scam: CBI names firms that got ‘undue advantage’
KR SRIVATS
New Delhi, May 12
In just over a month since itsenactment by the Parliament, the Centre has put intoeff�ect most provisions of theChartered Accountantsamendment, the Cost andWorks Accountants and theCompany Secretaries(amendment) Act, 2022.
It may be recalled that theAct had, among otherchanges, sought to overhaulthe disciplinary mechanismin three professional bodies— chartered accountants,company secretaries and costaccountant institutes. Themain intent of this law is tobring more transparency in
the functioning of the institutes, especially their disciplinary matters and raise thequality of disciplinaryprocess.
Key changesThe Corporate Aff�airs Ministry has now passed an executive order to bring mostprovisions of this amendment Act into force from May10, sources said. However, thecrucial provisions thatbrought changes to the disciplinary mechanism in thethree institutes are notcovered in the latest move,they added.
With the Parliament having passed the Act, a non
member would become thepresiding offi�cer of the disciplinary committee in theseinstitutes. However, a solacefor the institutes is that thegovernment would be appointing the offi�cer only outof the names recommendedby their respective CentralCouncil.
As part of the revamp ofthe disciplinary committee,the law had brought achange in its composition soas to introduce a 2+3 formula(two institute nominees andthree noninstitute members) instead of the earliercomposition of 3+2 (three institute members and twogovernment nominees).
It maybe recalled that theCA Institute had said — priorto the enactment of the law—that the disciplinary committee revamp, proposed in theBill, was not the best outcome for it and therefore,had written to the Ministryof Corporate Aff�airs seeking arelook at the provision.
The ICAI had preferred continuation of the earlier 3+2formula .Also, it had submitted that the presiding offi�cerhas to be a member of the institute and a chartered accountant for the disciplinarymechanism to work effi�ciently. However, these viewsdid not fi�nd acceptance withthe Centre.
Most provisions of CA amendment Act come into effect
OUR BUREAU
Mumbai, May 12
While the Reserve Bank of India(RBI) has highlighted concernsover cryptocurrencies fromtime to time, it has not issuedany instruction going againstthe Supreme Court’s order.
Coinbase CEO and cofounder Brian Armstrong hadrecently said informal pressurefrom the RBI led the globalcrypto exchange to disable UPIdeposits, a few days after its India launch. However, a personin the know pointed out thatthe RBI has only publicly highlighted its concerns oncryptocurrencies.
Highlighting concerns“Considering its prime responsibility of maintaining fi�nancial stability and the risks incryptocurrency transactionslike their possible use for illicitactivities, price volatility, lack ofcustomer protection, RBI haspublicly highlighted its concerns,” the source said.
The RBI in its May 31, 2021, circular had stated that in view ofthe Supreme Court order, its circular of April 6, 2018, which imposed restrictions on regulatedentities in dealing with virtualcurrencies, is no longer validfrom the date of the judgment.
‘Unique market’Armstrong, in the company’searnings call, had noted that India is a unique market in thesense that the Supreme Courthas ruled they can’t ban crypto.“But there are elements in thegovernment there, includingthe RBI who don’t seem to bepositive about it. And so, it’sbeen called a “shadow ban”,” hehad said.
RBI ‘hasn’t issuedany instructionagainst SC order’on crypto trading

................BM-BMECMYK
MUMBAI
4 BusinessLine FRIDAY • MAY 13 • 2022THINK
Published by N. Ravi at Kasturi Buildings, 859 & 860, Anna Salai, Chennai-600002 and Printed by N. Vaidyanathan at Dangat Media Pvt Ltd, No. 22, Dighe MIDC, Vishnu Nagar, TTC Industrial Area, Dighe, Navi Mumbai-400701 on behalf of THG PUBLISHING PVT LTD., Chennai-600002. Editor: Raghuvir Srinivasan (Editor responsible for selection of news under the PRB Act). ISSN 0971 - 7528
The Ministry of Electronics and Information Technology’s (MeitY) directions tovirtual private network (VPN) serviceproviders are signifi�cant. They say that
VPN providers should store data of Indian usersfor up to fi�ve years; this reinforces the importanceof striking a balance between the need to protectuser privacy and the government’s legitimate requirement to access data for cyber security. VPN isused to hide location as well as encrypt information being transferred between the sender and receiver. This can be the data of an enterprise sentover a cloud network and storage, or two individuals exchanging fi�les. On the one hand, this serviceis extremely useful for users accessing the Internet over public WiFi systems but on the otherhand, the endtoend encryption makes it a lethalweapon in the hands of cybercriminals. The bigworry for security agencies across the world isthat VPNs allow criminals to transmit datawithout fear of getting their IP addresses traced.
For example, law enforcement agencies inEurope banned a VPN service provider last yearafter it was discovered that cybercriminals wereusing the platform. This also has commercialramifi�cations for businesses like Netfl�ix and othercontent providers that have geographical restrictions. For example, a user in India can use VPN andpretend to be a Netfl�ix subscriber in the US towatch content that may be restricted in this country. Last year the Parliamentary Standing Committee on Home Aff�airs had even suggested banningVPN in India to counter cyber threats and othernefarious activities. However, VPN also helps companies, government agencies, and individuals encrypt data transmitted over the internet. It prevents any snooping and information tapping byexternal sources while the data is in transit.
The Centre itself had liberalised rules last yearfor the IT industry to enable them to work fromhome using VPN platforms. VPN adoption hasjumped manifold in India in the fi�rst half of 2021as companies moved to secure communicationnetworks as more employees worked from home.The number of VPN installations soared to 348.7million as at Juneend 2021 against 45.24 millionas at Decemberend 2020, according to Atlas VPN’sGlobal VPN Adoption Index. India ranked fourthamong 85 countries in the VPN penetration ratefor H1 2021. While the government’s securityneeds are understandable, banning VPN servicesis not a good idea. Asking VPN service providers tostore user data may not be desirable either, especially since the proposed Personal Data ProtectionBill is yet to be passed by the Parliament. TheCentre can, however, take other measures to ensure that cybercriminals do not hide behind a VPNplatform. This can be done through a consultativeprocess not just with VPN players but also withglobal law enforcement agencies. Rules can beframed that puts the onus on VPN service providers for keeping their platforms safe. For instance, The Information Technology (Intermediary Guidelines and Digital Media Ethics Code)Rules, 2021 ( IT rules) announced in February 2021puts in a framework that brings in transparencyin terms of the responsibilities and duties of theinternet intermediaries including Twitter andFacebook. VPN companies should cooperate withlawmakers in building such a framework.
Network effects
Virtual private networks need regulation tocheck cybercrime, while protecting data privacy
0xy z
friday, may 13, 2022
R GOPALAN/MC SINGHI
There has been a lot of discussion on the possibleadverse impact of thethree major structural
changes in the Indian economy, —demonetisation, introduction ofGoods & Services Tax and pandemicand the related lockdown on the informal sector in the economy.
How did these three events impact the informal sector?
The National Accounts do not perse defi�ne informal sector. Itprovides disaggregate data forGross Value Added, Gross CapitalFormation (fi�xed capital formationand overall including the inventories and stocks), Net capital stock(fi�xed capital stock and overall forpublic sector, private corporate sector and the households).
The households sector comprising own account enterprises andother unincorporated ones, is usually taken to correspond the informal sector. The Periodic LabourForce Survey report of 201920 (July2019 to June 2020), has defi�ned informal sector to cover partnershipand propriety enterprises as informal sector, though it has recognised informal employment informal sectors as well based on labour conditions and terms of service. The survey has estimated 77.1per cent of the total workforce tohave been engaged in informal sector. Agriculture, construction, tradeand road transport are the dominant sectors in this segment.
Shift in household sector sharesNotwithstanding the recent policyrelated changes and the pandemic,there is hardly any evidence of anysignifi�cant decline in the share ofinformal sector in the economy. Asper the fi�rst revised estimates of National Accounts released on January31, 2022, the overall share in grossvalue added (GVA) of the householdsector has declined from 45.5 percent in 201112 to 43.5 per cent in202021. In fact this share has generally been stable at 44 per cent since201516, prior to demonetisationand GST.
Even pandemic which resulted in
a decline in GVA in 202021, did notaff�ect the share of household sector.Overall growth of GVA of 8.8 percent during 201112 to 202021 ofhousehold sector at current priceswas only a shade lower than theeconomy wide growth of 9.3 percent during this period. The shareof non agriculture GVA of household sector, however, witnessed asharper fall, particularly in 202021.The share of the household sectorin gross capital formation (GCF),however, witnessed a consistent fallfrom 43.3 per cent in 201112 to 39.0per cent in 202021, due to perhapslower average annual growth.
Overall GCF growth of householdsector during 201112 to 202021 at4.4 per cent was signifi�cantly lowerthan the economy wide growth of5.6 per cent. The observed GCFlevels were, to a considerable extent, facilitated by a higher growthof 9 per cent of the public sector, including the core government. Theshare of household sector had in201516 decelerated to 31.2 per centbecause of a negative growth in GCFin that year.
While this decline may be due tothe inclusion of results of survey ofunincorporated nonagricultureenterprises that was released then,it is hard to explain an upsurge laterin 201617 and 201718. With availab
ility of data from a new survey likelyto come in future, we may perhapssee corrections to these numbers aswell.
Demonetisation, GST and pandemic in fact witnessed an increasein share of GCF post 201516 on acontinuous basis. The share ofhousehold sector in fi�xed and totalcapital stock had continued to riseuntil 201920 (the latest year forwhich this data is available). Thisbeing a stock variable and indicative of capital accumulation, a loweraccretion may not aff�ect the overallstock.
There has, however, been a sharpdecline in share of outstanding nonfood bank credit to sectors predominantly in the informal sector, butsuch decline is seen in post pandemic period and not during demonetisation of GST. This share,however, shows some improvement in the current year and was28.4 per cent as on end December2021, an increase of 2 percentagepoints. Based on shift in shares,pandemic has indeed aff�ected theinformal sector more thanproportionately.
Inter-sectoral sharesWhile there is near doubling of theshare of household sector in theactivity group ‘utility services’ com
prising electricity, gas, water supplyand other utility services, there is asharp decline in the share in ‘RealEstate and Professional Services’.
Household sector had no presence in fi�nancial services and services of public administration anddefence. The dominant position ofhousehold sector continued in201920 for agriculture and alliedactivities; construction; road transport; and trade and hotels.
While a decline in the share inprofessional services, includingreal estate services, may be due toconsolidation under demand pressure, an increase in the share in utility services is somewhat diffi�cult toexplain.
While the new initiatives on water supply and sanitation, coverageof households for other sources offuel has raised the share of thisactivity in 201920 to 2.6 per centfrom 2.3 per cent in 201112, which isindicative of wider inclusion in service generation and delivery.
For GCF, share of household sector has increased in activity groupsof mining and quarrying; construction; trade and hotels; and to an extent in other services, but it has declined for transport, storage andcommunication; and real estateand professional services.
Increase in the share in GCF in
certain sectors is indicative of increasing importance of minor minerals for construction, increasedemphasis on housing in rural andurban areas and increased opportunities in trade.
These two activity groups oftrade and hotels, being contact intensive sectors may, however, faceerosion in generation of capitalduring pandemic and post pandemic period. This perception canonly be validated by the next seriesof NAS.
However, a consistent increase inthe share of household sector inoverall GCF since 201516 and until202021(which has been the most affected pandemic year), suggeststhat sectoral shift in shares may notperhaps be signifi�cant.
Further, from the disaggregatedNAS data available now, it is diffi�cultto attribute such shifts to the threestructural factors of demonetisation, GST and the pandemic.
Third, the low share of agriculture and allied sector in capitalstock relative to their share in GVAis a historical fact and the share ofhousehold sector has also been inline with this trend.
An increase in the share of household sector in activity groups mining, construction and trade and hotels is also in line with theirincrease in share in GCF as capitalstock is nothing but the accumulated capital formation.
However, a sharp increase in theshare of household sector in capitalstock in activity group other services is perhaps indicative of expansion of household activities in thissector covering hospitality services,education and personal care. Theimpact of pandemic on these activities is mixed. The current data,however, do not suggest any collapse of household or informal sector, as is being made out.
However, we need to wait for National Accounts 2022 report and theReport of the Survey of unincorporated enterprises which is underwayto have a defi�nitive view about this.
Gopalan is a former Finance Secretary,
and Singhi is a former Senior
Economic Adviser, Ministry of Finance
There seems to be no discernible change in share of informal sector due to note ban, GST or the pandemic
Informal sector — the perception and the data
L BADRI NARAYANAN/HEMANT KRISHNA
The Metaverse, as is currently understood, refersloosely to virtual spacesthat may or may not
mimic reallife environments, andare characterised by interactivepossibilities of social media and online gaming and are powered by thetechnologies of blockchain, cryptocurrency, augmented reality andvirtual reality.
The Metaverse promises a notsodistant future in which people canwear their virtual reality (VR) headsets, glasses and wrist bands and socialise, work collaboratively, adoptavatars, play games, walk throughvirtual parks and jungles, meet atvirtual coff�ee shops, hold meetingsin virtual boardrooms, dance at virtual nightclubs, and attend concerts with friends virtually amongother things.
The very concept of the Metaverse throws up a variety of questions on the interplay between existing legal frameworks and issuesof ownership, transfer of value, protection of rights and infringementon the Metaverse. Of these, intellec
tual property issues are particularlyrelevant since the Metaverse encapsulates a range of technologies, literary and artistic works, designs, logos, symbols and imagery, most ofwhich have historically been protected under intellectual propertylaw regimes.
In the US, wellknown brandssuch as McDonalds, Nike, Walmart,Crocs, and Skechers, as well as unknown and independent applicants have been making a beeline toregister trademarks for their Metaverse off�erings. Some of thesebrands have also been exploringthe use of NFTs or nonfungibletokens to assert their intellectualproperty rights.
Cases galoreThe recent lawsuit involving fi�lmmaker Quentin Tarantino’s proposed public auction of a NFT of thescreenplay of Pulp Fiction, whichwas challenged by Miramax ongrounds of infringement of trademark and copyright, laid bare theproblem of applying traditional intellectual property laws to newtechnologies.
One question that frequently
comes up in discussions of theMetaverse is around who owns theright to create and commerciallyexploit virtual digital assets. Thereis growing consensus among intellectual property lawyers across theglobe that, in the absence of contractual mechanisms to conveycopyright, a mere purchase of anNFT does not entitle a buyer to copyright. But is copyright over an artwork a prerequisite for a party to issue a NFT over such artwork?
This question has come up beforethe Southern District Court of New
York recently. The administrators ofthe estate of the Indian artist, MFHusain, challenged the right ofTamarindArt LLC, the buyer of Husain’s painting called ‘Lightning’, toproceed with a project involvingthe sale of NFTs based on the artwork.
TamarindArt holds exclusive,worldwide, royaltyfree licence toreproduce the artwork in anyformat including digital formatsbut the estate administrators issued a ceaseanddesist notice toTamarindArt arguing that the latterwas not the ‘copyright owner’ andhad no right to reproduce the artwork, distribute copies, create derivative works based on it or displayit publicly.
Even as courts grapple with questions of how archaic intellectualproperty laws can be applied to protect intangible property on theMetaverse, there is no dearth ofplayers in the market innovating atthe edges of this fastevolvingparadigm.
In late 2019, Nike obtained a patent called ‘Cryptokicks’, which consists of a blockchain mechanismthrough which digital assets such
as NFTs can be linked to specifi�cphysical products such as sneakers.Eff�ectively, when one buys a pair ofphysical sneakers, they will also geta cryptographic token representingthe ownership of the physical pairof sneakers and such tokens can bestored in a cryptocurrency walletand transferred to other parties.But can a cryptographic token beused to prove ownership in a courtof law?
While the Metaverse is openingnew and exciting avenues forartists, creators, brands and consumers of new technology, theproblem of how to protect intangible property on the Metaversecontinues to loom large. The key tosolving this problem lies in recognising that while existing frameworks to protect intellectual property rely heavily on centralisedauthority involving regulators andcourts, the Metaverse is based on avision of a decentralised internetwith a preference for distributedconsensus mechanisms.
Narayanan is Executive Partner, and
Krishna is Partner, Lakshmikumaran &
Sridharan Attorneys
Protecting intellectual property in MetaverseThough Metaverse has thrown up opportunities for artists and brands, many legal issues need to be sorted out
Meta Decentralised internet REUTERS
SC’s welcome move
With reference to ‘SC suspends trials under sedition law’, the apexcourt decision is welcome, whichwill have a far reaching implications on civil rights.
Because now no further FIR canbe fi�led under section 124A and allpending cases would be kept inabeyance.
Given the misuse of this law,there needs to be a balance national security and personal liberties. But how long will the government take to reconsider thisprovision and come up with newlaw?
The government would do wellto have detailed discussions withall key stakeholders, including opposition before framing a new law. Bal GovindNoida
Act and deact
This refers to the report “SC haltstrials under colonial era seditionlaw” (May 12). The Apex Court hasdone well to suspend the operation of antiquated Act. It will compel the procrastinating government to repeal or amend the lawexpeditiously.
Since 2010 there have been 867cases against 13,306 accused out ofwhich Jharkhand, Tamil Nadu, Bihar, UP and Haryana account forover 60 per cent of number of accused. However, conviction ratehas been poor ranging from 3 percent to 33 per cent annually withan average of 20 per cent between2014 and 2020. About 20 per centcases were found to be false or mistaken or they lacked evidence. Percentage of cases pending with police or courts is also higharound
7085 percent on yearly basis. Allthis proves the ineff�ectiveness ofthe law. YG Chouksey Pune
Boosting PSU banks
Apropos 'Fasttracking PSU bankreforms' (May 12), several measures have been taken in the recentpast to bring up the ailing PSBs toequip them to compete with others. PSBs are facing issues rangingfrom digitalisation, mountingNPAs, staff� mix and inadequatecapital. Merger and acquisitionhave not proved eff�ective.
Meeting customers’ expectations is another major factor forPSU banks. The older clientele stillprefers visiting bank branches fortheir transactions.
Attitudes of employees do also
play a major role in shaping thebanks. Those who joined the service upto 1990s had their loyaltytowards the institution they belong to. Post 2000, given opportunities available now, many hopbetween jobs adding to the employers’ burden.RV BaskaranChennai
The roiling rupee
This refers to your editorial “Rupeetantrums” (May 12). While severalfactors like growing infl�ation,widening CAD could be attributedto the rupee’s fall , forex reserves ofabout $600 billion is not necessarily a comforting factor.
Unlike forex reserves built basedon export surplus which are stablein nature, FII and FPI are hotmoney which may fl�ow out of a
country at short notice. The factthat overseas investors havepulled more than ₹�1 lakh crore inthe current year proves the vulnerability of such infl�ows. Externalfactors like rise in global crude oilprice are putting pressure on therupee, unless the government decides to rationalise tax rates andcurb money supply it might provechallenging to arrest the downfallof rupee. Overseas borrowingswould prove costly if rupee continues its fall. Since the dollar dominates India’s forex reserves, the USFed’s policy moveswill have adverse impact on Redollar rates.
It is time for the governmentand RBI to work in unison to address this issue through suitablepolicy measures.Srinivasan VelamurChennai
LET TERS TO THE EDITOR Send your letters by email to [email protected] or by post to ‘Letters to the Editor’, The Hindu Business Line, Kasturi Buildings, 859-860, Anna Salai, Chennai 600002.
POCKET RAVIKANTH
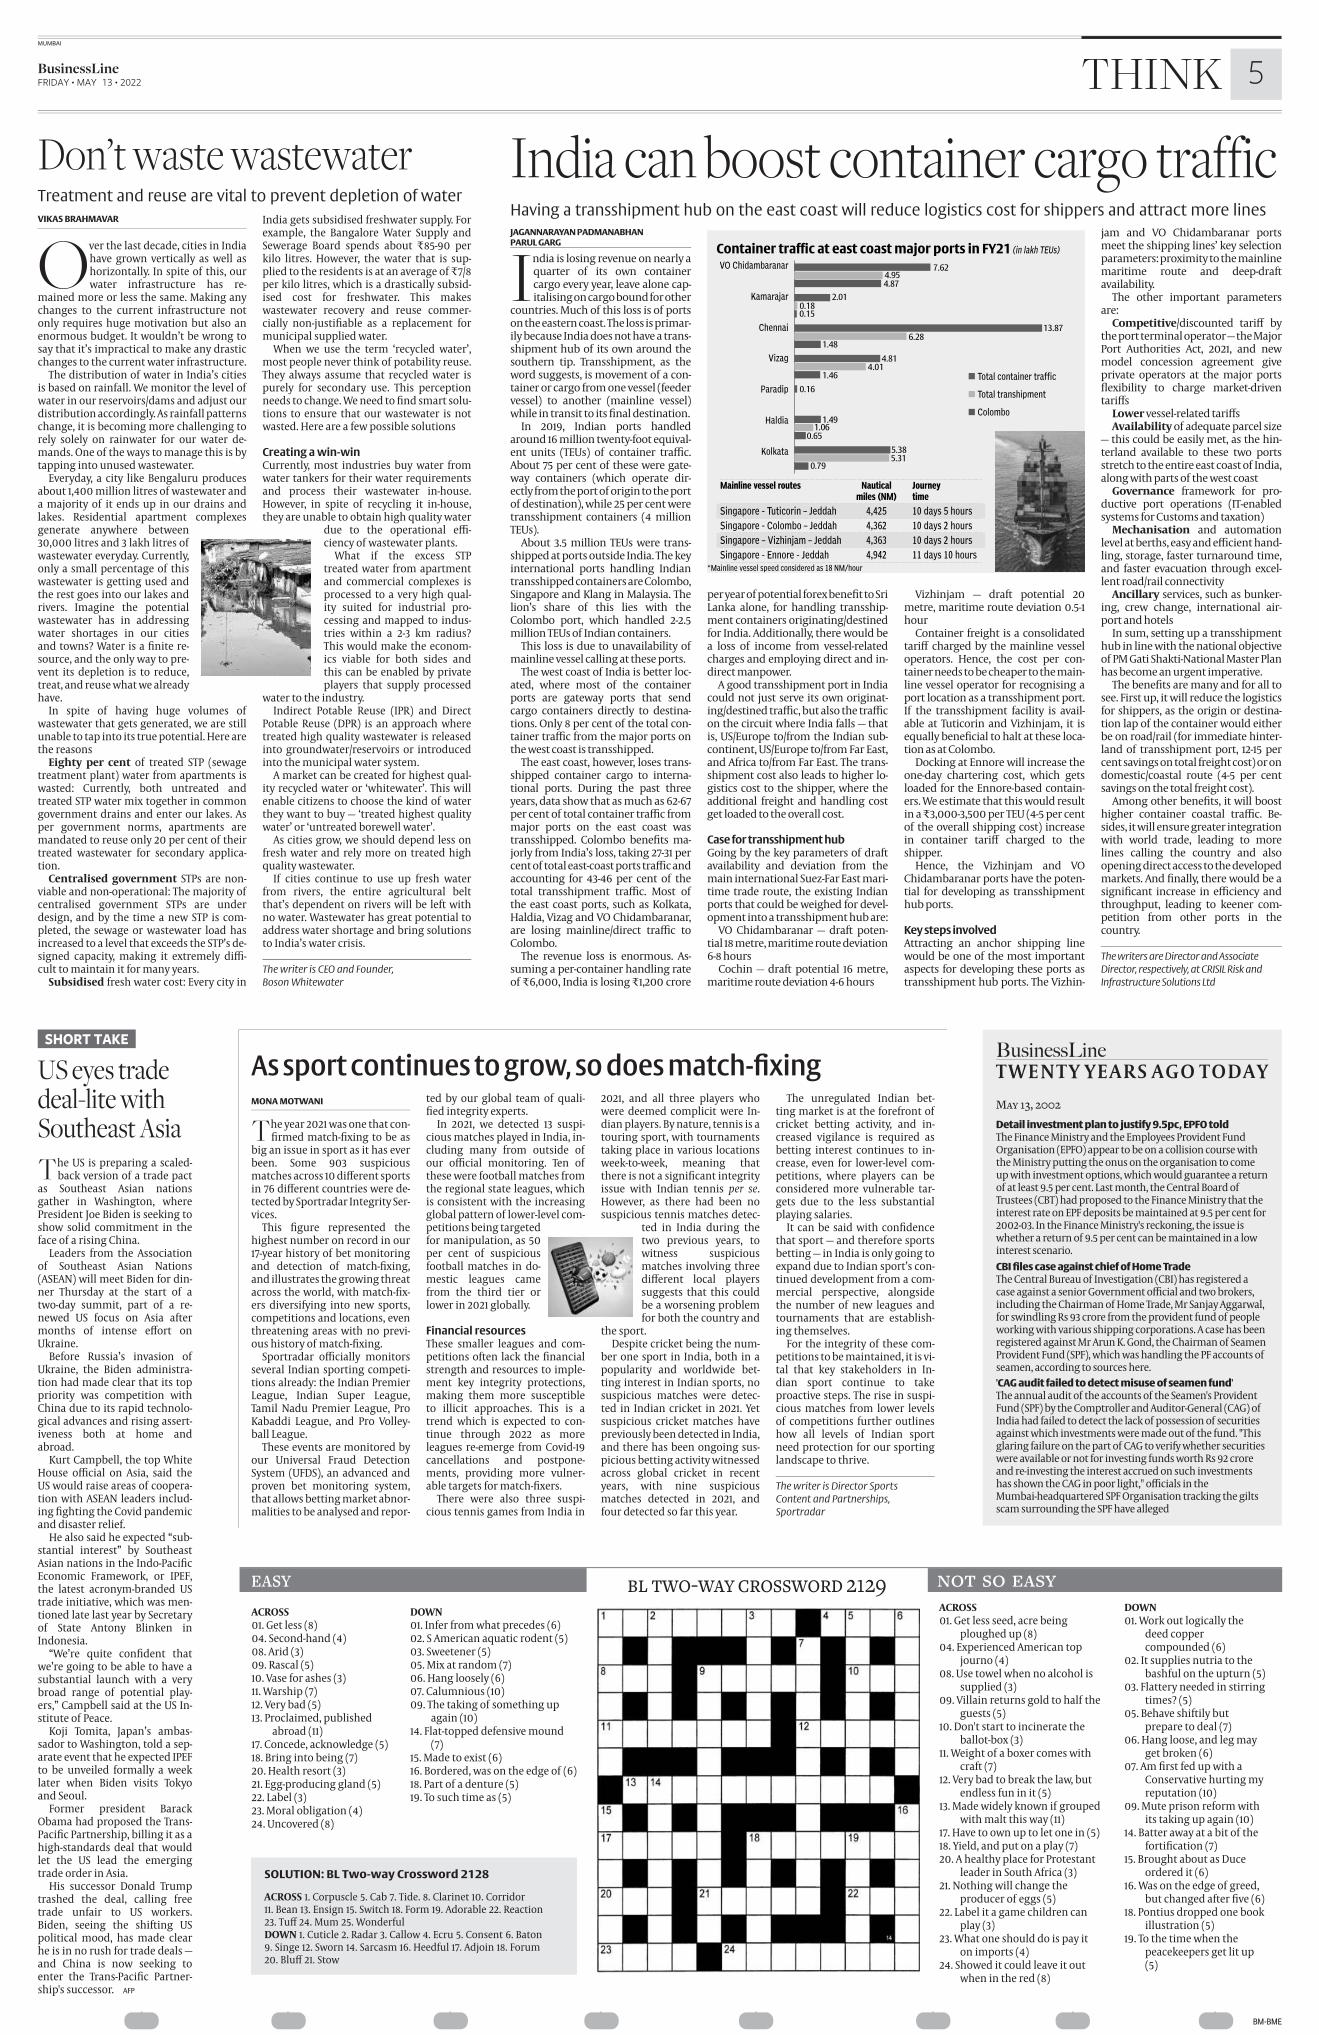
................BM-BMECMYK
MUMBAI
BusinessLineFRIDAY • MAY 13 • 2022 5THINK
ACROSS
01. Get less (8) 04. Secondhand (4) 08. Arid (3) 09. Rascal (5) 10. Vase for ashes (3) 11. Warship (7) 12. Very bad (5) 13. Proclaimed, published
abroad (11) 17. Concede, acknowledge (5) 18. Bring into being (7) 20. Health resort (3) 21. Eggproducing gland (5) 22. Label (3) 23. Moral obligation (4) 24. Uncovered (8)
DOWN
01. Infer from what precedes (6) 02. S American aquatic rodent (5) 03. Sweetener (5) 05. Mix at random (7) 06. Hang loosely (6) 07. Calumnious (10) 09. The taking of something up
again (10) 14. Flattopped defensive mound
(7) 15. Made to exist (6) 16. Bordered, was on the edge of (6) 18. Part of a denture (5) 19. To such time as (5)
ACROSS 01. Get less seed, acre being
ploughed up (8) 04. Experienced American top
journo (4) 08. Use towel when no alcohol is
supplied (3) 09. Villain returns gold to half the
guests (5) 10. Don't start to incinerate the
ballotbox (3) 11. Weight of a boxer comes with
craft (7) 12. Very bad to break the law, but
endless fun in it (5) 13. Made widely known if grouped
with malt this way (11) 17. Have to own up to let one in (5) 18. Yield, and put on a play (7) 20. A healthy place for Protestant
leader in South Africa (3) 21. Nothing will change the
producer of eggs (5) 22. Label it a game children can
play (3) 23. What one should do is pay it
on imports (4) 24. Showed it could leave it out
when in the red (8)
DOWN01. Work out logically the
deed coppercompounded (6)
02. It supplies nutria to thebashful on the upturn (5)
03. Flattery needed in stirringtimes? (5)
05. Behave shiftily butprepare to deal (7)
06. Hang loose, and leg mayget broken (6)
07. Am fi�rst fed up with aConservative hurting myreputation (10)
09. Mute prison reform withits taking up again (10)
14. Batter away at a bit of thefortifi�cation (7)
15. Brought about as Duceordered it (6)
16. Was on the edge of greed,but changed after fi�ve (6)
18. Pontius dropped one bookillustration (5)
19. To the time when thepeacekeepers get lit up(5)
easy not so easy
ACROSS 1. Corpuscle 5. Cab 7. Tide. 8. Clarinet 10. Corridor 11. Bean 13. Ensign 15. Switch 18. Form 19. Adorable 22. Reaction 23. Tuff� 24. Mum 25. Wonderful DOWN 1. Cuticle 2. Radar 3. Callow 4. Ecru 5. Consent 6. Baton 9. Singe 12. Sworn 14. Sarcasm 16. Heedful 17. Adjoin 18. Forum 20. Bluff� 21. Stow
bl two-way crossword 2129
SOLUTION: BL Two-way Crossword 2128
VIKAS BRAHMAVAR
Over the last decade, cities in Indiahave grown vertically as well ashorizontally. In spite of this, ourwater infrastructure has re
mained more or less the same. Making anychanges to the current infrastructure notonly requires huge motivation but also anenormous budget. It wouldn’t be wrong tosay that it’s impractical to make any drasticchanges to the current water infrastructure.
The distribution of water in India’s citiesis based on rainfall. We monitor the level ofwater in our reservoirs/dams and adjust ourdistribution accordingly. As rainfall patternschange, it is becoming more challenging torely solely on rainwater for our water demands. One of the ways to manage this is bytapping into unused wastewater.
Everyday, a city like Bengaluru producesabout 1,400 million litres of wastewater anda majority of it ends up in our drains andlakes. Residential apartment complexesgenerate anywhere between30,000 litres and 3 lakh litres ofwastewater everyday. Currently,only a small percentage of thiswastewater is getting used andthe rest goes into our lakes andrivers. Imagine the potentialwastewater has in addressingwater shortages in our citiesand towns? Water is a fi�nite resource, and the only way to prevent its depletion is to reduce,treat, and reuse what we alreadyhave.
In spite of having huge volumes ofwastewater that gets generated, we are stillunable to tap into its true potential. Here arethe reasons
Eighty per cent of treated STP (sewagetreatment plant) water from apartments iswasted: Currently, both untreated andtreated STP water mix together in commongovernment drains and enter our lakes. Asper government norms, apartments aremandated to reuse only 20 per cent of theirtreated wastewater for secondary application.
Centralised government STPs are nonviable and nonoperational: The majority ofcentralised government STPs are underdesign, and by the time a new STP is completed, the sewage or wastewater load hasincreased to a level that exceeds the STP’s designed capacity, making it extremely diffi�cult to maintain it for many years.
Subsidised fresh water cost: Every city in
India gets subsidised freshwater supply. Forexample, the Bangalore Water Supply andSewerage Board spends about ₹�8590 perkilo litres. However, the water that is supplied to the residents is at an average of ₹�7/8per kilo litres, which is a drastically subsidised cost for freshwater. This makeswastewater recovery and reuse commercially nonjustifi�able as a replacement formunicipal supplied water.
When we use the term ‘recycled water’,most people never think of potability reuse.They always assume that recycled water ispurely for secondary use. This perceptionneeds to change. We need to fi�nd smart solutions to ensure that our wastewater is notwasted. Here are a few possible solutions
Creating a win-winCurrently, most industries buy water fromwater tankers for their water requirementsand process their wastewater inhouse.However, in spite of recycling it inhouse,they are unable to obtain high quality water
due to the operational effi�ciency of wastewater plants.
What if the excess STPtreated water from apartmentand commercial complexes isprocessed to a very high quality suited for industrial processing and mapped to industries within a 23 km radius?This would make the economics viable for both sides andthis can be enabled by privateplayers that supply processed
water to the industry.Indirect Potable Reuse (IPR) and Direct
Potable Reuse (DPR) is an approach wheretreated high quality wastewater is releasedinto groundwater/reservoirs or introducedinto the municipal water system.
A market can be created for highest quality recycled water or ‘whitewater’. This willenable citizens to choose the kind of waterthey want to buy — ‘treated highest qualitywater’ or ‘untreated borewell water’.
As cities grow, we should depend less onfresh water and rely more on treated highquality wastewater.
If cities continue to use up fresh waterfrom rivers, the entire agricultural beltthat’s dependent on rivers will be left withno water. Wastewater has great potential toaddress water shortage and bring solutionsto India’s water crisis.
The writer is CEO and Founder,
Boson Whitewater
Don’t waste wastewaterTreatment and reuse are vital to prevent depletion of water
JAGANNARAYAN PADMANABHANPARUL GARG
India is losing revenue on nearly aquarter of its own containercargo every year, leave alone capitalising on cargo bound for other
countries. Much of this loss is of portson the eastern coast. The loss is primarily because India does not have a transshipment hub of its own around thesouthern tip. Transshipment, as theword suggests, is movement of a container or cargo from one vessel (feedervessel) to another (mainline vessel)while in transit to its fi�nal destination.
In 2019, Indian ports handledaround 16 million twentyfoot equivalent units (TEUs) of container traffi�c.About 75 per cent of these were gateway containers (which operate directly from the port of origin to the portof destination), while 25 per cent weretransshipment containers (4 millionTEUs).
About 3.5 million TEUs were transshipped at ports outside India. The keyinternational ports handling Indiantransshipped containers are Colombo,Singapore and Klang in Malaysia. Thelion’s share of this lies with theColombo port, which handled 22.5million TEUs of Indian containers.
This loss is due to unavailability ofmainline vessel calling at these ports.
The west coast of India is better located, where most of the containerports are gateway ports that sendcargo containers directly to destinations. Only 8 per cent of the total container traffi�c from the major ports onthe west coast is transshipped.
The east coast, however, loses transshipped container cargo to international ports. During the past threeyears, data show that as much as 6267per cent of total container traffi�c frommajor ports on the east coast wastransshipped. Colombo benefi�ts majorly from India’s loss, taking 2731 percent of total eastcoast ports traffi�c andaccounting for 4346 per cent of thetotal transshipment traffi�c. Most ofthe east coast ports, such as Kolkata,Haldia, Vizag and VO Chidambaranar,are losing mainline/direct traffi�c toColombo.
The revenue loss is enormous. Assuming a percontainer handling rateof ₹�6,000, India is losing ₹�1,200 crore
per year of potential forex benefi�t to SriLanka alone, for handling transshipment containers originating/destinedfor India. Additionally, there would bea loss of income from vesselrelatedcharges and employing direct and indirect manpower.
A good transshipment port in Indiacould not just serve its own originating/destined traffi�c, but also the traffi�con the circuit where India falls — thatis, US/Europe to/from the Indian subcontinent, US/Europe to/from Far East,and Africa to/from Far East. The transshipment cost also leads to higher logistics cost to the shipper, where theadditional freight and handling costget loaded to the overall cost.
Case for transshipment hubGoing by the key parameters of draftavailability and deviation from themain international SuezFar East maritime trade route, the existing Indianports that could be weighed for development into a transshipment hub are:
VO Chidambaranar — draft potential 18 metre, maritime route deviation68 hours
Cochin — draft potential 16 metre,maritime route deviation 46 hours
Vizhinjam — draft potential 20metre, maritime route deviation 0.51hour
Container freight is a consolidatedtariff� charged by the mainline vesseloperators. Hence, the cost per container needs to be cheaper to the mainline vessel operator for recognising aport location as a transshipment port.If the transshipment facility is available at Tuticorin and Vizhinjam, it isequally benefi�cial to halt at these location as at Colombo.
Docking at Ennore will increase theoneday chartering cost, which getsloaded for the Ennorebased containers. We estimate that this would resultin a ₹�3,0003,500 per TEU (45 per centof the overall shipping cost) increasein container tariff� charged to theshipper.
Hence, the Vizhinjam and VOChidambaranar ports have the potential for developing as transshipmenthub ports.
Key steps involvedAttracting an anchor shipping linewould be one of the most importantaspects for developing these ports astransshipment hub ports. The Vizhin
jam and VO Chidambaranar portsmeet the shipping lines’ key selectionparameters: proximity to the mainlinemaritime route and deepdraftavailability.
The other important parametersare:
Competitive/discounted tariff� bythe port terminal operator — the MajorPort Authorities Act, 2021, and newmodel concession agreement giveprivate operators at the major portsfl�exibility to charge marketdriventariff�s
Lower vesselrelated tariff�sAvailability of adequate parcel size
— this could be easily met, as the hinterland available to these two portsstretch to the entire east coast of India,along with parts of the west coast
Governance framework for productive port operations (ITenabledsystems for Customs and taxation)
Mechanisation and automationlevel at berths, easy and effi�cient handling, storage, faster turnaround time,and faster evacuation through excellent road/rail connectivity
Ancillary services, such as bunkering, crew change, international airport and hotels
In sum, setting up a transshipmenthub in line with the national objectiveof PM Gati ShaktiNational Master Planhas become an urgent imperative.
The benefi�ts are many and for all tosee. First up, it will reduce the logisticsfor shippers, as the origin or destination lap of the container would eitherbe on road/rail (for immediate hinterland of transshipment port, 1215 percent savings on total freight cost) or ondomestic/coastal route (45 per centsavings on the total freight cost).
Among other benefi�ts, it will boosthigher container coastal traffi�c. Besides, it will ensure greater integrationwith world trade, leading to morelines calling the country and alsoopening direct access to the developedmarkets. And fi�nally, there would be asignifi�cant increase in effi�ciency andthroughput, leading to keener competition from other ports in thecountry.
The writers are Director and Associate
Director, respectively, at CRISIL Risk and
Infrastructure Solutions Ltd
India can boost container cargo trafficHaving a transshipment hub on the east coast will reduce logistics cost for shippers and attract more lines
May 13, 2002
Detail investment plan to justify 9.5pc, EPFO toldThe Finance Ministry and the Employees Provident FundOrganisation (EPFO) appear to be on a collision course withthe Ministry putting the onus on the organisation to comeup with investment options, which would guarantee a returnof at least 9.5 per cent. Last month, the Central Board ofTrustees (CBT) had proposed to the Finance Ministry that theinterest rate on EPF deposits be maintained at 9.5 per cent for200203. In the Finance Ministry's reckoning, the issue iswhether a return of 9.5 per cent can be maintained in a lowinterest scenario.
CBI files case against chief of Home TradeThe Central Bureau of Investigation (CBI) has registered acase against a senior Government offi�cial and two brokers,including the Chairman of Home Trade, Mr Sanjay Aggarwal,for swindling Rs 93 crore from the provident fund of peopleworking with various shipping corporations. A case has beenregistered against Mr Arun K. Gond, the Chairman of SeamenProvident Fund (SPF), which was handling the PF accounts ofseamen, according to sources here.
'CAG audit failed to detect misuse of seamen fund'The annual audit of the accounts of the Seamen's ProvidentFund (SPF) by the Comptroller and AuditorGeneral (CAG) ofIndia had failed to detect the lack of possession of securitiesagainst which investments were made out of the fund. "Thisglaring failure on the part of CAG to verify whether securitieswere available or not for investing funds worth Rs 92 croreand reinvesting the interest accrued on such investmentshas shown the CAG in poor light," offi�cials in theMumbaiheadquartered SPF Organisation tracking the giltsscam surrounding the SPF have alleged
TWENTY YEARS AGO TODAY
BusinessLine
MONA MOTWANI
The year 2021 was one that confi�rmed matchfi�xing to be as
big an issue in sport as it has everbeen. Some 903 suspiciousmatches across 10 diff�erent sportsin 76 diff�erent countries were detected by Sportradar Integrity Services.
This fi�gure represented thehighest number on record in our17year history of bet monitoringand detection of matchfi�xing,and illustrates the growing threatacross the world, with matchfi�xers diversifying into new sports,competitions and locations, eventhreatening areas with no previous history of matchfi�xing.
Sportradar offi�cially monitorsseveral Indian sporting competitions already: the Indian PremierLeague, Indian Super League,Tamil Nadu Premier League, ProKabaddi League, and Pro Volleyball League.
These events are monitored byour Universal Fraud DetectionSystem (UFDS), an advanced andproven bet monitoring system,that allows betting market abnormalities to be analysed and repor
ted by our global team of qualifi�ed integrity experts.
In 2021, we detected 13 suspicious matches played in India, including many from outside ofour offi�cial monitoring. Ten ofthese were football matches fromthe regional state leagues, whichis consistent with the increasingglobal pattern of lowerlevel competitions being targetedfor manipulation, as 50per cent of suspiciousfootball matches in domestic leagues camefrom the third tier orlower in 2021 globally.
Financial resourcesThese smaller leagues and competitions often lack the fi�nancialstrength and resources to implement key integrity protections,making them more susceptibleto illicit approaches. This is atrend which is expected to continue through 2022 as moreleagues reemerge from Covid19cancellations and postponements, providing more vulnerable targets for matchfi�xers.
There were also three suspicious tennis games from India in
2021, and all three players whowere deemed complicit were Indian players. By nature, tennis is atouring sport, with tournamentstaking place in various locationsweektoweek, meaning thatthere is not a signifi�cant integrityissue with Indian tennis per se.However, as there had been nosuspicious tennis matches detec
ted in India during thetwo previous years, towitness suspiciousmatches involving threediff�erent local playerssuggests that this couldbe a worsening problemfor both the country and
the sport.Despite cricket being the num
ber one sport in India, both in apopularity and worldwide betting interest in Indian sports, nosuspicious matches were detected in Indian cricket in 2021. Yetsuspicious cricket matches havepreviously been detected in India,and there has been ongoing suspicious betting activity witnessedacross global cricket in recentyears, with nine suspiciousmatches detected in 2021, andfour detected so far this year.
The unregulated Indian betting market is at the forefront ofcricket betting activity, and increased vigilance is required asbetting interest continues to increase, even for lowerlevel competitions, where players can beconsidered more vulnerable targets due to the less substantialplaying salaries.
It can be said with confi�dencethat sport — and therefore sportsbetting — in India is only going toexpand due to Indian sport’s continued development from a commercial perspective, alongsidethe number of new leagues andtournaments that are establishing themselves.
For the integrity of these competitions to be maintained, it is vital that key stakeholders in Indian sport continue to takeproactive steps. The rise in suspicious matches from lower levelsof competitions further outlineshow all levels of Indian sportneed protection for our sportinglandscape to thrive.
The writer is Director Sports
Content and Partnerships,
Sportradar
As sport continues to grow, so does match-fixing
The US is preparing a scaledback version of a trade pact
as Southeast Asian nationsgather in Washington, wherePresident Joe Biden is seeking toshow solid commitment in theface of a rising China.
Leaders from the Associationof Southeast Asian Nations(ASEAN) will meet Biden for dinner Thursday at the start of atwoday summit, part of a renewed US focus on Asia aftermonths of intense eff�ort onUkraine.
Before Russia’s invasion ofUkraine, the Biden administration had made clear that its toppriority was competition withChina due to its rapid technological advances and rising assertiveness both at home andabroad.
Kurt Campbell, the top WhiteHouse offi�cial on Asia, said theUS would raise areas of cooperation with ASEAN leaders including fi�ghting the Covid pandemicand disaster relief.
He also said he expected “substantial interest” by SoutheastAsian nations in the IndoPacifi�cEconomic Framework, or IPEF,the latest acronymbranded UStrade initiative, which was mentioned late last year by Secretaryof State Antony Blinken inIndonesia.
“We’re quite confi�dent thatwe’re going to be able to have asubstantial launch with a verybroad range of potential players,” Campbell said at the US Institute of Peace.
Koji Tomita, Japan’s ambassador to Washington, told a separate event that he expected IPEFto be unveiled formally a weeklater when Biden visits Tokyoand Seoul.
Former president BarackObama had proposed the TransPacifi�c Partnership, billing it as ahighstandards deal that wouldlet the US lead the emergingtrade order in Asia.
His successor Donald Trumptrashed the deal, calling freetrade unfair to US workers.Biden, seeing the shifting USpolitical mood, has made clearhe is in no rush for trade deals —and China is now seeking toenter the TransPacifi�c Partnership's successor. AFP
US eyes tradedeal-lite withSoutheast Asia
SHORT TAKE
................BMBMECMYK
MUMBAI
6 BusinessLine FRIDAY • MAY 13 • 2022MARKET RADAR
For BSE/NSE live quotes, scan
the QR code or click the link
https://bit.ly/2FpossK
BusinessLine is not responsible for the recommendationssourced from third party brokerages. Reports may be sent
ANAND RATHI Ajanta Pharma (Buy) Target: ₹�2,378CMP: ₹�1,704.65Ajanta’s Q4FY22 sales grew 15 per cent to₹�870 crore. Its India and Africa brandeddivisions and Asia reported stellar growth.More price erosion and keener competition,however, led to muted US business. Onhigher price erosion (about 18 per cent) andfewerthanexpected launches (on lowerfi�lings), its US sales declined 3 per cent to₹�170 crore. It plans to fi�le 1012 products inFY23. We anticipate a 14per cent CAGR overFY2224 supported by the launches.Its gross margin slid 531 bps to 72.5 per centyoy due to higher raw material prices and aonetime impact (1.5 per cent of sales due tofl�urelated products written back and 1.5 percent more due to price erosion in the US).Adjusting for this, the gross margincontracted 280 bps yoy to 75 per cent .Higher other expenses squeezed the EBITDAmargin 1,053 bps to 23.7 per cent. PAT fell 5.1per cent to ₹�150 crore. With launches,continuing momentum in India, otherbranded markets and a pickup in the US,Ajanta would deliver 12 per cent revenue/PATgrowth each over FY2224. Risks: Currency fl�uctuations, rampingupdelays, pricing risk in India.
BROKER’S CALL
AUM CAPITAL Pitti Engineering (Buy) Target: ₹�312CMP: ₹�241Headquartered in Hyderabad, it is engagedin the manufacturing of electrical steellaminations, motor cores, subassemblies,die cast rotors and press tools with aninstalled capacity of 41,000 tpa as ofDecember 2021. PEL is currently undergoingcapacity expansion from 41,000 tpa to72,000 tpa by FY24 at a cost of ₹�270 cr. Theincreased capacity would help the companyto serve the incremental demand whichwould drive the business growth.The company enjoys a competitiveadvantage by developing more than 5,000diff�erent varieties of products for its clients.Any new entrant would take considerabletime to match the quality of PEL and hence,PEL enjoys the advantage of ‘Barriers toEntry’.Over a period of time, PEL has established avery solid client base through its diversifi�edproduct off�erings, which include renownednames as BHEL, Cummins, Toshiba, ABB,Wabtech, L&T, etc. With the Government ofIndia laying stress on the infrastructuredevelopment of the country by allocatingabout ₹�7.50 Lakh crore for developmentprojects, growth for industries such ascement, steel and power is expected to bestrong, going forward. This, in turn, createsdemand for PEL, which supplies criticalcomponents to these industries. Werecommend a ‘Buy’ on the stock with atarget price of ₹�312, in the next 912 months.
OUR BUREAU
New Delhi, May 12
The Supreme Court onThursday declined to grantany interim relief and staythe Life Insurance Corporation (LIC) IPO share allotment on a batch of pleasfi�led by some policyholders.
A bench of Justices DYChandrachud, Surya Kantand PS Narasimha said thecourt should be reluctant togrant any interim relief inmatters of commercial investments and IPO.
“We are not inclined togrant any interim relief,” thebench said, as it issued notice to the Centre and LIC onthe batch of pleas seeking
their response within eightweeks.
The Bench said that on theaspect of interim relief, thecourt must be guided by thewellsettled principle ofprima facie case, balance ofconvenience and whetherthere is any irreparableinjury.
Transfers Bombay HC writThe Bench noted that one ofthe pleas has challenged theinterim order passed by theBombay High Court and disposed it, saying the writ petition before the high courtwill be transferred to theapex court.
The top court tagged thebatch of pleas with apending matter referred to aConstitution bench on the issue of passage of the FinanceAct, 2021, as a money bill.
SC seeks response
from Centre,
insurance major
Apex Court refuses to stayLIC IPO share allotment
GURUMURTHY K
BL Research Bureau
The outlook for the stock ofSunteck Realty is bearish. Theprice action since September2021 indicates a head andshoulder pattern formation.The 4.85 per cent on Thursdayhas taken the stock below theneckline support of this pattern. The neckline is at ₹�415. Itwill act as a good resistance.Any intermediate bounce willbe capped at ₹�415. The 21daymoving average (DMA) is onthe verge of crossing below the200DMA.
This strengthens the bearishcase and also indicates that upside could be restricted. Thestock can fall to ₹�365360 in the
next one or two weeks. Traderscan go short at current levels.Accumulate shorts on a rise at₹�410. Keep the stoploss at ₹�421.Trail the stoploss down to ₹�392as soon as the stock falls to₹�383. Move the stoploss further down to ₹�381 as soon asthe stock touches ₹�375. Bookprofi�ts at ₹�372. Note that the₹�365360 region is a strongsupport zone. A trendline andthe 100week moving averageare poised in this zone. As suchthe chances are high for thestock to bounce from this support zone.
Note: The recommendations are
based on technical analysis.
There is risk of loss in trading
TODAY'S PICK
Sunteck Realty (₹�400.3): SELL
15825 • Nifty 50 FuturesS1 S2 R1 R2 COMMENT
15750 15680 15900 16000 May get a corrective bounce. So go
short with a stoploss at 15810 only
on a break below 15750.
S1, S2: Support 1 & 2; R1, R2: Resistance 1 & 2.
₹�1303 • HDFC BankS1 S2 R1 R2 COMMENT
1285 1240 1330 1350 Support ahead. Wait for a dip and
go long on a bounce from 1285.
Keep the stoploss at 1270
₹�1509 • InfosysS1 S2 R1 R2 COMMENT
1495 1450 1535 1565 Initiate fresh short positions with a
stoploss at 1510 only if the stock
breaks below 1495.
₹�253 • ITCS1 S2 R1 R2 COMMENT
249 244 257 260 Resistance ahead. Go short now and
on a rise at 256. Stoploss can be
placed at 259
₹�156 • ONGCS1 S2 R1 R2 COMMENT
153 150 161 167 Attempting bounce from support.
Go long now and on dips at 155
with a stoploss at 151
₹�2401 • Reliance Ind. S1 S2 R1 R2 COMMENT
2370 2350 2410 2435 Can see a fresh fall from here.
Initiate shorts at current levels.
Keep the stoploss at 2420
₹�462 • SBIS1 S2 R1 R2 COMMENT
458 456 465 472 Corrective rally is possible. Go long
with a stoploss at 463 if the stock
breaks above 465.
₹�3411 • TCSS1 S2 R1 R2 COMMENT
3385 3350 3425 3470 Can go either way from here. Avoid
trading this stock until a clear trend
emerges.
DAY TRADING GUIDE
Nifty 50 Movers H 359.10 pts.Close(₹�) Pts PE Wt(%)
Wipro. . . . . . . . . . . . . . . . . . . . . . . . . . . . . . . . . . .. . . . 473.80. . . . . . . . . . 0.64. . . . . . . . . 21.21 . . . . . . . . 1.01Dr Reddys Lab . . . . . . . . . . . . . . . . . . . . .. . 3880.00. . . . . . . . 0.11. . . . . . . . . 24.43 . . . . . . . . 0.68Eicher Motors . . . . . . . . . . . . . . . . . . . . . .. . 2384.65. . . . . . . . 0.14. . . . . . . . . 40.94 . . . . . . . . 0.48HCL Tech . . . . . . . . . . . . . . . . . . . . . . . . . . . . .. . 1059.40. . . . . . . . 0.36. . . . . . . . . 21.26 . . . . . . . . 1.62TCS . . . . . . . . . . . . . . . . . . . . . . . . . . . . . . . . . . . . . .. . 3408.65. . . . . . . . 0.79. . . . . . . . . 32.79 . . . . . . . . 5.10Bajaj Auto . . . . . . . . . . . . . . . . . . . . . . . . . . . .. . 3585.00. . . . . . . . 0.83. . . . . . . . . 16.82 . . . . . . . . 0.67TataConsumerProducts Ltd.. . . . 738.05. . . . . . . . 0.83. . . . . . . . . 67.00 . . . . . . . . 0.64Britannia Ind. . . . . . . . . . . . . . . . . . . . . . . .. . 3216.85. . . . . . . . 1.16. . . . . . . . . 51.11 . . . . . . . . 0.55Sun Pharma . . . . . . . . . . . . . . . . . . . . . . . . .. . . . 850.00. . . . . . . . 1.18. . . . . . . . . 31.57 . . . . . . . . 1.33Coal India . . . . . . . . . . . . . . . . . . . . . . . . . . . .. . . . 167.05. . . . . . . . 1.34. . . . . . . . . . . 6.75 . . . . . . . . 0.51Asian Paints. . . . . . . . . . . . . . . . . . . . . . . . .. . 3039.95. . . . . . . . 1.41. . . . . . . . . 94.52 . . . . . . . . 1.98BPCL. . . . . . . . . . . . . . . . . . . . . . . . . . . . . . . . . . . .. . . . 339.95. . . . . . . . 1.56. . . . . . . . . . . 3.78 . . . . . . . . 0.47Tech Mahindra. . . . . . . . . . . . . . . . . . . . .. . 1212.80. . . . . . . . 1.65. . . . . . . . . 22.97 . . . . . . . . 1.09ONGC . . . . . . . . . . . . . . . . . . . . . . . . . . . . . . . . . .. . . . 156.50. . . . . . . . 1.75. . . . . . . . . . . 4.09 . . . . . . . . 0.83Divis Lab . . . . . . . . . . . . . . . . . . . . . . . . . . . . . .. . 4233.40. . . . . . . . 1.76. . . . . . . . . 43.77 . . . . . . . . 0.78Cipla . . . . . . . . . . . . . . . . . . . . . . . . . . . . . . . . . . . .. . . . 920.75. . . . . . . . 1.99. . . . . . . . . 29.17 . . . . . . . . 0.69Hero MotoCorp. . . . . . . . . . . . . . . . . . . .. . 2401.20. . . . . . . . 2.05. . . . . . . . . 20.60 . . . . . . . . 0.45Apollo Hosp . . . . . . . . . . . . . . . . . . . . . . . . .. . 3580.85. . . . . . . . 2.30. . . . . . . . . 43.59 . . . . . . . . 0.53Shree Cement. . . . . . . . . . . . . . . . . . . . . .22627.40. . . . . . . . 2.30. . . . . . . . . 32.96 . . . . . . . . 0.44Nestle India Ltd. . . . . . . . . . . . . . . . . . .16220.00. . . . . . . . 2.38. . . . . . . . . 73.17 . . . . . . . . 0.84PowerGrid Corp . . . . . . . . . . . . . . . . . . .. . . . 235.90. . . . . . . . 2.58. . . . . . . . . 10.16 . . . . . . . . 1.17SBI Life . . . . . . . . . . . . . . . . . . . . . . . . . . . . . . . .. . 1060.60. . . . . . . . 2.67. . . . . . . . . 77.66 . . . . . . . . 0.67UPL . . . . . . . . . . . . . . . . . . . . . . . . . . . . . . . . . . . . . .. . . . 764.95. . . . . . . . 3.42. . . . . . . . . 13.17 . . . . . . . . 0.61HDFC Life . . . . . . . . . . . . . . . . . . . . . . . . . . . .. . . . 547.25. . . . . . . . 3.46. . . . . . . 101.43 . . . . . . . . 0.74UltraTech Cement. . . . . . . . . . . . . . . .. . 6185.45. . . . . . . . 4.08. . . . . . . . . 24.89 . . . . . . . . 1.03Grasim Ind . . . . . . . . . . . . . . . . . . . . . . . . . . .. . 1485.85. . . . . . . . 4.24. . . . . . . . . 10.15 . . . . . . . . 0.81Maurti Suzuki . . . . . . . . . . . . . . . . . . . . . .. . 7253.65. . . . . . . . 4.34. . . . . . . . . 56.48 . . . . . . . . 1.39NTPC . . . . . . . . . . . . . . . . . . . . . . . . . . . . . . . . . . .. . . . 148.55. . . . . . . . 4.34. . . . . . . . . . . 8.78 . . . . . . . . 1.02M&M . . . . . . . . . . . . . . . . . . . . . . . . . . . . . . . . . . .. . . . 865.25. . . . . . . . 4.77. . . . . . . . . 17.13 . . . . . . . . 1.20Hind Unilever. . . . . . . . . . . . . . . . . . . . . . .. . 2138.80. . . . . . . . 5.04. . . . . . . . . 56.55 . . . . . . . . 2.76JSW Steel . . . . . . . . . . . . . . . . . . . . . . . . . . . .. . . . 624.80. . . . . . . . 5.34. . . . . . . . . . . 6.93 . . . . . . . . 0.87ITC . . . . . . . . . . . . . . . . . . . . . . . . . . . . . . . . . . . . . . .. . . . 252.90. . . . . . . . 5.50. . . . . . . . . 20.70 . . . . . . . . 3.20Hindalco . . . . . . . . . . . . . . . . . . . . . . . . . . . . . .. . . . 405.85. . . . . . . . 5.57. . . . . . . . . . . 7.42 . . . . . . . . 0.86Titan . . . . . . . . . . . . . . . . . . . . . . . . . . . . . . . . . . . .. . 2048.55. . . . . . . . 6.31. . . . . . . . . 82.74 . . . . . . . . 1.24Tata Motors . . . . . . . . . . . . . . . . . . . . . . . . .. . . . 372.30. . . . . . . . 6.49. . . . . . . . . . . 0.00 . . . . . . . . 0.96Bajaj Finserv . . . . . . . . . . . . . . . . . . . . . . . .12850.70. . . . . . . . 6.62. . . . . . . . . 24.60 . . . . . . . . 1.12Adani Ports . . . . . . . . . . . . . . . . . . . . . . . . . .. . . . 713.30. . . . . . . . 7.65. . . . . . . . . 29.49 . . . . . . . . 0.74IndusInd Bank . . . . . . . . . . . . . . . . . . . . .. . . . 869.90. . . . . . . . 7.95. . . . . . . . . 14.02 . . . . . . . . 0.82Tata Steel . . . . . . . . . . . . . . . . . . . . . . . . . . . .. . 1117.70. . . . . . . . 8.85. . . . . . . . . . . 3.27 . . . . . . . . 1.30Bharti Airtel. . . . . . . . . . . . . . . . . . . . . . . . .. . . . 705.40. . . . . . . . 9.42. . . . . . . . . 63.50 . . . . . . . . 2.41State Bank . . . . . . . . . . . . . . . . . . . . . . . . . . .. . . . 462.65. . . . . . 12.19. . . . . . . . . 12.33 . . . . . . . . 2.57L&T . . . . . . . . . . . . . . . . . . . . . . . . . . . . . . . . . . . . . .. . 1526.15. . . . . . 12.33. . . . . . . . . 21.23 . . . . . . . . 2.67Bajaj Finance . . . . . . . . . . . . . . . . . . . . . . .. . 5593.40. . . . . . 13.00. . . . . . . . . 48.18 . . . . . . . . 2.15Axis Bank. . . . . . . . . . . . . . . . . . . . . . . . . . . . .. . . . 649.65. . . . . . 13.69. . . . . . . . . 14.04 . . . . . . . . 2.48Infosys . . . . . . . . . . . . . . . . . . . . . . . . . . . . . . . . .. . 1508.80. . . . . . 15.01. . . . . . . . . 28.66 . . . . . . . . 7.98Kotak Bank . . . . . . . . . . . . . . . . . . . . . . . . . .. . 1760.90. . . . . . 16.46. . . . . . . . . 28.90 . . . . . . . . 3.74HDFC . . . . . . . . . . . . . . . . . . . . . . . . . . . . . . . . . . .. . 2150.45. . . . . . 28.38. . . . . . . . . 16.18 . . . . . . . . 5.62ICICI Bank . . . . . . . . . . . . . . . . . . . . . . . . . . .. . . . 695.80. . . . . . 29.21. . . . . . . . . 18.18 . . . . . . . . 6.99Reliance Ind. . . . . . . . . . . . . . . . . . . . . . . . .. . 2399.40. . . . . . 39.34. . . . . . . . . 23.92 . . . . . . 11.96HDFC Bank . . . . . . . . . . . . . . . . . . . . . . . . . .. . 1303.05. . . . . . 45.59. . . . . . . . . 18.94 . . . . . . . . 8.25
Pts: Impact on index movement
Nifty Next 50 Movers H 969.85 pts.Close(₹�) Pts PE Wt(%)
Ambuja Cements . . . . . . . . . . . . . . . . .. . . . 373.55. . . . . . . . 38.12. . . . . . . . . 22.21 . . . . . . . . 2.61Indian Oilcorp. . . . . . . . . . . . . . . . . . . . . .. . . . 122.10. . . . . . . . 15.01. . . . . . . . . . . 4.14 . . . . . . . . 2.95Acc . . . . . . . . . . . . . . . . . . . . . . . . . . . . . . . . . . . . . .. . 2177.40. . . . . . . . . . 2.95. . . . . . . . . 24.10 . . . . . . . . 1.75Fsn ECommerce Ventures ... . 1286.15. . . . . . . . . . 1.87. . . . . 1356.25 . . . . . . . . 0.43Zydus Lifesciences .. . . . . . . . . . . . .. . . . 333.40. . . . . . . . . . 1.56. . . . . . . . . 14.33 . . . . . . . . 0.81Jubilant Foodworks . . . . . . . . . . . . .. . . . 468.85. . . . . . . . . . 0.41. . . . . . . . . 72.38 . . . . . . . . 1.70Proc & Gam . . . . . . . . . . . . . . . . . . . . . . . . .13415.20. . . . . . . . 1.45. . . . . . . . . 74.80 . . . . . . . . 0.74Gail (India) . . . . . . . . . . . . . . . . . . . . . . . . . .. . . . 150.30. . . . . . . . 2.28. . . . . . . . . . . 5.87 . . . . . . . . 2.60Berger Paints India . . . . . . . . . . . . .. . . . 660.20. . . . . . . . 2.78. . . . . . . . . 78.08 . . . . . . . . 1.52Marico . . . . . . . . . . . . . . . . . . . . . . . . . . . . . . . . .. . . . 500.15. . . . . . . . 2.96. . . . . . . . . 51.52 . . . . . . . . 2.46One 97 Communications .. . . .. . . . 515.90. . . . . . . . 2.96. . . . . . . . . . . 0.00 . . . . . . . . 0.28Colgate . . . . . . . . . . . . . . . . . . . . . . . . . . . . . . . .. . 1565.40. . . . . . . . 5.06. . . . . . . . . 39.81 . . . . . . . . 1.98Gland Pharma . . . . . . . . . . . . . . . . . . . . .. . 2851.70. . . . . . . . 5.73. . . . . . . . . 39.50 . . . . . . . . 0.88Zomato . . . . . . . . . . . . . . . . . . . . . . . . . . . . . . .. . . . . 51.95. . . . . . . . 7.06. . . . . . . . . . . 0.00 . . . . . . . . 0.43Bosch . . . . . . . . . . . . . . . . . . . . . . . . . . . . . . . . . .13128.60. . . . . . . . 8.13. . . . . . . . . 28.67 . . . . . . . . 1.07Torrent Pharma . . . . . . . . . . . . . . . . . . .. . 2504.40. . . . . . . . 8.52. . . . . . . . . 34.77 . . . . . . . . 1.17Hdfc Asset Mgmt Cmp .. . . . . . .. . 1840.05. . . . . . . . 8.68. . . . . . . . . 28.17 . . . . . . . . 1.16Dlf. . . . . . . . . . . . . . . . . . . . . . . . . . . . . . . . . . . . . . . .. . . . 322.20. . . . . . . . 8.97. . . . . . . . . 50.73 . . . . . . . . 1.89Biocon . . . . . . . . . . . . . . . . . . . . . . . . . . . . . . . . .. . . . 327.95. . . . . . 10.29. . . . . . . . . 51.03 . . . . . . . . 1.42Sbi Cards And Pay Srv . . . . . . . .. . . . 736.25. . . . . . 11.57. . . . . . . . . 42.97 . . . . . . . . 1.78Godrej Consumer . . . . . . . . . . . . . . . .. . . . 771.25. . . . . . 12.86. . . . . . . . . 44.16 . . . . . . . . 2.77Siemens. . . . . . . . . . . . . . . . . . . . . . . . . . . . . . .. . 2275.90. . . . . . 13.22. . . . . . . . . 78.45 . . . . . . . . 1.92Pi Industries . . . . . . . . . . . . . . . . . . . . . . .. . 2410.70. . . . . . 14.52. . . . . . . . . 44.65 . . . . . . . . 1.84Larsen & Toubro Info . . . . . . . . . .. . 4160.95. . . . . . 14.64. . . . . . . . . 31.73 . . . . . . . . 1.80Sail . . . . . . . . . . . . . . . . . . . . . . . . . . . . . . . . . . . . . .. . . . . 80.70. . . . . . 16.30. . . . . . . . . . . 2.52 . . . . . . . . 1.11Intglobeavi . . . . . . . . . . . . . . . . . . . . . . . . . .. . 1631.25. . . . . . 16.42. . . . . . . . . . . 0.00 . . . . . . . . 1.49Muthoot Finance . . . . . . . . . . . . . . . .. . 1110.90. . . . . . 16.87. . . . . . . . . 11.01 . . . . . . . . 1.14Dabur India. . . . . . . . . . . . . . . . . . . . . . . . . .. . . . 498.35. . . . . . 18.27. . . . . . . . . 50.57 . . . . . . . . 2.76Indus Towers .. . . . . . . . . . . . . . . . . . . . . .. . . . 201.55. . . . . . 19.39. . . . . . . . . . . 8.52 . . . . . . . . 1.55Lupin . . . . . . . . . . . . . . . . . . . . . . . . . . . . . . . . . . .. . . . 694.15. . . . . . 19.52. . . . . . . . . . . 0.00 . . . . . . . . 1.59United Spirits . . . . . . . . . . . . . . . . . . . . . .. . . . 791.70. . . . . . 20.04. . . . . . . . . 68.87 . . . . . . . . 2.24Mindtree . . . . . . . . . . . . . . . . . . . . . . . . . . . . .. . 2954.95. . . . . . 20.34. . . . . . . . . 29.47 . . . . . . . . 1.80Bandhan Bank . . . . . . . . . . . . . . . . . . . . .. . . . 304.15. . . . . . 20.70. . . . . . . . . . . 0.00 . . . . . . . . 1.95Srf .. . . . . . . . . . . . . . . . . . . . . . . . . . . . . . . . . . . . . .. . 2194.35. . . . . . 20.74. . . . . . . . . 34.44 . . . . . . . . 3.03Nmdc . . . . . . . . . . . . . . . . . . . . . . . . . . . . . . . . . . .. . . . 137.60. . . . . . 20.86. . . . . . . . . . . 3.88 . . . . . . . . 1.49CholamandInvestment&Fin . . . . 609.20. . . . . . 21.65. . . . . . . . . 23.22 . . . . . . . . 2.28Avenuesuper . . . . . . . . . . . . . . . . . . . . . . .. . 3270.45. . . . . . 22.86. . . . . . . 143.19 . . . . . . . . 2.87Havells. . . . . . . . . . . . . . . . . . . . . . . . . . . . . . . . .. . 1199.55. . . . . . 26.63. . . . . . . . . 62.79 . . . . . . . . 2.85IPrulife . . . . . . . . . . . . . . . . . . . . . . . . . . . . . . .. . . . 488.85. . . . . . 26.73. . . . . . . 110.68 . . . . . . . . 1.80Pidilitind . . . . . . . . . . . . . . . . . . . . . . . . . . . . . .. . 2115.00. . . . . . 26.82. . . . . . . . . 85.33 . . . . . . . . 3.06Bajaj Holdings . . . . . . . . . . . . . . . . . . . . .. . 4858.30. . . . . . 27.98. . . . . . . . . 13.11 . . . . . . . . 1.43Piramal Ent. . . . . . . . . . . . . . . . . . . . . . . . . .. . 1815.10. . . . . . 28.15. . . . . . . . . 32.38 . . . . . . . . 2.30Icici Lombard Gic . . . . . . . . . . . . . . . . .. . 1249.10. . . . . . 32.29. . . . . . . . . 48.61 . . . . . . . . 3.03Bank Of Baroda . . . . . . . . . . . . . . . . . . .. . . . . 96.05. . . . . . 34.64. . . . . . . . . . . 9.63 . . . . . . . . 1.70Info Edge (India) .. . . . . . . . . . . . . . . .. . 3539.50. . . . . . 36.14. . . . . . . . . . . 3.66 . . . . . . . . 2.60Vedanta . . . . . . . . . . . . . . . . . . . . . . . . . . . . . . .. . . . 314.25. . . . . . 46.49. . . . . . . . . . . 4.93 . . . . . . . . 3.33Punjab Natl Bank . . . . . . . . . . . . . . . . .. . . . . 28.60. . . . . . 47.88. . . . . . . . . . . 7.37 . . . . . . . . 0.81Adani Transmission .. . . . . . . . . . . .. . 2187.05. . . . . . 66.38. . . . . . . 194.65 . . . . . . . . 3.54Adani Enter. . . . . . . . . . . . . . . . . . . . . . . . . .. . 2045.20. . . . . . 72.91. . . . . . . 285.56 . . . . . . . . 5.34Adani Green Energy . . . . . . . . . . . .. . 2436.80. . . . 161.07. . . . . . . 779.38 . . . . . . . . 4.93
Pts: Impact on index movement
SAI PRABHAKAR YADAVALLI
BL Research Bureau
Venus Pipes & Tubes (Venus) is aGujaratbased company manufacturing stainless steel pipes.The company is raising ₹�165crore through fresh issue (no offerforsale), valuing it at ₹�662crore.
The company will trade at 21times 9MFY22 earnings (annualised) based on the postissueshareholding. But this seems tobe on the higher side comparedwith most peers, though it islower than Ratnamani Metalswhich is trading at 37 times theearnings.
Lack of long track-recordAlso, the company has a shortoperational history. We recommend investors avoid the issue,which is coming at the peak of
steel price cycle. The companywas incorporated in 2015 andcan present only seven years ofoperational history. However, toits credit, the company has added 55 per cent to the installedcapacity since 2019. The company has an installed capacity of10,800 MTPA and operates fromKutch, Gujarat. But the scale ofoperations is signifi�cantly lowerthan listed peers like Ratnamani, Man Industries andWelspun Corp, whose sales are614 times more.
The lack of scale will deter reliable B2B sales which derivesclose to half of the sales fromstockists and traders. The largerinstitutional orders, on theother hand, will want a strongtrack record.
The credit history of the company is also shaky with discon
tinuation of credit rating on account of the company’snoncooperation for the ratingissued by CARE Ratings inDecember 2020, and from Brickwork Ratings in April 2022.
Peak steel pricesSteel prices have rallied since
Covid to record highs both domestically and internationally,on account of steel shortagesfrom China and the US, andhigher demand from construction and automobiles. Venus’IPO valuation at 21 times earnings is based on these highersteel prices and higher margins,apart from capacity expansion.While steel prices witnessedmarginal correction from peaksin JanuaryFebruary, the RussiaUkraine confl�ict pushed priceshigher again (still lower thanearlier peaks).
On the other hand, the interest rate hike cycle, which has
started across economies, is expected to impact constructionand automobile demand, leading to a weaker view on demand. A high valuation multiple at a time of peak earningsmay lead to fl�at returns from related stock prices at best. In abestcase scenario, as steelprices may regain high peaks,valuations, which have factoredin higher prices, may not expand further.
Capacity expansionVenus manufactures two typesof stainlesssteel pipes — seamless for higher pressure applica
tions and welded pipes forpetrochemical applications.The fresh issue proceeds will beutilised for capital expansion ofthe seamless segment from3,600 MTPA in 2021 to 9,600MTPA and welded segmentfrom 7,200 MTPA to 14,400MTPA.
Also, Venus will be investingin a piercing line for manufacturing hollow pipes for backward integration. While the proposed plan for capacity buildinglooks to more than double theinstalled capacity, the extent ofrealisation on successful completion in twothree years willbe dependent on steel pricesprevalent then, which arealready correcting from thepeak. In case of declining steelprices, operating leverage,which helped Venus increase itsEBITDA margins from 7 per centin FY20 to 12.8 per cent in9MFY22, will reverse to an extentand on a higher fi�xed cost base
of the added plants. Venus’ capital expansion and
higher realisations aided a revenue growth of 74 per cent inFY21, of which 35 per cent wasfrom capacity expansion. Annualised, 9MFY22 would indicate a20per cent YoY growth withoutsignifi�cant volume growth contribution. Similarly, the marginsalso gained as gross and EBITDAmargins improved from 14.4and 7 per cent in FY19 to 18 and12.8 per cent in 9MFY22.
But in the period, Venus’working capital cycle moved upfrom 88 days in March 2019 to108 days in December 2021, as receivables and inventory holdingperiod increased.
Venus’ interest coverage ratioat eight times for its ₹�50croredebt (December 2021) indicatesa manageable level of debt, buta sharp correction in margins inthe period of increasing interestrates would be a key factor towatch.
Venus Pipes: Short operational history, high valuation erode appeal Peers are on better footing with higher scale of operations
OUR BUREAU
Mumbai, May 12
The rupee is facing testingtimes in the face of a strongdollar. The Indian unittouched an alltime intradaylow of 77.6250 per dollar onThursday before recoupingsome of the losses on ReserveBank of India’s strongintervention.
With the US infl�ation hitting 8.30 per cent in April, thelikelihood of the US Fed ramping up interest rates more aggressively has increased,pushing foreign portfolio investors to sell their holdingsin emergingeconomy fi�nancial markets, including India.This, coupled with higherglobal commodity pricesweakened Indian currency.The rupee closed at 77.4150 a
dollar, about 18 paise lowerversus previous close of 77.24.“That the rupee closed at77.4150 after touching an alltime intraday low of 77.6250is only due to RBI intervention. They sold dollars continuously,” said a Chief ForexDealer of a private sectorbank. “Now one needs to seehow big an interest rate hikethe RBI eff�ects following theApril CPI infl�ation reading of7.79 per cent. If our interestrate lags that of advanced economies, it will be negative forour currency, as there will further FPI outfl�ows,” he added.
Asian peers slump moreChinese Yuan (CNY) has lostabout 5.50 per cent afterPBOC’s failed attempt to propeconomy via rate cuts. TaiwanDollar and the Won are about7.30 per cent and 7.50 per centweaker against the dollar.
Rupee slumps to 77.625 Closes at 77.415 on
RBI intervention
OUR BUREAU
Mumbai, May 12
Fears of dollar liquidity beingsucked out by the US Federal Reserve (Fed) through aggressiveinterest rate hikes is pushingstock markets down.
Despite a more than two percent fall in Sensex and Nifty onThursday, and a nearly 15 percent crash in both the indicesfrom their lifetimehighs inJanuary this year, experts believe the markets are set for further downside. On Thursday,Sensex fell 1,158 points to close at52,930 and Nifty was down 359points at 15,808. Still, the badnews around the world was thatthe cryptocurrency crash haderased more than $200 billion
in a single day on Thursday.The lowinterest rate regime
by the Fed and global centralbanks was a key theme, whichwas driving one of the longestand most historic bull runs overthe past two years. But the hot
terthanexpected infl�ation fi�gures in the US and elsewherearound the world have putstock markets in a spot. Infl�ation in the US was recorded at a40year high on Wednesday at8.3 per cent. In India, the infl�ation rose to an eightyear highof 7.9 per cent.
FPIs exit, DIIs supportAs per exchange data, foreignportfolio investors (FPIs) soldstocks worth ₹� 5,255 crore onThursday in the equity cash segment, taking the total selling forthe month in the segment tonearly ₹�29,000 crore. Domesticinstitutional investors (DIIs)were net purchasers of stockworth ₹�4,815 crore.
“Lot of positions seem to beout of the system. Most newagestocks are just onefourth oftheir peak value. Better quality,oldeconomy stocks too aredown by 3060 per cent. Butnothing in earnings suggests
there should be a major revision to valuation of thesestocks. So far, markets seem tohave factored in the Fed hike. Iwould be surprised to see Niftybreak 15,500. Earnings have notdisappointed,” said RahulArora, CEO, Institutional Equities, Nirmal Bang Equities.
Wall Street meltdownIn the US, the techheavy Nasdaq100 index was down 27 per centfor the year, while the Dow Jonesand S&P 500 indices fell around15 per cent from their peak.
“Signifi�cant decline inChinese Covid cases and USbond trading below 3 per centmay give some relief to globalequities. Technically, Nifty is trying to defend and hold 15,800.There is support also at 15,697.Any short covering and a closeabove 16,000 for Nifty couldtake the index to 16,600,” saidPrashanth Tapse, VicePresident(Research), Mehta Equities Ltd.
Sensex, Nifty fall 15% from Jan peak Fear of dollarliquidity squeezeby US Fed pullsdown market
OUR BUREAU
Kolkata, May 12
Paradeep Phosphates Ltd’sIPO will open on May 17.The priceband of the off�erhas been fi�xed at ₹�39 42per share of face of ₹�10each. Bids can be made fora minimum of 350 equityshares.
The issue off�er comprises fresh issue of equityshares aggregating to ₹�1,004 crore and off�er forsale (OFS) up to 118,507,493equity shares by promoters and government ,the company said.
The OFS comprises of upto 6,018,493 equity sharesby Zuari Maroc Phosphates Pvt Ltd and up to112,489,000 equity sharesby the President of India,acting through the Ministry of Chemicals and Fertilisers.
Fund utilisationThe company intends toutilise net proceeds fromthe fresh issue towardspartfi�nancing the acquisition of the Goa facility; repayment/prepayment ofcertain borrowings; andfor general corporate purposes.
Zuari AgrochemicalsLtd (ZACL) had, in February last year, announcedthe sale of its fertiliserplant and the associatedbusinesses at Goa toParadeep Phosphates foran enterprise value of$280 million (approximately ₹�2,050 crore).
The company is lookingto enhance production capacity of its nonurea fertilisers by nearly 50 percent to 1.8 million tonnes(mt) from the present 1.2mt through debottlenecking at its existing unitat Paradeep in Odisha.
The equity sharesoff�ered in the off�er are proposed to be listed on boththe BSE and NSE. Axis Capital Ltd, ICICI Securities, JMFinancial and SBI CapitalMarkets are the bookrunning lead managers to theoff�er.
ParadeepPhosphatesIPO to openon May 17
REUTERS
May 12
Wall Street’s main indexes fellon Thursday, with growthstocks leading declines for asecond straight session as investors worried that aggressiveinterest rate increases to curbdecadeshigh infl�ation couldtip the economy into recession.
Megacap stocks Meta Platforms, Microsoft Corp, Alphabet Inc, Apple Inc , Amazon.com and Tesla Inc slippedbetween 2 per cent and 5.9 percent.
.The Dow Jones Industrial
was down 294.57 points, or 0.93per cent, at 31,539.54, the S&P500 was down 53.09 points, or1.35 per cent, at 3,882.09, andthe Nasdaq 193.70 points, or1.70 per cent, at 11,170.53.
Growth stocksdrag Wall Streetlower on ratehike worries

................BM-BMECMYK
MUMBAI
BusinessLineFRIDAY • MAY 13 • 2022 7NEWS
would be next to nothing inthe current fi�scal and therefore, the bank is betting big ongrowth in business volumes.
For Q4 FY22, PNB on Wednesday reported standalonenet profi�t of ₹�202 crore, lowerthan ₹�586 crore in samequarter last fi�scal. For the entire fi�scal, its net profi�t surgedto ₹�3,456 crore (from ₹�2,022crore).
After a gap of eight years,PNB is back in the dividend listwith a dividend announcement of 32 per cent (₹�0.64paisa on a face value of ₹�2 pershare).
Asked whether PNB wouldbe able to sustain the fullyearprofi�tability growth recordedin FY22, Goel said he wouldprefer not to give any detailson the bottomline front. How
KR SRIVATS
New Delhi, May 12
Punjab National Bank, thecountry’s secondlargest public sector bank, expects anoverall credit growth of 10 percent in FY23 on the back of robust credit demand in steel,road and cement sectors besides NBFCs, its MD & CEO AtulKumar Goel said on Thursday.
This is much higher thanthe six per cent overall creditgrowth in FY22.
Q4 numbers“We see 202223 as a very goodyear for the Indian economy.We have reached prepandemic demand levels,” Goelsaid post declaration of thebank’s Q4 results. He highlighted that the scope for PNBto garner treasury incomes
ever, he said that PNB is eyeinga 15 per cent growth in operating profi�t — which had comein at ₹�20,762 crore in FY22 —during the current fi�scal.
He added that PNB is eyeingnet interest margin (NIM) of 3per cent for FY23, up fromabout 2.79 per cent in FY22.
NPA transfer to Bad BankGoel said that PNB plans totransfer nonperforming assets (NPAs) worth ₹�8,000crore to the newlycreated Na
tional Asset ReconstructionCompany Ltd (NARCL) — commonly referred to as Bad Bank— in phases. The fi�rst phasewill involve transfer of badloans worth ₹�2,700 crore byJuneend. PNB has alreadymade 100 per cent provisionsfor these bad loans.
He said that PNB will, thisfi�scal, focus on credit quality,improvement in CASA, NPA recoveries and containment ofslippages. He is optimistic ofthe bank bringing down grossNPA percentage level to singledigits this fi�scal from the existing 11.78 per cent.
Non-core assetsGoel said that PNB would shedstakes in UTI Asset Management Company and CanaraHSBC Oriental Bank of Commerce Life Insurance thisfi�scal. It would also participatein its housing fi�nance arm’sright issue.
Bank expects overall credit growth
of 10% this fiscal, says MD & CEO
Atul Kumar Goel, MD & CEO,
Punjab National Bank
PNB mulls transferring NPAs worth₹�8,000 crore to Bad Bank in phases
YATTI SONI
Bengaluru, May 12
Ola has denied a claim madeby a customer, Balwant Singh,that it had published his son’spersonal data in a press release. Now his son Reetam sayshe will approach the SupremeCourt to fi�le a case against Olafor “selling defective scooters”.
On April 22, in response totweets in which Singh allegedthat his son was involved in anaccident due to a fault in Olascooter, the EV maker had saidin a press statement, “We did athorough investigation of theaccident and the data clearlyshows that the rider was overspeeding throughout thenight and that he braked in apanic, thereby losing controlof the vehicle. There is nothingwrong with the vehicle.”
On April 23, Singh objectedto the use of his escooter telemetry data in the EV manufacturer’s press statement. Hesaid the data was publiclyshared without his consentand authentication, and demanded its removal from thecompany’s social media accounts.
Personally identifiable dataTo this, Ola replied, “Ola respectfully controverts and expressly denies the contentions raised by you(Balwant Singh) andbrings to your notice that theTelematics Dataas published doesnot constitutepersonally identifi�able data or sensitivepersonal data and thecompany did not disclose anypersonally identifi�able or sensitive personal data or information.”
“It is unfortunate to notethat despite the above statedset of facts and circumstances;
and further despite detaileddata that clearly alludes to theusage of the vehicle outsidestatutory limits, usage advisory and above all in an absolutely unsafe manner, youhave since April 15, 2022 continued to make baseless, false,negative, derogatory, derisivecomments in relation to Olascooter and company,” Olaadded.
When contacted, Reetamtold BusinessLine, “Ola’s press
release on the Guhawati incident [site of the acci
dent] identifi�ed Balwant Singh in thefi�rst paragraph itself (‘We send ourheartful wishes toMr. Balwant
Singh’s son…’). Thisshows that the data
has not been shared anonymously and Ola has, in fact,identifi�ed the person drivingthe scooter.”
Stating that the legal noticefrom Ola blames him for driving beyond statutorily permitted speed, he says, “If it is not
statutorily permitted, why areyou selling and advertising‘hyper mode’ and ‘hyper delivery’? This is like the drugdealer blaming the drug addict for drug addiction, whenin the fi�rst place theyshouldn’t be selling thedrugs.”
‘Defective scooters’Beyond the sharing oftelematic data, Reetam wantsto take up the issue of “Olaselling defective scooters tocustomers”. He says he willjoin with other discontentedcustomers to fi�le a case in theSupreme Court.
“Bhavish Agarwal has clearlysuppressed facts, misled customers and falsifi�ed information to keep on selling a dangerous product. This is nolonger a fi�nancial crime but aserious IPC off�ence,” Reetamsaid.
He also wants Ola to publicly declare how many of the51,000 scooters it deliveredhave returned to the workshop due to faulty working.
Ola denies breaching customer privacyReetam Singh,
along with other
discontented
customers, to
approach SC
YATTI SONI
Bengaluru, May 12
Shortly after the exit of OlaCars’ CEO, Ola Electric’s ChiefMarketing Offi�cer Varun Dubeyhas also exited the company.
According to an Ola spokesperson, Dubey has left the company due to personal reasons.This is the most recent exit
among themultiplesenior executives whohave exitedOla in thepast fewmonths.However,the spokes
person saidthat Dubey’s exit is not relatedto Ola Cars’ CEO Arun Sirdeshmukh’s exit. The company hasattributed Sirdeshmukh’s exitto the fact that Arun Kumar GRhas taken over his role of overseeing gotomarket functionand Ola Cars. Arun Kumar GR isthe Group CFO Ola, and CFO OlaElectric.
Ola Electric’s Chief Technology Offi�cer, DineshRadhakrishnan has also beenreported to have quit the company in the past few days. Theseexits come at a time when Olahas been battling multiple customer complaints around Olaelectric scooters.
The company has also announced a recall of 1,441vehicles on April 24, after oneof its scooters caught fi�re inPune.
Ola Electric’sCMO quits
Varun Dubey
KR SRIVATS
New Delhi, May 12
India M&A activity in April2022 saw the highest monthlytotal on record with transactions amounting to $68.1 billion, showed the latest datafrom Refi�nitiv, a provider offi�nancial market data.
This volume was a fourtimes increase over the dealvalue of $14.78 billion in April2021, and a sevenfold jumpfrom March 2022 levels of$9.18 billion.
This brings Indiainvolvement M&A activity this calendar year (Jan 1 to May 11) to$107.7 billion, up 141.5 per centfrom $44.6 billion in the sameperiod last fi�scal. Even interms of number of deals, thecurrent year saw the highestever number at 874 since Refi�nitiv records began in 2000.
HDFC merger impactElaine Tan, Senior Analyst,Deals Intelligence, high
lighted that the number ofdeals — at 171 in April — wasdown 24 per cent from 223deals recorded in March 2022,as activity in April waspropped by the megamergerbetween Housing Development Finance Corp Ltd andHDFC Bank worth $60.4 billion.
The deal is currently thelargest Indian involvementdeal on record, surpassing the$16 billion FlipkartWalmartdeal in 2018, Tan added.
The strong show of M&Aactivity in India comes at atime when global M&A activity has also been quite strong.Deals totalling $378.4 billionwere announced around theworld during April 2022, up 23per cent on a yearonyearbasis.
PE-backed M&AsMeanwhile, private equitybacked M&A activity in Indiatoo saw robust increase of 25.2
per cent from January 1 to May11 of this year at $12.90 billionfrom $10.3 billion in sameperiod last year. This was thehighest ever since the JanMay11, 2000, period. There were234 such deals in the periodunder review, higher than 155deals last year.
April saw PEbackedmonthly volume of $2.59 billion, lower than the $5.67 billion in the same month lastyear. The number of monthlydeals too saw a decline to 41from 54 deals last year. Activityin India in March 2022 stood
at $2.96 billion across 52 deals.In April 2022, global private
equitybacked M&A saw astrong show at $147.4 billion,up 43 per cent over the previous month. In the fi�rst fourmonths of this calendar year,global PEbacked M&A dealsworth $442 billion were recorded, 28 per cent higher thatthe same period last year andan alltime yeartodate high,according to Refi�nitiv.
Private equity deals accounted for 31 per cent of all dealsby value this year, the highestyeartodate share.
April M&A deals hit monthly highAt $68.1 billion, jumped seven-fold
from March amid strong global trends
Implement Industry 4.0 to makeyour Business Covid Proof.WA: 7760587822 W: www.kriscon.inE: [email protected]
BUSINESS OFFER
CONSULTANTS
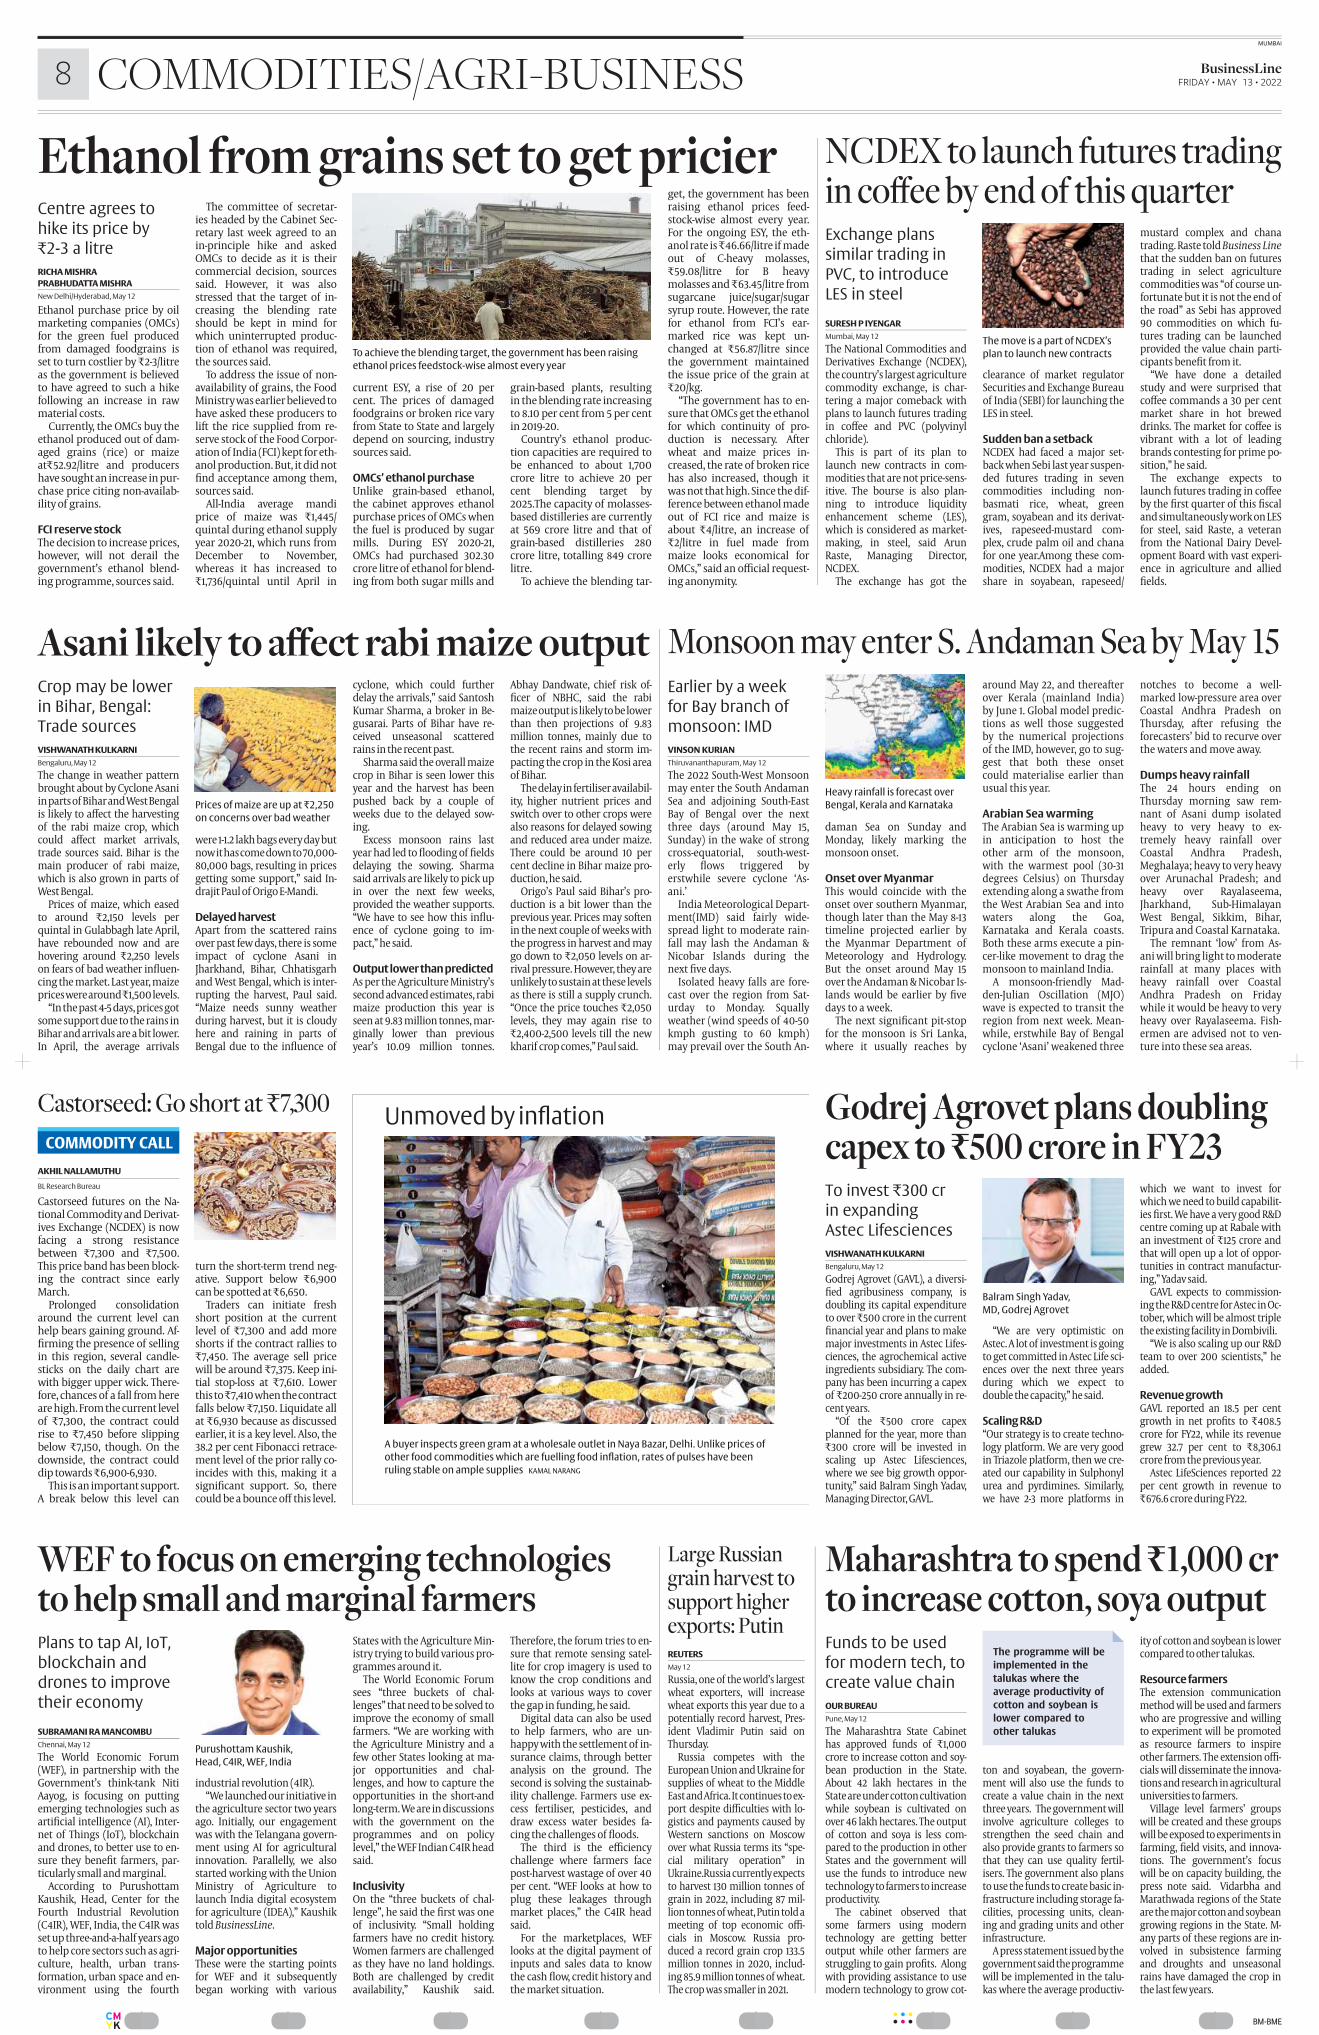
................BM-BMECMYK
MUMBAI
8 BusinessLine FRIDAY • MAY 13 • 2022COMMODITIES/AGRI-BUSINESS
RICHA MISHRA
PRABHUDATTA MISHRA
New Delhi/Hyderabad, May 12
Ethanol purchase price by oilmarketing companies (OMCs)for the green fuel producedfrom damaged foodgrains isset to turn costlier by ₹�23/litreas the government is believedto have agreed to such a hikefollowing an increase in rawmaterial costs.
Currently, the OMCs buy theethanol produced out of damaged grains (rice) or maizeat₹�52.92/litre and producershave sought an increase in purchase price citing nonavailability of grains.
FCI reserve stockThe decision to increase prices,however, will not derail thegovernment’s ethanol blending programme, sources said.
The committee of secretaries headed by the Cabinet Secretary last week agreed to aninprinciple hike and askedOMCs to decide as it is theircommercial decision, sourcessaid. However, it was alsostressed that the target of increasing the blending rateshould be kept in mind forwhich uninterrupted production of ethanol was required,the sources said.
To address the issue of nonavailability of grains, the FoodMinistry was earlier believed tohave asked these producers tolift the rice supplied from reserve stock of the Food Corporation of India (FCI) kept for ethanol production. But, it did notfi�nd acceptance among them,sources said.
AllIndia average mandiprice of maize was ₹�1,445/quintal during ethanol supplyyear 202021, which runs fromDecember to November,whereas it has increased to₹�1,736/quintal until April in
current ESY, a rise of 20 percent. The prices of damagedfoodgrains or broken rice varyfrom State to State and largelydepend on sourcing, industrysources said.
OMCs’ ethanol purchaseUnlike grainbased ethanol,the cabinet approves ethanolpurchase prices of OMCs whenthe fuel is produced by sugarmills. During ESY 202021,OMCs had purchased 302.30crore litre of ethanol for blending from both sugar mills and
grainbased plants, resultingin the blending rate increasingto 8.10 per cent from 5 per centin 201920.
Country’s ethanol production capacities are required tobe enhanced to about 1,700crore litre to achieve 20 percent blending target by2025.The capacity of molassesbased distilleries are currentlyat 569 crore litre and that ofgrainbased distilleries 280crore litre, totalling 849 crorelitre.
To achieve the blending tar
get, the government has beenraising ethanol prices feedstockwise almost every year.For the ongoing ESY, the ethanol rate is ₹�46.66/litre if madeout of Cheavy molasses,₹�59.08/litre for B heavymolasses and ₹�63.45/litre fromsugarcane juice/sugar/sugarsyrup route. However, the ratefor ethanol from FCI’s earmarked rice was kept unchanged at ₹�56.87/litre sincethe government maintainedthe issue price of the grain at₹�20/kg.
“The government has to ensure that OMCs get the ethanolfor which continuity of production is necessary. Afterwheat and maize prices increased, the rate of broken ricehas also increased, though itwas not that high. Since the difference between ethanol madeout of FCI rice and maize isabout ₹�4/litre, an increase of₹�2/litre in fuel made frommaize looks economical forOMCs,” said an offi�cial requesting anonymity.
Centre agrees to
hike its price by
₹�23 a litre
To achieve the blending target, the government has been raising
ethanol prices feedstockwise almost every year
Ethanol from grains set to get pricier
SURESH P IYENGAR
Mumbai, May 12
The National Commodities andDerivatives Exchange (NCDEX),the country’s largest agriculturecommodity exchange, is chartering a major comeback withplans to launch futures tradingin coff�ee and PVC (polyvinylchloride).
This is part of its plan tolaunch new contracts in commodities that are not pricesensitive. The bourse is also planning to introduce liquidityenhancement scheme (LES),which is considered as marketmaking, in steel, said ArunRaste, Managing Director,NCDEX.
The exchange has got the
clearance of market regulatorSecurities and Exchange Bureauof India (SEBI) for launching theLES in steel.
Sudden ban a setbackNCDEX had faced a major setback when Sebi last year suspended futures trading in sevencommodities including nonbasmati rice, wheat, greengram, soyabean and its derivatives, rapeseedmustard complex, crude palm oil and chanafor one year.Among these commodities, NCDEX had a majorshare in soyabean, rapeseed/
mustard complex and chanatrading. Raste told Business Line
that the sudden ban on futurestrading in select agriculturecommodities was “of course unfortunate but it is not the end ofthe road” as Sebi has approved90 commodities on which futures trading can be launchedprovided the value chain participants benefi�t from it.
“We have done a detailedstudy and were surprised thatcoff�ee commands a 30 per centmarket share in hot breweddrinks. The market for coff�ee isvibrant with a lot of leadingbrands contesting for prime position,” he said.
The exchange expects tolaunch futures trading in coff�eeby the fi�rst quarter of this fi�scaland simultaneously work on LESfor steel, said Raste, a veteranfrom the National Dairy Development Board with vast experience in agriculture and alliedfi�elds.
Exchange plans
similar trading in
PVC, to introduce
LES in steel
NCDEX to launch futures tradingin coffee by end of this quarter
The move is a part of NCDEX’s
plan to launch new contracts
VISHWANATH KULKARNI
Bengaluru, May 12
The change in weather patternbrought about by Cyclone Asaniin parts of Bihar and West Bengalis likely to aff�ect the harvestingof the rabi maize crop, whichcould aff�ect market arrivals,trade sources said. Bihar is themain producer of rabi maize,which is also grown in parts ofWest Bengal.
Prices of maize, which easedto around ₹�2,150 levels perquintal in Gulabbagh late April,have rebounded now and arehovering around ₹�2,250 levelson fears of bad weather infl�uencing the market. Last year, maizeprices were around ₹�1,500 levels.
“In the past 45 days, prices gotsome support due to the rains inBihar and arrivals are a bit lower.In April, the average arrivals
were 11.2 lakh bags every day butnow it has come down to 70,00080,000 bags, resulting in pricesgetting some support,” said Indrajit Paul of Origo EMandi.
Delayed harvestApart from the scattered rainsover past few days, there is someimpact of cyclone Asani inJharkhand, Bihar, Chhatisgarhand West Bengal, which is interrupting the harvest, Paul said.“Maize needs sunny weatherduring harvest, but it is cloudyhere and raining in parts ofBengal due to the infl�uence of
cyclone, which could furtherdelay the arrivals,” said SantoshKumar Sharma, a broker in Begusarai. Parts of Bihar have received unseasonal scatteredrains in the recent past.
Sharma said the overall maizecrop in Bihar is seen lower thisyear and the harvest has beenpushed back by a couple ofweeks due to the delayed sowing.
Excess monsoon rains lastyear had led to fl�ooding of fi�eldsdelaying the sowing. Sharmasaid arrivals are likely to pick upin over the next few weeks,provided the weather supports.“We have to see how this infl�uence of cyclone going to impact,” he said.
Output lower than predictedAs per the Agriculture Ministry’ssecond advanced estimates, rabimaize production this year isseen at 9.83 million tonnes, marginally lower than previousyear’s 10.09 million tonnes.
Abhay Dandwate, chief risk offi�cer of NBHC, said the rabimaize output is likely to be lowerthan then projections of 9.83million tonnes, mainly due tothe recent rains and storm impacting the crop in the Kosi areaof Bihar.
The delay in fertiliser availability, higher nutrient prices andswitch over to other crops werealso reasons for delayed sowingand reduced area under maize.There could be around 10 percent decline in Bihar maize production, he said.
Origo’s Paul said Bihar’s production is a bit lower than theprevious year. Prices may softenin the next couple of weeks withthe progress in harvest and maygo down to ₹�2,050 levels on arrival pressure. However, they areunlikely to sustain at these levelsas there is still a supply crunch.“Once the price touches ₹�2,050levels, they may again rise to₹�2,4002,500 levels till the newkharif crop comes,” Paul said.
Crop may be lower
in Bihar, Bengal:
Trade sources
Asani likely to affect rabi maize output
Prices of maize are up at ₹�2,250
on concerns over bad weather
VINSON KURIAN
Thiruvananthapuram, May 12
The 2022 SouthWest Monsoonmay enter the South AndamanSea and adjoining SouthEastBay of Bengal over the nextthree days (around May 15,Sunday) in the wake of strongcrossequatorial, southwesterly fl�ows triggered byerstwhile severe cyclone ‘Asani.’
India Meteorological Department(IMD) said fairly widespread light to moderate rainfall may lash the Andaman &Nicobar Islands during thenext fi�ve days.
Isolated heavy falls are forecast over the region from Saturday to Monday. Squallyweather (wind speeds of 4050kmph gusting to 60 kmph)may prevail over the South An
daman Sea on Sunday andMonday, likely marking themonsoon onset.
Onset over Myanmar This would coincide with theonset over southern Myanmar,though later than the May 813timeline projected earlier bythe Myanmar Department ofMeteorology and Hydrology.But the onset around May 15over the Andaman & Nicobar Islands would be earlier by fi�vedays to a week.
The next signifi�cant pitstopfor the monsoon is Sri Lanka,where it usually reaches by
around May 22, and thereafterover Kerala (mainland India)by June 1. Global model predictions as well those suggestedby the numerical projectionsof the IMD, however, go to suggest that both these onsetcould materialise earlier thanusual this year.
Arabian Sea warming The Arabian Sea is warming upin anticipation to host theother arm of the monsoon,with the warmest pool (3031degrees Celsius) on Thursdayextending along a swathe fromthe West Arabian Sea and intowaters along the Goa,Karnataka and Kerala coasts.Both these arms execute a pincerlike movement to drag themonsoon to mainland India.
A monsoonfriendly MaddenJulian Oscillation (MJO)wave is expected to transit theregion from next week. Meanwhile, erstwhile Bay of Bengalcyclone ‘Asani’ weakened three
notches to become a wellmarked lowpressure area overCoastal Andhra Pradesh onThursday, after refusing theforecasters’ bid to recurve overthe waters and move away.
Dumps heavy rainfall The 24 hours ending onThursday morning saw remnant of Asani dump isolatedheavy to very heavy to extremely heavy rainfall overCoastal Andhra Pradesh,Meghalaya; heavy to very heavyover Arunachal Pradesh; andheavy over Rayalaseema,Jharkhand, SubHimalayanWest Bengal, Sikkim, Bihar,Tripura and Coastal Karnataka.
The remnant ‘low’ from Asani will bring light to moderaterainfall at many places withheavy rainfall over CoastalAndhra Pradesh on Fridaywhile it would be heavy to veryheavy over Rayalaseema. Fishermen are advised not to venture into these sea areas.
Earlier by a week
for Bay branch of
monsoon: IMD
Monsoon may enter S. Andaman Sea by May 15
Heavy rainfall is forecast over
Bengal, Kerala and Karnataka
AKHIL NALLAMUTHU
BL Research Bureau
Castorseed futures on the National Commodity and Derivatives Exchange (NCDEX) is nowfacing a strong resistancebetween ₹�7,300 and ₹�7,500.This price band has been blocking the contract since earlyMarch.
Prolonged consolidationaround the current level canhelp bears gaining ground. Affi�rming the presence of sellingin this region, several candlesticks on the daily chart arewith bigger upper wick. Therefore, chances of a fall from hereare high. From the current levelof ₹�7,300, the contract couldrise to ₹�7,450 before slippingbelow ₹�7,150, though. On thedownside, the contract coulddip towards ₹�6,9006,930.
This is an important support.A break below this level can
turn the shortterm trend negative. Support below ₹�6,900can be spotted at ₹�6,650.
Traders can initiate freshshort position at the currentlevel of ₹�7,300 and add moreshorts if the contract rallies to₹�7,450. The average sell pricewill be around ₹�7,375. Keep initial stoploss at ₹�7,610. Lowerthis to ₹�7,410 when the contractfalls below ₹�7,150. Liquidate allat ₹�6,930 because as discussedearlier, it is a key level. Also, the38.2 per cent Fibonacci retracement level of the prior rally coincides with this, making it asignifi�cant support. So, therecould be a bounce off� this level.
Castorseed: Go short at ₹�7,300
VISHWANATH KULKARNI
Bengaluru, May 12
Godrej Agrovet (GAVL), a diversifi�ed agribusiness company, isdoubling its capital expenditureto over ₹�500 crore in the currentfi�nancial year and plans to makemajor investments in Astec Lifesciences, the agrochemical activeingredients subsidiary. The company has been incurring a capexof ₹�200250 crore annually in recent years.
“Of the ₹�500 crore capexplanned for the year, more than₹�300 crore will be invested inscaling up Astec Lifesciences,where we see big growth opportunity,” said Balram Singh Yadav,Managing Director, GAVL.
“We are very optimistic onAstec. A lot of investment is goingto get committed in Astec Life sciences over the next three yearsduring which we expect todouble the capacity,” he said.
Scaling R&D“Our strategy is to create technology platform. We are very goodin Triazole platform, then we created our capability in Sulphonylurea and pyrdimines. Similarly,we have 23 more platforms in
which we want to invest forwhich we need to build capabilities fi�rst. We have a very good R&Dcentre coming up at Rabale withan investment of ₹�125 crore andthat will open up a lot of opportunities in contract manufacturing,” Yadav said.
GAVL expects to commissioning the R&D centre for Astec in October, which will be almost triplethe existing facility in Dombivili.
“We is also scaling up our R&Dteam to over 200 scientists,” headded.
Revenue growthGAVL reported an 18.5 per centgrowth in net profi�ts to ₹�408.5crore for FY22, while its revenuegrew 32.7 per cent to ₹�8,306.1crore from the previous year.
Astec LifeSciences reported 22per cent growth in revenue to₹�676.6 crore during FY22.
To invest ₹�300 cr
in expanding
Astec Lifesciences
Godrej Agrovet plans doublingcapex to ₹�500 crore in FY23
Balram Singh Yadav,
MD, Godrej Agrovet
SUBRAMANI RA MANCOMBU
Chennai, May 12
The World Economic Forum(WEF), in partnership with theGovernment’s thinktank NitiAayog, is focusing on puttingemerging technologies such asartifi�cial intelligence (AI), Internet of Things (IoT), blockchainand drones, to better use to ensure they benefi�t farmers, particularly small and marginal.
According to PurushottamKaushik, Head, Center for theFourth Industrial Revolution(C4IR), WEF, India, the C4IR wasset up threeandahalf years agoto help core sectors such as agriculture, health, urban transformation, urban space and environment using the fourth
industrial revolution (4IR).“We launched our initiative in
the agriculture sector two yearsago. Initially, our engagementwas with the Telangana government using AI for agriculturalinnovation. Parallelly, we alsostarted working with the UnionMinistry of Agriculture tolaunch India digital ecosystemfor agriculture (IDEA),” Kaushiktold BusinessLine.
Major opportunitiesThese were the starting pointsfor WEF and it subsequentlybegan working with various
States with the Agriculture Ministry trying to build various programmes around it.
The World Economic Forumsees “three buckets of challenges” that need to be solved toimprove the economy of smallfarmers. “We are working withthe Agriculture Ministry and afew other States looking at major opportunities and challenges, and how to capture theopportunities in the shortandlongterm. We are in discussionswith the government on theprogrammes and on policylevel,” the WEF Indian C4IR headsaid.
InclusivityOn the “three buckets of challenge”, he said the fi�rst was oneof inclusivity. “Small holdingfarmers have no credit history.Women farmers are challengedas they have no land holdings.Both are challenged by creditavailability,” Kaushik said.
Therefore, the forum tries to ensure that remote sensing satellite for crop imagery is used toknow the crop conditions andlooks at various ways to coverthe gap in funding, he said.
Digital data can also be usedto help farmers, who are unhappy with the settlement of insurance claims, through betteranalysis on the ground. Thesecond is solving the sustainability challenge. Farmers use excess fertiliser, pesticides, anddraw excess water besides facing the challenges of fl�oods.
The third is the effi�ciencychallenge where farmers facepostharvest wastage of over 40per cent. “WEF looks at how toplug these leakages throughmarket places,” the C4IR headsaid.
For the marketplaces, WEFlooks at the digital payment ofinputs and sales data to knowthe cash fl�ow, credit history andthe market situation.
Plans to tap AI, IoT,
blockchain and
drones to improve
their economy
WEF to focus on emerging technologies to help small and marginal farmers
Purushottam Kaushik,
Head, C4IR, WEF, India
REUTERS
May 12
Russia, one of the world’s largestwheat exporters, will increasewheat exports this year due to apotentially record harvest, President Vladimir Putin said onThursday.
Russia competes with theEuropean Union and Ukraine forsupplies of wheat to the MiddleEast and Africa. It continues to export despite diffi�culties with logistics and payments caused byWestern sanctions on Moscowover what Russia terms its “special military operation” inUkraine.Russia currently expectsto harvest 130 million tonnes ofgrain in 2022, including 87 million tonnes of wheat, Putin told ameeting of top economic offi�cials in Moscow. Russia produced a record grain crop 133.5million tonnes in 2020, including 85.9 million tonnes of wheat.The crop was smaller in 2021.
Large Russiangrain harvest tosupport higherexports: Putin
OUR BUREAU
Pune, May 12
The Maharashtra State Cabinethas approved funds of ₹�1,000crore to increase cotton and soybean production in the State.About 42 lakh hectares in theState are under cotton cultivationwhile soybean is cultivated onover 46 lakh hectares. The outputof cotton and soya is less compared to the production in otherStates and the government willuse the funds to introduce newtechnology to farmers to increaseproductivity.
The cabinet observed thatsome farmers using moderntechnology are getting betteroutput while other farmers arestruggling to gain profi�ts. Alongwith providing assistance to usemodern technology to grow cot
ton and soyabean, the government will also use the funds tocreate a value chain in the nextthree years. The government willinvolve agriculture colleges tostrengthen the seed chain andalso provide grants to farmers sothat they can use quality fertilisers. The government also plansto use the funds to create basic infrastructure including storage facilities, processing units, cleaning and grading units and otherinfrastructure.
A press statement issued by thegovernment said the programmewill be implemented in the talukas where the average productiv
ity of cotton and soybean is lowercompared to other talukas.
Resource farmersThe extension communicationmethod will be used and farmerswho are progressive and willingto experiment will be promotedas resource farmers to inspireother farmers. The extension offi�cials will disseminate the innovations and research in agriculturaluniversities to farmers.
Village level farmers’ groupswill be created and these groupswill be exposed to experiments infarming, fi�eld visits, and innovations. The government’s focuswill be on capacity building, thepress note said. Vidarbha andMarathwada regions of the Stateare the major cotton and soybeangrowing regions in the State. Many parts of these regions are involved in subsistence farmingand droughts and unseasonalrains have damaged the crop inthe last few years.
Funds to be used
for modern tech, to
create value chain
Maharashtra to spend ₹�1,000 crto increase cotton, soya output
WXThe programme will be
implemented in the
talukas where the
average productivity of
cotton and soybean is
lower compared to
other talukas
COMMODITY CALL
Unmoved by infl�ation
A buyer inspects green gram at a wholesale outlet in Naya Bazar, Delhi. Unlike prices of
other food commodities which are fuelling food infl�ation, rates of pulses have been
ruling stable on ample supplies KAMAL NARANG
................BM-BMECMYK
MUMBAI
BusinessLineFRIDAY • MAY 13 • 2022 9NEWS
AMITI SEN
New Delhi, May 12
The Production Linked Incentive 2.0 for the textile industrymay restricted to garments andapparel, according to an offi�cialtracking the developments.
“The specifi�cs of the secondedition of the PLI scheme, including the product coverage,are still being fi�nalised. Restricting the scheme to garments andapparel is being seriously considered as it is where employment generation is at itsmaximum. If that happens,then the minimum investmentrequirement could be broughtdown to ₹�40–50 crore, while theminimum turnover requirement could be about ₹�100crore. But the matter is still under discussion,” the offi�cial toldBusinessLine.
The Textile Ministry has so farapproved 64 applications under
the scheme with a proposedtotal investment of ₹�19,798crore and a projected turnoverof ₹�1.93lakh crore. As thebudget for incentives under thescheme, fi�xed at ₹�10,683 crore, ismore than what would be utilised as payouts to the 64 shortlisted investors, the excess ofabout ₹�4,000 crore can be utilised as incentives under PLI 2.0.
PLI schemeThe PLI scheme for textiles isavailable for the production ofmanmade fi�bre fabrics, and apparels and technical textiles.The fi�rst part of the scheme re
quires a minimum investmentof ₹�300 crore and a minimumturnover of ₹�600 crore. Investors are entitled to an incentive of 15 per cent of theminimum turnover in the fi�rstyear, which would go down by 1per cent over the next four years.Part two requires a minimuminvestment of ₹�100 crore, and aminimum turnover of ₹�200crore. The incentive here islower at 11 per cent in the fi�rstyear, which would be reducedby 1 per cent over the next fouryears. “A majority of the 64 proposals that have been approvedso far are under part two, where
the minimum investment andturnover criteria is lower. To ensure participation of a largernumber of garment and apparel manufacturers, it wouldcertainly need to be broughtdown further,” the offi�cial said.
‘Not capital intensive’ Manufacturing of garments isnot very capital intensive, unlike textiles such as technicaltextiles or an integrated valuechains where weaving, spinning, and processing have to beundertaken, the offi�cialexplained.
“Basically, you need a shed forsewing machines. Typically, athousand machines should costaround ₹�40 crore. So, the minimum investment limit shouldnot be over ₹�4050 crore. Sincethe ratio of investment toturnover for garments is relatively better, the minimumturnover requirement could be₹�100 crore,” the offi�cial said.
The PLI schemes announcedby the Centre across 14 sectorshave the potential to generate atleast 60lakh new jobs, according to the Finance Ministry.
This segment holds
the highest
employment
potential, say sources
Textile Ministry approved 64 applications under the PLI scheme
with a proposed total investment of ₹�19,798 crore
‘Textile PLI 2.0 may be tailoredfor garment, apparel segment’
AM JIGEESH
New Delhi, May 12
The Parliamentary StandingCommittee on the welfare ofScheduled Castes and Scheduled Tribes, headed by seniorBJP MP Kirit Solanki, has decided to study the representation of SCs and STs in theJudiciary “with special reference to the appointment inHigh Courts and SupremeCourt”.
Members in the panel saidthe decision is a refl�ection ofthe demand that reservationmust be followed in judicialappointments too.
The Lok Sabha bulletin saidthe panel will examine “representation of ScheduledCastes and Scheduled Tribesin judiciary with special reference to the appointment inHigh Courts and SupremeCourt.”
‘Court verdicts’When contacted a rulingparty member in the panelsaid they have asked the LawMinistry to brief the panelabout the current situation.“We want all stakeholders tobe heard before submitting areport to Parliament on thecontroversial issue,” themember said.
Another senior membertold BusinessLine that thepanel will also study certain
recent higher court verdictsagainst reservation, particularly those against reservation in promotions.
The panel has also decidedto look into the issue of All India Judicial Services. “Statusof All India Judicial Servicesunder Article 312 of the Con
Central Public Sector Undertakings will also be examined.
“Role of autonomous bodies, Public Enterprises, educational Institutionsincluding Central Universities, Engineering Colleges,IIMs, IITs, Medical Institutesincluding AIIMS in socioeconomic development ofScheduled Castes and Scheduled Tribes” is another subject along with theimplementation of reservation policy in the Ministries/Departments of the Centreand the States.
The panel will also reviewthe functioning of NationalScheduled Castes Financeand DevelopmentCorporation.
stitution of India and itsscope of reservation forScheduled Castes and Scheduled Tribes” is another subject that will be studied bythe Parliamentary panel inthis year.Apart from that, the panelwill examine annual Reportsof National Commission forScheduled Castes/ScheduledTribes and the reservationpolicy in Public Sector.
Reservation in PSUsIt will also study atrocitycases against ScheduledCastes and Scheduled Tribeswith respect to implementation of the Prevention of Atrocities Act. The status ofreservation of ScheduledCastes/Scheduled Tribes in
Panel to examine SC, ST representation in Judiciary
BJP MP Kirit Solanki
‘Reflects demand
for reservation in
HCs, Apex Court’
OUR BUREAU
New Delhi, May 12
India may consider negotiating a preferential tradeagreement with Oman whileit works on a comprehensiveeconomic agreement withthe Gulf Cooperation Council (GCC), Commerce and Industry Minister Piyush Goyalsaid at the IndiaOman JointBusiness Council meeting onThursday.
“We have discussed certainitems where there are someissues that need to be resolved,” Goyal said.
Oman’s Minister of Commerce, Industry, and Investment Promotion Qais binMohammed Al Yousef,Omani envoy to India SheikhHamad Bin Saif Bin AbdulAziz AlRawahi, Indian Ambassador to Oman AmitNarang, and industry representatives from both countries were present at themeeting.
Joint Commission Meeting India has just concluded afree trade agreement withthe UAE, one of the six GCCmembers. Oman will be thesecond country from thegroup with which India willbe negotiating a trade agree
ment if things advance in thestated direction. The otherGCC members include SaudiArabia, Kuwait, Qatar, andBahrain. Although, India’sproposed free trade agreement with the GCC has beenstuck for long, eff�orts arenow on to restart the talks.
The Minister said that thelong overdue Joint Commission Meeting that took placeon Wednesday between Indiaand Oman, was a very productive one. He expressedconfi�dence that the discussions with business leaderson both sides would complement the discussions under
JCM to come up with newideas to boost bilateralpartnership.
Goyal pointed out thatconnections and friendshipbetween the two countrieswent back 5,000 years, yettwoway trade was in the region of $78 billion, while investment was hoveringaround $56 billion. The Minister emphasised that the engagement in the JCM, thefriendship between him andhis counterpart in Oman, thevisionary leadership of theheads of both nations, andthe warm peopletopeopleties between the two nations
should and must lead to asignifi�cant increase in businesstobusiness engagement, according to an offi�cialstatement by the Commerce& Industry Ministry.
Confidence in pharmaNoting the market study oncooperation in the pharmaceutical sector that was unveiled at the JCM, theMinister expressed confi�dence that “Our pharma companies will bring qualityproducts at competitiveprices to consumers in Omanand help bring down the costof healthcare,” he assured.He also thanked Oman foragreeing to fasttrack approval for Indian medicinesthat had already beencleared by strong regulatoryenvironments like the UK,the EU, and the US.
India’s exports to Oman include mineral fuels, machinery, cereals, articles ofiron or steel, electrical andelectronic equipment, vegetables, dairy products, meatand chemicals and plastics.The main items of importfrom Oman include mineralfuels, fertilisers, chemicals,plastics, iron and steel andaluminium.
Next, India-Oman preferential trade pact: Goyal
Commerce and Industry Minister Piyush Goyal with Oman’s
Minister of Commerce, Industry and Investment Promotion,
Qais Bin Mohammed Al Yousef, during the 10th IndiaOman
Business council meeting, on Thursday PTI
ABHISHEK LAW
New Delhi, May 12
India’s new regional connectivity scheme will look at“last mile connectivity” in TierII and TierIII towns throughsmall aircraft, includingsub20 seaters, the Civil Aviation Minister, JyotiradityaScindia said.
Scheme proposals are alsobeing formulated exclusivelyaround seaplanes.
According to Scindia, UDAN4.2 is based on all the routesthat “either were not executedin the earlier rounds” or onthe small aircraft schemeroutes.
Approximately 370 routesare being considered UDAN4.2, including 100 seaplaneroutes, 60odd helicopterroutes.
“You need to be able to lookat the metros as your base, andfrom the base you need to lookat international traffi�c coming in. And from the metros,you need to look downwardsfor TierII and TierIII connectivities. So I am coming up
with a small aircraft scheme,”Scindia told BusinessLine.
“Those (UDAN 4.2 routes)should open up around May30 and the results will be available in the next few weeks orso,” he added.
Scindia explained that thereare three options that havebeen included in the small aircraft scheme to make off�erings fi�nancially viable for operators.
Small aircraft schemeProposals include fi�xed farefor the full plane (based onwhich operators apply for vi
ability gap funding); a variable option where the airlineoperators bid for the route inthe form of VGF per seat, withthe VGF being capped for aparticular number of seatsand the other seats are pricedaccording to market dynamics; and primarily for seaplanes, where the leasing costof the plane will also be takeninto account at the time ofbidding.
“Seaplanes, never took off� inIndia because the capital costor leasing cost of an aircraftcannot be defrayed across thenumber of seats. Then it becomes too uneconomical, “hesaid. Around ₹�98,000 crore ofcapex has been earmarkedacross airports over the nextthreetofour years. These include 42 brownfi�eld expansion projects and three greenfi�eld projects by the AirportsAuthority of India at an estimated cost of ₹�32,000 crore.Around ₹�66,000 crore will beinvested by private playersacross seven brownfi�eld andfour greenfi�eld airports.
‘Udan 4.2 is about last-mile connectivity’
Civil Aviation Minister
Jyotiraditya Scindia
SHOBHA ROY
Kolkata, May 11
Vedant Fashions, whichowns the ethnic wear brandManyavar, plans to enhancefocus on the children’s segment and ramp up its presence both in domestic andinternational markets todrive growth. Plans are afootto strengthen its women’swedding and celebrationwear under the brand Moheyby setting up standalonestores.
In its recent investorpresentation for Q4FY22,made available on stock exchanges, it said it is lookingat opportunities in adjacentproduct categories withinwedding and celebrationwear such as apparels andaccessories and establishleadership position in women’s Indian wedding andcelebration wear market like‘Manyavar’.
It will establish standalone ‘Mohey’ brand stores
and crosssell with ‘Manyavar’ brand as coordinatedjodi.
“Vedant Fashion will increase penetration in existing markets and expand innew cities and towns,” it saidin its investor presentation,and is planning to double exclusive retail footprint to 2.2million sq ft from the current 1.3 million sq ft in thenext few years. The companycurrently has 583 exclusiveoutlets across 223 cities andtowns in India and 12 in USA,Canada and the UAE.
Quarterly resultsFor the quarter ended March31, 2022, the company witnessed 59 per cent growth instandalone revenue from operations at ₹�289 crore, ascompared with ₹�182 crore inthe same period last year. Itsstandalone net profi�t increased by 98 per cent at ₹�87crore, as against ₹�44 croresame period last year.
Vedant Fashions to expandwomen’s wedding wear brand
OUR BUREAU
Pune, May 12
Electric twowheeler maker,EVTRIC Motors, has set upover 100 dealerships acrossIndia in the last six months.
Currently EVTRIC Scootersare available in Rajasthan,Punjab, Uttar Pradesh, Maharashtra, Gujarat, Karnataka,Telangana, Kerala, WestBengal and Bihar with a signifi�cant presence in in Tire IIand Tier III markets and interior locations. The smallcities include Agra, Varanasi,Aligarh, Jodhpur, Bikanerand Surat.
Manoj Patil, Founder andMD EVTRIC Motors said thebrand is off�ering seven different electric scooters.
EVTRIC has inhouse roboticwelding chassis manufacturing and building and is onthe path to achieve 100 percent madeinIndia product,the company statement added.
Currently, Maharashtraand Karnataka are the twoStates generating maximumsales for EVTRIC Motors.The company is on target toset up 350 dealerships acrossIndia, it said.
E-scooter maker has
set up 100 outlets
over the last six
months with focus
on small towns
EVTRIC Motors targets 350 dealerships across India
RISHI RANJAN KALA
New Delhi, May 12
The Central Electricity Regulatory Commission has introduced the concept of multiplier for renewable energycertifi�cates (RECs) for new projects based on the tariff� rangeof various technologies by notifying the REC Regulations2022.
Introducing a technologymultiplier will help boost adoption of new renewable energy and costly technologiesand provide an avenue to off�erincentives for promoting lessmature technologies.
Certificate multiplierThe certifi�cate multiplier assigned to RE technologies willbe applicable for 15 years fromthe date of commissioning ofthe project. For the next threeyears, the CERC has assigned a
certifi�cate multiplier value of 1for onshore and off�shorewind projects, while hydro hasbeen assigned a value of 1.5.However, to boost the adoptionof new technologies for municipal solid waste (MSW) andnonfossil fuelbased cogeneration, the commission has assigned it a value of 2.
Boost for biomass, biofuelsAlso, biomass and biofuel projects have been assigned thehighest certifi�cate multiplierof 2.5, which indicates the regulator’s intent of off�ering maximum incentives to thistechnology.
In a notifi�cation on Monday,the CERC said that each REC issued under these regulationsshall represent one megawatthour (MWh) of electricity generated from renewable sourcesand injected or deemed to be
injected into the grid. Besides,the notifi�cations allow any generator, whose tariff� has notbeen determined under Section 62 or 63 of the ElectricityAct or who has not sold powerdirectly or through traders orin power exchange for Renewable Purchase Obligation compliance would be eligible forRECs.
However, the generatorshould not have availed benefi�ts of concessional or waiver oftransmission charge or wheeling charge. Also the registration of such entities would bevalid for 25 years from the dateof registration.
Captive generating stationsbased on renewable sources
will also be eligible for the saleof REC beyond selfconsumption. Discoms or open accessconsumers shall also be eligible for REC to the extent of excess procured over their RPOspecifi�ed by the respectiveState Commission.
Besides, the transactions ofRECs through power exchanges, transactions of certifi�cates through electricitytraders at mutually agreedprices have also been allowed.Also, there will be no fl�oor orforbearance price for certifi�cates. RECs issued to an entityshall remain valid till they aresold on a power exchange orthrough a trader and used forRPO compliance.
CERC introduces REC multiplier conceptBiomass, biofuel projects are rated the
highest at 2.5 times with each
RE Certificate representing 1 MWh
Nature hits back
The sea appears to have dumped back the city’s refuse at Lawson’s Bay Beach in
Visakhapatnam, on Thursday, as the severe cyclone Asani lashed the coast. The entire
beach was carpeted with garbage, including plastics KR DEEPAK
OUR BUREAU
New Delhi, May 12
President Ram Nath Kovindappointed Rajiv Kumar, theseniormost election commissioner, as the next ChiefElection Commissioner hereon Thursday. Kumar will assume charge on Sunday,when he will take over fromCEC Sushil Chandra who retires on Saturday.
Kumar will oversee the2024 Lok Sabha elections andupcoming Assembly elections.He will retire in February 2025.
Kumar is a 1984batch Indian Administrative Serviceoffi�cer of the Bihar/Jharkhand cadre. He superannuated from service inFebruary 2020.
Addressing Chief ElectoralOffi�cers of various States, Kumar said, “With a legacy ofthe past seven decades, ECIhas established exemplary,vibrant, and transparent processes for other democracies,” he said.
He said his experience ofconducting elections duringthe pandemic, has been fullof challenges and learning.
The unprecedented situationdemanded dynamic decisionmaking and preemptivemeasures.
‘Carry forward reforms’He asked the CEOs to carryforward the journey of reforms initiated during thetenure of Chandra to furtherstreamline the election processes.
ECI has streamlined theentire IT infrastructure witha focus on three criticalstakeholders — voters, political parties, and electionmanagement functionaries.He asked CEOs to strengthentheir IT systems, includingtraining of the IT personnelto adapt to the latestadvancements.
Election Commissioner Rajiv Kumar
Rajiv Kumar is next CEC
OUR BUREAU
New Delhi, May 12
The threeday ChintanShivir (brainstorming session) of the Congress will begin in Udaipur on Friday,which the party hopes will bea “new milestone of hope, aspirations and change.”
More than 400 functionaries will discuss politics, economy, agriculture, socialjustice, organisation and issues pertaining to youth during the session.
Rajasthan Chief MinisterAshok Gehlot and Congressgeneral secretary RandeepSingh Surjewala briefed reporters ahead of the meet.
‘New resolve’Gehlot said the BJP’s dream ofa Congressfree India will nothappen, and he said the threeday session will give a new resolve to the party.
Surjewala said the Congressresolves to work for a new India of progress, prosperity,and societal harmony. He saidthe party will introspect, con
template, and refl�ect upon theway forward and new milestones to be traversed in thesession.
“The insurmountable“wealth inequality” in Indiameans that the wealth of the142 richest Indians has goneup by ₹�30lakh crore in oneyear, whereas the income of 84per cent of Indian householdsdropped drastically,” he said.
He added that the free fall ofthe Indian economy has resulted in the Indian rupee fallingto an abysmal level of one dollar valued at ₹�77.50.
Six topics to be taken up “The Indian National Congresshas therefore chosen six subjects and constituted groupsto examine and submit theirprimary reports on actionables. These groups are: political, social justice and empowerment, economy,Congress organisation, Kisanand Khet Mazdoor, and youth.They will present their fi�rst impressions for a conclusive discussion,” he added.
Cong’s Shivir starts today
................BM-BMECMYK
MUMBAI
10 BusinessLine FRIDAY • MAY 13 • 2022NEWS
PT JYOTHI DATTA
Mumbai, May 12
With Covid19 becoming more“manageable” and expected tocome in waves, drugmaker Ciplasees uncertainty now comingfrom geopolitical challenges indiff�erent parts of the world.
“I see a lot of uncertainty on account of the procurement freightcosts for over the next 34months,” Umang Vohra, MD andGlobal CEO of Cipla, told Busi-nessLine.
“Geopolitically, how this impacts every market is a challenge,and I think we have to off�set thatwith a huge amount of executionon our side to make surelaunches go on,” he said, referring to strife in diff�erent parts of
the world, from Sri Lanka to Russia’s war on Ukraine.
What lies ahead?Cipla has a sizeable portfolio ofdrugs to treat Covid19, from theearly antivirals like Remdesivir toPaxlovid, the most recent onefrom Pfi�zer. Its kitty also includesRoche’s Tocilizumab, besides itsantibody cocktail therapy, the latter, however, seeing a slower off�take in the country.
The company’s India revenuesdid see a robust growth, including revenues from its Covid portfolio. However, the last quarterended March 31, 2022, also saw thecompany take a ₹�200crore impact from, among other things,demand variability in forecasts
largely due to Covid, he said. Cipla was also said to be help
ing Moderna with regulatory issues to bring its mRNA vaccineinto India. In fact, the vaccine hadeven received an emergency useauthorisation. However, Vohra,said, that did not seem to move
ahead as the environment in India had since changed. Outliningpriorities in the year ahead, Vohrasaid it would include ensuringthe pipeline of product launchesin the US, India and South Africa;and being prepared to get itsplants audited by the US Food andDrug Administration.
Financial performanceThe company posted revenues of₹�5,260 crore for Q4 FY22, up 14 percent over the same quarter in theprevious year. It also saw a 12 percent dip in its profi�t after tax at₹�362 crore compared to Q3. ForFY22, the company’s revenuesstood at ₹�21,763 crore (up 14 percent), and profi�t after tax at ₹�2,517crore (up 4.7 per cent).
Geopolitical challenges across the worldcast a shadow of uncertainty: Cipla CEO
Umang Vohra, MD and Global
CEO of Cipla
MEERA SRINIVASAN
Colombo, May 12
Sri Lankan President GotabayaRajapaksa on Thursday appointed former PM Ranil Wickremesinghe as Premier, in a bidto restore stability in the islandnation.
This is the sixth time Wickremesinghe, 73, has been appointed to the offi�ce — he hasnever fi�nished a full term.
Gotabaya’s older brotherMahinda Rajapaksa resigned asPrime Minister on Monday,hours after his supporters violently attacked antigovernment protesters.
Wickremesinghe’s UnitedNational Party (UNP) wasdecimated in the 2020 generalelections, in which the Rajapaksas secured a twothird majority. Wickremesinghe is currently the only member ofParliament from his party. Although he lost the 2020 general
elections, the UNP nominatedhim to legislature on the national list.
Just ahead of the 2020 poll,Wickremesinghe’s formerdeputy Sajith Premadasa brokeaway from the UNP and formedthe Samagi Jana Balawegaya(SJB or United People’s Force),the main Opposition party now.
Wickremesinghe’s majorityin Parliament is contingent onsubstantial support from theruling party. Most of its members have promised to backhim, according to politicalsources.
Meanwhile, OppositionLeader Sajith Premadasa, too,said he was willing to form anew government if the President committed to steppingdown within “a minimum timeframe”.
Religious leaders opposeProminent Buddhist monk
Omalpe Sobitha Thero saidRanil Wickremesinghe was“not suitable” for the job. Hisappointment “completely disregarded” the proposal madeby their highranking monks toappoint an allparty interimgovernment and was aimed atthe “sole protection” of the Rajapaksas, he said.
Archbishop of Colombo Cardinal Malcolm Ranjith, wasquoted by local media as saying, “People want a person withintegrity, not someone who hasbeen defeated in politics.”
The political opposition tooexpressed strong disapprovalat the President’s choice. Leaderof the leftist Janata VimukthiPeramuna (JVP) Anura KumaraDissanayake said: “Ranil protects the Rajapaksas, and the Rajapaksas protect Ranil. No citizen in this country will fall fortheir conspiracy this time.”
Tamil National Alliance lawmaker MA Sumanthiran said: “Wickremesinghe had no legitimacy in the current Parliament right from the beginning.He did not even win in his con
stituency.” The Parliamentstands adjourned till May 17,when the vote on the Presidentis scheduled to be taken up.Wickremesinghe may face atrust vote soon after.
India’s reactionIn a cautiouslyworded reactionon the development, India saidit “looks forward to workingwith the Government of SriLanka formed in accordancewith democratic processes pursuant to the swearing in of”Wickremesinghe.
The Indian High Commission in Colombo said in a tweeton Thursday evening: “HighCommission of India hopes forpolitical stability and looks forward to working with the Government of Sri Lanka formed inaccordance with democraticprocesses pursuant to theswearing in of Hon'ble@RW_UNP as the Prime Minister of #SriLanka.”
Meera Sreenivasan is The Hindu
Correspondent in Colombo.
Ranil Wickremesinghe is new PM of Sri LankaReligious leaders oppose appointment;
Parliament adjourned till May 17
Ranil Wickremesinghe (left) signing papers after his swearing in
at the President's Palace in Colombo on Thursday AFP
Terra Ecosystem, boughtvarious cryptocurrencies including Bitcoin in order tomaintain the stable coin’speg.”
“Earlier in the week, whenBTC fell to $30,000, LFG’s reserves ratio to UST issuedfell as well, forcing LFG to liquidate its BTC reserves.”
Losing their lureCryptocurrencies wereamong the favoured investments during the pandemicas many people workingfrom home started tradingin these assets.
With these assets havingno fundamental basis totheir valuation, priceszoomed higher, simply ledby higher demand.
Bitcoin prices gained 300per cent in 2020 followedby 59 per cent gain in 2021.
But after hitting an alltime high in November2021, the total cryptocurrency market cap started
RAM NARAYAN MURTHY
Chennai, May 12
There was a virtual bloodbath in cryptocurrencies onThursday. Investors werespooked by the crash instablecoin Luna and thehigh infl�ation reading inthe US. Ongoing turbulencein global equity, bonds andcurrency markets seems tohave aff�ected sentimentstoo.
Most cryptocurrenciesslid helplessly with bitcoinlosing around 11 per cent,ethereum 20 per cent, dogecoin and polkadot losingaround 23 per cent in justone session.
This fall in prices has ledto big erosion in investorwealth.
Total cryptocurrency market cap declined from $1.4trillion on May 11 to $1.18 trillion on May 12, decline of 21per cent in just one session.
Terra’s stablecoin UST losing its peg to the dollar anddeclining to a low of $0.30led to widespread panicamong investors.
Explaining the crisis, Darshan Bathija, CO founder &CEO, Vauld, says, “Typically,most stable coins likeTether and USDC are backedby assets like cash andbonds; in the case of algorithmic stablecoins, likeUST, they are supposed to beautomatically pegged to theprice of another digital asset. 1 UST can be redeemedor minted for exactly $1worth Luna.
“Luna Foundation Guard(LFG), the nonprofi�t foundation created to support the
falling and since then therehas been no looking back.One of the main reasons forthe reversal in sentimentwas the ban of cryptocurrency trading and miningin China which wiped outthe crypto market by 40 percent in one month.
This decline was furtherfuelled by the regulationsand taxations broughtupon cryptocurrencies incountries including Indiaand the US.
The Federal Reserve’smonetary tightening hasfurther led to investors fl�eeing the cryptocurrency market. In the last one monthcrypto currencies have lostclose to a trillion dollars inmarket cap from $2.16 trillion in April 2022 to $1.17trillion in May 2022.
Most top crypto currencies have been falling sincethe last week, losing morethan $240 billion in the last24 hours.
Cryptocurrency m-cap dips21% as panic grips investors DATA FOCUS
Inflation concerns
and crash in
stablecoin Luna
have hit sentiments
MEENAKSHI VERMA AMBWANI
New Delhi, May 12
Film stars seem to have beatensports stars on the ad volumescharts in the ongoing IPL season. According to the latestdata released by TAM Sports, adivision of TAM Media Research, fi�lm actors led inbrands’ endorsements with 47per cent share of ad volumes inthe fi�rst 39 matches of the 15 thedition of IPL. Meanwhile, theshare of ads featuringsportspersons was pegged at 37per cent of the ad volumes inthese matches.
Ranveer Singh was the mostvisible star with 9 per centshare of ad volumes in the fi�rst39 matches in the ongoing season, followed closely by ShahRukh Khan at 8 per cent andAmitabh Bachchan at 7 percent. MS Dhoni ( 6 per cent) isthe only sportsperson in thetop fi�ve most visible celebritiesin terms of ad volumes of thefi�rst 39 matches in the ongoing
season of the T20 league. Shareof ads featuring Aamir Khanwas pegged at 5 per cent.
Visible starsInterestingly, Ranveer Singh,Shah Rukh Khan and MS Dhoniwere also among the top fi�vemost visible celebrities interms of share in ad volumes inthe previous season. “Three outof Top 5 celebrities were common in 39 matches of both IPL15 and IPL 14,” the report added.
Celebrityendorsed advertising accounted for 53 per centof total ad volume in the fi�rst 39matches of the ongoing IPL season, TAM Sports’ report added.
Share of fi�lm actors endorsedads per channel grew in IPL15 by5 per cent (39 matches of IPL15)compared to IPL14. Ad volumesconsist of advertising on the 21channels of Star India Networkwhich is showcasing IPL.
Overall, the share ofcelebrityendorsed ads was up 8per cent in IPL 15 (39 matches),compared to the same numberof matches in the previous season. Ecommerce gaming, panmasala, ecommerce wallets,corporatefi�nancial institutesand ecommerce educationemerged as the top fi�ve categories in terms of share of advolumes.
Film stars score over sports icons in IPL 2022 adsShare of
celeb-endorsed
ads up 8% in the
15th edition of
the tournament
Bollywood actor Ranveer Singh cheers during a cricket match
of the Indian Premier League 2022 in Mumbai (file photo) PTI
OUR BUREAU
New Delhi, May 12
Prime Minister Narendra Modicalled for reforms in the WHO’sapproval process for vaccines andhighlighted the need for morefl�exibility in WTO rules, particularly related to intellectual property, to enable equitable access tovaccines and medicines and builda resilient global supply chain.
“WTO rules, particularly TRIPS,need to be more fl�exible. WHOmust be reformed andstrengthened to build a more resilient global health security architecture,” Modi said in his virtual address at the openingsession of the ‘Second GlobalCovid Virtual Summit’ onThursday.
The summit is cohosted by theUS, as fi�rst Covid Summit Chair,Belize, as CARICOM Chair; Germany, holding the G7 Presidency;Indonesia, holding the G20 Presidency; and Senegal as AfricanUnion Chair.
“It is clear that a coordinatedglobal response is required to
combat future health emergencies. We must build a resilientglobal supply chain and enableequitable access to vaccines andmedicines….,” Modi said.
Vaccine-making capacityIndia manufactures four WHOapproved vaccines and has the capacity to produce fi�ve billiondoses this year, the PM noted. “Wesupplied over 200 million dosesto 98 countries, bilaterally andthrough COVAX,” he said.
“In India, we extensively usedour traditional medicines to supplement our fi�ght against Covidand to boost immunity. Lastmonth, we laid the foundation of‘WHO Centre for Traditional Medicine’ in India, he said.
Modi pitches for reforms in WHO,WTO rules to enable vaccine equity
Narendra Modi
offi�cial, the decision was based onrecommendations by the National Technical Advisory Groupon Immunisation (NTAGI).
Travel players upbeatDaniel D’Souza, President & Country Head Holidays, SOTC Travel,said the move is expected to give afi�llip to the travel industry aheadof summer vacations and especially for customers planningtheir holidays to Europe.
“This welcome move (reducinggap between dose 2 and boostershot to less than nine months forinternational travellers) serves tosimplify travel and boosts consumer confi�dence,” D’Souza said.
EaseMyTrip’s President – External Aff�airs, Himank Tripathi,said the change is likely to encourage student communities totravel abroad “in large numbers”.
OUR BUREAU
New Delhi, May 12
India will allow its citizens andstudents to reduce the gapbetween the second dose and theprecautionary dose to below thecurrent 270daylimit for international travel.
Under the new rules, announced by the Union Minister ofHealth, Mansukh Mandaviya, citizens and students can take theprecautionary dose, also calledbooster dose, “as required by theguidelines of the destinationcountry”.
“Indian citizens and studentstravelling overseas can now takethe precaution dose as requiredby the guidelines of the destination country. This new facility willsoon be available on the CoWinportal,” Mandaviya tweeted.
According to aHealth Ministry
Booster shot norms fortravellers, students relaxed
VENKATESHA BABU
Bengaluru, May 12
Morgan Stanley, one of theworld’s largest investmentbank and fi�nancial servicescompany, says India remains astrong focus for it and the country has provided key talent forproviding innovative solutionsto its global operations.
Peter Akwaboah, the ChiefOperating Offi�cer of Technology and Global Head of Innovation at Morgan Stanley, says thetechnology team headcount inthe country has doubled to7,000 in the last two years underscoring India’s importanceto the company’s global operations. Of the 75,000 employeesMS has globally, 9,000 are in India including 7,000 in the technology team alone.
MS — which had annual rev
enues of $60 billion last yearand more than $6 trillion of assets under management (AUM)— is a leading player in institutional securities business,wealth and investment management.
Digitised tech teamStating that ‘..as our customersare becoming very sophisticated in what they do from a digitised economy point of view,our mandate is really to providethose kinds of cool, innovativesolutions using Artifi�cial Intelligence and Machine Languagefor our clients. India providessome of the key talent thatwe’re seeing to solve some ofthose innovative ideas. Whatwe’re building in technologyglobally, India is the secondlargest overall, after New York,’
he added. While MS works withsome of the Indian IT servicesproviders like Tata ConsultancyServices (TCS), the company —also due to Intellectual Property (IP), resiliency and riskmanagement reasons — continues to scale its own internaltechnology team too.
“We have the best of bothworlds philosophy, becausethere are things that (players
like) TCS can provide..and forIP and maintaining continuity, we have our (internalteam) too,” Akwaboah stated.
Innovative productsIn terms of innovation, hehighlighted a product calledSnowfl�ake built from India fortheir global operations whichprovided analytics solutionsusing AI and ML, helping customers to optimise theirportfolios.
“This is not just technologytalent. But it’s also (demonstrating) the teams understanding of the markets and asmartness to provide solutions. India remains a strongfocus for us. I’m personally excited of what we have builthere, and will continue to invest in India,” he added.
India key to global tech strength: Morgan Stanley
Peter Akwaboah, COO of
Technology and Global Head
of Innovation
SECOND EDITION OF GLOBAL COVID SUMMIT
OUR BUREAU
Chennai, May 12
Vivriti Capital, a Chennaibased nonbanking fi�nancecompany (NBFC), on Thursdayannounced that it has raisedan additional $30 million inSeries C funding from TVS Shriram Growth Fund 3, a homegrown private equity fundmanaged by TVS Capital.
Vivriti Capital earlier raised$55 million in the fi�rst close ofits Series C funding in March2022 from existing investorsLightrock and Creation Investments. The funds will be allocated between Vivriti Capitaland its subsidiary Vivriti AssetManagement, which managesclosedended debt funds investing in midsize corporates,the company said in a pressstatement.
Vineet Sukumar, Founder &CEO, Vivriti Capital and VivritiAsset Management, said:
“ The latest round of funding will enable us to deepenour engagement with our clients as well as invest in technology and product development,” he added.
Founded in 2017, the VivritiGroup is on track to becomethe largest technologyenabled midmarket debt lenderin India with assets of morethan $5 billion over 45 years.
Vivriti Capitalraises $30 m fromTVS Capital
YATTI SONI
Bengaluru, May 12
Food delivery platforms such asZomato and Swiggy are observing a dip in the availability ofgig workers, as delivery workersswitch to alternative platformslike Rapido, and Shadowfax, insearch of better pay and less restrictive working conditions.
Speaking to BusinessLine,Shaik Salauddin, National General Secretary of the Indian Federation of Appbased TransportWorkers (IFAT), said, “food delivery workers have held strikes asking for better payouts in the pastone month, as fuel pricesskyrocketed. As a recourse, workers have started shifting to alternative platforms like bikehailingplatform Rapido and ondemandgig marketplace Shadowfax, asthese platforms off�er almost 10per cent better payouts, less restrictions on dress code, and lowrisk of bad ratings because offood package spill, etc.”
In addition to better payouts,industry sources see migrationof delivery workers to their hometowns, and the availability of
betterpaying jobs as the economy opens up, as some of thereasons for this dip. According toSalauddin, roughly 2,000 workers per city have migrated back totheir hometowns from Tier 1cities.
Ajoy Thomas, VicePresidentand Business Head (Retail, Ecommerce, Logistics & transportation), TeamLease Services, alsonoted that a lot of gig workerstend to switch between platforms particularly opting forplatforms/brands who pay/incentivise them better or providethem with better job guaranteeor additional benefi�ts.
“There here has been a slightdip in the availability of gig workers. The demand for gig roles is increasing rapidly, creating a demandsupply mismatch in theindustry. According to overall industry estimates, the approximate shortage is between 10,000 to
15,000 workers,” Thomas added. However, Rahul Khanna, Dir
ector, and cofounder of AzureHospitality, which operates 79restaurants and cloud kitchens,said that the dip in gig workers’availability has not impacted thedelivery times of its restaurantsand cloud kitchens. It operatesbrands like Sly Granny, Mamagoto, Foxtrot, and Maalgaadi byDhaba Estd 1986 Delhi, locatedacross Tier1 and 2 cities.
Demand-supply gapAnurag Katriar, Founder and MDof Indigo Hospitality, also said,“there has not been any signifi�cant delay in assigning gig workers across its restaurants in Kolkata and Mumbai. Once in a whileon weekends, there might besome delay but no signifi�canttrouble as such.”
Swiggy has recently halted itshyperlocal delivery service Genie
in three cities, signaling the demandsupply gap in the industry.Swiggy attributed the temporaryhalt of Genie service to a surge indemand for food and grocery deliveries amid the cricketing andfestive season, requiring the company to prioritize these deliveriesover Genie.
Incentives offered Both Swiggy and Zomato recently announced new policiesand programmes incentivisingdelivery workers who haveworked with the company forthreefi�ve years. Swiggy said itwould reserve 20 per cent of allfl�eet manager hires for its 2.7Lakh delivery executives. The opportunity to become fl�eet managers was earlier only available todelivery partners who hadworked with the company for atleast threefour years. It is nowconsidering reducing the tenurerequirement to around twoyears.
Zomato, too, has set up a ₹�700crore fund for the benefi�t of itsdelivery partners. Under this fund, Zomato Delivery Partners, whohave been on its fl�eet for morethan fi�ve years, will get up to₹�50,000 per child per annum.The amount will go up to₹�1,00,000 per child per annum ifthe delivery partner completes 10years with Zomato.
Gig workers leaving food delivery platforms in search of better pay, working conditions Industry estimatesa shortage of10,000-15,000workers
Rising fuel prices have impacted gig workers in a big way.
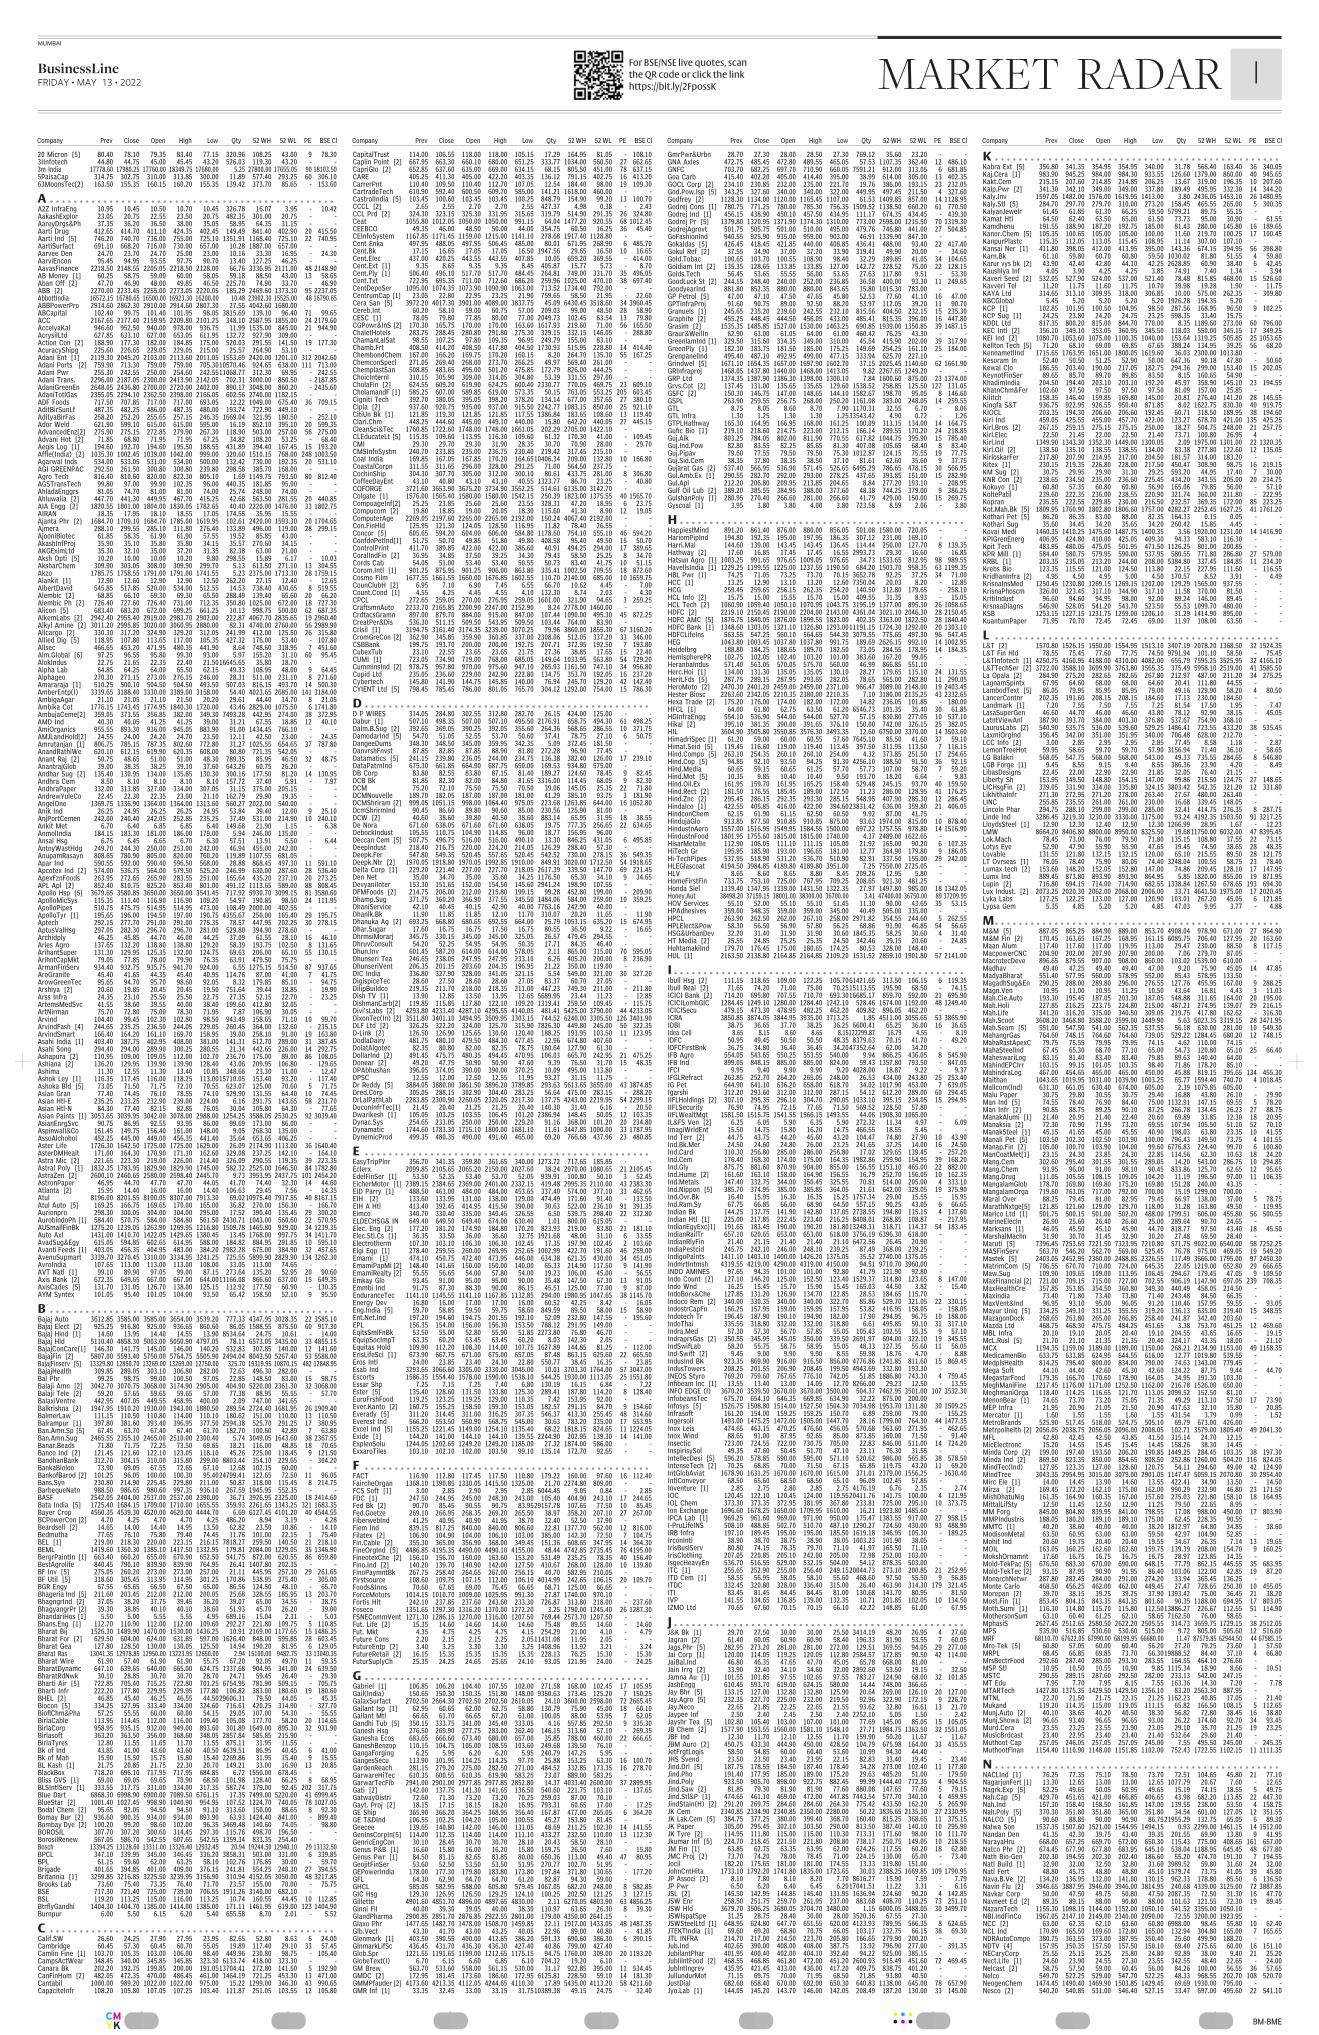
................BM-BMECMYK
MUMBAI
BusinessLineFRIDAY • MAY 13 • 2022 IMARKET RADAR
For BSE/NSE live quotes, scan
the QR code or click the link
https://bit.ly/2FpossK
Company Prev Close Open High Low Qty 52 WH 52 WL PE BSE Cl Company Prev Close Open High Low Qty 52 WH 52 WL PE BSE Cl Company Prev Close Open High Low Qty 52 WH 52 WL PE BSE Cl Company Prev Close Open High Low Qty 52 WH 52 WL PE BSE Cl
K . . . . . . . . . . . . . . . . . . . . . . . . . . . . . . . . . . . . . . . . . . . . . . . .Kabra Ext [5] 356.80 341.35 354.95 354.95 340.00 31.78 566.40 163.40 36 340.05Kaj.Cera [1] 983.90 945.25 984.00 984.30 933.55 126.60 1379.00 860.00 40 945.65Kakt.Cem 215.15 207.60 214.85 214.85 206.25 13.67 319.00 196.35 10 207.60Kalp.Pwr [2] 341.30 342.10 349.00 349.00 337.80 189.49 495.95 332.30 14 344.20Kaly.Inv 1597.05 1482.00 1576.00 1619.95 1413.00 3.80 2436.05 1453.10 26 1480.95Kaly.Stl [5] 284.70 297.70 279.70 310.00 273.20 158.45 465.55 265.00 5 300.35KalyanJewelr 61.45 61.85 61.30 66.25 59.50 5799.21 89.75 55.15 - - Kamat Htl 64.50 62.40 63.50 65.00 61.50 73.73 95.00 30.90 - 61.55Kamdhenu 191.55 188.90 187.20 192.75 185.00 81.43 280.00 145.80 16 189.65Kanor.Chem [5] 105.35 100.65 105.00 105.00 100.00 11.60 219.70 100.25 17 100.45KanpurPlastc 115.35 112.05 113.05 115.45 108.95 11.14 307.00 107.10 - - Kansai Ner [1] 411.80 398.05 412.00 413.95 395.00 143.36 674.15 394.95 56 398.80Karn.Bk 61.10 59.80 60.70 60.80 59.50 1030.02 81.80 51.55 4 59.80Karur vys bk [2] 43.90 42.40 42.80 44.10 42.25 2628.85 60.90 38.40 6 42.45Kaushlya Inf 4.05 3.90 4.25 4.25 3.85 74.91 7.40 1.34 - 3.94Kaveri Seed [2] 532.05 527.90 524.00 537.00 521.40 78.48 815.85 468.00 15 526.60Kavveri Tel 11.20 11.75 11.60 11.75 10.70 39.98 19.28 1.90 - 11.75KAYA Ltd 314.65 313.10 309.95 318.00 306.85 10.00 575.00 262.35 - 309.80KBCGlobal 5.45 5.20 5.20 5.20 5.20 1926.28 194.35 5.20 - - KCP [1] 102.85 101.95 100.50 104.95 98.50 287.56 168.95 96.50 9 102.25KCP Sug [1] 24.25 23.80 24.20 24.75 23.25 598.35 33.40 15.75 - - KDDL Ltd 817.35 800.20 815.00 844.70 770.00 8.35 1189.60 273.00 60 796.00KEC Intl [2] 356.10 349.10 353.05 360.95 345.50 118.03 550.00 345.15 17 349.25KEI Ind [2] 1080.70 1053.60 1075.00 1100.35 1040.00 153.64 1319.25 505.85 25 1053.65Kellton Tech [5] 71.20 68.10 69.00 69.85 67.65 388.24 134.95 39.25 56 68.20KennametlInd 1715.65 1763.95 1651.00 1800.05 1619.60 36.03 2300.00 1013.80 - - Kesoram In 52.40 50.50 51.25 52.90 50.00 647.36 90.18 47.80 - 50.60Kewal Clo 186.55 203.40 190.00 217.05 182.75 294.36 299.00 153.40 15 202.05KeynotFinSer 89.65 85.70 89.70 89.85 83.50 8.15 160.65 54.90 - - KhadimIndia 204.50 194.40 203.10 203.10 192.20 45.97 358.90 145.10 23 194.55KhatnChm&Fer 102.60 97.50 97.50 97.50 97.50 81.09 157.00 25.85 - - Kilitch 158.35 146.40 159.85 169.80 145.00 20.81 276.40 141.20 28 145.55Kingfa S&T 936.75 922.95 926.55 950.40 871.85 8.02 1622.75 830.30 40 919.75KIOCL 203.35 194.30 206.60 206.60 192.45 60.71 318.50 189.95 38 194.60Kiri Ind 459.05 425.55 455.00 457.70 422.00 123.27 678.70 421.00 135 425.25Kirl.Bros [2] 267.15 259.15 275.15 275.15 250.00 18.27 504.75 248.00 21 257.75Kirl.Elec 22.50 21.45 22.00 22.50 21.40 73.71 100.80 26.95 4 - Kirl.Ind 1349.90 1343.30 1352.30 1449.00 1300.05 2.09 1975.00 1301.00 22 1320.35Kirl.Oil [2] 138.50 135.10 138.55 138.55 134.00 83.38 277.80 122.60 12 135.05KirloskarFer 217.80 207.90 214.95 217.00 204.50 181.57 314.00 183.20 - - Kitex [1] 230.15 219.35 226.80 228.00 217.50 450.47 308.90 98.75 16 219.15KM Sug [2] 30.75 29.95 29.90 31.30 29.25 593.20 44.95 17.40 7 30.00KNR Con [2] 238.65 234.50 235.00 236.60 225.45 434.20 343.55 205.00 20 234.75Kokuyo [1] 60.80 57.35 60.80 60.80 56.90 165.06 79.85 56.00 - 57.10KoltePatil 239.60 222.35 236.00 238.55 220.90 321.74 360.00 211.80 - 222.95Kopran 235.55 222.55 229.85 230.00 216.50 232.57 369.35 172.00 85 223.25Kot.Mah.Bk [5] 1809.95 1760.90 1802.80 1806.60 1757.00 4282.27 2252.45 1627.25 41 1761.20Kothari Pet [5] 86.20 86.35 83.00 88.00 82.35 164.33 0.15 0.05 - - Kothari Sug 35.60 34.45 34.20 35.65 34.20 260.42 15.85 4.45 - - Kovai Medi 1460.35 1410.25 1475.60 1487.75 1400.35 3.56 1920.00 1231.00 14 1416.90KPIGrenEnerg 406.95 424.80 410.00 425.05 409.30 94.33 583.10 116.30 - - Kpit Tech 483.95 480.05 475.05 501.95 471.50 1126.25 801.00 200.85 - - KPR Mill [1] 584.40 580.75 579.95 590.00 537.95 580.55 771.80 286.80 27 579.00KRBL [1] 203.35 235.05 213.20 244.00 208.00 5384.80 337.45 184.85 11 234.30Krebs Bio 123.35 115.55 121.00 124.50 113.80 22.15 227.95 111.60 - 116.55KridhanInfra [2] 4.95 4.50 4.95 5.00 4.50 170.57 8.52 3.91 - 4.49KrisnaInsMed 1250.45 1230.80 1269.15 1269.15 1202.00 129.29 1565.00 937.55 - - KrisnaPhoscm 326.00 323.45 317.10 344.90 317.10 11.58 370.00 81.50 - - KritiIndust 96.60 94.60 94.95 98.00 92.00 89.24 146.00 89.45 - - KrsnaaDiagns 546.90 528.05 541.20 543.70 523.50 55.53 1099.70 480.00 - - KSB 1253.15 1227.15 1231.75 1259.00 1206.10 31.29 1414.90 895.00 - - KuantumPaper 71.95 70.70 72.45 72.45 69.00 11.97 108.00 63.50 - -
L . . . . . . . . . . . . . . . . . . . . . . . . . . . . . . . . . . . . . . . . . . . . . . . .L&T [2] 1570.80 1526.15 1550.00 1554.95 1513.10 3407.19 2078.20 1368.50 32 1524.35L&T Fin Hld 78.55 75.45 77.60 77.75 74.50 9791.94 101.10 58.50 - 75.45L&TInfotech [1] 4250.75 4160.95 4188.00 4310.00 4082.00 655.79 7595.25 3525.95 32 4165.10L&TTechSer [2] 3722.00 3588.10 3699.90 3763.80 3565.35 375.49 5958.10 2519.00 41 3585.50La Opala [2] 284.90 275.20 282.65 282.65 267.80 212.97 487.00 211.20 34 275.25LagnamSpintx 67.95 64.60 68.00 68.00 64.60 20.41 111.80 44.55 - - LambodText [5] 86.05 79.95 85.95 85.95 79.00 49.16 129.90 58.20 4 80.50LancerContnr 202.35 191.60 208.15 208.15 184.60 17.13 230.00 184.60 - - Landmark [1] 7.20 7.55 7.50 7.55 7.25 81.54 17.50 1.95 - 7.47LasaSuperGen 46.60 44.70 46.00 46.60 43.80 78.12 92.90 38.15 - 45.05LatntViewAnl 387.90 393.70 384.00 403.30 376.80 537.67 754.90 368.10 - - LaurusLabs [2] 540.90 535.75 536.00 539.60 529.25 1486.41 723.55 433.20 38 535.45LaxmiOrgInd 356.45 342.00 351.00 351.95 340.00 706.48 628.00 212.70 - - LCC Info [2] 3.00 2.85 2.95 2.95 2.85 77.45 8.58 1.18 - 2.87LemonTreeHot 59.95 58.65 59.70 59.70 57.90 3156.94 71.40 36.10 - 58.65LG Balakri 568.05 547.75 568.00 568.00 543.00 49.33 735.55 284.65 8 546.80LGB Forge [1] 9.45 8.55 9.15 9.40 8.55 386.36 23.90 4.20 - 8.49LibasDesigns 22.45 22.00 22.90 22.90 21.85 32.05 76.40 21.15 - - Liberty Sh 153.95 149.50 148.80 154.15 147.00 99.86 215.50 124.75 27 148.65LICHsgFin [2] 339.05 331.90 334.00 335.80 324.15 3803.42 542.35 321.20 12 331.80LikhithaInfr 271.30 272.95 271.20 278.00 263.40 27.67 480.00 263.40 - - LINC 255.85 235.55 261.00 261.00 230.00 16.68 339.45 148.05 - - Lincoln Phar 294.75 288.10 299.00 299.00 285.00 32.41 414.75 276.35 8 287.75Linde Ind 3286.45 3219.30 3230.00 3330.00 3175.00 93.24 4192.35 1503.50 91 3217.25LloydsSteel [1] 12.90 12.30 12.40 12.50 12.30 1266.99 28.95 1.67 - 12.23LMW 8664.20 8406.80 8800.00 8950.00 8325.50 19.6811750.00 6032.00 47 8395.45Lok.Mach 78.45 73.00 76.00 79.50 71.80 135.15 108.80 37.55 22 73.15Lotys Eye 52.90 47.90 55.90 55.90 47.65 19.45 74.50 38.65 28 48.35Lovable 131.55 121.80 132.15 132.15 120.00 65.10 215.55 89.50 28 121.75LT Ovrseas [1] 76.05 78.40 75.90 80.05 74.40 3248.04 100.55 58.75 23 78.40Lumax tech [2] 153.60 148.20 152.05 152.80 147.00 74.86 209.45 128.10 17 147.95Lumx Ind 889.45 873.80 893.90 893.90 864.95 5.85 1820.00 855.00 19 871.95Lupin [2] 716.80 694.15 714.00 714.90 682.55 1338.84 1267.50 678.65 193 694.30Lux Indust. [2] 2073.25 2020.30 2062.00 2068.00 2006.00 33.71 4641.50 1975.00 17 2020.45Lyka Labs 127.25 122.25 123.00 127.00 120.90 103.01 267.20 45.05 6 121.85Lypsa Gem 5.35 4.85 5.20 5.20 4.85 47.03 9.95 3.77 - 4.88
M. . . . . . . . . . . . . . . . . . . . . . . . . . . . . . . . . . . . . . . . . . . . . . . .M&M [5] 887.05 865.25 884.90 889.00 853.70 4908.04 978.90 671.00 27 864.90M&M Fin [2] 170.45 163.65 167.25 168.95 161.15 6085.75 206.40 127.95 20 163.60Maan Alum 117.40 117.60 117.00 119.95 113.00 29.47 230.00 88.50 8 117.15MacpowerCNC 204.90 202.00 207.90 207.90 200.00 7.06 279.70 87.05 - - MacrotecDeve 896.65 879.55 907.00 908.00 860.00 103.02 1539.00 610.00 - - Madhav 49.40 47.25 49.40 49.40 47.00 9.20 75.90 45.05 14 47.85MadyaBharat 551.40 577.95 560.00 578.95 552.00 85.43 578.95 133.50 - - MagadhSug&En 290.25 288.00 289.80 296.00 276.55 127.76 455.95 167.00 9 288.25Magn.Ven 10.95 11.00 10.95 11.25 10.50 43.64 16.81 4.43 3 11.03Mah.Cie.Auto 193.30 195.45 187.05 203.30 187.05 548.88 311.65 164.00 20 195.00Mah.Holi 227.85 216.25 223.75 224.80 215.00 487.21 274.95 139.07 29 216.15Mah.Life 341.20 316.20 335.00 340.50 309.05 219.75 417.80 162.62 - 316.30Mah.Scoot 3608.20 3468.80 3588.20 3599.00 3449.90 5.63 5023.35 3319.15 28 3471.95Mah.Seam [5] 551.00 547.50 541.00 562.35 537.55 56.18 630.00 281.00 10 549.30MahangrGas 764.60 748.15 764.60 764.60 739.05 529.22 1284.45 680.20 12 748.15MahaRastApexC 79.75 75.55 79.95 79.95 74.15 4.62 110.00 74.15 - - MahaSteelInd 67.45 65.30 68.70 77.10 65.00 54.73 120.80 65.10 25 66.40MaheswariLog 83.15 81.40 83.40 83.40 79.85 89.63 140.40 64.00 - - MahindEPCIrr 103.15 99.15 101.05 103.35 98.40 71.86 178.20 85.10 - - MahindraLog 467.00 454.65 465.00 465.00 450.00 45.88 819.15 395.65 134 455.30Maithan 1043.65 1019.95 1031.00 1039.90 1003.25 65.77 1594.40 740.70 4 1018.45Mallcom(Ind) 631.30 661.05 630.40 674.00 605.00 2.39 1079.85 605.00 - - Malu Paper 30.75 29.80 30.55 30.75 29.40 16.88 43.80 26.10 - 29.90Man Ind [5] 74.55 78.40 76.90 84.40 75.00 1132.91 147.15 69.55 5 78.20Man Infr [2] 90.85 88.75 89.25 90.10 87.25 266.78 134.45 26.23 27 88.75ManakAlumi [1] 21.40 20.95 21.40 22.40 20.60 69.89 33.85 12.30 18 20.95Manaksia [2] 72.30 70.90 71.95 73.20 69.55 107.94 105.50 51.10 52 70.10ManakSteel [1] 45.15 41.65 45.00 45.55 40.90 198.03 63.80 23.35 10 41.55Manali Pet [5] 103.50 102.30 102.50 103.90 100.00 796.43 149.50 73.75 4 101.55Manap.Fin [2] 105.00 100.70 103.90 104.00 99.60 6776.83 224.40 99.70 6 100.80ManCoatMet[1] 23.15 24.30 23.85 24.30 22.85 114.56 62.30 10.63 18 24.20Mang.Cem 302.60 295.40 301.55 301.55 289.05 14.20 543.00 286.75 10 294.85Mang.Chem 93.95 96.00 91.00 98.10 90.45 833.86 125.70 62.65 12 95.65Mang.Drug 111.05 105.55 108.15 109.05 104.20 11.19 196.50 97.00 11 106.35MangalamGlob 178.70 169.80 169.80 175.20 169.80 151.28 240.00 43.35 - - MangalamOrga 719.60 763.05 717.00 792.00 700.00 15.19 1299.00 700.00 - - Maral Over 88.25 79.45 81.00 82.95 79.45 66.97 138.00 37.00 5 78.75MarathNxtge[5] 121.85 121.60 129.00 129.70 118.00 31.28 163.80 49.50 - 119.95Marico Ltd [1] 501.75 500.15 501.00 502.20 488.00 1799.51 606.00 455.80 56 500.55MarineElecIn 26.90 25.60 26.40 26.60 25.00 289.64 90.70 24.65 - - Marksans [1] 46.05 45.50 45.10 45.90 44.70 818.77 97.50 43.40 18 45.50MarshalMachn 31.90 30.70 31.45 32.90 30.20 27.48 69.50 28.40 - - Maruti [5] 7396.45 7253.65 7221.50 7323.95 7210.80 571.75 9022.00 6540.00 58 7252.25MASFinServ 563.70 546.20 562.70 569.00 525.45 76.78 975.00 469.05 19 549.20Mastek [5] 2403.05 2452.95 2360.00 2488.85 2326.55 117.49 3666.00 1795.00 97 2450.30MatrimCom [5] 706.55 670.70 710.00 724.00 645.35 22.05 1219.00 652.80 29 666.65Maw.Sug 109.90 109.65 109.00 113.95 106.45 294.67 179.45 47.05 9 109.50MaxFinancial [2] 721.00 709.15 715.00 727.00 702.55 906.19 1147.90 697.05 239 708.35MaxHealthCre 357.85 353.85 354.50 360.80 349.30 440.49 458.05 214.50 - - MaxIndia 73.40 71.80 73.40 73.80 71.40 243.48 84.50 66.35 - - MaxVent&Ind 96.95 93.10 95.00 96.05 91.20 110.46 157.95 59.55 - 93.05Mayur Uniq [5] 334.25 349.10 331.25 355.55 319.20 136.13 635.00 319.40 15 348.55MazagonDock 268.65 263.80 265.00 266.85 258.40 241.87 342.40 203.60 - - Mazda Ltd 468.75 468.30 475.75 484.25 451.65 3.38 753.70 451.25 12 469.60MBL Infra 20.10 19.10 20.05 20.40 19.10 204.55 43.65 16.65 - 19.15McL.Rusl [5] 21.70 21.10 21.35 21.35 20.40 324.17 43.35 18.00 - 21.10MCX 1194.35 1159.00 1189.00 1189.00 1150.00 268.21 2134.90 1153.00 49 1158.35MedicamenBio 633.75 633.85 624.95 644.55 616.00 12.77 1019.80 539.55 - - MedplsHealth 814.25 796.40 800.00 834.00 790.00 74.63 1343.00 779.45 - - Mega Soft 44.10 44.40 42.60 45.30 42.60 124.22 87.75 9.44 - 44.70MegastarFood 179.35 166.70 170.60 178.90 164.05 34.95 191.30 103.30 - - MeghManiFine 1217.45 1176.00 1171.00 1252.50 1162.00 216.78 1526.00 650.00 - - MeghmaniOrga 118.40 114.25 116.65 121.70 113.05 2099.52 152.50 81.10 - - MenonBear [1] 74.65 73.70 73.20 75.05 71.35 49.29 113.10 57.50 17 73.90MEP Infra 21.95 20.90 21.05 21.50 20.90 417.63 32.10 15.80 - 20.85Mercator [1] 1.60 1.55 1.55 1.60 1.55 431.54 3.79 0.99 - 1.52MetroBrands 525.90 517.45 518.00 524.75 505.10 69.79 673.00 426.00 - - Metrpolhelth [2] 2056.05 2038.75 2056.05 2096.00 2008.05 102.71 3579.00 1805.40 49 2041.30MFL 42.80 42.45 42.50 43.85 41.50 315.14 24.70 12.15 - - MicElectronc 15.20 14.55 15.45 15.45 14.45 158.26 38.30 14.45 - - Minda Corp [2] 199.00 197.40 193.50 206.20 190.85 1449.25 284.45 103.35 38 197.30Minda Ind [2] 869.50 823.35 850.00 854.65 808.50 252.86 1260.00 504.20 116 824.05MindTec(Ind) 127.95 123.35 127.00 128.60 120.75 54.11 294.60 49.00 42 124.90MindTree 3043.35 2954.95 3015.00 3079.00 2901.05 1147.47 5059.15 2070.80 30 2954.40Mirc Ele [1] 14.00 14.45 13.90 14.60 13.55 422.41 34.90 13.50 - 14.50Mirza [2] 169.45 172.20 162.10 175.00 162.00 990.29 232.90 46.80 23 171.50MishDhatuNig 161.35 164.90 160.35 167.00 157.60 275.03 221.80 158.10 18 164.95MittalLifSty 12.50 11.45 12.50 12.90 11.25 79.50 22.65 8.95 - - MM Forg 845.00 804.80 839.95 841.00 798.55 17.08 988.00 450.00 17 803.90MMPIndustris 188.05 180.20 189.10 189.10 175.00 62.45 228.35 90.55 - - MMTC [1] 40.20 38.60 40.00 40.00 38.20 1812.97 64.80 34.85 - 38.60ModisonMetal 63.50 60.95 63.00 63.00 59.50 42.97 104.90 52.85 - - Mohit Ind 20.60 19.75 20.40 20.40 19.55 34.67 26.35 7.14 13 19.65MOIL 163.05 160.25 162.60 162.60 159.75 139.39 208.00 154.70 9 160.25MokshOrnamnt 17.60 16.75 16.75 16.75 16.75 28.97 123.85 14.35 - - Mold-TekPac [5] 676.50 683.30 670.00 690.00 648.15 77.79 862.15 445.55 35 683.95Mold-TekTec [2] 93.15 87.95 90.90 91.95 86.40 103.06 122.00 42.85 19 87.20MonarchNetwr 287.80 282.45 284.00 291.00 274.20 33.94 365.45 136.25 - - Monte Carlo 468.50 456.25 462.00 462.00 449.45 27.47 728.65 250.30 10 455.05Morepan [2] 39.70 38.15 39.25 39.25 37.90 1393.42 75.00 36.45 21 38.20Most.Fin [1] 853.45 804.15 843.35 843.35 801.60 90.35 1188.00 694.95 17 803.05Moth.Sumi [1] 116.30 114.80 115.70 115.80 112.5013886.27 226.67 112.55 51 114.90MothersonSum 63.10 60.40 61.25 62.10 58.65 7162.50 76.00 58.65 - - MphasiS 2627.45 2512.65 2580.50 2622.20 2505.55 314.73 3659.75 1729.15 38 2512.05MPS 535.90 516.85 530.60 530.60 515.00 9.72 805.00 505.60 12 516.60MRF 68110.70 67622.05 67990.00 68199.95 66680.00 11.47 87579.85 62944.50 44 67585.15Mro-Tek [5] 60.80 57.05 60.00 60.40 56.20 27.20 79.25 23.60 1 57.50MRPL 68.45 66.85 69.85 73.70 66.3019888.52 84.40 37.10 4 66.80MrsBectrFood 292.60 287.40 285.00 293.30 283.55 164.55 464.10 276.60 - - MSP Stl 10.95 10.50 10.55 10.90 9.85 1115.34 18.90 8.66 - 10.51MSTC 290.55 289.15 287.60 292.50 282.00 233.13 542.00 247.15 - - MT Edu 7.95 7.70 7.95 8.15 7.55 163.36 14.30 7.20 - 7.78MTARTech 1427.80 1375.35 1429.50 1429.50 1356.10 83.20 2563.30 887.95 - - MTNL 22.20 21.50 21.75 22.15 21.25 1162.23 40.85 17.05 - 21.40Mukand 119.20 114.35 115.00 119.05 111.15 65.82 166.50 108.15 5 112.65Munj.Auto [2] 40.10 38.65 40.20 40.50 38.30 56.82 72.80 38.45 16 38.80Munj.Showa [2] 96.65 93.40 96.65 96.65 93.00 26.22 174.60 92.70 34 93.45Murd.Cera 23.55 23.25 23.55 23.90 23.05 29.10 35.70 21.25 19 23.25MusicBrdcast 23.40 22.95 23.40 23.40 21.40 532.64 29.60 21.40 - - Muthoot Cap 257.05 246.05 257.05 257.05 245.00 7.55 495.50 245.00 - 245.35MuthootFinan 1154.40 1110.90 1148.00 1151.85 1102.00 752.43 1722.55 1102.15 11 1111.35
N . . . . . . . . . . . . . . . . . . . . . . . . . . . . . . . . . . . . . . . . . . . . . . . .NACLInd [1] 76.25 77.35 75.10 78.50 73.70 72.51 104.65 45.80 21 77.10NagarjunFert [1] 13.30 12.65 13.00 13.00 12.65 1077.79 20.67 7.60 - 12.65Nagrk.Exp [5] 52.25 49.65 50.05 50.95 49.65 15.19 74.15 18.55 5 49.75Nah.Cap [5] 429.70 451.65 421.00 466.85 406.65 43.98 682.20 113.85 22 447.30Nah.Ind 157.30 158.40 158.50 161.85 147.00 139.55 238.00 53.50 4 158.75Nah.Poly [5] 370.30 351.80 351.80 365.00 351.80 34.54 601.00 127.05 12 351.55NALCO [5] 90.60 88.85 90.00 90.90 86.7521955.29 132.75 65.05 6 89.30Nalwa Son 1537.35 1507.60 1521.00 1544.95 1494.15 0.93 2299.00 1461.15 14 1512.00Nandan Den 41.35 42.30 39.75 43.40 39.35 201.55 69.90 13.80 9 41.95NarayaHru 668.00 657.25 669.70 672.00 650.30 115.43 775.00 408.65 161 657.00Natco Phr [2] 674.45 677.90 677.80 683.95 645.10 538.04 1188.95 645.45 48 677.80Nath Bio-Gen 202.30 194.55 202.30 202.40 186.60 55.20 474.70 191.30 7 194.55Natl Build [1] 32.90 32.00 32.50 32.80 31.60 3989.52 59.80 31.60 24 32.00Natl Fert 48.80 45.75 48.80 48.80 45.10 1579.74 73.75 41.05 39 45.80Nava.B.Ve [2] 134.20 136.95 132.00 141.00 130.15 962.33 178.80 85.50 6 136.50Navin Flu [2] 3946.65 3887.95 3946.00 3946.00 3814.95 240.68 4339.00 3125.00 72 3887.85Navkar Corp 50.00 47.50 49.75 50.80 47.50 2087.35 72.50 31.30 16 47.70Navneet Ed [2] 89.35 89.15 88.00 90.80 88.00 101.63 121.55 72.30 19 89.45NazaraTech 1155.30 1098.15 1144.00 1152.00 1050.10 541.52 3356.00 1050.10 - - NBI.IndFinCo 1967.05 2147.10 2149.00 2340.00 2090.00 72.55 3200.00 1923.95 - - NCC [2] 63.00 62.35 62.10 63.60 60.80 6988.00 98.45 55.80 10 62.40NCL Ind 170.90 165.50 169.60 172.80 165.00 132.94 304.80 165.00 7 165.65NDRAutoCompo 380.75 363.55 373.00 387.95 350.40 25.60 499.90 188.20 - - NDTV [4] 157.95 150.35 157.50 157.50 150.10 69.40 275.65 60.00 16 151.10NECaryCorp 25.55 25.15 25.25 25.80 24.80 92.89 38.00 9.40 21 25.20Nect.Life [1] 24.60 23.90 24.55 27.30 23.55 342.55 48.40 22.65 - 24.00Nelcast [2] 58.75 57.50 59.00 60.45 56.00 84.26 100.00 56.55 36 57.65Nelco 549.70 522.25 529.00 547.70 522.25 48.33 968.55 202.70 108 520.70NeogenChem 1474.45 1490.40 1469.90 1503.85 1429.45 69.69 1930.00 795.00 - - Nesco [2] 540.20 540.85 531.00 546.40 527.15 33.47 697.00 495.60 22 541.10
20 Micron [5] 80.40 78.10 79.35 83.40 77.15 320.96 108.25 43.00 9 78.303IInfotech 44.80 44.75 45.00 45.45 43.20 526.03 119.30 43.20 - - 3m India 17778.60 17980.25 17760.00 18349.75 17680.00 5.25 27800.00 17655.05 90 18103.505PaisaCap 314.75 302.75 310.00 313.85 300.00 11.89 577.40 293.25 60 306.1063MoonsTec[2] 163.50 155.35 160.15 160.20 155.35 139.42 373.70 85.65 - 153.60
A . . . . . . . . . . . . . . . . . . . . . . . . . . . . . . . . . . . . . . . . . . . . . . . .A2Z InfraEng 10.95 10.45 10.50 10.70 10.45 326.78 16.07 3.95 - 10.42AakashExplor 23.05 20.75 22.55 23.50 20.75 482.35 301.00 20.75 - - AareyDrgs&Ph 37.35 36.20 36.50 38.00 35.05 58.95 64.35 31.15 - - Aarti Drug 412.65 414.70 411.10 424.35 402.45 149.49 841.40 402.90 20 415.50Aarti Ind [5] 746.20 740.70 736.00 755.00 725.10 1351.91 1168.40 725.10 22 740.95AartiSurfact 691.10 668.20 716.00 730.00 657.00 10.28 1887.00 657.00 - - Aarvee Den 24.70 23.70 24.70 25.00 23.00 10.16 33.30 16.95 - 24.30AarviEncon 95.45 94.95 93.55 97.75 90.70 13.40 127.25 46.25 - - AavasFinance 2218.50 2148.55 2205.05 2218.50 2128.00 66.76 3336.95 2111.00 48 2148.90AB Money [1] 60.25 58.75 59.00 60.00 58.05 59.18 88.50 43.00 13 58.65Aban Off [2] 47.70 46.90 48.00 49.85 46.50 225.70 74.90 33.70 - 46.90ABB [2] 2270.00 2233.45 2255.00 2273.05 2220.05 185.29 2469.60 1373.30 95 2237.05AbbottIndia 16572.15 16780.65 16500.00 16923.30 16200.00 10.48 23902.30 15525.00 48 16790.65ABBPowerPro 2914.60 2862.30 2910.00 2914.60 2807.30 27.55 4042.60 1680.00 - - ABCapital 102.40 99.75 101.40 101.95 98.05 3815.69 139.10 96.40 71 99.65ACC 2167.65 2177.40 2159.95 2209.80 2101.25 348.10 2587.95 1855.00 24 2179.60AccelyaKal 946.60 952.50 940.00 978.00 936.75 11.99 1535.00 845.00 21 944.90AcrysilLtd 627.85 633.10 627.00 653.05 611.95 132.72 927.90 309.00 - - Action Con [2] 188.90 177.30 182.00 184.85 175.00 520.03 291.55 141.50 19 177.30AcuracyShipg 225.60 226.65 229.05 229.05 215.00 25.57 264.90 53.10 - - Adani Ent [1] 2119.30 2045.20 2103.00 2113.60 2011.05 1553.69 2420.00 1201.10 312 2042.60Adani Ports [2] 759.90 713.30 759.00 759.00 705.3010570.46 924.65 638.00 111 713.00Adani Pwr 255.30 242.55 250.00 254.60 242.5511068.77 312.30 69.95 - 242.55Adani Trans. 2296.00 2187.05 2300.00 2413.90 2142.05 702.31 3000.00 860.50 - 2187.85AdaniGreenEn 2648.05 2436.80 2700.00 2720.00 2402.00 890.17 3048.00 860.20 - 2435.60AdaniTotlGas 2355.05 2294.10 2362.50 2398.00 2166.05 602.56 2740.00 1182.15 - - ADF Foods 717.50 707.85 717.00 717.00 693.05 12.22 1049.00 675.40 36 709.15AditBirSunLf 487.35 482.25 486.00 487.35 480.00 193.74 722.90 449.10 - - AdityaBirFas 258.20 252.20 255.65 257.15 246.35 1669.04 321.95 180.50 - 252.10Ador Weld 621.90 599.10 615.00 615.00 595.00 16.19 852.10 395.10 20 599.35AdvancedEnz[2] 275.90 275.15 272.85 279.90 267.30 118.90 503.00 257.00 56 275.00Advani Hot [2] 71.85 68.80 71.95 71.95 67.25 34.82 108.20 53.25 - 68.40Aegis Log [1] 194.60 192.70 194.60 195.50 188.55 431.89 394.40 167.45 15 193.20Affle(India) [2] 1035.30 1002.45 1039.00 1042.00 999.00 320.60 1510.15 768.00 248 1003.50Agarwal Inds 534.00 533.05 531.00 534.00 500.00 132.42 730.00 192.35 20 531.10AGI GREENPAC 292.50 261.50 300.80 300.80 239.80 298.58 385.70 168.00 - - Agro Tech 816.40 810.60 820.00 822.30 805.10 1.69 1149.75 793.50 80 812.40AGSTransTech 99.80 97.00 99.90 102.35 96.00 440.35 181.85 95.00 - - AhladaEnggrs 81.05 74.70 81.00 81.00 74.00 25.74 248.00 74.00 - - Ahluwalia [2] 447.70 441.30 449.95 467.70 415.25 42.68 563.50 281.55 20 440.85AIA Engg [2] 1820.55 1801.00 1804.00 1830.05 1782.65 40.40 2220.00 1476.00 33 1802.75AIRAN 18.35 17.95 18.10 18.55 17.05 174.55 35.95 15.55 - - Ajanta Phr [2] 1684.70 1709.10 1684.70 1785.00 1619.95 102.61 2420.00 1593.30 20 1704.65Ajmera 288.10 299.55 285.10 311.80 276.40 133.89 496.00 119.00 28 299.15AjooniBiotec 61.85 58.35 61.90 61.90 57.55 19.52 85.85 43.00 - - AkashInfProj 35.90 35.10 35.80 35.80 34.15 35.57 270.60 34.15 - - AKGEximLtd 35.30 32.10 35.00 37.20 31.35 82.38 63.00 21.00 - - Aksh Opti [5] 10.20 10.00 10.00 10.20 9.80 298.55 15.89 6.17 - 10.03AksharChem 309.90 303.05 308.00 309.90 299.70 5.13 613.50 271.10 13 304.55Akzo 1785.75 1758.55 1791.00 1791.00 1741.55 5.23 2375.00 1713.30 28 1759.15Alankit [1] 12.90 12.60 12.90 12.90 12.50 262.20 27.15 12.40 - 12.65AlbertDavid 545.85 517.85 520.00 534.00 512.55 14.53 738.40 430.65 8 519.55Alembic [2] 68.85 66.10 69.30 69.30 65.50 288.49 139.40 65.60 20 66.20Alembic Ph [2] 726.40 727.60 726.40 731.00 712.35 350.80 1025.00 672.00 18 727.30Alicon [5] 683.40 683.20 672.00 699.25 661.25 10.13 998.75 500.00 62 687.35AlkemLabs [2] 2942.40 2955.40 2919.00 2983.70 2902.00 222.87 4067.70 2835.65 19 2960.40Alkyl Amine [2] 3011.20 2995.85 3020.00 3060.95 2880.00 82.31 4740.00 2760.00 56 2989.90Allcargo [2] 330.30 317.20 324.90 329.20 312.05 241.99 412.00 125.50 26 315.80Allied Dig [5] 118.95 107.80 113.65 117.00 105.35 427.32 176.00 53.40 - 107.80Allsec 466.65 453.20 471.95 480.35 441.90 8.64 748.60 318.95 7 451.60Alm.Global [6] 97.25 96.55 95.80 99.30 93.00 5.97 155.20 31.10 60 95.45AlokIndus 22.75 21.65 22.35 22.40 21.5016645.65 35.80 18.70 - - Alpha Lab 64.85 64.25 64.00 65.50 62.15 49.33 108.95 48.00 9 64.45Alphageo 270.30 271.15 273.00 276.15 246.00 28.31 511.00 231.10 8 271.60Amararaja [1] 510.25 500.10 504.50 504.50 493.50 507.03 816.15 493.70 14 500.30AmberEntp(I) 3339.65 3188.40 3330.00 3389.00 3158.00 54.40 4023.65 2685.00 141 3184.00AmbigaAgar 21.10 21.05 21.10 21.50 20.20 29.61 44.40 14.70 8 21.05Ambika Cot 1776.15 1743.45 1774.95 1840.30 1720.00 43.46 2829.00 1075.50 6 1741.80AmbujaCeme[2] 359.05 373.55 356.85 382.00 349.30 7493.28 442.95 274.00 38 372.95AMD Ind 40.30 40.05 41.25 41.25 39.00 31.21 67.55 18.85 12 40.10AmiOrganics 955.55 893.30 936.00 945.05 883.90 91.00 1434.45 766.10 - - AMJLandHold[2] 24.55 24.00 24.20 24.70 23.50 12.11 42.50 23.00 - 24.35Amrutanjan [1] 806.75 785.15 787.35 802.60 772.80 31.27 1025.55 654.65 37 787.80AnandRathiWe 620.10 612.15 619.90 620.35 608.00 80.80 721.35 542.05 - - Anant Raj [2] 50.75 48.65 51.00 51.00 48.30 789.35 85.95 46.50 32 48.75AnantrajGlob 39.00 38.35 38.25 39.10 37.60 643.26 60.75 26.20 - - Andhar Sug [2] 135.40 130.95 134.00 135.85 130.30 300.16 177.50 81.20 14 130.95Andhra Cem 8.50 8.10 8.10 8.10 8.10 157.72 37.40 5.91 - 7.97AndhraPaper 332.00 313.85 327.00 334.00 307.05 31.15 375.00 205.15 - - AndrewYuleCo 22.45 22.30 22.35 23.00 21.10 162.79 29.90 19.35 - - AngelOne 1369.75 1336.90 1364.00 1364.00 1313.60 560.27 2022.00 540.00 - - Anik Ind 26.25 24.95 26.25 26.25 24.95 53.84 39.40 12.00 9 25.10AnjPortCemen 242.00 240.40 242.05 252.85 235.25 37.49 531.00 214.90 10 240.10Ankit Met 6.70 6.40 6.85 6.85 6.40 149.68 21.90 1.15 - 6.38AnmolIndia 184.15 183.30 181.00 186.00 179.00 5.94 246.00 135.00 - - Ansal Hsg 6.75 6.45 6.65 6.70 6.30 57.51 13.91 5.50 - 6.44AntnyWastHdg 249.70 244.30 250.00 253.00 242.00 46.94 455.00 242.00 - - AnupamRasayn 808.65 780.90 805.00 820.00 760.20 119.89 1107.55 681.05 - - Apar Ind 590.55 592.00 590.40 596.50 568.00 28.88 868.45 497.30 11 591.10Apcotex Ind [2] 574.00 536.75 564.00 579.50 525.20 246.99 630.00 287.60 28 536.40ApexFznFoods 263.95 272.65 265.90 283.55 251.00 165.64 435.20 237.10 20 273.25APL Apl [2] 852.40 810.75 825.20 853.40 801.00 491.12 1113.65 589.00 88 808.45Apollo Hsp [5] 3679.65 3580.85 3650.00 3650.00 3541.45 717.92 5930.70 3099.15 81 3580.60ApolloMicSys 115.35 111.40 116.90 116.90 109.20 54.97 190.85 98.50 24 111.95ApolloPipes 510.75 475.75 514.95 514.95 473.00 108.49 2000.00 402.55 - - ApolloTyr [1] 195.65 196.00 194.50 197.00 190.75 4355.67 250.00 165.40 29 195.75Aptech 292.15 277.70 291.00 291.00 275.35 78.57 447.95 202.25 30 278.15AptusValHsg 297.05 282.30 296.70 296.70 281.00 529.80 394.90 278.60 - - Archidply 46.25 45.85 44.70 46.00 44.25 37.09 61.55 28.10 16 46.10Aries Agro 137.65 132.20 138.80 138.80 129.20 58.39 193.75 102.50 8 131.65ArihantSuper 131.30 129.95 125.35 132.00 124.75 69.63 206.00 65.10 55 130.15ArihntCapMkt 79.05 77.85 78.00 79.90 76.35 63.91 479.50 75.75 - - ArmanFinServ 934.40 932.75 935.75 941.70 924.00 6.55 1275.15 514.50 87 937.65AroGranite 45.40 41.65 44.35 45.40 40.95 114.76 87.00 41.00 7 41.75ArowGreenTec 95.65 94.70 95.70 98.60 92.05 8.32 179.85 85.10 - 94.75Arshiya [2] 20.60 19.85 20.45 20.45 19.50 751.64 39.44 18.85 - 19.90Arss Infra 24.35 23.10 25.50 25.50 22.75 27.35 52.15 22.70 - 23.25ArtemsMedSvc 41.55 38.60 39.55 40.00 38.40 199.60 412.80 32.05 - - ArtNirman 75.70 72.80 75.00 78.30 71.95 7.87 106.90 30.05 - - Arvind 104.40 99.45 102.30 102.80 98.50 943.49 158.65 71.10 10 99.70ArvindFash [4] 244.65 235.25 236.50 244.05 229.05 260.45 364.00 132.60 - 235.15ArvindSmart 166.40 164.20 161.10 169.70 158.95 39.00 258.10 91.00 19 163.80Asahi India [1] 403.40 387.75 402.95 408.00 381.00 141.31 612.70 289.00 31 387.45Asahi Song 294.40 294.00 289.90 300.25 280.55 21.34 442.65 226.00 14 292.75Ashapura [2] 110.95 109.00 109.05 112.00 102.70 236.70 175.00 89.00 86 108.05Ashiana [2] 136.20 129.95 139.90 139.90 128.40 43.06 209.95 106.80 - 129.65Ashima 11.30 12.55 11.30 13.40 10.85 348.66 23.30 11.00 - 12.47Ashok Ley [1] 116.35 117.45 116.00 118.25 113.0015710.05 153.40 93.20 - 117.40Ashoka Bld [5] 73.05 71.50 71.75 72.10 70.55 623.07 125.00 70.60 5 71.75Asian Gran 77.40 74.45 76.10 78.55 74.10 529.90 131.55 64.40 10 74.45Asian Htl-E 235.25 233.25 232.90 239.00 224.00 6.16 291.75 143.65 58 231.70Asian Htl-N 84.30 77.40 82.15 82.85 76.05 30.04 105.80 64.30 - 77.65Asian Paints [1] 3053.65 3039.95 3042.00 3078.00 2988.00 1254.25 3588.05 2530.25 92 3039.40AsianEnrgSvc 90.75 86.95 92.55 93.95 86.00 99.69 173.00 86.00 - - Aspinwall&Co 161.45 149.75 156.40 161.00 148.00 9.05 268.30 135.00 - - AssoAlchohol 452.25 445.00 449.00 456.35 441.40 35.64 653.65 406.25 - - Aster Life 1726.30 1642.50 1725.00 1725.00 1629.00 26.09 2174.90 1113.00 36 1640.40AsterDMHealt 171.00 164.30 170.90 171.10 162.60 329.08 237.25 142.10 - 164.10Astra Mic [2] 221.65 223.30 219.00 226.00 214.40 326.09 290.55 119.35 39 223.35Astral Poly [1] 1832.35 1783.95 1829.90 1829.90 1745.00 582.32 2525.00 1646.50 84 1782.80AstraZen [2] 2600.10 2460.65 2580.00 2598.40 2445.70 9.73 3953.95 2437.75 101 2454.20AstronPaper 46.95 44.70 47.70 47.70 44.05 41.70 74.40 32.30 14 44.60Atlanta [2] 15.95 14.40 16.00 16.00 14.40 106.63 29.45 7.56 - 14.35Atul 8196.00 8201.55 8100.05 8307.00 7913.30 69.0210975.40 7917.55 40 8167.15Atul Auto [5] 169.25 166.75 169.65 170.00 165.00 36.82 270.00 156.30 - 166.70Aurionpro 298.30 300.05 304.00 304.00 295.00 17.52 390.40 135.45 29 300.20AurobindoPh [1] 584.40 570.75 584.00 584.80 561.50 2430.71 1043.00 560.60 22 570.95AUSmallFinBk 1275.20 1239.05 1263.90 1269.95 1216.80 1509.78 1465.80 929.00 34 1239.35Auto Axl 1431.00 1410.70 1422.05 1429.65 1380.45 13.45 1768.00 997.75 34 1411.70AvadSug&Egy 615.05 594.85 602.65 614.95 588.00 184.82 884.95 291.85 10 595.10Avanti Feeds [1] 403.05 456.35 404.95 483.00 384.20 2982.28 675.00 384.90 32 457.65AvenuSupmart 3339.70 3270.45 3310.00 3334.95 3241.25 725.55 5899.90 2829.90 134 3262.30AvroIndia 107.65 113.00 113.00 113.00 108.00 33.05 113.00 74.65 - - AVT Natl [1] 99.10 89.90 97.05 99.00 87.15 273.64 135.20 52.95 20 90.60Axis Bank [2] 672.35 649.65 667.00 667.00 644.0011166.08 866.60 637.00 15 649.35AxisCades [5] 131.70 131.05 126.70 138.00 125.15 112.92 177.50 60.90 - 130.35AYM Syntex 101.05 95.40 101.05 104.00 93.50 65.42 158.50 52.10 9 95.50
B . . . . . . . . . . . . . . . . . . . . . . . . . . . . . . . . . . . . . . . . . . . . . . . .Bajaj Auto 3612.85 3585.00 3585.00 3654.00 3539.20 777.33 4347.95 3028.35 22 3585.10Bajaj Elect [2] 925.25 916.80 925.00 936.65 860.60 86.05 1588.55 875.50 60 917.30Bajaj Hind [1] 14.60 13.95 14.40 14.55 13.90 8534.64 24.75 10.61 - 14.00Bajaj Hld 5110.40 4858.30 5003.00 5050.90 4797.05 78.11 6573.05 3435.00 33 4855.15BajajConCare[1] 146.30 141.75 145.00 146.00 140.20 532.83 307.85 140.00 12 141.60BajajFin [2] 5807.00 5593.40 5750.00 5764.75 5505.90 2494.04 8043.50 5267.40 53 5588.00BajajFinserv [5] 13329.80 12850.70 13269.00 13269.00 12750.00 325.70 19319.95 10870.15 482 12848.95BajajHealth 309.85 289.05 303.10 306.80 282.00 72.63 496.30 282.00 - - Bal Phr 99.25 98.75 99.00 100.50 97.05 22.85 148.50 83.00 15 98.75Balaji Amn [2] 3042.70 3070.75 3068.00 3174.90 2905.00 404.90 5220.00 2361.30 32 3068.00Balaji Tele [2] 59.20 57.65 59.65 59.65 57.00 77.38 88.95 55.55 - 57.70BalaxiVentre 442.95 407.05 449.55 458.95 400.00 2.09 747.00 341.65 - - Balkrishna [2] 1947.95 1910.20 1930.00 1943.00 1880.50 289.54 2724.40 1681.95 26 1909.40BalmerLaw 111.15 110.50 110.80 114.00 110.10 180.62 151.00 110.00 13 110.50Balrampur [1] 397.80 381.60 393.40 396.95 377.50 2594.38 525.70 291.25 17 380.95Ban.Amn.Sp [5] 67.45 63.70 67.40 67.40 61.70 182.70 100.60 42.89 7 63.80Ban.Amn.Sug 2465.55 2355.10 2465.00 2510.00 2300.40 5.74 3049.05 1643.60 38 2367.55Banar.Beads 71.80 71.75 72.25 73.50 69.65 18.21 116.00 48.85 18 70.65Banco Ind [2] 121.45 121.60 122.10 123.05 118.10 45.26 225.00 118.45 9 121.50BandhanBank 312.70 304.15 310.00 315.80 299.00 8803.44 354.10 229.65 - 304.20BankaBioloo 73.90 69.05 67.55 72.65 67.10 12.68 102.15 60.00 - - BankofBarod [2] 101.25 96.05 100.00 100.30 95.4024799.41 122.65 72.50 11 96.05Bans.Syn 230.80 214.90 225.45 229.80 211.00 50.87 318.00 115.45 8 214.75BarbequeNatn 988.50 986.65 980.60 997.35 936.10 267.59 1945.95 552.35 - - BASF 2542.05 2404.00 2537.00 2537.00 2390.00 36.71 3926.95 2325.00 18 2414.60Bata India [5] 1725.40 1684.15 1709.00 1710.00 1655.55 359.93 2261.65 1343.25 321 1683.35Bayer Crop 4560.35 4539.30 4520.00 4620.00 4444.70 6.69 6127.45 4101.20 40 4544.55BCPowerCon [2] 4.70 4.25 4.70 4.70 4.25 486.20 8.94 3.19 - 4.28Beardsell [2] 14.65 14.00 14.40 14.95 13.50 62.82 23.50 10.86 - 14.10Bedmutha 77.65 76.10 75.80 79.40 74.45 11.76 101.00 22.15 1 75.40BEL [1] 219.00 218.30 220.00 223.15 216.15 7818.27 259.50 140.50 21 218.10BEML 1419.60 1350.30 1385.10 1417.50 1332.95 179.81 2084.00 1229.05 35 1346.90BergrPaintIn [1] 663.40 660.20 655.00 670.90 652.50 541.75 872.00 620.55 86 659.80BestAgrolife 840.45 790.10 839.90 839.90 764.95 26.41 1407.80 202.35 - - BF Inv [5] 275.05 260.20 273.00 273.00 257.00 21.11 445.95 257.30 29 261.65BF Util [5] 318.60 305.45 313.95 314.95 301.25 170.86 538.95 275.40 - 305.00BGR Engy 67.55 65.65 66.50 67.50 65.00 86.56 124.50 48.10 - 65.70Bhageria Ind [5] 211.60 203.45 212.00 212.00 200.05 25.68 328.55 185.95 13 203.70BhagngrInd [2] 37.05 38.20 37.75 39.45 36.20 39.07 65.00 34.55 - 38.75BhagyangrPr [2] 39.30 38.85 40.10 40.10 38.60 51.93 45.70 26.20 - 39.00BhandariHos [1] 5.50 5.00 5.55 5.55 4.95 689.16 15.04 2.31 - 5.03Bhans.Eng [1] 112.70 110.90 112.00 112.00 109.60 292.27 221.80 109.75 5 110.85Bharat Bij 1526.30 1489.90 1470.00 1530.00 1436.25 10.91 2169.00 1177.65 15 1486.35Bharat For [2] 629.50 604.00 624.00 631.85 597.00 1626.40 848.00 595.85 28 603.45Bharat Gea 127.80 128.50 130.00 130.05 125.50 14.94 190.20 81.95 6 129.05Bharat Ras 13041.35 12978.85 12950.00 13223.95 12650.00 2.94 15100.00 9482.75 33 13040.35Bharat Wire 61.90 57.40 61.90 61.90 55.75 67.20 92.05 49.70 11 59.35BharatDynamc 647.10 639.65 640.00 665.00 624.75 1337.68 904.95 341.00 24 639.50BharatRdNwk 30.10 28.85 30.70 30.70 28.70 24.71 59.45 26.40 - 29.30Bharti Air [5] 722.85 705.40 715.25 722.80 701.25 6754.95 781.90 509.15 - 705.75Bharti Infr 222.20 177.80 229.95 229.95 177.80 106.82 383.00 180.60 19 180.60BHEL [2] 46.85 45.40 46.25 46.55 44.5029606.31 79.50 44.05 - 45.35Biocon [5] 334.25 327.95 333.40 334.00 324.60 716.61 420.25 314.90 - 327.70BioflChm&Pha 57.25 55.55 60.00 60.00 54.15 29.05 107.00 54.30 - 55.55BirlaCable 113.95 114.45 112.00 116.00 109.40 105.08 177.70 58.20 20 114.65BirlaCorp 958.95 935.15 932.00 949.00 893.60 301.89 1649.00 895.30 32 931.90Birlasoft 363.20 363.50 356.00 368.60 348.05 2857.84 585.85 215.90 - - BirlaTyres 12.80 11.55 11.65 11.70 11.55 875.11 31.95 11.55 - - Bk of Ind 43.85 41.00 43.60 43.60 40.50 4639.51 86.95 40.45 6 41.00Bk of Mah 15.90 15.50 15.75 15.80 15.40 2269.86 31.95 15.40 9 15.55BL Kash [1] 21.75 20.85 21.75 22.30 20.70 149.21 33.00 16.90 13 20.85BlackBox 718.20 696.10 717.95 717.95 684.85 6.72 1550.00 678.45 - - Bliss GVS [1] 69.00 69.05 69.65 70.90 68.50 101.98 128.40 66.25 8 68.95BLSIntlServ [1] 333.55 317.75 331.00 334.00 317.35 587.74 379.00 92.45 202 317.75Blue Dart 6868.30 6998.90 6900.00 7089.50 6761.15 17.35 7499.00 5220.00 41 6999.45BlueStar [2] 1001.40 1027.45 998.90 1040.90 954.95 107.52 1224.70 740.05 78 1027.05Bodal Chem [2] 95.65 92.05 94.50 94.50 91.10 313.60 150.00 88.65 8 92.30Bomay Bur [2] 936.60 900.35 934.00 934.00 893.90 63.93 1424.40 841.00 - 899.40Bombay Dye [2] 100.20 99.20 98.60 102.00 96.35 3469.48 140.60 74.05 - 98.80BOROSIL 307.70 307.20 300.60 314.45 297.30 115.76 498.70 196.50 - - BorosilRenew 567.05 586.70 542.55 607.65 542.55 1359.34 833.35 254.40 - - Bosch 13394.25 13128.60 13311.00 13326.40 12932.45 20.94 19244.50 12940.10 29 13132.50BPCL 347.10 339.95 345.00 346.45 336.20 3858.31 503.00 331.00 6 339.85BPL 61.15 59.60 62.00 63.25 58.10 102.76 176.65 30.00 - 59.70Brigade 401.65 394.85 401.00 409.00 376.15 241.81 554.25 240.30 27 394.55Britannia [1] 3259.85 3216.85 3225.50 3239.95 3156.90 310.94 4152.05 3050.00 48 3217.85Brooks Lab 73.60 75.40 73.35 76.40 71.70 23.57 155.00 70.00 - 75.75BSE 717.30 721.40 725.00 739.00 706.55 1911.26 3140.00 682.10 - - BSL 119.20 113.25 115.00 116.00 113.25 10.74 160.55 44.45 10 112.85BtrflyGandhi 1404.30 1404.70 1385.00 1414.00 1385.00 171.11 1461.95 619.00 123 1404.90Burnpur 6.00 5.50 6.15 6.20 5.40 655.58 8.70 2.01 - 5.52
C . . . . . . . . . . . . . . . . . . . . . . . . . . . . . . . . . . . . . . . . . . . . . . . .Calif.SW 26.60 24.25 27.90 27.95 23.95 82.65 52.80 8.63 6 24.00Cambridge 60.45 57.30 60.45 60.70 55.05 19.89 117.40 29.10 33 57.45Camlin Fine [1] 103.70 105.35 103.00 106.00 98.40 449.96 230.80 98.75 - 105.40CampsActWear 348.45 340.00 345.85 345.85 323.30 6133.74 418.00 323.30 - - Canara Bk 202.20 192.75 199.85 200.00 191.0513704.41 272.80 141.50 5 192.90CanFinHom [2] 482.05 472.35 470.00 486.45 461.00 1464.19 721.25 453.30 13 471.00Cantabil 1000.00 989.20 1022.00 1022.00 975.00 15.22 1299.00 346.30 43 990.65CapaciteInfr 108.20 105.80 107.05 107.25 103.40 111.87 251.05 103.55 12 105.80
CapitalTrust 114.00 106.55 118.00 118.00 105.15 17.29 164.95 81.05 - 108.10Caplin Point [2] 667.95 663.30 660.10 680.00 651.25 333.77 1034.00 560.50 27 662.65CapriGlo [2] 652.85 637.60 635.00 669.00 634.15 68.15 805.50 451.00 78 637.15CARE 405.25 411.30 405.00 422.20 403.35 136.12 791.15 402.75 16 413.20CarrerPnt 110.40 109.50 110.40 112.70 107.05 12.54 184.40 98.00 19 109.30CartradeTech 610.90 592.40 600.50 609.70 585.00 141.21 1618.00 460.00 - - CastrolIndia [5] 103.45 100.60 103.45 103.45 100.25 848.79 154.90 99.20 13 100.70CCCL [2] 2.65 2.55 2.70 2.70 2.55 427.37 4.98 0.38 - 2.43CCL Prd [2] 324.30 323.15 325.30 331.95 315.65 319.79 514.90 291.35 26 324.80Ceat 1055.80 1012.05 1050.00 1050.00 991.15 64.04 1477.20 920.55 68 1012.45CEEBCO 49.35 46.00 48.50 50.00 44.00 354.75 60.50 16.25 36 45.40CEInfoSystem 1167.85 1171.45 1159.00 1215.00 1141.10 278.68 1917.40 1128.80 - - Cent Enka 497.95 488.05 497.95 506.45 485.00 80.01 671.95 268.90 6 485.70Cent.Bk 17.15 16.65 17.05 17.05 16.50 1947.56 29.65 16.50 10 16.65Cent.Elec 437.00 420.25 443.55 443.55 407.85 10.05 659.20 369.55 - 414.00Cent.Ext [1] 9.35 8.65 9.35 9.35 8.45 405.87 15.77 5.73 - 8.70Cent.Ply [1] 506.40 496.10 517.70 517.70 484.45 264.81 749.00 331.70 35 496.05Cent.Txt 722.95 695.35 711.00 712.60 686.20 259.96 1025.00 470.10 38 697.40CentDepoSer 1095.00 1074.35 1073.90 1090.90 1063.00 713.52 1734.40 792.00 - - CentrumCap [1] 23.05 22.80 22.95 23.25 21.90 759.65 58.50 21.95 - 22.60Cera San [5] 3972.20 4017.30 3901.00 4089.00 3837.75 45.09 6430.45 3518.60 34 3960.45Cereb.Int 60.20 58.10 59.00 60.75 57.00 209.03 99.00 48.50 28 58.90CESC [1] 78.05 79.80 77.85 80.00 77.00 2049.73 102.45 63.54 13 79.80CGPowr&InS [2] 170.30 165.75 170.00 170.00 163.60 1617.93 219.60 71.00 56 165.50ChaletHotels 283.75 288.45 280.80 291.80 275.30 329.15 332.15 146.05 - 288.80ChamanLalSat 98.55 107.25 97.80 109.35 96.95 249.79 155.00 83.10 - - Chamb.Frt 408.50 414.20 408.50 417.80 404.50 1730.93 515.95 228.80 14 414.40ChembondChem 167.00 166.20 169.75 170.20 160.15 8.20 264.70 135.30 55 167.25ChemconSpecl 271.05 269.40 268.00 273.70 266.25 49.97 569.40 261.00 - - ChemplastSan 508.85 483.65 495.00 501.20 475.85 172.79 826.00 444.25 - - ChoicInternl 310.15 305.90 309.00 314.05 304.80 53.39 331.55 297.00 - - CholaFin [2] 624.55 609.20 619.90 624.25 600.40 2330.77 770.05 469.75 23 609.10CholamandF [1] 585.25 607.00 589.85 619.00 573.35 50.15 763.05 553.25 205 603.45Cigniti Tech 392.70 380.05 395.05 398.20 378.20 134.14 677.00 357.65 27 380.10Cipla [2] 937.60 920.75 935.00 937.00 915.50 2242.77 1083.15 850.00 25 921.10CitiUn Bk [1] 121.85 119.30 121.85 121.85 117.55 1386.84 183.65 108.60 13 119.40Clari.Chm 448.25 444.60 445.00 449.10 440.00 15.80 642.20 440.05 27 445.15CleanSci&Tec 1760.85 1722.60 1748.00 1748.00 1661.05 202.29 2705.00 1422.10 - - CLEducateLt [5] 115.35 109.60 113.95 116.30 109.60 61.32 170.30 41.00 - 109.45CMI 29.30 29.70 29.30 31.90 28.35 30.70 70.90 28.00 - 29.70CMSInfoSystm 240.70 233.85 235.00 236.75 230.40 219.42 317.45 215.10 - - Coal India 169.85 167.05 167.85 170.20 164.6510406.34 209.00 132.80 10 166.80CoastalCorpn 311.55 311.65 296.00 328.00 291.25 71.00 564.50 237.75 - - CochinShip 304.30 307.70 305.00 312.00 300.10 80.61 433.75 281.00 8 306.80CoffeeDayEnt 43.10 40.80 43.10 43.10 40.55 1323.77 86.70 23.25 - 40.80COFORGE 3721.60 3653.90 3675.20 3734.90 3552.25 514.61 6135.00 3142.70 - - Colgate [1] 1576.00 1565.40 1580.00 1580.00 1542.15 250.39 1823.00 1375.55 40 1565.70CompuageInf[2] 25.25 23.85 25.60 25.60 23.55 328.31 47.20 18.95 6 23.75Compucom [2] 19.80 18.85 19.00 20.05 18.30 115.60 41.30 8.90 12 19.05ComputerAge 2269.05 2197.60 2265.00 2265.00 2192.00 150.24 4067.40 2192.00 - - Con.FinHld 125.95 121.30 124.05 128.50 116.95 11.82 78.40 26.55 - - Concor [5] 605.65 594.20 604.00 606.00 584.80 1178.60 754.10 555.10 46 594.20ConfdnPetInd[1] 51.75 50.70 49.85 51.80 49.80 408.58 95.40 49.50 15 50.70ControlPrint 411.70 389.85 422.00 422.00 386.60 40.91 494.25 294.00 17 389.65CoralIndFin [2] 36.95 34.85 37.50 39.25 34.30 79.43 58.50 25.25 8 34.70Cords Cab 54.05 51.00 53.40 53.40 50.55 50.73 83.40 41.75 10 51.15Corom.Intl [1] 901.25 875.95 901.25 906.00 863.80 335.41 1002.50 709.55 18 872.60Cosmo Film 1677.55 1661.55 1660.00 1676.85 1602.55 110.70 2140.00 685.00 10 1659.75CounClubH [2] 6.95 7.10 6.90 7.45 6.55 66.70 10.62 4.45 - 7.00Count.Cond [1] 4.55 4.25 4.45 4.55 4.10 132.30 8.74 2.03 - 4.30CPCL 272.65 259.05 270.00 276.95 259.05 1601.00 321.90 94.65 3 259.25CraftsmnAuto 2233.70 2165.85 2200.90 2247.00 2152.90 8.24 2778.00 1460.00 - - CrdtacsGramn 897.00 879.70 884.00 915.00 847.00 107.44 1090.00 495.30 45 872.25CreatPer&Dis 536.30 511.15 509.50 543.95 509.50 103.44 764.00 83.90 - - Crisil [1] 3194.75 3161.40 3174.35 3239.00 3070.25 79.96 3860.00 1855.30 67 3160.20CromGreCon [2] 362.90 345.85 359.90 360.85 337.00 2308.06 512.05 337.20 33 346.00CSBBank 199.75 193.70 200.00 200.00 192.75 207.71 372.95 192.50 7 193.80CubexTub 23.10 22.55 23.65 23.65 21.75 27.36 38.85 17.65 15 22.40CUMI [1] 723.05 734.90 719.00 768.00 685.05 149.64 1033.95 563.80 54 729.20CumminsInd [2] 978.75 957.80 970.00 975.60 947.10 265.93 1161.50 747.10 34 956.80Cupid Ltd 235.05 236.60 229.00 242.90 222.80 134.75 353.70 192.05 16 237.20Cybertech 145.80 141.90 144.75 145.85 140.00 76.94 245.70 129.20 42 142.40CYIENT Ltd [5] 798.45 785.45 786.00 801.05 765.70 304.12 1292.00 754.00 15 786.30
D . . . . . . . . . . . . . . . . . . . . . . . . . . . . . . . . . . . . . . . . . . . . . . . .D P WIRES 314.05 284.80 302.55 312.80 282.70 26.15 424.00 125.00 - - Dabur [1] 507.10 498.35 507.00 507.10 495.50 2176.91 658.75 494.30 61 498.25Dalm.B.Sug [2] 392.65 369.05 390.25 392.05 355.60 264.36 568.65 286.55 10 371.75DamodarInd [5] 54.70 51.05 52.55 53.70 50.60 37.41 78.75 27.10 6 50.75DangeeDums 348.30 348.50 345.00 359.95 342.35 5.09 372.45 181.50 - - DanvrshFnvst 87.85 82.85 87.85 88.90 81.80 272.28 96.90 77.45 - - Datamatics [5] 241.15 239.80 236.05 244.00 234.75 136.38 382.40 126.00 17 239.10DataPatrnInd 675.30 661.85 664.90 687.75 650.00 169.53 934.80 575.00 - - DB Corp 83.80 82.55 83.80 87.15 81.40 189.27 124.60 78.45 9 82.45DCB Bk 81.85 82.30 82.00 84.80 81.65 3316.00 114.45 68.05 9 82.30DCM 75.20 72.10 75.50 75.50 70.50 39.06 145.05 25.35 22 71.80DCMNouvelle 189.70 182.05 187.00 187.00 181.00 41.29 385.10 93.75 3 181.90DCMShriram [2] 999.05 1051.15 998.00 1064.40 975.05 223.68 1263.85 644.00 16 1052.80DcmShrirmInd 90.45 86.60 89.80 90.60 85.00 230.56 125.90 81.00 - - DCW [2] 40.60 38.60 39.80 40.50 38.60 883.14 65.95 31.95 18 38.55De Nora 671.60 638.05 671.60 671.60 638.05 19.75 777.35 256.65 22 634.65DebockIndust 105.55 110.75 104.90 114.85 96.00 18.77 156.95 96.00 - - Deccan Cem [5] 507.75 496.75 516.00 516.00 490.10 13.30 846.25 431.05 6 495.85DeepIndust 218.40 216.75 220.00 224.20 214.05 126.29 288.40 57.30 - - Deepk.Fer 547.80 549.35 520.45 557.65 520.45 542.52 730.00 278.15 36 549.35Deepk.Ntr [2] 1970.05 1918.80 1970.05 1992.85 1910.00 849.91 3020.00 1712.50 54 1918.65Delta Corp [1] 229.20 221.40 227.00 227.70 218.05 2617.39 339.50 147.70 69 221.45Den Net 35.00 34.70 35.00 35.60 34.25 1176.50 65.30 34.10 9 34.65DevyaniInter 153.30 151.65 152.00 154.50 145.60 2941.24 198.90 107.55 - - DFMFoods [2] 214.75 206.00 212.00 215.80 199.15 99.28 452.80 199.00 - 209.90Dhamp.Sug 371.75 360.20 366.90 377.55 345.50 1484.06 584.00 259.00 10 359.25DhaniService 42.10 40.45 40.15 42.90 40.00 7763.16 242.90 40.00 - - Dhanlk.Bk 11.90 11.85 11.85 12.10 11.70 310.07 20.20 11.65 - 11.90Dhanuka Ag [2] 693.25 668.80 680.65 692.55 664.00 25.79 1053.15 635.20 15 674.95Dhar.Sugar 17.60 16.75 16.75 17.50 16.75 80.55 36.50 9.22 - 16.65DhrmsiMorarj 345.75 330.15 345.00 345.00 325.05 26.57 479.45 294.55 - - DhruvConsult 54.20 52.25 54.95 54.95 50.35 17.71 84.35 46.40 - - Dhun.Inv 601.45 587.20 614.00 614.00 578.05 2.11 865.00 315.00 70 595.05Dhunseri Tea 246.65 238.05 247.95 247.95 233.10 6.26 405.20 200.00 8 236.90DhunseriVent 206.35 201.15 203.60 204.35 196.95 21.22 350.00 119.00 - - DIC India 336.80 327.90 328.00 341.05 321.15 5.54 549.00 321.00 30 327.20DigispiceTec 28.60 27.50 28.60 28.60 27.05 83.37 60.70 27.05 - - DilipBuildco 219.35 211.70 218.00 218.35 211.00 447.23 749.30 211.00 - 211.80Dish TV [1] 13.90 12.85 13.50 13.95 12.65 5689.95 23.44 11.23 - 12.85DishmanCarb[2] 119.85 115.85 117.80 122.10 109.20 1319.41 259.50 109.45 - 115.75Divi'sLabs [2] 4293.80 4233.40 4287.10 4295.55 4140.05 481.41 5425.00 3790.00 44 4233.05DixonTec(In) [2] 3511.80 3401.10 3494.95 3509.95 3303.15 744.52 6240.00 3305.50 126 3401.90DLF Ltd [2] 326.25 322.20 324.00 325.70 315.90 7826.30 449.80 245.00 50 322.35D-Link [2] 126.50 126.90 125.65 130.60 120.40 188.25 193.95 103.50 11 123.95DodlaDairy 481.75 480.10 479.50 484.30 477.45 12.96 674.80 407.60 - - DolatAlgotec 82.35 80.80 82.00 82.35 78.75 180.64 127.90 61.30 - - DollarInd [2] 491.45 475.75 480.35 494.45 470.95 106.03 665.70 242.95 21 475.25Donear [2] 49.20 47.75 50.90 50.90 47.60 9.39 76.50 31.70 15 48.35DPAbhushan 396.05 374.05 390.00 390.00 370.25 10.09 495.00 113.80 - - DPSC 12.55 12.00 12.50 12.55 11.95 93.27 31.15 11.75 - - Dr Reddy [5] 3884.05 3880.00 3861.50 3896.20 3789.85 293.63 5613.65 3655.00 43 3874.85Dred.Corp 305.05 288.15 302.90 304.40 283.25 56.64 475.00 283.15 - 288.20DrLalPathLab 2283.85 2300.90 2260.05 2320.05 2217.30 137.75 4243.00 2219.95 54 2299.15DuconInfrTec[1] 21.45 20.40 21.25 21.25 20.40 140.30 31.40 6.16 - 20.50Dwarikesh [1] 105.05 103.25 103.55 106.45 101.20 2386.94 148.45 50.05 12 103.35Dynac.Sys 254.65 233.05 250.00 250.00 229.20 91.16 368.00 101.20 20 234.80Dynamatic 1744.60 1783.30 1715.10 1800.00 1681.10 11.61 3447.85 1000.00 33 1787.95DynemicProd 499.35 480.35 490.00 491.60 465.00 69.20 766.68 437.96 23 480.85
E . . . . . . . . . . . . . . . . . . . . . . . . . . . . . . . . . . . . . . . . . . . . . . . .EasyTripPlnr 356.70 341.35 359.80 361.65 340.00 1273.72 717.65 185.85 - - Eclerx 2099.85 2105.65 2065.20 2150.00 2027.60 38.24 2970.00 1080.65 21 2105.45EdelFinSer [1] 53.50 52.35 53.40 53.70 52.05 939.91 100.80 50.10 3 52.45EicherMotor [1] 2389.15 2384.65 2369.00 2401.00 2332.15 419.48 2995.35 2110.00 43 2383.30EID Parry [1] 488.50 463.00 484.00 484.00 453.65 337.40 574.00 377.10 33 462.65EIH [2] 133.60 133.95 131.00 138.00 129.00 474.49 171.60 91.40 - 133.50EIH A Htl 413.40 392.45 414.95 415.50 390.00 30.63 522.00 236.10 91 391.35Eimco 340.70 330.40 335.00 340.45 326.55 6.50 539.75 298.40 22 332.80ELDECHSG& IN 649.40 649.50 649.40 674.00 630.40 1.01 800.00 615.05 - - Elec. Eng [2] 177.20 181.20 174.90 184.80 170.20 823.93 219.00 83.80 21 181.10Elec.Stl.Cs [1] 36.35 33.50 36.00 36.60 32.75 1921.68 48.00 31.10 6 33.55Electrotherm 107.30 103.10 106.30 106.30 102.45 17.35 197.90 102.45 2 103.60Elgi Eqp [1] 278.40 259.55 260.00 269.95 252.65 1002.99 422.70 191.60 46 259.00Emami [1] 474.10 450.75 472.40 473.95 446.00 634.38 621.35 430.00 34 451.05EmamiPapMi [2] 148.40 141.65 150.00 150.00 140.00 65.33 214.90 117.50 9 141.90EmamiRealty [2] 55.55 56.65 54.00 57.80 54.00 19.23 106.00 45.00 - 56.55Emkay Glo 93.45 91.00 95.00 95.00 90.00 35.48 147.50 67.30 13 91.05Emmbi Ind 91.75 87.30 88.30 90.00 86.15 45.51 125.00 77.00 9 87.00EnduranceTec 1141.10 1145.55 1141.10 1167.85 1132.85 294.00 1980.95 1047.65 38 1145.70Energy Dev 16.80 16.00 17.00 17.00 16.00 60.52 42.25 8.42 - 16.05Eng.India [5] 59.70 58.85 59.50 59.75 58.60 849.59 89.50 58.00 15 58.90Ent.Net.Ind 197.20 194.60 194.75 201.55 192.10 52.09 232.80 147.55 - 195.60EPL 156.35 154.00 156.00 156.30 153.50 788.12 291.95 149.00 - - EqitsSmlFnBk 53.50 55.00 52.80 55.90 51.85 2273.80 76.80 46.70 - - EquipSocImpT 63.35 60.20 63.45 63.45 60.20 8.03 142.30 2.05 - - Equitas Hold 109.90 112.20 108.30 114.00 107.75 1627.89 144.85 81.25 - 112.00ErisLifeSci [1] 673.90 667.75 671.00 675.00 657.05 87.48 863.15 625.60 22 665.50Eros Intl 24.00 23.85 23.40 24.30 22.80 550.77 38.45 16.35 - 23.85Esab Ind 3293.65 3066.60 3305.00 3330.00 3045.00 10.01 3703.30 1764.00 57 3047.00Escorts 1586.35 1554.40 1578.00 1590.00 1538.10 544.25 1930.00 1113.05 25 1551.80Essar Shp 7.25 7.15 7.25 7.40 6.80 130.19 16.15 6.84 - 7.22Ester [5] 135.40 128.60 131.50 133.80 125.30 289.41 187.80 114.20 8 128.40EuroFrshFood 119.25 123.25 119.25 129.00 110.35 7.42 153.95 92.00 - - Ever.Kanto [2] 160.75 155.25 158.50 159.30 153.05 182.57 291.15 84.70 9 154.60Everady [5] 311.20 314.45 311.00 316.25 307.35 546.37 413.30 255.45 48 314.60Everest Ind 566.20 553.50 560.90 568.75 545.00 30.63 783.20 335.00 17 553.95Excel Ind [5] 1155.25 1221.45 1149.00 1254.10 1135.40 68.22 1818.15 824.65 11 1224.05Exide [1] 144.20 141.00 144.10 144.10 139.55 2244.90 202.95 139.30 14 141.00ExpleoSolu 1244.05 1202.65 1249.20 1249.20 1185.00 27.32 1874.00 586.00 - - ExxaroTiles 103.10 102.10 102.00 103.50 99.10 135.14 172.70 92.65 - -
F . . . . . . . . . . . . . . . . . . . . . . . . . . . . . . . . . . . . . . . . . . . . . . . .FACT 116.90 112.80 117.45 117.50 110.80 179.22 160.00 97.60 16 112.40FaircheOrgan 1368.10 1390.85 1330.05 1415.50 1325.00 21.70 2274.80 809.00 - - FCS Soft [1] 3.00 2.85 2.90 2.95 2.85 6044.45 9.05 0.84 - 2.85FDC [1] 247.50 244.95 245.00 248.30 243.00 105.40 404.90 243.10 17 244.65Fed Bk [2] 90.70 85.45 90.55 90.75 83.9529157.78 107.65 77.50 10 85.45Fed.Goetze 269.10 266.95 268.35 269.20 265.50 38.97 358.20 207.10 27 267.00FiberwebInd 41.25 40.95 40.90 41.95 38.70 32.40 52.50 37.90 - - Fiem Ind 839.15 817.25 840.00 840.00 806.60 22.81 1377.70 562.00 12 816.00Filatex [2] 106.90 104.90 104.00 106.10 103.00 385.00 142.30 72.50 7 104.75Fin.Cable [2] 355.30 365.00 356.90 368.00 349.45 151.36 608.65 347.95 14 364.30FineOrgInd [5] 4486.85 4195.35 4490.00 4490.10 4155.00 48.44 4742.85 2735.45 76 4195.00FineotexChe [2] 156.10 156.70 160.00 163.60 153.20 531.49 235.25 78.35 40 156.40Fino.Ind [2] 140.20 139.70 140.90 142.00 127.50 410.67 268.00 128.00 10 139.80FinoPaymntBk 267.75 258.40 264.65 267.00 256.15 40.70 582.95 210.05 - - Firstsource 108.60 109.75 107.15 112.00 106.10 4014.99 242.65 106.15 20 109.70Foods&Inns 70.60 67.65 69.00 76.45 66.65 68.71 125.00 66.65 - - ForceMotors 1014.15 1010.70 1009.00 1025.95 991.30 27.87 1740.00 970.10 - - Fortis Hlt 242.10 237.85 237.60 243.60 233.30 726.87 313.80 218.00 - 237.60Foseco 1351.65 1297.30 1316.20 1370.00 1272.20 3.25 1790.00 1245.40 26 1287.30FSNECommVent 1271.30 1286.15 1270.00 1316.00 1207.50 769.44 2573.70 1207.50 - - Fut. Life [2] 15.35 14.60 14.60 14.60 14.60 75.48 89.55 14.60 - 14.60Fut. Mkt 4.35 4.75 4.25 4.75 4.15 254.29 21.00 4.10 - 4.79Future Cons 2.20 2.15 2.15 2.25 2.0511431.08 11.95 2.05 - - FutureEntp [2] 3.40 3.25 3.30 3.30 3.25 1408.96 13.92 3.21 - 3.24FutureRetail [2] 16.15 15.35 15.35 15.35 15.35 228.13 76.25 15.30 - 15.30FuturSuplyCh 25.35 24.25 24.65 25.65 24.10 93.05 121.95 24.00 - 24.25
G . . . . . . . . . . . . . . . . . . . . . . . . . . . . . . . . . . . . . . . . . . . . . . . .Gabriel [1] 106.85 106.20 104.40 107.55 102.00 271.58 168.00 102.45 17 105.95Gail(India) 150.65 150.30 150.35 151.80 148.00 9350.63 173.45 125.20 7 150.25GalaxSurfact 2702.50 2664.30 2702.50 2702.50 2610.05 24.10 3600.00 2598.00 72 2665.45Gallant Isp [1] 62.95 60.65 62.00 62.75 58.80 130.79 75.90 45.00 18 60.10Gallant Mtl 66.65 61.70 66.65 67.20 61.00 100.05 88.00 53.95 7 62.05Gandhi Tub [5] 350.15 333.75 341.00 345.40 333.05 4.16 557.85 292.50 9 335.30Ganesh Hsg 276.50 269.90 277.75 283.00 262.40 146.15 313.60 57.10 - 269.35Ganesha Ecos 683.65 666.60 673.40 680.00 657.00 35.85 788.00 460.00 22 666.65GaneshBenzop 110.15 104.75 105.00 108.55 103.60 249.68 139.50 76.10 - - GangaForging 6.25 5.95 6.20 6.20 5.95 240.79 147.25 5.95 - - GangesSecu 113.90 101.95 114.25 114.25 97.70 25.88 153.25 63.30 16 100.70GardenReach 281.15 279.20 275.00 282.50 271.00 484.52 332.85 173.35 16 278.70GarwareHiTec 610.35 600.55 610.35 619.90 583.25 23.07 889.00 583.25 - - GarwarTecFib 2941.00 2901.00 2977.85 2977.85 2852.80 14.37 4033.40 2600.00 37 2899.95Gati [2] 142.00 137.75 141.30 141.65 136.50 540.60 221.75 103.10 - 137.65GatwayDistri 72.60 71.30 73.20 73.20 70.25 259.03 87.00 70.10 - - Gayt. Proj [2] 18.15 17.15 18.15 18.20 16.95 793.31 60.65 17.00 - 17.25GE Ship 365.90 366.20 364.25 368.95 356.40 167.87 477.00 265.05 6 364.20GE T&DInd 106.55 102.25 104.20 105.00 100.55 45.27 153.80 81.45 - - Geecee 139.65 140.80 142.00 146.00 131.05 48.69 211.25 102.30 14 141.55GenInsCorpIn[5] 114.00 112.35 114.00 114.00 111.10 433.27 232.50 110.00 13 112.30GenricEngCon 30.10 28.45 30.70 30.70 28.10 20.43 58.50 28.10 - - Genus P&B [1] 16.60 15.80 16.00 16.20 15.80 159.75 26.50 7.60 - 15.80Genus Pwr [1] 84.50 81.15 82.65 83.85 80.00 650.36 113.00 49.40 47 80.95GeojitFinSer 53.60 52.50 53.50 53.50 51.95 270.77 102.70 51.95 - - GEPowerIndia 178.00 177.30 179.80 183.80 173.80 197.84 371.80 130.65 - 177.20GFL 64.30 62.90 64.70 64.70 61.20 82.87 94.30 59.00 - - GHCL 585.05 582.95 588.00 605.80 579.45 1067.05 682.20 248.00 8 582.85GIC Hsg 129.30 126.95 126.50 129.25 124.10 100.25 202.50 121.25 3 127.15Gillette 4901.60 4851.70 4896.00 4897.65 4830.00 2.11 6270.05 4803.90 63 4856.25Ginni Fil 40.00 39.30 39.05 40.00 38.30 110.97 63.65 26.30 8 39.30GlandPharma 2900.85 2851.70 2876.85 2922.55 2801.00 179.00 4350.00 2641.15 - - Glaxo Phr 1477.65 1482.70 1478.00 1508.70 1459.85 22.11 1917.00 1433.05 48 1487.35Glb.Vect 43.30 41.70 43.00 43.25 40.05 22.96 89.00 40.80 - 41.85Glenmark [1] 403.50 390.55 400.00 412.65 386.20 591.33 690.60 386.30 6 390.15GlnmarkLifSc 436.45 431.70 436.30 436.30 427.40 40.86 799.00 427.40 - - Glob.Spr 1221.55 1191.65 1199.00 1212.65 1175.15 94.75 1760.00 309.00 20 1193.20GlobeText(I) 6.70 6.15 6.60 6.85 6.10 704.32 19.20 6.10 - - GM Brew 563.70 533.60 558.00 561.15 530.00 31.17 922.85 395.00 11 534.45GMDC [2] 172.95 181.45 173.60 186.60 172.95 6125.81 228.50 59.10 14 181.30GMMPfauder [2] 4173.60 4213.35 4112.05 4244.65 4110.30 17.89 5435.00 4113.20 58 4211.60GMR Inf [1] 33.35 32.45 33.00 33.15 31.7510389.38 49.15 24.75 - 32.40
GmrPwr&Urbn 28.70 27.30 28.00 28.50 27.30 769.12 35.60 23.20 - - GNA Axles 472.75 485.45 472.80 489.55 465.05 57.53 1107.35 362.40 12 486.10GNFC 703.70 682.25 697.70 710.90 660.05 7591.21 912.00 313.05 6 681.85Goa Carb 415.40 402.20 405.00 414.40 395.00 38.99 614.00 305.00 13 402.35GOCL Corp [2] 234.10 230.85 232.00 235.00 221.70 19.76 386.00 193.15 23 232.05God.Pow.Isp [5] 343.25 327.60 340.00 340.00 322.00 449.95 497.45 211.50 4 327.60Godfrey [2] 1128.30 1134.00 1120.00 1165.45 1107.00 61.53 1409.85 857.00 14 1128.95Godrej Cons [1] 780.75 771.25 780.00 785.30 756.35 1509.52 1138.50 660.20 61 770.50Godrej Ind [1] 456.15 438.90 450.10 457.50 434.95 111.17 674.35 434.45 - 439.30Godrej Pr [5] 1379.80 1320.95 1371.90 1374.30 1310.00 773.00 2598.00 1215.50 70 1319.30GodrejAgrovt 501.75 505.75 501.00 510.00 495.00 479.76 746.80 441.00 27 504.85GoFashionInd 940.55 925.90 935.00 959.00 903.00 46.91 1339.90 847.30 - - Gokaldas [5] 426.45 418.45 421.85 440.00 408.85 436.41 488.00 93.40 22 417.40Gokul Ref [2] 37.55 34.90 37.00 37.20 33.90 319.41 49.90 20.00 - 34.60Gold.Tobac 100.65 103.70 100.55 108.90 98.40 32.29 189.85 41.05 34 104.65Goldiam Int [2] 135.35 128.65 133.85 133.85 127.00 142.72 228.52 75.00 22 128.15Golds.Tech 56.45 53.65 55.55 56.00 53.65 27.63 117.80 9.51 - 53.30GoodLuck St [2] 244.15 248.40 240.00 252.00 236.85 36.58 400.00 93.30 11 249.65GoodyearInd 881.80 852.35 880.00 880.00 843.65 15.80 1015.30 783.00 - - GP Petrol [5] 47.00 47.10 47.50 47.65 45.80 52.53 77.60 41.10 16 47.00GPTInfraProj 91.60 90.75 89.00 92.50 88.20 53.97 112.05 39.20 11 90.70Granuels [1] 245.65 235.20 239.60 242.55 232.10 815.56 404.50 232.15 15 235.30Graphite [2] 455.25 448.45 444.50 456.05 433.00 485.41 815.35 396.00 16 447.80Grasim [2] 1535.35 1485.85 1527.00 1530.00 1463.25 690.85 1939.00 1350.85 39 1487.15Graur&WeilIn 62.90 63.00 61.05 64.00 61.00 460.42 76.25 43.30 - - GreenlamInd [1] 329.50 315.60 334.35 349.00 310.00 45.54 415.90 202.00 39 317.90GreenPly [1] 182.30 183.75 181.50 185.00 175.25 149.69 254.25 161.10 25 184.00GrenpanelInd 495.40 487.10 492.95 499.00 477.15 333.94 625.70 227.10 - - Grindwel [5] 1671.10 1654.35 1657.00 1697.90 1602.70 37.15 2025.45 1140.60 62 1661.90GRInfraproj 1468.05 1437.80 1440.00 1468.00 1413.05 9.82 2267.65 1249.20 - - GRP Ltd 1374.35 1387.90 1386.30 1398.00 1300.10 7.84 1600.60 875.00 23 1374.00Grvs.Cot [2] 137.45 131.00 135.65 135.65 129.60 1538.52 258.85 125.50 127 131.05GSFC [2] 150.30 146.75 147.00 148.65 144.10 1582.67 198.70 95.05 8 146.60GSPL 263.90 259.55 256.75 268.00 250.20 1161.08 383.00 248.05 14 259.55GTL 8.75 8.05 8.60 8.70 7.90 1170.31 32.55 6.70 - 8.06GTL Infra 1.30 1.25 1.30 1.30 1.2533543.42 4.90 0.72 - 1.26GTPLHathway 165.30 164.95 166.95 168.00 161.25 100.09 313.15 134.00 14 164.75Gufic Bio [1] 219.10 218.60 214.75 223.00 212.15 166.14 289.55 170.20 24 218.85Guj.Alk 803.25 784.05 802.00 811.90 770.55 617.82 1044.75 395.90 15 785.40Guj.Ind.Pow 82.80 83.55 82.25 85.65 81.30 407.08 105.65 68.40 8 83.40Guj.Pipav 79.60 77.55 79.50 79.50 75.30 1012.87 124.15 75.55 19 77.75Guj.Sid.Cem 38.35 37.80 38.35 38.50 37.10 81.61 62.60 35.60 9 37.75Gujarat Gas [2] 537.40 566.95 536.90 571.45 526.65 6495.29 786.65 478.15 30 566.95Gul.Amb.Ex [1] 290.55 282.70 292.00 293.00 278.25 437.65 393.85 151.00 15 282.90Gul.Apl 212.20 206.80 209.95 213.85 204.65 8.84 277.20 193.10 - 208.95Gulf Oil Lub [2] 389.20 385.55 384.95 388.00 377.60 48.38 744.25 379.00 9 386.25GulshanPoly [1] 280.95 270.40 266.60 281.00 266.60 41.79 429.00 150.00 15 269.75Gyscoal [1] 3.95 3.80 3.80 4.00 3.80 723.58 8.59 2.06 - 3.80
H . . . . . . . . . . . . . . . . . . . . . . . . . . . . . . . . . . . . . . . . . . . . . . . .HappiestMind 891.20 861.40 876.00 880.00 856.05 501.08 1580.00 720.05 - - HariomPipInd 194.80 192.35 195.00 197.95 186.35 307.12 231.00 169.10 - - Harri.Mal 144.60 139.00 143.45 143.45 136.45 114.44 250.00 127.70 8 139.35Hathway [2] 17.60 16.85 17.45 17.45 16.55 2993.73 29.30 16.60 - 16.85Hatsun Agro [1] 1003.25 991.65 976.65 1009.05 976.65 34.73 1533.65 812.95 98 989.55HavellsIndia [1] 1229.25 1199.55 1225.00 1237.55 1190.50 684.20 1503.70 958.35 63 1199.35HBL Pwr [1] 74.25 71.05 73.25 73.70 70.15 3652.78 92.25 37.25 34 71.00HCC [1] 13.25 12.90 13.10 13.20 12.60 7350.04 20.03 8.20 - 12.85HCG 259.45 259.65 256.15 262.35 254.20 140.50 312.80 179.65 - 258.10HCL Info [2] 15.75 15.00 15.55 15.70 15.00 409.55 31.35 8.93 - 15.05HCL Tech [2] 1060.90 1059.40 1050.10 1070.95 1043.75 3195.19 1377.00 895.30 26 1058.65HDFC [2] 2219.10 2150.45 2190.00 2204.00 2143.00 4361.04 3021.10 2046.30 28 2150.45HDFC AMC [5] 1876.75 1840.05 1876.00 1899.55 1823.00 402.35 3363.00 1822.50 28 1840.40HDFC Bank [1] 1348.60 1303.05 1321.10 1326.80 1293.0011191.15 1724.30 1292.00 20 1303.10HDFCLifeIns 563.55 547.25 560.10 564.65 544.30 3079.55 775.65 497.30 96 547.45HEG 1043.80 1003.45 1037.80 1037.80 991.75 189.69 2626.15 992.10 14 1002.95Heidelbrg 188.80 184.25 188.65 189.70 182.50 73.05 284.55 178.95 14 184.35HemispherePR 102.75 102.05 102.40 103.20 101.00 383.60 167.20 99.05 - - HeranbaIndus 571.40 563.05 570.05 575.70 560.00 46.99 866.85 551.10 - - Herc.Hoi [1] 134.00 131.30 135.05 135.05 130.10 28.27 179.65 115.10 24 131.55Herit.Fds [5] 287.75 289.15 287.95 293.65 282.05 78.65 565.00 282.80 11 290.05HeroMoto [2] 2470.30 2401.20 2459.00 2459.00 2371.00 966.47 3089.00 2148.00 19 2403.45Hester Biosc 2263.60 2342.05 2210.35 2380.00 2210.35 7.10 3180.00 2135.25 43 2332.65Hexa Trade [2] 175.20 176.00 174.00 182.00 172.00 14.82 236.05 101.85 - 180.00HFCL [1] 64.00 61.80 62.75 63.50 61.20 6546.73 101.35 35.40 30 61.85HGInfraEngg 554.10 536.90 544.00 544.00 527.70 57.15 830.80 277.05 10 537.10Hikal [2] 395.10 381.35 390.00 391.65 376.10 150.00 742.00 326.15 25 382.05HIL 3604.90 3505.80 3550.85 3576.30 3493.35 12.60 6750.00 3370.00 14 3503.60HimadriSpec [1] 61.20 59.00 60.00 60.55 57.60 7645.10 85.50 41.60 37 59.10Himat.Seid [5] 119.45 116.60 119.00 119.40 113.45 397.50 311.95 113.50 7 116.15Hind.Compo [5] 263.10 254.35 260.10 260.10 254.00 4.32 373.85 251.50 17 254.65Hind.Cop [5] 94.85 92.10 93.50 94.25 91.30 4256.10 188.50 91.50 36 92.15Hind.Media 60.65 59.15 60.65 61.25 57.70 57.73 107.00 58.70 7 59.20Hind.Mot [5] 10.35 9.85 10.40 10.40 9.50 193.70 18.20 6.64 - 9.83Hind.Oil.Ex 161.95 159.70 161.95 165.25 158.40 529.48 245.15 93.70 40 159.50Hind.Rect [2] 181.50 176.55 185.45 189.00 172.50 11.23 286.00 128.95 41 176.25Hind.Znc [2] 295.45 286.15 292.35 293.30 285.15 548.95 407.90 285.30 12 286.45Hindalco [1] 422.55 405.85 416.00 422.00 394.6023831.42 636.00 359.80 21 406.05HindconChem 62.15 61.90 61.15 62.50 60.50 9.92 87.00 41.75 - - HindujaGlo 913.85 877.50 910.85 910.85 875.00 93.63 1974.00 815.00 10 878.40HindustnAero 1557.00 1516.95 1549.95 1584.55 1500.00 697.22 1757.55 978.80 14 1516.90HindustnFood 1801.95 1755.60 1815.00 1815.00 1740.00 4.37 2489.00 1622.65 - - HisarMetalIn 112.90 106.05 111.10 111.15 105.00 21.92 165.00 90.20 6 107.35HiTech Gr 195.95 185.90 193.00 196.65 181.00 12.77 364.90 179.80 9 186.05Hi-TechPipes 537.95 518.90 531.20 536.70 510.90 82.91 337.50 155.00 29 242.00HLEGlascoat 4194.50 3984.85 4189.80 4189.80 3951.00 7.25 7550.00 2725.05 - - HLV 8.65 8.60 8.65 8.80 8.45 209.26 12.95 5.80 - - HomeFirstFin 733.75 753.10 725.00 767.95 709.25 208.65 921.30 481.25 - - Honda Siel 1339.40 1347.95 1339.00 1431.50 1322.35 27.97 1497.80 985.00 18 1342.05Honey.Aut 38498.20 37159.15 38001.00 38300.00 36700.00 3.41 47400.00 36750.00 89 37209.95HOV Services 55.10 52.00 55.10 55.10 51.45 11.30 90.00 43.65 35 53.15HPAdhesives 359.00 348.35 359.00 359.00 345.00 40.49 505.00 335.00 - - HPCL 263.90 262.50 262.00 267.10 258.00 2971.82 354.55 244.60 5 262.55HPLElect&Pow 58.30 56.50 56.90 57.80 56.25 68.86 91.90 46.85 54 56.65HSG&UrbanDev 32.20 31.40 31.90 31.90 30.60 1845.35 58.25 30.60 4 31.40HT Media [2] 25.55 24.85 25.25 25.35 24.50 342.46 39.15 20.60 - 24.85HuhtamakiInd 179.70 176.45 175.00 180.65 174.25 80.53 328.00 148.40 - - HUL [1] 2163.50 2138.80 2164.85 2164.85 2109.20 1531.52 2859.10 1901.80 57 2141.00
I . . . . . . . . . . . . . . . . . . . . . . . . . . . . . . . . . . . . . . . . . . . . . . . . .Ibull Hsg [2] 111.15 118.65 109.00 122.25 105.7061421.65 313.50 106.15 6 119.35Ibull Real [2] 71.65 74.20 71.00 75.00 70.2515113.55 195.90 68.50 - 74.15ICICI Bank [2] 714.20 695.80 707.55 710.70 693.3016685.17 859.70 592.00 21 695.90ICICILombGIC 1284.45 1249.10 1280.00 1284.40 1242.10 528.46 1674.00 1192.00 48 1249.40ICICISecu 479.15 473.30 478.95 482.25 462.20 409.82 896.05 462.20 - - ICRA 3850.85 3874.05 3844.95 3935.00 3713.25 1.85 4511.00 3055.65 53 3865.90IDBI 38.75 36.65 37.70 38.25 36.25 6600.41 65.25 36.00 16 36.65Idea Cell 8.65 8.15 8.60 8.65 8.15122299.87 16.79 4.55 - 8.19IDFC 50.95 49.45 50.50 50.50 48.35 8379.63 70.15 41.70 - 49.20IDFCFirstBnk 36.75 34.80 36.40 36.45 34.2047352.64 62.00 34.20 - - IFB Agro 554.05 543.65 550.25 553.55 540.00 9.94 866.25 436.05 8 545.90IFB Ind 899.05 848.15 885.00 885.00 824.00 59.43 1357.80 793.50 - 847.05IFCI 9.95 9.40 9.90 9.90 9.20 4028.00 18.87 9.22 - 9.37IFGLRefract 263.85 252.70 264.20 265.05 248.00 26.53 434.00 243.80 25 253.40IG Pet 644.90 641.10 636.20 658.00 618.70 34.02 1017.90 453.00 7 639.05Igarshi 312.20 293.60 312.00 312.00 287.15 54.12 612.20 289.00 60 294.45IIFLHoldings [2] 307.10 295.35 296.10 304.70 290.05 1033.10 395.15 234.05 15 294.95IIFLSecurity 76.90 74.95 72.15 77.65 71.50 569.52 128.50 57.80 - - IIFLWealtMgt 1581.50 1515.75 1541.55 1566.15 1493.55 44.06 1908.30 1065.00 - - IL&FS Ven [2] 6.25 6.05 5.90 6.35 5.90 272.32 11.34 4.97 - 6.09ImagiWrldEnt 15.50 14.75 15.80 16.20 14.75 466.55 18.55 5.45 - - Ind Terr [2] 44.75 43.75 44.20 45.60 43.20 104.47 74.80 27.90 10 43.90Ind.Bk.Mer 24.50 24.60 24.80 26.00 23.25 241.65 37.25 14.00 16 24.50Ind.Card 310.30 256.80 285.00 286.00 256.80 17.02 329.65 139.45 - 257.20Ind.Cem 176.40 168.30 174.00 175.00 164.35 1982.86 259.90 154.95 39 168.20Ind.Gly 875.75 881.60 870.90 904.00 855.00 156.55 1153.10 465.00 22 882.00Ind.Hume [2] 161.60 163.10 158.00 164.90 156.55 16.79 252.70 156.05 10 162.35Ind.Metals 347.40 332.75 344.00 350.45 325.55 70.81 514.00 205.00 4 333.10Ind.Nippon [5] 385.70 374.95 385.00 385.85 364.05 21.61 642.00 329.05 19 375.90Ind.Ovr.Bk 16.40 15.95 16.30 16.35 15.25 1757.34 29.00 15.55 - 15.95Ind.Ram.Sy 67.75 66.85 66.00 68.90 64.50 557.15 90.25 43.05 6 66.65Indian Bk 144.25 137.75 141.90 142.80 137.05 2738.55 194.80 115.15 4 137.60Indian Htl [1] 225.00 217.85 222.45 223.40 216.25 8408.01 268.85 108.87 - 217.95IndianEgyExc[1] 191.65 183.45 190.00 190.20 181.8013248.31 318.71 114.37 54 183.45IndianRailTr 657.10 620.65 653.00 653.00 618.00 3756.19 6396.30 618.00 - - IndianRlyFin 21.40 21.15 21.40 21.40 21.10 6472.56 26.45 20.90 - - IndiaPestcid 245.75 242.10 246.00 248.10 239.25 87.49 368.00 239.25 - - IndigoPaints 1411.10 1403.10 1400.00 1426.20 1375.05 35.52 2740.00 1375.05 - - IndmrtIntmsh 4319.55 4219.00 4290.00 4319.00 4150.00 94.51 9710.70 3960.00 - - INDO AMINES 97.65 94.35 101.00 101.00 92.80 41.79 121.90 92.80 - - Indo Count [2] 127.10 146.20 125.00 152.50 123.40 1529.37 314.80 123.65 8 147.00Indo Wnd 16.25 15.45 15.70 15.90 15.45 165.03 44.50 3.82 - 15.40IndoBorx&Che 127.85 131.20 126.90 134.70 122.85 28.53 184.65 115.70 - - Indoco Rem [2] 340.00 330.35 340.00 340.00 322.70 85.86 529.70 321.05 22 330.15IndostrCapFn 166.25 157.95 159.00 159.95 157.95 53.82 416.95 158.05 - 158.05Indotech Tr 196.45 187.90 190.10 194.90 182.00 17.90 294.95 96.75 10 188.00IndoThai 335.55 318.80 332.00 332.00 318.80 6.61 495.85 50.10 31 317.10Indra.Med 57.30 57.30 56.70 57.85 55.05 105.43 102.55 55.35 9 57.10IndraprsGas [2] 350.55 345.95 345.05 350.00 339.50 2691.97 604.00 322.10 19 345.55IndSwifLab 58.20 55.75 58.75 58.95 55.05 48.33 127.35 55.60 11 56.05Ind-Swift [2] 9.45 9.00 9.90 9.90 8.55 59.98 18.76 4.70 - 8.88IndusInd BK 923.35 869.90 916.00 916.50 856.00 4776.86 1241.85 811.60 15 869.45IndusTowers 208.25 201.55 206.90 208.45 199.50 4943.69 332.80 193.30 - - INEOS Styro 769.20 759.60 767.65 776.10 742.05 51.85 1886.80 743.30 4 759.45Infibeam Inc [1] 13.55 13.40 13.00 14.05 12.70 8266.00 29.23 12.50 - 13.55INFO EDGE (I) 3670.20 3539.50 3670.00 3670.00 3500.00 504.37 7462.95 3501.00 107 3532.30InfobeansTec 675.70 654.10 646.35 669.85 634.90 32.22 875.00 200.00 - - Infosys [5] 1526.75 1508.80 1514.00 1527.50 1504.30 7034.98 1953.70 1311.80 30 1509.25Infrasoft 161.20 154.00 159.25 159.25 150.70 6.89 259.00 79.00 - 155.25Ingersoll 1493.00 1475.25 1472.00 1505.00 1447.70 28.16 1799.00 764.30 44 1477.35Inox Leis 474.65 463.15 470.25 476.60 456.05 570.68 563.60 271.95 - 462.65Inox Wind 88.65 91.00 87.95 92.65 85.00 873.85 160.00 71.50 - 91.40Insectic 723.00 724.55 722.00 730.75 705.00 22.83 846.00 511.00 14 724.20InspirisySol 49.35 47.60 50.45 51.70 47.10 23.11 76.30 31.55 - - IntellecDesi [5] 596.20 578.85 590.00 595.00 571.10 520.62 986.00 565.85 38 578.50IntenseTech [2] 70.25 68.85 70.00 71.50 67.15 65.85 119.75 43.20 11 69.20IntGlobAviat 1678.90 1631.25 1670.00 1670.00 1615.00 371.01 2379.00 1556.25 - 1630.40IntlConveyor 68.50 65.60 68.50 68.50 65.10 96.09 102.45 57.85 - - Inventure [1] 2.85 2.75 2.80 2.85 2.75 4176.19 6.76 2.35 - 2.74IOC 120.45 122.10 120.45 124.00 119.5520411.76 141.75 100.00 4 121.95IOL Chem 373.30 373.35 372.95 381.95 367.80 233.81 725.00 295.10 10 373.75Ion Exchange 1696.60 1678.25 1650.00 1709.95 1610.00 16.21 1923.80 1485.60 - - IPCA Lab [1] 969.25 961.60 969.00 971.90 950.00 175.47 1383.55 917.00 27 958.15I-PruLifeINS 508.10 488.85 502.70 510.70 487.10 1290.27 724.50 430.00 93 488.90IRB Infra 197.10 189.45 195.00 195.00 185.50 1619.18 346.95 105.30 - 189.25IrconIntl 38.90 38.70 38.75 38.90 38.05 1003.23 101.90 38.05 - - IrisBusiServ 80.80 74.15 78.35 79.70 71.10 41.97 165.50 71.10 - - IrisClothing 207.05 220.85 205.10 242.00 205.00 72.98 252.00 103.00 - - IsgecHeavyEn 536.70 516.55 529.00 532.15 504.00 54.12 878.35 503.00 - - ITC [1] 255.65 252.90 255.00 256.40 249.1520044.73 273.10 200.85 21 252.95ITD Cem [1] 58.55 56.95 58.05 58.10 55.60 468.60 97.50 55.50 9 56.85ITDC 332.45 320.80 328.00 336.40 315.00 26.40 463.90 314.30 179 321.45ITI 83.45 81.45 84.45 84.45 81.00 130.68 143.70 80.95 - 81.50IVP 141.55 134.65 136.85 139.00 132.35 10.71 201.85 102.05 10 134.50IZMO Ltd 70.65 67.60 70.15 70.15 66.10 42.22 148.85 61.00 - 67.95
J . . . . . . . . . . . . . . . . . . . . . . . . . . . . . . . . . . . . . . . . . . . . . . . . .J&K Bk [1] 29.70 27.50 30.00 30.00 25.50 3414.19 48.20 26.95 4 27.60Jagran [2] 61.40 60.05 60.90 60.90 58.40 196.33 81.90 53.55 7 60.05Jags.Phr [5] 282.95 273.20 281.00 281.00 272.00 129.51 369.55 94.05 29 277.00Jai Corp [1] 120.00 114.05 119.25 120.05 112.80 2584.57 172.85 90.50 42 114.00JaiBal.Ind 46.80 46.35 47.65 47.70 45.05 65.78 668.00 81.00 - - Jain Irrg [2] 33.90 32.40 34.10 34.60 32.00 2892.60 53.50 19.15 - 32.50Jamna Au [1] 101.55 101.85 97.55 102.65 97.55 783.27 124.90 68.00 32 101.85JashEngg 610.45 593.70 619.00 624.15 580.00 14.44 748.00 366.65 - - Jay Bhr [5] 133.15 127.00 132.80 132.80 125.90 20.64 269.00 126.10 20 127.00Jay.Agro [5] 232.35 227.70 225.00 232.00 219.50 92.96 322.90 172.15 9 226.70Jay.Neco 22.65 21.85 22.25 22.65 21.55 93.62 32.80 16.61 13 21.70Jaypee Inf 2.50 2.40 2.45 2.50 2.40 2252.10 5.05 1.50 - 2.42Jayshr Tea [5] 102.80 105.40 103.00 107.00 101.00 77.69 145.00 85.05 15 105.05JB Chem [2] 1577.90 1553.55 1560.00 1581.10 1548.10 27.71 1984.75 1363.50 32 1551.05JBF Ind 12.30 11.70 12.10 12.55 11.70 159.90 50.20 11.67 - 11.67JBM Auro [2] 450.75 433.30 444.90 450.00 428.50 104.79 675.98 164.00 33 435.55JetFrgtLogis 58.50 54.85 60.00 60.40 53.60 10.99 94.30 44.40 - - JHS Svend 23.50 23.50 23.40 23.95 22.15 82.83 33.40 19.45 - 23.40Jind.Drl [5] 187.75 178.55 184.50 187.40 178.40 34.28 273.00 102.40 11 177.80Jind.Pho 191.40 177.95 185.00 189.00 175.20 29.63 485.20 51.00 - 179.50Jind.Poly 923.50 905.70 898.00 922.75 882.45 99.99 1444.40 772.35 4 904.55Jind.Saw [2] 81.85 79.30 81.90 81.90 77.60 880.08 147.65 77.60 5 79.15Jind.Stl&P [1] 474.65 461.10 469.00 472.00 447.85 7443.54 577.70 340.10 4 459.95JindStain(H) [2] 291.20 269.75 284.60 284.60 264.30 775.42 433.50 162.20 5 265.90JK Cem 2340.85 2334.90 2340.85 2350.00 2280.00 50.22 3836.65 2135.30 27 2330.95JK Lak.Cem [5] 384.75 377.25 380.00 399.40 368.70 160.40 815.25 368.65 11 375.15JK Paper 305.00 295.45 302.10 303.50 290.00 813.50 387.40 140.10 10 295.90JK Tyre [2] 114.95 111.80 115.00 115.00 110.30 713.31 171.60 98.00 10 111.70Jkumar Inf [5] 224.70 218.45 221.50 221.80 208.80 738.17 250.75 149.05 10 218.55JM Fin [1] 63.85 62.75 63.35 63.95 62.00 624.26 117.55 60.20 18 62.80JMC Proj [2] 73.70 74.20 78.00 78.45 71.00 224.15 130.00 65.00 - 73.40Jocil 182.20 175.65 181.00 181.00 174.55 13.33 319.80 151.00 - - JohnCntHita 1733.10 1792.20 1741.80 1835.00 1723.65 30.03 2388.25 1669.85 109 1790.95JP Associ [2] 8.10 7.80 8.10 8.20 7.70 8616.27 15.90 7.59 - 7.79JP Pwr 6.50 6.20 6.40 6.45 6.2017041.51 11.22 3.31 - 6.16JSL [2] 145.50 142.95 144.85 145.40 131.95 1636.94 224.60 90.20 4 142.85JSW Enr 258.50 251.75 259.70 261.95 237.00 883.68 408.70 110.25 73 251.10JSW Hld 3679.70 3506.25 3680.05 3704.70 3480.00 1.15 6000.05 3488.05 30 3499.70JSWIspatSpe 31.25 28.75 28.40 30.00 28.00 3520.36 67.55 27.30 - - JSWSteelLtd [1] 648.95 624.80 647.70 651.55 620.00 4123.93 789.95 566.35 8 624.65JTEKTIndia [1] 69.60 69.20 68.80 70.75 66.05 103.17 132.75 66.15 38 69.30JTL INFRA 214.70 217.00 214.50 223.70 205.80 166.65 279.90 200.20 - - Jub.Ind 402.65 390.00 408.00 408.00 387.75 13.92 796.90 277.00 - 391.35JubilantPhar 401.95 400.40 402.00 404.10 392.40 94.22 925.00 385.15 - - JublilntFood [2] 468.55 468.85 461.80 472.00 451.20 2600.93 915.49 451.60 72 469.45JublntIngrev 435.95 421.45 433.00 436.00 417.20 409.75 838.75 401.20 - - JullundurMot 71.15 69.75 70.00 71.95 68.50 21.85 93.80 40.50 - - JustDial 682.60 658.40 670.00 692.00 650.30 640.83 1138.00 645.00 78 657.90Jyo.Lab [1] 144.05 145.20 143.70 146.00 142.05 208.49 187.20 130.00 33 145.00
................BMBMECMYK
MUMBAI
II BusinessLine FRIDAY • MAY 13 • 2022MARKET RADAR
For BSE/NSE live quotes, scan
the QR code or click the link
https://bit.ly/2FpossK
Company Prev Close Open High Low Qty 52 WH 52 WL PE BSE Cl Company Prev Close Open High Low Qty 52 WH 52 WL PE BSE Cl Company Prev Close Open High Low Qty 52 WH 52 WL PE BSE Cl Company Prev Close Open High Low Qty 52 WH 52 WL PE BSE Cl
NestleIndia 16512.40 16220.00 16484.50 16484.50 16126.75 71.78 20599.95 16140.00 68 16231.55Netwk 18 [5] 68.45 72.75 67.45 74.60 65.55 2610.40 117.40 38.15 72.60Neuland 1061.85 1041.55 1079.00 1096.00 1036.10 68.20 2384.00 1000.00 21 1041.65NewgenSwTech 401.30 408.90 400.00 415.00 396.30 106.33 754.70 316.35 18 409.20NHPC 30.60 31.30 30.35 31.60 30.2514390.14 37.55 25.05 9 31.30NIIT [2] 473.05 435.10 455.15 465.00 406.00 559.55 658.55 167.70 72 436.00Nila Infras [1] 5.75 5.85 5.70 6.00 5.70 510.69 10.56 4.60 5.83NILA SPACES 4.20 4.60 4.50 4.60 4.35 1434.62 4.60 1.50 Nilkamal 1928.25 1900.85 1928.25 1928.25 1859.25 6.41 3174.00 1855.70 35 1910.20Nippo Bat [5] 375.45 366.05 374.55 374.55 363.05 3.57 641.23 362.95 15 369.90NipponLIAM 280.50 280.05 280.00 285.10 275.50 611.63 476.45 275.50 NirajCement 33.25 32.35 33.25 34.40 30.55 8.66 55.90 25.65 Nitco 21.00 21.30 21.50 21.65 20.20 29.66 42.75 19.35 21.45Nitin Spn 211.35 228.00 208.30 232.40 201.00 847.94 345.75 96.80 4 227.90NitirajEngg 81.80 74.15 83.90 83.90 74.00 11.13 100.50 38.20 NLC India 73.35 70.30 72.60 72.60 69.10 5370.27 92.40 49.90 7 70.35NMDC Ltd [1] 142.70 137.60 141.90 142.40 136.00 8268.73 213.15 127.80 4 137.50Nocil 235.20 226.40 233.25 233.35 224.10 686.39 321.00 191.00 26 226.05Noida Toll 7.25 6.85 7.30 7.30 6.60 89.40 10.33 5.13 6.86NovartisInd 584.65 576.25 581.10 583.75 573.40 4.98 823.00 573.40 NRAgarwalInd 226.85 226.45 228.00 232.20 222.00 7.57 361.15 208.00 NRB Bear [2] 110.00 108.75 109.10 109.65 108.00 120.60 189.65 106.70 14 109.00NRB Ind [2] 22.15 21.10 22.85 22.85 21.05 22.37 34.80 17.20 21.25NTPC 152.55 148.55 151.10 153.00 148.0011818.56 166.30 107.80 10 148.60Nucleas Sw 388.80 386.75 388.10 394.15 381.00 10.81 765.35 382.20 21 385.80NURECA 1042.55 963.80 1032.60 1039.95 940.90 23.06 2315.00 940.90 NuvocoVistas 308.30 304.45 308.00 308.00 296.10 563.91 577.90 294.10 Nxtdigital 350.10 350.70 343.00 352.00 340.00 5.16 619.80 333.30
O . . . . . . . . . . . . . . . . . . . . . . . . . . . . . . . . . . . . . . . . . . . . . . . . .Oberoi 853.40 824.85 846.80 846.80 812.00 502.45 1051.90 514.20 69 825.95OdishaCeme[2] 1447.00 1405.50 1435.00 1438.00 1379.00 197.67 2547.20 1279.45 125 1406.10Oil India 220.50 223.10 220.50 225.95 216.10 1418.18 267.70 129.05 8 222.65OlectrGrnTec 569.70 541.25 560.00 562.00 541.25 169.63 888.80 166.10 Omax Auto 44.85 45.75 43.60 47.25 43.60 20.34 74.00 39.35 46.20Omaxe 88.50 85.15 86.25 89.60 84.05 536.09 113.85 66.05 85.45OMDC [1] 2872.50 2734.10 2800.00 2800.00 2701.10 23.08 3800.00 2211.00 2725.10OmInfraLtd 34.60 33.55 34.50 35.00 32.90 58.96 56.45 20.35 Omkar Spl 28.30 27.15 26.95 28.25 26.90 21.65 47.05 7.73 27.10One97Communi 530.60 515.90 526.00 526.90 510.05 2218.79 1955.00 510.05 OnePntOneSol 10.65 10.25 10.65 11.00 10.15 320.87 96.05 10.15 ONGC [5] 158.60 156.50 159.00 161.00 154.0021459.07 194.60 108.50 5 155.90OnMobile 135.85 130.80 134.40 136.80 128.55 1582.07 190.90 94.20 76 130.50Onward Te 306.55 299.25 306.55 308.85 282.30 13.32 428.15 116.35 79 297.50OptimusInfra 277.75 270.15 274.00 296.95 263.80 532.49 436.00 124.15 21 269.40OracleFinSer [5] 3534.95 3500.10 3500.55 3545.55 3470.15 125.83 5144.60 3272.30 17 3501.40Orbit Exp 104.45 99.95 102.50 102.50 99.10 17.48 147.70 60.30 22 99.65OrchidPharma 318.95 306.90 325.80 325.80 300.00 7.99 1605.00 265.00 Oricon Enter [2] 28.25 27.10 28.00 28.60 26.75 124.53 44.80 22.75 24 27.65Orient Bell 407.40 403.75 406.00 415.90 391.30 25.10 669.00 229.70 26 406.60Orient Cem [1] 114.55 117.90 117.00 120.80 114.60 1651.13 185.50 110.00 9 118.05Orient Grn 10.05 9.55 9.85 10.05 9.55 2552.20 28.75 2.10 9.55Orient Htls [1] 60.70 56.75 60.10 60.60 56.05 399.51 69.95 24.05 56.70Orient Pap [1] 27.15 26.90 26.80 27.45 26.30 1115.46 39.40 24.95 26.70Orient Tri 12.45 12.30 12.25 12.70 12.00 95.12 16.94 7.04 12.18OrientAbr [1] 29.20 28.50 29.00 29.50 28.10 92.40 40.45 23.45 28.45OrientalArmt 563.10 508.35 559.80 559.80 501.00 51.81 1100.00 501.00 OrientalCar 812.05 803.10 819.00 819.00 791.00 5.23 1321.00 751.00 13 805.60OrientElect 309.95 308.90 298.00 337.80 280.00 562.98 408.00 277.00 OrisaBengCar 129.25 122.80 129.00 130.65 122.80 17.55 164.80 122.80 OrtinLabs 23.40 21.75 23.40 23.40 21.25 37.97 52.25 19.30 Oswal Chem 22.85 22.00 22.40 22.95 21.80 178.31 36.75 17.30 12 22.05OswalAgroMil 26.80 26.80 27.50 27.90 24.65 91.89 45.30 8.78 26.80
P . . . . . . . . . . . . . . . . . . . . . . . . . . . . . . . . . . . . . . . . . . . . . . . . .P&GHealth 4343.60 4300.00 4235.00 4328.95 4235.00 16.03 6100.00 3991.65 P&S Bk 15.05 14.15 14.95 14.95 13.10 562.49 22.65 13.85 11 14.15Page Ind 41785.60 40915.00 41699.00 41777.15 40625.20 16.68 46705.00 27800.00 99 40891.45PaisaloDigit 780.80 752.60 766.00 766.00 722.00 96.38 1143.15 560.10 42 746.40Pan.Petro [2] 272.15 258.40 271.00 284.20 254.00 302.28 359.00 177.80 8 260.15Panac.Bio [1] 143.20 136.40 143.00 143.00 135.00 37.75 453.70 135.45 135.90ParagMilk 93.50 88.25 90.10 92.75 86.85 310.92 159.85 87.00 17 88.10Param.Comn [2] 11.25 10.45 11.00 11.00 10.25 190.37 24.60 9.37 10.49ParasDef&Spc 595.35 575.70 592.00 592.00 572.25 100.74 1258.20 560.70 ParDrugs&Che 149.10 152.80 147.70 159.90 147.65 23.91 310.60 131.75 Parsvnath [5] 13.40 12.70 13.20 13.65 12.50 318.78 27.05 8.34 12.70PasuptiAcryl 36.05 34.90 36.05 36.05 34.05 91.30 57.60 28.05 Patel Eng [1] 21.80 21.00 21.90 21.90 20.75 361.02 34.95 13.15 10 21.00Patel Int 12.65 12.60 12.50 12.80 12.15 38.53 20.35 12.05 12.65PBFintech 590.35 549.60 580.00 584.95 542.00 740.96 1470.00 540.10 PC Jewl 19.70 19.20 19.70 20.05 18.90 963.53 30.80 18.65 19.20PCBL 100.30 99.60 100.30 100.30 97.40 946.12 277.30 94.75 PDS 1582.55 1572.45 1550.00 1640.00 1540.00 6.26 2041.30 686.15 Pearl Glo 408.90 384.80 401.55 407.25 383.50 12.62 598.00 178.00 56 388.55Pearl Poly 22.80 21.90 22.80 23.25 21.70 73.52 36.45 14.15 1 21.70Pennar Ind [5] 33.95 35.40 33.15 35.95 33.00 655.69 47.95 19.05 12 35.35Persistnt 3837.10 3701.00 3799.90 3847.95 3675.05 218.94 4986.85 2173.65 43 3698.95Petronet 213.40 209.80 203.40 213.00 203.15 4466.77 252.10 190.30 9 211.45PFC 108.05 106.40 107.00 107.85 105.00 3785.75 153.75 104.30 3 106.35Pfi�zer 4223.05 4210.15 4223.00 4238.05 4160.00 29.50 6164.80 4077.80 33 4213.50PG Elec 658.60 613.00 648.00 650.00 594.85 72.06 870.00 287.60 58 617.00PGHH 13484.95 13415.20 13401.15 13519.95 13255.00 3.83 16466.40 12342.20 75 13397.00Phoenx.Mil [2] 1055.10 1033.05 1050.05 1062.70 986.00 173.15 1199.95 709.00 197 1032.95PI Ind [1] 2461.15 2410.70 2411.00 2500.75 2385.00 270.85 3533.30 2334.35 46 2409.90PidiliteInd [1] 2164.15 2115.00 2150.00 2179.40 2105.10 376.21 2764.60 1816.15 88 2115.40PIL Italica [1] 8.05 8.40 8.00 8.85 7.65 942.92 16.40 5.41 8.45Pilani Inv 1706.10 1687.65 1723.00 1730.00 1665.50 4.50 2246.95 1523.90 13 1682.90Pion.Emb 46.75 42.40 45.50 46.65 41.25 138.45 79.60 39.10 5 42.60PiramalEntp [2] 1873.95 1815.10 1869.95 1869.95 1785.10 709.24 3013.00 1616.10 126 1815.30PittiEngg [5] 247.20 240.70 246.90 246.90 236.50 177.52 344.35 65.30 14 241.00PixTransmisn 860.05 828.25 850.05 876.00 797.80 23.63 1121.20 797.80 Plastiblen [5] 183.65 181.30 183.05 187.90 177.05 12.56 305.95 176.95 13 182.95PNB Gilts 65.60 65.00 65.30 65.75 64.40 257.24 94.65 53.95 7 64.95PNB Housing 327.65 312.80 327.00 327.00 311.45 168.72 924.00 312.00 6 312.90PNC Infratec [2] 237.25 232.15 232.50 235.00 229.15 121.64 395.55 222.05 14 231.95PoddarPigmen 265.55 267.85 269.40 275.40 259.30 4.97 434.00 209.15 11 266.40Pokarna Ltd [2] 524.20 526.05 535.00 535.00 503.35 82.25 832.00 240.75 525.15Poly.Medi [5] 742.95 742.20 739.00 760.45 731.85 26.67 1163.00 688.55 49 741.95PolycabIndia 2428.40 2431.70 2424.95 2450.10 2382.80 377.13 2820.00 1468.10 Polyplex 2288.00 2257.00 2240.00 2338.05 2205.55 345.88 2870.00 1081.60 11 2253.75PonawalaFinC 230.20 216.50 226.00 229.70 212.25 8198.38 343.80 125.10 Ponnie Sug 249.40 241.15 245.00 250.15 240.00 37.03 382.50 178.80 7 240.35Power Mech 958.05 899.75 959.85 959.85 890.65 28.93 1094.70 577.30 10 897.10PowerGrid 239.20 235.90 239.00 241.90 232.1519904.25 248.25 167.00 12 235.70Praj Ind [2] 348.60 324.00 340.00 343.40 320.50 1413.98 448.25 281.90 44 324.45PrakashPipes 172.85 163.80 170.15 172.35 162.00 166.56 210.00 125.00 Praksh.Ind 64.05 61.80 67.00 67.00 61.40 744.64 101.10 50.85 7 61.80Praksh.Stl [1] 5.25 4.80 5.15 5.25 4.75 1722.62 9.92 0.88 2 4.82PratapSnack [5] 600.15 588.40 609.15 609.15 563.30 15.00 953.00 540.95 42 595.00PrecisionCam 103.50 100.35 103.55 104.85 99.00 122.92 189.50 43.90 17 100.15Precot 243.55 235.80 233.00 241.00 232.75 3.24 400.00 119.60 Precsn.Pipe 192.05 177.30 188.00 188.50 172.95 40.35 339.35 168.70 24 178.05Precsn.Wre [1] 72.30 69.30 73.00 74.85 68.70 90.30 131.45 37.60 13 69.15PremPolyfi�l [5] 98.65 90.90 98.00 98.00 90.00 55.78 74.60 33.24 57.45Pressman [2] 40.85 39.95 41.65 42.50 38.65 32.83 53.50 23.75 21 40.30Prestige Est 430.40 431.80 429.00 439.00 413.60 348.15 553.40 265.00 52 431.10PRICOL [1] 108.40 99.95 106.55 106.55 88.90 1596.85 149.50 74.00 38 99.80Prime Foc [1] 68.70 69.85 69.85 71.90 68.00 31.08 102.75 48.55 69.90Prime.Sec [5] 102.85 100.10 104.40 104.40 94.65 137.85 133.25 40.00 22 99.75PrincPipeFit 625.60 627.80 612.00 632.00 611.95 113.86 897.00 555.50 PrismJohnson 111.30 111.45 108.00 113.50 102.05 697.68 160.00 99.40 44 111.05PritikAutoIn 14.50 14.20 14.55 14.75 14.10 41.70 22.80 13.00 PriviSpecial 1093.70 1148.80 1079.00 1174.80 1040.05 90.33 2249.00 970.20 ProzoneIntu [2] 23.00 21.50 23.00 24.25 21.05 382.04 56.45 18.45 21.60PSPProjects 487.50 468.50 480.10 483.50 464.00 97.51 639.00 394.00 11 468.20PTC 83.70 82.85 82.50 84.00 80.80 782.14 144.45 78.50 6 82.80PTC Ind Fin 15.80 15.15 15.40 15.70 15.00 735.66 25.90 15.00 15 15.20PTL Ent [1] 31.10 30.30 31.10 31.50 29.90 83.64 41.80 19.75 10 30.30PudumjeePap[1] 36.85 37.10 37.55 37.90 35.05 193.01 50.90 22.60 6 36.85Pun.Natl.Bk [2] 33.10 28.60 31.00 31.35 28.45203441.45 47.60 28.50 9 28.60Punj.Chem 1243.50 1211.65 1228.05 1244.00 1191.50 13.46 1930.00 1053.60 18 1210.00Puravankra [5] 88.60 85.25 88.05 88.15 83.05 150.96 166.35 76.95 12 85.45PVR 1787.50 1755.65 1784.00 1794.55 1725.05 771.47 2010.35 1150.75 1753.95
Q . . . . . . . . . . . . . . . . . . . . . . . . . . . . . . . . . . . . . . . . . . . . . . . . .Quess Corp 627.50 585.85 620.00 620.00 582.25 141.67 990.00 527.60 585.65QuickHealTec 175.65 171.60 175.00 175.10 170.00 51.34 319.90 168.40 12 171.05
R . . . . . . . . . . . . . . . . . . . . . . . . . . . . . . . . . . . . . . . . . . . . . . . . .R Sys Intl [1] 225.20 210.45 226.95 226.95 207.35 69.16 354.55 126.35 21 211.60Radico [2] 778.35 739.80 763.00 769.95 723.20 348.58 1299.85 535.00 35 741.65RagegainTrvl 317.20 304.90 310.60 322.00 299.65 378.19 525.00 275.20 RailTelCorp 94.45 92.85 94.40 94.40 91.80 607.48 164.60 84.00 RailVikasNgm 31.15 30.45 31.00 31.35 30.20 1747.99 44.80 27.50 Rain Ind [2] 156.55 146.65 153.55 155.00 145.25 2291.58 272.90 145.30 146.50RainbowChild 483.30 462.15 473.00 478.00 453.35 1681.63 517.90 421.65 Raj.Exp [1] 574.80 593.45 571.00 606.15 562.00 108.78 994.50 511.80 98 593.75RajnandniMet 408.55 391.55 408.50 408.90 388.50 39.38 449.00 93.00 RajOilMills 68.60 65.20 70.50 70.50 65.20 20.33 150.35 51.10 Rajsr.Sug 32.30 31.10 32.45 32.90 30.70 29.88 48.00 20.55 31.15RajsrePolypk 181.70 176.20 177.15 184.55 173.70 19.86 284.00 147.15 Rallis [1] 198.60 198.00 197.60 202.50 194.00 390.70 362.00 194.15 23 198.05Rama News 17.15 16.70 17.15 17.15 16.40 30.23 27.60 15.50 16.55Rama Steel [5] 355.70 340.00 355.00 363.50 337.95 73.80 455.15 72.50 62 339.10Ramco Cem [1] 705.55 703.25 700.50 709.95 685.10 502.04 1130.95 685.60 17 702.70Ramco Ind [1] 192.85 187.70 192.00 192.75 184.30 33.11 366.00 184.95 14 188.05Ramco Sys 245.15 242.05 240.00 251.50 233.15 110.78 686.00 234.75 242.15Ramk.Forg [2] 164.30 152.85 160.20 160.60 151.00 551.75 251.92 120.75 12 152.90Ramky Inf 159.90 155.95 158.90 172.00 153.20 197.14 258.35 71.30 7 156.90Rana Sug 30.10 30.80 29.50 31.40 28.55 1442.75 44.35 14.01 3 30.70Rane (M) 297.75 294.25 297.70 297.75 285.80 6.55 489.65 286.30 23 294.55Rane Brk 593.75 578.75 593.75 606.00 575.00 7.11 1200.90 576.00 16 579.00Rane Eng 220.35 211.70 219.95 219.95 211.25 4.14 386.00 212.00 212.40Rane Hld 592.15 576.00 581.70 583.20 574.00 12.36 782.45 550.65 38 576.15RatanindiaEn 32.35 31.25 32.20 32.20 30.50 2075.13 65.90 12.30 Ratnamani [2] 2201.50 2240.10 2197.00 2279.00 2146.50 23.73 2641.80 1753.60 33 2245.05RattanIndPow 4.55 4.35 4.40 4.45 4.35 9285.05 9.99 3.02 4.33Raymond 785.80 745.30 780.90 780.90 737.00 490.10 964.15 343.05 26 746.10RBL Bank 108.25 101.70 107.00 107.15 100.8020964.17 226.45 100.80 101.75RCF 86.15 82.00 84.80 85.30 81.30 4128.26 112.65 66.45 9 82.00Rcom [5] 2.40 2.30 2.40 2.40 2.2010735.05 5.49 1.70 2.29RECL 118.60 115.90 118.05 118.60 114.55 4916.83 168.70 114.60 2 115.85Redington [2] 128.70 132.75 125.00 134.95 124.10 3972.72 179.25 89.05 11 132.65Refex Ref 126.60 121.85 125.80 125.80 116.25 101.69 173.10 113.00 7 121.60Rel Cap 14.50 13.80 14.40 14.40 13.80 1764.52 30.80 10.85 13.85Rel.Ind.Inf 982.20 960.80 987.00 1001.55 953.10 1396.16 1201.80 381.25 192 959.90Rel.Infra 101.00 100.90 102.00 107.80 96.40 3026.64 149.50 49.05 100.85Relaxo [1] 1029.50 1018.75 940.00 1052.00 925.00 962.25 1447.00 885.00 109 1029.15RelHomeFin 3.55 3.25 3.50 3.50 3.20 1140.85 6.75 2.45 Reliance 2449.30 2399.40 2427.50 2434.85 2370.00 9456.28 2855.00 1906.50 42 2400.95Religare 105.95 106.55 105.70 108.20 97.65 1325.66 194.50 91.25 106.25Remsons 195.70 196.45 191.50 200.15 187.25 3.34 313.80 155.00 32 197.80RenaisncGlob 656.35 623.60 640.00 662.95 612.05 38.78 1090.90 389.70 Repco Home 159.20 157.80 159.50 163.75 156.15 146.96 429.25 152.75 5 158.10Repro 403.35 378.65 403.00 405.55 373.15 10.83 660.00 340.95 378.35Resp.Ind [1] 130.30 127.40 129.50 130.90 126.10 104.01 215.00 98.05 127.70
RestBrndAsia 90.80 87.35 89.90 90.45 86.50 874.36 189.70 86.50 Revathi 591.75 577.25 599.60 607.15 570.45 1.45 957.00 516.65 17 580.40RHIMagnesInd 548.60 535.45 530.00 548.70 527.00 209.26 674.00 293.10 Rico Auto [1] 32.75 32.45 32.35 32.90 32.00 276.12 62.30 31.20 16 32.35RitcoLogistc 123.60 118.20 126.50 126.50 117.45 53.26 160.70 115.85 RITES 248.55 246.55 245.00 249.50 245.00 85.56 318.00 239.00 12 246.20RKECProjects 44.20 41.60 46.00 46.00 39.60 29.29 117.00 39.60 RolexRings 1147.00 1146.10 1150.00 1174.95 1118.00 9.38 1394.00 994.80 Rollatainers [1] 1.70 1.55 1.70 1.70 1.55 1469.40 4.61 1.54 1.59RosariBiotec 858.20 880.30 862.70 898.00 830.00 30.30 1619.00 830.00 Rossell [2] 172.90 170.65 171.85 175.00 166.25 42.29 226.25 112.00 47 169.40RotoPumps 414.90 408.45 415.00 416.45 396.00 27.36 469.00 390.45 RouteMobile 1400.80 1371.85 1391.10 1391.80 1350.80 147.13 2389.00 1350.80 Royal Orchd 123.00 121.55 119.00 124.40 118.70 58.01 153.35 60.65 121.20RPG Life [8] 474.55 461.35 467.45 475.00 450.55 27.14 751.80 422.00 15 458.45RPower 13.00 12.40 12.75 12.95 12.3518307.72 19.25 6.45 12.45RPP Infra 40.50 39.20 40.40 40.60 38.25 73.48 78.75 38.40 7 39.35RPSGVentures 502.80 497.15 500.60 505.05 490.00 31.51 1144.90 379.10 RS Soft [5] 26.65 25.95 26.65 26.90 25.80 62.05 51.90 25.90 26.05RSWM 459.80 418.75 451.00 453.80 414.00 133.45 572.60 219.90 5 417.05Ruby Mills [5] 380.50 361.50 372.35 385.00 359.45 49.03 500.15 180.80 20 361.70Ruch.Paper 91.50 87.85 90.00 93.70 85.80 172.88 134.00 63.05 8 87.85RuchiSoyaInd 944.95 937.20 922.00 957.00 880.00 4849.89 1376.70 677.15 RudrabhshEnt 195.00 194.60 197.75 197.80 190.00 16.11 280.00 186.00 Rupa [1] 479.65 481.20 471.00 486.00 469.40 553.82 585.05 302.00 18 479.60Rush.Decor 431.45 409.25 427.80 431.00 397.35 97.01 600.45 218.00 65 409.60
S . . . . . . . . . . . . . . . . . . . . . . . . . . . . . . . . . . . . . . . . . . . . . . . . .S H Kelkar 134.40 129.25 136.35 136.35 128.20 226.65 207.30 128.45 30 129.20Sadbhav [1] 26.85 25.80 26.75 27.00 25.55 462.63 96.30 24.15 8 25.90SafariIndia 910.85 906.75 930.00 930.00 892.10 4.63 1051.05 567.00 Sagar Cem [2] 210.60 203.00 195.00 206.00 195.00 191.26 319.00 153.60 26 201.45SagrdeepAloy 31.10 30.55 34.00 34.00 30.05 27.46 49.95 26.00 SAIL 83.85 80.70 83.45 83.50 79.8035341.24 145.85 79.85 2 80.65SakarHealth 117.45 114.00 116.95 117.45 111.80 6.20 212.00 103.35 Saksoft 721.65 691.40 711.10 727.85 688.00 11.84 1172.35 470.00 39 690.50Sakth.Sug 15.60 15.45 15.75 16.50 15.10 248.17 22.90 11.55 15.30Sakuma [1] 17.20 16.05 16.70 16.95 15.75 970.92 19.60 5.15 16.05SAL Stl 9.00 8.65 9.00 9.20 8.55 157.58 17.55 4.13 3 8.64SalasarTech 235.75 235.10 233.00 242.20 227.00 59.61 370.75 202.00 20 232.40SalonaCot 239.65 231.80 253.80 253.80 230.00 2.94 372.00 91.05 6 234.20Salzer Elec 177.75 180.25 175.00 181.00 171.70 38.99 263.50 122.35 11 180.25Sambhaav [1] 4.35 4.25 4.40 4.40 4.05 43.17 7.77 2.48 4.28Sandesh 721.00 701.15 727.00 727.00 700.00 1.63 1079.00 635.65 7 701.00SandharTech 227.90 224.55 222.00 231.20 220.45 18.14 333.00 198.00 17 224.60Sangam 292.55 280.50 288.15 290.20 277.10 48.64 423.40 94.10 10 282.75Sangh.Mov [2] 176.70 170.15 179.45 179.45 170.00 60.06 262.00 145.00 40 171.00Sanghi Ind 41.60 39.85 40.00 40.55 39.50 280.81 84.70 39.50 17 39.85SanginitChem 21.10 19.85 21.40 21.40 19.50 64.81 47.20 18.75 Sanofi� 6510.65 6533.25 6412.00 6710.00 6351.00 22.52 9300.00 6320.70 26 6510.55SanseraEngg 700.95 700.50 700.00 717.00 676.45 63.75 889.00 548.55 SapireFoodIn 1095.50 1040.10 1081.45 1090.45 1021.35 137.35 1540.00 974.45 Sarda Ene 1042.60 1002.35 1025.00 1034.35 960.20 102.89 1358.10 491.10 6 998.05Saregama [1] 371.55 361.35 367.65 370.75 355.00 368.67 548.70 187.20 46 362.55Sarla Perf [1] 49.45 47.05 48.50 50.25 45.30 225.26 78.30 31.40 7 46.65SarthakMetal 104.10 101.30 107.40 108.50 99.05 27.10 144.00 84.90 Sasken 753.15 745.85 756.95 759.75 718.00 14.31 1528.95 713.30 9 748.15SastaSunVent 339.15 324.10 334.05 337.75 321.70 28.09 583.00 181.00 325.00SatiaIndus 115.85 113.10 113.50 117.95 108.90 476.95 152.35 81.60 Satin Credit 108.20 102.90 104.55 107.95 102.80 183.98 133.00 66.70 19 103.00Savita 1040.40 1004.30 1029.00 1029.00 1000.00 5.70 1822.65 920.00 5 1002.00SBCExports 5.75 5.50 5.60 5.70 5.50 1298.00 208.55 5.30 SBI [1] 476.55 462.65 473.00 473.00 456.3518947.10 549.05 359.60 12 462.45SBICards&Pay 748.95 736.25 744.60 745.60 723.45 2102.68 1165.00 712.25 SBILifeInsur 1087.15 1060.60 1075.50 1081.95 1048.00 1457.23 1293.00 956.85 70 1061.15Schaefl�erInd [2] 2073.65 1979.90 2043.30 2062.45 1958.05 105.47 2437.05 964.95 44 1981.70SChand&Co [5] 97.70 93.30 97.00 97.00 92.30 38.59 149.40 91.20 54 93.30Schneider [2] 115.20 114.20 112.20 115.50 110.80 631.29 153.90 96.55 114.25SCI 111.30 110.60 110.10 111.45 106.95 1253.52 160.20 93.10 6 110.65Seamec 865.80 862.80 880.00 883.45 847.55 12.43 1423.95 385.50 22 861.45SecureludTec 68.75 65.50 68.00 68.00 63.50 57.11 243.75 63.50 SecuriIntSvc [5] 484.60 477.35 484.60 487.30 472.55 108.36 559.75 380.65 52 477.50Selan Exp 193.20 195.30 193.00 196.90 190.45 126.91 227.55 122.40 30 195.80SEPC 8.45 7.55 8.30 10.10 7.15 2217.65 12.45 4.00 Sequent Sc [2] 116.30 112.40 115.85 118.00 111.55 960.24 336.40 111.50 112.35SercotechPwr 83.35 79.20 79.30 82.95 79.20 61.73 104.50 17.95 Sesh.Paper [2] 188.75 179.05 187.65 188.00 178.10 104.46 238.95 133.95 11 179.15SetcoAuto [2] 14.30 13.65 14.30 14.40 13.45 89.32 25.20 13.45 13.65Shah Alloy 69.75 70.60 66.50 72.60 66.50 45.94 135.35 9.93 2 70.05Shakt.Pump 436.25 420.05 438.00 438.05 415.00 49.73 910.00 415.10 14 420.35Shal.Paints [2] 128.40 124.85 129.60 129.60 122.00 157.44 163.50 85.00 125.70SHALBY 109.45 104.25 107.80 108.05 103.55 63.25 214.00 103.65 16 104.50ShankarBldg 671.90 659.20 674.00 674.00 650.00 40.19 843.00 370.00 67 655.65Shanthi Grs [1] 200.20 207.95 199.70 212.00 194.50 475.74 244.20 135.30 38 209.10ShardMotor [2] 638.45 657.90 645.00 683.25 576.65 20.72 950.00 361.10 13 652.50ShardaCropch 584.85 587.00 585.00 604.00 563.45 109.59 740.40 287.75 20 586.95ShareIndSec 1242.85 1172.80 1196.00 1219.95 1167.90 46.95 1475.00 377.55 SheelaFoam [5] 3396.10 3357.05 3310.00 3468.00 3132.55 48.33 4054.00 1957.20 80 3338.60Shemaroo Ent 107.65 106.90 107.65 110.00 104.70 32.66 181.00 86.60 45 106.10Shilpa Med [1] 407.80 392.10 406.00 414.70 390.30 67.66 670.95 380.35 27 392.95ShilyEngPlas 1699.15 1570.75 1670.00 1725.00 1541.25 5.52 2390.00 1541.25 Shiv.Global 24.25 25.00 23.10 25.15 23.05 53.11 38.95 9.11 20 25.15ShivalikBimt 386.65 392.05 371.00 399.95 366.20 74.69 584.00 115.10 Shivam Auto [2] 30.25 29.25 29.65 30.00 28.75 276.48 44.85 17.50 29.50ShivaMills 99.35 94.85 94.40 96.50 94.40 11.08 209.00 51.50 5 95.15ShivaTaxyarn 191.25 185.35 191.05 212.25 182.00 47.73 322.15 155.35 10 187.75ShivlkRasayn 818.35 760.80 800.00 827.70 741.00 42.03 1195.00 741.00 Shop.Stop [5] 445.95 441.65 435.00 463.00 435.00 185.57 598.65 197.25 445.80Shr.CU.Fin 1638.90 1642.60 1638.90 1699.95 1564.65 110.76 2600.00 1402.00 10 1646.20Shr.Ram.Mul [5] 13.10 12.45 12.75 12.80 12.45 42.19 23.00 10.80 12.35Shr.Ren.Sug [1] 44.55 42.05 43.50 45.35 41.7512024.41 63.25 13.75 42.10Shr.Tr.Fin 1120.00 1064.75 1120.00 1120.00 1047.10 1879.49 1696.15 1002.50 11 1063.10ShradInfProj 46.55 43.20 45.05 46.85 43.00 9.30 80.00 41.05 Shre PushChe 258.45 258.40 251.00 273.40 247.65 234.48 323.90 150.30 22 257.80ShreDigvjCem 63.30 62.25 63.85 69.95 60.20 231.84 97.80 47.10 ShreeCement 23382.30 22627.40 23172.00 23382.30 22508.85 43.80 31441.05 21667.50 33 22640.50SHRENIK 2.35 2.15 2.25 2.35 2.15 1974.53 4.60 1.40 ShreRamProtn 88.45 89.00 84.05 90.00 84.05 193.29 138.00 29.65 Shreyans 115.55 112.60 117.00 117.55 108.70 9.14 152.00 89.70 8 112.65Shreyas 292.80 290.65 285.00 298.50 281.60 46.54 448.00 96.90 4 289.95ShriramPropr 63.55 61.45 63.70 63.70 61.10 375.42 115.75 61.10 ShyamCent [1] 23.50 22.35 22.60 23.45 22.35 763.91 38.05 7.35 10 22.40ShyamMetalic 302.00 299.90 291.10 302.65 291.10 198.94 461.15 289.15 Sical Log 10.35 10.00 10.30 10.30 9.80 120.14 23.83 9.85 10.09Siemens [2] 2317.40 2275.90 2316.00 2317.00 2255.20 308.53 2577.45 1919.50 77 2275.35SigachiIndus 254.65 256.10 254.00 259.00 247.60 68.72 494.00 247.60 SignetIndus 38.25 36.30 37.50 37.90 35.35 27.50 69.45 35.15 SIL Inv 320.25 284.75 310.40 319.15 283.05 5.23 429.45 223.10 18 286.00SilgoRetail 31.00 31.55 31.40 31.95 30.65 43.13 49.50 24.65 SircPaintInd 441.05 424.10 439.00 442.75 410.00 28.39 625.00 283.00 Siyaram [2] 589.20 552.75 570.00 576.55 545.70 75.61 698.00 202.00 12 552.60SJSEnterpris 382.95 379.85 375.00 389.00 371.05 36.19 551.00 339.50 SJVN 27.10 27.25 26.95 27.40 26.65 4158.16 33.80 25.35 7 27.20SKF India 3094.95 3103.45 3050.00 3230.95 2981.30 110.70 4245.25 2212.80 39 3102.65Skipper [1] 56.25 60.60 60.00 64.40 58.50 1177.15 98.35 54.10 22 60.70SKM Egg 60.65 59.10 60.90 60.90 58.60 29.69 98.45 54.95 14 58.90Smartlink [2] 117.85 116.85 123.70 123.70 113.15 47.95 253.80 89.00 4 117.60SMCGloblSecu 81.30 79.75 81.00 81.05 78.55 188.43 104.75 65.80 SML Isuzu 562.45 527.75 564.05 568.00 523.15 25.21 842.80 435.30 528.75SMS Phr [1] 87.80 82.15 88.60 88.60 81.20 102.64 199.15 81.50 9 82.25SMSLifeScien 599.00 576.50 602.95 602.95 556.20 5.22 1024.90 556.20 SnowmanLogi 32.75 30.90 32.35 32.35 30.10 443.37 59.70 30.15 30.90Sobha 535.60 503.65 535.60 537.70 496.20 470.56 1045.00 442.00 46 503.25Solar Ind [2] 2820.35 2781.10 2811.45 2829.90 2751.00 23.26 3191.55 1198.45 96 2775.95SolarActPhSc 443.00 448.60 443.00 465.00 414.00 112.39 1859.95 414.00 Somany [2] 555.75 556.15 558.00 565.00 533.35 44.29 952.45 416.55 21 556.00SomanyHomInn 301.15 291.55 304.00 304.00 287.40 85.77 464.00 267.15 SomiConveyor 33.65 32.20 34.50 34.50 32.00 6.74 68.50 32.05 25 32.95SonaBLWPrecn 562.85 568.95 562.85 577.95 552.35 1497.24 839.90 295.00 SonamClock 88.15 87.00 88.15 88.50 85.80 107.73 98.00 73.00 Sonata [1] 639.20 661.90 642.00 698.80 612.85 195.95 1030.00 570.00 30 662.45SorilInfrRes 60.10 59.80 61.85 61.85 55.75 33.73 182.50 56.65 59.60South In Bk [1] 7.75 7.65 7.75 7.75 7.60 4164.97 13.95 7.45 7.63SouthWestPin 200.50 197.30 204.40 205.80 194.75 19.48 249.00 33.85 SpandnaSphor 385.00 385.70 380.00 394.90 375.65 151.04 820.00 323.00 SPApparels 333.75 324.45 325.00 333.00 320.45 42.29 530.00 187.35 12 324.90Spec.Rest 130.10 122.35 128.00 128.00 120.20 124.01 177.00 39.20 33 122.90SpencersRetl 75.45 73.05 75.40 75.40 70.50 164.36 144.30 68.55 SPIC 60.50 59.25 59.20 60.50 57.05 1422.74 93.05 40.80 7 58.95Spicejet 48.65 47.25 48.00 48.00 46.65 2028.83 87.30 46.25 SPL Ind 51.35 52.80 51.85 54.20 49.00 79.63 79.95 37.10 9 52.90SPML Infra [2] 43.90 42.05 41.90 42.45 41.75 71.19 75.40 9.85 41.60Sr.Leathrs 176.55 173.05 174.10 177.00 171.00 8.84 233.95 139.75 23 175.30Sr.Ray.HHP 377.75 370.60 377.70 377.85 365.10 15.90 523.00 269.10 8 370.70SREI Infr 4.80 4.60 4.70 4.80 4.60 466.89 18.39 3.47 1 4.57SRF 2234.25 2194.35 2230.00 2234.20 2166.10 1100.40 2773.00 1240.00 43 2195.10StampedeCap 10.95 10.80 10.95 11.20 10.50 349.15 13.35 1.85 Star Pap 153.35 152.40 152.35 156.95 147.25 67.59 195.00 110.45 9 152.40StarCement [1] 85.05 82.60 85.05 86.25 82.00 67.85 120.00 82.00 20 82.90StarHealth 685.85 647.95 684.90 684.90 626.05 253.25 940.00 583.60 STC India 87.85 85.20 87.20 88.00 83.50 57.16 138.75 81.65 85.25Steel Strp [5] 755.50 744.80 785.00 785.00 738.50 54.43 995.00 357.90 12 747.80Steelcast 319.10 309.95 316.00 323.10 304.40 10.01 392.10 238.00 SteelCitySec 57.85 56.45 57.90 57.90 56.25 10.69 98.70 37.80 SteelExIndia 168.70 160.30 162.30 168.85 160.30 143.37 258.70 56.25 Stel Hld [1] 121.20 116.25 123.20 123.20 115.00 8.04 0.24 0.20 Ster.Tool [2] 122.55 119.35 124.05 125.05 115.00 64.19 257.00 116.05 13 120.75Sterlg&Wilsn 319.55 321.55 316.65 325.00 313.80 402.70 509.10 220.05 SterliteTech 163.70 156.20 162.10 162.30 154.65 703.50 318.00 154.65 StoveKraft 559.45 553.70 555.00 558.60 524.60 122.11 1133.70 480.00 Str.Arcolab 275.70 266.40 275.05 284.25 264.35 1412.94 847.45 263.45 86 266.30StylamIndust 860.70 868.70 855.00 890.00 840.65 15.71 1419.90 840.65 SUBEX 30.25 28.65 29.90 29.90 28.45 3654.53 74.40 28.45 Subros [2] 303.45 300.25 305.00 313.00 293.85 92.13 418.00 295.00 48 300.90Sud.Chem [2] 461.55 446.20 454.15 465.35 444.00 74.21 791.95 444.35 28 446.05Sumeet 8.65 8.55 8.40 8.70 8.25 235.09 14.43 4.31 4 8.48Sumit.Sec 589.65 575.55 589.65 599.90 570.00 5.99 899.00 505.05 30 571.00SumitomoChem 412.10 412.40 409.20 419.75 402.30 282.91 477.00 294.05 Sun Pharma [1] 854.80 850.00 852.90 855.85 835.20 2700.59 966.90 652.75 117 850.15Sun Phr Adv [1] 218.30 203.95 214.00 214.00 201.00 372.58 348.75 201.20 204.30Sun TV [5] 431.15 413.65 429.00 429.95 409.35 646.03 611.25 409.50 10 413.80Sund.Brak 352.60 332.80 351.95 351.95 330.20 2.76 489.95 320.05 335.00Sund.Clay [5] 3615.35 3604.50 3610.00 3629.00 3513.50 2.85 5123.55 3003.25 41 3609.80Sund.Fast [1] 718.20 702.95 725.00 725.35 673.05 58.91 993.00 676.00 34 703.25Sund.Fin 1831.00 1827.05 1790.00 1868.65 1790.00 19.57 2705.90 1754.80 25 1828.90Sund.Multi [1] 3.05 2.75 3.20 3.20 2.75 907.20 5.80 1.11 2.76SundarFinHol 70.65 69.75 73.35 73.35 69.10 77.82 94.70 67.10 Sunfl�ag 94.60 96.90 93.80 102.50 91.50 470.73 136.10 58.70 7 96.70Sunteck [1] 419.50 400.95 415.00 417.80 396.20 713.02 589.95 252.10 400.30Superhouse 157.65 150.85 156.15 156.15 146.70 22.90 245.05 120.50 7 151.60Supr.Ind [2] 1896.90 1848.50 1889.90 1889.90 1818.60 119.42 2689.00 1819.30 29 1848.95Suprajit [1] 310.45 306.80 307.90 316.90 302.80 128.55 478.00 240.60 31 307.15SupryaLifeSc 337.95 322.70 338.00 343.30 321.00 314.66 601.90 315.50 Surana Solar [5] 22.00 20.20 22.65 22.65 20.05 98.60 42.85 9.09 20.20Surana Tel [1] 11.45 10.90 10.90 10.95 10.90 84.12 17.97 4.31 10.92Surya Rosh 372.95 358.95 366.00 369.90 355.30 56.35 868.40 355.25 11 358.90Suryalaxmi 69.35 64.45 62.65 66.05 62.65 76.55 98.90 40.45 64.75
SuryodaySFB 127.70 122.75 127.00 128.55 120.65 92.32 247.65 87.00 Sutlej Te [1] 66.70 63.40 65.10 66.20 62.90 214.90 104.85 44.00 6 63.50SuumayaLife 83.95 79.80 83.00 83.00 79.80 63.37 736.85 79.80 Suven Lif [1] 77.35 78.45 77.90 79.15 74.50 308.20 124.40 72.00 78.50SuvenPharma 536.00 516.00 515.20 533.70 502.50 214.50 631.75 425.70 SuvidaInfSvc 6.70 6.20 6.65 6.65 6.05 449.05 31.15 6.05 Suzlon [2] 9.20 8.60 9.10 9.10 8.5535263.85 13.10 5.35 8.62SVPGlobalVen 45.25 43.10 44.00 45.40 42.75 112.05 164.85 38.55 Swan Ener [1] 280.35 266.35 280.45 284.50 260.25 277.01 337.00 112.50 264.85Swaraj Eng 1507.70 1480.30 1500.00 1505.00 1476.00 8.80 1989.90 1292.55 16 1480.50Swle. Ener 362.85 344.75 344.75 354.95 344.75 14.05 468.85 205.00 21 344.80Symphony [2] 1020.95 1004.30 1010.00 1013.85 992.65 50.19 1214.00 890.00 63 1003.90Syngene Int 543.90 538.90 530.00 549.50 530.00 291.64 699.95 508.10 52 538.90
T . . . . . . . . . . . . . . . . . . . . . . . . . . . . . . . . . . . . . . . . . . . . . . . . .Tainwala 78.00 76.70 75.00 79.15 75.00 13.21 124.00 60.55 41 77.45Taj GVK [2] 141.65 136.95 140.50 141.65 136.00 131.84 186.30 112.00 87 136.70Take Sol [1] 22.35 21.00 22.30 22.90 20.70 1108.67 74.65 20.75 21.00Talbros 413.15 400.60 400.10 408.45 394.00 23.65 654.90 196.00 13 400.90Tanla Sol [1] 1177.40 1170.60 1162.00 1217.90 1143.75 378.42 2094.40 735.00 134 1171.40Tarmat 54.25 53.95 55.05 55.05 52.60 13.81 98.00 47.65 16 54.00TarsonsProd 620.40 608.70 608.00 619.15 600.05 76.79 924.90 538.70 TastyBiteEat 10117.30 9965.3510150.0010151.05 9930.00 1.1021470.50 9835.05 131 9951.55Tata Chem 988.35 935.40 974.50 980.00 926.90 1294.62 1158.00 690.20 30 935.80Tata Cof [1] 200.85 199.25 200.85 201.00 195.75 1062.79 254.00 157.45 36 198.70Tata Com 972.75 974.10 966.20 977.00 947.25 607.20 1590.00 947.15 24 973.90Tata Elxsi 6872.50 6884.50 6805.30 6975.00 6601.55 890.70 9420.00 3350.00 78 6886.60Tata Inv 1393.85 1370.00 1390.00 1390.00 1357.95 16.98 1734.00 1048.60 34 1370.50Tata M DVR [2] 187.95 182.85 185.75 185.90 180.45 3671.23 298.50 129.10 182.75Tata Metlk 706.20 705.80 707.00 715.00 686.00 125.10 1364.90 686.00 10 705.75Tata Motors [2] 388.15 372.30 382.00 384.65 366.2033511.54 536.50 268.50 372.10Tata Steel 1165.70 1117.70 1156.90 1162.40 1103.00 9419.16 1534.60 1050.50 4 1118.15TataConsuPro 744.10 738.05 742.00 748.00 728.00 1488.55 889.00 621.00 TataPowerC [1] 226.50 219.05 225.80 227.05 217.0529320.36 298.00 101.05 51 219.05TataStlLngPr 654.65 633.10 650.00 657.95 625.05 53.33 1087.70 625.00 TatvaChinPha 2084.05 2062.25 2071.70 2079.00 2039.70 50.45 2977.80 2001.00 TCI Express [2] 1544.00 1524.00 1542.00 1581.95 1442.05 66.63 2570.00 908.20 43 1520.50TCNSClothing 709.90 689.45 693.00 714.30 683.00 28.22 932.00 504.00 TCPLPackage 671.90 680.20 656.55 685.05 656.55 17.48 979.80 445.45 TCS [1] 3412.00 3408.65 3378.00 3449.70 3350.10 2807.20 4045.50 3035.65 33 3411.00TD Power 382.40 384.25 374.00 397.60 367.35 401.14 492.60 174.90 22 383.35TeamleaseSvc 3456.75 3445.20 3402.55 3511.00 3400.00 17.35 5544.10 3147.55 63 3447.60TechMahind [5] 1224.45 1212.80 1209.00 1232.85 1197.05 3110.22 1837.75 941.45 23 1213.55Technocr 988.05 937.95 987.90 987.90 930.00 16.16 1235.00 382.65 12 937.35TechnoEle&En 260.45 255.35 266.00 266.00 254.25 58.58 362.80 222.00 TegaIndust 421.85 420.20 416.00 424.20 416.00 61.81 767.70 397.00 TejasNetwork 401.15 392.00 400.00 406.80 385.05 382.96 570.90 170.30 TemboGlblInd 173.80 159.40 170.00 170.00 156.45 36.36 334.55 134.00 TeraSoftware 38.70 38.85 38.00 39.50 37.60 22.57 85.00 37.70 38.80Tex.Infra [1] 73.05 72.10 73.05 75.30 70.20 218.62 83.75 50.00 71.50Tex.Pipe 66.05 64.75 64.10 65.95 63.00 138.83 100.90 29.70 11 65.05Tex.Rail [1] 46.75 46.80 46.70 48.95 46.05 7213.51 58.90 25.19 46.55Thanga.Jwl 1137.90 1069.50 1143.60 1147.95 1056.00 15.08 1520.00 627.55 33 1067.70TheAnupEngg 782.85 794.70 770.00 815.00 741.00 17.42 1236.95 576.00 TheInvstTrst 90.45 88.05 87.35 91.70 87.00 8.01 141.15 86.95 TheMandRetVe 13.25 12.80 13.90 13.90 12.60 51.84 25.00 10.91 12.72Themis 795.40 798.75 816.00 816.00 772.60 0.99 1198.80 436.75 12 803.55TheNewIndA [5] 104.75 102.45 101.60 108.40 101.60 281.43 182.90 101.75 18 102.45Thermax [2] 1952.10 1888.35 1923.00 1930.00 1875.20 67.06 2347.00 1288.35 89 1894.25Thiru.Chem [1] 235.70 222.70 229.90 234.20 220.60 852.16 357.25 101.30 13 222.80Thom.Cook [1] 63.50 62.10 63.00 63.20 61.20 341.19 91.35 46.70 62.20ThyrocareTec 736.75 737.70 735.95 750.90 723.05 48.34 1465.90 722.15 26 734.95Tidewater [2] 1031.10 1011.20 1026.00 1030.55 1001.30 13.25 3693.75 924.01 18 1012.10TIL 105.25 101.10 104.70 105.00 98.05 16.70 245.00 97.00 101.10Tilakngr Ind 54.30 51.80 55.40 55.40 51.60 422.88 103.80 34.35 51.95Time Tech [1] 95.50 89.55 94.70 95.20 88.00 1859.40 109.30 63.10 20 89.60Timken 1797.55 1795.40 1806.55 1830.00 1770.05 159.26 2301.65 1226.00 52 1796.65Tinplate 355.60 334.30 349.75 350.95 332.55 364.68 443.15 196.50 10 334.20Tips Ind 1673.25 1627.10 1744.00 1756.90 1591.00 13.21 2620.30 742.25 29 1629.20TirpathiForg 10.10 9.60 10.30 10.30 9.60 144.04 13.95 9.60 Tita.Wag [2] 98.75 100.35 97.00 101.70 96.85 731.63 123.85 47.40 16 100.20TitanCompa [1] 2114.70 2048.55 2102.00 2103.90 2035.55 1362.03 2767.55 1426.00 82 2048.40TN News 187.90 189.50 182.30 193.50 178.40 395.47 226.85 116.30 190.70TN Petro 102.15 100.10 100.20 102.75 98.80 411.15 150.45 84.40 5 100.00Tokyo Pl 90.80 81.70 87.55 89.00 81.05 34.47 130.75 69.75 82.00Tor.Pwr 452.45 438.85 452.45 459.30 430.30 1043.18 606.05 421.75 27 438.65TorrentPhar [5] 2552.90 2504.40 2550.00 2550.45 2484.15 166.18 3304.45 2485.00 40 2503.40TotalTranspt 61.50 59.65 60.00 64.50 58.50 6.22 106.50 38.55 Tou.Fin.Cor 55.25 53.35 55.45 55.45 52.50 90.58 83.30 51.50 6 53.20TPL Plastech 126.60 123.30 125.00 125.20 120.30 6.86 228.30 105.30 14 122.45Trans.Corp [2] 645.65 634.60 627.00 654.65 627.00 61.67 858.00 270.20 20 631.85Tree Hse 7.75 7.80 7.75 8.10 7.50 44.64 13.70 7.32 7.76TrejharaSolu 59.05 56.10 59.90 59.90 56.10 37.42 127.45 34.10 Trent [1] 1045.90 1010.85 1045.00 1045.00 982.85 1433.29 1347.10 753.55 139 1010.25TRF 117.75 111.90 115.00 115.70 111.90 9.08 171.15 95.50 113.00Trib Bhimji 57.85 56.40 58.00 58.80 55.20 96.64 104.40 55.50 22 56.40Trident [1] 48.25 45.85 48.20 48.20 45.85 6312.32 70.90 15.65 31 45.75Trigyn 106.10 100.75 105.00 105.10 99.35 178.75 218.60 80.75 101.05TRIL [1] 30.20 30.40 29.90 31.35 29.10 206.70 46.50 22.00 25 30.35Triv.Eng [1] 268.25 257.45 262.00 262.90 253.05 939.51 374.00 137.10 17 257.55Triv.Tur [1] 172.35 179.15 168.00 183.90 167.85 404.46 231.25 96.35 57 179.25TT 101.55 89.25 96.10 98.00 88.00 102.36 137.00 48.50 13 89.45TTK Prst [1] 779.15 771.25 779.15 803.40 763.55 683.81 1269.60 682.21 37 769.00TTKHealtcare 750.65 742.25 746.95 763.90 727.10 9.50 969.75 567.95 26 736.60TTML 131.80 125.25 126.00 127.45 125.25 1576.29 291.05 12.15 125.15TubeInvIndia 1666.60 1635.00 1650.05 1692.00 1575.05 71.66 2025.00 1081.05 TV Today [5] 357.90 319.25 351.10 364.15 312.65 333.36 460.00 272.55 10 318.20TV18 Br [2] 39.95 41.80 39.00 42.40 38.5525025.49 82.55 33.10 41 41.85TVS Elec 209.60 199.80 208.55 211.95 197.00 91.07 284.40 131.50 23 199.85TVS Mot [1] 620.15 602.25 615.50 619.00 589.05 1947.44 793.45 495.00 31 603.00TVS Sri 1584.40 1545.10 1562.65 1562.65 1510.85 3.28 2588.00 1489.00 17 1541.50
U . . . . . . . . . . . . . . . . . . . . . . . . . . . . . . . . . . . . . . . . . . . . . . . . .UB [1] 1464.05 1456.30 1451.75 1462.95 1416.35 256.95 1793.65 1193.50 106 1455.70Ucal Fuel 110.80 105.45 110.90 110.90 104.45 23.97 206.10 104.90 71 105.40Uco Bk 11.25 11.05 11.15 11.20 10.90 2204.73 15.85 10.91 11.05UdaipurCemen 29.95 30.10 29.10 30.65 28.80 276.50 41.80 25.40 Ufl�ex 575.45 560.50 572.00 572.00 555.00 124.97 719.00 412.00 21 560.80UFO Moviez 96.80 100.35 95.80 102.00 93.70 260.65 138.70 70.75 100.10Ugar Sug [1] 52.85 50.25 50.75 51.80 50.25 515.81 86.50 25.30 15 50.20UgroCapital 152.70 146.55 147.85 152.35 145.00 71.99 230.35 108.55 Ujaas [1] 3.85 3.65 3.70 3.90 3.55 882.49 8.42 2.46 3.65UjivanFinSer 135.85 135.40 134.00 139.10 132.95 482.65 261.70 96.10 135.25UjjivanSFB 16.05 16.10 16.20 16.55 15.50 1879.56 34.40 14.05 UltraTech 6340.20 6185.45 6300.00 6300.00 6077.60 323.73 8267.00 5631.05 25 6190.30UmaExports 55.80 59.90 56.00 65.05 52.25 1417.28 74.90 47.00 UmangDair [5] 60.40 56.80 60.70 60.75 56.50 15.43 99.00 56.45 56.90Unichm Lab [2] 253.70 243.55 255.00 255.00 241.70 35.42 374.90 197.50 243.75Union Bk 34.95 33.75 34.70 34.75 33.50 7742.86 54.80 32.65 4 33.70Uniph.Ent [2] 124.00 126.00 122.10 136.15 121.55 11.97 157.00 92.65 16 126.75United Spr [2] 810.50 791.70 804.90 807.55 781.20 932.17 1019.75 551.75 65 790.60UnitedDrilng 418.25 406.15 410.00 425.00 400.00 27.99 604.85 275.25 Univ.Cab 136.25 134.25 132.35 138.25 132.35 12.38 217.55 131.00 20 134.80UnivastIndia 71.60 72.60 71.50 72.95 66.50 79.18 121.75 38.00 UniversusImg 415.10 386.05 424.55 424.55 384.00 1.63 988.00 180.00 UPL [2] 792.15 764.95 782.00 789.25 753.00 2998.41 864.75 625.00 50 766.35UrjaGlobal [1] 13.80 13.10 13.80 13.80 12.85 2878.69 34.85 5.86 13.15Usha Mar [1] 120.25 120.75 118.80 126.60 113.55 1085.75 164.65 48.15 20 120.75UTIAMC 724.75 715.50 720.00 723.90 691.25 104.65 1216.20 672.00 Utm.G.Stl 4.30 4.10 4.35 4.40 4.10 941.95 9.36 3.56 4.06Utm.Sug 206.05 210.70 201.50 214.00 200.60 187.75 337.30 141.00 8 211.50
V . . . . . . . . . . . . . . . . . . . . . . . . . . . . . . . . . . . . . . . . . . . . . . . . .V Mart 2912.70 2925.95 2900.00 2956.00 2823.05 25.27 4620.00 2560.00 452 2929.40V2 Retail 136.65 123.90 131.60 133.50 123.00 51.54 206.95 101.50 124.20VA T Wab [2] 241.90 236.55 236.05 240.00 233.20 171.33 404.25 233.30 16 236.90Vadilal 1677.10 1698.30 1670.00 1728.10 1650.00 19.96 1850.00 827.30 1697.55VadivrSpeChe 233.60 240.55 236.00 250.00 225.00 9.65 338.00 154.00 Vaibhav [2] 394.85 389.10 393.00 399.00 381.30 116.09 937.90 360.25 54 389.60Vakrang [1] 32.45 31.45 32.30 32.50 31.30 1719.05 54.50 29.00 31.50ValiantOrgan 755.70 712.00 752.00 772.00 700.00 119.33 1848.00 700.00 Vard Text [2] 309.90 318.50 305.00 329.55 297.55 1389.57 576.00 252.30 6 318.15Vard.Acry 52.85 51.70 52.70 53.00 51.00 64.42 321.95 180.50 252.10Vard.Hld 2851.75 2752.40 2800.00 2820.35 2729.95 1.28 4667.55 1978.50 10 2763.05Vard.SPC 225.80 220.65 221.00 226.50 219.05 40.27 309.30 187.70 9 220.90VarrocEngg 350.50 331.25 342.60 347.90 330.00 374.84 493.85 260.00 VarunBevera 1049.40 1064.25 1049.95 1073.95 1035.35 1146.50 1152.75 646.40 82 1062.85Vascon 22.55 22.10 22.00 22.75 21.50 320.76 36.70 15.50 17 22.10Vaswani 18.55 18.20 18.65 19.45 17.60 138.42 38.50 10.51 18.05VaxtexCotfab 35.60 35.05 37.30 37.35 33.85 6147.21 37.35 20.55 Vedanta [1] 325.90 314.25 321.85 325.80 304.2016664.76 440.75 242.60 7 312.35VedantFashn 954.10 943.70 954.10 954.10 917.30 375.42 1143.95 790.20 Venky's 1912.95 1876.15 1912.95 1912.95 1859.35 34.07 3950.00 1790.00 16 1874.40VenusRem 241.65 206.70 232.00 241.25 202.10 340.93 638.50 204.35 4 206.75VerandaLearn 217.20 206.35 206.35 206.35 206.35 47.39 298.20 206.35 VertozAdvtsg 80.15 75.90 76.20 78.95 74.10 38.44 270.00 74.10 Vesuvius 987.90 990.70 989.05 1005.60 965.70 11.40 1362.00 906.00 27 983.30Veto Switch 90.90 87.75 90.95 90.95 87.00 34.65 171.85 78.55 8 88.15VGuard [1] 206.85 203.55 205.50 205.50 199.20 207.73 285.00 181.90 43 203.25VidhiSpclIng [1] 386.60 391.75 378.10 398.00 377.00 116.03 513.60 184.80 33 392.15VijayaDianos 372.40 373.40 372.40 387.00 362.40 59.00 672.00 362.40 Viji Finance [1] 3.70 3.60 3.80 3.85 3.55 304.60 7.02 0.88 3.59VikasEcoTec [1] 3.65 3.50 3.50 3.50 3.50 1677.83 6.90 1.33 3.40VikasLifecre 4.05 3.65 3.85 3.90 3.6512247.20 6.20 2.65 VikasPro&Gnt 1.80 1.70 1.75 1.80 1.70 1521.64 3.30 1.50 Vimta Lab [2] 318.50 338.00 310.00 348.90 310.00 103.45 453.00 215.60 20 336.85Vinati Org [1] 1801.40 1790.95 1776.00 1819.15 1775.10 118.65 2289.55 1562.95 58 1791.50Vindh.Tel 926.35 923.80 904.25 941.00 901.15 5.28 1499.00 842.40 10 921.50VineetLabs 50.70 53.45 53.80 53.80 50.05 21.39 124.00 45.50 Vinyl Chm [1] 265.05 258.50 260.00 264.00 254.50 76.61 330.55 141.00 20 258.60VIP Ind [2] 644.15 602.40 622.00 629.70 596.35 277.15 774.50 332.55 200 602.95Visagar [1] 1.65 1.60 1.60 1.65 1.50 1664.42 3.44 0.68 1.57Visak.Ind 528.95 497.45 522.30 522.30 495.00 38.63 873.55 495.85 7 498.15Visesh.Inf [1] 0.90 0.85 0.85 0.90 0.8521698.91 1.37 0.19 0.85VishalFabric 30.75 31.00 30.55 31.80 29.85 198.91 147.75 27.20 VishwarajSug 19.90 19.40 19.95 19.95 19.20 1011.76 220.00 19.20 Vivi Lab [2] 13.75 13.35 13.25 13.65 13.05 120.93 34.20 13.00 13.45VLS Fin 153.50 143.00 156.80 156.80 140.10 60.75 264.85 95.00 2 143.65Voltamp 1896.80 1794.00 1860.00 1892.05 1729.00 20.04 2255.00 1128.60 16 1783.20Voltas [1] 977.85 949.40 968.00 971.65 935.00 2387.33 1356.90 935.50 54 950.70VRL Logistic 516.65 518.00 519.00 544.90 505.55 452.97 658.80 213.60 32 517.60VST Ind 3170.65 3133.05 3183.00 3183.00 3113.30 5.55 3893.95 2786.00 15 3136.85VST Til 2369.45 2400.10 2353.85 2444.70 2318.00 41.22 3458.45 1721.00 21 2406.00
W . . . . . . . . . . . . . . . . . . . . . . . . . . . . . . . . . . . . . . . . . . . . . . . .Waterbase 82.10 81.05 81.00 83.75 78.25 127.31 145.80 78.25 Wels.Corp [5] 168.65 167.45 166.65 173.25 159.75 916.75 222.00 106.00 12 167.50Wels.India [1] 63.70 66.05 64.60 67.80 62.20 7630.43 170.75 62.30 17 66.05Wels.Inv 265.90 266.70 266.15 284.00 258.25 1.15 587.00 235.60 42 264.40Welspun Ent. 76.35 70.55 75.00 76.35 69.00 166.69 131.00 69.00 13 71.40Wendt 5970.90 5985.00 5912.20 6150.00 5850.00 0.44 7354.05 3250.00 45 5997.00West C Pap [2] 314.35 305.20 314.35 314.35 298.15 159.52 394.95 194.00 11 304.85WestlifeDevp 430.15 415.50 428.00 440.10 402.30 112.51 629.00 402.30 Wheels Ind 565.70 551.40 564.00 564.00 545.00 10.16 1039.00 461.60 17 551.05Whirlpool 1564.55 1559.15 1541.00 1563.10 1515.15 184.58 2549.80 1515.70 74 1559.15Wil.Magor 22.15 20.60 22.00 22.00 20.05 10.63 40.00 16.50 20.65
Win.Diamond[2] 34.50 33.40 33.65 35.00 33.00 73.58 51.60 25.75 16 33.55
WindlsBiotec 218.55 215.80 218.55 220.95 213.00 36.09 452.00 209.30
WinproIndust 4.95 5.40 5.10 5.40 4.85 522.94 13.00 4.70
Wipro [2] 471.90 473.80 468.10 476.00 462.15 7286.50 739.80 462.15 21 473.80
Wockhardt [5] 237.00 230.40 233.00 235.95 228.30 261.96 741.36 228.80 230.20
WonderlaHoli 217.00 211.60 215.00 215.00 206.30 97.36 269.90 181.20 211.50
WorthPeriprl 105.70 102.10 106.00 106.00 101.55 15.90 132.50 54.15
X-Z . . . . . . . . . . . . . . . . . . . . . . . . . . . . . . . . . . . . . . . . . . . . . . .Xchang 71.10 70.80 70.40 71.90 68.65 185.22 141.25 67.10 36 70.90
XelpmocD&T 237.75 221.75 230.10 233.05 216.20 52.82 513.00 216.20
YaariDigiInt 31.90 33.00 31.65 33.55 30.10 285.41 127.70 30.10
Yes Bk [2] 12.85 12.55 12.85 12.85 12.50108927.33 16.25 10.51 12.57
Zee Ent [1] 239.55 236.25 235.00 240.55 233.05 9306.59 378.60 166.80 15 235.90
Zee Learn [1] 6.05 6.30 5.75 6.35 5.75 5507.99 20.70 5.72 6.27
Zee Med [1] 16.50 16.70 16.00 17.30 15.95 3587.54 25.15 8.25 16.70
Zen Tech. [1] 160.25 152.25 152.55 156.90 152.25 561.35 257.70 65.00 152.05
ZensarTec [2] 293.90 305.60 296.00 309.80 290.05 1963.51 587.00 267.65 22 305.50
ZFComVeCtrSy 7500.95 7381.60 7445.00 7589.95 7300.00 13.74 8780.05 6381.00
Zod.Clo 97.40 95.20 96.90 98.70 94.25 39.58 153.80 92.05 95.45
ZomatoLtd 54.20 51.95 53.80 53.90 51.0537338.27 169.00 50.05
ZotaHealthCr 287.65 262.65 286.55 291.30 257.65 94.64 448.00 146.10
Zuari Ag 161.70 155.10 159.00 160.25 152.50 111.78 218.40 93.00 156.55
Zuari Glo 150.80 152.00 150.00 154.90 143.20 120.20 216.85 87.40 9 151.55
ZydusLifescn 331.70 333.40 331.85 335.00 324.10 1263.22 673.70 319.00
ZydusWel 1591.75 1528.75 1565.00 1579.00 1522.00 17.50 2472.85 1431.00 1529.50
Exchange Traded Funds
Company Pre Cl NSE Cl Vol 52 WH 52 WL BSE Cl
Axis Gold [1] 43.99 44.15 72.77 47.00 39.80 44.12
AXISAMC AXISBNKETF 346.85 335.31 6.14 449.40 320.31
AXISAMC AXISBPSETF 10.35 10.34 7.86 12.00 9.06
AXISAMC AXISCETF 65.38 65.03 23.19 81.00 60.00
AXISAMC AXISHCETF 80.23 79.99 2.53 105.00 66.00
AXISAMC AXISNIFTY 172.86 171.44 15.38 212.22 151.20
AXISAMC AXISTECETF 326.95 307.25 5.30 437.10 251.95
Bank BeEs [1] 348.50 338.19 1811.26 420.43 322.40 338.14
Birla Gold 46.66 46.62 4.70 50.96 41.90 46.69
Birla Nifty [100] 18.00 17.63 64.69 5020.95 4191.00 4694.00
BIRLASLAM ABSLBANETF 34.69 33.33 13.23 415.21 29.00
BIRLASLA ABSLNN50ET 39.63 38.62 8.15 520.00 34.00
BIRLASLAMC BSLSENETFG 51.91 50.84 2.52 664.99 43.65
BIRLASLAMC HEALTHY 7.78 7.70 16.12 10.41 7.00
BIRLASLAMC SILVER 63.43 62.31 134.74 78.50 62.23
BIRLASLAMC TECH 30.00 30.14 4.21 43.75 29.80
ConsConstCon 131.17 129.33 454.84 157.90 110.90
DSPAMC DSPN50ETF 162.75 159.52 6.06 184.00 156.50
DSPAMC DSPNEWETF 185.17 181.77 7.39 209.85 158.90
DSPAMC DSPQ50ETF 153.77 152.24 8.96 189.00 151.01
DSPBRAMC QUIDETF 999.99 1000.00 18.79 1020.00 805.90
EDELAMC BBETF0432 985.30 984.59 3.41 1156.00 976.11
EDELAMC EBANK 3717.99 3708.78 0.01 4398.00 3308.30
EDELAMC EBBETF0423 1167.70 1166.89 3.22 1187.95 1083.37
EDELAMC EBBETF0425 1060.03 1060.08 4.92 1170.00 1005.00
EDELAMC EBBETF0430 1171.66 1171.63 2.69 1247.90 1100.00
EDELAMC EBBETF0431 1042.97 1043.55 6.80 1143.10 1030.00
Gold BeEs [1] 44.06 44.02 2448.61 47.00 39.69 43.96
Goldmanamc CPSEETF 34.49 33.92 1321.66 38.00 24.52 33.84
HangSengBees [1] 303.11 297.11 3.43 374.00 243.00 297.13
HDFC Gold [1] 45.19 45.11 433.30 50.00 40.72 45.12
HDFCAMC HBANKETF 346.29 337.95 5.70 419.95 305.90
HDFCAmcNift [76] 173.54 170.33 139.01 202.00 155.00 170.43
HDFCAmcSens 583.23 573.45 18.46 704.92 487.40
IBULLSAMC IBMFNIFTY 175.61 169.67 0.53 200.00 142.95
ICICIPRAMC BHARATIWIN 47.11 46.29 991.79 52.60 34.70
ICICIPRAMC ICICI500 22.92 22.69 74.14 283.80 22.25
ICICIPRAMC ICICI5GSEC 50.28 50.56 0.24 51.15 50.00
ICICIPRAMC ICICIALPLV 157.45 155.33 162.38 197.60 143.06
ICICIPRAMC ICICIAUTO 103.88 101.49 413.29 124.40 92.90
ICICIPRAMC ICICIBANKP 173.91 167.85 27.04 227.70 161.60
ICICIPRAMC ICICICONSU 65.88 64.99 11.33 82.25 57.01
ICICIPRAMC ICICIFMCG 372.18 366.83 5.23 437.00 338.00
ICICIPRAMC ICICILIQ 999.99 999.99 44.91 1058.36 971.50
ICICIPRAMC ICICIM150 103.51 101.59 45.98 132.70 92.30
ICICIPRAMC ICICINXT50 39.59 38.96 153.40 50.97 33.20
ICICIPRAMC ICICIPHARM 78.04 77.10 10.07 105.00 71.99
ICICIPRAMC ICICISILVE 63.29 62.37 389.80 79.50 62.25
ICICIPRAMC ICICITECH 308.04 304.10 357.11 419.70 253.05
ICICIPRAMC IPRU5008 344.99 334.52 455.12 449.70 297.20
ICICIPRNIFLWVL30ETF 45.19 45.05 879.79 51.60 37.10
ICICIPRNIFLWVL30ETF 92.91 92.59 30.21 117.95 77.10
ICICIPRUDENTIALNV20ETF 90.33 89.44 37.83 112.10 69.30
ICICIPRUDNIFTY100ETF 178.57 174.97 37.15 208.00 143.40
ICICIPRUDNIFTYETF 174.01 170.90 697.74 231.30 151.50
ICICIPRUDSENSEXETF 592.05 579.86 13.71 700.00 522.00
IDBI Gold [100] 4663.00 4700.60 0.05 5020.95 4191.00 4694.00
IDFCAMC IDFNIFTYET 169.69 166.45 3.25 223.00 150.10
Infra BeEs 498.69 488.96 7.69 2050.00 1514.00 1660.00
InvesIndGold [100] 4608.60 4608.85 0.14 4946.00 4111.00 4573.00
InvesInNifty 1764.90 1773.26 0.09 2319.00 1559.00
Kotak Nifty [5] 171.62 167.80 238.47 2252.45 1627.25 1761.20
Kotak PSU Bk 248.65 237.66 31.48 305.25 212.00 237.95
KOTAKMAMKOTAKALPHA 28.86 27.98 469.72 41.00 27.90
KOTAKMAMC KOTAKIT 30.62 30.24 79.01 46.00 24.00
KOTAKMAMKOTAKLOVOL 12.34 12.00 9.99 15.00 10.50
KOTAKMAMKOTAKMID50 75.65 73.35 3.80 91.00 71.65
KOTAKMAMCKOTKBKETF 350.10 337.00 517.27 429.70 298.90
KOTAKMAMCKTNV20ETF 92.24 91.05 26.10 106.80 79.36
Kotal Gold [1] 44.15 44.06 180.01 46.98 40.05 44.08
LICNAMC CNFENGP 177.47 172.19 8.20 202.99 162.60 172.34
LICNAMC CNFESGP 580.71 572.66 0.56 677.40 522.14
LICNAMC CNFNHGP 173.37 170.59 6.48 230.00 151.23
LICNAMC CNMFET 21.81 21.97 3.99 26.94 19.00
Liquid BeEs [1000] 999.99 1000.00 2744.20 1015.00 971.00 999.99
MIRAEAMC MAESGETF 27.30 26.71 31.24 32.70 24.53
MIRAEAMC MAFANG 40.03 38.47 807.88 69.00 38.01
MIRAEAMC MAFSETF 15.94 15.44 1103.80 21.00 15.04
MIRAEAMC MAHKTECH 13.17 12.95 209.87 23.00 11.44
MIRAEAMC MAM150ETF 10.27 10.05 172.35 13.55 9.98
MIRAEAMC MAMFGETF 74.45 72.93 2.99 95.00 72.51
MIRAEAMC MAN50ETF 167.35 163.67 62.65 210.80 147.03
MIRAEAMC MANXT50 389.47 378.65 4.67 530.18 354.31
MIRAEAMC MASPTOP50 26.78 26.80 134.92 37.00 23.10
MOTILOS MIDCAP100 ETF 28.90 28.41 203.26 36.65 25.53
MOTILOS NASDAQ100 ETF 103.99 101.35 931.23 1046.70 95.80
MOTILAL OSWAL M50 ETF 161.51 157.90 6.32 194.00 142.00
MOTILALAMC G5 48.50 48.49 0.57 59.05 40.01
MOTILALAMCMOLOWVOL 108.75 105.97 0.21 129.00 105.15
MOTILALMOMOMENTUM 177.70 172.97 17.92 225.34 171.05
MOTILALAMC MONQ50 49.80 47.23 60.42 78.00 45.00
NiftyBeEs [1] 175.34 171.72 12227.81 201.00 156.44 171.63
NiftyJrBeEs [1] 408.39 398.34 431.92 473.00 373.77 398.74
NIPINDETFCONSUMPTION 71.36 70.45 18.30 86.00 60.36
NIP IND ETF DIV OPP 43.30 43.43 11.73 51.20 36.30
NIP IND ETF ETF NV20 93.18 91.83 17.46 118.00 80.20
NIP IND ETF IT 30.88 30.64 1982.98 41.08 25.75
NIPINDETFLONGTER GILT 21.87 21.88 5.58 25.80 20.80
NIP IND ETF MIDCAP 150 104.51 102.25 357.22 140.00 82.51
NIP IND ETF NIFTY 100 169.78 165.92 16.54 219.40 146.68
NIPPON INDIA NIMFXX 107.00 106.00 4.83 109.25 104.30
NIPPONAMC NETFAUTO 104.44 102.71 13.79 120.75 92.01
NIPPONAMNETFPHARMA 12.63 12.49 353.22 17.44 12.36
NIPPONAMC NETFSILVER 61.36 59.99 2005.99 74.00 59.44
PSU Bk BeEs [1] 27.66 26.33 2147.76 34.11 23.52 26.38
Qgold [2] 43.81 43.77 44.71 46.82 39.58 43.78
Qnifty 1694.00 1657.05 3.26 2050.00 1514.00 1660.00
RELCAPAMC NETFGILT5Y 49.24 48.99 74.64 59.40 41.99
RELCAPAMCNETFSDL26 105.92 105.82 39.65 124.00 100.93
SBIAMC SBIETFCON 66.22 65.16 24.28 77.31 58.55
SBIAMC SBIETFIT 308.51 302.80 27.45 428.70 256.00
SBIAMC SBIETFPB 175.30 171.51 8.03 222.00 163.75
SBIAMC SBIETFQLTY 140.32 138.77 22.77 164.98 124.10
SBIAMC SETF10GILT 199.25 199.46 0.02 239.00 184.70
SBIETF Gold 45.26 45.27 513.05 4404.25 42.00
SBIETF NIFTY 50 165.44 162.70 2032.32 196.54 141.00
SBIETF NIFTY BANK 345.32 335.33 482.11 420.00 316.20
SBIETFNN50 403.61 395.13 61.75 476.00 363.80
Sharia BeEs 403.94 402.42 1.78 518.00 362.11 397.75
TATAAML NETF 168.45 165.56 4.98 222.68 160.10
TATAAML NPBET 176.10 174.56 0.96 228.89 165.30
TATAAML TNIDETF 55.87 54.61 8.68 77.00 54.25
UTI Gold [1] 43.80 43.85 98.78 47.30 40.25 43.84
UTIAMC UTIBANKETF 34.78 34.33 10.36 45.00 31.99
UTIAMC UTINEXT50 40.68 40.10 31.80 49.50 36.05
UTIAMC UTINIFT 1709.55 1669.79 10.81 2240.00 1505.60
UTIAMC UTISENS 570.14 560.32 4.11 737.55 487.50
UTIAMC UTISXN50 47.48 46.11 1.96 59.00 39.40
*: Closing price is the average of trade price(s) for the last half an hour;52Week High/Low fi�gurespertain to BSE.
Shares of face value other than ₹�10 is indicated in brackets immediately following the name of thecompany.
Qty (No of shares traded) is denoted in thousands.
The PE(priceearnings multiple) of each stock is based on the latest declared earnings.
The PE computation takes into account the per share earnings of each company for the latest 12months.
BSE Stocks
A.Sarabhai 31.20 30.05Aarey Drugs 37.40 36.55Aarnav 45.80 44.30Aartisurf 691.45 667.75Abslamc [5] 486.10 482.35Aci Infocom [1] 2.38 2.27Acrycil Ltd. [2] 631.55 633.30Ador Fontech[2] 68.90 67.95Advikca [1] 3.32 3.16Agstra 99.90 97.20Aiil [1] 136.45 130.00Aimco Pesti. 122.75 112.05Ajanta Soya 267.85 254.50Alu Fluoride 293.10 279.45Amines&Plast [2] 97.70 93.35Amiorg 954.60 898.70Amrawor Agr[1] 1.43 1.36Anandrathi [5] 622.10 611.60Andhra Petro 97.25 95.50Andrew Yule [2] 22.40 22.10Ang 220.20 221.30Angelone 1370.20 1337.50Anuh Pharma[5] 90.25 90.35Anupam [1] 2.73 2.55Anuras 809.10 783.15Apollotri [2] 822.25 791.65Aptus [2] 297.40 282.75Arcfi�n [1] 1.80 1.71Architorg 40.55 43.05Arihant Cap. [1] 81.10 77.55Artson Eng [1] 72.85 69.25Ashirwa Cap [1] 5.71 5.43Asian Tea 16.05 15.60Asianene 90.90 86.85Asm Technolo 491.00 466.45Asrl 96.20 94.40Asso.Alcohol 449.75 445.45Avantel Ltd 1168.15 1110.70Awhcl [5] 250.45 246.05Bajaj Steel [5] 545.50 583.00Bajajhcare [5] 310.30 293.70Balmer La.In 367.40 363.45Baluforge 94.15 87.70Banas Fin. 38.85 36.95
Barbeque [5] 986.80 982.30Baroda Extr. [1] 3.93 3.79Basant Agro [1] 19.70 18.55Bclenterpr [1] 3.09 2.94Bcpl 41.05 39.40Bectorfood 292.30 287.55Bengla& Asm 2322.90 2197.50Bestagro 842.80 777.35Bfl�afl� 99.75 94.80Bgjl 17.55 16.75Bhatia [1] 24.80 23.60Bilcare Ltd. 64.70 62.40Birla Pretec [2] 25.30 24.10Birlatyres 12.85 11.60Blackrose [1] 187.05 182.95Bls Infote [1] 5.69 5.97Boroltd [1] 308.75 307.60Campus [5] 348.40 339.90Cams 2265.85 2196.80Captain Poly [2] 17.55 17.50Cartrade 613.00 592.40Ceinsystech 162.85 151.90CgVak Softw 258.50 236.60Chamanl Se [2] 99.80 106.65Chandra Prab 232.95 227.55Charterlogis [1] 6.06 5.91Chemcon 271.70 269.25Chemcrux 185.80 173.50Chemplasts [5] 500.30 483.95Cheviot Co. 1136.95 1100.50Choice Int. 311.50 305.50Clean [1] 1762.15 1720.95Cmsinfo 241.25 234.00Coast Corp 312.75 306.10Cockerill 1411.60 1261.80Cosmo Ferr. 563.35 535.45Craftsman [5] 2208.70 2162.95Cressanda So[1] 40.00 38.00DaiIchi Kar 316.45 279.75Danube [2] 54.35 51.65Datapattns [2] 674.00 662.50Deccangold [1] 23.35 23.20Decipher 41.15 39.10Deep 211.20 204.60
Deepak Spinn 249.75 242.15Deepind 217.65 216.70Devyani [1] 152.90 151.45Dhanlxmi Fab 115.00 120.75Dhanvarsha [2] 86.65 82.90Dharamsi Chm 349.00 331.05Diamines&Chm 283.50 296.55Dspnewetf 185.24 181.04Dspq50etf 153.47 151.75Dynamic 110.80 105.30Earum [2] 4.93 4.70Easemytrip [2] 357.65 341.25Ecoreco 102.70 100.50Elantas 3852.85 3835.70Elegant Flor 21.25 20.20Equitasbnk 53.65 54.90Eurekaforbe 301.65 299.35Everest Org. 174.65 159.30Evexia [2] 4.82 4.58Facor Alloys [1] 6.52 6.20Fairchemor 1366.00 1390.10Faze Three L 316.40 303.30Filat Fash [5] 7.15 7.11Finopb 268.80 258.30Foods & Inns [1] 70.90 67.60Forbes & Co 360.40 387.30Force Motr 1013.55 1004.90Fredun 919.45 902.30G.V.Films [1] 0.94 0.89Galactico 122.85 126.30Ganesh Benz [1] 109.95 104.75Garmntmntr 77.25 70.60Gateway 72.55 71.70Gennex Lab [1] 6.42 6.38Genpharma [1] 5.16 5.15Ggeng [2] 5.01 4.92Gitarenew 174.20 165.60Gland [1] 2893.90 2846.85Gls [2] 436.25 432.15Gmrp&Ui [5] 28.55 27.15Gocolors 941.10 924.35Golden Lami [5] 858.90 864.85Goodyear (I) 878.20 857.85Goyal Asso. [1] 1.78 1.71
Grauer& Weil[1] 62.70 63.00Greenpanel [1] 495.95 487.00Grinfra [5] 1469.50 1433.55Grwrhitech 606.80 598.90Guj.Themis. [5] 404.05 386.25Haldyn Glass [1] 40.85 38.05Hansugar 6.94 6.83Happstmnds [2] 892.10 862.10Hariompipe 193.80 191.90Hawkins Cook 5151.20 5161.40Hemiprop 102.75 102.05Heranba 572.25 564.30Hfi�l 20.35 19.50High Energy 1402.20 1303.25Hind Alumin 38.05 35.05Hitech 542.10 518.80Hleglas 4205.55 3981.95Homefi�rst [2] 732.20 756.50Hpal 358.65 348.50Iciciauto 104.56 101.60Icicilovol 131.97 129.39Icicisensx 592.83 580.65Iifl�sec [2] 76.95 75.75Iifl�wam [2] 1576.65 1529.70Ind.Acrylics 12.35 12.31Indiamart 4330.35 4217.55Indian Info. [1] 3.95 3.76Indian Sucro 61.25 60.65Indigopnts 1410.30 1402.65Indo Amines [5] 97.15 93.55Indoboraxc [1] 128.10 129.70Indovation 26.15 27.45Indrayani Bi 30.25 30.35Indsil Hyd 77.30 78.80Int.Conveyor [1] 68.70 65.80Integra Tele 18.20 17.55Inter St.Fin [1] 8.90 8.46Ion Exchange 1691.75 1658.65Ipl [1] 246.20 242.30Ircon [2] 38.95 38.65Irctc [2] 657.85 620.75Irfc 21.40 21.15Isec [5] 479.10 471.80Isgec [1] 533.20 515.50
Ishan Dyes 115.50 115.10Isw Ltd [1] 3.10 2.79Jasch Indust 145.25 136.30Jaykay [1] 63.70 60.60Jct Ltd [2] 3.74 3.37Johnpharma [1] 1.01 0.96Jtl Infra [2] 214.50 216.40Jublingrea [1] 435.70 422.00Jyoti Resins 2014.80 1914.10Kacl [1] 91.25 86.70Kallam [2] 17.20 16.00Kalyankjil 63.75 61.50Kanchi 661.25 662.70Kcp Sugar In [1] 24.25 23.80Kennametal 1707.30 1765.40Khaitan Che [1] 102.70 97.60Khoobsurat [1] 2.95 2.81Kilpest (I) 333.80 343.35Kims 1249.70 1231.55Kirl.Ferrous [5] 218.20 208.60Kirlosar Pn [2] 419.30 400.40Kkalpanaind [2] 34.60 31.45Kmc Shil [1] 57.10 59.30Kotakbketf 352.00 336.90Kotaknifty 171.25 168.09Kpel 157.55 152.40Kpigreen 404.90 424.55Kpittech 484.40 479.65Kranti 57.25 54.45Kriti Nutri [1] 62.95 59.20Krsnaa [5] 546.95 526.70Lancer 202.60 190.80Latentview [1] 388.00 394.85Latimmetal 173.45 168.90Lee&Nee Soft 11.53 10.47Lkpsec [2] 14.90 13.60Lodha 895.55 880.25Luharuka [1] 2.84 2.70Lxchem [2] 357.15 342.15Madhavipl [1] 4.68 4.34Madrasfert 43.00 42.50Mafang [40] 40.10 38.61Mafsetf 15.99 15.48Maha Corp [1] 1.35 1.26
Mahktech 13.32 13.01Mangalam In[1] 4.75 4.52Manorama 1038.30 1032.95Manorg 727.80 759.15Manyavar [1] 953.75 944.40Mapmyindia [2] 1166.35 1169.25Maris Spin. 108.40 97.65Maxhealth 357.35 353.75Mazdock 268.55 264.45MediaMatrix [1] 9.74 9.51Medplus [2] 816.55 792.45MenonPiston[1] 42.45 41.20Metrobrand [5] 526.45 515.30Mfl� 1217.45 1178.25Mfl� India [1] 1.20 1.09Mid India In 30.05 31.55Minaxi Text. [1] 2.77 2.54Mishtann [1] 22.85 22.05Mitsu 286.90 276.75Mkexim 77.90 71.70Modison Met[1] 64.00 60.55Mol [1] 118.40 114.40Monarch 286.95 282.10Moschip [2] 50.40 45.60Mstc 290.20 289.25Msumi [1] 63.05 60.75Mtartech 1436.50 1373.15Mul [1] 3.83 3.79Nat.Peroxide 1635.40 1591.25Natural Caps 466.30 467.35Navkar 77.90 80.35Nazara [4] 1151.25 1096.55Ncl Research [1] 1.19 1.12Ndrauto 385.25 363.35Neogen 1479.30 1496.30NglFine Chm [5] 1857.60 1871.95Nilaspaces [1] 4.23 4.65Nirlon 380.55 375.30Nitta Gela 325.15 315.70Nureca 1048.85 968.05Nuvoco 308.05 304.55Nykaa [1] 1271.95 1288.35Oal [5] 562.45 507.95Obcl 130.00 123.50
Ok Play (I) 34.70 35.65Ontic 22.00 17.60Orientelec [1] 310.55 314.10Osiajee 52.45 49.85Pan India C 3.86 3.68Panafi�c [1] 1.93 1.84Panth 24.85 26.05Paras 595.60 575.90Parleind 8.14 7.69Parnaxlab 114.90 116.00Pas.Acrylon 35.95 34.95Paushakltd 9418.55 9435.65Paytm [1] 530.85 515.65Piccadily Ag 32.10 32.80Pix Trans 868.15 834.70Pmcfi�n [1] 3.84 3.65Policybzr [2] 590.85 548.90Polycab 2432.15 2427.65Powerindia [2] 2920.35 2861.75Ppl 173.10 164.25Princepipe 626.15 627.55Prismx [1] 5.35 5.11Pun.Alkali [2] 77.75 71.50Quadrant [1] 2.10 2.00Quest Softec 18.42 17.50Quint 322.05 300.40Raclgear 568.85 589.55Radhikajwe 190.80 183.25Radiocity [2] 23.35 22.90Raghuvir Syn[1] 151.70 144.15Railtel 94.55 92.95Rainbow 484.80 462.55Rajoo Engin. [1] 32.10 30.85Ram RatWire[5] 186.95 181.05Rama Phosph 359.45 345.45Raminfo 114.35 111.00Rategain [1] 317.60 308.20Rba 90.75 87.40Rel.Chemotx 206.60 194.75Relhome 3.56 3.25Resonance 144.65 136.20Rexnord Ele. 59.25 55.85Rlfl� [1] 2.19 2.29Rolexrings 1144.60 1159.45
Rossari [2] 861.15 870.90Roto Pumps [2] 413.70 410.30Route 1399.45 1372.65Rubfi�la Int. [5] 81.05 79.70Ruttonsha In 239.30 216.10Rvnl 31.20 30.50S.I.Paper 151.60 145.05Saboo Sodium 20.20 19.10Sacheta Met. 22.40 22.45Sadhana Nitr[1] 117.80 113.15Sahya Indu 459.75 452.95SaintGobain 75.00 73.05Sanduma 3213.05 3044.65Sankhya Info 19.72 18.74Sansera [2] 697.35 697.80Sapphire 1094.95 1041.80Satia [1] 116.85 113.10Sauras.Cem. 60.50 59.80Sbc [1] 5.72 5.44Sbicard 748.45 736.10Sbisensex 573.47 562.00Scanstl 42.25 42.50Seacoast [1] 6.67 6.21Setfnif50 165.67 162.92Sgrl 269.55 266.65Sha Eng Pla 1703.10 1589.10Sharika [5] 13.20 12.55Sharp Inv [1] 2.18 2.08Shil [2] 305.15 291.65Shilchar Tec 536.75 523.30Shiv.Bimetal [2] 387.10 392.45ShivCement [2] 46.00 46.15Shivalik [5] 814.30 756.70Shreeganes [1] 3.32 3.10ShrJagdamb [1] 805.85 795.95Shrirampps 63.45 61.40Shyammetl 302.00 299.70Sigachi 255.00 255.90Sinclair Hot [2] 99.30 89.20Singer India [2] 48.00 45.30Sisl 1240.80 1169.65Sjs 383.80 381.45Smcglobal [2] 81.40 79.50Smgold 86.80 83.30
Whiteorg 11.55 11.06Windlas [5] 218.55 215.50Winpro [5] 5.02 5.48Xelpmoc 238.75 222.05Xtglobal [1] 45.10 42.85Yashpakka 80.95 78.85Zeal [1] 7.69 7.35Zenith Healt [1] 6.12 6.14Zenotech 49.45 50.10Zomato [1] 54.20 52.00
Group T
Awl [1] 612.40 581.80Bh.Immun&Bio 29.50 28.05GrmOverseas [2] 399.55 379.60Lloyds Met E [1] 169.35 160.90Raj Glo Wir [2] 640.80 618.15Sindhu Trade [1] 90.80 93.30Sintexplast [1] 6.69 6.36Sportking 1012.90 991.55Yasho 1454.00 1381.30
Utinext50 [1] 40.75 39.59Utique 5.46 5.50Utlinds [1] 4.38 4.12Valiantorg 759.60 713.45Vama Inds [2] 8.72 8.29Varroc [1] 350.30 331.65Vedavaag 47.50 48.45Vijaya [1] 371.95 373.25Vikaslife [1] 4.02 3.67Vikasprop [1] 1.77 1.70Vikram Therm 249.70 56.80Vipulorg 167.65 162.00Virinchi 34.15 34.50Virtual Glo [1] 1.49 1.42Visagar Fin [1] 1.85 1.80Vishal [5] 30.85 31.10Vishwaraj [2] 19.90 19.45Waareertl 302.05 294.50Wardinmobi [1] 62.40 60.75Waterbase 82.25 81.90Welsplsol [6] 15.40 14.90Westlife Dev [2] 430.55 411.60
Tejasnet 401.10 392.00Tgvsl 83.00 78.85Thinkink [5] 61.15 63.30Tiger Logs 203.00 218.25Tiindia [1] 1664.65 1632.70Tilak [1] 10.48 9.96Timex Group [1] 58.65 56.85Tineagro 22.05 20.95Tinnarubr 330.15 313.75Titan Biotec 238.55 231.60Titan Secur. 17.10 15.70Toyamind [1] 12.45 11.85Transpek 1634.00 1613.35Triveni Ent [1] 11.97 11.99Tuni Textile [1] 3.04 2.89Udaip Ceme [4] 29.65 30.15Ultracab [2] 25.20 24.40Ultramarine [2] 334.65 320.85Umaexports 55.80 59.90Unison 28.35 25.85United Drill 418.90 407.55Utiamc 724.25 714.85
Smlt 105.10 101.55Solara 442.45 448.85Sonacoms 563.85 568.00Spandana 384.35 384.60Spel Semicon 58.40 55.50Spencer [5] 75.55 73.05Spicejet Ltd 48.60 47.25Srd 320.60 307.45Srestha [2] 1.47 1.46Sri Digv Cem 63.55 61.70Starhealth 683.85 646.70Starhfl� 115.85 115.35Steel Exch 166.75 158.50Stovekraft 562.60 554.90Sukjit Strch 458.15 437.15Sulabh Eng. [1] 8.89 9.33Sumichem 412.10 411.85Sunil Health 78.30 82.10Sunshield Ch 568.75 511.05SuperTanner [1] 6.50 6.68Supriya [2] 337.75 322.90Surat Text. [1] 13.36 12.70Suryoday 127.85 122.85Suvenphar [1] 536.00 515.75Suvidhaa [1] 6.75 6.24Svartcorp [1] 5.15 5.08Svpglob [1] 45.85 43.05Swasti Vinay [1] 6.86 6.47Swissmltry [2] 22.80 21.70Swsolar [1] 320.45 321.35Sxetf [250] 584.25 573.76Synco Form. [1] 8.45 8.53Taalent 1763.35 1673.25Tamboli Cap 90.65 85.55Taneja Aero. [5] 111.15 105.50Tarc [2] 39.05 38.35Tarsons [2] 620.35 607.30Tata Yodogaw 108.55 99.10Tatia Glob [1] 2.73 2.49Tatva 2082.90 2063.95Tcnsbrands [2] 713.40 691.05Tcpl Pack 669.70 679.40Technoe [2] 261.70 257.20Tega 421.30 419.05
Ruchi Inff [1] 8.95 8.55SadbhavInfra 9.15 8.90SintexPlast 6.65 6.35SITINetworks 2.20 2.10SomDist&Bre[5] 56.70 56.05Super Spn [1] 11.35 11.45SupremeEngg 2.60 2.65TheBykeHospl 35.75 35.30TN Tele 9.05 9.50VaishaliPhar 75.00 71.85VIPClothing [2] 24.05 22.85VishnuChem 1388.20 1320.15Walch.Ind [2] 49.90 47.45Webel SL 98.70 93.85Xpro India 1126.85 1081.50ZodiaEnergy 101.25 96.20
GravitaIndia [2] 282.35 268.55GSS Info 196.50 193.80GujratFlrChe 2200.20 2263.20HindNtGls&I [2] 14.90 14.20Hubtown 56.00 53.25IceMkeRefrid 90.60 88.10Jind.World [1] 285.60 276.80JITFInfraLog [2] 143.60 136.75Kanani Ind [1] 32.55 33.35KapstonFacil 152.55 151.10MadhavCopper 27.35 26.05Nah.Spg [5] 435.95 414.20PeninsulLand[2] 11.00 10.45PVP Ven 4.95 5.05RajratnGlbWr 636.80 618.50RoltaIndDep 4.85 4.65
AdaniWilmer 612.40 581.80AjrInf&Toll 1.90 1.85AnsalPro&In [5] 14.25 13.90Archies [2] 17.55 16.70AurumProptec 88.85 87.65Auto Stamp 440.70 418.70Autoline 58.15 55.25BAG Films [2] 6.05 5.75BclIndustrs 380.15 361.15BigblocCon [2] 95.25 90.50BrightcomGr [2] 65.20 61.95DB Realty 63.65 60.50ExcelRealNIn 5.60 5.35Genesys [5] 487.75 475.60GodhaCarbon 15.85 15.10GokulAgroRe[2] 107.10 101.75
Company Pr Cl Cl Company Pr Cl Cl Company Pr Cl Cl Company Pr Cl Cl Company Pr Cl Cl Company Pr Cl Cl Company Pr Cl Cl Company Pr Cl Cl
Company Pr Cl ClCompany Pr Cl Cl
Company Pr Cl Cl
Company Pr Cl Cl
Company Pr Cl Cl Company Pr Cl Cl Company Pr Cl Cl
NSE Trade for Trade
Related Documents


![Switching Surges Handout[1]](https://static.cupdf.com/doc/110x72/5439dc86afaf9fbd2e8b5532/switching-surges-handout1.jpg)


