Association of hygienically relevant microorganisms with freshwater plankton Dissertation zur Erlangung des akademischen Grades eines Doktors der Naturwissenschaften – Dr. rer. nat. – vorgelegt von Miriam Tewes geboren in Duisburg Biofilm Centre, Aquatische Mikrobiologe der Universität Duisburg-Essen 2012

Welcome message from author
This document is posted to help you gain knowledge. Please leave a comment to let me know what you think about it! Share it to your friends and learn new things together.
Transcript
Association of hygienically relevant microorganisms
with freshwater plankton
Dissertation
zur Erlangung des akademischen Grades eines
Doktors der Naturwissenschaften
– Dr. rer. nat. –
vorgelegt von
Miriam Tewes
geboren in Duisburg
Biofilm Centre, Aquatische Mikrobiologe
der
Universität Duisburg-Essen
2012

ii
Erklärung
Hiermit versichere ich, dass ich die vorliegende Arbeit mit dem Titel
„Association of hygienically relevant microorganisms with freshwater plankton”
selbst verfasst und keine außer den angegebenen Hilfsmitteln und Quellen benutzt
habe, und dass die Arbeit in dieser oder ähnlicher Form noch bei keiner anderen
Universität eingereicht wurde.
Essen, im Dezember 2012
Gutachter: Prof. Dr. Hans-Curt Flemming
Prof. Dr. Bernd Sures
Tag der Disputation: 13.02.2013

iii
Die vorliegende Arbeit wurde von der Deutschen Forschungsgemeinschaft (DFG)
gefördert und im Zeitraum von Januar 2009 bis Dezember 2012 im Arbeitskreis von
Prof. Dr. Hans-Curt Flemming am Biofilm Centre der Universität Duisburg-Essen
durchgeführt.

iv
Für meine Eltern

v
“The role of the infinitely small in nature is infinitely great.”
― Louis Pasteur

vi
Danksagung
“Was aus Liebe getan wird, geschieht immer jenseits von Gut und Böse!” Friedrich Nietzsche (Jenseits von Gut und Böse, Aph. 153)
Mein besonderer Dank gilt meinem Doktorvater Herrn Prof. Dr. Hans-Curt Flemming, der mir
ermöglichte diese Arbeit am Biofilm Centre in der Aquatischen Mikrobiologie zu verfassen.
Danke für Dein Vertrauen, Deine Begeisterungsfähigkeit und die Möglichkeit mich
wissenschaftlich ausleben zu dürfen.
Auch möchte ich mich herzlich bei Herrn Dr. Jost Wingender bedanken, der immer gute
wissenschaftliche Ideen und Ratschläge parat hatte. Vielen Dank für die anregenden
Diskussionen und Tipps und auch sonst die netten Gespräche.
Den Mitarbeitern der Hydrobiologie Universität Duisburg-Essen, Dr. Christian K. Feld und
Henrike Hamer, danke ich für die Unterstützung bei den Probennahmen auf dem
Baldeneysee und die Bestimmung der Planktontaxa.
Mein weiterer Dank gilt meinen „Mitbewohnern“ im Büro, für die unfassbar schöne
Atmosphäre, die lustigen Momente, vielen Scherze, die aufbauenden Gespräche und
endlosen Diskussionen. Ohne Euch Mädels und Jungs wäre mein „Diss-Alltag“ sehr langweilig
gewesen. Danke an Zenyta Dwidjosiswojo, Janine Wagner, Jasmine Hanke, Jan Frösler und
Giacomo Bertini – ich werde Euch vermissen!
Ich danke allen Mitarbeitern der Aquatischen Mikrobiologie für die schöne Atmosphäre und
Unterstützung. Besonderer Dank gilt meinem Hiwi Philip Eickenbusch, der „Floh-Pflege-Vati“,
für die Pflege meiner Daphnien-Kulturen und Felicitas Dudziak für die gute Zusammenarbeit.
Meinen Freunden gebührt ein Riesen-Dank! Ihr habt meine „Launen“ ertragen, mich endlos
motiviert und immer an mich geglaubt. Ihr habt mit mir gefeiert, gelacht und geweint.
Ihr seid absolut die Größten! Katrin Weidmann, Simon Knur, Jennifer Weidmann, Kathrin
Bemmann, Nanni Noël, Zenyta Dwidjosiswojo, Stefan Tummes, Nicole Zajac, Jennifer Hardes,
Danica Behrends. Ich bin froh, dass es Euch gibt!
Mein allergrößter Dank gilt meiner Oma Margret Tewes, meinem Opa Hans Tewes (†) und
meinen Eltern Marion und Sigi Tewes! Danke, dass Ihr zugelassen habt, dass ich zu dem
wurde was ich bin! Ihr habt mich all die Jahre wie es nur ging unterstützt und niemals an mir
gezweifelt, danke für Euer Vertrauen und Eure Liebe! Ohne Euch hätte ich das alles niemals
geschafft!
Last but not least - möchte ich mich von ganzem Herzen bei meinem Freund Stephan
Lämmel bedanken. Du hast an meine Fähigkeiten geglaubt, mich immer wieder motiviert
und machst mein Leben einfach jeden Tag aufs Neue so viel bunter und aufregender!
Mein letztendlicher Dank gilt natürlich allen Wasserflöhen!

vii
Glossary
CFDA carboxyfluorescein diacetate
cfu colony forming units
CTC 5-cyano-2,3-ditolyl tetrazolium chloride
DAPI 4’,6-diamidino-2-phenylindole dihydrochloride
DNA deoxyribonucleic acid
DVC direct viable count
EDTA ethylene diamine tetra-acetic acid
EPS extracellular polymeric substances
FDA fluorescein diacetate
FISH fluorescence in situ hybridization
HPC heterotrophic plate count
PBS phosphate buffered saline
PCR polymerase chain reaction
PI propidium iodide
PMA propidium monoazide
PNA peptide nucleic acid
rRNA ribosomal ribonucleic acid
VBNC viable but non-culturable

viii
Abstract
In aqueous environments bacteria can occur planktonically in the water phase, or
associated in biofilms attached to solid surfaces or other phase boundaries. Plankton
organisms in surface waters provide external surfaces which can be colonized by
biofilms. Plankton surface can comprise areas up to thousands of km2 in a lake.
Possible associations of potentially pathogenic bacteria with phyto- and zooplankton
were observed in a field study in a freshwater environment (Lake Baldeney, Essen,
Germany) and in laboratory experiments.
Hygienically relevant microorganisms considered were, bacteria with faecal origin
(Escherichia coli, coliforms, intestinal enterococci, Clostridium perfringens), an
obligate human pathogen of faecal origin (Campylobacter spp.), and environmental
opportunistic bacteria (some coliforms, Pseudomonas aeruginosa, Aeromonas spp.,
Legionella spp.). For all of the investigated hygienically relevant bacteria an
association with freshwater plankton could clearly be demonstrated, except for
Campylobacter spp. which was only found in water and Legionella spp. which was
not detected by culture. The bacterial abundance in all samples was found to be
higher with plankton than compared to the free water. With the culture-independent
methods, fluorescence in situ hybridization (FISH) and quantitative polymerase chain
reaction (qPCR), the organisms P. aeruginosa and Legionella spp. were found in
significant higher concentrations in water and plankton than with cultural methods.
This observation indicates that both may occur in a viable but nonculturable (VBNC)
state.
In laboratory experiments hygienically relevant bacteria were co-cultivated with
Daphnia magna in microcosms. To study cladoceran-bacteria associations in detail, it
was discriminated between carapace-associated and ingested bacteria.
The organisms P. aeruginosa and A. hydrophila were found more frequently located
on the carapace of D. magna, whereas most of E. faecalis was located in the gut.
FISH analysis indicated the possibility of VBNC cells for these organisms in
association with D. magna.
The field study as well as laboratory microcosms indicate that there are associations
and accumulations of pathogenic bacteria, with different characteristics and origins,
with plankton. Plankton can act as a reservoir and a vector for potentially pathogens
and may spatially enhance bacterial concentrations up to infectious doses. In case of
VBNC bacteria, it is possible that the VBNC cells resuscitate and regain their

ix
virulence. Plankton-pathogen associations are of relevance considering human
health in drinking water production and recreational use of the surface water.

Table of contents
1 Introduction .......................................................................................................... 1
1.1 Background of this study ............................................................................... 1
1.2 Plankton organisms as a habitat for hygienically relevant microorganisms ... 3
1.2.1 Biology and ecology of Daphnia magna .................................................. 7
1.2.2 Appearance and abundance of the macrophyte Elodea nuttallii ............. 9
1.3 Bacteria in the viable but non-culturable state ............................................. 11
1.4 Distribution of hygienically relevant organisms in surface water .................. 16
1.4.1 Environmental pathogens ..................................................................... 16
1.4.1.1 Pseudomonas aeruginosa .............................................................. 16
1.4.1.2 Aeromonas spp. ............................................................................. 17
1.4.1.3 Legionella spp. ............................................................................... 18
1.4.2 Bacteria of faecal origin ........................................................................ 20
1.4.2.1 Coliform bacteria ............................................................................ 20
1.4.2.2 Enterococcus spp. .......................................................................... 20
1.4.2.3 Escherichia coli .............................................................................. 21
1.4.2.4 Clostridium perfringens ................................................................... 22
1.4.3 Human pathogen .................................................................................. 23
1.4.3.1 Campylobacter spp......................................................................... 23
1.5 Aims of the study ......................................................................................... 25
2 Material and methods ......................................................................................... 26
2.1 Organisms ................................................................................................... 26
2.1.1 Bacterial test strains .............................................................................. 26
2.1.2 Daphnia ................................................................................................ 26
2.1.3 Algae ..................................................................................................... 26
2.2 Growth media .............................................................................................. 27
2.3 Buffers and other solutions for general use ................................................. 33
2.4 Commercial kits ........................................................................................... 34
2.5 Chemicals .................................................................................................... 35
2.6 Equipment ................................................................................................... 36
2.7 Software ...................................................................................................... 38
2.8 Sampling of water and plankton at Lake Baldeney ...................................... 39
2.8.1 Identification of plankton organisms ...................................................... 42
2.8.2 Determination of plankton mass and sample preparation ..................... 42

xi
2.9 Sampling and preparation of Elodea nuttallii from Lake Baldeney .............. 42
2.10 Microbiological methods ........................................................................... 43
2.10.1 Determination of total cell count......................................................... 43
2.10.2 Determination of heterotrophic plate count (HPC) ............................. 43
2.10.3 Determination of culturable Pseudomonas aeruginosa ..................... 43
2.10.4 Determination of culturable coliforms and Escherichia coli ................ 44
2.10.5 Determination of culturable Enterococcus spp. ................................. 45
2.10.6 Determination of culturable Legionella spp. ....................................... 45
2.10.7 Determination of culturable Campylobacter spp. ............................... 46
2.10.8 Determination of culturable Aeromonas spp. ..................................... 46
2.10.9 Determination of culturable Clostridium perfringens and their spores 47
2.11 Characterization of bacterial isolates........................................................ 47
2.11.1 Biochemical characterization ............................................................. 47
2.11.2 16S rDNA sequence analysis ............................................................ 48
2.11.2.1 Isolation of DNA from pure cultures ................................................ 48
2.11.2.2 Amplification of 16S rDNA fragments ............................................. 48
2.11.2.3 DNA sequencing and comparative sequence analysis ................... 49
2.12 Molecularbiological methods .................................................................... 50
2.12.1 Buffers and solutions for polymerase chain reaction (PCR) .............. 50
2.12.2 Fluorescence in-situ hybridization (FISH) .......................................... 51
2.12.3 Solutions and buffers for fluorescence in-situ hybridization (FISH) ... 51
2.12.4 Quantitative PCR ............................................................................... 55
2.12.5 Solutions and buffers for qPCR ......................................................... 55
2.13 Cultivation of plankton organisms ............................................................ 63
2.13.1 Daphnia magna ................................................................................. 63
2.13.2 Scenedesmus obliquus ...................................................................... 63
2.14 Determination of toxicity of pathogens against Daphnia magna ............... 63
2.15 Co-cultivation of Daphnia magna with selected bacterial strains .............. 64
2.15.1 Co-cultivation with Pseudomonas aeruginosa ................................... 64
2.15.2 Co-cultivation with Aeromonas hydrophila ......................................... 66
2.15.3 Co-cultivation with Enterococcus faecalis .......................................... 66
3 Results ............................................................................................................... 67
3.1 Association of hygienically relevant bacteria with plankton organisms in Lake
Baldeney ............................................................................................................... 67

xii
3.1.1 Physico-chemical characterization of surface water ............................. 68
3.2 Abundance and identification of plankton organisms................................... 71
3.3 Detection of target organisms with cultural methods in water and plankton
samples of Lake Baldeney .................................................................................... 75
3.3.1 Distribution and proportion of bacteria in surface water and associated
with plankton ...................................................................................................... 76
3.3.2 Detection of organisms of faecal origin in surface water and plankton . 79
3.3.2.1 Determination of C. perfringens spores .......................................... 84
3.3.3 Detection of the human pathogen Campylobacter spp. ........................ 85
3.3.4 Detection of environmental pathogens in surface water and in
association with plankton ................................................................................... 86
3.3.5 Distribution of pathogens in a filtered water sample .............................. 89
3.3.6 Detection of target organisms with culture independent methods ......... 90
3.3.7 Microorganisms associated with the macrophyte Elodea nuttallii ......... 93
3.4 Interaction between Daphnia magna and pathogens in laboratory
microcosms ........................................................................................................... 96
3.4.1 Determination of toxicity of Pseudomonas aeruginosa, Aeromonas
hydrophila and Enterococcus faecalis to Daphnia magna.................................. 96
3.4.2 Co-cultivation of Daphnia magna with Pseudomonas aeruginosa ........ 98
3.4.3 Co-cultivation of Daphnia magna with Aeromonas hydrophila ............ 104
3.4.4 Co-cultivation of Daphnia magna with Enterococcus faecalis ............. 108
4 Discussion ........................................................................................................ 112
4.1 Association of potentially pathogenic bacteria with plankton organisms .... 112
4.1.1 Effects observed in Lake Baldeney ..................................................... 112
4.1.1.1 Abundance of plankton in Lake Baldeney .................................... 114
4.1.1.2 General abundance of bacteria in lake water and in association with
plankton 118
4.1.1.3 Occurence of organisms with faecal origin associated with plankton
and in the free water ..................................................................................... 119
4.1.1.3.1 Abundance of total coliforms and E. coli in lake water and
associated with plankton ........................................................................... 119
4.1.1.3.2 Intestinal enterococci in water and plankton samples .............. 120
4.1.1.3.3 C. perfringens and their endospores, can both be determined in
the free water as well as plankton-associated? ......................................... 121
4.1.1.3.4 Abundance of the human pathogen Campylobacter spp. in the
freshwater environment of Lake Baldeney ................................................ 123

xiii
4.1.1.4 Opportunistic pathogens in Lake Baldeney .................................. 124
4.1.1.4.1 Aeromonas spp. – the most abundant organism determined in
Lake Baldeney ........................................................................................... 124
4.1.1.4.2 P. aeruginosa was less abundant than Aeromonas spp. .......... 126
4.1.1.4.3 Abundance of Legionella spp. and L. pneumophila .................. 127
4.1.1.5 Are P. aeruginosa, Legionella spp. and L. pneumophila occurring in
a viable but nonculturable state in Lake Baldeney? ...................................... 128
4.1.1.5.1 Is the macrophyte Elodea nuttallii an appealing habitat for
hygienically relevant bacteria? .................................................................. 132
4.1.1.5.2 Estimation and reliability of the results referred to plankton volume
and wet weight........................................................................................... 133
4.1.1.5.3 Associations of pathogens with plankton in freshwater
environments ............................................................................................. 135
4.1.2 Daphnia magna as a habitat for hygienically relevant bacteria ........... 136
4.2 Conclusions ............................................................................................... 142
5 Literature .......................................................................................................... 146
xiv
List of Figures:
Figure 1.1 Lake Baldeney with possibly pathways of contamination by bacteria with
hygienical relevance. The objects of interest are phyto-, zooplankton and Elodea
nuttallii, which can be colonized and associated with pathogens from the surrounding
water. (Sources of pictures: see appendix) ................................................................. 2
Figure 1.2 Conceptional view on aquatic bacteria and their network. ........................ 4
Figure 1.3 Scanning electron micrograph (SEM) of D. magna. .................................. 5
Figure 1.4 Lightmicroscopic picture of D. magna. ...................................................... 8
Figure 1.5 Massive growth of Elodea nuttallii. .......................................................... 10
Figure 2.1 Ruttner Schöpfer for sampling of water at the lake bottom (Hydro-Bios
Apparatebau GmbH, Kiel, Germany) ........................................................................ 39
Figure 2.2 Overview of the sampling procedure ...................................................... 41
Figure 2.3: Co-cultivation of pathogens with D. magna: .......................................... 64
Figure 2.4: Preparation of D. magna ....................................................................... 65
Figure 2.5 Overview oft he sampling procedure of co-cultivation experiments. One
well contained 10 mL of medium (ADaM) with bacteri and 5 daphnids. ................... 66
Figure 3.1 Schematic overview of Lake Baldeney. Red lines indicate transects 1, 2,
and 3. The retaining wall impounding the River Ruhr is indicated as a black line. Flow
direction of the river is from East (right) to West (left). .............................................. 67
Figure 3.2 Temporal course of mean water temperature and oxygen concentration of
surface water samples and water samples taken at the bottom of Lake Baldeney. .. 68
Figure 3.3 Temporal course of phyto- and zooplankton organism abundance in Lake
Baldeney (inividuals/m3). .......................................................................................... 71
Figure 3.4: Total cell counts (TCC) and colony counts (HPC) of surface water and
plankton samples. ..................................................................................................... 76
Figure 3.5 Concentrations of total cell counts (TCC) and HPC bacteria in water and
plankton samples per 100 mL. Results for plankton were referred to the sampled
volume of water which was filtered through the plankton net while collecting plankton
(1250 L for phytoplankton and 9000 L for zooplankton) ........................................... 77
Figure 3.6 Distribution of total cell counts (in %) in the free water, phytoplankton and
zooplankton in Lake Baldeney in the month August. (Microscopic pictures by Miriam
Tewes) ...................................................................................................................... 78
Figure 3.7: Concentrations of organisms with faecal origin. ..................................... 79
Figure 3.8 Geometric mean values of concentrations of organisms of faecal origin
(coliforms, E. coli, intestinal enterococci, C. perfringens) in water and plankton
samples (n = 6) ......................................................................................................... 80
Figure 3.9 Concentrations of organisms with faecal origin in water and plankton
samples per 100 mL. Results for plankton were referred to the sampled volume of
water which was filtered through the plankton net while collecting plankton (1250 L
for phytoplankton and 9000 L for zooplankton) ......................................................... 81
Figure 3.10 Proportion of C. perfringens spores. ..................................................... 84
Figure 3.11 Concentrations of Aeromonas spp, and P. aeruginosa in surface water
and plankton samples. .............................................................................................. 86

xv
Figure 3.12 Geometric mean values for Aeromonas spp. and P. aeruginosa in water
and plankton samples (n = 6) ................................................................................... 87
Figure 3.13 Concentrations of Aeromonas spp. and P. aeruginosa in water and
plankton samples per 100 mL. Results for plankton were referred to the sampled
volume of water which was filtered through the plankton net while collecting plankton
(1250 L for phytoplankton and 9000 L for zooplankton) ........................................... 88
Figure 3.14 Quantification of P. aeruginosa and Legionella spp. in water and
plankton samples with q PCRin comparison to total cell counts (TCC) and colony
counts (HPC bacteria). ............................................................................................. 90
Figure 3.15 Concentrations of FISH positive cells of the opportunistic pathogens P.
aeruginosa (probe Psae 16S-182), Legionella spp. (probe LEG705) and L.
pneumophila (LEGPNE1) in water samples (n = 6) .................................................. 91
Figure 3.16 Comparison between cultural and molecular methods of the water
samples. ................................................................................................................... 92
Figure 3.17 General bacterial abundance in surface water and on Elodea nuttallii. 93
Figure 3.18 Concentrations of organisms with faecal origin (coliforms, E. coli,
intestinal enterococci, C. perfringens) and the pathogen (Aeromonas spp.) in surface
water and on Elodea nuttallii. .................................................................................... 94
Figure 3.19 Geometric mean values of bacterial abundencies (total cell counts and
HPC bacteria, left) and organisms with faecal origin (coliforms, E. coli, intestinal
enterococci, C. perfringens, right) as well as the opportunistic pathogen Aeromonas
spp. determined in Elodea nuttallii samples (n = 3, given per 100 g dry weight)
compared to concentrations on plankton (n = 6, given per 100 g wet weight). ......... 95
Figure 3.20 Toxicity of P. aeruginosa and A. hydrophila on D. magna. ................... 97
Figure 3.21 D. magna separated into gut (left) and the carapace with leftover
entrails. (Lightmicroscopic pictures, magnification 100x, source: Miriam Tewes,
Biofilm Centre, University of Duisburg-Essen) .......................................................... 99
Figure 3.22 Total cell counts, determined with the DAPI method, colony counts on
CN selective agar and FISH positive cells (probe PSAE-16S-182) of P. aeruginosa in
association with D. magna (n =2). .......................................................................... 100
Figure 3.23 Balance of colony counts of P. aeruginosa in association with D. magna.
............................................................................................................................... 102
Figure 3.24 Balance: Distribution of FISH positive cells of P. aeruginosa in a co-
cultivation experiment with D. magna (n = 2) .......................................................... 103
Figure 3.25 Total cell counts (DAPI method), colony counts (ampicillin-dextrin agar)
(n=6) and FISH positive cells (probe AERBOMO) (n=2) of A. hydrophila in
association with D. magna. ..................................................................................... 104
Figure 3.26 Balance of colony counts of A. hydrophila in association with D. magna.
............................................................................................................................... 106
Figure 3.27 Balance: Distribution of FISH positive cells of A. hydrophila in a co-
cultivation experiment with D. magna (n = 2) .......................................................... 107
Figure 3.28 Overview of total cell counts, FISH positive cells and colony counts of E.
faecalis in association with D. magna. .................................................................... 108
Figure 3.29 Balance of colony counts of E. faecalis in association with D. magna. 110

xvi
Figure 3.30 Balance: Distribution of FISH positive cells of A. hydrophila in a co-
cultivation experiment with D. magna (n = 2) .......................................................... 111
Figure 4.1 Lake Baldeney data (source: Ruhrverband, 2010) ............................... 116
Figure 4.2 Schematic overview of attachment sites for hygienically relevant
organisms in a well of the co-cultivation system with D. magna. (1) Bacteria free-
living in the medium, (2) Attachted to the carapace of D. magna, (3) infiltrated and
located in the gut, (4) attachment to the polystyrene well. (Source of D. magna
picture: http://www.stu.hochschule-reutlingen.de/images/stoffp3.gif ....................... 137

xvii
List of Tables:
Table 1.1 Overview of approaches and methods used for the assessment of bacterial
viability (adapted from Keer & Birch, 2003) .............................................................. 12
Table 2.1 Microorganisms used as a reference ....................................................... 26
Table 2.2 Stock solutions for ADaM ......................................................................... 27
Table 2.3 Preparation of 10 L ADaM ........................................................................ 27
Table 2.4 Preparation of WCg medium: .................................................................... 32
Table 2.5 Equipment used in this study.................................................................... 36
Table 2.6 Software used in this study. ..................................................................... 38
Table 2.7 Approaches of Malachite green broth MPN method ................................. 44
Table 2.8: Components and concentrations of the PCR reaction used for bacterial
16S rDNA amplification............................................................................................. 48
Table 2.9 The PCR program parameters ................................................................. 48
Table 2.10 Primers ................................................................................................... 50
Table 2.11 Hybridisation buffers for oligonucleotide probes targeting bacterial 16S
rRNA ......................................................................................................................... 51
Table 2.12 Oligonucleotide probes ........................................................................... 52
Table 2.13 Washing buffers for oligonucleotide probes targeting bacterial 16S rRNA
................................................................................................................................. 53
Table 2.14 Ready-made qPCR reagents ................................................................. 55
Table 2.15 Sequences of oligonucleotides ............................................................... 55
Table 2.16 Enzymes and other proteins (enzymes contained in ready-made PCR
reagents are not listed) ............................................................................................. 55
Table 2.17 Temperature protocol used in Legionella qPCR. .................................... 57
Table 2.18 PCR reaction mix for each sample in Pseudomonas aeruginosa qPCR
using the TaqMan probe. .......................................................................................... 59
Table 2.19 Temperature protocol used in Pseudomonas aeruginosa qPCR............ 59
Table 2.20 PCR reaction mix per sample in Pseudomonas aeruginosa qPCR using
SYBR Green. ............................................................................................................ 60
Table 3.1 Physico-chemical parameters of surface water samples taken at Lake
Baldeney. .................................................................................................................. 69
Table 3.2 Physico-chemical parameters water samples taken at the bottom of Lake
Baldeney. .................................................................................................................. 70
Table 3.3 Means of plankton organism .................................................................... 71
Table 3.4 Phytoplankton taxa and concentrations determined in phytoplankton
samples of Lake Baldeney (individuals/m3) .............................................................. 73
Table 3.5 Zooplankton taxa and concentrations determined in zooplankton samples
of Lake Baldeney (individuals/m3) ............................................................................ 74
Table 3.6 Geometric mean values for total cell counts (cells/100 mL water or 100 g
wet weight plankton) and HPC bacteria (cfu/100 mL water or 100 g wet weight
plankton) for water and plankton .............................................................................. 77
Table 3.7 Identified species of coliforms and intestinal enterococci in water and
plankton samples of four exemplary sampling dates (June- September 2010). In

xviii
brackets number of samples which were positive for the species identified. (n.d., not
determined) .............................................................................................................. 83
Table 3.8 Arithmetical mean values of colony counts of vegetative C. perfringens
cells and endsospores in water and plankton samples ............................................. 84
Table 3.9 Campylobacter species identified from six water, phyto- and zooplankton
samples. In brackets, number of samples which were positive for the species
identified. .................................................................................................................. 85
Table 3.10 Aeromonas species identified by 16S rDNA sequencing analysis of 13
isolates from surface water and plankton. In brackets, number of samples which were
positive for the species identified .............................................................................. 89
Table 3.11 Culturability (in %) of P. aeruginosa in the different compartments in a co-
culture with D. magna over a time period of 48 h (n=2) .......................................... 101
Table 3.12 Culturability (in %) of A. hydrophila in the different compartments in a co-
culture with D. magna over a time period of 48 h (n=6) .......................................... 105
Table 3.13 Culturability (in %) of E. faecalis in the different compartments in a co-
culture with D. magna over a time period of 48 h (n=6) .......................................... 109
Table 4.1 Geometric mean values for hygienically relevant microorganisms in water
and plankton (n.d.; not determined) ........................................................................ 113
Table 4.2 Surface areas calculated for the plankton organisms Fragilaria capucina
and Daphnia magna (µm2) ...................................................................................... 115
Table 4.3 Surface areas of phyto- and zooplankton in the samples of April and July
(m2/ m3) .................................................................................................................. 115
Table 4.4 Surface area of plankton (km2) in relation to the volume of Lake Baldeney
............................................................................................................................... 116
Table 4.5 Surface area of plankton in one Liter sample (cm2/L) ............................. 116
Table 4.6 Bacterial abundance on 1 m2 of plankton (cells, cfu or MPN/m2) ........... 117
Table 4.7 Bacterial densities (bacteria/cm2) on a surface (Flemming et al., 2000) . 117
Table 4.8 Preferential associations and attachment sites of the tested organisms (P.
aeruginosa, A. hydrophila, E. faecalis) in the co-cultivation system with D. magna
(intensity of association: +++ high, ++ medium, + low) ........................................... 139

Introduction
1
1 Introduction
1.1 Background of this study
Plankton organisms in surface waters provide large surfaces which can be colonized
by bacteria, including hygienically relevant organisms. Plankton can act as a hide, a
nutrient source or as a vector for these pathogens. This has been shown for Vibrio
spp. and a few other pathogens, but mostly in marine environments. Furthermore, the
microorganisms can enter the viable but nonculturable (VBNC) state and will not be
detected with conventional culture methods. The transition of potentially pathogenic
bacteria into the VBNC state when living in association with freshwater plankton has
not been considered yet, except for E. faecalis.
In the present study the associations of pathogenic microorganisms with freshwater
plankton and with the macrophyte Elodea nuttallii are investigated. Two main
objectives are taken in consideration, (i) a field study, the examination in a natural
surface water, Lake Baldeney in Essen/Germany, (ii) the simulation of associations in
microcosms with selected pathogens and Daphnia magna as a zooplankton model
organism.
Hygienically relevant microorganisms considered in this study are ubiquitous in
surface waters. They belong to the categories of faecal indicator bacteria
(Escherichia coli, coliforms, intestinal enterococci, Clostridium perfringens), an
obligate human pathogen of faecal origin (Campylobacter spp.), and environmental
opportunistic bacteria (e.g. some coliforms, Pseudomonas aeruginosa, Aeromonas
spp., Legionella spp.). These organisms can originate from urban and agricultural
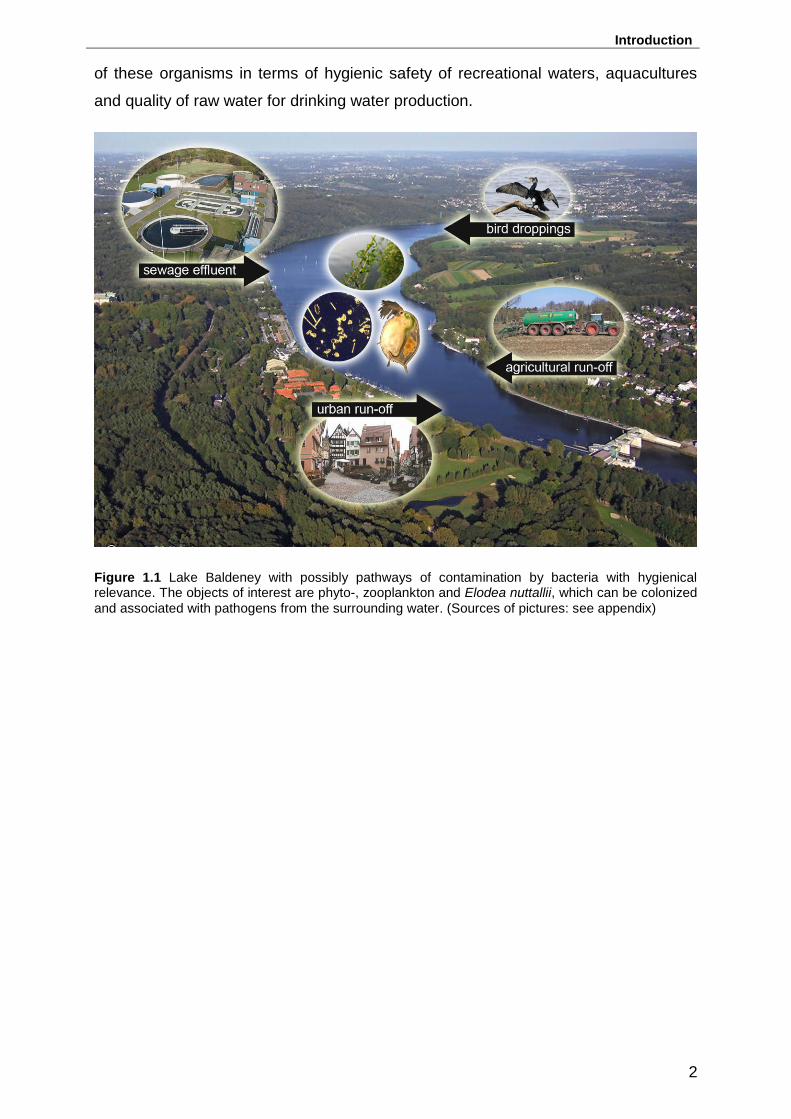
run-off, sewage overflow, or dropping of birds. In the picture (Figure 1.1) the objects
of interest that can be colonized by bacteria, such as phyto- and zooplankton, as well
as macrophytes, and possibly pathways for hygienically relevant bacteria into the
lake are illustrated.
The novelty of the project lies in the fact that the available information about the
interaction between plankton and hygienically relevant microorganisms in freshwater
is very scarce. Possible correlations between certain plankton species and the target
organisms were not investigated, or less is reported unitl now.
This research will provide in the first place fundamental knowledge about the
association and interaction of the target organisms with plankton. It offers knowledge
relevant for public health in terms of a deeper understanding and, eventually, control
Introduction
2
of these organisms in terms of hygienic safety of recreational waters, aquacultures
and quality of raw water for drinking water production.
Figure 1.1 Lake Baldeney with possibly pathways of contamination by bacteria with hygienical relevance. The objects of interest are phyto-, zooplankton and Elodea nuttallii, which can be colonized
and associated with pathogens from the surrounding water. (Sources of pictures: see appendix)
Introduction
3
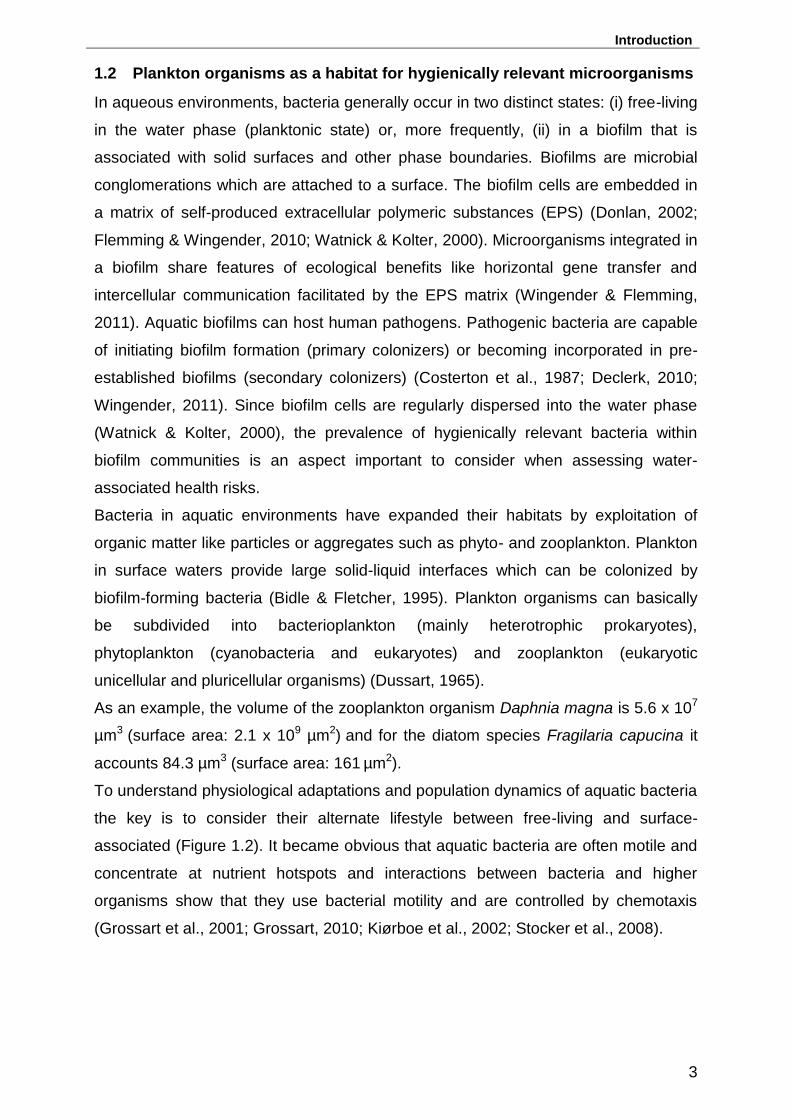
1.2 Plankton organisms as a habitat for hygienically relevant microorganisms
In aqueous environments, bacteria generally occur in two distinct states: (i) free-living
in the water phase (planktonic state) or, more frequently, (ii) in a biofilm that is
associated with solid surfaces and other phase boundaries. Biofilms are microbial
conglomerations which are attached to a surface. The biofilm cells are embedded in
a matrix of self-produced extracellular polymeric substances (EPS) (Donlan, 2002;
Flemming & Wingender, 2010; Watnick & Kolter, 2000). Microorganisms integrated in
a biofilm share features of ecological benefits like horizontal gene transfer and
intercellular communication facilitated by the EPS matrix (Wingender & Flemming,
2011). Aquatic biofilms can host human pathogens. Pathogenic bacteria are capable
of initiating biofilm formation (primary colonizers) or becoming incorporated in pre-
established biofilms (secondary colonizers) (Costerton et al., 1987; Declerk, 2010;
Wingender, 2011). Since biofilm cells are regularly dispersed into the water phase
(Watnick & Kolter, 2000), the prevalence of hygienically relevant bacteria within
biofilm communities is an aspect important to consider when assessing water-
associated health risks.
Bacteria in aquatic environments have expanded their habitats by exploitation of
organic matter like particles or aggregates such as phyto- and zooplankton. Plankton
in surface waters provide large solid-liquid interfaces which can be colonized by
biofilm-forming bacteria (Bidle & Fletcher, 1995). Plankton organisms can basically
be subdivided into bacterioplankton (mainly heterotrophic prokaryotes),
phytoplankton (cyanobacteria and eukaryotes) and zooplankton (eukaryotic
unicellular and pluricellular organisms) (Dussart, 1965).
As an example, the volume of the zooplankton organism Daphnia magna is 5.6 x 10⁷
µm3 (surface area: 2.1 x 109 µm2) and for the diatom species Fragilaria capucina it
accounts 84.3 µm3 (surface area: 161 µm2).
To understand physiological adaptations and population dynamics of aquatic bacteria
the key is to consider their alternate lifestyle between free-living and surface-
associated (Figure 1.2). It became obvious that aquatic bacteria are often motile and
concentrate at nutrient hotspots and interactions between bacteria and higher
organisms show that they use bacterial motility and are controlled by chemotaxis
(Grossart et al., 2001; Grossart, 2010; Kiørboe et al., 2002; Stocker et al., 2008).

Introduction
4
Bacterium-plankton associations are considered a widespread phenomenon and
have been studied for a long time (Carli et al., 1993; Huq et al., 1983; Huq et al.,
1984; Maugeri et al., 2004). Previous studies mainly focusing on marine
environments have revealed interactions of bacteria with phytoplankton such as
diatoms (Plough & Grossart, 2000) and zooplankton such as small crustaceans and
copepods (Huq et al., 1983, Huq et al., 1984, Lipp et al., 2002). Epibiotic bacteria can
survive longer than free forms, the biotic surfaces represent nutrient sources for
certain microorganisms favouring their attachment and biofilm development (Maugeri
et al., 2004; Watnick & Kolter, 2000). Plankton-colonizing biofilms can harbor
pathogens. First investigations have been carried out in marine environments with
Vibrio species. Huq et al. (2005) found greater numbers of vibrios associated with
zooplankton than in the water column. Chitinolytic bacteria such as Vibrio spp., i.e. V.
parahaemolyticus or V. cholerae, which produce an active chitinase utilize the
chitineous exoskeleton of copepods as source of both carbon and nitrogen (Kaneko
& Colwell, 1975, Yu et al., 1991). The association of V. cholera with zooplankton in
aquatic environments of Bangladesh was found to be a particular factor of human
epidemic cholera outbreaks (Islam et al. 2007, Rawlings et al. 2007). In the presence
of copepods, these bacteria have a competitive advantage when other sources of
nutrients are scarce (Heidelberg et al., 2002). Vibrio cholerae possesses multiple
Figure 1.2 Conceptional view on aquatic bacteria and their network. (1) Free-living stage; (2) Bacteria associated with microparticles; (3) Bacteria clustering around photosynthetic organisms; (4) Chemotactic bacteria surrounding an aggregate; (5) Bacteria associated with motile organisms (Grossart, 2010).

Introduction
5
strategies for colonization of both abiotic and biotic surfaces (Mueller et al., 2007)
and even associations with cyanobacteria enhanced their survival (Islam et al., 1990,
2004).
Emblazing the question about the distribution of potentially pathogenic bacteria as
free living or plankton associated, Møller et al. (2007) found elevated abundance and
growth rates for bacteria living associated with copepods compared to free living
bacteria. It may be advantageous for bacteria to stay close or attached to the
copepods, because copepods produce dissolved organic matter. Exterior bacteria
can be found near the mouth, between segments or close to the anus (Carman &
Dobbs, 1997). Electron micrographs of the zooplankton organism Daphnia magna
during this study revealed large numbers of bacteria located on the surface of the
carapace embedded in matrix, as illustrated in Figure 1.3.
The association of hygienically relevant bacteria to marine plankton has been
acknowledged for various pathogenic species such as Vibrio spp. (e.g. Carli et al.,
1993; Heidelberg et al., 2002; Huq et al., 1983; Maugeri et al., 2004), Campylobacter
spp. (Maugeri et al., 2004), and Helicobacter pylori (Carbone et al., 2005), and for the
faecal indicators Escherichia coli (Maugeri et al., 2004) and Enterococcus spp.
(Maugeri et al., 2004; Signoretto et al., 2004; Signoretto et al., 2005). Amongst
environmental opportunistic pathogens, Aeromonas spp. has been linked to plankton
colonization (Maugeri et al., 2004), but no information is available so far about the
connection of other representatives of this category such as Pseudomonas
aeruginosa or Legionella spp. to plankton.
Figure 1.3 Scanning electron micrograph (SEM) of D. magna. Left: overview of D. magna. Right: Part of the abdomen of D. magna covered with bacteria. (Source: Miriam Tewes, Biofilm Centre, University of Duisburg-Essen)

Introduction
6
In previous studies it was shown that wind, birds, and land animals can help carry
aquatic bacteria from lake to lake, and that bacteria can spread quickly through a
particular water mass simply by their extremely rapid growth rates (Hervàs et al.,
2009; van der Gucht et al., 2007). Earlier studies also show that bacteria can move
downward with the larger, heavier particles of organic detritus that constantly rain
upon the seabed (Simon et al., 2002; Turley & Mackie, 1995). If bacteria travel with
zooplankton species that migrate from the depths to the surface, they can overcome
huge distances, either vertically or horizontally, expand their habitat and are
transported to favourable feeding areas within their journey. Their idea requires that
bacteria not only attach to the upwardly migrating zooplankton, but that they later
detach into the free water again. This is of high ecological importance in habitats
where spatio-temporal changes may occur rapidly (Grossart 2010). Free-living and
particle-associated bacterial communities should not be perceived as separate
entities, but rather as interacting assemblages. There is an active exchange of
bacteria between plankton organisms and the surrounding water (Hansen & Bech,
1996; Riemann & Winding, 2005), the bacteria actively attach to the phyto- or
zooplankton surface (Simon et al., 2002), they may enter their gut via ingestion by
the zooplankton and are released together with gut flora by defecation or are egested
unharmed (Tang 2005). Since copepods are the main dietary constitutens of many
marine carnivores, including fish, bacterial attachment to the copepod integument
can contribute to the transfer of pathogens through the food chain (Dumontet et al.,
1996).
Algal exudates are important nutrient sources for heterotrophic bacteria in aquatic
environments. Their cellular products can promote growth of indicator organisms, and
there is potential for pathogenic bacteria to persist and grow on these algae
(Byappanahalli et al. 2003; Kaplan & Bott, 1989). Reche et al. (1997) found out that
algae and bacteria can balance grazing losses by compensatory growth. High
masses of zooplankton stimulated bacterial growth, whereas release of organic
carbon by phytoplankton declined. The algal decrease of organic carbon supply for
bacteria could affect the balance and lead to a change from competition to
commensalism.
Growth of bacteria on algal aggregates enhanced bacterial abundance and activities
and even changed the composition of the free-living communities in the surrounding
water (Tang et al. 2006). The colonization of plankton by bacteria can spatially

Introduction
7
enhance bacterial concentration, increase the possibility for humans to be exposed to
infectious doses and therefore pose a health concern (Omar et al. 2002).
1.2.1 Biology and ecology of Daphnia magna
In this study the zooplankton organism Daphnia magna was used to investigate
associations with hygienically relevant mircroorganisms. It is a well-established
model species and has been used in biological research for ecotoxicology, ecology
and evolution studies since the 18th century (Ebert, 2008; Lampert, 2011; Routtu et
al., 2010; Schaffer 1755). D. magna is a planktonic freshwater crustacean, a member
of the Phyllopoda (Branchiopoda) and within the branchiopods they belong to the
Cladocera. It is an ecologically important species in freshwater environments as a
key grazer of algae and also being preferred as prey for fish (Lampert 2006). D.
magna is a relatively large species (up to 5 mm) it is widespread in the northern
hemisphere and easy to maintain in laboratories. Daphnia populations in their natural
environment can be found, in lakes or ponds and are often one of the dominant
zooplankton organisms. The density of the populations vary strongly throughout the
seasons. Density peaks can be observed two or three times per year and especially
in the cold or dry season it is possible that they disappear entirely. In the early
season there is rapid population increase by recruitment from resting eggs and/or
surviving females. A peak in Daphnia density occurs often after a peak in algae
density and results in the clear-water phase in which Daphnia have removed most of
the phytoplankton out of the water (Ebert 2005).
Daphnia are key herbivors in many freshwater ecosystems and efficiently consume
heterotrophic bacteria (Brendelberger at al., 1991; De Mott 1986; Gophen & Geller,
1984). Porter et al. (1983) calculated filtering rates of D. magna with approximately
2.77 mL per individual and hour. They found that filtering rates of cladocerans
increase with increasing body size. Also the filter efficiency is enhanced by the
presence of larger particles, bacteria can be associated to larger particles and
therefore be more easily collected by filtering appendages (Porter et al., 1983).
The body is an uncalcified shell called carapace, which mainly consists of chitin
(Ebert 2005).
The English name for Daphnia, waterflea comes from the jumping-like behavior. This
behavior originates from the beating of their antennae, which they use for swimming.
Daphnia are filter feeders, feeding on small suspended particles in the water. With
their flattened leaf-like legs, the phylopds, they produce a water current for the
Introduction
8
filtering apparatus. Usually the food is made up of planktonic algae, but also bacteria
can be collected. Green algae are the best food e.g. Scenedesmus or
Chlamydomonas and therefore mainly used in laboratory experiments. (Ebert 2005).
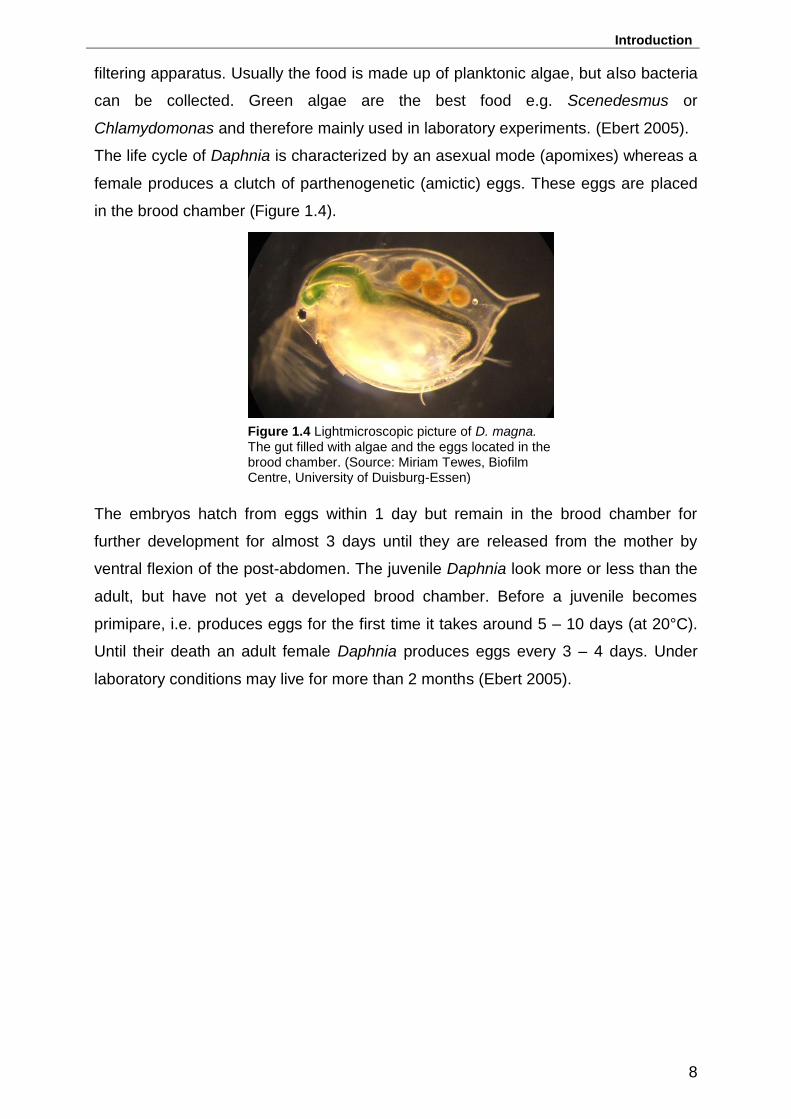
The life cycle of Daphnia is characterized by an asexual mode (apomixes) whereas a
female produces a clutch of parthenogenetic (amictic) eggs. These eggs are placed
in the brood chamber (Figure 1.4).
The embryos hatch from eggs within 1 day but remain in the brood chamber for
further development for almost 3 days until they are released from the mother by
ventral flexion of the post-abdomen. The juvenile Daphnia look more or less than the
adult, but have not yet a developed brood chamber. Before a juvenile becomes
primipare, i.e. produces eggs for the first time it takes around 5 – 10 days (at 20°C).
Until their death an adult female Daphnia produces eggs every 3 – 4 days. Under
laboratory conditions may live for more than 2 months (Ebert 2005).
Figure 1.4 Lightmicroscopic picture of D. magna. The gut filled with algae and the eggs located in the brood chamber. (Source: Miriam Tewes, Biofilm Centre, University of Duisburg-Essen)

Introduction
9
1.2.2 Appearance and abundance of the macrophyte Elodea nuttallii
The investigation of macrophytes was initially not intended within this study but due
to the massive growth of the waterweed Elodea nuttallii in the year 2009, it provided
another objective for the investigation of associations with hygienically relevant
microorganisms. In literature there is less reported about macrophyte-pathogen
associations in freshwaters yet.
Macrophytes are ubiquitous in freshwater environments. They excrete metabolites
which can act as nutrient source for epiphytic bacteria. These bacteria can form
biofilms on the plants´surface and use it as a habitat or a hide. In freshwater and
marine habitats there are often associations of bacteria of the Cytophaga-
Flavobacteria-Bacteriodetes group and Alpha- and Betaproteobacteria described
(Eiler et al., 2004; Riemann et al., 2000; Sapp et al., 2007). There are investigations
about heterotrophic biofilms on plants in freshwater (Hempel et al., 2008) but there is
no information about the association of macrophyta with hygienically relevant
bacteria.
In the catchment area of the Ruhr, especially in the reservoirs like Lake Baldeney, an
invasive proliferation and massive growth of the neophyte Elodea nuttallii could be
observed within the last years. Disregarding from the fact that the massive growth
poses a problem for recreational use of the surface waters, e.g. for sailing or motor
boats, the plant surface presents an attachment side for pathogens.
The macrophyte Elodea nuttallii is a species of waterweed which is a perennial
aquatic plant with a thin branching stem and narrow recurved leaves. Stalks of the
water plant are disseminated by abscising and floating until they anchor to the
ground. The species can grow in oligotrophic as well as polytrophic surface waters
and has a slender demand of light (Vöge 1995). Elodea nuttallii is native in North
America and was found in Europe for the first time in 1939. Nowadays the waterweed
is widespread and can be found in all dams of the catchment area of the river Ruhr,
e.g. Lake Hengstey, Lake Harkort and Lake Baldeney. In the year 2000 the first
comprehensive massive proliferation of the neophyte was noticed in Lake Harkort
(Figure 1.5), where the plant was growing from ground up to the surface of the lake.

Introduction
10
Figure 1.5 Massive growth of Elodea nuttallii. Massive growth at Lake Harkort in 2004 (left) (Ruhrverband 2009); Elodea nuttallii (right) (J. Wingender,
Biofilm Centre, University Duisburg-Essen)
The change of a phytoplankton-dominated to a macrophyte-dominated surface water
is the result of the reduction of ortho-phosphate concentrations by extension of
sewage water plants (Scheffer et al., 1993; Scheffer 1989; Scheffer 1998). In contrast
to other macrophytes Elodea nuttallii has physiological advantages, they start already
to be in bud at 4 °C and can take up nutrients, e. g. phosphate either with their leaves
as well as their roots. Furthermore they can exist with low concentrations of
phosphorus (0.2 % of the dry weight) (Garbey et al., 2004; Simpson 1990). In view of
the water ecology the macrophytes have a positive effect for zooplankton organisms,
macrozoobenthos and fish populations (Ruhrverband 2009).

Introduction
11
1.3 Bacteria in the viable but non-culturable state
Biofilms in water systems act as a reservoir for hygienically relevant microorganisms
and serve as a source for contamination of water by the release of pathogens.
Significant numbers of pathogens can be found in environmental reservoirs, therefore
it is important to assess their viability status to determine whether they pose a risk to
public health. A review article of Keer & Birch (2003) provides a suitable overview of
molecular methods for the assessment of bacterial viability.
Bacteria in the viable but non-culturable (VBNC) state fail to grow on routine culture
media on which they would normally grow, although they are still alive and show
metabolic activity. This phenomenon is described for numerous microorganisms (Mc
Kay, 1992; Oliver 2005, 2009, 2010) including pathogens considered in this project,
e.g. A. hydrophila (Mary et al., 2002), P. aeruginosa (Kimata et al., 2004), L.
pneumophila (Steinert et al., 1997), E. coli, E. faecalis (Signoretto et al., 2004, 2005),
C. jejuni, C. coli (Rollins and Colwell, 1986). Cells enter the VBNC state as a
response to a variety of environmental stresses like starvation, osmotic stress,
temperature variations, shifts in oxygen concentration or exposure to biocides or toxic
metal ions (Oliver, 2005). Therefore the transformation into the VBNC state is
considered to be a survival strategy and it has to include the capability to increase
metabolic activity and to regain culturability (Whiteside and Oliver, 1997).
Pathogens, e.g. V. cholera and Aeromonas spp., were found attached to plankton in
the viable but nonculturable state in a freshwater environment in India (Shukla et al.,
1995). VBNC V. cholerae O1 were also found in marine environments of Argentina,
where they were associated with phyto- and zooplankton (Binzstein et al., 2004). In
the harbor of Naples in Italy Dumontet et al. (2000) found Vibrio spp. and A. caviae in
the VBNC state adhering to copepods. The detection of E. faecalis in both lake water
(Lake Garda) and sea water (Adriatic Sea) showed the organism mostly bound to
plankton and that adhesion to copepods accelerated the entry into the VBNC state
(Signoretto et al., 2005).
In this study it has to be investigated whether bacteria, particularly opportunistic
pathogens, pass into the VBNC state, when they are associated with plankton in a
freshwater environment. This phenomenon should furthermore be proved in batch
cultures where pathogens are co-cultivated with plankton organisms. There is the aim
to find out, if the VBNC state is induced when bacteria live attached to the outer
surface of the zooplankton organism, or when they were ingested and are released
after gut passage.

Introduction
12
If human pathogens like A. hydrophila, or E. faecalis enter into a state in which they
are no longer detectable with cultural methods they present a public health concern,
because it has been demonstrated that these bacteria, remain viable, conserve their
pathogenic characteristics and are able to resume growth again (Kell et al., 1998;
Oliver 2000; Pruzzo et al., 2002). Thus determination of pathogens on the basis of
culture methods alone are expected to be unreliable in order to establish the load of
hygienically relevant bacteria in environmental waters.
The transition from a culturable into a non-culturable state can provoke morphological
and physiological changes in the bacteria, like a reduced cell size, modified cell
membrane compositions or reduced respiration rates. But generally VBNC bacteria
maintain some viability markers, e.g. integrity of cytoplasmic membrane, respiratory
activity or the presence of ribosomes (Lleó et al. 2000; Oliver, 2009). The detection of
bacteria in the VBNC state can be improved if the standard culture-based methods
are combined with molecular methods (Grobe et al. 2010; Keer & Birch, 2003).
Table 1.1 Overview of approaches and methods used for the assessment of bacterial viability
(adapted from Keer & Birch, 2003)
Methods Literature
Presence of
nucleic acids
DNA (real-time) PCR Behets et al., 2007
mRNA RT-PCR NASBA
Birch et al., 2001 Chan & Fox, 1999 Maher et al., 2001
rRNA FISH, PNA-FISH
Bottari et al., 2006 Moter & Göbel, 2000
Metabolic
activity
Respiratory activity CTC assay Nwoguh et al., 1995 Rodriguez et al., 1992
Enzymatic activity FDA, CFDA Ziglio et al., 2002
Cell elongation Direct viable count (DVC) Kalmbach et al., 1997 Kogure te al., 1979
Cellular integrity
Membrane integrity PI, PMA SYTO 9, GFP persistence
Banning et al., 2002 Nocker et al., 2007
Respiratory activtiy Rhodamine 123; DIBAC4 (3)
Banning et al., 2002 Lowder et al., 2000
Introduction
13
To assess metabolic activity of a bacterial cell, preferential in mixed bacterial
populations, respiration activity can be determined by intracellular hydrolysis of 5-
cyano-2,3-ditolyl tetrazolium chloride (CTC) and detection of CTC-formazan crystals
with fluorescence microscopy (Rodriguez et al., 1992). To determine enzyme activity,
fluorogenic esters, like fluorescein diacetate (FDA) and carboxyfluorescein diacetate
(CFDA) can be used. The analysis of membrane integrity is based on the ability of
bacterial cells to exclude fluorescent dyes, e.g. propidium iodide (PI) or propidium
monoazide (PMA) (Nocker et al., 2007).
For specific detection and quantification of hygienically relevant bacteria such as P.
aeruginosa or Legionella spp. the molecular methods quantitative real-time PCR
(qPCR) or fluorescence in situ hybridization (FISH) are preferential and were used in
this study. Quantitative PCR is a technique based on the exponential in vitro
amplification of a double-stranded DNA (dsDNA) target sequence from a DNA
template by a heat-stable polymerase enzyme. The resulting amplification product is
referred to as the “amplicon”. In contrast to conventional PCR, qPCR employs
fluorogenic molecules which allow the detection and quantification of the amplicon in
real-time (Mackay et al., 2007; Shipley 2006). There are primer and probe systems
available for Legionella spp., L. pneumophila and P. aeruginosa, but PCR methods
do not give information about the viablility of bacteria (Declerck et al., 2007;
Wellinghausen et al., 2001; Qin et al., 2003). Due to its high degree of sensitivity,
qPCR is prone to errors caused by matrix effects. Numerous contaminants may
interfere and eventually causing partial or total PCR inhibition by matrix compounds
and may lead to false-negative results. Often, inhibiting substances originate from the
sample matrix itself as humic acids, polysaccharides (Wilson, 1997), or iron and
manganese (Wullings & van der Kooij, 2006). This phenomenon was observed in
analyzing cooling water samples, presumably due to their relatively high matrix
complexity (Yaradou et al. 2007). Furthermore extracellular DNA or DNA from dead
cells can lead to an overestimation of VBNC cells, due to false-positive results
(Lehtola et al., 2007; Wellinghausen et al., 2001).
The principle of FISH involves the staining of ribosomal RNA by fluorescent dye-
labelled nucleic acid probes. Probes may be general, binding to ribosomes of every
cell regardless of the domain, or specifically designed to fit to certain species. By
treating fixed cells with appropriate chemicals, they become permeable and allow
intrusion of the probe solution. In a subsequent hybridization step, the probe binds to

Introduction
14
the 16S rRNA of the cell's ribosomes. FISH allows detection and quantification of
culturable and non-culturable cells (Madigan et al., 2006; Moter & Göbel, 2000). This
method has limitations since it is known that the physiological state of bacteria can
affect the amount of rRNA. A positive FISH signal might not be a direct indicator of
metabolic activity, because stresses, like starvation or disinfection can degrade rRNA
over time and lead to a weak or absent fluorescent signal, although the cells might be
still alive (Bjergbæk & Roslev, 2005; Lehtola et al., 2007). This might lead to a false-
negative result. On the osther side, rRNA is remaining stable for a long time,
although cells are already dead. Since this would indicate false-positive results, the
method should not be used to assess the viability of individual cells (Tolker-Nielsen et
al., 1997, Prescott et al., 1999).
Is FISH coupled with the method of direct viable count (DVC) it is possible to detect
the capacity of bacteria to metabolize nutrients. Therefore gyrase inhibitors, like
pipemidic acid or nalidixic acid, are used to inhibit cell division and provoke cell
elongation of dividing cells with accumulation of ribosomes.
Afterwards the FISH method is applied and viable, culturable as well as VBNC cells
are detected (Regnault et al., 2000; Armisen & Servais, 2004; Piqueres et al., 2006).
As a recent development, FISH methods using probes made up from peptide nucleic
acid (PNA) instead of DNA are available. PNAs are uncharged and analogous to
DNAs but possess 2-aminoethyl-glycinelinkages instead of a phosphodiester
backbone. This structural change provides resistance to enzymatic cleavage, better
salt tolerance, and higher thermal stability for the molecule, but nevertheless allows it
to bind to complementary nucleic acid sequences (Bottari et al., 2006).
Also, PNA probes can be designed with a shorter length, allowing them to pass the
cell membrane more easily and the binding to nucleic acids is stronger than that of
oligonucleotide probes. Comparisons of DNA and PNA probe efficiency for the same
target site in Legionella have shown that PNA probes surpass comparable DNA
probes in terms of target specificity and signal intensity, and proved their superiority
for the detection of legionellae in environmental samples (Wilks & Keevil, 2006).
Some studies reported long-term persistence of DNA and RNA (Lázaro et al., 1999,
Lleó et al., 2000), while others have shown evidence for nucleis acid contents to
gradually decrease in VBNC cells (Weichart et al., 1997).
To estimate the viability of bacteria it is useful to determine their viability markers,
e.g. membrane integrity with propidium iodide (PI) or propidium monoazide (PMA)
Introduction
15
(Nocker et al., 2007). Respiration can be detected by intracellular hydrolysis of 5-
cyano-2,3-ditolyl tetrazolium chloride (CTC) (Rodriguez et al. 1992).
Resuscitation after non-culturability is possible when the environmental conditions
change or the stress factors are reduced (Kell et al., 1998). The process of
resuscitation can be enhanced by co-cultivation with protozoa for example L.
pneumophila regained culturability in association with Acanthamoeba castellani
(Steinert et al. 1997), or by inoculation of C. jejuni into the yolk sacs of embryonated
eggs (Cappelier et al., 1999). Signoretto et al. (2004, 2005) found that the
persistence in aquatic environments for E. faecalis in the VBNC state is warranted by
the adhesion to copepods. P. aeruginosa which was transformed into the VBNC state
by copper stress, was resuscitated and regained infectivity to human lung cells by
use of a copper chelator (Dwidjosiswojo et al., 2011). In the monitoring of viability
with the current available methods it has to be considered that none of the methods
is universally appropriate, rather several methods should be used simultaneously or
combined to increase accuracy of the result (Lisle et al., 2001).

Introduction
16
1.4 Distribution of hygienically relevant organisms in surface water
A well documented summary about hygienically relevant organisms in biofilms of
man made water systems is reported by Dr. Jost Wingender in Biofilm Highlights
(Flemming et al., 2011).
The following organisms with hygienical relevance were selected to represent a
variety of members of three different groups. They are all ubiqutious bacteria in
aquatic environments with pathogenic properties and originate, for instance, from
sewage effluents, urban or agricultural run-off and birds. The environmental
opportunistic pathogens, such as P. aeruginosa, Aeromonas spp. and Legionella
spp., are of particular relvance in drinking water distribution system, since they are
known to form biofilms or integrate into pre-existing biofilms. But they are also of
significance in waters used for recreational purposes. The bacteria of faecal origin
(coliforms, Escherichia coli, intestinal enterococci and Clostridium perfringens) are
indicator for a faecal pollution water. Some are inhabtitants of the intestinal tract of
humans and warm-blooded animals, but they can also be found in natural
environments, such as soil or surface waters. Their incidence is also considered in
the EU bathing water directive. Campylobacter spp. represent common human
enteric obligate pathogens with faecal origin, some species can cause severe
gastrointestinal diseases.
1.4.1 Environmental pathogens
1.4.1.1 Pseudomonas aeruginosa
The Gram-negative, aerobic, non-spore-forming rod-shaped bacterium
Pseudomonas aeruginosa (Madigan et al., 2006; Stover et al., 2000) is an ubiquitous
environmental organism, occurring in sediments and soil, in freshwater and marine
surface waters, on plant and animal tissue, as well as in man-made environments
such as drinking water distribution and plumbing systems, swimming pool
environments, hospitals, and wastewater effluents (Hardalo & Edberg, 1997; Khan et
al., 2007; Pellett et al., 1983; Schwartz et al., 2006; Valentino & Torregrossa, 1995).
Elevated levels of P. aeruginosa in surface waters are often related to anthropogenic
alterations of the water body (Pirnay et al., 2005). Kimata et al. (2004) and Khan et
al. (2007) isolated P. aeruginosa from the open ocean. Its natural occurrence,
however, rather might be associated with sediments and submerged surfaces,
suggesting that surveillance of P. aeruginosa should not be restricted to water alone

Introduction
17
(Pellet et al., 1983). Pseudomonas spp. were found in association with marine
phytoplankton (Berland et al., 1976) and recently with Daphnia (Qi et al., 2009).
Infections of humans with P. aeruginosa can arise in water bodies that are used for
recreation purposes (e.g. swimming). The main route is contact of skin or mucous
tissue with contaminated water, ingestion of water rarely leads to infections.
Transmitted through wounds that are exposed to contaminated water, P. aeruginosa
causes bathing-water-associated ear, eye, and skin infections (Grobe et al., 1994;
Wingender et al., 2009). In technical water systems, P. aeruginosa is capable of
integrating into pre-existing biofilms or, acting as a primary coloniser, to develop
biofilms, thus promoting the subsequent incorporation of other species into the biofilm
(Declerck, 2010; Moritz et al., 2010; Wingender et al., 2009). P. aeruginosa is able to
form multispecies biofilms together with other microorgansims (Al-Bakri et al., 2004;
Stewart et al., 1997), often being one of the dominant organisms in this habitat
(Andersson et al. 2008; Shin et al. 2007)
P. aeruginosa is an opportunistic human pathogen of high clinical relevance
(Anaissie et al., 2002; Exner et al., 2007; Reuter et al., 2002; Szewzyk et al., 2000;
Trautmann et al., 2009), causing a multitude of infections in immuno-compromised
hosts, such as cancer patients, aids and transplant patients, young children and
elderly persons, but rarely in healthy people. In hospitals and other medical
environments, P. aeruginosa accounts for a significant fraction of nosocomial
infections of burn wounds, the urinary tract, the respiratory system, and the
bloodstream (Anaissie et al., 2002; Trautmann et al., 2009). In cystic fibrosis patients
suffering from chronic lung infections, it is a frequent cause of morbidity and mortality
(Trautmann et al., 2005).
1.4.1.2 Aeromonas spp.
Aeromonas spp. are widespread in natural habitats and have been isolated from soil,
fresh and brakish water, sewage and waste water, drinking water and a variety of
foods (Buchanan & Palumbo et al. 1985; Araujo et al., 1991). Aeromonas hydrophila
is a Gram-negative, motile, oxidase positive, non-sporeforming facultative anaerob
bacterium (Joseph & Carnahan, 1994). It is ubiquitous in the water environment, but
is normally not an inhabitant of the gastrointestinal tract in humans (Messi et al.,
2002). A. hydrophila has been reported to cause in humans both intestinal and
extraintestinal infections (Galindo et al., 2006; Janda 2001; Vila et al., 2003) including
gastroenteritis, hepatobiliary tract infections, urinary tract and wound infections,
Introduction
18
septicemia, cellulitis, soft tissue infections, broncho-pulmonary infections and
occasionally meningitis and peritonitis (Galindo et al., 2006; Hornemann et al., 2007;
Janda et al., 1988). The most frequent route of infection is direct contact with
contaminated water (Janda et al., 1991).
A. hydrophila was found in adhesion to zooplankton, especially in association with
both dead and live copepods, in case of alive copepods this could allow transport of
bacteria to other locations (Alfredsson et al., 1995; Dumontet et al., 2000; Krovacek
et al., 1994; Maugeri et al., 2004). Hazen & Esch (1983) found a positive correlation
between A. hydrophila and algal blooms in an estuarine habitat influenced by
fertilizer effluents. Accumulation of bacteria on plankton surfaces can lead to
consumption of infectious doses by humans (Dumontet et al. 1996; Omar et al.,
2002). Some strains of A. hydrophila produce virulence factors and are capable of
causing septicemia in fish and amphibians (Krovacek et al., 1993), whereas A.
salmonicida is a well-known fish pathogen (Austin & Austin 1993). A. hydrophila is
known to produce a number of potential virulence factors including cytotoxin,
haemolysin and enterotoxins (Houston et al., 1991; Krovacek et al. 1991; Kühn et al.
1997; Wadstrom et al., 1976). The wide distribution of the bacterium in different
aquatic habitats underlines its ability to adapt to environments that differ in nutrient
supply and presence of other aquatic microorganisms (Messi et al., 2002).
1.4.1.3 Legionella spp.
Legionellae are Gram-negative, aerobic bacteria which occur rod-shaped or
filamentous (Declerck, 2010). Over 50 different Legionella species including
numerous serogroups have been described so far, about half of which are
considered to be opportunistic human pathogens, causing legionellosis, an infection
of the respiratory tract that is acquired by inhalation or micro-aspiration of Legionella-
carrying aerosols from contaminated sources, e.g. taps, shower heads, whirlpools, air
conditioning systems, or fountains. Legionella pneumophila with the predominant
serogroup 1 is regarded to be the medically most important species amongst
Legionella (Yu et al., 2002).
Legionellae ubiquitously inhabit both natural and anthropogenic freshwater
environments (Fliermans et al., 1981). Natural environments are rarely associated
with outbreaks of legionellosis, because the lower water temperatures do not support
significant proliferation of legionellae (Declerck, 2010; Fields et al., 2002).

Introduction
19
Tison et al. (1980) found L. pneumophila serogroup 1 in association with
cyanobacteria. The bacterium is provided by algal extracellular products which can
be used as energy source and this maintains the distribution in natural habitats.
L. pneumophila is also capable to consume and grow on dead bacteria such as
Pseudomonas putida and Escherichia coli (Temmermann et al., 2006). Moreover,
they are able to replicate as parasites in biofilm-grazing protozoans such as
amoebae (Fields et al., 2010; Kuiper et al., 2004; Kuiper et al., 2006; Greub & Raoult,
2004). Association of L. pneumophila with biofilm communities and amoebae
provides the bacterium with necessary nutrients and thus, despite its fastidious
growth requirements, allows it to thrive in oligotrophic environments (Lau & Ashbolt,
2009; Declerck, 2010; Fields et al., 2010).
Although legionellae do not produce monospecies biofilms under environmental
conditions (Declerck, 2010), they readily incorporate into existing biofilms as a
secondary coloniser where they persist or even multiply (Moritz et al., 2010; Rogers
et al., 1994). Survival and growth of L. pneumophila depends on their cohabitants,
several Gram-negative bacteria e.g. Pseudomonas aeruginosa, Pseudomonas
fluorescens, as well as Aeromonas hydrophila were found to inhibit L. pneumophila
growth and biofilm formation (Toze et al., 1990; Guerrieri et al., 2008).

Introduction
20
1.4.2 Bacteria of faecal origin
1.4.2.1 Coliform bacteria
To the group of coliform bacteria belong a wide range of aerobic and facultatively
anaerobic, Gram-negative, non-spore-forming, rod shaped bacteria (Rompré et al.,
2002). Coliforms such as Escherichia, Citrobacter and Enterobacter are common
inhabitants of the intestinal tract of humans and of warm-blooded animals, but they
are also heterotrophic and can be found in natural environments such as soil or
surface waters where they are able to survive or multiply in biofilms even under low-
nutrient and low-temperature conditions (Le Chevallier et al. 1987; Camper et al.
1996; Leclerc et al., 2001). Coliforms from environmental sources which are adapted
to oligotrophic conditions are more likely to colonize surfaces and form biofilms in
water systems than bacteria which are adapted to elevated nutrient levels. Are there
no autochthonous sessile microorganisms present coliforms are also able to act as
primary colonizer and form biofilms (Szabo et al., 2006). Coliforms have been used
as indicator organisms for faecal pollution of drinking water. Some are facultative
pathogens and can cause e.g. wound infections, pneumonia and septicemia
(Feuerpfeil et al. 2009). There is no recent knowledge about associations of bacteria
of the coliform group with plankton organisms in aquatic habitats, except for E. coli.
1.4.2.2 Enterococcus spp.
Enterococci are Gram-positive, ovoid, non-spore-forming, facultative anaerobic
bacteria (Fisher & Philips 2009). Their origins can vary from environmental sources
as well as from humans or animals, as they are part of the microflora in warm-
blooded animals and humans. They have been found associated with soil, plants,
zooplankton and algae. E. faecalis was found in association with zooplankton
organisms and is able to persist in the environment for long periods (Signoretto et al.
2004; Signoretto et al. 2005). E. faecalis can enter the viable but non-culturable
(VBNC) state as a survival strategy when they are released in fresh or marine water
environments (Lleò et al., 1998). Mote et al. (2012) found that both E. faecalis and E.
casseliflavus were able to survive and multiply in plankton suspensions for longer
times than just in artificial seawater. This implies that Enterococcus spp. may be
highly associated with plankton or other particles and furthermore they are able to
survive longer in marine environments than fecal coliforms (Cabelli et al. 1983). The
EU bathing water quality directive defines a bathing water in good quality with a
Introduction
21
concentration of intestinal enterococci of 200 cfu/100 mL (Directive 2006/7/EC).
Enterococci were found in high densities attached to the green alga Cladophora
(Byappanahalli et al., 2003) in shoreline waters of Lake Michigan. Plankton may
serve as a reservoir for enterococci which enhances growth due to nutrient supply
and persistence of this fecal indicator e.g. by protection from sunlight (Byappanahalli
et al., 2003; Signoretto et al. 2004; Signoretto et al. 2005). The U.S. Environmental
Protection Agency (EPA) recommended to use enterococci instead of fecal coliforms
as indicator organism for fecal pollution (U.S. Environmental Protection Agency,
1986). And in addition the findings by Mote et al. (2012) imply the effectiveness of
enterococci as an indicator of water quality, especially in particle-rich aquatic
habitats.E. faecalis and E. faecium are the most common ones in the human
gastrointestinal tract (Klein, 2003). They can cause urinary tract infections, wound
infections endocarditis (Guzmán et al., 1991).
1.4.2.3 Escherichia coli
E. coli are straight cylindrical rods which are Gram-negative, motile, aerobic and
facultatively anaerobic (Scheutz & Strockbine, 2005). The organism is commonly
found in the human intestine but there are also obligate pathogens existing like
enterotoxigenic and enterohaemorrhagic variants (Nwachuku & Gerba, 2008).
Association and persistence of E. coli with the green alga Cladophora at Lake
Michigan was investigated by Whitman et al. (2003). Cladophora harbour high
densities of E. coli and provides a habitat and nutrients for survival and growth of this
organism (Byappanahalli et al. 2003; Whitman et al. 2003; Olapade et al., 2006). In
the presence of protozoa Sibille et al. (1998) observed enhanced elimination of E.
coli by grazing activity in an experimental distribution system. Mc Mahon & Rigler
(1965) found that Daphnia are efficiently grazers on E. coli.
E. coli is able to become incorporated into pre-existing drinking water biofilms, but
also to form monospecies biofilms (Jones & Bradshaw, 1996; Bridier et al., 2010). It
is a widely used indicator of fecal contamination but this is contended because of its
persistence and common occurrence in natural habitats (Whitman et al. 2006). E. coli
can occur in habitats that are not influenced by sewage inputs. They can survive in
soil or sand for months and be washed into the water body due to rainfall. Once the
cells are adsorbed to particulate matter in moist areas they are protected from
environmental stresses, like desiccation and UV light (Whitman et al., 2006). The

Introduction
22
current European guideline for bathing waters uses E. coli enumeration for
determination of fecal contamination instead of total or fecal coliforms. The
concentration for a good bathing water quality is 500 cfu E. coli /100 mL (Directive
2006/7/EC).
1.4.2.4 Clostridium perfringens
The organism Clostridium perfringens is Gram-positive, anaerobic and is able to form
endospores. This species produces different soluble substances that cause a variety
of toxic effects (Rainey et al., 2005). C. perfringens is widespread in the environment
and found in soil as well as aquatic habitats. The organism can be found in the
intestine of animals or humans where it can be pathogenic, in humans it is able to
cause gangrene and gastrointestinal diseases. C. perfringens produces various
toxins and enzymes which results in lesions of healthy cells and leads to the specific
symptoms. For epidemiological studies it is important to identify the C. perfringens
pathovars because each type of toxin induces a certain syndrome (Petit et al., 1999).
Clostridia play an important role in anoxic organic-rich environments, because they
degrade via fermentation complex organic materials into acid, alcohols, hydrogen
and carbon dioxide. Besides fecal coliforms and fecal streptococci the most
frequently used indicator for fecal pollution in water is C. perfringens. This species is
consistently present in wastewater at concentrations of 103 to 104 cells per 100 mL.
Because of its resistance to chlorination and diverse environmental factors, its
indicator value resembles that of enteric viruses (Fujioka and Shizumura, 1985). C.
perfringens and its spores had been specified as an indicator parameter of quality of
water for human consumption in the Directive of the European Community (EC,
1998). The presence of spores and the ratio between vegetative cells and spores can
be a potential sensitive indicator for recent fecal pollution by agricultural sources or
microorganisms entering streams with municipal wastewater (Bisson and Cabelli,
1979; Lango, 1999; Sørensen et al., 1989). C. perfringens spores can persist in water
for a long time and are considered as much longer than the persistence of most
enteropathogenic bacteria (Cabelli et al., 1982). Both vegetative cells and spores are
used to monitor water treatment process efficiency (Ryzinska-Paier et al., 2011).
There is no recent knowledge about associations of C. perfringens with plankton
organisms neither in freshwater nor in marine environments.
Introduction
23
1.4.3 Human pathogen
1.4.3.1 Campylobacter spp.
Campylobacter spp. are fastidious Gram-negative, non-spore-forming, motile,
microaerophilic, spiral-shaped bacteria (Vandamme & De Ley, 1991; Rowe et al.,
2000). They are of clinical and epidemiological relevance because of enteric food-
and waterborne disease causing gastrointestinal illness. Point source outbreaks
involving contaminated raw milk, poultry as well as water are well described, in most
cases these events are sporadic with no clear source (St. Pierre et al. 2009).
Campylobacters can form monospecies biofilms (Joshua et al. 2006) and integrate
into pre-existing mixed-population biofilms, e.g. isolates of C. jejuni and C. coli were
found to survive in such biofilms (Buswell et al., 1998). There are different
possibilities for Campylobacter spp. to contaminate environmental water, e.g.
streams, rivers or lakes because the organism colonizes a variety of hosts like
domestic animals or wild birds and thus the organism is excreted via the faeces,
agricultural run-off, or it is discharged from wastewater treatment plants (Obiri-Danso
& Jones, 1999; St. Pierre et al. 2009). Campylobacters that are excreted into aquatic
environments or upon starvation undergo a physiological change and can enter the
viable but non-culturable state (VBNC) (Rollins & Colwell, 1986; Tholozan et al. 1999;
Chaveerach et al. 2003). They can persist in water and survive for months under
various conditions (Cools et al. 2003). The survival of campylobacters is contributed
by the ingestion of planktonic grazers. Ishii et al. (2006) observed Campylobacter
associated with Cladophora. The green algae serves as a protective and nutritive
reservoir for pathogenic bacteria. It was shown that Daphnia were highly efficient
grazers of aquatic bacteria and affect the biomass, productivity, size structure and
species composition of aquatic bacterial biofilms (Jürgens 1994; Kamjunke et al.
1999). Schallenberg et al. (2005) found Daphnia carinata grazing on C. jejuni and to
reduce the survival of the pathogen.
Campylobacters in natural aquatic habitats were found to survive in cold water at
temperatures below 10°C in the winter period much longer than they survive in water
at higher temperatures in Finland and Norway (Korhonen & Martikainen, 1991;
Brennhovd et al., 1992)
Campylobacter spp. in particular C. jejuni is one of the most important causes of
food-borne gastrointestinal disease (Koenraad et al. 1997). Foods of animal origin
and water are regarded as the main transmission routes due to the presence of these
organisms in the intestine of many animals (Pearson et al., 1996). C. jejuni and C.

Introduction
24
coli are the most common human enteric pathogens among the thermotolerant
campylobacters and cause acute bacterial diarrhea (Frost 2001).

Aims of the study
25
1.5 Aims of the study
Overall goal is to assess the role of plankton as a site for accumulation,
transport and possible proliferation of hygienically relevant microorganisms
- Determination of the association in a freshwater environment, in Lake
Baldeney/Essen/Germany
- Investigation of pathogens existing in the VBNC state
- Use of cultural and culture-independent methods
Quantitative polymerase chain reaction (qPCR)
Fluorescence in-situ hybridization (FISH)
- Simulation of the plankton-bacteria association in batch cultures with
the model organism Daphnia magna and selected pathogens
(Pseudomonas aeruginosa, Aeromonas hydrophila and Enterococcus
faecalis)
- Balance studies between attached pathogens on the carapace of
D. magna and the amount ingested, thus located in the gut (with
cultural methods and FISH)
Evaluation of the results in concern of relevance for public health considering
drinking water production and recreational water quality

Material and methods
26
2 Material and methods
2.1 Organisms
2.1.1 Bacterial test strains
The organisms used in this study listed in the table below were obtained from the
German Collection of Microorganisms and Cell Cultures (DSMZ, Germany) and kept
in cryogenic vials (Mast Diagnostica) at -70°C.
Additionally used organisms were P. aeruginosa PAO1 (Nottingham wild type from
Holloway collection) and A. hydrophila AH-1N (wild type, Swift et al. 1999).
Table 2.1 Microorganisms used as a reference
Organism DSMZ No. ATCC No.
Aeromonas hydrophila 30187 7966
Clostridium perfringens 756 13375
Enterococcus faecalis 20478 19433
Escherichia coli 30083 11775
Legionella pneumophila 7513 33152
Pseudomonas aeruginosa 50071 10145
2.1.2 Daphnia
The strain of Daphnia magna K34Q used in this study was originally isolated by Prof.
Dr. Winfried Lampert from „Großer Binnensee” in Schleswig-Holstein/Germany
(Lampert, 1991). The Daphnids were obtained from Dr. D. Martin-Creuzburg,
Limnological institute, University of Konstanz and Prof. Dr. R. Tollrian, Animal
ecology, evolution and biodiversity, University of Bochum.
2.1.3 Algae
The unicellular green algae Scenedesmus obliquus (SAG 276-3a) was used for
feeding of Daphnia magna. The algae was obtained from Dr. D. Martin-Creuzburg,
Limnological institute, University of Konstanz.
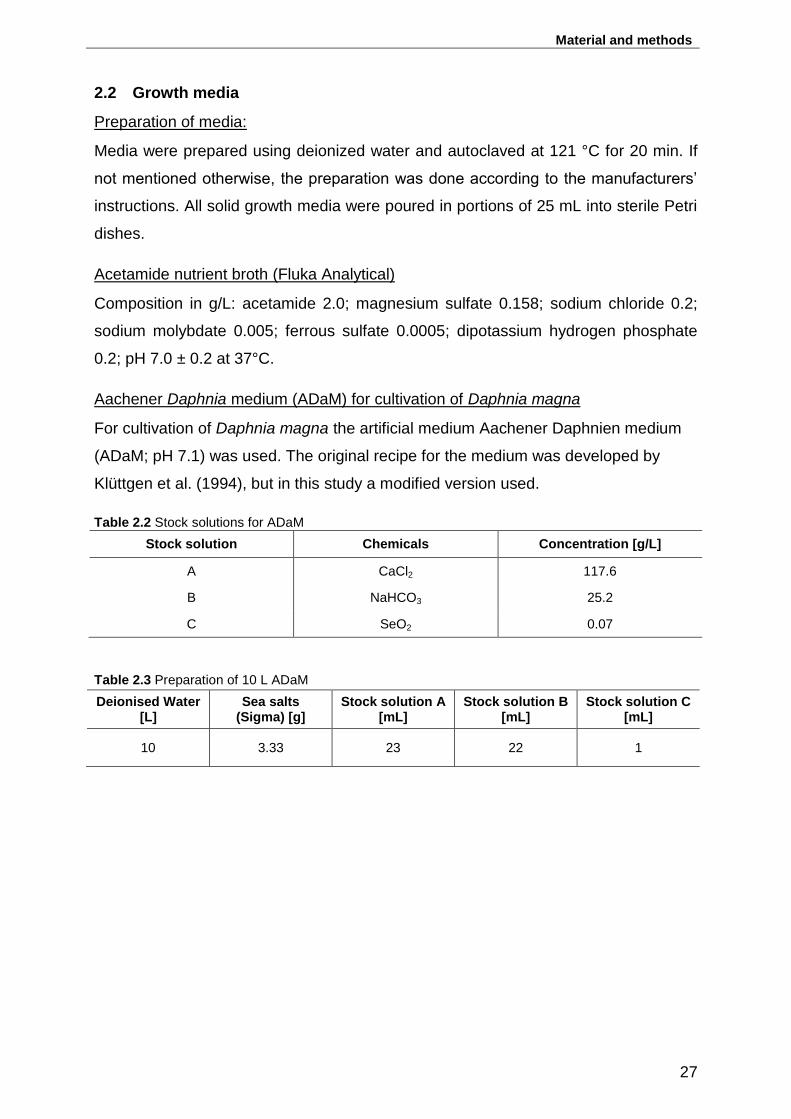
Material and methods
27
2.2 Growth media
Preparation of media:
Media were prepared using deionized water and autoclaved at 121 °C for 20 min. If
not mentioned otherwise, the preparation was done according to the manufacturers’
instructions. All solid growth media were poured in portions of 25 mL into sterile Petri
dishes.
Acetamide nutrient broth (Fluka Analytical)
Composition in g/L: acetamide 2.0; magnesium sulfate 0.158; sodium chloride 0.2;
sodium molybdate 0.005; ferrous sulfate 0.0005; dipotassium hydrogen phosphate
0.2; pH 7.0 ± 0.2 at 37°C.
Aachener Daphnia medium (ADaM) for cultivation of Daphnia magna
For cultivation of Daphnia magna the artificial medium Aachener Daphnien medium
(ADaM; pH 7.1) was used. The original recipe for the medium was developed by
Klüttgen et al. (1994), but in this study a modified version used.
Table 2.2 Stock solutions for ADaM
Stock solution Chemicals Concentration [g/L]
A CaCl2 117.6
B NaHCO3 25.2
C SeO2 0.07
Table 2.3 Preparation of 10 L ADaM
Deionised Water [L]
Sea salts (Sigma) [g]
Stock solution A [mL]
Stock solution B [mL]
Stock solution C [mL]
10 3.33 23 22 1
Material and methods
28
Ampicillin-dextrin agar
According to Havelaar et al. 1987
Composition in g/L: Bacto Agar (Beckton Dickinson) 15.0; dextrin from potato starch
(Fluka analytical) 10.0; Bacto Tryptose (Beckton Dickinson) 5.0; sodium chloride
(VWR) 3,0; yeast extract granulated (Merck) 2.0; potassium chloride (Merck) 2.0;
magnesium sulfate heptahydrate (Fluka analytical) 0.2; iron(III)chloride hexahydrate
(Merck) 0.1.
8 mL of bromothymol blue solution (Merck) was added (10 mg/ml) and pH was
adjusted with NaOH (1 M) to 8.0 ± 0.2 at 25°C.
The medium was autoclaved for 20 min at 121°C, cooled down to 55°C and freshly
prepared, filter sterilized (pore size 0.2 µm) 10 mL of ampicillin sodium salt
(AppliChem) (final conc. 1 mg/ml) and 10 mL of deoxycholic acid sodium salt (Fluka
Analytical) (final conc. 10 mg/ml) were added.
Bile aesculine azide agar (Merck)
Composition in g/L: peptone from casein 17.0; yeast extract 5.0; peptone 3.0; ox bile
dried 10.0; sodium chloride 5.0; aesculine 1.0; ammonium iron(III)citrate 0.5; sodium
azide 0.15; agar-agar 13.0. pH 7.1 ± 0.2 at 25°C.
BCYEα agar (OXOID)
Commercial agar plates, ready-to-use.
Composition in g/L (ISO 11731:1998): yeast extract 10.0, agar 12.0, activated
charcoal 2.0, alpha-ketoglutarate, monopotassium salt 1.0, ACES buffer (N-2-
actetamido-2-aminoethanesulfonic acid) 10.0, potassium hydroxide 2.8, L-cysteine
hydrochloride monohydrate 0.4, iron(III)pyrophosphate 0.25, deionized water ad
1000 mL.
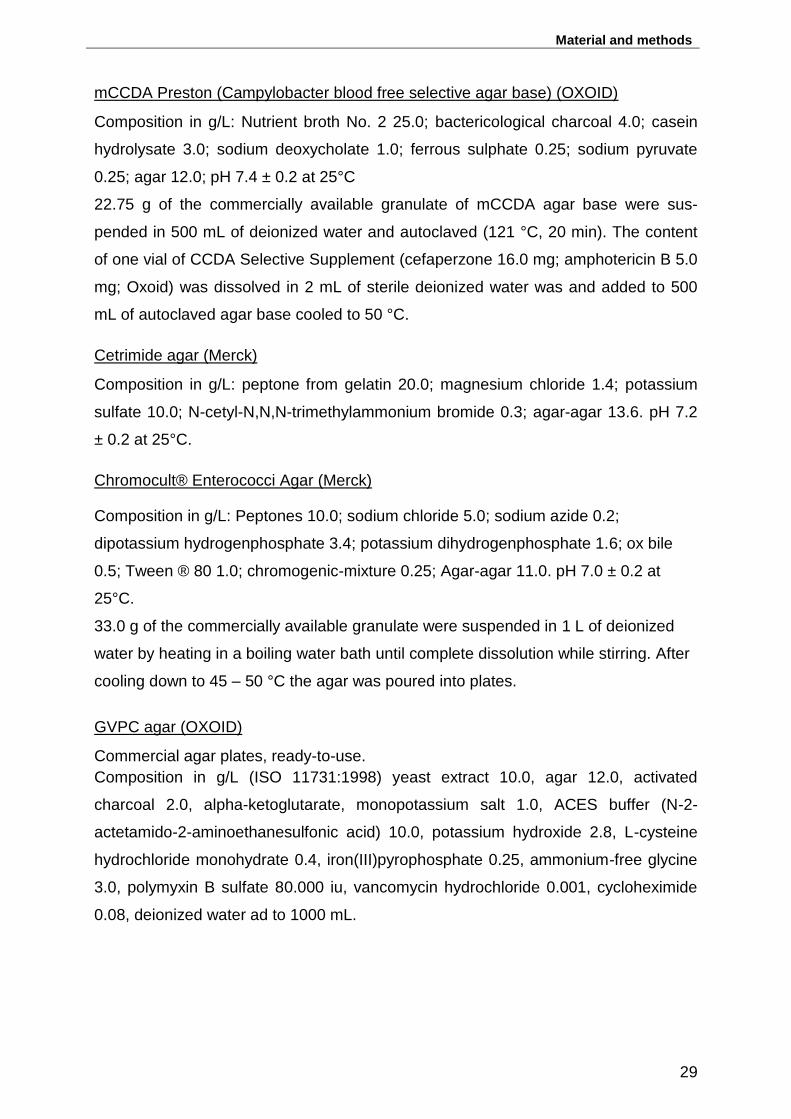
Material and methods
29
mCCDA Preston (Campylobacter blood free selective agar base) (OXOID)
Composition in g/L: Nutrient broth No. 2 25.0; bactericological charcoal 4.0; casein
hydrolysate 3.0; sodium deoxycholate 1.0; ferrous sulphate 0.25; sodium pyruvate
0.25; agar 12.0; pH 7.4 ± 0.2 at 25°C
22.75 g of the commercially available granulate of mCCDA agar base were sus-
pended in 500 mL of deionized water and autoclaved (121 °C, 20 min). The content
of one vial of CCDA Selective Supplement (cefaperzone 16.0 mg; amphotericin B 5.0
mg; Oxoid) was dissolved in 2 mL of sterile deionized water was and added to 500
mL of autoclaved agar base cooled to 50 °C.
Cetrimide agar (Merck)
Composition in g/L: peptone from gelatin 20.0; magnesium chloride 1.4; potassium
sulfate 10.0; N-cetyl-N,N,N-trimethylammonium bromide 0.3; agar-agar 13.6. pH 7.2
± 0.2 at 25°C.
Chromocult® Enterococci Agar (Merck)
Composition in g/L: Peptones 10.0; sodium chloride 5.0; sodium azide 0.2;
dipotassium hydrogenphosphate 3.4; potassium dihydrogenphosphate 1.6; ox bile
0.5; Tween ® 80 1.0; chromogenic-mixture 0.25; Agar-agar 11.0. pH 7.0 ± 0.2 at
25°C.
33.0 g of the commercially available granulate were suspended in 1 L of deionized
water by heating in a boiling water bath until complete dissolution while stirring. After
cooling down to 45 – 50 °C the agar was poured into plates.
GVPC agar (OXOID)
Commercial agar plates, ready-to-use.
Composition in g/L (ISO 11731:1998) yeast extract 10.0, agar 12.0, activated
charcoal 2.0, alpha-ketoglutarate, monopotassium salt 1.0, ACES buffer (N-2-
actetamido-2-aminoethanesulfonic acid) 10.0, potassium hydroxide 2.8, L-cysteine
hydrochloride monohydrate 0.4, iron(III)pyrophosphate 0.25, ammonium-free glycine
3.0, polymyxin B sulfate 80.000 iu, vancomycin hydrochloride 0.001, cycloheximide
0.08, deionized water ad to 1000 mL.

Material and methods
30
LB medium (Lenox Broth)
Composition in g/L: tryptone 10.0, sodium chloride 5.0, yeast extract 5.0 / pH 7.0 ±
0.2 at 25 °C. The compounds were dissolved in deionized water, pH was adjusted to
7.0 ± 0.2 and deionized water was added up to 1 L.
Malachite-green broth (base) (Merck)
Composition in g/L: peptone from meat 5.0; meat extract 3.0; di-potassium hydrogen
phosphate 0.37. pH 7.3 ± 0.2 at 25 °C.
8.4 g (single concentrated broth) and 16.8 g (double concentrated broth) were
dissolved in 1 L deionized water and the solutions were autoclaved (121 °C, 20 min).
0.15 g malachite-green oxalate (Merck) were dissolved in 90 ml, filter sterilized and
12 ml were added to the double concentrated broth base or 6 ml to the single
concentrated broth which was before cooled to 50°C.
m-CP agar (OXOID)
Commercial agar plates, ready to use.
Composition in g/L: tryptose 30.0; yeast extract 20.0; saccharose 5.0; L-Cysteine
hydrochloride 1.0; magnesium sulphate x 7 H2O; bromocresol purple 0.04; agar-agar
15.0; polymyxin B sulphate 0.025; D-Cycloserine 0.4. pH 7.6 ± 0.2 at 25 °C.
Nutrient agar (NA, Merck)
Composition in g/L: peptone from meat 5.0, meat extract 3.0, agar 12.0 / pH 7.0 ± 0.2
at 25 °C.
Preston broth (OXOID)
Composition in g/L: ‘Lab-Lemco’ Powder 10.0; peptone 10.0; sodium chloride 5.0; pH
7.5 ± 0.2 at 25 °C.
12.5 g of the commercially available granulate of Nutrient broth No. 2 (agar base)
were suspended in 500 mL of deionized water and autoclaved (121 °C, 20 min). The
content of one vial of modified Preston Campylobacter Selective Supplement
(polymyxin B 2500/U; trimethoprim 5.0 mg; rifamipicin 5.0 mg; amphotericin B 5.0
mg; Oxoid) was dissolved in 2 mL of sterile deionized water and was added to 500
mL of autoclaved agar base cooled to 50 °C.

Material and methods
31
Pseudomonas Agar F (base) (Merck)
Composition in g/L: peptone from casein 10.0; peptone from meat 10.0; magnesium
sulfate 1.5; di-potassium hydrogen phosphate 1.5, agar-agar 12.0. pH 7.2 ± 0.2 at 25
°C.
Pseudomonas Agar P (base) (Merck)
Composition in g/L: peptone 20.0; magnesium chloride 1.4; potassium sulfate 10.0;
agar-agar 12.6. pH 7.2 ± 0.2 at 25 °C.
Pseudomonas selective agar (CN agar, Oxoid)
Composition in g/L: gelatin peptone 16.0, casein hydrolysate 10.0, potassium sulfate
10.0, magnesium chloride 1.4, agar 11.0 / pH 7.1 ± 0.2 at 25 °C.
24.2 g of the commercially available granulate of Pseudomonas agar base were sus-
pended in 500 mL of deionized water and 5 mL of glycerol were added before auto-
claving (121 °C, 20 min). The content of one vial of Pseudomonas CN supplement
(100 mg cetrimide, 7.5 mg sodium nalidixate; Oxoid) was dissolved in 2 mL of a 1:1
(vol/vol) mixture of ethanol and sterile deionized water and the solution was added to
500 mL of autoclaved agar base cooled to 50 °C.
R2A medium (Difco)
Composition in g/L: yeast extract 0.5, Difco proteose peptone no. 3 0.5, casamino
acids 0.5, glucose 0.5, soluble starch 0.5, sodium pyruvate 0.3, potassium hydrogen
phosphate 0.3, magnesium sulfate heptahydrate 0.05, agar 15.0 / pH 7.2 ± 0.2 at 25
°C.
18.2 g of the commercially available granulate were dissolved in 1 L of deionized
water.
Slanetz & Bartley Medium (OXOID)
Composition in g/l: tryptose 20.0; yeast extract 5.0; glucose 2.0; potassium hydrogen
phosphate dihydrate 4.0; sodium azide 0.4; tetrazolium chloride 0.1; agar 10.0; pH
7.2 ± 0.2 at 25°C.
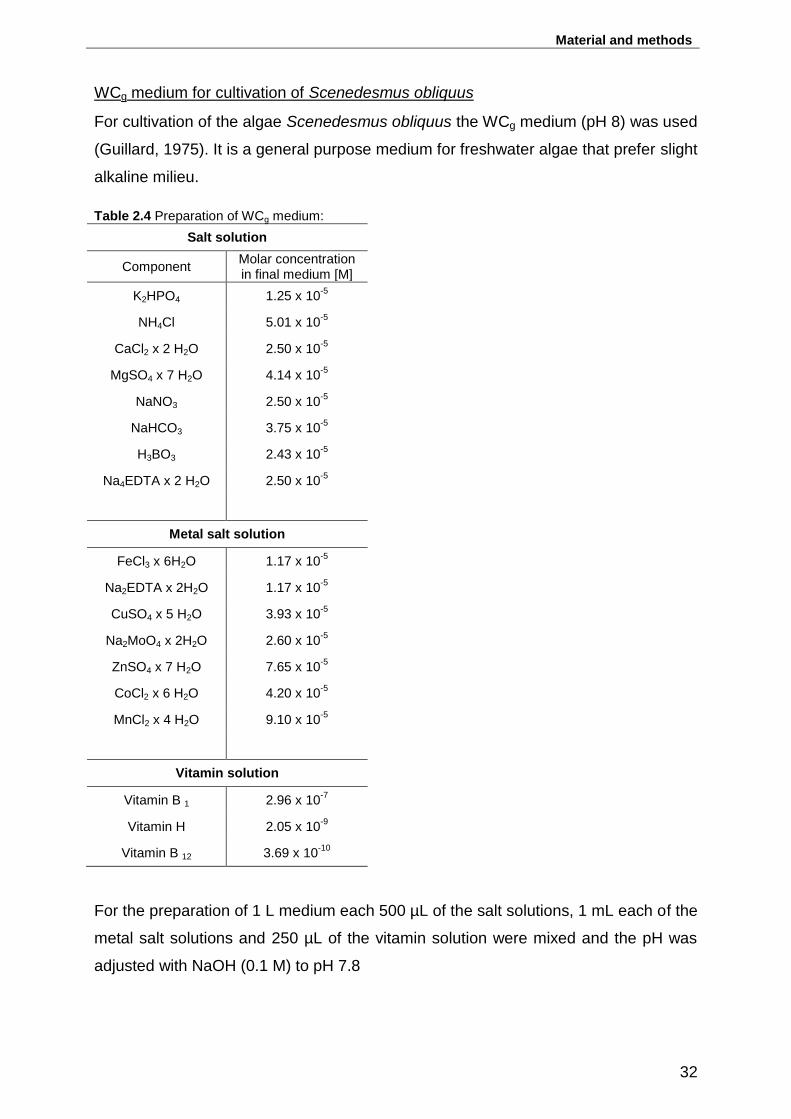
Material and methods
32
WCg medium for cultivation of Scenedesmus obliquus
For cultivation of the algae Scenedesmus obliquus the WCg medium (pH 8) was used
(Guillard, 1975). It is a general purpose medium for freshwater algae that prefer slight
alkaline milieu.
Table 2.4 Preparation of WCg medium:
Salt solution
Component Molar concentration in final medium [M]
K2HPO4 1.25 x 10⁻⁵
NH4Cl 5.01 x 10⁻⁵
CaCl2 x 2 H2O 2.50 x 10⁻⁵
MgSO4 x 7 H2O 4.14 x 10⁻⁵
NaNO3 2.50 x 10⁻⁵
NaHCO3 3.75 x 10⁻⁵
H3BO3 2.43 x 10⁻⁵
Na4EDTA x 2 H2O 2.50 x 10⁻⁵
Metal salt solution
FeCl3 x 6H2O 1.17 x 10⁻⁵
Na2EDTA x 2H2O 1.17 x 10⁻⁵
CuSO4 x 5 H2O 3.93 x 10⁻⁵
Na2MoO4 x 2H2O 2.60 x 10⁻⁵
ZnSO4 x 7 H2O 7.65 x 10⁻⁵
CoCl2 x 6 H2O 4.20 x 10⁻⁵
MnCl2 x 4 H2O 9.10 x 10⁻⁵
Vitamin solution
Vitamin B 1 2.96 x 10⁻⁷
Vitamin H 2.05 x 10⁻⁹
Vitamin B 12 3.69 x 10⁻¹⁰
For the preparation of 1 L medium each 500 µL of the salt solutions, 1 mL each of the
metal salt solutions and 250 µL of the vitamin solution were mixed and the pH was
adjusted with NaOH (0.1 M) to pH 7.8

Material and methods
33
2.3 Buffers and other solutions for general use
0.9 % NaCl solution
9.0 g NaCl were dissolved in 1 L deionized water. The solution was autoclaved for 20
min at 121 °C.
Acid buffer (ISO 11731: 1998)
Solution A: 0.2 M HCl
200 mL 1 M HCl in 800 mL of deionized water.
Solution B: 0.2 M KCl
14.9 g KCl were dissolved in 1 L deionized water.
For preparation 3.9 mL of solution A were mixed with 25 mL of solution B. After
adjusting the pH to 2.2 ± 0.2 with 1 M KOH, the buffer was filter sterilized (pore size
0.2 μL).
DAPI stock solution (25 μg/ml) in 2 % (v/v) formaldehyde
12.5 mg 4’,6-diamidino-2-phenylindole dihydrochloride (DAPI; Sigma) were dissolved
in 500 mL formaldehyde solution (2 %) and filtered through a cellulose acetate filter
(pore size 0.2 μm).
DNA Ladder
MassRuler™ DNA Ladder Mix, ready-to-use, range 80-10000 bp (Fermentas,
SM0403).
Loading Dye
6 x TriTrack™ DNA Loading Dye (Fermentas, R1161).
Composition: 10 mM Tris-HCl (pH 7.6), 0.03% bromophenol blue, 0.03% xylene cya-
nol FF, 0.15% orange G, 60% glycerol, 60 mM EDTA.
Ethidium bromide solution
10 mg/mL (Bio-Rad, 161-0433)
McFarland standard (bioMérieux, 70900)
Particle-free deionised water
Deionized water was filtered through a cellulose acetate filter (pore size 0.2 μm) and
then autoclaved (20 min, 121 °C).

Material and methods
34
2.4 Commercial kits
API®20 NE (bioMérieux, 20 050)
API NaCL 0.85 % Medium (bioMérieux, 20 070) API 20 NE test stripes
JAMES (bioMérieux, 70 542)
NIT 1 + NIT 2 (bioMérieux, 70 442)
Zn reagent (bioMérieux, 70 380)
Mineral oil (bioMérieux, 70 100)
API®Campy (bioMérieux, 20 800)
API NaCL 0.85 % Medium (bioMérieux, 20 070) API Campy test stripes
NIT 1 + NIT 2 (bioMérieux, 70 442)
FB (bioMérieux, 70 562)
NIN (bioMérieux, 70 491)
Mineral oil (bioMérieux, 70 100)
API®rapid ID 32 E (bioMérieux, 32 400)
Aquadien™ Kit (BioRad)
iQ-Check™ Legionella Quantification Standards (BioRad)
iQ-Check™ Screen L. pneumophila Kit (BioRad)
iQ-Check™ Screen Legionella spp. Kit (BioRad)
Quant-iT™ PicoGreen® dsDNA Kit (Invitrogen)
DNeasy Kit (Qiagen)
Material and methods
35
2.5 Chemicals
4’,6-Diamidino-2-phenylindole dihydrochloride (DAPI; Sigma)
50x TAE (TRIS/acetic acid/EDTA) buffer (BioRad)
Agarose (Pulsed Field Certified; Bio-Rad, 162-0137)
Bovine serum albumin (BSA), 100x, 10 mg/mL (New England BioLabs, B9001S)
Calcium chloride dihydrate, ≥ 99 % (Fluka Chemie AG)
di-Sodium tartrate dihydrate, ≥ 99.5 % (Merck)
Ethanol Rotipuran (Roth)
EDTA tetrasodium salt dihydrate, ≥ 99 % (Sigma-Aldrich)
Ethidium bromide (10 mg/ml) (BioRad)
Folin Ciocalteu’s phenol reagent, 2N (Sigma-Aldrich)
Formaldehyde solution, ~ 36 % in H2O (Fluka, 47630)
Formamide deionised, ≥ 99.5%, p.a (Roth, P040.1)
Glycerol (KMF Laborchemie Handels GmbH)
Humic acid (Fluka Chemie AG)
Loading Dye TriTrack (Fermentas)
Magnesium chloride hexahydrate, grade for analysis (Merck)
Paraformaldehyde (Merck, 1.04005)
Rotipuran Water (Roth, p.a., ACS)
Sodium carbonate, anhydrous, ≥ 99.8 % (Roth)
Sodium dodecyl sulfate (SDS), 99 % (Sigma-Aldrich)
Sodium hydroxide pellets, 99 % (KMF Laborchemie)
TRIS PUFFERAN®, ≥ 99.9 % (Roth)
Water for Molecular Biology (Roth, DPEC treated)

Material and methods
36
2.6 Equipment
Table 2.5 Equipment used in this study
Equipment Manufacturer
Biofuge fresco Heraeus Instruments
Cary 50 Bio UV-Visible Spectrophotometer Varian
Centrifuge 5415 D Eppendorf
Filtropur S plus 0.2 membrane filters, 0.20 µm porosity
Sarstedt
Electrophoresis chamber HE 33 mini horizontal submarine unit
Amersham Biosciences
iCycler BioRad
iQTM5 Multicolor Real-Time PCR Detection System
BioRad
LabelGuardTM Microliter Cell Implen
Leica DMLS Leica Microsystems Wetzlar GmbH
Microseal® ‘B’ Film BioRad
Molecular Imager Gel Doc XR System BioRad
Omnifix 10 ml syringe B. Braun Melsungen AG
PCR plates, 96-well BioRad
Polycarbonate membrane filters, white, 0.40 µm porosity
Millipore
Power Supply Pack P25 Biometra
SFM 25 A fluorescence spectrophotometer Kontron Instruments
Thermomixer comfort Eppendorf
Cooling centrifuge, Sorvall® RC26PLUS Sorvall
Bactident® Oxidase Test Strips Merck, 1.13300
Black polycarbonate membrane filters, pore size 0.2 μm
Millipore
Desk centrifuge 5415 D Eppendorf
Disposable Bottle Top Filter OR, non-fiber releasing membrane, surfactant free cellulose acetate pore size 0.20 μm
NALGENE®
Disposable cuvettes PMMA semi-micro, 12.5 × 12.5 × 45 mm
BRAND, 7591 15
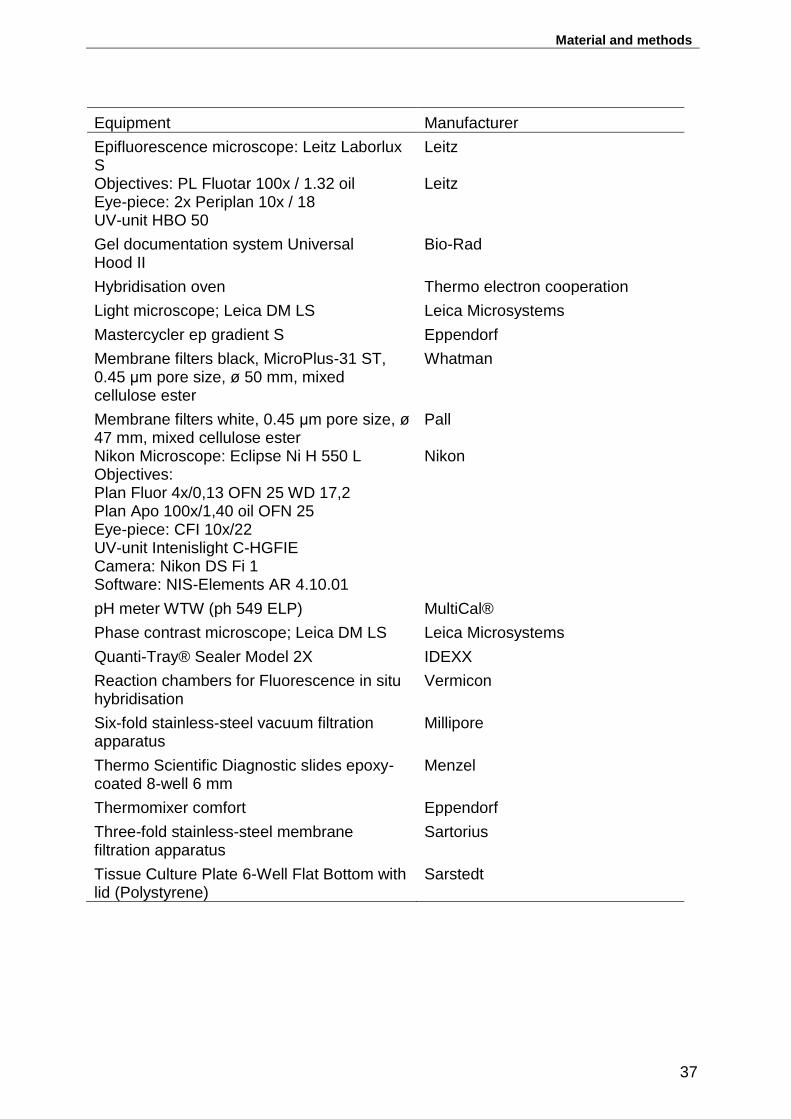
Material and methods
37
Equipment Manufacturer
Epifluorescence microscope: Leitz Laborlux S Objectives: PL Fluotar 100x / 1.32 oil Eye-piece: 2x Periplan 10x / 18 UV-unit HBO 50
Leitz Leitz
Gel documentation system Universal Hood II
Bio-Rad
Hybridisation oven Thermo electron cooperation
Light microscope; Leica DM LS Leica Microsystems
Mastercycler ep gradient S Eppendorf
Membrane filters black, MicroPlus-31 ST, 0.45 μm pore size, ø 50 mm, mixed cellulose ester
Whatman
Membrane filters white, 0.45 μm pore size, ø 47 mm, mixed cellulose ester Nikon Microscope: Eclipse Ni H 550 L Objectives: Plan Fluor 4x/0,13 OFN 25 WD 17,2 Plan Apo 100x/1,40 oil OFN 25 Eye-piece: CFI 10x/22 UV-unit Intenislight C-HGFIE Camera: Nikon DS Fi 1 Software: NIS-Elements AR 4.10.01
Pall Nikon
pH meter WTW (ph 549 ELP) MultiCal®
Phase contrast microscope; Leica DM LS Leica Microsystems
Quanti-Tray® Sealer Model 2X IDEXX
Reaction chambers for Fluorescence in situ hybridisation
Vermicon
Six-fold stainless-steel vacuum filtration apparatus
Millipore
Thermo Scientific Diagnostic slides epoxy-coated 8-well 6 mm
Menzel
Thermomixer comfort Eppendorf
Three-fold stainless-steel membrane filtration apparatus
Sartorius
Tissue Culture Plate 6-Well Flat Bottom with lid (Polystyrene)
Sarstedt

Material and methods
38
2.7 Software
Table 2.6 Software used in this study.
Software Manufacturer
Microsoft Office Excel 2003/2010 Microsoft Deutschland GmbH, Unterschleißheim, Germany
iQTM5 Optical System Software 2.0 BioRad, Hercules, CA, USA
Simple Reads 2.0 Varian Australia Pty Ltd., Mulgrave, VIC, Australia
Quantity One 4.6.3 BioRad, Hercules, CA, USA
Win UV Scan Varian Australia Pty Ltd., Mulgrave, VIC, Australia
Chromas Version 2.01
Technelysium Pty Ltd, Australia
APILAB Plus V 3.3.3 bioMérieux

Material and methods
39
2.8 Sampling of water and plankton at Lake Baldeney
Water and plankton samples were obtained from Lake Baldeney (Essen, Germany),
the lowermost reservoir within the course of the River Ruhr. Between April and
September 2010, six successive sampling events were deployed at monthly intervals.
At each event, three different transects (T1, T2, T3) across the lake (from the
northern to the southern shore) were sampled (Figure 2.2). Sampling included the
collection of one water sample (at T1 only) and the collection of zoo- and
phytoplankton at all transects. This lead to a total of 42 samples (18 each for zoo-
and phytoplankton plus 6 water samples).
Physico-chemical parameters (pH value, air temperature, water temperature, electric
conductivity and oxygen concentration) were measured on-site halfway along each
transect while water samples were taken at the same spot (T1 only), approximately
30 cm below the water surface using glass bottles. Additionally to surface water
samples, samples were also taken at the lake bottom with a ‘Ruttner Schöpfer’
(Figure 2.1) and the depth was measured with an ultrasonic sensor.
Figure 2.1 Ruttner Schöpfer for sampling of water at the lake bottom (Hydro-Bios Apparatebau GmbH,
Kiel, Germany)

Material and methods
40
Sampling of plankton was carried out using different plankton nets for phytoplankton
(55 µm) and zooplankton (200 µm) along diagonal hauls from the lake bottom up to
the surface. Therefore, the plankton net was first lowered until it almost reached the
lake ground (depth measured before using an ultrasonic sensor) and then slowly
lifted while the boat slowly moved toward the opposite lake shore. After each haul,
the net was emptied and its content transferred into polyethylene containers (200 ml).
Altogether four replicate samples (2–4 hauls each) were taken, two of which were
further processed for bacterial analysis and the other two for identification. Plankton
samples for indentification were fixed and preserved in Lugol´s fluid (5%), while
plankton samples for bacteriological analysis were transported alive without
preservation (but cooled at 4° C). All sampling and transport was done following DIN
EN ISO 19458 (2006) and processed within 6 h after sampling.
Once arrived at the laboratory, plankton samples for bacteriological analysis were
filtered through a piece of gauze (Hydro-Bios Germany, mesh size 55 µm) and the
wet weight of the biomass was measured. Plankton was then resuspended in defined
volumes of sterile and filtered (pore size 0.2 µm) lake water and homogenised by
stirring on a magnetic stirrer for 5 min. Water samples and homogenised plankton
suspensions were immediately subjected to cultural methods and DNA extraction or
stored in the dark at -20 °C until further analysis.

Material and methods
41
Figure 2.2 Overview of the sampling procedure (A) Plankton nets are hauled along a transect to harvest phytoplankton and zooplankton, respectively; (B) Plankton is recovered in a sterile polyethylene bottle by opening a valve at the lower end of the plankton net; (C) Collection of water samples in sterile glass bottles; (D) Schematic overview of Lake Baldeney. Red lines indicate transects 1, 2, and 3. The retaining wall impounding the River Ruhr is indicated as a black line. Flow direction is from East (right) to West (left). (Source A – C: J. Wingender, Biofilm Centre, University of Duisburg-Essen)
Material and methods
42
2.8.1 Identification of plankton organisms
The preserved plankton samples were separated into zooplankton and phytoplankton
and identified under a dissecting microscope or binoculars (Olympus SZ 51 and BX
51). Dominant taxa (abundance >5%) were identified to the lowest possible
taxonomic level.
Phytoplankton density was determined by averaging the counts of five replicate
subsamples (10 µL each). The subsamples were fully processed under the
microscope. Zooplankton samples were fully processed and counted (without sub-
sampling). Identification of phytoplankton followed recommendations of Mischke and
Behrendt (2007), which is the most recent standard for phytoplankton identification in
Central Europe and DGL (2007). Zooplankton species (Rotatoria, Copepoda,
Cladocera) were identified using Kiefer & Fryer (1978).
2.8.2 Determination of plankton mass and sample preparation
For the determination of the wet weight of the obtained plankton masses, both
plankton samples were each filtered through a net (mesh size 55 µm) and weighed
with an analytical balance. Furthermore the plankton samples were washed one time
in filter-sterilized lake water (0.2 µm) and resuspended in 600 mL of filter-sterilized
lake water and stirred on a magnetic stirrer for 5 min. Additionally a ‘plankton-free’
water sample was investigated which was a water sample that was filtered through a
55 µm plankton net.
2.9 Sampling and preparation of Elodea nuttallii from Lake Baldeney
Additionally the neophyte Elodea nuttallii which showed massive growth at Lake
Baldeney in 2009 was sampled. Therefore floating plants at the surface of the lake
were collected and transported in sterile flasks (according to DIN EN ISO 19458,
2006). For preparation the water plant was washed one time in filter-sterilized lake
water and afterwards suspended in filter-sterilized lake water and stirred on a
magnetic stirrer for 5 min. The determination of the dry residue and water content
was done according to DIN EN 12880 (2000) and the loss of ignition of the dry mass
was determined according to DIN EN 12879 (2000).

Material and methods
43
2.10 Microbiological methods
2.10.1 Determination of total cell count
4 mL of diluted or undiluted sample were mixed with 1 mL DAPI solution (25 μg/mL)
in 2 % (v/v) formaldehyde and incubated at room temperature for 20 min in the dark.
Afterwards the solution was filtered through a black polycarbonate membrane filter
(0.2 μm pore size, Milipore) using a six-fold vacuum filtration apparatus. The filter
was stored at 4 °C in the dark until enumeration (Hobbie et al., 1977).
The cells counts were determined using an epifluorescence microscope at 1000-fold
magnification with immersion oil. 20 randomly selected fields of view were examined
for each filter with the help of a counting grid (100 μm x 100 μm). Results are given
as cells/mL.
2.10.2 Determination of heterotrophic plate count (HPC)
Decimal dilutions of water samples and plankton suspensions were prepared in
sterile particle-free deionized water and plated in triplicate on R2A agar to determine
the HPC (Reasoner and Geldreich, 1985). Colonies were enumerated. After 7 d of
incubation at 20 °C colonies were enumerated. Plates with colony numbers between
30 and 300 were considered for enumeration, Results are given as colony-forming
units (cfu)/mL or g wet weight.
2.10.3 Determination of culturable Pseudomonas aeruginosa
P. aeruginosa was quantified according to the standard DIN EN ISO 16266 (2008) by
filtering 10 ml and 1 mL of water samples or plankton suspensions through 47 mm
mixed cellulose ester membrane filters with a pore size of 0.45 μm (Pall). Filters were
transferred onto CN agar and the plates were incubated at 36 °C for 48 hours. Plates
with colony numbers between 20 and 200 were considered for enumeration. Results
are expressed as cfu/mL or g wet weight.
Additionally detection by liquid enrichment in malachite green broth in MPN scale
was done according to DIN 38411 part 8 (1982). Single and double concentrated
broth was used in 3 different volumina in fivefold approach. The analyzed volume
amounted 249.75 mL in total.

Material and methods
44
Table 2.7 Approaches of Malachite green broth MPN method
Sample Malachite green broth
Approach volume (mL) volume (mL) concentration
1 45 45 double
2 4.5 4.5 double
3 0.45 10 single
The broth was incubated at 36°C for 48 hours. All yellow and turbid approaches were
subcultured on Cetrimide Agar. Afterwards typical colonies were streaked onto
Pseudomonas-Agar P (PAP) and Pseudomonas Agar F (PAF) incubated at 36°C for
48 hours. On PAF and PAP agar plates the colonies were observed for fluorescence
under UV light and blue-green (pyocyanine) or red-brownish (pyorubine)
pigmentation.
Additionally typical colonies were inoculated in acetamide broth incubated at 36°C for
22 hours. For confirmation a drop of Nessler´s reagent was added to the acetamide
broth after incubation, a positive result was proven if a yellow or brick-red precipitate
occurred.
By means of positive confirmed results the concentration of P. aeruginosa in 250 mL
was determined with the help of a MPN table (Klug, M., 2004; Diploma thesis).
2.10.4 Determination of culturable coliforms and Escherichia coli
Quantification of total coliforms and E. coli was performed using the Colilert-18
Quanti-Tray®/2000 system (IDEXX). One vial of the Colilert-18 reagent was
dissolved in 100 mL of the diluted or undiluted water and plankton samples and
subsequently transferred into a Quanti-Tray®. The Tray was sealed and incubated at
36 °C for 19 ± 1 h. Positive (yellow colored (coliforms) or fluorescent (E. coli) wells
were enumerated and the number was converted to MPN/100 mL or per g wet weight
according to the manufacturer’s instruction.

Material and methods
45
2.10.5 Determination of culturable Enterococcus spp.
Quantification of Enterococccus spp. was carried out according to the standard DIN
EN ISO 7899-2 (2000). Sample volumes of 100 mL and 10 mL water samples or
plankton suspensions were filtered through 47 mm mixed cellulose ester membrane
filters with a pore size of 0.45 μm (Pall).Filters were transferred onto Slanetz &
Bartley agar and the plates were incubated at 36 °C for 44 hours. All red or red-
brownish colonies were counted and the filters were transferred onto pre-warmed
bile-aesculine-azide agar plates and incubated at 44°C for 2 hours. Results were
confirmed if typical colonies developed a visible black corona in the agar medium.
Plates with colony numbers between 20 and 200 were considered for enumeration.
Results are expressed as cfu/mL or g wet weight.
2.10.6 Determination of culturable Legionella spp.
Legionella spp. was quantified according to the standard ISO 11731 (1998).
2 ml of the water samples and plankton suspensions were centrifuged for 10 min at
6000 x g and 4 °C. Half volume of the supernatant was discarded and replaced by an
equal volume of acid buffer (pH 2.2).
The pellet was resuspended and the suspension was incubated at room temperature
for 5 min. After incubation, the suspension was spread-plated in tripiclate and
incubated at 36 °C for up to 10 days. Plates with colony numbers between 30 and
300 were considered for enumeration. Results are expressed as cfu/mL or g wet
weight.
Additionally 100, 10 and 1 mL of the samples were filtered through black 50 mm
mixed cellulose ester membrane filters with a pore size of 0.45 μm (Whatman) and
treated with 10 mL of acid buffer (pH 2.2) for 5 min. Afterwards the filters were rinsed
with 10 mL of sterile deionised water and placed onto GVPC agar. Plates were
incubated for up to 10 days at 36 °C. Plates with colony numbers between 20 and
200 were considered for enumeration. Results are expressed as cfu/mL or g wet
weight.

Material and methods
46
2.10.7 Determination of culturable Campylobacter spp.
For qualitative determination of Campylobacter spp. (according to ISO 17995 (2005))
volumes of 100 ml and 200 ml water samples and plankton suspensions were filtered
through 47 mm mixed cellulose ester membrane filters with a pore size of 0.45 μm
(Pall) and transferred into bottles with 100 ml Preston broth. Incubation occurred in
anaerobic jars under microaerophilic conditions (Anaerocult C, Merck) at 36°C for 48
hours. Afterwards 10 µL of the Bouillon were streaked onto mCCDA-Agar and
incubated under microaerophilic conditions at 42°C for 48 hours.
Grown colonies were streaked in duplicate onto nutrient agar plates and incubated at
42°C for 24 hours, one plate under aerobic and the other under microaerophilic
conditions. A positive result is given, when the incubated colonies do not grow under
aerobic conditions.
2.10.8 Determination of culturable Aeromonas spp.
Quantification of Aeromonas spp. was performed according to Havelaar et al. (1987).
The water samples and plankton suspensions were spread-plated (volumes 500 µL
and 100 µL) on ampicillin dextrin agar and incubated at 30°C for 24 hours.
Additionally volumes of 10 mL and 1 mL were filtered through 47 mm mixed cellulose
ester membrane filters with a pore size of 0.45 μm (Pall).Filters were transferred onto
ampicillin dextrin agar and the plates were incubated at 30 °C for 24 hours. Plates
with colony numbers between 30 and 300 (spread-plate method) or between 20 and
200 (membrane filtration) were considered for enumeration. Results are expressed
as cfu/mL.

Material and methods
47
2.10.9 Determination of culturable Clostridium perfringens and their spores
C. perfringens was quantified by membrane filtration according to the German
Drinking Water Ordinance (TrinkwV, 2001). Water samples and plankton suspension
volumes of 100 mL and 10 mL were filtered through 47 mm mixed cellulose ester
membrane filters with a pore size of 0.45 μm (Pall). Filters were transferred onto m-
CP agar (Armon & Payment, 1988) and incubated in anaerobic jars under anaerobic
conditions (Anaerocult A, Merck) at 44°C for 21 hours. All opaque-yellow colonies
were counted and afterwards the plates were exposed to ammonium hydroxide
steam for 30 seconds. All opaque-yellow colonies which turned to pink were
considered for enumeration between 20 and 200. Results are given in cfu/mL or g
wet weight.
Additionally the amount of C. perfringens spores was determined by pasteurisation of
100 mL of each sample at 80°C for 10 min. Afterwards cultivation occurred similar to
those for vegetative cells.
2.11 Characterization of bacterial isolates
2.11.1 Biochemical characterization
P. aeruginosa, A. hydrophila and Campylobacter spp. were identified using the API®
20 NE system and the API® Campy system (bioMérieux), respectively. Intestinal
enterococci and coliforms were identified using API®rapid ID 32 strep and API® 20 E
respectively. Test strips were inoculated according to the manufacturer’s instruction
and incubated at 30 °C for 24 to 48 h (API® 20 NE) or at 36 °C for 24 (API® 20 E) up
to 48 h, microaerophilic (API® Campy), or 36°C for 4 h (API®rapid ID 32).
Identification was performed using the software APILAB Plus V 3.3.3.

Material and methods
48
2.11.2 16S rDNA sequence analysis
2.11.2.1 Isolation of DNA from pure cultures
A concentration of approximately 1.2 x 10⁹ cells/mL (Mc Farland standard 4) was
prepared in 0.9 % NaCl solution with cell material from 24 h old pre-cultures. By
centrifugation (10 min, 5000 x g) the cell material was harvested. The QIAGEN
DNeasy® Blood & Tissue Kit was used following the protocol for DNA isolation from
Gram-negative bacteria. For the final elution of the DNA from the spin column 2 x 100
μL elution buffer were used. The DNA solution was stored at -20°C.
2.11.2.2 Amplification of 16S rDNA fragments
Polymerase chain reaction (PCR) was performed for the amplification of bacterial
16S rDNA gene fragments by use of the primer fd1 and rp2 (Weisburg et al., 1991).
For each reaction the following components were pipetted into a 0.2 mL PCR tube:
Table 2.8: Components and concentrations of the PCR reaction used for bacterial 16S rDNA
amplification
Constituent Final concentration Volume in 50 μL
Primer fd1 50 pM 0.5 μL Primer rp2 50 pM 0.5 μL MasterMix 2.5x 20 μL Taq DNA Polymerase 1.25 U KCl 50 mM Tris-HCl pH 8.3 30 mM Mg(OAc)2 1.5 mM (Mg2+) Igepal®-CA630 0.1% dNTP (each) 200 μM Stabilizers DNA solution (3.3.2.1.) 1 μL H2O (molecular biology grade) 28 μL
Total Volume 50 μL
A negative control without DNA template was included in all PCR reactions.
Table 2.9 The PCR program parameters
Initial Denaturation 94 °C 120 s 30 Cycles: Denaturation 94 °C 60 s Annealing 59 °C 60 s Elongation 72 °C 90 s Final Elongation 72 °C 5 min Cooling 4 °C

Material and methods
49
2.11.2.3 DNA sequencing and comparative sequence analysis
The cleaned PCR products were sent to Sequence Laboratories Göttingen GmbH
(Göttingen, Germany). For sequencing 10 μL of DNA with a concentration of 80 ng/μl
and 10 μL of the forward primer fd1 with a concentration of 10 pM/μL were sent.
By use of the software Chromas Version 2.01 (Technelysium Pty Ltd, Australia)
sequence data were edited and processed. Identification of microbial species
was performed using the nucleotide-nucleotide Blast service available at the website
of the National Center for Biotechnology Information
(http://www.ncbi.nlm.nih.gov/BLAST/).
The nucleotide sequence was compared to sequence databases and the most
significant statistical match was considered (Altschul et al., 1997). A sequence match
of more than 97% implies relation on species level, a minimum of 95% sequence
homology was set to signify relation on genus level (Angenent et al. 2005).

Material and methods
50
2.12 Molecularbiological methods
2.12.1 Buffers and solutions for polymerase chain reaction (PCR)
dNTP Mix
Commercial ready-to-use reagent mix (5 Prime, 2201200).
10 mM of each dNTP.
MasterMix 2.5x
Commercial ready-to-use reagent mix (5 Prime, 2200100).
Composition: 62.5 U/μL Taq DNA Polymerase, 125 mM KCl, 0.5 % ®-CA630, 75 mM
Tris-HCl (pH 8.3), 3.75 mM Mg2+ (Mg(OAc)2), , 500 μM dNTP (each), 0.25% Igepal,
stabilizers.
Table 2.10 Primers
Primer Sequence Reference
fd1 5’-AGA GTT TGA TCC TGG CTC AG-3’ Weisburg et al., 1991 rp2 5’-ACG GCT ACC TTG TTA CGA CTT-3’ Weisburg et al., 1991
Primers were obtained as lyophilisates from Eurofins MWG Operon (Ebersbach, Germany).
Taq buffer advanced
Commercial ready-to-use reagent mix (5 Prime, 2201240).
10x concentrated with 15 mM Magnesium.
Taq DNA Polymerase (5 U/μL; 5 Prime, 2200000).
Taq Master PCR Enhancer
Commercial ready-to-use reagent mix (5 Prime, 2201250).
5x concentrated.
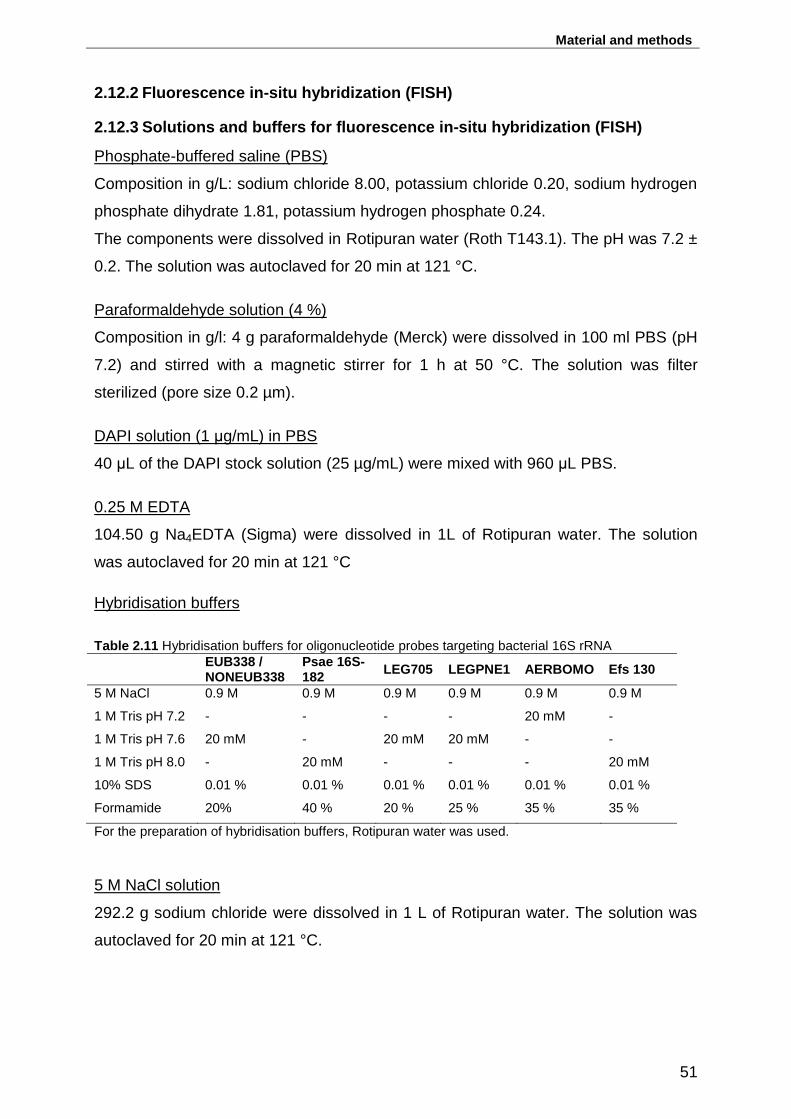
Material and methods
51
2.12.2 Fluorescence in-situ hybridization (FISH)
2.12.3 Solutions and buffers for fluorescence in-situ hybridization (FISH)
Phosphate-buffered saline (PBS)
Composition in g/L: sodium chloride 8.00, potassium chloride 0.20, sodium hydrogen
phosphate dihydrate 1.81, potassium hydrogen phosphate 0.24.
The components were dissolved in Rotipuran water (Roth T143.1). The pH was 7.2 ±
0.2. The solution was autoclaved for 20 min at 121 °C.
Paraformaldehyde solution (4 %)
Composition in g/l: 4 g paraformaldehyde (Merck) were dissolved in 100 ml PBS (pH
7.2) and stirred with a magnetic stirrer for 1 h at 50 °C. The solution was filter
sterilized (pore size 0.2 µm).
DAPI solution (1 μg/mL) in PBS
40 μL of the DAPI stock solution (25 µg/mL) were mixed with 960 μL PBS.
0.25 M EDTA
104.50 g Na4EDTA (Sigma) were dissolved in 1L of Rotipuran water. The solution
was autoclaved for 20 min at 121 °C
Hybridisation buffers
Table 2.11 Hybridisation buffers for oligonucleotide probes targeting bacterial 16S rRNA
EUB338 / NONEUB338
Psae 16S-182
LEG705 LEGPNE1 AERBOMO Efs 130
5 M NaCl 0.9 M 0.9 M 0.9 M 0.9 M 0.9 M 0.9 M
1 M Tris pH 7.2 - - - - 20 mM -
1 M Tris pH 7.6 20 mM - 20 mM 20 mM - -
1 M Tris pH 8.0 - 20 mM - - - 20 mM
10% SDS 0.01 % 0.01 % 0.01 % 0.01 % 0.01 % 0.01 %
Formamide 20% 40 % 20 % 25 % 35 % 35 %
For the preparation of hybridisation buffers, Rotipuran water was used.
5 M NaCl solution
292.2 g sodium chloride were dissolved in 1 L of Rotipuran water. The solution was
autoclaved for 20 min at 121 °C.

Material and methods
52
Table 2.12 Oligonucleotide probes
Probe Sequence Specific for Reference
EUB338 5’-GCT GCC TCC CGT AGG AGT-3'
Eubacteria Amann et al., 1990
NONEUB338 5’-CGA CGG AGG GCA TCC TCA-3'
negative control Wallner et al., 1993
Psae16S-182 5’-CCA CTT TCT CCC TCA GGA CG- 3’
P. aeruginosa Wellinghausen et al., 2005
LEGPNE1 5’-ATC TGA CCG TCC CAG GTT- 3’
L. pneumophila Grimm et al., 1998
LEG705 5’-CTG GTG TTC CTT CCG ATC- 3’
Legionella spp. Manz et al., 1995
AERBOMO 5’-CTA CTT TCC CGC TGC CGC C-3’
A. hydrophila Bomo et al. 2004 Kämpfer et al., 1996
Efs 130 5’-CCCTCTGATGGGTAGGTT-3’ E. faecalis Meier et al. 1997
All oligonucleotide probes were Cy3-labelled at the five prime end and HPLC cleaned. Probes were
obtained as lyophilisates from Eurofins MWG Operon (Ebersbach, Germany).
Oligonucleotide probe solutions
Lyophilisates were dissolved in water for molecular biology (Roth) to a final concen-
tration of 1 μg/μL. Then stock solutions of the specific probes were prepared by
diluting the dissolved lyophilisates with water for molecular biology to a final con-
centration of 50 μg/μL.
For preparation of the working solutions stock solutions were diluted 1:10 in the
appropriate hybridisation buffer.
10 % (w/v) SDS
10 g SDS (sodium dodecyl sulfate; Riedel de Haen) were dissolved in 100 mL
Rotipuran water and the solution was filter sterilized (pore size 0.2 μm).
1 M Tris-buffer pH 7.2/pH 7.6/pH 8.0
121.14 g Tris(hydroxymethyl)-aminomethane (Roth) were dissolved in 1 L of Rotipu-
ran water and the pH was adjusted to pH 7.6 or pH 8.0 ± 0.2 with 7 M hydrochloric
acid. The solution was autoclaved for 20 min at 121 °C.

Material and methods
53
Table 2.13 Washing buffers for oligonucleotide probes targeting bacterial 16S rRNA
EUB338 /
NONEUB338 Psae 16S-
182 LEG705 LEGPNE1 AERBOMO Efs 130
1 M Tris pH 7.2
- - - - 20 mM -
1 M Tris pH 7.6
20 mM - 20 mM 20 mM - -
1 M Tris pH 8.0
- 20 mM - - - -
5 M NaCl
225 mM 56 mM 225 mM 160 mM 40 mM 80 mM
0.25 M EDTA
- 5 mM - 5 mM 5 mM 5 mM
10% SDS
0.01 % 0.01 % 0.01% 0.01% 0.01% 0.01%
For the preparation of washing buffers, Rotipuran water was used.
FISH was performed using the probe EUB338 for the detection of Eubacteria (Amann
et al., 1990), Psae16S-182 for P. aeruginosa. Leg 705 for Legionella spp. and
LEGPNE1 for the detection of L. pneumophila (Grimm et al., 1998), AERBOMO for A.
hydrophila (Bomo et al. 2004) and Efs 130 for E. faecalis (Meier et al., 1997).
As a negative control a nonsense probe complementary to the sequence of probe
EUB338, NONEUB338 (Wallner et al., 1993) was used.
Fixation. By centrifugation (10 min, 6000 x g, 4 °C) cells were harvested and the
supernatant was discarded. The pellet was resuspended in half the volume of 4 %
paraformaldehyde in phosphate-buffered saline (PBS), pH 7.2 and incubated for
fixation at 4°C for 1 h. Afterwards the suspension was centrifuged (5 min, 6000 x g, 4
°C), the supernatant was discarded and the pellet was washed once in PBS.
After centrifugation (5 min, 6000 x g, 4 °C) the supernatant was discarded and the
pellet was resuspended in a mixture of PBS and ethanol absolute (1:1) and stored at
-20°C.
FISH procedure. The fixed samples (10 µL) of bacterial suspensions were pipetted
onto epoxy-coated 8-well diagnostic slides (Thermo Scientific) and air-dried. By
dipping the slides into 50 %, 80 % and 96 % ethanol (3 min for each step) the
samples were dehydrated. After air-drying hybridization was conducted by adding 10
μL of hybridisation buffer containing 5 ng/μL of the respective oligonucleotide probe
to the samples fixed slides. Hybridization took place in a humid reaction chamber
(Vermicon) at 46 °C for 90 min. Afterwards the 8-well diagnostic slides were
transferred into reaction chambers containing 25 mL to 46°C pre-heated (48 °C for

Material and methods
54
Efs 130) washing buffer and incubated at 46 °C for 15 min (5 min. for Efs 130). Then
the slides were washed in deionised water, air-dried and bacterial cells were
counterstained by adding 10 μL of DAPI (1 μg/mL) to each well and incubating for 20
min at room temperature in the dark. The diagnostic slides were washed in deionised
water and stored at 4 °C in the dark until enumeration of cells. For enumeration an
epifluorescence microscope at 1000-fold magnification was used and 20 randomly
selected fields of view or at least 200 cells were enumerated for each filter with the
help of a counting grid (100 μm x 100 μm). The percentage of FISH-positive bacteria
was calculated in relation to the number of DAPI stained cells.

Material and methods
55
2.12.4 Quantitative PCR
2.12.5 Solutions and buffers for qPCR
Reagents
Table 2.14 Ready-made qPCR reagents
qPCR reagent Manufacturer
MaximaTM
SYBR Green/Fluorescein qPCR Master Mix (2X)
Fermentas, St. Leon-Rot, Germany
qPCR probe dilution buffer (10 mM TRIS-Cl, 1 mM EDTA, pH 8)
Eurofins MWG Operon, Ebersberg, Germany
TaqMan Exogeneous Internal Positive Control Reagents (10X Exo IPC Mix, 10X Exo IPC Block, 50X Exo IPC DNA)
Applied Biosystems, Darmstadt, Germany
VeriQuestTM
Probe qPCR Master Mix (2X) USB/Affymetrix, High Wycombe, UK
Oligonucleotides
The following oligonucleotides were used in this study (kit components are not listed):
- Forward primer Pa23FP (Eurofins MWG Operon, Ebersberg, Germany)
- Reverse primer Pa23RPb (Eurofins MWG Operon, Ebersberg, Germany)
- TaqMan probe Pa23FAM (Eurofins MWG Operon, Ebersberg, Germany)
Stock solutions (100 pmol/µL) of the primers Pa23FP and Pa23RPb, and the
TaqMan probe Pa23FAM were stored at -20 °C in the dark. The sequences of the
oligonucleotides used in this work are listed in Table 2.15.
Table 2.15 Sequences of oligonucleotides
Oligoname Sequence Reference
Pa23FPa
5’-TCCAAGTTTAAGGTGGTAGGCTG-3’ Schwartz et al., 2006; Volkmann et al., 2007
Pa23RPba
5’-ACCACTTCGTCATCTAAAAGACGAC-3’ Volkmann et al., 2007
Pa23FAMb
FAM-5’-AGGTAAATCCGGGGTTTCAAGGCC-3’-TAMRA
Schwartz et al., 2006; Volkmann et al., 2007
a Primer. b TaqMan probe.
Enzymes and proteins
Table 2.16 Enzymes and other proteins (enzymes contained in ready-made PCR reagents are not listed)
Enzyme Concentration Manufacturer
Bovine serum albumin (BSA) 10 mg ml-1
New England Biolabs, Frankfurt am Main, Germany
KU: Kunitz unit(s).

Material and methods
56
Isolation and purification of DNA with Aquadien™ DNA extraction Kit (Bio Rad)
According to the protocol for dirty water samples provided by the manufacturer, 50 ml
of each sample were concentrated by filtration using white 0.40-µm-pore-diameter
polycarbonate membrane filters. Filters were placed in a tube containing lysis buffer.
Lysis of cells was performed in the presence of thermal shock by incubating for 15
min at 95 °C. The filter was removed and the lysate was stored for 24 h at 2 °C to 8
°C to allow the resin of the lysis buffer to settle. Using 1 ml of supernatant, DNA was
purified by ultrafiltration and adsorption on a silica column, and eluted into a final
volume of 100 µl using elution buffer. Centrifugation time was extended to ensure
that all supernatant was filtered through the column. Centrifugation speed remained
constant for all samples. For samples containing high amounts of plankton material
(heavily-loaded samples), 1 ml supernatant was split and processed in two separate
columns (500 µl each). After pooling both eluates, a final volume of 200 µl was
obtained. These DNA extracts were stored at -20 °C until analysis.
Cells from pure cultures of all bacterial strains each were suspended in deionised
water to obtain a bacteria concentration of 106 cells litre-1 and 5×10⁵ cells litre-1 for
Legionella spp. and Pseudomonas aeruginosa, respectively. DNA extraction was
performed according to the AquadienTM Kit protocol for drinking water samples.
Z-values
The Z value is a theoretical factor that compensates for DNA loss during DNA extrac-
tion and represents the fraction of the initial sample analysed in each PCR assay. It
was calculated for every method and was 32 for the AquadienTM Kit (64 for heavily-
loaded samples).
Determination of DNA quantitiy
DNA yield was quantified using the PicoGreen assay Quant-iTTM PicoGreen® dsDNA
Kit according to the manufacturer’s instructions. DNA extracts were limited in volume,
they had to be diluted in TE (1X) buffer 100-fold or 1,000-fold, respectively.
Fluorescence was detected using a fluorescence spectrophotometer (SFM 25 A
fluorescence spectrophotometer, Kontron Instruments, Mila, Italy).

Material and methods
57
Quantitative real-time PCR
Quantitative real-time PCR (qPCR) was performed using an iCycler combined with
an iQTM5 Multicolor Real-Time PCR Detection System (Bio Rad). Samples were
introduced into the cycler in 96-well plates that were sealed with transparent, self-
adhesive film, and analysed in duplicates.
Legionella spp. and L. pneumophila
Legionella qPCR was carried out using commercially available iQ-CheckTM kits (Bio
Rad) for the detection of Legionella spp. and L. pneumophila, respectively. Each kit
provided a target DNA-specific FAM-labelled (FAM-490) molecular beacon probe,
and a Texas-Red-labelled (TexasRed-575) probe as the internal control DNA. By
mixing the amplification mix and the probe solution in a ratio (8:1) defined by the
manufacturer, a PCR reaction mix was created. For each sample, 45 µl of PCR
reaction mix were pipetted in a well, and 5 µl sample of extracted DNA were added
(according to manufacturers´ instructions). In the event of PCR inhibition detected by
validation of the Texas Red signal, samples were diluted in molecular-grade water.
Each qPCR run accommodated a no-template control (5 µl molecular-grade water), a
positive, and a negative control (both supplied in the kit; 5 µl of each). For
quantification, a set of four L. pneumophila DNA standards (QS1 – QS4 PCR
standards, supplied in the kits; 5 µl of each), corresponding to a DNA concentration
range of 15 genome units (GU) to 3×10⁴ GU per assay, was applied. A 3-step PCR
was run for 50 cycles following initial UDG treatment as well as a denaturing step at
95 °C for 15 min (Table 2.17). Fluorescence emission by the FAM-labelled probe at a
wavelength of 530 nm resulting from excitation at 490 nm was measured after each
annealing step. The Texas Red signal was monitored simultaneously.
Table 2.17 Temperature protocol used in Legionella qPCR.
Cycle Step Temperature [°C] Time [min]
1a
50 02:00
2b
95 15:00
3 - 52 1 95 00:15
2c 55 00:30
3 72 00:30
a Uracil-DNA Glycosylase inactivation.
b Hot-start polymerase activation.
c Collect data.
Material and methods
58
P. aeruginosa
Pseudomonas aeruginosa qPCR was carried out using two different probes: A FAM-
labelled TaqMan hydrolysis probe and SYBR Green as a general DNA-binding agent.
TaqMan probe assay. For each qPCR run, a PCR reaction mix was created by
mixing primers, probe solution, BSA, VeriQuestTM Probe qPCR Master Mix, and
molecular-grade water. Optionally, a TaqMan Exogenous Internal Positive Control
(IPC) comprising a VIC-labelled probe and synthetic DNA was administered, adjust-
ing the volume of water used (Table 2.18). In each well, 45 µl of PCR reaction mix
were provided. Samples were analysed by adding 5 µl of the respective DNA extract.
Template DNA was replaced with P. aeruginosa ATCC 10145 pure culture DNA
extract as a positive control, or with molecular-grade water as a no-template control,
respectively. When using an IPC, additionally a no-amplification control (NAC) had to
be applied, controlling the IPC itself. For this, 5 µl of 10X Exo IPC Block solution were
added instead of DNA template. Generally, samples were analysed in duplicates.
However, when using the IPC, six replicates of NTC respectively NAC had to be run
to ensure a 99.7 % confidence level.
Quantification standards were set up using DNA extracted from pure cultures of P.
aeruginosa ATCC 10145. The DNA content in the extract was measured via
PicoGreen assay. The DNA extract was then ten-fold diluted serially to create a set of
five standards with a P. aeruginosa DNA content ranging from 8 pg ml-1 to 80 ng ml-1.
In order to obtain results comparable to Legionella qPCR, the units of the standards
had to be converted to GU. Since no information regarding the genome weight of
P. aeruginosa had been published so far, the author derived a simplified genome
weight by correlating a genome length of approximately 6.3 Mbp and a GC content of
66.6 % (Stover et al., 2000) with a bp weight for GC and AT of 618.14 Da and 617.43
Da (Howe et al., 2009), respectively. A theoretical genome weight of 6.43 fg was
obtained. Based on this value, the concentrations of the standards corresponded to a
range from 6.22 GU to 6.22×10⁴ GU per assay.
A 2-step PCR with a combined annealing and elongation step was run for 40 cycles
(Table 2.19), again following an initial UDG treatment and a denaturation step.
Fluorescence emission by the FAM-labelled probe at a wavelength of 530 nm result-
ing from prior excitation at 490 nm was detected after each annealing step. Since
restricted calibration of the qPCR instrument did not allow for detecting the VIC sig-
nal, the IPC was monitored by using the hexachloro-6-carboxyfluorescein (HEX)

Material and methods
59
channel instead, which exhibits excitation and emission maxima similar to VIC (VIC:
excitationmax = 538 nm, emissionmax = 554 nm; HEX: excitationmax = 535 nm, emis-
sionmax = 556 nm) (Bustin & Nolan, 2004).
Table 2.18 PCR reaction mix for each sample in Pseudomonas aeruginosa qPCR using the TaqMan
probe.
Component Final concentration Volume [µl]
PCR reaction mix - 45
VeriQuestTM
Probe qPCR Master Mix (2X) 1X 25
Forward primer Pa23FP 300 nM 1.5
Reverse primer Pa23RPb 300 nM 1.5
TaqMan probe Pa23FAM 200 nM 1
BSA 200 µg ml-1
1
IPCa - 6
10X Exo IPC Mixa
1X 5
50X Exo IPC DNAa
1X 1
Water, molecular-grade - ad 45
Template DNA / Water / Standard / 10X Exo IPC Block - 5
Total volume 50
a Optional.
Table 2.19 Temperature protocol used in Pseudomonas aeruginosa qPCR.
Cycle Step Temperature [°C] Time [min]
1a
50 02:00
2b
95 10:00
3 - 42 1 95 00:15
2c
60 01:00
a UDG inactivation.
b Hot-start polymerase activation.
c Collect data.

Material and methods
60
SYBR Green assay. Pseudomonas qPCR using SYBR Green as a detection system
was carried out under the same conditions as with using the TaqMan probe but with
an adjusted PCR reaction mix (Table 2.20). Melt curve analysis was performed after
each run. Temperature was raised by 0.5 °C every 15 s, starting from 55 °C to 95 °C.
Fluorescence signal decrease was measured on-line as a function of temperature.
The software automatically constructed a melt curve peak chart by plotting the first
negative derivative of the fluorescence against the temperature.
Table 2.20 PCR reaction mix per sample in Pseudomonas aeruginosa qPCR using SYBR Green.
Component Final concentration Volume [µl]
PCR reaction mix - 45
MaximaTM
SYBR Green/Fluorescein qPCR Master
Mix (2X)
1X 25
Forward primer Pa23FP 300 nM 1.5
Reverse primer Pa23RPb 300 nM 1.5
BSA 200 µg ml-1
1
Water, molecular-grade - ad 45
Template DNA / Water / Standard - 5
Total volume 50
Data analysis and evaluation
For quantification, the iQTM5 software automatically generates a standard curve
based on the Ct values of the standards. PCR benchmarks are expressed in the
correlation coefficient R2 and amplification efficiency (Eq. 1). Results are given as
starting quantity (SQ) per well, corresponding to the amount of target GU per assay
(5 µl of DNA extract). The baseline threshold value for all wells was manually set to
the first cycle in which any amplification could be observed. Also, the fluorescence
threshold was adjusted to be just above the baseline noise. These measures were
done to improve both the correlation coefficient R2 and the PCR efficiency, with
optimal values being ≥ 0.99 and 75 % to 125%, respectively.
SQ values were translated to GU per litre (Eq. 2) using Microsoft Excel. The unit GU
l-1 is established in literature for qPCR-based quantifications of bacteria in water. For
theoretical considerations, quantitative results obtained for plankton samples (in GU l-
1) were further referenced to the wet weight of the plankton biomass analysed. A
theoretical water content of the plankton of approximately 100 % was estimated in
order to permit a weight-to-volume-based conversion of the results. Plankton sample
results were thus expressed as genome units per kilogram plankton (GU kg-1). This

Material and methods
61
conversion was mandatory in order to permit comparability amongst different
plankton samples, and to be able to relate concentrations in the plankton samples to
concentrations in the water samples.
⁄ , (Kuiper et al., 2006) (Equation 1)
E: PCR efficiency. s: Slope of the regression line.
Detection limits and quantification limits were derived to check whether results were
in the range of the standards. The detection limit (Ld) of a qPCR method for the
detection of Legionella is defined as the lowest number of GU generating a positive
result at a 90 % confidence limit (AFNOR XP T90-471, 2006). It corresponds to 5 GU
per 5 µl DNA extract (5 GU/assay). Calculation is shown in Equation 5. Although be-
ing intended for detection of Legionella, it was also used for P. aeruginosa qPCR.
The lower quantification limit (LQL) corresponds to the lowest number of copies
allowing a reliable and accurate quantification as described in the AFNOR XP T90-
471 standard (2006). It was calculated for each method (also P. aeruginosa qPCR)
according to Equation 6. The upper quantification limit on the other hand is defined
as the value given by the highest quantification standard (Eq. 5).
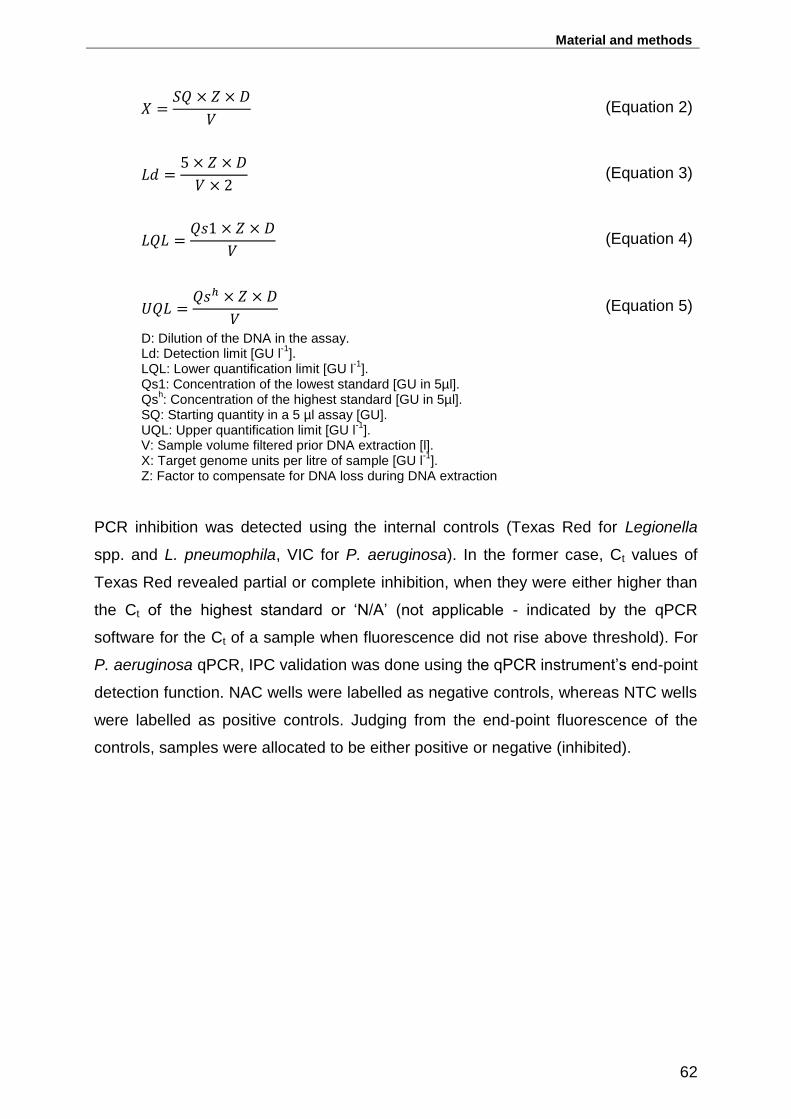
Material and methods
62
(Equation 2)
(Equation 3)
(Equation 4)
(Equation 5)
D: Dilution of the DNA in the assay. Ld: Detection limit [GU l
-1].
LQL: Lower quantification limit [GU l-1
]. Qs1: Concentration of the lowest standard [GU in 5µl]. Qs
h: Concentration of the highest standard [GU in 5µl].
SQ: Starting quantity in a 5 µl assay [GU]. UQL: Upper quantification limit [GU l
-1].
V: Sample volume filtered prior DNA extraction [l]. X: Target genome units per litre of sample [GU l
-1].
Z: Factor to compensate for DNA loss during DNA extraction
PCR inhibition was detected using the internal controls (Texas Red for Legionella
spp. and L. pneumophila, VIC for P. aeruginosa). In the former case, Ct values of
Texas Red revealed partial or complete inhibition, when they were either higher than
the Ct of the highest standard or ‘N/A’ (not applicable - indicated by the qPCR
software for the Ct of a sample when fluorescence did not rise above threshold). For
P. aeruginosa qPCR, IPC validation was done using the qPCR instrument’s end-point
detection function. NAC wells were labelled as negative controls, whereas NTC wells
were labelled as positive controls. Judging from the end-point fluorescence of the
controls, samples were allocated to be either positive or negative (inhibited).
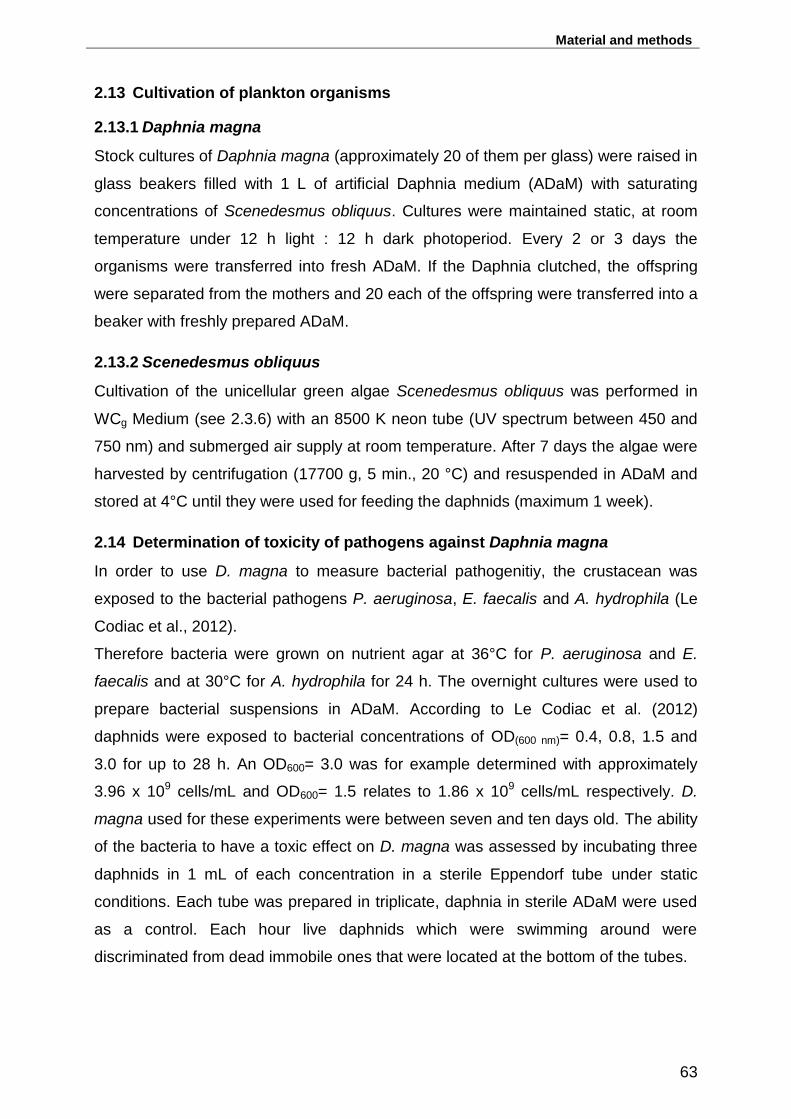
Material and methods
63
2.13 Cultivation of plankton organisms
2.13.1 Daphnia magna
Stock cultures of Daphnia magna (approximately 20 of them per glass) were raised in
glass beakers filled with 1 L of artificial Daphnia medium (ADaM) with saturating
concentrations of Scenedesmus obliquus. Cultures were maintained static, at room
temperature under 12 h light : 12 h dark photoperiod. Every 2 or 3 days the
organisms were transferred into fresh ADaM. If the Daphnia clutched, the offspring
were separated from the mothers and 20 each of the offspring were transferred into a
beaker with freshly prepared ADaM.
2.13.2 Scenedesmus obliquus
Cultivation of the unicellular green algae Scenedesmus obliquus was performed in
WCg Medium (see 2.3.6) with an 8500 K neon tube (UV spectrum between 450 and
750 nm) and submerged air supply at room temperature. After 7 days the algae were
harvested by centrifugation (17700 g, 5 min., 20 °C) and resuspended in ADaM and
stored at 4°C until they were used for feeding the daphnids (maximum 1 week).
2.14 Determination of toxicity of pathogens against Daphnia magna
In order to use D. magna to measure bacterial pathogenitiy, the crustacean was
exposed to the bacterial pathogens P. aeruginosa, E. faecalis and A. hydrophila (Le
Codiac et al., 2012).
Therefore bacteria were grown on nutrient agar at 36°C for P. aeruginosa and E.
faecalis and at 30°C for A. hydrophila for 24 h. The overnight cultures were used to
prepare bacterial suspensions in ADaM. According to Le Codiac et al. (2012)
daphnids were exposed to bacterial concentrations of OD(600 nm)= 0.4, 0.8, 1.5 and
3.0 for up to 28 h. An OD600= 3.0 was for example determined with approximately
3.96 x 10⁹ cells/mL and OD600= 1.5 relates to 1.86 x 10⁹ cells/mL respectively. D.
magna used for these experiments were between seven and ten days old. The ability
of the bacteria to have a toxic effect on D. magna was assessed by incubating three
daphnids in 1 mL of each concentration in a sterile Eppendorf tube under static
conditions. Each tube was prepared in triplicate, daphnia in sterile ADaM were used
as a control. Each hour live daphnids which were swimming around were
discriminated from dead immobile ones that were located at the bottom of the tubes.

Material and methods
64
2.15 Co-cultivation of Daphnia magna with selected bacterial strains
2.15.1 Co-cultivation with Pseudomonas aeruginosa
Pre-cultures of the organism P. aeruginosa PAO1 were grown on nutrient agar at 36
°C for 24 h. 2 or 3 colonies were inoculated in LB-broth and incubated in a water bath
with agitation at 36 °C for 18 h. Cells were harvested by centrifugation and the pellet
was washed once in 10 mL sterile filtered ADaM. After centrifugation (1400 g, 10
min., 4 °C) the pellet was resuspended in 10 mL sterile ADaM. The cell concentration
was determined by using a Thoma counting chamber.
D. magna used for these experiments were between seven and ten days old. A
bacterial concentration of approximately 107 cells/mL was used for the co-cultivation
with Daphnia. In each well of a 6-well plate 10 mL of the PAO1 suspension were
transferred and 5 D. magna were added to each well (Figure 2.3).
Additionally, wells containing 10 mL sterile ADaM and 5 Daphnia were cultivated. As
a control bacterial suspension without Daphnia and 10 mL sterile ADaM were used.
Sampling of medium and daphnids occurred at time intervals of 0, 24 and 48 h.
At time intervals the 5 Daphnia were collected from the wells, gently washed once in
sterile ADaM for 5 minutes to remove nonadherent bacteria. Afterwards the gut of the
daphnids was separated from the carapace by the use of two sterile pairs of tweezers
(Figure 2.4). The carapace and leftover entrails were minced by use of a mortar, both
samples were suspended separately in 1 mL sterile ADaM and diluted in sterile
deionized water. By use of a swab the surface of the well was sampled, therefore the
medium was removed of the well before and the well was rinsed once with 10 mL of
sterile ADaM. The swab was resuspended in 2 mL sterile ADaM and afterwards 1 mL
Figure 2.3: Co-cultivation of pathogens with D. magna: 6-well plates with 10 mL of a bacterial suspension (10
8 cells/mL) and 5 daphnids in each well. As
controls, 5 daphnids in sterile ADaM without bacteria, and bacterial suspension without daphnids. Incubation occurred at roomtemperature (22-24°C) over a period of 48 h.
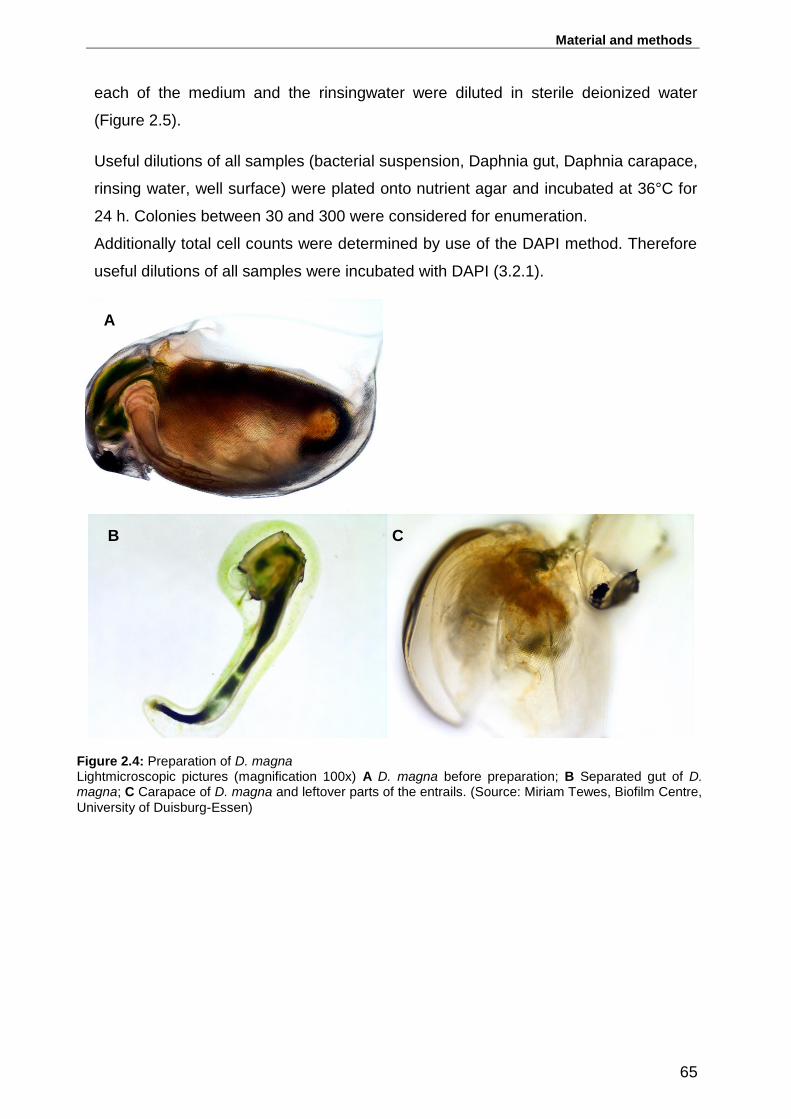
Material and methods
65
each of the medium and the rinsingwater were diluted in sterile deionized water
(Figure 2.5).
Useful dilutions of all samples (bacterial suspension, Daphnia gut, Daphnia carapace,
rinsing water, well surface) were plated onto nutrient agar and incubated at 36°C for
24 h. Colonies between 30 and 300 were considered for enumeration.
Additionally total cell counts were determined by use of the DAPI method. Therefore
useful dilutions of all samples were incubated with DAPI (3.2.1).
Figure 2.4: Preparation of D. magna Lightmicroscopic pictures (magnification 100x) A D. magna before preparation; B Separated gut of D. magna; C Carapace of D. magna and leftover parts of the entrails. (Source: Miriam Tewes, Biofilm Centre,
University of Duisburg-Essen)
A
B C
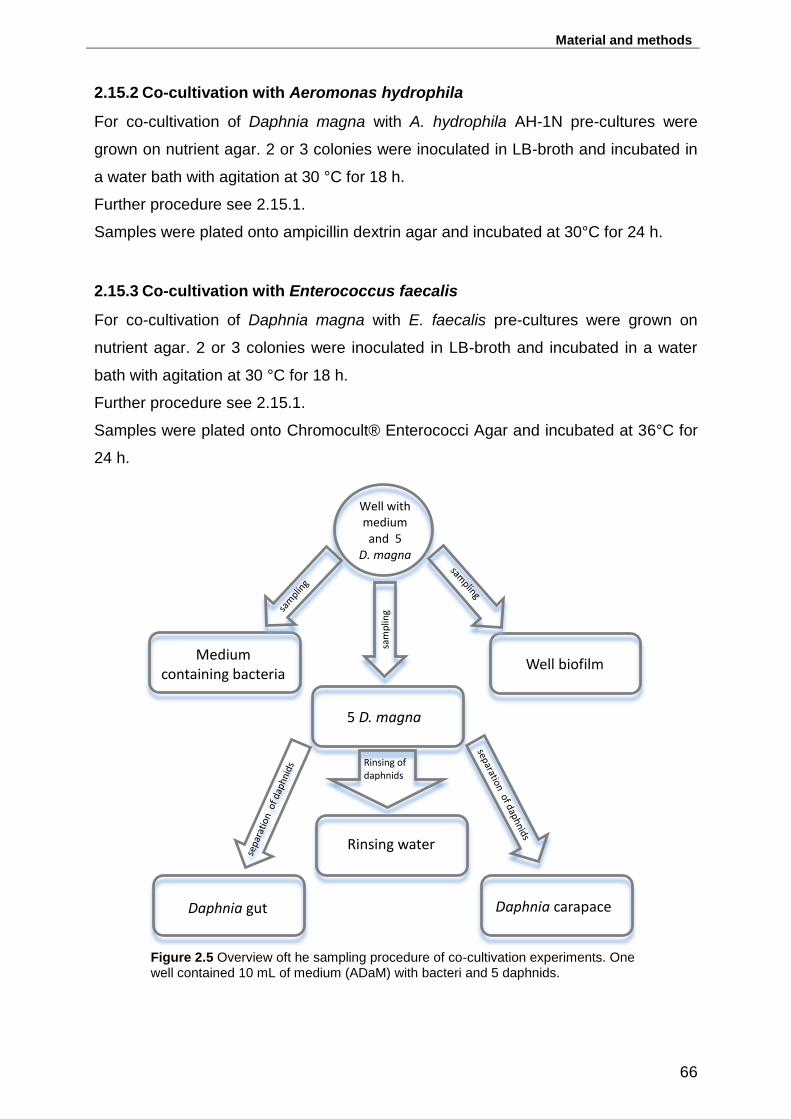
Material and methods
66
2.15.2 Co-cultivation with Aeromonas hydrophila
For co-cultivation of Daphnia magna with A. hydrophila AH-1N pre-cultures were
grown on nutrient agar. 2 or 3 colonies were inoculated in LB-broth and incubated in
a water bath with agitation at 30 °C for 18 h.
Further procedure see 2.15.1.
Samples were plated onto ampicillin dextrin agar and incubated at 30°C for 24 h.
2.15.3 Co-cultivation with Enterococcus faecalis
For co-cultivation of Daphnia magna with E. faecalis pre-cultures were grown on
nutrient agar. 2 or 3 colonies were inoculated in LB-broth and incubated in a water
bath with agitation at 30 °C for 18 h.
Further procedure see 2.15.1.
Samples were plated onto Chromocult® Enterococci Agar and incubated at 36°C for
24 h.
Medium containing bacteria
Rinsing water
Daphnia gut Daphnia carapace
Well biofilm
5 D. magna
Well with medium and 5
D. magna
sam
plin
g Rinsing of
daphnids
Figure 2.5 Overview oft he sampling procedure of co-cultivation experiments. One well contained 10 mL of medium (ADaM) with bacteri and 5 daphnids.

Results
67
3 Results
3.1 Association of hygienically relevant bacteria with plankton organisms in
Lake Baldeney
In the first part of the present study the association of hygienically relevant organisms
with freshwater plankton was investigated in a field study at Lake Baldeney in
Essen/Germany. At six sampling dates from April to September in the year 2010 the
bacterial abundance, plankton taxa and physico-chemical parameter were
investigated monthly. Overall a total of 42 samples (18 each for zoo- and
phytoplankton plus 6 water samples) were investigated. Phytoplankton as well as
zooplankton samples were taken at three transects across the lake (Figure 3.1).
Figure 3.1 Schematic overview of Lake Baldeney. Red lines indicate transects 1, 2, and 3. The retaining wall impounding the River Ruhr is indicated as a black line. Flow direction of the river is from East (right) to West (left).
With respect to the sampling location (T1, T2, T3), plankton samples were referred to
as T1Z, T2Z, and T3Z for zooplankton, and T1P, T2P, and T3P for phytoplankton,
respectively. A water sample was taken at transect 1 (T1).
Due to the occasion of massive growth of the macrophyte Elodea nuttallii in Lake
Baldeney in the year 2009, samples of the macrophyte were investigated to discover
associations of pathogenic bacteria and the waterplant (n = 3).
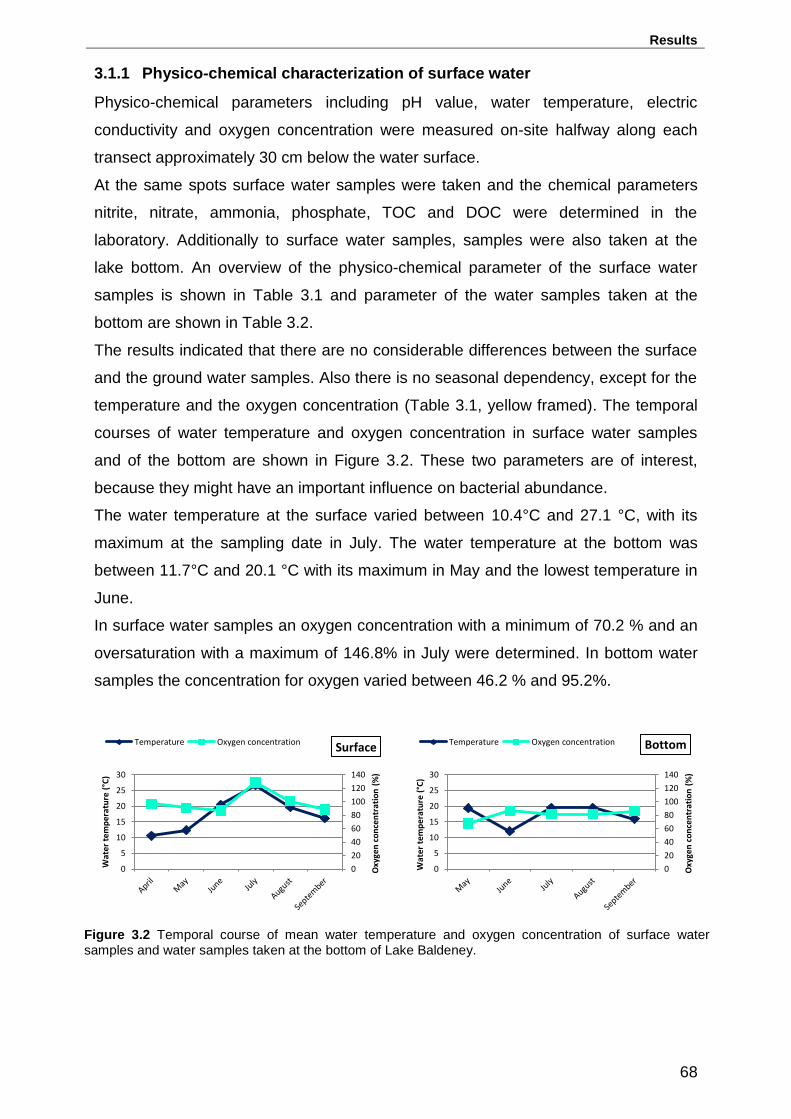
Results
68
3.1.1 Physico-chemical characterization of surface water
Physico-chemical parameters including pH value, water temperature, electric
conductivity and oxygen concentration were measured on-site halfway along each
transect approximately 30 cm below the water surface.
At the same spots surface water samples were taken and the chemical parameters
nitrite, nitrate, ammonia, phosphate, TOC and DOC were determined in the
laboratory. Additionally to surface water samples, samples were also taken at the
lake bottom. An overview of the physico-chemical parameter of the surface water
samples is shown in Table 3.1 and parameter of the water samples taken at the
bottom are shown in Table 3.2.
The results indicated that there are no considerable differences between the surface
and the ground water samples. Also there is no seasonal dependency, except for the
temperature and the oxygen concentration (Table 3.1, yellow framed). The temporal
courses of water temperature and oxygen concentration in surface water samples
and of the bottom are shown in Figure 3.2. These two parameters are of interest,
because they might have an important influence on bacterial abundance.
The water temperature at the surface varied between 10.4°C and 27.1 °C, with its
maximum at the sampling date in July. The water temperature at the bottom was
between 11.7°C and 20.1 °C with its maximum in May and the lowest temperature in
June.
In surface water samples an oxygen concentration with a minimum of 70.2 % and an
oversaturation with a maximum of 146.8% in July were determined. In bottom water
samples the concentration for oxygen varied between 46.2 % and 95.2%.
0
20
40
60
80
100
120
140
0
5
10
15
20
25
30
Oxy
gen
co
nce
ntr
atio
n (
%)
Wat
er t
em
per
atu
re (
°C)
Surface Temperature Oxygen concentration
0
20
40
60
80
100
120
140
0
5
10
15
20
25
30
Oxy
gen
co
nce
ntr
atio
n (
%)
Wat
er t
em
pe
ratu
re (
°C)
Bottom Temperature Oxygen concentration
Figure 3.2 Temporal course of mean water temperature and oxygen concentration of surface water samples and water samples taken at the bottom of Lake Baldeney.

Results
69
Table 3.1 Physico-chemical parameters of surface water samples taken at Lake Baldeney.
Sampling date
Transect Tempera-
ture [°C]
pH
Conduct-ivity
[µS/cm at 25°C]
Oxygen concen-tration [mg/L]
Oxygen concen-tration in
[%]
Depth of
vision [m]
TOC [mg/L]
DOC [mg/L]
Carbonate hardness [mmol/L]
Total hardness [mmol/L]
Chloride [mg/L]
Phosphate [mg/L]
Ammonia [mg/L]
Nitrite [mg/L]
Nitrate [mg/L]
April T1 10.5 7.8 460 10.9 98.0 2.1 2.2 1.9 1.6 1.4 52.0 0.4 0.2 0.1 9.8
T2 10.4 7.8 455 10.7 95.3 1.2 2.8 2.0 1.8 1.5 50.0 0.3 0.2 0.1 5.5
T3 10.6 7.9 460 10.7 96.9 4.5 2.0 1.9 1.7 1.2 44.0 0.4 0.2 0.1 12.8
May T1 12.3 6.9 87.5 9.3 88.2 2.1 3.7 3.4 2.0 1.3 42.0 0.5 0.4 0.2 14.2
T2 12.3 7.7 96.7 10.0 94.6 1.8 4.3 3.5 1.4 1.0 56.0 0.3 0.3 0.1 7.6
T3 12.1 7.6 89 9.4 89.6 2.5 3.4 3.2 1.4 1.0 56.0 0.4 0.2 0.1 8.7
June T1 20.6 7.6 590 8.9 101.9 1.1 4.2 3.2 2.5 1.5 70.0 0.4 0.2 0.3 13.3
T2 20.0 8.0 607 7.4 87.4 0.8 4.5 3.2 2.5 1.6 84.0 0.5 0.1 0.0 6.0
T3 20.6 7.5 586 6.2 70.2 1.2 3.4 3.1 2.5 1.6 82.0 0.5 0.3 0.1 11.8
July T1 26.3 7.7 514 11.7 146.8 0.9 4.2 3.7 2.2 1.5 82.0 0.4 0.2 0.1 10.1
T2 27.1 7.8 527 9.8 125.3 0.9 4.2 3.7 2.3 1.5 88.0 0.5 0.6 0.1 5.3
T3 26.3 7.6 509 7.1 112.4 1.1 3.9 3.6 2.1 1.5 82.0 0.4 0.2 0.1 9.8
August T1 19.4 7.4 419 7.1 79.0 1.1 4.2 3.3 1.8 0.9 30.0 0.8 0.1 0.0 12.4
T2 20.1 7.6 504 7.1 79.0 1.1 3.6 3.1 1.9 0.8 24.0 0.7 0.1 0.0 5.4
T3 19.4 7.7 431 7.8 85.3 1.0 4.1 3.2 2.0 1.1 30.0 0.7 0.1 0.0 5.3
September T1 16.0 7.2 542 9.5 95.4 1.8 2.5 2.4 1.0 0.7 20.0 0.7 0.1 n.d. 2.1
T2 16.1 7.7 530 7.6 76.8 2.4 2.4 2.2 2.0 0.7 16.0 0.7 0.2 0.0 3.5
T3 16.1 7.7 530 9.0 91.9 2.2 2.4 2.3 1.6 0.7 18.0 0.7 0.1 0.0 4.6
n.d., not determined

Results
70
Table 3.2 Physico-chemical parameters water samples taken at the bottom of Lake Baldeney.
Date Transect Depth [m]
Temper-ature [°C]
pH Conductivity
[µS/cm at 25°C]
Oxygen concen-tration [mg/L]
Oxygen concen-tration in [%]
TOC [mg/L]
DOC [mg/L]
Carbonate hardness [mmol/L]
Total hardness [mmol/L]
Chloride [mg/L]
Phosphate [mg/L]
Ammonia [mg/L]
Nitrite [mg/L]
Nitrate [mg/L]
April T1 3.9 n.d. n.d. n.d. n.d. n.d. 2.5 1.9 1.9 1.4 48.0 0.4 0.2 0.1 9.5
T2 3.0 n.d. n.d. n.d. n.d. n.d. 3.0 2.0 2.0 1.5 56.0 0.4 0.2 0.1 17.8
T3 5.6 n.d. n.d. n.d. n.d. n.d. 2.0 1.9 2.0 1.4 60.0 0.3 0.1 0.1 5.7
May T1 4.6 17.9 7.3 777 8.10 83.5 7.5 3.5 1.8 1.2 58.0 0.5 0.4 0.2 8.1
T2 6.0 19.9 7.6 635 6.63 72.0 4.2 3.2 1.5 1.1 58.0 0.4 0.4 0.1 6.9
T3 5.0 20.1 7.5 611 7.80 46.2 3.4 3.1 1.8 1.3 58.0 0.5 0.3 0.1 11.2
June T1 3.3 12.4 7.3 87,6 8.87 83.5 3.9 3.4 2.4 1.6 78.0 0.4 0.1 0.0 12.6
T2 2.0 11.8 7.7 96,6 9.37 88.4 4.0 3.5 2.5 1.6 90.0 0.5 0.2 0.1 10.4
T3 5.0 11.7 7.4 88,2 9.23 87.0 3.4 3.1 2.4 1.7 92.0 0.6 0.3 0.0 12.2
July T1 3.8 19.2 7.5 439 7.48 79.1 4.6 3.3 2.5 1.5 80.0 0.4 0.6 0.1 10.0
T2 5.8 19.9 7.7 505 7.69 78.8 3.5 3.0 2.2 1.5 80.0 0.5 0.5 0.1 9.8
T3 6.2 19.2 7.7 433 7.67 85.0 4.0 3.2 2.5 1.5 84.0 0.5 0.6 0.1 11.8
August T1 3.5 19.2 7.5 439 7.48 79.1 4.6 3.3 2.6 1.4 43.0 0.7 0.2 0.0 13.7
T2 5.9 19.9 7.7 505 7.69 78.8 3.5 3.0 0.8 0.7 30.0 0.6 0.0 0.0 8.2
T3 4.5 19.2 7.7 433 7.67 85.0 4.0 3.2 1.2 0.9 30.0 0.6 0.1 0.0 6.9
September T1 3.5 15.8 7.1 543 9.38 95.2 2.8 2.2 1.8 0.9 20.0 0.7 0.1 0.0 2.4
T2 5.0 15.9 7.7 535 7.30 73.4 2.6 2.3 2.0 1.0 30.0 0.7 0.1 0.0 11.5
T3 6.1 16.0 7.6 531 8.91 89.5 2.4 2.2 1.8 0.6 40.0 0.6 0.1 0.0 4.8
n.d., not determined

Results
71
3.2 Abundance and identification of plankton organisms
Sampling of plankton was carried out using different plankton nets for phytoplankton
(55 µm) and zooplankton (200 µm) along diagonal hauls from the lake bottom up to
the surface. The concentrations and the taxa of the phyto- and zooplankton were
determined microscopically according to the recommendations of Mischke and
Behrendt (2007) and the German Limnological Society (DGL, 2007) for
phytoplankton, whereas Kiefer & Fryer (1978) was used for zooplankton.
Table 3.3 shows mean values of individual concentrations determined in phyto- and
zooplankton samples during the sampling season. Highest abundance of
phytoplankton organisms could be detected in May, June and July with up to 1010
individuals/m3. The temporal course in Figure 3.3 shows an increase of zooplankton
according to the decrease of phytoplankton abundnace. Zooplankton was determined
with a maximum in July with up to 105 individuals/m3.
This seasonal trend can be explained by zooplankton organisms grazing on
phytoplankton unitl the so called clear water state is reached, where phytoplankton is
almost eliminated by zooplankton grazing.
Table 3.3 Means of plankton organism abundance in Lake Baldeney during the sampling season (individuals/m
3).
Identified plankton species are shown in Table 3.4 and 3.5. Among phytoplankton
organisms members of the diatoms represented the highest amount. Followed by
Melosira sp. which was found in all samples. Other diatom species detected in
phytoplankton samples were Fragilaria sp., Niztschia sp., Asterionella sp. and
Synedra sp.
Phytoplankton Zooplankton
April 4.4 x 10⁹ 9.3 x 10
1
May 2.0 x 10¹⁰
2.2 x 10³
June 1.9 x 10¹⁰
9.6 x 10²
July 1.3 x 10¹⁰
3.2 x 10⁵
August 1.4 x 10⁹ 3.2 x 10
4
September 5.2 x 10⁹ 8.5 x 10
1
0,00E+00
5,00E+04
1,00E+05
1,50E+05
2,00E+05
2,50E+05
3,00E+05
3,50E+05
0,00E+00
5,00E+09
1,00E+10
1,50E+10
2,00E+10
2,50E+10
Phytoplankton Zooplankton
Figure 3.3 Temporal course of phyto- and zooplankton organism abundance in Lake Baldeney (inividuals/m
3).
Results
72
Chlorophyta sp., Scenedesmus sp. and Pediastrum sp. for example were the most
abundant green algae determined in the samples. Cyanobacteria species found in
2010 were Oscillatoria sp., Spirulina sp. and Anabena sp.. Among the class
chrysophyceae Dinobryon sp. was the only present species of golden algae in
phytoplankton samples.
The most abundant species of zooplankton detected in the samples belong to to the
group of Rotatoria (Table 3.5). Most of the other detected species were member of
the Crustacea, mainly the subclasses Cladocera and Copepoda, e.g. Daphnia sp.,
Polyphemus sp., Cyclopoida and Calanoida.
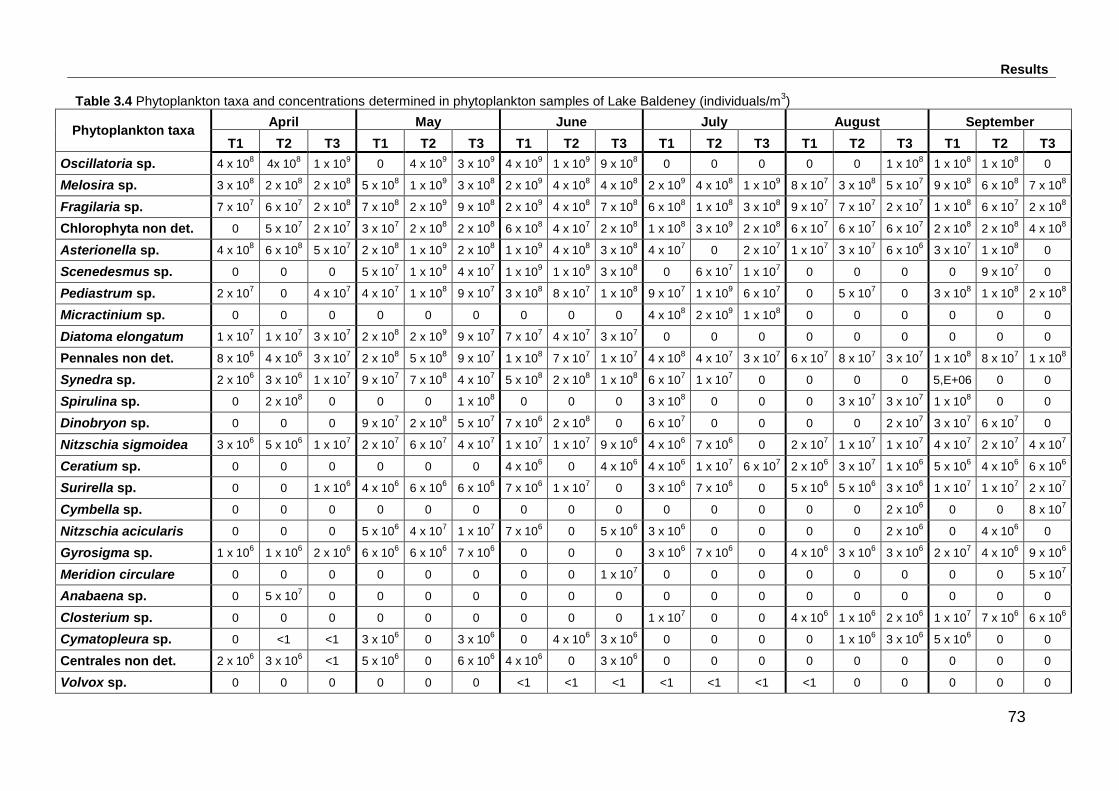
Results
73
Table 3.4 Phytoplankton taxa and concentrations determined in phytoplankton samples of Lake Baldeney (individuals/m3)
Phytoplankton taxa April May June July August September
T1 T2 T3 T1 T2 T3 T1 T2 T3 T1 T2 T3 T1 T2 T3 T1 T2 T3
Oscillatoria sp. 4 x 10⁸ 4x 10
8 1 x 10
9 0 4 x 10
9 3 x 10
9 4 x 10
9 1 x 10
9 9 x 10
8 0 0 0 0 0 1 x 10
8 1 x 10
8 1 x 10
8 0
Melosira sp. 3 x 10⁸
2 x 10⁸ 2 x 10
8 5 x 10
8 1 x 10
9 3 x 10
8 2 x 10
9 4 x 10
8 4 x 10
8 2 x 10
9 4 x 10
8 1 x 10
9 8 x 10
7 3 x 10
8 5 x 10
7 9 x 10
8 6 x 10
8 7 x 10
8
Fragilaria sp. 7 x 10⁷ 6 x 10
7 2 x 10
8 7 x 10
8 2 x 10
9 9 x 10
8 2 x 10
9 4 x 10
8 7 x 10
8 6 x 10
8 1 x 10
8 3 x 10
8 9 x 10
7 7 x 10
7 2 x 10
7 1 x 10
8 6 x 10
7 2 x 10
8
Chlorophyta non det. 0 5 x 10⁷
2 x 10⁷
3 x 10⁷ 2 x 10
8 2 x 10
8 6 x 10
8 4 x 10
7 2 x 10
8 1 x 10
8 3 x 10
9 2 x 10
8 6 x 10
7 6 x 10
7 6 x 10
7 2 x 10
8 2 x 10
8 4 x 10
8
Asterionella sp. 4 x 10⁸
6 x 10⁸
5 x 10⁷
2 x 10⁸ 1 x 10
9 2 x 10
8 1 x 10
9 4 x 10
8 3 x 10
8 4 x 10
7 0 2 x 10
7 1 x 10
7 3 x 10
7 6 x 10
6 3 x 10
7 1 x 10
8 0
Scenedesmus sp. 0 0 0 5 x 10⁷ 1 x 10
9 4 x 10
7 1 x 10
9 1 x 10
9 3 x 10
8 0 6 x 10
7 1 x 10
7 0 0 0 0 9 x 10
7 0
Pediastrum sp. 2 x 10⁷
0 4 x 10⁷
4 x 10⁷ 1 x 10
8 9 x 10
7 3 x 10
8 8 x 10
7 1 x 10
8 9 x 10
7 1 x 10
9 6 x 10
7 0 5 x 10
7 0 3 x 10
8 1 x 10
8 2 x 10
8
Micractinium sp. 0 0 0 0 0 0 0 0 0 4 x 10⁸ 2 x 10
9 1 x 10
8 0 0 0 0 0 0
Diatoma elongatum 1 x 10⁷
1 x 10⁷
3 x 10⁷
2 x 10⁸ 2 x 10
9 9 x 10
7 7 x 10
7 4 x 10
7 3 x 10
7 0 0 0 0 0 0 0 0 0
Pennales non det. 8 x 10⁶
4 x 10⁶ 3 x 10
7 2 x 10
8 5 x 10
8 9 x 10
7 1 x 10
8 7 x 10
7 1 x 10
7 4 x 10
8 4 x 10
7 3 x 10
7 6 x 10
7 8 x 10
7 3 x 10
7 1 x 10
8 8 x 10
7 1 x 10
8
Synedra sp. 2 x 10⁶ 3 x 10
6 1 x 10
7 9 x 10
7 7 x 10
8 4 x 10
7 5 x 10
8 2 x 10
8 1 x 10
8 6 x 10
7 1 x 10
7 0 0 0 0 5,E+06 0 0
Spirulina sp. 0 2 x 10⁸ 0 0 0 1 x 10
8 0 0 0 3 x 10
8 0 0 0 3 x 10
7 3 x 10
7 1 x 10
8 0 0
Dinobryon sp. 0 0 0 9 x 10⁷ 2 x 10
8 5 x 10
7 7 x 10
6 2 x 10
8 0 6 x 10
7 0 0 0 0 2 x 10
7 3 x 10
7 6 x 10
7 0
Nitzschia sigmoidea 3 x 10⁶ 5 x 10
6 1 x 10
7 2 x 10
7 6 x 10
7 4 x 10
7 1 x 10
7 1 x 10
7 9 x 10
6 4 x 10
6 7 x 10
6 0 2 x 10
7 1 x 10
7 1 x 10
7 4 x 10
7 2 x 10
7 4 x 10
7
Ceratium sp. 0 0 0 0 0 0 4 x 10⁶ 0 4 x 10
6 4 x 10
6 1 x 10
7 6 x 10
7 2 x 10
6 3 x 10
7 1 x 10
6 5 x 10
6 4 x 10
6 6 x 10
6
Surirella sp. 0 0 1 x 10⁶ 4 x 10
6 6 x 10
6 6 x 10
6 7 x 10
6 1 x 10
7 0 3 x 10
6 7 x 10
6 0 5 x 10
6 5 x 10
6 3 x 10
6 1 x 10
7 1 x 10
7 2 x 10
7
Cymbella sp. 0 0 0 0 0 0 0 0 0 0 0 0 0 0 2 x 10⁶ 0 0 8 x 10
7
Nitzschia acicularis 0 0 0 5 x 10⁶ 4 x 10
7 1 x 10
7 7 x 10
6 0 5 x 10
6 3 x 10
6 0 0 0 0 2 x 10
6 0 4 x 10
6 0
Gyrosigma sp. 1 x 10⁶ 1 x 10
6 2 x 10
6 6 x 10
6 6 x 10
6 7 x 10
6 0 0 0 3 x 10
6 7 x 10
6 0 4 x 10
6 3 x 10
6 3 x 10
6 2 x 10
7 4 x 10
6 9 x 10
6
Meridion circulare 0 0 0 0 0 0 0 0 1 x 10⁷ 0 0 0 0 0 0 0 0 5 x 10
7
Anabaena sp. 0 5 x 10⁷ 0 0 0 0 0 0 0 0 0 0 0 0 0 0 0 0
Closterium sp. 0 0 0 0 0 0 0 0 0 1 x 10⁷ 0 0 4 x 10
6 1 x 10
6 2 x 10
6 1 x 10
7 7 x 10
6 6 x 10
6
Cymatopleura sp. 0 <1 <1 3 x 10⁶ 0 3 x 10
6 0 4 x 10
6 3 x 10
6 0 0 0 0 1 x 10
6 3 x 10
6 5 x 10
6 0 0
Centrales non det. 2 x 10⁶ 3 x 10
6 <1 5 x 10
6 0 6 x 10
6 4 x 10
6 0 3 x 10
6 0 0 0 0 0 0 0 0 0
Volvox sp. 0 0 0 0 0 0 <1 <1 <1 <1 <1 <1 <1 0 0 0 0 0

Results
74
Table 3.5 Zooplankton taxa and concentrations determined in zooplankton samples of Lake Baldeney (individuals/m3)
Zooplankton taxa April May June July August September
T1 T2 T3 T1 T2 T3 T1 T2 T3 T1 T2 T3 T1 T2 T3 T1 T2 T3
Rotatoria non det. 2 1 2 100 200 8 60 300 40 3000 158000 2000 0 0 0 0 0 0
Ciliata non det. 0 0 0 0 0 0 0 0 0 0 140000 0 0 13000 0 0 0 0
Parapodophyra sp. 0 0 0 0 0 0 0 0 0 0 0 0 18000 0 0 0 0 0
Cladocera non det. 7 6 6 200 300 200 40 200 30 3000 12000 400 100 40 300 20 10 10
Cyclopoida non det. 10 10 8 400 0 200 40 100 7 600 2000 100 30 10 50 10 0 20
Bosmina sp. 2 0 0 200 100 50 1 0 0 0 0 0 0 0 0 0 0 0
Nematoda non det. 3 10 8 40 5 50 1 30 20 0 0 0 6 1 8 2 2 2
Daphnia sp. 0 0 0 20 50 10 5 4 3 0 0 0 20 0 40 2 0 2
Polyphemus sp. 0 0 0 0 0 8 0 0 0 0 0 0 8 60 10 0 0 4
Calanoida non det. 2 0 1 0 0 10 5 20 0 0 0 0 0 6 0 0 0 0
Harpacticoida non det. 1 2 1 2 0 20 0 6 1 0 0 0 0 0 0 0 0 0
Acari non det. 0 0 0 2 0 0 5 10 0 0 0 4 0 0 0 1 0 0
Ostracoda non det. 0 0 0 0 0 0 0 6 0 0 0 0 2 1 0 0 0 0
non det. = not determined
Results
75
3.3 Detection of target organisms with cultural methods in water and plankton
samples of Lake Baldeney
In a six month sampling campaign the association of hygienically relevant
mircoorganisms with freshwater phyto- and zooplankton was elucidated and
compared to organisms in the surrounding water column of Lake Baldeney in
Essen/Germany. The investigated organisms with facultative pathogenic properties
can be divided in three main groups: faecal indicator bacteria (e.g. Escherichia coli,
coliforms, intestinal enterococci, Clostridium perfringens), obligate pathogens of
faecal origin (e.g. Campylobacter spp.), and environmental opportunistic bacteria
(e.g. some coliforms, Pseudomonas aeruginosa, Aeromonas spp., Legionella spp.).
The overall aim was to assess whether the bacteria are more frequently found in a
planktonic state in the water phase or in association with plankton.
General bacterial abundance (total cell counts, HPC bacteria) and potentially
pathogenic bacteria were detected with cultural methods. Additionally determination
of the organisms P. aeruginosa and Legionella spp were carried out by with
molecular methods, such as FISH and qPCR. Furthermore the occurrence and
proportions of phyto- and zooplankton organisms were determined.
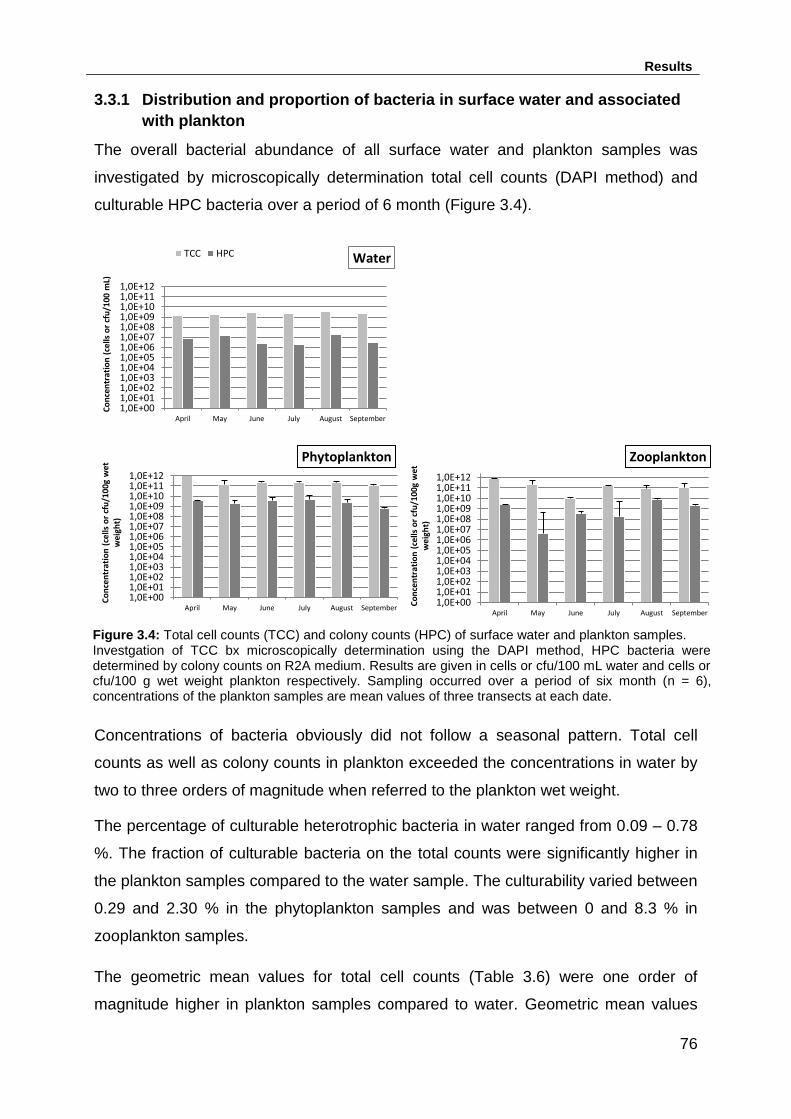
Results
76
3.3.1 Distribution and proportion of bacteria in surface water and associated
with plankton
The overall bacterial abundance of all surface water and plankton samples was
investigated by microscopically determination total cell counts (DAPI method) and
culturable HPC bacteria over a period of 6 month (Figure 3.4).
Concentrations of bacteria obviously did not follow a seasonal pattern. Total cell
counts as well as colony counts in plankton exceeded the concentrations in water by
two to three orders of magnitude when referred to the plankton wet weight.
The percentage of culturable heterotrophic bacteria in water ranged from 0.09 – 0.78
%. The fraction of culturable bacteria on the total counts were significantly higher in
the plankton samples compared to the water sample. The culturability varied between
0.29 and 2.30 % in the phytoplankton samples and was between 0 and 8.3 % in
zooplankton samples.
The geometric mean values for total cell counts (Table 3.6) were one order of
magnitude higher in plankton samples compared to water. Geometric mean values
1,0E+001,0E+011,0E+021,0E+031,0E+041,0E+051,0E+061,0E+071,0E+081,0E+091,0E+101,0E+111,0E+12
April May June July August September
Co
nce
ntr
atio
n (
cells
or
cfu
/10
0 m
L)
Water TCC HPC
1,0E+001,0E+011,0E+021,0E+031,0E+041,0E+051,0E+061,0E+071,0E+081,0E+091,0E+101,0E+111,0E+12
April May June July August September
Co
nce
ntr
atio
n (
cells
or
cfu
/100
g w
et
wei
ght)
Phytoplankton
1,0E+001,0E+011,0E+021,0E+031,0E+041,0E+051,0E+061,0E+071,0E+081,0E+091,0E+101,0E+111,0E+12
April May June July August September
Co
nce
ntr
atio
n (
cells
or
cfu
/100
g w
et
wei
ght)
Zooplankton
Figure 3.4: Total cell counts (TCC) and colony counts (HPC) of surface water and plankton samples. Investgation of TCC bx microscopically determination using the DAPI method, HPC bacteria were determined by colony counts on R2A medium. Results are given in cells or cfu/100 mL water and cells or cfu/100 g wet weight plankton respectively. Sampling occurred over a period of six month (n = 6), concentrations of the plankton samples are mean values of three transects at each date.
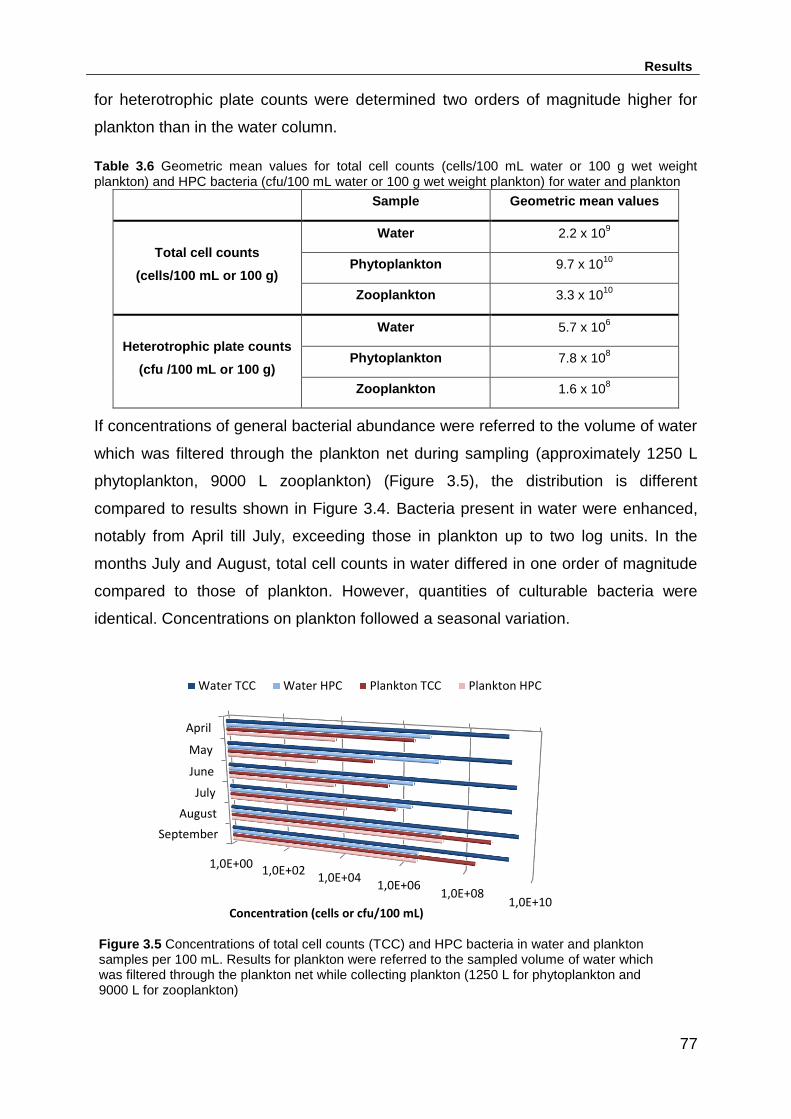
Results
77
for heterotrophic plate counts were determined two orders of magnitude higher for
plankton than in the water column.
Table 3.6 Geometric mean values for total cell counts (cells/100 mL water or 100 g wet weight plankton) and HPC bacteria (cfu/100 mL water or 100 g wet weight plankton) for water and plankton
Sample Geometric mean values
Total cell counts
(cells/100 mL or 100 g)
Water 2.2 x 10⁹
Phytoplankton 9.7 x 10¹⁰
Zooplankton 3.3 x 10¹⁰
Heterotrophic plate counts
(cfu /100 mL or 100 g)
Water 5.7 x 10⁶
Phytoplankton 7.8 x 10⁸
Zooplankton 1.6 x 10⁸
If concentrations of general bacterial abundance were referred to the volume of water
which was filtered through the plankton net during sampling (approximately 1250 L
phytoplankton, 9000 L zooplankton) (Figure 3.5), the distribution is different
compared to results shown in Figure 3.4. Bacteria present in water were enhanced,
notably from April till July, exceeding those in plankton up to two log units. In the
months July and August, total cell counts in water differed in one order of magnitude
compared to those of plankton. However, quantities of culturable bacteria were
identical. Concentrations on plankton followed a seasonal variation.
1,0E+001,0E+02
1,0E+041,0E+06
1,0E+081,0E+10
April
May
June
July
August
September
Concentration (cells or cfu/100 mL)
Water TCC Water HPC Plankton TCC Plankton HPC
Figure 3.5 Concentrations of total cell counts (TCC) and HPC bacteria in water and plankton samples per 100 mL. Results for plankton were referred to the sampled volume of water which was filtered through the plankton net while collecting plankton (1250 L for phytoplankton and 9000 L for zooplankton)

Results
78
Phytoplankton
Water phase Zooplankton
84 %
5 %
11 %
The results indicated that there is an accumulation of bacteria on plankton, referred
to the plankton mass. Also they showed an elevated percentage of culturability
compared to those bacteria in water. The culturablilty seems to be enhanced due to
favourable nutrient conditions for bacteria living in communitiy with plankton
organisms.
If plankton samples are referred to the sampled water volume they reflect only a
minor fraction of the general bacterial concentrations when they were compared to
the whole water environment of Lake Baldeney. As an example the distribution in
percent of total cells between water, phyto and zooplankton in the month August is
illustrated in Figure 3.6.
Figure 3.6 Distribution of total cell counts (in %) in the free water, phytoplankton and zooplankton in Lake Baldeney in the month August. (Microscopic pictures by Miriam Tewes)
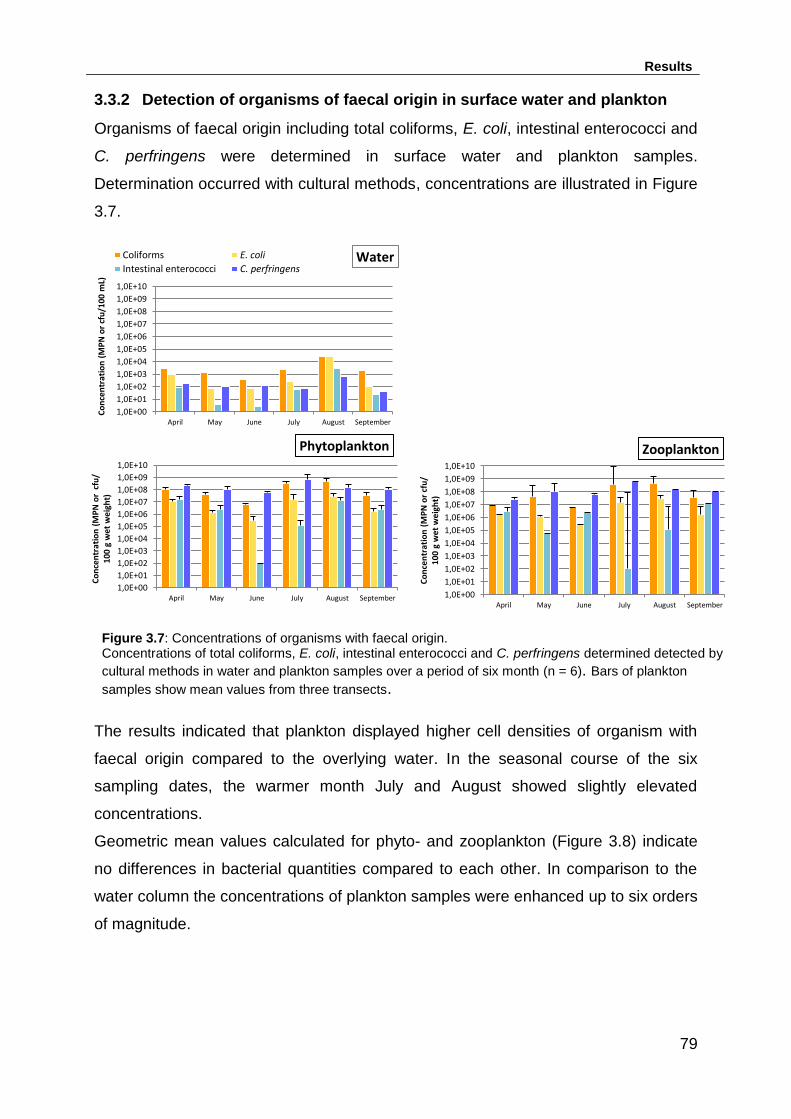
Results
79
3.3.2 Detection of organisms of faecal origin in surface water and plankton
Organisms of faecal origin including total coliforms, E. coli, intestinal enterococci and
C. perfringens were determined in surface water and plankton samples.
Determination occurred with cultural methods, concentrations are illustrated in Figure
3.7.
The results indicated that plankton displayed higher cell densities of organism with
faecal origin compared to the overlying water. In the seasonal course of the six
sampling dates, the warmer month July and August showed slightly elevated
concentrations.
Geometric mean values calculated for phyto- and zooplankton (Figure 3.8) indicate
no differences in bacterial quantities compared to each other. In comparison to the
water column the concentrations of plankton samples were enhanced up to six orders
of magnitude.
1,0E+00
1,0E+01
1,0E+02
1,0E+03
1,0E+04
1,0E+05
1,0E+06
1,0E+07
1,0E+08
1,0E+09
1,0E+10
April May June July August September
Co
nce
ntr
atio
n (
MP
N o
r cf
u/1
00
mL)
Water Coliforms E. coli
Intestinal enterococci C. perfringens
1,0E+00
1,0E+01
1,0E+02
1,0E+03
1,0E+04
1,0E+05
1,0E+06
1,0E+07
1,0E+08
1,0E+09
1,0E+10
April May June July August September
Co
nce
ntr
atio
n (
MP
N o
r c
fu/
100
g w
et w
eigh
t)
Phytoplankton
1,0E+00
1,0E+01
1,0E+02
1,0E+03
1,0E+04
1,0E+05
1,0E+06
1,0E+07
1,0E+08
1,0E+09
1,0E+10
April May June July August September
Co
nce
ntr
atio
n (
MP
N o
r cf
u/
100
g w
et w
eigh
t)
Zooplankton
Figure 3.7: Concentrations of organisms with faecal origin. Concentrations of total coliforms, E. coli, intestinal enterococci and C. perfringens determined detected by
cultural methods in water and plankton samples over a period of six month (n = 6). Bars of plankton
samples show mean values from three transects.
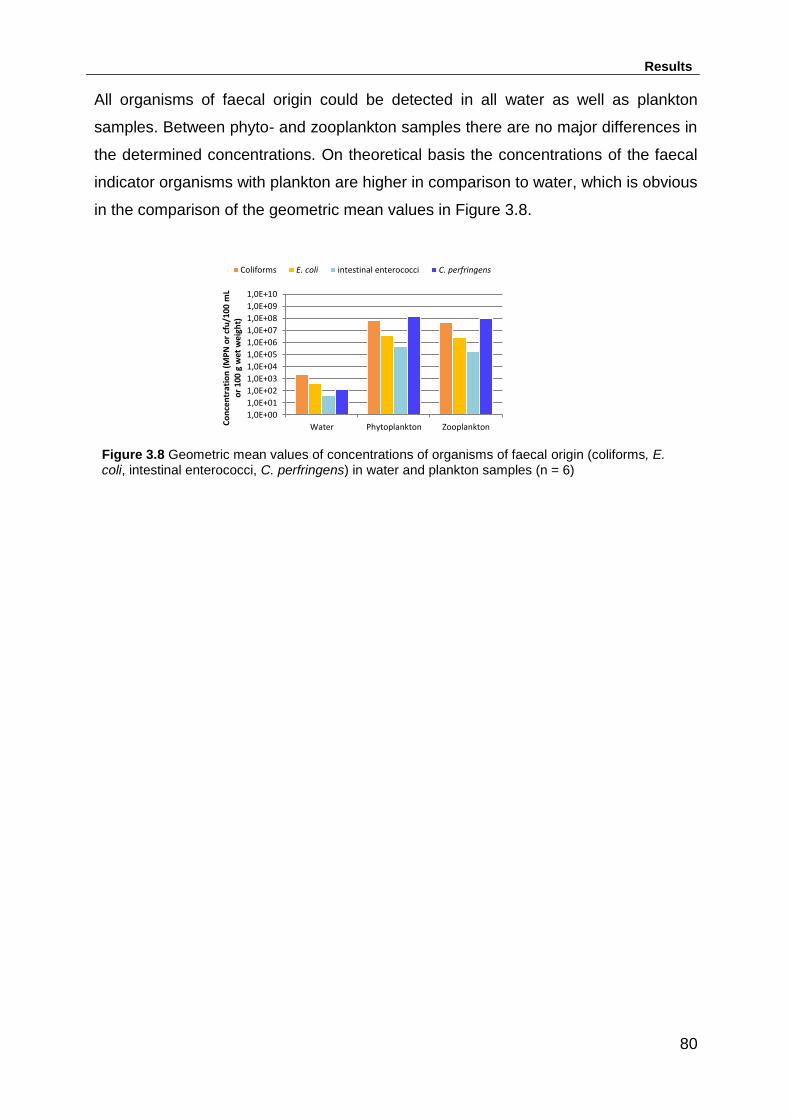
Results
80
All organisms of faecal origin could be detected in all water as well as plankton
samples. Between phyto- and zooplankton samples there are no major differences in
the determined concentrations. On theoretical basis the concentrations of the faecal
indicator organisms with plankton are higher in comparison to water, which is obvious
in the comparison of the geometric mean values in Figure 3.8.
1,0E+00
1,0E+01
1,0E+02
1,0E+03
1,0E+04
1,0E+05
1,0E+06
1,0E+07
1,0E+08
1,0E+09
1,0E+10
Water Phytoplankton ZooplanktonCo
nce
ntr
atio
n (
MP
N o
r cf
u/1
00
mL
or
100
g w
et w
eigh
t)
Coliforms E. coli intestinal enterococci C. perfringens
Figure 3.8 Geometric mean values of concentrations of organisms of faecal origin (coliforms, E. coli, intestinal enterococci, C. perfringens) in water and plankton samples (n = 6)
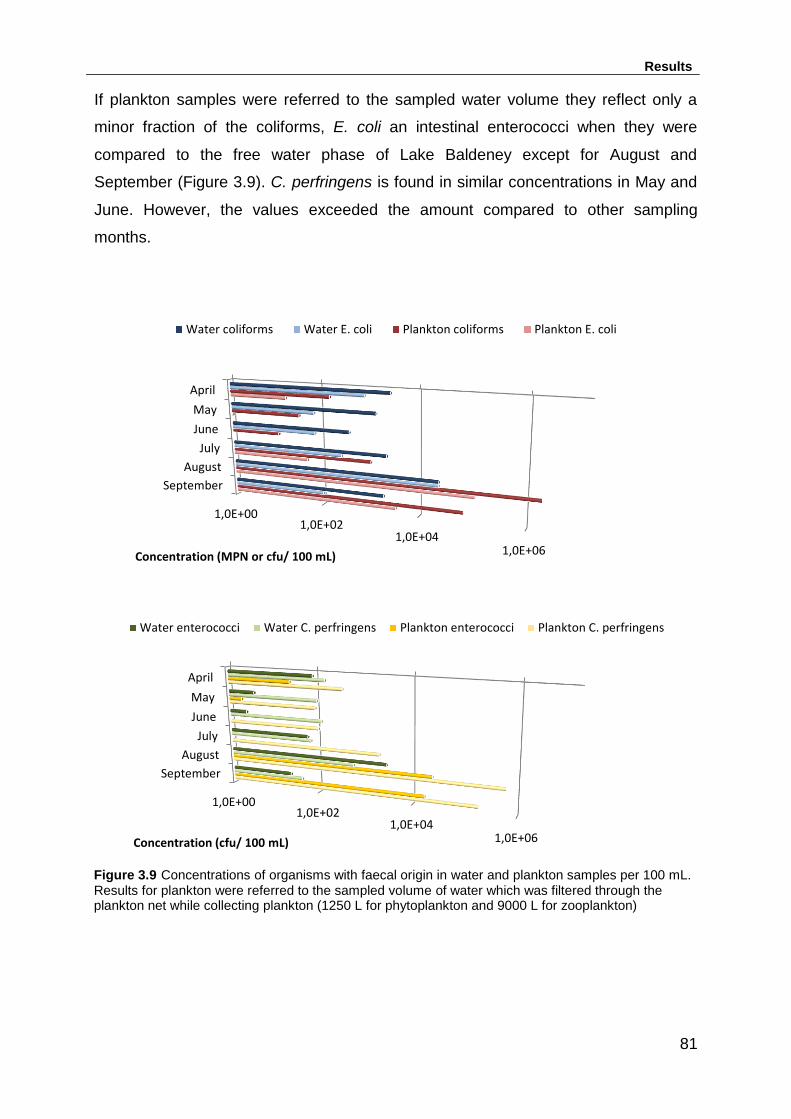
Results
81
If plankton samples were referred to the sampled water volume they reflect only a
minor fraction of the coliforms, E. coli an intestinal enterococci when they were
compared to the free water phase of Lake Baldeney except for August and
September (Figure 3.9). C. perfringens is found in similar concentrations in May and
June. However, the values exceeded the amount compared to other sampling
months.
1,0E+001,0E+02
1,0E+041,0E+06
April
May
June
July
August
September
Concentration (MPN or cfu/ 100 mL)
Water coliforms Water E. coli Plankton coliforms Plankton E. coli
1,0E+001,0E+02
1,0E+041,0E+06
April
May
June
July
August
September
Concentration (cfu/ 100 mL)
Water enterococci Water C. perfringens Plankton enterococci Plankton C. perfringens
Figure 3.9 Concentrations of organisms with faecal origin in water and plankton samples per 100 mL. Results for plankton were referred to the sampled volume of water which was filtered through the plankton net while collecting plankton (1250 L for phytoplankton and 9000 L for zooplankton)

Results
82
The results indicated that plankton displayed higher cell densities referred to the wet
weight of plankton which represents the high local population of faecal indicator on
the plankton organisms. The bacterial concentrations on plankton compared to the
situation in the entire surface water, indicate that they reflect only a minor fraction.
However, the concentrations of C. perfringens were similar or exceeded those in in
water during the sampling period. Concentrations of total coliforms, E. coli and
intestinal enterococci were higher than those in the free water in the month of August
and September.
In addition to the quantification of coliforms and intestinal enterococci, the systems
API® 20 E and API® rapid ID 32 were used respectively to evaluate the presence of
clinically important species. Therefore selected isolates of coliforms and intestinal
enterococci from four sampling dates (June, July, August and September 2010) were
tested. Identification of coliforms and intestinal enterococci reflected a variety of
species (Table 3.7).
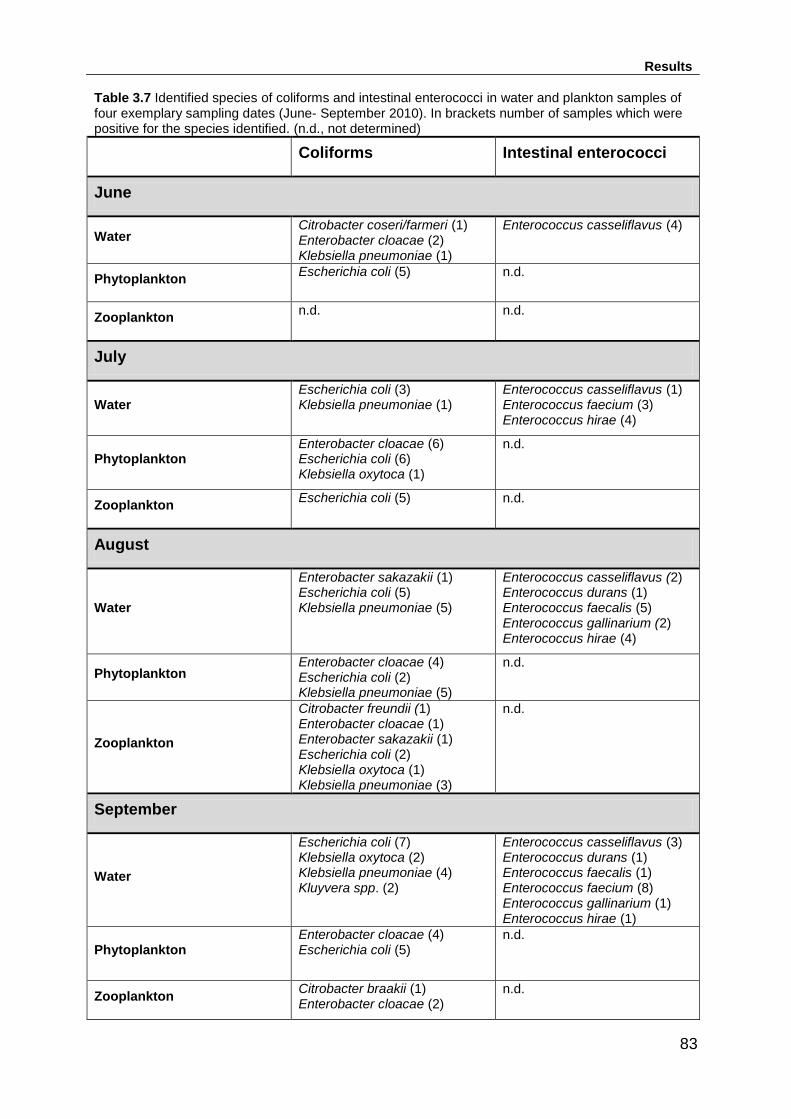
Results
83
Table 3.7 Identified species of coliforms and intestinal enterococci in water and plankton samples of four exemplary sampling dates (June- September 2010). In brackets number of samples which were positive for the species identified. (n.d., not determined)
Coliforms Intestinal enterococci
June
Water Citrobacter coseri/farmeri (1) Enterobacter cloacae (2) Klebsiella pneumoniae (1)
Enterococcus casseliflavus (4)
Phytoplankton Escherichia coli (5) n.d.
Zooplankton n.d. n.d.
July
Water Escherichia coli (3) Klebsiella pneumoniae (1)
Enterococcus casseliflavus (1) Enterococcus faecium (3) Enterococcus hirae (4)
Phytoplankton Enterobacter cloacae (6) Escherichia coli (6) Klebsiella oxytoca (1)
n.d.
Zooplankton Escherichia coli (5) n.d.
August
Water
Enterobacter sakazakii (1) Escherichia coli (5) Klebsiella pneumoniae (5)
Enterococcus casseliflavus (2) Enterococcus durans (1) Enterococcus faecalis (5) Enterococcus gallinarium (2) Enterococcus hirae (4)
Phytoplankton Enterobacter cloacae (4) Escherichia coli (2) Klebsiella pneumoniae (5)
n.d.
Zooplankton
Citrobacter freundii (1) Enterobacter cloacae (1) Enterobacter sakazakii (1) Escherichia coli (2) Klebsiella oxytoca (1) Klebsiella pneumoniae (3)
n.d.
September
Water
Escherichia coli (7) Klebsiella oxytoca (2) Klebsiella pneumoniae (4) Kluyvera spp. (2)
Enterococcus casseliflavus (3) Enterococcus durans (1) Enterococcus faecalis (1) Enterococcus faecium (8) Enterococcus gallinarium (1) Enterococcus hirae (1)
Phytoplankton Enterobacter cloacae (4) Escherichia coli (5)
n.d.
Zooplankton Citrobacter braakii (1) Enterobacter cloacae (2)
n.d.
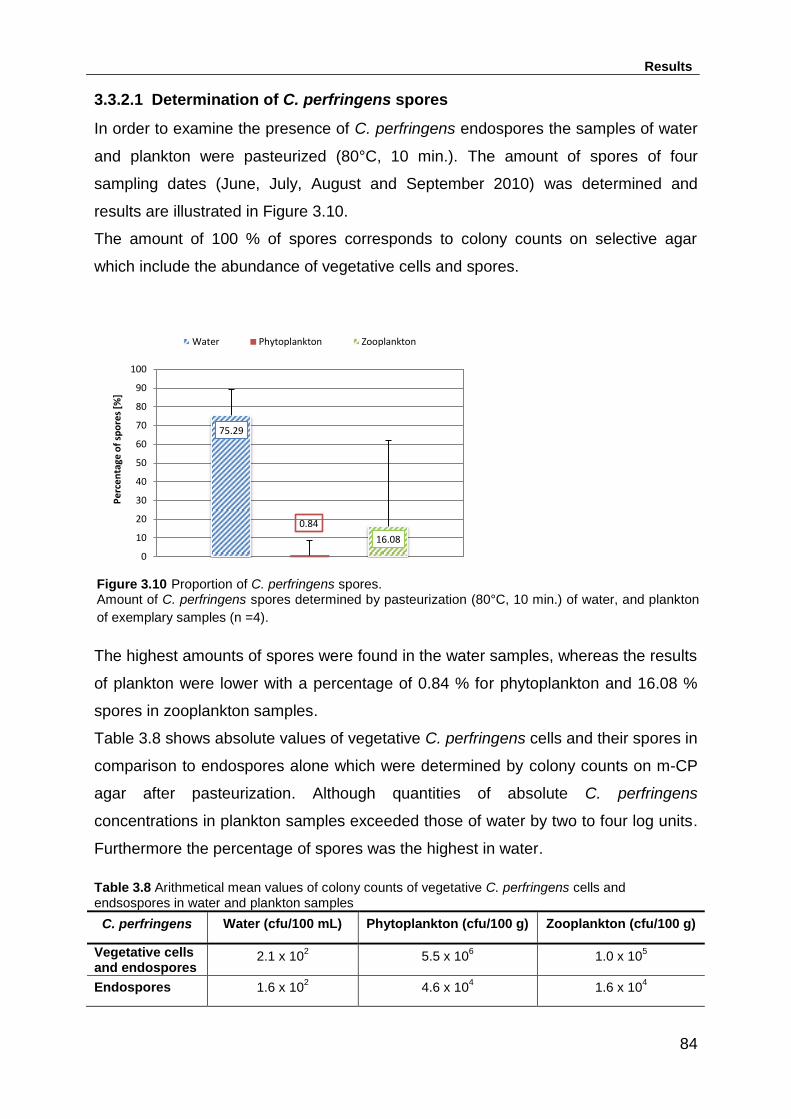
Results
84
3.3.2.1 Determination of C. perfringens spores
In order to examine the presence of C. perfringens endospores the samples of water
and plankton were pasteurized (80°C, 10 min.). The amount of spores of four
sampling dates (June, July, August and September 2010) was determined and
results are illustrated in Figure 3.10.
The amount of 100 % of spores corresponds to colony counts on selective agar
which include the abundance of vegetative cells and spores.
The highest amounts of spores were found in the water samples, whereas the results
of plankton were lower with a percentage of 0.84 % for phytoplankton and 16.08 %
spores in zooplankton samples.
Table 3.8 shows absolute values of vegetative C. perfringens cells and their spores in
comparison to endospores alone which were determined by colony counts on m-CP
agar after pasteurization. Although quantities of absolute C. perfringens
concentrations in plankton samples exceeded those of water by two to four log units.
Furthermore the percentage of spores was the highest in water.
Table 3.8 Arithmetical mean values of colony counts of vegetative C. perfringens cells and endsospores in water and plankton samples
C. perfringens Water (cfu/100 mL) Phytoplankton (cfu/100 g) Zooplankton (cfu/100 g)
Vegetative cells and endospores
2.1 x 10² 5.5 x 10
6 1.0 x 10
5
Endospores 1.6 x 10²
4.6 x 10⁴
1.6 x 10⁴
75.29
0.84
16.08
0
10
20
30
40
50
60
70
80
90
100
Pe
rce
nta
ge o
f sp
ore
s [%
]
Water Phytoplankton Zooplankton
Figure 3.10 Proportion of C. perfringens spores. Amount of C. perfringens spores determined by pasteurization (80°C, 10 min.) of water, and plankton
of exemplary samples (n =4).
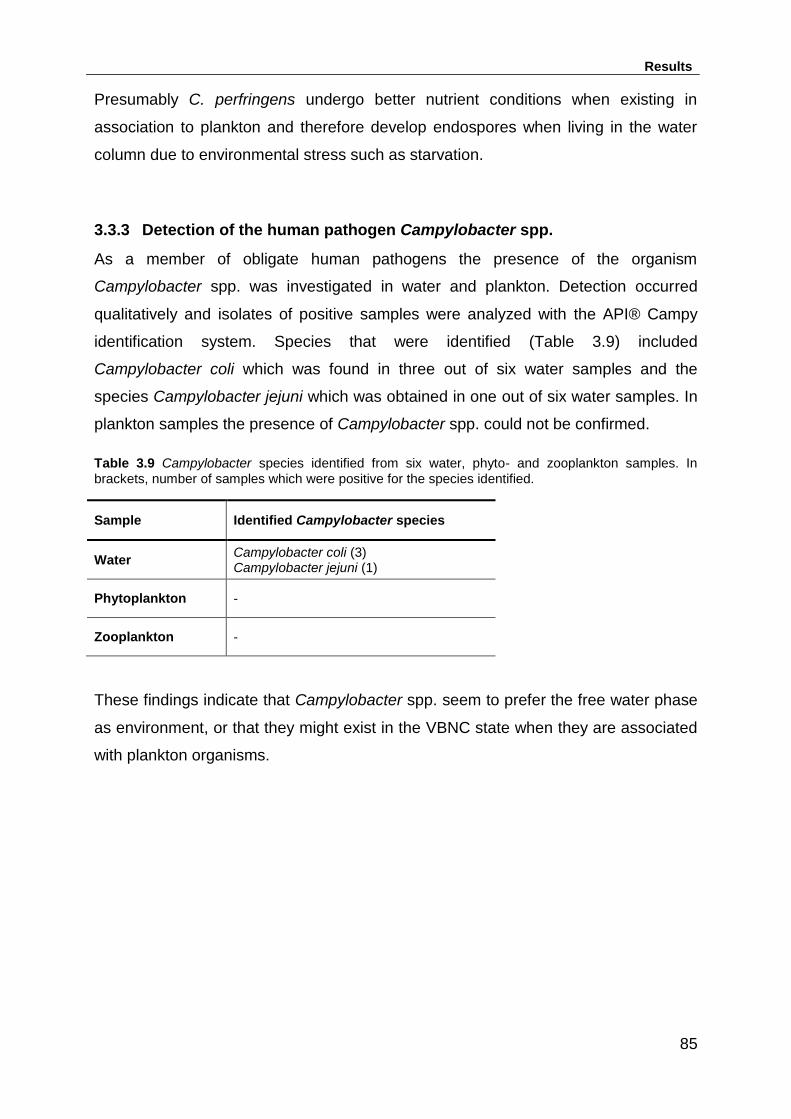
Results
85
Presumably C. perfringens undergo better nutrient conditions when existing in
association to plankton and therefore develop endospores when living in the water
column due to environmental stress such as starvation.
3.3.3 Detection of the human pathogen Campylobacter spp.
As a member of obligate human pathogens the presence of the organism
Campylobacter spp. was investigated in water and plankton. Detection occurred
qualitatively and isolates of positive samples were analyzed with the API® Campy
identification system. Species that were identified (Table 3.9) included
Campylobacter coli which was found in three out of six water samples and the
species Campylobacter jejuni which was obtained in one out of six water samples. In
plankton samples the presence of Campylobacter spp. could not be confirmed.
Table 3.9 Campylobacter species identified from six water, phyto- and zooplankton samples. In
brackets, number of samples which were positive for the species identified.
Sample Identified Campylobacter species
Water Campylobacter coli (3) Campylobacter jejuni (1)
Phytoplankton -
Zooplankton -
These findings indicate that Campylobacter spp. seem to prefer the free water phase
as environment, or that they might exist in the VBNC state when they are associated
with plankton organisms.
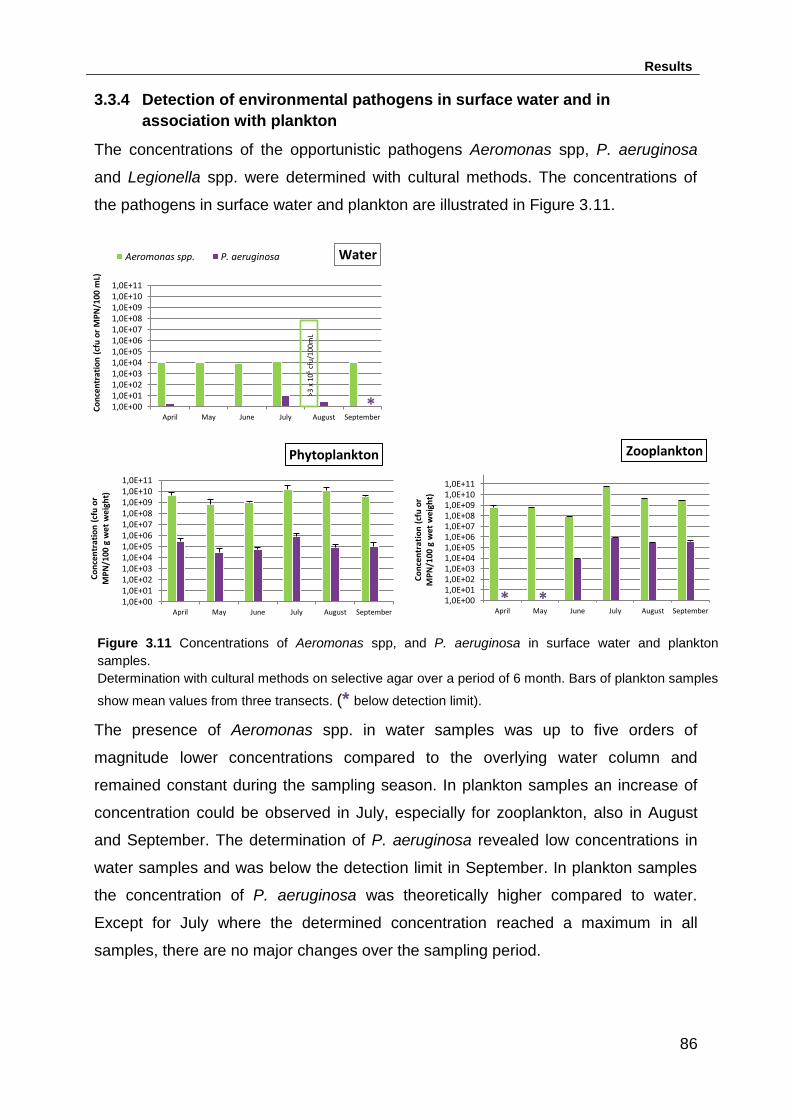
Results
86
3.3.4 Detection of environmental pathogens in surface water and in
association with plankton
The concentrations of the opportunistic pathogens Aeromonas spp, P. aeruginosa
and Legionella spp. were determined with cultural methods. The concentrations of
the pathogens in surface water and plankton are illustrated in Figure 3.11.
The presence of Aeromonas spp. in water samples was up to five orders of
magnitude lower concentrations compared to the overlying water column and
remained constant during the sampling season. In plankton samples an increase of
concentration could be observed in July, especially for zooplankton, also in August
and September. The determination of P. aeruginosa revealed low concentrations in
water samples and was below the detection limit in September. In plankton samples
the concentration of P. aeruginosa was theoretically higher compared to water.
Except for July where the determined concentration reached a maximum in all
samples, there are no major changes over the sampling period.
1,0E+001,0E+011,0E+021,0E+031,0E+041,0E+051,0E+061,0E+071,0E+081,0E+091,0E+101,0E+11
April May June July August September
Co
nce
ntr
atio
n (
cfu
or
MP
N/1
00
mL)
Water Aeromonas spp. P. aeruginosa
>3 x
10
5 c
fu/1
00m
L
*
1,0E+001,0E+011,0E+021,0E+031,0E+041,0E+051,0E+061,0E+071,0E+081,0E+091,0E+101,0E+11
April May June July August September
Co
nce
ntr
atio
n (
cfu
or
M
PN
/100
g w
et w
eigh
t)
Phytoplankton
1,0E+001,0E+011,0E+021,0E+031,0E+041,0E+051,0E+061,0E+071,0E+081,0E+091,0E+101,0E+11
April May June July August September
Co
nce
ntr
atio
n (
cfu
or
M
PN
/100
g w
et w
eigh
t)
Zooplankton
* *
Figure 3.11 Concentrations of Aeromonas spp, and P. aeruginosa in surface water and plankton
samples.
Determination with cultural methods on selective agar over a period of 6 month. Bars of plankton samples
show mean values from three transects. (* below detection limit).

Results
87
In zooplankton samples P. aeruginosa was observed also two times below the
detection limit which was calculated in relation to the determined plankton mass with
6.5 x 10⁴ MPN/100 g wet weight and 1.7 x 10⁵ MPN/100 g wet weight.
The geometric mean values (Figure 3.12) show that the local density of the two
investigated opportunistic pathogens on plankton, particularly on phytoplankton, was
higher compared to the water column.
If plankton samples were referred to the sampled water volume the concentrations of
Aeromonas spp. and P. aeruginosa showed compared to the free water less
differences in the months April till June (Figure 3.13). Aeromonas spp. quantities in
plankton samples exceeded those in water in July, August and September. The same
could be detected for P. aeruginosa in August and September.
1,0E+00
1,0E+01
1,0E+02
1,0E+03
1,0E+04
1,0E+05
1,0E+06
1,0E+07
1,0E+08
1,0E+09
1,0E+10
Water Phytoplankton Zooplankton Water Phytoplankton Zooplankton
Aeromonas spp. P. aeruginosa
Co
nce
ntr
atio
n (
cfu
or
MP
N/
100
mL
or
10
0 g
wet
wei
ght)
Figure 3.12 Geometric mean values for Aeromonas spp. and P. aeruginosa in water and plankton samples (n = 6)
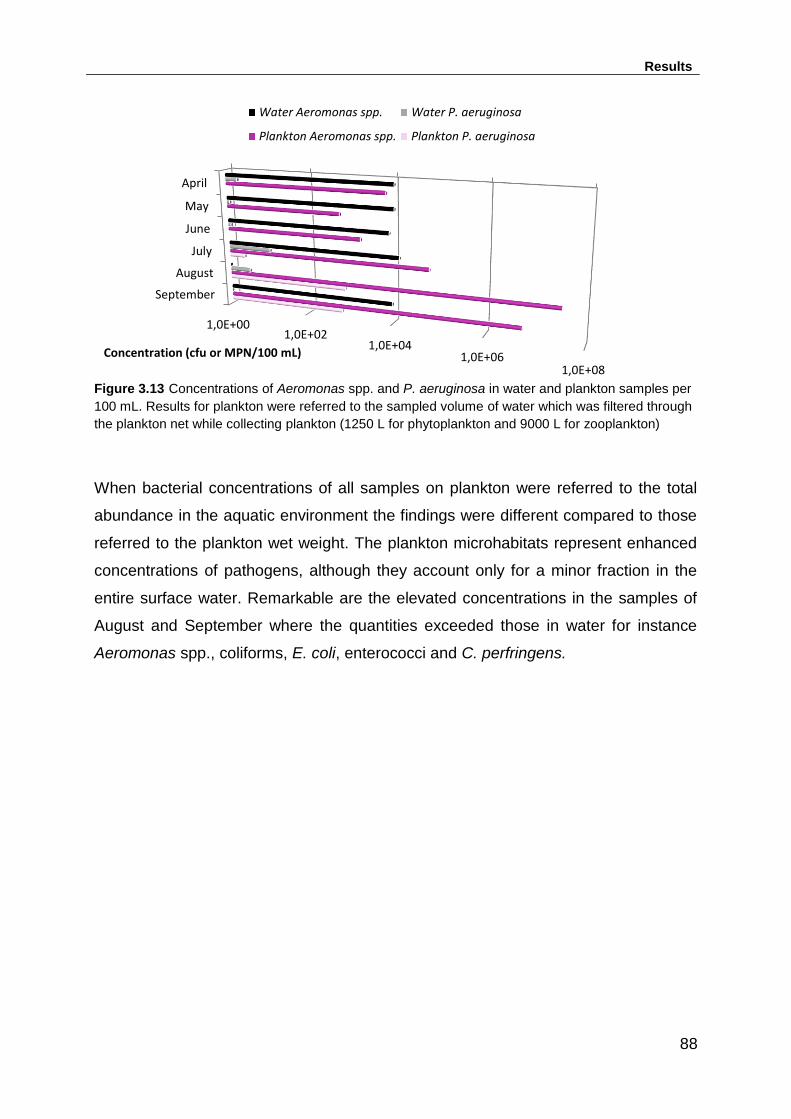
Results
88
1,0E+001,0E+02
1,0E+041,0E+06
1,0E+08
April
May
June
July
August
September
Concentration (cfu or MPN/100 mL)
Water Aeromonas spp. Water P. aeruginosa
Plankton Aeromonas spp. Plankton P. aeruginosa
Figure 3.13 Concentrations of Aeromonas spp. and P. aeruginosa in water and plankton samples per
100 mL. Results for plankton were referred to the sampled volume of water which was filtered through
the plankton net while collecting plankton (1250 L for phytoplankton and 9000 L for zooplankton)
When bacterial concentrations of all samples on plankton were referred to the total
abundance in the aquatic environment the findings were different compared to those
referred to the plankton wet weight. The plankton microhabitats represent enhanced
concentrations of pathogens, although they account only for a minor fraction in the
entire surface water. Remarkable are the elevated concentrations in the samples of
August and September where the quantities exceeded those in water for instance
Aeromonas spp., coliforms, E. coli, enterococci and C. perfringens.

Results
89
Moreover 13 isolates of Aeromonas spp. from water and plankton samples were
analyzed by 16S rDNA sequencing (Table 3.10). The analysis identified 11 isolates
as A. hydrophila with a probability of 94 – 99%. This species showed homology to
ATCC type strain 7966. Furthermore, one species isolated from phytoplankton was
identified as A. salmonicida (probability 96%) and one isolate could not be identified
and is nominated as ‘none’.
Table 3.10 Aeromonas species identified by 16S rDNA sequencing analysis of 13 isolates from surface water and plankton. In brackets, number of samples which were positive for the species identified
Sample Identified Aeromonas species
Water Aeromonas hydrophila (5)
Phytoplankton
Aeromonas hydrophila (2)
Aeromonas salmonicida (1)
‘None’ (1)
Zooplankton Aeromonas hydrophila (4)
Legionella spp. was never detected neither in water nor in plankton over the whole
sampling period of six months with cultural methods. Detection limits for Legionella
spp. were calculated on the basis of the assumption that at least 1 cfu/100 mL or 100
g plankton might have been detected. Hence, the detection limit in water was 1.0
cfu/100 mL. Detection limits on plankton were calculated in relation to the sampled
plankton mass and were 3.7 x 10⁴ cfu/100 g wet weight for phytoplankton and 2.2 x
105 cfu/100 g wet weight of zooplankton.
3.3.5 Distribution of pathogens in a filtered water sample
In order to determine if there is a significant difference of bacterial abundance in a
water sample compared to a plankton-free water sample, at three sampling dates
water was filtered through a plankton net (mesh size 55 µm) and therefore
considered as plankton-free.
The exemplary investigation of total cell counts, heterotrophic plate counts, coliforms
and E. coli in plankton-free water showed no differences compared to the water
samples (data not shown) and was therefore neglected in further sampling.
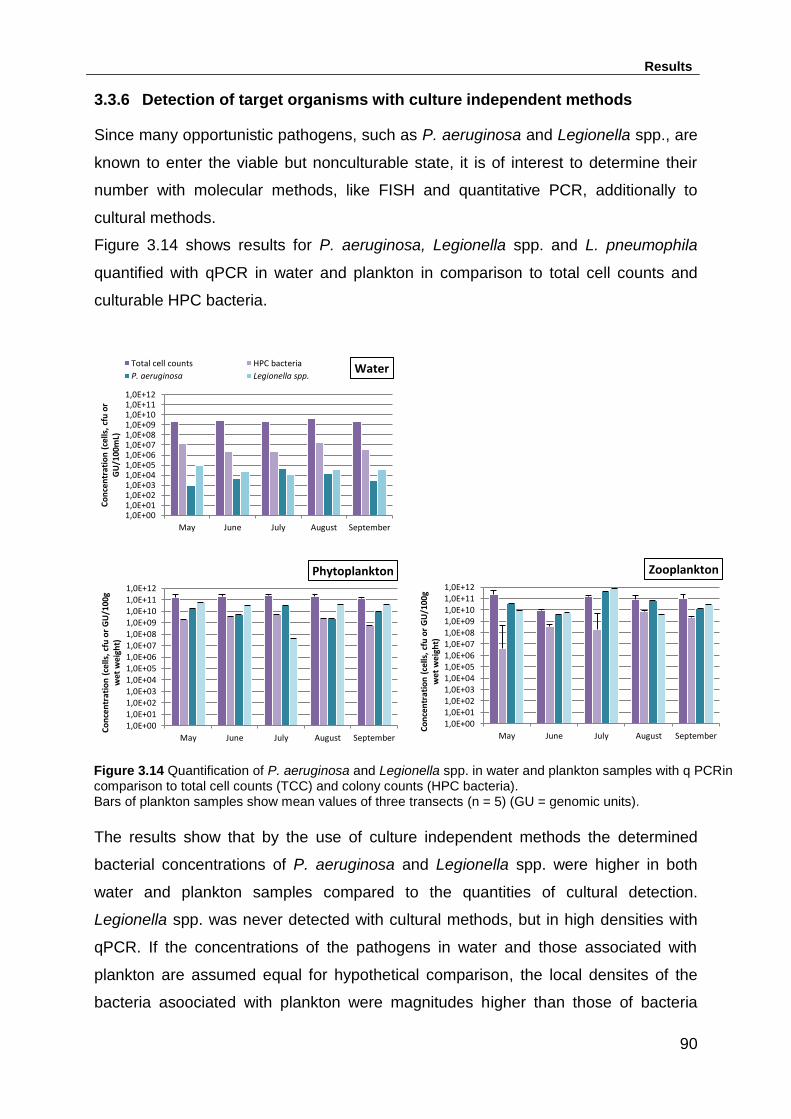
Results
90
3.3.6 Detection of target organisms with culture independent methods
Since many opportunistic pathogens, such as P. aeruginosa and Legionella spp., are
known to enter the viable but nonculturable state, it is of interest to determine their
number with molecular methods, like FISH and quantitative PCR, additionally to
cultural methods.
Figure 3.14 shows results for P. aeruginosa, Legionella spp. and L. pneumophila
quantified with qPCR in water and plankton in comparison to total cell counts and
culturable HPC bacteria.
The results show that by the use of culture independent methods the determined
bacterial concentrations of P. aeruginosa and Legionella spp. were higher in both
water and plankton samples compared to the quantities of cultural detection.
Legionella spp. was never detected with cultural methods, but in high densities with
qPCR. If the concentrations of the pathogens in water and those associated with
plankton are assumed equal for hypothetical comparison, the local densites of the
bacteria asoociated with plankton were magnitudes higher than those of bacteria
Figure 3.14 Quantification of P. aeruginosa and Legionella spp. in water and plankton samples with q PCRin comparison to total cell counts (TCC) and colony counts (HPC bacteria). Bars of plankton samples show mean values of three transects (n = 5) (GU = genomic units).
1,0E+001,0E+011,0E+021,0E+031,0E+041,0E+051,0E+061,0E+071,0E+081,0E+091,0E+101,0E+111,0E+12
May June July August September
Co
nce
ntr
atio
n (
cells
, cf
u o
r G
U/1
00m
L)
Water Total cell counts HPC bacteria
P. aeruginosa Legionella spp.
1,0E+001,0E+011,0E+021,0E+031,0E+041,0E+051,0E+061,0E+071,0E+081,0E+091,0E+101,0E+111,0E+12
May June July August September
Co
nce
ntr
atio
n (
cells
, cf
u o
r G
U/1
00g
wet
wei
ght)
Phytoplankton
1,0E+001,0E+011,0E+021,0E+031,0E+041,0E+051,0E+061,0E+071,0E+081,0E+091,0E+101,0E+111,0E+12
May June July August September
Co
nce
ntr
atio
n (
cells
, cf
u o
r G
U/1
00g
wet
wei
ght)
Zooplankton

Results
91
living in the water column. A slightly peak was also notable in zooplankton in
comparison to phytoplankton samples, especially in the month July.
If qPCR results are compared to total cell counts, the difference displays about five
orders of magnitude in water and about 2 orders of magnitude in plankton samples.
FISH-results of the opportunistic pathogens P. aeruginosa, Legionella spp. and L.
pneumophila could be detected and quantified in all water samples during the six
month of sampling. Concentrations of the three organisms were around 106 cells/100
mL of water (Figure 3.15).
1,0E+00
1,0E+01
1,0E+02
1,0E+03
1,0E+04
1,0E+05
1,0E+06
1,0E+07
April May June July August September
Co
nce
ntr
atio
n (
cells
/100
mL)
P. aeruginosa Legionella spp. L. pneumophila
Figure 3.15 Concentrations of FISH positive cells of the opportunistic pathogens P. aeruginosa (probe Psae 16S-182), Legionella spp. (probe LEG705) and L. pneumophila (LEGPNE1) in water samples (n = 6)
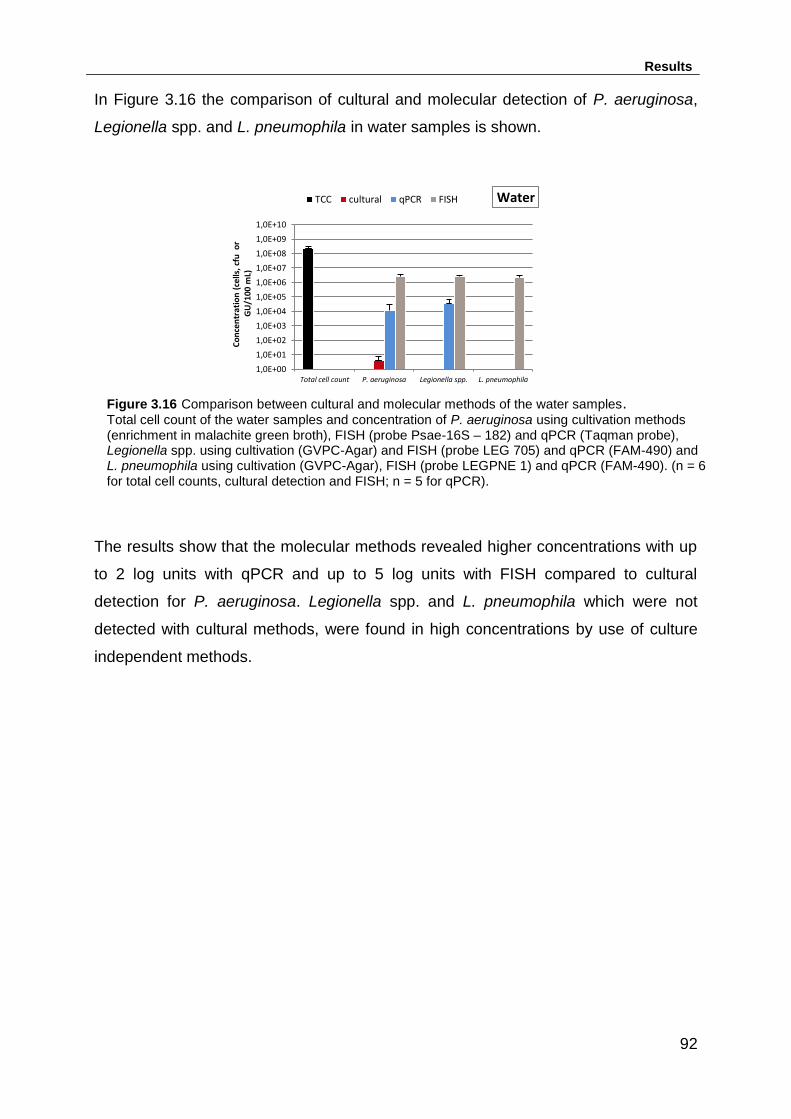
Results
92
In Figure 3.16 the comparison of cultural and molecular detection of P. aeruginosa,
Legionella spp. and L. pneumophila in water samples is shown.
The results show that the molecular methods revealed higher concentrations with up
to 2 log units with qPCR and up to 5 log units with FISH compared to cultural
detection for P. aeruginosa. Legionella spp. and L. pneumophila which were not
detected with cultural methods, were found in high concentrations by use of culture
independent methods.
1,0E+00
1,0E+01
1,0E+02
1,0E+03
1,0E+04
1,0E+05
1,0E+06
1,0E+07
1,0E+08
1,0E+09
1,0E+10
Total cell count P. aeruginosa Legionella spp. L. pneumophila
Co
nce
ntr
atio
n (
cells
, cf
u o
r G
U/1
00
mL)
Water TCC cultural qPCR FISH
Figure 3.16 Comparison between cultural and molecular methods of the water samples. Total cell count of the water samples and concentration of P. aeruginosa using cultivation methods (enrichment in malachite green broth), FISH (probe Psae-16S – 182) and qPCR (Taqman probe), Legionella spp. using cultivation (GVPC-Agar) and FISH (probe LEG 705) and qPCR (FAM-490) and L. pneumophila using cultivation (GVPC-Agar), FISH (probe LEGPNE 1) and qPCR (FAM-490). (n = 6 for total cell counts, cultural detection and FISH; n = 5 for qPCR).

Results
93
3.3.7 Microorganisms associated with the macrophyte Elodea nuttallii
In aquatic environments there are different surfaces available for bacteria to attach
and for biofilm formation. Due to the massive growth of the macrophyte Elodea
nuttallii in the year 2009 it was obvious to investigate whether there is an
accumulation of bacteria on the surface of the waterplant. Figure 3.17 shows the
overall bacterial abundance with total cell counts and heterotrophic plate counts
associated with the macrophyte compared to planktonic bacteria in the water phase.
Water temperature during Elodea sampling ranged between 21.3 °C in July, 22.5 °C
in August and 11.3 °C in October.
The bacterial abundance, determined by total cell counts and heterotrophic plate
counts, was enhanced with one to three orders of magnitude by presence of E.
nuttallii compared to the results of the overlying water. This indicates that the nutrient
supply by the macrophyte is favourable for bacterial attachment.
1,0E+001,0E+011,0E+021,0E+031,0E+041,0E+051,0E+061,0E+071,0E+081,0E+091,0E+101,0E+111,0E+121,0E+13
July August October
Co
nce
ntr
atio
n (
cells
or
cfu
/10
0 m
L)
Water TCC HPC
1,0E+001,0E+011,0E+021,0E+031,0E+041,0E+051,0E+061,0E+071,0E+081,0E+091,0E+101,0E+111,0E+121,0E+13
July August October
Co
nce
ntr
atio
n (
cells
or
cfu
/10
0 g
d
ry w
eigh
t)
Elodea nuttallii
Figure 3.17 General bacterial abundance in surface water and on Elodea nuttallii. Total cell counts (TCC) and colony counts (HPC) in water and on the macrophyte Elodea nuttallii (n = 3).

Results
94
In Figure 3.18 the concentrations of the organisms with faecal origin, thus total
coliforms, E. coli, intestinal enterococci, C. perfringens and the amount of the
opportunistic pathogen Aeromonas spp. are shown in water samples and samples
with Elodea nuttallii.
Densities of the investigated organism were found elevated in association with
Elodea nuttallii compared to the water. The group of intestinal enterococci seemed to
prefer the interaction with the macrophyte, notably in August where the concentration
was about seven orders of magnitude higher than in water sample. The organisms
Aeromonas spp. and C. perfringens showed also increased concentrations on the
macrophyte compared to water with a difference of three to four log units.
As an important member of obligate human pathogens, Campylobacter spp. was
investigated in water samples and in association with Elodea nuttallii. Identification of
positive samples with the API® Campy identification system confirmed the presence
of Campylobacter coli in one of the three macrophyte samples, but never in water
samples.
Hygienically relevant organisms were present in the water column as well as in
samples associated with the macrophyte Elodea nuttallii. When milliliters of water
and grams of dry weight of the waterplant are assumed equal for hypothetical
comparison, there is a notable accumulation of bacteria on Elodea nuttallii.
Figure 3.18 Concentrations of organisms with faecal origin (coliforms, E. coli, intestinal enterococci, C. perfringens) and the pathogen (Aeromonas spp.) in surface water and on Elodea nuttallii.
Determination of the pathogens occurred with cultural methods, samples were taken in July, August and
October (n = 3). Results are given per 100 mL of water and per 100 g of dry weight for Elodea nuttallii.
1,0E+00
1,0E+01
1,0E+02
1,0E+03
1,0E+04
1,0E+05
1,0E+06
1,0E+07
1,0E+08
1,0E+09
July August October
Co
nce
ntr
atio
n (
MP
N o
r cf
u/1
00
mL)
Water coliforms E. coli
intestinal enterococci C. perfringens
Aeromonas spp.
1,0E+00
1,0E+01
1,0E+02
1,0E+03
1,0E+04
1,0E+05
1,0E+06
1,0E+07
1,0E+08
1,0E+09
July August OctoberCo
nce
ntr
atio
n (
MP
N o
r cf
u/1
00
g
dry
wei
ght)
Elodea nuttallii

Results
95
The comparison of bacterial abundencies determined on Elodea nuttallii are
compared to those in plankton samples, indicated an enhancement in total cell
counts as well as HPC bacteria around one order of magnitude (Figure 3.19).
Organisms with faecal origin as well as Aeromonas spp. were also found in higher
concentrations in plankton samples, except for intestinal enterococci which where
determined with higher quantity on Elodea.
The macrophyte Elodea nuttallii seems to represent another surface for hygienically
relevant microorganisms for attachment and biofilm formation or symbiosis. Where
the general abundance of bacteria was found higher on the macrophyte, the
organisms of faecal origin and the opportunistic pathogen Aeromonas spp. seem to
prefer the interaction with plankton. Except for the group of intestinal enterococci,
they were found in elevated concentraions on Elodea nuttallii.
1,0E+001,0E+011,0E+021,0E+031,0E+041,0E+051,0E+061,0E+071,0E+081,0E+091,0E+101,0E+111,0E+121,0E+13
TCC HPCbacteria
TCC HPCbacteria
TCC HPCbacteria
Elodea Phytoplankton Zooplankton
Co
nce
ntr
atio
n (
cells
or
cfu
/10
0 g
dry
w
eigh
t o
r w
et w
eigh
t)
1,0E+001,0E+011,0E+021,0E+031,0E+041,0E+051,0E+061,0E+071,0E+081,0E+091,0E+101,0E+111,0E+121,0E+13
Elo
dea
Ph
yto
pla
nkt
on
Zoo
pla
nkt
on
Elo
dea
Ph
yto
pla
nkt
on
Zoo
pla
nkt
on
Elo
dea
Ph
yto
pla
nkt
on
Zoo
pla
nkt
on
Elo
dea
Ph
yto
pla
nkt
on
Zoo
pla
nkt
on
Elo
dea
Ph
yto
pla
nkt
on
Zoo
pla
nkt
on
coliforms E. coli intestinalenterococci
C.perfringens
Aeromonasspp.
Co
nce
ntr
atio
n (
MP
N o
r cf
u/
10
0g
dry
wei
ght
or
wet
w
eigh
t)
Figure 3.19 Geometric mean values of bacterial abundencies (total cell counts and HPC bacteria, left) and organisms with faecal origin (coliforms, E. coli, intestinal enterococci, C. perfringens, right) as well as the opportunistic pathogen Aeromonas spp. determined in Elodea nuttallii samples (n = 3, given per 100 g dry weight) compared to concentrations on plankton (n = 6, given per 100 g wet weight).

Results
96
3.4 Interaction between Daphnia magna and pathogens in laboratory
microcosms
As an example for associations of hygienically relevant organisms with zooplankton
organisms, the interaction of the opportunistic pathogens Pseudomonas aeruginosa,
Aeromonas hydrophila and Enterococcus faecalis with the zooplankton model
organism Daphnia magna was investigated in laboratory microcosms.
3.4.1 Determination of toxicity of Pseudomonas aeruginosa, Aeromonas
hydrophila and Enterococcus faecalis to Daphnia magna
To determine bacterial toxicity on D. magna according to Le Codiac et al. (2012) the
zooplankton organism was exposed to 4 different concentrations each of the
organsims P. aeruginosa PAO1, A. hydrophila AH-1N and E. faecalis DSMZ 20478
over a period of up to 28 h.
This was conducted to determine a bacterial concentration that does not lead to
death of daphnids which was important for the following co-cultivation experiments.
In each batch culture three daphnids were exposed to bacterial densities with an OD
(600 nm) of 0.4, 0.8, 1.5, and 3. An OD600 of 3 corresponded to a cell density of
approximately 109 cells/mL for all of the pathogens. Bacterial suspensions were
prepared in sterile Daphnia medium (ADaM) and incubation occurred at room
temperature.
D. magna was assumed to be dead when they were immobile, thus sinking to the
bottom of the Eppendorf tubes and not swimming anymore after turning the tube
upside down (Le Codiac et al., 2012).
As a control three D. magna individuals were cultivated per Eppendorf tube
containing sterile Daphnia medium (ADaM ).

Results
97
Results of toxicity are illustrated in Figure 3.20. With increasing bacterial
concentration a faster death of daphnids occurred.
In the Eppendorf tube with an OD600 of 3 the three daphnids died within 6 hours, after
7 hours none of three D. magna were alive in the batchculture with a bacterial density
of OD600 = 1.5. After 24 hours the tube with a bacterial concentration of OD600= 0.8
yielded no Daphnia alive and an OD600 of 0.4 led to death of all three daphnids after
28 hours.
In the microcosms with A. hydrophila the first daphnids were found to be dead after
27 hours within the tubes with a bacterial density OD600 of 3. In all other tubes a few
D. magna were still alive.
For E. faecalis the daphnids survived completely and no death was observed within
28 h (data not shown).
Acute toxicity on D. magna dependent on bacterial concentration could only be
observed for P. aeruginosa.
Figure 3.20 Toxicity of P. aeruginosa and A. hydrophila on D. magna.
In each Eppendorf tube three D. magna were exposed to 1mL bacterial suspension of the pathogens P.
aeruginosa PAO1 and A. hydrophila AH-1N with bacterial densities of OD600= 0.4, 0.8, 1.5, and 3 for up to
28 h (n = 3). Incubation occurred at room temperature (22-24°C). As a control, three D. magna were
incubated in sterile ADaM.
0
1
2
3
4
0 1 2 3 4 5 6 7 8 9 22 23 24 25 26 27 28
Nu
mb
er o
f d
aph
nid
s al
ive
Time (h)
P. aeruginosa OD 0.4 OD 0.8 OD 1.5
OD 3 Control
0
1
2
3
4
0 1 2 3 4 5 6 25 26 27
Nu
mb
er o
f d
aph
nid
s al
ive
Time (h)
A. hydrophila OD 0.4 OD 0.8 OD 1.5OD 3 Control

Results
98
3.4.2 Co-cultivation of Daphnia magna with Pseudomonas aeruginosa
Since associations between hygienically relevant microorganisms and plankton are
described in literature and were approved with investigations of Lake Baldeney, this
phenomenon was examined in laboratory experiments. The aim was to elucidate
wheter the bacteria prefer to live free in the water phase or associated to the
zooplankton organisms. In the latter case a differentiation between the proportion of
organisms found on the integument or in the gut of the daphnids was carried out.
This separation was conducted to determine the ratio of bacteria that were attached
to the daphnids´ surface and the part which was ingested by the plankton organism.
Furthermore the quantities of pathogens existing in a nonculturable state where
determined with FISH.
In co-cultivation experiments D. magna was exposed to defined concentrations
(~ 107 cells/mL) of bacterial suspensions. The association was determined by use of
total cell counts, colony counts on selective media and with FISH at the times of 0, 24
and 48 h. Co-cultivation was performed in 6-well culture plates composed of
polystyrene. Bacterial suspensions were prepared in sterile Daphnia medium
(ADaM). As a control, the bacterial suspension was incubated without daphnids.
Incubation occurred at room temperature between 22° and 24°C.
To observe the distribution of the organisms in batch cultures, samples of different
compartments were obtained.
Compartments are:
- the ‘well biofilm’, bacterial biofilms adhering to the surface of the cultivation
well
- the ‘planktonic phase’, consisting of the culture medium and loosly associated
bacteria, which could be washed off (rinsing water) of the daphnids surface
- ‘Daphnia-associated’, therefore the daphnids were separated under a
microscope by the use of tweezers into the gut and the carapace, including
leftover entrails and the rest of the organisms´ body (Figure 3.21).
As a control, D. magna was incubated without bacteria and same samples were
processed (data not shown). The investigated opportunistic pathogens were never
detected and therefore concluded that they were not member in the natural bacterial
flora of the daphnids tested in this study.

Results
99
Results of the planktonic phase are given in mL, results of Daphnia are given per one
D. magna organism and results of the biofilm are calculated for the surface of one
well in the 6-well plates (which was determined with 13.47 cm2) and are given per
cm2.
Figure 3.21 D. magna separated into gut (left) and the carapace with leftover entrails. (Lightmicroscopic pictures, magnification 100x, source: Miriam Tewes, Biofilm Centre, University of Duisburg-Essen)

Results
100
The association of D. magna with the pathogen P. aeruginosa was investigated in a
co-culture system. The distribution of the bacterium onto the different mentioned
compartments was investigated with total cell counts (DAPI-method), colony counts
on CN agar and FISH with the gene probe Psae-16S-182 (Figure 3.22). The control,
thus the inoculation medium, was determined with total cell counts around 3.0 x 10⁷
cells/mL and colony counts of 8.8 x 10⁶ cfu/mL.
1,0E+001,0E+011,0E+021,0E+031,0E+041,0E+051,0E+061,0E+071,0E+081,0E+091,0E+101,0E+111,0E+121,0E+13
0 24 48Co
nce
ntr
ati
on
(ce
lls o
r cf
u/m
L)
Time (h)
Medium Total cells FISH pos. colony counts
1,0E+001,0E+011,0E+021,0E+031,0E+041,0E+051,0E+061,0E+071,0E+081,0E+091,0E+101,0E+111,0E+121,0E+13
0 24 48C
on
cen
trat
ion
(ce
llso
r cf
u/m
L)
Time (h)
Rinsing water
1,0E+001,0E+011,0E+021,0E+031,0E+041,0E+051,0E+061,0E+071,0E+081,0E+091,0E+101,0E+111,0E+121,0E+13
0 24 48Co
nce
ntr
atio
n (
cells
or
cfu
/Dap
hn
ia)
Time (h)
Carapace
1,0E+001,0E+011,0E+021,0E+031,0E+041,0E+051,0E+061,0E+071,0E+081,0E+091,0E+101,0E+111,0E+121,0E+13
0 24 48Co
nce
ntr
atio
n (
cells
or
cfu
/Dap
hn
ia)
Time (h)
Gut
1,0E+001,0E+011,0E+021,0E+031,0E+041,0E+051,0E+061,0E+071,0E+081,0E+091,0E+101,0E+111,0E+121,0E+13
0 24 48
Co
nce
ntr
atio
n (
cells
or
cfu
/cm
2)
Time (h)
Well
Figure 3.22 Total cell counts, determined with the DAPI method, colony counts on CN selective agar and FISH positive cells (probe PSAE-16S-182) of P. aeruginosa in association with D. magna (n =2). In a co-culture with 5 D. magna in each well the distribution of the pathogen P. aeruginosa was observed
over a time period of 48 h. Incubation occurred in ADaM medium with a bacterial concentration of 108
cells/mL at room temperature (22-24°C). As a control, bacterial suspension without Daphnia.
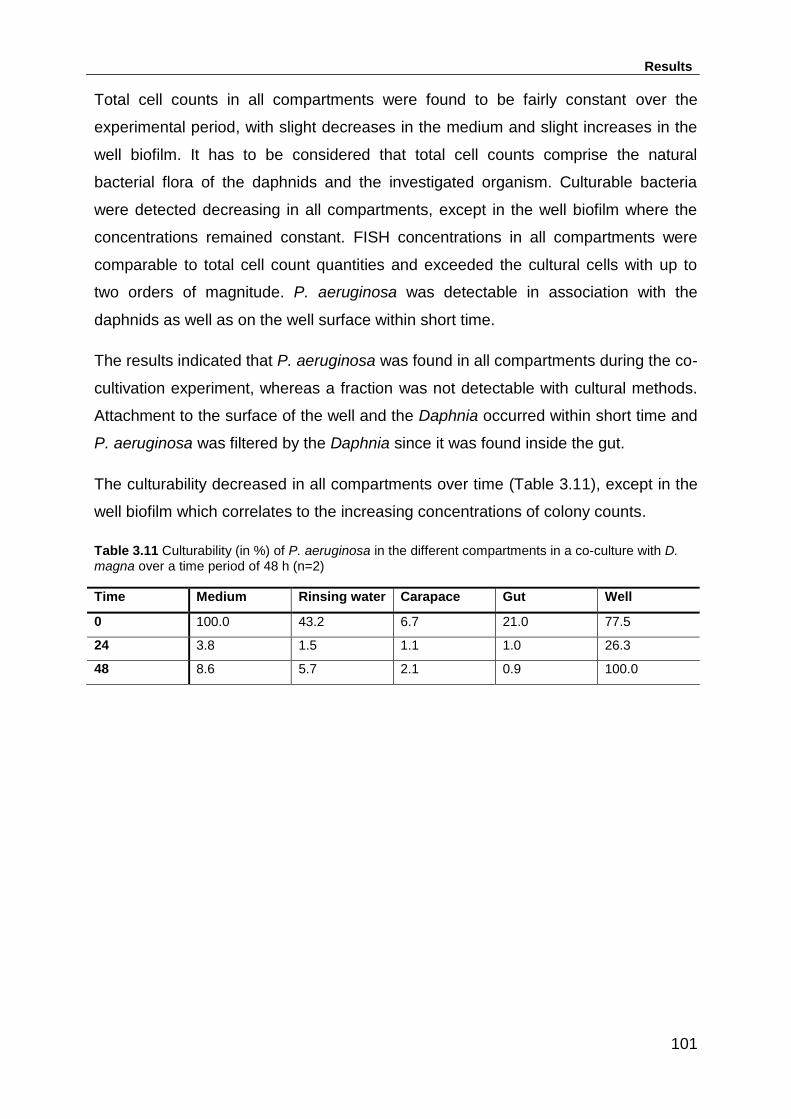
Results
101
Total cell counts in all compartments were found to be fairly constant over the
experimental period, with slight decreases in the medium and slight increases in the
well biofilm. It has to be considered that total cell counts comprise the natural
bacterial flora of the daphnids and the investigated organism. Culturable bacteria
were detected decreasing in all compartments, except in the well biofilm where the
concentrations remained constant. FISH concentrations in all compartments were
comparable to total cell count quantities and exceeded the cultural cells with up to
two orders of magnitude. P. aeruginosa was detectable in association with the
daphnids as well as on the well surface within short time.
The results indicated that P. aeruginosa was found in all compartments during the co-
cultivation experiment, whereas a fraction was not detectable with cultural methods.
Attachment to the surface of the well and the Daphnia occurred within short time and
P. aeruginosa was filtered by the Daphnia since it was found inside the gut.
The culturability decreased in all compartments over time (Table 3.11), except in the
well biofilm which correlates to the increasing concentrations of colony counts.
Table 3.11 Culturability (in %) of P. aeruginosa in the different compartments in a co-culture with D. magna over a time period of 48 h (n=2)
Time Medium Rinsing water Carapace Gut Well
0 100.0 43.2 6.7 21.0 77.5
24 3.8 1.5 1.1 1.0 26.3
48 8.6 5.7 2.1 0.9 100.0

Results
102
To observe the distribution in between the different compartments in the co-
cultivation system the percentages of culturable P. aeruginosa are shown in Figure
3.23.
The major shift in the distribution of culturable P. aeruginosa within the co-cultivation
compartments was observed within the inoculation medium, where it decreased from
80.6 % to 3.6 % onto the surface of the well, where culturable cells increased from
9.3 % to 88.6 %. Daphnia-associated P. aeruginosa showed a very slight increase in
colony counts.
9,3%
4,8%
80,6%
3,2% 2,1%
0 h
well
rinsing water
medium
carapace
gut
84,8%
0,3%
7,4% 6,6% 0,9%
24 h
88,6%
0,2%
3,6% 7,3% 0,3%
48 h
Figure 3.23 Balance of colony counts of P. aeruginosa in association with D. magna. Distribution (in %) of P. aeruginosa in the different compartments of the co-cultivation system; the well,
rinsing water, medium, carapace and gut. (n=2).

Results
103
The distribution of FISH positive cells within the five compartments, showed that the
proportion of P. aeruginosa is the highest in the association with the daphnids, in
particular with the carapce. The concentration was continously decreasing in the
planktonic compartments, the medium and the rinsing water, and increasing in
association with Daphnia within 48 h (Figure 3.24).
P. aeruginosa was detected in all compartments during the co-cultivation experiment,
whereas a fraction was not detectable with cultural methods. Attachment to the
surface of the well and the Daphnia occurred within short time since the organism
was found inside the gut at time point 0 it has to be assumed that the organism was
filtered by the Daphnia immediately. Co-cultivation of P. aeruginosa with D. magna
indicated that within 48 h the opportunistic pathogen attached with preference to the
daphnids surface and to the well of the culture plate. The culturability of P.
aeruginosa decreased in association with the Daphnia and increased in the well
biofilm. This might indicate that P. aeruginosa passed into the VBNC state in
interaction with D. magna.
Figure 3.24 Balance: Distribution of FISH positive cells of P. aeruginosa in a co-cultivation experiment with D. magna (n = 2)
7,7%
29,9%
5,7%
49,8%
7,0% 0 h
well biofilm
carapace
gut
medium
rinsing water
26,9%
48,6%
6,4%
16,3%
1,8% 24 h
14,0%
70,3%
6,4%
8,4% 0,8% 48 h

Results
104
3.4.3 Co-cultivation of Daphnia magna with Aeromonas hydrophila
In a co-cultivation experiment the association of A. hydrophila with the zooplankton
organsim D. magna was investigated using total cell counts, colony counts on
ampicillin-dextrin agar and the FISH method (probe AERBOMO) (Figure 3.25).
Figure 3.25 Total cell counts (DAPI method), colony counts (ampicillin-dextrin agar) (n=6) and FISH positive cells (probe AERBOMO) (n=2) of A. hydrophila in association with D. magna. In a co-culture with 5 D. magna in each well the distribution of the pathogen A. hydrophila was observed over
a time period of 48 h. Incubation occurred in ADaM medium with a bacterial concentration of 108 cells/mL at
room temperature (22-24°C). As a control, bacterial suspension without Daphnia.
1,0E+001,0E+011,0E+021,0E+031,0E+041,0E+051,0E+061,0E+071,0E+081,0E+091,0E+101,0E+111,0E+121,0E+13
0 24 48C
on
cen
trat
ion
(ce
lls o
r cf
u/m
L)
Time (h)
Rinsing water
1,0E+001,0E+011,0E+021,0E+031,0E+041,0E+051,0E+061,0E+071,0E+081,0E+091,0E+101,0E+111,0E+121,0E+13
0 24 48
Co
nce
ntr
atio
n (
cells
or
cfu
/mL)
Time (h)
Medium Total cells FISH pos. colony counts
1,0E+001,0E+011,0E+021,0E+031,0E+041,0E+051,0E+061,0E+071,0E+081,0E+091,0E+101,0E+111,0E+121,0E+13
0 24 48Co
nce
ntr
atio
n (
cells
or
cfu
/Dap
hn
ia)
Time (h)
Carapace
1,0E+001,0E+011,0E+021,0E+031,0E+041,0E+051,0E+061,0E+071,0E+081,0E+091,0E+101,0E+111,0E+121,0E+13
0 24 48
Co
nce
ntr
atio
n (
cells
or
cfu
/Dap
hn
ia)
Time (h)
Gut
1,0E+001,0E+011,0E+021,0E+031,0E+041,0E+051,0E+061,0E+071,0E+081,0E+091,0E+101,0E+111,0E+121,0E+13
0 24 48
Co
nce
ntr
atio
n (
cells
or
cfu
/cm
2)
Time (h)
Well

Results
105
The control, thus the inoculation medium of A. hydrophila without the influence of
Daphnia was remaining constant over time with total cell counts of 8.4 x 10⁷ cells/mL
and colony counts of 8.9 x 10⁷ cfu/mL.
Total cell counts as well as culturable bacteria showed decreasing tendencies in the
medium, wheras the concentrations were slightly increasing in the well biofim and
remained fairly constant in the rinsing water, the carapace and the gut.
Concentrations of A. hydrophila determined with the FISH method were constant
over time and about one to two orders of magnitude higher than with cultural
methods. In the well biofilm, FISH positive cells were detected increasing with one
log unit within 48 h.
The culturability of A. hydrophila in the association with D. magna was decreasing in
all compartments over time (Table 3.12).
Table 3.12 Culturability (in %) of A. hydrophila in the different compartments in a co-culture with D.
magna over a time period of 48 h (n=6)
Time Medium Rinsing water Carapace Gut Well
0 51.2 100.0 7.7 61.0 100.0
24 8.4 13.4 2.1 23.6 54.8
48 1.3 17.4 0.3 1.5 7.7
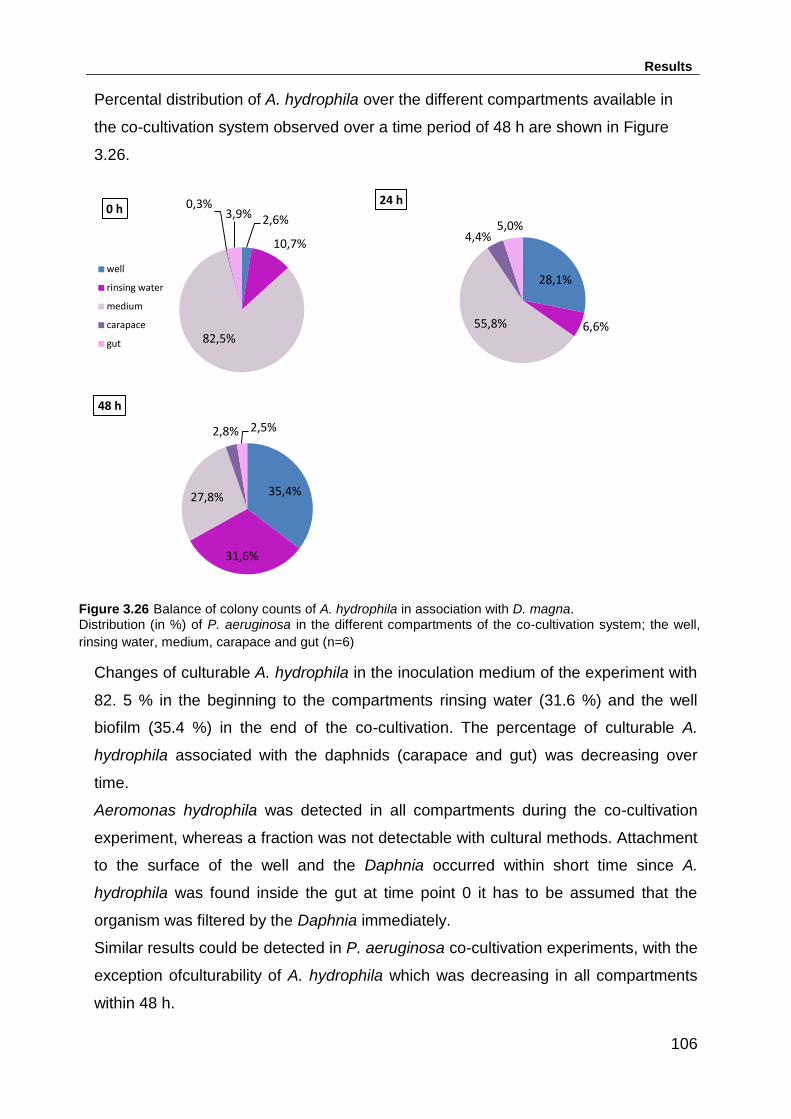
Results
106
Percental distribution of A. hydrophila over the different compartments available in
the co-cultivation system observed over a time period of 48 h are shown in Figure
3.26.
Changes of culturable A. hydrophila in the inoculation medium of the experiment with
82. 5 % in the beginning to the compartments rinsing water (31.6 %) and the well
biofilm (35.4 %) in the end of the co-cultivation. The percentage of culturable A.
hydrophila associated with the daphnids (carapace and gut) was decreasing over
time.
Aeromonas hydrophila was detected in all compartments during the co-cultivation
experiment, whereas a fraction was not detectable with cultural methods. Attachment
to the surface of the well and the Daphnia occurred within short time since A.
hydrophila was found inside the gut at time point 0 it has to be assumed that the
organism was filtered by the Daphnia immediately.
Similar results could be detected in P. aeruginosa co-cultivation experiments, with the
exception ofculturability of A. hydrophila which was decreasing in all compartments
within 48 h.
2,6%
10,7%
82,5%
0,3% 3,9% 0 h
well
rinsing water
medium
carapace
gut
28,1%
6,6% 55,8%
4,4% 5,0%
24 h
35,4%
31,6%
27,8%
2,8% 2,5%
48 h
Figure 3.26 Balance of colony counts of A. hydrophila in association with D. magna. Distribution (in %) of P. aeruginosa in the different compartments of the co-cultivation system; the well,
rinsing water, medium, carapace and gut (n=6)
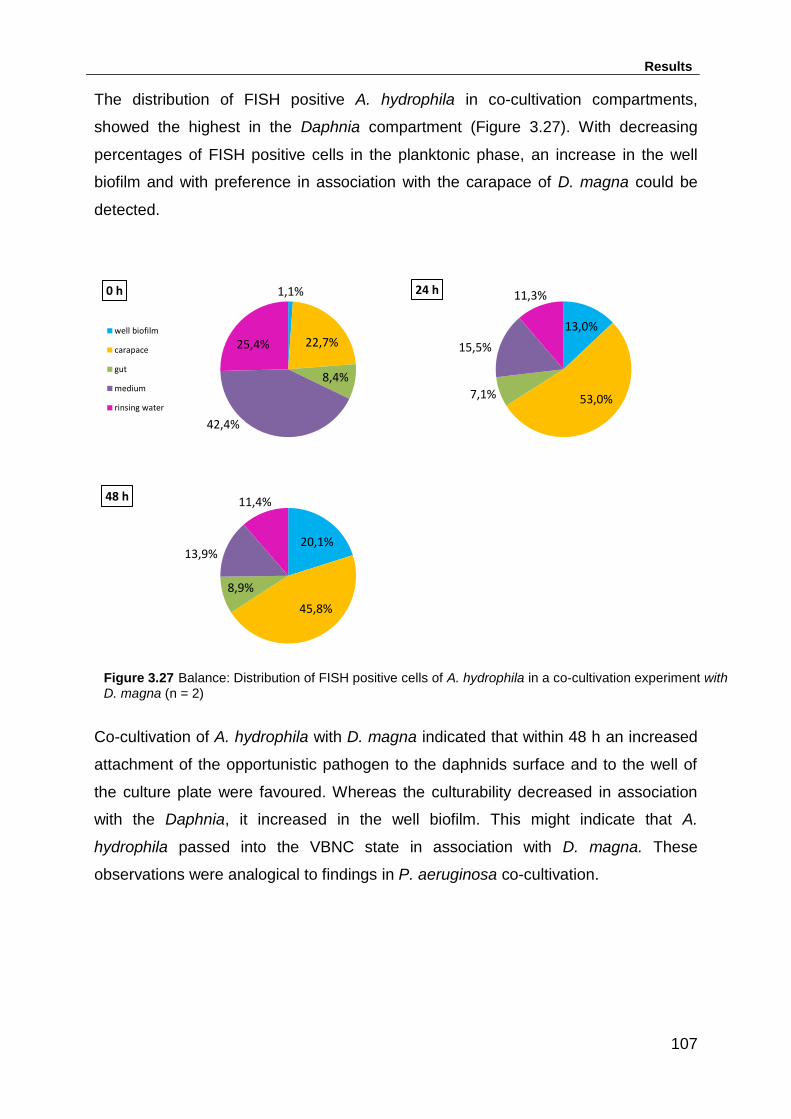
Results
107
The distribution of FISH positive A. hydrophila in co-cultivation compartments,
showed the highest in the Daphnia compartment (Figure 3.27). With decreasing
percentages of FISH positive cells in the planktonic phase, an increase in the well
biofilm and with preference in association with the carapace of D. magna could be
detected.
Co-cultivation of A. hydrophila with D. magna indicated that within 48 h an increased
attachment of the opportunistic pathogen to the daphnids surface and to the well of
the culture plate were favoured. Whereas the culturability decreased in association
with the Daphnia, it increased in the well biofilm. This might indicate that A.
hydrophila passed into the VBNC state in association with D. magna. These
observations were analogical to findings in P. aeruginosa co-cultivation.
Figure 3.27 Balance: Distribution of FISH positive cells of A. hydrophila in a co-cultivation experiment with D. magna (n = 2)
1,1%
22,7%
8,4%
42,4%
25,4%
0 h
well biofilm
carapace
gut
medium
rinsing water
13,0%
53,0% 7,1%
15,5%
11,3% 24 h
20,1%
45,8%
8,9%
13,9%
11,4% 48 h
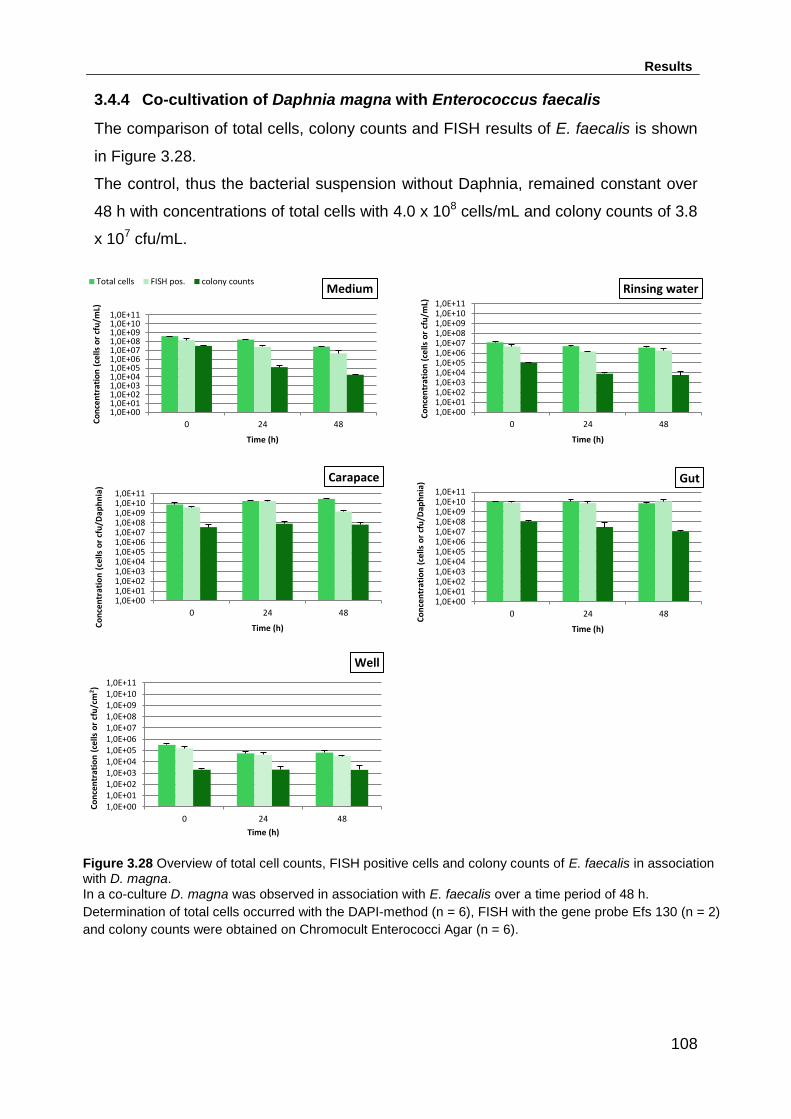
Results
108
3.4.4 Co-cultivation of Daphnia magna with Enterococcus faecalis
The comparison of total cells, colony counts and FISH results of E. faecalis is shown
in Figure 3.28.
The control, thus the bacterial suspension without Daphnia, remained constant over
48 h with concentrations of total cells with 4.0 x 10⁸ cells/mL and colony counts of 3.8
x 107 cfu/mL.
Figure 3.28 Overview of total cell counts, FISH positive cells and colony counts of E. faecalis in association with D. magna. In a co-culture D. magna was observed in association with E. faecalis over a time period of 48 h.
Determination of total cells occurred with the DAPI-method (n = 6), FISH with the gene probe Efs 130 (n = 2)
and colony counts were obtained on Chromocult Enterococci Agar (n = 6).
1,0E+001,0E+011,0E+021,0E+031,0E+041,0E+051,0E+061,0E+071,0E+081,0E+091,0E+101,0E+11
0 24 48Co
nce
ntr
atio
n (
cells
or
cfu
/mL)
Time (h)
Medium Total cells FISH pos. colony counts
1,0E+001,0E+011,0E+021,0E+031,0E+041,0E+051,0E+061,0E+071,0E+081,0E+091,0E+101,0E+11
0 24 48C
on
cen
trat
ion
(ce
lls o
r cf
u/m
L)
Time (h)
Rinsing water
1,0E+001,0E+011,0E+021,0E+031,0E+041,0E+051,0E+061,0E+071,0E+081,0E+091,0E+101,0E+11
0 24 48
Co
nce
ntr
ati
on
(ce
lls o
r cf
u/D
ap
hn
ia)
Time (h)
Carapace
1,0E+001,0E+011,0E+021,0E+031,0E+041,0E+051,0E+061,0E+071,0E+081,0E+091,0E+101,0E+11
0 24 48
Co
nce
ntr
atio
n (
cells
or
cfu
/Dap
hn
ia)
Time (h)
Gut
1,0E+001,0E+011,0E+021,0E+031,0E+041,0E+051,0E+061,0E+071,0E+081,0E+091,0E+101,0E+11
0 24 48
Co
nce
ntr
atio
n (
cells
or
cfu
/cm
2)
Time (h)
Well

Results
109
Determination of E. faecalis cells in the planktonic phase which was consisting of the
two compartments, medium and rinsing water, showed both a decrease in
concentrations.
The two compartments consisting of E. faecalis associated with D. magna (the
carapace and the gut) showed opposed variations in the bacterial concentrations.
Whereas the concentration on the carapace increased, the abundance of E. faecalis
in the gut decreased slightly.
The results indicated that the concentrations of E. faecalis detected by the cultural
method were up to 3 log units lower than those determined by FISH. Obvious is that
the concentrations in the planktonic phases are decreasing over time and slightly
increase in the Daphnia-associated compartments, the carapace and the gut.
The culturability of E. faecalis in association with D. magna decreased in all
compartments, except of the well, where the percentage of culturable cells increased
slightly from 1.2 % to 5.8 % within 48 h (Table 3.13).
Table 3.13 Culturability (in %) of E. faecalis in the different compartments in a co-culture with D. magna over a time period of 48 h (n=6)
Time Medium Rinsing water Carapace Gut Well
0 29.9 3.4 1.1 0.3 1.2
24 0.5 0.2 0.3 0.5 4.8
48 0.1 0.3 2.4 0.0 5.8

Results
110
In the co-cultivation experiments of D. magna and E. faecalis the distribution of the
microorganism between the different compartments in the batch cultures was
compared to each other. In Figure 3.29 on the left side the percentages of total cell
counts of E. faecalis in the medium, the washwater, the carapace, the gut and the
well are shown. The circular charts on the right side indicate the distribution of the
bacterium between free-living in the planktonic phase, in the biofilm attached to the
wall of the well and associated with the zooplankton organism.
Co-cultivation experiments resulted in a shift in the dispersal of E. faecalis from the
inoculation medium onto the other compartments. The circular charts show that the
percentage of colony counts in the medium decreased over time. The abundance of
culturable E. faecalis on the carapace of D. magna increased, whereas all other
compartments increased.
Figure 3.29 Balance of colony counts of E. faecalis in association with D. magna. Distribution (in %) of E. faecalis in the different compartments of the co-cultivation system; the well,
rinsing water, medium, carapace and gut (n=6)
0,6% 2,9%
95,4%
0,5% 0,6% 0 h
well
rinsing water
medium
carapace
gut
0,5% 2,9%
92,2%
2,8% 1,6% 24 h
2,2% 8,8%
63,9%
19,9%
5,3% 48 h
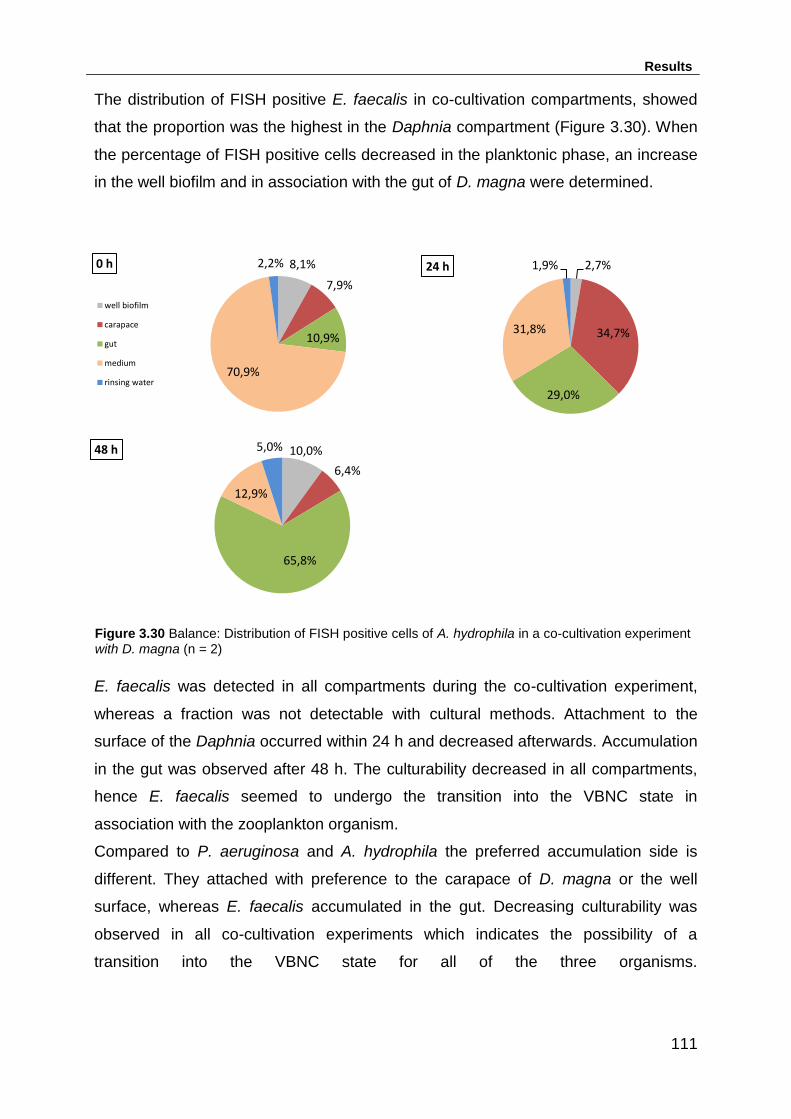
Results
111
The distribution of FISH positive E. faecalis in co-cultivation compartments, showed
that the proportion was the highest in the Daphnia compartment (Figure 3.30). When
the percentage of FISH positive cells decreased in the planktonic phase, an increase
in the well biofilm and in association with the gut of D. magna were determined.
E. faecalis was detected in all compartments during the co-cultivation experiment,
whereas a fraction was not detectable with cultural methods. Attachment to the
surface of the Daphnia occurred within 24 h and decreased afterwards. Accumulation
in the gut was observed after 48 h. The culturability decreased in all compartments,
hence E. faecalis seemed to undergo the transition into the VBNC state in
association with the zooplankton organism.
Compared to P. aeruginosa and A. hydrophila the preferred accumulation side is
different. They attached with preference to the carapace of D. magna or the well
surface, whereas E. faecalis accumulated in the gut. Decreasing culturability was
observed in all co-cultivation experiments which indicates the possibility of a
transition into the VBNC state for all of the three organisms.
8,1%
7,9%
10,9%
70,9%
2,2% 0 h
well biofilm
carapace
gut
medium
rinsing water
2,7%
34,7%
29,0%
31,8%
1,9% 24 h
10,0%
6,4%
65,8%
12,9%
5,0% 48 h
Figure 3.30 Balance: Distribution of FISH positive cells of A. hydrophila in a co-cultivation experiment with D. magna (n = 2)

Discussion
112
4 Discussion
4.1 Association of potentially pathogenic bacteria with plankton organisms
In the present study the occurrence of pathogenic bacteria with freshwater phyto- and
zooplankton was elucidated and compared to organisms in the surrounding water
column in Lake Baldeney. The investigated organisms are ubiqutious bacteria in
aquatic environments with facultative pathogenic properties. The faecal indicator
bacteria (e.g. Escherichia coli, coliforms, intestinal enterococci, Clostridium
perfringens), obligate pathogens of faecal origin (e.g. Campylobacter spp.), and
environmental opportunistic bacteria (e.g. some coliforms, Pseudomonas aeruginosa,
Aeromonas spp., Legionella spp.). Furthermore microcosm experiments with
Daphnia magna and selected organisms were applied to study possible associations
in detail. The overall aim was to evaluate the role of plankton in a freshwater
environment and observe interactions between pathogens and a zooplankton model
organism in microcosms, considering the following questions:
(i) is plankton acting as a vector for those pathogens
(ii) is there an evidence of pathogens occuring viable but non-culturable?
4.1.1 Effects observed in Lake Baldeney
In the field study the general bacterial abundance (total cell counts, HPC bacteria)
and potentially pathogenic bacteria were detected with cultural methods. Additionally
determination with molecular methods, FISH and qPCR for certain selected
organisms were determined in water and associated with plankton. Occurrence and
proportions of phyto- and zooplankton organisms were determined.
In natural aquatic environments pathogens can enter in a viable but non-culturable
(VBNC) state due to environmental stresses. The VBNC state is considered to be a
survival strategy and includes the capability to remain viable, conserve their
pathogenic characteristics, to increase metabolic activity and regain growth again
(Kell et al., 1998; Oliver 2000; Pruzzo et al., 2002; Whiteside and Oliver, 1997). Thus
the determination of pathogens with cultural methods alone will underestimate the
real load of hygienically relevant bacteria. The VBNC state is described for various
pathogens, such as V. cholera, Aeromonas spp. or E. faeaclis, and some report that
the organisms were found attached to plankton in the VBNC state (Binzstein et al.,
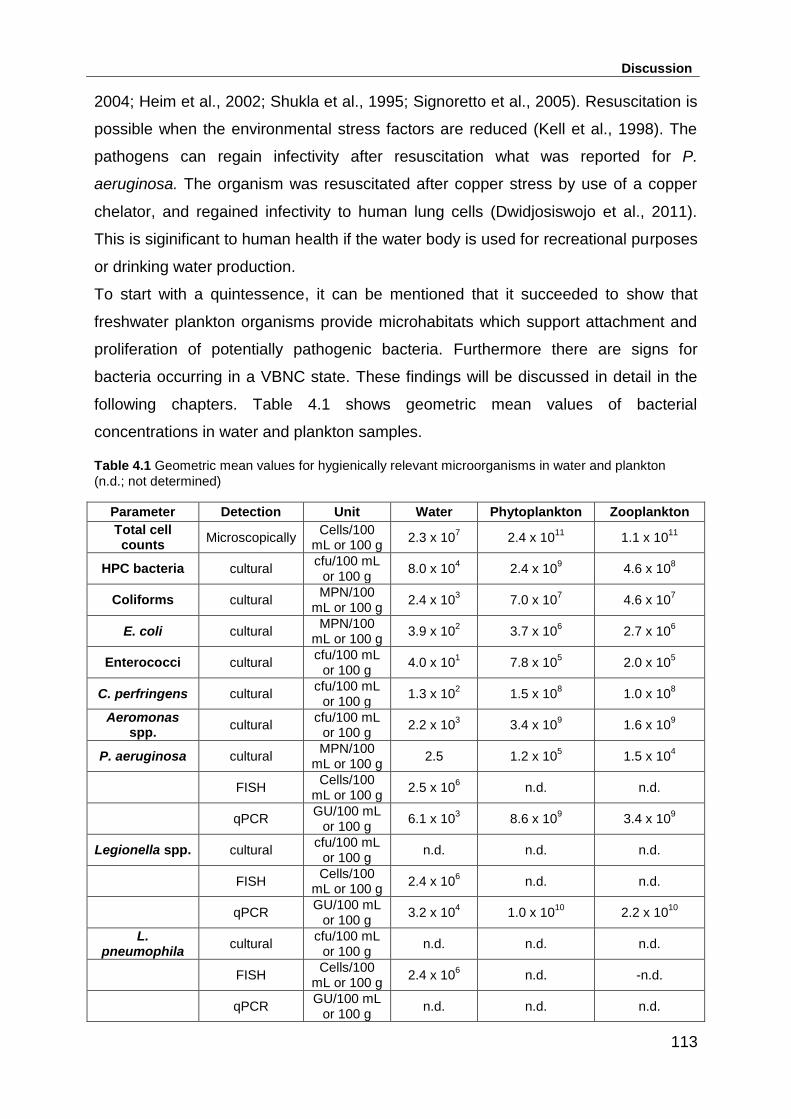
Discussion
113
2004; Heim et al., 2002; Shukla et al., 1995; Signoretto et al., 2005). Resuscitation is
possible when the environmental stress factors are reduced (Kell et al., 1998). The
pathogens can regain infectivity after resuscitation what was reported for P.
aeruginosa. The organism was resuscitated after copper stress by use of a copper
chelator, and regained infectivity to human lung cells (Dwidjosiswojo et al., 2011).
This is siginificant to human health if the water body is used for recreational purposes
or drinking water production.
To start with a quintessence, it can be mentioned that it succeeded to show that
freshwater plankton organisms provide microhabitats which support attachment and
proliferation of potentially pathogenic bacteria. Furthermore there are signs for
bacteria occurring in a VBNC state. These findings will be discussed in detail in the
following chapters. Table 4.1 shows geometric mean values of bacterial
concentrations in water and plankton samples.
Table 4.1 Geometric mean values for hygienically relevant microorganisms in water and plankton
(n.d.; not determined)
Parameter Detection Unit Water Phytoplankton Zooplankton
Total cell counts
Microscopically Cells/100
mL or 100 g 2.3 x 10
7 2.4 x 10
11 1.1 x 10
11
HPC bacteria cultural cfu/100 mL
or 100 g 8.0 x 10
4 2.4 x 10
9 4.6 x 10
8
Coliforms cultural MPN/100
mL or 100 g 2.4 x 10
3 7.0 x 10
7 4.6 x 10
7
E. coli cultural MPN/100
mL or 100 g 3.9 x 10
2 3.7 x 10
6 2.7 x 10
6
Enterococci cultural cfu/100 mL
or 100 g 4.0 x 10
1 7.8 x 10
5 2.0 x 10
5
C. perfringens cultural cfu/100 mL
or 100 g 1.3 x 10
2 1.5 x 10
8 1.0 x 10
8
Aeromonas spp.
cultural cfu/100 mL
or 100 g 2.2 x 10
3 3.4 x 10
9 1.6 x 10
9
P. aeruginosa cultural MPN/100
mL or 100 g 2.5 1.2 x 10
5 1.5 x 10
4
FISH Cells/100
mL or 100 g 2.5 x 10
6 n.d. n.d.
qPCR GU/100 mL
or 100 g 6.1 x 10
3 8.6 x 10
9 3.4 x 10
9
Legionella spp. cultural cfu/100 mL
or 100 g n.d. n.d. n.d.
FISH Cells/100
mL or 100 g 2.4 x 10
6 n.d. n.d.
qPCR GU/100 mL
or 100 g 3.2 x 10
4 1.0 x 10
10 2.2 x 10
10
L. pneumophila
cultural cfu/100 mL
or 100 g n.d. n.d. n.d.
FISH Cells/100
mL or 100 g 2.4 x 10
6 n.d. -n.d.
qPCR GU/100 mL
or 100 g n.d. n.d. n.d.

Discussion
114
4.1.1.1 Abundance of plankton in Lake Baldeney
Determination and quantification of plankton organisms collected during the sampling
season in 2010 displayed species according to determinations of the Ruhrverband
(2010). Concentrations of phytoplankton were found between 109 to 1010
individuals/m3 with a maximum from May to July. The abundance of diatoms was the
highest among phytoplankton, followed by green algae. The diatom species Melosira
sp. was found in most of the phytoplankton samples. Other diatoms identified in
phytoplankton samples were Fragilaria sp., Niztschia sp., Asterionella sp. and
Synedra sp.
Chlorophyta sp., Scenedesmus sp. and Pediastrum sp. were the most abundant
green algae determined in the samples. Cyanobacteria species found in 2010 were
Oscillatoria sp., Spirulina sp. and Anabaena sp. In phytoplankton samples one
species of the golden algae was determined as Dinobryon sp. The Ruhrverband
reported phytoplankton concentrations in 2010 varying between 9.0 x 10⁹ to 1.9 x
1010 cells/m3 whereas in the 1990´s more than 1.0 x 10¹¹ cells/m3 were found. The
spectrum of phytoplankton individuals has changed in the last years. The typical
individuals of the green algae were found seldom, but diatoms were increasing and
dominated the phytoplankton in the summer of the year 2010 (Ruhrverband, 2010).
The Ruhrverband investigated that diatoms represented the highest amount with
about 94% of the whole biovolume of algae, the species Melosira was dominating.
This is confirmed by the results reported in this study. Since a few years it could be
observed that the abundance of cyanobacteria and green algae is considerably
decreasing, whereas the occurrence of golden algae increased. The improvement of
the trophic level of the lower part of the River Ruhr could be the reason fot that
(Ruhrverband, 2010). The temporal course and intensity of phytoplankton growth is
effected by grazing of zooplankton and other abiotic factors, such as river flow and
total irradiation.
Zooplankton organisms were determined with concentrations ranging between 101
and 105 individuals/m3 with a peak in July and August. The increase in zooplankton
individuals from 9.62 x 10² individuals/m3 in the month June to 3.21 x 10⁵
individuals/m3 in July and 3.17 x 10⁴ individuals/m3 in August might be explained by
the clearance rate of algivore zooplankton organisms which graze on phytoplankton.

Discussion
115
The most abundant species of zooplankton detected in the samples belonged to the
group of Rotatoria, e.g. the species Brachionus. Other dominant species identified for
zooplankton are in the group of Crustaceans, mainly the subclasses Cladocera and
Copepoda, e.g. Daphnia sp., Polyphemus sp., Cyclopoida and Calanoida. Copepods
accounted for 86.8% among all zooplankton organisms in a marine coastal zone by
Maugeri et al., (2004).
It was observed that the plankton abundencies follow a seasonal trend. With
declining phytoplankton concentrations the abundance of zooplankton was rising.
This seasonal trend can be explained by zooplankton organisms grazing on
phytoplankton until the so called clear water state is reached, where phytoplankton is
almost eliminated by zooplankton grazing.
For evaluation of surface areas provided by plankton organisms in the samples in this
study, calculation was done as follows.
Assumption:
The phytoplankton samples consist of the diatom species Fragilaria capucina and
zooplankton is composed of Daphnia magna.
The specifications for these organisms (length, width and height) are given in Hoehn
et al. (1998). For the calculation of the surface areas it was assumed that Fragilaria
capucina can be seen as a cuboid form and Daphnia magna as an elliptical cylinder
(Table 4.2).
Table 4.2 Surface areas calculated for the plankton organisms Fragilaria capucina and Daphnia magna (µm
2)
Individual Formula Surface area
(µm2)
Fragilaria capucina Cuboid: 2 x length x width 161
Daphnia magna Elliptical cylinder: 2 x π x length x width + 2 x π x length x width x height 2 x 10⁹
As an example, the surface areas for phyto- and zooplankton samples of the month
April and July (Table 4.3) were calculated due to the amount of individuals per m3.
Table 4.3 Surface areas of phyto- and zooplankton in the samples of April and July (m2/ m
3)
Surface area of plankton in the samples Phytoplankton (m2/m
3) Zooplankton (m
2/m
3)
April 0.2 0.2
July 0.7 447
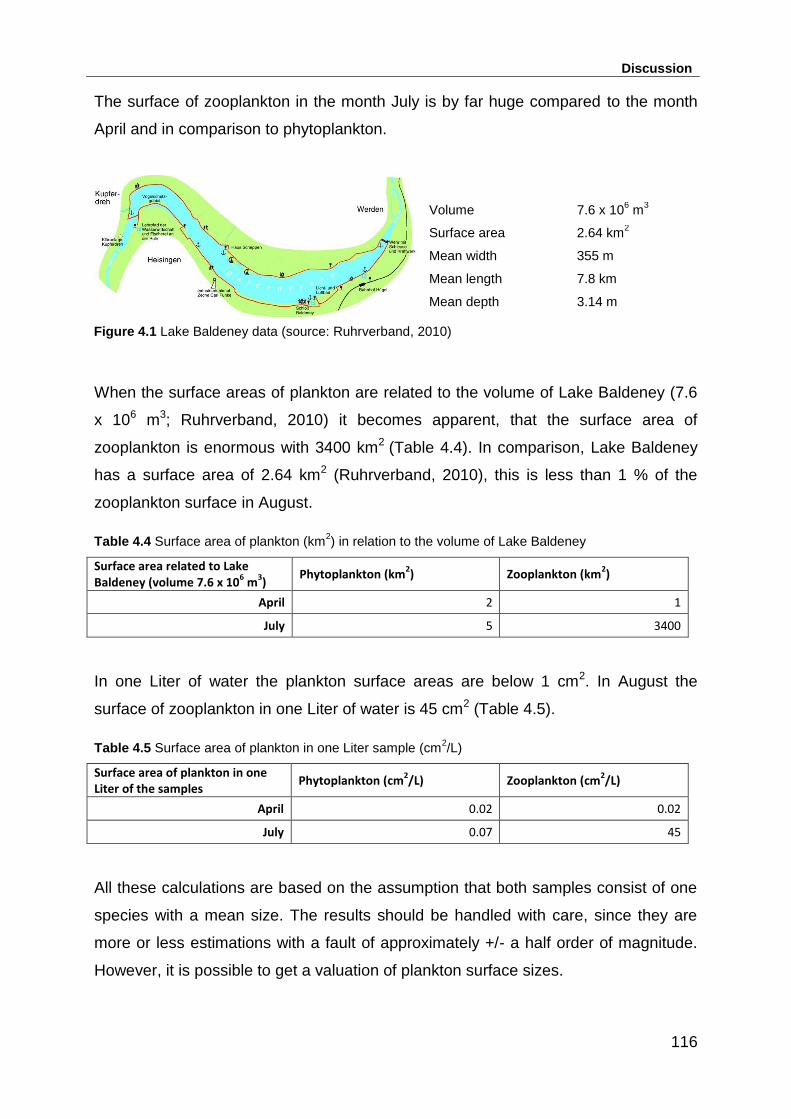
Discussion
116
The surface of zooplankton in the month July is by far huge compared to the month
April and in comparison to phytoplankton.
Volume 7.6 x 10⁶ m
3
Surface area 2.64 km2
Mean width 355 m
Mean length 7.8 km
Mean depth 3.14 m
When the surface areas of plankton are related to the volume of Lake Baldeney (7.6
x 106 m3; Ruhrverband, 2010) it becomes apparent, that the surface area of
zooplankton is enormous with 3400 km2 (Table 4.4). In comparison, Lake Baldeney
has a surface area of 2.64 km2 (Ruhrverband, 2010), this is less than 1 % of the
zooplankton surface in August.
Table 4.4 Surface area of plankton (km2) in relation to the volume of Lake Baldeney
Surface area related to Lake Baldeney (volume 7.6 x 10
6 m
3)
Phytoplankton (km2) Zooplankton (km
2)
April 2 1
July 5 3400
In one Liter of water the plankton surface areas are below 1 cm2. In August the
surface of zooplankton in one Liter of water is 45 cm2 (Table 4.5).
Table 4.5 Surface area of plankton in one Liter sample (cm2/L)
Surface area of plankton in one Liter of the samples
Phytoplankton (cm2/L) Zooplankton (cm
2/L)
April 0.02 0.02
July 0.07 45
All these calculations are based on the assumption that both samples consist of one
species with a mean size. The results should be handled with care, since they are
more or less estimations with a fault of approximately +/- a half order of magnitude.
However, it is possible to get a valuation of plankton surface sizes.
Figure 4.1 Lake Baldeney data (source: Ruhrverband, 2010)
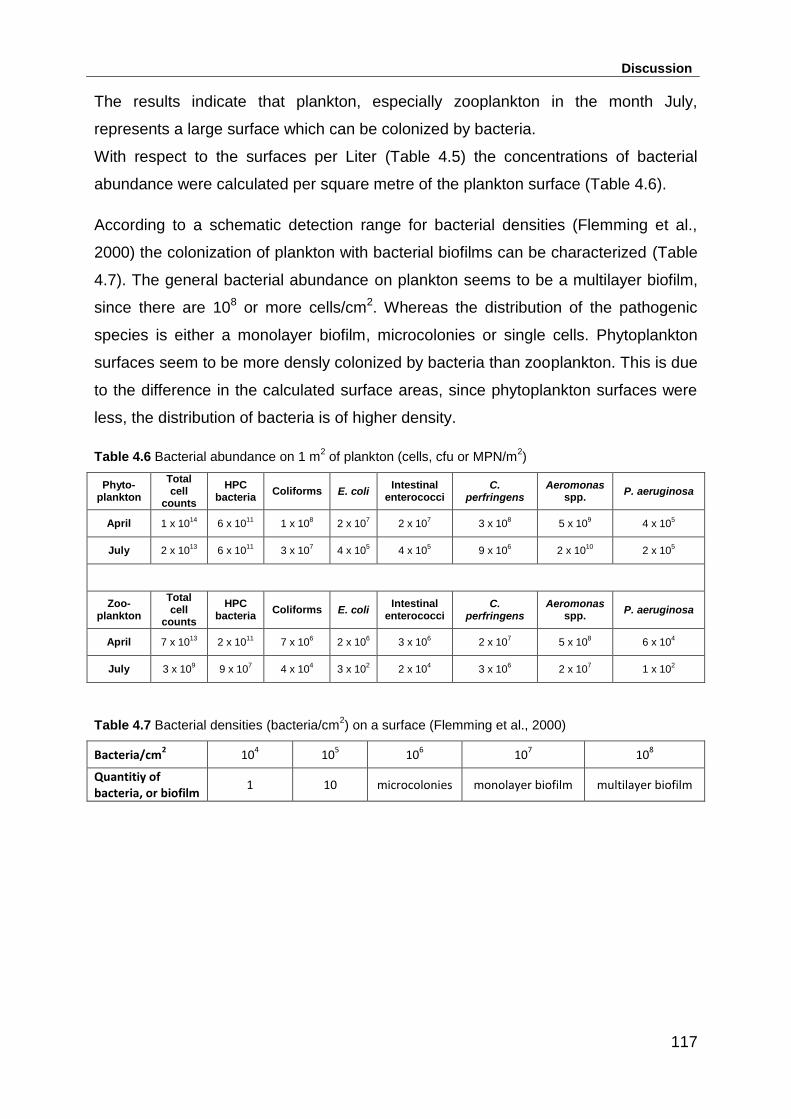
Discussion
117
The results indicate that plankton, especially zooplankton in the month July,
represents a large surface which can be colonized by bacteria.
With respect to the surfaces per Liter (Table 4.5) the concentrations of bacterial
abundance were calculated per square metre of the plankton surface (Table 4.6).
According to a schematic detection range for bacterial densities (Flemming et al.,
2000) the colonization of plankton with bacterial biofilms can be characterized (Table
4.7). The general bacterial abundance on plankton seems to be a multilayer biofilm,
since there are 108 or more cells/cm2. Whereas the distribution of the pathogenic
species is either a monolayer biofilm, microcolonies or single cells. Phytoplankton
surfaces seem to be more densly colonized by bacteria than zooplankton. This is due
to the difference in the calculated surface areas, since phytoplankton surfaces were
less, the distribution of bacteria is of higher density.
Table 4.6 Bacterial abundance on 1 m2 of plankton (cells, cfu or MPN/m
2)
Phyto- plankton
Total cell
counts
HPC bacteria
Coliforms E. coli Intestinal
enterococci C.
perfringens Aeromonas
spp. P. aeruginosa
April 1 x 10¹⁴
6 x 10¹¹
1 x 10⁸ 2 x 10
7 2 x 10
7 3 x 10
8 5 x 10
9 4 x 10
5
July 2 x 10¹³
6 x 10¹¹
3 x 10⁷ 4 x 10
5 4 x 10
5 9 x 10
6 2 x 10
10 2 x 10
5
Zoo- plankton
Total cell
counts
HPC bacteria
Coliforms E. coli Intestinal
enterococci C.
perfringens Aeromonas
spp. P. aeruginosa
April 7 x 10¹³
2 x 10¹¹
7 x 10⁶ 2 x 10
6 3 x 10
6 2 x 10
7 5 x 10
8 6 x 10
4
July 3 x 10⁹ 9 x 10
7 4 x 10
4 3 x 10
2 2 x 10
4 3 x 10
6 2 x 10
7 1 x 10
2
Table 4.7 Bacterial densities (bacteria/cm2) on a surface (Flemming et al., 2000)
Bacteria/cm2 10
4 10
5 10
6 10
7 10
8
Quantitiy of bacteria, or biofilm
1 10 microcolonies monolayer biofilm multilayer biofilm
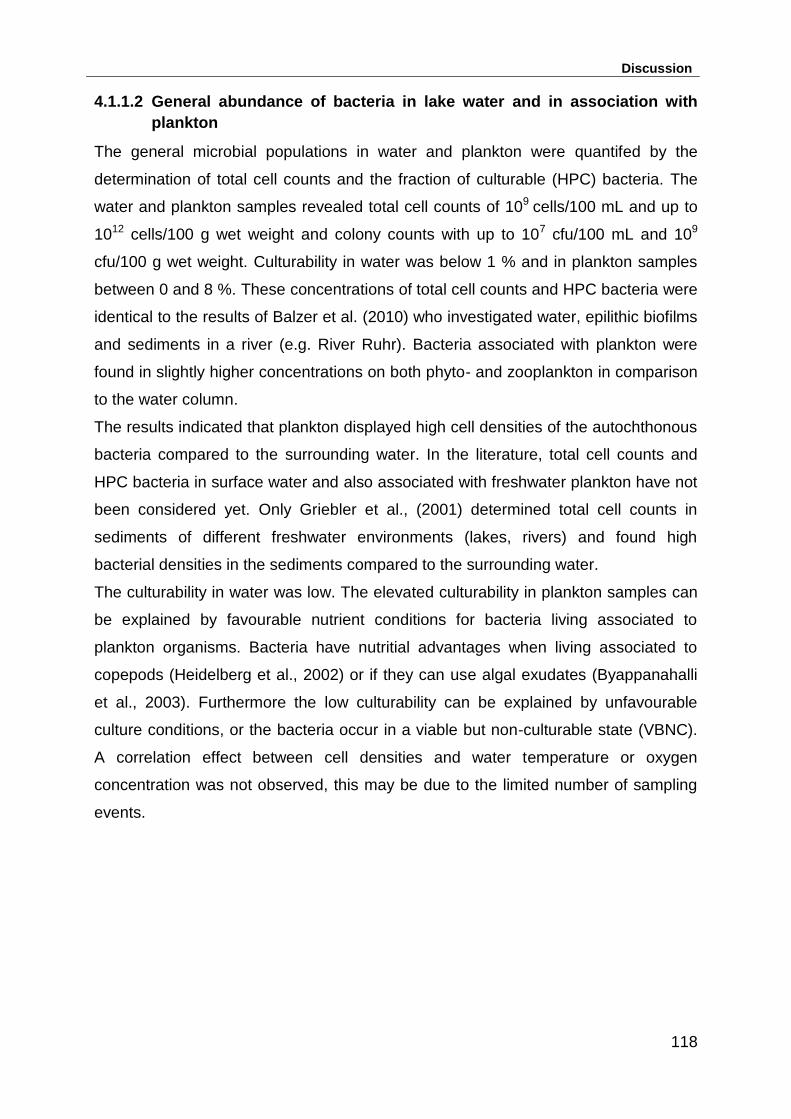
Discussion
118
4.1.1.2 General abundance of bacteria in lake water and in association with
plankton
The general microbial populations in water and plankton were quantifed by the
determination of total cell counts and the fraction of culturable (HPC) bacteria. The
water and plankton samples revealed total cell counts of 109 cells/100 mL and up to
1012 cells/100 g wet weight and colony counts with up to 107 cfu/100 mL and 109
cfu/100 g wet weight. Culturability in water was below 1 % and in plankton samples
between 0 and 8 %. These concentrations of total cell counts and HPC bacteria were
identical to the results of Balzer et al. (2010) who investigated water, epilithic biofilms
and sediments in a river (e.g. River Ruhr). Bacteria associated with plankton were
found in slightly higher concentrations on both phyto- and zooplankton in comparison
to the water column.
The results indicated that plankton displayed high cell densities of the autochthonous
bacteria compared to the surrounding water. In the literature, total cell counts and
HPC bacteria in surface water and also associated with freshwater plankton have not
been considered yet. Only Griebler et al., (2001) determined total cell counts in
sediments of different freshwater environments (lakes, rivers) and found high
bacterial densities in the sediments compared to the surrounding water.
The culturability in water was low. The elevated culturability in plankton samples can
be explained by favourable nutrient conditions for bacteria living associated to
plankton organisms. Bacteria have nutritial advantages when living associated to
copepods (Heidelberg et al., 2002) or if they can use algal exudates (Byappanahalli
et al., 2003). Furthermore the low culturability can be explained by unfavourable
culture conditions, or the bacteria occur in a viable but non-culturable state (VBNC).
A correlation effect between cell densities and water temperature or oxygen
concentration was not observed, this may be due to the limited number of sampling
events.

Discussion
119
4.1.1.3 Occurence of organisms with faecal origin associated with plankton
and in the free water
Surface waters can be contaminated with faecally derived bacteria. This can occur
through point sources, such as sewage effluents, or non-point sources, such as
agricultural or urban run-off. The faecal indicator organisms investigated in this study
were total coliforms, E. coli, intestinal enterococci and C. perfringens. Coliform
bacteria can also be of environmental origin (Leclerc et al. 2001). All these organisms
were detected in water as well as plankton samples during sampling from April to
September. Slightly elevated concentrations of these organisms in the water column
were observed in August. Generally the investigated faecal indicator organisms seem
to be more abundant adhering to plankton than in the water column when referred to
the plankton mass.
4.1.1.3.1 Abundance of total coliforms and E. coli in lake water and associated
with plankton
Total coliforms and E. coli were all detected in water and plankton samples. Total
coliform concentrations were quantified with 4.0 x 10² to 2.4 x 10⁴ cfu/100 mL in lake
water and the abundance in plankton samples varied between 106 to 108 cfu/100 g.
The concentrations of E. coli ranged from 7.4 x 101 to 2.4 x 10⁴ MPN/100 mL in water
and between 105 and 107 MPN/100 g wet weight for plankton. Balzer et al. (2010)
reported similar concentrations for river water and epilithic biofilms. The elevated
concentrations of coliforms and E. coli in plankton samples compared to those in
water indicate that the bacteria persist in these environments and may meet
favourable nutrient conditions in the interaction with plankton.
The aim of the Ruhrverband (2010) is to not exceed a target value of coliforms with
1.5 x 10⁴ per 100 mL in mean, which was not fulfilled with the detected values. The
River Ruhr is no bathing water but it is intensively used for other recreational
purposes. Araujo et al., (1989) reported faecal coliforms with 107 to 109 cfu/100 mL in
freshwater environments (rivers) in the South of Barcelona/Spain, this confirms
observations made in association with plankton in Lake Baldeney. E. coli
concentrations in river water were reported with 4.9 x 101 cfu/100 mL to 2.2 x 10⁴
cfu/100 mL (Rodriguez & Araujo, 2010). Maugeri et al. (2004) found E. coli in
seawater with 1.0 x 101 to 1.5 x 10⁴ cfu/100 mL. Less is considered about plankton
associations of coliforms or E. coli in literature yet, only by Signoretto et al. (2004;

Discussion
120
2005) E. coli has been linked to plankto. However there are reports about sediments.
For freshwater and coastal sediments the presence of E. coli was reported several
times. Elevated concentrations of coliforms and E. coli as well as long-term survival
and multiplications in sediments was assumed to be likely compared to the overlying
water in freswahter streams as well as coastal waters (Byappanahalli et al., 2003;
Craig et al. 2002, 2004; Obiri-Danso & Jones, 1999; Valiela et al., 1991). However,
the survival of these bacteria seemed to be limited by competition with the natural
microflora and predation by protozoa (Marino & Gannon, 1991). A variety of species
was found by identification of coliform isolates from water and plankton. They can be
divided into three ecological categories according to Leclerc et al., (2001). The
identified species Citrobacter, Klebsiella and Enterobacter cloacae belong to the
ubiquitous group of coliforms. They may be of faecal origin, but can also be found in
natural environments such as surface waters, soil or vegetation. The organism E. coli
was isolated from both water and plankton samples and is representing the
thermotrophic group of faecal origin. Member of the environmental group that were
detected was Kluyvera sp.
Some of these species identified are known as oportunistic pathogens, such as K.
pneumonia, Enterobacter spp., Citrobacter spp. (Guentzel, 1996; Sanders &
Sanders, 1997; Struve & Krogfeldt, 2004). E. coli which is usually harmless
commensals for humans, also include pathogenic variants such as
enterohaemorraghic E. coli O157:H7 (Leclerc et al., 2001).
In this study it succeeded to determine total coliforms as well as E. coli in water and
plankton samples. The organisms showed preferences to be plankton-associated,
since they were found with four orders of magnitude higher concentrations in
plankton samples than in the free water. In August the abundance of total coliforms
was elevated and showed plankton preference even when the concentration was
related to the sampling volume.
4.1.1.3.2 Intestinal enterococci in water and plankton samples
In water samples enterococci varied between 2.5 and 3.0 x 10³ cfu/100 mL. These
findings are similar to those and quantities in river water with Enterococci were
reported with 2.0 to 8.0 x 10² cfu/100 mL (Maugeri et al., 2004) or 6.0 to 2.4 x 10²
cfu/100 mL (Balzer et al., 2010).
Discussion
121
E. faecalis has been linked to plankton, in Lake Garda it was found adhering to
plankton and in water. Enterococci were reported more often associated with
zooplankton, than E. coli, especially in the winter month, where zooplankton may
provide an overwintering site for enterococci (Maugeri et al., 2004). Signoretto et al.
(2004) found numbers of enterococci in a freshwater lake to decrease in the water
phase and concurrently increase in zooplankton during summer. In this study, during
the sampling season from April to September, E. coli was more abundant in plankton
samples as enterococci.
The organisms identified from enterococci isolates of water were Enterococcus hirae,
Enterococcus durans, Enterococcus faecalis and Enterococcus faecium. These
organisms represent species of true faecal origin (Pinto et al., 1999), whereas E.
faecalis and E. faecium are known to cause a variety of infections in humans (Jett et
al., 1994). Other species identified were Enterococcus casseliflavus and
Enterococcus gallinarum which are regarded as environmental organisms (Pinto et
al., 1999). E. faecalis and E. faecium were the most frequently isolated species from
environmental samples (Pinto et al., 1999), this correlates to the inicidence in Lake
Baldeney. Similar to investigations in this study Mote et al. (2012) described up to
95% higher abundencies of culturable enterococci in the plankton-associated state
than in the bulk water. Several authors investigated associations of enterococci with
specific types of plankton such as copepods and green algae in freshwater and
marine environments (Signoretto et al., 2004, 2005, Whitman et al., 2003).
In this study an association of enterococci with plankton was clearly observed. In
August and Septmeber the abundance of intestinal enterococci exceeded those in
the free water significantly, although plankton represents only a small fraction in the
bulk water.
4.1.1.3.3 C. perfringens and their endospores, can both be determined in the
free water as well as plankton-associated?
The faecal indicator C. perfringens was quantified with 101 to 102 cfu/100 mL in water
samples of Lake Baldeney and between 107 and 108 cfu/100 g in plankton samples.
Endospores of C. perfringens were consistently recovered in water samples at about
75.3 % and with less percentages in plankton samples (16.1 % for zooplankton; 0.8
% for phytoplankton). Abundance of C. perfringens in freshwater sediments were

Discussion
122
reported with quantities of 3.0 x 10⁵ cfu/100 g to 1.1 x 10⁶ cfu/100 g dry weight, the
presence of C. perfringens spores was found to be constant at high levels in Lake
Michigan (Mueller-Spitz et al., 2010). C. perfringens levels above 10 cfu/100 mL can
be associated with human health risks when bathing in fresh recreational waters
(Wiedenmann et al., 2006). In literature associations of C. perfringens and their
spores with plankton are not considered yet. Hence, the results of this study can only
be reverted to findings in sediments and sewage effluents. Medema et al. (1997)
found C. perfringens deriving from sewage was persistent in natural waters. The
organism survived longer than oocysts and may therefore be proved as an indicator
for the presence of C. parvum. Recovery of spores in freshwater sediments had been
reported by several authors (Edwards et al., 1998; Lisle et al., 2004). Mueller-Spitz et
al. (2010) considered freshwater sediments and sewage inputs into freshwater
habitats as reservoirs of enterotoxin-carrying C. perfringens spores. However, the
accumulation of C. perfringens to particles or sediments indicates the possibility of
creating reservoirs for this potential pathogen organism in aquatic environments
(Mueller-Spitz et al., 2010).
New in this study was the determination of C. perfringens associated with plankton
organisms, as well as the balancing of endopspore distribution between the free
water and plankton-associated state. It succeeded to detect both vegetative C.
perfringens cells and their spores. Whereas the vegetative form seemed to prefer the
plankton association, most of the spores were found in the water column. The high
concentration of endospores in the free water compared to plankton in this study can
be referred to elevated nutrient conditions for C. perfringens vegetative cells living
attachted to plankton surfaces.
The results of organisms of faecal origin indicate that plankton displayed higher cell
densities compared to the surrounding water column. In the warmer months July and
August the oxgen concentration was elevated and correlated to higher abundancies
of coliforms, E. coli and C. perfringens in plankton samples. Compared to total cell
counts and HPC bacteria the concentrations of the faecal indicator bacteria reflect
that they join better nutrient conditions when associated to plankton than living in the
free water (Table 4.1). If the results were referred to the sampled volume the
abundencies of the organisms on plankton seem to be lower than in the free water

Discussion
123
phase. However in the months August and September the organisms were found to
be more associated with plankton than in the free water.
4.1.1.3.4 Abundance of the human pathogen Campylobacter spp. in the
freshwater environment of Lake Baldeney
The obligate human pathogen Campylobacter spp. can contaminate surface waters
via point sources, like sewage effluents, or non-point sources, like agricultural or
urban run-off and wild bird excretion. Campylobacter spp. was determined
qualitatively in four out of six water samples, but was never present in plankton
samples. Campylobacter spp. isolates were identified as the species C. coli and C.
jejuni. Both are the most common human enteric pathogens among campylobacters
and cause acute bacterial diarrhea (Frost 2001).
In this study the human pathogen of faecal origin was determined sporadically in
water, but never in plankton samples. However in previous studies Campylobacter
spp. were found more frequently associated with zooplankton than with
phytoplankton in seawater (Maugeri et al., 2004). In this study several factors may
have contributed to the apparently low Campylobacter isolation,
(i) a low prevalence of the organism in the sampled water, presumably below
the detection limit,
(ii) predation by and competition with other microorganisms which led to
reduced survival times for Campylobacter spp. and might explain the
absence in plankton samples (Korhonen et al., 1991),
(iii) unfavourable culture conditions, or
(iv) Campylobacter species may have entered into a VBNC state due to
starvation or other environmental stress and therefore fail to grow on
culture media.
Hence molecular detection assays may be useful to elucidate potential
epidemiological sources and reservoirs (Moore et al., 2001; Rollins & Colwell, 1986).
In river waters in Greece C. jejuni and C. coli were the most abundant species
identified (Arvanitidou, et al., 1995). These identified species may originate from
sewage effluents, run-off or wild bird populations and have been found in freshwater
bathing sites in the UK (Obiri-Danso & Jones, 1999). In river water of the
Mediterranean area Campylobacter counts were low and determined with 1.3
Discussion
124
MPN/100 mL, whereas especially in the summer many samples were negative
(Rodriguez & Araujo, 2010). The sampling period in this study occurred from April to
September which might explain the low concentrations of the human pathogen due to
the elevated temperatures which not favour their survival and growth. Campylobacter
spp. were found in higher occurrence in the winter month and with lower
concentrations or none in the warmer summer months by several authors
(Brennhovd et al., 1992; Carter et al., 1987; Jones et al., 1990). Survival seemed to
be enhanced in water microcosms at temperatures below 4 °C (Rollins & Colwell,
1986; Terzieva & McFeters., 1991).
Campylobacter spp. was detected in the bulk water, but seldom. An association with
plankton was not confirmed, although there is a reference in literature. The identified
species in water belong to the most common enteric human pathogens. The reason
for the absence of Campylobacter spp. in plankton samples is not clear, and different
possibilities to explain the absence were mentioned before. If it is assumed that the
human pathogen occurs in a VBNC state when associated to plankton, this can pose
a health threat for humans. The VBNC-Camplyobacter spp. may regain their
pathogenic characteristics after resusucitation due to amelioration of environmental
conditions. Therefore it should be considered to use cultivation independent methods
to elucidate the true abundance of the human pathogen.
4.1.1.4 Opportunistic pathogens in Lake Baldeney
Determination of opportunistic pathogenic bacteria in association with plankton
confirmed that all organisms, except for Legionella spp., were found in both phyto-
and zooplankton samples by cultural methods. Remarkable are the high
concentrations of Aeromonas spp. in water as well as plankton and the low
culturability of P. aeruginosa.
4.1.1.4.1 Aeromonas spp. – the most abundant organism determined in Lake
Baldeney
Aeromonas spp. were found with 8.0 x 10³ and 3.0 x 10⁵ cfu/100 mL in the water
phase of Lake Baldeney, with elevated concentrations in August. In plankton
samples abundance of Aeromonas spp. varied between 108 to 1010 cfu/100 g of
Discussion
125
phytoplankton and between 107 to 1010 cfu/100 g in zooplankton samples. In both
samples an increase in colony counts in August could be observed due to elevated
water temperatures with 26°C. Species identified from isolates of water and plankton
included the organisms A. hydrophila and A. salmonicida. Both has been reported to
cause infections in humans (e. g. Galindo et al., 2006; Janda 2001), whereas the
latter is also well-known as a fish pathogen (Austin & Austin 1993).
Maugeri et al. (2004) determined Aeromonas spp. with 4 x 10³ cfu/100 mL in
seawater. Abundance during the sampling period showed seasonal pattern in the
water samples of the marine coastal zone in Italy. The species A. hydrophila was
quantified with concentrations of 104 cfu/100 mL in a River in Poland (Niewolak &
Opieka, 2000). Concentrations of Aeromonas spp. reported by Araujo et al. (1989) in
rivers in Spain were up to 4 log units (102 to 109 cfu/100 mL) higher than those
presented in this study. Aeromonas spp. has been linked to plankton colonization
(Maugeri et al., 2004) and was recently found in association with the cladoceran B.
coregoni (Grossart et al., 2009). The concentrations of Aeromonas spp. determined
in this study exceed the findings of 6.0 x 10² cfu/100 mL in phytoplankton and 1.9 x
1010 cfu/100 mL in zooplankton reported by Maugeri et al. (2004). Omar et al. (2002)
found A. hydrophila in siginificant numbers in surface water as well as in association
with copepods in the Straits of Malacca, Malaysia.
Dumontet et al. (2000) reported that the abundance of Aeromonas spp. often
exceeds those of coliform bacteria, whereas Araujo et al. (1989) described a
correlation between Aeromonas spp. and faecal coliforms. In Lake Baldeney the
concentrations of Aeromonas spp. were often higher than those of coliforms in water
samples as well as in plankton samples.
In this study Aeromonas spp. was determined with with the highest abundance
among all investigated organisms, by use of cultural methods. Abundance in the
plankton samples was determined with six orders of magnitude higher concentrations
than in the free water. The amounts correlated to those of HPC bacteria. For
Aeromonas spp. the preference seem to be a plankton-associated life state, since
they showed elevated culturability in plankton samples compared to water. Plankton
organisms seem to be an attractive microhabitat for Aeromonas spp. in a freshwater
environment. During the sampling period from April to September Aeromonas spp.
was consistently abundant in all samples and with higher concentrations in plankton
samples. In the warmer months July, August and September the concentrations were
Discussion
126
slightly elevated when they were referred to the wet weight of plankton. Also when
they were referred to the plankton sampling volume, Aeromonas spp. associated with
plankton exceeded the concentrations in water in July, August and September.
4.1.1.4.2 P. aeruginosa was less abundant than Aeromonas spp.
Detection of P. aeruginosa in water samples of Lake Baldeney revealed 10 MPN/100
mL, whereas in plankton samples the colony counts varied between 104 to 105
MPN/100 g wet weight, with the highest abundance among all samples, in the month
with the warmer water temperature, in July. Bacterial loads, including P. aeruginosa,
were reported as significantly higher at elevated water temperatures and with the
occurrence of algal blooms, e.g. in the Woluwe River in Belgium (Hoadley, 1977;
Pirnay et al., 2005). Cultivation-based quantification of P. aeruginosa in river water
provided results in the range of 103 cfu/100 mL to 104 cfu/100 mL (Hardalo & Edberg,
1997; Pirnay et al., 2005; Ziegert & Stelzer, 1986). Seyfried & Cook (1984) reported
much lower concentrations in lakes in Canada with quantities ranging from 2 to 33
cfu/100 mL, and similar values with 3 to 32 cfu/100 mL were found in a river in
Poland (Niewolak & Opieka, 2000). In Tokio Bay P. aeruginosa was determined with
7.0 x 101 cells/mL (Kimata et al. 2004). They suggest that P. aeruginosa is commonly
present in Tokio Bay, but that only a small percentage of those is culturable. The
environmental pathogen Pseudomonas spp. is one of the most common bacteria in
aquatic habitats (Pearce et al., 2005) and was reported in association with marine
phytoplankton (Berland et al., 1976), previously P. aeruginosa had been found in
association with Daphnia (Qi et al., 2009).
In this study it succeeded to detect P. aeruginosa associated with plankton, until now
this phenomenon is not mentioned in literature. P. aeruginosa was found to be less
culturable than all other investigated organisms. Especially in water the
concentrations were low. The concentrations referred to the sampling volume of
plankton were found to be elevated in August and September, when compared to the
free water. The difference in the concentrations between water and plankton samples
was four to five orders of magnitude. This allows the assumption of favourable
conditions for P. aeruginosa when existing associated with plankton organisms.
This supports the assumption that, apart from sediments, surface-associated
biofilms, like on plankton surfaces, appear to represent a reservoir of P. aeruginosa

Discussion
127
in natural waters (Pirnay et al., 2005). Pellett et al. (1983) found P. aeruginosa to be
present at highest numbers when associated with submerged surfaces of rocks,
macrophytes, and fish, whereas concentrations were lower in the water.
Both organisms with facultative pathogen properties, Aeromonas spp. and P.
aeruginosa showed slightly elevated cell densities in the warmer months July and
August, where the oxygen saturation in the lake peaked. The results indicate higher
concentrations of the pathogens associated with plankton compared to the
surrounding water. The carapace of zooplankton organisms is mostly made up of
chitin. Therefore the question remains, whether pathogens can degrade the chtin and
use it as carbon, nitrogen and energy source A. hydrophila, for instance employs
extracellular chtinases and is able to degrade chtin. Although P. aeruginosa is also
known to produce a chitinase, the organism is reported not to grow with chitin
(Jagmann et al., 2010). The hypothesis is that this phenomenon explains the high
abundance of Aeromonas spp. and the low frequency of P. aeruginosa abundance.
4.1.1.4.3 Abundance of Legionella spp. and L. pneumophila
Legionella spp., or L. pneumophila, the medically most important species among
legionellae, were never detected in water as well as plankton samples with cultural
methods during the sampling period. Culture-based detection frequently
underestimates the true number of legionellae (Behets et al., 2007) and was reported
repeatedly (e.g. Carvalho et al., 2007). Reasons might be that the culture media were
not favourable and the organisms may have entered into the VBNC state due to
environmental stress, such as starvation. Presumably legionellae suffered by
competition with other microorganisms, that the plates were overgrown by other
bacteria (e.g. Ng et al., 1997).
Discussion
128
4.1.1.5 Are P. aeruginosa, Legionella spp. and L. pneumophila occurring in a
viable but nonculturable state in Lake Baldeney?
The hypothesis is that a large proportion of the hygienically relevant microorganisms
found in both lake water and plankton samples are viable but nonculturable.
This assumption was confirmed using the culture-independent qPCR technique and
the FISH method. P. aeruginosa was determined in very low concentrations, whereas
Legionella spp. as well as L. pneumophila were never detected with cultural methods.
With molecular methods the target organisms were found to be present at much
higher quantities, and in virtually every sample, suggesting that both Legionella spp.
and P. aeruginosa were present in significant concentrations throughout the sampling
period.
In comparison with FISH and qPCR results, cultivation provided a recovery of less
than 0.1 %, detecting concentrations of P. aeruginosa with 106 cells/100 mL water by
FISH and up to 104 GU/100 mL water by qPCR. The organism P. aeruginosa was
determined in concentrations up to three or five log units higher than compared to
cultural methods. The number of studies dealing with the quantification of P.
aeruginosa in environmental aquatic samples using qPCR is low. Various qPCR
assays have been developed for clinical (e.g. Qin et al., 2003) or wastewater-related
applications (Schwartz et al., 2006; Volkmann et al., 2007), but no attempt has been
made to quantify P. aeruginosa abundance in natural surface water or on plankton.
The same applied for the FISH method. P. aeruginosa was found to show signs of
metabolic acitivity such as presence of ribosomal RNA which was detected by the
FISH method using the gene probe PSAE-16S-182. Since rRNA is known to remain
stable for a long time after cell death, it is not an appropriate viability marker. Hence,
FISH positive cells should not directly be regarded as VBNC cells (Tolker-Nielsen et
al. 1997, Prescott et al.,1999). A FISH positive signal should critically be seen as, at
most, a first sign of the possibility of VBNC.
P. aeruginosa concentrations in the water showed significant seasonal differences.
The highest concentrations were observed in the hottest months of the sampling
period, in July and August. This is confirmed by observations of Pirnay et al. (2005)
who found the microbial load in river water, including P. aeruginosa abundance, to
peak during the warmest period of a year. Reasons for this increase are probably
higher water temperatures and algal blooms, which both have been reported to
support multiplication of P. aeruginosa (Hoadley, 1977).
Discussion
129
P. aeruginosa is known to produce a chtinase and a chitin-binding protein, but it was
found not biodegrade chitin by Jagmann et al., 2010. Whereas A. hydrophila could
grow with chitin, P. aeruginosa could not. In co-cultures of P. aeruginosa and A.
hydrophila in association with chitin, Jagmann et al. (2010) observed oxidation of
chtin by A. hydrophila with acetate as end-product. This supported the growth of P.
aeruginosa which influenced A. hydrophila in parasitic way.
Legionella spp. which was not detectable by culture based methods, where found in
high amounts in water as well as plankton samples in Lake Baldeney by use of
molecular methods. Culture-based detection frequently underestimates the true
number of legionellae (Behets et al., 2007). In this case, underestimation might have
occurred due to the following reasons: (i) the plates were rapidly overgrown by other
microorganisms, a phenomenon observed regularly (e.g. Ng et al., 1997). Evaluation
of these plates was impossible. (ii) preparation steps such as acidification of the
samples in order to reduce this contamination or sample concentration by filtration
probably have led to a decrease of Legionella viability of 50 % to 90 % (Boulanger &
Edelstein, 1995; Levi et al., 2003). Furthermore, another explanation might be that no
viable cells were present in the samples.
Numerous studies concerning the detection of legionellae, have shown that qPCR is
more sensitive than conventional cultures (Behets et al., 2007; Bonetta et al., 2010;
Fiume et al., 2005; Palmer et al., 1995; Wellinghausen et al., 2001; Yaradou et al.,
2007). In the present study, concentrations of Legionella spp. in the water samples
determined by qPCR averaged 4.0 x 10⁴ GU/100 mL, whereas L. pneumophila could
not be detected. These findings confirm previously reported concentrations of
legionellae in surface waters detected by qPCR. Parthuisot et al. (2010) found
Legionella spp. with 4.7 x 10⁴ GU/100 mL for the majority of their samples along the
Tech River in France. They were also not able to detect the most important species
among Legionella spp. concerning human health, L. pneumophila. Similar Legionella
spp. concentrations of 1.0 x 10⁵ cells/100 mL were reported for rivers and open
storage basins by Wullings & van der Kooij (2006) who used a semi-quantitative PCR
method. Declerck et al. (2007) found Legionella spp. and L. pneumophila both to be
present in natural aquatic environments (e.g. lakes, creeks) at concentrations of up to
101 GU/100 mL.
Discussion
130
Carvalho et al. (2007) found Legionella spp. failed to grow on routine culture media,
but detected DNA sequences with PCR which were homologous to the 16S
ribosomal DNA gene of Legionella pneumophila and other Legionella species.
Recently, qPCR has become a popular technique for the detection of legionellae in
aqueous systems (Behets et al., 2007; Declerck, 2010). However, the studies dealing
with qPCR have been mostly restricted to man-made systems like drinking water
distribution systems or cooling towers (Behets et al., 2007; Bonetta et al., 2010;
Chang et al., 2009; Joly et al., 2006; Levi et al., 2003; Wellinghausen et al., 2001;
Wéry et al., 2008; Yáñez et al., 2005; Yaradou et al., 2007). Only few attempts have
been carried out to use qPCR for the enumeration of legionellae in surface waters
(Declerck et al., 2007; Parthuisot et al., 2010; Wullings & van der Kooij, 2006).
The FISH method revealed high concentrations of Legionella spp. as well as L.
pneumophila (~ 106 cells/100 mL), which indicates metabolical activity, however
literature does not provide comparative studies.
A seasonal pattern in Legionella concentrations resulting in a summer and autumn
peak was reported elsewhere (Fliermans et al., 1981; Parthuisot et al., 2010; Wéry et
al., 2008), but could not be confirmed in this study. In fact, concentrations appeared
to decrease with increasing water temperature. This might indicate the presence of
legionellae with a relatively low temperature optimum for growth. Concentrations of
Legionella spp. in the plankton samples remained constant over time. A summer
peak was observed in only one sample collected in August and therefore did not
appear to be significant.
In this study, the medically most important species among legionellae, L.
pneumophila could be detected with FISH but never with qPCR. Parthuisot et al.
(2010) were also not able to detect L. pneumophila with qPCR. The high amount of
FISH positive L. pneumophila cells indicates that this species accounts for almost all
of the FISH positive Legionella spp. cells.
In contrast to cultivation, qPCR also detects viable but non-culturable (VBNC) cells,
contributing to the observed discrepancy between culture and molecular methods
(Signoretto et al., 2004). Entry to VBNC state is triggered by environmental stressors
such as starvation or altered temperature and promotes survival of the cell in
unfavourable conditions. Both Legionella spp. and P. aeruginosa are described to
become VBNC (Dwidjosiswojo et al., 2010; Oliver, 2005). VBNC Legionella have
Discussion
131
been detected in natural waters (Delgado-Viscogliosi et al., 2005), and their presence
is considered to greatly affect the magnitude of qPCR results (Bonetta et al., 2010).
VBNC P. aeruginosa were assumed to be present in marine environments, but little is
known about the abundance of VBNC cells in freshwater (Khan et al., 2007). Co-
detection of VBNC cells, however, can be important with respect to health risk
assessment of contaminated water systems. The detection of these bacteria with
PCR (Wellinghausen et al., 2001; Declerck et al., 2009; Felföldi et al., 2009) or FISH
(Långmark et al., 2005; Lehtola et al., 2007) has been shown to be more efficient
compared to culture-based methods.
It is not known whether all bacteria detected by FISH using oligonucleotide probes
which are targeted at intact rRNA are still viable. Ribosomal RNA can still remain
stable, although the bacteria are already dead. This would lead to false-positive
results.Therefore FISH-positive cells should not be seen as an evidence for VBNC
cells, but rather as a hint for VBNC possibility (Tolker-Nielsen et al. 1997, Prescott et
al.,1999). The possibility to detect false-negative results can arise from degradation
of rRNA due to environmental stress which induces weak or absent fluorescent
signals (Bjergbæk & Roslev, 2005; Lehtola et al., 2007). Based on the assumption
that detection of rRNA with fluorescent oligonucleotide probes indicated viability, the
low ratio of culturable cells to FISH-positive cells suggests that P. aeruginosa and
Legionella spp. may occur in the VBNC state in freshwater environments, in the
water column. These organisms are known to enter the VBNC state (Oliver 2010),
but the determination of these organisms with the FISH method is not reported for
surface waters in literature up to now.
Even though qPCR might overestimate the true number of viable and culturable
target organisms present in a sample, VBNC cells still may pose a potential health
threat. Health significance of various pathogens in VBNC state has been
demonstrated before (McFeters et al., 1986), proving them to regain virulence after
resuscitation. The same applies to legionellae. In environmental water systems, they
are able to resuscitate from VBNC state within ubiquitous amoebae (Steinert et al.,
1997; Oliver, 2005). Therefore, disregarding non-culturable cells in the detection of
pathogenic bacteria may lead to an underestimation of health risk and thus to a false
evaluation of water safety. Since qPCR also detects free DNA that may originate
from dead, lysed cells or is released during horizontal gene transfer. It is possible that

Discussion
132
the true number of target genomes is overestimated, (Declerck et al., 2007; Ng et al.,
1997; Yanez et al., 2005). Therefore, quantitative results must be considered critically
with respect to health risk evaluation (Bonetta et al., 2010). However, it remains
unknown whether the proportion of DNA which was present in the samples as
extracellular DNA was large enough to significantly bias quantification.
4.1.1.5.1 Is the macrophyte Elodea nuttallii an appealing habitat for hygienically
relevant bacteria?
Investigations of bacterial abundance in association with the macrophyte Elodea
nuttallii compared to the water phase occured in July, August and October in the year
2009. Total cell counts were about 1012 cells/100 g dry weight and culturable HPC
bacteria were detected with 1010 cfu/100 g dry weight. The distribution of total cells
as well as HPC bacteria on macrophytes has not been reported yet. However
Hempel et al. (2008) determined total cell concentrations with 109 cells/100 g dry
mass on submerged macrophytes in Lake Constance. Compared to other aquatic
surfaces, cell densities found on Elodea nuttallii are similar to those of sediments in a
river (Balzer et al. 2010). Faecal indicator bacteria, total coliforms E. coli and
enterococci abundencies were determined with 103 to 104 MPN/100 g dry weight and
between 106 to 108 cfu/100 mL for the latter one. These concentrations are up to two
log units higher compared to those found in sediments in the river Ruhr (Balzer et al.,
2010). E. coli and enterococci were reported to be associated with the macrophytic
green alga Cladophora which harbored high densities (up to 108 cfu/100 g dry
weight) in Lake Michigan (Byappanahalli et al., 2007; Olapade et al., 2006; Whitman
et al., 2003, 2006). Determination of Aeromonas spp. yielded concentrations of 108
cfu/100 g dry weight in Elodea samples. The human pathogen Campylobacter spp.
was found associated with the macrophyte Elodea nuttallii quantitatively in one of
three investigated samples. The species identified was C. jejuni. It is known as one of
the most common human enteric pathogens among the thermotolerant
campylobacters (Frost 2001). No information exists in literature about the association
between Elodea nutallii with hygienically relevant bacteria. However, there is
evidence for pathogens existing associated with macrophytes. Ishii et al. (2006)
determined the pathogens Salmonella, Shigella and Campylobacter in samples of
Cladophora in Lake Michigan. Furthermore associations with bacteria of the
Discussion
133
Cytophaga-Flavobacteria-Bacteriodetes group and alpha- and betaproteobacteria in
freshwater and marine habitats are often reported (Eiler et al., 2004; Riemann et al.,
2000; Sapp et al., 2007). Although submerged macrophytes produces secondary
metabolites, such as polyphenols, which may have antimicrobial activity, some
bacteria seem not be influenced in their attachment to the plant and their survival
when associated with the plant (Hempel et al., 2008; Scalbert, 1991).
New in this study was the investigation of bacteria with hygiencal relevance in
association with the macrophyte Elodea nuttallii. The local density of general
bacterial abundance as well as concentrations of pathogens living attached to Elodea
nuttallii were four to six orders of magnitude higher than those in the water column.
The hypothesis is that these organisms may overcome the polyphenol-based plant
defences and are able to profit from the released inorganic and organic nutrients.
One question remains, how high is the amount of potentially pathogens occurring in
a VBNC state when existing associated with the macrophyte, due to stress by
antimicrobial metabolites? To evaluate the true amounts of pathogens associated
with Eldoea nuttallii, the detection by molecular methods should be considered.
4.1.1.5.2 Estimation and reliability of the results referred to plankton volume
and wet weight
Bacterial concentrations determined for plankton samples, which were referred to the
wet weight of plankton mass, indicate accumulations of the potentially pathogens in
comparison to the surrounding water. If the results of plankton are referred to the
sampling volume from which the plankton organisms were collected, then the
bacterial abundance on plankton represents only a small proportion in the whole
aquatic environment. In August the incidence was different. The absolut
concentrations of most of the pathogens were higher in association with plankton
than in the free water. This might be in relation with the clear water state, where
abundencies of zooplankton exceed those of phytoplankton due to grazing. These
findings seem to indicate that there exists a stronger association of hygienically
relevant microorganisms with zooplankton than with phytoplankton, due to less
amounts of phytoplankton available.
The important fact is that plankton as well as Elodea microhabitats often only account
for a minor fraction of the total bacterial abundance in the surface water, although

Discussion
134
they represent dense local populations of hygienically relevant bacteria. It has to be
considered that these accumulations on plankton can spatially increase the bacterial
concentrations up to those of infectious doses and therefore pose a health concern
for humans (Omar et al., 2002).
However, as a drawback to this finding, it has to be acknowledged that comparisons
of concentrations of bacteria free-living in the water column, of plankton-associated
bacteria and macrophyte-associated bacteria (expressed per 100 mL of water; 100 g
wet weight plankton and 100 g dry weight of Elodea nuttallii respectively) are
restricted and, at best, estimates (Heidelberg et al., 2002).
(i) this is due to the sampling method. Since the plankton was concentrated during
sampling, the true distribution of the plankton within the original water column was
lost, whereas sampled water was analysed undiluted. The relatively low weight of the
sampled plankton biomass could not be estimated correctly, which is why quantitative
results of the plankton samples lost precision during unit conversion from mL to g.
However, normalizing bacterial concentrations in plankton to the sampled biomass
was essential for theoretical considerations. Since this allowed a comparison of all
plankton samples to a comparable reference value.
(ii) the nature of the reference media (water and plankton) differs widely, which
complicates weight-to-volume comparisons. The water content of the sampled
plankton is unknown and also may differ between phyto- and zooplankton. Plankton
must then be considered as a colonisable phase boundary of unknown surface area
which includes not only the outer surface, but also the guts of, for instance,
crustacean zooplankton (Carli et al., 1993).
Discussion
135
4.1.1.5.3 Associations of pathogens with plankton in freshwater environments
In this study it was successful to demonstrate that there are strong associations of
hygienically relevant bacteria with phyto- and zooplankton organisms, as well as with
the macrophyte Elodea nuttallii. These findings were absolutely new for most of the
bacterial species.
Microbial diversity associated with plankton is partly species-specific to the
zooplankton characteristics. Furthermore dependend on the environment, for
instance to the ambient bacterial communities. Associations between bacterial
communities and zooplankton, whether if they are permanent or transient can affect
ecological and biogeochemical pathways in the water column (Grossart et al 2009).
Colonization of plankton by bacteria seems to be a widespread phenomenon. There
are different possibilities in the association of bacteria with plankton. The
microorganisms can colonize and attach to phytoplankton or zooplankton organisms
by direct contact to its surface (Carman and Dobbs, 1997), or enter the gut of a
zooplanktor by ingestion. In the case of ingestion, the host can release the organism
by defecation of the gut flora into the environment (Tang, 2005). This leads to an
active exchange of bacteria between plankton organisms and the surrounding water.
The question is if they are released unharmed and active after gut passage or in a
VBNC state. There is evidence that some bacteria survive the passage through the
gut, whereas others are digested or biodegraded. Copepod-bacteria associations
seem to occur regardless of the oligotrophic or eutrophic state of the surface water
(Nagasawa, 1988). However in case of eutrophy, the abundance of plankton will
dramatically enhance the association with pathogens and therefore the proliferation
within the surface water.

Discussion
136
4.1.2 Daphnia magna as a habitat for hygienically relevant bacteria
D. magna is known to be a well-established model organism and is used in biological
research for ecotoxicology, ecology and evolution studies since the 18th century
(Ebert, 2008; Lampert, 2011; Routtu et al., 2010; Schaffer 1755). The cladoceran is a
key herbivors in many freshwater ecosystems and efficiently consumes heterotrophic
bacteria (Brendelberger at al., 1991; De Mott 1986; Gophen & Geller, 1984). Daphnia
sp. was found to be abundant in Lake Baldeney samples. To investigate the fate of
Daphnia magna in association with the pathogens Pseudomonas aeruginosa,
Aeromonas hydrophila and Enterococcus faecalis, toxicity experiments according to
Le Codiac et al. (2012) were performed.
The selected organisms of hygienical relevance were chosen, with the following
reasons, since all of the three were found in association with plankton in Lake
Baldeney:
- P. aeruginosa was less abundant in lake water, but indicated a clear association to
plankton. The organism is known to persist and proliferate in biofilms, for instance in
drinking water systems. P. aeruginosa is assumed to be VBNC in association with
plankton, as observed in Lake Baldeney.
- Aeromonas spp. was found to be the most abundant organism in Lake Baldeney,
with respect to those which were included in this study. Preferencially it was found in
association with plankton.
- The organism E. faecalis has faecal origin and was found to be associated with
plankton and occurring in a VBNC state by Signoretto et al. (2004; 2005).
The experiment according to Le Codiac et al. (2012) was conducted to determine a
concentration of the pathogens that seemed to be harmless to the health of D.
magna. Since the zooplankton organism should survive the co-cultivation
experiments with the pathogens over 48 h.
The experiments with P. aeruginosa showed that with increasing bacterial
concentration more rapid death of daphnids occurred. For A. hydrophila different
results were obtained and the first zooplankton organisms died after 25 h. This was
observed independent of the bacterial densities. With E. faecalis no toxic effects on
D. magna were observed, no death occurred within 28 h.

Discussion
137
D. magna can be used to assess acute pathogenity of organisms relevant to human
health, such as P. aeruginosa. The toxicity to D. magna might be caused by secretion
of various toxic compounds by P. aeruginosa (e.g. rhamnolipids, elastase; Le Codiac
et al., 2012). Some strains of Pseudomonas spp. are able to produce secondary
metabolites that have the characteristic to inhibit or kill invertebrates, including
Daphnia (Padmanabhan et al., 2005), or to inactivate other pathogens, like A.
hydrophila (Jagmann et al., 2010). Tan et al. (1999) found P. aeruginosa
accumulating in the intestine of nematodes and killing their hosts slowly by an
infection-like process. D. magna incubated with a virulent strain of P. aeruginosa (PT
894) died within 6 hours and with the wild-type virulent strain P. aeruginosa PAO1
daphnids died over a period of 7 h in experiments of Le Codiac et al. (2012).
Daphnia can be seen as a model organism to analyze associations with several
bacterial environmental pathogens in a natural context and also mounting
opportunistic infections in humans (Ebert, 2008; Le Codiac et al., 2012).
Co-cultivation experiments were investigated with D. magna in association with the
pathogens, P. aeruginosa, A. hydrophila and E. faecalis under defined conditions
over a period of 48 h. The aim was the examination of the question whether the
bacteria prefer the free-living state in the inoculation medium (1), if they are attached
to the integument of the cladoceran (2), infiltrated and accumulated in the gut (3) or if
they prefer the adhesion to the surface of the polystyrene well (4) (Figure 4.2).
4
3
2
1
Figure 4.2 Schematic overview of attachment sites for hygienically relevant organisms in a well of the co-cultivation system with D. magna. (1) Bacteria free-living in the medium, (2) Attachted to the carapace of D. magna, (3) infiltrated and located in the gut, (4) attachment to the polystyrene well. (Source of D. magna picture: http://www.stu.hochschule-reutlingen.de/images/stoffp3.gif)

Discussion
138
The distribution of the pathogenic organisms in the different compartments available
in the batch culture were investigated and balances were calculated.
Co-cultivation of P. aeruginosa with D. magna revealed determination of the
opportunistic pathogen over the experimental period of 48 h. A shift in the distribution
of P. aeruginosa from the free-living state in the inoculation medium in the beginning
of the experiments to adhesion to the carapace with preference and to the surface of
the well was observed. Culturability decreased in all compartments during 24 h and
afterwards increased slightly, except in the well biofilm where it increased with 100 %
after 48 h. By the use of FISH the concentrations of P. aeruginosa were up to two log
units higher compared to cultivation. Associations between P. aeruginosa and D.
magna were reported recently by Qi et al., (2009) in laboratory microcosms, whereas
Huq et al., (1984) described the attachment of Pseudomonas sp. to crustacean
zooplankton organisms to be weak.
In the co-cultivation experiments with D. magna and A. hydrophila, the potential
pathogen was detectable over 48 h, but culturability in all compartments decreased
over time. The occurence of culturable bacteria attached to the well increased. A.
hydrophila was found in concentrations attached to the carapace of the Daphnia and
with less concentrations in the gut. The bacterial concentrations in all compartments
determined with FISH were two to three orders of magnitude higher than with cultural
methods. Dumontet et al. (1996) reported that V. cholerae and A. hydrophila able to
colonize on live and dead copepods within short times, while E. coli, Pseudomonas
spp. and two Vibrio species were not present, neither on live nor on dead copepods.
These observations occurred in batch cultures with copepods collected from the Gulf
of Naples (Italy). Aeromonas salmonicida is known to exhibit enhanced growth rates
when co-cultured with the protozoan Tetrahymena pyriformis in batch cultures (King
& Shotts, 1988).
E. faecalis co-cultivated with D. magna could be detected in all compartments of the
system over the experimental period. The organism was generally less culturable
compared to the other two tested pathogens. The culturability decreased over time,
except in the well biofilm, where the cells became a little more culturable within 48 h.
In the association between D. magna and E. faecalis, the highest amount of
Daphnia-associated organisms was found in the gut and lower percentages on the
carapace, whereas the situation was the other way around for P. aeruginosa and A.
hydrophila. Concentrations determined with FISH were up to three orders of
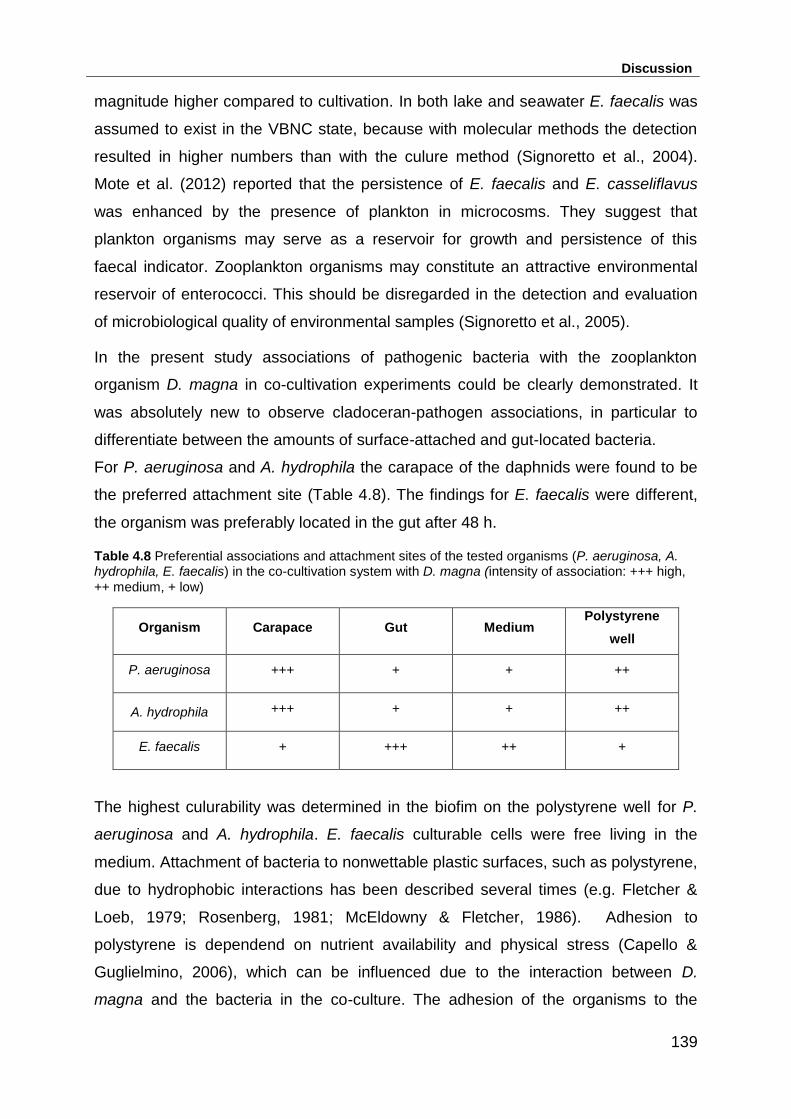
Discussion
139
magnitude higher compared to cultivation. In both lake and seawater E. faecalis was
assumed to exist in the VBNC state, because with molecular methods the detection
resulted in higher numbers than with the culure method (Signoretto et al., 2004).
Mote et al. (2012) reported that the persistence of E. faecalis and E. casseliflavus
was enhanced by the presence of plankton in microcosms. They suggest that
plankton organisms may serve as a reservoir for growth and persistence of this
faecal indicator. Zooplankton organisms may constitute an attractive environmental
reservoir of enterococci. This should be disregarded in the detection and evaluation
of microbiological quality of environmental samples (Signoretto et al., 2005).
In the present study associations of pathogenic bacteria with the zooplankton
organism D. magna in co-cultivation experiments could be clearly demonstrated. It
was absolutely new to observe cladoceran-pathogen associations, in particular to
differentiate between the amounts of surface-attached and gut-located bacteria.
For P. aeruginosa and A. hydrophila the carapace of the daphnids were found to be
the preferred attachment site (Table 4.8). The findings for E. faecalis were different,
the organism was preferably located in the gut after 48 h.
Table 4.8 Preferential associations and attachment sites of the tested organisms (P. aeruginosa, A. hydrophila, E. faecalis) in the co-cultivation system with D. magna (intensity of association: +++ high,
++ medium, + low)
Organism Carapace Gut Medium Polystyrene
well
P. aeruginosa +++ + + ++
A. hydrophila +++ + + ++
E. faecalis + +++ ++ +
The highest culurability was determined in the biofim on the polystyrene well for P.
aeruginosa and A. hydrophila. E. faecalis culturable cells were free living in the
medium. Attachment of bacteria to nonwettable plastic surfaces, such as polystyrene,
due to hydrophobic interactions has been described several times (e.g. Fletcher &
Loeb, 1979; Rosenberg, 1981; McEldowny & Fletcher, 1986). Adhesion to
polystyrene is dependend on nutrient availability and physical stress (Capello &
Guglielmino, 2006), which can be influenced due to the interaction between D.
magna and the bacteria in the co-culture. The adhesion of the organisms to the
Discussion
140
polystyrene surface can be explained by (i) the low nutrient availability in the Daphnia
medium, (ii) the stress induced by the presence of the daphnids, (iii) furthermore, in
case of P. aeruginosa, it is known to be a primary colonizer in technical water
systems and is able to develop biofilms.
E. faecalis showed low adhesion capacities, since the organism is found less
attached to the carapace as well as the polystyrene well.
The quantities of investigated pathogens in co-culture with D. magna were higher
with the FISH method than with cultural detection. With regard to the fact, that the
detected rRNA could originate from already dead cells, due to the stability of rRNA.
The results indicate that a fraction of the bacteria might occur in the VBNC state,
particularly those associated with the D. magna. Associations between pathogens
and plankton organisms, such as attachment to the surface of zooplankton
organisms as well as accumulation inside the gut, can lead to transition of the
bacteria into the VBNC state, or out of the VBNC state. Is it possible for the bacteria
to return viable again? The question remains unknown and seems to be species
specific. For E. faecalis the VBNC state was described as a surivial strategy that was
induced by association with zooplankton in aquatic environments (Signoretto et al.,
2004). Resuscitation for L. pneumophila was reported inside of amoebae (Steinert et
al., 1997).
Daphnia are effective filter feeder and presumably show no selectivity between
filtering small algae or large bacteria, but they are effective grazers of bacteria with
typical clearance rates ranging from 0.1 – 2.8 ml/individual/hour (DeMott, 1982;
Jürgens, 1994; Porter et al., 1983; Tóth et al., 2001). If it is assumed that one D.
magna filters, at least, 0.1 mL per hour, the five daphnids in the microcosms will have
filtered the amount of 10 mL inoculation medium already within 20 h. Therefore it is
obvious that D. magna living associated to bacterial suspensions will ingest a certain
amount of pathogens within 48 hours by the filtering process. It is known to take
between three to 20 minutes for a particle ingested by a rotifer to move across the
entire digestive tract (Wetzel, 2001), this is depending on the zooplankton species,
due to their body size and on the environmental conditions, e.g. temperature. The
question remains if a part of the ingested bacteria is digested in the gut, or if they are
released unharmed after gut passage. Furthermore they can occur in a VBNC state
after gut passage.

Discussion
141
Another possibility in the observation of associations between hygienically relevant
microorganisms and plankton is the formation of bacterial biofilms on the surface of
plankton. Motility and chemotactic behavior may allow auqutic bacteria to attach and
detach from particles and organisms (Grossart, 2010). The formation of biofilms on
zooplankton organisms seems controlled by the natural bacterial community of the
plankton organism (Kirschner 2011). It is acknowledged that biotic surfaces may
represent a nutrient source for certain microorganisms (Watnick & Kolter, 2000). The
chitineous exoskeleton of marine crustacean zooplankton was shown to be
potentially utilised by chitinase-producing bacteria such as Vibrio spp. in marine
environments (Carli et al, 1993; Yu et al., 1991). Both P. aeruginosa and A.
hydrophila are capable of excreting chitinase enzymes which might aid the organism
in nutrient acquisition (DebRoy et al., 2006; Folders et al., 2001; Wang & Chang,
1997). However, Jagmann et al. (2010) found A. hydrophila to grow with chitin, while
P. aeruginosa did not. It is unknown whether growth of the organisms can be
promoted by the degradation of chitin derived from living crustacean carapaces.
Despite feeding on the plankton surface itself, the pathogens may thrive on other
plankton-associated compounds.
In the studies dealing with the association of pathogens and plankton organisms,
different phenomenons are described. Some studies report enhancement of growth
of hygienically relevant organisms in the presence of zooplankton. Kirschner et al.
(2011) detected significant promotion of growth of V. cholera by addition of
cladocerans to laboratory microcosms. Otherwise bacterial numbers of C. jejuni were
found to be declining with up to 91 % in association with Daphnia carrinata,
presumably they were killed during passage through the gut (Schallenberg et al.
2005). The latter case, pathogen concentrations and hence the risk of contracting
waterborne diseases could be reduced by food web biomanipulations. This could be
accomplished by enhancing the densities of e.g. Daphnia in recreational water
bodies and drinking water reservoirs, which graze effectively on pathogens and lead
to death during the gut passage (Schallenberg et al. 2005).

Discussion
142
4.2 Conclusions
As a main objective of this study, the association of hygienically relevant
microorganisms with freshwater plankton was clearly demonstrated. All hygienically
relevant bacteria considered in this study were found associated to plankton (except
for Campylobacter spp.) and Elodea nuttallii as well as in the water of Lake Baldeney.
Relationships between pathogenic bacteria and plankton have been acknowledged
before, mainly in marine environments (e.g. Maugeri et al., 2004), but no information
was hitherto available on whether plankton may represent a potential reservoir for
these pathogens.
Plankton organisms may provide large surfaces for attachment of bacteria. The
calculated surface areas were enormous, especially in some seasons. In July
zooplankton surfaces were about 45 cm2/L.The fact, that plankton-associated
biofilms are a site for survival and multiplication of opportunistic pathogens (Maugeri
et al., 2004), highlights that plankton must be considered as a potential reservoir and
vector for pathogens (Lipp et al., 2002). Bacteria attached to plankton are transported
within the water body (Carli et al., 1993) and can contaminate the surrounding water
column by detaching from the plankton-associated biofilm (Watnick & Kolter, 2000).
Bacteria associated with zooplankton organisms migrating through the water column
cover long distances during their travels and expand their habitat (Grossart 2010; van
der Gucht et al., 2007). Although plankton microhabitats may account for a minor
fraction of the total bacterial biomass in aquatic environments, they represent dense
local populations of bacteria. In terms of bacterial processes they seem to be more
active and dynamic than the bulk water. The association of plankton with bacteria can
spatially enhance bacterial concentration, increase the possibility for humans to be
exposed to infectious doses and therefore pose a health concern (Omar et al. 2002).
Free-living and particle-associated bacterial communities should not be perceived as
separate entities, but rather as interacting assemblages. There is an active exchange
of bacteria between plankton organisms and the surrounding water (Hansen & Bech,
1996; Riemann & Winding, 2005). The bacteria actively attach to the phyto- or
zooplankton surface, and furthermore zooplankton organisms have active
mechanisms to remove the attachted bacteria, either by active emigration or
predation by bacterivorous protozoans (Simon et al., 2002; Kiørboe et al., 2002,
2003).

Discussion
143
All of the investigated organisms are known to possibly enter the VBNC state under
stress influence. Hence, it has to be considered that the concentrations determined
with cultural methods underestimate the real abundance. This has been proved for P.
aeruginosa and L. pneumophila, determined with orders of magnitude higher
concentrations by the use of qPCR and FISH in water and plankton samples. These
results should be handled with care, due to the mentioned limitations of those
methods, such as overestimation by extracellular DNA, or prolonged stability of rRNA
after cell death.
Co-cultivation experiments of Daphnia magna with selected hygienically relevant
bacteria showed associations due to colonization of the zooplankton integument and
of the gut. Culturablility decreased during the experimental period which
accompanied the assumption of the bacteria entering the VBNC state, when
associated to plankton.
Since copepods are the main dietary constitutens of many marine carnivores,
including fish, bacterial attachment to the zooplankton integument can contribute to
the transfer of pathogens through the food chain (Dumontet et al., 1996).
However, the association of pathogens to zooplankton organisms is preferentially
compared to non-living particles. While a non-living particle contains a finite amount
of organic substrates, zooplankton organisms supply bacteria continuously with
organic substrates due to their own feeding processes.
Another possibility is the ingestion of bacteria by zooplankton organisms. Therefore
the loss mechanism would be defecation. The bacteria can be released together with
the gut flora by defecation (Tang, 2005). The faecal pellets of zooplankton organisms
are known to contain high concentrations of bacteria (Hansen et al., 2001; Tang et
al., 2001). The question remains if bacteria replicate inside of plankton, remain viable
and if they are released unharmed and active after gut passage or in a VBNC state.
There is evidence that some bacteria survive the passage through the gut, whereas
others are digested or biodegraded. Colonization of the egg sac of copepods was
documented by Huq et al. (1983), where multiplication of the colonizing bacteria was
observed. Attachment of pathogens to plankton is documented as a vectoring mode,
whereas most studies deal with Vibrio cholerae (Cottingham et al., 2003; Huq et al.,
1983; Huq et al., 2005; Lipp et al., 2003). It is necessary to characterize the fate of
pathogens digested by zooplankton. Bacteria found in contact with zooplankton or in

Discussion
144
particular in the digestive tract were protected from chlorination and remained viable
inside the digestive tract (Levy et al., 1986).
Zooplankton organisms as a habitat for pathogens might have advantages as well as
disadvantages for both of the organisms. On the one hand the plankton organisms
can benefit from bacterial metabolites, but on the other hand the zooplanktor can
also be harmed by virulent species, as shown for P. aeruginosa in toxcity tests. The
bacteria can benefit from metabolites excreted by plankton, or possibly degrade the
chtinous carapace. If the bacteria are ingested by a zooplankton organism, they can
be released viable and unharmed after gut passage, in a VBNC state or inactivated
and dead. Resucitation from the VBNC state might be possible, when the bacteria
are released after gut passage or by detachment of bacteria from the copepod.
Plankton organisms are ubiquitous in surface waters and some species can
proliferate in granular and biological filters of water treatment plants, can be released
in the filter effluent and colonize the distribution system (Castaldelli et al., 2005;
Matsumoto et al., 2002; Schreiber et al., 1997). Some waterborne pathogens are
known to maintain viability in amoebae or nematodes, such as Legionella who
replicates within amoebae and benefits from the protection against disinfectents and
the transport through the distribution system (e.g. Steinert et al., 1997). Most studies
about zooplankton characterize their grazing activity on various species in a microbial
community or their impact on other planktonic organisms. These studies do not
provide information about grazing of zooplankton organisms on waterborne
pathogens (Bichai et al., 2008). Furthermore the role of zooplankton organisms in
pathogen transmission through drinking water, especially that pathogens are
internalized in higher organisms in raw water and might be restistant to disinfection
processes remains poorly understood and is less reported in literature yet (Birchai et
al., 2008).
The incidence that phytoplankton might also act as a potential reservoir for
pathogens was not investigated in this study. Although associations of hygienically
relevant organisms with phytoplankton were observed in Lake Baldeney. Since algal
exudates are known to be important nutrient sources for heterotrophic bacteria in
aquatic environments, it has to be considered that there might be similar interactions
than found with zooplankton. The cellular products of phytoplankton organisms can
promote growth of pathogens, and there is potential for bacteria to persist and grow
on these algae (Byappanahalli et al. 2003; Kaplan & Bott, 1989).

Discussion
145
Diatoms were found to be true microbial hotspots when they are colonized by
bacteria (Simon et al., 2002). They bacteria can utilize the released organic
compounds of the diatoms and therefore they can display generally higher growth
rates than free-living bacteria (Simon, 1987).
Znachor et al. (2012) reported several possibilities of interactions for bacteria living
associated with diatoms (i) competition, bacteria compete with diatoms for inorganic
nurients (Bratbak & Thingstad, 1985), (ii) commensalism, bacteria benfit from
diatoms without harming them, (iii) parasitism, bacteria invade the host cell and
produce metabolites which lead to cell lysis and death of the diatom (Park et al.,
2010), or the diatoms can inihibit growth of bacteria by production of antibiotic
compunds (Lefalive & Ten-Hage, 2009), (iv) mutualism, bacteria benefit from diatom
exudates, whereas the diatoms profit from bacterial products (Pete et al., 2010; Croft
et al., 2005; Droop, 2007).
Generalization of the experimental results of this study should be done with care.
Because the size, abundance and physiology of plankton organisms in lakes vary
spatially and temporally, this might have effects on the ambient and attached bacteria
(Grossart et al., 2010). In case of eutrophy of an aquatic environment, where large
quantities of plankton organisms are available, the plankton-bacteria associations
might be increased dramatically. The bacterial load and proliferation of potential
human pathogens within the aquatic habitat would be enhanced drastically. This is of
relevance considering human health in drinking water production and recreational
use of the surface water.
However, the results indicate that it is of concern to consider the issue of plankton
organisms acting as vectors for human pathogens and the possibility that a single
organism might carry an infectious dose through a drinking water distribution system.
When considering health risks associated with pathogens being protected by
zooplankton organisms in drinking water, there are three main objectives that have to
be regarded (i) the source water, (ii) the effluent water, due to colonization of granular
media filters by invertebrates, (iii) the water distribution system, since L. pneumophila
is known to proliferate within amoebae in distribution systems (Birchai et al., 2008).

Literature
146
5 Literature
AFNOR XP T90-471 Standard (2006): Detection and quantification of Legionella and
Legionella pneumophila by concentration and PCR amplification.
Al-Bakri, A. G.; Gilbert, P.; Allison, D. G. (2004): Immigration and emigration of
Burkholderia cepacia and Pseudomonas aeruginosa between and within mixed
biofilm communities. Journal of Applied Microbiology 96, 455-463.
Alfredsson, G.A., Xiang, J.Y., Gudmundsson, H.M., Gudmundsson, S. (1995):
Aeromonas from marine sources in Iceland. Proceedings Fifth International
Symposium Aeromonas and Plesiomonas, April 8-9. Heriot-Watt University,
Edinburgh, Scotland.
Amann, R. I., Krumholz, L., Stahl, D. A. (1990): Fluorescent-oligonucleotide probing
of whole cells for determinative, phylogenetic, and environmental studies in
microbiology. Journal of Bacteriology 172: 762–770.
Anaissie, F.J., Penzak, S.R., Dignani, M.C. (2002): The hospital water supply as a
source of nosocomial infections. Archives of International Medicine 162, 1483-1492.
Andersson, S., Kuttuva Rajarao, G., Land, C. J., Dalhammar, G. (2008): Biofilm
formation and interactions of bacterial strains found in wastewater treatment systems.
FEMS Microbiology Letters 283, 83–90.
Araujo, R.M., Arribas, R.M., Lucena, F., Pares, R. (1989): Relation between
Aeromonas and faecal coliforms in fresh waters. Journal of Applied Microbiology 97:
213-217.
Araujo, R. M., Arribas, R. M., Pares, R. (1991): Distribution of Aeromonas species in
waters with different levels of pollution. Journal of Applied Bacteriology 71: 182-186.
Armisen, T. G., Servais, P. (2004): Combining direct viable count (DVC) and
fluorescent in situ hybridisation (FISH) to enumaerate viable E. coli in rivers and
wastewaters. Water, Science and Technology 50: 271-275.
Armont, R., Payment, P. (1988): A modified m-CP medium for enumerating
Clostridium perfringens from water samples. Canadian Journal of Microbiology. 34:
78-79.
Arvanitidou, M., Constantinidis, T. C., Katsouyannopoulos V. (1995): A survey on
Campylobacter and Yersinia spp. Occurrence in sea and river waters in Nothern
Greece. The Science of the Total Environment 171: 101-106.
Austin, B., Austin, D A., (1993): Aeromonadaceae representatives (Aeromonas
salmonicida) In: Austin, B., Austin, D. A. (eds) Bacterial fish pathogens: disease in
farmed and wild fish, 2nd edn. Ellis Horwood Ltd. Chichester, p. 86-170.

Literature
147
Balzer, M., Witt, N., Flemming, H.-C., Wingender, J. (2010): Faecal indicator bacteria
in river biofilms. Water Science and Technology 61: 1105-1111.
Banning, N., Toze, S., Mee, B.J., (2002): Escherichia coli survival in groundwater and
effluent measured using a combination of propidium iodide and the green fluorescent
protein. Journal of Applied Microbiology 93: 69–76.
Behets, J., Declerck, P., Delaedt, Y., Creemers, B., Ollevier, F. (2007): Development
and evaluation of a TaqMan duplex real-time PCR quantification method for reliable
enumeration of Legionella pneumophila in water samples. Journal of Microbiological
Methods 68: 137-144.
Berland, B. R., Bonin, D. J., Durbec, J. P., Maestrini, S. Y. (1976): Typologie de
bacteries prelevées devant le delta du Rhone. Classification hierarchique par une
method d’aggregation suviant la variance. International Review of Hydrobiology. 61:
359-372
Bichai, F., Payment, P., Barbeau, B. (2008): Protection of waterborne pathogens by
higher organisms in drinking water: a review. Canadian Journal of Microbiology 54:
509-524.
Bidle, K.D., Fletcher, M. (1995): Comparison of free-living and particle-associated
bacterial communities in the Chesapeake Bay by stable low-molecular-weight RNA
analysis. Applied and Environmental Microbiology 61: 944-952.
Binzstein, N., Costagliola M. C., Pichel, M., Jurquiza, V., Ramirez, F. C., Akselmann,
R., Vacchino, M., Huq, A., Colwell, R. (2004): Viable but nonculturable Vibrio
cholerae O1 in the aquatic environment of Argentina. Applied Environmental
Microbiology 70: 7481-7486.
Birch, L., Dawson, C.E., Cornett, J.H., Keer, J.T., (2001): A comparison of nucleic
acid amplification techniques for the assessment of bacterial viability. Letters in
Applied Microbiology 33: 296– 301.
Bisson, J. W., Cabelli, V. J. (1979): Membrane Filter Enumeration Method for
Clostridium perfringens. Applied and Environmental Microbiology 37: 55-66.
Bjergbæk, L. A., Roslev, P. (2005): Formation of nonculturable Escherichia coli in
drinking water. Journal of Applied Microbiology 99: 1090-1098.
Bomo, A.-M., Storey, M. V., Ashbolt, N. J. (2004): Detection, integration and
persistence of aermonads in water distribution pipe biofilms. Journal of Water and
Health 2: 83-96.
Bonetta, S., Bonetta, S., Ferretti, E., Balocco, F., Carraro, E. (2010): Evaluation of
Legionella pneumophila contamination in Italian hotel water systems by quantitative
real-time PCR and culture methods. Journal of Applied Microbiology 108: 1576-1583.

Literature
148
Bottari, B., Ercolini, D., Gatti, M., Neviani, E. (2006): Application of FISH technology
for microbiological analysis: current state and prospects. Applied Microbiology and
Biotechnology 73: 485–494.
Boulanger, C.A., Edelstein, P.H. (1995): Precision and accuracy of recovery of
Legionella pneumophila from seeded tap water by filtration and centrifugation.
Applied and Environmental Microbiology 61: 1805-1809.
Bratbak, G., Thingstad, T. F. (1985): Phytoplankton-bactria interactions: an apparent
paradox? Analysis of a model system with both competition and commensalism.
Marine Ecology Progress Service 25: 23-30.
Brendelberger, H. (1991): Filter mesh size of cladocerans predicts retention efficiency
for bacteria. Limnology and Ocenography 36: 884-894.
Brennhovd, O., Kapperud, G., Langeland, G. (1992): Survey of thermotolerant
Campylobacter spp. and Yersinia spp. In three surface water sources in Norway.
International Journal of Food Microbiology 15: 327-338.
Buchanan, R. L., Palumbo, S. A. (1985): Aeromonas hydrophila and Aeromonas
sobria as potential food poisening species: a review. Journal of Food Safety 7: 15-29.
Bustin, S.A., Nolan, T.: Chemistries. In: Bustin, S.A. (ed.) (2004): A-Z of Quantitative
PCR. International University Line, La Jolla, CA, USA: 215-278.
Buswell CM, Herlihy YM, Lawrence LM, McGuiggan JTM, Marsh PD, Keevil CW,
Leach SA(1998): Extended survival and persistence of Campylobacter spp. in water
and aquatic biofilms and their detection by immunofluorescent-antibody and -rRNA
staining. Applied Environmental Microbiology 64:733–741.
Byappanahalli, M., Fowler, M., Shively, D., Whitman, R. (2003): Ubiquity and
Persistence of Escherichia coli in a Midwestern Coastal Stream. Applied and
Environmental Microbiology 69: 4549-4555.
Byappanahalli, M.N., Shively, D.A., Nevers, M.B., Sadowsky, M.J., Whitman, R.L.
(2003): Growth and survival of Escherichia coli and enterococci populations in the
macro-alga Cladophora (Chlorophyta). FEMS Microbiology Ecology 46: 203-211.
Byappanahalli, M.N., Whitman, R.L., Shively, D.A., Ferguson, J.F., Ishii, S.,
Sadowsky, M.J. (2007): Population structure of cladophora-borne Escherichia coli in
nearshore water of Lake Michigan. Water Research 41: 3649-3654.
Cabelli, V. J., Dufour, A. P., McCabe, L. J., Levin, M. A. (1983): Swimming-
associated gastroenteritis and water quality. American Journal of Epidemiology 115:
606-616.

Literature
149
Camper, A.K., Jones, W.L., Hayes, J.T. (1996): Effect of growth conditions and
substratum composition on the persistence of coliforms in mixed-population biofilms.
Applied and Environmental Microbiology 62:4014–4018.
Cappelier, J. M., Minet, J., Magras, C., Colwell, R. R., Federighi, M. (1999): Recovery
in embryonated eggs of viable but nonculturable Campylobacter jejuni cells and
maintenance of ability to adhere to HeLa cells after resuscitation. Applied
Environmental Microbiology 65: 5154-5157.
Capello, S., Guglielmino, S. P. P. (2006): Effects of growth temperature on
polystyrene adhesion of Pseudomonas aeruginosa ATCC 27853. Brazilian Journal of
Microbiology 37: 205-207.
Carbone, M., Maugeri, T.L., Gugliandolo, C., La Camera, E., Biondo, C., Fera, M.T.
(2005): Occurrence of Helicobacter pylori DNA in the coastal environment of
southern Italy (Straits of Messina). Journal of Applied Microbiology 98: 768-774.
Carli, A., Pane, L., Casareto, L., Bertone, S., Pruzzo, C. (1993): Occurrence of Vibrio
alginolyticus in ligurian coast rock pools (Tyrrhenian Sea, Italy) and its association
with the copepod Tigriopus filvus (Fisher 1860). Applied and Environmental
Microbiology 59: 1960-1962.
Carman, K. R., Dobbs, F. C. (1997): Epibiotic microorganisms on copepods and
other marine crustaceans. Microscopy research and technique 37: 116-135.
Carter, A. M., Pacha, R. E., Clark, G. W., Williams, E. A. (1987): Seasonal
occurrence of Campylobacter spp. in surface waters and their correlation with
standard indicator bacteria. Applied Environmental Microbiology 53: 523-526.
Carvalho, F. R. S., Vazoller, R. F., Foronda, A. S., Pellizari, V. H. (2007):
Phylogenetic study of Legionella Species in pristine and polluted aquatic samples
from a tropical Atlantic Forest ecosystem. Current Microbiology 55: 288-293.
Castadelli, G., Mantovani, S., Benvenuti, M. R., Rossi, R., Fano, E. A. (2005):
Invertebrate colonization of GAC filters in a potabilisation plant treating groundwater.
Journal of Water Supply, Research and Technology 54: 561-568.
Chang, B., Sugiyama, K., Taguri, T., Amemura-Maekawa, J., Kura, F., Watanabe, H.
(2009): Specific detection of viable Legionella cells by combined use of
photoactivated ethidium monoazide and PCR/real-time PCR. Applied and
Environmental Microbiology 75: 147-153.
Chan, A.B., Fox, J.D., (1999): NASBA and other transcription-based amplification
methods for research and diagnostic microbiology. Reviews in Medical Microbiology
10: 185–196.

Literature
150
Chaveerach, P., ter Huurne, A. A. H. M., Lipman, L. J. A., van Knapen, F. (2003):
Survival and resuscitation of ten strains of Campylobacter jejuni and Campylobacter
coli under acid conditions. Applied and Environmental Microbiology 69: 711-714.
Connelly, S. J., Wolyniak, E. A., Dieter, K. L., Williamson, C. E., Jellison, K. L. (2007):
Impact of zooplankton grazing on the excystation, viability, and infectivity of the
protozoan pathogens Cryptosporidium parvum and Giardia lamblia. Applied and
Environmental Microbiology 73: 7277-7282.
Cools, I., Uyttendaele, M., Caro, C., D´Haese, E., Neils, H. D., Debevere, J. (2003):
Survival of Campylobacter jejuni strains of different origin in drinking water. Journal of
Applied Microbiology 94: 886-892.
Costerton, J.W., Cheng, K.-J., Geesey, G.G., Ladd, T.I., Nickel, J.C., Dasgupta, M.,
Marrie, T.J. (1987): Bacterial biofilms in nature and disease. Annual Review of
Microbiology 47: 435-464.
Cottingham, K. L., Chiavelli, D. A., Taylor, R. K. (2003): Environmental microbe and
human pathogen: the ecology and microbiology of Vibrio cholerae. Frontiers in
Ecology and the Environment 1: 80-86.
Craig, D., Fallowfield, H. J., Cromar, N. J. (2002): Enumeration of faecal coliforms
from recreational coastal sites: evaluation of techniques for the separation of bacteria
from sediments. Journal of Applied Microbiology 93: 557-565.
Craig, D., Fallowfield, H. J., Cromar, N. J. (2004): Use of microcosms to determine
persistence of Escherichia coli in recreational coastal water and sediment and
validation with in situ measurements. Journal of Applied Microbiology 96: 922-930.
Croft, M. T., Lawrence, A. D. Raux-Dery, E., Warren, M. J., Smith, A. G. (2005):
Algae acquire vitamin B-12 through a symbiotic relationship with bacteria. Nature
438: 90-93.
Declerck, P., Behets, J., van Hoef, V., Ollevier, F. (2007): Detection of Legionella
spp. and some of their amoeba hosts in floating biofilms from anthropogenic and
natural aquatic environments. Water Research 41: 3159-3167.
Declerck, P., Behets, J., Margineanu, A., van Hoef, V., De Keersmaecker, B.,
Ollevier, F. (2009): Replication of Legionella pneumophila in biofilms of water
distribution pipes. Microbiological Research 164: 593–603.
Declerck, P. (2010): Biofilms: the environmental playground of Legionella
pneumophila. Environmental Microbiology 12: 557-566.
DebRoy, S., Dao, J., Söderberg, M., Rossier, O., Cianciotto, N.P. (2006): Legionella
pneumophila type II secretome reveals unique exoproteins and a chitinase that
promotes bacterial persistence in the lung. Proceedings of the National Academy of
Sciences of the United States of America 103: 19146-19151.

Literature
151
Delgado-Viscogliosi, P., Simonart, T., Parent, V., Marchand, G., Dobbelaere, M.,
Pierlot, E., Pierzo, V., Menard-Szczebara, F., Gaudard-Ferveur, E., Delabre, K.,
Delattre, J.M. (2005): Rapid method for enumeration of viable Legionella
pneumophila and other Legionella spp. in water. Applied and Environmental
Microbiology 71: 4086-4096.
DeMott, W. R. (1982): Feeding selectivities and relative ingestion rates of Daphnia
and Bosmina. Limnology and Oceanography 27: 518-527.
DeMott, W. R. (1986): The role of taste in food selection by freswater zooplankton.
Oecologica 69: 334-340.
DGL (Deutsche Gesellschaft für Limnologie) (2007): Empfehlungen zu Grundlagen
einheilticher Qualitätsanforderungen limnologisch tätiger Büros und Laboratorien.
DGL-Arbeitskreis Qualitätssicherung, 12.09.2007, 41 S.
DIN EN ISO 7899-2 (2000): Wasserbeschaffenheit - Nachweis und Zählung von
intestinalen Enterokokken - Teil 2: Verfahren durch Membranfiltration.
DIN EN 12879 (2000) Characterization of sludges – Determination of the loss of
ignition of dry mass.
DIN EN 12880 (2000) Characterization of sludges – Determination of dry residue and
water content.
DIN EN ISO 16266 (2008): Wasserbeschaffenheit - Nachweis und Zählung von
Pseudomonas aeruginosa – Membranfiltrationsverfahren
DIN EN ISO 19456 (2006): Water quality – Sampling for microbiological analysis
(Deutsche Fassung EN ISO 19458:2006).
Directive 2006/7/EC of the European Parliament and of the Council of 15 February 2006 concerning the management of bathing water quality and repealing Directive 76/160/EEC. Donlan, R. M. (2002): Biofilms: Microbial Life on Surfaces. Emerging Infectious
Diseases 8: 881-890.
Droop, M. R., (2007): Vitamins, phytoplankton and bacteria: symbiosis or
scavenging? Journal of Plankton Research 29:107-113.
Dumontet, S., Krovacek, K., Baloda, S.B., Grottoli, R., Pasquale, V., Vanucci, S.
(1996): Ecological relationship between Aeromonas and Vibrio spp. and planktonic
copepods in the coastal marine environment in Southern Italy. Comparative
Immunology, Microbiology and Infectious Diseases 19: 245-254.

Literature
152
Dumontet, S., Krovacek, K., Svenson, S.B., Pasquale, V., Baloda, S.B., Figliuolo, G.
(2000): Prevalence and diversity of Aeromonas and Vibrio spp. in coastal waters of
Southern Italy. Comparative Immunology, Microbiology and Infectious Diseases 23,
53-72.
Dussert, B.H. (1965): Les different categories de plancton. Hydrobiologica, 26 72-74.
Dwidjosiswojo, Z.S.M., Richard, J., Moritz, M.M., Flemming, H.-C., Dopp, E.,
Wingender, J. (2011): Influence of copper ions on the viability and cytotoxicity of
Pseudomonas aeruginosa under conditions relevant to drinking water. International
Journal of Hygiene and Environmental Health 214: 485-492.
Ebert, D. (2005): Ecology, Epidemiology, and evolution of parasitsm in Daphnia
[Internet]. Bethesda (MD): National Center for Biotechnology Information (US).
Ebert, D. (2008): Host-parasite coevolution: insights from the Daphnia-parasite model
system. Current Opinion in Microbiology 11: 290-301.
EC (European Community). Richtlinie 98/83/EG des Rates vom 3. Nov. 1998 über
die Qualität von Wasser für den menschlichen Gebrauch, Amtsblatt der Europ.
Gemeinschaften v. 5.12.98, L330/32-54 mit Berichtigung v. 19.2.99, L45/55,1998.
Edwards, D. D., McFeters, G. A., Venkatesan, M. I. (1998): Distribution of Clostridium perfringens and fecal sterols in a benthic coastal marine environment influenced by the sewage outfall from McMurdo Station, Antartica. Applied Environmental Microbiology 64: 2596-2600. Eiler, A., Bertilsson, S. (2004): Composition of freshwater bacterial communities associated with cyanobacterial blooms in four Swedish lakes. Environmental Microbiology 6:1228-1243. Exner, M., Kramer, A., Kistemann, T., Gebel, J., Engelhardt, S. (2007). Wasser als
Infektionsquelle in medizinischen Einrichtungen, Prävention und Kontrolle.
Bundesgesundheitsbl Gesundheitsforsch Gesundheitsschutz 50, 302–311.
Felföldi, T., Heeger, Z., Vargha, M., Marialigeti, K. (2010): Detection of potentially
pathogenic bacteria in the drinking water distribution system of a hospital in Hungary.
Clinical Microbiology and Infection 16: 89–92.
Feuerpfeil, I., Rädel, U., Exner, M., 2009. Coliforme Bakterien im Trinkwasser.
Empfehlung zur Risikoabschätzung und Maßnahmen bei systemischer
Kontamination - Empfehlung des Umweltbundesamtes nach Anhörung der
Trinkwasserkommission des Bundesministeriums für Gesundheit beim
Umweltbundesamt. Bundesgesundheitsbl. Gesundheitsforsch. Gesundheitsschutz
52, 474-482
Fields, B.S., Benson, R.F., Besser, R.E. (2002): Legionella and Legionnaires’
Disease: 25 Years of Investigation. Clinical Microbiology Reviews 15: 506-526.
Literature
153
Fisher, K., Philips, C. (2009): The ecology, epidemiology and virulence of
Enterococcus. Microbiology 155: 1749-1757.
Fiume, L., Bucca Sabattini, M.A., Poda, G. (2005): Detection of Legionella
pneumophila in water samples by species-specific real-time and nested PCR assays.
Letters in Applied Microbiology 41: 470-475.
Flemming, H.-C., Szewzyk, U., Griebe, T. (eds) (2000): Biofilms. Investigative
methods and applications. Technomic Publishers. Lancaster, Basel.
Flemming, H.-C., Wingender, J. (2010): The biofilm matrix. Nature Reviews
Microbiology 8: 623-633.
Flemming, H.-C., (eds.), Wingender, J., Szewzyk, U. (2011): Biofilm Highlights,
Springer Series on Biofilms 5, Springer Verlag Berlin Heidelberg.
Fletcher, M., Loeb, G. I. (1979): Influence of substratum characteristics on the
attachment of a marine pseudomonad to solid surfaces. Applied and Environmental
Microbiology 37: 67-72.
Fliermans, C.B., Cherry, W.B., Orrison, L.H., Smith, S.J., Tison, D.L., Pope, D.H.
(1981): Ecological Distribution of Legionella pneumophila. Applied and Environmental
Microbiology 41: 9-16.
Folders J., Tommassen, J., van Loon, L.C., Bitter, W. (2000): Identification of a
Chitin-Binding Protein Secreted by Pseudomonas aeruginosa. Journal of
Bacteriology 182: 1257-1263.
Folders, J., Algra, J., Roelofs, M.S., van Loon, L.C., Tommassen, J., Bitter, W.
(2001): Characterization of Pseudomonas aeruginosa chitinase, a gradually secreted
protein. Journal of Bacteriology 183: 7044-7052.
Frost, J. A. (2001): Current epidemiological issues in human campylobacteriosis.
Journal of Applied Microbiology 90: 85S-95S.
Fujioka, R. S., Shizumura, L. K. (1985): Clostridium perfringens a reliable indicator of
stream water quality. Journal WPCF 57 (10): 986-992.
Galindo, C. L., Gutierrez, C. Jr, Chopra, K. (2006): Potential involvement of galectin-3
and SNAP23 in Aeromonas hydrophila cytotoxic enterotoxin-induced host cell
apoptosis. Microbial Pathogenesis 40: 56-68.
Garbey, C., Murphy, K. J., Thiebaut, G., Muller, S. (2004): Variation in P-Content in
aquatic plant tissue offers an efficient tool for determining plant growth strategies
along a resource gradient. Freshwater Biology 49: 1 – 11.

Literature
154
German Drinking Water Ordinance (Trinkwasserverordnung-TrinkwV 2001), 2001.
Verordnung über die Qualität von Wasser für den menschlichen Gebrauch.
Trinkwasserverordnung vom 21. Mai 2001 (BGBl. I S. 959), die durch Artikel 363 der
Verordnung vom 31. Oktober 2006 (BGBl. I S. 2407) geändert worden ist (in
German).
Gophen, M., Geller, W. (1984): Filter mesh size and food particle uptake by Daphnia.
Oecologica 64: 408-412.
Greub, G., Raoult, D. (2004): Microorganisms Resistant to Free-Living Amoebae.
Applied and Environmental Microbiology 17: 413-433.
Giebler, C., Mindl, B., Slezak, D. (2001): Combining DAPI and SYBR Green II for the
enumeration of total bacterial numbers in aquatic sediments. International Reviews in
Hydrobiology 86: 453-465.
Grimm, D., Merkert, H., Ludwig, W., Schleifer, K. H., Hacker, J., Brand, B. C. (1998):
Specific detection of Legionella pneumophila: construction of a new 16S rRNA-
targeted oligonucleotide probe. Applied and Environmental Microbiology 64: 2686–
2690.
Grobe, S. Schaule, G. Wingender, J., Flemming, H.-C. (2010). Mikrobiologische
Kontaminationen im Trinkwasser - Ursachenermittlung. Energie-Wasser-Praxis 61,
18-21.
Grossart, H.-P., Riemann, L., Azam, F. (2001): Bacterial motility in the sea and its
biogeochemical implications. Aquatic Microbial Ecology 25: 247-258.
Grossart, H.-P. (2010): Ecological consequences of bacterioplankton lifestyles:
changes in concepts are needed. Environmental Microbiology reports 1-9.
Grossart, H.-P., Dziallas, C., Leunert, F., Tang, K. W. (2010): Bacterial dispersal by
hitchhiking on zooplankton. Proceedings of the National Acadamy of Sciences: 1-6.
Grossart, H.-P., Dziallas, C., Tang, K. W. (2009): Bacterial diversity associated with
freshwater zooplankton. Environmental Microbiology Reports 1: 50-55.
Guentzel, M. N. (1996): Escherichia, Klebsiella, Enterobacter, Serratia, Citrobacter,
and Proteus. In: Baron, S., Albrecht, T., Castro, G., Couch, R. B., Davis, C. P.,
Dianzani, F., McGinnis, M. R., Niesel, D. W., Olson, L. J., Woods, G. L. (eds) Medical
Microbiolgy, 4th Edition. The University of Texas Medical Branch, Galveston, USA,
Chapter 26.
Guerrieri, E., Bondi, M., Sabia, C., de Niederhäusern, S., Borella, P., Messi, P.
(2008): Effect of bacterial interference on biofilm development by Legionella
pneumophila. Current Microbiology 57: 532–536.
Literature
155
Guillard, R.R.L. (1975): Culture of phytoplankton for feeding marine invertebrates. pp
26-60. In Smith W.L. and Chanley M.H (Eds.) Culture of Marine Invertebrate Animals.
Plenum Press, New York, USA.
Hansen, B., Bech, G. (1996): Bacteria associated with a marine planktonic copepod
in culture. Bacterial genera in sea water, body surface, intestines and fecal pellet and
succession during fecal pellet degradation. Journal of Plankton Research 18: 257-
273.
Hansen, B., Fotel, F. L., Jensen, N. J., Madsen, S. D. (1996): Bacteria associated
with a marine planktonic copepod culture, II. Degradation of fecal pellets produced on
a diatom, a nanoflagellate or a dinoflagellate diet. Journal of Plankton Research 18:
275-288.
Hardalo, C., Edberg, S.C. (1997): Pseudomonas aeruginosa: Assessment of Risk
from Drinking Water. Critical Reviews in Microbiology 23: 47-75.
Havelaar, A. H., During, M., Versteegh, J. F. M. (1987): Ampicillin-dextrin agar medium for the enumeration of Aeromonas species in water by membrane filtration.Journal of Applied Bacteriology 62: 297-287. Hazen, T.C., Esch, G.W. (1983): Effect of effluent from nitrogen fertilizer factory and
a pulp mill on the distribution and abundance of Aeromonas hydrophila in Albermarle
Sound, North Carolina. Applied and Environmental Microbiology 45: 31-42.
Heidelberg, J.F., Heidelberg, K.B., Colwell, R.R. (2002): Bacteria of the gamma-
Subclass Proteobacteria Associated with Zooplankton in Chesapeake Bay. Applied
and Environmental Microbiology 68: 5498-5507.
Heim, S., Lleò, M.M., Bonato, B., Guzman, C.A., Canepari, P. (2002): The Viable but
nonculturable state and starvation are different stress responses of Enterococcus
faecalis, as determinate by proteome analysis. Journal of Bacteriology 184: 6739-
6745.
Hempel. M., Blume, M., Blindow, I., Gross, E. M. (2008): Epiphytic bacterial community composition on two common submerged macrophytes in brackish water and freshwater. BioMed Central Microbiology 8. Hervàs, A., Camaero, L., Reche, I., Casamayor E. O. (2009): Viability and potential for migration of airborne bacteria from Africa that reach high mountain lakes in Europe. Environmental Microbiology 11: 1612-1623. Hoadley, A.W.: Potential health hazards associated with Pseudomonas aeruginosa in
water. In: Hoadley, A.W., Dutka, B.J. (eds.) (1977): Bacterial indicators/health
hazards associated with water. American Society for Testing and Materials,
Philadelphia, PA, USA: 80-114.

Literature
156
Hobbie, J.B., Daley, E.J., Jasper, S. (1977): Use of nuclepore filters for counting
bacteria by fluorescence microscopy. Applied and Environmental Microbiology 33:
1225-1228.
Hoehn, E., Clasen, J., Scharf, W., Ketelaars, H. A. M., Nienhüser, A. E., Horn, H.,
Kersken, H., Ewig, B. (1998) Erfassung und Bewertung von Planktonorganismen.
Arbeitsgemeinschaft Trinkwassertalsperren e. V., Arbeitskreis Biologie. ATT
Technische Information Nr. 7, R. Oldenbourg Verlag, München
Hornemann, A. J., Ali, A., Abbott S. (2007). Aeromonas, p. 716-722. In. Murray, P.
R., Baron, E. J., Jorgensen, J. H., Landry M. L., Pfaller, M. A. (ed.), Manual of clinical
microbiology, 9th ed. ASM press, Washington, DC, USA.
Howe, G.B., Loveless, B.M., Norwood, D., Craw, P., Waag, D., England, M., Lowe,
J.R., Courtney, B.C., Pitt, M.L., Kulesh, D.A. (2009): Real-time PCR for the early
detection and quantification of Coxiella burnetti as an alternative to the murine
bioassay. Molecular and Cellular Probes 23: 127-131.
Huq, A., Small, E.B., West, P.A., Huq, M.I., Rahman, R., Colwell, R.R. (1983):
Ecological relationships between Vibrio cholerae and planktonic crustacean
copepods. Applied and Environmental Microbiology 45: 275-283.
Huq, A., West, P.A., Small, E.B., Huq, I., Colwell, R.R. (1984): Influence of water
temperature, salinity, and pH on survival and growth of toxigenic Vibrio cholerae
serovar O1 associated with live copepods in laboratory microcosmos. Applied and
Environmental Microbiology 48, 420-424.
Huq, A., Sack, R. B., Nizam, A., Longini, I. M., Nair, G. B., Ali, A. (2005): Critical
factors influencing the occurrence of Vibrio cholera in the environment of
Bangladesh. Applied and Environmental Microbiology 71: 4645-4653.
Ishii, S., Yan, T., Shivley, D. A., Byappanahalli, M. N., Whitman, R. L., Sadowsky, M.
J. (2006): Cladophora (Chlorophyta) spp. harbor human bacterial pathogens in
nearshore water of Lake Michigan. Applied and Environmental Microbiology 72, 4545
– 4553,
Islam, M.S., Drasar, B.S., Bradley, D.J. (1989): Attachment of toxigenic Vibrio cholera
O1 to various freshwater plants and survival with filamentous green algae
Rhizoclonium fontanum. Journal of Tropical Medicine and Hygiene 92: 396-401.
Islam, M.S., Drasar, B.S., Bradley, D.J. (1990): Longterm persistence of toxigenic
Vibrio cholerae O1 in the mucilaginous sheath of a blue-green alga, Anabaena
variabilis. Journal of Tropical Medicine and Hygiene 93: 133-139.
Islam, M.S., Mahmuda, S., Morshed, M. G., Bakht, H. B., Khan, M. N., Sack, R. B.,
Sack, D. A. (2004): Role of cyanobacteria in the persistence of Vibrio cholera O139 in
saline microcosms. Canadian Journal of Microbiology 50: 127-131.
Literature
157
Islam, M.S., Jahid, M.I.K., Rahman, M.M., Rahman, M.Z., Islam, M.S., Kabir, M.S.,
Sack, D.A., Schoolnik, G.K. (2007): Biofilm acts as a microenvironment for plankton-
associated Vibrio cholerae in the aquatic Eenvironment of Bangladesh. Microbiology
and Immunology 51: 369-379.
ISO 11731 (1998): Water quality – detection and enumeration of Legionella.
ISO 11731-2 (2004): Water quality – detection and enumeration of Legionella. Part 2:
direct membrane filtration method for waters with low bacterial counts.
ISO 17995 (2005): Water quality -- Detection and enumeration of thermotolerant
Campylobacter species.
Jagmann, N., Brachvogel, H.P., Philipp, B. (2010): Parasitic growth of Pseudomonas
aeruginosa in co-culture with the chtiniolytic bacterium Aeromonas hydrophila.
Environmental Microbiology 12: 1787-1802.
Janda, J. M., Duffey, P. S. (1988): Aeromonas in human disease: Current taxonomy,
laboratory identification, and infectious disease spectrum. Reviews of Infectious
Diseases 10: 980-997.
Janda, J. M. (1991): Recent advances in the study of the taxonomy, pathogenicity
and infectious syndromes associated with genus Aeromonas. Clinical Microbiology
Reviews 4:397-410.
Jett, B. D., Huycke, M. M. & Gilmore, M. S. (1994). Virulence of enterococci. Clinical
Microbiology Reviews 7, 462–478.
Joly, P., Falconnet, P.-A., André, J., Weill, N., Reyrolle, M., Vandenesch, F., Maurin,
M., Etienne, J., Jarraud, S. (2006): Quantitative real-time Legionella PCR for
environmental water samples: Data Interpretation. Applied and Environmental
Microbiology 72: 2801-2808.
Jones, K., Betaieb, M., Telford, D. R. (1990): Thermophilic campylobacters in surface
waters around Lancaster UK: negative correlation with campylobacter infections in
the community. Journal of Applied Bacteriology 69: 758-764.
Joseph, S. W., Carnahan, A. (1994): The isolation, identification and systematics of
the motile Aeromonas species. Annual review of Fish diseases 4: 315-343.
Joshua, G. W., Guthrie-Irons, C., Karlyshev, A. V., Wren, B. W. (2006): Biofilm
formation in Campylobacter jejuni. Microbiology 152:387–396.
Jürgens, K. (1994): Impact of Daphnia on planktonic microbial food webs – a review.
Mar. Microb. Food webs 8: 295-324.

Literature
158
Kämpfer, P., Erhart, R., Beimfohr, C., Bohringer, J., Wagner, M., Amann, R. (1996):
Characterization of bacteral communities from activated sludge: Culture-dependent
numerical identification versus in situ identification using group- and genus-specific
rRNA-targeted oligonucleotide probes. Microbial Ecology 32: 101-121.
Kalmbach, S., Manz, W., Szewzyk, U. (1997): Isolation of new bacterial species from
drinking water biofilms and proof of their in situ dominance with highly specific 16S
rRNA probes. Applied and Environmental Microbiology 63: 4164.
Kamjunke, N., Benndorf, A., Wilbert, C., Opitz, M., Kranich, J., Bollenbach, M.,
Benndorf, J. (1999): Bacteria ingestion by Daphnia galeata in a biomanipulated
reservoir: a mechanism stabilizing biomanipulation? Hydrobiologia 403: 109-121.
Kaneko, T., Colwell, R.R. (1975): Adsorption of Vibrio parahaemolyticus onto Chitin
and Copepods. Applied Microbiology 29: 269-274.
Kaplan, L.A., Bott, T.L. (1989): Diel fluctuations in bacterial activity on streambed
substrata during vernal algal blooms: Effects of temperature, water chemistry and
habitat. Limnology and Oceanography 34: 718-733.
Keer, J. T., Birch, L. (2003): Molecular methods for the assessment of bacterial
viability. Journal of Microbiological Methods 53: 175-183.
Kell, D. B., Kaprelyants, A. S., Weichart, D. H., Harwood, C. R., Barer, M. R. (1998).
Viability and activity in readily culturable bacteria: a review and discussion of the
practical issues. Antonie Van Leeuwenhoek 73, 169–187.
Khan, N.H., Ishii, Y., Kimata-Kino, N., Esaki, H., Nishino, T., Nishimura, M., Kogure,
K. (2007): Isolation of Pseudomonas aeruginosa from open ocean and comparison
with freshwater, clinical, and animal isolates. Microbial Ecology 53: 173-186.
Kiefer, F., Fryer, G. (1978): Das Zooplankton der Binnengewässer, 2. Teil,
Freilebende Copepoda. Buch VIII. Schweizerbart´sche Verlagsbuchhandlung.
Kimata, N., Nishino, T., Suzuki, S., Kogure, K. (2004): Pseudomonas aeruginosa
isolated from marine environments in Tokyo Bay. Microbial Ecology 47: 41-47.
King, C. H., Sanders, R. W., Shotts, E. B. Jr., Porter, K. G. (1991): Differential
survival of bacteria ingested by zooplankton from a stratified eutrophic lake.
Limnology and Oceanography 36: 829-845.
King, C. H., Shotts, E. B. (1988): Enhancement of Edwardsiella tarda and Aeromonas
salmonicida through ingestion by the ciliated protozoan Tetrahymena pyriformis.
Federation of European Microbiological Socities. Microbiology Letters 51:95-100.
Kiørboe, T., Grossart, H. P., Plough, H., Tang, K. (2002): Bacterial colonization of
sinking aggregates: mechanisms and rates. Applied and Environmental Microbiology
68: 3996-4006.

Literature
159
Kiørboe, T., Tang, K., Grossart, H. P., Plough, H. (2003): Dynamics of microbial
communities on marine snow aggregates: colonization, growth, detachment and
grazing mortalitiy of attached bacteria. Applied and Environmental Microbiology 69:
3036-3047.
Kirschner, A.K.T., Schauer, S., Steinberger, B., Wilhartitz, I., Grim, C.J., Huq,A.,
Colwell, R.R., Herzig, A., Sommer,R. (2011): Interaction of Vibrio cholerae non-
O1/non-O139 with copepods, cladocerans and competing bacteria in the large
alkaline Lake Neusiedler See, Austria. Microbial Ecology 61: 496-506.
Klein,G. (2003): Taxonomy, ecology and antibiotic resistance of enterococci from
food and the gastro-intestinal tract. International Journal of Food Microbiology 88:
123-131.
Klüttgen, B., Dulmer, U., Engels, M., Ratte, H. T. (1994): ADaM, an artificial
freshwater for the culture of zooplankton. Water Research 28: 743-756.
Klug, M. (2004): Einsatz von Gensonden zum Nachweis von Pseudomonas
aeruginosa in Wasser und Biofilmen. Diploma thesis, Heinrich-Heine-University
Düsseldorf, Germany.
Koenraad, P. M. F. J., Rombouts, F. M., Notermans, S. H. W. (1997):
Epidemiological aspects of thermophilic Campylobacter in water-related
environments: a review. Water Environ. Res. 69: 52-63.
Kogure, K., Simidu, U., Taga, N., (1979): A tentative direct microscopic method for
counting living marine bacteria. Canadian Journal of Microbiology 25: 415– 420.
Krovacek, K., Faris, A., Mansson, I. (1991): Growth of and toxin production by
Aeromonas hydrophila and Aeromonas sobria at low temperatures. International
Journal of Food Microbiology 13: 165-176.
Krovacek, K., Conte , M., Galderisis, P., Morelli, G., Postiglione, A., Dumontet, S.
(1993): Fatal septicaemia caused by Aeromonas hydrophila in patient with cirrhosis.
Comparative Immunology, Microbiology and Infectious Diseases 16: 267-272.
Krovacek, K., Pasquale, V., Baloda, S.B., Soprano, V., Conte, M., Dumontet, S.
(1994): Comparison of putative virulence factors in Aeromonas hydrophila strains
isolated from marine environment and human diarrhoeal cases in Southern Italy.
Applied and Environmental Microbiology 60: 1379-1382.
Korhonen, L.K., Martikainen, P. J. (1991): Survival of Escherichia coli and
Campylobacter jejuni in untreated and filtered lake water. Journal of Applied
Bacteriology 71: 379-382.
Literature
160
Kuiper, M.W., Wullings, B.A., Akkermans, A.D., Beumer, R.R., van der Kooij, D.
(2004): Intracellular proliferation of Legionella pneumophila in Hartmannella
vermiformis in aquatic biofilms grown on plasticized polyvinyl chloride. Applied and
Environmental Microbiology 70: 6826-6833.
Kuiper, M.W., Valster, R.M., Wullings, B.A., Boonstra, H., Smidt, H., van der Kooij, D.
(2006): Quantitative detection of the free-living amoeba Hartmannella vermiformis in
surface water by using real-time PCR. Applied and Environmental Microbiology 72:
5750-5756.
Langó Z. (1999): Occurrence of Clostridia in the sediment of an extremely polluted
Danube Reach. Acta Hydrochimica et Hydrobiologica 27: 19-26.
Lampert, W. (1991): The dynamics of Daphnia in a shallow lake. Verhandlungen des
Internationalen Verein Limnologie 24: 795-798.
Lampert, W. (2006): Daphnia: Model herbivore, predator and prey. Polish Journal of
Ecology 54: 607-620.
Lampert, W. (2011): Daphnia: development of a model organism in ecology and
evolution. Excellence in Ecology Series. Book 21. International Ecology Institute,
Oldendorf/Luhe, Germany.
Långmark, J., Storey, M. V., Ashbolt, N. J., Stenstrom, T. A. (2005): Biofilms in an
urban water distribution system: measurement of biofilm biomass, pathogens and
pathogen persistence within the Greater Stockholm Area, Sweden. Water Science
and Technology 52: 181–189.
Lau, H. Y., Ashbolt, N. J. (2009). The role of biofilms and protozoa in Legionella
pathogenesis: implications for drinking water. Journal of Applied Microbiology 107,
368–378.
Lázaro, B., Cárcamo, J., Audícana, A., Perales, I., Fernández-Astorga, A., (1999):
Viability and DNA maintenance in non-culturable spiral Campylobacter jejuni cells
after long-term exposure to low temperatures. Applied Environmental Microbiology
65: 4677– 4681.
Le Chevallier, M.W., Babcock, T.M., Lee, R.G. (1987): Examination and
characterization of distribution system biofilms. Applied Environmental Microbiology
53: 2714–2724.
Leclerc, H., Mossel, D.A.A., Edberg, S.C., Struijk, C.B. (2001): Advances in the
bacteriology of the coliform group: Their suitability as markers of microbial water
safety. Annual Review Microbiology 55: 201-234.
Le Codiac, M., Simon, M., Marchetti, A., Ebert, D., Cosson, P. (2012): Daphnia
magna, a host for evaluation of bacterial virulence. Applied and Environmental
Microbiology 78: 593-595.
Literature
161
Leflaive, J., Ten-Hage, L. (2009): Chemical interactions in diatoms: role of
polyunsaturated aldehydes and precursors. New Phytologist 184: 794-805.
Lehtola, M. J., Torvinen, E., Kusnetsov, J., Pitkanen, T., Maunula, L., von Bonsdorff,
C.-H. (2007): Survival of Mycobacterium avium, Legionella pneumophila, Escherichia
coli, and caliciviruses in drinking water-associated biofilms grown under high-shear
turbulent flow. Applied Environmental Microbiology 73: 2854–2859.
Levi, K., Smedley, J., Towner, K.J. (2003): Evaluation of a real-time PCR
hybridization assay for rapid detection of Legionella pneumophila in hospital and
environmental water samples. Clinical Microbiology and Infection 9: 754-758.
Levy, R. V., Hart, F. L., Cheetham, R. D. (1986): Occurrence and public health
signifance of invertebrates in drinking water systems. Journal of the American Water
Works Association 78: 105-110.
Lipp, E.K., Huq, A., Colwell, R.R. (2002): Effects of global climate on infectious
disease: the cholera model. Clinical Microbiology Reviews 15: 757-770.
Lipp, E. K., Rivera, I. N. G., Gil, A. I., Espeland, E. M., Choopum, N., Louis, V.R.
(2003): Direct detection of Vibrio cholera and ctxA in Peruvian coastal water and
plankton by PCR. Applied and Environmental Microbiology 69: 3676-3680.
Lisle, J.T., Pyle, B.H., McFeters, G.A., (1999): The use of multiple indices of
physiological activity to assess viability in chlorine disinfected Escherichia coli
O157:H7. Letters in Applied Microbiololgy 29: 42– 47.
Lisle, J. T., Smith, J. J., Edwards, D. D., McFeters, G. A. (2004): Occurrence of
microbial indicators and Clostridium perfringens in wastewater, water column
samples, sediments, drinking water, and Weddell seal feces collected at McMurdo
Station, Antarctica. Applied Environmental Microbiology 70: 7269-7276.
Lleò, M.M., Tafi, M.C., Canepari, P. (1998): Nonculturable Enterococcus faecalis
cells are metabolically active and capable of resuming active growth. Systematic and
Applied Microbiology 21: 333-339.
Lleò, M. M., Pierobon, S., Tafi, M. C., Signoretto, C., Canepari, P. (2000): mRNA
detection by transcription-PCR for monitoring viability over time in an Enterococcus
faecalis viable but nonculturable population maintained in a laboratory microcosm.
Applied Environmental Microbiology. 66: 4564-4567.
Lowder, M., Unge, A., Maraha, N., Jansson, J.K., Swiggett, J., Oliver, J.D., (2000):
Effect of starvation on the viable-but-nonculturable state on green fluorescent protein
(GFP) fluorescence in GFP-tagged Pseudomonas fluorescens A506. Applied
Environmental Microbiology 66: 3160– 3165.
Literature
162
Mackay, I.M., Mackay, J.F., Nissen, M.D., Sloots, T.P.: Real-time PCR: History and
Fluorogenic Chemistries. In: Mackay, I.M. (ed.) (2007): Real-time PCR in
microbiology – from diagnosis to characterization. Caister Academic Press, Norfolk,
UK: 1-39.
Madigan M.T. & Martinko J.M. Brock: Biology of microorganisms. 11th edition. 2006.
Pearson Prentice Hall. New Jersey, USA.
Manz, W., Amann, R., Szewzyk, R., Szewzyk, U., Stenstrom, T. A., Hutzler, P., et al.
(1995): In situ identification of Legionellaceae using 16S rRNA-targeted
oligonucleotide probes and confocal laser scanning microscopy. Microbiology 141:
29–39.
Marino, R. P., Gannon, J. J. (1991): Survival of fecal coliforms and fecal streptococci
in storm drain sediment. Water Research 25: 1089-1098.
Mary, P., Chihib, N.E., Charafeddine, O., Defives, C., Hornez, J. P. (2002): Starvation
survival and viable but nonculturable states in Aeromonas hydrophila. Microbial
Ecology 43: 250-258.
Matsumoto, N., Aizawa, T., Ohgaki, S., Hirata, T., Toyooka, K., Kanbayashi, T.,
Tsutsumi, Y., Hasegawa, T. (2002): Removal methods of nematode contained in the
effluent of activated carbon. Journal of Water Supply, Water Science and Technology
2: 183-190.
Maugeri, T.L., Carbone, M., Fera, M.T., Irrera, G.P., Gugliandolo, C. (2004):
Distribution of potentially pathogenic bacteria as free living and plankton associated
in a marine coastal zone. Journal of Applied Microbiology 97: 354-361.
McEldowny, S., Fletcher, M. (1986): Variability of the influence of physicochemical
factors affecting bacterial adehesion to polystyrene substrata. Applied and
Environmental Microbiology 52: 460-465.
McFeters, G. A., LeChevallier, M. W., Singh, A., Kippin, J. S. (1986): Health
significance and occurrence of injured bacteria in drinking water. Water Science and
Technology 18: 227-231.
McKay (1992): Viable but non-culturable forms of potentially pathogenic bacteria in
water. Letters in Applied Microbiology 97: 354-361.
McMahon, J. W., Rigler, F. H. (1965): Feeding rate of Daphnia magna Straus in
different foods labeled with radioactive phosphorus. Limnololgy and Oceanography
10: 105-113.
Medema, G. J., Bahar, M., Schets, F. M. (1997): Survival of Crytosporidium parvum,
Escherichia coli, faecal enterococci and Clostridium perfringens in river water.
Influence of temperature and autochthonous microorganisms. Water, Science and
Technology 35: 549-252.

Literature
163
Meier, H., Koob, C., Ludwig, W., Amann, R., Frahm, E., Hoffmann, S., Obst, U.,
Schleifer, K.H. (1997): Detection of Enterococci with rRNA targeted DNA probes and
their use for hygienic drinking water control. Water Science and Technology 35: 437-
444.
Messi, P., Guerrieri, E., Bondi, M. (2002): Survival of an Aeromonas hydrophila in an
artificial mineral water microcosm. Water Research 36: 3410-3415.
Mischke, U., Behrendt, H. (2007): Handbuch zum Bewertungsverfahren von
Fließgewässern mittels Phytoplankton zur Umsetzung der EU-WRRL in Deutschland,
Weißensee Verlag.
Møller, E.F., Riemann, L., Søndergaard, M. (2007): Bacteria associated with
copepods: abundance, activity and community composition. Aquatic Microbial
Ecology 47: 99-106.
Moore, J.E., Crower, M., Heaney, N., Crothers, E. (2001): Antibiotic resistance in
Campylobacter spp. isolated from human faeces (1980-2000) and foods (1997-2000)
in Northern Ireland: An update. Journal of Antimicrobial Chemotherapy 48: 455-457.
Moritz, M.M., Flemming, H.-C., Wingender, J. (2010): Integration of Pseudomonas
aeruginosa and Legionella pneumophila in drinking water biofilms grown on domestic
plumbing materials. International Journal of Hygiene and Environmental Health 213:
190-197.
Mote, B. L., Turner J. W., Lipp E. K. (2012): Persistence and growth of the fecal
indicator bacteria enterococci in detritus and natural estuarine plankton communities.
Applied Environmental Microbiology 78: 2569-2577.
Moter, A., Göbel, U. B. (2000). Fluorescence in situ hybridization (FISH) for direct
visualization of microorganisms. Journal of Microbiological Methods 41: 85–112.
Mueller, R.S., McDougald, D., Cusumano, D., Sodhi, N., Kjelleberg, St., Azam, F.,
Bartlett, D.H. (2007): Vibrio cholerae strains possess multiple strategies for abiotic
and biotic surface colonization. Journal of Bacteriology 189: 5348-5360.
Mueller-Spitz, S. R., Stewart, L. B., Val Klump, J., McLellan, S. (2010): Freshwater
suspended sediments and sewage are reservoirs for enterotoxin-positive Clostridium
perfringens. Applied and Environmental Microbiology 76: 5556-5562.
Nagasawa, S. (1988): Copepod-bacteria associations in Zielony Lake, Poland.
Journal of Plankton Research 10: 551-554.
Ng, D.L.K., Koh, B.B., Tay, L., Heng, B.H. (1997): Comparison of polymerase chain
reaction and conventional culture for the detection of legionellae in cooling tower
waters in Singapore. Letters in Applied Microbiology 24: 214-216.

Literature
164
Niewolak, S., Opieka, A. (2000): Potentially pathogenic microorganisms in water and
bottom sediments in the Czarna Hancza River. Polish Journal of Environmental
Studies 9: 183-194.
Nocker, A., Sossa-Fernandez, P., Burr, M. D., Camper, A. K. (2007). Use of
propidium monoazide for live/dead distinction in microbial ecology. Applied
Environmental Microbiology 73, 5111–5117.
Nwachuku, N., Gerba, C.P. (2008): Occurrence and persistence of Escherichia coli
O157:H7 in water. Reviews in Environmental Science and Biotechnology 7: 267-273.
Nwoguh, C.E., Harwood, C.R., Barer, M.R., (1995): Detection of induced beta-
galactosidase activity in individual non-culturable cells of pathogenic bacteria by
quantitative cytological assay. Molecular Microbiology 17: 545– 554.
Obiri-Danso, K., Jones, K. (1999): Distribution and seasonality of microbial indicators
and thermophilic campylobacters in two freshwater bathing sites on the River Lune in
northwest England. Journal of Applied Microbiology 87: 822-832.
Olapade, O. A., Depas, M. M., Jensen, E. T., Mc Lellan, S. L. (2006): Microbial
communities and fecal indicator bacteria associated with Cladophora mats on beach
sites along Lake Michigan shores. Applied and Environmental Microbiology 72, 1932-
1938
Oliver, J.D. (2000): The public health significance of viable but nonculturable
bacteria, p. 277-300. In R.R. Colwell and D.J. Grimes (ed.), Nonculturable
microorganisms in the environment. ASM Press, Washington, D.C.
Oliver, J.D. (2005): The viable but nonculturable state in bacteria. The Journal of
Microbiology 43: 93-100.
Oliver, J. D. (2009): Recent findings on the viable but nonculturable state in
pathogenic bacteria. FEMS Microbiology Reviews: 1-11.
Oliver, J. D. (2010). Recent findings on the viable but nonculturable state in
pathogenic bacteria. FEMS Microbiology Reviews 34: 415–425.
Omar, R., Ali Rahman, Z., Latif, M.T., Lihan, T.m Adam, J.H. (Eds.) (2002): The
occurrence of aerolysin-positive Aeromonas hydrophila strains in seawater and
associated with marine copepods (Asmat, A., Gires, U.). In Proceedings of the
Regional Symposium on Environment and Natural Ressources, Hotel Renaissance
Kuala Lumpur, Malaysia. Vol.: 1: 495-502.
Padmanabhan, V., Prabakaran, G., Paily, K.P., Balaraman, K. (2005): Toxicity of a
mosquitocidal metabolite of Pseudomonas fluorescence on larvae & pupae of the
house fly, Musca dometica. Indian Journal of Medical Research 121: 116-119.
Literature
165
Palmer, C.J., Bonilla, G.F., Roll, B., Paszko-Kolva, C., Sangermano, L.R., Fujioka,
R.S. (1995): Detection of Legionella species in reclaimed water and air with the
EnviroAmp Legionella PCR Kit and direct fluorescent antibody staining. Applied and
Environmental Microbiology 61: 407-412.
Park, J. H., Yoshinaga, I., Nishikawa, T., Imai, I. (2010): Algicidal bacteria in particle-
associated form and in free-living form during a diatom bloom in the Seto Inland Sea,
Japan. Aquatic Microbial Ecology 60: 151-161.
Parthuisot, N., West, N.J., Lebaron, P., Baudart, J. (2010): High Diversity and
Abundance of Legionella spp. in a Pristine River and impact of seasonal and
anthropogenic effects. Applied and Environmental Microbiology 76: 8201-8210.
Pearce, D.A., van der Gast, C.J., Woodward, K., Newsham K.K. (2005): Significant
changes in the bacterioplankton community structure of maritime Antarctic freshwater
lake following nutrient enrichment. Microbiology 151:3237-3248.
Pearson, A.D., Greenwood, M.H., Feltham, R.K.A., Healing, T.D., Donaldson, J.,
Jones, D.M., Colwell, R.R. (1996): Microbial ecology of Campylobacter jejuni in a
United Kingdom chicken supply chain: Intermittent common source, vertical
transmission, and amplification by flock propagation. Applied and Environmental
Microbiology 62: 4614-4620.
Pellett, S., Bigley, D.V., Grimes, D.J. (1983): Distribution of Pseudomonas
aeruginosa in a Riverine Ecosystem. Applied and Environmental Microbiology 45:
328-332.
Prescott, A. M., Fricker, C. R., (1999): Use of PNA oligonucleotides for the in situ
detection of Escherichia coli in water. Molecular Cell probes 13: 261-268.
Pete, R., Davidson, K., Hart, M.C. Gutierrez, T., Miller, A. E. J. (2010): Diatom
derived dissolved organic matter as a driver of bacterial productivity: the role of
nutrient limitation. Journal of Experimental Marine Biology and Ecology 391:20-26.
Petit, L., Gibert, M., Popoff, M. R. (1999): Clostridium perfringens: toxinotype and
genotype. Trends in Microbiology 7: 104-110.
Pinto, B., Pierotti, R., Canale, G., Reali, D. (1999): Characterization of ‘faecal
streptococci’ as indicator of faecal pollution and distribution in the environment.
Letters in Applied Microbiology 29: 258-263.
Piqueres, P., Moreno, Y., Alonso, J. L., Ferrus, M.A. (2006): A combination of direct
viable count and fluorescent in situ hybridization for estimating Helicobacter pylori cell
viability. Research in Microbiology 157: 345-349.
Pirnay, J.-P., Matthijs, S., Colak, H., Chablain, P., Bilocq, F., Van Eldere, J., De Vos,
D., Zizi, M., Triest, L., Cornelis, P. (2005): Global Pseudomonas aeruginosa
biodiversity as reflected in a Belgian river. Environmental Microbiology 7: 969-980.

Literature
166
Plough, H., Grossart, P. (2000): Bacterial growth and grazing on diatom aggregates:
Respiratory carbon turnover as a function of aggregate size and sinking velocity.
Limnology and Oceanography 45: 1467-1475.
Porter, K. G., Feig, Y. S., Vetter, E. F. (1983): Morphology, flow regimes, and filtering
rates of Daphnia, Ceriodapnia and Bosmina fed natural bacteria. Oecologia 58: 156-
163.
Pruzzo, C., Tarsi, R., Lleò, M. M., Signoretto C., Zampini, M., Colwell, R. R.,
Canepari, P. (2002): In vitro adhesion to human cells by viable but nonculturable
Enterococcus faecalis. Current Microbiology 45: 105-110.
Qi, W. Nong, G., Preston, J.F., Ben-Ami, F., Ebert, D. (2009): Comparative
metagenomics of Daphnia symbionts. BMC Genomics 10: 172.
Qin, X., Emerson, J., Stapp, J., Stapp, L., Abe, P., Burns, J.L. (2003): Use of real-
time PCR with multiple targets to identify Pseudomonas aeruginosa and other
nonfermenting Gram-negative Bacilli from patients with Cystic Fibrosis. Journal of
Clinical Microbiology 41: 4312-4317.
Rainey, F. A., Hollen, B. J., Small, A. (2005): Family I. Clostridiaceae. In: Parte, A. C.
(ed. in chief), de Vos, P., Garrity, G. M. Jones, D., Krieg, N. R., Ludiwg, W., Rainey,
F. A., Schleifer, K.-H., Whitman, W. B. (eds). Bergey`s Manual of Systematic
Bacteriology, Second Edition. Volume three, The Firmicutes. Springer, New York.
738-858.
Rawlings, T.K., Ruiz, G.M., Colwell, R.R. (2007): Association of Vibrio cholerae O1
E1 Tor and O139 Bengal with the copepods Acartia tonsa and Eurytemora affinis.
Applied and Environmental Microbiology 73: 7926-7933.
Reasoner, D. J., Geldreich, E. E. (1985): A new medium for the enumeration and subculture of bacteria from potable water. Applied and Environmental Microbiology 49:1-7. Reche, I., Carillo, P., Cruz-Pizarro, L. (1997): Influence of metazooplankton on interactions of bacteria and phytoplankton in an oligotrophic lake. Journal of Plankton Research 19: 631-646. Regnault, B., Martin-Delautre, S., Grimont, P. A. (2000): Problems associated with the direct viable count procedure applied to Gram-positive bacteria. International Journal of Food Microbiology 55: 1-3. Reuter, S., Sigge, A., Wiedeck, H., Trautmann, M. (2002). Analysis of transmission pathways of Pseudomonas aeruginosa between patients and tap water outlets. Critical Care Medicine 30: 2222–2228. Riemann, L., Steward, G. F., Azam, F. (2000): Dynamics of bacterial community composition and activity during a mesocosm diatom bloom. Applied and Environmental Microbiology 66: 578-587.
Literature
167
Riemann, L., Winding, A. (2005): Community dynamics of free-living and particle-associated bacterial assemblages during a freshwater phytoplankton bloom. Microbial Ecology 42: 274-285. Rodriguez, S., Araujo, R. (2010): Occurrence of thermotolerant Campylobacter
species in surface waters of Mediterranenan area and its prevailing pollution sources.
Journal of Applied Microbiology 109: 1027-1034.
Rodriguez GG, Phipps D, Ishiguro K, Ridgway HF (1992): Use of a fluorescent redox
probe for direct visualization of actively respiring bacteria. Applied and Environmental
Microbiology 58: 1801–1808.
Rogers, J., Dowsett, A.B., Dennis, P.J., Lee, J.V., Keevil, C.W. (1994): Influence of
temperature and plumbing material selection on biofilm formation and growth of
Legionella pneumophila in a model potable water system containing complex
microbial flora. Applied and Environmental Microbiology 60: 1585-1592.
Rollins, D. M., Colwell, R. R. (1986): Viable but nonculturable stage Campylobacter
jejuni and its role in survival in the natural aquatic environment. Applied and
Environmental Microbiology 52: 531-538.
Rompré, A., Servais, P., Baudart, J., de-Roubin, M.-R., Laurent, P. (2002): Detection
and enumeration of coliforms in drinking water: current methods and emerging
approaches. Journal of Microbiological Methods 49: 31-54.
Rosenberg, M. (1981): Bacterial adherence to polystyrene: a replica method of
screening for bacterial hydrophobicity. Applied and Environmental Microbiology 42:
375-377.
Roszak, D. B., Colwell, R. R. (1987): Metabolic activity of bacterial cells enumerated
by direct viable count. Applied Environmental Microbiology 53: 2889.
Routtu, J., Jansen, B., Colson, I., De Meester, L., Ebert, D. (2010): The first-
generation Daphnia magna linkage map. BMC Genomics 11: 508.
Rowe, M. T. (2000): Campylobacter. In Encyclopedia of Food Microbiology ed.
Robinson, R. K., Batt, C. A., Patel, P. D. Vol. 1: 335-352. London: Academic press.
Ruhrverband (2009): Ruhrgütebericht 2009.
Ruhrverband (2010): Ruhrgütebericht 2010.
Ryzinska-Paier, G., Sommer, R., Haider, J. M., Knetsch, S., Frick, C., Kirschner, A.
K. T., Farnleitner, A. H. (2011): Acid phosphatase test proves superior to standard
phenotyic identification procedure for Clostridum perfringens strains isolated from
water. Journal of Microbiological Methods 87: 189-194.
Literature
168
Sanders, W. E. Jr., Sanders, C. C. (1997): Enterobacter spp.: pathogens poised to
flourish at the turn of the century. Clinical Microbiology Reviews 10: 220-241.
Sapp, M., Wichels, A., Wiltshire, K. H., Gerdts, G. (2007): Bacterial community dynamics during the winter-spring transition in the North Sea. FEMS Microbiological Ecology 59: 622-637. Scalbert, A. (1991): Antimicrobial properties of tannins. Phytochemistry 30: 3875-3883. Schaffer, J.C. (1755): Die grünen Armpolypen, die geschwänzten und ungeschwänzten zackigen Wasserflöhe und eine besondere Art kleiner Wasseraale Germany: Regensburg. Schallenberg, M., Bremer, P. J., Henkel, S., Launhardt, A., Burns, C. W. (2005):
Survival of Campylobacter jejuni in Water: Effect of Grazing by the Freshwater
Crustacean Daphnia carrinata (Cladocera). Applied and Environmental Microbiology
71: 5085-5088.
Scheffer, M. (1989): Alternative stable states in eutrophic freshwater systems. A minimal model. Hydrobiological Bulletin 23: 73-83.
Scheffer, M. (1998): Ecology of shallow lakes. Chapmann & Hall, London.
Scheffer, M., Hosper, S. H., Meijer, M. L., Moss, B., Jeppesen, E. (1993): Alternative equilibria in shallow lakes. Trends Ecology Evolution 8: 275-279.
Scheutz, S., Strockbine, N.A. (2005): Family I. Enterobacteriaceae. In: Garrity GM,
(ed. in chief), Brenner DJ, Krieg NR, Stale JT. (eds). Bergey`s Manual of Systematic
Bacteriology, Second Edition. Volume two, The Proteobacteria, Part B: The
Gammaproteobacteria. Springer, New York. 607-623.
Schreiber, H., Schoenen, D., Traunspurger, W. (1997): Invertebrate colonization of
granular activated carbon filters. Water Research 31: 743-748.
Schwartz, T., Volkmann, H., Kirchen, S., Kohnen, W., Schön-Hölz, K., Jansen, B.,
Obst, U. (2006): Real-time PCR detection of Pseudomonas aeruginosa in clinical and
municipal wastewater and genotyping of the ciprofloxacin-resistant isolates. FEMS
Microbiology Ecology 57: 158-167.
Seyfried, P.L., Cook, R.J. (1984): Otitis externa infections related to Pseudomonas aeruginosa levels in five Ontario lakes. Canadian Journal of Public Health 75:83–91. Shin, J. E., Jang, M. J., Koo, J. Y., Ahn, S. K., Yu, M. J. (2007). Variation of biofilm
formation on distribution pipe depending on water treatment processes and pipe
materials. Water Science and Technology: Water Supply 7, 25–32.
Shipley, G.L.: An introduction to real-time PCR. In: Dorak, M.T. (ed.) (2006): Real-
time PCR. Taylor & Francis Group, Milton Park, UK: 1-31.
Literature
169
Sibille I, Sime-Ngando T, Mathieu L, Block JC (1998): Protozoan bacterivory and Escherichia coli survival in drinking water distribution systems. Applied and Environmental Microbiology 64:197–202. Signoretto, C., Burlacchini, G., Lleò, M., Pruzzo, C., Zampini, M., Pane, L., Franzini,
G., Canepari, P. (2004): Adhesion of Enterococcus faecalis in the nonculturable State
to plankton is the main mechanism responsible for persistence of this bacterium in
both lake and seawater. Applied and Environmental Microbiology 70: 6892-6896.
Signoretto, C., Burlacchini, G., Pruzzo, C., Canepari, P. (2005): Persistence of
Enterococcus faecalis in aquatic environments via surface interactions with
copepods. Applied and Environmental Microbiology 71: 2756-2761.
Simon, M. (1987): Biomass and production of small and large free-living and attached
bacteria in Lake Constance. Limnology and Oceanography 32: 591-607.
Simon, M., Grossart, H. P., Schweitzer, B., Plough, H. (2002): Microbial ecology of
organic aggregates in aquatic ecosystems. Aquatic Microbial Ecology 28: 175-211.
Simpson, D. A. (1990): Displacement of Elodea canadensis by Elodea nuttallii
(Planch.) St. John in the British Isles. Watsonia 18: 173-177.
Sørensen, D. L., Eberl, S. G., Dicksa, R. T. (1989): Clostridium perfringens as a point
source indicator in non-point polluted streams. Water Research 23, 191–197.
Steinert, M., Emody, L., Amann, R., Hacker, J. (1997): Resuscitation of viable but
nonculturable Legionella pneumophila Philadelphia JR32 by Acanthamoeba
castellanii. Applied Environmental Microbiology 63: 2047-2053.
Stewart, P. S., Camper, A. K., Handran, S. D., Huang, C.-T., Warnecke, M. (1997).
Spatial distribution and coexistence of Klebsiella pneumoniae and Pseudomonas
aeruginosa in biofilms. Microbial Ecology 33, 2–10.
Stocker, R., Seymour, J. R., Samadani, A., Hunt, D. F., Polz, M. (2008): Rapid
chemotactic response enables marine bacteria to exploit ephemeral microscale
nutrient patches. Proceedings of the National Acadamy of Science USA 105: 4209-
4214.
Stover, C.K., Pham, X.Q., Erwin, A.L., Mizoguchi, S.D., Warrener, P., Hickey, M.J.,
Brinkman, F.S.L., Hufnagle, W.O., Kowalik, D.J., Lagrou, M., Garber, R.L., Goltry, L.,
Tolentino, E., Westbrock-Wadman, S., Yuan, Y., Brody, L.L., Coulter, S.N., Folger,
K.R., Kas, A., Larbig, K., Lim, R., Smith., K., Spencer, D., Wong, G.K.-S., Wu, Z.,
Paulsen, I.T., Reizer, J., Saier, M.H., Hancock, R.E.W., Lory, S., Olson, M.V. (2000):
Complete genome sequence of Pseudomonas aeruginosa PA01, an opportunistic
pathogen. Nature 406: 959-964.
Literature
170
St. Pierre, K., Lévesque, S., Frost, E., Carrier, N., Arbeit, R.D., Michaud, S. (2009):
Thermotolerant coliforms are not a good surrogate for Campylobacter spp. in
environmental water. Applied and Environmental Microbiology 75: 6736-6744.
Struwe, C., Krogfeldt, K. A. (2004): Pathogenic potential of environmental Klebsiella
pneumoniae isolates. Environmental Microbiology 6: 584-590.
Swift, S., Lynch, M.J., Fish, L., Kirke, D.F., Tomás, J.M.,Stewart, G.S., and Williams,
P. (1999) Quorum sensing dependent regulation and blockade of exoprotease
production in Aeromonas hydrophila. Infection and Immunity 67: 5192–5199.
Szabo, J.G., Rice, E.W., Bishop, P.L. (2006): Persistence of Klebsiella pneumoniae on simulated biofilm in a model drinking water system. Environmental Science and Technology 40:4996–5002. Szewzyk, U., Szewzyk, R., Manz, W., Schleifer, K. H. (2000). Microbiological safety
of drinking water. Annual Review of Microbiology 54, 81–127.
Tan, M. W., Mahajan-Miklos, S., Ausubel, F. M. (1999): Killing of Caenorhabditis
elegans by Pseudomonas aeruginosa used to model mammalian bacterial
pathogenesis. Proceedings of the National Acadamy of Science USA 96: 715-720.
Tang, K. W., Visscher, P. T., Dam, H. G., (2001): DMSP-consuming bacteria
associated with the calanoid copepod Acartia tonsa (Dana). Journal of Experminetal
Marine Biology and Ecology 256:185-198.
Tang, K.W. (2005): Copepods as microbial hot spots in the ocean: effects of host
feeding activities on attached bacteria. Aquatic Microbial Ecology 38: 31-40.
Tang, K. W., Hutalle, K. M. L., Grossart, H. P. (2006): Microbial abundance,
composition and enzymaticactivity during decomposition of copepod carcasses.
Aquatic Microbial Ecology 45: 219-227.
Tarsi, R., Pruzzo, C. (1999): Role of surface proteins in Vibrio cholerae attachment to
chitin. Applied and Environmental Microbiology 65: 1348-1351.
Temmerman, R., Vervaeren, H., Noseda, B., Boon, N., and Verstraete, W. (2006)
Necrotrophic growth of Legionella pneumophila. Applied Environmental Microbiology
72: 4323–4328.
Terzieva, S. I., McFerters, G. A. (1991): Survival and injury of Escherichia coli,
Campylobacter jejuni, and Yersinia enterocolitica in stream water. Canadian Journal
of Microbiology 37: 785-790.
Tholozan, J. L., Cappelier, J. M., Tissier, J. P., Delattre, G., Federighi, M. (1999):
Physiological characterization of viable-but-nonculturable Campylobacter jejuni cells.
Applied Environmental Microbiology 65: 1110-1116.

Literature
171
Tison, D.L., Pope, D.H., Cherry, W.B., Fliermans, C.B. (1980): Growth of Legionella
pneumophila in association with blue-green algae (Cyanobacteria). Applied and
Environmental Microbiology 39: 456-459.
Tolker-Nielsen, T., Larsen, M. H., Kyed, H., Molin, S. (1997): Effects of stress
treatments on the detection of Salmonella typhimurum by in situ hybridization.
International Journal of Food Microbiology 35: 251-258.
Tóth, L. G., Kato, K., Abe, D. (2001): Grazing of Daphnia galeata (Crustacea,
Cladocera) on epi- and hypolimnetic bacteria in the mesotrophic Lake Kizaki, Japan.
Verhandlungen des Internationalen Verein Limnologie 27: 3712-3717.
Toze, S., Sly, L.I., Macrae, I.C., and Fuerst, J.A. (1990): Inhibition of growth of
Legionella species by heterotrophic plate-count bacteria isolated from chlorinated
drinking water. Current Microbiology 21, 139–143.
Trautmann, M., Lepper, P.M., Haller, M. (2005): Ecology of Pseudomonas
aeruginosa in the intensive care unit and the evolving role of water outlets as a
reservoir of the organism. American Journal of Infection Control 33: 41-49.
Trautmann, M., Halder, S., Lepper, P. M., Exner, M. (2009): Reservoirs of
Pseudomonas aeruginosa in the intensive care unit. The role of tap water as a
source of infection. Bundesgesundheitsblatt Gesundheitsforschung
Gesundheitsschutz 52: 339–344.
Turley, C.M., Mackie, P. J. (1995): Bacterial and cyanobacterial flux to the deep. NE
Atlantic on sedimenting particles. Deep Sea Research 42: 1453-1474.
Valentino, L., Torregrossa, M.V. (1995): Risk of Bacillus cereus and Pseudomonas
aeruginosa nosocomial infections in a burns centre: The microbiological monitoring of
water supplies for a preventive strategy. Water Science and Technology 31, No. 5-6:
37-40.
Valiela, I., Alber, M., LaMontagne, M. (1991): Fecal coliform loadings and stocks in
Buttermilk Bay, Massachusetts, USA, and management implications. Environmental
Managament 15: 659-674.
Van der Gucht, K., Cottenie, K., Muylart, K., Vloemans, N., Cousin, S., Declerck, S.,
Jeppesen, E., Conde-Porcuna, J.-M., Schwenk, K., Zwart, G., Degans, H.,
Vyverman, W., De Meester, L. (2007): The power of species sorting: Local factors
drive bacterial community composition over a wide range of spatial scales.
Proceedings of the National Acadamy of Science USA 104: 20404-20409.
Vandamme. P., De Ley, J. (1991): Proposal for a new family Campylobacteriaceae.
International Journal of Systematic Bacteriology 41: 451-455.
Literature
172
Vila, J., Ruiz, J., Gallardo, F., Vargas, M., Soler, L., Figueras, M. J., Gascon, J.
(2003): Aeromonas spp. and traveler´s diarrhea: clinical features and antimicrobial
resistance. Emerging Infectious Diseases 9: 552-555.
Villari, P., Motti, E., Farullo, C., Torre, I. (1998): Comparison of conventional culture
and PCR methods for the detection of Legionella pneumophila in water. Letters in
Applied Microbiology 27: 106-110.
Vöge, M. (1995): Langzeitbeobachtungen an Elodea nuttallii (Planch.) St. John in
norddeutschen Seen. Floristische Rundbriefe 29: 189-193.
Volkmann, H., Schwartz, T., Kirchen, S., Stofer, C., Obst, U. (2007): Evaluation of
inhibition and cross-reaction effects on real-time PCR applied to the total DNA of
wastewater samples for the quantification of bacterial antibiotic resistance genes and
taxon-specific targets. Molecular and Cellular Probes 21: 125-133.
Wallner, G., R. Amann, and W. Beisker (1993): Optimizing fluorescent in situ
hybridization with rRNA-targeted oligonucleotide probes for flow cytometric
identification of microorganisms. Cytometry 14: 136-143.
Wang, S.-L., Chang, W.-T. (1997): Purification and characterization of two
bifunctional chitinases/lysozymes extracellularly produced by Pseudomonas
aeruginosa K-187 in a shrimp and crab shell powder medium. Applied and
Environmental Microbiology 63: 380-386.
Watnick, P., Kolter, R. (2000): Biofilm, City of Microbes. Journal of Bacteriology 182:
2675-2679.
Weichart, D., McDougald, D., Jacobs, D., Kjelleberg, S., (1997): In situ analysis of
nucleic acids in cold-induced nonculturable Vibrio vulnificus. Applied Environmental
Microbiology 63: 2754– 2758.
Weisburg, W.G., Barns, S.M., Pelletier, D.A., Lane, D.J. (1991): 16S ribosomal DNA
Amplification for Phylogenetic Study. Journal of Bacteriology 173: 697-703.
Wellinghausen, N., Frost, C., Marre, R. (2001): Detection of legionellae in hospital
water samples by quantitative real-time LightCycler PCR. Applied and Environmental
Microbiology 67: 3985-3993.
Wellinghausen, N., Kothe, J., Wirths, B., Sigge, A., Poppert, S. (2005): Superiority of
molecular techniques for identification of gram-negative, oxidase-positive rods,
including morphologically nontypical Pseudomonas aeruginosa, from patients with
cystic fibrosis. Journal of Clinical Microbiology 43: 4070–4075.
Wéry, N., Bru-Adan, V., Minervini, C., Delgénes, J.-P., Garrelly, L., Godon, J.-J.
(2008): Dynamics of Legionella spp. and bacterial populations during the proliferation
of L. pneumophila in a cooling tower facility. Applied and Environmental Microbiology
74: 3030-3037.

Literature
173
Wetzel, R. G. (2001): Limnology, lakes and river ecosystems. Elsevier Academic
Press, New York.
Whiteside, M. D., Oliver, J. D. (1997). Resuscitation of Vibrio vulnificus from the
Viable but Nonculturable State. Applied Environmental Microbiology 63: 1002–1005.
Whitman, R.L., Shively, D.A., Pawlik, H., Nevers, M.B., Byappanahalli, M.N. (2003):
Occurrence of Escherichia coli and Enterococci in Cladophora (Chlorophyta) in
nearshore water and beach sand of Lake Michigan. Applied and Environmental
Microbiology 69: 4714-4719.
Whitman, R.L., Nevers, M.B., Byappanahalli, M.B. (2006): Examination of the
watershed-wide distrbution of Escherichia coli along southern Lake Michigan: an
integrated approach. Applied and Environmental Microbiology 72: 7301-7301.
Wiedenmann, A., Krüger, P., Dietz, K., López-Pila, J. M., Szewzyk, R., Botzenhart,
K. (2006): A randomized controlled trial assessing infectious disease risks from
bathing in fresh recreational waters in relation to the concentration of Escherichia
coli, intestinal Enterococci, Clostridium perfringens, and somatic coliphages.
Environmental Health Perspectives 114: 228-236.
Wilson, I.G. (1997): Inhibition and facilitation of nucleic acid amplification. Applied
and Environmental Microbiology 63: 3741-3751.
Wingender, J., Hambsch, B., Schneider, S. (2009): Mikrobiologisch-hygienische
Aspekte des Vorkommens von Pseudomonas aeruginosa im Trinkwasser. Energie
Wasser-Praxis 60: 60-66.
Wingender, J., Flemming, H.-C. (2011): Biofilms in drinking water and their role as
reservoir for pathogens. International Journal of Hygiene and Environmental Health.
Article in press.
Wullings, B.A., van der Kooij, D. (2006): Occurence and genetic diversity of
uncultured Legionella spp. in drinking water treated at temperatures below 15°C.
Applied and Environmental Microbiology 72: 157-166.
Yáñez, M.A., Carrasco-Serrano, C., Barberá, V.M., Catalán, V. (2005): Quantitative
detection of Legionella pneumophila in water samples by immunomagnetic
purification and real-time PCR Amplification of the dotA gene. Applied and
Environmental Microbiology 71: 3433-3441.
Yaradou, D.F., Hallier-Soulier, S., Moreau, S., Poty, F., Hillion, Y., Reyrolle, M.,
André, J., Festoc, G., Delabre, K., Vandenesch, F., Etienne, J., Jarraud, S. (2007):
Integrated real-time PCR for detection and monitoring of Legionella pneumophila in
water systems. Applied and Environmental Microbiology 73: 1452-1456.
Yu, C., Lee, A.M., Bassler, B.L., Roseman, S. (1991): Chitin utilization by marine
bacteria. Journal of Biological Chemistry 266: 24260-24267.

Literature
174
Yu, V.L., Plouffe, J.F., Castellani Pastoris, M., Stout, J.E., Schousboe, M., Widmer,
A., Summersgill, J., File, T., Heath, C.M., Paterson, D.L., Chereshsky, A. (2002):
Distribution of Legionella species and serogroups isolated by culture in patients with
sporadic community-acquired legionellosis: An International Collaborative Survey.
Journal of Infectious Diseases 186: 127-128.
Ziegert, E., Stelzer, W. (1986): Comparative study of the detection of Pseudomonas
aeruginosa in water. Zentralblatt für Mikrobiologie 141: 121-28.
Ziglio, G., Andreottola, G., Barbesti, S., Boschetti, G., Bruni, L., Foladori, P., et al.
(2002): Assessment of activated sludge viability with flow cytometry. Water Research
36: 460–468.
Znachor, P., Simek, K., Nedoma, J. (2012): Bacterial colonization of the freshwater
planktonic diatom Fragilaria crotonensis. Aquatic Microbial Ecology 66: 87-94.

Appendix
175
Appendix
Sources of pictures used in Figure 1.1
Phytoplankton, Daphnia magna and Elodea nuttallii: source: Miriam Tewes, Biofilm Centre, University
of Duisburg-Essen
Lake Baldeney:
http://www.google.de/imgres?num=10&um=1&hl=de&client=firefox-
a&rls=org.mozilla:de:official&channel=np&biw=1366&bih=574&tbm=isch&tbnid=MNiQDPM0zOCeAM:
&imgrefurl=http://www.luftbild-archiv.de/page-
g51.htm&docid=ulFWL2uGAseEPM&imgurl=http://www.luftbild-archiv.de/d090831_027u_Luftbild-
Baldeneysee.jpg&w=980&h=715&ei=l9irUKWPJIyVswaI5IBQ&zoom=1&iact=rc&dur=351&sig=109059
784839555650694&sqi=2&page=1&tbnh=136&tbnw=209&start=0&ndsp=17&ved=1t:429,r:14,s:0,i:161
&tx=102&ty=50
Cormorant:
http://www.google.de/imgres?num=10&um=1&hl=de&client=firefox-
a&rls=org.mozilla:de:official&channel=np&biw=1366&bih=574&tbm=isch&tbnid=izhq5xzYd7CLtM:&im
grefurl=http://www.naturfoto-cz.de/kormoran-foto-15.html&docid=tkZm-
8Vp8E_kmM&imgurl=http://www.naturfoto-cz.de/bilder/vogel/kormoran-
575.jpg&w=600&h=410&ei=VsyrUOapG4zLtAaM04DoDQ&zoom=1&iact=hc&vpx=867&vpy=196&dur
=777&hovh=185&hovw=272&tx=137&ty=88&sig=109059784839555650694&sqi=2&page=1&tbnh=14
7&tbnw=201&start=0&ndsp=19&ved=1t:429,r:5,s:0,i:134
Sewage plant:
http://www.google.de/imgres?num=10&um=1&hl=de&client=firefox-
a&rls=org.mozilla:de:official&channel=np&biw=1366&bih=574&tbm=isch&tbnid=NL0hdaNzHbSqDM:&
imgrefurl=http://www.beilngries.de/index.php%3Fcontent_id%3D101&docid=lYobGHcxw3Y71M&imgu
rl=http://www.beilngries.de/timm_images/kommunales/klaeranlage.jpg&w=500&h=375&ei=IsyrUPGLJ
9DgtQbr4YGoAw&zoom=1&iact=hc&vpx=398&vpy=240&dur=782&hovh=194&hovw=259&tx=119&ty=
83&sig=109059784839555650694&sqi=2&page=1&tbnh=139&tbnw=198&start=0&ndsp=17&ved=1t:4
29,r:7,s:0,i:153
Tractor:
http://www.google.de/imgres?um=1&hl=de&client=firefox-
a&rls=org.mozilla:de:official&channel=np&biw=1366&bih=574&tbm=isch&tbnid=nkLDSR9MwdiCnM:&i
mgrefurl=http://www.schuette-
wulkotte.de/allcontent.php&docid=5d0NVvnv_XntHM&imgurl=http://www.schuette-
wulkotte.de/images/22CIMG0119_Guellefass1.jpg&w=410&h=308&ei=4cyrUKa0D8TZtAbbmIHYDg&z
oom=1&iact=hc&vpx=315&vpy=159&dur=434&hovh=140&hovw=193&tx=127&ty=91&sig=109059784
839555650694&page=1&tbnh=138&tbnw=190&start=0&ndsp=18&ved=1t:429,r:1,s:0,i:69
Village:
http://www.google.de/imgres?um=1&hl=de&client=firefox-
a&rls=org.mozilla:de:official&channel=np&biw=1366&bih=574&tbm=isch&tbnid=a-
w6XfJWYSXDwM:&imgrefurl=http://www.zum.de/Faecher/G/BW/Landeskunde/rhein/staedte/kl2/wimpf
en/stadt1.htm&docid=Brs_rAe3m0ek5M&imgurl=http://www.zum.de/Faecher/G/BW/Landeskunde/rhei
n/staedte/kl2/wimpfen/stadt1.jpg&w=435&h=326&ei=p86rUIjzNonxsgbY94CwAg&zoom=1&iact=hc&v
px=537&vpy=109&dur=4596&hovh=194&hovw=259&tx=136&ty=131&sig=109059784839555650694&
page=1&tbnh=147&tbnw=201&start=0&ndsp=18&ved=1t:429,r:14,s:0,i:174
Lebenslauf
176
PERSÖNLICHE DATEN Name
Geburtsdatum
Geburtsort
Familienstand
Miriam Tewes
25.02.1981
Duisburg
ledig
STUDIUM, AUSBILDUNG Promotion
Seit 01/2009 – 03/2013
Promotion zum Dr. rer. nat.
Wissenschaftliche Mitarbeiterin der Universität Duisburg – Essen,
Campus Essen, Biofilm Centre – Aquatische Mikrobiologie,
Thema: “Association of hygienically relevant bacteria with
freshwater plankton” , von der Deutschen
Forschungsgemeinschaft (DFG) gefördertes Projekt
Akademische Ausbildung
12/2008
03/2008 – 09/2008
10/2006 – 12/2008
10/2006
02/2006 – 06/2006
Erlangung des akademischen Grades „Master of Science“
Masterarbeit: Universität Duisburg-Essen, Campus Duisburg, Biofilm
Centre – Aquatische Mikrobiolgie
Thema: “Analysis of genetic variability of aquatic Legionella
isolates by pulsed-field gel electrophoresis”
Universität Duisburg-Essen, Fakultät Chemie
Master-Studium: Water Science
Erlangung des akademischen Grades „Bachelor of Science“
Bachelorarbeit: IWW Rheinisch-Westfälisches Institut für
Wasserforschung gemeinnützige GmbH Mülheim a. d. Ruhr
Abteilung Angewandte Mikrobiologie
Thema: „Nachweis der Schädigung von Biofilmbakterien durch
eine oxidative Desinfektion mit Chlor durch den Einsatz des
Fluoreszenzfarbstoffes SYBR® green II“
10/2003 – 10/2006
Berufsausbildung
08/2000 – 07/2003
Universität Duisburg-Essen, Fakultät Chemie
Bachelor-Studium: Wasser: Chemie, Analytik, Mikrobiologie
Friedrich-Albert-Lange Berufskolleg Duisburg-Mitte
Ausbildung zur Umweltschutztechnischen Assistentin
Abschluss: Staatlich geprüfte Umweltschutztechnische Assistentin
und Fachhochschulreife
Lebenslauf
177
Schulbildung
1991 - 2000
Max-Planck-Gymnasium, Duisburg, Fachoberschulreife
PRAXISERFAHRUNG
01/2009 – 03/2013
10/2010
05/2011
Wissenschaftliche Mitarbeiterin,
Universität Duisburg – Essen, Campus Essen, Biofilm Centre
Universität Stellenbosch/Südafrika
Department of Microbiology; Prof. Dr. T. E. Cloete
Polymerase chain reaction (PCR), Northern blot, Southern blot
Universität Konstanz
Limnologie, Mikrobielle Ökologie; Prof. Dr. B. Schink
und
Limnologisches Institut; Dr. D. Martin-Creuzburg
Kultivierung von Algen (Scenedesmus obliquus) und Daphnien (Daphnia
magna)
Co-Kultivierung von Daphnien mit pathogenen Mikroorganismen
Wissenschaftliche
Hilfskraft
10/2008 - 12/2008
10/2007 - 12/2007
Universität Duisburg-Essen, Campus Duisburg,
Biofilm Centre - Aquatische Mikrobiologie
Mitarbeit im vom Bundesministerium für Bildung und
Forschung (BMBF) geförderten Projekt: “Integration of
hygienically relevant bacteria in drinking water biofilms grown
on domestic plumbing materials”
Universität Duisburg-Essen, Campus Duisburg
Biofilm Centre - Aquatische Mikrobiologie
Isolierung und Quantifizierung von pathogenen
Mikroorganismen aus Trinkwasserbiofilmen
Studentische Hilfskraft
08/2006 - 12/2006
IWW Rheinisch-Westfälisches Institut für Wasserforschung
gemeinnützige GmbH Mülheim a. d. Ruhr
Abteilung Angewandte Mikrobiolgie
Quantifizierung von Bakterien mittels kultureller Verfahren
Durchführung von Hygienemaßnahmen im Rahmen der
Qualitätssicherung

Lebenslauf
178
Praktikum
08/2002 - 09/2002
Praktikum
08/2001 – 09/2001
IWW Rheinisch-Westfälisches Institut für Wasserforschung
gemeinnützige GmbH Mülheim a. d. Ruhr
Abteilung: Anorganische Chemie
Bestimmung von Metallen mittels ICP-MS
Bestimmung von anionischen Tensiden durch flüssig-flüssig
Extraktion und photometrischer Quantifizierung
Bestimmung von Bromat und Chlorat mittels
Ionenchromatographie
Landesumweltamt Nordrhein-Westfalen, Düsseldorf
Dezernat für Abfall- und Altlastenuntersuchungen
Untersuchungen zum Mobilitätsverhalten von Schwermetallen
und Anionen an Kompostmaterialien
Feststoffprobenvorbereitung und Eluatgewinnung nach DIN
38414 Teil 4
Related Documents


