Citation: Drenowatz, C.; Chen, S.-T.; Cocca, A.; Ferrari, G.; Ruedl, G.; Greier, K. Association of Body Weight and Physical Fitness during the Elementary School Years. Int. J. Environ. Res. Public Health 2022, 19, 3441. https://doi.org/10.3390/ ijerph19063441 Academic Editor: Paul B. Tchounwou Received: 14 February 2022 Accepted: 11 March 2022 Published: 15 March 2022 Publisher’s Note: MDPI stays neutral with regard to jurisdictional claims in published maps and institutional affil- iations. Copyright: © 2022 by the authors. Licensee MDPI, Basel, Switzerland. This article is an open access article distributed under the terms and conditions of the Creative Commons Attribution (CC BY) license (https:// creativecommons.org/licenses/by/ 4.0/). International Journal of Environmental Research and Public Health Article Association of Body Weight and Physical Fitness during the Elementary School Years Clemens Drenowatz 1, * , Si-Tong Chen 2 , Armando Cocca 3 , Gerson Ferrari 4 , Gerhard Ruedl 3 and Klaus Greier 3,5 1 Division of Sport, Physical Activity and Health, University of Education Upper Austria, 4020 Linz, Austria 2 Institute for Health and Sport, Victoria University, Melbourne 8001, Australia; [email protected] 3 Department of Sport Science, University of Innsbruck, 6020 Innbruck, Austria; [email protected] (A.C.); [email protected] (G.R.); [email protected] (K.G.) 4 Escuela de Ciencias de la Actividad Física, El Deporte y la Salud, Universidad de Santiago de Chile (USACH), Santiago 7500618, Chile; [email protected] 5 Division of Physical Education and Sports, University of Education Stams—KPH-ES, 6422 Stams, Austria * Correspondence: [email protected]; Tel.: +43-732-7470-7426 Abstract: Physical fitness and body weight are key correlates of health. Nevertheless, an increasing number of children display poor physical fitness and high body weight. The aim of this study was to examine the prospective association of physical fitness with body weight throughout the elementary school years with a special emphasis on children with high body weight or poor physical fitness at baseline. A total of 303 Austrian children (55.1% male) completed the German motor test up to eight times over a 4-year time span (between the ages 6 and 10 years). Physical fitness did not differ across quartiles of body weight at baseline. A more pronounced weight gain, however, was associated with an impaired development of physical fitness and this association was more pronounced in children with higher baseline body weight. In addition, the detrimental effects of an impaired development of physical fitness on subsequent body weight were more pronounced in children with higher baseline body weight. No differences in the longitudinal association between body weight and physical fitness, on the other hand, were observed across quartiles of baseline fitness. These results emphasize the importance of the promotion of physical fitness, particularly in children with increased body weight, to ensure future health. Keywords: overweight; obesity; youth; cardiorespiratory fitness; muscular strength; BMI percentile; motor competence 1. Introduction Excess body weight is one of the major health risks in modern society due to the association with various non-communicable diseases [1,2]. Overweight/obesity during childhood is associated with cardiovascular dysfunction and asthma [3–5], in addition to psychological problems including lower self-esteem, underachievement in school, and overall quality of life [6]. Children with excess body weight are also at increased risk to become overweight/obese adults [7] and, even in the absence of overweight/obesity during adulthood, children with excess body weight have an increased risk for cardiovascular disease later in life [8]. Physical fitness, which consists of cardiorespiratory endurance, muscular strength, and endurance, in addition to flexibility and body composition, is also a critical marker of health [9]. Various components of physical fitness have been associated with beneficial effects on cardiovascular and metabolic disease risk, bone health, and psychological and cognitive outcomes, which contribute to an enhanced quality of life [9–13]. As physical fitness is defined as a person’s ability to perform daily tasks without undue fatigue and adequate energy to enjoy leisure-time pursuits [14], it should also be considered a critical Int. J. Environ. Res. Public Health 2022, 19, 3441. https://doi.org/10.3390/ijerph19063441 https://www.mdpi.com/journal/ijerph

Welcome message from author
This document is posted to help you gain knowledge. Please leave a comment to let me know what you think about it! Share it to your friends and learn new things together.
Transcript
�����������������
Citation: Drenowatz, C.; Chen, S.-T.;
Cocca, A.; Ferrari, G.; Ruedl, G.;
Greier, K. Association of Body Weight
and Physical Fitness during the
Elementary School Years. Int. J.
Environ. Res. Public Health 2022, 19,
3441. https://doi.org/10.3390/
ijerph19063441
Academic Editor: Paul B.
Tchounwou
Received: 14 February 2022
Accepted: 11 March 2022
Published: 15 March 2022
Publisher’s Note: MDPI stays neutral
with regard to jurisdictional claims in
published maps and institutional affil-
iations.
Copyright: © 2022 by the authors.
Licensee MDPI, Basel, Switzerland.
This article is an open access article
distributed under the terms and
conditions of the Creative Commons
Attribution (CC BY) license (https://
creativecommons.org/licenses/by/
4.0/).
International Journal of
Environmental Research
and Public Health
Article
Association of Body Weight and Physical Fitness during theElementary School YearsClemens Drenowatz 1,* , Si-Tong Chen 2 , Armando Cocca 3 , Gerson Ferrari 4 ,Gerhard Ruedl 3 and Klaus Greier 3,5
1 Division of Sport, Physical Activity and Health, University of Education Upper Austria, 4020 Linz, Austria2 Institute for Health and Sport, Victoria University, Melbourne 8001, Australia; [email protected] Department of Sport Science, University of Innsbruck, 6020 Innbruck, Austria;
[email protected] (A.C.); [email protected] (G.R.); [email protected] (K.G.)4 Escuela de Ciencias de la Actividad Física, El Deporte y la Salud, Universidad de Santiago de Chile (USACH),
Santiago 7500618, Chile; [email protected] Division of Physical Education and Sports, University of Education Stams—KPH-ES, 6422 Stams, Austria* Correspondence: [email protected]; Tel.: +43-732-7470-7426
Abstract: Physical fitness and body weight are key correlates of health. Nevertheless, an increasingnumber of children display poor physical fitness and high body weight. The aim of this study was toexamine the prospective association of physical fitness with body weight throughout the elementaryschool years with a special emphasis on children with high body weight or poor physical fitness atbaseline. A total of 303 Austrian children (55.1% male) completed the German motor test up to eighttimes over a 4-year time span (between the ages 6 and 10 years). Physical fitness did not differ acrossquartiles of body weight at baseline. A more pronounced weight gain, however, was associated withan impaired development of physical fitness and this association was more pronounced in childrenwith higher baseline body weight. In addition, the detrimental effects of an impaired development ofphysical fitness on subsequent body weight were more pronounced in children with higher baselinebody weight. No differences in the longitudinal association between body weight and physicalfitness, on the other hand, were observed across quartiles of baseline fitness. These results emphasizethe importance of the promotion of physical fitness, particularly in children with increased bodyweight, to ensure future health.
Keywords: overweight; obesity; youth; cardiorespiratory fitness; muscular strength; BMI percentile;motor competence
1. Introduction
Excess body weight is one of the major health risks in modern society due to theassociation with various non-communicable diseases [1,2]. Overweight/obesity duringchildhood is associated with cardiovascular dysfunction and asthma [3–5], in additionto psychological problems including lower self-esteem, underachievement in school, andoverall quality of life [6]. Children with excess body weight are also at increased risk tobecome overweight/obese adults [7] and, even in the absence of overweight/obesity duringadulthood, children with excess body weight have an increased risk for cardiovasculardisease later in life [8].
Physical fitness, which consists of cardiorespiratory endurance, muscular strength,and endurance, in addition to flexibility and body composition, is also a critical markerof health [9]. Various components of physical fitness have been associated with beneficialeffects on cardiovascular and metabolic disease risk, bone health, and psychological andcognitive outcomes, which contribute to an enhanced quality of life [9–13]. As physicalfitness is defined as a person’s ability to perform daily tasks without undue fatigue andadequate energy to enjoy leisure-time pursuits [14], it should also be considered a critical
Int. J. Environ. Res. Public Health 2022, 19, 3441. https://doi.org/10.3390/ijerph19063441 https://www.mdpi.com/journal/ijerph
Int. J. Environ. Res. Public Health 2022, 19, 3441 2 of 12
aspect in the promotion of an active lifestyle. The beneficial associations of physical fitnesswith various health parameters, however, are independent of physical activity [15], andchildren with a better physical fitness have a lower risk for metabolic and cardiovasculardisease in adulthood independent of confounding factors [9,16]. Given these long-termeffects, both physical fitness and body weight have been recognized as predictors ofmorbidity and mortality [9,10,17,18].
There is also extensive evidence on an inverse association between physical fitnessand body weight [19–22], in addition to the independent association of these entities withseveral health outcomes. Longitudinal studies further showed that current body weightaffects the development of physical fitness [23–25] and that poor physical fitness increasesthe risk for excess weight gain [23,26]. Despite considerable efforts to control excessweight gain and promote physical fitness in youth, overweight/obesity rates in childrenremain high and physical fitness levels have declined over the last several decades [27–29].These trends are further associated with low motor competence in children, which iscritical for the promotion of physical activity that, in turn, enhances physical fitness andfacilitates weight management [30]. Given the long-term health implications, such adevelopment not only affects the individual but also puts a substantial burden on the healthcare system [31–33]. Accordingly, additional actions are required to prevent the potentialadverse health outcomes associated with poor physical fitness and high body weight.Recent efforts addressing low physical fitness and high body weight in children, however,have achieved limited success and it appears that a more targeted approach is warranted.This also requires a better understanding of the reciprocal association between physicalfitness and body weight. The present study, therefore, examined potential differences inthe cross-sectional and longitudinal association between these two entities across differentlevels of physical fitness and body weight in Austrian elementary school children. Giventhe potentially greater deficiencies in functional capacity and future health risks, a specialfocus was given to participants with low initial fitness and those with high body weight.
2. Materials and Methods
The study was conducted in the largest county of the federal state of Tyrol, Austria. Ofthe total 71 elementary schools in the county, 15 schools were selected via a random numbergenerator and received information about the study. One school declined to participatedue to organizational problems. The final sample, therefore, consisted of 14 schools thatparticipated in data collection throughout the 4-year observation period. In order to trackparticipants throughout their entire elementary school time, only students who were infirst grade at baseline were eligible for participation. In addition, participants needed tobe able to complete a physical fitness test battery, and children with mental, neurological,or physical diagnoses were excluded from the study. This resulted in a sample size of392 children (55.4% male; age: 6.9 ± 0.5 years). The study protocol was approved by theInstitutional Review Board of the University of Innsbruck (certificate of good standing,16/2014), the school authorities of the federal state of Tyrol, and the school board ofeach participating school. Written parental consent was obtained prior to baseline datacollection and children provided oral assent at the time of data collection. All studyprocedures were in accordance with the ethical standards of the Declaration of Helsinki (asamended in 2013).
Participants completed anthropometric measurements and physical fitness tests duringeach fall and spring semester over their four years in elementary school, which resultedin up to eight measurements throughout the entire observation period. Baseline datacollection occurred during the school entry evaluation in October 2014 and the final follow-up measurements were completed in June 2018 when children were in their final grade(fourth grade) of elementary school. In order to be included in the analysis, participantsneeded to provide valid and complete data for at least five measurements, including atbaseline and the last follow-up assessment.
Int. J. Environ. Res. Public Health 2022, 19, 3441 3 of 12
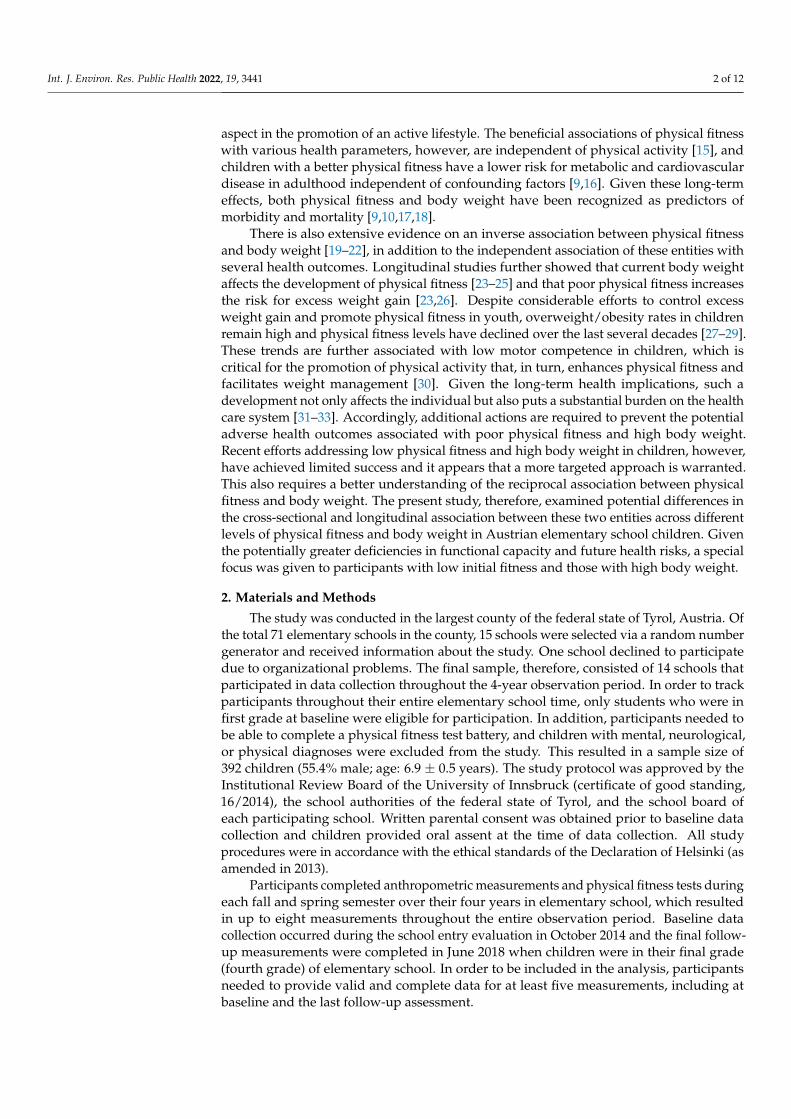
Data collection occurred in the participating school’s gymnasium during regular classtime in a single session. Anthropometric measurements and fitness tests were adminis-tered by exercise science graduate students, who were well trained in conducting thesemeasurements in a pediatric population during the course of a research seminar prior todata collection. A total of 14 students were involved in the measurements throughout the4-year study period, with 6 to 7 students present during each measurement session in theschools. An overview of the procedures for each testing session is provided in Figure 1.
Int. J. Environ. Res. Public Health 2022, 19, x FOR PEER REVIEW 3 of 12
Data collection occurred in the participating school’s gymnasium during regular
class time in a single session. Anthropometric measurements and fitness tests were
administered by exercise science graduate students, who were well trained in conducting
these measurements in a pediatric population during the course of a research seminar
prior to data collection. A total of 14 students were involved in the measurements
throughout the 4‐year study period, with 6 to 7 students present during each
measurement session in the schools. An overview of the procedures for each testing
session is provided in Figure 1.
Figure 1. Data collection procedure at each measurement time.
Body height (cm) was measured with a portable stadiometer (SECA® 217, Hamburg,
Germany) and weight (kg) was measured with a calibrated digital scale (SECA® 803,
Hamburg, Germany) to the nearest 0.1 cm and 0.1 kg, respectively, with children wearing
gym clothes and barefoot. Body mass index (BMI) was calculated (kg/m2) and converted
to BMI percentiles (BMIPCT) using German reference values [34]. Children with a
BMIPCT above the 90th percentile were classified as overweight/obese. For the statistical
analyses, quartiles of baseline BMI percentiles were established (Quartile 1: BMIPCT <
29.0; Quartile 2: 29 ≤ BMIPCT < 50.2; Quartile 3: 50.2 ≤ BMIPCT < 76; Quartile 4: BMIPCT
> 76.0).
Upon the completion of anthropometric measurements, participants completed the
German Motor Test (DMT6‐18) [35], which has been shown to provide valid and reliable
information on physical fitness in children and adolescents [35,36]. The DMT6‐18 consists
of eight test items that assess cardiorespiratory endurance, muscular endurance, muscular
strength, power, speed and agility, and balance and flexibility. Specifically, participants
performed a 6 min run, sit ups, push ups, a standing long jump, a 20 m sprint, 20 s
sideways jumping, backwards balancing, and a stand and reach test, with practice trials
and measured attempts as specified in the test manual. Fitness tests were administered in
random order after a standardized 5 min warm up, except for the 20 m sprint, which was
completed at the beginning, and the 6 min run, which was completed at the end of the test
session. In addition to raw performance values, the DMT6‐18 provides sex‐ and age‐
standardized scores. The average of these scores is used as an indicator for overall
physical fitness, with a value of 100 indicating average physical fitness for the respective
age and sex; higher scores indicate above average physical fitness and lower scores
indicate below average physical fitness [35]. As shown for baseline BMIPCT, quartiles for
baseline physical fitness were established based on overall physical fitness scores
(Quartile 1: overall physical fitness < 100; Quartile 2: 100 ≤ overall physical fitness < 105;
Quartile 3: 105 ≤ overall physical fitness < 108; Quartile 4: overall physical fitness ≥ 108).
Statistical Analysis. Normal distribution of the data was confirmed prior to statistical
analyses. Cross‐sectional associations between BMIPCT and components of physical
fitness were examined via Pearson correlation analysis. Linear mixed models (LMMs)
were used to determine change in BMIPCT and overall physical fitness throughout the
observation period in order to account for different time intervals between measurement
periods. Subsequently, ANOVA was used to examine differences in the development of
BMIPCT and physical fitness across quartiles of baseline BMIPCT and baseline physical
Figure 1. Data collection procedure at each measurement time.
Body height (cm) was measured with a portable stadiometer (SECA® 217, Hamburg,Germany) and weight (kg) was measured with a calibrated digital scale (SECA® 803, Ham-burg, Germany) to the nearest 0.1 cm and 0.1 kg, respectively, with children wearing gymclothes and barefoot. Body mass index (BMI) was calculated (kg/m2) and converted to BMIpercentiles (BMIPCT) using German reference values [34]. Children with a BMIPCT abovethe 90th percentile were classified as overweight/obese. For the statistical analyses, quar-tiles of baseline BMI percentiles were established (Quartile 1: BMIPCT < 29.0; Quartile 2:29 ≤ BMIPCT < 50.2; Quartile 3: 50.2 ≤ BMIPCT < 76; Quartile 4: BMIPCT > 76.0).
Upon the completion of anthropometric measurements, participants completed theGerman Motor Test (DMT6-18) [35], which has been shown to provide valid and reliableinformation on physical fitness in children and adolescents [35,36]. The DMT6-18 consistsof eight test items that assess cardiorespiratory endurance, muscular endurance, muscularstrength, power, speed and agility, and balance and flexibility. Specifically, participantsperformed a 6 min run, sit ups, push ups, a standing long jump, a 20 m sprint, 20 ssideways jumping, backwards balancing, and a stand and reach test, with practice trialsand measured attempts as specified in the test manual. Fitness tests were administeredin random order after a standardized 5 min warm up, except for the 20 m sprint, whichwas completed at the beginning, and the 6 min run, which was completed at the endof the test session. In addition to raw performance values, the DMT6-18 provides sex-and age-standardized scores. The average of these scores is used as an indicator foroverall physical fitness, with a value of 100 indicating average physical fitness for therespective age and sex; higher scores indicate above average physical fitness and lowerscores indicate below average physical fitness [35]. As shown for baseline BMIPCT, quartilesfor baseline physical fitness were established based on overall physical fitness scores(Quartile 1: overall physical fitness < 100; Quartile 2: 100 ≤ overall physical fitness < 105;Quartile 3: 105 ≤ overall physical fitness < 108; Quartile 4: overall physical fitness ≥ 108).
Statistical Analysis. Normal distribution of the data was confirmed prior to statisticalanalyses. Cross-sectional associations between BMIPCT and components of physical fitnesswere examined via Pearson correlation analysis. Linear mixed models (LMMs) were usedto determine change in BMIPCT and overall physical fitness throughout the observationperiod in order to account for different time intervals between measurement periods.Subsequently, ANOVA was used to examine differences in the development of BMIPCTand physical fitness across quartiles of baseline BMIPCT and baseline physical fitness,respectively. Additionally, quantile regression analyses were performed to determine theeffect of change in physical fitness and BMIPCT on physical fitness and BMIPCT at follow-up, respectively, across baseline quartiles of BMIPCT and baseline quartiles of physicalfitness. In addition to change in BMIPCT or physical fitness (based on LMM), baseline
Int. J. Environ. Res. Public Health 2022, 19, 3441 4 of 12
BMIPCT and physical fitness were included in the regression models. Secondary analysesincluded sex as a co-variate to examine potential sex-specific associations. All statisticaltests were performed in SPSS V26.0 software (SPSS Inc., IBM Corp., Armonk, NY, USA)with the significance level set at α < 0.05.
3. Results
Of the 392 eligible participants 303 children between 6 and 8 years of age at baseline(55.1% male; 9.3% overweight/obese) provided valid measurements for at least five timepoints, including baseline and the last follow-up measurement. There were no differencesin sex distribution and anthropometric characteristics at baseline between children includedin the analyses and those excluded due to missing follow-up data. Children with sufficientfollow-up measurements, however, displayed better overall physical fitness at baselinecompared to those excluded (104.2 ± 5.9 vs. 100.9 ± 6.5, p < 0.01).
Descriptive characteristics of participants included in the analyses are shown in Table 1.Boys were taller and heavier compared to girls but there was no difference in BMIPCT.Accordingly, there was also no difference in weight status and sex distribution did not differacross quartiles of BMIPCT. There was also no sex difference in overall physical fitness andsex distribution across quartiles of physical fitness. Absolute performance for the 6 minrun, sit ups, standing long jump and 20 m sprint, however, was better in boys, whereasbalance and flexibility was better in girls (p < 0.05).
Table 1. Descriptive characteristics at baseline for the total sample and separately for boys and girls.Values are Mean ± SD.
Total Sample(n = 303)
Girls(n = 135)
Boys(n = 166)
Age (years) 6.9 ± 0.5 6.9 ± 0.5 6.9 ± 0.5Height (cm) ** 122.4 ± 5.7 121.2 ± 5.3 123.4 ± 5.9Weight (kg) * 24.3 ± 4.4 23.6 ± 4.2 24.8 ± 4.5BMI percentile 51.8 ± 27.3 50.2 ± 26.4 53.0 ± 28.16 min run (m) ** 854 ± 140 823 ± 130 879 ± 143Sit ups (# in 40 s) ** 15.1 ± 5.6 14.0 + 6.0 16.0 ± 5.2Push ups (# in 40 s) 11.6 ± 3.7 11.5 ± 3.7 11.7 ± 3.6Long jump (cm) ** 113.5 ± 17.9 106.2 ± 15.8 119.4 ± 17.320 m sprint (s) ** 4.8 ± 0.5 5.0 ± 0.6 4.6 + 0.4Side jumps (# in 15 s) 23.0 ± 5.8 22.3 ± 5.6 23.5 ± 5.9Balance (steps) * 26.7 ± 9.8 28.0 ± 10.2 25.7 ± 9.5Stand and reach (cm) 1,** 0.8 ± 5.6 1.9 ± 5.2 −0.1 ± 5.7Overall fitness score (Z) 104.2 ± 5.9 103.5 ± 6.2 104.7 ± 5.6
1 positive values indicate reaching beyond the toes, while negative values indicate not reaching toes. * sig. sexdifference (p < 0.05); ** sig. sex difference (p < 0.01).
Pearson correlation analyses did not show significant cross-sectional correlations be-tween BMIPCT and components of physical fitness at baseline, except for a low inverseassociation between BMIPCT and 6 min run performance (Table 2). Nevertheless, theprevalence of overweight/obesity differed significantly across fitness quartiles (Q1: 4.0%,Q2: 3.0%, Q3: 1.7%, Q4: 0.7%; p = 0.02). However, during the last follow-up assessment,when children were 10.4 ± 0.5 years of age, significant cross-sectional associations wereobserved between BMIPCT and all components of physical fitness, except for flexibility.Accordingly, overall physical fitness was negatively associated with BMIPCT (r= −0.43,p < 0.01) when participants were in fourth grade, whereas there was no significant correla-tion between overall physical fitness and BMIPCT in children when they were in first grade.In addition, low significant negative correlations between weight change and change invarious components of physical fitness were observed, which also resulted in a negativeassociation of weight change with change in overall physical fitness during the elementaryschool years (r = −0.25, p < 0.01).
Int. J. Environ. Res. Public Health 2022, 19, 3441 5 of 12
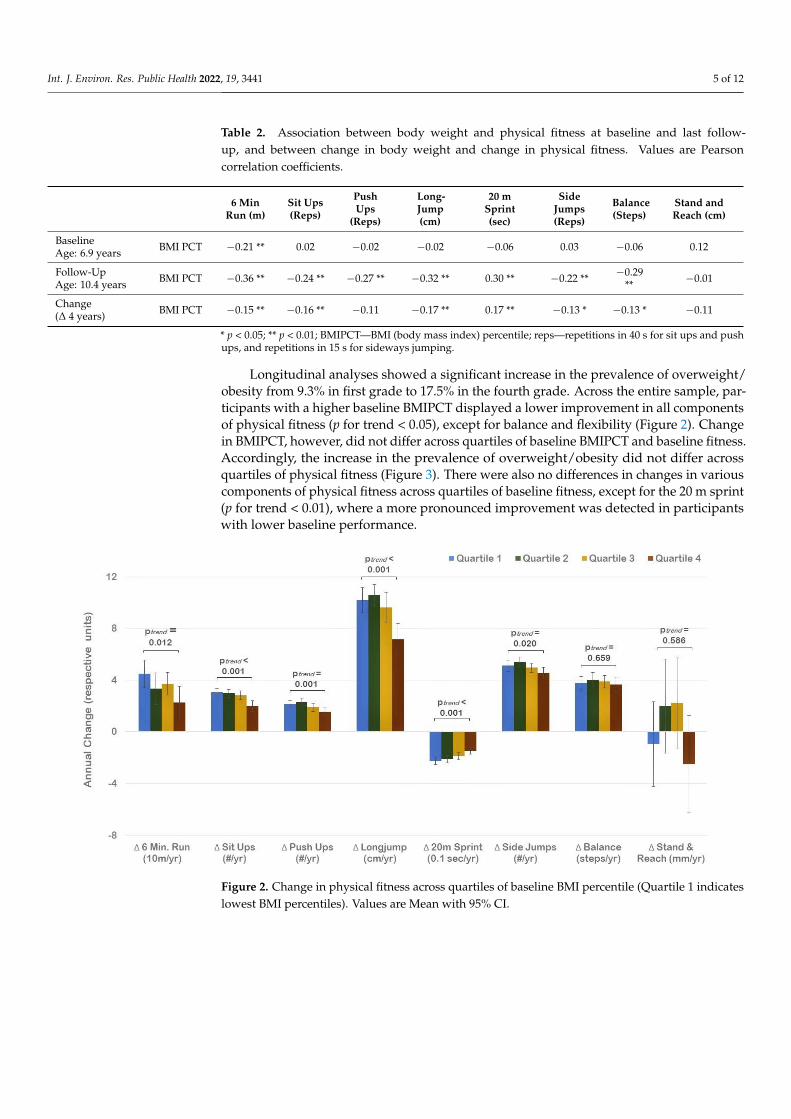
Table 2. Association between body weight and physical fitness at baseline and last follow-up, and between change in body weight and change in physical fitness. Values are Pearsoncorrelation coefficients.
6 MinRun (m)
Sit Ups(Reps)
PushUps
(Reps)
Long-Jump(cm)
20 mSprint(sec)
SideJumps(Reps)
Balance(Steps)
Stand andReach (cm)
BaselineAge: 6.9 years BMI PCT −0.21 ** 0.02 −0.02 −0.02 −0.06 0.03 −0.06 0.12
Follow-UpAge: 10.4 years BMI PCT −0.36 ** −0.24 ** −0.27 ** −0.32 ** 0.30 ** −0.22 ** −0.29
** −0.01
Change(∆ 4 years) BMI PCT −0.15 ** −0.16 ** −0.11 −0.17 ** 0.17 ** −0.13 * −0.13 * −0.11
* p < 0.05; ** p < 0.01; BMIPCT—BMI (body mass index) percentile; reps—repetitions in 40 s for sit ups and pushups, and repetitions in 15 s for sideways jumping.
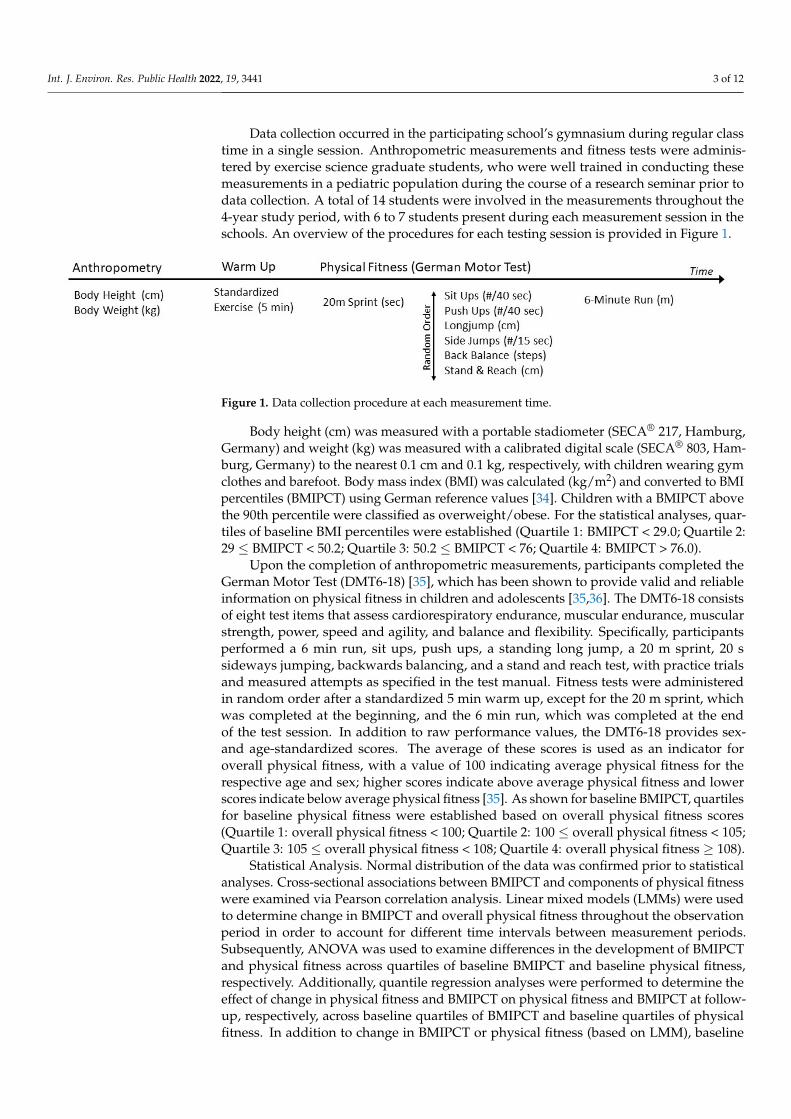
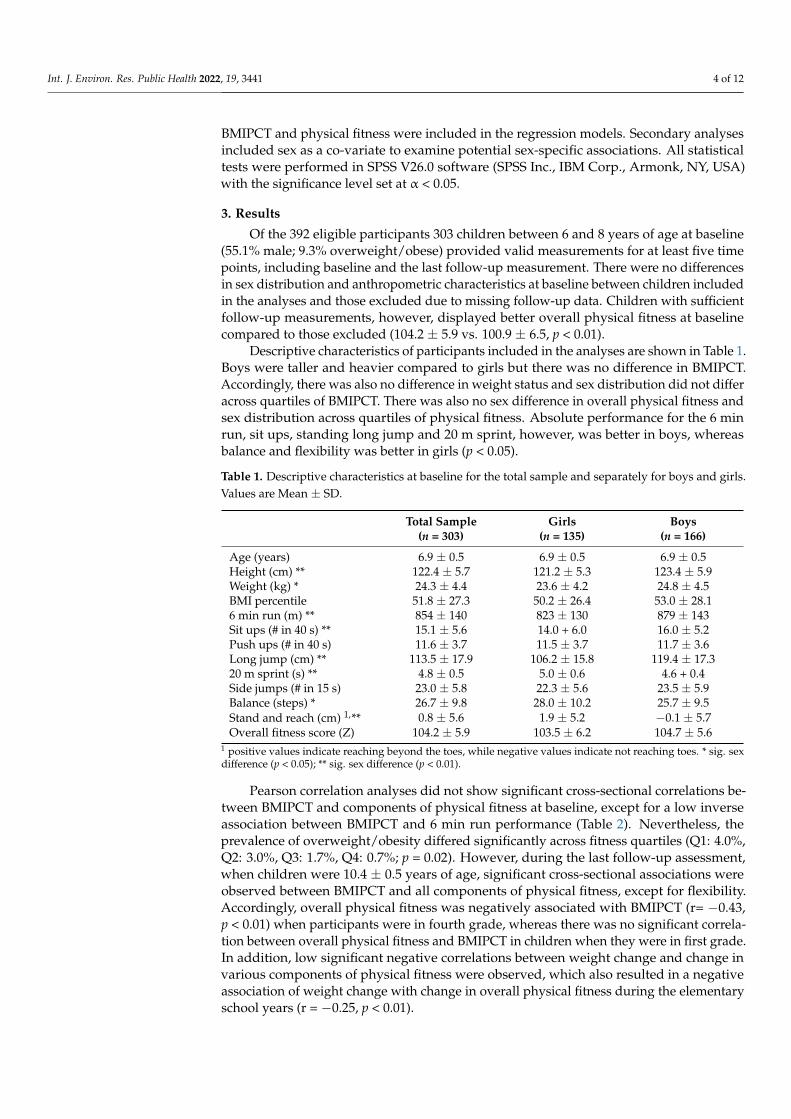
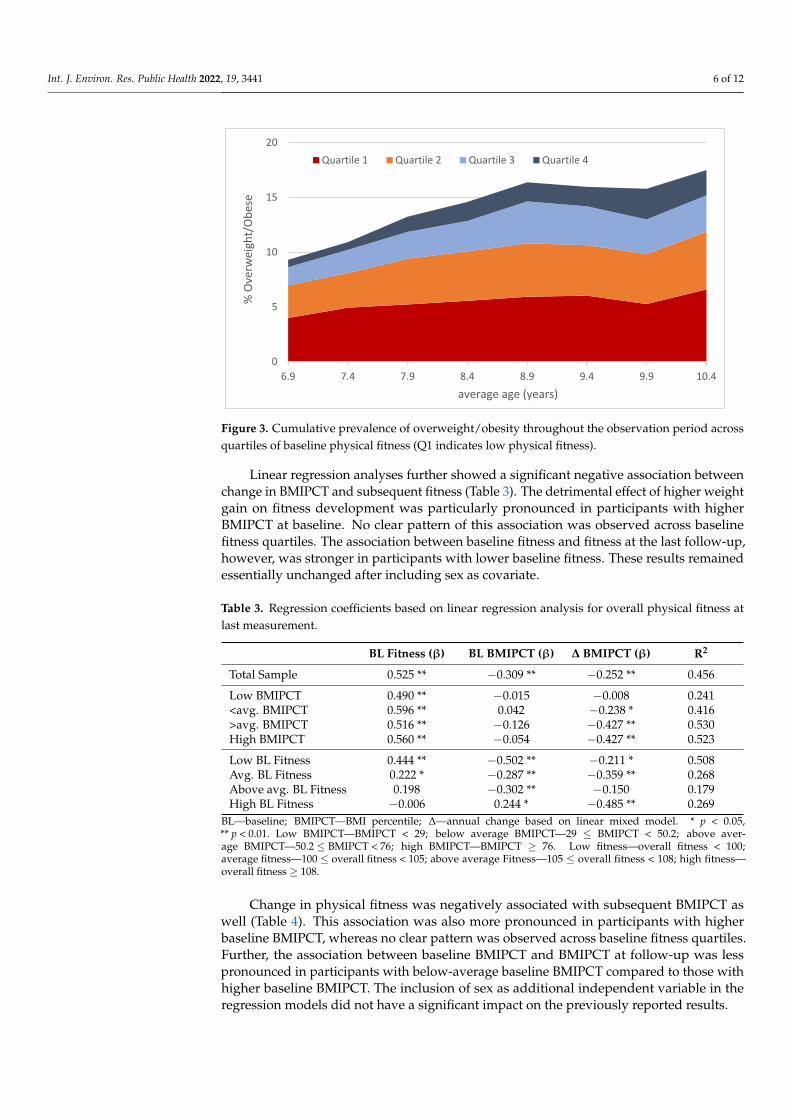
Longitudinal analyses showed a significant increase in the prevalence of overweight/obesity from 9.3% in first grade to 17.5% in the fourth grade. Across the entire sample, par-ticipants with a higher baseline BMIPCT displayed a lower improvement in all componentsof physical fitness (p for trend < 0.05), except for balance and flexibility (Figure 2). Changein BMIPCT, however, did not differ across quartiles of baseline BMIPCT and baseline fitness.Accordingly, the increase in the prevalence of overweight/obesity did not differ acrossquartiles of physical fitness (Figure 3). There were also no differences in changes in variouscomponents of physical fitness across quartiles of baseline fitness, except for the 20 m sprint(p for trend < 0.01), where a more pronounced improvement was detected in participantswith lower baseline performance.
Int. J. Environ. Res. Public Health 2022, 19, x FOR PEER REVIEW 5 of 12
< 0.01) when participants were in fourth grade, whereas there was no significant
correlation between overall physical fitness and BMIPCT in children when they were in
first grade. In addition, low significant negative correlations between weight change and
change in various components of physical fitness were observed, which also resulted in a
negative association of weight change with change in overall physical fitness during the
elementary school years (r= −0.25, p < 0.01).
Table 2. Association between body weight and physical fitness at baseline and last follow‐up, and
between change in body weight and change in physical fitness. Values are Pearson correlation
coefficients.
6 Min
Run (m)
Sit Ups
(Reps)
Push Ups
(Reps)
Long‐
jump (cm)
20 m
Sprint
(sec)
Side
Jumps
(Reps)
Balance
(Steps)
Stand and
Reach (cm)
Baseline
Age: 6.9 years BMI PCT −0.21 ** 0.02 −0.02 −0.02 −0.06 0.03 −0.06 0.12
Follow‐Up
Age: 10.4 years BMI PCT −0.36 ** −0.24 ** −0.27 ** −0.32 ** 0.30 ** −0.22** −0.29 ** −0.01
Change
(Δ 4 years) BMI PCT −0.15 ** −0.16 ** −0.11 −0.17 ** 0.17 ** −0.13 * −0.13 * −0.11
* p < 0.05; ** p < 0.01; BMIPCT—BMI (body mass index) percentile; reps—repetitions in 40 s for sit
ups and push ups, and repetitions in 15 s for sideways jumping.
Longitudinal analyses showed a significant increase in the prevalence of
overweight/obesity from 9.3% in first grade to 17.5% in the fourth grade. Across the entire
sample, participants with a higher baseline BMIPCT displayed a lower improvement in
all components of physical fitness (p for trend < 0.05), except for balance and flexibility
(Figure 2). Change in BMIPCT, however, did not differ across quartiles of baseline
BMIPCT and baseline fitness. Accordingly, the increase in the prevalence of
overweight/obesity did not differ across quartiles of physical fitness (Figure 3). There were
also no differences in changes in various components of physical fitness across quartiles
of baseline fitness, except for the 20 m sprint (p for trend < 0.01), where a more pronounced
improvement was detected in participants with lower baseline performance.
Figure 2. Change in physical fitness across quartiles of baseline BMI percentile (Quartile 1 indicateslowest BMI percentiles). Values are Mean with 95% CI.
Int. J. Environ. Res. Public Health 2022, 19, 3441 6 of 12
Int. J. Environ. Res. Public Health 2022, 19, x FOR PEER REVIEW 6 of 12
Figure 2. Change in physical fitness across quartiles of baseline BMI percentile (Quartile 1 indicates
lowest BMI percentiles). Values are Mean with 95% CI.
Figure 3. Cumulative prevalence of overweight/obesity throughout the observation period across
quartiles of baseline physical fitness (Q1 indicates low physical fitness).
Linear regression analyses further showed a significant negative association between
change in BMIPCT and subsequent fitness (Table 3). The detrimental effect of higher
weight gain on fitness development was particularly pronounced in participants with
higher BMIPCT at baseline. No clear pattern of this association was observed across
baseline fitness quartiles. The association between baseline fitness and fitness at the last
follow‐up, however, was stronger in participants with lower baseline fitness. These results
remained essentially unchanged after including sex as covariate.
Table 3. Regression coefficients based on linear regression analysis for overall physical fitness at
last measurement.
BL Fitness (β) BL BMIPCT (β) Δ BMIPCT (β) R2
Total Sample 0.525 ** −0.309 ** −0.252 ** 0.456
Low BMIPCT 0.490 ** −0.015 −0.008 0.241
<avg. BMIPCT 0.596 ** 0.042 −0.238 * 0.416
>avg. BMIPCT 0.516 ** −0.126 −0.427 ** 0.530
High BMIPCT 0.560 ** −0.054 −0.427 ** 0.523
Low BL Fitness 0.444 ** −0.502 ** −0.211 * 0.508
Avg. BL Fitness 0.222 * −0.287 ** −0.359 ** 0.268
Above avg. BL Fitness 0.198 −0.302 ** −0.150 0.179
High BL Fitness −0.006 0.244 * −0.485 ** 0.269
BL—baseline; BMIPCT—BMI percentile; Δ—annual change based on linear mixed model. * p < 0.05,
** p < 0.01. Low BMIPCT—BMIPCT < 29; below average BMIPCT—29 ≤ BMIPCT < 50.2; above
average BMIPCT—50.2 ≤ BMIPCT < 76; high BMIPCT—BMIPCT ≥ 76. Low fitness—overall fitness
< 100; average fitness—100 ≤ overall fitness < 105; above average Fitness—105 ≤ overall fitness < 108;
high fitness—overall fitness ≥ 108.
Change in physical fitness was negatively associated with subsequent BMIPCT as
well (Table 4). This association was also more pronounced in participants with higher
baseline BMIPCT, whereas no clear pattern was observed across baseline fitness quartiles.
Further, the association between baseline BMIPCT and BMIPCT at follow‐up was less
0
5
10
15
20
6.9 7.4 7.9 8.4 8.9 9.4 9.9 10.4
% Overw
eigh
t/Obese
average age (years)
Quartile 1 Quartile 2 Quartile 3 Quartile 4
Figure 3. Cumulative prevalence of overweight/obesity throughout the observation period acrossquartiles of baseline physical fitness (Q1 indicates low physical fitness).
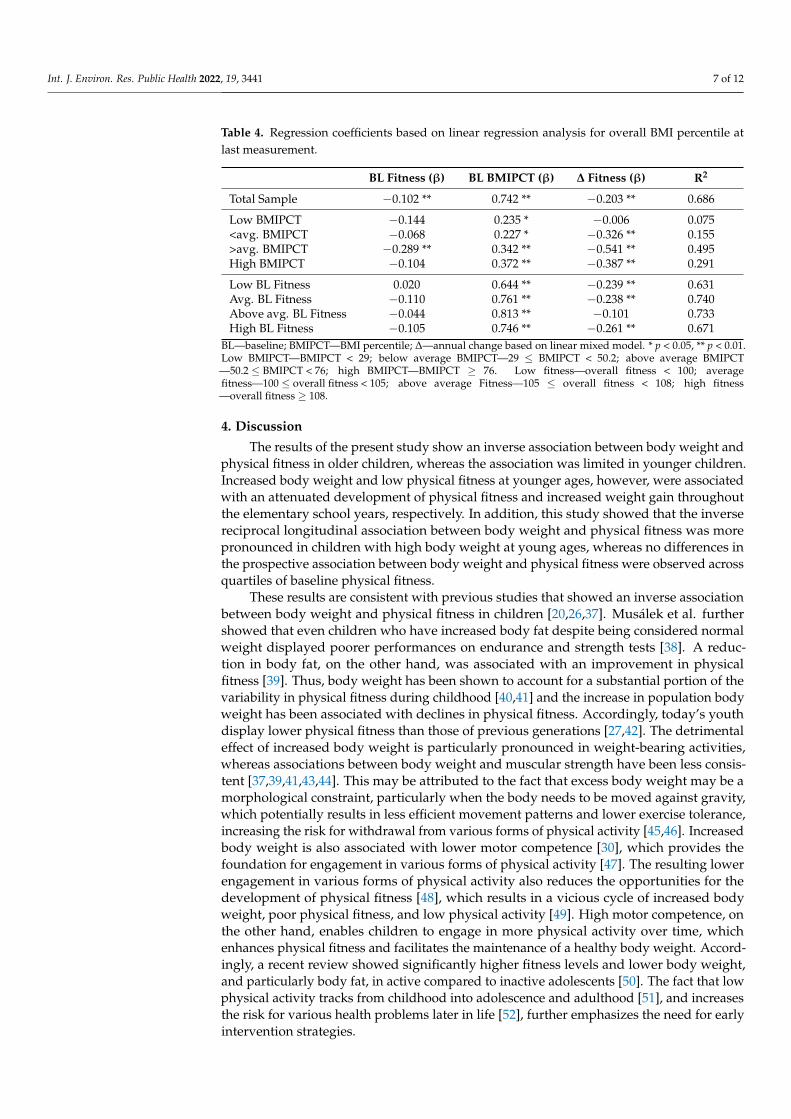
Linear regression analyses further showed a significant negative association betweenchange in BMIPCT and subsequent fitness (Table 3). The detrimental effect of higher weightgain on fitness development was particularly pronounced in participants with higherBMIPCT at baseline. No clear pattern of this association was observed across baselinefitness quartiles. The association between baseline fitness and fitness at the last follow-up,however, was stronger in participants with lower baseline fitness. These results remainedessentially unchanged after including sex as covariate.
Table 3. Regression coefficients based on linear regression analysis for overall physical fitness atlast measurement.
BL Fitness (β) BL BMIPCT (β) ∆ BMIPCT (β) R2
Total Sample 0.525 ** −0.309 ** −0.252 ** 0.456
Low BMIPCT 0.490 ** −0.015 −0.008 0.241<avg. BMIPCT 0.596 ** 0.042 −0.238 * 0.416>avg. BMIPCT 0.516 ** −0.126 −0.427 ** 0.530High BMIPCT 0.560 ** −0.054 −0.427 ** 0.523
Low BL Fitness 0.444 ** −0.502 ** −0.211 * 0.508Avg. BL Fitness 0.222 * −0.287 ** −0.359 ** 0.268Above avg. BL Fitness 0.198 −0.302 ** −0.150 0.179High BL Fitness −0.006 0.244 * −0.485 ** 0.269
BL—baseline; BMIPCT—BMI percentile; ∆—annual change based on linear mixed model. * p < 0.05,** p < 0.01. Low BMIPCT—BMIPCT < 29; below average BMIPCT—29 ≤ BMIPCT < 50.2; above aver-age BMIPCT—50.2 ≤ BMIPCT < 76; high BMIPCT—BMIPCT ≥ 76. Low fitness—overall fitness < 100;average fitness—100 ≤ overall fitness < 105; above average Fitness—105 ≤ overall fitness < 108; high fitness—overall fitness ≥ 108.
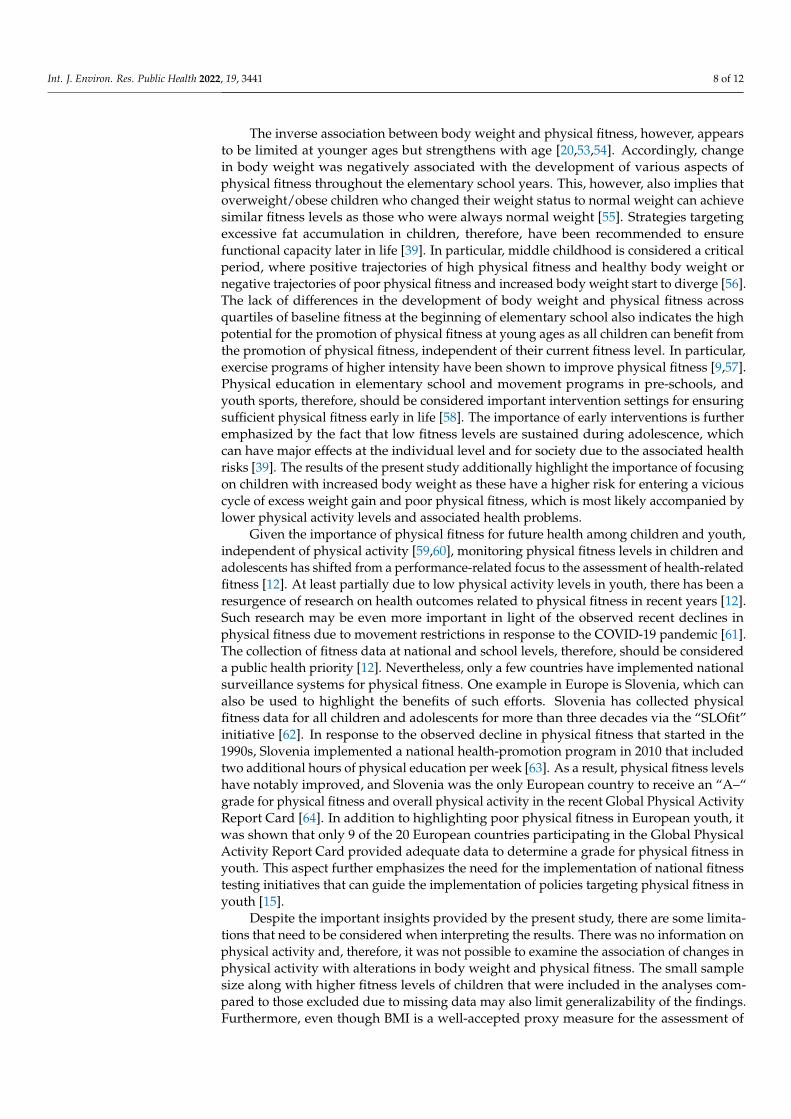
Change in physical fitness was negatively associated with subsequent BMIPCT aswell (Table 4). This association was also more pronounced in participants with higherbaseline BMIPCT, whereas no clear pattern was observed across baseline fitness quartiles.Further, the association between baseline BMIPCT and BMIPCT at follow-up was lesspronounced in participants with below-average baseline BMIPCT compared to those withhigher baseline BMIPCT. The inclusion of sex as additional independent variable in theregression models did not have a significant impact on the previously reported results.
Int. J. Environ. Res. Public Health 2022, 19, 3441 7 of 12
Table 4. Regression coefficients based on linear regression analysis for overall BMI percentile atlast measurement.
BL Fitness (β) BL BMIPCT (β) ∆ Fitness (β) R2
Total Sample −0.102 ** 0.742 ** −0.203 ** 0.686
Low BMIPCT −0.144 0.235 * −0.006 0.075<avg. BMIPCT −0.068 0.227 * −0.326 ** 0.155>avg. BMIPCT −0.289 ** 0.342 ** −0.541 ** 0.495High BMIPCT −0.104 0.372 ** −0.387 ** 0.291
Low BL Fitness 0.020 0.644 ** −0.239 ** 0.631Avg. BL Fitness −0.110 0.761 ** −0.238 ** 0.740Above avg. BL Fitness −0.044 0.813 ** −0.101 0.733High BL Fitness −0.105 0.746 ** −0.261 ** 0.671
BL—baseline; BMIPCT—BMI percentile; ∆—annual change based on linear mixed model. * p < 0.05, ** p < 0.01.Low BMIPCT—BMIPCT < 29; below average BMIPCT—29 ≤ BMIPCT < 50.2; above average BMIPCT—50.2 ≤ BMIPCT < 76; high BMIPCT—BMIPCT ≥ 76. Low fitness—overall fitness < 100; averagefitness—100 ≤ overall fitness < 105; above average Fitness—105 ≤ overall fitness < 108; high fitness—overall fitness ≥ 108.
4. Discussion
The results of the present study show an inverse association between body weight andphysical fitness in older children, whereas the association was limited in younger children.Increased body weight and low physical fitness at younger ages, however, were associatedwith an attenuated development of physical fitness and increased weight gain throughoutthe elementary school years, respectively. In addition, this study showed that the inversereciprocal longitudinal association between body weight and physical fitness was morepronounced in children with high body weight at young ages, whereas no differences inthe prospective association between body weight and physical fitness were observed acrossquartiles of baseline physical fitness.
These results are consistent with previous studies that showed an inverse associationbetween body weight and physical fitness in children [20,26,37]. Musálek et al. furthershowed that even children who have increased body fat despite being considered normalweight displayed poorer performances on endurance and strength tests [38]. A reduc-tion in body fat, on the other hand, was associated with an improvement in physicalfitness [39]. Thus, body weight has been shown to account for a substantial portion of thevariability in physical fitness during childhood [40,41] and the increase in population bodyweight has been associated with declines in physical fitness. Accordingly, today’s youthdisplay lower physical fitness than those of previous generations [27,42]. The detrimentaleffect of increased body weight is particularly pronounced in weight-bearing activities,whereas associations between body weight and muscular strength have been less consis-tent [37,39,41,43,44]. This may be attributed to the fact that excess body weight may be amorphological constraint, particularly when the body needs to be moved against gravity,which potentially results in less efficient movement patterns and lower exercise tolerance,increasing the risk for withdrawal from various forms of physical activity [45,46]. Increasedbody weight is also associated with lower motor competence [30], which provides thefoundation for engagement in various forms of physical activity [47]. The resulting lowerengagement in various forms of physical activity also reduces the opportunities for thedevelopment of physical fitness [48], which results in a vicious cycle of increased bodyweight, poor physical fitness, and low physical activity [49]. High motor competence, onthe other hand, enables children to engage in more physical activity over time, whichenhances physical fitness and facilitates the maintenance of a healthy body weight. Accord-ingly, a recent review showed significantly higher fitness levels and lower body weight,and particularly body fat, in active compared to inactive adolescents [50]. The fact that lowphysical activity tracks from childhood into adolescence and adulthood [51], and increasesthe risk for various health problems later in life [52], further emphasizes the need for earlyintervention strategies.
Int. J. Environ. Res. Public Health 2022, 19, 3441 8 of 12
The inverse association between body weight and physical fitness, however, appearsto be limited at younger ages but strengthens with age [20,53,54]. Accordingly, changein body weight was negatively associated with the development of various aspects ofphysical fitness throughout the elementary school years. This, however, also implies thatoverweight/obese children who changed their weight status to normal weight can achievesimilar fitness levels as those who were always normal weight [55]. Strategies targetingexcessive fat accumulation in children, therefore, have been recommended to ensurefunctional capacity later in life [39]. In particular, middle childhood is considered a criticalperiod, where positive trajectories of high physical fitness and healthy body weight ornegative trajectories of poor physical fitness and increased body weight start to diverge [56].The lack of differences in the development of body weight and physical fitness acrossquartiles of baseline fitness at the beginning of elementary school also indicates the highpotential for the promotion of physical fitness at young ages as all children can benefit fromthe promotion of physical fitness, independent of their current fitness level. In particular,exercise programs of higher intensity have been shown to improve physical fitness [9,57].Physical education in elementary school and movement programs in pre-schools, andyouth sports, therefore, should be considered important intervention settings for ensuringsufficient physical fitness early in life [58]. The importance of early interventions is furtheremphasized by the fact that low fitness levels are sustained during adolescence, whichcan have major effects at the individual level and for society due to the associated healthrisks [39]. The results of the present study additionally highlight the importance of focusingon children with increased body weight as these have a higher risk for entering a viciouscycle of excess weight gain and poor physical fitness, which is most likely accompanied bylower physical activity levels and associated health problems.
Given the importance of physical fitness for future health among children and youth,independent of physical activity [59,60], monitoring physical fitness levels in children andadolescents has shifted from a performance-related focus to the assessment of health-relatedfitness [12]. At least partially due to low physical activity levels in youth, there has been aresurgence of research on health outcomes related to physical fitness in recent years [12].Such research may be even more important in light of the observed recent declines inphysical fitness due to movement restrictions in response to the COVID-19 pandemic [61].The collection of fitness data at national and school levels, therefore, should be considereda public health priority [12]. Nevertheless, only a few countries have implemented nationalsurveillance systems for physical fitness. One example in Europe is Slovenia, which canalso be used to highlight the benefits of such efforts. Slovenia has collected physicalfitness data for all children and adolescents for more than three decades via the “SLOfit”initiative [62]. In response to the observed decline in physical fitness that started in the1990s, Slovenia implemented a national health-promotion program in 2010 that includedtwo additional hours of physical education per week [63]. As a result, physical fitness levelshave notably improved, and Slovenia was the only European country to receive an “A–“grade for physical fitness and overall physical activity in the recent Global Physical ActivityReport Card [64]. In addition to highlighting poor physical fitness in European youth, itwas shown that only 9 of the 20 European countries participating in the Global PhysicalActivity Report Card provided adequate data to determine a grade for physical fitness inyouth. This aspect further emphasizes the need for the implementation of national fitnesstesting initiatives that can guide the implementation of policies targeting physical fitness inyouth [15].
Despite the important insights provided by the present study, there are some limita-tions that need to be considered when interpreting the results. There was no information onphysical activity and, therefore, it was not possible to examine the association of changes inphysical activity with alterations in body weight and physical fitness. The small samplesize along with higher fitness levels of children that were included in the analyses com-pared to those excluded due to missing data may also limit generalizability of the findings.Furthermore, even though BMI is a well-accepted proxy measure for the assessment of
Int. J. Environ. Res. Public Health 2022, 19, 3441 9 of 12
weight status, it does not directly measure body fatness and fat distribution [65]. A higherBMI could also be associated with higher lean body mass, rather than fat mass, whichhas a stronger association with health compared to body weight [66]. Nevertheless, BMIis commonly used in epidemiological studies and has been shown to correlate well withbody fat percentage in youth [67]. The utilization of a validated test battery that assessesvarious components of physical fitness, which was administered by trained personnel,on the other hand, should be considered a strength of the present study. Additionally,a total of eight measurements were administered over four years throughout the entireelementary school period, which allows for an investigation of the dynamic, prospectiverelationship of physical fitness and body weight. Causality, however, cannot be establisheddue to the observational nature of this study. The insights gained, nevertheless, enhancethe understanding of the complex interaction between body weight and physical fitnessand, therefore, support evidence-based practice. In order to examine causal relationships,randomized controlled trials that explore effects of different exercise programs on physicalfitness in youth are needed. Such longitudinal studies should also include other criticalcorrelates of leisure time physical activity, such as self-efficacy and socio-environmentalaspects, along with the assessment of health markers in order to provide further evidenceon the impact of physical fitness on future health and well-being. With an increased publicawareness on the influence of physical fitness and body weight on future health, there mayalso be a stronger commitment to emphasize the promotion of physical fitness in childrenas a critical contributor to public health.
5. Conclusions
In conclusion, the results of the present study show an inverse reciprocal relationshipbetween body weight and physical fitness in elementary school children. The fact that thisassociation starts to emerge during the elementary school years emphasizes the importanceof early intervention strategies that minimize excess fat accumulation to ensure adequatephysical fitness later in life. Additionally, it was shown that the inverse association betweenbody weight and physical fitness was more pronounced in heavier children, whereas nodifferences in the progression of physical fitness were observed across different levelsof baseline fitness. This highlights the potential of promoting physical fitness for eachchild, independent of their current fitness level. Intervention efforts, nevertheless, shouldpay particular attention to children with non-optimal weight status as they are at anincreased risk for entering a vicious cycle of excess body weight, poor physical fitness, andlow physical activity, which has a significant impact on general development and healthlater in life.
Author Contributions: Conceptualization, K.G.; methodology, K.G.; formal analysis, C.D. resources,G.R.; data curation, K.G.; writing—original draft preparation, C.D.; writing—review and editing,S.-T.C., A.C., G.F., G.R. and K.G.; project administration, K.G. All authors have read and agreed to thepublished version of the manuscript.
Funding: This research received no external funding.
Institutional Review Board Statement: The study was conducted in accordance with the Declarationof Helsinki, and approved by the Institutional Review Board of the University of Innsbruck (certificateof good standing 16/2014).
Informed Consent Statement: Informed consent was obtained from all subjects involved in the study.
Data Availability Statement: The data presented in this study are available on request from thecorresponding author.
Conflicts of Interest: The authors declare no conflict of interest.

Int. J. Environ. Res. Public Health 2022, 19, 3441 10 of 12
References1. Pi-Sunyer, F.X. The obesity epidemic: Pathophysiology and consequences of obesity. Obes. Res. 2002, 10 (Suppl. 2), 97S–104S.
[CrossRef] [PubMed]2. Poirier, P.; Giles, T.D.; Bray, G.A.; Hong, Y.; Stern, J.S.; Pi-Sunyer, F.X.; Eckel, R.H. Obesity and cardiovascular disease: Pathophysi-
ology, evaluation, and effect of weight loss: An update of the 1997 American Heart Association Scientific Statement on Obesityand Heart Disease from the Obesity Committee of the Council on Nutrition, Physical Activity, and Metabolism. Circulation 2006,113, 898–918. [PubMed]
3. Cote, A.T.; Harris, K.C.; Panagiotopoulos, C.; Sandor, G.G.; Devlin, A.M. Childhood obesity and cardiovascular dysfunction.J. Am. Coll. Cardiol. 2013, 62, 1309–1319. [CrossRef] [PubMed]
4. Ayer, J.; Charakida, M.; Deanfield, J.E.; Celermajer, D.S. Lifetime risk: Childhood obesity and cardiovascular risk. Eur. Heart J.2015, 36, 1371–1376. [CrossRef]
5. Lang, J.E.; Bunnell, H.T.; Hossain, M.J.; Wysocki, T.; Lima, J.J.; Finkel, T.H.; Bacharier, L.; Dempsey, A.; Sarzynski, L.; Test, M.; et al.Being Overweight or Obese and the Development of Asthma. Pediatrics 2018, 142, e20182119. [CrossRef]
6. Lobstein, T.; Jackson-Leach, R.; Moodie, M.L.; Hall, K.D.; Gortmaker, S.L.; Swinburn, B.A.; James, W.P.T.; Wang, Y.; McPherson, K.Child and adolescent obesity: Part of a bigger picture. Lancet 2015, 385, 2510–2520. [CrossRef]
7. Simmonds, M.; Llewellyn, A.; Owen, C.G.; Woolacott, N. Predicting adult obesity from childhood obesity: A systematic reviewand meta-analysis. Obes. Rev. 2016, 17, 95–107. [CrossRef]
8. Umer, A.; Kelley, G.A.; Cottrell, L.E.; Giacobbi, P.; Innes, K.E.; Lilly, C.L. Childhood obesity and adult cardiovascular disease riskfactors: A systematic review with meta-analysis. BMC Public Health 2017, 17, 683. [CrossRef]
9. Ortega, F.B.; Ruiz, J.R.; Castillo, M.J.; Sjöström, M. Physical fitness in childhood and adolescence: A powerful marker of health.Int. J. Obes. 2008, 32, 1–11. [CrossRef]
10. Ruiz, J.R.; Castro-Piñero, J.; Artero, E.G.; Ortega, F.B.; Sjöström, M.; Suni, J.; Castillo, M.J. Predictive validity of health-relatedfitness in youth: A systematic review. Br. J. Sports Med. 2009, 43, 909–923. [CrossRef]
11. Zaqout, M.; Michels, N.; Bammann, K.; Ahrens, W.; Sprengeler, O.; Molnar, D.; Hadjigeorgiou, C.; Eiben, G.; Konstabel, K.; Russo,P.; et al. Influence of physical fitness on cardio-metabolic risk factors in European children. The IDEFICS study. Int. J. Obes. 2016,40, 1119–1125. [CrossRef] [PubMed]
12. Sacheck, J.; Hall, M. Current evidence for theimpact of physical fitness on health outcomes in youth. Am. J. Lifestyle Med. 2015, 9,388–397. [CrossRef]
13. Smith, J.J.; Eather, N.; Morgan, P.J.; Plotnikoff, R.C.; Faigenbaum, A.D.; Lubans, D.R. The health benefits of muscular fitness forchildren and adolescents: A systematic review and meta-analysis. Sports Med. 2014, 44, 1209–1223. [CrossRef] [PubMed]
14. Caspersen, C.J.; Powell, K.E.; Christenson, G.M. Physical activity, exercise, and physical fitness: Definitions and distinctions forhealth-related research. Public Health Rep. 1985, 100, 126–131. [PubMed]
15. Lang, J.J.; Tomkinson, G.R.; Janssen, I.; Ruiz, J.R.; Ortega, F.B.; Léger, L.; Tremblay, M.S. Making a Case for CardiorespiratoryFitness Surveillance Among Children and Youth. Exerc. Sport Sci. Rev. 2018, 46, 66–75. [CrossRef] [PubMed]
16. Grøntved, A.; Ried-Larsen, M.; Møller, N.C.; Kristensen, P.L.; Froberg, K.; Brage, S.; Andersen, L.B. Muscle strength in youthand cardiovascular risk in young adulthood (the European Youth Heart Study). Br. J. Sports Med. 2015, 49, 90–94. [CrossRef][PubMed]
17. García-Hermoso, A.; Ramírez-Campillo, R.; Izquierdo, M. Is Muscular Fitness Associated with Future Health Benefits in Childrenand Adolescents? A Systematic Review and Meta-Analysis of Longitudinal Studies. Sports Med. 2019, 49, 1079–1094. [CrossRef]
18. Ajala, O.; Mold, F.; Boughton, C.; Cooke, D.; Whyte, M. Childhood predictors of cardiovascular disease in adulthood. A systematicreview and meta-analysis. Obes. Rev. 2017, 18, 1061–1070. [CrossRef]
19. Janssen, I.; Leblanc, A.G. Systematic review of the health benefits of physical activity and fitness in school-aged children andyouth. Int. J. Behav. Nutr. Phys. Act. 2010, 7, 40. [CrossRef]
20. Fiori, F.; Bravo, G.; Parpinel, M.; Messina, G.; Malavolta, R.; Lazzer, S. Relationship between body mass index and physical fitnessin Italian prepubertal schoolchildren. PLoS ONE 2020, 15, e0233362.
21. Barnett, L.M.; Lai, S.K.; Veldman, S.L.; Hardy, L.L.; Cliff, D.P.; Morgan, P.J.; Zask, A.; Lubans, D.R.; Shultz, S.P.; Ridgers, N.D.; et al.Correlates of Gross Motor Competence in Children and Adolescents: A Systematic Review and Meta-Analysis. Sports Med. 2016,46, 1663–1688. [CrossRef] [PubMed]
22. Tsiros, M.D.; Coates, A.M.; Howe, P.R.; Walkley, J.; Hills, A.P.; Wood, R.E.; Buckley, J.D. Adiposity is related to decrements incardiorespiratory fitness in obese and normal-weight children. Pediatr. Obes. 2016, 11, 144–150. [CrossRef]
23. Greier, K.; Drenowatz, C. Bidirectional association between weight status and motor skills in adolescents: A 4-year longitudinalstudy. Wien. Klin. Wochenschr. 2018, 130, 314–320. [CrossRef] [PubMed]
24. Ruedl, G.; Franz, D.; Frühauf, A.; Kopp, M.; Niedermeier, M.; Drenowatz, C.; Greier, K. Development of physical fitness inAustrian primary school children: A longitudinal study among overweight and non-overweight children over 2.5 years. Wien.Klin. Wochenschr. 2018, 130, 321–327. [CrossRef]
25. Albrecht, C.; Hanssen-Doose, A.; Oriwol, D.; Bös, K.; Worth, A. Beeinflusst ein Veränderung des BMI die Entwicklung dermotorischen Leistungsfähigkeit im Kindes- und Jugendalter? Ergebnisse der Motorik-Modul Studie (MoMo). Beweg. und Gesundh.2016, 32, 168–172.
Int. J. Environ. Res. Public Health 2022, 19, 3441 11 of 12
26. Lopes, V.; Maia, J.; Rodrigues, L.; Malina, R. Motor coordination, physical activity and fitness as predictors of longitudinal changein adiposity during childhood. Eur. J. Sport Sci. 2012, 12, 384–391. [CrossRef]
27. Tomkinson, G.R.; Lang, J.J.; Tremblay, M.S. Temporal trends in the cardiorespiratory fitness of children and adolescents rep-resenting 19 high-income and upper middle-income countries between 1981 and 2014. Br. J. Sports Med. 2019, 53, 478–486.[CrossRef]
28. NCD Risk Factor Collaboration (NCD-RisC). Worldwide trends in body-mass index, underweight, overweight, and obesity from1975 to 2016: A pooled analysis of 2416 population-based measurement studies in 128·9 million children, adolescents, and adults.Lancet 2017, 390, 2627–2642. [CrossRef]
29. Brunner, F.; Kornexl, E.; Kastner, H.; Drenowatz, C.; Greier, K. Fitness trend analysis in male Austrian middle and high schoolstudents from 1975 to 2010. Curr. Issues Sport Sci. 2021, 6, 007. [CrossRef]
30. Bolger, L.E.; Bolger, L.A.; O’Neill, C.; Coughlan, E.; O’Brien, W.; Lacey, S.; Burns, C.; Bardidd, F. Global levels of fundamentalmotor skills in children: A systematic review. J. Sports Sci. 2021, 39, 717–753. [CrossRef]
31. Drozdz, D.; Alvarez-Pitti, J.; Wójcik, M.; Borghi, C.; Gabbianelli, R.; Mazur, A.; Herceg-Cavrak, V.; Lopez-Valcarcel, B.G.;Brzezinski, M.; Lurbe, E.; et al. Obesity and Cardiometabolic Risk Factors: From Childhood to Adulthood. Nutrients 2021,13, 4176. [CrossRef] [PubMed]
32. Muka, T.; Imo, D.; Jaspers, L.; Colpani, V.; Chaker, L.; van der Lee, S.J.; Mendis, S.; Chowdhury, R.; Bramer, W.M.; Falla, A.;et al. The global impact of non-communicable diseases on healthcare spending and national income: A systematic review. Eur. J.Epidemiol. 2015, 30, 251–277. [CrossRef] [PubMed]
33. Spieker, E.A.; Pyzocha, N. Economic Impact of Obesity. Prim. Care 2016, 43, 83–95. [CrossRef] [PubMed]34. Kromeyer-Hauschild, K.; Wabitsch, M.; Kunze, D.; Geller, F.; Geiß, H.; Hesse, V.; von Hippel, A.; Jaeger, U.; Johnsen, D.; Korte,
W.; et al. Perzentile für den Body-mass-Index für das Kindes- und Jugendalter unter Heranziehung verschiedener deutscherStichproben. Mon. Kinderheilkd. 2001, 149, 807–818. [CrossRef]
35. Bös, K.; Schlenker, L.; Büsch, D.; Lämmle, L.; Müller, H.; Oberger, J.; Seidel, I.; Tittelbach, S. Deutscher Motorik-Test 6-18 (DMT6-18)[German Motor Abilities Test 6-18 (DMT6-18)]; Czwalina: Hamburg, Germany, 2009.
36. Abdelkarim, O.; Fritsch, J.; Jekauc, D.; Bös, K. Examination of Construct Validity and Criterion-Related Validity of the GermanMotor Test in Egyptian Schoolchildren. Int. J. Environ. Res. Public Health 2021, 18, 8341. [CrossRef]
37. Ceschia, A.; Giacomini, S.; Santarossa, S.; Rugo, M.; Salvadego, D.; Da Ponte, A.; Driussi, C.; Mihaleje, M.; Poser, S.; Lazzer, S.Deleterious effects of obesity on physical fitness in pre-pubertal children. Eur. J. Sport Sci. 2016, 16, 271–278. [CrossRef]
38. Musálek, M.; Clark, C.C.T.; Kokštejn, J.; Vokounova, Š.; Hnízdil, J.; Mess, F. Impaired Cardiorespiratory Fitness and MuscleStrength in Children with Normal-Weight Obesity. Int. J. Environ. Res. Public Health 2020, 17, 9198. [CrossRef]
39. Joensuu, L.; Kujala, U.M.; Kankaanpää, A.; Syväoja, H.J.; Kulmala, J.; Hakonen, H.; Oksanen, H.; Kallio, J.; Tammelin, T.H.Physical fitness development in relation to changes in body composition and physical activity in adolescence. Scand. J. Med. Sci.Sports 2021, 31, 456–464. [CrossRef]
40. Brunet, M.; Chaput, J.P.; Tremblay, A. The association between low physical fitness and high body mass index or waistcircumference is increasing with age in children: The ‘Québec en Forme’ Project. Int. J. Obes. 2007, 31, 637–643. [CrossRef]
41. Sacchetti, R.; Ceciliani, A.; Garulli, A.; Masotti, A.; Poletti, G.; Beltrami, P.; Leoni, E. Physical fitness of primary school children inrelation to overweight prevalence and physical activity habits. J. Sports Sci. 2012, 30, 633–640. [CrossRef]
42. Santtila, M.; Pihlainen, K.; Koski, H.; Vasankari, T.; Kyröläinen, H. Physical Fitness in Young Men between 1975 and 2015 with aFocus on the Years 2005–2015. Med. Sci. Sports Exerc. 2018, 50, 292–298. [CrossRef]
43. Armstrong, M.E.G.; Lambert, M.I.; Lambert, E.V. Relationships between different nutritional anthropometric statuses andhealth-related fitness of South African primary school children. Ann. Hum. Biol. 2017, 44, 208–213. [CrossRef]
44. Gulías-González, R.; Sánchez-López, M.; Olivas-Bravo, Á.; Solera-Martínez, M.; Martínez-Vizcaíno, V. Physical fitness in Spanishschoolchildren aged 6–12 years: Reference values of the battery EUROFIT and associated cardiovascular risk. J. Sch. Health 2014,84, 625–635. [CrossRef]
45. Kakebeeke, T.H.; Lanzi, S.; Zysset, A.E.; Arhab, A.; Messerli-Bürgy, N.; Stuelb, K.; Leeger-Aschmann, C.S.; Schmutz, E.A.; Meyer,A.H.; Kriemler, S.; et al. Association between Body Composition and Motor Performance in Preschool Children. Obes. Facts 2017,10, 420–431. [CrossRef]
46. de Andrade Gonçalves, E.C.; Augusto Santos Silva, D.; Gimenes Nunes, H.E. Prevalence and Factors Associated with LowAerobic Performance Levels in Adolescents: A Systematic Review. Curr. Pediatr. Rev. 2015, 11, 56–70. [CrossRef]
47. Gallahue, D.; Ozmun, J.; Goodway, J. Understanding Motor Development. Infants, Children, Adolescents, Adults, 7th ed.; McGraw-Hill:Boston, MA, USA, 2012.
48. Lima, R.A.; Bugge, A.; Ersbøll, A.K.; Stodden, D.F.; Andersen, L.B. The longitudinal relationship between motor competence andmeasures of fatness and fitness from childhood into adolescence. J. Pediatr. 2019, 95, 482–488. [CrossRef]
49. Stodden, D.; Goodway, J.; Langendorfer, S.; Roberton, M.; Rudisill, M.; Garcia, C.; Garcia, L.E. A developmental perspective onthe role of motor skill competence in physical activity: An emergent relationshihp. Quest 2008, 60, 290–306. [CrossRef]
50. Mateo-Orcajada, A.; González-Gálvez, N.; Abenza-Cano, L.; Vaquero-Cristóbal, R. Differences in Physical Fitness and BodyComposition Between Active and Sedentary Adolescents: A Systematic Review and Meta-Analysis. J. Youth Adolesc. 2022. Epubahead of print. [CrossRef]
Int. J. Environ. Res. Public Health 2022, 19, 3441 12 of 12
51. Telama, R.; Yang, X.; Leskinen, E.; Kankaanpää, A.; Hirvensalo, M.; Tammelin, T.; Raitakari, O.T. Tracking of physical activityfrom early childhood through youth into adulthood. Med. Sci. Sports Exerc. 2014, 46, 955–962. [CrossRef]
52. Li, J.; Siegrist, J. Physical activity and risk of cardiovascular disease-a meta-analysis of prospective cohort studies. Int. J. Environ.Res. Public Health 2012, 9, 391–407. [CrossRef]
53. Battaglia, G.; Giustino, V.; Tabacchi, G.; Lanza, M.; Schena, F.; Biino, V.; Giuriato, M.; Gallotta, M.C.; Guidetti, L.; Baldari, C.; et al.Interrelationship Between Age, Gender, and Weight Status on Motor Coordination in Italian Children and Early AdolescentsAged 6–13 Years Old. Front. Pediatr. 2021, 9, 738294. [CrossRef]
54. Battaglia, G.; Giustino, V.; Tabacchi, G.; Alesi, M.; Galassi, C.; Modica, C.; Palma, A.; Bellafiore, M. Effectiveness of a PhysicalEducation Program on the Motor and Pre-literacy Skills of Preschoolers From the Training-To-Health Project: A Focus on WeightStatus. Front. Sports Act. Living 2020, 2, 579421. [CrossRef] [PubMed]
55. Lima, R.A.; Soares, F.C.; Queiroz, D.R.; Aguilar, J.A.; Bezerra, J.; Barros, M.V.G. The importance of body weight status on motorcompetence development: From preschool to middle childhood. Scand. J. Med. Sci. Sports 2021, 31 (Suppl. 1), 15–22. [CrossRef][PubMed]
56. Robinson, L.E.; Stodden, D.F.; Barnett, L.M.; Lopes, V.P.; Logan, S.W.; Rodrigues, L.P.; D’Hondt, E. Motor Competence and itsEffect on Positive Developmental Trajectories of Health. Sports Med. 2015, 45, 1273–1284. [CrossRef] [PubMed]
57. Beltran-Valls, M.R.; Adelantado-Renau, M.; Moliner-Urdiales, D. Reallocating time spent in physical activity intensities: Longitu-dinal associations with physical fitness (DADOS study). J. Sci. Med. Sport 2020, 23, 968–972. [CrossRef] [PubMed]
58. Cocca, A.; Carbajal Baca, J.E.; Hernández Cruz, G.; Cocca, M. Does A Multiple-Sport Intervention Based on the TGfU PedagogicalModel for Physical Education Increase Physical Fitness in Primary School Children? Int. J. Environ. Res. Public Health 2020,17, 5532. [CrossRef]
59. Kelly, A.S.; Wetzsteon, R.J.; Kaiser, D.R.; Steinberger, J.; Bank, A.J.; Dengel, D.R. Inflammation, insulin, and endothelial function inoverweight children and adolescents: The role of exercise. J. Pediatr. 2004, 145, 731–736. [CrossRef]
60. Janz, K.F.; Dawson, J.D.; Mahoney, L.T. Increases in physical fitness during childhood improve cardiovascular health duringadolescence: The Muscatine Study. Int. J. Sports Med. 2002, 23 (Suppl. 1), S15–S21. [CrossRef]
61. Jarnig, G.; Jaunig, J.; van Poppel, M.N.M. Association of COVID-19 Mitigation Measures with Changes in CardiorespiratoryFitness and Body Mass Index Among Children Aged 7 to 10 Years in Austria. JAMA Netw. Open 2021, 4, e2121675. [CrossRef]
62. Jurak, G.; Kovac, M.; Sember, V.; Starc, G. 30 years of SLOfit: Its legacy and perspective. Turk. J. Sports Med. 2019, 54, 23–27.[CrossRef]
63. Strel, J. Analysis of the Program Healthy Lifestyle for the Years 2010/11 and 2011/12; Institute for Sport Planica: Ljubljana, Slovenia, 2013.64. Coppinger, T.; Milton, K.; Murtagh, E.; Harrington, D.; Johansen, D.; Seghers, J.; Skovgaard, T.; HEPA Europe Children & Youth
Working Group; Chalkley, A. Global Matrix 3.0 physical activity report card for children and youth: A comparison across Europe.Public Health 2020, 187, 150–156. [CrossRef]
65. Freedman, D.S.; Katzmarzyk, P.T.; Dietz, W.H.; Srinivasan, S.R.; Berenson, G.S. Relation of body mass index and skinfoldthicknesses to cardiovascular disease risk factors in children: The Bogalusa Heart Study. Am. J. Clin. Nutr. 2009, 90, 210–216.[CrossRef] [PubMed]
66. Lo, K.; Wong, M.; Khalechelvam, P.; Tam, W. Waist-to-height ratio, body mass index and waist circumference for screeningpaediatric cardio-metabolic risk factors: A meta-analysis. Obes. Rev. 2016, 17, 1258–1275. [CrossRef] [PubMed]
67. Mei, Z.; Grummer-Strawn, L.M.; Pietrobelli, A.; Goulding, A.; Goran, M.I.; Dietz, W.H. Validity of body mass index comparedwith other body-composition screening indexes for the assessment of body fatness in children and adolescents. Am. J. Clin. Nutr.2002, 75, 978–985. [CrossRef] [PubMed]
Related Documents