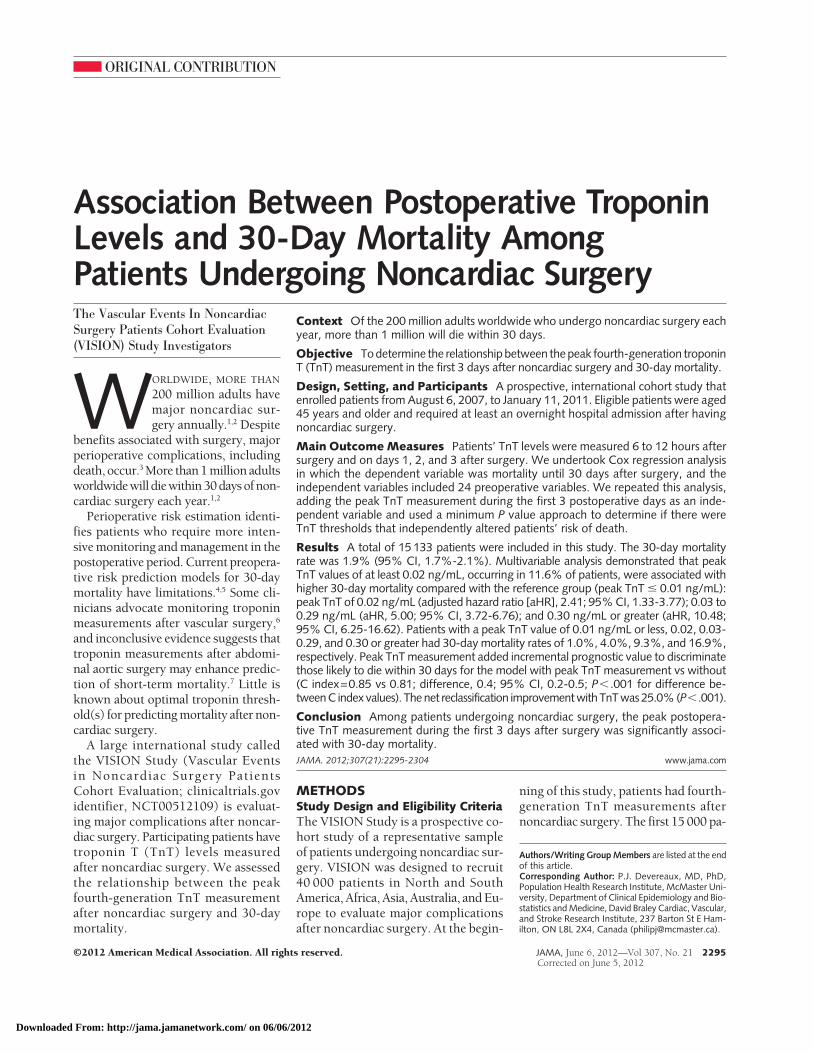
ORIGINAL CONTRIBUTION Association Between Postoperative Troponin Levels and 30-Day Mortality Among Patients Undergoing Noncardiac Surgery The Vascular Events In Noncardiac Surgery Patients Cohort Evaluation (VISION) Study Investigators W ORLDWIDE, MORE THAN 200 million adults have major noncardiac sur- gery annually. 1,2 Despite benefits associated with surgery, major perioperative complications, including death, occur. 3 More than 1 million adults worldwide will die within 30 days of non- cardiac surgery each year. 1,2 Perioperative risk estimation identi- fies patients who require more inten- sive monitoring and management in the postoperative period. Current preopera- tive risk prediction models for 30-day mortality have limitations. 4,5 Some cli- nicians advocate monitoring troponin measurements after vascular surgery, 6 and inconclusive evidence suggests that troponin measurements after abdomi- nal aortic surgery may enhance predic- tion of short-term mortality. 7 Little is known about optimal troponin thresh- old(s) for predicting mortality after non- cardiac surgery. A large international study called the VISION Study (Vascular Events in Noncardiac Surgery Patients Cohort Evaluation; clinicaltrials.gov identifier, NCT00512109) is evaluat- ing major complications after noncar- diac surgery. Participating patients have troponin T (TnT) levels measured after noncardiac surgery. We assessed the relationship between the peak fourth-generation TnT measurement after noncardiac surgery and 30-day mortality. METHODS Study Design and Eligibility Criteria The VISION Study is a prospective co- hort study of a representative sample of patients undergoing noncardiac sur- gery. VISION was designed to recruit 40 000 patients in North and South America, Africa, Asia, Australia, and Eu- rope to evaluate major complications after noncardiac surgery. At the begin- ning of this study, patients had fourth- generation TnT measurements after noncardiac surgery. The first 15 000 pa- Authors/Writing Group Members are listed at the end of this article. Corresponding Author: P.J. Devereaux, MD, PhD, Population Health Research Institute, McMaster Uni- versity, Department of Clinical Epidemiology and Bio- statistics and Medicine, David Braley Cardiac, Vascular, and Stroke Research Institute, 237 Barton St E Ham- ilton, ON L8L 2X4, Canada ([email protected]). Context Of the 200 million adults worldwide who undergo noncardiac surgery each year, more than 1 million will die within 30 days. Objective To determine the relationship between the peak fourth-generation troponin T (TnT) measurement in the first 3 days after noncardiac surgery and 30-day mortality. Design, Setting, and Participants A prospective, international cohort study that enrolled patients from August 6, 2007, to January 11, 2011. Eligible patients were aged 45 years and older and required at least an overnight hospital admission after having noncardiac surgery. Main Outcome Measures Patients’ TnT levels were measured 6 to 12 hours after surgery and on days 1, 2, and 3 after surgery. We undertook Cox regression analysis in which the dependent variable was mortality until 30 days after surgery, and the independent variables included 24 preoperative variables. We repeated this analysis, adding the peak TnT measurement during the first 3 postoperative days as an inde- pendent variable and used a minimum P value approach to determine if there were TnT thresholds that independently altered patients’ risk of death. Results A total of 15 133 patients were included in this study. The 30-day mortality rate was 1.9% (95% CI, 1.7%-2.1%). Multivariable analysis demonstrated that peak TnT values of at least 0.02 ng/mL, occurring in 11.6% of patients, were associated with higher 30-day mortality compared with the reference group (peak TnT 0.01 ng/mL): peak TnT of 0.02 ng/mL (adjusted hazard ratio [aHR], 2.41; 95% CI, 1.33-3.77); 0.03 to 0.29 ng/mL (aHR, 5.00; 95% CI, 3.72-6.76); and 0.30 ng/mL or greater (aHR, 10.48; 95% CI, 6.25-16.62). Patients with a peak TnT value of 0.01 ng/mL or less, 0.02, 0.03- 0.29, and 0.30 or greater had 30-day mortality rates of 1.0%, 4.0%, 9.3%, and 16.9%, respectively. Peak TnT measurement added incremental prognostic value to discriminate those likely to die within 30 days for the model with peak TnT measurement vs without (C index=0.85 vs 0.81; difference, 0.4; 95% CI, 0.2-0.5; P .001 for difference be- tween C index values). The net reclassification improvement with TnT was 25.0% (P .001). Conclusion Among patients undergoing noncardiac surgery, the peak postopera- tive TnT measurement during the first 3 days after surgery was significantly associ- ated with 30-day mortality. JAMA. 2012;307(21):2295-2304 www.jama.com ©2012 American Medical Association. All rights reserved. JAMA, June 6, 2012—Vol 307, No. 21 2295 Corrected on June 5, 2012 Downloaded From: http://jama.jamanetwork.com/ on 06/06/2012

Welcome message from author
This document is posted to help you gain knowledge. Please leave a comment to let me know what you think about it! Share it to your friends and learn new things together.
Transcript
ORIGINAL CONTRIBUTION
Association Between Postoperative TroponinLevels and 30-Day Mortality AmongPatients Undergoing Noncardiac SurgeryThe Vascular Events In NoncardiacSurgery Patients Cohort Evaluation(VISION) Study Investigators
WORLDWIDE, MORE THAN
200 million adults havemajor noncardiac sur-gery annually.1,2 Despite
benefits associated with surgery, majorperioperative complications, includingdeath, occur.3 More than 1 million adultsworldwidewill diewithin 30days ofnon-cardiac surgery each year.1,2
Perioperative risk estimation identi-fies patients who require more inten-sive monitoring and management in thepostoperative period. Current preopera-tive risk prediction models for 30-daymortality have limitations.4,5 Some cli-nicians advocate monitoring troponinmeasurements after vascular surgery,6
and inconclusive evidence suggests thattroponin measurements after abdomi-nal aortic surgery may enhance predic-tion of short-term mortality.7 Little isknown about optimal troponin thresh-old(s) for predicting mortality after non-cardiac surgery.
A large international study calledthe VISION Study (Vascular Eventsin Noncardiac Surgery PatientsCohort Evaluation; clinicaltrials.govidentifier, NCT00512109) is evaluat-ing major complications after noncar-diac surgery. Participating patients havetroponin T (TnT) levels measuredafter noncardiac surgery. We assessedthe relationship between the peakfourth-generation TnT measurementafter noncardiac surgery and 30-daymortality.
METHODSStudy Design and Eligibility CriteriaThe VISION Study is a prospective co-hort study of a representative sampleof patients undergoing noncardiac sur-gery. VISION was designed to recruit40 000 patients in North and SouthAmerica, Africa, Asia, Australia, and Eu-rope to evaluate major complicationsafter noncardiac surgery. At the begin-
ning of this study, patients had fourth-generation TnT measurements afternoncardiac surgery. The first 15 000 pa-
Authors/Writing Group Members are listed at the endof this article.Corresponding Author: P.J. Devereaux, MD, PhD,Population Health Research Institute, McMaster Uni-versity, Department of Clinical Epidemiology and Bio-statistics and Medicine, David Braley Cardiac, Vascular,and Stroke Research Institute, 237 Barton St E Ham-ilton, ON L8L 2X4, Canada ([email protected]).
Context Of the 200 million adults worldwide who undergo noncardiac surgery eachyear, more than 1 million will die within 30 days.
Objective To determine the relationship between the peak fourth-generation troponinT (TnT) measurement in the first 3 days after noncardiac surgery and 30-day mortality.
Design, Setting, and Participants A prospective, international cohort study thatenrolled patients from August 6, 2007, to January 11, 2011. Eligible patients were aged45 years and older and required at least an overnight hospital admission after havingnoncardiac surgery.
Main Outcome Measures Patients’ TnT levels were measured 6 to 12 hours aftersurgery and on days 1, 2, and 3 after surgery. We undertook Cox regression analysisin which the dependent variable was mortality until 30 days after surgery, and theindependent variables included 24 preoperative variables. We repeated this analysis,adding the peak TnT measurement during the first 3 postoperative days as an inde-pendent variable and used a minimum P value approach to determine if there wereTnT thresholds that independently altered patients’ risk of death.
Results A total of 15 133 patients were included in this study. The 30-day mortalityrate was 1.9% (95% CI, 1.7%-2.1%). Multivariable analysis demonstrated that peakTnT values of at least 0.02 ng/mL, occurring in 11.6% of patients, were associated withhigher 30-day mortality compared with the reference group (peak TnT � 0.01 ng/mL):peak TnT of 0.02 ng/mL (adjusted hazard ratio [aHR], 2.41; 95% CI, 1.33-3.77); 0.03 to0.29 ng/mL (aHR, 5.00; 95% CI, 3.72-6.76); and 0.30 ng/mL or greater (aHR, 10.48;95% CI, 6.25-16.62). Patients with a peak TnT value of 0.01 ng/mL or less, 0.02, 0.03-0.29, and 0.30 or greater had 30-day mortality rates of 1.0%, 4.0%, 9.3%, and 16.9%,respectively. Peak TnT measurement added incremental prognostic value to discriminatethose likely to die within 30 days for the model with peak TnT measurement vs without(C index=0.85 vs 0.81; difference, 0.4; 95% CI, 0.2-0.5; P� .001 for difference be-tween C index values). The net reclassification improvement with TnT was 25.0% (P�.001).
Conclusion Among patients undergoing noncardiac surgery, the peak postopera-tive TnT measurement during the first 3 days after surgery was significantly associ-ated with 30-day mortality.JAMA. 2012;307(21):2295-2304 www.jama.com
©2012 American Medical Association. All rights reserved. JAMA, June 6, 2012—Vol 307, No. 21 2295Corrected on June 5, 2012
Downloaded From: http://jama.jamanetwork.com/ on 06/06/2012
tients experienced event rates at ap-proximately 3 times what was ex-pected. Recognizing that we hadsufficient events to address our objec-tives related to the fourth-generationTnT measurements, the operationscommittee decided to henceforthmonitor the fifth-generation high-sensitivity TnT assay. This publica-tion is restricted to patients during theperiod of fourth-generation TnT use.
Eligible patients for the VISIONStudy had noncardiac surgery, were atleast 45 years of age, received a gen-eral or regional anesthetic, and under-went elective, urgent, or emergency sur-gery during the day or at night on aweekday or weekend. Additional eligi-bility criteria restricting patients tothose with data allowing prognosticevaluation of fourth-generation TnTincluded patients who had a fourth-generation TnT assay measurement andcomplete data for the 24 potential pre-operative predictors of 30-day mortal-ity that we evaluated. Patients were ex-cluded if they did not require anovernight hospital admission after sur-gery, were previously enrolled in theVISION Study, or declined consent.The research ethics board at each siteapproved the protocol prior to patientrecruitment.
Patient Recruitment
Patients gave consent prior to surgeryor, for those from whom we could notobtain consent preoperatively (eg,emergency night surgical case), re-search personnel obtained consentwithin the first 24 hours after surgery.Eight centers used a deferred consentprocess for patients unable to provideconsent (eg, patients sedated and me-chanically ventilated) and for whom nonext of kin was available. This al-lowed collection of TnT measure-ments while awaiting patient or next-of-kin consent.
Patients were identified by screen-ing daily patient lists in preoperative as-sessment clinics, on surgical wards, andin intensive care units; daily and pre-vious-day surgical lists; and patients inthe preoperative holding area. In some
centers, surgical volume exceeded thecapacity of research staff to enroll alleligible patients on consecutive weeks.In these centers, the project office eithercreated a recruitment schedule consist-ing of random weeks of nonrecruit-ment or randomly selected surgical ser-vices. At the end of each week, researchpersonnel reviewed the surgical log-book and reported the number of pa-tients eligible but not enrolled.
Procedures
Research personnel interviewed and ex-amined patients and reviewed medi-cal records to obtain information on po-tential predictors of major perioperativecomplications. At each site, an inves-tigator reviewed and approved all data.Patients had blood collected to mea-sure a Roche 4th-generation ElecsysTnT assay 6 to 12 hours postopera-tively and on the first, second, and thirddays after surgery. Patients enrolled be-tween 12 and 24 hours after surgery hada TnT drawn immediately, and testingcontinued as previously reported. AllTnT measurements were analyzed at theparticipating hospitals. TnT results werereported to the attending physicians.
Throughout each patient’s hospitalstay, research personnel performedclinical evaluations, reviewed medicalrecords, ensured patients had TnT mea-surements drawn, and noted outcomeevents. The primary outcome was mor-tality at 30 days after surgery. Centersalso reported the cause of death (vas-cular or nonvascular, definitions in eAp-pendix 2 available at http://www.jama.com). Patients were phoned at 30 daysafter surgery. If patients (or next of kin)indicated the occurrence of an out-come, their physicians were contactedto obtain documentation. Research per-sonnel at participating centers submit-ted the case report forms and support-ing documentation directly to the datamanagement system (iDataFax, coor-dinating center, McMaster University,Hamilton, Ontario, Canada).
Data monitoring in VISION con-sisted of central data consistencychecks, statistical monitoring, and on-site monitoring for all centers. For the
on-site monitoring, the central coordi-nator randomly selected participantswith and without a perioperative com-plication, and independent monitorsaudited their medical records and allother supporting documents. No cen-ter stood out regarding results from cen-tral data consistency checks or statis-tical monitoring. On-site monitoringdemonstrated no major discrepanciesbetween the submitted data and themonitoring findings, except for a sys-tematic error in recording the dura-tion of perioperative hemodynamiccompromise at 2 centers. This was cor-rected and subsequent on-site moni-toring at these 2 centers demonstratedno substantial errors.
Statistical Analyses
The analyses related to the associationbetween TnT and 30-day mortalitywere planned prior to evaluating anyof the data. Patients who did not com-plete the 30-day follow-up were cen-sored on the last day their vital statuswas known. We determined the per-centage of patients who died within30 days after surgery and the associ-ated 95% CI. We undertook a Coxproportional hazards model in whichthe dependent variable was mortalityuntil 30 days after surgery, and theindependent variables included 24preoperative variables (eAppendix 3).The model was repeated adding the peakfourth-generation TnT measurementduring the first 3 days after surgery asan independent variable and a mini-mum P value approach was used to de-termine if there were TnT threshold val-ues that independently altered thepatients’ risk of mortality.8 This ap-proach evaluated every possible thresh-old of TnT (eg, �0.01 vs �0.01; �0.02vs �0.02) in the multivariable modelwith the 24 preoperative variables. Thisanalysis showed the TnT value that dem-onstrated the smallest statistically sig-nificant P value was a TnT threshold thatindependently predicted 30-day mor-tality. Subsequently, this threshold wasfixed and the multivariable analysis wasrepeated to determine if there was an-other statistically significant threshold
POSTOPERATIVE TROPONIN LEVELS AND 30-DAY MORTALITY
2296 JAMA, June 6, 2012—Vol 307, No. 21 ©2012 American Medical Association. All rights reserved.Corrected on June 5, 2012
Downloaded From: http://jama.jamanetwork.com/ on 06/06/2012

in addition to the first threshold. Themultivariable analysis was repeated un-til we were no longer able to identify an-other statistically significant TnT thresh-old. The Kruskal-Wallis test was usedto identify any statistically significant dif-ferences in the median time from thepeak TnT value to death across the TnTthresholds that independently pre-dicted mortality.
For all independent predictors of30-day mortality, we report theadjusted hazard ratio (aHR), 95% CI,and associated P value (a priori2-sided �=.05 was designated as sta-tistically significant). For the TnTthresholds that independently pre-dicted 30-day mortality, we deter-mined the aHRs and their 95% CIsthrough bootstrapping 1000 samples.We undertook a random-effects(frailty) Cox model to adjust for anypotential site-clustering effect.9 Wecalculated the population attributablerisk for the independent predictors of30-day mortality.10,11 The populationattributable risk represents the pro-portion of all deaths potentially attrib-utable to the relevant risk factor (eg,an elevated TnT measurement) ifcausality were proven. For the TnTthresholds that independently pre-dicted 30-day mortality, we deter-mined the likelihood ratios. For themodel that included the peak TnTmeasurement, discrimination wasassessed through evaluation of theC index and calibration with agoodness-of-fit test.12-14 The differencein the C index between the model thatincluded the peak TnT measurementand the model that only includedpreoperative variables was examinedusing 1000 bootstrap samples. Assess-ment of improved risk classification,as demonstrated in the model thatincluded the peak TnT measurementvs the model that only included pre-operative variables, was made bycalculating the net reclassificationimprovement.15 For this analysis weclassified 30-day mortality as low risk(�1%), intermediate risk (1%-5%),high risk (�5%-10%), and very highrisk (�10%).
In patients for whom preoperativecreatinine was measured, we analyzedwhether there was an interactionbetween patients’ preoperative esti-mated glomerular filtration rate(eGFR) (�30 mL/min per 1.73 m2 orreceiving dialysis, 30 to 44 mL/minper 1.73 m2, 45 to 59 mL/min per1.73 m2, and �60 mL/min per 1.73m2)16,17 and the TnT thresholds thatindependently predicted 30-day mor-tality. For these analyses, we used aCox proportional hazard model thatincorporated a test for interaction anda priori �=.01 was designated as sta-tistically significant.
We undertook sensitivity analysesthat excluded patients with a preop-erative history of coronary artery dis-ease, recent high-risk coronary arterydisease, or congestive heart failureand a separate analysis excludingpatients who died within 36 hoursafter surgery. In the sensitivity analy-ses that included the other preopera-tive variables, we determined if theTnT thresholds established in ourmodel that included the peak TnTmeasurement continued to predict30-day mortality. Additional sensitiv-ity analyses were used to determine ifthe TnT thresholds that indepen-dently predict overall 30-day mortal-ity predicted both vascular mortalityand nonvascular mortality, based onthe center’s determination of thecause of death.
For all models, forced simultaneousentry (all candidate variables remainedin the models) was used rather thanautomated stepwise selection becausesimulations demonstrate a higherrisk of overfitting with the latter ap-proach.18,19 We assessed colinearityusing the variance inflation factor thatmeasures the extent to which the vari-ance of the model coefficients areinflated (because of the correlation ofa variable with other predictor vari-ables) if that variable is included in themodel. We considered variables with avariance inflation factor of greaterthan 10 to be colinear.20 All analyseswere performed using SAS version 9.2,except for the random-effect (frailty)
Cox model that was performed usingR, version 2.14.1.
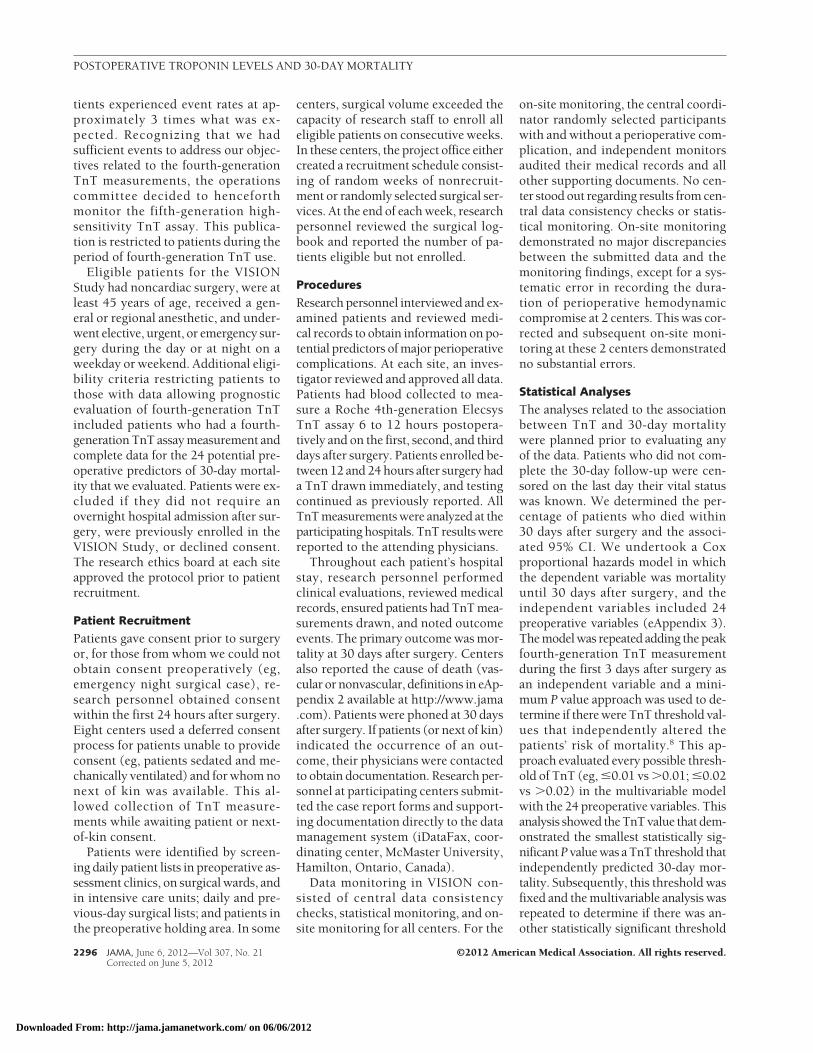
RESULTSFIGURE 1 reports the patient flow. Ofthe 15 133 patients included in theVISION fourth-generation TnT prog-nostic study, 99.7% of the patients com-pleted the 30-day follow-up. Centersthat recruited patients from August 6,2007 to January 11, 2011, are listed bylocation and number of patients ineTable 1.
eTable 2 reports the preoperative pa-tient characteristics and the type of sur-gery. Approximately 1 in 4 patients(24.2%) were at least 75 years of age and51.5% were women. The most com-mon vascular risk factors were hyper-tension (50.9%) and diabetes (19.5%),and 26.5% of the patients had activecancer. The most common surgerieswere major orthopedic surgery (20.4%),major general surgery (20.3%), andlow-risk surgeries (39.4%). The me-dian number of fourth-generation TnTmeasurements in the first 3 days aftersurgery was 3 (interquartile range [IQR]2-4).
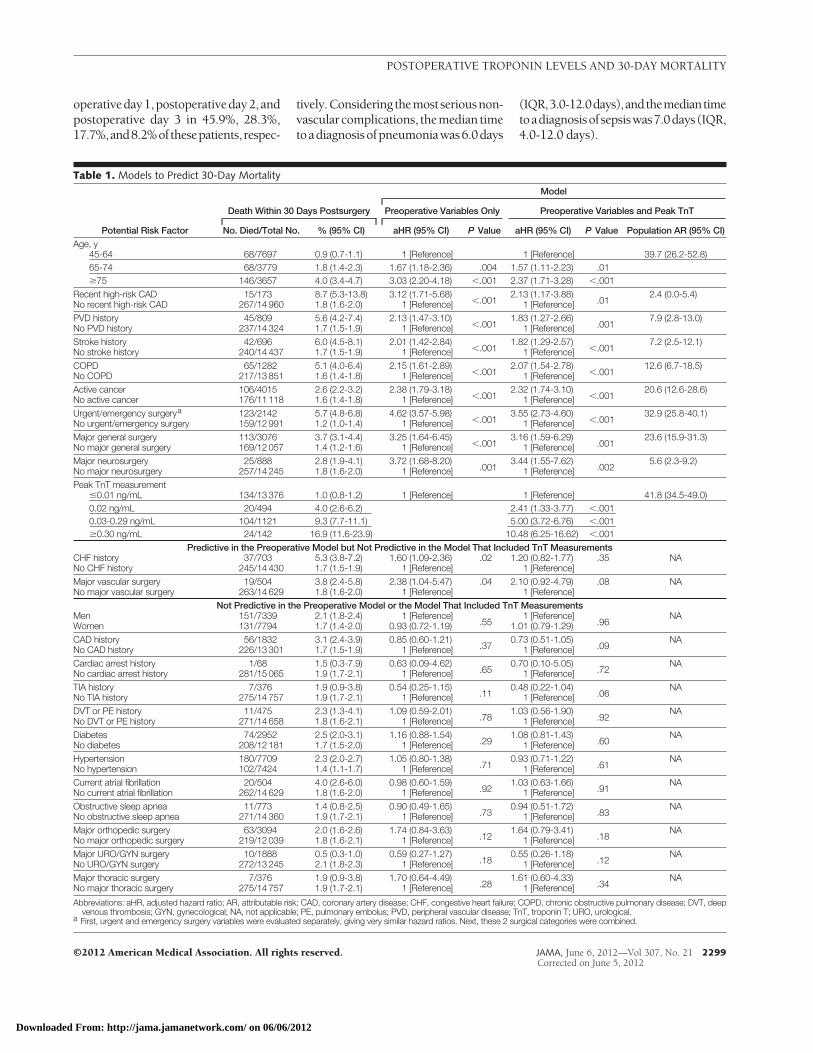
The 30-day mortality rate was 1.9%(282 deaths; 95% CI, 1.7%-2.1%), with26.6% dying after hospital discharge(median time from discharge to deathwas 11.0 days; IQR, 4.0-15.0 days).TABLE 1 presents the results of the pre-operative Cox proportional hazardsmodel. Eleven of the 24 variables as-sessed were independent predictors of30-day mortality. Urgent/emergencysurgery was the strongest preopera-tive predictor of 30-day mortality (aHR,4.62; 95% CI, 3.57-5.98).
Using a minimum P value ap-proach, multivariable analysis demon-strated that peak TnT threshold val-ues of 0.02 ng/mL, 0.03 ng/mL, and0.30 ng/mL were independently asso-ciated with 30-day mortality (Table 1).The random-effects (frailty) Cox modelthat adjusted for any potential site clus-tering effect produced similar results.A history of congestive heart failure andmajor vascular surgery independentlypredicted mortality in the preopera-tive model, but not in the model in-
POSTOPERATIVE TROPONIN LEVELS AND 30-DAY MORTALITY
©2012 American Medical Association. All rights reserved. JAMA, June 6, 2012—Vol 307, No. 21 2297Corrected on June 5, 2012
Downloaded From: http://jama.jamanetwork.com/ on 06/06/2012

cluding the peak TnT measurement.The strongest independent predictorsof 30-day mortality were a peak TnTvalue of 0.03 to 0.29 ng/mL (aHR, 5.00;95% CI, 3.72-6.76) and 0.30 ng/mL orgreater (aHR, 10.48; 95% CI, 6.25-16.62). The independent prognosticfactors identified in this model poten-tially explain the majority of the deathsthat occurred (ie, the total populationattributable risk was 89.0%; 95% CI,85.3-92.4); the prognostically rel-evant peak TnT values had the largestpopulation attributable risk (41.8%).
Peak TnT values of 0.01 ng/mL orless, 0.02 ng/mL, 0.03 to 0.29 ng/mL,and 0.30 ng/mL or greater occurred in88.4%, 3.3%, 7.4%, and 0.9% of thepatients, respectively. The incidenceof 30-day mortality was 1.0%, 4.0%,9.3%, and 16.9% in patients with apeak TnT values of 0.01 or less, 0.02,0.03 to 0.29, and 0.30 ng/mL orgreater, respectively. eTable 3 reports thelikelihood ratios for these TnT thresh-
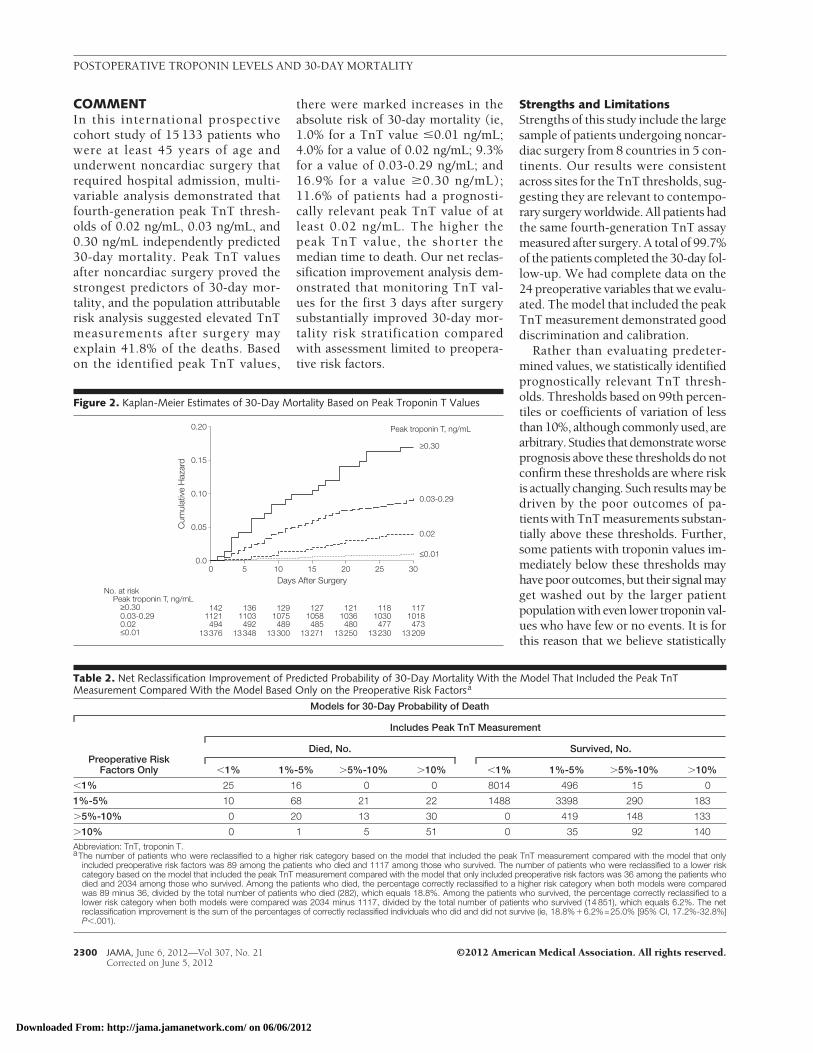
olds. Patients with TnT values that wereindependently associated with mortal-ity demonstrated the following mediantimes from the peak TnT measurementto death: 0.02 ng/mL (13.5 days; IQR,8.5-20 days); 0.03 to 0.29 ng/mL (9.0days; IQR, 3.5-16 days); and 0.30 ng/mLor greater (6.5 days; IQR, 1.5-15 days),P=.01 for differences among time todeath. FIGURE 2 reports Kaplan-Meierestimates for death based on the peakTnT values. eTable 4 reports the re-sults of our sensitivity analysis that ex-cluded patients who had a preopera-tive history of coronary artery disease,recent high-risk coronary artery dis-ease, or congestive heart failure, andeTable 5 reports the results of our sen-sitivity analysis that excluded patientswho died within the first 36 hours af-ter surgery. Both sensitivity analysesdemonstrated that results for the TnTthresholds did not appreciably differfrom the model that included all 15 133patients.
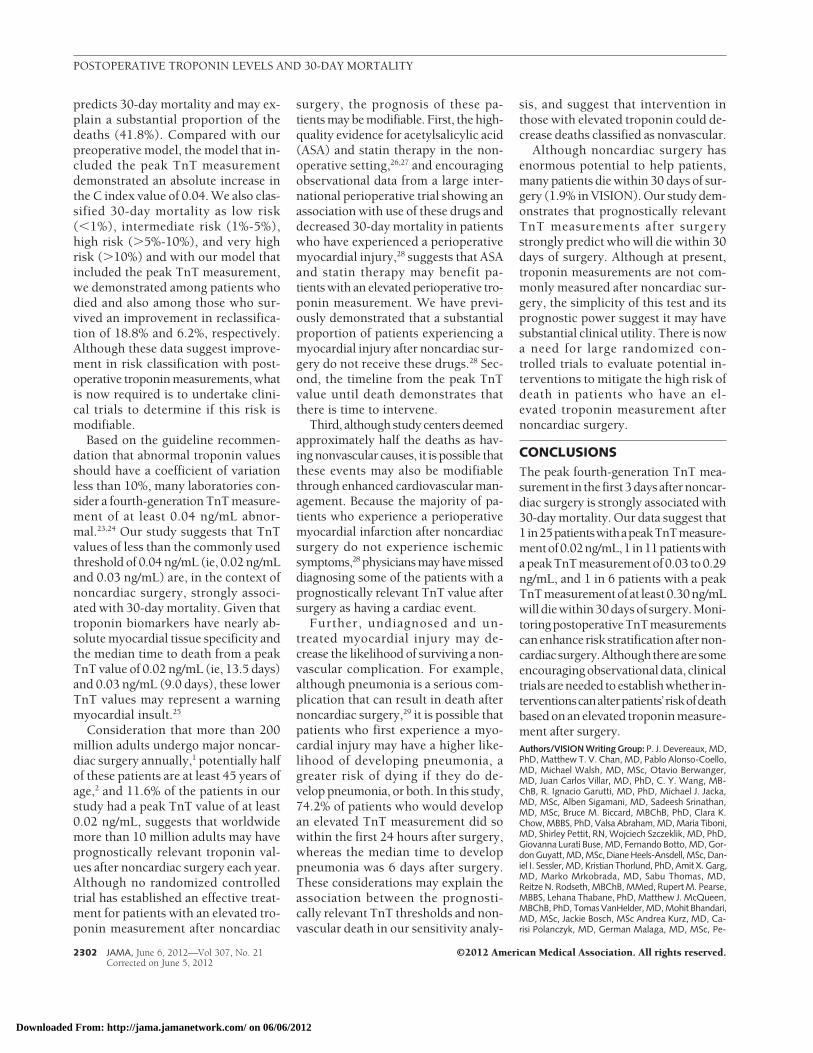
Each variable included in the modelsdemonstrated a variance inflation fac-tor of less than 10, suggesting no colin-earity. The model that included the peakTnT measurement demonstrated goodcalibration (goodness-of-fit test P=.43).The model that included the peak TnTmeasurement demonstrated good dis-crimination, as did the preoperativemodel without TnT measurement (C in-dex=0.85 vs 0.81; [difference, 0.4; 95%CI, 0.2-0.5] P� .001 for difference be-tween C index values). Among the pa-tients who died, the percentage cor-rectly reclassified toahigher riskcategorywith the model that included the peakTnT measurement compared with themodel that only included preoperativerisk factors was 18.8% (TABLE 2). Amongthe patients who survived, the percent-age correctly reclassified to a lower riskcategorywith themodel that included thepeak TnT measurement compared withthe model that only included preopera-tive risk factors was 6.2%. The net re-classification improvement associatedwith TnT measurement was 25.0% (95%CI, 17.2%-32.8%; P� .001).
Of the 14 008 (92.6%) patients inwhom preoperative creatinine levelswere measured, 520 patients (3.7%) hadan eGFR of less than 30 mL/min per1.73 m2 or were receiving dialysis; 760patients (5.4%) had an eGFR of 30 to44 mL/min per 1.73 m2; 1496 patients(10.7%) had an eGFR of 45 to 59 mL/min per 1.73 m2; and 11 232 patients(80.2%) had an eGFR of at least 60 mL/min per 1.73 m2. There was no inter-action between preoperative eGFR andthe TnT thresholds (P=.05).
Among the 282 patients who diedwithin30daysofsurgery,centersreporteda vascular cause of death in 127 patients(45.0%) and a nonvascular cause in 155patients (55.0%).TABLE 3 reports the in-dependentpredictorsof30-dayvascularmortalityandnonvascularmortalitysepa-rately.Theresults for theTnTthresholdsthatindependentlypredicted30-daymor-tality were not appreciably different forvascular and nonvascular mortality.Among patients who experienced a TnTelevation 0.02 ng/mL or greater, this oc-curredat6to12hoursaftersurgery,post-
Figure 1. Patient Flow Chart
15 133 Patients included in the final analyses
15 133 Included in the VISION fourth-generationTroponin T Prognostic Study
16 087 Enrolled in VISION
22 609 Screened in time
23 693 Patients fulfilled VISION eligibility criteria
40 Did not complete the 30-dayfollow-up and were censored atthe time of last contact
15 093 Completed the 30-day follow-up
1084 Not identified in time to enroll
6522 Excluded5262 Did not consent251 Cognitive impairment (unable to provide consent)134 Surgeon did not approve patient participation875 Other reasons
954 Excluded from the fourth-generation TroponinT Prognostic Study779 No troponin assay measured after surgery
146 Had peak troponin measurement reported as<0.04, <0.03, or <0.02 instead of the absolute value
29 Missing data on ≥1 of 24 clinical variables assessedin model
29 Died before a troponin assay was measured750 No troponin assay measured before discharge
POSTOPERATIVE TROPONIN LEVELS AND 30-DAY MORTALITY
2298 JAMA, June 6, 2012—Vol 307, No. 21 ©2012 American Medical Association. All rights reserved.Corrected on June 5, 2012
Downloaded From: http://jama.jamanetwork.com/ on 06/06/2012
operativeday1,postoperativeday2,andpostoperative day 3 in 45.9%, 28.3%,17.7%,and8.2%ofthesepatients,respec-
tively.Consideringthemostseriousnon-vascularcomplications, themedian timetoadiagnosisofpneumoniawas6.0days
(IQR,3.0-12.0days),andthemediantimetoadiagnosisofsepsiswas7.0days(IQR,4.0-12.0 days).
Table 1. Models to Predict 30-Day Mortality
Potential Risk Factor
Death Within 30 Days Postsurgery
Model
Preoperative Variables Only Preoperative Variables and Peak TnT
No. Died/Total No. % (95% CI) aHR (95% CI) P Value aHR (95% CI) P Value Population AR (95% CI)Age, y
45-64 68/7697 0.9 (0.7-1.1) 1 [Reference] 1 [Reference] 39.7 (26.2-52.8)65-74 68/3779 1.8 (1.4-2.3) 1.67 (1.18-2.36) .004 1.57 (1.11-2.23) .01�75 146/3657 4.0 (3.4-4.7) 3.03 (2.20-4.18) �.001 2.37 (1.71-3.28) �.001
Recent high-risk CAD 15/173 8.7 (5.3-13.8) 3.12 (1.71-5.68)�.001
2.13 (1.17-3.88).01
2.4 (0.0-5.4)No recent high-risk CAD 267/14 960 1.8 (1.6-2.0) 1 [Reference] 1 [Reference]PVD history 45/809 5.6 (4.2-7.4) 2.13 (1.47-3.10)
�.0011.83 (1.27-2.66)
.0017.9 (2.8-13.0)
No PVD history 237/14 324 1.7 (1.5-1.9) 1 [Reference] 1 [Reference]Stroke history 42/696 6.0 (4.5-8.1) 2.01 (1.42-2.84)
�.0011.82 (1.29-2.57)
�.0017.2 (2.5-12.1)
No stroke history 240/14 437 1.7 (1.5-1.9) 1 [Reference] 1 [Reference]COPD 65/1282 5.1 (4.0-6.4) 2.15 (1.61-2.89)
�.0012.07 (1.54-2.78)
�.00112.6 (6.7-18.5)
No COPD 217/13 851 1.6 (1.4-1.8) 1 [Reference] 1 [Reference]Active cancer 106/4015 2.6 (2.2-3.2) 2.38 (1.79-3.18)
�.0012.32 (1.74-3.10)
�.00120.6 (12.6-28.6)
No active cancer 176/11 118 1.6 (1.4-1.8) 1 [Reference] 1 [Reference]Urgent/emergency surgerya 123/2142 5.7 (4.8-6.8) 4.62 (3.57-5.98)
�.0013.55 (2.73-4.60)
�.00132.9 (25.8-40.1)
No urgent/emergency surgery 159/12 991 1.2 (1.0-1.4) 1 [Reference] 1 [Reference]Major general surgery 113/3076 3.7 (3.1-4.4) 3.25 (1.64-6.45)
�.0013.16 (1.59-6.29)
.00123.6 (15.9-31.3)
No major general surgery 169/12 057 1.4 (1.2-1.6) 1 [Reference] 1 [Reference]Major neurosurgery 25/888 2.8 (1.9-4.1) 3.72 (1.68-8.20)
.0013.44 (1.55-7.62)
.0025.6 (2.3-9.2)
No major neurosurgery 257/14 245 1.8 (1.6-2.0) 1 [Reference] 1 [Reference]Peak TnT measurement
�0.01 ng/mL 134/13 376 1.0 (0.8-1.2) 1 [Reference] 1 [Reference] 41.8 (34.5-49.0)0.02 ng/mL 20/494 4.0 (2.6-6.2) 2.41 (1.33-3.77) �.0010.03-0.29 ng/mL 104/1121 9.3 (7.7-11.1) 5.00 (3.72-6.76) �.001�0.30 ng/mL 24/142 16.9 (11.6-23.9) 10.48 (6.25-16.62) �.001
Predictive in the Preoperative Model but Not Predictive in the Model That Included TnT MeasurementsCHF history 37/703 5.3 (3.8-7.2) 1.60 (1.09-2.36) .02 1.20 (0.82-1.77) .35 NANo CHF history 245/14 430 1.7 (1.5-1.9) 1 [Reference] 1 [Reference]Major vascular surgery 19/504 3.8 (2.4-5.8) 2.38 (1.04-5.47) .04 2.10 (0.92-4.79) .08 NANo major vascular surgery 263/14 629 1.8 (1.6-2.0) 1 [Reference] 1 [Reference]
Not Predictive in the Preoperative Model or the Model That Included TnT MeasurementsMen 151/7339 2.1 (1.8-2.4) 1 [Reference]
.551 [Reference]
.96NA
Women 131/7794 1.7 (1.4-2.0) 0.93 (0.72-1.19) 1.01 (0.79-1.29)CAD history 56/1832 3.1 (2.4-3.9) 0.85 (0.60-1.21)
.370.73 (0.51-1.05)
.09NA
No CAD history 226/13 301 1.7 (1.5-1.9) 1 [Reference] 1 [Reference]Cardiac arrest history 1/68 1.5 (0.3-7.9) 0.63 (0.09-4.62)
.650.70 (0.10-5.05)
.72NA
No cardiac arrest history 281/15 065 1.9 (1.7-2.1) 1 [Reference] 1 [Reference]TIA history 7/376 1.9 (0.9-3.8) 0.54 (0.25-1.15)
.110.48 (0.22-1.04)
.06NA
No TIA history 275/14 757 1.9 (1.7-2.1) 1 [Reference] 1 [Reference]DVT or PE history 11/475 2.3 (1.3-4.1) 1.09 (0.59-2.01)
.781.03 (0.56-1.90)
.92NA
No DVT or PE history 271/14 658 1.8 (1.6-2.1) 1 [Reference] 1 [Reference]Diabetes 74/2952 2.5 (2.0-3.1) 1.16 (0.88-1.54)
.291.08 (0.81-1.43)
.60NA
No diabetes 208/12 181 1.7 (1.5-2.0) 1 [Reference] 1 [Reference]Hypertension 180/7709 2.3 (2.0-2.7) 1.05 (0.80-1.38)
.710.93 (0.71-1.22)
.61NA
No hypertension 102/7424 1.4 (1.1-1.7) 1 [Reference] 1 [Reference]Current atrial fibrillation 20/504 4.0 (2.6-6.0) 0.98 (0.60-1.59)
.921.03 (0.63-1.66)
.91NA
No current atrial fibrillation 262/14 629 1.8 (1.6-2.0) 1 [Reference] 1 [Reference]Obstructive sleep apnea 11/773 1.4 (0.8-2.5) 0.90 (0.49-1.65)
.730.94 (0.51-1.72)
.83NA
No obstructive sleep apnea 271/14 360 1.9 (1.7-2.1) 1 [Reference] 1 [Reference]Major orthopedic surgery 63/3094 2.0 (1.6-2.6) 1.74 (0.84-3.63)
.121.64 (0.79-3.41)
.18NA
No major orthopedic surgery 219/12 039 1.8 (1.6-2.1) 1 [Reference] 1 [Reference]Major URO/GYN surgery 10/1888 0.5 (0.3-1.0) 0.59 (0.27-1.27)
.180.55 (0.26-1.18)
.12NA
No URO/GYN surgery 272/13 245 2.1 (1.8-2.3) 1 [Reference] 1 [Reference]Major thoracic surgery 7/376 1.9 (0.9-3.8) 1.70 (0.64-4.49)
.281.61 (0.60-4.33)
.34NA
No major thoracic surgery 275/14 757 1.9 (1.7-2.1) 1 [Reference] 1 [Reference]
Abbreviations: aHR, adjusted hazard ratio; AR, attributable risk; CAD, coronary artery disease; CHF, congestive heart failure; COPD, chronic obstructive pulmonary disease; DVT, deepvenous thrombosis; GYN, gynecological; NA, not applicable; PE, pulmonary embolus; PVD, peripheral vascular disease; TnT, troponin T; URO, urological.
a First, urgent and emergency surgery variables were evaluated separately, giving very similar hazard ratios. Next, these 2 surgical categories were combined.
POSTOPERATIVE TROPONIN LEVELS AND 30-DAY MORTALITY
©2012 American Medical Association. All rights reserved. JAMA, June 6, 2012—Vol 307, No. 21 2299Corrected on June 5, 2012
Downloaded From: http://jama.jamanetwork.com/ on 06/06/2012
COMMENTIn this international prospectivecohort study of 15 133 patients whowere at least 45 years of age andunderwent noncardiac surgery thatrequired hospital admission, multi-variable analysis demonstrated thatfourth-generation peak TnT thresh-olds of 0.02 ng/mL, 0.03 ng/mL, and0.30 ng/mL independently predicted30-day mortality. Peak TnT valuesafter noncardiac surgery proved thestrongest predictors of 30-day mor-tality, and the population attributablerisk analysis suggested elevated TnTmeasurements after surgery mayexplain 41.8% of the deaths. Basedon the identified peak TnT values,
there were marked increases in theabsolute risk of 30-day mortality (ie,1.0% for a TnT value �0.01 ng/mL;4.0% for a value of 0.02 ng/mL; 9.3%for a value of 0.03-0.29 ng/mL; and16.9% for a value �0.30 ng/mL);11.6% of patients had a prognosti-cally relevant peak TnT value of atleast 0.02 ng/mL. The higher thepeak TnT value, the shorter themedian time to death. Our net reclas-sification improvement analysis dem-onstrated that monitoring TnT val-ues for the first 3 days after surgerysubstantially improved 30-day mor-tality risk stratification comparedwith assessment limited to preopera-tive risk factors.
Strengths and LimitationsStrengths of this study include the largesample of patients undergoing noncar-diac surgery from 8 countries in 5 con-tinents. Our results were consistentacross sites for the TnT thresholds, sug-gesting they are relevant to contempo-rary surgery worldwide. All patients hadthe same fourth-generation TnT assaymeasured after surgery. A total of 99.7%of the patients completed the 30-day fol-low-up. We had complete data on the24 preoperative variables that we evalu-ated. The model that included the peakTnT measurement demonstrated gooddiscrimination and calibration.
Rather than evaluating predeter-mined values, we statistically identifiedprognostically relevant TnT thresh-olds. Thresholds based on 99th percen-tiles or coefficients of variation of lessthan 10%, although commonly used, arearbitrary. Studies that demonstrate worseprognosis above these thresholds do notconfirm these thresholds are where riskis actually changing. Such results may bedriven by the poor outcomes of pa-tients with TnT measurements substan-tially above these thresholds. Further,some patients with troponin values im-mediately below these thresholds mayhave poor outcomes, but their signal mayget washed out by the larger patientpopulation with even lower troponin val-ues who have few or no events. It is forthis reason that we believe statistically
Figure 2. Kaplan-Meier Estimates of 30-Day Mortality Based on Peak Troponin T Values
0.20
0.15
0.10
0.05
0.0
Peak troponin T, ng/mLNo. at risk
Peak troponin T, ng/mL
≥0.30
≤0.01
0.03-0.29
0.02
0 5 10 15 20 25 30
≥0.30 142 136 129 127 121 118 1170.03-0.29 1121 1103 1075 1058 1036 1030 10180.02 494 492 489 485 480 477 473≤0.01 13 376 13 348 13 300 13 271 13 250 13 230 13 209
Days After Surgery
Cum
ulat
ive
Haz
ard
Table 2. Net Reclassification Improvement of Predicted Probability of 30-Day Mortality With the Model That Included the Peak TnTMeasurement Compared With the Model Based Only on the Preoperative Risk Factorsa
Models for 30-Day Probability of Death
Preoperative RiskFactors Only
Includes Peak TnT Measurement
Died, No. Survived, No.
�1% 1%-5% �5%-10% �10% �1% 1%-5% �5%-10% �10%
�1% 25 16 0 0 8014 496 15 0
1%-5% 10 68 21 22 1488 3398 290 183
�5%-10% 0 20 13 30 0 419 148 133
�10% 0 1 5 51 0 35 92 140Abbreviation: TnT, troponin T.aThe number of patients who were reclassified to a higher risk category based on the model that included the peak TnT measurement compared with the model that only
included preoperative risk factors was 89 among the patients who died and 1117 among those who survived. The number of patients who were reclassified to a lower riskcategory based on the model that included the peak TnT measurement compared with the model that only included preoperative risk factors was 36 among the patients whodied and 2034 among those who survived. Among the patients who died, the percentage correctly reclassified to a higher risk category when both models were comparedwas 89 minus 36, divided by the total number of patients who died (282), which equals 18.8%. Among the patients who survived, the percentage correctly reclassified to alower risk category when both models were compared was 2034 minus 1117, divided by the total number of patients who survived (14 851), which equals 6.2%. The netreclassification improvement is the sum of the percentages of correctly reclassified individuals who did and did not survive (ie, 18.8%�6.2%=25.0% [95% CI, 17.2%-32.8%]P�.001).
POSTOPERATIVE TROPONIN LEVELS AND 30-DAY MORTALITY
2300 JAMA, June 6, 2012—Vol 307, No. 21 ©2012 American Medical Association. All rights reserved.Corrected on June 5, 2012
Downloaded From: http://jama.jamanetwork.com/ on 06/06/2012

identifying prognostically relevant TnTthresholds based on the actual data area more appropriate method.
This study also has limitations. We didnot measure a TnT value prior to sur-gery and cannot comment on how apreoperative value would impact riskprediction.Weonlymeasured the fourth-generation TnT assay, and thereforecannot comment on the prognostic rel-evance of other troponin assays. De-spite our large sample size, only 1263 pa-tients had a peak troponin threshold of0.03 ng/mL or greater. Therefore, it ispossible with an even larger cohort thatwe may have identified another statisti-cally significant and prognostically rel-evant TnT threshold between 0.03-0.29 ng/mL and at greater than 0.30 ng/mL. Although we did not demonstratean interaction between preoperativeeGFR and the TnT thresholds, we can-not exclude an interaction, especially atlower levels of renal function. Our re-sults are, however, consistent with a prior
large (N=7033) acute coronary syn-drome study that demonstrated TnT lev-els predicted 30-day mortality regard-less of patients’ baseline eGFR.21 We didnot capture whether patients were re-cruited prior to or after surgery, andtherefore we cannot evaluate these sub-groups of patients separately. We did notrecord whether any actions were takenbased on the TnT values reported to phy-sicians, and therefore we cannot com-ment on the potential impact of any suchinterventions. If physicians imple-mented therapies based upon these TnTmeasurements and these interventionsimpacted 30-day mortality, then our 30-day mortality rates associated with el-evated TnT measurements likely repre-sent the mortality rates future unblindedphysicians can expect in their clinicalpractice.
Comparison to Other Studies
Levy et al22 undertook a meta-analysisof 10 studies (N=1728 patients) that as-
sessed the independent prognostic ca-pabilities of an elevated troponin mea-surement after noncardiac surgeryto predict intermediate-term (�12months) mortality and demonstrated anodds ratio of 6.7 (95% CI, 4.1-10.9;I2=0%).22 The studies in this meta-analysis used several different tro-ponin assays, numerous different tro-ponin thresholds, and did not evaluatethe impact on short-term mortality(�30 days). Le Manach et al7 demon-strated in a study of 1136 abdominalaortic surgical cases that a Dade-Behring Troponin I measurement ofgreater than 1.5 ng/mL was an inde-pendent predictor of in-hospital mor-tality. Our study included a muchbroader spectrum of noncardiac sur-geries and a much larger sample size.
Interpretation
We have demonstrated that the peakfourth-generation TnT measurement inthe first 3 days after surgery strongly
Table 3. Perioperative Independent Predictors of 30-Day Causes of Death (Vascular and Nonvascular) as Reported by Centers
Potential Independent Predictors
Vascular Mortality (n = 127)Nonvascular Mortality (n = 155)
No./No.a % (95% CI)Adjusted HR
(95% CI) No./No.a % (95% CI) aHR (95% CI)
Age, y45-64 24/7697 0.3 (0.2-0.5) 1 [Reference] 44/7697 0.6 (0.4-0.8) 1 [Reference]
65-75 25/3779 0.7 (0.4-1.0) 1.59 (0.90-2.81) 43/3779 1.1 (0.8-1.5) 1.56 (1.02-2.38)
�75 78/3657 2.1 (1.7-2.7) 3.29 (2.03-5.35) 68/3657 1.9 (1.5-2.4) 1.83 (1.22-2.74)
Recent high-risk CAD 11/173 6.4 (3.6-11.0) 2.48 (1.30-4.73) 4/173 2.3 (0.9-5.8) 0.95 (0.34-2.60)No recent high-risk CAD 116/14 960 0.8 (0.6-0.9) 1 [Reference] 151/14960 1.0 (0.9-1.2) 1 [Reference]
History of PVD 23/809 2.8 (1.9-4.2) 1.66 (1.03-2.67) 22/809 2.7 (1.8-4.1) 2.07 (1.29-3.32)No history of PVD 104/14 324 0.7 (0.6-0.9) 1 [Reference] 133/14324 0.9 (0.8-1.1) 1 [Reference]
History of stroke 28/696 4.0 (2.8-5.8) 2.66 (1.72-4.10) 14/696 2.0 (1.2-3.3) 1.15 (0.66-2.03)No history of stroke 99/14 437 0.7 (0.6-0.8) 1 [Reference] 141/14437 1.0 (0.8-1.2) 1 [Reference]
COPD 36/1282 2.8 (2.0-3.9) 2.65 (1.78-3.95) 29/1282 2.3 (1.6-3.2) 1.63 (1.07-2.47)No COPD 91/13 851 0.7 (0.5-0.8) 1 [Reference] 126/13851 0.9 (0.8-1.1) 1 [Reference]
Active cancer 29/4015 0.7 (0.5-1.0) 1.14 (0.72-1.79) 77/4015 1.9 (1.5-2.4) 3.17 (2.22-4.53)No active cancer 98/11 118 0.9 (0.7-1.1) 1 [Reference] 78/11118 0.7 (0.6-0.9) 1 [Reference]
Urgent/emergency surgery 58/2142 2.7 (2.1-3.5) 3.26 (2.24-4.75) 65/2142 3.0 (2.4-3.8) 4.26 (3.00-6.04)No urgent/emergency surgery 69/12 991 0.5 (0.4-0.7) 1 [Reference] 90/12991 0.7 (0.6-0.9) 1 [Reference]
Major general surgery 36/3076 1.2 (0.8-1.6) 1.57 (1.04-2.38) 77/3076 2.5 (2.0-3.1) 3.04 (2.15-4.31)No major general surgery 91/12 057 0.8 (0.6-0.9) 1 [Reference] 78/12057 0.6 (0.5-0.8) 1 [Reference]
Major neurosurgery 12/888 1.4 (0.8-2.3) 2.46 (1.32-4.58) 13/888 1.5 (0.9-2.5) 2.74 (1.49-5.03)No major neurosurgery 115/14 245 0.8 (0.7-1.0) 1 [Reference] 142/14245 1.0 (0.8-1.2) 1 [Reference]
Peak TnT measurement�0.01 ng/mL 56/13 376 0.4 (0.3-0.5) 1 [Reference] 78/13376 0.6 (0.5-0.7) 1 [Reference]
0.02 ng/mL 7/494 1.4 (0.7-2.9) 1.65 (0.74-3.67) 13/494 2.6 (1.5-4.4) 3.25 (1.78-5.94)
0.03-0.29 ng/mL 51/1121 4.5 (3.5-5.9) 4.81 (3.18-7.25) 53/1121 4.7 (3.6-6.1) 5.06 (3.47-7.38)
�0.30 ng/mL 13/142 9.2 (5.4-15.0) 10.01 (5.30-18.90) 11/142 7.7 (4.4-13.3) 9.20 (4.79-17.65)Abbreviations: aHR, adjusted hazard ratio; CAD, coronary artery disease; COPD, chronic obstructive pulmonary disease; PVD, peripheral vascular disease; TnT, troponin T.aNo./No., number of patients who died in subgroup /total number of patients in subgroup.
POSTOPERATIVE TROPONIN LEVELS AND 30-DAY MORTALITY
©2012 American Medical Association. All rights reserved. JAMA, June 6, 2012—Vol 307, No. 21 2301Corrected on June 5, 2012
Downloaded From: http://jama.jamanetwork.com/ on 06/06/2012
predicts 30-day mortality and may ex-plain a substantial proportion of thedeaths (41.8%). Compared with ourpreoperative model, the model that in-cluded the peak TnT measurementdemonstrated an absolute increase inthe C index value of 0.04. We also clas-sified 30-day mortality as low risk(�1%), intermediate risk (1%-5%),high risk (�5%-10%), and very highrisk (�10%) and with our model thatincluded the peak TnT measurement,we demonstrated among patients whodied and also among those who sur-vived an improvement in reclassifica-tion of 18.8% and 6.2%, respectively.Although these data suggest improve-ment in risk classification with post-operative troponin measurements, whatis now required is to undertake clini-cal trials to determine if this risk ismodifiable.
Based on the guideline recommen-dation that abnormal troponin valuesshould have a coefficient of variationless than 10%, many laboratories con-sider a fourth-generation TnT measure-ment of at least 0.04 ng/mL abnor-mal.23,24 Our study suggests that TnTvalues of less than the commonly usedthreshold of 0.04 ng/mL (ie, 0.02 ng/mLand 0.03 ng/mL) are, in the context ofnoncardiac surgery, strongly associ-ated with 30-day mortality. Given thattroponin biomarkers have nearly ab-solute myocardial tissue specificity andthe median time to death from a peakTnT value of 0.02 ng/mL (ie, 13.5 days)and 0.03 ng/mL (9.0 days), these lowerTnT values may represent a warningmyocardial insult.25
Consideration that more than 200million adults undergo major noncar-diac surgery annually,1 potentially halfof these patients are at least 45 years ofage,2 and 11.6% of the patients in ourstudy had a peak TnT value of at least0.02 ng/mL, suggests that worldwidemore than 10 million adults may haveprognostically relevant troponin val-ues after noncardiac surgery each year.Although no randomized controlledtrial has established an effective treat-ment for patients with an elevated tro-ponin measurement after noncardiac
surgery, the prognosis of these pa-tients may be modifiable. First, the high-quality evidence for acetylsalicylic acid(ASA) and statin therapy in the non-operative setting,26,27 and encouragingobservational data from a large inter-national perioperative trial showing anassociation with use of these drugs anddecreased 30-day mortality in patientswho have experienced a perioperativemyocardial injury,28 suggests that ASAand statin therapy may benefit pa-tients with an elevated perioperative tro-ponin measurement. We have previ-ously demonstrated that a substantialproportion of patients experiencing amyocardial injury after noncardiac sur-gery do not receive these drugs.28 Sec-ond, the timeline from the peak TnTvalue until death demonstrates thatthere is time to intervene.
Third, although study centers deemedapproximately half the deaths as hav-ing nonvascular causes, it is possible thatthese events may also be modifiablethrough enhanced cardiovascular man-agement. Because the majority of pa-tients who experience a perioperativemyocardial infarction after noncardiacsurgery do not experience ischemicsymptoms,28 physicians may have misseddiagnosing some of the patients with aprognostically relevant TnT value aftersurgery as having a cardiac event.
Further, undiagnosed and un-treated myocardial injury may de-crease the likelihood of surviving a non-vascular complication. For example,although pneumonia is a serious com-plication that can result in death afternoncardiac surgery,29 it is possible thatpatients who first experience a myo-cardial injury may have a higher like-lihood of developing pneumonia, agreater risk of dying if they do de-velop pneumonia, or both. In this study,74.2% of patients who would developan elevated TnT measurement did sowithin the first 24 hours after surgery,whereas the median time to developpneumonia was 6 days after surgery.These considerations may explain theassociation between the prognosti-cally relevant TnT thresholds and non-vascular death in our sensitivity analy-
sis, and suggest that intervention inthose with elevated troponin could de-crease deaths classified as nonvascular.
Although noncardiac surgery hasenormous potential to help patients,many patients die within 30 days of sur-gery (1.9% in VISION). Our study dem-onstrates that prognostically relevantTnT measurements after surgerystrongly predict who will die within 30days of surgery. Although at present,troponin measurements are not com-monly measured after noncardiac sur-gery, the simplicity of this test and itsprognostic power suggest it may havesubstantial clinical utility. There is nowa need for large randomized con-trolled trials to evaluate potential in-terventions to mitigate the high risk ofdeath in patients who have an el-evated troponin measurement afternoncardiac surgery.
CONCLUSIONSThe peak fourth-generation TnT mea-surement in the first3daysafternoncar-diac surgery is strongly associated with30-day mortality. Our data suggest that1in25patientswithapeakTnTmeasure-mentof0.02ng/mL,1 in11patientswithapeakTnTmeasurementof0.03 to0.29ng/mL, and 1 in 6 patients with a peakTnTmeasurementofat least0.30ng/mLwilldiewithin30daysof surgery.Moni-toringpostoperativeTnTmeasurementscanenhanceriskstratificationafternon-cardiacsurgery.Althoughtherearesomeencouraging observational data, clinicaltrials areneeded toestablishwhether in-terventionscanalterpatients’riskofdeathbased on an elevated troponin measure-ment after surgery.Authors/VISION Writing Group: P. J. Devereaux, MD,PhD, Matthew T. V. Chan, MD, Pablo Alonso-Coello,MD, Michael Walsh, MD, MSc, Otavio Berwanger,MD, Juan Carlos Villar, MD, PhD, C. Y. Wang, MB-ChB, R. Ignacio Garutti, MD, PhD, Michael J. Jacka,MD, MSc, Alben Sigamani, MD, Sadeesh Srinathan,MD, MSc, Bruce M. Biccard, MBChB, PhD, Clara K.Chow, MBBS, PhD, Valsa Abraham, MD, Maria Tiboni,MD, Shirley Pettit, RN, Wojciech Szczeklik, MD, PhD,Giovanna Lurati Buse, MD, Fernando Botto, MD, Gor-don Guyatt, MD, MSc, Diane Heels-Ansdell, MSc, Dan-iel I. Sessler, MD, Kristian Thorlund, PhD, Amit X. Garg,MD, Marko Mrkobrada, MD, Sabu Thomas, MD,Reitze N. Rodseth, MBChB, MMed, Rupert M. Pearse,MBBS, Lehana Thabane, PhD, Matthew J. McQueen,MBChB, PhD, Tomas VanHelder, MD, Mohit Bhandari,MD, MSc, Jackie Bosch, MSc Andrea Kurz, MD, Ca-risi Polanczyk, MD, German Malaga, MD, MSc, Pe-
POSTOPERATIVE TROPONIN LEVELS AND 30-DAY MORTALITY
2302 JAMA, June 6, 2012—Vol 307, No. 21 ©2012 American Medical Association. All rights reserved.Corrected on June 5, 2012
Downloaded From: http://jama.jamanetwork.com/ on 06/06/2012
ter Nagele, MD, MSc, Yannick Le Manach, MD, PhD,Martin Leuwer, MD, PhD, Salim Yusuf, MD, DPhil;The Vascular Events in Noncardiac Surgery PatientsCohort Evaluation (VISION) Study Investigators.Author Affiliations: are available as eAppendix 1 athttp://www.jama.com.Author Contributions: Dr Devereaux had full accessto all of the data in the study and takes responsibilityfor the integrity of the data and the accuracy of thedata analysis.Study concept and design: Chan, Walsh, Villar, Jacka,Botto, Guyatt, Thorlund, Mrkobrada, Thomas,Bhandari, Yusuf, Devereaux.Acquisition of data: Chan, Alonso-Coello, Walsh, Villar,Wang, Garutti, Sigamani, Srinathan, Biccard, Chow,Abraham, Tiboni, Pettit, Szczeklik, Lurati-Buse, Botto,Mrkobrada, Thomas, Rodseth, Pearse, McQueen,VanHelder, Bosch, Polanczyk, Malaga, Nagele, Yusuf,Devereaux.Analysis and interpretation of data: Chan,Alonso-Coello, Walsh, Berwanger, Villar, Wang,Szczeklik, Lurati-Buse, Botto, Heels-Ansdell, Sessler,Thorlund, Garg, Mrkobrada, Thomas, Rodseth, Pearse,Thabane, McQueen, VanHelder, Kurz, Polanczyk,LeManach, Leuwer, Yusuf, Devereaux.Drafting of the manuscript: Devereaux.Critical revision of the manuscript for important in-tellectual content: Chan, Alonso-Coello, Walsh,Berwanger, Villar, Wang, Garutti, Jacka, Sigamani,Srinathan, Biccard, Chow, Abraham, Tiboni, Szczeklik,Lurati-Buse, Botto, Guyatt, Heels-Ansdell, Sessler,Thorlund, Garg, Mrkobrada, Thomas, Rodseth, Pearse,Thabane, McQueen, Bhandari, Bosch, Kurz, Polanczyk,Malaga, Nagele, Leuwer, Yusuf, Devereaux.Statistical analysis: Heels-Ansdell, Thorlund,Thabane.Obtained funding: Chan, Alonso-Coello, Walsh, Wang,Srinathan, Chow, Thomas, Pearse, Bhandari, Polanczyk,Nagele, Devereaux.Administrative, technical, or material support: Chan,Walsh, Berwanger, Villar, Sigamani, Srinathan,Biccard, Abraham, Szczeklik, Lurati-Buse, Botto,Mrkobrada, Rodseth, McQueen, Bosch, Leuwer, Yusuf,Devereaux.Study supervision: Walsh, Garutti, Jacka, Sigamani,Biccard, Tiboni, Szczeklik, Botto, Sessler, McQueen,VanHelder, Bhandari, Malaga, Nagele, Devereaux.Conflict of Interest Disclosures: All authors have com-pleted and submitted the ICMJE Form for Disclosureof Potential Conflicts of Interest. Drs Chan, Walsh, Car-los Villar, Garutti, Jacka, Srinathan, Biccard, Tiboni,Szczeklik, McQueen, VanHelder, Bhandari, Kurz,Malaga, Nagele, Leuwer, and Devereaux; and MsBosch report receipt of a grant(s) to their institutionfrom Roche Diagnostics Global Office (Troponin T as-says and some financial support for the VISION Study).Dr Chan reports receipt of institutional grants from thePublic Policy Research Fund, Research Grant Coun-cil, Hong Kong SAR, and a project grant from the Aus-tralian and New Zealand College of Anesthesiolo-gists; Drs Alonzo-Coello and Garutti report receipt ofinstitutional grants from Instituto de Salud Carlos III,and Fundacio La Marato de TV3; Dr Walsh reports re-ceipt of institutional grants from the Canadian Insti-tutes of Health Research, and Pfizer Canada; Dr Garuttireports receipt of an institutional grant from the Span-ish Health Ministry; Dr Srinathan reports receipt of in-stitutional grants from Manitoba Medical ServicesFoundation, Manitoba Health Research Council, Uni-verity of Manitoba Department of Surgery, Health Sci-ences Research Foundation, and employment with theWinnipeg Regional Health Authority; Dr Chow re-ports receipt of an institutional grant from Abbott, feesfor development of educational presentations from As-traZeneca, and that her salary is partially supportedby the National Health and Medical Research Coun-cil Program Grant (Australia); Dr Abraham reports re-ceipt of an institutional grant from Christian MedicalCollege, Ludhiana; Dr Szczeklik reports having served
on the speakers bureau for Jagiellonian University; DrsGuyatt and Devereaux report receipt of an institu-tional grant from McMaster University (no depart-ment specified); Dr Pearse reports receipt of institu-tional grants from National Institute for Health Research(UK), Circassia Holdings plc, and LiDCo Ltd; consul-tancy fees from Covidien Inc; and having served onspeakers bureaus for Pulsion Medical Systems, Ed-wards Lifesciences, and B. Braun. Dr McQueen re-ports receipt of an institutional grant from the CanadianInstitutes of Health Research, Sanofi, GlaxoSmithKline,AstraZeneca, Roche, and Beckman; and having servedon speakers bureaus for Merck, Roche, and Merck-Frosst. Dr Bhandari reports receipt of institutional grantsfrom Smith & Nephew and DePuy; and provision ofconsultancy services to Stryker, Smith & Nephew, andAmgen. Dr Malaga reports employment with Univer-sidad Peruana Cayetano Heredia; and Dr Nagele re-ports receipt of an institutional grant from the Ameri-can Heart Association, and provision of consultancyservices to the Gerson-Lehrman Group. The remain-ining authors report no disclosures.Funding/Support: Funding for this study comesfrom more than 50 grants for VISION and its sub-studies. Dr Devereaux reports receipt of institu-tional grants for VISION from: Canadian Institutesof Health Research (6 grants), Heart and StrokeFoundation of Ontario (2 grants), Academic HealthScience Centres Alternative Funding Plan Innova-tion Fund Grant, Population Health ResearchInstitute Grant, Clarity Research Group Grant,McMaster University, Department of Surgery, Sur-gical Associates Research Grant, Hamilton HealthScience New Investigator Fund Grant, HamiltonHealth Sciences Grant, Ontario Ministry ofResource and Innovation Grant, Stryker Canada,McMaster University, Department of Anesthesiol-ogy (2 grants), Saint Joseph’s Healthcare—Department of Medicine (2 grants), Father SeanO’Sullivan Research Centre (2 grants), McMasterUniversity—Department of Medicine (2 grants),Hamilton Health Sciences Summer Studentships (6grants), McMaster University—Department ofClinical Epidemiology and Biostatistics Grant,McMaster University—Division of CardiologyGrant, and Canadian Network and Centre for TrialsInternational Grant. Other grants provided butnot indicated as received by a specific author/institution: Winnipeg Health Sciences FoundationOperating Grant; Diagnostic Services of ManitobaResearch Grant; University of Manitoba, Faculty ofDentistry Operational Fund; Projeto Hospitais deExcelencia a Servico do SUS grant from the BrazilianMinistry of Health in Partnership with Hcor (CardiacHospital Sao Paulo-SP); School of Nursing, Univer-sidad Industrial de Santander; Grupo de CardiologıaPreventiva, Universidad Autonoma de Bucara-manga; Fundacion Cardioinfantil—Instituto de Car-diologıa; Alianza Diagnostica SA; University ofMalaya Research Grant; and University of Malaya,Penyelidikan Jangka Pendek Grant.Role of the Sponsors: The VISION Study fundingsources had no role in the design and conduct of thestudy; collection, management, analysis, and inter-pretation of the data; and preparation, review, orapproval of the manuscriptOperations Committee: P. J. Devereaux, D. I.Sessler, M. Walsh, G. Guyatt, M. McQueen, M.Bhandari, D. Cook, J. Bosch, N. Buckley, P. Raina,and S. Yusuf.VISION Investigators: Sydney, Australia: Clara K.Chow, Graham S. Hillis, Richard Halliwell, Stephen Li,Vincent W. Lee, and John Mooney. Brazil: Carisi A.Polanczyk and Mariana V. Furtado (Porto Alegre); andOtavio Berwanger, Erica Suzumura, Eliana Santucci,Katia Leite, Jose Amalth do Espirirto Santo, Cesar A.P. Jardim, Alexandre Biasi Cavalcanti, and Helio PennaGuimaraes (Sao Paulo). Canada: Michael J. Jacka, Mi-chelle Graham, Finlay McAlister, Sean McMurtry, Derek
Townsend, Neesh Pannu, and Sean Bagshaw, Uni-versity of Alberta Hospital (Edmonton, Alberta); Mo-hit Bhandari, John Eikelboom, Javier Ganame, JamesHankinson, Stephen Hill, Sanjit Jolly, Andre Lamy, Eliza-beth Ling, Patrick Magloire, Karen Raymer, David Sza-lay, Jacques Tittley, Jeff Weitz, and Richard Whit-lock, Hamilton General Hospital, Hamilton HealthSciences (HHS); Saeed Darvish-Kazim, Justin De-Beer, Peter Kavsak, Clive Kearon, Richard Mizera, Mar-tin O’Donnell, Jehonathan Pinthus, Sebastian Ribas,Jagmeet Sethi, Tej Sheth, Marko Simunovic, TomasVanHelder, and Mitchell Winemaker, Juravinski Hos-pital and Cancer Centre, HHS; Hertzel Gerstein, MichaelMarcaccio, Sarah McDonald, Paul O’Bryne, AmeenPatel, James Paul, Zubin Punthakee, Omid Salehian,Fred Spencer, Stephen Walter, and Andrew Worster,McMaster University Medical Centre, HHS; AnthonyAdili, Catherine Clase, Deborah Cook, Mark Crowther,James Douketis, Hugh Fuller, Azim Gangji, Paul Jack-son, Wendy Lim, Peter Lovrics, Sergio Mazzadi, Wil-liam Orovan, Jill Rudkowski, Mark Soth, and MariaTiboni, St Joseph’s Hospital (Hamilton, Ontario); andSadeesh K. Srinathan, Clare Ramsey, Philip St John,Laurel Thorlacius, Faisal S. Siddiqui, Hilary P. Gro-cott, Andrew McKay, Justin Wong, Trevor W. R. Lee,Ryan Amadeo, Duane Funk, Heather McDonald, andJames Zacharias, Health Sciences Centre Winnipeg(Winnipeg, Manitoba). Bucaramanga, Colombia: JuanCarlos Villar, Olga Lucıa Cortes, Maria Stella Chap-arro, Skarlett Vasquez, Silvia Fererira, and Alvaro Casta-neda. Hong Kong, People’s Republic of China: Mat-thew T. V. Chan, Gordon Y. S. Choi, Tony Gin, andLydia C. W. Lit. India: Denis Xavier, Alben Sigamani,Atiya Faruqui, Radhika Dhanpal, Smitha Almeida, Jo-seph Cherian, and Sultana Furruqh (Bangalore); andValsa Abraham, Lalita Afzal, Preetha George, andShaveta Mala (Ludhiana). Kuala Lumpur, Malaysia:C. Y. Wang, G. S. Y. Ong, M Mansor, Alvin S. B. Tan,I. I. Shariffuddin, V. Vajiravelu, N. H. M. Hashim, A.Wahab Undok, K. I. Ushananthini, H. Y. Lai, W. A.Wan Azman, and A. H. A. Razack. Lima, Peru: Ger-man Malaga, Vanessa Valderrama-Victoria, DanielRomero-Tuesta, Johanna Vasquez-Grande, and JavierD. Loza-Herrera. Krakow, Poland: Wojciech Szczek-lik, Barbara Sokolowska, Jacek Musial, Jacek Gorka,Pawel Iwaszczuk, Krzysztof Zajac, Maciej Chwala, Mar-cin Zaczek, and Tomasz Mrowiecki. Durban, SouthAfrica: Bruce Biccard, Hussein Cassimjee, Dean Go-palan, Theroshnie Kisten, Aine Mugabi, Prebashini Nai-doo, Lucelle Padayachee, Santosh Pershad, Reitze Rod-seth, David Skinner, and Alex Torborg. Spain: PilarPaniagua, Gerard Urrutia, Mari Luz Maestre, MiquelSantalo, Raul Gonzalez, Adrià Font, Sonia Mirabet, Ce-cilia Martınez, Xavier Pelaez, Marta De Antonio, JoseMarcial Villamor, Maria Jose Ferre, Ekaterina Popova,and Pablo Alonso-Coello (Barcelona); and IgnacioGarutti, Patricia Cruz, Carmen Fernandez, Susana Dıaz,Teresa del Castillo, Angeles de Miguel, Manuel Mu-noz, Maria Palencia, Patricia Pineiro, Alberto Varela,Maria del Barrio, Gabriel Cusati, Alejandro Fernan-dez, Maria Jose Membrillo, and Hector Bueno (Ma-drid). England: C. Williams, A. Rushton, I. Welters, andM. Leuwer (Liverpool); and Rupert Pearse, Ahsun Khan,Edyta Niebrzegowska, Sally Benton, Andrew Wragg,Andrew Archbold, Amanda Smith, Eleanor Mcalees,Cheryl Ramballi, Neil Macdonald, and MartaJanuszewska (London). United States: Daniel I. Sessler,and Andrea Kurz (Cleveland, Ohio); and Peter Nagele,Jane Blood, Megan Kalin, David Gibson, and Troy Wil-des (St Louis, Missouri).Study Coordination: This study was coordinated bythe Clinical Advances Through Research and Infor-mation Translation (CLARITY) project office and thePopulation Health Research Institute (PHRI), at theHamilton Health Sciences, McMaster University, Ham-ilton, Ontario, Canada.Online-Only Material: eAppendixes 1 through 3 andeTables 1 through 5 are available at http://www.jama.com.
POSTOPERATIVE TROPONIN LEVELS AND 30-DAY MORTALITY
©2012 American Medical Association. All rights reserved. JAMA, June 6, 2012—Vol 307, No. 21 2303Corrected on June 5, 2012
Downloaded From: http://jama.jamanetwork.com/ on 06/06/2012
REFERENCES
1. Weiser TG, Regenbogen SE, Thompson KD, et al.An estimation of the global volume of surgery. Lancet.2008;372(9633):139-144.2. Devereaux PJ, Chan M, Eikelboom J. Major vas-cular complications in patients undergoing noncar-diac surgery: the magnitude of the problem, risk pre-diction, surveillance, and prevention. In: Yusuf S, CairnsJA, Camm AJ, Fallen EL, Gersh BJ, eds. Evidence-Based Cardiology. 3rd ed. London, England: BMJBooks; 2009:47-62.3. Devereaux PJ, Yang H, Yusuf S, et al; POISE StudyGroup. Effects of extended-release metoprololsuccinate in patients undergoing non-cardiac sur-gery (POISE trial. Lancet. 2008;371(9627):1839-1847.4. Ford MK, Beattie WS, Wijeysundera DN. System-atic review: prediction of perioperative cardiac com-plications and mortality by the revised cardiac risk index.Ann Intern Med. 2010;152(1):26-35.5. Gordon HS, Johnson ML, Wray NP, et al. Mortal-ity after noncardiac surgery: prediction from admin-istrative versus clinical data. Med Care. 2005;43(2):159-167.6. Kim LJ, Martinez EA, Faraday N, et al. Cardiac tro-ponin I predicts short-term mortality in vascular sur-gery patients. Circulation. 2002;106(18):2366-2371.7. Le Manach Y, Perel A, Coriat P, Godet G, BertrandM, Riou B. Early and delayed myocardial infarction af-ter abdominal aortic surgery. Anesthesiology. 2005;102(5):885-891.8. Mazumdar M, Smith A, Bacik J. Methods for cat-egorizing a prognostic variable in a multivariable setting.Stat Med. 2003;22(4):559-571.9. Hougaard P. Shared Frailty Models. Analysis ofMultivariate Survival Data: Statistics for Biologyand Health. New York, NY: Springer; 2000:215-262.10. Engel LS, Chow WH, Vaughan TL, et al. Popula-
tion attributable risks of esophageal and gastric cancers.J Natl Cancer Inst. 2003;95(18):1404-1413.11. Bruzzi P, Green SB, Byar DP, Brinton LA, SchairerC. Estimating the population attributable risk for mul-tiple risk factors using case-control data. Am JEpidemiol. 1985;122(5):904-914.12. Parzen M, Lipsitz SR. A global goodness-of-fit sta-tistic for Cox regression models. Biometrics. 1999;55(2):580-584.13. May S, Hosmer DW. A simplified method of cal-culating an overall goodness-of-fit test for the Cox pro-portional hazards model. Lifetime Data Anal. 1998;4(2):109-120.14. Kremers WK. Concordance for survival time data:fixed and time-dependent covariates and possible tiesin predictor and time. Rochester, MN: Mayo Clinic;2007. Technical Report Series #80.15. Pencina MJ, D’Agostino RB Sr, D’Agostino RB Jr,Vasan RS. Evaluating the added predictive ability of anew marker. Stat Med. 2008;27(2):157-172.16. Levey AS, Eckardt KU, Tsukamoto Y, et al. Defi-nition and classification of chronic kidney disease. Kid-ney Int. 2005;67(6):2089-2100.17. Levey AS, Stevens LA, Schmid CH, et al; CKD-EPI (Chronic Kidney Disease EpidemiologyCollaboration). A new equation to estimate glomer-ular filtration rate. Ann Intern Med. 2009;150(9):604-612.18. Derksen S, Keselman H. Backward, forward andstepwise automated subset selection algorithms. Br JMath Stat Psychol. 1992;45:265-282 doi:10.1111/j.2044-8317.1992.tb00992.x.19. Steyerberg EW, Eijkemans MJ, Harrell FE Jr,Habbema JD. Prognostic modeling with logistic re-gression analysis. Med Decis Making. 2001;21(1):45-56.20. Kline R. Data preparation and screening. In: KlineR, ed. Principles and Practice of Structural EquationModeling. New York, NY: The Guilford Press; 1998:67-94.21. Aviles RJ, Askari AT, Lindahl B, et al. Troponin T
levels in patients with acute coronary syndromes, withor without renal dysfunction. N Engl J Med. 2002;346(26):2047-2052.22. Levy M, Heels-Ansdell D, Hiralal R, et al. Prog-nostic value of troponin and creatine kinase muscleand brain isoenzyme measurement after noncardiacsurgery. Anesthesiology. 2011;114(4):796-806.23. Thygesen K, Alpert JS, White HD, et al; Joint ESC/ACCF/AHA/WHF Task Force for the Redefinition ofMyocardial Infarction. Universal definition of myo-cardial infarction. Circulation. 2007;116(22):2634-2653.24. Panteghini M, Pagani F, Yeo KT, et al; Commit-tee on Standardization of Markers of Cardiac Dam-age of the IFCC. Evaluation of imprecision for cardiactroponin assays at low-range concentrations. ClinChem. 2004;50(2):327-332.25. Jaffe AS, Ravkilde J, Roberts R, et al. It’s time fora change to a troponin standard. Circulation. 2000;102(11):1216-1220.26. Antithrombotic Trialists’ Collaboration. Collab-orative meta-analysis of randomised trials of anti-platelet therapy for prevention of death, myocardialinfarction, and stroke in high risk patients. BMJ. 2002;324(7329):71-86.27. Mills EJ, Rachlis B, Wu P, Devereaux PJ, Arora P,Perri D. Primary prevention of cardiovascular mortal-ity and events with statin treatments. J Am Coll Cardiol.2008;52(22):1769-1781.28. Devereaux PJ, Xavier D, Pogue J, et al; POISE (Peri-Operative ISchemic Evaluation) Investigators. Char-acteristics and short-term prognosis of perioperativemyocardial infarction in patients undergoing noncar-diac surgery. Ann Intern Med. 2011;154(8):523-528.29. Qaseem A, Snow V, Fitterman N, et al; ClinicalEfficacy Assessment Subcommittee of the AmericanCollege of Physicians. Risk assessment for and strat-egies to reduce perioperative pulmonary complica-tions for patients undergoing noncardiothoracicsurgery. Ann Intern Med. 2006;144(8):575-580.
POSTOPERATIVE TROPONIN LEVELS AND 30-DAY MORTALITY
2304 JAMA, June 6, 2012—Vol 307, No. 21 ©2012 American Medical Association. All rights reserved.Corrected on June 5, 2012
Downloaded From: http://jama.jamanetwork.com/ on 06/06/2012
Related Documents