Asset Allocation and Implementation Wyoming State Loan & Investment Board

Welcome message from author
This document is posted to help you gain knowledge. Please leave a comment to let me know what you think about it! Share it to your friends and learn new things together.
Transcript
Asset Allocation and ImplementationWyoming State Loan & Investment Board
Table of Contents
I. IntroductionII. 2018 Capital Markets AssumptionsIII. Review of Individual Investment Pools
– Permanent Funds• Asset Allocation: Total Return Focus
– Permanent Mineral Trust Fund– Permanent Land Fund
• Asset Allocation: Income Focus– Common School Permanent Land Fund– Higher Education Endowment Fund
• Risk Analysis• Intergenerational Equity Analysis
– State Agency Pool: Asset Allocation & Risk Analysis– Workers’ Compensation Fund: Asset Allocation & Risk Analysis– Pool A Investment Account: Asset Allocation & Risk Analysis
IV. Asset Class Implementation – Priorities and Next StepsV. Appendix
– University Permanent Land Fund– Hathaway Scholarship Fund
2

Introduction

Introduction
Periodic review of strategic asset allocation is an important fiduciary duty as investment objectives, constraints and market conditions may change over time.
In 2017, the Wyoming State Loan and Investment Board (“SLIB”) reviewed the asset allocations of each investment pool, with consideration of the following:
• Investment Pool Characteristics
• New Statutory and Constitutional Amendments
• Long-Term Investment Return Objectives
• Impact of the Above on Future Purchasing Power of Permanent Funds
4

Summary of 2017 Asset Allocation Enhancements
Permanent Funds (PMTF, PLF, UPLF, CSPLF, Hathaway, and Higher Ed)• Improved the likelihood of achieving each pool’s long-term return objectives, focusing on long-
term total return or income generation based on respective spending policy goals and needs.Increased allocations to public equity and alternatives for pools with a long-term total return focus, increased allocations to higher yielding assets for pools with an income focus.
State Agency Pool• Focused on aligning the risk profile appropriately with the needs of the constituent investors.
Emphasized risk reduction and capital preservation to help mitigate significant short-term draw downs.
Introduced low duration fixed income to reduce portfolio interest rate risk.
Workers’ Compensation Fund• Examined risk in terms of surplus volatility to help preserve the fund’s fiscal health with a
healthy funded status. Introduced a modest allocation to long duration fixed income to help reduce funded status volatility.
Pool A Investment Account (formerly Tobacco Settlement Fund)• Introduced public equity and alternative investments in a thoughtful manner such that the
overall risk profile remains appropriate.Gradually introduce allocations to risk assets when better entry points are available.
5

2018 Capital Markets Assumptions

Capital Markets Assumptions
Philosophy• Each year, RVK’s general consulting and research teams collaborate to
review the capital market environment and update long-term, forward-looking capital market (CM) expectations for each asset class utilized by our clients.
• The forecast horizon is for long-term periods over multiple market cycles, typically 10 years or more.
• The components we estimate include:– Return– Risk (volatility of returns)– Correlation (relationship of asset class returns with all other asset
classes)
• Return assumptions are generally index-based and assume no investment manager alpha.
• Annual updates are typically gradual and incorporate historical performance, current valuations, as well as the overall economic environment.
7

What does it mean to get CM Assumptions “right”?
Relative accuracy is most important…
• Relative Accuracy: Assumptions capture the relative relationships between asset classes – particularly closely related ones.– Having some assumptions that are spot on and others that are far off will
produce unbalanced and poorly diversified portfolios.
But “absolute” accuracy matters too—just not as much.
• Absolute Accuracy: Assumptions reflect the absolute values actually experienced in future long-term market environments.– Having CM assumptions that are too high or too low across the board can
cause a Fund to believe it can spend more than it can afford or restrict spending more than necessary.
8
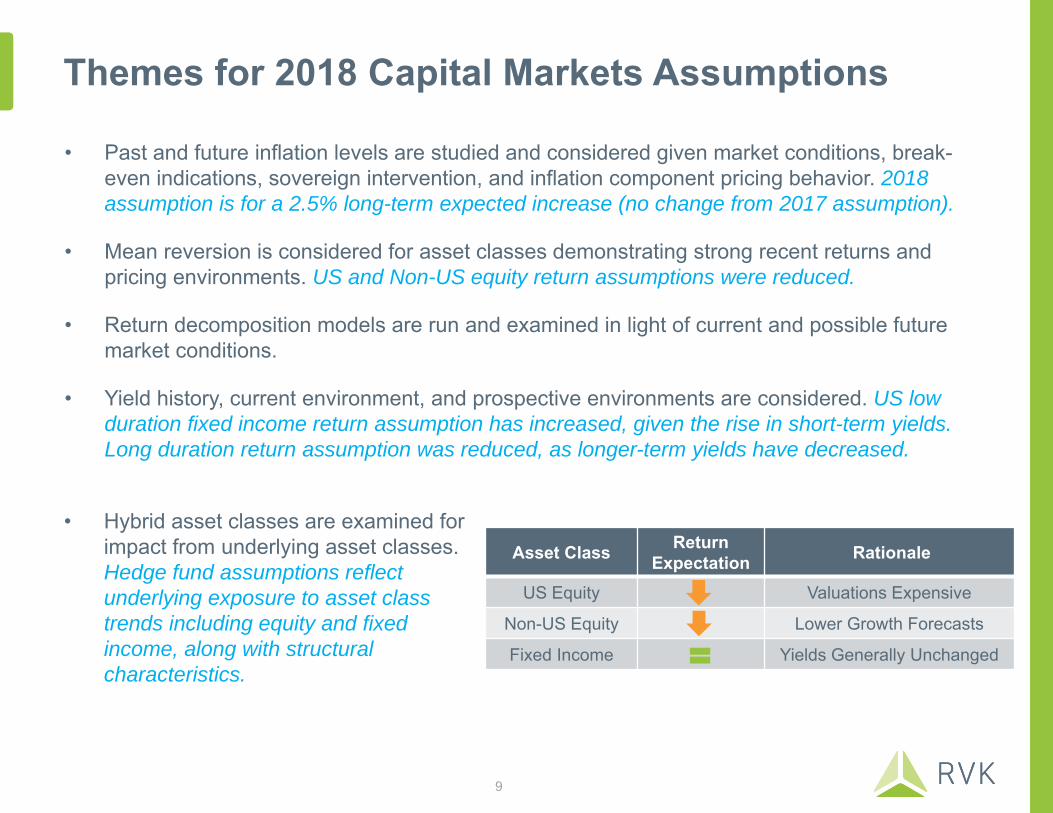
Themes for 2018 Capital Markets Assumptions
• Hybrid asset classes are examined for impact from underlying asset classes. Hedge fund assumptions reflect underlying exposure to asset class trends including equity and fixed income, along with structural characteristics.
Asset Class Return Expectation Rationale
US Equity Valuations Expensive
Non-US Equity Lower Growth Forecasts
Fixed Income Yields Generally Unchanged
• Past and future inflation levels are studied and considered given market conditions, break-even indications, sovereign intervention, and inflation component pricing behavior. 2018 assumption is for a 2.5% long-term expected increase (no change from 2017 assumption).
• Mean reversion is considered for asset classes demonstrating strong recent returns and pricing environments. US and Non-US equity return assumptions were reduced.
• Return decomposition models are run and examined in light of current and possible future market conditions.
• Yield history, current environment, and prospective environments are considered. US low duration fixed income return assumption has increased, given the rise in short-term yields. Long duration return assumption was reduced, as longer-term yields have decreased.
9

Factors to keep in mind when evaluating assumptions…
• While excessively high capital market assumptions provide the hope of higher rates of expected return, this prospect may not actually materialize if the market environment does not support them and can often lead to suboptimal portfolio structures.
• A well-structured and executed investment program will be best positioned to benefit from the available market returns regardless of the forecasts for total return.
• Well-structured asset allocations (and the resulting outcomes) are largely produced by the relative accuracy of assumptions, not simply by forecasting higher absolute returns.
10

RVK 2018 Capital Markets AssumptionsYear-over-Year Changes
Blue highlighted cells indicate values are being calculated based on a roll up of underlying asset classes.Broad US Equity is a combination of 91.5% Large/Mid Cap US Equity and 8.5% Small Cap US Equity.Broad International Equity is a combination of 64.4% Dev'd Large/Mid Cap Int'l Equity, 11.2% Dev'd Small Cap Int'l Equity, and 24.4% Emerging Markets Equity.Global Equity is a combination of 51.7% Broad US Equity and 48.3% Broad International Equity.Convertibles is a combination of 65% Broad US Equity and 35% Intermediate Duration Fixed Income.
Asset Class Return (Arithmetic)
Standard Deviation
Return (Compound)
Return/Risk Ratio
Return (Arithmetic)
Standard Deviation
Return (Compound)
Return/Risk Ratio
Return (Arithmetic)
Standard Deviation
Return (Compound)
Return/Risk Ratio
Large/Mid Cap US Equity 6.75% 17.75% 5.30% 0.38 7.00% 17.75% 5.56% 0.39 -0.25% ‐‐ -0.25% -0.01Small Cap US Equity 7.25% 21.25% 5.20% 0.34 7.50% 21.25% 5.46% 0.35 -0.25% ‐‐ -0.25% -0.01Broad US Equity 6.80% 17.80% 5.35% 0.38 7.05% 17.80% 5.60% 0.40 -0.25% ‐‐ -0.25% -0.01
Broad Int'l Equity 8.60% 20.80% 6.66% 0.41 8.85% 20.65% 6.94% 0.43 -0.25% 0.15% -0.28% -0.02
Global Equity 7.65% 18.35% 6.12% 0.42 7.90% 18.30% 6.38% 0.43 -0.25% 0.05% -0.26% -0.01
MLPs 8.50% 22.00% 6.34% 0.39 8.50% 22.00% 6.34% 0.39 ‐‐ ‐‐ ‐‐ ‐‐
Preferred Stock 5.75% 13.25% 4.93% 0.43 5.75% 13.25% 4.93% 0.43 ‐‐ ‐‐ ‐‐ ‐‐
Low Duration Fixed Income 3.00% 3.50% 2.94% 0.86 2.50% 3.50% 2.44% 0.71 0.50% ‐‐ 0.50% 0.14Intermediate Duration Fixed Income 3.50% 6.00% 3.33% 0.58 3.50% 6.00% 3.33% 0.58 ‐‐ ‐‐ ‐‐ ‐‐Long Duration Fixed Income 3.50% 11.50% 2.87% 0.30 4.00% 11.50% 3.37% 0.35 -0.50% ‐‐ -0.50% -0.04TIPS 3.75% 6.25% 3.56% 0.60 3.75% 6.25% 3.56% 0.60 ‐‐ ‐‐ ‐‐ ‐‐Bank Loans 5.25% 10.00% 4.78% 0.53 5.25% 10.00% 4.78% 0.53 ‐‐ ‐‐ ‐‐ ‐‐EMD (Local Currency) 5.75% 12.50% 5.02% 0.46 6.75% 12.50% 6.03% 0.54 -1.00% ‐‐ -1.01% -0.08Convertibles 5.60% 13.70% 4.72% 0.41 5.80% 13.70% 4.92% 0.42 -0.20% ‐‐ -0.20% -0.01
Core Real Estate 6.25% 12.50% 5.52% 0.50 6.25% 12.50% 5.52% 0.50 ‐‐ ‐‐ ‐‐ ‐‐Non-Core Real Estate 9.00% 22.50% 6.75% 0.40 9.25% 22.50% 7.00% 0.41 -0.25% ‐‐ -0.25% -0.01
Diversified Hedge Funds 5.75% 9.50% 5.33% 0.61 6.25% 9.50% 5.83% 0.66 -0.50% ‐‐ -0.50% -0.05
Private Equity 9.75% 25.50% 6.90% 0.38 10.00% 25.50% 7.16% 0.39 -0.25% ‐‐ -0.26% -0.01
Commodities 5.75% 19.75% 3.95% 0.29 5.75% 19.75% 3.95% 0.29 ‐‐ ‐‐ ‐‐ ‐‐
US Inflation 2.50% 3.00% 2.46% 0.83 2.50% 3.00% 2.46% 0.83 ‐‐ ‐‐ ‐‐ ‐‐Cash Equivalents 2.50% 3.00% 2.46% 0.83 2.25% 3.00% 2.21% 0.75 0.25% ‐‐ 0.25% 0.08
Indicates a favorable change to the assumption from 2017 to 2018Indicates an unfavorable change to the assumption from 2017 to 2018
20172018 Change (2018 - 2017)
11
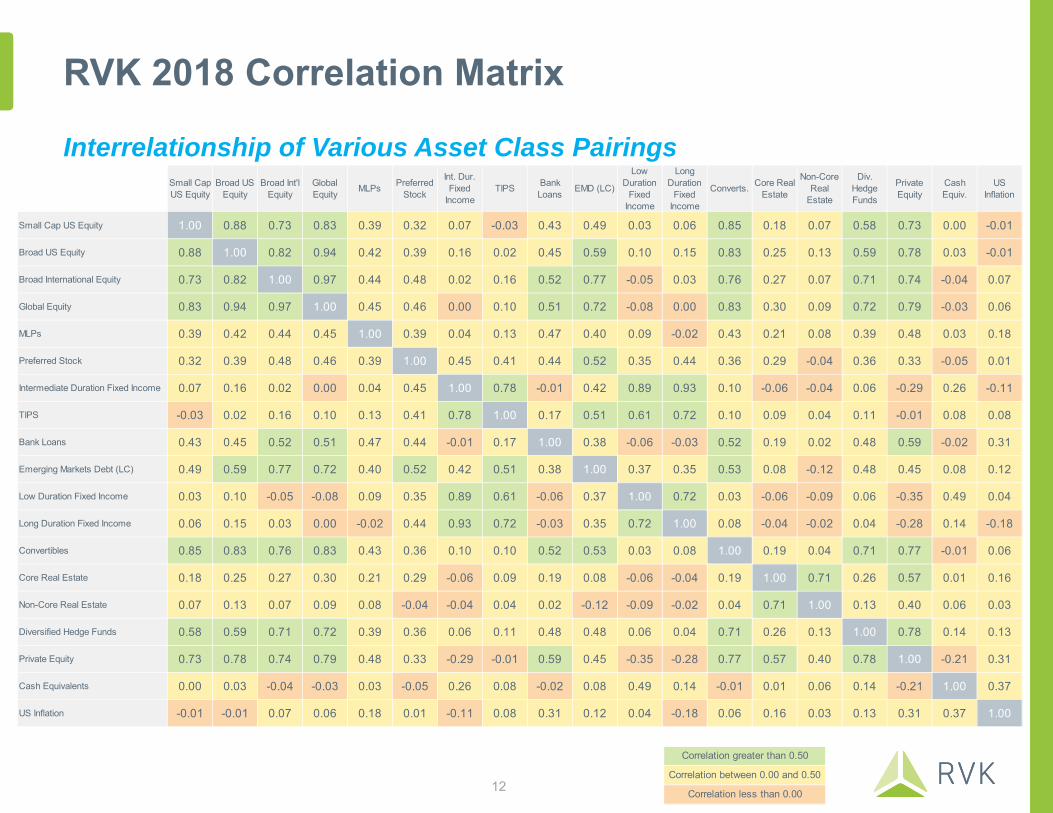
RVK 2018 Correlation Matrix
Interrelationship of Various Asset Class Pairings
Correlation greater than 0.50
Correlation between 0.00 and 0.50
Correlation less than 0.00
Small Cap US Equity
Broad US Equity
Broad Int'l Equity
Global Equity MLPs Preferred
Stock
Int. Dur. Fixed
IncomeTIPS Bank
Loans EMD (LC)
Low Duration
Fixed Income
Long Duration
Fixed Income
Converts. Core Real Estate
Non-Core Real
Estate
Div. Hedge Funds
Private Equity
Cash Equiv.
US Inflation
Small Cap US Equity 1.00 0.88 0.73 0.83 0.39 0.32 0.07 -0.03 0.43 0.49 0.03 0.06 0.85 0.18 0.07 0.58 0.73 0.00 -0.01
Broad US Equity 0.88 1.00 0.82 0.94 0.42 0.39 0.16 0.02 0.45 0.59 0.10 0.15 0.83 0.25 0.13 0.59 0.78 0.03 -0.01
Broad International Equity 0.73 0.82 1.00 0.97 0.44 0.48 0.02 0.16 0.52 0.77 -0.05 0.03 0.76 0.27 0.07 0.71 0.74 -0.04 0.07
Global Equity 0.83 0.94 0.97 1.00 0.45 0.46 0.00 0.10 0.51 0.72 -0.08 0.00 0.83 0.30 0.09 0.72 0.79 -0.03 0.06
MLPs 0.39 0.42 0.44 0.45 1.00 0.39 0.04 0.13 0.47 0.40 0.09 -0.02 0.43 0.21 0.08 0.39 0.48 0.03 0.18
Preferred Stock 0.32 0.39 0.48 0.46 0.39 1.00 0.45 0.41 0.44 0.52 0.35 0.44 0.36 0.29 -0.04 0.36 0.33 -0.05 0.01
Intermediate Duration Fixed Income 0.07 0.16 0.02 0.00 0.04 0.45 1.00 0.78 -0.01 0.42 0.89 0.93 0.10 -0.06 -0.04 0.06 -0.29 0.26 -0.11
TIPS -0.03 0.02 0.16 0.10 0.13 0.41 0.78 1.00 0.17 0.51 0.61 0.72 0.10 0.09 0.04 0.11 -0.01 0.08 0.08
Bank Loans 0.43 0.45 0.52 0.51 0.47 0.44 -0.01 0.17 1.00 0.38 -0.06 -0.03 0.52 0.19 0.02 0.48 0.59 -0.02 0.31
Emerging Markets Debt (LC) 0.49 0.59 0.77 0.72 0.40 0.52 0.42 0.51 0.38 1.00 0.37 0.35 0.53 0.08 -0.12 0.48 0.45 0.08 0.12
Low Duration Fixed Income 0.03 0.10 -0.05 -0.08 0.09 0.35 0.89 0.61 -0.06 0.37 1.00 0.72 0.03 -0.06 -0.09 0.06 -0.35 0.49 0.04
Long Duration Fixed Income 0.06 0.15 0.03 0.00 -0.02 0.44 0.93 0.72 -0.03 0.35 0.72 1.00 0.08 -0.04 -0.02 0.04 -0.28 0.14 -0.18
Convertibles 0.85 0.83 0.76 0.83 0.43 0.36 0.10 0.10 0.52 0.53 0.03 0.08 1.00 0.19 0.04 0.71 0.77 -0.01 0.06
Core Real Estate 0.18 0.25 0.27 0.30 0.21 0.29 -0.06 0.09 0.19 0.08 -0.06 -0.04 0.19 1.00 0.71 0.26 0.57 0.01 0.16
Non-Core Real Estate 0.07 0.13 0.07 0.09 0.08 -0.04 -0.04 0.04 0.02 -0.12 -0.09 -0.02 0.04 0.71 1.00 0.13 0.40 0.06 0.03
Diversified Hedge Funds 0.58 0.59 0.71 0.72 0.39 0.36 0.06 0.11 0.48 0.48 0.06 0.04 0.71 0.26 0.13 1.00 0.78 0.14 0.13
Private Equity 0.73 0.78 0.74 0.79 0.48 0.33 -0.29 -0.01 0.59 0.45 -0.35 -0.28 0.77 0.57 0.40 0.78 1.00 -0.21 0.31
Cash Equivalents 0.00 0.03 -0.04 -0.03 0.03 -0.05 0.26 0.08 -0.02 0.08 0.49 0.14 -0.01 0.01 0.06 0.14 -0.21 1.00 0.37
US Inflation -0.01 -0.01 0.07 0.06 0.18 0.01 -0.11 0.08 0.31 0.12 0.04 -0.18 0.06 0.16 0.03 0.13 0.31 0.37 1.00
12
-10%
-5%
0%
5%
10%
15%
20%
25%
0 5 10 15 20 25 30 35 40 45 50
10-Y
ear F
orw
ard
S&P
500
Rea
l Ret
urns
(Ann
ualiz
ed, %
)
Shiller S&P 500 P/E Ratio (Normalized Real 10-Year)
1926-1929
1930-1949
1950-1969
1970-1989
1990-2007
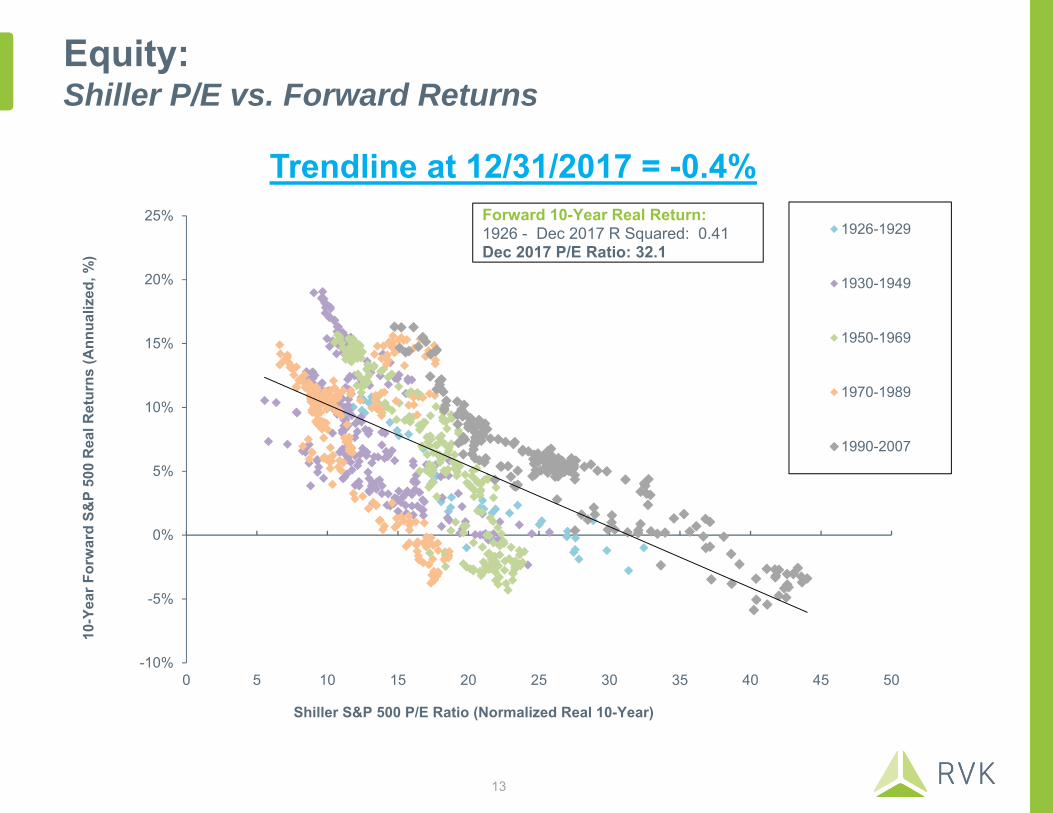
Forward 10-Year Real Return:1926 - Dec 2017 R Squared: 0.41Dec 2017 P/E Ratio: 32.1
Equity:Shiller P/E vs. Forward Returns
Trendline at 12/31/2017 = -0.4%
13

2%
4%
6%
8%
10%
12%
14%
16%
18%
2% 4% 6% 8% 10% 12% 14% 16% 18%
10-Y
ear F
orw
ard
Blo
ombe
rg U
S A
ggre
gate
Bon
d In
dex
Ret
urns
(Ann
ualiz
ed, %
)
Bloomberg US Aggregate Bond Index YTW (Annualized, %)
1976-1979
1980-1989
1990-1999
2000-2007
Fixed Income:Current Yield vs. Forward Returns
Trendline at 12/31/2017 = 3.4%
Forward 10-Year Return:1976-2007 R Squared: 0.85Dec 2017 YTW: 2.7%
14

Decomposition Models
Global Equity Summary Statistics
Fixed Income Summary Statistics
Yield Inflation Growth Total Valuation Change Total
Large/Mid Cap US Equity 1.89% 2.50% 2.17% 6.56% -1.34% 5.22%Small Cap US Equity 1.34% 2.50% 3.08% 6.92% -1.76% 5.16%Dev'd Large/Mid Cap Int'l Equity 3.01% 2.50% 2.19% 7.70% -0.74% 6.96%Dev'd Small Cap Int'l Equity 2.65% 2.50% 3.00% 8.15% -0.79% 7.36%Emerging Markets Equity 2.22% 2.50% 3.27% 7.99% 0.20% 8.19%
Growth component consists of GDP growth and profit margin growth.
YTW 2016
YTW 2017
YTW Average
YTW10-Yr Avg
OAS2016
OAS2017
OASAvg
OAS10-Yr Avg
Duration 2016
Duration 2017
Duration Average
Duration 10-Yr Avg
Intermediate Duration Fixed Income 2.61 2.71 6.73 2.77 0.43 0.36 0.55 0.70 5.89 5.98 4.75 5.13Non-US Dev'd Sov. Fixed Income 0.66 0.77 2.27 1.63 0.23 0.21 0.15 0.26 8.56 8.61 5.80 7.37Emerging Markets Debt (Hard) 5.80 5.27 7.11 6.03 3.42 2.85 3.92 3.53 6.51 6.85 6.54 6.89Emerging Markets Debt (Local) 6.79 6.14 6.76 6.72 4.90 3.96 4.34 5.09 4.91 5.09 4.45 4.63TIPS 0.18 0.34 0.77 2.39 N/A N/A N/A N/A 4.87 5.84 5.07 5.66Low Duration Fixed Income 1.45 2.03 5.62 1.19 0.26 0.14 0.35 0.38 1.92 1.91 1.80 1.88Long Duration Fixed Income 3.95 3.49 7.58 4.42 1.04 0.83 0.73 1.20 14.97 15.42 11.24 13.80High Yield 6.12 5.72 10.16 8.06 4.09 3.43 5.14 6.07 4.11 3.86 4.42 4.21
Yield to Worst (YTW) Option-Adjusted Spread (OAS) Duration
Below 10-Yr AverageAbove 10-Yr Average
15

Review of Individual Investment Pools
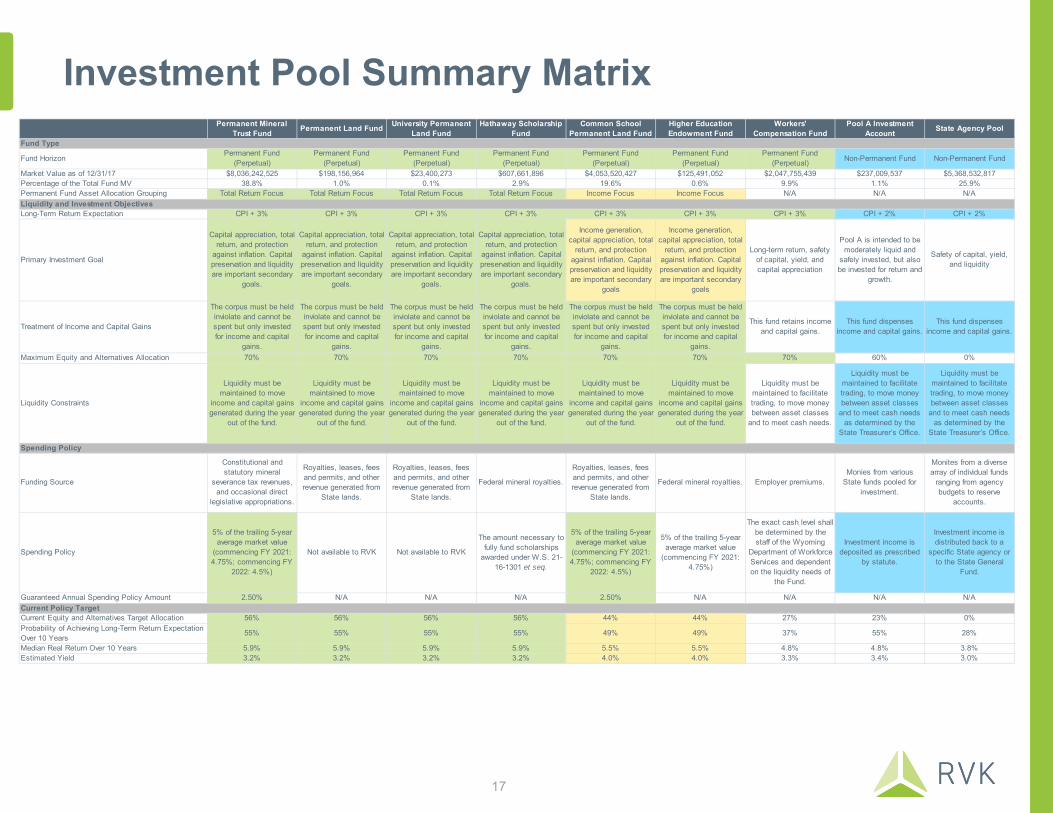
Investment Pool Summary MatrixPermanent Mineral
Trust Fund Permanent Land Fund University Permanent Land Fund
Hathaway Scholarship Fund
Common School Permanent Land Fund
Higher Education Endowment Fund
Workers' Compensation Fund
Pool A Investment Account State Agency Pool
Fund HorizonPermanent Fund
(Perpetual)Permanent Fund
(Perpetual)Permanent Fund
(Perpetual)Permanent Fund
(Perpetual)Permanent Fund
(Perpetual)Permanent Fund
(Perpetual)Permanent Fund
(Perpetual) Non-Permanent Fund Non-Permanent Fund
Market Value as of 12/31/17 $8,036,242,525 $198,156,964 $23,400,273 $607,661,896 $4,053,520,427 $125,491,052 $2,047,755,439 $237,009,537 $5,368,532,817Percentage of the Total Fund MV 38.8% 1.0% 0.1% 2.9% 19.6% 0.6% 9.9% 1.1% 25.9%Permanent Fund Asset Allocation Grouping Total Return Focus Total Return Focus Total Return Focus Total Return Focus Income Focus Income Focus N/A N/A N/A
Long-Term Return Expectation CPI + 3% CPI + 3% CPI + 3% CPI + 3% CPI + 3% CPI + 3% CPI + 3% CPI + 2% CPI + 2%
Primary Investment Goal
Capital appreciation, total return, and protection
against inflation. Capital preservation and liquidity are important secondary
goals.
Capital appreciation, total return, and protection
against inflation. Capital preservation and liquidity are important secondary
goals.
Capital appreciation, total return, and protection
against inflation. Capital preservation and liquidity are important secondary
goals.
Capital appreciation, total return, and protection
against inflation. Capital preservation and liquidity are important secondary
goals.
Income generation, capital appreciation, total
return, and protection against inflation. Capital preservation and liquidity are important secondary
goals
Income generation, capital appreciation, total
return, and protection against inflation. Capital preservation and liquidity are important secondary
goals
Long-term return, safety of capital, yield, and capital appreciation
Pool A is intended to be moderately liquid and
safely invested, but also be invested for return and
growth.
Safety of capital, yield, and liquidity
Treatment of Income and Capital Gains
The corpus must be held inviolate and cannot be spent but only invested for income and capital
gains.
The corpus must be held inviolate and cannot be spent but only invested for income and capital
gains.
The corpus must be held inviolate and cannot be spent but only invested for income and capital
gains.
The corpus must be held inviolate and cannot be spent but only invested for income and capital
gains.
The corpus must be held inviolate and cannot be spent but only invested for income and capital
gains.
The corpus must be held inviolate and cannot be spent but only invested for income and capital
gains.
This fund retains income and capital gains.
This fund dispenses income and capital gains.
This fund dispenses income and capital gains.
Maximum Equity and Alternatives Allocation 70% 70% 70% 70% 70% 70% 70% 60% 0%
Liquidity Constraints
Liquidity must be maintained to move
income and capital gains generated during the year
out of the fund.
Liquidity must be maintained to move
income and capital gains generated during the year
out of the fund.
Liquidity must be maintained to move
income and capital gains generated during the year
out of the fund.
Liquidity must be maintained to move
income and capital gains generated during the year
out of the fund.
Liquidity must be maintained to move
income and capital gains generated during the year
out of the fund.
Liquidity must be maintained to move
income and capital gains generated during the year
out of the fund.
Liquidity must be maintained to facilitate trading, to move money between asset classes
and to meet cash needs.
Liquidity must be maintained to facilitate trading, to move money between asset classes
and to meet cash needs as determined by the
State Treasurer’s Office.
Liquidity must be maintained to facilitate trading, to move money between asset classes
and to meet cash needs as determined by the
State Treasurer’s Office.
Funding Source
Constitutional and statutory mineral
severance tax revenues, and occasional direct
legislative appropriations.
Royalties, leases, fees and permits, and other revenue generated from
State lands.
Royalties, leases, fees and permits, and other revenue generated from
State lands.
Federal mineral royalties.
Royalties, leases, fees and permits, and other revenue generated from
State lands.
Federal mineral royalties. Employer premiums.Monies from various
State funds pooled for investment.
Monites from a diverse array of individual funds
ranging from agency budgets to reserve
accounts.
Spending Policy
5% of the trailing 5-year average market value
(commencing FY 2021: 4.75%; commencing FY
2022: 4.5%)
Not available to RVK Not available to RVK
The amount necessary to fully fund scholarships
awarded under W.S. 21-16-1301 et seq.
5% of the trailing 5-year average market value
(commencing FY 2021: 4.75%; commencing FY
2022: 4.5%)
5% of the trailing 5-year average market value
(commencing FY 2021: 4.75%)
The exact cash level shall be determined by the staff of the Wyoming
Department of Workforce Services and dependent on the liquidity needs of
the Fund.
Investment income is deposited as prescribed
by statute.
Investment income is distributed back to a
specific State agency or to the State General
Fund.
Guaranteed Annual Spending Policy Amount 2.50% N/A N/A N/A 2.50% N/A N/A N/A N/A
Current Equity and Alternatives Target Allocation 56% 56% 56% 56% 44% 44% 27% 23% 0%Probability of Achieving Long-Term Return Expectation Over 10 Years
55% 55% 55% 55% 49% 49% 37% 55% 28%
Median Real Return Over 10 Years 5.9% 5.9% 5.9% 5.9% 5.5% 5.5% 4.8% 4.8% 3.8%Estimated Yield 3.2% 3.2% 3.2% 3.2% 4.0% 4.0% 3.3% 3.4% 3.0%
Fund Type
Liquidity and Investment Objectives
Spending Policy
Current Policy Target
17

Grouping of Permanent Funds
The Permanent Funds are grouped into two buckets for purposes of asset allocation, based on each fund’s unique objectives and constraints.
1. Total Return Focus• Emphasis on maximizing total return over the long-term with an appropriate level of
risk, while meeting annual spending needs.• Higher long-term total return and corpus growth.• Permanent Funds:
– Permanent Mineral Trust Fund– Permanent Land Fund– University Permanent Land Fund– Hathaway Scholarship Fund
2. Income Focus• Emphasis on generating sufficient levels of income to meet annual spending needs.
– Secondary focus on maximizing total return over the long-term with an appropriate level of risk.
• Lower long-term total return and corpus growth.• Permanent Funds:
– Common School Permanent Land Fund– Higher Education Endowment Fund
18

Permanent Funds: Total Return Focus-Permanent Mineral Trust Fund-Permanent Land Fund-University Permanent Land Fund-Hathaway Scholarship Fund
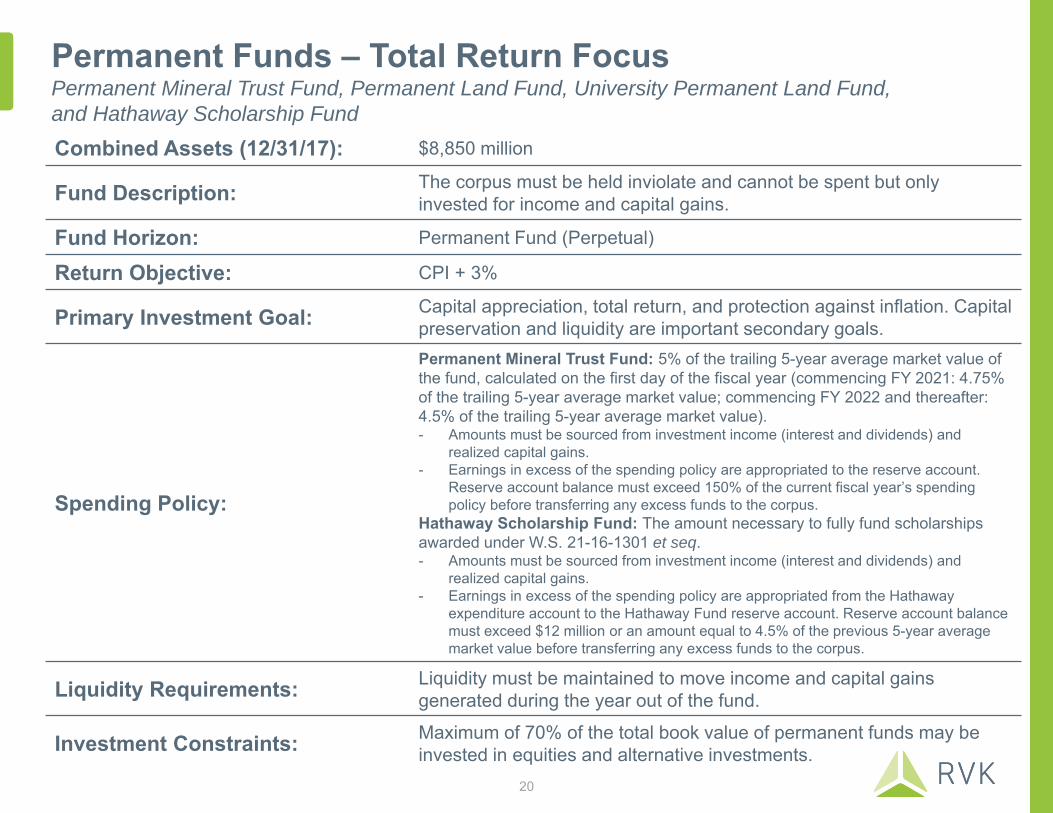
Permanent Funds – Total Return FocusPermanent Mineral Trust Fund, Permanent Land Fund, University Permanent Land Fund, and Hathaway Scholarship FundCombined Assets (12/31/17): $8,850 million
Fund Description: The corpus must be held inviolate and cannot be spent but only invested for income and capital gains.
Fund Horizon: Permanent Fund (Perpetual)
Return Objective: CPI + 3%
Primary Investment Goal: Capital appreciation, total return, and protection against inflation. Capital preservation and liquidity are important secondary goals.
Spending Policy:
Permanent Mineral Trust Fund: 5% of the trailing 5-year average market value of the fund, calculated on the first day of the fiscal year (commencing FY 2021: 4.75% of the trailing 5-year average market value; commencing FY 2022 and thereafter: 4.5% of the trailing 5-year average market value).- Amounts must be sourced from investment income (interest and dividends) and
realized capital gains.- Earnings in excess of the spending policy are appropriated to the reserve account.
Reserve account balance must exceed 150% of the current fiscal year’s spending policy before transferring any excess funds to the corpus.
Hathaway Scholarship Fund: The amount necessary to fully fund scholarships awarded under W.S. 21-16-1301 et seq. - Amounts must be sourced from investment income (interest and dividends) and
realized capital gains.- Earnings in excess of the spending policy are appropriated from the Hathaway
expenditure account to the Hathaway Fund reserve account. Reserve account balance must exceed $12 million or an amount equal to 4.5% of the previous 5-year average market value before transferring any excess funds to the corpus.
Liquidity Requirements: Liquidity must be maintained to move income and capital gains generated during the year out of the fund.
Investment Constraints: Maximum of 70% of the total book value of permanent funds may be invested in equities and alternative investments.
20
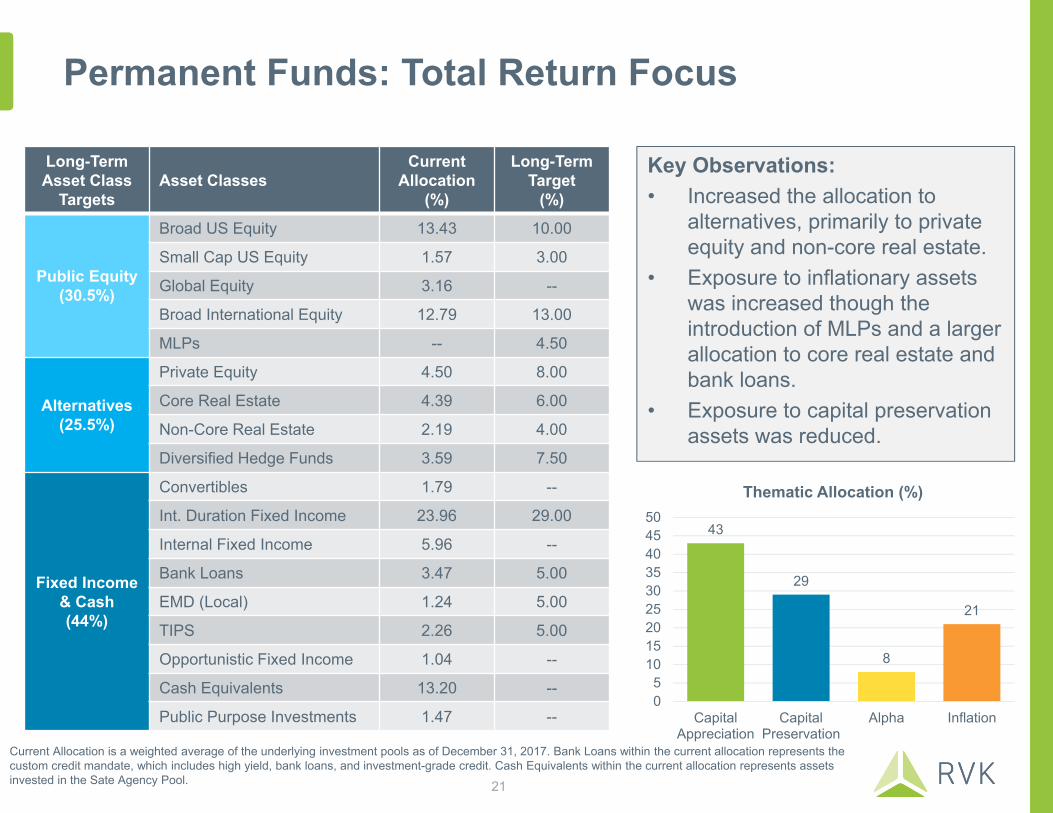
Permanent Funds: Total Return Focus
Key Observations:• Increased the allocation to
alternatives, primarily to private equity and non-core real estate.
• Exposure to inflationary assets was increased though the introduction of MLPs and a larger allocation to core real estate and bank loans.
• Exposure to capital preservation assets was reduced.
Long-TermAsset Class
TargetsAsset Classes
Current Allocation
(%)
Long-Term Target
(%)
Public Equity(30.5%)
Broad US Equity 13.43 10.00
Small Cap US Equity 1.57 3.00
Global Equity 3.16 --
Broad International Equity 12.79 13.00
MLPs -- 4.50
Alternatives(25.5%)
Private Equity 4.50 8.00
Core Real Estate 4.39 6.00
Non-Core Real Estate 2.19 4.00
Diversified Hedge Funds 3.59 7.50
Fixed Income & Cash(44%)
Convertibles 1.79 --
Int. Duration Fixed Income 23.96 29.00
Internal Fixed Income 5.96 --
Bank Loans 3.47 5.00
EMD (Local) 1.24 5.00
TIPS 2.26 5.00
Opportunistic Fixed Income 1.04 --
Cash Equivalents 13.20 --
Public Purpose Investments 1.47 --
43
29
8
21
05
101520253035404550
CapitalAppreciation
CapitalPreservation
Alpha Inflation
Thematic Allocation (%)
Current Allocation is a weighted average of the underlying investment pools as of December 31, 2017. Bank Loans within the current allocation represents the custom credit mandate, which includes high yield, bank loans, and investment-grade credit. Cash Equivalents within the current allocation represents assets invested in the Sate Agency Pool. 21
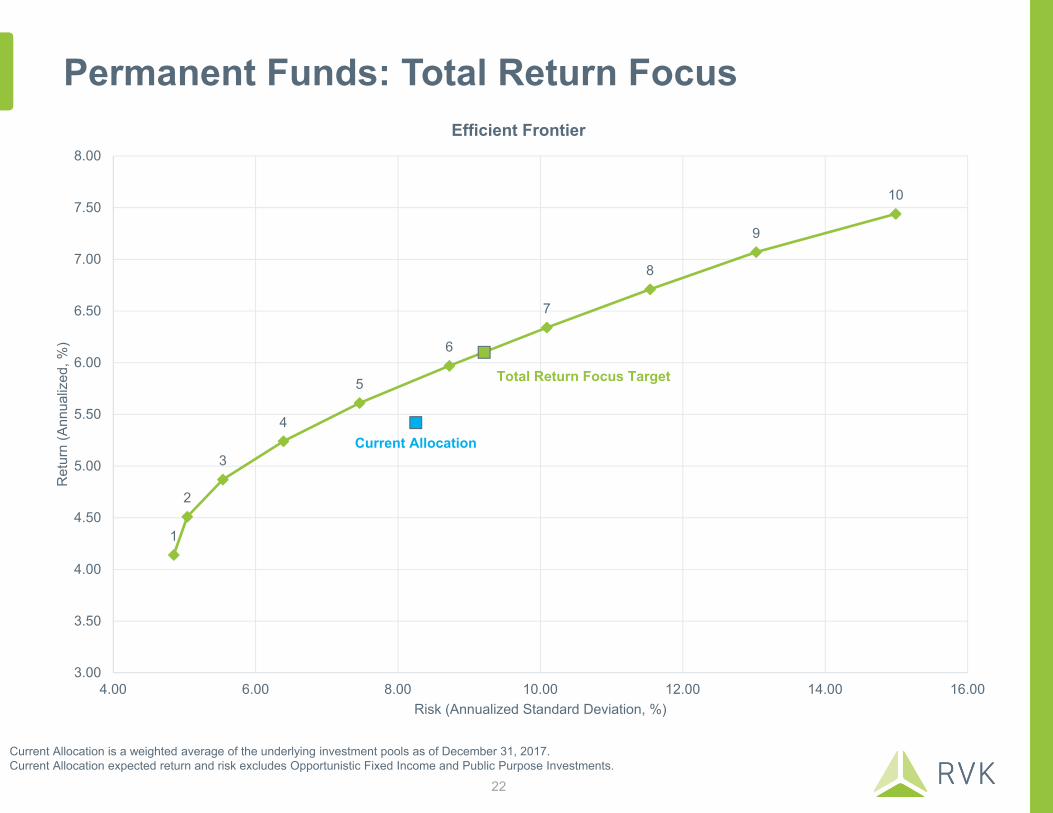
Permanent Funds: Total Return Focus
Current Allocation is a weighted average of the underlying investment pools as of December 31, 2017. Current Allocation expected return and risk excludes Opportunistic Fixed Income and Public Purpose Investments.
1
2
3
4
5
6
7
8
9
10
Total Return Focus Target
Current Allocation
3.00
3.50
4.00
4.50
5.00
5.50
6.00
6.50
7.00
7.50
8.00
4.00 6.00 8.00 10.00 12.00 14.00 16.00
Ret
urn
(Ann
ualiz
ed, %
)
Risk (Annualized Standard Deviation, %)
Efficient Frontier
22
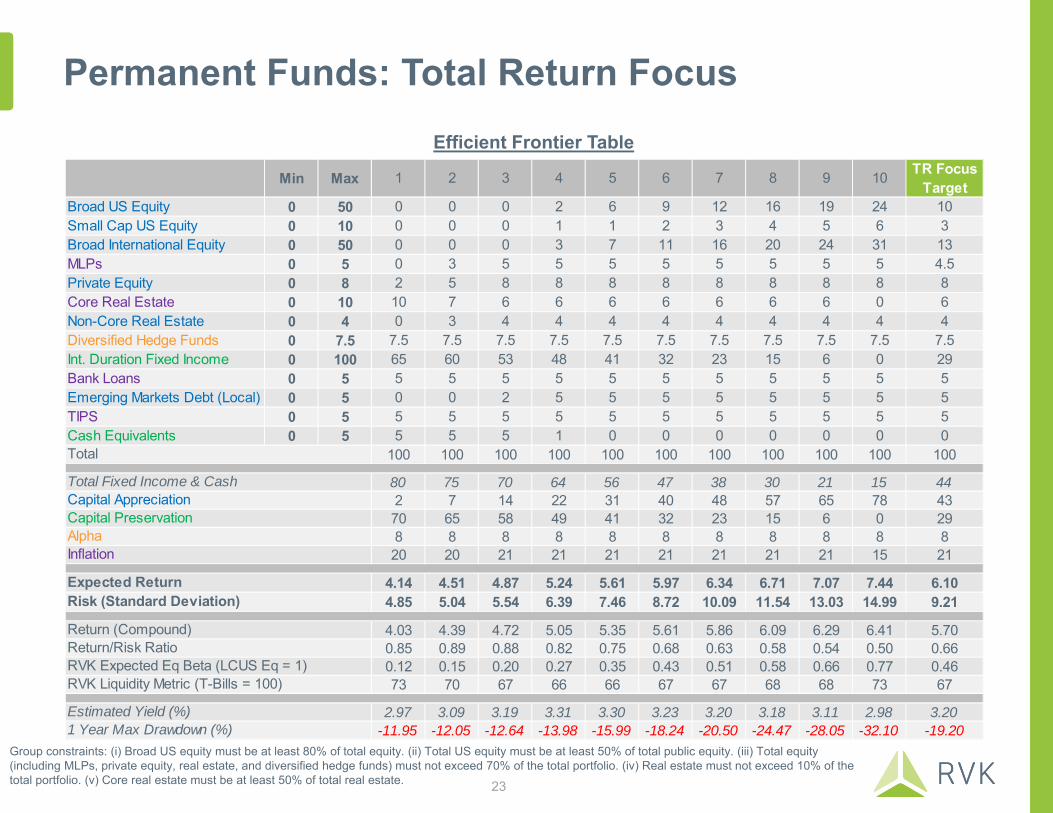
Min Max 1 2 3 4 5 6 7 8 9 10 TR Focus Target
Broad US Equity 0 50 0 0 0 2 6 9 12 16 19 24 10Small Cap US Equity 0 10 0 0 0 1 1 2 3 4 5 6 3Broad International Equity 0 50 0 0 0 3 7 11 16 20 24 31 13MLPs 0 5 0 3 5 5 5 5 5 5 5 5 4.5Private Equity 0 8 2 5 8 8 8 8 8 8 8 8 8Core Real Estate 0 10 10 7 6 6 6 6 6 6 6 0 6Non-Core Real Estate 0 4 0 3 4 4 4 4 4 4 4 4 4Diversified Hedge Funds 0 7.5 7.5 7.5 7.5 7.5 7.5 7.5 7.5 7.5 7.5 7.5 7.5Int. Duration Fixed Income 0 100 65 60 53 48 41 32 23 15 6 0 29Bank Loans 0 5 5 5 5 5 5 5 5 5 5 5 5Emerging Markets Debt (Local) 0 5 0 0 2 5 5 5 5 5 5 5 5TIPS 0 5 5 5 5 5 5 5 5 5 5 5 5Cash Equivalents 0 5 5 5 5 1 0 0 0 0 0 0 0
100 100 100 100 100 100 100 100 100 100 100
80 75 70 64 56 47 38 30 21 15 442 7 14 22 31 40 48 57 65 78 4370 65 58 49 41 32 23 15 6 0 298 8 8 8 8 8 8 8 8 8 820 20 21 21 21 21 21 21 21 15 21
4.14 4.51 4.87 5.24 5.61 5.97 6.34 6.71 7.07 7.44 6.104.85 5.04 5.54 6.39 7.46 8.72 10.09 11.54 13.03 14.99 9.21
4.03 4.39 4.72 5.05 5.35 5.61 5.86 6.09 6.29 6.41 5.700.85 0.89 0.88 0.82 0.75 0.68 0.63 0.58 0.54 0.50 0.660.12 0.15 0.20 0.27 0.35 0.43 0.51 0.58 0.66 0.77 0.4673 70 67 66 66 67 67 68 68 73 67
2.97 3.09 3.19 3.31 3.30 3.23 3.20 3.18 3.11 2.98 3.20-11.95 -12.05 -12.64 -13.98 -15.99 -18.24 -20.50 -24.47 -28.05 -32.10 -19.20
Estimated Yield (%)
Total
Expected ReturnRisk (Standard Deviation)
Return (Compound)Return/Risk RatioRVK Expected Eq Beta (LCUS Eq = 1)RVK Liquidity Metric (T-Bills = 100)
Total Fixed Income & CashCapital AppreciationCapital PreservationAlphaInflation
1 Year Max Drawdown (%)
Permanent Funds: Total Return FocusEfficient Frontier Table
Group constraints: (i) Broad US equity must be at least 80% of total equity. (ii) Total US equity must be at least 50% of total public equity. (iii) Total equity (including MLPs, private equity, real estate, and diversified hedge funds) must not exceed 70% of the total portfolio. (iv) Real estate must not exceed 10% of the total portfolio. (v) Core real estate must be at least 50% of total real estate. 23
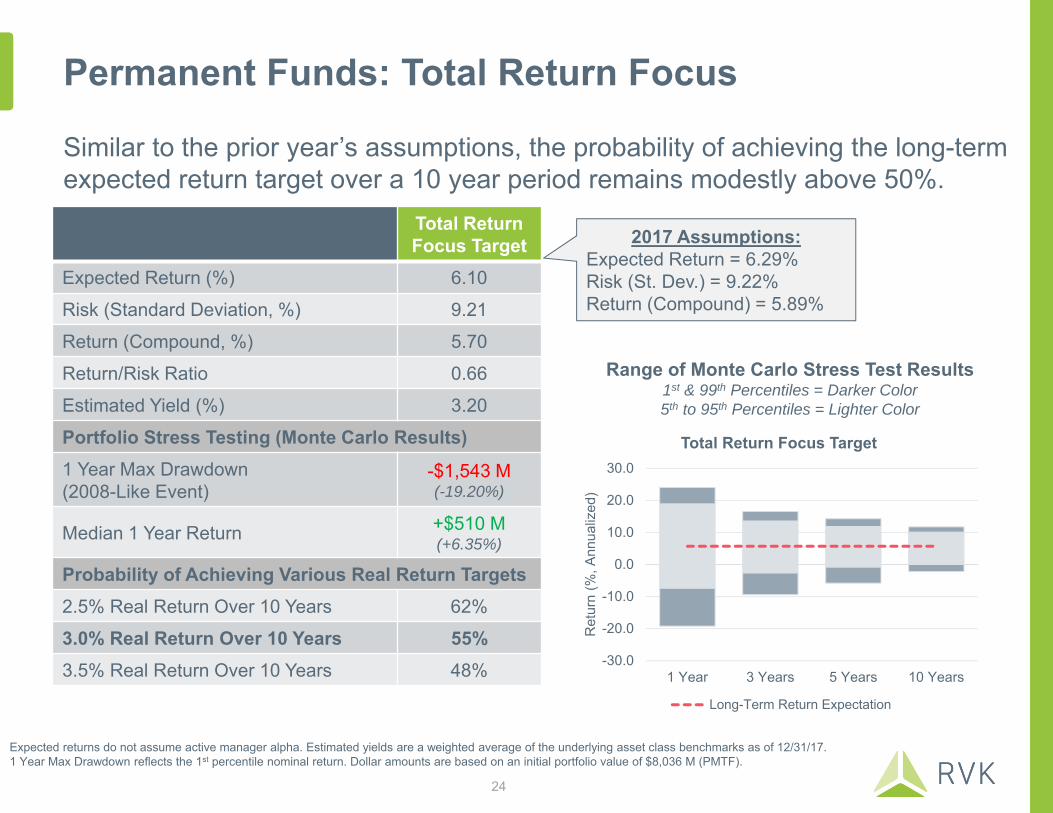
Permanent Funds: Total Return Focus
Similar to the prior year’s assumptions, the probability of achieving the long-term expected return target over a 10 year period remains modestly above 50%.
Total ReturnFocus Target
Expected Return (%) 6.10
Risk (Standard Deviation, %) 9.21
Return (Compound, %) 5.70
Return/Risk Ratio 0.66
Estimated Yield (%) 3.20
Portfolio Stress Testing (Monte Carlo Results)1 Year Max Drawdown(2008-Like Event)
-$1,543 M(-19.20%)
Median 1 Year Return +$510 M(+6.35%)
Probability of Achieving Various Real Return Targets2.5% Real Return Over 10 Years 62%
3.0% Real Return Over 10 Years 55%3.5% Real Return Over 10 Years 48%
Expected returns do not assume active manager alpha. Estimated yields are a weighted average of the underlying asset class benchmarks as of 12/31/17. 1 Year Max Drawdown reflects the 1st percentile nominal return. Dollar amounts are based on an initial portfolio value of $8,036 M (PMTF).
Range of Monte Carlo Stress Test Results1st & 99th Percentiles = Darker Color5th to 95th Percentiles = Lighter Color
2017 Assumptions:Expected Return = 6.29%Risk (St. Dev.) = 9.22%Return (Compound) = 5.89%
-30.0
-20.0
-10.0
0.0
10.0
20.0
30.0
1 Year 3 Years 5 Years 10 Years
Ret
urn
(%, A
nnua
lized
)
Total Return Focus Target
Long-Term Return Expectation
24

Permanent Funds: Income Focus-Common School Permanent Land Fund-Higher Education Endowment Fund
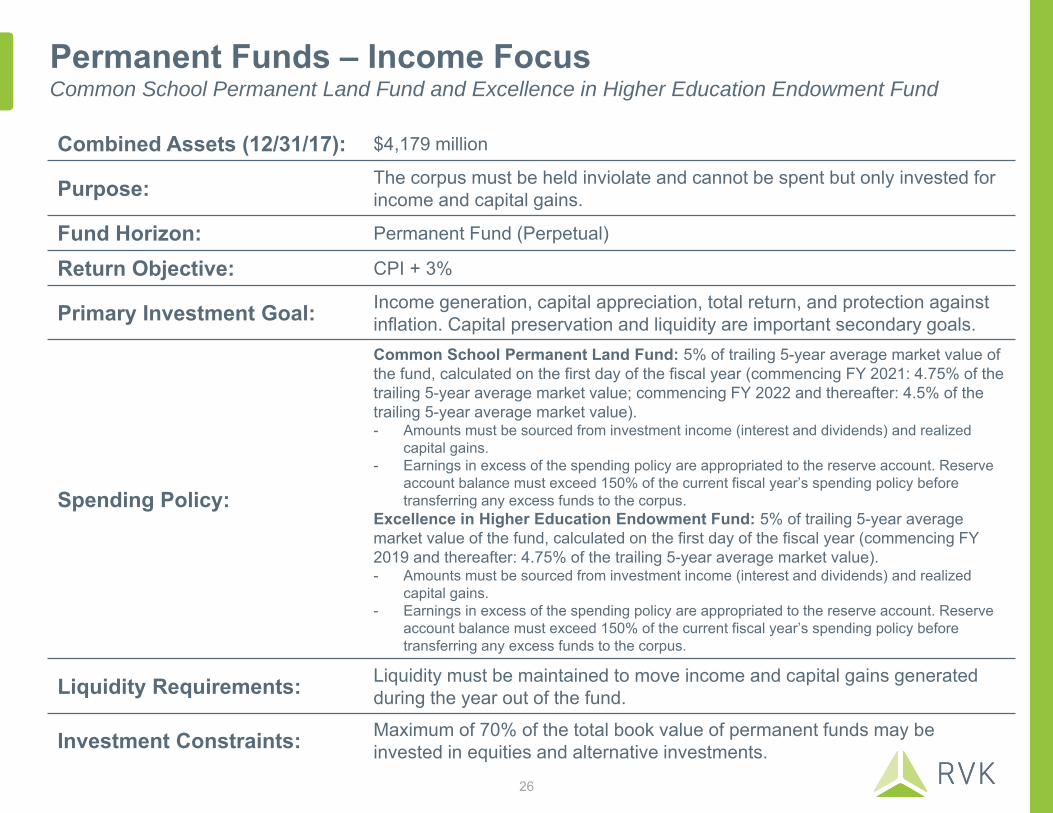
Combined Assets (12/31/17): $4,179 million
Purpose: The corpus must be held inviolate and cannot be spent but only invested for income and capital gains.
Fund Horizon: Permanent Fund (Perpetual)
Return Objective: CPI + 3%
Primary Investment Goal: Income generation, capital appreciation, total return, and protection against inflation. Capital preservation and liquidity are important secondary goals.
Spending Policy:
Common School Permanent Land Fund: 5% of trailing 5-year average market value of the fund, calculated on the first day of the fiscal year (commencing FY 2021: 4.75% of the trailing 5-year average market value; commencing FY 2022 and thereafter: 4.5% of the trailing 5-year average market value). - Amounts must be sourced from investment income (interest and dividends) and realized
capital gains.- Earnings in excess of the spending policy are appropriated to the reserve account. Reserve
account balance must exceed 150% of the current fiscal year’s spending policy before transferring any excess funds to the corpus.
Excellence in Higher Education Endowment Fund: 5% of trailing 5-year average market value of the fund, calculated on the first day of the fiscal year (commencing FY 2019 and thereafter: 4.75% of the trailing 5-year average market value). - Amounts must be sourced from investment income (interest and dividends) and realized
capital gains.- Earnings in excess of the spending policy are appropriated to the reserve account. Reserve
account balance must exceed 150% of the current fiscal year’s spending policy before transferring any excess funds to the corpus.
Liquidity Requirements: Liquidity must be maintained to move income and capital gains generated during the year out of the fund.
Investment Constraints: Maximum of 70% of the total book value of permanent funds may be invested in equities and alternative investments.
Permanent Funds – Income FocusCommon School Permanent Land Fund and Excellence in Higher Education Endowment Fund
26
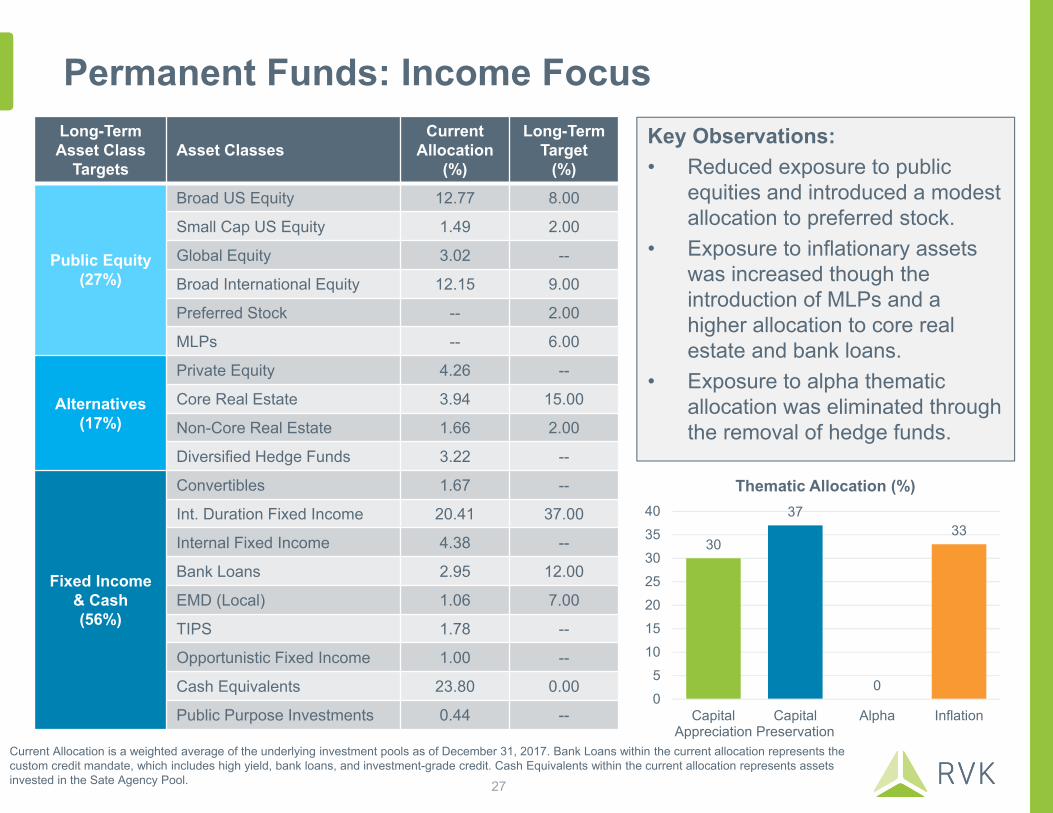
Permanent Funds: Income FocusKey Observations:• Reduced exposure to public
equities and introduced a modest allocation to preferred stock.
• Exposure to inflationary assets was increased though the introduction of MLPs and a higher allocation to core real estate and bank loans.
• Exposure to alpha thematic allocation was eliminated through the removal of hedge funds.
Long-Term Asset Class
TargetsAsset Classes
Current Allocation
(%)
Long-Term Target
(%)
Public Equity(27%)
Broad US Equity 12.77 8.00
Small Cap US Equity 1.49 2.00
Global Equity 3.02 --
Broad International Equity 12.15 9.00
Preferred Stock -- 2.00
MLPs -- 6.00
Alternatives(17%)
Private Equity 4.26 --
Core Real Estate 3.94 15.00
Non-Core Real Estate 1.66 2.00
Diversified Hedge Funds 3.22 --
Fixed Income & Cash(56%)
Convertibles 1.67 --
Int. Duration Fixed Income 20.41 37.00
Internal Fixed Income 4.38 --
Bank Loans 2.95 12.00
EMD (Local) 1.06 7.00
TIPS 1.78 --
Opportunistic Fixed Income 1.00 --
Cash Equivalents 23.80 0.00
Public Purpose Investments 0.44 --
30
37
0
33
05
10152025303540
CapitalAppreciation
CapitalPreservation
Alpha Inflation
Thematic Allocation (%)
Current Allocation is a weighted average of the underlying investment pools as of December 31, 2017. Bank Loans within the current allocation represents the custom credit mandate, which includes high yield, bank loans, and investment-grade credit. Cash Equivalents within the current allocation represents assets invested in the Sate Agency Pool. 27

Permanent Funds: Income Focus
Current Allocation is a weighted average of the underlying investment pools as of December 31, 2017. Current Allocation expected return and risk excludes Opportunistic Fixed Income and Public Purpose Investments.
1
2
3
4
5
6
7
8
9
10
Income Focus Target
Current Allocation
3.00
3.50
4.00
4.50
5.00
5.50
6.00
6.50
7.00
7.50
4.00 6.00 8.00 10.00 12.00 14.00 16.00
Ret
urn
(Ann
ualiz
ed, %
)
Risk (Annualized Standard Deviation, %)
Efficient Frontier
28
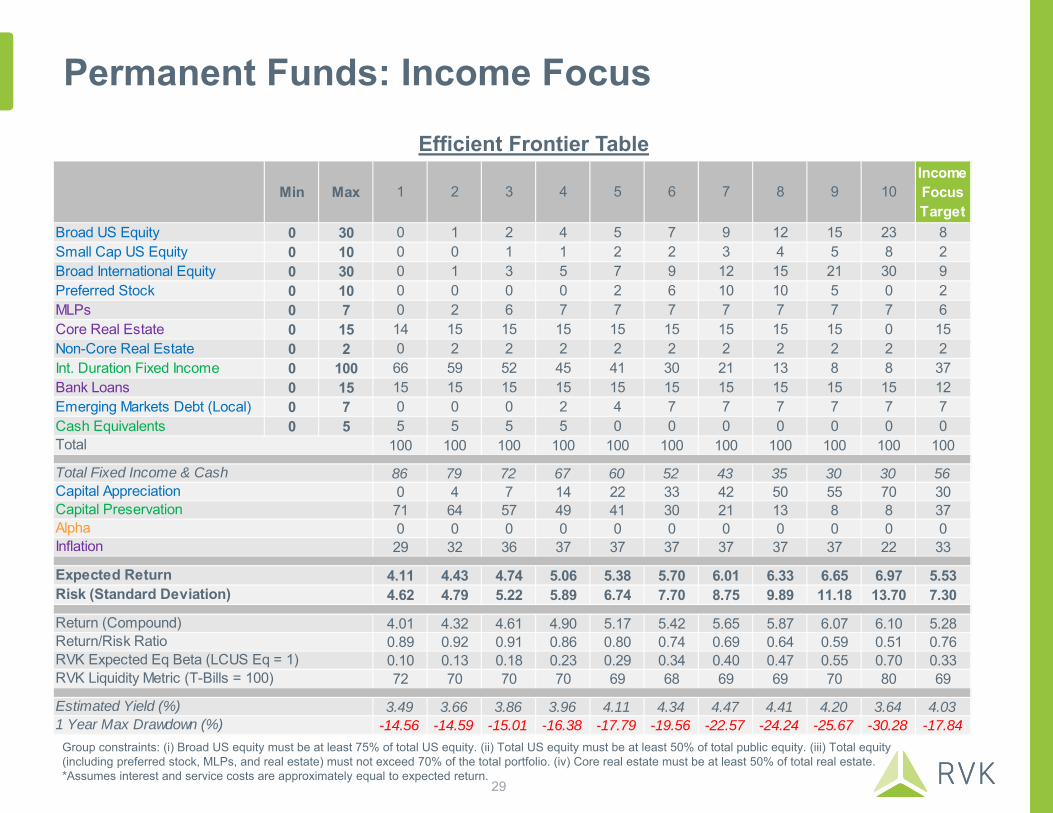
Permanent Funds: Income FocusEfficient Frontier Table
Group constraints: (i) Broad US equity must be at least 75% of total US equity. (ii) Total US equity must be at least 50% of total public equity. (iii) Total equity (including preferred stock, MLPs, and real estate) must not exceed 70% of the total portfolio. (iv) Core real estate must be at least 50% of total real estate.*Assumes interest and service costs are approximately equal to expected return.
Min Max 1 2 3 4 5 6 7 8 9 10Income Focus Target
Broad US Equity 0 30 0 1 2 4 5 7 9 12 15 23 8Small Cap US Equity 0 10 0 0 1 1 2 2 3 4 5 8 2Broad International Equity 0 30 0 1 3 5 7 9 12 15 21 30 9Preferred Stock 0 10 0 0 0 0 2 6 10 10 5 0 2MLPs 0 7 0 2 6 7 7 7 7 7 7 7 6Core Real Estate 0 15 14 15 15 15 15 15 15 15 15 0 15Non-Core Real Estate 0 2 0 2 2 2 2 2 2 2 2 2 2Int. Duration Fixed Income 0 100 66 59 52 45 41 30 21 13 8 8 37Bank Loans 0 15 15 15 15 15 15 15 15 15 15 15 12Emerging Markets Debt (Local) 0 7 0 0 0 2 4 7 7 7 7 7 7Cash Equivalents 0 5 5 5 5 5 0 0 0 0 0 0 0
100 100 100 100 100 100 100 100 100 100 100
86 79 72 67 60 52 43 35 30 30 560 4 7 14 22 33 42 50 55 70 3071 64 57 49 41 30 21 13 8 8 370 0 0 0 0 0 0 0 0 0 029 32 36 37 37 37 37 37 37 22 33
4.11 4.43 4.74 5.06 5.38 5.70 6.01 6.33 6.65 6.97 5.534.62 4.79 5.22 5.89 6.74 7.70 8.75 9.89 11.18 13.70 7.30
4.01 4.32 4.61 4.90 5.17 5.42 5.65 5.87 6.07 6.10 5.280.89 0.92 0.91 0.86 0.80 0.74 0.69 0.64 0.59 0.51 0.760.10 0.13 0.18 0.23 0.29 0.34 0.40 0.47 0.55 0.70 0.3372 70 70 70 69 68 69 69 70 80 69
3.49 3.66 3.86 3.96 4.11 4.34 4.47 4.41 4.20 3.64 4.03-14.56 -14.59 -15.01 -16.38 -17.79 -19.56 -22.57 -24.24 -25.67 -30.28 -17.84
Estimated Yield (%)
Total
Expected ReturnRisk (Standard Deviation)
Return (Compound)Return/Risk RatioRVK Expected Eq Beta (LCUS Eq = 1)RVK Liquidity Metric (T-Bills = 100)
Total Fixed Income & CashCapital AppreciationCapital PreservationAlphaInflation
1 Year Max Drawdown (%)
29
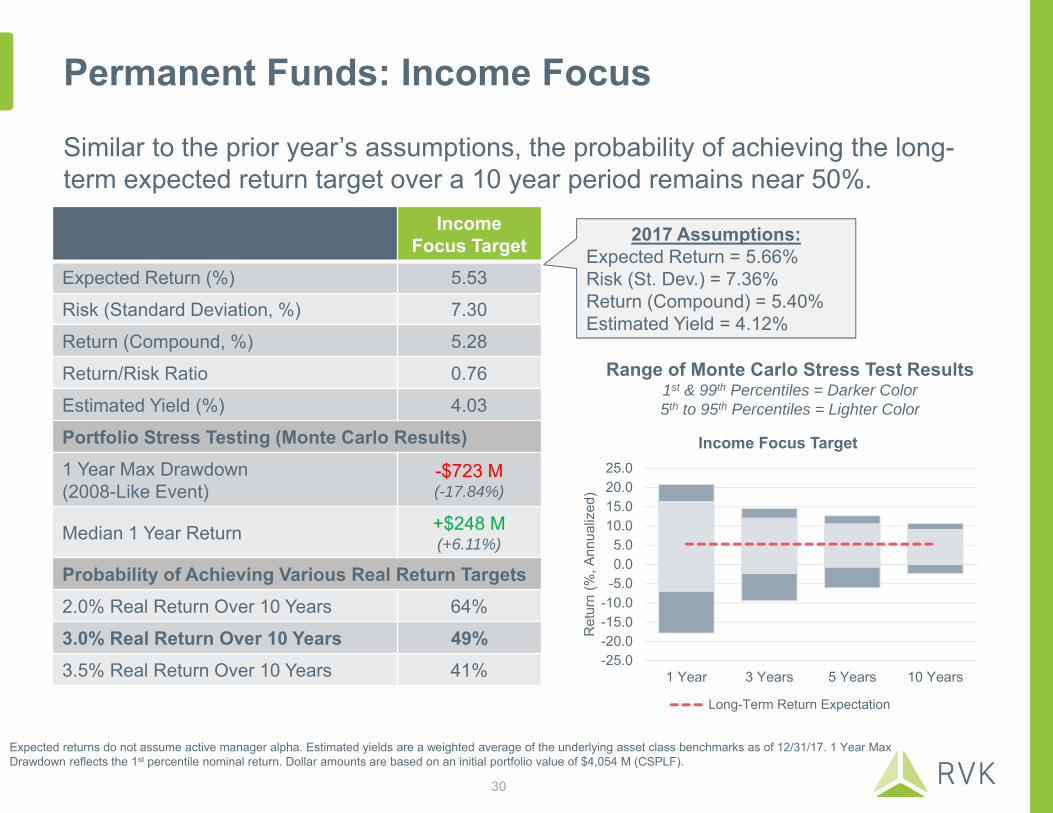
Permanent Funds: Income Focus
Similar to the prior year’s assumptions, the probability of achieving the long-term expected return target over a 10 year period remains near 50%.
IncomeFocus Target
Expected Return (%) 5.53
Risk (Standard Deviation, %) 7.30
Return (Compound, %) 5.28
Return/Risk Ratio 0.76
Estimated Yield (%) 4.03
Portfolio Stress Testing (Monte Carlo Results)1 Year Max Drawdown(2008-Like Event)
-$723 M(-17.84%)
Median 1 Year Return +$248 M(+6.11%)
Probability of Achieving Various Real Return Targets2.0% Real Return Over 10 Years 64%
3.0% Real Return Over 10 Years 49%3.5% Real Return Over 10 Years 41%
Expected returns do not assume active manager alpha. Estimated yields are a weighted average of the underlying asset class benchmarks as of 12/31/17. 1 Year Max Drawdown reflects the 1st percentile nominal return. Dollar amounts are based on an initial portfolio value of $4,054 M (CSPLF).
Range of Monte Carlo Stress Test Results1st & 99th Percentiles = Darker Color5th to 95th Percentiles = Lighter Color
2017 Assumptions:Expected Return = 5.66%Risk (St. Dev.) = 7.36%Return (Compound) = 5.40%Estimated Yield = 4.12%
-25.0-20.0-15.0-10.0-5.00.05.0
10.015.020.025.0
1 Year 3 Years 5 Years 10 Years
Ret
urn
(%, A
nnua
lized
)
Income Focus Target
Long-Term Return Expectation
30

Permanent Funds: Risk Analysis
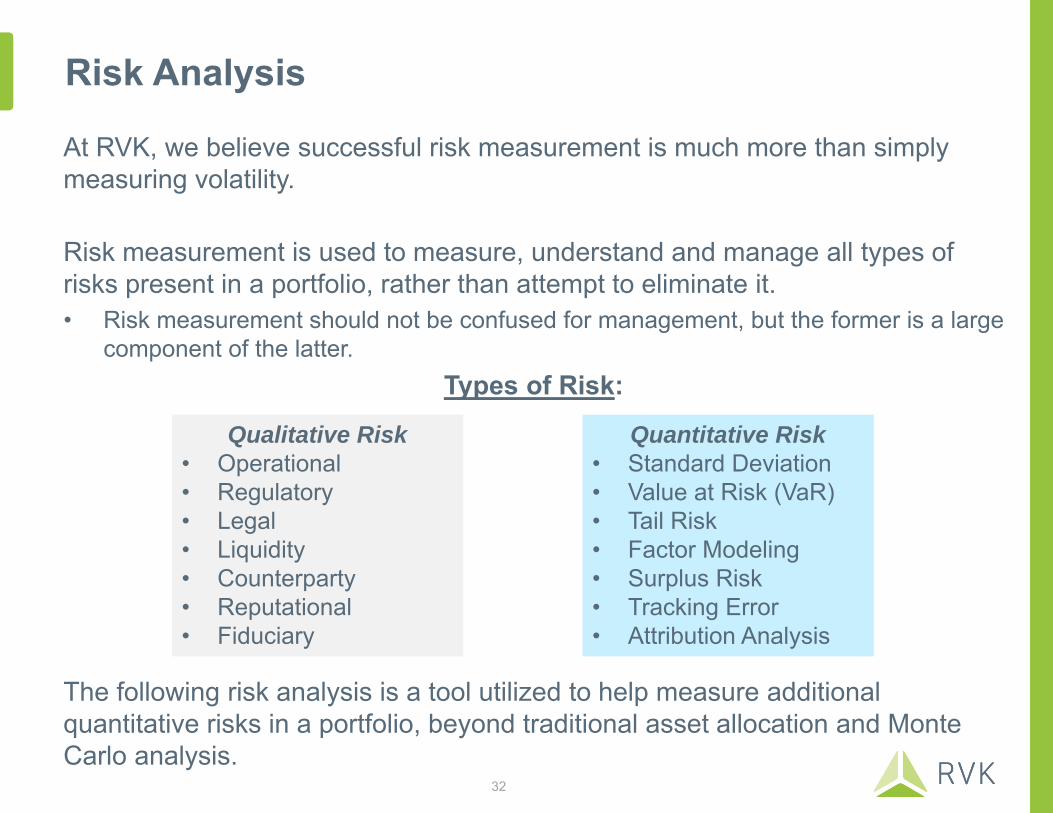
Risk Analysis
At RVK, we believe successful risk measurement is much more than simply measuring volatility.
Risk measurement is used to measure, understand and manage all types of risks present in a portfolio, rather than attempt to eliminate it.• Risk measurement should not be confused for management, but the former is a large
component of the latter. Types of Risk:
The following risk analysis is a tool utilized to help measure additional quantitative risks in a portfolio, beyond traditional asset allocation and Monte Carlo analysis.
Qualitative Risk• Operational• Regulatory• Legal• Liquidity• Counterparty• Reputational• Fiduciary
Quantitative Risk• Standard Deviation• Value at Risk (VaR)• Tail Risk• Factor Modeling• Surplus Risk• Tracking Error• Attribution Analysis
32

Risk Analysis: Total Return FocusTarget Allocation Risk Summary
January 1, 2008 to December 31, 2017
Factor Contribution to Risk
Percent Contribution to Risk and ETLTotal Portfolio Summary
*Calculated with a 99% Confidence Interval.**Similar to the Sharpe Ratio which is a standard deviation-based performance measure, but STARR (stable tail-adjusted return ratio) uses the ETL in the denominator as a risk measure. STARR can be seen as a more effective indicator of risk-adjusted performance because it penalizes only for downside risk, while the standard deviation does not distinguish between upside and downside risk.
Volatility 6.3%
Value at Risk (VaR)* 12.9%
Expected Tail Loss (ETL)* 17.3%
Expected Tail Return (ETR)* 12.3%
Rachev Ratio (ETR/ETL)* 0.7
STARR Performance (Excess Return/ETL)** 0.1
21%
6%
33%
6%
19%
2%
1%
3%
2%
7%
2%
20%
7%
35%
7%
13%
1%
0%
3%
3%
2%
7%
2%
10%
3%
13%
5%
8%
6%
4%
8%
29%
5%
5%
5%
0% 10% 20% 30% 40%
US EquitySmall Cap US…
International EquityMLPs
Private EquityCore Real Estate
Non-Core Real…Div. Hedge Funds
Int. Duration…Bank Loans
Emerging Market…TIPS
Percent Contribution to ETL Percent Contribution to Risk Target Allocation
9%
0%
63%
3%
19%
0%
1%
8%
-2%
-20% 0% 20% 40% 60% 80%
Specific Risk
Commodity Risk
Equity Risk
FX Risk
Fixed Income Risk
Style Risk
Size Risk
Interest Rate Risk
Volatility
Scenario Analysis
Analysis provided by PerTrac RiskPlus powered by FinAnalytica. All values are annual.
33
2.0%
-1.9%
5.3%
-5.1%
3.4%
-5.8%
-16.7%
8.0%
-2.3%
-30%
-20%
-10%
0%
10%
20%
30%

Risk Analysis: Income FocusTarget Allocation Risk Summary
January 1, 2008 to December 31, 2017
Analysis provided by PerTrac RiskPlus powered by FinAnalytica. All values are annual.
Factor Contribution to Risk
Percent Contribution to Risk and ETLTotal Portfolio Summary
*Calculated with a 99% Confidence Interval.**Similar to the Sharpe Ratio which is a standard deviation-based performance measure, but STARR (stable tail-adjusted return ratio) uses the ETL in the denominator as a risk measure. STARR can be seen as a more effective indicator of risk-adjusted performance because it penalizes only for downside risk, while the standard deviation does not distinguish between upside and downside risk.
Volatility 5.3%
Value at Risk (VaR)* 9.5%
Expected Tail Loss (ETL)* 12.7%
Expected Tail Return (ETR)* 10.8%
Rachev Ratio (ETR/ETL)* 0.9
STARR Performance (Excess Return/ETL)** 0.1
Scenario Analysis
34
1.5%
-1.4%
3.9%
-3.6%
1.9%
-2.2%
-15.2%
10.3%
-9.0%
-25%-20%-15%-10%
-5%0%5%
10%15%20%25%
21%
5%
29%
3%
12%
8%
0%
2%
7%
13%
19%
5%
29%
3%
14%
5%
0%
6%
7%
12%
8%
2%
9%
2%
6%
15%
2%
37%
12%
7%
0% 10% 20% 30% 40% 50%
US Equity
Small Cap US…
International Equity
Preferred Stock
MLPs
Core Real Estate
Non-Core Real…
Int. Duration…
Bank Loans
Emerging Market…
Percent Contribution to ETL Percent Contribution to Risk Target Allocation
7%
0%
84%
2%
13%
0%
-1%
3%
-8%
-20% 0% 20% 40% 60% 80% 100%
Specific Risk
Commodity Risk
Equity Risk
FX Risk
Fixed Income Risk
Style Risk
Size Risk
Interest Rate Risk
Volatility

Permanent Funds: Intergenerational Equity Analysis

Intergenerational Equity
Key Principles:1. Strives for egalitarian equity between present and future generations in the
State of Wyoming. 2. Aims to ensure citizens of tomorrow have the same opportunities and
purchasing power as the citizens of today.
Components:Each plays an important role in maintaining Intergenerational Equity. 1. Sustainable Spending Policy2. Investment Returns (After Inflation)3. Contribution Policy
Sustainable Spending
Policy
Investment Returns(After
Inflation)
Contribution Policy
36

Permanent Funds and Intergenerational Equity
Maintaining intergenerational equity or attaining the “Full Objective” is defined as:1. Preserving economic value after inflation2. Achieving 1% annual real growth to account for increasing resource demands (e.g.
population growth)
Probability of Attaining Full ObjectiveFunds should strive to reach and maintain a 50% probability of attaining the Full Objective in order to provide equitable opportunities across all generations.
Full Objective for Permanent FundsFor the following Funds, attaining the Full Objective would mean growing Fund assets from today’s market value to the following in Year 50:
Since the Full Objective is to achieve real growth, all subsequent data shown is in real terms (after inflation).
Probability Interpretation0% - 49% Value of benefits available to future generations is eroding relative to generations of today
50% Value of benefits available to future generations is equal relative to generations of today
51% - 100% Value of benefits available to future generations is greater relative to generations to today
PMTF CSPLF Hathaway Higher Ed
Beginning Fund Value (6/30/17) $7,666 M $3,860 M $589 M $121 M
Full Objective Value in Year 50 $12,608 M $6,667 M $968 M $200 M
37
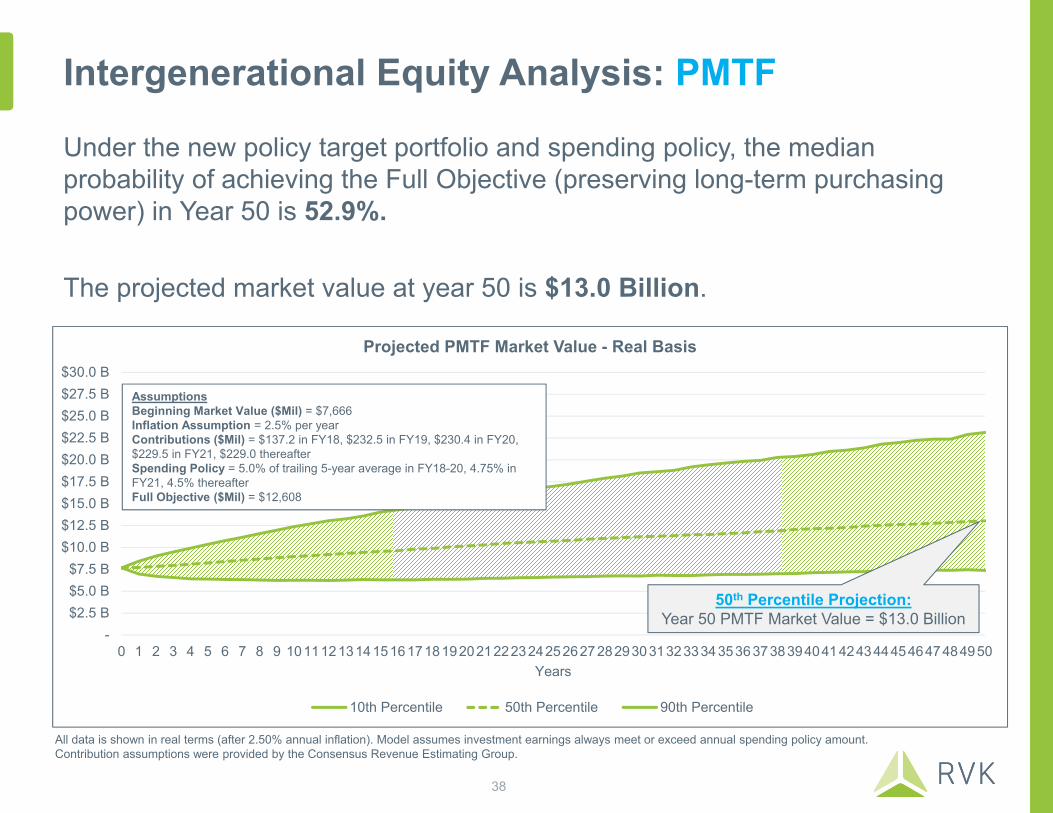
Intergenerational Equity Analysis: PMTF
Under the new policy target portfolio and spending policy, the median probability of achieving the Full Objective (preserving long-term purchasing power) in Year 50 is 52.9%.
The projected market value at year 50 is $13.0 Billion.
All data is shown in real terms (after 2.50% annual inflation). Model assumes investment earnings always meet or exceed annual spending policy amount. Contribution assumptions were provided by the Consensus Revenue Estimating Group.
-$2.5 B$5.0 B$7.5 B
$10.0 B$12.5 B$15.0 B$17.5 B$20.0 B$22.5 B$25.0 B$27.5 B$30.0 B
0 1 2 3 4 5 6 7 8 9 1011121314151617181920212223242526272829303132333435363738394041424344454647484950Years
Projected PMTF Market Value - Real Basis
10th Percentile 50th Percentile 90th Percentile
AssumptionsBeginning Market Value ($Mil) = $7,666 Inflation Assumption = 2.5% per yearContributions ($Mil) = $137.2 in FY18, $232.5 in FY19, $230.4 in FY20, $229.5 in FY21, $229.0 thereafterSpending Policy = 5.0% of trailing 5-year average in FY18-20, 4.75% in FY21, 4.5% thereafterFull Objective ($Mil) = $12,608
50th Percentile Projection:Year 50 PMTF Market Value = $13.0 Billion
38

Intergenerational Equity Analysis: PMTF
PMTF – Total ReturnFocus Target
Cumulative 50 Year Distributions ($B) $23.6Volatility of Annual Spending Changes (% YoY St. Dev.) 4.31%Projected 50 Year Market Value ($B) $13.0Probability of Achieving Full Objective 52.9%
Inflation Contributions Distributions
Baseline(Probability of AchievingFull Objective)
2.5% per year(52.9%)
$137.2M in FY18, $232.5M in FY19, $230.4M in FY20, $229.5M
in FY21, $229.0M thereafter(52.9%)
5.0% spending rate in FY18-20,4.75% spending rate in FY21, 4.5% spending rate thereafter
(52.9%)
Impact of UP move to assumption
3.5% per year(25.0%)
$137.2M in FY18, $232.5M in FY19, $230.4M in FY20, $229.5M
in FY21, $229.0M in FY22, growing by 1%/year thereafter
(70.2%)
5.0% spending rate in FY18-20,4.75% spending rate in FY21, 5.5% spending rate thereafter
(25.3%)
Impact of DOWN move to assumption
1.5% per year(76.7%)
$137.2M in FY18, $232.5M in FY19, $230.4M in FY20, $229.5M
in FY21, $229.0M in FY22, declining by 1%/year thereafter
(39.2%)
5.0% spending rate inFY18-20,4.75% spending rate in FY21, 3.5% spending rate thereafter
(77.2%)
Sensitivity Analysis
Current Framework
All data is shown in real terms (after 2.50% annual inflation). Model assumes investment earnings always meet or exceed annual spending policy amount. Contribution assumptions were provided by the Consensus Revenue Estimating Group.
39
-
$2.5 B
$5.0 B
$7.5 B
$10.0 B
$12.5 B
$15.0 B
$17.5 B
$20.0 B
0 1 2 3 4 5 6 7 8 9 1011121314151617181920212223242526272829303132333435363738394041424344454647484950Years
Projected CSPLF Market Value - Real Basis
10th Percentile 50th Percentile 90th Percentile
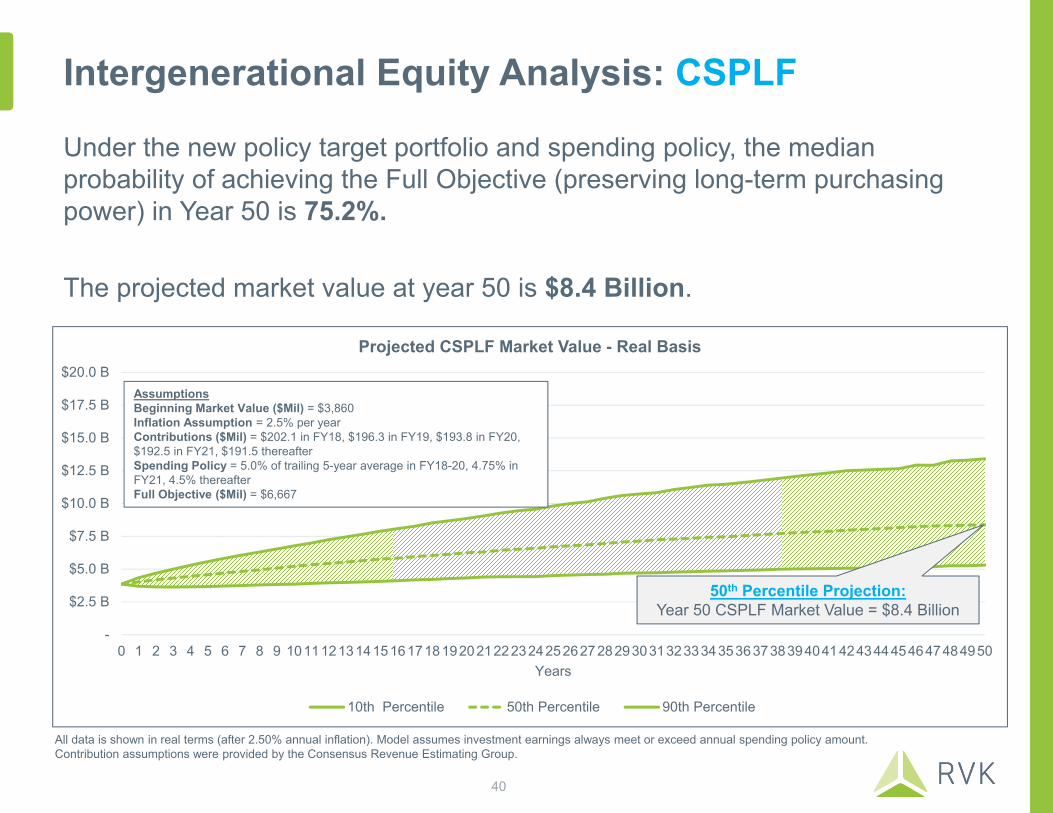
Intergenerational Equity Analysis: CSPLF
Under the new policy target portfolio and spending policy, the median probability of achieving the Full Objective (preserving long-term purchasing power) in Year 50 is 75.2%.
The projected market value at year 50 is $8.4 Billion.
AssumptionsBeginning Market Value ($Mil) = $3,860 Inflation Assumption = 2.5% per yearContributions ($Mil) = $202.1 in FY18, $196.3 in FY19, $193.8 in FY20, $192.5 in FY21, $191.5 thereafterSpending Policy = 5.0% of trailing 5-year average in FY18-20, 4.75% in FY21, 4.5% thereafterFull Objective ($Mil) = $6,667
50th Percentile Projection:Year 50 CSPLF Market Value = $8.4 Billion
All data is shown in real terms (after 2.50% annual inflation). Model assumes investment earnings always meet or exceed annual spending policy amount. Contribution assumptions were provided by the Consensus Revenue Estimating Group.
40
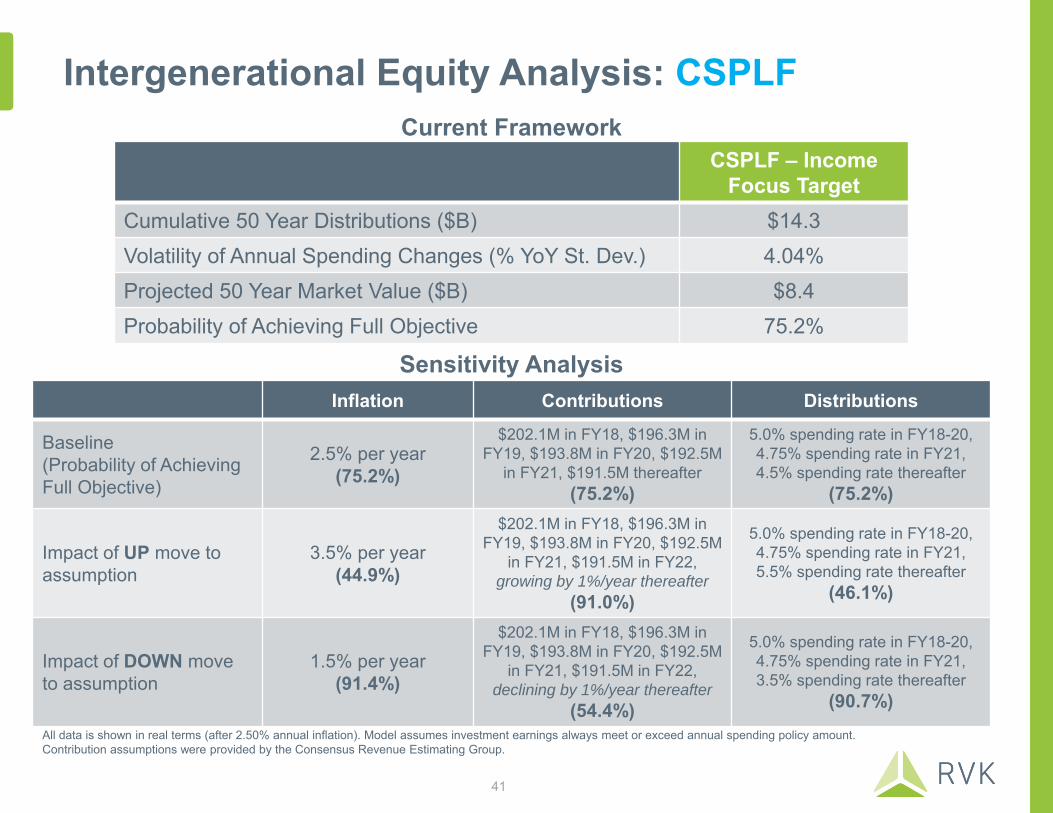
Intergenerational Equity Analysis: CSPLF
CSPLF – Income Focus Target
Cumulative 50 Year Distributions ($B) $14.3Volatility of Annual Spending Changes (% YoY St. Dev.) 4.04%Projected 50 Year Market Value ($B) $8.4Probability of Achieving Full Objective 75.2%
Inflation Contributions Distributions
Baseline(Probability of AchievingFull Objective)
2.5% per year(75.2%)
$202.1M in FY18, $196.3M in FY19, $193.8M in FY20, $192.5M
in FY21, $191.5M thereafter(75.2%)
5.0% spending rate in FY18-20,4.75% spending rate in FY21, 4.5% spending rate thereafter
(75.2%)
Impact of UP move to assumption
3.5% per year(44.9%)
$202.1M in FY18, $196.3M in FY19, $193.8M in FY20, $192.5M
in FY21, $191.5M in FY22, growing by 1%/year thereafter
(91.0%)
5.0% spending rate in FY18-20,4.75% spending rate in FY21, 5.5% spending rate thereafter
(46.1%)
Impact of DOWN move to assumption
1.5% per year(91.4%)
$202.1M in FY18, $196.3M in FY19, $193.8M in FY20, $192.5M
in FY21, $191.5M in FY22, declining by 1%/year thereafter
(54.4%)
5.0% spending rate in FY18-20,4.75% spending rate in FY21, 3.5% spending rate thereafter
(90.7%)
Sensitivity Analysis
Current Framework
All data is shown in real terms (after 2.50% annual inflation). Model assumes investment earnings always meet or exceed annual spending policy amount. Contribution assumptions were provided by the Consensus Revenue Estimating Group.
41
-
$0.2 B
$0.4 B
$0.6 B
$0.8 B
$1.0 B
$1.2 B
$1.4 B
$1.6 B
0 1 2 3 4 5 6 7 8 9 10 111213 141516 1718 192021 222324 2526 272829 303132 333435 3637 383940 414243 4445 464748 4950Years
Projected Hathaway Market Value - Real Basis
10th Percentile 50th Percentile 90th Percentile
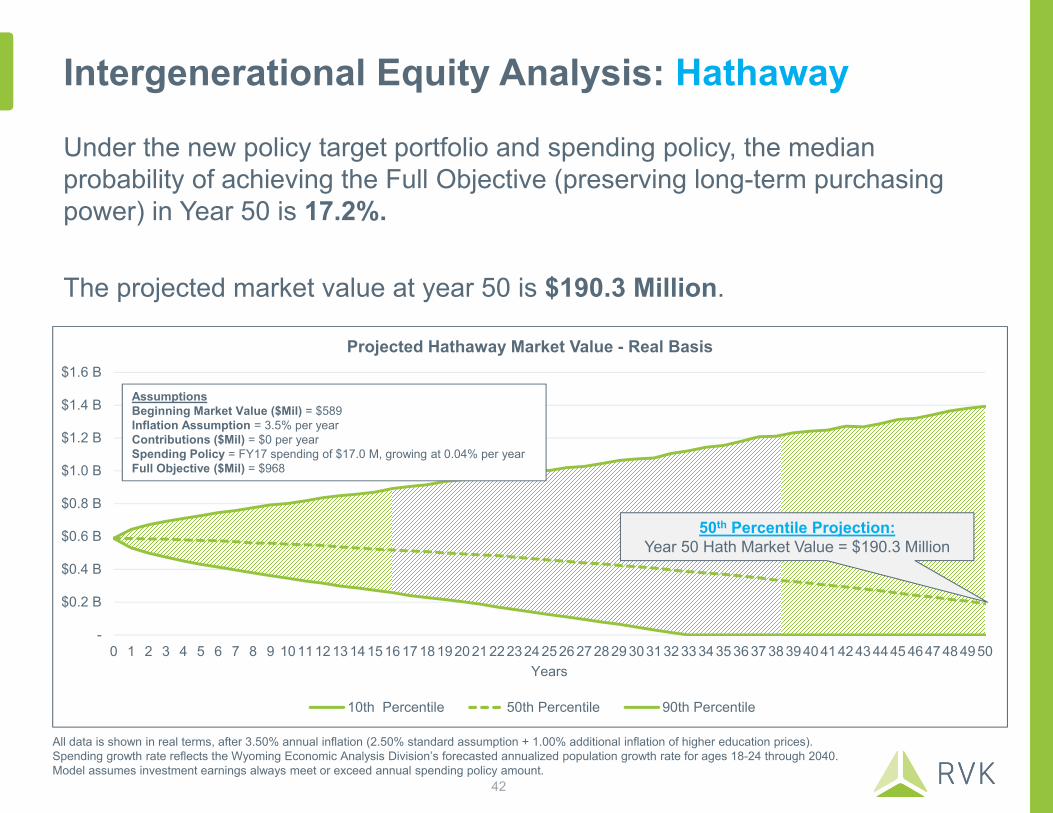
Intergenerational Equity Analysis: Hathaway
Under the new policy target portfolio and spending policy, the median probability of achieving the Full Objective (preserving long-term purchasing power) in Year 50 is 17.2%.
The projected market value at year 50 is $190.3 Million.
AssumptionsBeginning Market Value ($Mil) = $589 Inflation Assumption = 3.5% per yearContributions ($Mil) = $0 per yearSpending Policy = FY17 spending of $17.0 M, growing at 0.04% per yearFull Objective ($Mil) = $968
50th Percentile Projection:Year 50 Hath Market Value = $190.3 Million
All data is shown in real terms, after 3.50% annual inflation (2.50% standard assumption + 1.00% additional inflation of higher education prices). Spending growth rate reflects the Wyoming Economic Analysis Division’s forecasted annualized population growth rate for ages 18-24 through 2040.Model assumes investment earnings always meet or exceed annual spending policy amount.
42
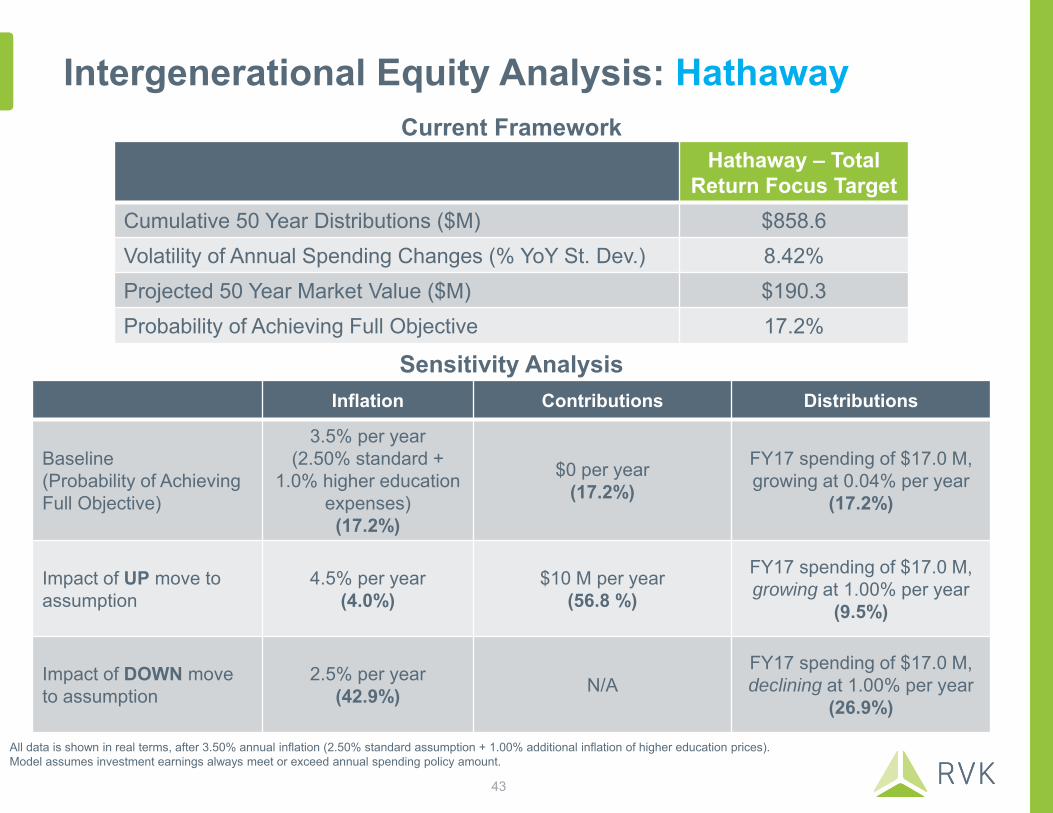
Intergenerational Equity Analysis: Hathaway
Hathaway – Total Return Focus Target
Cumulative 50 Year Distributions ($M) $858.6Volatility of Annual Spending Changes (% YoY St. Dev.) 8.42%Projected 50 Year Market Value ($M) $190.3Probability of Achieving Full Objective 17.2%
Inflation Contributions Distributions
Baseline(Probability of AchievingFull Objective)
3.5% per year(2.50% standard +
1.0% higher education expenses)
(17.2%)
$0 per year(17.2%)
FY17 spending of $17.0 M, growing at 0.04% per year
(17.2%)
Impact of UP move to assumption
4.5% per year(4.0%)
$10 M per year(56.8 %)
FY17 spending of $17.0 M, growing at 1.00% per year
(9.5%)
Impact of DOWN move to assumption
2.5% per year(42.9%) N/A
FY17 spending of $17.0 M, declining at 1.00% per year
(26.9%)
Sensitivity Analysis
Current Framework
All data is shown in real terms, after 3.50% annual inflation (2.50% standard assumption + 1.00% additional inflation of higher education prices). Model assumes investment earnings always meet or exceed annual spending policy amount.
43

Intergenerational Equity Analysis: Higher Ed
All data is shown in real terms, after 3.50% annual inflation (2.50% standard assumption + 1.00% additional inflation of higher education prices). Model assumes investment earnings always meet or exceed annual spending policy amount.
-
$25.0 M
$50.0 M
$75.0 M
$100.0 M
$125.0 M
$150.0 M
0 1 2 3 4 5 6 7 8 9 1011121314151617181920212223242526272829303132333435363738394041424344454647484950Years
Projected Higher Education Market Value - Real Basis
10th Percentile 50th Percentile 90th Percentile
Under the new policy target portfolio and spending policy, the median probability of achieving the Full Objective (preserving long-term purchasing power) in Year 50 is 0.0%.
The projected market value at year 50 is $21.4 Million.
AssumptionsBeginning Market Value ($Mil) = $121 Inflation Assumption = 3.5% per yearContributions ($Mil) = $0 per yearSpending Policy = 5.0% of trailing 5-year average in FY18, 4.75% thereafterFull Objective ($Mil) = $200
50th Percentile Projection:Year 50 HiEd Market Value = $21.4 Million
44
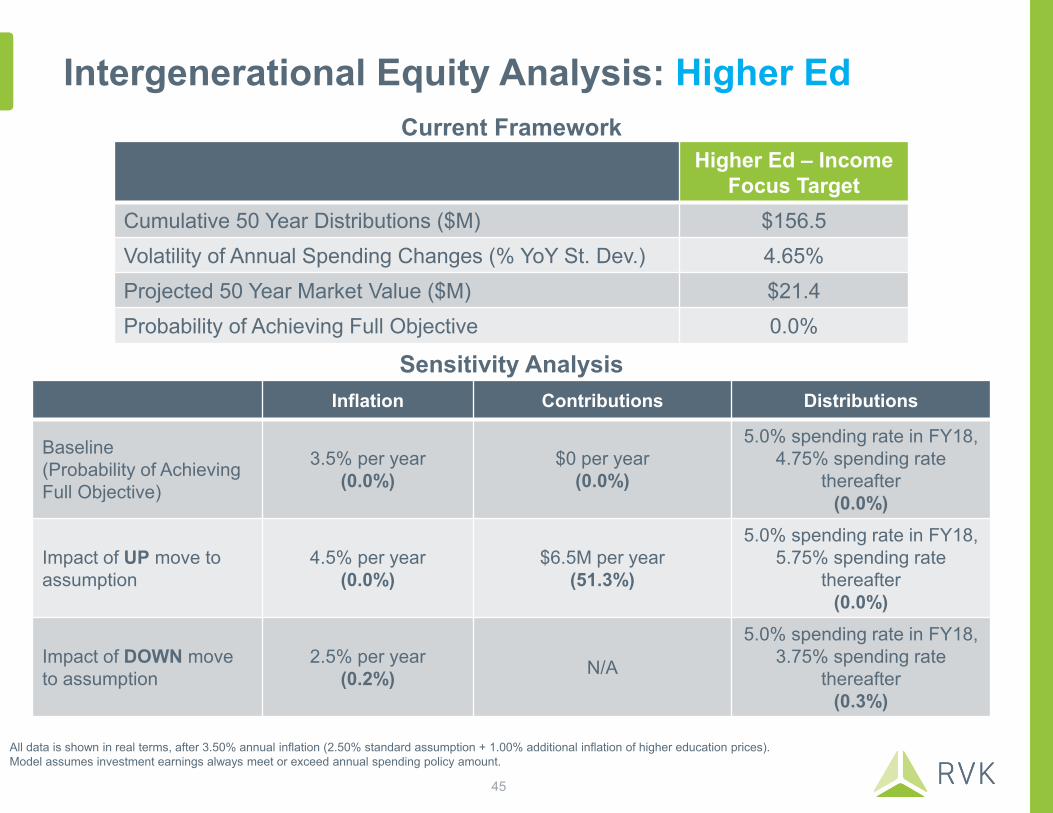
Intergenerational Equity Analysis: Higher Ed
Higher Ed – IncomeFocus Target
Cumulative 50 Year Distributions ($M) $156.5Volatility of Annual Spending Changes (% YoY St. Dev.) 4.65%Projected 50 Year Market Value ($M) $21.4Probability of Achieving Full Objective 0.0%
Inflation Contributions Distributions
Baseline(Probability of AchievingFull Objective)
3.5% per year(0.0%)
$0 per year(0.0%)
5.0% spending rate in FY18,4.75% spending rate
thereafter(0.0%)
Impact of UP move to assumption
4.5% per year(0.0%)
$6.5M per year(51.3%)
5.0% spending rate in FY18,5.75% spending rate
thereafter(0.0%)
Impact of DOWN move to assumption
2.5% per year(0.2%) N/A
5.0% spending rate in FY18,3.75% spending rate
thereafter(0.3%)
Sensitivity Analysis
Current Framework
All data is shown in real terms, after 3.50% annual inflation (2.50% standard assumption + 1.00% additional inflation of higher education prices). Model assumes investment earnings always meet or exceed annual spending policy amount.
45

Asset Allocation: State Agency Pool
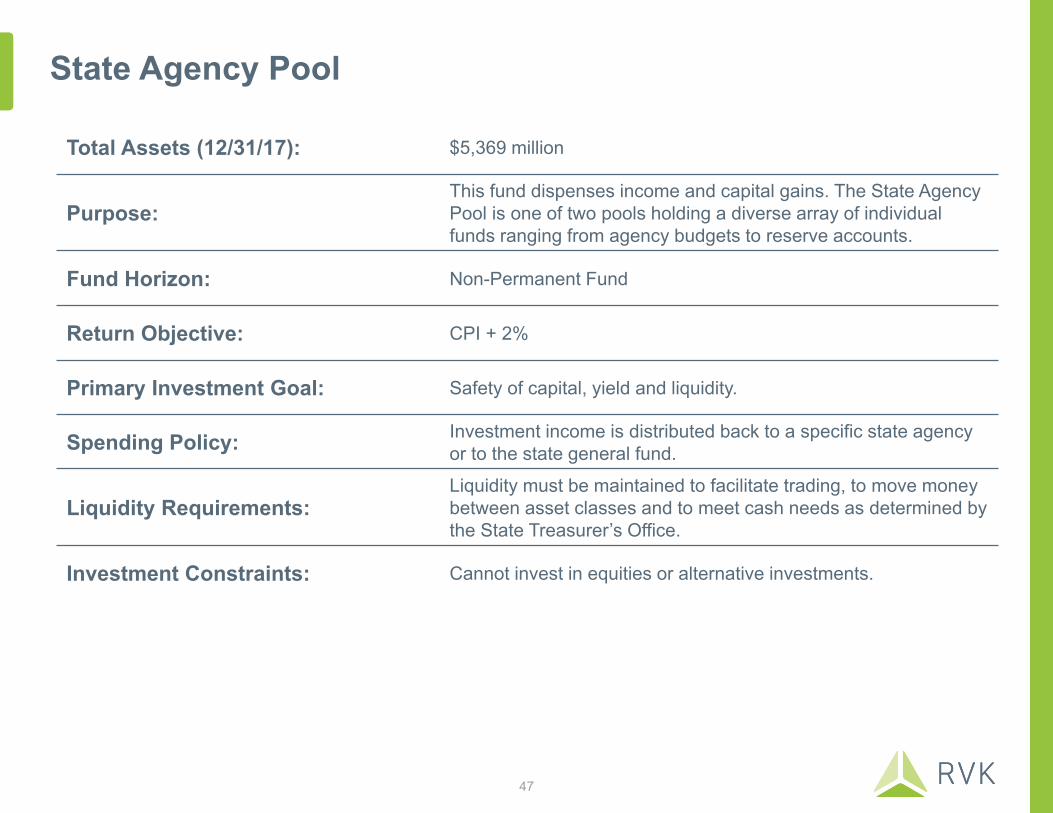
State Agency Pool
Total Assets (12/31/17): $5,369 million
Purpose:This fund dispenses income and capital gains. The State Agency Pool is one of two pools holding a diverse array of individual funds ranging from agency budgets to reserve accounts.
Fund Horizon: Non-Permanent Fund
Return Objective: CPI + 2%
Primary Investment Goal: Safety of capital, yield and liquidity.
Spending Policy: Investment income is distributed back to a specific state agency or to the state general fund.
Liquidity Requirements:Liquidity must be maintained to facilitate trading, to move money between asset classes and to meet cash needs as determined by the State Treasurer’s Office.
Investment Constraints: Cannot invest in equities or alternative investments.
47
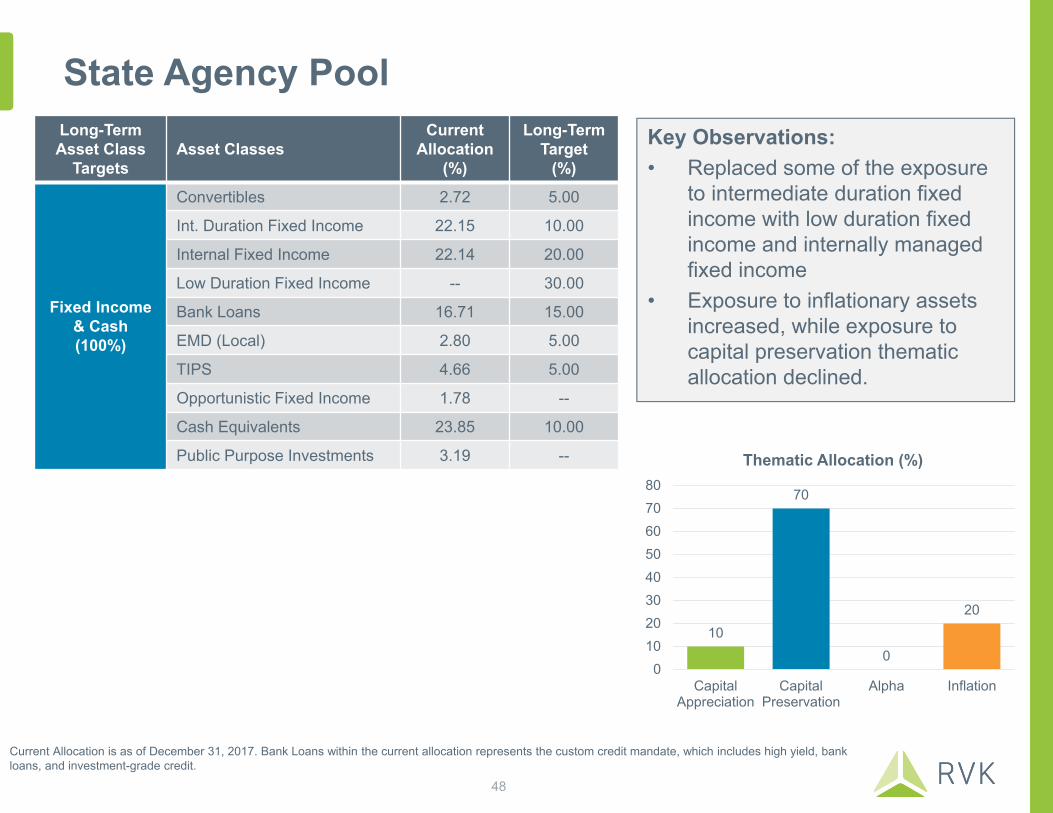
State Agency PoolKey Observations:• Replaced some of the exposure
to intermediate duration fixed income with low duration fixed income and internally managed fixed income
• Exposure to inflationary assets increased, while exposure to capital preservation thematic allocation declined.
Long-Term Asset Class
TargetsAsset Classes
Current Allocation
(%)
Long-Term Target
(%)
Fixed Income & Cash(100%)
Convertibles 2.72 5.00
Int. Duration Fixed Income 22.15 10.00
Internal Fixed Income 22.14 20.00
Low Duration Fixed Income -- 30.00
Bank Loans 16.71 15.00
EMD (Local) 2.80 5.00
TIPS 4.66 5.00
Opportunistic Fixed Income 1.78 --
Cash Equivalents 23.85 10.00
Public Purpose Investments 3.19 --
10
70
0
20
01020304050607080
CapitalAppreciation
CapitalPreservation
Alpha Inflation
Thematic Allocation (%)
Current Allocation is as of December 31, 2017. Bank Loans within the current allocation represents the custom credit mandate, which includes high yield, bank loans, and investment-grade credit.
48
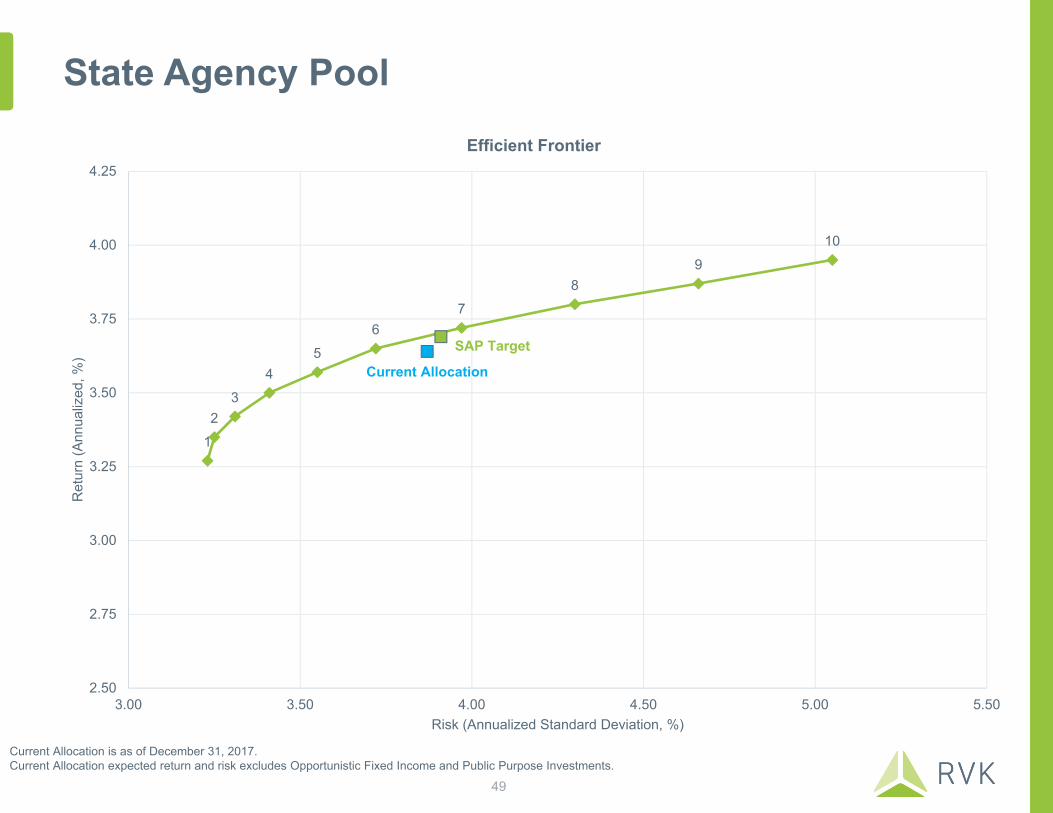
State Agency Pool
12
34
56
78
910
SAP Target
Current Allocation
2.50
2.75
3.00
3.25
3.50
3.75
4.00
4.25
3.00 3.50 4.00 4.50 5.00 5.50
Ret
urn
(Ann
ualiz
ed, %
)
Risk (Annualized Standard Deviation, %)
Efficient Frontier
Current Allocation is as of December 31, 2017. Current Allocation expected return and risk excludes Opportunistic Fixed Income and Public Purpose Investments.
49
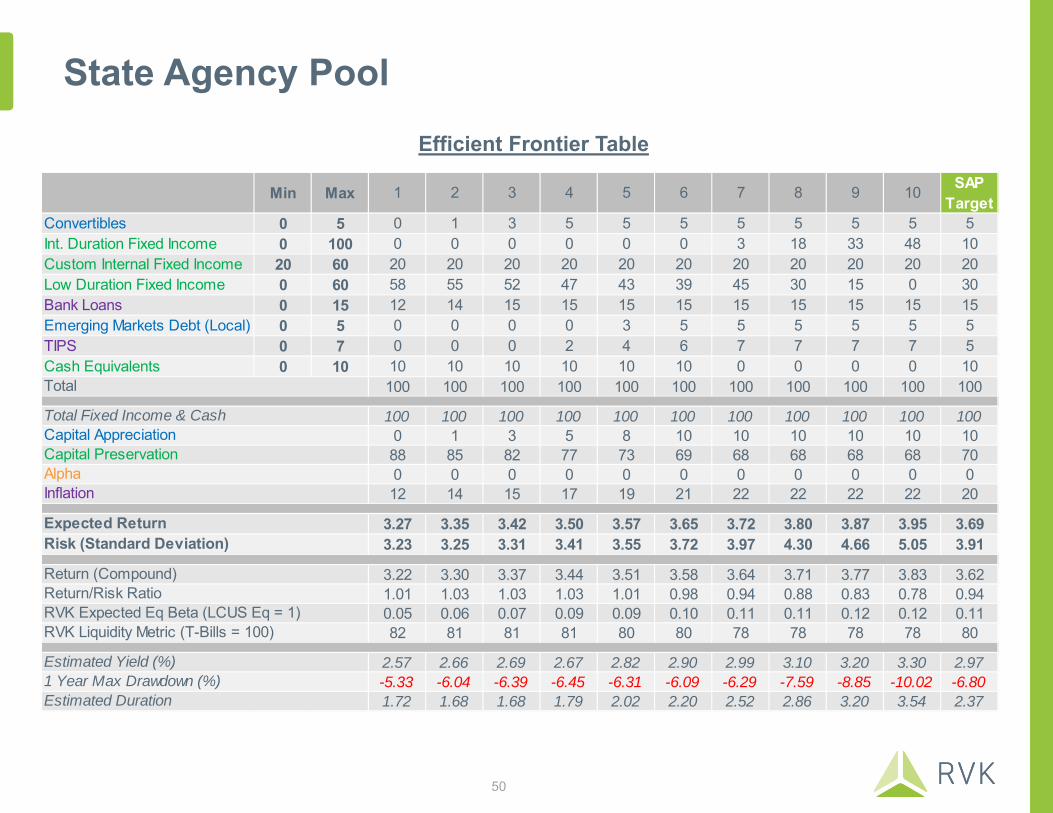
State Agency PoolEfficient Frontier Table
Min Max 1 2 3 4 5 6 7 8 9 10 SAP Target
Convertibles 0 5 0 1 3 5 5 5 5 5 5 5 5Int. Duration Fixed Income 0 100 0 0 0 0 0 0 3 18 33 48 10Custom Internal Fixed Income 20 60 20 20 20 20 20 20 20 20 20 20 20Low Duration Fixed Income 0 60 58 55 52 47 43 39 45 30 15 0 30Bank Loans 0 15 12 14 15 15 15 15 15 15 15 15 15Emerging Markets Debt (Local) 0 5 0 0 0 0 3 5 5 5 5 5 5TIPS 0 7 0 0 0 2 4 6 7 7 7 7 5Cash Equivalents 0 10 10 10 10 10 10 10 0 0 0 0 10
100 100 100 100 100 100 100 100 100 100 100
100 100 100 100 100 100 100 100 100 100 1000 1 3 5 8 10 10 10 10 10 1088 85 82 77 73 69 68 68 68 68 700 0 0 0 0 0 0 0 0 0 012 14 15 17 19 21 22 22 22 22 20
3.27 3.35 3.42 3.50 3.57 3.65 3.72 3.80 3.87 3.95 3.693.23 3.25 3.31 3.41 3.55 3.72 3.97 4.30 4.66 5.05 3.91
3.22 3.30 3.37 3.44 3.51 3.58 3.64 3.71 3.77 3.83 3.621.01 1.03 1.03 1.03 1.01 0.98 0.94 0.88 0.83 0.78 0.940.05 0.06 0.07 0.09 0.09 0.10 0.11 0.11 0.12 0.12 0.1182 81 81 81 80 80 78 78 78 78 80
2.57 2.66 2.69 2.67 2.82 2.90 2.99 3.10 3.20 3.30 2.97-5.33 -6.04 -6.39 -6.45 -6.31 -6.09 -6.29 -7.59 -8.85 -10.02 -6.801.72 1.68 1.68 1.79 2.02 2.20 2.52 2.86 3.20 3.54 2.37
Estimated Yield (%)
Estimated Duration
Expected ReturnRisk (Standard Deviation)
Return (Compound)Return/Risk RatioRVK Expected Eq Beta (LCUS Eq = 1)RVK Liquidity Metric (T-Bills = 100)
1 Year Max Drawdown (%)
Inflation
Total
Total Fixed Income & CashCapital AppreciationCapital PreservationAlpha
50
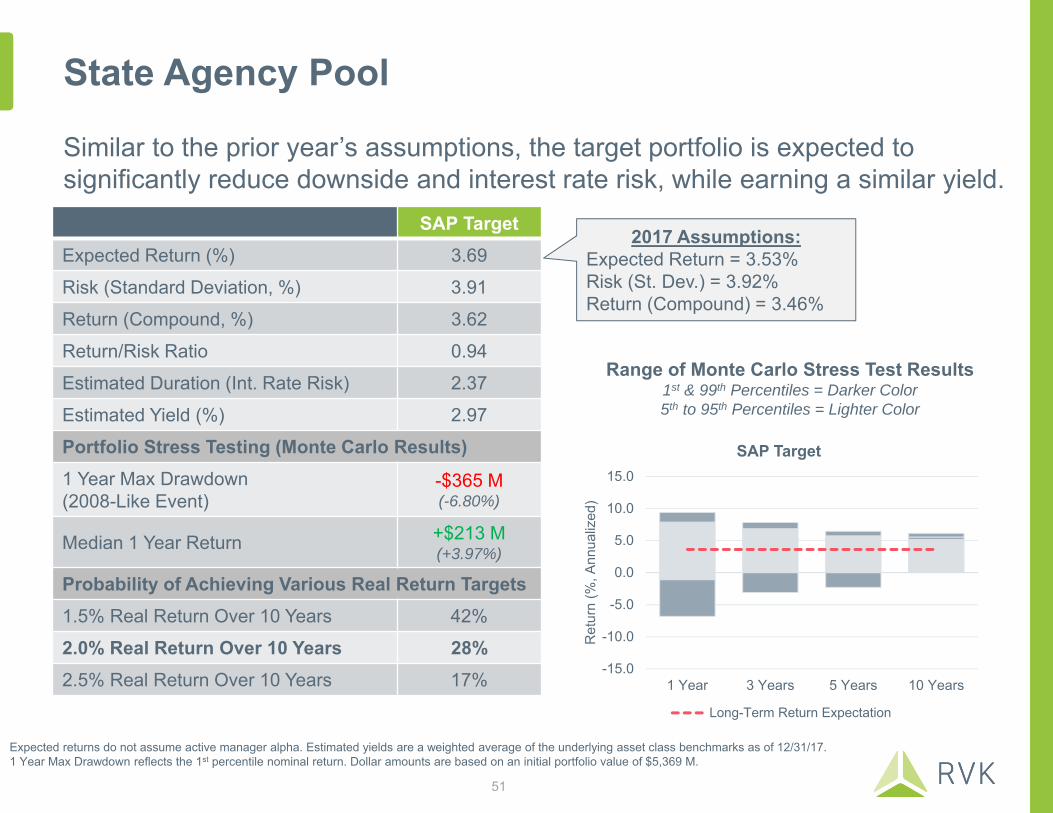
State Agency Pool
Similar to the prior year’s assumptions, the target portfolio is expected to significantly reduce downside and interest rate risk, while earning a similar yield.
SAP TargetExpected Return (%) 3.69
Risk (Standard Deviation, %) 3.91
Return (Compound, %) 3.62
Return/Risk Ratio 0.94
Estimated Duration (Int. Rate Risk) 2.37
Estimated Yield (%) 2.97
Portfolio Stress Testing (Monte Carlo Results)1 Year Max Drawdown(2008-Like Event)
-$365 M(-6.80%)
Median 1 Year Return +$213 M(+3.97%)
Probability of Achieving Various Real Return Targets1.5% Real Return Over 10 Years 42%
2.0% Real Return Over 10 Years 28%2.5% Real Return Over 10 Years 17%
Expected returns do not assume active manager alpha. Estimated yields are a weighted average of the underlying asset class benchmarks as of 12/31/17. 1 Year Max Drawdown reflects the 1st percentile nominal return. Dollar amounts are based on an initial portfolio value of $5,369 M.
Range of Monte Carlo Stress Test Results1st & 99th Percentiles = Darker Color5th to 95th Percentiles = Lighter Color
2017 Assumptions:Expected Return = 3.53%Risk (St. Dev.) = 3.92%Return (Compound) = 3.46%
-15.0
-10.0
-5.0
0.0
5.0
10.0
15.0
1 Year 3 Years 5 Years 10 Years
Ret
urn
(%, A
nnua
lized
)
SAP Target
Long-Term Return Expectation
51
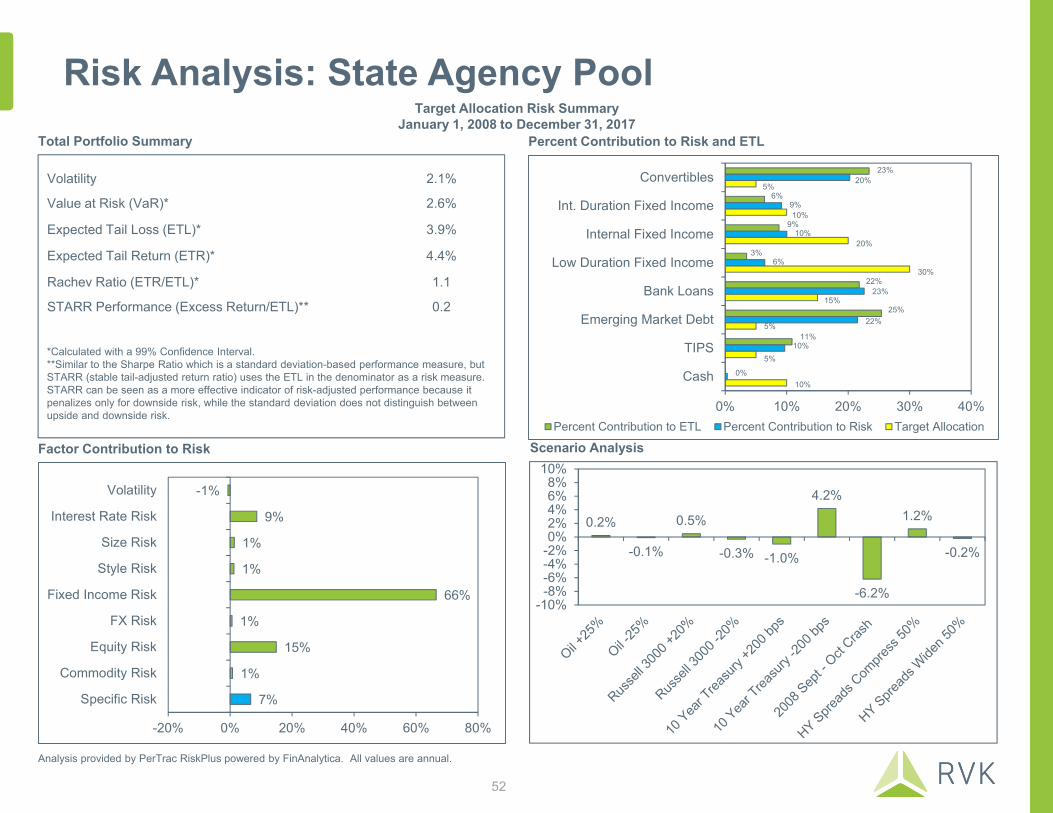
Risk Analysis: State Agency PoolTarget Allocation Risk Summary
January 1, 2008 to December 31, 2017
Analysis provided by PerTrac RiskPlus powered by FinAnalytica. All values are annual.
Factor Contribution to Risk
Percent Contribution to Risk and ETLTotal Portfolio Summary
*Calculated with a 99% Confidence Interval.**Similar to the Sharpe Ratio which is a standard deviation-based performance measure, but STARR (stable tail-adjusted return ratio) uses the ETL in the denominator as a risk measure. STARR can be seen as a more effective indicator of risk-adjusted performance because it penalizes only for downside risk, while the standard deviation does not distinguish between upside and downside risk.
Volatility 2.1%
Value at Risk (VaR)* 2.6%
Expected Tail Loss (ETL)* 3.9%
Expected Tail Return (ETR)* 4.4%
Rachev Ratio (ETR/ETL)* 1.1
STARR Performance (Excess Return/ETL)** 0.2
23%
6%
9%
3%
22%
25%
11%
20%
9%
10%
6%
23%
22%
10%
0%
5%
10%
20%
30%
15%
5%
5%
10%
0% 10% 20% 30% 40%
Convertibles
Int. Duration Fixed Income
Internal Fixed Income
Low Duration Fixed Income
Bank Loans
Emerging Market Debt
TIPS
Cash
Percent Contribution to ETL Percent Contribution to Risk Target Allocation
7%
1%
15%
1%
66%
1%
1%
9%
-1%
-20% 0% 20% 40% 60% 80%
Specific Risk
Commodity Risk
Equity Risk
FX Risk
Fixed Income Risk
Style Risk
Size Risk
Interest Rate Risk
Volatility
Scenario Analysis
52
0.2%
-0.1%
0.5%
-0.3% -1.0%
4.2%
-6.2%
1.2%
-0.2%
-10%-8%-6%-4%-2%0%2%4%6%8%
10%

Asset Allocation: Workers’ Compensation Fund
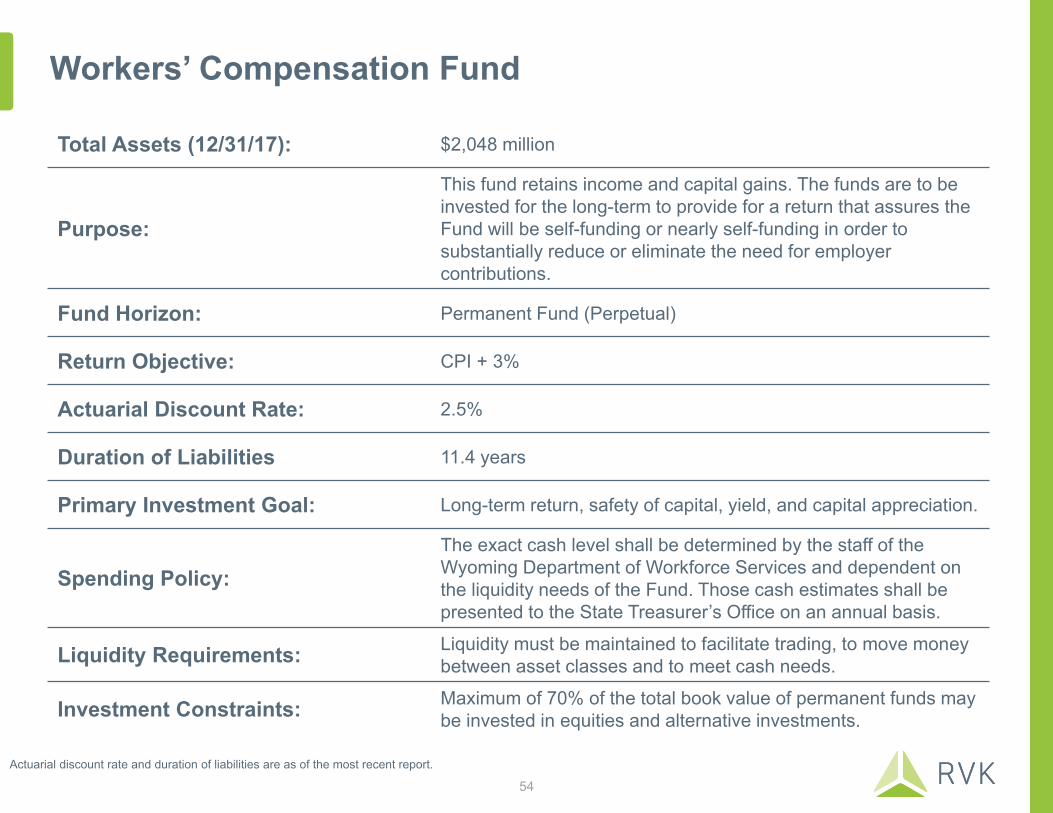
Workers’ Compensation Fund
Total Assets (12/31/17): $2,048 million
Purpose:
This fund retains income and capital gains. The funds are to be invested for the long-term to provide for a return that assures the Fund will be self-funding or nearly self-funding in order to substantially reduce or eliminate the need for employer contributions.
Fund Horizon: Permanent Fund (Perpetual)
Return Objective: CPI + 3%
Actuarial Discount Rate: 2.5%
Duration of Liabilities 11.4 years
Primary Investment Goal: Long-term return, safety of capital, yield, and capital appreciation.
Spending Policy:The exact cash level shall be determined by the staff of the Wyoming Department of Workforce Services and dependent on the liquidity needs of the Fund. Those cash estimates shall be presented to the State Treasurer’s Office on an annual basis.
Liquidity Requirements: Liquidity must be maintained to facilitate trading, to move money between asset classes and to meet cash needs.
Investment Constraints: Maximum of 70% of the total book value of permanent funds may be invested in equities and alternative investments.
54Actuarial discount rate and duration of liabilities are as of the most recent report.
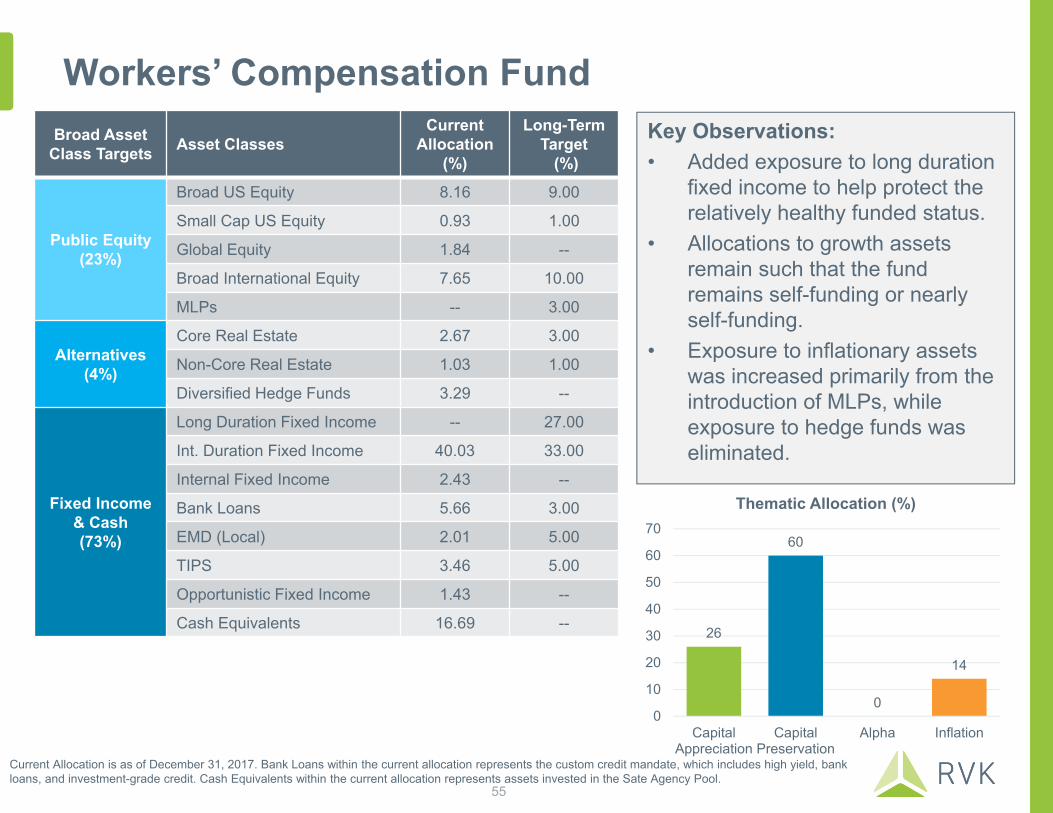
Workers’ Compensation FundKey Observations:• Added exposure to long duration
fixed income to help protect the relatively healthy funded status.
• Allocations to growth assets remain such that the fund remains self-funding or nearly self-funding.
• Exposure to inflationary assets was increased primarily from the introduction of MLPs, while exposure to hedge funds was eliminated.
Broad Asset Class Targets Asset Classes
Current Allocation
(%)
Long-Term Target
(%)
Public Equity(23%)
Broad US Equity 8.16 9.00
Small Cap US Equity 0.93 1.00
Global Equity 1.84 --
Broad International Equity 7.65 10.00
MLPs -- 3.00
Alternatives(4%)
Core Real Estate 2.67 3.00
Non-Core Real Estate 1.03 1.00
Diversified Hedge Funds 3.29 --
Fixed Income & Cash(73%)
Long Duration Fixed Income -- 27.00
Int. Duration Fixed Income 40.03 33.00
Internal Fixed Income 2.43 --
Bank Loans 5.66 3.00
EMD (Local) 2.01 5.00
TIPS 3.46 5.00
Opportunistic Fixed Income 1.43 --
Cash Equivalents 16.69 -- 26
60
0
14
0
10
20
30
40
50
60
70
CapitalAppreciation
CapitalPreservation
Alpha Inflation
Thematic Allocation (%)
Current Allocation is as of December 31, 2017. Bank Loans within the current allocation represents the custom credit mandate, which includes high yield, bank loans, and investment-grade credit. Cash Equivalents within the current allocation represents assets invested in the Sate Agency Pool.
55
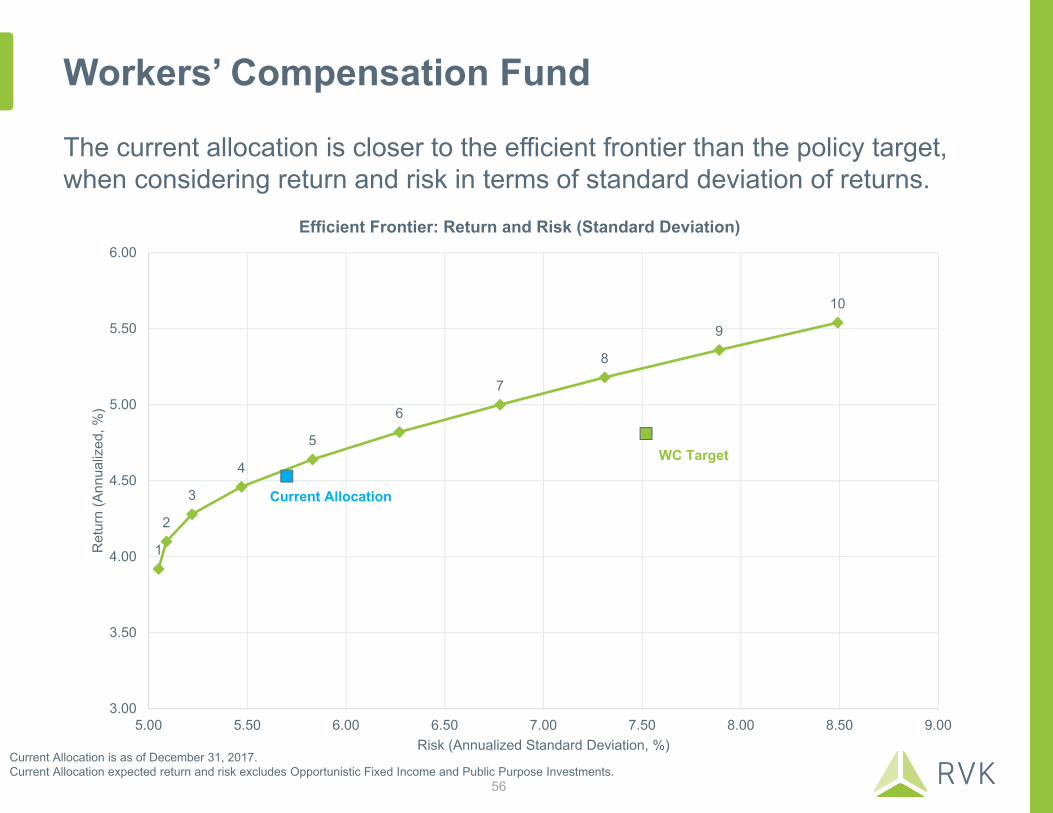
Workers’ Compensation Fund
The current allocation is closer to the efficient frontier than the policy target, when considering return and risk in terms of standard deviation of returns.
Current Allocation is as of December 31, 2017. Current Allocation expected return and risk excludes Opportunistic Fixed Income and Public Purpose Investments.
1
2
3
4
5
6
7
8
9
10
WC Target
Current Allocation
3.00
3.50
4.00
4.50
5.00
5.50
6.00
5.00 5.50 6.00 6.50 7.00 7.50 8.00 8.50 9.00
Ret
urn
(Ann
ualiz
ed, %
)
Risk (Annualized Standard Deviation, %)
Efficient Frontier: Return and Risk (Standard Deviation)
56
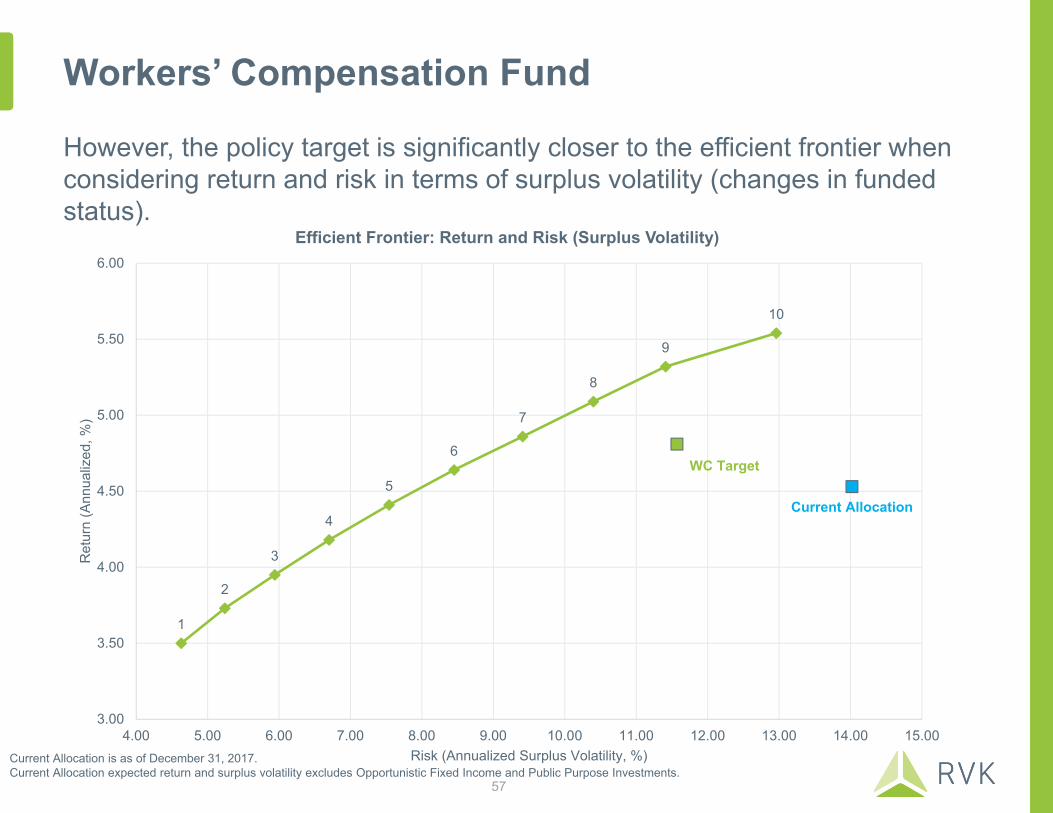
Workers’ Compensation Fund
However, the policy target is significantly closer to the efficient frontier when considering return and risk in terms of surplus volatility (changes in funded status).
Current Allocation is as of December 31, 2017. Current Allocation expected return and surplus volatility excludes Opportunistic Fixed Income and Public Purpose Investments.
1
2
3
4
5
6
7
8
9
10
WC Target
Current Allocation
3.00
3.50
4.00
4.50
5.00
5.50
6.00
4.00 5.00 6.00 7.00 8.00 9.00 10.00 11.00 12.00 13.00 14.00 15.00
Ret
urn
(Ann
ualiz
ed, %
)
Risk (Annualized Surplus Volatility, %)
Efficient Frontier: Return and Risk (Surplus Volatility)
57
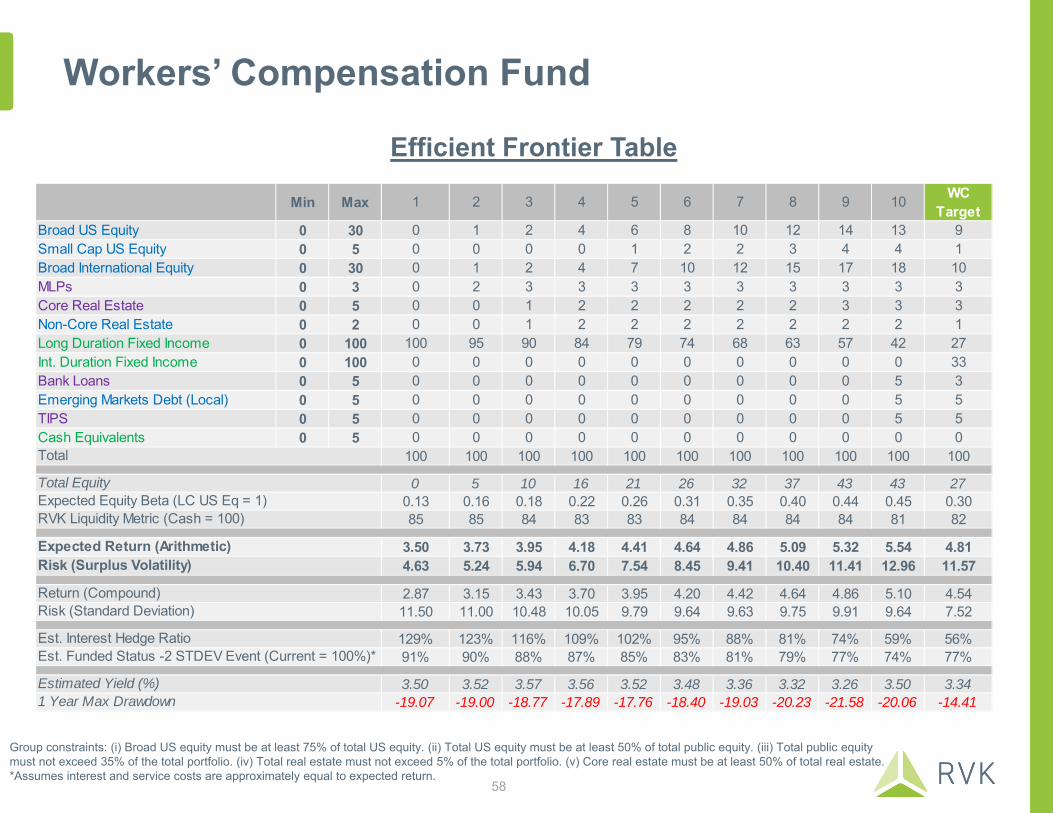
Workers’ Compensation Fund
Efficient Frontier Table
Group constraints: (i) Broad US equity must be at least 75% of total US equity. (ii) Total US equity must be at least 50% of total public equity. (iii) Total public equity must not exceed 35% of the total portfolio. (iv) Total real estate must not exceed 5% of the total portfolio. (v) Core real estate must be at least 50% of total real estate.*Assumes interest and service costs are approximately equal to expected return.
Min Max 1 2 3 4 5 6 7 8 9 10 WC Target
Broad US Equity 0 30 0 1 2 4 6 8 10 12 14 13 9Small Cap US Equity 0 5 0 0 0 0 1 2 2 3 4 4 1Broad International Equity 0 30 0 1 2 4 7 10 12 15 17 18 10MLPs 0 3 0 2 3 3 3 3 3 3 3 3 3Core Real Estate 0 5 0 0 1 2 2 2 2 2 3 3 3Non-Core Real Estate 0 2 0 0 1 2 2 2 2 2 2 2 1Long Duration Fixed Income 0 100 100 95 90 84 79 74 68 63 57 42 27Int. Duration Fixed Income 0 100 0 0 0 0 0 0 0 0 0 0 33Bank Loans 0 5 0 0 0 0 0 0 0 0 0 5 3Emerging Markets Debt (Local) 0 5 0 0 0 0 0 0 0 0 0 5 5TIPS 0 5 0 0 0 0 0 0 0 0 0 5 5Cash Equivalents 0 5 0 0 0 0 0 0 0 0 0 0 0
100 100 100 100 100 100 100 100 100 100 100
0 5 10 16 21 26 32 37 43 43 270.13 0.16 0.18 0.22 0.26 0.31 0.35 0.40 0.44 0.45 0.3085 85 84 83 83 84 84 84 84 81 82
3.50 3.73 3.95 4.18 4.41 4.64 4.86 5.09 5.32 5.54 4.814.63 5.24 5.94 6.70 7.54 8.45 9.41 10.40 11.41 12.96 11.57
2.87 3.15 3.43 3.70 3.95 4.20 4.42 4.64 4.86 5.10 4.5411.50 11.00 10.48 10.05 9.79 9.64 9.63 9.75 9.91 9.64 7.52
129% 123% 116% 109% 102% 95% 88% 81% 74% 59% 56%91% 90% 88% 87% 85% 83% 81% 79% 77% 74% 77%
3.50 3.52 3.57 3.56 3.52 3.48 3.36 3.32 3.26 3.50 3.34-19.07 -19.00 -18.77 -17.89 -17.76 -18.40 -19.03 -20.23 -21.58 -20.06 -14.41
Estimated Yield (%)
Total
Return (Compound)Risk (Standard Deviation)
Est. Interest Hedge RatioEst. Funded Status -2 STDEV Event (Current = 100%)*
Total EquityExpected Equity Beta (LC US Eq = 1)RVK Liquidity Metric (Cash = 100)
Expected Return (Arithmetic)Risk (Surplus Volatility)
1 Year Max Drawdown
58
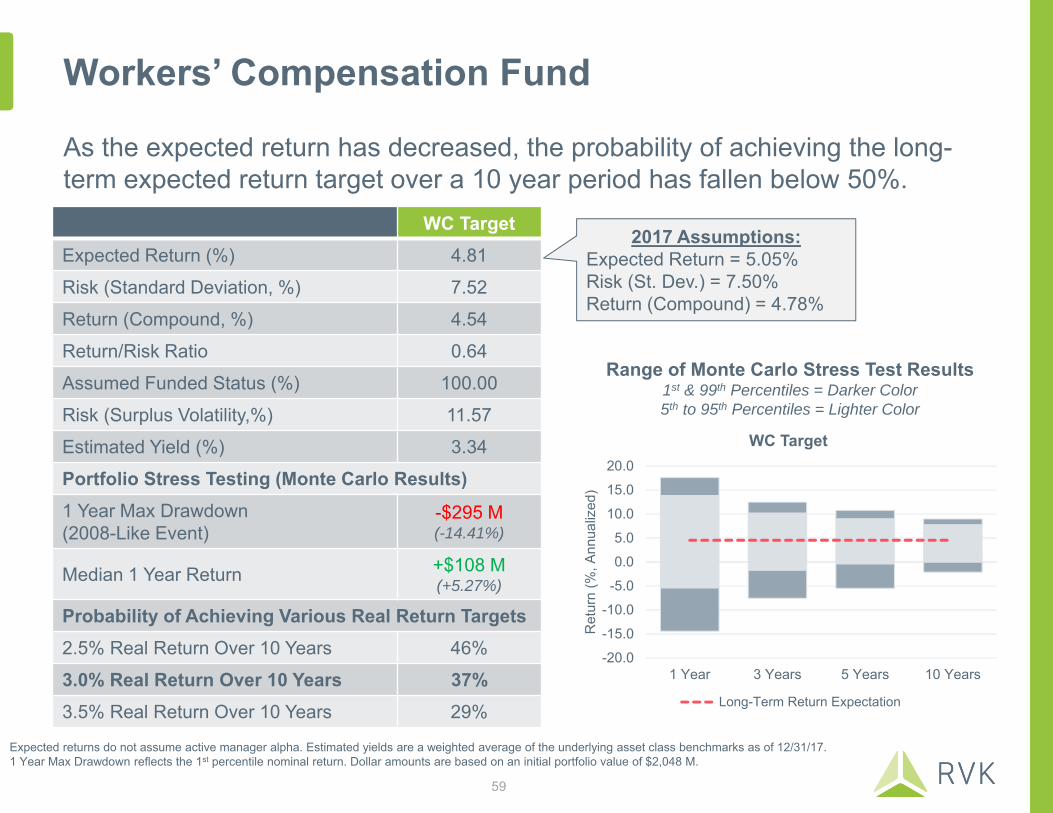
Workers’ Compensation Fund
As the expected return has decreased, the probability of achieving the long-term expected return target over a 10 year period has fallen below 50%.
WC TargetExpected Return (%) 4.81
Risk (Standard Deviation, %) 7.52
Return (Compound, %) 4.54
Return/Risk Ratio 0.64
Assumed Funded Status (%) 100.00
Risk (Surplus Volatility,%) 11.57
Estimated Yield (%) 3.34
Portfolio Stress Testing (Monte Carlo Results)1 Year Max Drawdown(2008-Like Event)
-$295 M(-14.41%)
Median 1 Year Return +$108 M(+5.27%)
Probability of Achieving Various Real Return Targets2.5% Real Return Over 10 Years 46%
3.0% Real Return Over 10 Years 37%3.5% Real Return Over 10 Years 29%
Expected returns do not assume active manager alpha. Estimated yields are a weighted average of the underlying asset class benchmarks as of 12/31/17. 1 Year Max Drawdown reflects the 1st percentile nominal return. Dollar amounts are based on an initial portfolio value of $2,048 M.
-20.0
-15.0
-10.0
-5.0
0.0
5.0
10.0
15.0
20.0
1 Year 3 Years 5 Years 10 Years
Ret
urn
(%, A
nnua
lized
)
WC Target
Long-Term Return Expectation
Range of Monte Carlo Stress Test Results1st & 99th Percentiles = Darker Color5th to 95th Percentiles = Lighter Color
2017 Assumptions:Expected Return = 5.05%Risk (St. Dev.) = 7.50%Return (Compound) = 4.78%
59
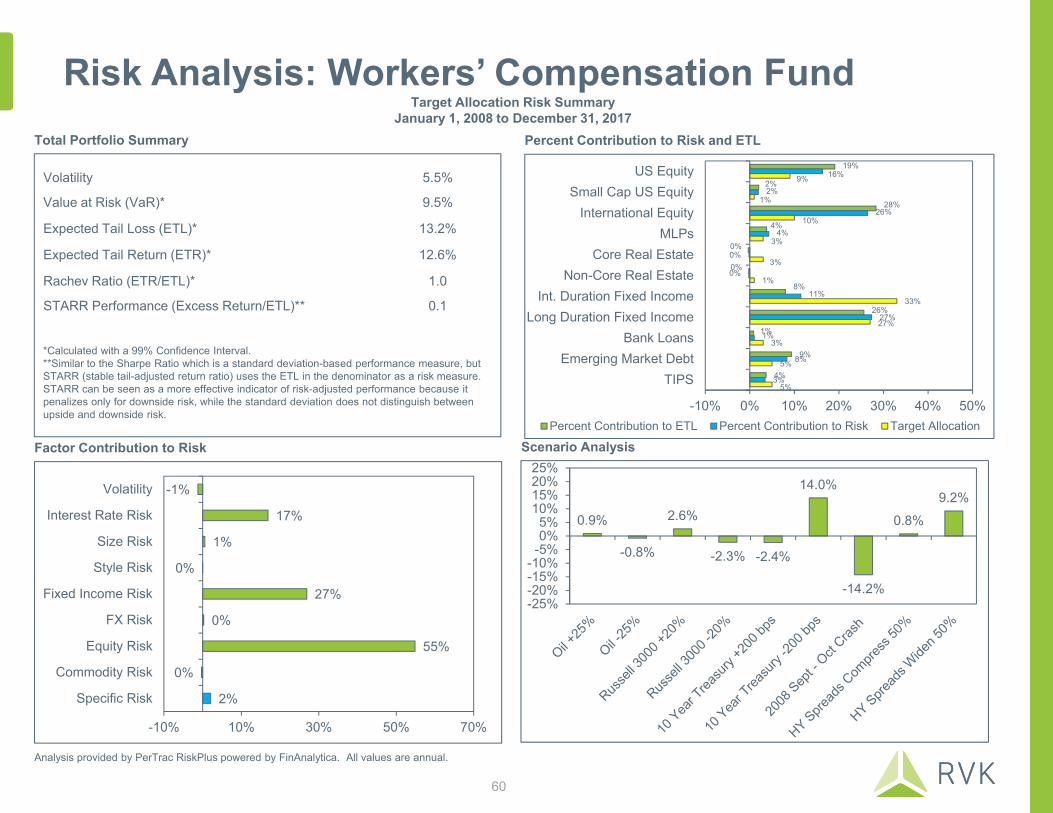
Risk Analysis: Workers’ Compensation FundTarget Allocation Risk Summary
January 1, 2008 to December 31, 2017
Analysis provided by PerTrac RiskPlus powered by FinAnalytica. All values are annual.
Factor Contribution to Risk
Percent Contribution to Risk and ETLTotal Portfolio Summary
*Calculated with a 99% Confidence Interval.**Similar to the Sharpe Ratio which is a standard deviation-based performance measure, but STARR (stable tail-adjusted return ratio) uses the ETL in the denominator as a risk measure. STARR can be seen as a more effective indicator of risk-adjusted performance because it penalizes only for downside risk, while the standard deviation does not distinguish between upside and downside risk.
Volatility 5.5%
Value at Risk (VaR)* 9.5%
Expected Tail Loss (ETL)* 13.2%
Expected Tail Return (ETR)* 12.6%
Rachev Ratio (ETR/ETL)* 1.0
STARR Performance (Excess Return/ETL)** 0.1
Scenario Analysis
60
0.9%
-0.8%
2.6%
-2.3% -2.4%
14.0%
-14.2%
0.8%
9.2%
-25%-20%-15%-10%
-5%0%5%
10%15%20%25%
2%
0%
55%
0%
27%
0%
1%
17%
-1%
-10% 10% 30% 50% 70%
Specific Risk
Commodity Risk
Equity Risk
FX Risk
Fixed Income Risk
Style Risk
Size Risk
Interest Rate Risk
Volatility
19%
2%
28%
4%
0%
0%
8%
26%
1%
9%
4%
16%
2%
26%
4%
0%
0%
11%
27%
1%
8%
3%
9%
1%
10%
3%
3%
1%
33%
27%
3%
5%
5%
-10% 0% 10% 20% 30% 40% 50%
US EquitySmall Cap US Equity
International EquityMLPs
Core Real EstateNon-Core Real Estate
Int. Duration Fixed IncomeLong Duration Fixed Income
Bank LoansEmerging Market Debt
TIPS
Percent Contribution to ETL Percent Contribution to Risk Target Allocation

Asset Allocation: Pool A Investment Account
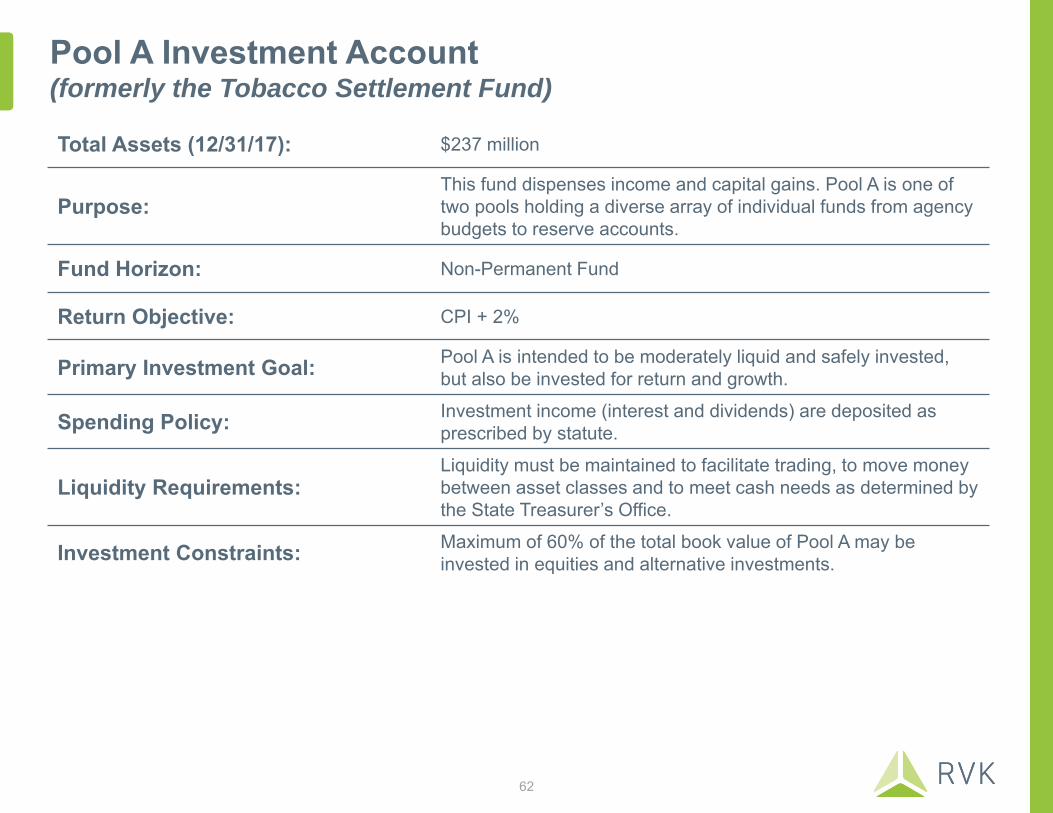
Pool A Investment Account (formerly the Tobacco Settlement Fund)
Total Assets (12/31/17): $237 million
Purpose:This fund dispenses income and capital gains. Pool A is one of two pools holding a diverse array of individual funds from agency budgets to reserve accounts.
Fund Horizon: Non-Permanent Fund
Return Objective: CPI + 2%
Primary Investment Goal: Pool A is intended to be moderately liquid and safely invested, but also be invested for return and growth.
Spending Policy: Investment income (interest and dividends) are deposited as prescribed by statute.
Liquidity Requirements:Liquidity must be maintained to facilitate trading, to move money between asset classes and to meet cash needs as determined by the State Treasurer’s Office.
Investment Constraints: Maximum of 60% of the total book value of Pool A may be invested in equities and alternative investments.
62

Pool A Investment AccountKey Observations:• Introduced exposure to public
equity, preferred stock, and MLPs.
• Exposure to inflationary and capital appreciation assets was increased.
• Exposure to capital preservation was reduced, primarily through a lower intermediate duration fixed income allocation (-25%).
Long-Term Asset Class
TargetsAsset Classes
Current Allocation
(%)
Long-Term Target
(%)
Public Equity(23%)
Broad US Equity -- 7.50
Small Cap US Equity -- 1.00
Broad International Equity -- 7.50
Preferred Stock -- 2.00
MLPs -- 5.00
Fixed Income & Cash(77%)
Convertibles 3.39 --
Int. Duration Fixed Income 42.64 49.00
Internal Fixed Income 21.00 --
Bank Loans 18.19 10.00
EMD (Local) 4.83 5.00
TIPS 6.40 8.00
Opportunistic Fixed Income 2.52 --
Cash Equivalents 1.03 5.00
23
54
0
23
0
10
20
30
40
50
60
CapitalAppreciation
CapitalPreservation
Alpha Inflation
Thematic Allocation (%)
Current Allocation is as of December 31, 2017. Bank Loans within the current allocation represents the custom credit mandate, which includes high yield, bank loans, and investment-grade credit. Cash Equivalents within the current allocation represents assets invested in the Sate Agency Pool.
63
Pool A Investment Account
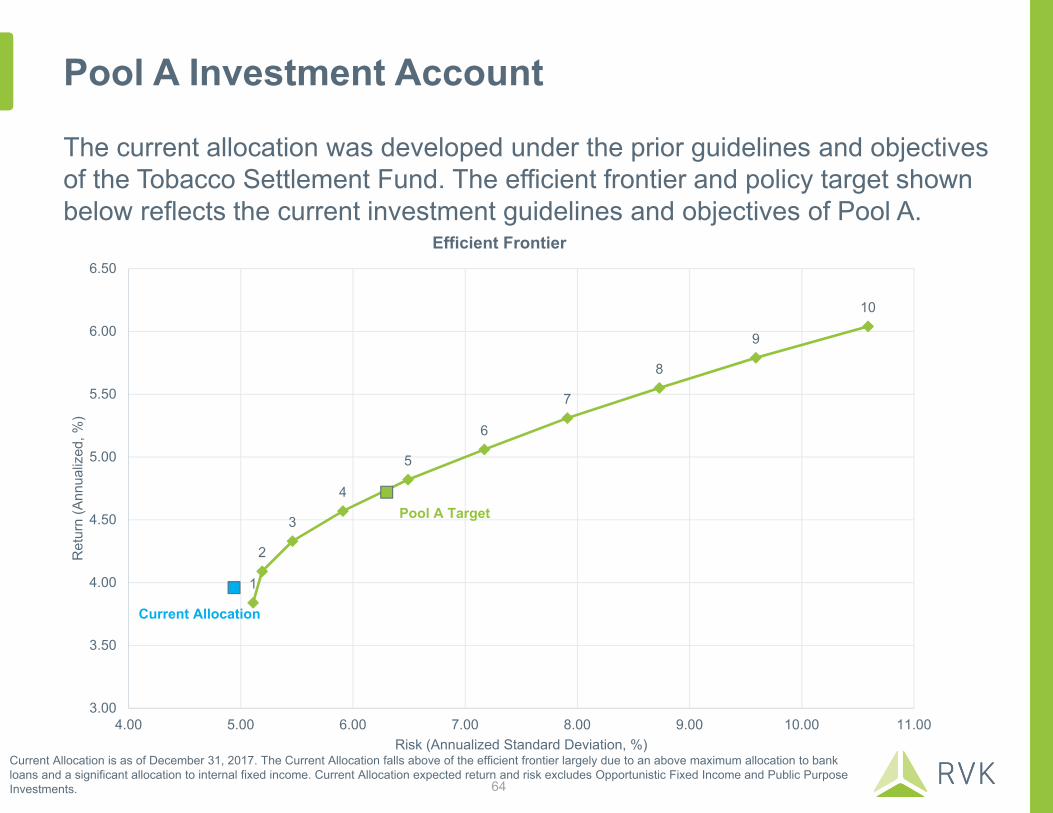
Current Allocation is as of December 31, 2017. The Current Allocation falls above of the efficient frontier largely due to an above maximum allocation to bank loans and a significant allocation to internal fixed income. Current Allocation expected return and risk excludes Opportunistic Fixed Income and Public Purpose Investments.
1
2
3
4
5
6
7
8
9
10
Pool A Target
Current Allocation
3.00
3.50
4.00
4.50
5.00
5.50
6.00
6.50
4.00 5.00 6.00 7.00 8.00 9.00 10.00 11.00
Ret
urn
(Ann
ualiz
ed, %
)
Risk (Annualized Standard Deviation, %)
Efficient Frontier
The current allocation was developed under the prior guidelines and objectives of the Tobacco Settlement Fund. The efficient frontier and policy target shown below reflects the current investment guidelines and objectives of Pool A.
64

Pool A Investment AccountEfficient Frontier Table
Group constraints: (i) Broad US equity must be at least 75% of total US equity. (ii) Total US equity must be at least 50% of total public equity.
Min Max 1 2 3 4 5 6 7 8 9 10 Pool A Target
Broad US Equity 0 20 1 2 4 6 7 9 11 13 14 20 7.5Small Cap US Equity 0 5 0 1 1 2 2 3 4 4 5 5 1Broad International Equity 0 20 1 3 5 8 10 12 15 17 19 20 7.5Preferred Stock 0 5 0 0 0 1 5 5 5 5 5 5 2MLPs 0 5 2 4 5 5 5 5 5 5 5 5 5Int. Duration Fixed Income 0 100 73 67 62 55 48 46 43 36 29 22 49Bank Loans 0 10 10 10 10 10 10 10 10 10 10 10 10Emerging Markets Debt (Local) 0 5 0 0 0 0 0 0 0 2 5 5 5TIPS 0 8 8 8 8 8 8 8 8 8 8 8 8Cash Equivalents 0 5 5 5 5 5 5 2 0 0 0 0 5
100 100 100 100 100 100 100 100 100 100 100
96 90 85 78 71 66 61 56 52 45 773 6 10 17 24 29 34 41 48 55 2378 72 67 60 53 48 43 36 29 22 540 0 0 0 0 0 0 0 0 0 020 22 23 23 23 23 23 23 23 23 23
3.84 4.09 4.33 4.57 4.82 5.06 5.31 5.55 5.79 6.04 4.725.11 5.19 5.46 5.91 6.49 7.17 7.91 8.73 9.59 10.59 6.30
3.71 3.96 4.19 4.40 4.62 4.82 5.01 5.19 5.36 5.52 4.530.75 0.79 0.79 0.77 0.74 0.71 0.67 0.64 0.60 0.57 0.750.10 0.14 0.19 0.24 0.28 0.33 0.38 0.43 0.48 0.54 0.2683 83 84 84 84 84 84 84 83 84 82
3.09 3.17 3.20 3.21 3.34 3.35 3.37 3.40 3.48 3.42 3.41-11.01 -11.27 -12.53 -13.97 -15.65 -17.03 -18.99 -20.46 -21.75 -24.92 -13.63
Estimated Yield (%)
Expected ReturnRisk (Standard Deviation)
Return (Compound)Return/Risk RatioRVK Expected Eq Beta (LCUS Eq = 1)RVK Liquidity Metric (T-Bills = 100)
1 Year Max Drawdown (%)
Inflation
Total
Total Fixed Income & CashCapital AppreciationCapital PreservationAlpha
65

Pool A Investment Account
Similar to the prior year’s assumptions, the probability of achieving the long-term expected return target over a 10 year period remains modestly above 50%.
IncomeFocus Target
Expected Return (%) 4.72
Risk (Standard Deviation, %) 6.30
Return (Compound, %) 4.53
Return/Risk Ratio 0.75
Estimated Yield (%) 3.41
Portfolio Stress Testing (Monte Carlo Results)1 Year Max Drawdown(2008-Like Event)
-$32 M(-13.63%)
Median 1 Year Return +$12 M(+5.16%)
Probability of Achieving Various Real Return Targets1.5% Real Return Over 10 Years 65%
2.0% Real Return Over 10 Years 55%3.0% Real Return Over 10 Years 34%
Expected returns do not assume active manager alpha. Estimated yields are a weighted average of the underlying asset class benchmarks as of 12/31/17. 1 Year Max Drawdown reflects the 1st percentile nominal return. Dollar amounts are based on an initial portfolio value of $237 M.
Range of Monte Carlo Stress Test Results1st & 99th Percentiles = Darker Color5th to 95th Percentiles = Lighter Color
2017 Assumptions:Expected Return = 4.80%Risk (St. Dev.) = 6.31%Return (Compound) = 4.61%
-20.0
-15.0
-10.0
-5.0
0.0
5.0
10.0
15.0
20.0
1 Year 3 Years 5 Years 10 Years
Ret
urn
(%, A
nnua
lized
)
Pool A Target
Long-Term Return Expectation
66

Risk Analysis: Pool A Investment AccountTarget Allocation Risk Summary
January 1, 2008 to December 31, 2017
Analysis provided by PerTrac RiskPlus powered by FinAnalytica. All values are annual.
Factor Contribution to Risk
Percent Contribution to Risk and ETLTotal Portfolio Summary
*Calculated with a 99% Confidence Interval.**Similar to the Sharpe Ratio which is a standard deviation-based performance measure, but STARR (stable tail-adjusted return ratio) uses the ETL in the denominator as a risk measure. STARR can be seen as a more effective indicator of risk-adjusted performance because it penalizes only for downside risk, while the standard deviation does not distinguish between upside and downside risk.
Volatility 4.7%
Value at Risk (VaR)* 8.0%
Expected Tail Loss (ETL)* 10.8%
Expected Tail Return (ETR)* 10.4%
Rachev Ratio (ETR/ETL)* 1.0
STARR Performance (Excess Return/ETL)** 0.1
21%
3%
27%
3%
11%
10%
6%
11%
7%
19%
3%
27%
3%
12%
14%
6%
10%
5%
8%
1%
8%
2%
5%
49%
10%
5%
8%
0% 10% 20% 30% 40% 50% 60%
US Equity
Small Cap US…
International Equity
Preferred Stock
MLPs
Int. Duration…
Bank Loans
Emerging Market…
TIPS
Percent Contribution to ETL Percent Contribution to Risk Target Allocation
3%
0%
68%
1%
26%
1%
1%
2%
-2%
-20% 0% 20% 40% 60% 80% 100%
Specific Risk
Commodity Risk
Equity Risk
FX Risk
Fixed Income Risk
Style Risk
Size Risk
Interest Rate Risk
Volatility
Scenario Analysis
67
1.1%
-1.1%
2.7%
-2.6%
0.0% 3.0%
-14.3%
7.0%
-4.6%
-25%-20%-15%-10%
-5%0%5%
10%15%20%25%

Synopsis of 2017 Approved Asset Allocation Changes
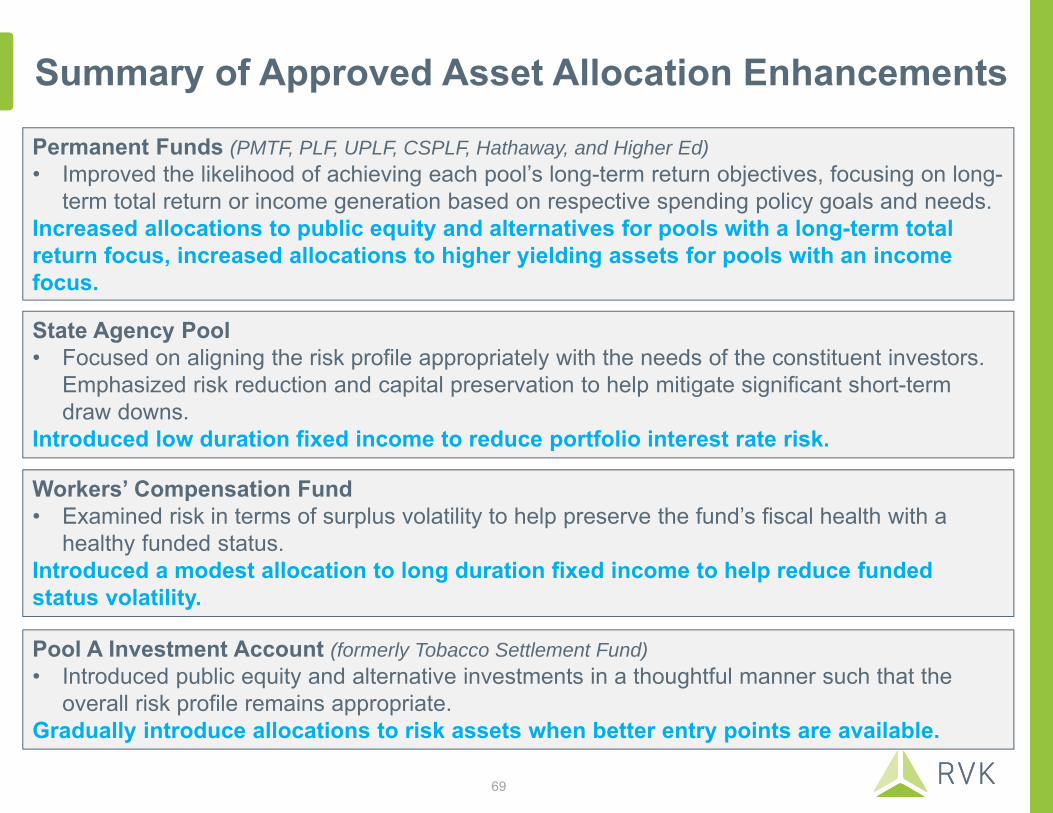
Summary of Approved Asset Allocation Enhancements
Permanent Funds (PMTF, PLF, UPLF, CSPLF, Hathaway, and Higher Ed)• Improved the likelihood of achieving each pool’s long-term return objectives, focusing on long-
term total return or income generation based on respective spending policy goals and needs.Increased allocations to public equity and alternatives for pools with a long-term total return focus, increased allocations to higher yielding assets for pools with an income focus.
State Agency Pool• Focused on aligning the risk profile appropriately with the needs of the constituent investors.
Emphasized risk reduction and capital preservation to help mitigate significant short-term draw downs.
Introduced low duration fixed income to reduce portfolio interest rate risk.
Workers’ Compensation Fund• Examined risk in terms of surplus volatility to help preserve the fund’s fiscal health with a
healthy funded status. Introduced a modest allocation to long duration fixed income to help reduce funded status volatility.
Pool A Investment Account (formerly Tobacco Settlement Fund)• Introduced public equity and alternative investments in a thoughtful manner such that the
overall risk profile remains appropriate.Gradually introduce allocations to risk assets when better entry points are available.
69
Asset Class Implementation: Priorities and Timeline
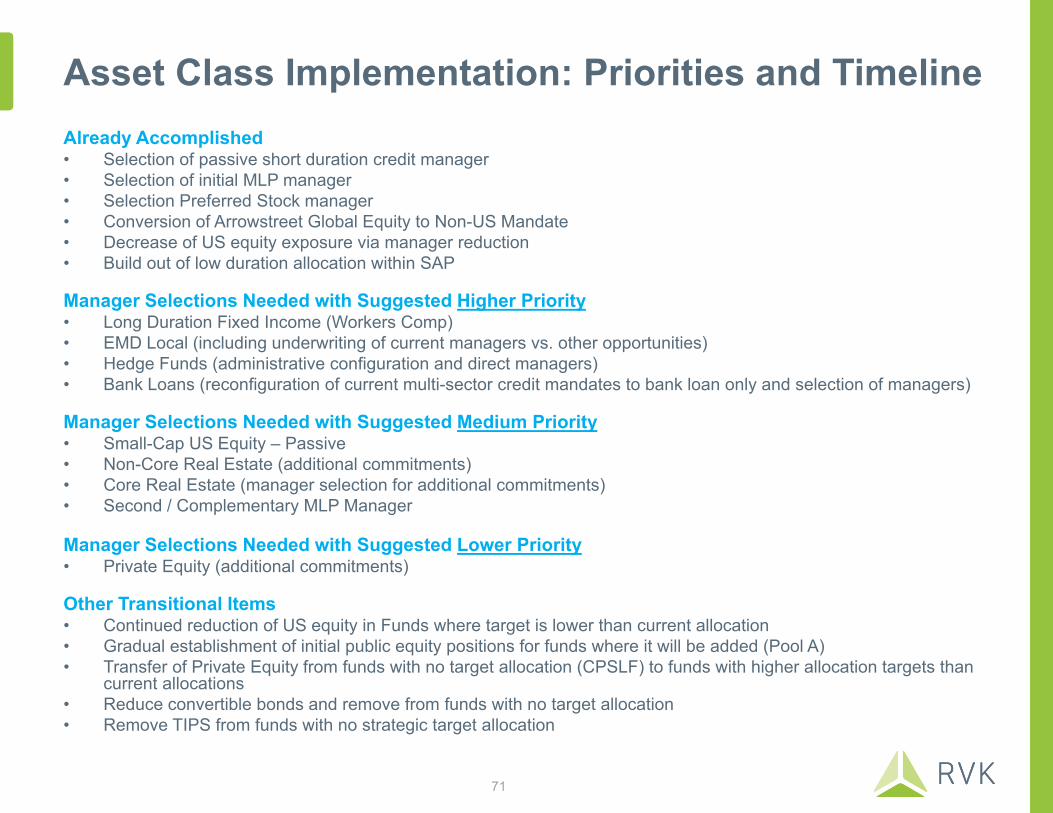
Asset Class Implementation: Priorities and TimelineAlready Accomplished• Selection of passive short duration credit manager• Selection of initial MLP manager• Selection Preferred Stock manager• Conversion of Arrowstreet Global Equity to Non-US Mandate • Decrease of US equity exposure via manager reduction • Build out of low duration allocation within SAP
Manager Selections Needed with Suggested Higher Priority • Long Duration Fixed Income (Workers Comp) • EMD Local (including underwriting of current managers vs. other opportunities) • Hedge Funds (administrative configuration and direct managers) • Bank Loans (reconfiguration of current multi-sector credit mandates to bank loan only and selection of managers)
Manager Selections Needed with Suggested Medium Priority • Small-Cap US Equity – Passive• Non-Core Real Estate (additional commitments)• Core Real Estate (manager selection for additional commitments) • Second / Complementary MLP Manager
Manager Selections Needed with Suggested Lower Priority • Private Equity (additional commitments)
Other Transitional Items • Continued reduction of US equity in Funds where target is lower than current allocation• Gradual establishment of initial public equity positions for funds where it will be added (Pool A)• Transfer of Private Equity from funds with no target allocation (CPSLF) to funds with higher allocation targets than
current allocations • Reduce convertible bonds and remove from funds with no target allocation• Remove TIPS from funds with no strategic target allocation
71

Appendix

Risk Analysis Summary Matrix
Total Portfolio Summary statistics are calculated with a 99% Confidence Interval.**STARR Performance is similar to the Sharpe Ratio which is a standard deviation-based performance measure, but STARR (stable tail-adjusted return ratio) uses the ETL in the denominator as a risk measure. STARR can be seen as a more effective indicator of risk-adjusted performance because it penalizes only for downside risk, while the standard deviation does not distinguish between upside and downside risk.
73
Total Return Focus
IncomeFocus
Total Portfolio SummaryVolatility 6.3% 5.3% 2.1% 5.5% 4.7%Value at Risk (VaR) 12.9% 9.5% 2.6% 9.5% 8.0%Expected Tail Loss (ETL) 17.3% 12.7% 3.9% 13.2% 10.8%Expected Tail Return (ETR) 12.3% 10.8% 4.4% 12.6% 10.4%Rachev Ratio (ETR/ETL) 0.7 0.9 1.1 1.0 1.0STARR Performance (Excess Return/ETL) 0.1 0.1 0.2 0.1 0.1Selected Factor Contributions to RiskVolatility -2% -8% -1% -1% -2%Interest Rate Risk 8% 3% 9% 17% 2%Fixed Income Risk 19% 13% 66% 27% 26%Equity Risk 63% 84% 15% 55% 68%Commodity Risk 1% 0% 1% 0% 0%Specific Risk 9% 7% 7% 2% 3%Scenario AnalysisOil +25% 2% 2% 0% 1% 1%Oil -25% -2% -1% 0% -1% -1%Russell 3000 +20% 5% 4% 0% 3% 3%Russell 3000 -20% -5% -4% 0% -2% -3%10 Year Treasury +200 bps 3% 2% -1% -2% 0%10 Year Treasury -200 bps -6% -3% 4% 14% 3%2008 Sept - Oct Crash -17% -15% -6% -14% -14%HY Spreads Compress 50% 8% 10% 1% 1% 7%HY Spreads Widen 50% -2% -9% 0% 9% -5%
Permanent Funds State Agency Pool
Workers' Compensation
Fund
Pool A Investment
Account

Permanent Mineral Trust Fund Spending PolicyPermanent
Mineral Trust Fund (PMTF)
Corpus
PMTF Investment Earnings
(Interest, Dividends and Realized Capital Gains)
General Fund(2.5%)
Spending Policy Amount (SPA) = 5% of five-year average
value of corpus (commencing FY 2021: 4.75%; commencing FY 2022: 4.50%)
LSRA: Legislative
Stabilization Reserve Account
SIPA: Strategic
Investments and Projects
Account
LSRA & SIPAReceive up to 2.5% of earnings in
excess of the first 2.5% given to the General Fund
(commencing FY 2021: up to 2.25%; commencing FY 2022: up to 2.00% PMTF Reserve
Account receives
earnings in excess of SPA
Excess over 150% of SPA in Reserve Account directed back to PMTF corpus –effective immediately
74

Hathaway Scholarship Fund Spending Policy
Hathaway Scholarship Fund
(Hathaway) Corpus
Hathaway Investment Earnings
(Interest, Dividends and Realized Capital Gains)
Hathaway Scholarship Expenditure
Account pursuant to W.S. 21-16-
1304 through 21-16-1306
If the Reserve Account balance exceeds the greater of $12M or 4.5%
of the five-year average value of corpus, the excess is transferred
back to Hathaway corpus.
Hathaway Reserve Account receives
earning in excess of scholarships
awarded during fiscal year. Insufficient
funds in the income account are to be
taken from the reserve account.
75

Common School Permanent Land Fund Spending PolicyCommon School Permanent Land
Fund (CSPLF) Corpus
CSPLF Investment Earnings
(Interest, Dividends and Realized Capital Gains)
Common School Land
Income Fund
Spending Policy Amount (SPA) = 5% of five-year average
value of corpus (commencing FY 2021: 4.75%; commencing FY 2022: 4.50%)
SFP: School Foundation
ProgramCSPLF
Reserve Account
Excess over 150% of SPA in Reserve Account directed back to CSPLF corpus –
effective immediately
SFP Reserve Account
receives the difference between
investment earnings from
CSLIF and SPA
Federal Mineral Royalties –Automatic appropriation to
the CSPLF Reserve Account or the SFP-RA from Federal Mineral Royalties above of below the $200 million cap equal to the extent to which
earnings exceed the SPA, or in the case of the SFP-RA
exceed 3%
Back flow – to ensure at least
2.5% is going to the SFP76
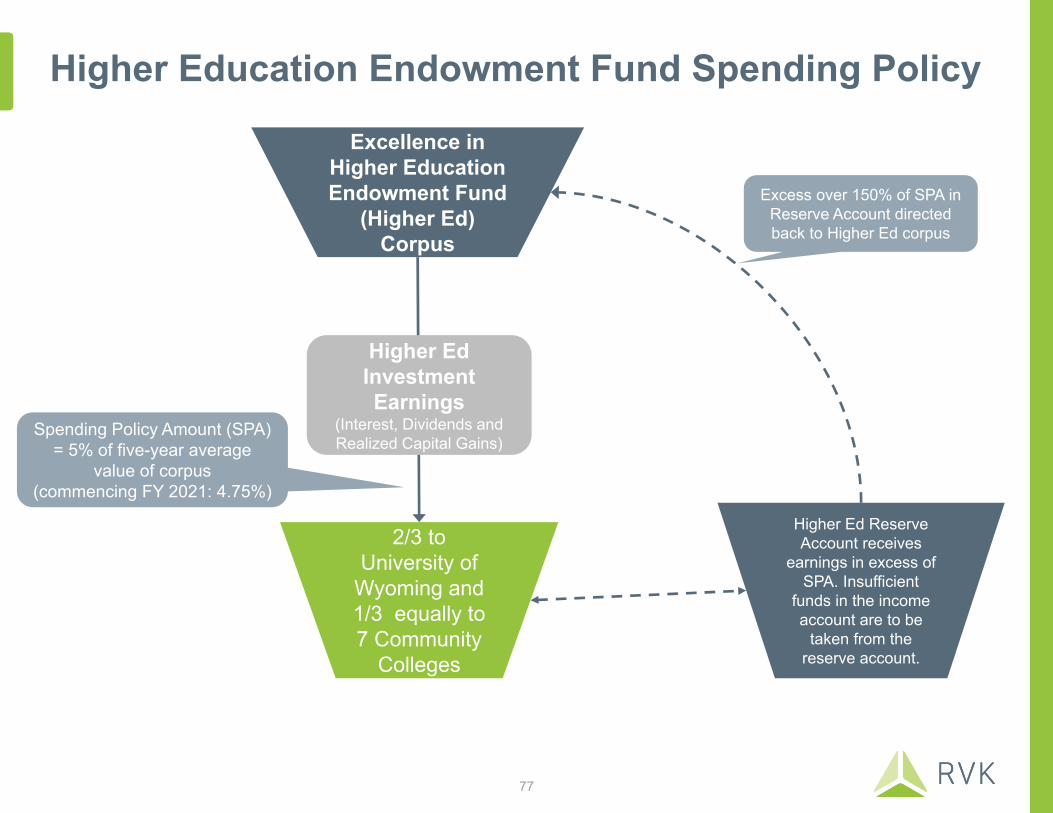
Higher Education Endowment Fund Spending Policy
Excellence in Higher Education Endowment Fund
(Higher Ed) Corpus
Higher Ed Investment Earnings
(Interest, Dividends and Realized Capital Gains)
2/3 to University of
Wyoming and 1/3 equally to 7 Community
Colleges
Spending Policy Amount (SPA) = 5% of five-year average
value of corpus (commencing FY 2021: 4.75%)
Excess over 150% of SPA in Reserve Account directed back to Higher Ed corpus
Higher Ed Reserve Account receives
earnings in excess of SPA. Insufficient
funds in the income account are to be
taken from the reserve account.
77
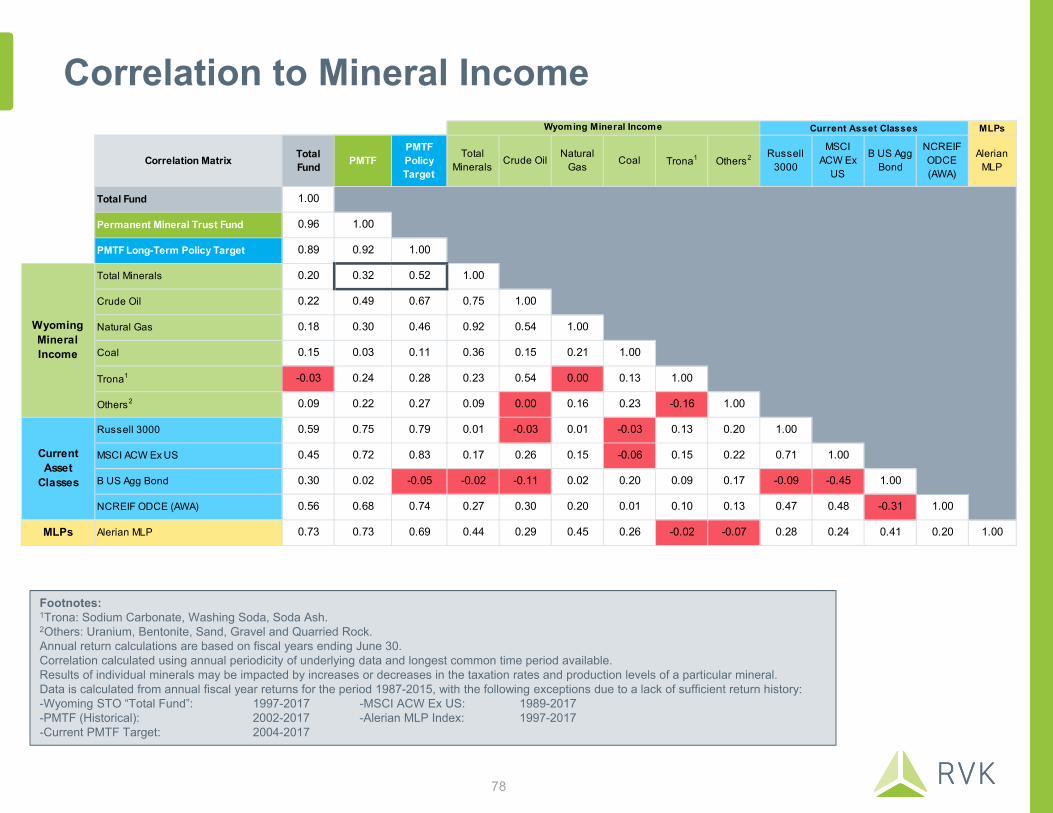
Correlation to Mineral Income
Footnotes:1Trona: Sodium Carbonate, Washing Soda, Soda Ash.2Others: Uranium, Bentonite, Sand, Gravel and Quarried Rock.Annual return calculations are based on fiscal years ending June 30.Correlation calculated using annual periodicity of underlying data and longest common time period available.Results of individual minerals may be impacted by increases or decreases in the taxation rates and production levels of a particular mineral.Data is calculated from annual fiscal year returns for the period 1987-2015, with the following exceptions due to a lack of sufficient return history:-Wyoming STO “Total Fund”: 1997-2017 -MSCI ACW Ex US: 1989-2017-PMTF (Historical): 2002-2017 -Alerian MLP Index: 1997-2017-Current PMTF Target: 2004-2017
78
MLPs
Correlation Matrix Total Fund PMTF
PMTF Policy Target
Total Minerals Crude Oil Natural
Gas Coal Trona1 Others2 Russell 3000
MSCI ACW Ex
US
B US Agg Bond
NCREIF ODCE (AWA)
Alerian MLP
Total Fund 1.00
Permanent Mineral Trust Fund 0.96 1.00
PMTF Long-Term Policy Target 0.89 0.92 1.00
Total Minerals 0.20 0.32 0.52 1.00
Crude Oil 0.22 0.49 0.67 0.75 1.00
Natural Gas 0.18 0.30 0.46 0.92 0.54 1.00
Coal 0.15 0.03 0.11 0.36 0.15 0.21 1.00
Trona1 -0.03 0.24 0.28 0.23 0.54 0.00 0.13 1.00
Others2 0.09 0.22 0.27 0.09 0.00 0.16 0.23 -0.16 1.00
Russell 3000 0.59 0.75 0.79 0.01 -0.03 0.01 -0.03 0.13 0.20 1.00
MSCI ACW Ex US 0.45 0.72 0.83 0.17 0.26 0.15 -0.06 0.15 0.22 0.71 1.00
B US Agg Bond 0.30 0.02 -0.05 -0.02 -0.11 0.02 0.20 0.09 0.17 -0.09 -0.45 1.00
NCREIF ODCE (AWA) 0.56 0.68 0.74 0.27 0.30 0.20 0.01 0.10 0.13 0.47 0.48 -0.31 1.00
MLPs Alerian MLP 0.73 0.73 0.69 0.44 0.29 0.45 0.26 -0.02 -0.07 0.28 0.24 0.41 0.20 1.00
Current Asset
Classes
Current Asset Classes
Wyoming Mineral Income
Wyoming Mineral Income
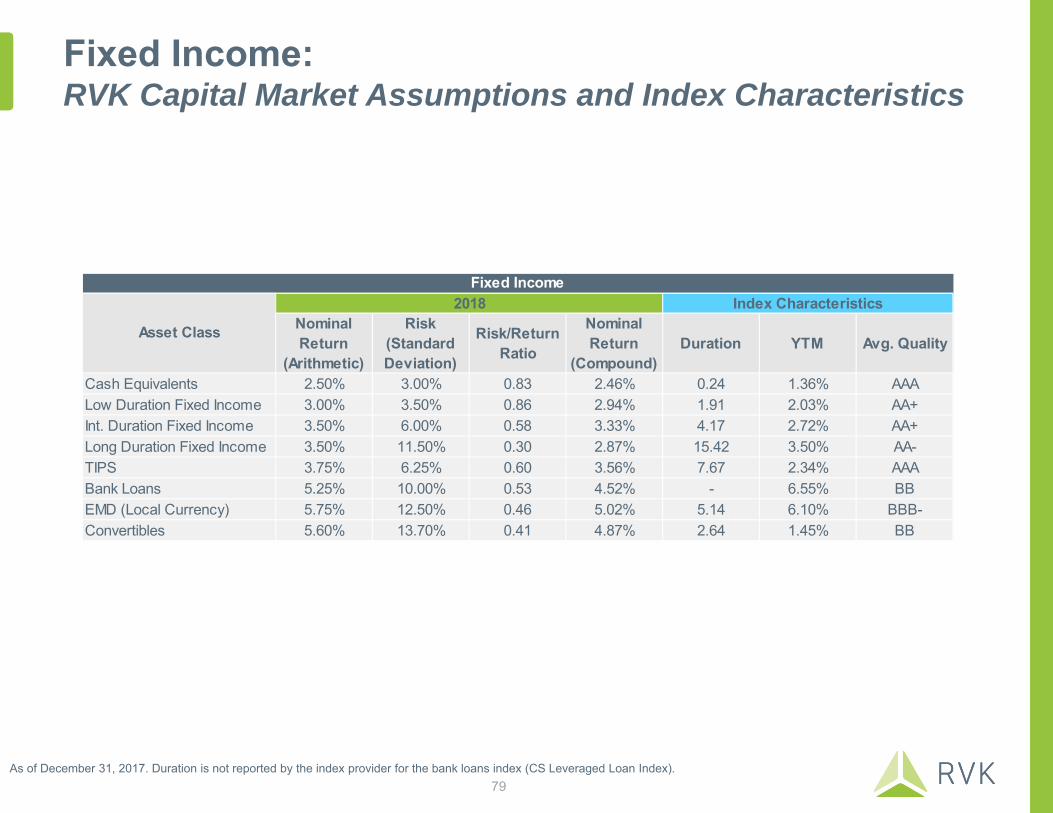
Fixed Income:RVK Capital Market Assumptions and Index Characteristics
As of December 31, 2017. Duration is not reported by the index provider for the bank loans index (CS Leveraged Loan Index).
Nominal Return
(Arithmetic)
Risk (Standard Deviation)
Risk/Return Ratio
Nominal Return
(Compound)Duration YTM Avg. Quality
Cash Equivalents 2.50% 3.00% 0.83 2.46% 0.24 1.36% AAALow Duration Fixed Income 3.00% 3.50% 0.86 2.94% 1.91 2.03% AA+Int. Duration Fixed Income 3.50% 6.00% 0.58 3.33% 4.17 2.72% AA+Long Duration Fixed Income 3.50% 11.50% 0.30 2.87% 15.42 3.50% AA-TIPS 3.75% 6.25% 0.60 3.56% 7.67 2.34% AAABank Loans 5.25% 10.00% 0.53 4.52% - 6.55% BBEMD (Local Currency) 5.75% 12.50% 0.46 5.02% 5.14 6.10% BBB-Convertibles 5.60% 13.70% 0.41 4.87% 2.64 1.45% BB
Fixed Income
Asset Class
2018 Index Characteristics
79
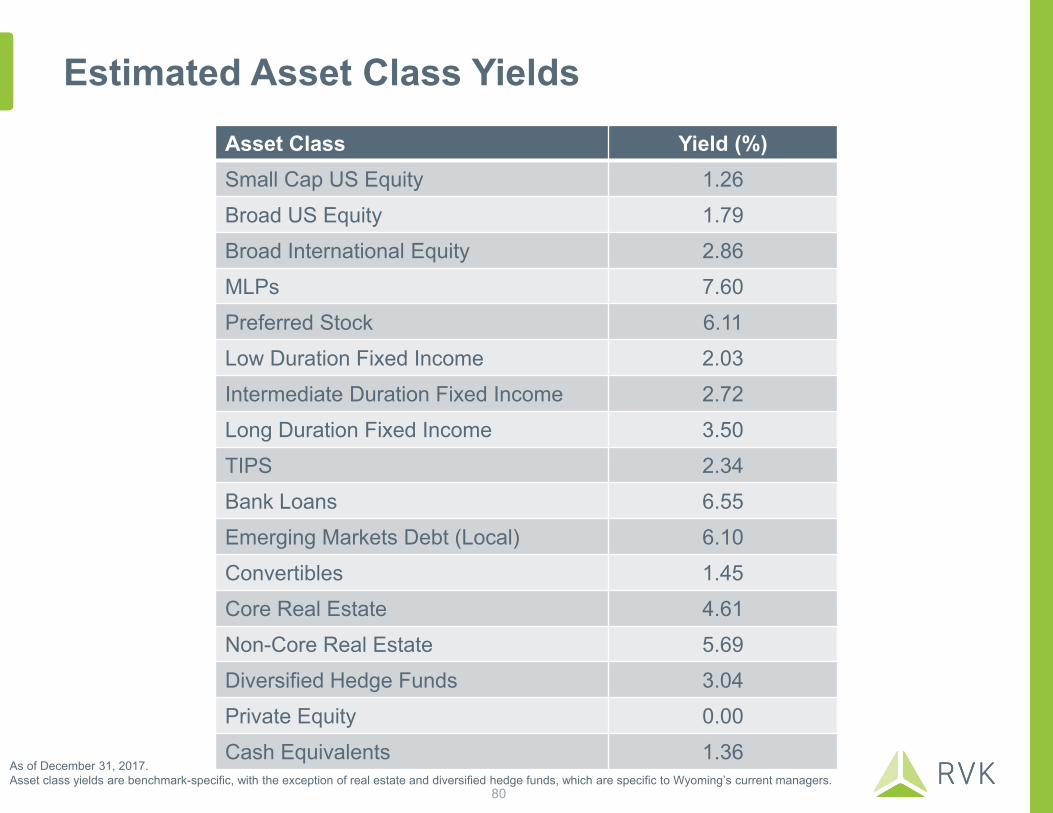
Estimated Asset Class YieldsAsset Class Yield (%)Small Cap US Equity 1.26Broad US Equity 1.79Broad International Equity 2.86MLPs 7.60Preferred Stock 6.11Low Duration Fixed Income 2.03Intermediate Duration Fixed Income 2.72Long Duration Fixed Income 3.50TIPS 2.34Bank Loans 6.55Emerging Markets Debt (Local) 6.10Convertibles 1.45Core Real Estate 4.61Non-Core Real Estate 5.69Diversified Hedge Funds 3.04Private Equity 0.00Cash Equivalents 1.36
80
As of December 31, 2017. Asset class yields are benchmark-specific, with the exception of real estate and diversified hedge funds, which are specific to Wyoming’s current managers.
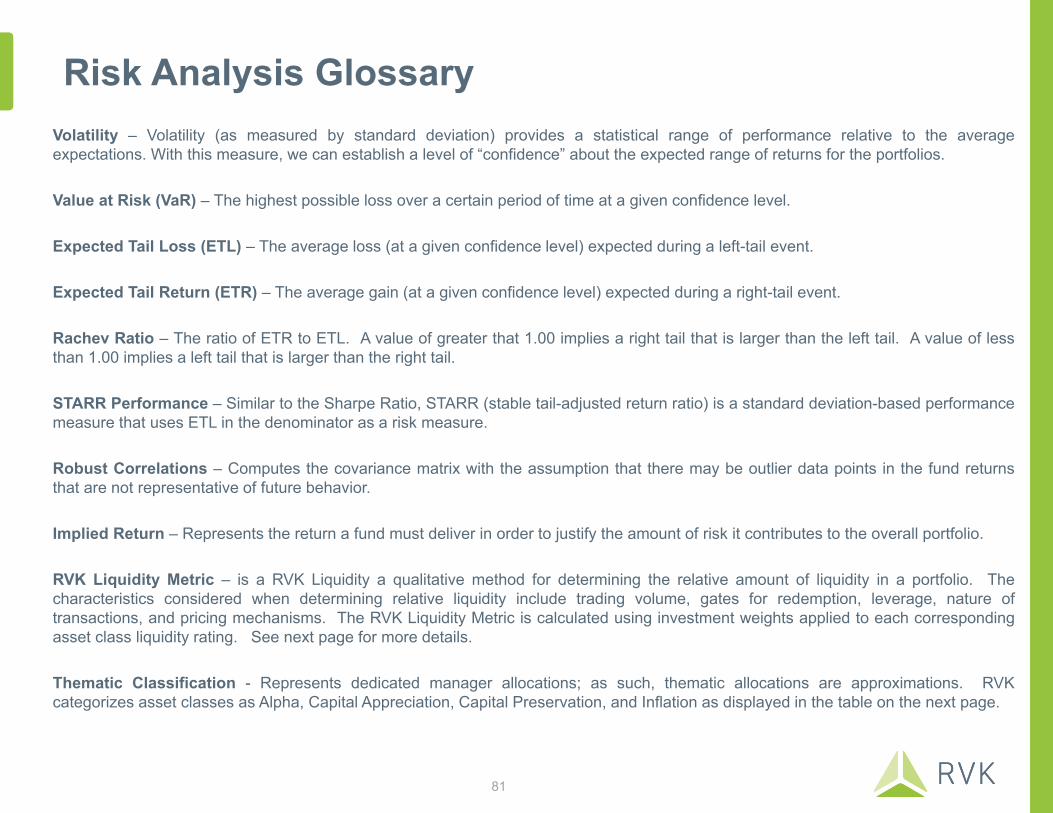
Risk Analysis GlossaryVolatility – Volatility (as measured by standard deviation) provides a statistical range of performance relative to the averageexpectations. With this measure, we can establish a level of “confidence” about the expected range of returns for the portfolios.
Value at Risk (VaR) – The highest possible loss over a certain period of time at a given confidence level.
Expected Tail Loss (ETL) – The average loss (at a given confidence level) expected during a left-tail event.
Expected Tail Return (ETR) – The average gain (at a given confidence level) expected during a right-tail event.
Rachev Ratio – The ratio of ETR to ETL. A value of greater that 1.00 implies a right tail that is larger than the left tail. A value of lessthan 1.00 implies a left tail that is larger than the right tail.
STARR Performance – Similar to the Sharpe Ratio, STARR (stable tail-adjusted return ratio) is a standard deviation-based performancemeasure that uses ETL in the denominator as a risk measure.
Robust Correlations – Computes the covariance matrix with the assumption that there may be outlier data points in the fund returnsthat are not representative of future behavior.
Implied Return – Represents the return a fund must deliver in order to justify the amount of risk it contributes to the overall portfolio.
RVK Liquidity Metric – is a RVK Liquidity a qualitative method for determining the relative amount of liquidity in a portfolio. Thecharacteristics considered when determining relative liquidity include trading volume, gates for redemption, leverage, nature oftransactions, and pricing mechanisms. The RVK Liquidity Metric is calculated using investment weights applied to each correspondingasset class liquidity rating. See next page for more details.
Thematic Classification - Represents dedicated manager allocations; as such, thematic allocations are approximations. RVKcategorizes asset classes as Alpha, Capital Appreciation, Capital Preservation, and Inflation as displayed in the table on the next page.
81

Related Documents