This article was published in an Elsevier journal. The attached copy is furnished to the author for non-commercial research and education use, including for instruction at the author’s institution, sharing with colleagues and providing to institution administration. Other uses, including reproduction and distribution, or selling or licensing copies, or posting to personal, institutional or third party websites are prohibited. In most cases authors are permitted to post their version of the article (e.g. in Word or Tex form) to their personal website or institutional repository. Authors requiring further information regarding Elsevier’s archiving and manuscript policies are encouraged to visit: http://www.elsevier.com/copyright

Welcome message from author
This document is posted to help you gain knowledge. Please leave a comment to let me know what you think about it! Share it to your friends and learn new things together.
Transcript

This article was published in an Elsevier journal. The attached copyis furnished to the author for non-commercial research and
education use, including for instruction at the author’s institution,sharing with colleagues and providing to institution administration.
Other uses, including reproduction and distribution, or selling orlicensing copies, or posting to personal, institutional or third party
websites are prohibited.
In most cases authors are permitted to post their version of thearticle (e.g. in Word or Tex form) to their personal website orinstitutional repository. Authors requiring further information
regarding Elsevier’s archiving and manuscript policies areencouraged to visit:
http://www.elsevier.com/copyright

Author's personal copy
Ecotoxicology and Environmental Safety 69 (2008) 488–495
Assessment of toxicity of the untreated and treated olive millwastewaters and soil irrigated by using microbiotests$
Ali Mekki, Abdelhafidh Dhouib�, Firas Feki, Sami Sayadi
Laboratoire des bioprocedes, Centre de Biotechnologie de Sfax, BP: )K* , 3038 Sfax, Tunisie
Received 19 March 2006; received in revised form 3 April 2007; accepted 9 April 2007
Available online 22 May 2007
Abstract
Hazard assessments based on two measures of toxicity were conducted for the untreated olive mill wastewaters (U), untreated olive
mill wastewaters organic extract (UOE), treated olive mill wastewaters (T), treated olive mill wastewaters organic extract (TOE) and
extracts of soils ferti-irrigated with untreated (SU) and with treated olive mill wastewaters (ST). The measures of toxicity were achieved
by the determination of the bioluminescence inhibition percent (IB%) of Vibrio fischeri and by the growth inhibition (GI) of Bacillus
megaterium, Pseudomonas fluorescens and Escherichia coli. A bioluminescence inhibition of V. fischeri of 100%, 100%, 65%, 47%, 46%
and 30% were obtained with U, UOE, T, TOE, SU and ST respectively. Indeed, even diluted 24 times, a significant bioluminescence
inhibition of 96% was obtained by U. However, only 30% bioluminescence inhibition was obtained by 24 times diluted T. Whereas, 24
times diluted, SU and ST did not show a bioluminescence inhibition (3% and 1%, respectively). The GI of B. megaterium, P. fluorescens
and E. coli were, respectively, 93%, 72% and 100% by U; 100%, 80% and 100% by UOE; 70%, 60% and 89% by T; 63%, 54% and
68% by TOE; 39%, 27% and 43% by SU and 23%, 0% and 34% by ST. The incubation of U or T in the soil during four months
reduced their toxicity by 54% and 35%, respectively. As it was expected, the most resistant bacterium to OMW toxicity is P. fluorescens
then B. megaterium and E. coli. V. fischeri remained the most sensitive strain to the toxicity of this sewage what proves again its
utilisation as standard of measure of the toxicity.
r 2007 Elsevier Inc. All rights reserved.
Keywords: Olive mill wastewaters; Toxicity; Bioluminescence inhibition; Growth inhibition; Soil
1. Introduction
The annual production of olive mill wastewaters (OMW)in Mediterranean region reached 30 million cubic meters(D’Annibale et al., 2004). The polluting properties of the
OMW are essentially owed to their high organic contents(Feria, 2000), and their toxicities especially to theirphenolic molecules of different molecular mass (Capassoet al., 1995; Sayadi and Ellouz, 1995; Sayadi et al., 2000;DellaGreca et al., 2001; Tsioulpas et al., 2002; Fiorentinoet al., 2003). OMW physicochemical composition andcharacteristics are well documented (Capasso et al., 1992;Ben Sassi et al., 2006; Dhouib et al., 2006a). OMW containrelevant amounts of mineral salts and organic nutrients ofpotential interest for the ferti-irrigation. However, theuncontrolled disposal of OMW may cause serious environ-mental pollution with unforeseeable effects on the soil-plant system and even transfers harmful compounds intoother media, such as ground waters and surface waters(Azbar et al., 2004). In many studies, authors warmed thatOMW disposal in the nature causes serious environmentalproblems due to its antibacterial effects and its phytotoxi-city (Sierra et al., 2001; Rana et al., 2003; Cereti et al.,
ARTICLE IN PRESS
www.elsevier.com/locate/ecoenv
0147-6513/$ - see front matter r 2007 Elsevier Inc. All rights reserved.
doi:10.1016/j.ecoenv.2007.04.008
Abbreviations: COD, chemical oxygen demand; BOD5, biochemical
oxygen demand; EC, electrical conductivity; IB%, bioluminescence
inhibition percent of Vibrio fischeri; GI, growth inhibition; OMW, olive
mill wastewaters; OM, organic matter; U, untreated olive mill waste-
waters; UOE, untreated olive mill wastewaters organic extract; SU, extract
of soil ferti-irrigated with untreated olive mill wastewaters; ST, extract of
soil ferti-irrigated with treated olive mill wastewaters; T, treated olive mill
wastewaters; TOC, total organic carbon; TOE, treated olive mill waste-
waters organic extract$This research was supported by the ‘‘Ministry of Higher Education,
Scientific Research and Technology of Tunisia’’ and the E.C program
‘‘Medusa water’’ Contract ICA-CT-1999-00010.�Corresponding author. Fax: +216 74 440 452.
E-mail address: [email protected] (A. Dhouib).
Author's personal copy
2004; Mekki et al., 2006a; Piotrowska et al., 2006). Thispractice represents now a controversy discussion and adebate of actuality between those that are for and thosethat are against this strategy. Therefore, research has notyet reached a consensus about the effects of this by-producton the soil.
Recently, Mekki et al. (2006b), Komilis et al. (2005),Iconomou et al. (2002) and Aliotta et al. (2002) reportedthe phytotoxicity of polyphenols from OMW on seedgermination and plant growth. Yesilada and Sam (1998)reported their toxic effects on the soil bacterium Pseudo-
monas aeruginosa. Fiorentino et al. (2003) reported thetoxic potential of this matrix on the typical organisms ofthe freshwater food chain.
Toxicity evaluation is an important parameter in wastecharacterisation (Wang et al., 2003; Novotny et al., 2006).Many types of bioassays using representatives frommicroorganisms, plants, invertebrates, and fish are avail-able (Aggelis et al., 2003; Tsui and Chu, 2003; Ricco et al.,2004; Zurita et al., 2005; Novotny et al., 2006). In recentyears, use of bioluminescence bacterial tests has becomeparticularly popular because they are rapid, reproducible,simple to use, and unambiguous and they cause no ethicalproblems (Ribo, 1997). Bioluminescence bioassays havebeen frequently employed to measure the toxicity ofwastewaters, sludges, and solid wastes (Perez et al., 2001;Wang et al., 2002; Lapa et al., 2002; Schultz et al., 2002;Farre and Barcelo, 2003; Hernando et al., 2006). However,only a few attempts to use bacterial growth inhibition (GI)bioassays in conjunction with ecotoxicity tests have beenmade (Lambolez et al., 1994; Fernandez-Sempere et al.,1997; Schultz et al., 2002; Isidori et al., 2005).
In previous works, we reported the negative impact ofthe application of OMW on the soil physico-chemical andmicrobiological characteristics (Mekki et al., 2006a,b,2007). In this work we investigated to compare antibacter-ial effects of untreated and treated OMWs, organic extractsof OMWs and soil ferti-irrigated, on the model biotest ofV. fischeri bioluminescence and on GI of some representingsoil and aquatic bacteria as Bacillus megaterium,
P. fluorescens and E. coli. Among main goals of thiswork is to know: (i) how much the treatment methodapplication (untreated and treated OMW) or the incuba-tion in soil can remove its toxicity, (ii) the estimation of thesensitivity limits of B. megaterium, P. fluorescens andE. coli bacterial species for OMW phenolic compounds,and (iii) the evaluation of the potential of microbiotest forthe estimation of the toxicity and the importance of theadditional information for risk assessment.
2. Materials and methods
2.1. Materials
2.1.1. OMW origin
The fresh OMW was taken from a continuous extraction system
factory located in Sfax, Tunisia. The treated OMW, was obtained with an
integrated process based on electro-coagulation pre-treatment followed by
a decantation step then anaerobic digestion (Khoufi et al., 2006). The
characteristics of the treated and untreated OMW are given in Table 1.
2.1.2. Soil samples
Soil samples were collected 4 months after the OMW spreading, from
two different plots ferti-irrigated with 100m3 ha�1 y�1 and 400m3 ha�1 y�1
of untreated and treated OMW, respectively. Samples were taken from
different parts of each plot from 0–10 cm deep, using a soil auger. All soil
samples, taken from each plot were then mixed, air-dried, sieved with a
mesh size of 450mm and stored at 4 1C prior to use.
2.1.3. Bacteria
P. fluorescens DSM 50090, B. megaterium DSM 90 and E. coli DSM
498 were purchased from German collection of microorganisms and cell
cultures DSMZ, Germany.
2.2. Methods
2.2.1. Physicochemical analysis
OMW pH and electrical conductivity (EC) were determined according
to Sierra et al. (2001) standard method.
Organic matter (OM) was determined by combustion of the samples in
a furnace at 550 1C for 4 h.
Total organic carbon was determined by dry combustion (TOC
Analyser multi-N/C-1000). Chemical oxygen demand (COD) was
determined according to Knechtel (1978) standard method.
Biochemical oxygen demand (BOD5) was determined by the mano-
metric method with a respirometer (WTW BSB-Controller Model 620T,
Weilheim, Germany).
Phosphorus, iron, magnesium, potassium, calcium, sodium and
chloride were determined by atomic absorption.
ARTICLE IN PRESS
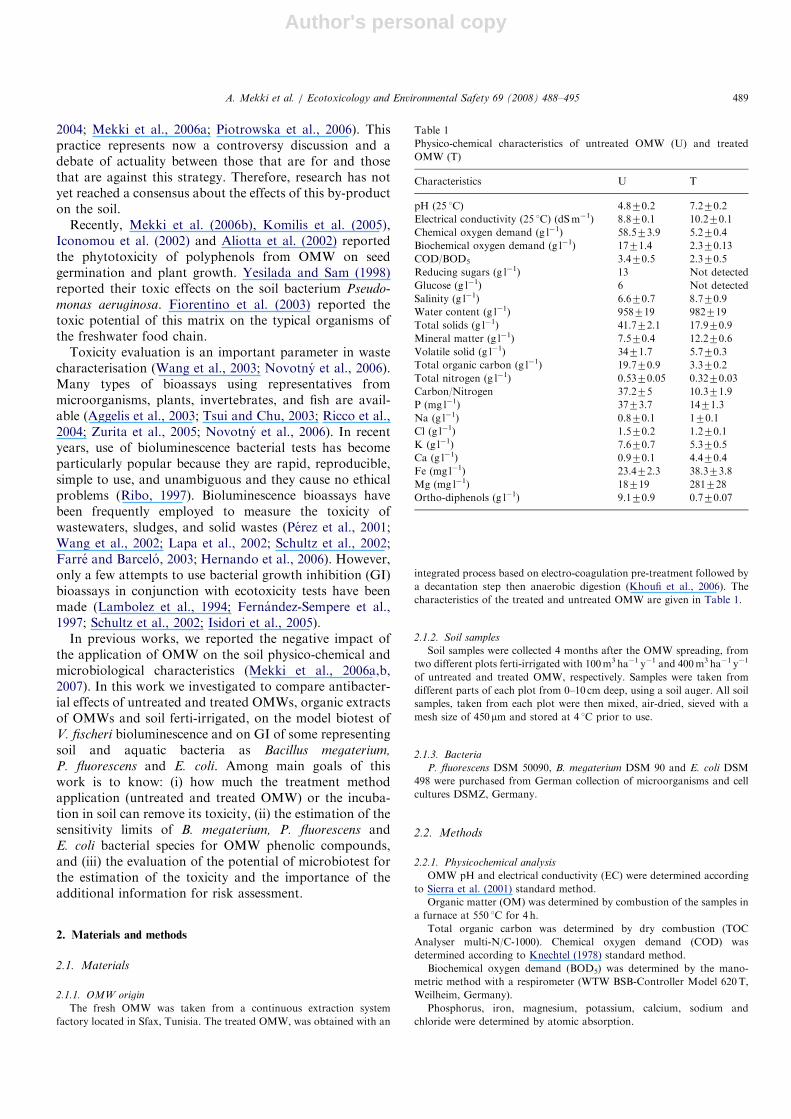
Table 1
Physico-chemical characteristics of untreated OMW (U) and treated
OMW (T)
Characteristics U T
pH (25 1C) 4.870.2 7.270.2
Electrical conductivity (25 1C) (dSm�1) 8.870.1 10.270.1
Chemical oxygen demand (g l�1) 58.573.9 5.270.4
Biochemical oxygen demand (g l�1) 1771.4 2.370.13
COD/BOD5 3.470.5 2.370.5
Reducing sugars (g l�1) 13 Not detected
Glucose (g l�1) 6 Not detected
Salinity (g l�1) 6.670.7 8.770.9
Water content (g l�1) 958719 982719
Total solids (g l�1) 41.772.1 17.970.9
Mineral matter (g l�1) 7.570.4 12.270.6
Volatile solid (g l�1) 3471.7 5.770.3
Total organic carbon (g l�1) 19.770.9 3.370.2
Total nitrogen (g l�1) 0.5370.05 0.3270.03
Carbon/Nitrogen 37.275 10.371.9
P (mg l�1) 3773.7 1471.3
Na (g l�1) 0.870.1 170.1
Cl (g l�1) 1.570.2 1.270.1
K (g l�1) 7.670.7 5.370.5
Ca (g l�1) 0.970.1 4.470.4
Fe (mg l�1) 23.472.3 38.373.8
Mg (mg l�1) 18719 281728
Ortho-diphenols (g l�1) 9.170.9 0.770.07
A. Mekki et al. / Ecotoxicology and Environmental Safety 69 (2008) 488–495 489
Author's personal copy
Ortho-diphenols were quantified by means of Folin–Ciocalteu colori-
metric method (Box, 1983) using caffeic acid as standard. The absorbance
was determined at l ¼ 765 nm.
2.2.2. Organic extracts of untreated (UOE) and treated OMW (TOE)
Untreated and treated OMW were extracted 3 times with ethyl acetate
ð12: v=vÞ. The collected organic fractions were dried and evaporated under
vacuum. The residues were extracted twice with dichloromethane in order
to remove the non-phenolic fraction (lipids, aliphatic and sugars). The
liquid phase was discarded while the washed residues (UOE and TOE)
were recuperated in the same volume of water and were analysed by size
exclusion-HPLC technique (Allouche et al., 2004).
2.2.3. Soil extract preparation
For soil phenolic compounds, only water soluble substances were
determined. A 1/2.5 (w/v) soil/aqueous mixture was shaken for 12 h in a
mechanical shaker (Hund and Traunspurger, 1994). The supernatant was
extracted 3 times with ethyl acetate. The collected organic fractions (SU
and ST) were recuperated in the same volume of water and were analysed
by size exclusion-HPLC technique (Allouche et al., 2004).
2.2.4. Toxicity testing
2.2.4.1. Acute toxicity LUMIstox bioassay. A LUMIStox 300 lumin-
ometer, a LUMISterm incubator, and the non-pathogenic bacteria
V. fischeri LCK 480 (liquid dried), all obtained from Dr. Lange GmbH,
Dusseldorf, Germany, were used for toxicity measurements. The test
consisted in the inhibition of the bioluminescence of V. fischeri according
to ISO 11348-2, (1998). Since the luminescent bacterium requires marine
conditions. Solid sodium chloride crystals were added to the OMW and
soil extract samples to obtain a final concentration of 2% w/v. The pH was
adjusted to 7.070.2. Dilutions of OMW and soil extracts were carried out
with 2% sodium chloride solution according to Dr. Lange LUMIStox
operating manual. Percentage inhibition of the bioluminescence was
achieved by mixing 0.5ml of OMW or soil extract and 0.5ml luminescent
bacterial suspension. After a 15min exposure at 15 1C, the decrease in light
emission was measured. The toxicity of the OMW and soil extract was
expressed as the percent of the inhibition of bioluminescence (%IB)
relative to a non-contaminated reference. Blank (Milli-Q water containing
2% NaCl) and positive control (K2Cr2O7 4.0mg l�1 and NaCl 7.5%)
solutions were used with each batch of bacteria to verify bacteria and
reagent quality.
2.2.4.2. GI test. P. fluorescens, B. megaterium and E. coli were cultivated
on nutrient broth (NB) as control. P. fluorescens and B. megaterium were
incubated at 30 1C and E. coli at 37 1C. Each one of U, T, UOE, TOE, SU
and ST was mixed in 10%, 20%, 40% and 50% proportions with NB and
inoculated with each bacterial strain. The bacterial growth was assessed by
mixed liquor volatile suspended solids (MLVSS) determination and by
cell-numeration every 2 h during 10 h culture. The GI was determined as
described by Capasso et al. (1995):
GIð%Þ ¼ 100� ð100�Ns=NcÞ
where, GI (%) is the percentage of GI, Ns the CFUml�1 or MLVSS
(gml�1) in the sample, Nc the CFUml�1 or MLVSS (gml�1) in the
control.
3. Results
3.1. Treated and untreated OMW characterisation
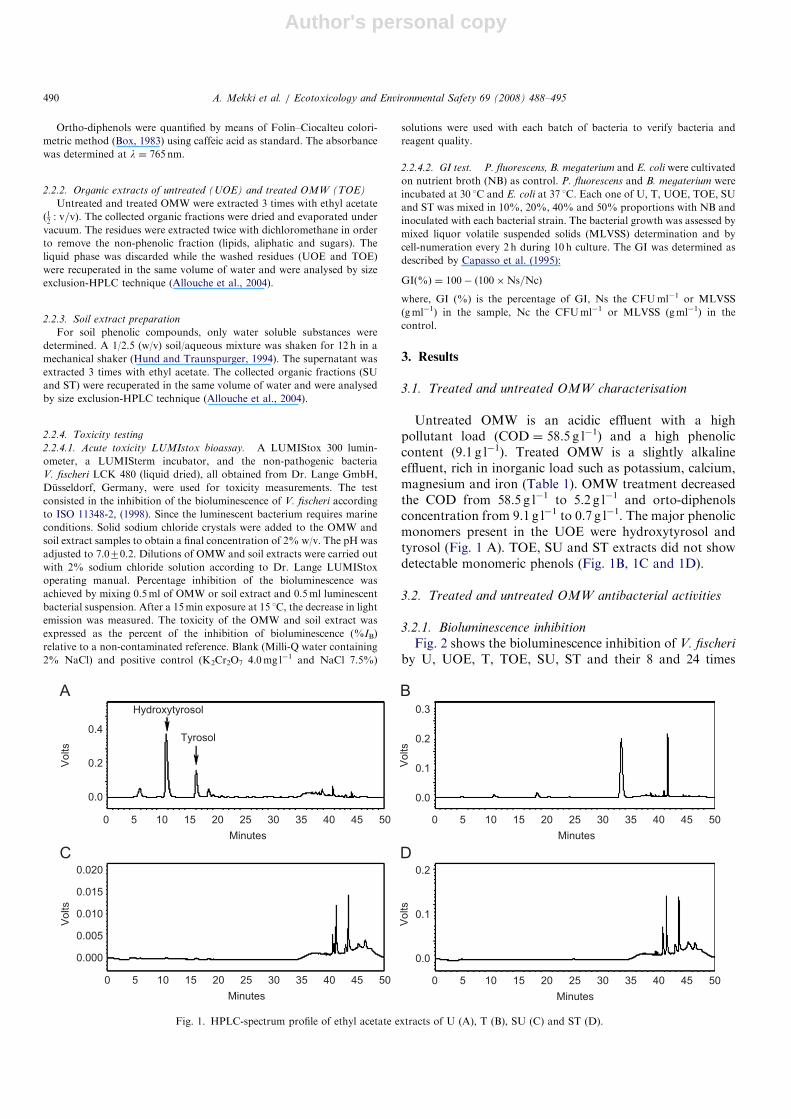
Untreated OMW is an acidic effluent with a highpollutant load (COD ¼ 58.5 g l�1) and a high phenoliccontent (9.1 g l�1). Treated OMW is a slightly alkalineeffluent, rich in inorganic load such as potassium, calcium,magnesium and iron (Table 1). OMW treatment decreasedthe COD from 58.5 g l�1 to 5.2 g l�1 and orto-diphenolsconcentration from 9.1 g l�1 to 0.7 g l�1. The major phenolicmonomers present in the UOE were hydroxytyrosol andtyrosol (Fig. 1 A). TOE, SU and ST extracts did not showdetectable monomeric phenols (Fig. 1B, 1C and 1D).
3.2. Treated and untreated OMW antibacterial activities
3.2.1. Bioluminescence inhibition
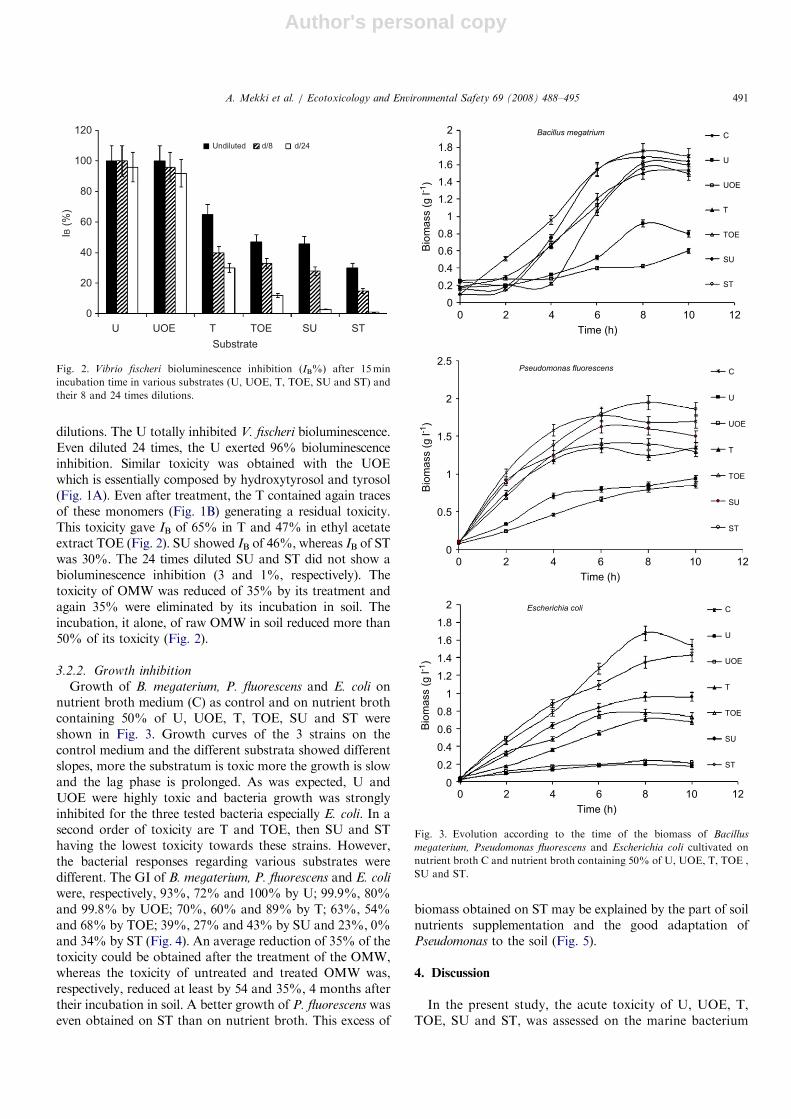
Fig. 2 shows the bioluminescence inhibition of V. fischeri
by U, UOE, T, TOE, SU, ST and their 8 and 24 times
ARTICLE IN PRESS
0.4
0.020
0.015
0.010
0.005
0.000
0.2
0.0
0 5 10
Hydroxytyrosol
Tyrosol
15 20
Minutes
25 30 35 40 45 50
0 5 10 15 20
Minutes
25 30 35 40 45 50
0 5 10 15 20
Minutes
25 30 35 40 45 50
0 5 10 15 20
Minutes
25 30 35 40 45 50
Volts
Volts
Volts
Volts
0.3
0.2
0.1
0.0
0.2
0.1
0.0
Fig. 1. HPLC-spectrum profile of ethyl acetate extracts of U (A), T (B), SU (C) and ST (D).
A. Mekki et al. / Ecotoxicology and Environmental Safety 69 (2008) 488–495490
Author's personal copy
dilutions. The U totally inhibited V. fischeri bioluminescence.Even diluted 24 times, the U exerted 96% bioluminescenceinhibition. Similar toxicity was obtained with the UOEwhich is essentially composed by hydroxytyrosol and tyrosol(Fig. 1A). Even after treatment, the T contained again tracesof these monomers (Fig. 1B) generating a residual toxicity.This toxicity gave IB of 65% in T and 47% in ethyl acetateextract TOE (Fig. 2). SU showed IB of 46%, whereas IB of STwas 30%. The 24 times diluted SU and ST did not show abioluminescence inhibition (3 and 1%, respectively). Thetoxicity of OMW was reduced of 35% by its treatment andagain 35% were eliminated by its incubation in soil. Theincubation, it alone, of raw OMW in soil reduced more than50% of its toxicity (Fig. 2).
3.2.2. Growth inhibition
Growth of B. megaterium, P. fluorescens and E. coli onnutrient broth medium (C) as control and on nutrient brothcontaining 50% of U, UOE, T, TOE, SU and ST wereshown in Fig. 3. Growth curves of the 3 strains on thecontrol medium and the different substrata showed differentslopes, more the substratum is toxic more the growth is slowand the lag phase is prolonged. As was expected, U andUOE were highly toxic and bacteria growth was stronglyinhibited for the three tested bacteria especially E. coli. In asecond order of toxicity are T and TOE, then SU and SThaving the lowest toxicity towards these strains. However,the bacterial responses regarding various substrates weredifferent. The GI of B. megaterium, P. fluorescens and E. coli
were, respectively, 93%, 72% and 100% by U; 99.9%, 80%and 99.8% by UOE; 70%, 60% and 89% by T; 63%, 54%and 68% by TOE; 39%, 27% and 43% by SU and 23%, 0%and 34% by ST (Fig. 4). An average reduction of 35% of thetoxicity could be obtained after the treatment of the OMW,whereas the toxicity of untreated and treated OMW was,respectively, reduced at least by 54 and 35%, 4 months aftertheir incubation in soil. A better growth of P. fluorescens waseven obtained on ST than on nutrient broth. This excess of
biomass obtained on ST may be explained by the part of soilnutrients supplementation and the good adaptation ofPseudomonas to the soil (Fig. 5).
4. Discussion
In the present study, the acute toxicity of U, UOE, T,TOE, SU and ST, was assessed on the marine bacterium
ARTICLE IN PRESS
U
0
20
40
60
80
100
120
Undiluted d/8 d/24
IB (
%)
UOE T TOE SU ST
Substrate
Fig. 2. Vibrio fischeri bioluminescence inhibition (IB%) after 15min
incubation time in various substrates (U, UOE, T, TOE, SU and ST) and
their 8 and 24 times dilutions.
2
1.8
Bacillus megatrium
Pseudomonas fluorescens
1.6
1.4
1.2
1
0.8
Bio
mass (
g l
-1)
0.6
0.4
0.2
0
Bio
mass (
g l
-1)
2.5
2
1.5
1
0.5
0
0 2 4 6 8
Time (h)
10 12
0 2 4 6 8
Time (h)
10 12
ST
SU
TOE
T
UOE
U
C
ST
SU
TOE
T
UOE
U
C
Escherichia coli2
1.8
1.6
1.4
1.2
1
0.8
Bio
mass (
g l
-1)
0.6
0.4
0.2
00 2 4 6 8
Time (h)
10 12
ST
SU
TOE
T
UOE
U
C
Fig. 3. Evolution according to the time of the biomass of Bacillus
megaterium, Pseudomonas fluorescens and Escherichia coli cultivated on
nutrient broth C and nutrient broth containing 50% of U, UOE, T, TOE ,
SU and ST.
A. Mekki et al. / Ecotoxicology and Environmental Safety 69 (2008) 488–495 491

Author's personal copy
V. fischeri and on representing soil and aquatic bacteria asB. megaterium, P. fluorescens and E. coli. Toxicity assaysbased on bioluminescence in V. fischeri can provide a rapidassessment of chemical toxicity (Ribo, 1997). They arewidely used for routine screening of waste effluents or aspart of more elaborate environmental assessments thatinvolve several forms of bioassay and employ a range ofdifferent organisms (Kaiser and Esterby, 1991; Astleyet al., 1999; Jennings et al., 2001). But there are only a few
studies that have compared toxicity data obtained using GIof soil or water representative bacteria and the behaviourof these bacteria towards these toxic substrates.Untreated OMW totally inhibited the bioluminescence
of V. fischeri. This toxicity was essentially due to itshigh content of phenolic compounds and more preciselyto phenolic monomers as hydroxytyrosol and tyrosol(Fig. 1A). Indeed, similar toxicity was obtained with theUOE which is essentially composed by hydroxytyrosol andtyrosol (Fig. 2). These findings are in line with previousfindings of Dhouib et al. (2006b) who put in evidence thetoxicity exercised by the main phenolic monomers of theOMW on the microbial flora implied in the treatment ofthis waste. Fiorentino et al. (2003) reported that the mosttoxic fraction to the test organisms (Pseudokirchneriella
subcapitata (alga), Brachionus calyciflorus (rotifer) and thetwo crustaceans Daphnia magna and Thamnocephalus
platyurus) was the low molecular weight (o350Da) andespecially catechol and hydroxytyrosol, the most abundantcomponents of this fraction. Allouche et al. (2004) andObied et al. (2005) reported that compounds found inOMW that exhibited antibacterial activity were tyrosol,hydroxytyrosol, oleuropeine, 3–4 dihydroxyphenyl aceticacid, and 4-hydroxybenzoic acid.Our results showed that the treatment of the OMW
reduced considerably its phenolic content from 9.1 to 0.7and eliminate essentially phenolic monomers which re-duced the IB from 100% to 65%. Treated or untreatedOMW incubation in soil contributed also in the reductionof its toxicity and therefore, the significant role played bythe soil microflora. In line with this, Cox et al. (1998),Sierra et al. (2001) and Mekki et al. (2007) showed the fastdegradation of these monomers by the biologic activities ofsoil or their infiltration in the deep layers of soil.Bioluminescence inhibition of V. fischeri is a very
appreciable and very efficient ecotoxicological test todetect and to quantify the toxicity exercised by anysubstratum. Moreover, in order to perform a site-specificecotoxicological monitoring, the optimisation bioassay
ARTICLE IN PRESS
120 Bacillus megatrium
Escherichia Coli
Pseudomonas fluorescens
U
UOE
T
TOE
SU
ST
U
UOE
T
T
TOE
SU
ST
U
UOE
TOE
SU
ST
100
80
60
40
GI
(%)
GI
(%)
20
0
120
100
80
60
40
GI
(%)
20
0
0 10 20
Substrate concentration (%)
30 40 50 60
0 10 20
Substrate concentration (%)
30 40 50 60
0 10 20
Substrate concentration (%)
30 40 50 60
100
90
80
70
60
50
40
30
20
10
0
Fig. 4. Growth inhibition percent of Bacillus megaterium, Pseudomonas
fluorescens and Escherichia coli by various concentrations (10%, 20%,
40% and 50%) in nutrient browth of U, UOE, T, TOE, SU and ST.
C0
0.5
1
Bio
ma
ss (
gl-1
)
1.5
2
2.5Pseudomonas fluorescens Bacillus megatrium E.Coli
ST SU U UOE T TOE
Substrate concentration (50%)
Fig. 5. Bacillus megaterium, Pseudomonas fluorescens and Escherichia coli,
10 h growth on nutrient broth containing 50% proportion of various
substrates (U, UOE, T, TOE, SU and ST) in comparison with growth
control (C) on nutrient broth.
A. Mekki et al. / Ecotoxicology and Environmental Safety 69 (2008) 488–495492

Author's personal copy
procedure may be applied to another target microorganism,specific for the polluted site. The monitoring of the growthof bacteria representing the soil or the aquatic microflora asB. megaterium, P. fluorescens and E. coli cultivated in thepresence of OMW is very instructive and permits to predicttheir behaviour, the day where they will be in contact withthis waste or submitted to its toxicity in the nature.
The strains were interesting to compare their perfor-mances with the same chemicals. Although time, condi-tions of exposure, and species specificity were different, itwould be useful to know how the response of each teststrain to other one may predict chronic toxicity. Thebacterial responses regarding various substrates U, UOE,T, TOE, SU or ST were different. The GI values forB. megaterium, P. fluorescens and E. coli (Fig. 4) allowvisualisation of the fact that the E. coli response is the mostsensitive to the toxic effect of monomers present in U andUOE. P. fluorescens showed the high resistance to OMWtoxicity. A better growth was even obtained on ST that onnutrient broth (Fig. 5). This is quite normal because thisbacterium is known by its powerful capacity to degrade therecalcitrant compounds and its ubiquitous distribution insoil and water environments. This bacterium has oftenbeen found during biodegradation studies of petroleumhydrocarbons contaminated samples (Richard and Vogel,1999; Bugg et al., 2000; Evans et al. 2004). Abbondanziet al. (2003) observed that the lower sensitivity ofP. fluorescens to phenol makes difficult its use as microbialbioassay in organic polluted samples. However, B. mega-
terium and E. coli were more sensitive to this toxicity. Thisfinding confirms previous findings by Perez et al. (1992)reporting that B. megaterium was the most sensitivebacteria to OMW ethyl acetate extract. On the other hand,Ramos-Cormenzana et al. (1996) noted that antibacterialactivity of OMW phenolic compounds was higher on Grampositive than on Gram negative bacteria. Indeed, the relationbetween the toxicity of the phenolic compound of OMW andthe bacterial sensitivity are in report with the bacterial capacityto convert these compounds. The E. coli response is the mostsensitive to U, UOE, T, TOE, SU and ST (GI ¼ 100%,99.8%, 89%, 68%, 43% and 34%, respectively). So this straincan be used as standard species of measure of the phenoliccompounds toxicity. The method developed for culturing andmonitoring the bacterium as B. megaterium or E. coli duringgrowth curve was fairly simple and did not required excessivespeciality equipment. The data presented in this study showclearly that the results obtained in four of these ecotoxicolo-gical test systems compare very favourably and that there is asignificant difference between the response obtained by thesefour strains for different chemicals resulting from thetreatment or the incubation in soil of the OMW. Thus,according to our results we can classify the four tested bacteriaaccording to their increasing sensitivity toward the toxiccompounds of the OMW as following: P. fluorescensoB. megateriumoE. colioV. fischeri.
The present work has demonstrated that E. coli is assensitive as LUMIStox culture (V. fischeri), for phenolic
monomers. This makes it possible to use E. coli bioassay intoxicity testing of phenolic polluted samples, thus avoidingresult distortions related to salinity correction of theLUMIStox test. Moreover, E. coli has often been foundduring biodegradation studies of OMW contaminatedsamples, due to its ubiquity in soil and water. However,further work is required to evaluate the real sensitivity ofE. coli to different organic compounds in order to assess itseventual resistance or degrading capability.
5. Conclusion
The results of the acute toxicity and the GI tests showedthat OMW toxicity was mainly due to its monomericphenolic compounds such as hydroxytyrosol and tyrosol.U and UOE showed highly toxic effects on the four testedbacteria (V. fischeri, B. megaterium, P. fluorescens, andE. coli). OMW treatment or incubation in soil reducessignificantly its toxicity by eliminating the phenolicmonomers. It can be seen from both methods thatLUMIStox bioassay is the most sensitive test, while GItest exhibits a very narrow dependence to the used strain ofbacterium. Indeed, E. coli is very sensitive to the phenoliccompounds toxicities as well as V. fischeri of theLUMIStox bioassay. To a least degree of sensitivity comesB. megaterium, but P. fluorescens seems to be resistantenough to such substratum and not suitable for similartests. The results indicated that bioassays with thedetermination of GI of E. coli or B. megaterium aresuitable for evaluating the toxic effects of OMW phenolicmonomers. These strains can be considered a good choicefor such bioassays. As regards the comparison betweenthe two bioassays, the GI one is simple to carry out (theexperimental apparatus can easily be assembled with theordinary lab equipment), measurement time is quite short(about 10h) and the method is specific since the toxicityeffects are evaluated directly on the wastewater or soil. On theother hand, LUMIStox has the advantage of operating with aselected pure culture and with a standardised procedure. Thisbiotest possesses also a high sensitivity to a wide range ofsubstrata. In conclusion, both methods can be usefullyapplied for toxicity detection in wastewater and soil.
Acknowledgment
This research was funded by E.C. program ‘‘Medusawater’’ Contract ICA-CT-1999-00010 and contract pro-grammes (MHESRT, Tunisia).
Disclaimer
Authors of this manuscript declare that this workcomplies with national and institutional guidelines for theprotection of human subjects and animal welfare. In thispaper, no experiments involving humans or experimentalanimals were conducted.
ARTICLE IN PRESSA. Mekki et al. / Ecotoxicology and Environmental Safety 69 (2008) 488–495 493

Author's personal copy
References
Abbondanzi, F., Cachada, A., Campizi, T., Guerra, R., Raccagni, M.,
Iacondini, A., 2003. Optimisation of a microbial bioassay for
contaminated soil monitoring: bacterial inoculum standardisation
and comparison with Microtox assay. Chemosphere 53, 889–897.
Aggelis, G., Iconomou, D., Christou, M., Bokas, D., Kotzailias, S.,
Christou, G., Tsagou, V., Papanikolaou, S., 2003. Phenolic removal in
a model olive oil mill wastewater using Pleurotus ostreatus in
bioreactor cultures and biological evaluation of the process. Water
Res. 37, 3897–3904.
Aliotta, G., Fiorentino, A., Oliva, A., Temussi, F., 2002. Olive oil mill
wastewater: isolation of polyphenols and their phytotoxicity in vitro.
Allelopathy J 9, 9–17.
Allouche, N., Fki, I., Sayadi, S., 2004. Toward a high yield recovery of
antioxidants and purified hydroxytyrosol from olive mill wastewaters.
J. Agri. Food Chem. 52, 267–273.
Astley, K.N., Meigh, H.C., Glegg, G.A., Braven, J., Depledge, M.H.,
1999. Multi-variate analysis of biomarker responses in Mytilus edulis
and Carcinus maenas from the Tees Estuary (UK). Mar. Pollut. Bull.
39, 145–154.
Azbar, N., Bayram, A., Filibeli, A., Muezzinoglu, A., Sengul, F., Ozer, A.,
2004. A review of waste management options in olive oil production.
Crit. Rev. Environ. Sci. Technol. 34, 209–247.
Ben Sassi, A., Boularbah, A., Jaouad, A., Walker, G., Boussaid, A., 2006.
A comparison of olive oil mill wastewaters (OMW) from three
different processes in Morocco. Process Biochem. 41, 74–78.
Box, J.D., 1983. Investigation of the Folin-Ciocalteu phenol reagent for
the determination of polyphenolic substances in natural waters. Water
Res. 17, 511–522.
Bugg, T., Foght, J.M., Pickard, M.A., Gray, M.R., 2000. Uptake and
active efflux of polycyclic aromatic hydrocarbons by Pseudomonas
fluorescens Lp6a. Appl. Environ. Microbiol. 66, 5387–5392.
Capasso, R., Cristinzio, G., Evidente, A., Scognamiglio, F., 1992.
Isolation, spectroscopy and selective phytotoxic effects of polyphenols
from vegetable waste waters. Phytochemistry 31, 4125–4128.
Capasso, R., Evidente, A., Schivo, L., Orru, G., Marcialis, M.A.,
Cristinzio, G., 1995. Antibacterial polyphenols from olive mill
wastewaters. J. Appl. Bacteriol. 79, 393–398.
Cereti, C.F., Rossini, F., Federici, F., Quaratino, D., Vassilev, N., Fenice,
M., 2004. Reuse of microbially treated olive mill wastewater as fertiliser
for wheat (Triticum durum Desf). Bioresour. Technol. 91, 135–140.
Cox, L., Celis, R., Hermosin, M.C., Beker, A., Cornejo, J., 1998. Porosity
and herbicide leaching in soils amended with olive-mill wastewater.
Agri. Ecosyst. Environ. 65, 151–161.
D’Annibale, A., Casa, R., Pieruccetti, F., Ricci, M., Marabottini, R.,
2004. Lentinula edodes removes phenols from olive-mill wastewater:
impact on durum wheat (Triticum durum Desf.) germinability.
Chemosphere 54, 887–894.
DellaGreca, M., Monaco, P., Pinto, G., Pollio, A., Previtera, L., Temussi,
F., 2001. Phytotoxicity of low molecular weight phenols from olive
mill waste waters. Bull. Environ. Contam. Toxicol. 67, 352–357.
Dhouib, A., Aloui, F., Hamad, N., Sayadi, S., 2006a. Pilot-plant
treatment of olive mill wastewaters by Phanerochaete chrysosporium
coupled to anaerobic digestion and ultrafiltration. Process Biochem.
41, 159–167.
Dhouib, A., Ellouz, M., Aloui, F., Sayadi, S., 2006b. Effect of
bioaugmentation of activated sludge with white-rot fungi on olive
mill wastewater detoxification. Lett. Appl. Microbiol. 42, 405–411.
Evans, F.F., Seldin, L., Sebastian, G.V., Kjelleberg, S., Holmstrom, C.,
Rosado, A.S., 2004. influence of petroleum contamination and
biostimulation treatment on the diversity of Pseudomonas spp. in soil
microcosms as evaluated by 16 s rRNA based-PCR and DGGE. Lett.
Appl. Microbiol. 38, 93–98.
Farre, M., Barcelo, D., 2003. Toxicity testing of wastewater and sewage
sludge by biosensors, bioassays and chemical analysis. Trends Anal.
Chem. 22, 299–310.
Feria, L.A., 2000. The generated situation by the O.M.W. in Andalusia.
Actas/Proceedings-Workshop Improlive-2000-Anexo A1/Annex A1,
pp. 55–63.
Fernandez-Sempere, J., Barrueso-Martınez, M.L., Font-Montesinos, R.,
Sabater-Lillo, M.C., 1997. Characterization of tannery wastes
comparison of three leachability tests. J. Hazard. Mater. 54, 31–45.
Fiorentino, A., Gentili, A., Isidori, M., Monaco, P., Nardelli, A., Parrella,
A., Temussi, F., 2003. Environmental effects caused by olive mill waste
waters: toxicity comparison of low-molecular-weight phenol compo-
nents. J. Agri. Food Chem. 51, 1005–1009.
Hernando, M.D., Malato, O., Farre, M., Fernandez-Alba, A.R.,
Barcelo, D., 2006. Application of ring study: water toxicity determina-
tions by bioluminescence assay with V. fischeri. Talanta 69,
370–376.
Hund, K., Traunspurger, W., 1994. Ecotox-evaluation strategy for soil
bioremediation exemplified for a PAH-contaminated site. Chemo-
sphere 29, 371–390.
Iconomou, D., Earayanni-Christou, I., Zanganas, P., Theocharopoulos,
S., 2002. Bioremediated olive oil mill waste-waters and their use on
the growth of lettuce and tomate plants. Proceedings of the sixth
International Conference, on the Protection and Restoration on
the Environment VI., Skiathos Island, Greece, 1–5, July 2002,
pp. 651–658.
Isidori, M., Lavorgna, M., Nardelli, A., Parrella, A., 2005. Model study
on the effects of 15 phenolic olive mill wastewater constituents on seed
germination and V. fischeri metabolism. J. Agri. Food Chem. 53,
8414–8417.
ISO 11348-2, 1998. Water Quality Determination of the Inhibitory Effect
of Water Samples on the Light Emission of Vibrio fischeri (Lumines-
cent Bacteria Test). Part 2: Method Using Liquid-Dried Bacteria.
DIN Deutsches Institut fur Normung Burggrafenstrasse 6 DE-10787
Berlin.
Jennings, V.L.K., Rayner-Brandes, M.H., Bird, D.J., 2001. Assessing
chemical toxicity with the bioluminescent Photobacterium (Vbrio
fischeri): a comparison of three commercial systems. Water Res. 35,
3448–3456.
Kaiser, K.L.E., Esterby, S.R., 1991. Regression and cluster-analysis of the
acute toxicity of 267 chemicals to six species of biota and the octanol
water partition coefficient. Sci. Total Environ. 109, 499–514.
Khoufi, S., Aloui, F., Sayadi, S., 2006. Treatment of olive oil millwaste-
water by combined process electro-Fenton reaction and anaerobic
digestion. Water Res. 40, 2007–2016.
Knechtel, R.J., 1978. A more economical method for the determination of
chemical oxygen demand, Water Pollut. Control. 25–29.
Komilis, D.P., Karatzas, E., Halvadakis, C.P., 2005. The effect of olive
mill wastewater on seed germination after various pretreatment
techniques. J. Environ. Manage. 74, 339–348.
Lambolez, L., Vasseur, P., Ferard, J.F., Gisbert, T., 1994. The
environmental risks of industrial waste disposal: an experimental
approach including acute and chronic toxicity studies. Ecotoxicol.
Environ. Saf. 28, 317–328.
Lapa, N., Barbosa, R., Morais, J., Mendes, B., Mehu, J., Santos Oliveira,
J.F., 2002. Ecotoxicological assessment of leachates from MSWI
bottom ashes. Waste Manage. 22, 583–593.
Mekki, A., Dhouib, A., Sayadi, S., 2006a. Changes in microbial and soil
properties following amendment with treated and untreated olive mill
wastewater. Microbiol. Res. 161, 93–101.
Mekki, A., Dhouib, A., Aloui, F., Sayadi, S., 2006b. Olive wastewater as
an ecological fertiliser. Agron. Sustain. Dev. 26, 61–67.
Mekki, A., Dhouib, A., Sayadi, S., 2007. Polyphenols dynamics and
phytotoxicity in a soil amended by olive mill wastewaters. J. Environ.
Manage. 84, 134–140.
Novotny, C., Dias, N., Kapanen, A., Malachova, K., 2006. Comparative
use of bacterial, algal and protozoan tests to study toxicity of azo- and
anthraquinone dyes. Chemosphere 63, 1436–1442.
Obied, H.K., Allen, M.S., Bedgood, D.R., Prenzler, P.D., Robards, K.,
Stockmann, R., 2005. Bioactivity and analysis of biophenols recovered
from olive mill waste. J. Agri. Food Chem. 53, 823–837.
ARTICLE IN PRESSA. Mekki et al. / Ecotoxicology and Environmental Safety 69 (2008) 488–495494

Author's personal copy
Perez, J., Delarubia, T., Moreno, J., Martinez, J., 1992. Phenolic content
and antibacterial activity of olive oil wastewaters. Environ. Toxicol.
Chem. 11, 489–495.
Perez, S., Farre, M., Garcıa, M.J., Barcelo, D., 2001. Occurrence of
polycyclic aromatic hydrocarbons in sewage sludge and their
contribution to its toxicity in the ToxAlerts 100 bioassay. Chemo-
sphere 45, 705–712.
Piotrowska, A., Iamarino, G., Rao, M.A., Gianfreda, L., 2006. Short-
term effects of olive mill waste water (OMW) on chemical and
biochemical properties of a semiarid Mediterranean soil. Soil Biol.
Biochem. 38, 600–610.
Ramos-cormenzana, A., Juarez-Jimenez, B., Garcia-Pateja, M.P., 1996.
Antimicrobial activity of olive mill waste waters (Alpechin) and
biotransformed olive oil mill waste water. Int. Biodeterior. Biodegrad.
38, 283–290.
Rana, G., Rinaldi, M., Introna, M., 2003. Volatilisation of substances
after spreading olive oil waste water on the soil in a Mediterranean
environment. Agri. Ecosyst. Environ. 96, 49–58.
Ribo, J.M., 1997. Interlaboratory comparison of studies of the
luminescent bacteria toxicity bioassay. Environ. Toxicol. Water Qual.
12, 283–294.
Ricco, G., Tomei, M.C., Ramadorib, R., Laera, G., 2004. Toxicity
assessment of common xenobiotic compounds on municipal activated
sludge: comparison between respirometry and Microtoxs. Water Res.
38, 2103–2110.
Richard, J.Y., Vogel, T.M., 1999. Characterisation of a soil bacterial
consortium capable of degrading diesel fuel. Int. Biodeterior.
Biodegrad. 44, 93–100.
Sayadi, S., Ellouz, R., 1995. Roles of lignin peroxidase and manganese
peroxidase from Phanerochaete chrysosporium in the decolorization of
olive mill wastewaters. Appl. Environ. Microbiol. 61, 1098–1103.
Sayadi, S., Allouche, N., Jaoua, M., Aloui, F., 2000. Detrimental effects of
high molecular-mass polyphenols on olive mill wastewaters biotreat-
ments. Process Biochem. 35, 725–735.
Schultz, E., Vaajasaari, K., Joutti, A., Ahtiainen, J., 2002. Toxicity of
industrial wastes and waste leaching test eluates containing organic
compounds. Ecotoxicol. Environ. Saf. 52, 248–255.
Sierra, J., Marti, E., Montserrat, G., Cruanas, R., Garau, M.A., 2001.
Characterization and evolution of a soil affected by olive oil mill
wastewater disposal. Sci. Total Environ. 279, 207–214.
Tsioulpas, A., Dimou, D., Iconomou, D., Aggelis, G., 2002. Phenolic
removal in olive oil mill wastewater by strains of Pleurotus spp. in
respect to their phenol oxidase (laccase) activity. Bioresource Technol.
84, 251–257.
Tsui, M.T.K., Chu, L.M., 2003. Aquatic toxicity of glyphosate-based
formulations: comparison between different organisms and the effects
of environmental factors. Chemosphere 52, 1189–1197.
Wang, C.X., Yediler, A., Lienert, D., Wang, Z.J., Kettrup, A., 2002.
Toxicity evaluation of reactive dyestuffs, auxiliaries and selected
effluents in textile finishing industry to luminescent bacteria V. fischeri.
Chemosphere 46 (2), 339–344.
Wang, C., Wang, Y., Kiefer, F., Yedeler, A., Wang, Z., Kettrup, A., 2003.
Ecotoxicological and chemical characterization of selected treatment
process effluents of municipal sewage treatment plant. Ecotoxicol.
Environ. Saf. 56, 211–217.
Yesilada, O., Sam, M., 1998. Toxic effects of biodegraded and detoxified
olive oil mill wastewater on the growth of Pseudomonas aeruginosa.
Toxicol. Environ. Chem. 65, 87–94.
Zurita, J.L., Repetto, G., Jos, A., del Peso, A., Salguero, M., Lopez-
Artıguez, M., Olano, D., Camean, A., 2005. Ecotoxicological
evaluation of diethanolamine using a battery of microbiotests. Toxicol.
In Vitro 19, 879–886.
ARTICLE IN PRESSA. Mekki et al. / Ecotoxicology and Environmental Safety 69 (2008) 488–495 495
Related Documents