Copyright is owned by the Author of the thesis. Permission is given for a copy to be downloaded by an individual for the purpose of research and private study only. The thesis may not be reproduced elsewhere without the permission of the Author.

Welcome message from author
This document is posted to help you gain knowledge. Please leave a comment to let me know what you think about it! Share it to your friends and learn new things together.
Transcript

Copyright is owned by the Author of the thesis. Permission is given for a copy to be downloaded by an individual for the purpose of research and private study only. The thesis may not be reproduced elsewhere without the permission of the Author.

ACTIVATED SLUDGE TREATMENT
OF DAIRY PROCESSING WASTEWATERS:
THE ROLE OF SELECTORS FOR THE
CONTROL OF SLUDGE BULKING.
A thesis presented in partial fulfilment of the requirements for the degree of
Doctor of Philosophy
at Massey University
ANNE M. LEONARD
1996

11
ABSTRACT
The typical wastewater from a milk processIng facility producing butter and milk
powder was treated in a modified activated sludge system in order to establish process
characteristics and investigate operational problems.
A synthetic wastewater was developed with similar average physical and chemical
characteristics to that from a full scale facility . The relative biodegradability of the
wastev-;ater fractions was assessed and basic microbial growth parameters also
determined. A laboratory scale activated sludge reactor configuration was then
established and its performance monitored. Although effective treatment was achieved
in terms of suspended and soluble organic matter removal, the use of a completely
mixed reactor resulted in the system becoming inoperable due to the excessive grov.,th of filamentous microorganisms, with Type 04 I I being the dominant filament.
In order to inhibit filamentous bulking, various selector reactor configurations were
trialed. As nitrification of feed stream proteins had been indicated, unaerated selectors were used with the intention of effecting anoxic substrate removal in the initial selector
zone; but due to the limited supply of oxidised nitrogen, insufficient substrate removal
occurred in the selectors to prevent filamentous bulking, with Type 021 N becoming dominant.
The next series of trials used aerated selectors, with some configurations demonstrating the abi lity to both prevent and cure filamentous bulking. The unsuccessful trials
resulted in the proliferation of Haliscomenobacter hydrossis. From selector trials
conducted it was established that the requirements for successful suppression of
filamentous growth were the incorporation of an initial selector zone in which greater
than 95% of removable soluble substrate was removed and the bulk solution was
maintained in a fully aerobic state. Serial selector configurations demonstrated improved performance over a single selector.
From observations of the physical conditions and substrate concentrations in the reactor
configurations employed, a correlation of filament type to environmental condition can
be tentatively made: Types 04 1 1 and 02 1N were indicated to be low organic loading
type filaments, whereas H hydrossis was indicated to be a low dissolved oxygen filament.

1Jl
Rapid substrate removal rates were anributed to biosorption, accumulation and storage mechanisms, increasing as the selector configuration trials progressed. In general floc
formers possessed a higher specific growth rate and substrate affinity than the
filamentous microorganisms. Fi lament Type 021 N was indicated to lack biosorptive
capacity, however H. hydrossis was indicated as having a greater biosorptive capacity
than the floc formers present.
The highly degradable nature of the substrate and high substrate concentration gradients
imposed by the selector configuration caused rapid oxygen uptake rates; resulting in aerobic, anoxic and anaerobic substrate removal mechanisms all occurring in the initial
selector zone. The occurrence of simultaneous nitrification, denitrification and
phosphorus accumulation resulted in significant nutrient removals from the aerated
selector reactor system, with influent nitrogen and phosphorus levels each reduced by
up to 96% in the effluent stream.
This study found that an activated sludge process was an appropriate method for the effective treatment of milk processing wastewaters, as effluent suspended solids of less
than 10 g.m-3 and soluble COD of less than 30 g.m-3 were consistently obtained,
however a modified configuration \vould be required to prevent the growth of
filamentous microorganisms and anendant operability problems. Due to the nature of
dairy processing wastewaters, a selector reactor configuration could be employed not
only to overcome potential filamentous bulking problems, but also to provide an
opportunity for biological nutrient removal without the inclusion of dedicated anoxic / anaerobic reaction steps or the complex flow regimes conventionally employed for
nutrient removal activated sludge systems.

IV
ACKNOWLEDG MENTS
I wish to thank Rao Bhamidimarri and Dick Earle for providing the opportunity to do
this study and also Jim Barnett and the NZ Dairy Research Institute for providing the
financial support for this research.
Many thanks also to the PET laboratory and workshop staff for their assistance.
Thanks to my family and friends for moral support over the past five years: longsuffering Derek; Dad & Mum; Selma & Graham, Dave & Sue, James & Bridget et a! . ,
Dave and Jules .
Thanks to the sport of bowls for distracting Derek for long enough to allow me to finish
this and the art of gardening for keeping me sane.
TABLE OF CONTENTS
Abstract
Acknowledgments
Table of contents
List of Figures
List of Tables
Abbreviations and Nomenclature
Chapter 1 :
Chapter 2:
Chapter 3:
Chapter 4:
Chapter 5:
Chapter 6:
Chapter 7:
Chapter 8:
Chapter 9:
Chapter 1 0:
Appendix:
Bibliography
Introduction
Dairy processing wastewaters and their treatment
Methodology for the analysis of treatment system performance
Substrate biodegradation studies
Model activated sludge performance
Unaerated selector reactors
Aerated selector reactors
Effect of influent nitrogen content
Summary of results and discussion
Summary and conclusions
Directory of Appendix files
v
Page
11
IV
V
VI
Xlll
XVI11
5
35
51
91
127
181
225
285
329
333
337

Chapter 2
Figure 2. 1
Chapter 3
Figure 3 . 1
Chapter 4
Figure 4. 1 :
Figure 4.2:
Figure 4.3:
Figure 4.4:
Figure 4.5:
Figure 4.6:
Figure 4.7:
Figure 4.8:
Figure 4.9:
Figure 4.1 0:
Figure 4.11:
Figure 4.12:
Chapter 5 Figure 5. 1 :
LIST OF FIGURES
Activated Sludge Process Schematic
'Respirometer' Vessel Schematic
Estimation of Ss - measurement of the OUR after substrate
addition.
Estimation of Ss - determination of the ratio of oxygen
consumed to substrate added.
Determination of Ss and SH fractions from OUR data.
Effect of variation in SIX ratio on the interval of elevated
OUR.
Fractionation of substrate COD by degradability and milk
components.
Calculated biomass concentration versus time for the
estimation of �MAX using the High SIX method.
Modified linear plot for the estimation of �MAX and Ks
using the High SIX method.
Modified linear plot for the estimation of �MAX and Ks
using the Low SIX method.
Use of wide range of initial substrate concentrations to
determine IlMAX and Ks using the Low SIX method.
Lactose removal rates during batch tests with varying
initial lactose concentrations.
Effect of initial lactose concentration on removal rate in
batch tests.
Soluble COD removal rates during batch tests at varying
initial soluble COD concentrations.
Reactor configuration during the conventional CSTR trials.
VI
Page
10
46
56
56
59
59
63
66
67
70
74
79
79
81
92

Figure 5 .2:
Figure 5 .3:
F igure 5 .4:
F igure 5 .5:
Figure 5 .6: F igure 5 .7:
F igure 5 .8 :
F igure 5 .9:
Figure 5 . 1 0 :
Reactor mixed l iquor suspended solids concentration
during the CSTR trials at various SRT.
Reactor effluent quality during the 5 day SRT trial .
Reactor effluent quality during the 10 day SRT trial .
Reactor effluent quality during the 20 day SRT trial .
Reactor effluent quality during the 30 day SRT trial . Determination of decay rate using biomass from the 1 0 day
SR T trial, starting after 1 8 days at target SR T.
Batch soluble COD removal rates during the various
CSTR trials.
Change in Sludge Volume Index during the conventional
CSTR trials at various SR T.
Well settl ing biomass. 1 0d SRT trial after 2 days at SRT, non-bulking SVI of 83 ml.g-J•
95
97
98
99
1 00
1 04
1 05
1 1 0
1 1 3
Figure 5 . 1 1 : F ilaments protruding from the flocs. IOd SR T trial after 1 1 3 1 9 days at SRT, SVI had increased to 1 70 ml.g-J•
F igure 5 . 1 2 : Abundant filament gro\\1h. 1 0d SRT trial after 23 days at 1 1 5
SRT, SVI had continued to increase to 3 76 ml.g-I .
F igure 5 . 1 3: Excessive filament growth. IOd SRT trial after 3 5·days at 1 1 5 .
SRT, SVI had increased still further to 450 ml.g-I . F igure 5 . 1 4: Dominant rotifer type observed throughout all trials. 1 1 7 Figure 5 . 1 5 : Stalked ciliated protozoa commonly observed in the CSTR 1 1 7
trials Figure 5 . 1 6: Change in substrate removal rate and maximum specific 1 23
Chapter 6
Figure 6. 1 :
Figure 6.2: Figure 6.3:
Figure 6.4:
Figure 6 .5 :
Figure 6 .6 :
Figure 6.7:
Figure 6.8:
growth rate with SVI.
Reactor system configuration during the selector reactor
trials. Change in SVI during Trials ANI, AN2 and AN3.
Change in selector soluble COD concentration with
increasing recycle rate during Trial ANI.
Selector soluble COD concentrations during Trial AN3 .
Trial AN I after 23 days at SRT. SVI = 240 ml.g-I .
Trial ANI after 49 days at SRT. SVI = 280 ml.g-I .
Trial ANI after 56 days at SRT. SVI = 300 ml.g-I.
Trial AN3 after 1 8 days at SRT. SVI = 300 ml.g-I .
1 3 1
1 3 5 1 3 7
139
1 4 1
1 4 1
1 43
1 43
Vll

Figure 6.9: Trial AN3 after 25 days at SRT. SVI unchanged from 145
Figure 6..8.
Figure 6.10: Trial AN3 after 34 days at SRT. SVI unchanged from 145
Figure 6.8.
Figure 6.11: Soluble COD removal and OUR during batch tests with 149
AN2 biomass.
Figure 6.12: Initial soluble COD removal rates during Trials AN 1, AN2 149
and AN3.
Figure 6.13: Comparison of batch soluble COD removal rates between 151
biomass from CSTR and unaerated selector trials.
Figure 6.14: Soluble COD removal in aerated and unaerated batch tests 153
during Trial AN2.
Figure 6.15: Ammonia concentrations in the reactor zones during Trials 159
ANI, AN2 and AN3.
Figure 6.16: Plot of ammonia concentration against selector residence 161
time during Trial AN3.
Figure 6.17: Nitrate concentrations in the reactor zones during Trials 162
ANI, AN2 and AN3.
Figure 6.18: Nitrite concentrations in the reactor zones during Trials 163
ANI, AN2 and AN3.
Figure 6.19: Phosphorus content of biomass in the reactor and selector 168
zones during Trials ANI, AN2 and AN3.
Figure 6.20: Dissolved phosphorus concentration in the reactor zones 169
during Trials ANI, AN2 and AN3.
Chapter 7
Figure 7.1: Aerated selector reactor system - equipment configuration. 183
Figure 7.2: Reactor soluble COD concentrations during aerated . 186
selector reactor Trials AE1 to AE4.
Figure 7.3: Change in Sludge Volume Index during aerated selector 188
trials in Reactor System 2.
Figure 7.4: Change in Sludge Volume Index during aerated selector 188
trials in Reactor System 1.
Figure 7.5: Filamentous bulking at the end of Trial AE4. SVI = 323 191
I -I m .g .
Vlll

Figure 7.6: Reduction in filament abundance and SVI during Trial 19 1
AE5; by Day 22 of the trial the SVI had decreased to 133
I -I m .g .
Figure 7.7: Soluble COD removal through the reactor system zones 193
during Trial AE5.
Figure 7.8: Soluble COD removal during batch tests usmg biomass 195
from Day 29 of Trial AE5.
Figure 7.9: Ammonia concentration trends during periods of Trials 204
AE 1, AE3 and AE5.
Figure 7. 10: Ammonia concentration trends during periods of Trials 204
AE2 and AE4.
Figure 7. 1 1: Nitrate concentration trends during periods of Trials AEI, 205
AE3 and AE5.
Figure 7. 12: Nitrate concentration trends during periods of Trials AE2 205
and AE4.
Figure 7. 13: Nitrite concentration measures during periods of Trials 206
AE 1, AE3 and AE5.
Figure 7. 14: Nitrite concentration trends during periods of Trials AE2 206
and AE4.
Figure 7. 15: Nitrogen content of mixed liquor solids during the various 207
unaerated and aerated selector trials.
Figure 7. 16: Average ammonia concentrations in the reactor zones 209
during the aerated selector trials.
Figure 7. 17: Average nitrate concentrations in the reactor zones during 209
the aerated selector trials.
Figure 7.18: Nitrogen balance during the various unaerated and aerated 21 1
selector reactor trials.
Figure 7. 19: DRP concentration trends during periods of the trials 2 14
conducted in Reactor System 2.
Figure 7.20: DRP concentration trends during periods of the trials 2 14
conducted in Reactor System 1.
Figure 7.21: Phosphorus content of the mixed liquor solids during the 215
aerated selector trials.
Figure 7.22 Selector DRP and nitrate concentrations during the aerated 22 1
selector trials.
Figure 7.23: Reactor DRP and nitrate concentrations during the aerated 222
selector trials.
IX

Chapter 8
Figure 8.1:
Figure 8.2:
Figure 8.3:
Figure 8.4:
Figure 8.5:
Figure 8.6:
Figure 8.7:
Figure 8.8:
Reactor soluble COD concentrations during Trials AE5,
AE6 and AE7.
Reactor soluble COD concentrations during Trial AE8.
pH in the reactor zones during Trials AE6, AE7 and AE8.
Change in SVI during Trials AE5, AE6 and AE7.
Filament abundance on Day 2 of Trial AE7,
SVI = 219 ml.g-I.
Filament abundance on Day 8 of Trial AE7,
SVI = 179 ml.g-I.
Filament abundance on Day 18 of Trial AE7,
SVI = 93 ml.g-I.
Filament abundance on Day 30 of Trial AE7,
SVI = 63 ml.g-I.
227
229
231
233
235
235
237
237
Figure 8.9: Change in SVI during Trial AE8. 239
Figure 8.10 Filament abundance on Day 24 of Trial AE8, 239
SVI = 301 ml.g-'.
Figure 8.11: Filament abundance on Day 37 of Trial AE8, 241
SVI = 183 ml.g-'.
Figure 8.12: Filament abundance on Day 40 of Trial AE8, 241
SVI = 116 ml.g-'.
Figure 8.13: Batch soluble COD removal, Day 12 of Trial AE8. 244
Figure 8.14: Ammonia concentration trends during the trials in Reactor 250
System 2.
Figure 8.15: Nitrate concentration trends during the trials in Reactor 251
System 2.
Figure 8.16: Nitrite concentration trends during the trials in Reactor 251
System 2.
Figure 8.17: Ammonia concentration trends during the trials in Reactor 253
System 1.
Figure 8.18: Nitrate concentration trends during the trials in Reactor 253
System 2.
Figure 8.19: Nitrite concentration trends during the trials in Reactor 254
.System 2.
Figure 8.20: Average concentrations of ammonia, nitrate and nitrite 255
during Trials AE6, AE7 and AE8, by reactor zone.
x

Figure 8.21: Average concentrations of ammonia, nitrate and nitrite in 255 reactor zones during Trials AE6, AE7 and AE8.
Figure 8.22: Concentration of ammonia and nitrate flowing into and out 256 of the first selector zone during Trials AE6, AE7 and AE8.
Figure 8 .23 Estimation of maximum growth rate of nitrifiers from 259 effluent nitrate and nitrite concentrations after a change in
substrate N level. Figure 8 .24: Ammonia concentration and pH in the reactor zone during 26 1
Trials AE6, AE7 and AE8 . Figure 8.25: Comparison of estimated nitrogen removals VIa 263
denitrification during Trials AE5 to AE8. Figure 8 .26: Nitrogen removal balance during the trials at an increased 265
substrate N content. Figure 8 .27: Effluent DRP concentrations during Trials AE6, AE7 and 267
AE8. Figure 8.28 : DRP concentrations in the vanous reactor zones during 268
Trials AE6, AE7 and AE8 . Figure 8 .29: Selector A nitrate and DRP concentrations during Trials 269
AE6, AE7 and AE8. Figure 8.30: Reactor ammonia, nitrate and DRP concentrations during 269
Trials AE6, AE7 and AE8. Figure 8.3 1 : Phosphorus content of VSS during Trials AE6, AE7 and 272
AE8.
Figure 8.32: Biomass SVI, reactor pH and Selector A dissolved oxygen 275 concentration during Trials AE6, AE7 and AE8 .
Figure 8.33: Specific oxygen uptake rate in the various reactor zones. 279 Figure 8.34: Oxygen consumption in the various reactor zones. 279 Figure 8.35: Total mass of mixed liquor suspended solids in the reactor 281
system during the trials in Reactor System 2.
Figure 8.36: Total mass of mixed liquor suspended solids in the reactor 281 system during the trials in Reactor System 1.
Chapter 9
Figure 9.1 : Effluent soluble COD concentrations obtained during the 289
various trials in each reactor system.
Figure 9.2: Effluent suspended solids concentrations obtained during 290
the various trials in each reactor system.
Xl

Figure 9.3: Effect of floc loading in the batch tests on substrate 292
biosorption.
Figure 9.4: Effect of SVI on biosorption during batch substrate removal 293 tests utilising biomass from unaerated selector trials.
Figure 9.5: Effect of SVI on biosorption during batch substrate removal 293
tests utilising biomass from aerated selector trials.
Figure 9.6 : Change in maximum Specific OUR with SVI during the 297
various series of trials
Figure 9.7: Relationship between maximum Specific OUR and Ks. 298
Figure 9.8: Nitrogen content of biomass in the various reactor zones 30 I
during the selector configuration trials.
Figure 9.9: COD content of mixed liquor suspended solids In the 302
various reactor zones during each trial .
Figure 9. 1 0: Average soluble COD concentrations observed In the 307
various reactor configuration zones.
Figure 9. 1 1 : Nitrogen compounds in the effluent stream during Trials 3 1 1 ANI to AE5.
Figure 9. 1 2 : Reactor system nitrogen balance and trend In extent of 3 1 5
denitrification during Trials AN I to AE8 .
Figure 9. 1 3: Trend in effluent P concentrations and the P content of 3 1 9
biomass, during trials in Reactor System 1 . Figure 9. 1 4: Trend in effluent P concentrations and the P content of 320
biomass, during trials in Reactor System 2. Figure 9. 1 5 : Average phosphorus content of biomass In the vanous 323
reactor zones during Trials ANI to AE8.
Figure 9. 1 6: Trend in initial selector zone DRP with increasing nitrate 324
concentration during Trials AE5 to AE8.
Xli

Chapter 2
Table 2 . 1 :
Table 2.2:
Chapter 4
LIST OF TABLES
Dairy process111g wastewater treatment methods
employed in New Zealand.
Categorisation of filaments as proposed by Jenkins el al.
( 1 993).
9
1 6
Table 4. 1 : Typical Effluent Characteristics of Butter and Milk 52
Powder Production Facility.
Table 4 .2 : Composition of Butter and Milk Powder Products. 53
Table 4.3: Synthetic Wastewater Composition Based on Ingredient 53
Composition.
Table 4.4: Characteristics Measured on the Synthetic Wastewater. 54
Table 4.5: Estimation of Biodegradable Fractions Ss and SH of the 58
Soluble Wastewater.
Table 4.6: Division of Readily Biodegradable Fraction of the 58
Wastewater into Ss and SH. Table 4.7: Estimation of �max and Ks Using High SIX Ratios at 20 66
0c. Table 4.8: Estimation of �max and Ks Using Low SIX Ratios. 7 1
Table 4.9: Effect of SIX Ratio on the Estimation of �max and Ks at 73
20°C.
Table 4. 1 0: Estimation of Y H from batch growth tests. ·76
Table 4. 1 1 : Estimation of Y H from Oxygen Consumption During Ss 77
Determination.
Table 4 . 1 2 : Lactose Removal Rates at Varying Initial Concentrations. 80 Table 4. 1 3: Soluble COD Removal Rates at Varying Initial 82
Concentrations.
Table 4. 14: 2.5 day HRT/SRT Continuous Reactor Performance. 84
Chapter 5
Table 5 . 1 : Reactor mixed liquor conditions at different solids 96
retention times.
Table 5.2: Reactor effluent quality at different solids retention times. 1 0 1
Xlll

Table 5.3:
Table 5.4:
Table 5.5:
Table 5.6:
Table 5.7:
Estimation of J-lmax and Ks for mixed liquors of various
solids retention times.
Decay rate coefficients estimated at vanous solids
retention times.
Soluble COD removal rates in batch tests using biomass
at various solids retention times.
Effluent ammonia and nitrate concentrations at vanous
solids retention times.
Reactor performance at low F 1M and 20 days solids
retention time.
102
103
106
107
108
Table 5.8: Microscopic observations of filament abundance during 111
the 10 day solids retention time trial.
Table 5.9: Microscopic observations of the dominant filamentous 112 . .
mlcroorgamsm.
Table 5.10: Summary of biomass characteristics at vanous solids 122
Chapter 6
Table 6.1:
Table 6.2:
Table 6.3:
Table 6.4:
Table 6.5:
Table 6.6:
retention times and sludge volume index.
Unaerated selector reactor treatment perfonnance.
Selector perfonnance and operation during the unaerated
selector trials.
Microscopic observations of filament abundance during
Trial ANI .
Soluble COD removal during aerobic batch tests.
Estimation of decay rate coefficient during unaerated
selector trials.
Values Calculated for J.lmax and Ks during unaerated
selector trials.
133
136
140
150
154
155
Table 6.7: Average nitrogen and phosphorus concentrations during 156
Trial ANI: 1 x 1.2 I selector.
Table 6.8: Average nitrogen and phosphorus concentrations during 157
Trial AN2: 1 x 2.4 I selector.
Table 6.9: Average nitrogen and phosphorus concentrations during 157
Trial AN3: 3 x 0.6 1 selectors.
Table 6.10: Estimation of nitrogen removal· during the unaerated 165
selector reactor trials.
xiv

Table 6.11: Estimate of nitrogen removed in the settler and selector 166
zones.
Table 6.12: Phosph�rus removals in the unaerated selector systems. 171
Table 6.13: Selector soluble COD removal attributable due 175
Chapter 7 Table 7.1:
Table 7.2:
Table 7.3:
Table 7.4:
Table 7.5:
Table 7.6:
Table 7. 7:
Table 7.8:
denitrification.
Aerobic selector reactor treatment performance.
Selector performance and operation during the aerobic
selector trials.
Batch soluble COD removal rate tests.
Oxygen consumption in response to substrate removal in
the selector zone during Trial AE5 . Kinetic constants measured during aerated selector trials.
Mixed liquor suspended solids COD / VSS ratios.
DNA content of biomass at different locations in the
reactor system.
Nitrogen and phosphorus concentrations during Trial AE1:
3xO.6 I selector configuration.
184
185
194
196
197
198
199
200
Table 7.9: Nitrogen and phosphorus concentrations during Trial AE2: 201
1 x 1.2 I selector configuration.
Table 7.10: Nitrogen and phosphorus concentrations during Trial AE3: 201
2x 0.6 I selector configuration.
Table 7.11: Nitrogen and phosphorus concentrations during Trial AE4: 202
1 x 0.6 I selector configuration.
Table 7.12: Nitrogen and phosphorus concentrations during Trial AE5: 203
3x 0.6 I selector configuration.
Table 7. 13: Nitrification rates estimated from reactor N02 and N03 210
concentrations.
Table 7.14: Estimation of nitrogen removal during aerobic selector 212
trials.
Table 7.15: Phosphorus mass balance for the aerated selector system 216
trials.
Table 7.16: Estimation of substrate removal processes In the first 220
selector zone.
Chapter 8 Table 8. 1: Treatment perfonnance at increased substrate N content. 228
xv

Table 8.2:
Table 8.3:
Table 8.4:
Table 8. 5:
Table 8.6:
Selector performance and operation at increased substrate
N content.
Results from batch soluble COD removal rate tests.
Oxygen consumption in response to soluble substrate
addition.
Dissolved oxygen concentrations and uptake rates in the
reactor system.
Kinetic constants detem1ined during increased feed
nitrogen content trials.
230
2 43
2 45
2 46
2 47
Table 8.7: Biomass decay rates measured during increased substrate 248
nitrogen content trials.
Table 8.8: Nitrogen and phosphorus concentrations during Trial AE6 2 49
at 33% higher substrate nitrogen.
Table 8.9: Nitrogen and phosphorus concentrations during Trial 250
AE7: at 67% higher substrate nitrogen.
Table 8.10: Nitrogen and phosphorus concentrations during Trial 2 52
AE8: 67% higher substrate nitrogen.
Table 8. 11: Change in mass of oxidised nitrogen and ammonia through 258
the various reactor zones during Trials AE6, AE7 and AE8.
Table 8. 12 : Estimation of nitrification rates from reactor nitrate and 2 62
nitrite concentrations.
Table 8. 13: Reactor system nitrogen balance during Trials AE6, AE7 2 64
and AE8.
Table 8.14: Reactor system phosphorus balance during Trials AE6, 271
AE7 and AE8.
Table 8. 15: Estimation of oxygen consumption for nitrification and 280
substrate removal.
Chapter 9
Table 9.1: Summary of reactor configurations and conditions for the 2 87
trials conducted.
Table 9.2 :
Table 9. 3:
Table 9. 4:
Table 9.5:
Table 9.6:
Substrate removal observed In batch soluble COD
removal tests.
Respirometric estimation of biomass kinetic para!11eters.
Trend in biomass decay rates during the study.
Oxygen and substrate consumption in the aerated selector
zones.
vssrrss ratio of the Reactor suspended solids.
2 95
296
299
304
321
XVI

Appendix
Table A l Directory of Appendix Files, Data Disk No.1
Table A2 Directory of Appendix Files, Data Disk No.2 333 335
XVll

AS
ATU
BOD
COD
DO
DRI
DRP
EBPR
HRT
Ks
Jlmax
N
NTU
OUR
Ox PAO
P
RAS
RBCOD
sCOD
S
SI SH
So Ss SMP
SpOUR
SRT
SVI
TKN
TN TP
TS
ABBREVIATIONS AND NOMENCLATURE
Activated Sl udge
Al lyl thiourea
Biochemical Oxygen Demand (g.m·3)
Chemical Oxygen D emand (g.m-3)
Dissol ved Oxygen (g.m-3)
NZ Dairy Research Institute, Pal merston North, NZ.
Dissolved Reactive Phosphorus (g.m-3)
Enhanced Biological Phosphorus Removal
Hydraul ic Retention Time (d)
Substrate half saturation co-efficient (g COD .m-3 )
Maximum specific growth rate (d-I)
Nitrogen
Nephel ometric Turbidity Units
Oxygen Uptake Rate (g O2 .m-3 . min-I )
COD content of biomass (g COD.g TSS-')
Phosphorus Accumulating Organism
Phosphorus
Return Activated Sl udge
Readil y Biodegradable Chemical Oxygen Demand
xviii
Sol ubl e COD (g COD ,m,3 ). Defined as GFC filterable COD for this
study.
Substrate concentration (g COD .m,3 )
Soluble Inert substrate concentration (g COD ,m-3 )
Rapidl y hydrolyseable substrate (g COD .m-3 )
Initial substrate concentration (g COD .m-3 )
Readily biodegradabl e substrate (g COD .m-3 )
Soluble Microbial Products
Specific Oxygen Uptake Rate (g O2 ' g VSS-I , d-I )
Sol ids Retention Time (d)
Sludge Volume Index (mI. g-I )
Total Kjehldahl Nitrogen (g .m-3 )
Total Nitrogen (g.m-3 )
Total Phosphorus (g.m-3)
Total Solids (g.m-3)

TSS Total Suspended Solids (g.m-3)
VSS Volatile Suspended Solids (g.m-3)
X Biomass concentration (g. m-3)
XI Particulate inert substrate concentration (g COD .m-3 )
Xo Initial biomass concentration (g.m-3)
Xs Slowly biodegradable substrate (g COD .m-3 )
Y Cell growth yield (g cell mass. g substrate COD-I)
Y H Heterotrophic growth yield (g cell COD . g substrate COD -I )
XIX

1.1 Background
CHAPTER 1
INTRODUCTION
1
:
The dairy industry is one of New Zealand's major industries, contributing significantly to many local economies as well as being one of the country's largest export earners. The extent of the milk processing capability is still increasing with over 8 million m3 of milk being handled each year, predominantly into products such as whole. milk or milk component powders, cheese and butter.
The manufacture of dairy products results in an effluent stream comprised mainly of diluted milk or milk products, which can possess a considerable oxygen depleting effect if discharged into natural waters and therefore require treatment before disposal. As the continuing trend is toward fewer but larger milk processing installations, an efficient treatment system will be required for future facilities, which needs to be capable of handling large volumes of a wastewater that may be highly variable in both flowrate and composition.
Most New Zealand milk processing facilities are positioned at a location central to the milk supply and due to the requirement for a significant supply of fresh water, are usually positioned near a river. Discharge of wastewaters has traditionally been to natural waterway, or by irrigation on to land. The most important parameters for disposal into a natural waterway are removal of organic matter, suspended solids and
. nutrients, in particular nitrogen and phosphorus.
As dairy processing wastewaters are essentially readily biodegradable and non-toxic, they are amenable to biological treatment methods, however due to the move towards facilities with larger processing capacities, higher rate treatment systems are being sought due to the concurrently larger land area requirements if spray irrigation or aerated ponds are used.
One of the options for higher rate biological treatment is an activated sludge system, as these have been successfully used for many years to produce a high quality effluent from a wide range of wastewaters. Activated sludge systems are more compact than the

2
aerobic treatment systems already in use by the NZ dairy industry, and have the
opportunity to be modified for a variety of treatment objectives including nutrient
removal, which is of importance as the treatment requirements for dairy effluents are
likely to include nitrogen and phosphorus removal in the future.
This study was undertaken to establish the treatability of milk processing wastew�te�s,
such as that produced from a butter and milk powder production facility, in an activated
sludge system, to assist in the evaluation of the appropriateness of such systems for
future processing installations.
1.2 Approach taken in this study
In order to establish the important requirements for an effective activated sludge
treatment system, a laboratory scale reactor was established for this study utilising a
typical dairy processing wastewater.
The study was undertaken in stages, with results from each stage being used to
detennine the direction and focus of subsequent study. Chapter 2 reviews literature that
has been published relevant to the milk processing industry on methods utilised for the
treatment of its wastewaters. A review is also made of activated sludge treatment
systems, including modifications used to address specific operability problems or
treatment objectives, in particular the removal of nutrients and the prevention of
filamentous bulking.
The methodology utilised for the various experiments conducted· and parameters
detennin.ed in this study is outlined in Chapter 3. The first series of experiments as
detailed in Chapter 4, was conducted to devise and characterise a synthetic wastewater
representative of the 'typical' effluent produced by a butter and milk powder production
facility. Substrate characterisation was perfonned in a manner consistent with current
research directions for activated sludge systems, to assist with future design or
modelling infonnation requirements.
Treatability of the wastewater was initially evaluated in a conventional activated sludge
configuration as described in Chapter 5. Although a high quality wastewater was
obtained, filamentous bulking problems were encountered which rendered the system
inoperable. . This has been found in practice to be a common operational problem
encountered in the aerobic treatment of diary processing wastewaters using activated

sludge type systems. The next stage of the study therefore concentrated on the
establishment of a reactor configuration which could prevent the growth of problematic
microorganisms, and the determination of critical parameters for reactor design. The
use of unaerated selector reactors in an attempt to prevent bulking is detailed in Chapter
6 and subsequent aerated selector trials are described in Chapter 7. :
During the evaluation of various selector reactor configurations, it became evident that
significant biological nutrient removal was also occurring. Although the removal of
nitrogen was expected during the unaerated selector trials, the removal of phosphorus
was not anticipated and the continuing improvement in nutrient removal under the fully
aerated reactor configurations was also not expected. As a result, a subsequent set of
trials at an increased level of substrate nitrogen content was conducted, as detailed in
Chapter 8, to further investigate nutrient removal relationships and refme reactor
requirements for the prevention of filamentous growth.
A comparison between results obtained for the different sets of trials in the study and an
evaluation of wastewater treatability, substrate removal mechanisms and the extent of
nutrient removal observed is given in Chapter 9; together with a discussion of
implications for full scale systems and recommendations for areas of further research.

4
;

CHAPTER 2
DAIRY PROCESSING W ASTEW A TERS
2.1 Introduction
AND THEIR TREATMENT
5
;
The dairy industry is important to the economy of New Zealand and its continued
success in the future will see new processing facilities being built or processing
capacities of existing plants being expanded to handle the increased milk volumes
becoming available. This wi ll increase the requirements for an effective wastewater
treatment method capable of efficiently treating the variable effluents typically
produced by such facilities. The initial aim of the project was to investigate the
feasability of using an activated sludge system for the treatment of dairy processing
wastewaters.
Activated sludge treatment is a well proven technology, however operability problems
are commonly reported. Many variations on the conventional activated sludge
configuration have also been developed to enhance the removal of specific wastewater
constituents, in particular nitrogen and phospJ:torus which can otherwise cause nutrient
enrichment problems in receiving waters. However, the treatment conditions reported
as being required for overcoming operability problems or enhancing nutrient removal
are widely varied and in some cases, conflicting.
2.2 The Dairy Processing Industry
The processing of milk into a variety of dairy products is a significant activity in New
Zealand, with a total of 8633 million m3 of milk processed in 1 994/95 (NZ Dairy
Board, 1 995). Milk production and hence milk processing is seasonal in nature, with
products manufactured being destined predominantly for overseas markets. The main
products include cheese, butter, milk powders and milk component powders.

6
Individual processing facilities tend to be very large, in 1995 there were a total of 32
manufacturing units, with the largest being a multi-product plant capable of processing
7000 m3.d-1 of milk (Russell, 1996). The trend over the past few decades has been
towards fewer plants with a larger individual processing capacity (Barnett et al., 1982;
Marshall and Harper, 1984; NZ Dairy Board, 1995).
2.3 Dairy Processing Wastewaters
:
Dairy processmg plants are large consumers of fresh water and producers of
wastewater. Dairy processing effluents are comprised primarily of diluted milk, milk
components or milk products (Carawan et al., 1979; Barnett et al., 1982; Marshall and Harper, 1984; Strydom et al., 1993) and require some form of treatment before disposal.
2.3.1 Characteristics of Dairy Processing Wastewaters
As wastewaters contain predominantly water and diluted milk or milk products, the
main components of milk are also the main components of the wastewater, however the
composition may be highly variable, depending on the products manufactured at the
given processing facility.
The main components of milk are water (85-87%), fat (3-7%), protein (3-5%), lactose
(4-5%), minerals (0. 7-0. 8%), and vitamins. The milkfat exists as globules, fonning an
emulsion in the milk serum. Milk proteins are either caseins (80%) or whey proteins
(20%) the former being present as micelles while the latter are soluble and therefore
dissolved in the milk serum along with the lactose and minerals (Marshall and Harper,
1984; Walstra and Jenness, 1984).
Water is removed from milk during concentration or evaporation stages in the
production of various milk products such as butter, cheese and milk powder, so the
effluent contains not only process water but also milk derived water. The dairy
processing industry is a large user of water, predominantly for washing and cooling
purposes, with specific water consumption ratios (water consumed: raw milk processed}
of 1.0 to 4. 0 reported in NZ (Russell, 1996) and 1. 4 to 9.6 in South Africa (Strydom et al. , 1993)

7
Main sources of wastewater constituents include: rinsings and washings from tanks, pipelines, processing equipment, vats and delivery tankers; carryover in separation
processes; startup or shutdown residues, spills and leaks from the process and unusable
by-products such as the condensate from evaporators and penneates from membrane
plants. Other significant components of the wastewater may include detergents,
sanitisers, lubricants and boiler or process water treatment chemicals· (Carawan el af.,
1979; De Haast, 1984; Marshall and Harper, 1984).
The general characteristics of dairy processing wastewaters are: high organic content, as
measured by wastewater biochemical oxygen demand (BOD) or chemical oxygen
demand (COD); rapid biodegradability; low to negligible toxicity; potential for
significant nitrogen contents due to milk proteins; a significant fat content; and high
turbidity (Barnett et aI., 1982; Marshall and Harper, 1984; Fang, 1990; Strydom et al.,
1993).
Whole milk has a BOD of approximately 100,000 g.m-3 and COD of around 200,000
g.m-3 (De Haast et aI., 1984; Marshall and Harper, 1984). Average COD values of the
wastewaters from milk powder type processing plants range between 3500 g.m-3 to
4000 g.m-3 (Marshall and Harper, 1984; Strydom et al., 1993); although one of the
salient features of these wastewaters has been a highly variable composition and
concentration (Jones, 1974; Barnett et af., 1982; Marshall and Harper, 1984; Fang,
1990).
Due to the highly degradable nature of the wastewater, initial substrate removal is very
rapid, with deoxygenation rates reported as being twice that obserVed for domestic
wastewaters (Marshall and Harper, 1984), and in some instances in excess of the
possible oxygenation rate (Adamse 1968c). Of the soluble components of the substrate,
milk proteins are more slowly removed (Adamse 1968c; Jones, 1974); however of the
total milk derived constituents, the insoluble milk fats are the most slowly degraded due
to their size, but are still highly biodegradable (Marshall and Harper, 1984). The
presence of fats have been associated with other problems in activated sludge systems
such as foaming and the proliferation of filamentous microorganisms such as Nocardia
sp. and Microthrix parvicella (Forster, 1992). Foaming has also been associated with
the whey protein fraction of mill< (Jones, 1974; Marshall and Harper, 1984).
As well as significant N contents of up to 190 g.m-3 due to milk proteins, and in some
cases due to nitric acid cleaners (IDF, 1985); dairy processing wastewaters have also
been reported to have significant phosphorus contents, with values averaging 10 g.m-3

8
being commonly reported (Marshall and Harper, 1984), ranging from 2 to 120 g.m-3,
and due mainly to the use of P containing detergents or boiler water treatment
chemicals (Jones, 1974; IDF, 1985). The pH of the wastewater can vary widely and is
mainly dependent on whether the cleaning compounds used are acid or alkali (Marshall
and Harper, 1984).
2.3.2 Methods of Treatment for Dairy Processing Wastewaters
:
As wastewaters are derived primarily from milk components, the greatest gains 10 reducing the impacts of processing effluents have been through in-plant waste
minimisation. However, due to technological, financial and product quality constraints,
a waste stream is still currently produced; which must be treated prior to disposal into
the receiving environment to remove organic, turbidity causing or nutrient containing
constituents.
The reported methods commonly used for the treatment of dairy processing wastewaters
include: discharge into municipal sewers (Carawan et al., 1979; Barnett et al., 1982;
Elkin, 1984; Marshall and Harper, 1984; IDF, 1985; Fang, 1990; Strydom et al. , 1993);
irrigation onto land and pasture (Carawan et al., 1979; Barnett et al., 1982; Marshall
and Harper, 1984; Strydom et al., 1993); chemical precipitation (Marshall and Harper,
1984; IDF 1985; Honer 1992); anaerobic biological treatment (Jones, 1974;
Middlebrooks, 1979; Elkin, 1984; Marshall and Harper, 1984; Honer, 1992; Kilani,
1993); and aerobic biological treatment (IDF, 1985; Honer, 1992).
The most often reported means of aerobic treatment include: activated sludge (Jones,
1974; Middlebrooks, 1979; Elkin, 1984; Hung, 1984; Marshall and Harper, 1984; Fang,
1990; Fang 199 1); trickling filters (Jones, 1974; Middlebrooks, 1979; Barnett et al.,
1982; Elkin, 1984; Marshall and Harper, 1984); oxidation ditches (Marshall and Harper,
1984); aerated lagoons (Jones, 1974; Carawan et al., 1979; Middlebrooks, 1979; Barnett
et al., 1982; Marshall and Harper, 1984) and rotating biological discs (Jones, 1974).
In New Zealand the treatment methods used generally include either chemical or
biological treatment followed by discharge to land or to natural waterways. The various
methods of treatment currently employed in NZ are listed in Table 2. 1 (Russell, 1996)
with some processing sites utilising more than one of the methods outlined.

9
F or many years land based systems such as spray irrigation have been the favoured
means of treatment in New Zealand, however this method is dependent on the
availability of suitable land and favourable weather conditions to be effective. As
processing sites become larger, irrigation schemes need to become correspondingly
larger and hence more expensive to install and operate. Therefore tre�tn;ent processes
with a smaller land requirement may need to be considered.
Table 2.1 Dairy processing wastewater treatment methods employed in New Zealand.
Wastewater Treatment Method No. of sites
Land disposal 4
Dissolved air flotation followed by land disposal 1 1
Dissolved air flotation followed by aerobic treatment 1
Aerobic biological treatment only 1
Anaerobic / aerobic biological treatment 1
Discharge to river or sea 1 1
Discharge t o municipal treatment system 6
Application of high strength waste to land 14
The readily biodegradable nature of dairy processing wastewaters means that they -are
amenable to biological treatment and due to the high initial oxygen demand, high rate /
short hydraulic residence time systems can be used, as long as a longer sludge age is
employed to degrade the non - soluble milk derived material such as milk fat. Of the
commonly employed aerobic biological treatment options, activated sludge requires the
shortest hydraulic residence time and therefore a smaller space requirement than the
currently used aerated lagoon configuration.
2.4 Activated Sludge Treatment
The activated sludge process has been used for many years, being first d�veloped by
Ardem and Lockett in England in 1914 (Metcalf & Eddy, 1991). Activated sludge (AS)
treatment systems utilise a high concentration of suspended biomass in the form of
flocculated microorganisms or 'floes'. The conventional system configuration is
comprised of an aeration tank followed by a settler for the gravity separation of biomass

10
floes from the liquid to produce a clarified effluent. The floes are recycled to the
aeration tank to maintain elevated concentrations of biomass, generally resulting in a
mixed liquor suspended solids level of between 1500 and 8000 g.m-3 (Marshall and
Harper, 1984; Metcalf and Eddy, 1991), which allows for more rapid biodegradation
and a smaller sized treatment plant. This type of treatment process also allo�s �or
variation between the time spent by solid and liquid phases in the system.
Influent
1
Reactor
. . . . . . . . . . . . . . . . Air
...
Return Activated Sludge
Figure 2.1: Activated Sludge Process Schematic
1 Effluent
Waste Activated S ludge
The conventional AS system configuration has been modified in a variety of ways to
either overcome problems such as poor solids settling due to sludge bulking, or to
achieve additional or enhanced treatment performance, such as biological nutrient
removal (Metcalf and Eddy, 1991 ). Types of modified AS configurations that have
been utilised for the treatment of dairy processing wastewaters include: fill and draw,
high rate, extended aeration, contact stabilisation and deep shaft (Marshall and Harper,
1984).
The use of activated sludge to treat dairy processing wastewaters has resulted in
efficient removal of organic matter, with removals of up to 99% of the influent BOD
being reported (Marshall and Harper, 1984; Fang, 1990); although Jones ( 1974) ana
Hung (1984) reported that effluent BOD concentrations of below 30 g.m-3
were difficult
to consistently achieve. Orhon el af. ( 1993) achieved similar results but found that the

1 1
effluent sCOD was due to the fonnation of soluble microbial products rather than residual undegraded substrate components.
2.4. 1 Biomass Characteristics in Activated Sludge Systems ;
The operability of an activated sludge system is most often limited by the physical characteristics of the biomass, in particular sludge settleability. The biomass exists in a flocculated fonn in activated sludge systems, as cell aggregates connected by an exopolymer gel consisting of generally proteins, polysaccharides and DNA (Urbain et
al. , 1 993; Jorand et al., 1 995). The sludge settleability is related to the size and density of the flocs, which can be affected by biomass composition, filament abundance or the mass and type of polymeric substances present; and is generally measured as initial settling velocity (ISV); zone settling velocity (ZSV); or as sludge volume index (SVI) which is usually detennined as diluted (DSVI) or stirred (SSVI) sludge volume indices (Hultman et al., 1 99 1 ; Catunda and van Haandel, 1 992; Jenkins et al. , 1 993).
Adamse ( 1 968a) identified the main bacterial flora of an dairy processing wastewater activated sludge biomass to be corynefonn bacteria, Psuedomonadaceae and Achromobacteraceae. The biomass had a brown / orange colour which was attributed mainly to the presence of Flavobacterium sp.
2.4.2 Substrate Characterisation for Activated Sludge Treatment Systems
Wastewaters to be treated by activated sludge type treatment systems are currently commonly characterised with respect to biodegradablity and microbial response rather than the chemical composition of its constituents. This form of characterisation was first proposed by Dold et al. ( 1980); and was further developed in computer modelling developments such as the IA WPRC Activated Sludge Model No. 1 (Henze et al. , 1987)
and IA WQ Activated Sludge Model No.2 (Henze et al., 1 995).
Initially four categories were proposed: soluble readily biodegradable (8s); soluble inert (SI); particulate slowly biodegradable (Xs); and particulate inert (XI) material. However, this has since been further refined by dividing the degradable material into three fractions: Ss as before; rapidly hydrolysable (SH) and slowly hydrolysable (Xs) material (Sollfrank and Gujer, 1 99 1 ). The SH fraction was previously included in the initial definition of Xs due to its degradability rather than its physical form. The Ss and

1 2
SH fractions are physically ' soluble' and the Xs 'insoluble' as defined by molecular size
or filtration tests (Henze, 1 992; Henze et aI. , 1 994). The nitrogenous fractions of a
wastewater have also been characterised due to biodegradability, using similar
classifications as those adopted for carbonaceous substrate.
The types of compounds that constitute the various degradable fractions of a substr�te
have been outlined predominantly for municipal wastewaters (Henze, 1 992; Henze et
aI. , 1 994), from a knowledge of the classes of compounds involved and their molecular
weight. The Ss fraction is comprised predominantly of volatile fatty acids (VF As); the
SH fraction of higher VF As, simple carbohydrates, lower alcohols and amino acids; and
the Xs fraction of higher carbohydrates, proteins and fats.
Some of the earlier methods proposed for the complete characterisation of a wastewater,
as outlined in Ekama et al. ( 1 986) and Henze et al. ( 1 987) have since been considerably
developed and refined. Many methods for determining the various biodegradability
fractions of a wastewater have been proposed, as summarised by Henze ( 1 992),
consisting of either batch or continuous tests with the wastewater and acclimated
biomass. The parameters that have been utilised for the detennination of wastewater
characteristics include: specific substrate components; soluble and total chemical
oxygen demand (COD); oxygen uptake rate (OUR), specific oxygen uptake rate
(SpOUR) and nitrate uptake rate (NUR).
2.5 Filamentous Bulking in Activated Sludge Systems
Although activated sludge treatment can result in a high quality effluent in tenns of low
levels of organic matter and suspended solids, there have been a very large number of
reports · of operational difficulties due to the proliferation of filamentous
microorganisms and the subsequent interference with biomass settling and recycling in
the system. Though a common problem, specific management strategies which prevent
the growth of filaments have been difficult to define, due to the wide range of causative
conditions proposed to result in their proliferation.

2.5.1 Causes of Filamentous B ulking
1 3
From the very large number of reports of filamentous bulking problems published, the
most commonly proposed factors influencing the growth of microorganisms include:
• reactor configuration :
• substrate type
• substrate concentration
• dissolved oxygen concentration
• availability of nutrients
• biomass age
• biomass concentration
• pH • temperature
The extent of filamentous growth and effect on sludge settleability is measured as the
Sludge Volume Index (SVI) of the mixed liquor, which is the volume that a unit mass
of mixed liquor solids occupies after a defined settling period. A bulking sludge is
characterised by a high SVI value, with SVls of greater than 1 50 ml.g- 1 being indicative
of filamentous bulking, and increases in SVI having been found to reflect increases in
filament abundance (Palm et aI., 1 980; Strom and Jenkins, 1 984; Surucu and Cetin,
1 990; Jenkins et al. , 1 993).
2.5.1 . 1 Influence of substrate on filamentous bulking
Both the substrate type and concentration have been proposed to influence the ability of
filamentous microorganisms to proliferate in an activated sludge system. The influent
carbonaceous substrate is generally a combination of soluble and particulate substrates,
with the extent of each form present considered to have an influence on the tendency for
a system to bulk (Wanner, 1 994).
Low molecular weight substrates, such as simple sugars are readily biodegradable as
they can be directly utilised by microorganisms. Wastewaters with a high carbohydrate
substrate fraction are commonly reported to have resulted in bulking (Rensink, 1 974;
Chudoba, 1 985a; Strom and Jenkins, 1 984; Jenkins et al. 1 993 ; Wanner, 1 994); and
dairy processing wastewaters or lactose containing substrates have often been
specifically cited as being problematic (Adamse, 1 968a; Adamse, 1 968b; Jones, 1 974;
Rensink, 1 974; Van den Eynde et al. 1 982; Marshall and Harper, 1 984; Strom and

14
Jenkins, 1984; Chudoba, 1985a; Goronszy et al. 1985; Hoffman, 1987; Rensink and
Donker, 1990).
Higher molecular weight substrates are more slowly degraded and often particulate in
nature, but have also been implicated in the growth of filamentous microorgani�m�.
The modelling of filamentous bulking on particulate substrates usually assumes that the
hydrolysis products of particulate substrates are released back into solution where they
are available for consumption by filamentous organisms (Henze et al., 1987). This
implies that particulate substrate can be a supply of soluble substrate for the filaments
via hydrolysis products (Wanner and Novak, 1990; Albertson, 1991; Wanner, 1994),
which may result in bulking. As bulking is not always observed when the substrate has
a significant fraction of particulate matter, a second theory proposes that the readily
biodegradable hydrolysis products remain on the floc surface and are therefore n6t
made available to filaments (Wentzel el aI. , 1992); or that the availability of such
products in bulk solution to filaments is limited (Gujer and Kappeler, 1992).
The origin of the wastewater will also influence availability of inorganic nutrients,
particularly N and P, which have been known to affect bulking. It is not only the
concentration, but also the fonn of nutrients present that is of importance (Jenkins et al. ,
1993) as it is the fraction of bioavailable N and P that is criticaL Adamse ( 1968a,c)
proposed that the combination of a readily biodegradable C source in the fonn of
lactose and less degradable N source in the fonn of milk proteins can cause problems.
The substrate concentration has also been indicated as affecting filament growth
(Chudoba et al., 1973b; Hoffman 1987; Albertson, 1991; Jenkins et al. , 1993).
Filamentous bulking is commonly reported in .systems with low FIM ratios, or in
completely mixed AS systems which maintain a low substrate concentration in bulk
solution at all times; although some CSTR systems have been reported that did not bulk
below a critical substrate loading (Rensink, 1974; Lee et al. , 1 982). It is the
concentration of soluble degradable substrate in particular that has been found to be
important, with a relationship commonly reported between SVI and the maximum
concentration of sCOD that the biomass is exposed to (Chudoba et al. , 1973b; Chudoba,
1985a).

1 5
2.5. 1 .2 Influence of reactor conditions on filamentous bulking
The dissolved oxygen (DO) concentration in the various zones of a reactor system has
been found to affect filamentous growth, with low DO often reported as promoting
some fi lament types. Chudoba ( 1 985a) proposed that the aeration tank DO must be
kept above 2mg/1 to keep the floes aerobic, otherwise only the protruding filaments
would see aerobic conditions. Palm et al. ( 1 980) deduced that the required DO
concentration depends on the substrate loading and listed various DO l imits for a range
of Food : Microorganism ratio (FIM) conditions. However, the presence of aerobic
reactor conditions has not been found to be essential, as Wanner et al. ( 1 987) ran an
anoxic CSTR without an aerated stage which still maintained control over filament
growth, although it did result in dispersed floes. Higher organisms such as rotifers and
cilitated protozoa also disappeared in the totally anoxic system.
The use of plug flow reactors or reactor configurations which result in a substrate
gradient have been shown to result in a more well settling biomass than that from a
completely mixed reactor receiving the same influent (Chudoba et aI. , 1 973a; Chudoba
et aI. , 1 973b; Rensink, 1 974; Azimi and Horan, 1 99 1 ) . Some authors have illustrated a
relationship between the Dispersion Number through the system and the resultant
biomass SVI (Chudoba et al. , 1 973b; Salmeh and Malina, 1 989). The use of a batch
feeding regime can also be used to introduce a substrate gradient in a CSTR system and
prevent filament growth (Rensink, 1 974; Houtmeyers et al. , 1 980; Van den Eynde et
al. , 1 983; Chiesa et aI. , 1 985; Goronszy et aI. , 1 985).
The use of a substrate gradient in the system exposes the floc to an initially higher
substrate concentration, with lower SVIs resulting from higher substrate floc loadings in
. the first selector compartment (Chudoba et al. , 1 973b). However, high floc loadings
have also been found to result in the promotion of filament growth, with Chudoba et al.
( 1 974) determining a loading limit of 0.5 g BOD .g ML VSS-1 .d-1 above which bulking
occurred.
2.5.1.3 Identification of Causative Filamentous Microorganisms
Due to difficulties in isolating and identifying individual bacterial species from the
activated sludge biomass, filamentous microorganisms have been classified due to
morphological characteristics and staining reactions in the mixed culture. This
classification system was first proposed by Eikelboom ( 1 977) and has been further

1 6
developed into comprehensive keys such as that stated in Jenkins et al. ( 1 993) and
WPCF (1 990). Many of the filaments identified are classified by 'type number' rather
than genus and species, and it has been found that the occurrence of a specific type can
often be related to various operating conditions. Therefore identification of the
causative organism may be of use in identifying a successful bulking control strategy.;
Strom and Jenkins ( 1 984) grouped the filaments according to growth environment as
either low organic loading, low DO, or low inorganic nutrient; as well as summarizing
those commonly due to various specified substrate types such as food processing,
pulp/paper or chemical wastewaters. Further examination of filament growth
requirements led Wanner and Grau ( 1 989) to propose three classes of bulking
microorganisms, which have been further refined to four classes by Jenkins et al. ( 1 993)
as listed in Table 2.2. Jenkins et al. ( 1 993) also devised control strategies after
categorising the main causes of bulking as either: nutrient deficiency; low DO; aeration
basin configuration, or feeding strategy.
Filaments that have been specifically associated with dairy processing wastewaters
include: Nocardia (Strom and Jenkins, 1 984); Type 0092 (Eikelboom, 1 977; Strom and
Jenkins, 1 984;); Haliscomenobacter hydrossis (Eikelboom, 1 977); Type 02 1 N
(Eikelboom, 1 977); Type 0041 (Eikelboom, 1 977); Sphaerotilius natans (Adamse,
1 968b; Van den Eynde et aI. , 1 982; Rensink and Donker, 1 990); Leucothrix sp. (Van
den Eynde et ai. , 1 984a); and Nostocoida limicola (Van den Eynde et al. , 1 984a).
2.5.2 Control of Filamentous Bulking
The two mam approaches to control filamentous bulking are to either inhibit all
biomass growth in a non-specific manner, or to specifically suppress the growth of
filamentous microorganisms. Non-specific control measures usually involve dosing the
mixed liquor with a biocidal chemical such as chlorine or hydrogen peroxide (Jenkins et
al. , 1 993). By carefully controlling the dose rate, protruding filaments will be affected
to a greater extent than the floc formers.
Specific control of filamentous bacteria involves altering the growth conditions in the
reactor system so as to confer a selective advantage on the floc forming fraction of the'
popUlation. This results in the bulking microorganisms being unable to compete for
substrate, therefore filament abundance in the mixed liquor will decline and their future

17
proliferation wi ll be p revented. Sp ecific control is generally i mp lemented by i mp osing
carefu ll y controll ed environmental condi tions for substrate removal.
Table 2.2: Categorisation of filaments as proposed by Jenki ns et at. (1993):
.
Requisite conditions Control strategy M aj or typ es
Group I: L ow DO oxi c zone growers
- range of SRT - aerobic / anoxic or s. natans,
- low DO anaerobic selectors Type 1 70 1 ,
- readily degradable - i ncreased DO H hydrossis
substrate - increased SRT
Group II: Mix otrophic ox ic zone growers
- mid to high SR T - aerobic / anoxic or Typ e 02 1 N,
- readi ly degradable anaerobi c selectors Thiothrix sp.
substrate - increased nutrients
- nutrient deficient
Group III : Other oxic zone growers
- mid to high SRT - aerobic / anoxic or Type 185 1,
- readily degradable anaerobic selectors N limicola
substrate - reduced SRT
Group IV: Aerobic, Anoxic, Anaerobic zone growers
2.5.2.1
- nutrient removal - stage the aerobic zone Types 004 1 , 0675
systems - maintain uniform DO and 0092,
- high SRT in aerobic zone MparviceUa
Use of a Selector Reactor to Suppress Filamentous Organism Growth
From observations of bulking and non-bulking activated sludge systems, it has been
proposed that in order to provide conditions that favour the growth of floc fonners, a
concentration gradient must be imposed. This may be accomplished by using an

18
intennittent feed regime, o r In co ntinuo usl y fed systems by using a plug flow
co nfiguratio n or a sel ector reactor (Wanner, 199 4). A ' sel ector' can be defined as the
inl et part of the reacto r system in which higher co ncentratio ns of substrate are
maintained in order to support the growth of faster growing flo c fonners and to
suppress the growth of slow growing fil aments (Chudoba, 19 85a) . :
The success of the co ncentratio n gradient in the preventio n of fil amentous growth has
been attributed to fil aments generall y having a lower maximum specific growth rate
(�MAX) and substrate half saturatio n co -effi cient (Ks) than floc fonners. This ' kinetic
sel ectio n theory' was first presented by Chudo ba et af. (l 9 73b) and has been
experimental l y verified by a number of researchers (Van den Eynde et aI. , 1983;
Chudo ba et aI. , 1985a; Chiesa et al. , 1985; D aigger et al. , 1985; van Niekerk et al.,
1987b; Chudoba et af. , 1991). Sel ectors are therefore used to al ter the F 1M ratio, o r
substrate concentratio n experienced by the mixed l iquo r when it first co mes into co ntact
with the wastewater, pro viding an enviro nment which ca n sel ect for the growth of
o rganisms which grow fastest at increased substrate co ncentratio ns.
The kinetic selection theory woul d explain the abil ity of filaments to dominate under
conditions of low o rganic loading, however to expl ain the o ccurrence of bulking also at
high organic loadings, Chiesa and Irvine (1985) proposed that �MAX and Ks of floc
fonners was DO dependent. They proposed that there was a third type of micro
organism - a fast growing, starvation susceptible filament which had a �MAX and Ks that
was higher than that of the floc fonners under low DO conditions. The kinetic selection
theory is therefore useful in the inhibition of low F/M type fil aments, although . other
types of filaments may require different strategies (Chudoba and Pujol, 1994).
Generally the propagation of filaments proceeds faster than their suppression (Chudoba
et af. , 1 973b; van Niekerk et al. , 1988) with selection of floc fonning microorganisms
and a return to non-bulking conditions commonly taking three SRTs or longer (Linne
and Chiesa, 1 987; van Niekerk et al. , 1988; Sal ameh and Malina, 1989; Foot, 1992;
Pujol and Canler, 1 994). The use of shorter SRTs also results in lower MLSS
concentrations, and therefore generally higher substrate lo ading rates and bulk DO
levels which favo ur floc formers. It was o bserved by van Niekerk et al. ( 1988) that the
SVI continued to increase for up to 1 SR T after the instal latio n of an appropriately sized
selector, before the desired reduction was o bserved.

1 9
2.5.2.2 Requirements for selector type and configuration
Bulk conditions in the selector zone can be maintained in either an aerobic, anoxic or
anaerobic state. A commonly reported selector type is an aerated selector (Chudoba et
at. , 1 973b; Daigger el at. , 1 985; Daigger and Nicholson, 1 990) and is teqned a 'kinetic
selector' due to the relative abil ity of different microorganisms present to rapidly
accumulate and store substrate being the sole selection criteria.
Anoxic selectors have been used successfully to suppress bulking (Hoffman, 1 987;
Wanner et af. , 1 987 Shao and Jenkins, 1 989; Brenner and Argaman, 1 990b; Foot,
1 992); particularly that due to Type 02 1N and S. natons. Wanner et of. ( 1 987) found
that filamentous cultures had rates of nitrate utilisation that were an order of magnitude
lower than non-filamentous mixed cultures and concluded along with others (Shao and
Jenkins, 1 989; Brenner and Argaman, 1 990b) that some filamentous microorganisms
did not have the ability to denitrify and were therefore unable to use substrate under
anoxic conditions, or could only partially denitrify nitrate to nitrite (Shao and Jenkins,
1 989; Casey et of. , 1 994).
Casey et oZ. ( 1 994) found that bulking in anoxic selector systems was related to nitrate
and more particularly, nitrite concentrations leaving the anoxic selector zone. It was
hypothesized that floc formers would be inhibited in subsequent aerobic stages by the
presence of intracellular nitrification intermediates, while the filaments which c0l,11d
only de nitrify to nitrite were not affected.
The use of anaerobic selector in a full scale application was reported by Daigger and
Nicholson (1 990) and on a laboratory scale by Wanner and Novak ( 1 990). Daigger and
Nicholson ( 1 990) compared the performance of several full scale plants with differing
selector types and concluded that rather than selector. type, the success of a particular
configuration was dependent on aeration in the main reactor and the extent of substrate
storage as compared to oxidation in the selector zone. Both anoxic and anaerobic
selectors are termed 'metabolic selectors' as they select for the ability of the- - . .
microorganisms to denitrify or accumulate phosphorus respectively, in addition to the
substrate affinity or 'kinetic' selection imposed due to the ' feast / famine' conditions
(Jenkins et oZ. , 1 993). The added advantage of these type of selectors is therefore the
incorporation of a biological N or P removal step in the activated sludge process.
Even though the selector may be aerated and have appreciable DO in bulk solution,
Albertson ( 1 99 1 ) suggested that at high selector FIM ratios (>3kg/kg.d) floc centres are

20
likely to be devoid of either O2 or NO) and therefore experience anoxic or anaerobic
conditions respectively, a situation that was also proposed by Hoffman ( 1 987). This
could result in aerobic, anoxic and anaerobic metabolisms active simultaneously in
various regions of the same reactor zone (Jenkins el aI. , 1 993).
The reactor configurations employed have been as varied as the selector types. The u'se
of a single selector reactor has been commonly reported (Daigger and Nicholson, 1 990;
Foot, 1 992; Pujol and Canler, 1 994); however serial selector configurations have also
been frequently utilised as this configuration would have a greater capacity to handle
variations in the influent flowrate and substrate concentration (Van den Eynde el aI. ,
1 984a; Chudoba el al. , 1 973b; Daigger el aI. , 1 985; Hoffman, 1987; van Niekerk el al. ,
1 988; Linne el aI. , 1 989; Salmeh and Malina, 1 989). The use of serial selectors is also
more desirable for aerobic selectors, where kinetic mechanisms provide the sole basis
for microbial selection (Jenkins el al., 1 993; Wanner, 1994), due to the ability of such a
configuration to maintain a concentration gradient even under varying substrate
conditions.
The residence time in the selector zone is relatively short, with residence times for
aerobic selectors of 1 1 to 1 5 minutes commonly used (Daigger and Nicholson, 1 990;
Linne et al. , 1 989; Daigger et al. , 1 985), but of up to 25 minutes also reported (van
Niekerk et aI. , 1 988). Longer residence times of between 25 and 40 minutes are
generally employed for anoxic selectors (Shao and Jenkins, 1 989; Foot, 1 992), and
durations of up to 99 minutes reported for anaerobic selectors (Daigger and Nicholson,
1990). Lee et ai. ( 1 982) proposed that the fraction of system volume in the selector
zone should form the dominant design parameter, with Vlolal / Vseleclor values of greater
than 40 necessary for successful operation, however Wanner ( 1 994) suggests that values
of 1 0 should be sufficient.
2.5.2.3 Requirements for selector substrate concentration
To be effective the selectors must maintain a sharp concentration gradient in the system,
imposing higher F 1M ratios in the selector zone than in the main aerated reaction zone
(Linne and Chiesa, 1 987; Albertson, 1 99 1 ) ; usually with a greater gradient being
reported as providing better suppression of filamentous growth (Chudoba et aI. , 1 973b;
Hoffman 1 987). The substrate gradient also results in high oxygen uptake rates (OURs)
in the initial selector zone (Chiesa et aI. , 1 985; Linne and Chiesa, 1 987; Linne et at. ,

2 1
1989); with values as high as 60 mg02.gMLVSS-I .h- 1 being reported (Daigger e t aI. ,
1985).
The substrate removal requirement for successful selector operation depends on the
substrate type, with the most important fraction being the soluble readily biodegradable
substrate. A considerable level of removal is required to prevent significant quantities
of substrate entering the reactor zone, to prevent the growth of microorganisms with
low IJ.MAX and Ks values.
Some researchers have defined successful selector performance in terms of degradable
COD concentration exiting the selector zone, with Chudoba et al. ( 1985a) stating that
this must be less than 30 g.m-3 to give biomass SVI values of less than 100 ml.g-I . Shao
and Jenkins (1989) proposed a limit of less than 100 g.m -3 sCOD, with an additional
requirement of less than 1 g.m-3 of readily biodegradable sCOD (RBCOD) leaving the
selector zone.
Other researchers have stated limits in terms of fraction of substrate removal in the
selector zone, with . recommendations of the extent required for the successful
suppression of bulking varying widely. Suggestions have ranged from at least 60%
(Linne et al. , 1989; Daigger and Nicholson, 1990); to at l�ast 80% (Foot, 1 992); to
greater than 90% of soluble organics removed in the selector zone (Linne and Chiesa,
1987).
The contact time in the selector must be sufficient to allow the f<?quired substrate
removal to be achieved, with recommended contact times varying between 1 0 and 18
minutes in aerobic selectors; 10 to 30 minutes in anoxic selectors; and 30 to 60 minutes
or longer in anaerobic selectors as summarised by Wanner ( 1994). Residence times in
anoxic and anaerobic selectors may be greater than that necessary for substrate removal
alone due to nutrient removal performance requirements. Due to the added metabolic
selection pressures in these types of selectors, the contact time is less critical than for
aerobic selectors which rely solely on kinetic selection (Jenkins et al. , 1 993; Wanner, . _ _
1994).
Substrate loadings in the first selector are usually reported as a FIM ratio, with values of
up to 7.2 gBOD.gMLSS·1 .d- 1 used (pujol and Canler, 1994) although 3 to 5
gBOD.gMLSS-1 .d- 1 are generally recommended for design (Wanner, 1 994). Lower
selector . FIM ratios, from 3 gBOD.gMLSS·1 .d-1 (Foot, 1 992) down to 0.7
gBOD.gMLSS-1 .d- 1 (Daigger and Nicholson, 1990) were possible when anoxic or

22
anaerobic selectors were used due to the additio nal selective pressures affo rd ed by these
systems.
The requirements for bo th high substrate co ncentratio n gradients and high substrate
remo val efficiencies in the sam e selecto r zo ne rep resent co nfl icting conditio ns,
particularly when a single selecto r co nfiguration is emplo yed. Patoczka and
Eckenfelder ( 1990 and 1991), developed a model fo r op timising selector design and
suggested that the best recycle rate is that which results in a substrate co ncentratio n in
the selector equal to 50% of the infl uent co ncentratio n. Wanner (1994) reco mm ends a
recycle rate of less than unity in o rder to m aintain the necessary selective p ressures.
2.5.2.4 Substrate removal mechanisms in Selector Reactor Configurations
S electo r reactor co nfigurations pro vide a zo ne of high floc lo ading fo llowed by a 10!1ger
period of aeratio n with little or no residual substrate in solutio n, resulting in different
substrate removal m echanisms to those exhibited in CSTR co nfiguratio ns. Substrate
removal by biosorptio n has been commo nly documented (Marshall and H arper, 1985;
Chiesa et al. , 1985; Go ro nszy and Eckenfelder, 1986; B unch and G riffin, 1987;
Hoffman, 1987; Kohno et a/., ] 991; Rensink and Donker, 1991; Eckenfelder and G rau,
1992; Pujol and Cant er, 1992) especially for modified activated sludge systems that
incorpo rate selecto r reactors or intennittent feeding patterns. Substrate removal is
proposed to involve adsorptio n o nto the cell surface, transport across the cell w all,
accumulation and co nversio n into storage compounds.
Evidence for substrate accumulatio n and storage has be<:: n o btained from monitoring the
changes in substrate co ncentration and respiration rates in the selector zo ne. It has been
found that substrate was removed from bulk solution soo ner than the OUR had declined
to a stable level (Chudoba et af. , 197 3; Chudo ba et af. , 1982; Chiesa et af. , 1985;
Goro nszy et af. , 1985; Shao and J enki ns, 1989). L inne et af. (1989) found that less than
20% of the system O2 requirement was used in the selector zo ne indicating that
substrate uptake and o xidatio n pro cesses were no t coupled, an effect also o bserved by
Chudoba et af. ( 1991). Further evidence was reported by Van den E ynde et af. (1984b)
who measured instantaneo us substrate absorptio n amounting to 7 m g of glucose p er g
MLVSS.
The rate of substrate removal from bulk solution via biosorption has been observed as
rapid, usually being completed withi n 5 to 15 minutes of contact with the biomass

2 3
(Chiesa et af. , 1985; Eckenfel der, 1987; Eckenfel der and Grau, 1992 ) . The biosorption
abil ity of biomass has been positivel y correl ated to the substrate loading experienced
(Rensink and Donker, 1991; Novak et af. , 1995) up to a maximum of 0. 5 gCOD.gVSS-1
(Puj ol and Canler, 1992 ) .
.
The period of in itial biosorption is followed by a period of first order substrate removal,
al though Grau e/ al. (1 975) and van Ni ekerk e/ al. (1987a) propose that this i s actual ly a
' pseudo' first order effect resulting from the summation of different zero order removal
rates for each of the individual substrate components. Low SV I sludges have been
shown to exhibit higher specific OURs and first order substrate removal rates
(Houtmeyers et af. , 1980; Chiesa et af. , 1 985; van Niekerk et al., 1987b; Chudoba et al. ,
1991). Chiesa et al. (1985) found that bulking sludges did not exhibit an initial period
of biosorption, however Pujol and Canler (1992 ) detected filamentous· populations
exhibiting higher biosorptions than non-fil amentous ones. Andreadakis and
Chatj ikonstan tin ou (1994 ) demonstrated simil ar substrate removal curves under anoxic
conditions and concluded that simil ar substrate accumulation and storage effects
occurred with nitrate as with oxygen as the electron acceptor.
Chudoba et af. (1982) proposed a model for substrate accumulation and storage,
defining the accumulation capacity (AC) as the q uantity of substrate which can be
accumulated per unit weight of cells, and found that with glucose as a substrate, AC' s
0.3 to 0.4 gig could be measured. I t was also proposed that the i ni ti al FIM rati o would
indicate whether cell replication could be expected to occur. With systems having� an
initi al F 1M ratio below 2, the main synthesis products were accumulation and storage
compounds, but if the F 1M was greater than 2 , then cell replication occurred before the
removal of exogenous substrate was completed.
Req uirements determined for substrate accumulation included the presence of a sui table
concentration gradient and of a regeneration period for accumulation c apacity (AC)
restoration, with at least 50 % of the substrate removed needing to be oxidised if a low
SVI was to result (Chudoba et al. , 1 982). D uring the regeneration period accumulated ·
substrate was oxidised and storage compounds produced, resulting in the regeneration
of accumulation capacity, the extent of which could be tracked using respiration rate
measurements. Drtil et al. (1993) determined that the regeneration phase m ay be
equ ally accomplished under either aerobic or anoxic c onditions. If the reg en eration
period was long enough to restore the ACs of all th e spec ies in the mix ed culture, then
the predominant species would be that with the highest capacity for and rate of substrate
accumulation, and generally fl oc formers have been found to possess a higher AC than

2 4
filaments (Chudoba et aI. , 1982 ; Van den Eynde el aI. , 1983 and 1984b; Chudoba
1985 a).
The p eriod of aeration without exogenous substrate also aids in the selection against
microorganisms without biosorp tion ability, as these sp ecies wil l starve in this ' famine'
phase of feast / famine environments (Verachtert et aI. , 1980) . In general , fil�e�ts
have been found to more susceptibl e to starvation than fl oc formers (Cheisa and I rvine,
1985 ; Chiesa et a/. , 1985 ) .
2.6 Measurement of Biokinetic Parameters in Activated Sludge
In order to characterise an activated sl udge biomass and to design a ful l scal e treatment
system, estimated val ues for the kinetic param eters of biomass growth and decay need
to be obtained.
Growth rates of microorganisms, including mixed cul tures used in w astewater treatment
are commonly described by Monod typ e kinetic expressions where the characteristic
p arameters are a maximum specific growth rate (J.1MAX ) and substrate affinity in tenns
of a half saturation co-efficient (Ks) . Methods for the measurement of parameters J.1MAX and Ks vary from direct measurement of microbial growth (Peil and G audy, 1 97 1 ) to
the use of surrogate growth measures such as oxygen consumption or substrate removal
(William son, 1 975; Cech et ai, 1985 ; G audy et aI. , 1987; G rady et al., 1 989; Kappeler
and G uj er, 1992). The various means of determination have included both batch and
continuous tests; monitoring changes in characteristics such as suspended solids,
turbidity, dissolved oxygen and substrate components. D ecay rates are generally
detennined using a batch test conducted over a p eriod of several days (Marais and
Ekama, 1 976; H enze et al. , 1 987).
As well as defining system design aspects such as solids residence time and sludge
production rates, kinetic p arameters are also of interest due to the variations that have
been attributed to the dominant microorganism type present and reactor configuration
i mp osed. The differences in J.1MAX and Ks between fl oc forming and filamentous
bacteria has already been mentioned in Section 2. 5. 2. 1. D ifferences in biomass decay·
rates have been observed for differing AS configurations, with Shao and Jenkins ( 1 989)
finding decay rates for selector systems lower than for comparable CSTR systems.
Rates of 0. 1 1 d-I were measured in conventional AS systems, with a lower rate of 0.063

25
d-I recorded for biomass from biological nutrient removal (BNR) systems (McCl in tock
el ai. , 1 993).
2.7 Nutri en t R e m oval in Activated Sludge Systems :
I n conventional activated sludge reactor systems, nitrogen and phosphorus removal
from the infl uent stream occurs only to the extent necessary to satisfy biomass growth
requirements. B iomass N contents that have been measured in activated sludge systems
include: an average of 9.8% of VSS during both conventional and B NR systems
(McClintock et ai. , 1 993); and ranging between 8 .7 and 1 0.2%, with an average of 9.7%
in long SRT conventional AS experiments (Suwa et af. , 1 992). T hese measured values
are lower than the empirical value of 12 . 4% proposed in M etcalf and Eddy ( 1 99 1 ) . The
normal P content of biomass is considered to rang e from 2 to 3% (Tetreault et ai., 1 986;
Y oeman et al., 1 988b).
2.7. 1 Nitrogen removal in Activated Sludge Systems
The removal of substrate organic nitrogen I n activated sludge is a staged process
requiring a variety of microorganisms and environmental conditions. The steps
involved include: am monifi cation, the conversion of organic nitrogen compoun ds such
as proteins to ammonia; nitrifi cation, the conversion of ammonia to nitri te and then
nitrate; and denitrifi cation, the conversion of nitrate to nitrogen gas. Activated sludge
systems are able to be modifi ed so that the entire sequence of reactions occurs wi thin a
single sludge system (Henze, 1991; Metalf and Eddy, 1991).
2.7.1 .1 Ammonification
The fi rst stage of nitrifi cation, the conversion of organi c nitrogenous materials to
ammonia, is considered to be the rate limiting step in the reaction pathway and has been
determined to be a fi rst order reaction (Wong-Chong and L oehr, 1975) with an average
rate constant at 20°C and pH 6. 5 to 9.0 of 0.111 h-I , reaching a maximum 0[-0.240 h-1 at
pH 8.0. The rate of amm onifi cation measured was dependent on b oth the concentration
and form of organic nitrogen supplied.

26
2.7. 1 .2 Nitrification
Nitrification, the conversion of ammonia to nitrate, involves oxidation: firstly to nitrite
by Nitrosomonas sp. ; then to nitrate by Nilrobacter sp. , with the former reaction
generally considered to be the rate limit ing step (Wong-Chong and Loehr, 197_5 ;
Antoniou et af. , 1990; Stenstrom and Song, 199 1 ) although some researchers have
suggested otherwise (Munch et al., 1996).
Oxygen is required for the conversion of ammonia to nitrate and mtnte, with the
minimum DO levels recommended ranging between 0.5 and 2.5 g.m-3 under steady state
conditions, depending on mass transfer considerations in the flocs (Metcalf and Eddy,
1991; Stenstrom and Song, 199 1). Munch et al. (1996) determined a considerably
higher half saturation coefficient for nitrification of 4.5 g DO .m-3; stating that this vallie
would be a system constant and dependent on the floc size, mixing intensity and rate of
oxygen diffusion into the floes. Nowak et af. ( 1 995) found a decrease in the nitrite
oxidation capacity of activated sludge subjected to anaerobic conditions, whereas the
ammonia oxidation capacity remained constant.
Autotrophic nitrifiers have been found to require more favourable conditions than
heterotrophs, being less competitive under adverse conditions such as low DO
(Stenstrom and Song, 199 1). Temperatures of between 15 and 25 °C were found to best
support the growth and activity of nitrifiers (Antoniou et af. , 1990). A sludge age of
greater than 2.5 days also needed to be maintained to sustain a population of nitrifying
bacteria at 20°C (Argaman and Brenner, 1986; Azimi and Horan, 1991), with the SRT
requirement increasing at lower mixed liquor DO concentrations (Stenstrom and Song,
199 1). Nitrification efficiencies have been found to be greater in plug flow or selector
reactor configurations than in CSTRs (Chudoba et aI. , 1985; Linne et al. 1989; Azimi
and Horan, 199 1) and for longer SRTs when DO is limited (Stenstrom and Song, 1991).
Both the ammonia and nitrite oxidation reactions have been determined to be zero order
when the ammonia concentration is above 2 g.m-3 (Wong-Chong and Loehr, 1975;
Argaman and Brenner, 1986; Harremoes and Sinkjaer, 1 995); the ammonia oxidation
rate constant being a maximum at pH 7.5 to 7.8 (Wong-Chong and Loehr, 1975;
Antoniou et af. , 1990), while the nitrite oxidation rate constant increased up to a pH of
9. The optimum pH for nitrification has been variously reported to be between 7.5 and'
8.6 (Metcalf and Eddy, 199 1); and between 7.0 and 8.2, with a maximum at 7.9
(Antoniou e/ af. , 199 1). Alkalinity is required during nitrification, with values of 7. 14

27
to 8.64 g alkalinity. g NH3-1 reported (Argaman and Brenner, 1 986; Metcalf and Eddy,
1 99 1 ).
As the ammonium oxidation reaction is generally considered the rate l imiting step,
significant nitrite concentrat ions are not normally observed ; however the combination
of high pH and ammonium concentrations (Wong-Chong and Loehr, "1 915 ; Azimi and
Horan, 1 99 1 , Munch el ai, 1 996) or transient increases in the anunonia oxidation rate
(Stenstrom and Song, 1 99 1 ) have been suggested as being responsible for nitrite
accumulation in solution. The inhibition effect of ammonia was observed to be less in
reactors with a plug flow rather than a completely mixed reactor configuration
(Chudoba et al. , 1 985) suggested as being due to differences in the d istribution of
nitrifiers and mass transfer resistances through the floc structure.
A range of nitrification rates have been measured in practise with Argaman and Brenner
( 1 986) having recorded a specific nitrification rate of 2.3 gN.gML VSS-I d- I ; and Metcalf
and Eddy ( 1 99 1 ) of between 0.05 and 0.6 gN.gMLVSS- ld- l . Specific nitrification rate�
of between 1 .3 and 7.8 mgN.gMLVSS-lh- 1 were measured by McClintock et af. ( 1 993),
with the rate generally found to decrease as the SRT was increased.
2.7.1 .3 Denitrification
The removal of N from activated sludge systems occurs via the conversion of oxidised
N compounds to nitrogen gas. Denitrification proceeds in anoxic zones when a readily
assimilable carbonaceous substrate is present, with specific bacteria being able to utilise
nitrate as an electron acceptor during substrate removal, thereby reducing nitrate or
nitrite present in solution. Henze ( 1 99 1 ) reported typical effluent N concentrations of
between 6 and 1 0 gN.m-3 from biological N removal plants.
Denitrification occurs in activated sludge systems which incorporate anoxic zones.
These conditions can be specifically provided for in modified activated sludge system .
configurations, or can arise in inadequately aerated reactors (Suwa et al. , 1 992), or non
aerated zones such as the secondary clarifier (Cizinska et af. , 1 992; Henze et af. , 1 993;
Siegrist and Gujer, 1 994; Siegrist et ai. , 1 995). Denitrification in the secondary clarifier
can interfere with system operation by causing rising sludge, unless the effluent nitrate
concentration is kept below 6 to 8 gNOrN.m-3 (Henze et al. , 1 993 ; S iegrist and Guj er,
1 994).

28
Oxygen has been found to exert a negative influence on denitrification, (Henze et aI. ,
1 993); even at very low levels (Lie and Wei ander, 1 994). However, denitrification in
aerobic reactors has been recorded by Suwa et al. ( 1 992) when the bulk liquid DO was
maintained at above 3 g02.m,3, with the extent of N removal increasing as the COD:N
ratio was increased, due to the provision of anoxic regions within the flocs at hig�er
readily biodegradable COD (RBCOD) concentrations. Munch et al. ( 1 996) described
the effect of oxygen on denitrification using a Monod type expression and detennined
half saturation co-efficients of between 0.4 and 0.67 g DO.m,3. Denitrification also
results in the release of alkalinity, with measurements of 3 .57 g alkalinity. g NO)
removed' l being reported (Argaman and Brenner, 1 986).
Denitrification requires the presence of a carbonaceous substrate and the main factors
affecting N removal have been summarised as being the COD:N ratio, recycle ratio arid
aerobic volume fraction of the system (Brenner and Argaman, 1 990a). The presence or
addition of RBCOD has been found to result an immediate increase in the rate of
denitrification, with the type of substrate also affecting the resultant rate (Clayton et al. ,
1 99 1 ; Carucci et aI. , 1 996; Henze et aI. , 1 994; Siegrist and Gujer, 1 994; Isaacs and
Henze, 1 995). The mass of substrate required for denitrification has been measured as
6.0 to 6.7 g sCOD.gNOrN'1 (Shao and Jenkins, 1 989); and 7 to 8 gCOD.gN·1
(Argaman and Brenner, 1 986; Henze, 1 99 1 ; Siegrist and Gujer, 1 994; Wanner, 1 994;
Isaacs and Henze, 1 995).
The denitrification reaction has been reported as zero order with respect to both carbon
and nitrogen substrates (Suwa et aI. , 1 992; Carucci et aI. , 1 996); although Argaman and
Brenner ( 1 986) found that this was the case only when COD concentration was high,
otherwise denitrification was first order and governed by the COD removal reaction.
Clayton et al. ( 1 99 1 ) found the denitrification rate to be proportional to the active
fraction of the biomass, the rate remaining constant until RBCOD in bulk solution was
consumed. Carucci et al. ( 1 996) reported the use of endogenous or stored substrate for
denitrification, though at considerably lower rates than when a readily degradable C
source was supplied.
Denitrification rates reported include: up to 0. 1 1 gN03.gVSS, I .d, 1 (Argaman and
Brenner, 1 986); between 0.024 and 0. 1 2 gN03.gVSS, I .d, 1 on whey (Henze, 1 99 1 );
0.096 gN03-N.gVSS- 1d,1 (Wanner, 1 994); 0.075 to 0. 1 1 5 gNOrN.gVSS-1d-1 at 20°C;
with the denitrification rate decreasing as the sludge age increases (Metcalf and Eddy,
1 99 1 ); and from 0.25 gNOrN.gVSS-1d- 1 (Carucci et al. , 1 996) up to 0.48 gNO)
N .gVSS- 1d-1 when readily biodegradable substrate was used (Henze et al. , 1 994). Suwa

29
et al. ( 1 992) recorded an endogenous denitrification rate of 0.0 122 g oxidised
N.gVSS- 1d-\ while Carucci et at. ( 1 996) measured a higher rate 0.07 gNOrN.gVSS-1dI . Clayton el al. ( 1 99 1 ) found increased rates of denitrification in combined N and P
removal systems as compared to systems removing N only.
Although denitrification is said to require the absence of oxygen, while nitrification
requires the presence of oxygen, simultaneous nitrification and denitrification in the
same reactor zone has been suggested by Suwa et al. (1 992), and by Szpyrkowicz and
Zilio-Grandi ( 1 995a) and Munch et al. ( 1 996) during periods of low reactor DO. The
main explanations given were that low DO conditions would allow the interior of the
flocs to be anoxic while the exterior remains aerobic; or that dentrification enzymes
were only gradually repressed under continued aeration rather than immediately
inhibited by DO. Munch et al. ( 1 996) recorded a maximum specific denitrification rate
of 0.06 g N.gVSS- 1d- 1 under aerated conditions in a sequencing batch reactor, not
dissimi lar to the rates recorded by others under anoxic conditions.
2.7.2 Phosphorus Removal in Activated Sludge Systems.
Conventional activated sludge systems remove in the order of 10% to 40% of influent P
for normal biomass metabolic requirements (Yeoman el aI. , 1 988a; Metcalf and Eddy,
1 99 1 ), however additional phosphorus removal can be incorporated into activated
sludge systems by using either chemical or biological removal processes.
Methods for chemical removal of P include precipitation, either with: calcium salts,
usually lime, at a pH of between 8 and 11; iron (III) ions around pH 5.3 ; or aluminium
ions, usually added as aluminium sulphate at around pH 6.3 (Yeoman el al. , 1 988b;
Metcalf and Eddy, 1 99 1 ; Eckenfelder, 1 989). Precipitation within the activated sludge
system can also occur due to the presence of calcium and magnesium ions in solution at
a pH of between 7.5 and 8.5 . This P precipitation effect can be increased under
favourable conditions including increased P concentration provided by anaerobic p . _ .
release, or increased pH which can result from the occurrence o f denitrification.
(Tetreault et ai. , 1 986; Yeoman et at. , 1 988b; Szpyrkowicz and Zilio-Grandi, 1 995b)
The P content of activated sludge effluents can also be reduced by enhanced biological
phosphorus removal (EBPR), due to the activity of phosphorus accumulating organisms
(PAOs). It is generally considered that for biological P removal, the system must have
alternating anaerobic and aerobic zones with a readily degradable substrate present · in

30
the anaerobic zone. The PAOs can store low molecular weight fatty acids in the
substrate as cellular polyhyroxybutyrate (PHB), causing a release of phosphorus into
bulk solution, due to the degradation of stored polyphosphate (polyP) to provide energy
for PHB storage (Comeau et al. , 1 987). Under aerobic conditions the PAOs utilise the
stored PHB and remove phosphorus from bulk solution as polyP is resynthesised.
However recent studies (Knight et aI. , 1 995) indicate that synthesis of PHB and pol)'P
can occur under a range of environmental conditions and that the synthesis of both may
occur under the same conditions.
The bacteria responsible for such a metabolism are usually considered to be
Acinelobacter species, and in plants with EBPR, it has been claimed that up to 50% of
the heterotrophic biomass may be Acinetobacler species (Y oeman et al. , 1 988b),
generally found clumped together due to the presence of extracel lular material . The
ability of various Acinetobacler strains to accumulate polyP has been demonstrated to
be highly variable (Knight et al. , 1 995). Other researchers have found P accumulating
bacteria other than A cinetobacter to be present (Yoeman el al. , 1 988a,b), or dominant
(Kavaugh and Randall, 1 994; Szpyrkowicz and Zilio-Grandi, 1 995b) in EBPR systems,
including Aeromonas, Pseudomonas and Klebsiella species.
Conditions generally stated as being required for biological P removal include: an
anaerobic zone followed by an aerobic zone; the initial anaerobic zone to be plug flow;
anaerobic detention times of up to 12 hours or longer, although 1 to 2 hours is more
commonly used; COD: P ratios of greater than 1 00:3 ; a pH of less than 6 and the
absence of nitrates in the anaerobic zone; (Y oeman et al. , 1 988b). Conditions required
in the aerobic zone for optimum P uptake include: a pH of between 6 to 8 (Deineina et . 3
ai. , 1 985); a DO of between 2 to 6 g.m- ; and a temperature of between 20 and 3 0
degrees C. (Tetreault et aI. , 1 986; Yoeman et aI. , 1 988a,b; McCl intock et aI. , 1 993).
System SRTs of greater than 5 days with an aerobic SRT greater than 2 .7 days have
been found to be successful, with a further decrease in SRT reducing P removal
(McClintock et aI. , 1 993). Chudoba et al. ( 1 974) found that plug flow configurations
had a greater P demand than CSTR systems.
Several modified 'single sludge' activated sludge configurations have been developed to
enhance the maintenance of conditions required for EBPR. The most common of these
include the 'Bardenpho', 'UCT' and 'AlO' processes although numerous variants of these'
systems also exist (Tetreault et aI. , 1 986; Y oeman et aI. , 1 988b; Eckenfelder, 1 989;
Metcalf and Eddy, 1 99 1 ; Wentzel et aI., 1 992). All these systems feature alternating

3 1
anaerobic and aerobic zones, often with internal recycle to minimize the concentration
of nitrates in the anaerobic zone.
Biological P removal occurs due to the luxury uptake of P by cells, transferring the P
from influent substrate to mixed liquor biomass. Therefore P is r�m�ved from the
system in the wasted biomass which has an elevated P content. An activated sludge
biomass with more than 2% to 3% is generally considered to be due to luxury P uptake
(Tetreault et aI. , 1 986; Yoeman et af. , 1 988b) with biomass P contents as high as 1 1 %
having been reported (Appeldoorn et af. , 1 992). The highest possible P content is
dependent on the ratio of carbonaceous substrate to phospho.rus in the influent, as
sho.wn by Tetreault et al. ( 1 986) who. i l lustrated a decrease in sludge P content as the
influent sBOD:sTP ratio increased.
For efficient biological P removal and to obtain a final effluent with · a low final P
concentration, a relatively high COD:P ratio is required, reported as ranging from above
64 : 1 to above 1 00: 1 (Tetreault et af. , 1 986; Yoeman et ai, 1 988b; Szpyrkowicz and
Zilio-Grandi, 1 995a) . The overall substrate requirement for P remo.val has been
reported as 0. 1 gP per g influent RBCOD (Clayton et af. , 1 99 1 ) and P release in
resPo.nse to substrate uptake has been reported as 0 .5 gP.gCOD-1 (Mamais et al., 1 993;
Isaacs and Henze, 1 995) and 0.78 gP.g Acetate-1 (Co.meau et al. , 1 987).
The preferred substrates fo.r PAOs have been determined to be sho.rt-chain fatty acids,
alcoho.ls and lactic acids (Deinema el aI. , 1 985; Mino et aI. , 1 994; Knight et aI. , 1995)
and a high acetate:glucose ratio (Appeldoorn et aI. , 1 992). When comparing dissolved
and particulate carbo.n sources, ling et al. ( 1 992) found mo.re co.nsistent and greater P
removal when using gluco.se rather than starch, and that the type and cellular Io.catio.n o.f
P sto.rage co.mpo.unds also differed with substrate type. Wanner and Novak ( 1 990) alSo.
fo.und improved EBPR with soluble rather than particulate substrates. Heymann and
Po.tgieter ( 1 989) found that sewage substrates that were supplemented with milk protein
demonstrated impro.ved P removals, although lactose was also present in that substrate.
The anaerobic uptake o.f substrate in EBPR systems can also o.ccur due to. the presence. _
o.f co.mpeting non poly-P accumulating bacteria, termed 'G bacteria' (Cech and Hartman,
1 993), which predominated when glucose was present in additio.n to. acetate. P release
in the absence of readi ly degradable material has also been o.bserved (Carlsso.n et al.,
1 996)
. There is co.nflicting evidence o.n the effect o.f the presence o.f o.xidised N co.mpo.unds o.n
bio.Io.gical P removal . Previo.usly it has been generally accepted that the presence o.f

32
oxidised N inhibits P release due to denitrifiers competing successfully with PAOs for
substrate (Tetreault et aI. , 1 986); or PAOs being unable to store substrate under anoxic
conditions (Comeau et aI. , 1 987). Hoffman ( 1 987) and Appeldoorn et al. ( 1 992) also
demonstrated a negative effect, recording a reduction in biomass P content when reactor
nitrate and nitrite concentrations increased . However Isaacs and Henze ( 1 995) and
Chuang et al. ( 1 996) reported P release under anoxic conditions, and Gerber et al. ( 1 987) proposed that nitrate in the 'anaerobic' zone did not inhibit P release if the
concentration of short-chain fatty acids was high enough.
Tetreault et al. ( 1 986) found that for one particular operationally modified plant, the
initial stage was possibly anoxic rather than anaerobic, but that P removal stil l occurred
and suggested that if sufficient substrate was available (influent BOD:TP > 25) then
simultaneous denitrification and P release could occur, with denitrification occurring
outside the flocs and anaerobic conditions occurring inside the floc. However the
effluent nitrate concentration was sti ll positively correlated with effluent soluble P
concentration.
Szpyrkowicz and Zilio-Grandi ( 1 995a,b) found no influence of nitrate concentrations up
to 8gN.m-3 on P removal and further concluded that as the bacterial culture had not
changed during process start-up, that denitrifiers could also carry out biological P
removal. P release was also observed in anoxic zones when substrate was still available
in solution after a previous anaerobic stage (Isaacs et al. , 1 995), with anoxic P release
showing a greater dependence on the availability of substrate than denitrification rate.
Kenn-Jespersen and Henze ( 1 993), Barker and Dold ( 1 996), and Sorm et al. ( 1 996)
reported that some P accumulating bacteria were able to utilise nitrate as well as oxygen
as an oxidant, therefore indicating that the occurrence of P accumulation could be
accompanied by denitrification; although Knight et al. ( 1 995) found that Acinetobacter
strains could only reduce nitrate to nitrite, not to nitrogen gas. The effect of denitrifying
PAOs has also been included as a modification to the IA WQ Activated Sludge Model
No.2 (Henze et aI., 1 995) by Mino et al. ( 1 995) and Isaacs et al. ( 1 995), to account for
observations of decreasing phosphate concentrations under anoxic conditions.
The majority of the research into nutrient removal in activated sludge systems has been
progressed using domestic wastewater as a substrate, however the principles and
meachanisms discussed would also have relevance to dairy processing wastewaters due
to the biodegradability of carbonaceous substrates and similar origins of N and P
compounds in the wastewater as compared to domestic sewage substrates.

2.8 Proposed project.
33
From the previous studies of both laboratory and full scale activated sludge systems, it
can be concluded that the removal of substrate components including nutrients is highly
d ependent on the microbial species present in the activated sludge bio mpss , which i n
turn is dependent on the environmental conditions prevailing in the system. The
effectiveness of a treatment system, particularly with respect to operability and nutrient
removal was not easily defined and many of the reported findings confl ict in their
recommendations.
The objectives of the project were to define the critical operating parameters that would
result in the effective treatment of dairy processing wastewaters, where 'effectiveness'
of the system was assessed in terms of:
" removal of undesirable wastewater components: primarily carbonaceous substrate
fractions (cabohydrates, prote ins and fats); but preferably also removal of nutrients
(nitrogen and phosphorus).
• production of an effluent low in turbidity and suspended solids.
• biomass stability and robustness, development of a population with desirable floc
and hence sludge settleability characteristics.
• process operability, having a system configuration and operating strategy suitable
for large scale use.
The definition of a successful treatment strategy for dairy processmg wastewater
therefore was to be establ ished through a series of laboratory scale experiments with a
typical effluent. The means and extent of removal of substrate components was to be
monitored as well as the physical characteristics of the biomass, in order to define the
requisite environmental conditions for an effective and operable treatment system.

34
:

CHAPTER 3
METHODOLOGY FOR THE ANALYSIS OF
TREATl\1ENT SYSTEM: PERFO RMANCE -
3.1 I ntroduction
35
This chapter describes the methods and materials that were used for the determination
of parameters identified or measured in this study_ These methods were used to
characterise the reactor system performance and biomass present under varying feed
and reactor conditions.
3.2 Determination of Biomass Concentration.
The biomass concentration was measured as being equivalent to the volatile suspended
solids (VSS) concentration of the mixed liquor suspended solids. There was some error
associated with this assumption as not all the VSS present would have been due to
active biomass. As well as inactive or dead cells, the VSS measurement could also
include substrate derived material. The substrate to be used contained suspended
organic matter in the form of milkfat and milk proteins, which could be present in the
mixed liquor either in bulk solution, adsorbed onto cell surfaces, or enmeshed in
biomass floes.
As there was no rapid method that could be routinely used to distinguish between cell
derived VSS 'and substrate derived VSS, it was assumed for this study that the substrate
contribution to mixed liquor VSS was small and that all the VSS could be attributed to
biomass_ This may have lead to an overestimation in the value used for biomass '
concentration, affecting both the performance data and biokinetic constants calculated,
however results obtained during this study indicate that the above assumption did not
introduce significant errors.
The types of solids determinations that were carried out during this study included total
solids and suspended solids, both of the substrate and various reactor streams.

36
3.2. 1 Determination of Total and Volatile Suspended Solids
The total suspended solids (TSS) and volatile suspended solids (VSS) were determined
according to the procedure in 'Standard Methods' (APHA 1 992) Sections 2540D and
2540E. All analyses were performed in duplicate, with the average of the two values
taken as the result.
Specific materials and equipment used were:
1 . Analyses were carried out using glass fibre filters (Whatman, GFC, 4 .7cm
diameter filter circles).
2 . Filters were prepared by placing in a NEY M525 Series II muffle furnace at
525 (+1- 25) oC, for 20 minutes then cooled and stored in a desiccator
containing silica gel (BDH, Poole, England) until needed.
3 . Filters and dried residue were weighed on a Mettler AE200 balance to four
decimal places.
4. Filters were dried at 1 04 (+1- 1 ) oC in a Contherm Series Five oven, for
between one and 24 hoUrs.
5. Dried filters were cooled in a desiccator containing silica gel before being
weighed.
6. For VSS analysis, filters were ignited in the muffle furnace at 525 (+1- 25) oC,
for one hour, or until a stable weight was obtained.
7. TSS and VSS were calculated as fol lows:
where:
(B - A) x 1000 V
(B - C) x 1 000
V
A = Weight of fi lter (mg)
B = Weight of filter plus residue dried at 1 040C (mg)
(3 . 1 )
(3 .2)

C = Weight of filter plus residue after ignition (mg)
V = volume of sample (ml)
3.2.2 Determination of Total Solids
37
The total solids (TS) of the substrate was detennined according to the procedure in Section 2540B of 'Standard Methods' (APHA 1 992) using the same apparatus as
outlined for TSS analysis.
3.3 Determination of Chemical Oxygen Dema n d
Chemical Oxygen Demand (COD) was detennined using the closed reflux, colorimetric
method as given in Section 5220D of 'Standard Methods' (APHA 1 992).
Both total (tCOD) and soluble (sCOD) Chemical Oxygen Demand detenninations were
carried out. Soluble COD was defined as the COD of a filtrate that had passed through
a GFC grade filter. All analyses were perfonned in duplicate, with the average of the
two values taken for the result.
COD analyses were conducted as follows:
1 . A standard curve was prepared using potassium hydrogen phthalate standards
in the range from 0 to 500 mglI COD. Samples were diluted before analysis
as necessary to give a final COD in the required range. Reactor and selector
mixed liquor samples were usually analysed using a 1 :20 dilution whereas
effluent and filtered reactor samples were usually undiluted.
2 . 2 . 5 m l o f sample, 1 .5 m l o f digestion solution and 3 .5 ml o f catalyst solution
were added to 1 6 x 1 00 mm Kimax culture tubes with teflon lined caps.
3 . Samples were digested for 2 hours at 1 50 ° C i n a HACH C O D Reactor of 25
tube capacity.
4. Absorbances of the cooled samples were read at 600nm on a Philips PU 8625
UV NIS Spectrophotometer , using a glass cuvette with a 1 cm path length. A
reagent blank was used to zero the spectrophotometer.

38
5 . COD was calculated as follows:
where:
COD (g.m-3 ) = A x F x D
A = absorbance at 600nm
F = conversion factor calculated from the calibration curve
D = dilution factor of the sample
(3 .3)
3.4 Determination of Sludge Volume Index
The method used detennining sludge volume was the Diluted Sludge Volwne Index
(DSVI) as described in Jenkins el af. 1 993 . This is essentially the same as the method
outlined in 'Standard Methods' (APHA 1 992) Section 271 OD, except that the mixed
liquor was diluted so that the final settled sludge volume did not exceed 250 ml per litre
of sample volume.
The method used was as follows:
1 . Mixed liquor, or mixed liquor diluted to a 1 12, 1 14 or 1 18 dilution with tap
water, was poured into a one litre measuring cylinder.
2. The measuring cylinder was inverted several times to ensure that the biomass
was evenly distributed throughout the liquid volume, then allowed to stand
undisturbed for a period of 30 minutes.
3. The volwne of the cylinder occupied by sludge at the end of the settling
period was recorded. If the settled sludge volume was more than 250 ml the
test was repeated using greater dilution of the mixed liquor.
4 . The SVI was then calculated as in Equation (3.4):
where:
S x 1000
TSS x V
S = volwne occupied by sludge after settling (ml.rl)
TSS = TSS of the mixed liquor (g.rl)
(3.4)
V = volwne of mixed liquor used in 1 litre total of sample settled (ml)

3.5 Determination of Dissolved Oxygen and Oxygen Upta ke Rate
3 9
Dissolved Oxygen (DO) was measured using a Model 57 YSI Dissolved Oxygen Meter connected 10 a YSI Model 5750 BOD bottle probe that was fitted with a YSI standard membrane. The meter was air calibrated according to the manufacturers instructions.
The Oxygen Uptake Rate (OUR) was measured on the mixed liquor in the reactor and selectors, and also measured during various batch respirometric tests to determine kinetic parameters.
Measurements were made either in stirred 1 0 I bioreactor vessels, or in a I litre working volume respirometer placed on a Heidolph MR300 I magnetic stirrer. The reaction vessels are described in more detail in Section 3 . 1 3 of this chapter.
The DO meter was connected to a Sekonic SS250F Chart Recorder. The recorder range was set at O. l mY and chart speed at 600 mm/hr. The DO meter was set at the 0- 1 0 mg/l range scale, which corresponded on the chart to a width of 30.5rnrn per mg DO.
The OUR was calculated from the slope of the line recorded on the chart:
(3 .5)
time elapsed (s)
Both total OUR and carbonaceous OUR measurements were made. In the heterotrophic bacteria OUR determinations, nitrifying bacteria were inhibited with allylthiourea (BDH, Poole, England) at a concentration of approximately I g.m-3 as recommended by Cech et al. ( 1 984).
3.6 Determination of pH
pH measurements on samples from the reactors were made using a Radiometer PHM6 1 Laboratory pH meter fitted with a Philips CE 50 electrode.
The pH meter was calibrated before use at pH 7 and pH 4 or pH 1 0 as appropriate, with colour key buffer solutions (BDH, Poole, England).

40
3.7 Determination of Nitrogen Concentrations
The nitrogen compounds of interest were ammonia, nitrate, nitrite and total Kjeldahl
nitrogen (TKN). NH3, N03 and N02 were measured on GFC filtered samples, while
TKN was measured on the whole sample. The methods used for the determination of
each nitrogenous compound fol low.
3.7.1 Ammonia
Ammonia was analysed using a Technicon Autoanalyser (Technicon (Ireland) Ltd, Dublin) continuous flow analytical instrument using a modification of the automated phenate method as outlined in Section 4500-NHrH of 'Standard Methods' (APHA, 1 992). The absorbance of the solutions was detected in the Technicon colorimeter fitted with a 660 nm filter and recorded as a peak on a Technicon chart recorder.
Standards of 0, 0.25, 0.5, 1 .0, 2.0, 2,5 and 3 .0 g.m-3 ammonia were analysed to construct a calibration curve of peak height versus ammonia concentration.
Samples were diluted with deionised water as necessary to give peak heights in the required range.
3.7.2 Nitrate
Nitrate was analysed at the same time as ammonia on the Technicon Autoanalyser. An
automated hydrazine reduction method as outlined in Section 4500-N03- H of 'Standard Methods' (APHA 1 992) was used, the absorbance of the resultant solution being · measured at 520 run and recorded on the chart recorder at the same time as the ammonia results.
A range of nitrate standards from 0 to 3 .0 g.m-3 was used to calculate nitrate concentrations in the same manner as for the ammonia determination. Samples were diluted as necessary prior to analysis with deionised water to give peaks in the required range.

3.7.3 Nitrite
4 1
Nitrite concentration was determined using a HACH DRJ2000 Direct Reading
Spectrophotometer. The nitrite determination performed was Method No. 3 7 1 in the
DRJ2000 Handbook, which is a diazotisation method.
One HACH Nitriver 3 reagent powder pillow was added to 25 ml of filtered sample.
The sample was mixed to dissolve the reagents then al lowed to stand for 1 5 minutes
before reading the absorbance at 507 nm .
The spectrophotometer uses a preprogrammed calibration curve and reports the result as
g.m-3 N02 -N. The instrument calibration was checked using a standard nitrite solution
as outlined in the DRJ2000 Handbook.
3.7.4 Total Kjcldahl Nitrogen
TKN was determined using a micro Kjehldahl method as follows .
. 1 . A 5 ml sample of mixed liquor or 50 ml sample of whole effluent measured into a
1 00mi digestion tube, acidified with 1 drop of concentrated H2S04 then dried
overnight in a Contherm Series Five oven at 105 °C.
2. 4 ml of digest acid containing concentrated H2S04, K2S04 and selenium powder,
was added to the dried sample in the digestion tube, then the tube heated in a
digestion block at 350 °C for four hours or until the solution had become colourless.
3. The digested sample was cooled to room temperature, then made up to 50 ml with
deionised water. A Labline Instruments Inc. (Illinois, USA) Supennixer No. l 29 1
vortex mixer was used to ensure that the resultant solution was well mixed.
The TKN content of the sample was then analysed using a Technicon Autoanalyser .
continuous flow analytical instrument. The method used was a modified phenate
method with colorimetric determination at 630 nm by a Technicon Autoanalyser II colorimeter. The resultant absorbance was measured as a peak on a Tec�con Chart
Recorder. Standard solutions in the range from 5 to 1 50 g.m-3 N were analysed so that a
calibration curve relating peak height to TKN could be constructed.

42
3.8 Determination of Phosphorus Concentrations
Two different phosphorus analyses were performed: Total Phosphorus and Dissolved
-3 P Reactive Phosphorus. Both sets of results are reported as g.m .
3.8 . 1 Total Phosphorus (TP)
The TP was analysed on digested samples at the same time as the TKN. P concentration
was measured by the Technicon Autoanalyser using a modified
vanadomolybdophosphoric acid method with colorimeters at 400nm. Standards in the
range of 0 .5 to 1 5 g.m-3 P were analysed to provide a linear calibration curve, from
which measured sample peak height could be converted to P concentration.
3.8.2 Dissolved Reactive Phosphorus (DRP)
DRP was detennined primarily using the Vanadomolybdophosphoric Acid Colorimetric
method as outlined in Section 4500-P C. of 'Standard Methods' (APHA 1 992). The
HACH DR/2000 Direct Reading Spectrophotometer was used for a small nwnber of
analyses. S imilar results to the standard method were obtained using the DR/2000
spectrophotometer.
3.8.2.1 DRP determination by the Vanadomolybdophosphoric Acid Method.
1 . The sample was filtered using Whatman GFC filter paper prior to analysis.
2. 1 8 m1 of undiluted sample was pipetted into a 25 ml volumetric flask, 5ml of
vanadate reagent was added, then the flask made up to the mark with
deionised water. The sample was inverted several times to mix then allowed
to stand for at least 1 0 minutes.
3 . The absorbance of the resultant solution at 400nm was measured on a
Shimadzu UV - 1 20 1 , UV -Vis Spectrophotometer. A reagent blank was used .
to zero the instrwnent.
4. A calibration curve was constructed in the range of 0 to 18 g.m-3 P using an
anhydrous KH2P04 standard solution.

43
3.8.2.2 DRP determination using the HACH DR/2000 Spectrophotometer
1 . The amino acid method, No. 485 in the DRJ2000 Manual was used. The sample was filtered using Whatman GFC filter paper prior to analysis.
2 . Then 1 ml o f HACH 2 :� : i no acid re�1gent and 1 111 1 of HACH Jl10lybdate reagent
was added to 25 ml of sample. The sample was inverted several times to mix then allowed to stand for at least 1 0 minutes.
3 . The absorbance of the resultant solution was measured on the DRJ2000 Spectrophotometer at 530nm. A reagent blank was used to zero the instrument.
4. The result was reported in g.m-3 P04 which was converted to g.m-3 P by dividing the P04 value by 3 .07.
3.9 Determi nation of Biomass Floc Morphology
The physical appearance of the biomass in the mixed l iquor was examined microscopically as outlined in Jenkins et aI. , ( 1 993) . Observations included: floc size and morphology; abundance of filaments; presence of other significant microorganisms and reaction to various staining procedures.
Most observations were made at l OOx magnification on a Olympus BH2 light microscope with DPlan objective lenses. Photographs were made using a Leitz Ortholux II microscope with an Leitz manual camera and Kodak 35mm Technical pan film. Stained preparations were viewed at 1 000x on one of the above microscopes. Phase contrast observations were made on a Nikon Optiphot microscope.
Filamentous microorganism identification was carried out using the morphology and staining techniques and identification keys outlined in Jenkins et al., ( 1 993) and LaTrobe University ( 1 993). The microbial stain solutions required were prepared as described in Jenkins et aI. , ( 1 993) or in Harrigan and McCance ( 1 966).
3.1 0 Determination of Lactose Concentration
Lactose concentration was measured using a Waters HPLC consisting of: a Model 590

44
pump and controller; a Model R40 1 differential refractometer and a Model 740 data module. The HPLC was fitted with a Waters Sugar-Pak column and used an aqueous mobile phase containing 50 g.m-3 CaEDTA . A set of standard solutions containing
from 1 00 to 1 000 g.m-3 lactose was used to construct a standard curve relating peak area to lactose concentration.
3.1 1 Determination of Turbidity
Turbidity of the reactor feed solution was measured usmg a HACH 2 1 00P Turbidimeter, calibrated with manufacturer supplied standards.
3. 1 2 Determination of DNA Content
Total DNA content of the activated sludge mixed l iquor was measured usmg the
method outlined in Marshall et al., ( 1 98 1 ).
3.13 Reactor Vessels
Three main types of reaction vessel were used in this study: a 1 0 litre working volume completely mixed reactor with external settler, a 6.25 I working volume completely mixed reactor with an internal settler and a 1 litre working volume respirometer.
3.13.1 Respirometer Design
The 'respirometer' used for many batch tests and kinetic parameter estimations consisted of a cylindrical 0. 1 m internal diameter perspex vessel with a working volume of 1 litre as detailed in Figure 3 . 1 and based on the design described by Cech et al. ( 1 984). These respirometers were constructed specifically for this use in the Department of Process and Environmental Technology (PET) workshop, Massey University.
Constant temperature conditions were maintained by placing the respirometer In a waterbath at the desired temperature, or placing the stirred respirometer on a Heidolph MR 300 1 heated plate magnetic stirrer.

Top view
/
----f--+ 0 o ort for thennometer
Side view
Igure 3.1: 'Respirometer' vessel schematic.
+-f--- Port for DO probe
Port for substrate addition and for air supply l ine
O-ring seal - between lid and
body of ' respirometer'
+-- Internal wal l baffles
45

46
Aeration was supplied via a length of flexible tubing connected to a filtered, pressurised air supply. The tubing was immersed in the respirometer contents through the air port in the respirometer l id and air flowrate was adjusted as needed using a screw clamp on the tubing.
A DO probe could be immersed directly into the respi rometer contents via a specificaHy sized port, and a third sealable port was available for the addition of chemicals and for exit airflow during aeration.
3.13.2 6.25 litre Completely Mixed Reactor with Internal Settler
This reactor was used for initial biodegradability studies and to supply acclimated biomass for batch tests, as described in Chapter 4. The rectangular reactor was constructed of perspex by the PET Department, having a total volume of 1 0 l i tres and l iquid level control via a stainless steel overflow pipe through the reactor base.
A porous stone diffuser located centrally at the base of the reactor provided both aeration and mixing in the vessel. The overflow pipe was positioned to maintain a working volume in the reactor of 6.25 litres. Feed to the reactor was del ivered via a Cole Panner Model 7554-30 Masterflex pump and controller, fitted with a 70 1 3-20 pump head and Norprene Masterflex tubing.
3.13.3 10 l itre Completely Mixed Reactor with External Settler
The continuous activated sludge trials were conducted using a New Brunswick Scientific Co. Model MF- 1 4 bioreactor with a 1 0 I working volume glass vessel. The bioreactor had adj ustable stirrer, air flowrate and temperature control . The stirring rate in the reactors was maintained at 1 00 rpm, air flowrate at 7 lImin and temperature at 25 °c for all activated sludge trials.
The reactor used an external settler, which was an 0. 1 1 m internal diameter cylindrical perspex container with a sloping base, notched overflow weir and 1 .75 l itre working volume. A wire stirrer rotated at approximately 4 rpm at the base of the settler to prevent floc bridging at the settler outlet.
Flowrates in and out of all the activated sludge system vessels were controlled using Cole Panner Model 7554-60 or Model 7554-30 Masterflex pumps fitted with 70 1 4-20

47
or 70 1 6-20 pump heads and Norprene Masterflex tubing.
3 . 1 4 Chemicals
All chemicals used were analytical reagent grade, unless specified .
3. 1 4.1 Reactor Feed
Whole Milk Powder Skim Milk Powder Butter Lactose
'Anchor' brand, NewZealand Dairy Foods Ltd, Auckland, NZ. 'Anchor' brand, NewZealand Dairy Foods Ltd, Auckland, NZ. 'Anchor' brand, NewZealand Dairy Foods Ltd, Auckland, NZ. BDH, Poole, England.
NaOH 'Prolabo' brand, Rhone Poulenc ltd, Pari s, France.
3.14.2 Chemical Oxygen Demand:
Potassium hydrogen thalate K2Cr207 HgS04 H2S04 Ag2S04
BDH, Poole, England. 'Univar' brand, Ajax Chemicals, Auburn, Australia. BDH, Poole, England. 'Univar' brand, Ajax Chemicals, Auburn, Australia. BDH, Poole, England
3.14.3 Phosphorus Determination
(NH4)6Mo7024.7H20 'Univar' brand, Ajax Chemicals, Auburn, Australia . . NH4 V03 'Univar' brand, Ajax Chemicals, Auburn, Australia. HCI 'Univar' brand, Ajax Chemicals, Auburn, Australia. KH2P04 'Univar' brand, Ajax Chemicals, Auburn, Australia. HACH Amino Acid Reagent HACH Cat. No. 1 943-32 HACH Molybdate Reagent HACH Cat.No. 2236-32
3.14.4 Ammonia Determination
'Univar' brand, Ajax Chemicals, Auburn, Australia.

48
NaOH Disodium hydrogen orthophosphate. 1 2H20 Sodium salicylate Na2(NO)Fe(CN)s,2H20 NaOCI(4% solution) NaCI
'Prolabo' brand, Rhone Poulenc ltd, Paris, France. 'Univar' brand, Ajax Chemicals, Auburn, Australia.
'Univar' brand, Ajax Chemicals, Auburn, Australia. BDH, Poole, England 'Janola' brand, Reckitt and Coleman, Auckland, New Zeal2.nd 'Prolabo' brand, Rhone Poulenc ltd, Paris, France.
3.1 4.5 Nitrate Determination
CuS04·5H20 ZnS04·7H20 NaOH Hydrazine sulphate Sulphalinimide N-( 1 -naphthyl) ethylene diamine dihydrochloride Merckoquant 1 0 020 Nitrate test strips
'Univar' brand, Ajax Chemicals, Auburn, Australia. 'Univar' brand, Ajax Chemicals, Auburn, Australia. 'Prolabo' brand, Rhone Poulenc ltd, Paris, France BDH, Poole, England BDH, Poole, England BDH, Poole, England
MERCK
3.14.6 Nitrite Determination
HACH Nitriver 3 Reagent Powder Pillows. HACH Catalogue No. 1 4065 - 66.
3.14.7 Total Kjeldahl Nitrogen Determination
NaOH Phenol NaKC4H406.4H20
'Prolabo' brand, Rhone Poulenc ltd, Paris, France. BDH, Poole, England BDH, Poole, England
3.14.8 Digestion Acid for TKN and TP Determination
H2S04 ' Univar' brand, Ajax Chemicals, Auburn, Australia. K2S04 Selenium powder
'Univar' brand, Ajax Chemicals, Auburn, Australia. BDH, Poole, England

3. 1 5 Determination of System Steady State
49
All trials were c arried out for a period of at least three solids retent ion tim es (SRTs)
where possible as it is widely reported (Linne and Chiesa, 1 987; van Niekerk et al. ,
1 988 ; Salameh and Malina, 1 989; Foot, 1 992; Puj ol and Canler, 1 994) that changes in
the bio mass mixed cul ture popu lation require that order of t ime to reach a new ' pseudo
st eady state ' after a c hange in system param eters.
Som e of the trials failed within the 3 SRT interval and others demons trated a c ontinuing
change in measureable parameters after the 3 SRT period had pass ed. Res ults for each
trial are therefore reported as trends during the period of the trial, and averages at the
end of the trial where m easured system parameters appear to have s tabilis ed. In general
it c ould not be c oncluded that systems were operating at 'steady s tate' duri ng the tri als ,
but system status after at least 3 SR Ts was taken as an indication of the s ystem response
to a c hange in operating c on ditions.
3. 1 6 Determination of Measurement Variabil ity
Where possible and appropriate, 95% confidence intervals on average measured values
are provided. However, in m ost cas es estimates of m easurem ent vari ability are not
stated as it was deemed inappropri ate to do s o.
To be a true replicate, the individual values needed to be determ ined us ing the same
biomass population reacting under the s ame conditions. Many of the results of repeated
tes ts for which an average value is given were performed using biomass wi th a differing
popUlation compos ition and therefore could not be considered true replicates . Likewis e
it was inappropri ate to provide co nfidence intervals o n most average system parameters
m easured during a trial, as the system was not at steady state o ver that period, with
changing trends readily obs ervable. F or s uch average values , a range is provided rather
than a confidence interval.
All analytical tes ts were performed in duplicate, with the average value being recorded.

50

CHAPTER 4
SUBSTRATE BIODEGRADATION STUDIES
4. 1 Introd uction
51
The first section of experimental work was carried out to define then characterise the
substrate to be used in this study. The substrate to be used was to represent the typical
wastewater from a milk processing facil ity producing butter and milk powder, so a
synthetic substrate was designed using average effluent characteristics measured on
effluent from a full scale operation. The important physical and chemical
characteristics of the real wastewater were defined, then reproduced in the synthetic
substrate using a combination of milk derived products.
To assess the relative impact of the various milk constituents on the overall wastewater
biodegradability, the synthetic substrate was further characterised using
biodegradability definitions as developed for the modelling of activated sludge systems.
This involved a series of specifically designed batch tests with acclimated biomass;
monitoring changes in substrate, oxygen and biomass concentrations with time.
B iodegradability assessment of the substrate also included obtaining estimates for the
important biokinetic parameters such as biomass growth and yield.
To provide acclimated biomass for the batch studies, a small continuous reactor was
operated at a 2.5 day HRT and SRT using the synthetic substrate under study. The
treatment perfonnance of this bioreactor was also monitored periodically to give an
initial assessment of effluent treatability.
Results from the biodegradability studies could also be used subsequently to provide
infonnation required for the next phase of the study - a laboratory scale activated sludge ·
system - as suitable values for operating parameters such as hydraulic residence time
and organic loading rate could be detennined from the data obtained as well as an
estimate of the degree of treatment achievable with the defined substrate.

52
4.2 Substrate Cha racterisation
The substrate used as the reactor feed stream was to be representative of the typical effluent from a milk processing faci lity producing butter and milk powder. As these effluents consist primari ly of diluted milk and milk products, the wastewater to be us,�d in further studies was decided to be a 'synthetic' one, with similar physical and chemical characteristics as the 'typical' wastewater. The use of a synthetic effluent would ensure that a consistent substrate composition and quality would be available for all tests, and would also allow the impact of variations in reactor operating conditions to be distinguished without interference from variations in substrate.
4.2 .1 Substrate Definition
The typical effluent characteristics of a butter and milk powder production faCil ity were supplied by the New Zealand Dairy Research Institute (NZDRI) as l isted in Table 4. 1 .
Table 4.1 Typical Effluent Characteristics of Butter and Milk powder Production Facil ity
Characteristic
COD (g.m-3 )
BODS (g.m-3 )
TSS (g.m-3 )
pH
Temperature (OC)
Total N (g.m-3 )
Total P (g.m-3 )
Lactose (g.m-3 )
Fat (g.m-3 )
NS = not supplied
Average Value
2000
1 1 50
3 000
1 1 .2
3 5
29
1 8
600
300
Typical Range
1 000 - 4000
NS
NS
8.3 - 1 2.6
20 - 50
4 - 80
9 - 3 1
NS
1 00 - 700
.
As dairy processing wastewaters are noted for their variability in both concentration and
composition with time, the 'synthetic' wastewater was to comprise of a mixture of milk

53
products that would give the same COD, lactose, N and fat content as the average value determined from analyses of a large number of actual wastewater samples.
The milk products used as ingredients of the synthetic effluent were: whole powder (WMP); skim milk powder (SMP) and full cream salted butter (B). These ingredients had compositions determined by the NZDRI as given in Table 4 .2 .
Table 4 .2
Constituent
COD
- Fat
Lactose
Total N
Total P
Compositions of Butter and Milk Powder Products
g ig WMP g i g SMP
1 . 5 1 . 1
0.257 0.008
0 .37 0.523
0.045 0.0445
0.058 0.058
g i g Butter
2 . 1
0 .82
0.0064
0 .0008
0
The combination of milk products that resulted in the desired level of wastewater constituents is given in '(able 4.3 . The resultant COD, lactose and fat concentrations matched the average value for typical dairy effluent constituents very closely.
Table 4 .3 Synthetic Wastewater Composition Based on Ingredient Composition
WMP SMP Butter Synthetic Desired Effluent Total Value
(g.m-3 ) (g.m-3 )
Mass of ingredient 650 700 1 50 1 500 (g.m-3 )
COD (g.m-3 ) 975 770 3 1 5 2060 2000
Lactose (g.m -3 ) 24 1 366 1 608 600
Fat (g.m-3 ) 1 67 6 1 23 296 300
N (g_m-3 ) 29 2 1 0 60 29
P (g.m-3 ) 38 40 0 78 1 8

54
The value for total N was above the average value, but well within the typical range
specified and so considered acceptable. Although the expected P value was apparently
higher than desired, it could not be reduced using the ingredients available and
subsequent analysis of the synthetic wastewater gave total P values very close the
typical effluent value, as shown in Table 4.4. This indicated that the supplied P value
for the milk powders shown in Table 4.2 may have been overestimated.
All ingredients were dissolved in a small volume of warm tap water then made up to the required volume with tap water. Sufficient NaOH was then added to the wastewater to give a solution of pH 1 1 .
4.2.2 Physical and Chemical Characteristics of the Substrate
The physical and chemical characteristics measured on the wastewater as defined In Table 4.3 are listed in Table 4.4.
Table 4.4 Characteristics Measured on the Synthetic Wastewater
Characteristic Whole GFC filtered Wastewater « approx. l �m)
TS (g.m-3 ) 1 500 -
TSS (g.m-3 ) 1 50 -
VSS (g.m-3 ) 1 50 -
COD (g.m-3 ) 2200 1 650
Turbidity (NTU) 442 2 1 8
Total P (g.m -3 ) 1 4 1 3
Total N (g.m-3 ) 89 72
( - : not measured)
Membrane filtered « 0.45 �m)
-
-
-
1 250
77
-
-
It can be seen that the largest proportion of the solids and organic matter (90% of TS and 75% of COD) is less than 1 �m in size, with 57% of COD attributed to solids less ' than 0.45 �m, indicating that the substrate is predominantly in a colloidal or dissolved fonn. The turbidity values also indicate that there is significant colloidal matter in the wastewater. In all further experimental work the tenn 'soluble' refers to that which

passes through a GFC filter, which includes both colloidal and truly soluble material.
4.2.3 Readily Biodegradable Fraction of Substrate
55
The wastewater characterisation protocol described by Henze et al. ( 1 987) divides the
total COD into four fractions: inert and biodegradable fractions of both particulate and
soluble COD. The terms 'soluble' and 'particulate' were defined so that they represented biodegradability to microorganisms rather than actual physical state of the organic matter.
The soluble inert (S,) fraction of milk processing wastewaters has been reported
previously (Germirli et aI. , 1 99 1 ; Orhon et al. , 1 993) to be negligible and so was not
measured, as the composition of the synthetic wastewater was not expected to differ in
this regard. As the VSS/TSS ratio measured was equal to 1 , the inert content due to ash
components of the substrate was also considered to be negligible.
The methodology given for estimating particulate COD fractions, both inert (X,) and
slowly biodegradable (Xs) is by curve fitting and difference techniques once the soluble
proportion is known (Henze et aI. , 1 987).
The remaining COD fraction, readily biodegradable (Ss), was expected to be the most
significant due to the origin of the organic matter in the wastewater and the high
proportion of soluble or colloidal COD. Methods described for estimating Ss are summarised by Henze ( 1 992), and most commonly involve measuring the change in OUR in response to either feed cessation in continuous reactors (Ekama et al. , 1 986;
Sollfrank and Gujer, 1 99 1 ) or feed addition in batch reactors (Ekama et al. , 1 986;
Kappeler and Gujer, 1 992). The batch method outlined in Ekama et al. ( 1 986) was
initially chosen for estimating Ss due to the suitability of the method and biomass
availability at this stage of the project.
A respirometer containing mixed liquor from the 2.5 day S RTIHRT reactor was inj ected with varying volumes of concentrated feed so that the feed volume added was less than
1 % of the volume of mixed liquor in the respirometer. The OUR was measured during the interval required for it to return to a constant rate or plateau, which Ekama et al.
( 1 986) attributes to the hydrolysis rate of Xs once all Ss has been removed. The
experiment was repeated using different added volumes of substrate to give a range of
initial substrate concentrations in the respirometer.

56
1 .4
1 .2
= E
0.8 M
o e.o E 0.6
'-"
0.4
0 .2
o
•
o 1 00 200 3 00
Time (minutes)
400
0 1 3 5 mg COD
;( 405 mg COD
. 205 mg COD
(j, 540 mg COD
500
Figure 4. 1 : Estimation of Ss - measurement of the OUR after substrate addition.
200
M 1 60 o e.o E '-"
1 20
80
40
o
o 1 00 200 300 400
Substrate added (mg sCOD)
o count squares
• weigh plot
5 00 600
Figure 4.2: Estimation of Ss - determination of the ratio of oxygen consumed to
substrate added.

57
Typical OUR profiles recorded during the experiment are shown in Figure 4 . 1 . The area under the curve, above the final stable OUR baseline, represents the O2 consumed in response to the substrate COD added. From the areas under the curves for a set of experiments, a mass ratio of O2 consumed to COD added was calculated as i l lustrated in Figure 4 .2 . Ekama et al. ( 1 986) suggest that this is related to the readily biodegradable
fraction (f Ss) of the substrate as follows:
f Ss =
g O2 consumed per g COD added g COD added
where : fSs = Ss/So = COD fraction of readily biodegradable substrate. Ss = concentration of readily biodegradable COD (g.m -3 ) So = initial substrate COD concentration in the respirometer (g.m-3 ) Y H = yield coefficient (g.cell COD per g.substrate COD)
(4. 1 )
Using this relationship, the results obtained from different replicates o f the trial are summarised in Table 4.5. The substrate used in these experiments was the GFC filtered portion of the feed, therefore the readily biodegradable fraction of the wastewater was estimated to be 75% of the experimental estimate, given the soluble and total COD results reported earlier in Table 4.4. A value of Y H = 0.68 g cell COD produced per g substrate COD consumed was used in calculating the values of Ss, the choice of Y H value used being discussed later in this chapter.
More recently (Sollfrank and Gujer, 1 99 1 ) the biodegradable fraction of the wastewater has been divided into three, rather than two fractions, based on observed OUR
responses with activated sludge biomass. The fractionation, based on rate of biodegradation of the substrate components is now thought to be more accurately represented by:
Ss : readily biodegradable material SH: rapidly hydrolysable material Xs: slowly hydrolysable material
The new fraction SH is mostly the physically soluble, more degradable fra�tion of the previously defined Xs, but may also contain some of the more rapidly degraded particulate material (Henze, 1 992; Henze et al. , 1 994).

58
The area under the OUR curve obtained by Sollfrank and Guj er ( 1 99 1 ) from similar batch tests is considered to contain both Ss and SH' with the degradation of SH being indicated by a l inear decline in OUR at the end of the test. A similar shaped curve that includes a high OUR plateau, followed by a rapid decrease and then a linear decrease in
OUR, is indicated in this study as can be seen in Figure 4. 1 . Using this analysis, the fraction of readily biodegradable substrate calculated in Table 4 .5 would then be the sum of both Ss and SH fractions.
Table 4.5 Estimation of Biodegradable Fractions Ss and SH of the Soluble
Wastewater.
Date No. of i-,Q2 �QnSlJmed f Ss + f SH of Soluble f Ss + f SH of Whole tests g COD added Wastewater Wastewater
1 7/3/93 4 0.33 1 .03 0 .77
1 8/3/93 4 0.3 1 0.97 0 .73
25/3/93 4 0.26 0.8 1 0 .6 1
3 1 /3/93 4 0.3 1 0.97 0.73
Average 0.30 0.94 0 .7 1
From the results in Table 4.5, it appears that almost the entire soluble substrate COD was either readily biodegradable or rapidly hydrolysable. Using batch test OUR data as shown in Figure 4. 1 , Kappeler and Gujer ( 1 992) estimate Ss as being the area under the curve with a basel ine equal to the final linear OUR decline rather than a final stable OUR baseline as described in Ekarna el al. ( 1 986). This distinction as shown in Figure 4.3 allows a separation of the oxygen consumed during the batch test into that due to the presence of Ss and that due to SH' A similar analysis of the OUR graphs from the tests listed in Table 4.5 resulted in the fractionation given in Table 4.6.

0 .8 •
E 0.6 - .
Base l i n� 'f�; S� . . - . - . . • . .• 0.4 . .
...
.
.. . ..
. . . . . . . • . " . , . , . . . . . , . • . . , , . , - - . , . . . . - - , , , - - - • , • , • . - - , . - , , , , , •. ,." . . I�
0.2 Baseline for (Ss +SH)
o
o 50 1 00 1 50 200 2 5 0
Time (minutes)
Figure 4.3 : Determination of Ss and SH fractions from OUR data.
1 .4
• • • • • •
1 .2 0 o SIX = 0.2 0 0 • 0 • • + SIX = 0.3 0 � + 0 <> o SIX = 0.5 -..
+ �� o <> -;- • SIX = 0.6 c • . -
S o 0 0 0 0 + + 0 0 .. • . [ • •• - 0 .8 ;... 0 0 + + 0 bl) e 0 -- 0.6 0 + • 0::: 0 ;:J <> • • • •
0 0 0 + • 0.4 0 + +++ 0 0 00 0 0 0 0
+ ++ + 0
0.2
0 1 00 200 3 00 400 500
Time (minutes)
Figure 4.4 : Effect of variation in SIX ratio on the interval of eIevated OUR.
3 00
600
5 9

r
60
Table 4.6 Division of Readily Biodegradable Fraction of the Wastewater into Ss and SH
Date Ss Fraction SH Fraction f Ss of Whole f SH of Whole Wastewater Wastewater
..
1 7/3/93 0 .57 0.43 0.44 0 .33
1 8/3/93 0.6 1 0.39 0.45 0 .28
25/3/93 0.60 0.40 0.3 7 0.24
3 1 13193 0.60 0.40 0.44 0.29
Average 0.60 0.40 0.425 0 .285
From these results the size distribution of the colloidal material in the membrane filtered fraction of the substrate can also be roughly estimated. The respirometric tests indicated that of the GFC filterable material , 60% was soluble and 40% colloidal . As 24% of the COD passing through a GFC filter did not pass through the smaller 0.45 �m pore size, it is estimated that 60% of the colloidal materials in the SH fraction were between 0.45 �m and approximately 1 �m in size.
Both Ekama et at. ( 1 986) and Kappeler and Gujer ( 1 992) specify fairly closely the interval of elevated OUR in the batch test for the determination of Ss, the former suggesting a period of approximately 1 to 2 hours and the latter of 30 minutes, with a total measurement time of 4 to 5 hours. This was recommended to ensure that heterotrophic growth did not occur and so that the amount of hydrolysed substrate would not interfere with the interpretation.
In the batch tests performed, a wide range of initial substrate to biomass (SolXo) ratios were used so that the influence of a varying elevated OUR interval could be assessed. The average TSS concentration in the respirometers was 1 700 g.m-3, resulting in SolXo ratios in the order of 0.04 to 0.65 g.COD per g.TSS. The curves as shown in Figure 4. 1
and Figure 4.4 illustrate that the period of elevated OUR lasted between one and eight hours. As each set of results gave a constant ratio of O2 consumed to COD added over the entire FIM range, there did not seem to be any effect of prolonged OUR elevation' on the ratio obtained. No significant increase in TSS concentration was measured over the duration of the tests, indicating negligible cell growth, as would be expected since the SolXo ratio was less than 2 (Chudoba et at. , 1 992).

6 1
The biodegradable fractions Ss and SH have been related to the kinds of organi c
molecules present in wastewaters. Henze ( 1 992) describes the readily biodegradable
fraction (Ss) as being li mited to small molecules of volatile fatty acids, carbohydrates,
alcohol s and amino acids, with a molecular weight below about 1 000. The rapidly
hydrolysable matter SH' is described as that which would be hydrolysed under aerobic
condition s within a few hours, and a general approximation for its estimation is given
as:
SH = Total soluble COD - S, - Ss (4.2)
It can be seen from the results calculated in Table 4.5 that the above approximation held
for the substrate used in this study, given that it was assum ed that S, was negligible. As
the determination method used for estimating Ss involved time p eri ods from one to ni ne
hours, and considering the results gained in Table 4.5 and Figures 4.1 and 4.4, it seems
most lik ely that the value initially obtained for the biodegradable fraction did in fact
include both readily biodegradable and rapidly hydrolysable material.
Using the descriptions of Henze ( 1 992) for Ss and SH' the COD fractionation can be
related to the substrate comp onents. All the following milk comp onent data was taken
from W alstra and J enness ( 1 984), unless otherwise stated. Wh ole milk comprises of
app roximately 87% water and 1 3% solids, as a non-homogenous solution, wi th almost
all of the solids being lactose, milk protei ns or milk fat. U sing the exp ected
composition data for the synthetic wastewater given in Table 4.3, an estimate of the
COD contribution from each of the lactose, protein and fat fractions can be made.
For the synthetic substrate, the readily biodegradable fraction would be exp ected to
comprise of lactose, which represents 36% of the dry matter in milk. L actose has a
molecular w ei ght of 342, so would be expected to be readily biodegradable given the
defini tion of a molecular weight lower than 1 000 (Henze 1 992; Henze et al. , 1 994).
The chemical composition of lactose is CI2H2 20II > therefore a theoretical COD value of
1 . 1 2 gCOD . g lactose-I can be calculated (Metcalf & Eddy, 1 99 1 ). The synthetic .
substrate lactose concentration of 608 g.m -3 would then be exp ected to p rovide 68 1
gCOD.m-3 , which represents 34% of the total substrate COD and 80% of the readily
biodegradable COD fraction.
Fat molecules make up 3 1 % of the dry matter in milk, b.eing found as globules of
varying sizes between 0. 1 Jl m and 10 Jl m. Approximately 97% of the fat globules are
greater than 1 Jlm in size, so most of the COD associated with fat w ould be insoluble

62
and would fonn the Xs fraction of wastewater organic matter. From the data given in
Marshall and Harper ( 1 984), milkfat has an average BODS of 0.89 kg/kg and an
average BODS/COD ratio of 0.79. The expected 296 g.m-3 of fat would then represent
333 g.m-3 of COD, or 1 6 .7% of the total COD.
The remaining major class of component, protein, comprises a further 26% of the dTy
matter in milk, 80% of which is casein proteins with molecular weights between 1 9,000
and 2S,300 and the remainder mostly whey proteins with the greatest proportion having
a molecular weight up to 1 8,SOO (Walstra and Jenness, 1 984). Due to their size,
proteins are expected to fonn the rapidly hydrolysable fraction of the wastewater. An
approximation of the proteinaceous COD in the synthetic substrate can be made from
the following data: proteins contribute to 9S% of the N content (Walstra and Jenness,
1 984); there is approximately 6 .38 g protein per g N ('NZ Dairy Industry Standard
Methods . . ', 1 993); the average BODs of milk proteins is 1 .03 kg/kg and the BODs/COD
ratio i s 0.46 for casein and 0.23 for whey protein (Marshall and Harper, 1 984).
Therefore the wastewater would be expected to contain 364 g.m-3 of protein with a
COD of 977 g.m-3, representing 48 .9% of the total COD.
Casein exists predominantly as a fine dispersion of micelles having a diameter of
between 1 0nm and 3 00nm (Walstra and Jenness, 1 984), whereas whey proteins exist as
a colloidal solution with particle diameters of 3-6nm. Therefore the whey proteins are
expected to be more rapidly degraded than the caseins. Using the protein data already
stated, of the estimated 977 g.m-3 of proteinaceous COD, 326 g.m-3 would be expected
to be associated with the soluble whey proteins and 6S 1 g.m-3 associated with casein
micelles, representing 1 6.3% and 32.6% respectively of the total substrate COD.
The above calculations suggest that the COD contributions due to lactose, fat and
protein are 68 1 , 333 and 977 g.m-3 respectively, giving a total component COD of 1 99 1
g.m-3 compared to the total expected COD of 2000 g.m-3 calculated from ingredient
data. This supported the assumption made that the amount of ' inert' non-biodegradable
COD was not expected to be significant, as the difference between total component and
ingredient COD values was less than O.S%.
A comparison of substrate COD fractionation and component COD data is given in
Figure 4.S, where fractionation is given by:
Total substrate COD = Xs + X, + S, + Ss + SH (4.3 )

63
I t has already been stated that SI was assumed to be negligible, and due to the total
COD contribution calculated for lactose, protein and fat; XI can also be assumed to be
small . Figure 4.5 suggests that most of the Ss fraction is due to the lactose content in
the wastewater, just over half of Xs is due to fat, and that the milk proteins contribute to
all three fractions: approximately 1 7% of Ss, possibly almost all of SH' and just under
half of Xs.
0.9
0 .8 � 0 0.7 U
e<:: 0 .6 ..... C ......
0 . 5 '-c c: OA 0 - -...... c.J e<:: 0.3 s..
� 0.2
0 . 1
0
- - - -
Xs + X, - - - - - -
- - -- _ . . -
- - - - - -
SH
- .. - - - -
- - - - - -
Ss - - - - - -
- - - - - -
Degradability Fractions
fat
prote in
lactose
Milk Components
Figure 4 .5 : Fractionation of substrate COD by degradability and mi lk components.
4.3 Estimation of Kinetic constants
In order to characterise the response of the biomass to the substrate, several kinetic
parameters were measured. Monod type kinetics have been used previously for the '
biodegradation of dairy wastewaters (Orhon el al. 1 993), so were assumed to adequately
describe the relationship between growth rate and substrate concentration in this case.
Therefore the parameters of interest were: the maximum specific growth rate of
biomass, Ilmax (d- I ); the substrate half saturation co-efficient, Ks (gCOD.�-3) and the
yield co-efficient, Y H (g cell COD. g substrate COD-I). These parameters were
subsequently used to design continuous reactor studies.

64
4.3.1 Selection of Methodology
All the methods selected for the detennination of biokinetic constants used COD as a
measure of substrate concentration, as this is now the common basis for activated
sludge models (Henze et al. , 1 987) and allows an oxygen balance to be perfonned over
the system. The biomass concentrations were measured gravimetrically and also .as
COD, after the oxygen equivalence of cells, Ox (g COD. g biomass- I ) had been
established from COD and TSSNSS data.
As the substrate in this case was turbid, conventional methods for measuring biokinetic
constants involving relating cell concentration to optical density at a specified
wavelength could not be used. Other methods which measure concentrations of
substances specific to biological growth such as DNA or A TP are not suited to routine
application. Therefore respirometric and gravimetric methods were employed in this
study.
4.3.2 Measurement of J!max and Ks.
The estimation of flmax and Ks requires detennination of the biomass growth response to
various initial substrate concentrations. This can be done either: directly by following
biomass growth as an increase in cell number, optical density or cell mass; or indirectly
by measuring substrate removal as a change in component or COD concentration, or
from oxygen consumption data. The indirect methods relate substrate or oxygen
removal to an increase in biomass through a yield factor, Y (mass of cells produced per
unit of substrate removed), assuming that all substrate is either used for the production
of new cells or oxidised to provide energy. In this study respirometric methods were
used, which relate oxygen uptake rates to cell growth.
There are two main types of experiments used for the respirometric detennination of
flmax and Ks : those that employ a high SIX ratio (Gaudy et al. , 1 987; Kappeler and
Gujer, 1 992) and those using a low SIX ratio (Cech et al. 1 984). The high SIX ratio
tests measure 'growth' as an increase in cell numbers, while the low SIX methods
measure 'growth' as a storage or accumulation response to substrate addition.
Both high and low SIX methods were assessed for further use in this study. The
substrate used in both methods was the GFC filtered fraction of the feed so that cell
concentration could be estimated by TSS analysis.

4.3.2.1 Measurement of Ilmax and Ks Using a High SIX Ratio.
65
The methodology outlined by Gaudy et at. ( 1 987) was used to determine Ilmax and Ks under cell replication conditions. Biomass from the chemostat was used to seed a series
of respirometers with initial soluble substrate concentrations of between 255 and 2900
gCOD.m-3 . The initial SIX ratio was greater than the 2 - 4 range needed;to ensure that
cel l replication would take place (Chudoba et at. 1 992). The respirometers were
aerated, stirred and maintained at 20 0C for the duration of the test. OURs in each
respirometer were measured every 1 0 to 20 minutes for a period of approximately 8 to
1 2 hours until a decrease in OUR was observed. TSS and COD concentrations were
measured at the beginning and end of the test so that Y H and Ox could be estimated.
The change in biomass concentration (X) is related to the change in oxygen
concentration (0) via Y, the cell yield (g.m·3 cel ls formed per g.m-3 COD removed) as
fol lows:
dX
dt
d O2
dt
(4.4)
The ( 1 1Y - Ox) expression represents the mass of O2 consumed per mass of biomass
produced and is known as the respirometric ratio (R), that is the ratio of respiration to
synthesis (Gaudy el al. , 1 987) and is a constant for any particular system. Using this .
substitution, Equation (4.4) can be integrated to provide the following equation for
biomass:
X(t) = X(O) +
where: X(t) = biomass concentration at time, t
!::. O2 (t) = cumulative oxygen uptake at time, t
(4.5)
The OUR versus time data measured during a test was used to calculate the
accumulated oxygen uptake. Using the Y and Ox values calculated from test TSS and
COD data, the increase in cell concentration was calculated using Equation 4.5. The
logarithm of the resultant cell concentration in each respirometer was plotted versus
time as shown in Figure 4.6 and the specific growth rate (Jl) estimated from the slope of
the straight line portion. This gave an estimate of Jl for each respirometer at a different

66
5.8
/)" 5 .7
----'? 5 .6
/
S oil 5 . 5 --::: 0 .- 5 . 4 G ..... c:: )'/ I-..... 5 . 3 :::
07 <l) CJ ::: 5 .2 0/ 0
U 0 '" 5. 1 0 '" 0 eo: 0 S 5 0 0 0 .- 0 � 4 . 9 0 ::: o 0
..J 4 .8 0 0
4 . 7
0 50 1 00 1 50 200 250 300 3 50 400 4 5 0 500
Time (minutes)
Figure 4.6: Calculated biomass concentration versus time for the estimation of �ma" using the high SIX method.
So value in the series.
The values of So and � were then plotted on a modified linear plot as shown in Figure
4.7 to estimate �max and Ks. A measure of the accuracy of the result can be determined
from the size of the triangle defined at the intersection point by the series of lines. The
values obtained from various repetitions of the procedure are listed in Table 4.7.
Table 4.7 Estimation of LAmax and Ks Usin2 Hi2h SIX Ratios at 20 Ok
Date
2/1 2/92
811 2/92
30/ 12/92
8/1 /93
Average:
So range
(g.m-3 COD)
1 80 - 365
255 - 390
455 - 2600
680 - 2900
SolXo range R �max (gCOD .gTSS-l ) (d-l )
5.9 0.99 2.7
2.6 - 3 .8 0.67 . 2.4
1 5 0.7 1 3 .6
5 .7 - 24. 1 0 .71 5 .0
3 .4
Ks (g.m-3 COD)
60
68
90
380
1 50

-3000
Figure 4.7
/ ,/
/
-2500 -2000 - 1 500 - 1 000 -500
Substrate concentration (gCOD.m-3)
Modi fied l inear plot for the estimation of �mil:� and Ks usi ng the High SIX ratio method .
2
o 500 1 000

68
The value of Y used was taken as the average Y calculated from COD and TSS data for
the series of respirometers in each test, where Y = YH l Ox. The values for Y H are
summarised in Table 4. 1 1 . The value used for Ox was 1 .42 g ceil COD I g TSS, also as
measured during the test from final TSS and COD data. The series of respirometers
employed for each determination used either a constant Xo value or a constant SofXo
ratio, both experimental approaches gave good results.
4.3.2.2 Measurement of J.1max and Ks Using a Low SIX Ratio.
The low SIX ratio method used to determine J.lmax and Ks was that outlined in Cech el
af. ( 1 984). This is a respirometric method in which the biomass growth rate is related
to the immediate change in OUR measured in response to the addition of a known
amount of substrate.
One litre of mixed liquor from the 2.5 day HRT/SRT reactor was aerated in a
respirometer for approximately 30 to 60 minutes or until a stable endogenous OUR was
recorded. The respirometer was reaerated until a dissolved oxygen concentration of
between 6 and 8 g.m-3 was reached, then the aeration was stopped and the OUR
recorded on a chart recorder. Once a measurable straight line was obtained, a known
amount of concentrated substrate was added, and the new OUR recorded. The change
in OUR was detennined from the change in slope of the l ines recorded before and after
substrate addition. At the end of the test, the respirometer was reaerated and after the
OUR had returned to a stable endogenous rate, the process was repeated for other initial
substrate concentrations. At least three runs with different substrate concentrations
were performed so that at least three estimates of J.l were obtained.
Temperature of the mixed liquor was controlled at a constant value (± 0 .5 OC)
throughout the experiment. As the 'biomass used had an SRT of 2.5 days, inhibition of
nitrification during the tests was not considered necessary, as nitrifier growth was not
expected at this short sludge age.
The OUR is related to J.l through an oxygen balance as follows:
YH - YH
� OUR
VSS . O x
(4.6) .

where:
69
VSS = volatile suspended solids concentration in the respirom eter (g.m-3 )
�OUR = change in OUR in response to th e addition of substrate (g 02 .m-3 . d- 1 )
A specific �OUR (g 02 .g cell COD-I.d-I ) can be calculated from the following group of
variables in Equation 4.6 :
. Spi1 0UR i1 OUR
VSS . Ox
(4 .7)
The value of �max was determined from a modified linear pl ot as in the high SIX
m ethod. An example of the results gained from this m ethod is shown in Figure 4 .8 .
One advantage of this m ethod is that since i10UR is proportional to � for a given
respirom eter, a modifi ed linear pl ot of i1 0UR versus volum e of substrate inj ected could
be constructed as the s et of runs progressed and the experim ent c ould be stopped as
soon as the required number of intersecting lines was obtained.
Values estimated for �max and Ks over a period of several m onths are summarised in
Tabl e 4.8 . A value of Y H = 0.68 g cel l COD per g of substrate COD was used in al l
cal culations, as determ ined by respirom etric evaluation and discussed in Section 4.3 .3 .
Either a set of replicate respirometers or a singl e respirometer reinjected several till?:es
was used, both techniques gave conclusive results. In any given respirometer, the OUR
response to additions of a defined amount of substrate was found to be stabl e over a
period of at l east six hours and with as many as ten reinjections of substrate. In this
study the cul ture response did not seem to be particul arly sensitive to aeration or feed
history over a period of several hours, a possible concern that has been raised with this
m ethod (Grady and Phil brook, 1 984).
It can be seen that the resul ts gained seem ed to be variabl e over the peri od of study,
indicating that the m icrobial composition of the m ixed cul ture was changing with time . .
A s the SRT o f the biom ass used was rel ativel y short at 2 .5 days, and due t o the
m ulti component nature of the substrate, significant popUlation shifts coul d be possibl e
over a period of several m onths. It can be seen from results gained on consecutive days
however, as on 1 6, 1 7 and 1 8/ 1 2/92 at 20 oC, that relativel y consistent resul ts c ould be
gained from dail y m easurements, as results for �max ranged from 0.97 to 1 .05 d-I and
Ks from 1 0. 1 to 1 7.3 g.m-3 COD over the three days.

-25 - 1 5
, 1 . 8 � , J-lmax , 1 .6 � _ ___ _ ._. __
1 .4 -: , 1 .2 -: , // , ././ 10 / / /)�J� -� - // ,
�.6:
.4 ..! , ,
. � I , 0.2 .J , -5 5
Substrate Concentration (g COD.m-3 )
Figure 4.8 Modified l inear plot for the estimation of Ilmax .. and Ks using the Low SIX ratio method.
I S 25

Table 4 .8 Estimation of llmax and Ks Using Low SIX Ratios.
Date Temp
°c
1 01 1 2/92 24
1 6/ 1 2/92 1 9
1 71 1 2/92 20
24.5
1 8/ 1 2/92 20
25
71 1 /93 20
271 1 /93 20
25
2911 /93 1 8
20
23
25
27
1 6/3/93 20
1 8/3/93 25
1 1 16/93 20
2 1
Average 20 °C
Average 25 °c
. So Range
(g.m·3 COD)
5 . 3 - 63 .6
4 .55 - 54.6
8 .4 - 33 .6
8 .4 - 33 .6
9 - 36
9 - 36
6 .6 - 46.2
1 3 .8 - 26. 8
1 0.4 - 26.8
1 0 - 23.5
1 0 - 23.5
1 0 - 23 .5
10 - 23.5
10 - 26.8
33 .8 - 270
70 - 280
1 2.6 - 75.6
50.4 - 63 .0
�SpOURmax 11 max
(g02.gCOO· 1 .d· l) (d·l )
0.5 1 - 0.55 1 .09 - 1 . 1 6
0.47 - 0.50 1 .00 - 1 .05
0.47 1 .00
0.60 - 0.63 1 .28 - 1 .3 3
0.46 - 0.47 0.97 - 1 .00
0.75 - 0.80 1 .60 - 1 .70
1 .02 - 1 .06 2. 1 7 - 2.26
0.44 0.94
0.9 1 1 .93
0.57 1 .20
0.72 1 .53
0.83 1 .75
0.83 1 .76
0.98 - 1 .0 1 2 .09 - 2. 1 4
0.235 - 0.245 0.50 - 0.52
0.3 1 - 0.32 0.65 - 0.68
0.43 - 0.44 0.9 1 - 0.94
0.38 0.8 1
0.54 1 . 1 5
0.69 1 .47
7 1
Ks (g.m·3 COO)
1 4 .2 - 1 7 .3
1 5 .5 - 1 7.3
1 0. 1
8 .4 - 9.9
8 . 1 - 9 .9
1 1 .7 - 1 5 .3
33 - 35 .6
5 .5
1 7 .9
1 9. 1
1 9.4
2 1 . 1
1 5 .4
1 9.4 - 20.8
3 5 .4 - 43.9
1 0.7 - 2 1 .3
1 5 .6 - 1 7. 5
3 .4
1 6.9
1 4.4
The temperature dependence of Jlmax and Ks was assessed using a. series of respirometers maintained at different temperatures. At temperatures lower than 1 7 °C
and higher than 27 °c, conclusive results were difficult to obtain. The continuous reactor that was used as a biomass source was operated at ambient temperatures in the laboratory, usually between 20 and 25 °C, so extremes in batch test temperature may

72
have affected the ability of the culture to uti lise the substrate. From the set of data
collected on 291 1 2/92 at temperatures between 1 8 and 27 °C, it can be seen that Ilmax did
increase with increasing temperature. Using the following relationship commonly
applied for the dependence of biological processes on temperature (Metcalf and Eddy,
1 99 1 ):
(T - 20) Ilmax (T) = Ilmax (20) e
where:
T = temperature (oC), with 20°C as the reference point temperature.
e = temperature activity co-efficient.
. .
(4 .8)
An average value of e = 1 .063 was obtained, which compares well to the typical value
of 1 .04 ± 0.04 given in �etcalf and Eddy ( 1 99 1 ) for activated s,lud�;. hi ()fa�s. No
obvious temperature relationship was observed for Ks. • . .
4.3.2.3 Effect of SIX Ratio on the Measurement of I-lmax and Ks.
The averages of estimates obtained for Ilmax and Ks at 20 °C by the high SIX and low
SIX methods are swnmarised in Table 4.9. It can be seen that the magnitude of the
result appears to be dependent on the estimation method used.
The major differences between the two approaches were the SIX ratio and the initial
substrate concentration range used. The SIX ratio affected whether cell replication
would occur or not and the initial substrate concentration would be important if high
substrate concentrations inhibited cell growth. The ranges of these parameters used in
the various methods are also l isted in Table 4.9.
Each method had an . inherent l imit in the So range that could be used, due to the
accuracy of respirometric measurements. For the high SIX method, using low So concentrations such as those below 200 gCOD.m-3 , required that very low biomass
concentrations be used to maintain the required initial SIX ratio. These very low
biomass concentrations resulted in a very low OUR, which was difficult to detennine
accurately. For the low SIX method, the largest value feasible for So was detennined
by the ability of the measuring apparatus to accurately detect the large resultant .10UR.

Table 4 .9 Effect of SIX Ratio on the Estimation of llmax and Ks at 20 ok
I1max :
I1max :
Ks :
Ks :
. I average (d- )
range (d-I )
average (gCOD.m-3 )
range (gCOD.m-3 )
Number of tests performed
Initial Substrate COD, So (g.m-3 )
SdXo Ratio (g COD / g VSS)
High SIX Method Low SIX Method
3.4 1 .2
2.4 - 5 .0 0 .5 -;2.3
1 50 1 7
60 - 380 8 . 1 - 44
4 7
1 80 - 2900 4.5 - 270
2.6 - 24 0 .003 - 0 . 1 5
73
To discount the effect of initial substrate concentration, the low SIX method was repeated using a larger range of So so that highest concentration used was in the same order as the concentrations used in the high SIX method, and so that the range spanned a tenfold increase in So concentration. The results of this test using So values from 33 .8
to 270 g.m-3 soluble COD are shown i n Figure 4_9 and i t can be seen that all the concentrations used gave a common intersection point. Therefore the discrepancy in
I1max and Ks results given by the two different methods is unlikely to be caused by the choice of So.
It i s then indicated that the values obtained for Ilmax and Ks are affected by whether cell repl ication occurs or not. This is in agreement with the results obtained by Chudoba et
al. ( 1 992), who reported higher values for both Ilmax and Ks when a high SIX ratio method was used. The reported magnitude of difference between values estimated by the two methods using various pure substrates, is also similar to the results found in this study_
The reason proposed for the higher values of Ilmax and Ks obtained from a high SIX method, is that only faster growing species in the mixed culture will replicate within the · time frame of the test (Chudoba et al. , 1 992; Grady et al., 1 996)_ The estimates of kinetic parameters gained will therefore pertain to a culture with a higher proportion of faster growing species than the original mixed culture. It is therefore recomrpended that low SIX methods be used for obtaining representative data on mixed cultures.

0.7 '
0 .6 '
0 .5 !lmax
',� 0.4 �
-300 -250 -200 - 1 50 - 1 00 -50 o 5 0
Substrate Concentration (gCOD.m-3 )
Figure 4.9 Use of a wide range of initial substrate concentrations to determine Umax and Ks using the Low SIX ratio method.
/ /
1 00

,
1 L \.,
4.3.3 Measurement of Growth Yield. Y H
75
Several methods are reported for the estimation of heterotrophic biomass growth yield,
Y. All the estimated yield values made in this study were calculated on a COD basis
(Y H), where Y H is equal to g .cell COD produced per g.substrate COD consumed .
4.3.3. 1 Y H from Batch Growth Tests
The traditional growth test involved measuring the increase In cell mass and
corresponding decrease in substrate concentration. This is the basis of the method
outlined in Henze et af. ( 1 987). In this method a small amount of settled biomass is
used to seed a known volume of filtered wastewater. The total and soluble COD are
measured periodically and the cell yield calculated from the following two equations :
Cell COD (g.m·3 ) = Total COD (g.m-3 ) - Soluble COD (g.m-3 )
11 cell COD
11 soluble COD
(4.9)
(4. 1 0)
Batch tests were carried out in a series of respirometers at either 20°C or 25°C with
varying initial COD concentrations. The initial substrate concentration in the
respirometers varied between 225 and 1 500 g.m-3 soluble COD and the initial SIX ratio
ranged from 2.6 to 25.6, to ensure that cell replication would occur. There was not
expected to be any effect of batch test temperature on the value obtained for Y H, as Y H has not been found to be significantly dependent on temperature or sludge age (Henze et
al. 1 987, Sollfrank and Gujer, 1 99 1 ). The values that were obtained for Y H using batch
growth tests are l isted in Table 4. 1 0.
The results ranged between 0.48 and 0.7 1 with an average calculated to be 0.62 ± 0. 1 1 g
cell COD/g substrate COD. These results were comparable to those reported elsewhere '
using different substrates and biomass compositions: Orhon et af. ( 1 993) reported
values of Y from 0.4 1 to 0.538 g VSS/g COD using a high SIX method and dairy
processing wastewaters, which is equivalent to Y H = 0.58 to 0.76 g �ell COD/g
substrate COD consumed, if a value of 1 .42 g COD per g VSS is assumed. Sollfrank
and Gujer ( 1 99 1 ) obtained an average value of Y H = 0.64 ± 0.4 (low SIX method) and
Henze et al. ( 1 987) suggest a typical value of Y H = 0.67 (no method specified), both for
domestic wastewater substrates.

76
Table 4 . 1 0 Estimation of Y H from batch gro\vt:h tests.
Time 4 5 6 7
(hours)
Date So SofXo
301 1 1 192 550 6 .0 0.67 0.59 0.57 0 .64
2/ 1 2/92 350 3 .9 0 .58 0.65 0.57
8/1 2/92 400 2.6 0.65 0.68 0 .70
8/ 1 2/92 320 2.7 0.68 0.70 0.7 1
301 1 2/92 1 3 50 1 1 .6 0.58 0.66
8/1 /93 990 8 .6 0.66
1 14/93 1 300 1 0 0.48
1 14/93 900 1 0 0.60
1 14/93 620 1 0 0.63
25/5/93 1 500 25
25/5/93 1 500 25
25/5/93 740 1 3 0.68
25/5/93 740 1 3 0.62
Average:
8 24 Average
YH ,
0.62 0 .62
0 .57 0 .59
0.65 0 .67
0.68 0.69
0.68 0.64
0.68 0 .67
0.66 0.48 0.54
0.48 0.50 0 .53
0 .57 0.54 0.58
0.67 0.68 0.68
0 .57 0 .59 0 . 58
0.63 0.54 0 .62
0 .58 0 .59 0 .60
0.62
±0. 1 1
Some uncertainty may have been introduced in this method of estimation for Y H due to the nature of the substrate. From Equation 4.9 it is assumed that all the insoluble COD
is due to biomass, but from batch COD removal test data reported later in this chapter, it is apparent that some of the insoluble COD may be due to substrate adsorbed onto the cells. This would result in an overestimation of the value of Y H, however as no clear increasing trend is observed in the value obtained for Y H at increasing So' concentrations, the effect of adsorbed substrate was assumed to be not significant.

i. i"
77
4.3.3.2 Y H Estimated From Batch Respirometric Tests
Both Cech el at. ( 1 984) and Soli frank and Gujer ( 1 99 1 ) recommend measuring Y H from an indirect method relating oxygen consumption to COD degraded in a batch test as fol lows :
biomass produced substrate consumed
= 1 -02 consumed (4 . 1 1 )
substrate COD consumed
Conditions in the batch tests are such that cel l replication does not occur. The above methods outline how Y H can be determined at the same time as Jlmax and Ks or Ss are determined.
General ly the amount of substrate added in the low SIX determination of Jlmax and Ks was such that the culture did not return to an endogenous OUR before the DO in the respirometer had dropped to 1 g.m-3. Therefore the method illustrated in Cech el at.
( 1 984) was not used at this stage.
If the data in Table 4.5 from the estimation of Ss are used and COD degraded is assumed to be equivalent to COD added, then the method outlined by Sollfank and Gujer ( 1 99 1 ) can be used to obtain the values for Y H listed in Table 4 . 1 1 . This method gave a value for Y H of 0.70 ± 0_05 (g cell COD produced per g substrate COD consumed)_ The average value of the three closest replicates, Y H = 0.68 was used' in other respirometric test calculations_
Table 4 . 1 1 Estimation of YH from Oxygen Consumption During Ss Detennination.
Date gj22 consumed YH g COD added (g cell COD.g substrate COD-I )
1 7/3/93 0.33 0.67
1 8/3/93 0.32 0.68
25/3/93 0.25 0.75
3 1 /3/93 0.30 0 .70
The assumption that COD degraded is equivalent to COD added seems reasonable, as only sohible COD was added in the Ss test, and if the COD degraded was less, then the

78
resultant value for Y H would be even higher, which seems unlikely considering other published literature values already stated. Also the wastewater characterisation studies implied that virtual ly all the soluble wastewater was degraded during the batch test.
4.3.3.3 Comparison of Y H Estimates From Different Methods
The method for estimation of Y H seemed to affect the value obtained. As for the ).lmax and Ks results, batch tests in which cell replication occur seemed to give different results to those in which replication did not occur. In this case the average Y H value of 0.6 1 from batch growth tests was lower than the value of Y H = 0.68 obtained from oxygen consumption data. Chudoba et al. ( 1 992) also found that Y H depended on
SolXo ratio, with lower Y H values as SolXo increased. This was explained as being due to more substrate being oxidised for energy and therefore less substrate being channelled into cell mass during cel l replication 'growth' than during substrate accumulation and storage 'growth'.
The Y H value that was used in the calculations for Ss, ).lmax and Ks depended on the type of experiment used. F or the respirometric estimation of Ss, ).lmax and Ks at low SIX ratios, the respirometrically determined value of Y H = 0.68 was used. For the determination of ).lmax and Ks at high SIX ratios, the average value of Y H measured on the set of respirometers from COD and TSS data was used, as listed in Table 4. 1 0 . In this manner the 'growth' yield value that was used in the calculation corresponded to the 'growth' response measured in the test.
4.4 Lactose Removal Rate
As the readily biodegradable fraction of the wastewater was estimated to be due to the presence of lactose, the ability of the mixed culture to remove lactose was assessed.
The rate of removal of lactose by acclimated biomass was measured by adding known amounts of lactose to a series of aerated respirometers, each containing one l itre of continuous reactor mixed l iquor and maintained at 20 °C. Initial target concentrations . of between 200 and 800 g lactose.m-3 and 1 530 to 1 620 g VSS.m-3 were used. Samples were withdrawn every 60 minutes and immediately filtered through a 0.45 ).lm membrane filter, the lactose content being determined using HPLC.

800
700 ..-":' E 600 er: '--' t: 500 0 :;: � l-- 400 t: C.) u t: C 300 U � en 0
200 -u � � 1 00
0
0 5 0 1 00 1 50 200 250 3 00 3 5 0
Time (minutes)
Figure 4 . 1 0: Lactose removal rates during batch tests with varying initial lactose concentrations.
� -� l- --- � � � 0 00 E � 00 l- > QJ b1) en 0 QJ -U en C':I 0 -� u u C':I
l;::: � .c; b1) QJ '-' c.. rJ)
1 .8
1 .6
1 .4
1 .2
0 . 8
0 .6
0 .4
0 .2
o
o 1 00 200 3 00 400 5 00 600 700 800
Initial Lactose concentration (g.m-3)
Figure 4. I I : Effect of initial lactose concentration on removal rate in batch tests.
79

80
A plot of lactose concentration versus time for each batch test is shown in Figure 4. 1 0.
From a regression analysis of the data, it was found that the data were best described
using a zero order equation, hence linear lactose removal rate constants were calculated as listed in Table 4. 1 2.
Table 4. 1 2 Lactose Removal Rates at Varying Initial Concentrations.
Target Initial Lactose 200 400 600
Concentration (g.m-3 )
Initial VSS in Respirometer 1 530 1 550 1 6 1 0
(g.m-3 ) Removal Rate 1 .58 1 .46 1 .37
(g. lactose.m -3 . - I ) .mIn
Specific Removal Rate 1 .49 1 .36 1 .23
(g lactose. g VSS- I .d- I )
R2 for linear regression 0.99 0.99 0.99
R2 for log regression 0.96 0.83 0.95
800
1 620
1 .2 1
1 .08
0 .99
0.94
It is indicated that removal rate was dependent on initial lactose concentration with faster removals being observed at lower initial substrate levels. The reduction in removal rate appeared to be a l inear function of initial lactose concentration as shown-in Figure 4. 1 1 . Using a lactose COD content of 1 . 1 2 g COD/g lactose, the above data corresponds to COD removal rates of between 1 .2 and 1 .7 g COD.g VSS-I .d- I .
4.5 COD Removal Rate
The rate of soluble COD removal by the acclimated microorganisms was also determined by batch tests. A known amount of concentrated, GFC filtered substrate was added to a series of respirometers to give initial COD concentrations of between 400 and 1 600 g.m-3 . Samples were withdrawn approximately half hourly and immediately filtered using GFC filters, the COD was then determined on the filtrate .. The resultant COD profiles are shown in Figure 4. 1 2, with the values at time t=O minutes representing the theoretical initial soluble COD concentration in solution due to the volume of concentrated substrate injected.

8 1
It can be seen that a greater proportion of the COD appeared to be removed in the first
30 minute time interval, followed by a linear removal rate until a level of approximately
1 00 g.m-3 soluble COD was reached. A regression analysis was performed using the
data during the linear phase only, resulting in the removal rates l isted in Table 4. 1 3 . A
comparison of R2 values indicated that COD removal was best described as a zero order
process, although the data could also have been adequately described by a first order
relationship. From the results obtained, there was no definite effect seen of initial substrate concentration on removal rate. When the COD remaining in solution had
decreased to about 1 00 g.m-3, the removal rate declined significantly, indicating that
different removal mechanisms were operating at low COD concentrations.
1 600
1 400
-.. 1 200 '7 E oil 1 000 '-"
� 0 800 U �
600 :c ::: -0 400 If)
200
0
0 50 1 00 1 50 200 250 3 00 350
Time (minutes)
Figure 4. 1 2: Soluble COD removal rates during batch tests at varying initial soluble COD concentrations.
The greater mass of COD appearing to be removed from solution in the first 3 0 minute time interval was thought to be due to the adsorption of substrate onto the biomass when initially mixed in the respirometer. This mechanism of COD removal has been observed to be significant by other researchers (Chiesa et aI. , 1 985; Bunch and Griffin, 1 987; Goronszy and Eckenfelder, 1 986; Rensink and Donker, 1 99 1 ; Pujol and Canler, 1 992). If the regression l ine is used to predict a soluble COD concentration at t=O minutes, then the amount of COD initially removed by adsorption can be calculated in

82
each test. It can be seen from Table 4. 1 3 that the mass of COD adsorbed per mass of
suspended solids in the respirometer increased as the initial COO concentration
increased, which would be expected as generally the amount adsorbed per unit weight
of adsorbant is a function of the concentration of adsorbate (Metcalf & Eddy, 1 99 1 ).
The substrate COD removal rate was lower than the lactose removal rate, as would De
expected due to the presence of other more slowly degraded compounds present in the
substrate. The specific removal rates determined above indicate that the substrate
would be amenable to activated sludge treatment given the usual design loadings of 0.2
to 0.6 g BOD. g TSS- 1 .d- I suggested in Metcalf and Eddy ( 1 99 1 ), assuming an average
BOD:COD ratio of around 0 .5 (Marshall and Harper, 1 984).
Table 4. 1 3 Soluble COD Removal Rates at Varying Initial Concentrations.
Soluble COD added 400
(g sCOD.m-3)
VSS in Respirometer 2490
(g.m-3 )
Initial Biosorption 0.0 1 6
(gCOD.gVSS- 1 )
Removal Rate 1 .62
(g.sCOD.m-3 .min- l )
Specific Removal Rate 0.94
(g sCaD. g vss-l .d-l )
R2 for linear regression 0.99
R2 for log regression 0.98
4.6 Continuous Reactor.
800 1 200 1 600
2630 2930 2850
0 .075 0.083 0. 1 0 1
1 .82 1 .56 2.24
1 .00 0 .77 1 . 1 3
0 .97 0.95 0 .89
0.84 0.94 0.89
To provide acclimated biomass for the batch tests described in this chapter, a small
scale continuous reactor without cell recycle was operated for the duration of the
biokinetic investigations. The reactor was originally seeded with a mixed culture .
obtained from a full scale dairy wastewater treatment facility and its performance in
terms of biomass concentration and COD removal was monitored during two intervals
of its operation.

83
4.6.1 Continuous Reactor Operation.
The reactor comprised .of a 6.25 litre working volume, mixed and aerated vessel with a
SRT and HRT of 2.5 days. It was continuously fed with the synthetic substrate as
defined in Table 4.3, except that the feed stream was more concentrated, having a total
COD of 3750 g.m-3 to provide a loading rate of 1 .5g COD per litre of reactor volume
per day_ At lower feed concentrations the resultant biomass concentration in the reactor
was not sufficient to provide the required mass of cells for batch tests.
The continuous reactor was operated at a short SRT so that the growth of nitrifiers was
l ikely to be negligible at the initial level of organic carbon used_ Therefore inhibition of
nitrification was not considered necessary in the batch tests described in this chapter
and all of the OUR in the batch tests was assumed to be due to the activity if
heterotrophic microorganisms.
4.6.2 Continuous Reactor Treatment Performance.
The performance of the reactor in terms of COD removal and mixed liquor
concentration was monitored during two intervals of its operation. The results obtained
are listed in Table 4. 1 4.
S imilar results were seen for the two periods monitored, the TSS levels being slightly
higher in the second period due to a small increase measured in influent COD concentration. The overall soluble COD removals were very high, up to 93%. This was
to be expected considering the highly degradable nature of the wastewater. The effluent
produced was turbid due to the presence of dispersed suspended biomass, which did not
readily settle out of the liquid. The mixed l iquor was a predominantly a yellow colour,
but varied occasionally through to a more orange hue, indicating that the composition of
the culture was probably changing.

84
Table 4. 1 4 2 .5 day HRT/SRT Continuous Reactor Performance
November 1 992
Reactor feed characteristics
pH 1 1 .0
Flowrate (m3.d- l ) 2.5 x 1 0-3
Total COD (g.m-3 ) 3700
Soluble COD (g.m-3 ) 2750
COD Loading Rate (g COD. rl .d- l ) 1 .48
Reactor mixed liquor I effluent characteristics
pH
TS (g.m-3 )
TSS (g.m-3 )
VSS (g.m-3 )
Total COD (g.m-3 )
Soluble COD (g.m-3 )
Overall performance
FIM (gCOD.gVSS-1 .d- l )
Soluble COD removal (%)
4.7 Discussion
8.3
1 640
1 220
1 1 00
2 1 00
270
1 .35
90 I
January 1 993
1 1 .0
2 .5 X 1 0-3
3900
2900
1 .56
7.4
1 820
1 470
1 440
2450
2 1 0
1 .08
93 I
This chapter investigated the biodegradability of a wastewater designed to be
representative of that from a typical milk processing facility involved in the
manufacture of butter and milk powder. A substrate with a COD, lactose, fat and N
content very similar to the typical 'real' wastewater could be achieved using a mixture of
milk powders and butter, as the actual wastewaters comprise predominantly of diluted
milk and milk products.
The wastewater had an total COD of 2200 g.m-3, of which 75% was attributable to GFC
filterable organics. The high turbidity and significant soluble COD fraction between

8 5
0.45 and 1 11m (400 gCOD.m,3) indicated the presence o f dispersed and colloidal material as well as dissolved organic matter.
The wastewater degradabil ity was characterised according to the oxygen uptake rate response of an acclimated mixed culture with almost al l the GFC filterable organics being degraded within a matter of hours. The wastewater characterisation results could be provisionally related to substrate components on the basis of molecular weight.
The organic matter in dairy processing wastewaters consists almost entirely of either lactose, milk proteins or milk fats (Walstra and Jenness, 1 984). In the synthetic wastewater the lowest molecular weight fraction, lactose, comprised about 80% of the readily biodegradable COD fraction (Ss ) which is able to be directly metabolised by cells (Henze, 1 992). The fat content of milk exists as micelles, with particle sizes covering a wide range from 0. 1 11m to 1 011m. Due to their size distribution, approximately 97% of the fat content of milk would be 'insoluble' when GFC filtered, and would be expected to form part of the 'particulate' slowly hydrolysable fraction, Xs. Over half of the COD of the Xs fraction (57%) could be attributed to milk fats.
The remaining major milk component, protein, consists of casein micelles in dispersion (80%) and soluble whey proteins ( 1 9%) with molecular weights ranging from 1 8,500 to 23 ,500. The proteins were expected to contribute to both the Ss, Xs and rapidly hydrolysable (SH) fractions. The whey proteins . probably contributed to the more biodegradable fractions due to their smaller size and soluble nature. The inert fractions, both soluble and particulate were assumed to be not significant due to the nature of the waste and a COD balance of milk components and negligible concentration of nonvolatiles concurred with this assumption.
Typical values of iSs and iSH for raw domestic wastewater COD have been reported by Henze ( 1 992) to be 1 0- 1 5% readily biodegradable and 1 5-25% rapidly hydrolysable. The substrate used in this study was found to have an average iSs of 42.5% and f SH of 28 .5%, therefore this dairy wastewater has a significantly higher readily biodegradable . fraction than typical domestic wastewaters.
The performance of both batch and continuous tests III terms of soluble substrate removal was measured. Up to 93% of influent soluble COD was removed in a 2.5 day HRT/SRT continuous reactor. The total influent COD removal could not be assessed due to the high level of suspended solids in the effluent. Batch lactose and soluble substrate removal rate tests resulted in specific COD removal rates of up to 1 .69 and

86
0.89 gCOD.gTSS-1 .d- 1 respectively. The lactose removal rates were higher than for the substrate as expected, because lactose forms the most readily biodegradable fraction of the substrate, as already discussed. These removal rates indicate that the wastewater is amenable to activated sludge treatment and other high organically loaded! high rate methods of aerobic treatment.
Estimates were gained for the biokinetic parameters Y H, Jlmax and Ks of the acclimated biomass. The values gained depended on the initial SIX ratio in the batch test used for the determination.
A verage values of Jlmax and Ks ranged from 1 .2 d-1 and 1 7 g.m-3 C OD at low SIX ratio, to 3 .4 d- 1 and 1 50 g.m-3 COD at high SIX ratio. In a summary paper, Henze et af. ( 1 987) gave typical values for Jlmax and Ks of 6 d-1 and 20 g.m-3 COD respectively for activated sludge treatment of domestic wastewater (no method specified). Sollfrank and Gujer ( 1 99 1 ) gave values of 1 .5 d- 1 and 5 g COD.m-3 using a low SIX method on domestic wastewater. Dairy wastewater values (Orhon et af. , 1 993) have been reported as 3 .3 d-1 and 74 g.m-3 COD using a high SIX method. The average results from this study, depending on determination method used, are therefore not substantially different to other published values and the magnitudes of Jlmax and Ks for dairy processing wastewaters seem to be similar to those obtained for domestic wastewaters.
The average yield value in COD terms, Y H, was calculated to be 0.61 (± 0.08) g cell COD per g substrate COD when high SIX methods were used and 0.68 when low SIX methods were used. These results are similar to other published values for Y H (Henze et af. , 1 987; Sollfrank and Gujer, 1 99 1 ).
As the values obtained for kinetic parameters were dependent upon the estimation method used, there must be some question about the appropriateness of the methods used. Several authors (Chudoba, 1 990; Peil and Gaudy, 1 97 1 ) have questioned the validity of using Monod kinetics at all for mixed cultures growing on multicomponent substrates. Also the concept of measuring 'growth' rate as a response which does not involve cell replication has been a matter of much debate, as summarised in Chudoba et
af. ( 1 992) and Grady et al. ( 1 996).
Although 'Monod' kinetics may not be strictly applicable to mixed cultures and· multi component substrates, the fact that conclusive results could be obtained for Jlmax and Ks from the methodology employed, indicate that a Monod type hyperbolic expression does indeed describe the relationship between biomass 'growth' response and

87
substrate concentration in this case.
The argument of whether the methods used are valid or not, should really depend on
what the end user wishes to utilise the kinetic data for. In activated sludge modelling it
is important to be able to measure the response of an acclimated mixed culture to
various substrate concentrations under typical activated sludge operating conditions.
The kinetic values are of use only in being able to accurately predict the most important
plant performance characteristics: particularly the oxygen requirement, and to a lesser
extent, the mixed liquor suspended solids concentration.
The actual value obtained for Jlmax is not critical for the operation of the activated sludge
plant as it is general practice to operate at SRTs much greater than the minimum value
indicated by Jlmax. Being able to detect significant culture shifts or changes in affinity
of the biomass for substrate is more important than the actual numerical value gained.
The actual srx ratio experienced by the biomass in a conventional activated sludge
system is also very low. So it would seem reasonable that a low SIX method would be
more appropriate for determining the response of the culture in a state more closely
matched to actual treatment plant conditions.
At srx ratios below 2, the 'growth' response measured is due to energy util ised for the
accumulation and storage of substrate by the biomass (Chudoba et af. , 1 992). As the
initial srx ratio rises above the 2-4 range, substrate is utilised for cell replication,
process which requires more energy to be expended than for substrate storage.
Therefore the cell yield value obtained will depend on initial srx ratio in the test. In the
short period of time employed in a batch growth test, only the faster growing
microorganisms wil l multiply, so that at the end of the test the mixed culture will have a
different composition from the original culture, with a higher proportion of faster
growing species. Therefore the value of Jlmax and Ks obtained wil l also depend on the
initial srx ratio. As it is the response of the original mixed culture to applied substrate
that is of interest, a low srx method is the only manner in which the biomass can be
studied without population shifts occurring.
This study used respirometric methods for the estimation of kinetic constants, that is,
the parameters of interest were determined from the oxygen uptake rate of the biomass
in response to different substrate concentrations. Other commonly used methods either
measure the increase in cell mass, or the decrease in substrate concentration.
Respirometry may be an indirect method of measuring the cell 'growth' response,
however it was deemed to be appropriate in this case as the oxygen consumption rate is

88
more critical in the operation of real activated sludge systems than substrate removal
rates (Henze et aI. , 1 987), and more representative of the mixed culture under study.
Therefore, it is bel ieved that the methods utilised for the estimation of biokinetic
parameters were appropriate and valid for the proposed end use of the data in this study.
The values obtained for the kinetic constants can only really be considered as a range of
values, rather than an absolute value due to the multi component nature of the substrate
and mixed microbial composition of the biomass. The results gained for Ilmax and Ks by
the low SIX method varied over a period of 6 months from 0.5 to 2.3 d- I and 8 . 1 to 44 g.m-3 COD respectively. The colour of the mixed liquor in the continuous reactor also
varied over the period of time that the experiments were carried out, indicating that a
stable 'steady' state had not been reached even after 70 SRTs. The occurrence of
population shifts with time was probably contributed to by the lack of temperature
control in the reactor which was operated at ambient temperatures in the laboratory,
varying between 20 and 25 °C.
The consistently high substrate removal performance in the batch reactor supported the
assessment of a high degree and rate of biodegradabil ity made in the substrate
characterisation and removal tests. The dairy processing wastewater resulted in
biomass with similar biokinetic parameters as found for domestic wastewaters, but
improved biodegradability indicated that treatment systems with shorter residence times
and producing a higher quality effluent in terms of organics removal may be possible
with dairy processing effluents than those of domestic origin.
4.8 Conclusions
A synthetic substrate was designed for use in this study, which had a similar cob, lactose, fat and N content as a typical wastewater from a butter and milk powder
production facility.
Initial biodegradability studies demonstrated that the substrate to be used was easily and
rapidly biodegraded. The organic matter in the substrate was detennined to be_
predominantly soluble: with 42.5% of the total COD being readily biodegradable,
mostly due to lactose; and a further 28.5% of the COD being rapidly hydrolysable, due
to the presence of the milk proteins. The remaining 29% of COD was more slowly
biodegradable, due to milk fat and larger milk proteins in the substrate.

89
The biokinetic parameters measured for microbial growth on the substrate also
indicated a h ighly degradable wastewater. Respirometric methods were used to
determine average values of 11 max = 1 . 1 5 d- I , Ks = 1 7 g.m-3 COD and YH = 0.68 g cell
COD per g substrate COD. Both low SIX and high SIX methods were used to
detem1 ine biokinetic parameters, the low SIX method being preferred as it would not
involve population shifts in the mixed culture.
Substrate removal rates in both batch and continuous tests indicated that a good quality
effluent in terms of COD removal was achievable in a relatively short time period,
suggesting that relatively highly loaded systems were an option with this wastewater.
Specific substrate removal rates of up to 1 .4 g lactose.gTSS- 1 .d- 1 and 0.9 g soluble
COD.gTSS- 1 .d- 1 were measured with a total of 93% soluble COD removal being
achieved in a 2.5d HRT/SRT continuous reactor.
Substrate characterisation tests usmg acclimated biomass suggested that dairy
processing wastewater was highly and rapidly biodegradable, with negligible inert or
recalcitrant organic matter. It is indicated that the wastewater would be amenable to
activated sludge treatment and that a high quality effluent in terms of organic matter
removal should be readily achievable.

90

CHAPTER 5
MODEL ACTIV A TED SLUDGE PERFORMANCE
5.1 Introduction
9 1
Having defined and characterised the substrate to be used, the next stage of the study was to develop a laboratory scale activated sludge reactor for the treatment of the synthetic wastewater. As the wastewater had a high proportion of readily biodegradable substrate, a relatively short hydraulic residence time would be possible. Biokinetic data had established a maximum specific growth rate of 1 . 1 5 d- 1 , which would also have allowed a very short solids residence time, however more conventional SRTs were considered to be more appropriate, especially as this would pennit nitrification to also take place_
The reactor configuration to be used was a conventional completely mixed reactor with external settler, and although some other researchers have reported filamentous bulking problems with dairy processing wastewaters, the suspended growth treatment plants currently operating in NZ also employ this configuration_
The treatment perfonnance and reactor operation at different reactor solids retention times (SRT) was investigated, as well as the effect of variations in organic loading. The main features to be studied for the various operating regimes were: treatment efficiency in tenns of COD and TSS removal; substrate removal rates; and biokinetic parameters of the mixed culture.
5.2 Reactor Configuration and Operating Characteristics.
A conventional activated sludge reactor configuration was used, as shown in-Figure 5 . 1 , consisting o f a completely mixed aerated reactor with a working volume of 1 0 litres and a 1 .75 I settler. The wastewater flowrate to the system was maintained at 1 0 l .d-1 ,

Air supply Agitation
Excess sludge
Reactor
Feed Reservoir Return Activated Sludge
Figure 5. 1 Reactor configuration during the convention�1 CSTR Trials.
Settler
Effluent Receiver

93
giving a HRT of 1 day and hydraulic loading of 2.2 kgCOD.m-3d- 1 at the average
measured feed concentration of 2200 g.m-3 COD. Temperature in the aerated reactor
was controlled to 25 . (± 0. 1 ) °c and an air flowrate of 7 l .min- 1 was maintained
throughout all subsequent trials.
A range of SRTs from 5 to 30 days were used, with the sludge age being based on the
reactor contents only, as generally the mass of microorganisms in the clarifier was
negligible compared to that in the reactor. The average value obtained for Ilmax of 1 .2 d-1 in initial batch studies i�dicated that quite short SRTs were possible with this
wastewater, however more conventional sludge ages were chosen that would support a
nitrifying biomass. The sludge wastage regime used to maintain the desired S RT was
dependant on the length of the sludge age. For the 5 day and 1 0 day SRT trials, sludge
wastage was achieved by continuously withdrawing mixed liquor from the reactor
vessel . For the 20 and 30 day SRT trials, the required biomass was removed once daily
from reactor. The wastage regimes were in accordance with the recommendations made
by Marais and Ekama ( 1 976) and were calculated taking the suspended solids in the
effluent stream into account:
SRT (days) = VE XF + Vw XR
where:
= Volume of reactor (m3)
= TSS in reactor (g.m-3) . 3 = Volume of effluent produces per day (m )
= TSS of effluent (g.m-3)
= Volume of reactor mixed liquor wasted per day (m3)
(5. 1 )
The reactor feed was made up daily, consisting of 1 .5g of butter, 6.5g of whole milk powder and 7.0g of skim milk powder in 1 0 litres of tap water. The wastewater was
adj usted to a final pH of 1 1 .0 using O.SN NaOH solution. Refrigeration of the feed was
not deemed necessary as measurement of the pH and COD over a 24 hour period .
indicated that the wastewater was stable at room temperature for that length of time.
The feed containers were washed thoroughly each day to prevent microbial
contamination and all pump tubing and reactor walls were regularly cleaned to remove
wall growth.
The return activated sludge (RAS) flowrate was varied as necessary to .... maintain a
minimum volume of settled sludge in the clarifier.

94
5.3 Activated Sludge Reactor Sta rt-up Proced u re.
The activated sludge reactor used in each SRT trial was seeded with biomass from the
2 .5 day HRT/SRT reactor. The reactor was usually batch fed for up to five days to
increase the mass of cells in the reactor and to encourage flocculant growth, then
continuously fed at the desired flowrate of 1 0 lid. Sludge wastage began after the
suspended solids in the reactor reached about 3000 g. m-3 and effluent TSS had dropped below approximately 1 00 g.m-3 TSS, indicating that a well flocculating biomass had
been formed.
5.4 Reactor Performance a t Varying SRT
A total of four trials were conducted with SRTs at 5, 1 0, 20 and 30 days. Reactor contents, feed and effluent streams were monitored daily. Each trial was continued for as long as possible until system failure occurred, which in each case was due to filamentous bacterial growth causing excessive washout of biomass in the effluent stream. It was intended to operate each reactor for approximately 3 SRTs until a 'psuedo steady state' was reached prior to assessing performance, however most trials failed before this length of time, so the data is presented as the number of days of operation at the target SRT.
5.4.1 Reactor Conditions.
The average reactor TSS concentration was dependent on system SRT, with an increase in TSS accompanying an increase in SRT. The average mixed liquor concentrations that were achieved after TSS had stabilised and before system failure occurred can be seen in Figure 5_2 and are summarised in Table 5 . 1 . The average vssrrss ratio measured during each trial appeared to have a decreasing trend with increasing SRT, however the results were not significantly different when 95% confidence intervals were compared. The resultant substrate loading, or food:microorganism (F/M) ratio in each trial was calculated from the following equation as given in Metcalf & Eddy' ( 1 99 1 ) :
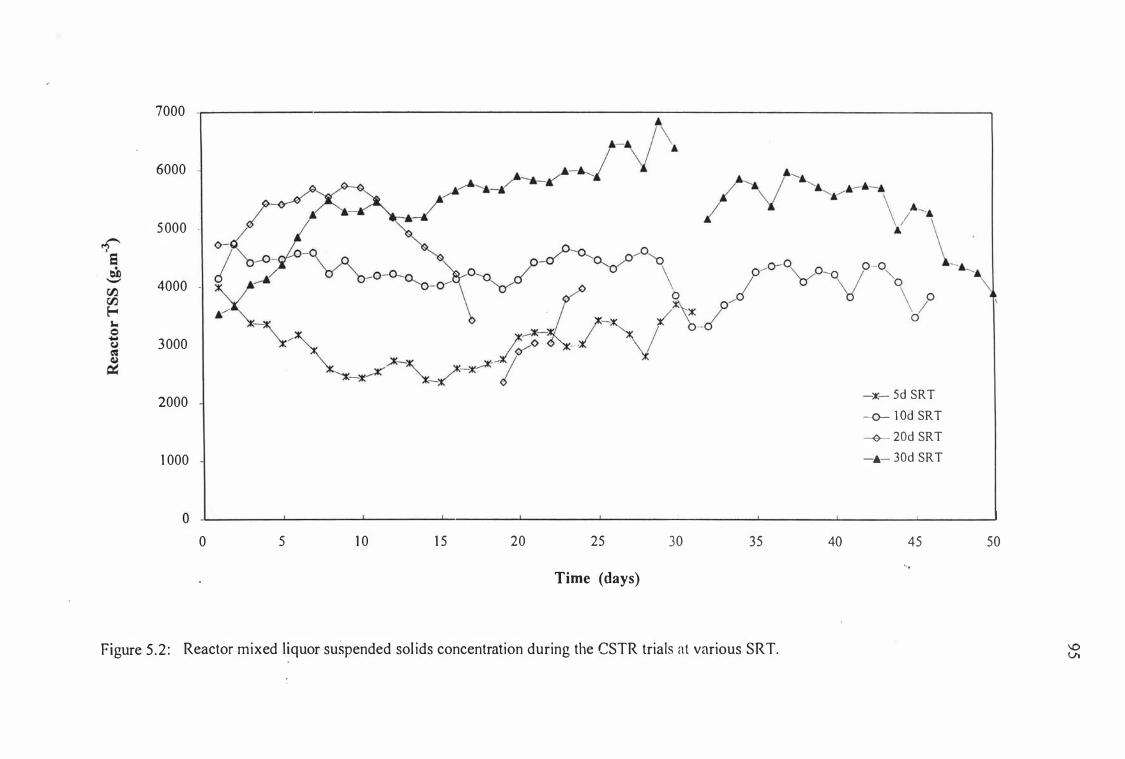
7000 -.---------------------------------------------------------------------------�
6000 -
5 000 .
4000 -
3000
2000 -;(- 5d SRT
-o- l Od SRT
-<)- 20d SRT
1 000 -.- 30d SRT
o _L-____ � ______ � ______ � ______ � ______ � ______ � ______ � ______ � ____ � ______ � o 5 1 0 1 5 20 25 30 35
Time (days)
Figure 5 . 2 : Reactor mixed liquor suspended sol ids concentration during the CSTR trials at various SRT.
40 45 50 '"

96
FIM = So Q
XR V
where:
So = influent COD concentration (g.m-3)
Q = influent flo'V.rrate (m-3• d- 1 )
XR = VSS concentration in the aeration tank (g.m-3)
V = volume of the aeration tank (m3)
(5.2)
At an HRT of 1 day and influent COD concentration of 2200 g.m-3, average FIM ratios
of between 0.46 and 0.82 gCOD.gVSS- 1 • d- 1 were calculated, with the FIM ratio
increasing as SR T and reactor VSS decreased. These F 1M ratios represent typical
design values for completely mixed activated sludge systems as given in Stevens and
Elkin ( 1 984) and Metcalf and Eddy ( 1 99 1 ) .
The average pH in the reactors ranged from 7.60 to 7.75, similar to that found for dairy
wastewater treatment by Adamse ( l 968c), indicating that there was sufficient buffering
capacity in the system. Biomass concentrations and average substrate loadings during
each trial are listed in Table 5 . 1 .
Table 5.1 Reactor Mixed liquor Conditions at Different SRTs.
Target SRT (days) 5 1 0 20
Reactor pH 7.60 7.60 7.75
Average TSS (g.m-3) 3020 4220 4570
TSS Range (g.m-3) 2360 - 4000 3320 - 4740 2360 - 5740
vssrrss Ratio 0.92 ± 0.06 0.92 ± 0.05 0.90 ± 0.05
Average FIM 0.82 0.57 0.57 (gCOD.gVSS-1 • d- I)
5.4.2 Reactor Effluent Quality.
�
30
7.60
5470
3 540 - 6850
0 .89 ± 0.05
0.46
A high quality effluent in tenns of COD and TSS concentrations was achieved during
all four SRTs trialed, as shown in Figures 5 .3 to 5 .6. Total COD removed by the

Figure 5 .3 : . Reactor effluent quality during the 5 day SRT trial .

500
450
400
3 50
.r-a 300 � --
00 250 00 � ... � 200 Q
0 U 1 50
1 00
50
0
0
" " "
,� ... , I ' ,
. . . . . . � � � . . . . . . . � . . . . . � . . ,
1 0 20 3 0
Time (days)
Figure 5 .4: Reactor effluent quality during the 1 0 day SRT trial .
� "
� ,. , ,
:0- , � , •
t , "
, : . ' ' {J " :
: . : ' : " ,.
+ .• ' .- +
40
- , .-
- -8·--· Reactor Soluble COD
---*- Efnucnt Total COD
- - ... - - Efnucnt TSS
•
50 60
.. ,

400
350
300
.r 8 250 � --
rJ:J rJ:J 200 E-4 a.. =
Q 1 50 0 U
1 00
50
0
0 2 4 6
Figure 5 .5 : Reactor effluent quality during the 20d SRT trial .
-e-- Reactor Soluble COD -lIE- Effluent Total COD
--+- Effluent TSS
8 1 0 1 2 1 4 1 6 1 8 20
Time (days)

600
5 00
tif' 400
6 � --
00 00 300 �
... Q � 0 U 200
1 00
0
0 5 1 0 1 5
Figure 5 .6: Reactor effluent quality during the 3 0d SRT trial
0 0
-a- Reactor Soluble COD
� Effluent Total COD
-+-- Effluent TSS
�
/ 20 25 3 0 3 5 40 45 50
Days at SRT

1 0 1
activated sludge systems ranged from 93% to 96%, with an average of up to 34% of the
effluent COD due to the presence suspended solids. The reactor soluble CODs were
decreased from a feed strength of 1 650 g.m·3 to averages ranging from 79 g.m·3 to 1 1 7
g.m·3 as listed in Table 5 .2. This represented average sCOD removals of 93% to 95%
through the systems.
Low effluent TSS levels were achieved, averaging between 1 5 and 44 g.m·3 and the
filtered effluent showed no residual turbidity or colour. There was no apparent effect of
reactor SRT on effluent quality, although the 20d and 30d SRT reactors failed before a
minimum of two solids retention times had passed, so it was difficult to predict whether
an improved effluent quality would have been achieved had the system been able to
operate for a longer period.
A summary of the effluent quality and reactor performance for each trial is listed in
Table 5 .2, the data used being taken from the period of stable reactor operation before
filamentous bulking started to interfere with effluent quality. The results indicate that
activated sludge systems could provide an acceptable treatment method for the dairy
processing wastewater, assuming that operability problems in tenns of filamentous
bulking could be overcome.
Table 5.2 Reactor Effluent Quality at Different SRTs.
Target SRT (days) 5
Reactor Soluble COD (g.m·3) 80
Soluble COD Removal Efficiency (%) 95
Effluent Total COD (g.m-3) 90
Total COD Removal Efficiency (%) 96
Effluent TSS (g.m·3) 1 8
Effluent COD due to TSS (%) 1 0
Days at SR T used in data analysis 5 - 27
Days at SRT to Failure 3 1
1 0 20 30
95 1 1 5 8 5
94 93 95
95 1 50 l 30
96 93 94
1 5 28 44
- 1 0 34
5 - 24 6 - 1 6 1 6 - 3 5
45 24 - 48

1 02
5.4.3 Kinetic Parameters
The low srx method for the estimation of Ilmax and Ks as outlined in Chapter 4 was
repeated with reactor mixed liquor from each SRT trial . The respirometers were
maintained at 250C during the test and nitrification was inhibited using allylthiourea, so
that the OUR response measured would be due to heterotrophic biomass only. The
results obtained for Ilmax and Ks using a value of Y H = 0.68 are listed in Table 5 . 3 , and
are at the low end of the 0.65 to 1 .93 d- I range measured at 250C during
biodegradability studies. There was no obvious effect of SRT on the values of J.imax and
Ks apparent from the limited data obtained.
Table 5 .3 Estimation of llmM and Ks for mixed liquors of various SRT.
Reactor SR T (days)
Days at SR T when tested
�SpOUR max
J.imax (d- I)
(g02.g cell COD-I . d-I )
Ks (g.m-3 COD)
5.4.4 Decay Rate
5 1 0
1 6 30
0.32 0.28
0.67 0.60
2.2 4.0
3 0
2 2
004 1
0.87
3 . 5
The heterotrophic biomass endogenous decay rate was estimated using a respirometric
batch test method as outlined in Marais and Ekama ( 1 976) and Henze et al. ( 1 987).
Nitrification was inhibited by the addition of 20 g.m-3 of allylthiourea to the mixed
liquor in each respirometer. The respirometer was aerated and maintained at 250C for
the duration of the test. Any evaporative losses were replaced with distil led water daily,
before OUR measurements were taken.
The decay rate was calculated from a plot of OUR against time as shown in Figure 5 .7
and represents the traditional decay rate coefficient, b. The modelling decay rate co
efficient used by Henze et al. ( 1 987), bH, is determined from b in the following manner: .
b (5.3)

1 03
where:
fp the fraction of biomass that ends up as inert particulate products after decay
= 0.08 using the decay process specified by the IA WPRC model.
A summary of al l the results obtained at various SRT is given in Table 5 .4'.
Table 5 .4 Decay Rate Co-efficients Estimated at Various SRT.
SRT of Days at SRT Traditional Decay IA WPRC Model Decay
biomass at start of Co-efficient, b Co-efficient bH
decay test (d' l ) (d' l )
5 days 1 0 0.27 0.9 1
1 2 0.26 0 .87
24 0.23 0 .78
10 days 1 3 0.24 0.82
1 6 0.22 0.75
1 8 0. 1 9 0.66
27 0.22 0.75
4 1 0.22 0.76
5d SR T biomass average: 0.25 0.85
1 0d SRT biomass average: 0.22 0.75
Overall average: 0.23 +/- 0.05 0.79 +/- 0. 1 9
The decay rate i s not expected to vary with SRT (Ekama and Marais, 1 976) and apart
from the initial value obtained from the 5d SRT mixed liquor, the results remained
relatively constant over the duration of the both trials. The average values obtained .
were 0.23 +/-0.05 d' i for the traditional decay co-efficient and 0.79 +/-0. 1 9 d'l for the
IA WPRC Model decay co-efficient, using a value of Y H = 0.68 g cell COD.g substrate
COD'I .

1 04
7
6
,-.., '0 5
":' a
4 '" 0 b1) '-'
3 ,-.., � ;:J 2 0 b = - 0. 1 9 d- I '-' C � R2 = 0.99
0
3 5 7 9 1 1
Day of Batch Test
Figure 5 .7 : Determination of decay rate using biomass from the 10 day SRT trial,
starting after 1 8 days at target SR T.
5.4.5 Batch con Removal Rate Tests.
A batch test to measure specific COD removal rates was performed using mixed liquor
from both the 5d SRT and 1 0d SRT reactors. Two tests were performed at different
times during the reactor trial . A portion of the soluble COD added appeared to be
immediately removed on contact with the biomass, then as can be seen from Figure 5 .8
and Table 5.5, the remaining sCOD was removed at a linear rate until a sCOD
concentration of approximately 1 00 g.m-3 was reached.
The proportion of sCOD added that was removed 'immediately' from solution by the
biomass, that is within 20 seconds of substrate addition, ranged from 20% to 54% in the
batch tests performed. It was assumed that this removal was due to substrate adsorption
onto the biomass, although it was not possible to directly measure such adsorption from
the tests performed, and therefore not possible to verify this assumption.

1 05
1 400 I
1 200 0 1 8d at 5d SRT Floc load = 0.68
1
- 0 3 1 d at 5d SRT Floc load = 0. 1 5 '7 5 1 000
• • • • • • 0.97 g sCOD/gVSS.d c:o '-' -- 0.45 g sCOD/gVSS.d 0 800 0 i u 600 1 0 Note. 1 8d data is plotted as (actual data · 1 450 g.m-3) � � o . o . ..E 400 � 0 CFl 0
200 0 6 f:l 0
0 1 00 200 300 400
700 �<>' 600 I O . 0 20d at 1 0dSRT Floc load = 0.44 l 0
- 0 46d at 1 0d SRT Floc load = 0. 1 4 '7 5 500 . • 0 • • . • • • 1 .44 gCOD/gVSS.d c:o
-- 0.49 gCOD/gVSS.d '-'
� 400 0 0 u 300 <I) -� ::s 200 <> • -0 CFl
1 00 0 8 0 0 0
0 1 00 200 300 400
450
400 Low FIM • 1 5d at SRT Floc load = 1 .08 0 - 350 .... 0 Low FIM • 8d at SRT Floc load = 0_58 . 5
• • • • • · 1 .8 gCOD/gVSS_d c:o 3 00 -- -- 3_2 gCOO/gTSS.d Q 250 0 . • • • <? U 200
<I) ::c 1 50 0 ::s � . '0 . • • Q CFl 1 00
50 0 0 0 0
0 1 00 200 3 00 400
Time (minutes)
Figure 5 . 8 : Batch soluble COD removal rates during the various CSTR trials
500
5 00
500

, Iable 5.5 Soluble COD removal rates in batch tests using biomass at various SRI. -o 0\
Reactor reed Reactor Feed
Substrate concentration in the CSIR trial So = 2200 gCOD.m ·3 So = 440 gCOD.m ·3
Biomass SRI 5 5 1 0 1 0 20 20
Days at SRI when tested 1 8 3 1 20 46 8 1 5
Floc loading during test (g sCOD.g VSS·t ) 0.68 0. 1 5 0.44 0. 1 4 0.58 1 .08
COD adsorption onto biomass (g sCOD. gVSS·t ) 0. 1 38 0.08 1 0. 1 29 0.076 0. 1 5 1 0.546
COD immediately adsorbed (% of added) 20% 54% 29% 26% 26% 5 1 %
R2 (linear fit) 0.96 0.97 0.97 0.98 0.996 0.98
Linear COD removal rate (gCOD.g VSS·t • d· l ) 0.97 0.45 1 .44 0.49 3. 1 9 1 .82
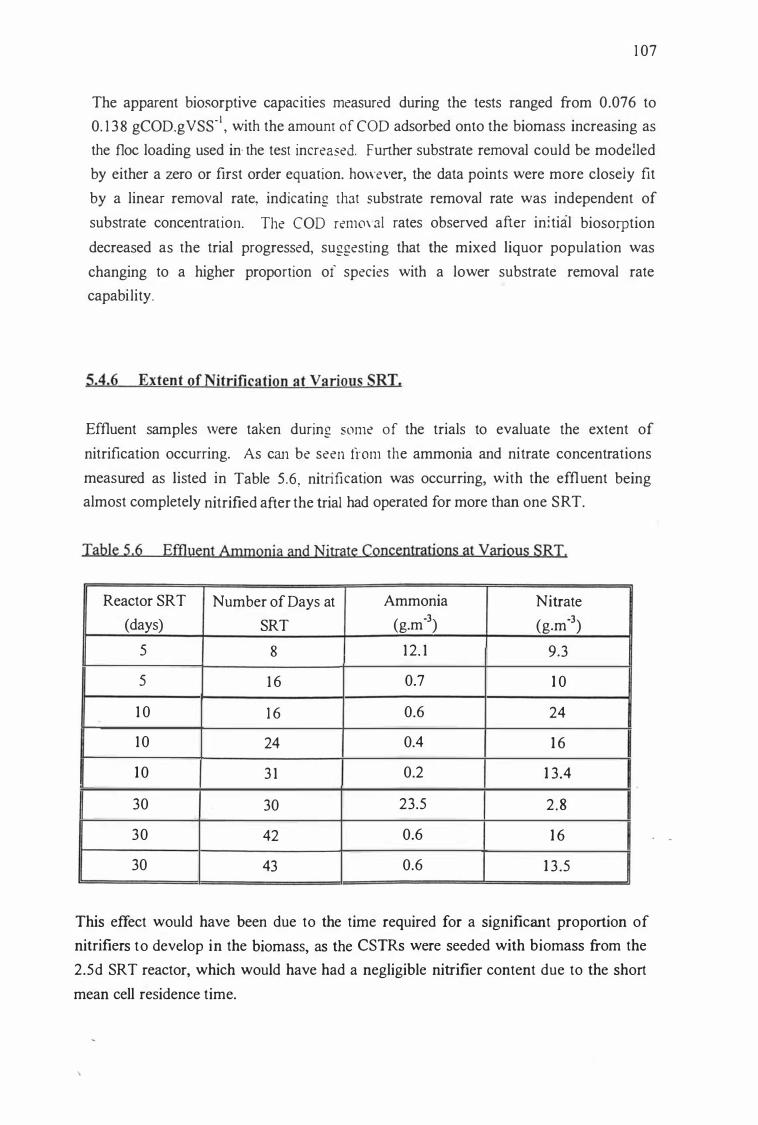
1 07
The apparent biosorptive capacities measured during the tests ranged from 0.076 to
0. 1 3 8 gCOD.gVSS- I , with the amount of eOO adsorbed onto the biomass increasing as
the floc loading used in- the test increased. Further substrate removal could be modelled
by either a zero or first order equation. however, the data points were more closely fit
by a linear removal rate, indicating that substrate removal rate was independent of
substrate concentration. The COD remoyal rates observed after initial biosorption
decreased as the trial progressed, suggesting that the mixed liquor population was
changing to a higher proportion of species with a lower substrate removal rate
capability.
5.4.6 Extent of Nitrification at Various SRT.
Effluent samples were taken during some of the trials to evaluate the extent of
nitrification occurring. As can be seen hom the ammonia and nitrate concentrations
measured as listed in Table 5.6, nitrification was occurring, with the effluent being
almost completely nitrified after the trial had operated for more than one SRT.
Table 5.6 Effluent Ammonia and Nitrate Concentrations at Various SRT,
Reactor SRT Number of Days at Ammonia Nitrate
(days) SRT (g,m-3) (g,m-3)
5 8 1 2. 1 9,3
5 1 6 0,7 1 0
1 0 1 6 0,6 24
1 0 24 0.4 1 6
1 0 3 1 0,2 1 3 .4
30 30 23,5 2 . 8
3 0 42 0,6 1 6
30 43 0,6 1 3 ,5
This effect would have been due to the time required for a significant proportion of
nitrifiers to develop in the biomass, as the CSTRs were seeded with biomass from the
2,5d SRT reactor, which would have had a negligible nitrifier content due to the short
mean cell residence time,

1 08
5.5 Reactor Performa nce at Varying FIM ratio
A trial was also performed at a low FIM ratio to investigate whether a lower FIM ratio
and lower biomass concentration would affect treatment performance or filamentous
bulking tendency. The same substrate was used but at a 1 : 5 di lution, so that the influent
stream COD was now 440 g.m-3. The reactor was started up in the same manner as for
the other reactors, and after the P1ixed liquor had reached a level of approximately 3000
g.m-3 TSS the feed concentration was reduced and SRT set at 20 days. The reactor
performance at 20d SRT and low FIM conditions is given in Table 5 .7 .
Table 5.7 Reactor Performance at Low FIM and 20d SRI.
Reactor
Average TSS (g.m-3) 1460
TSS Range (g.m -3) 1 250 - 1 780
Average VSS (g.m-3) 1 330
vssrrss Ratio 0.9 1
Total COD (g.m-3) 1 880
Soluble COD (g.m-3) 44
pH 8 .05
Total COD Removal (%) -
Soluble COD Removal (%) 89
FIM Ratio 0.33
Days at SR T to failure 3 1
Effluent
5 1
1 0 - 288
48
0.94
92
-
8 . 1 0
82
-
-
-
The system failed after 3 1 days at SRT due to filamentous bulking as for the trials with
higher influent COD. As both total and soluble COD removal efficiencies of 82% and
89% respectively were lower than for the trials with a more concentrated influent of 93-
96% and 93-95% respectively, and as the system still failed due to bulking, further trials
with the diluted substrate were abandoned.
Batch soluble COD removal rate tests were performed on the mixed liquor earlier in the
trial while the reactor was operating at 1 0d SRT. The same pattern of initial biosorption

1 09
followed by a linear COD removal rate was observed, as shown in Figure 5 .8 . The two
tests after 8 and 1 5 days at l Od SRT gave specific COD removal rates of 3 . 1 9 and 1 .82
gCOD.gVSS·I • d· 1 respectively, again showing a decrease in specific removal rate as the
culture spent longer at a given SRT.
5.6 Filamentous Bulking
All of the conventional completely mixed activated sludge reactor trials conducted
failed due to filamentous bulking. As the sludge volume index increased, the return
activated sludge recycle rate needed to be increased to retain the biomass in the reactor
system. Eventually system failure occurred when the SVI increased, as shown in Figure
5 .9, to such an extent that the biomass overflowed from the settler into the effluent.
5.6.1 Microscopic observations.
Microscopic observations were made regularly on the activated sludge as outlined in
Jenkins et. al. ( 1 993) and WPCF ( 1 990). General observations of floc structure and
filament abundance were made on wet mounts at 1 00x magnification.
In all trials the mixed liquor started off as a well settling flocculant biomass, with fe� visible protruding filaments as seen in Figure 5 . 1 0. As each trial progressed, filaments
started to protrude from the floes and increase in abundance until they dominated the
biomass and caused system failure. The progression fi:om well settling to bulking
mixed liquor suspended solids is outlined for the l Od SRT trial in Table 5.8 and
illustrated in Figures 5 . 1 0 to 5 . 1 3 .
The increase in biomass SVI and filament abundance was accompanied by a colour
change in the mixed liquor: from a yellow/tan colour at low initial SVI through to a red
/orange colour which intensified as bulking progressed. This same colour change was
observed in all conventional activated sludge trials performed, suggesting that the same
microorganism was becoming dominant in all cases. The red/orange colour was
associated with the biomass only, as the filtered effluent remained uncoloured at all
times.

1 600
1 400
,<> <> 0 1 200
-.
00 1 000 -00 E-c b1) - 800 8 -- o <>
� , , ,
> 600 00
400
200
0
0 5 1 0 1 5 20 25 30 35
Time (days)
Figure 5.9 Change in Sludge Volume Index during the conventional CSTR trials at various SRT.
40 45
. <> 5d SRT
�4 I Od SRT
. • . . 20d SRT
-x- 30d SRT
50
>-'
o
55

1 1 1
Other activated sludge microorganisms that were observed included rotifers, stalked ciliated protozoa and nematodes. These groups of organisms are predominant in low
FIM and higher SRT systems (Jenkins et aI. , 1 993).
Table 5.8 Microscopic Observations of Filament Abundance During lad SRT Trial .
Days at SVI SRT (ml.g-I)
2 83
1 6 1 33
1 9 1 70
23 3 76
35 450
45 640
Observations
Floes large and dense, no filaments visible. (Fig. 5 . 1 0)
Few long filaments protruding out from the floes In long
'ropes' or 'bundles'.
Filament bundles becoming longer and more extensive, protruding from small irregular, dense floes.
Filament bundles still . . IncreaSIng, and
(Fig. 5 . 1 1 )
wrappIng around flocculant biomass, increasing 'floc' size' but giving a less
dense structure. (Fig. 5 . 1 2)
Excessive filamentous growth dominates the biomass as bundles around and between floes. (Fig. 5. 1 3)
Filamentous growth still excessive, loss of biomass in the effluent stream.
Rotifers were frequently observed in the mixed liquor of all the trials. The dominant type seen were the Philodina sp. (Figure 5 . 1 4), although a few Lecaninae type rotifers (WPCF, 1 990) were occasionally seen in the 1 0d SRT biomass. Population densities
for rotifers usually ranged from 6000 to 30 000 per ml of mixed liquor, although they
were present at up to approximately 120 000 rotifers per ml in the early stages of the l Od SRT trial, reducing to the normal range after 2 SRT. Rotifers in activated sludge systems consume both bacteria growing at the floc surface and free floating bacteria,
reducing the effluent suspended solids. During the period of high rotifer populations in the 1 0d SRT trial, the effluent TSS was very low, between 10 and 1 6 g.m-3 •
Stalked ciliated protozoa were also commonly seen, becoming more abundant and with
increasing colony size as the trial progressed. The colonial protozoa observed were
tentatively identified as Opercu/aria sp. (Figure 5 . 1 5). As for rotifers, the presence of protozoan species enhances effluent quality by removing suspended bacteria and stimulating active floc bacteria. Madoni et a/. ( 1 993) found that Opercu/aria sp. were
associated With high organic loadings, low DO, high effluent BOD and non-nitrifying conditions. This does not seem to be true in this case however, as ammonia and nitrate

1 1 2
analyses indicated that nitrification was occurring, DO concentrations were maintained
above 4.5 g.m-3 in the reactor and FIM ratios were not above average for activated
sludge systems.
5.6.2 Identification of filamentous bacteria
Using the morphology and staining techniques as outlined by Eikelboom ( 1 98 1 ), and
Jenkins et al. ( 1 993), identification of the dominant filament was tentatively made. The
same filament was dominant in all the various SRT trials, although secondary filaments
were also observed and identified where possible.
The dominant filament protruded initially from the flocs as 'ropes' or 'bundles' of a few
filaments. As filament abundance increased the bundles became longer and thicker,
extending further out into solution until they surrounded the flocs entirely. Visual
observations of the filaments at 400x and 1 000x under phase contrast highlighted the
morphology and staining reactions listed in Table 5 .9.
Table 5.9: Microscopic observations of the dominant filamentous microon�anism
Filament appearance:
• irregularly bent bundles of filaments both protruding from flocs
and free floating • no attached growth or branching
• long, thin filament; approximately O.5Jlm x l 50Jlm
• indents at septa seen at l OOOx, but not at 400x
Staining reactions and observations on stained samples:
• Gram negative, long chain of cells • cells approximately 2-5 Jlm long
• Sulphur test negative / inconclusive
• Crystal violet sheath stain inconclusive
• India ink stain for exocellular polymers negative
• Neisser stain negative
• PHB stain negative

. ,
;iJ.
1 1 3
Figure 5 . 1 0 : Well settling biomass. 1 0d S RT trial after 2 days at SRT, non-bulking
SVI of 83 ml.g- l . ( l OOx magnification)
Figure 5 . 1 1 : Filaments protruding from the floes. 1 0d S RT trial after 1 9 days at
SRT, SVI had increased to 1 70 ml.g-1 • ( l OOx magnification)

Figure 5 . 1 2 :
Figure 5 . 1 3 :
'.
Abundant filament growth. 1 0d SRT trial after 23 days at SRT,
SVI had continued to increase to 376 ml.g· l . ( l OOx magnification)
Excessive filament growth. 1 0d SRT trial after 35 days at SRT,
SVI had increased still further to 450 ml.g·1 • ( 1 00x magnification)
1 1 5
(J

.:-
!.-
.:::
" -:.. ... ,' -
j.{�¥!/� . .; . .�
Figure 5 . 1 4:
Figure 5 . 1 5 :
:' ,.. ';.
,,. '-
. ' ," 'i
... . : \ �� ''" "
Dominant rotifer type observed throughout all trials.
( 1 00x magnification)
Stalked ciliated protozoa commonly observed in the CSTR trials.
( l OOx magnification)
1 1 7
-'.

1 1 9
Using the identification key in Jenkins et al. ( 1 993), the above results lead to the
identification of the dominant filament as Type 04 1 1 . Eikelboom ( 1 980) found that the
Type 04 1 I microorganism produced yellow, orange or red coloured colonies when
isolated as plate cultures and proposed that this type may belong to the genus
Flavobacterium. It is therefore possible that the colour change observed in the mixed
l iquor may be due to this organism.
Secondary filaments were observed for the 5d SRT and l Od SRT trials, in each case at a
greatly reduced frequency than the dominant filament. In the 5d SRT reactor after 2
SRTs had passed, a filament composed of a short gram negative rod, PHB positive,
with much attached growth was observed, identified as probably Type 1 70 1 . A 1 J..lm
diameter, long, gram negative, PHB positive filament was observed in both cultures
near the end of the trials. This filament was present both inside and protruding from the
flocs, being more curled inside the floc, and was identified as being either Type 09 1 4 or
Type 02 1 N. Nocardia sp. was also observed in stained preparations from the 1 0d SRT
reactor mixed liquor near the end of the trial, which was not unexpected as foaming at
the inlet to the settler had been observed for the 6 days prior to microscopic
examination.
5.6.3 Possible Filamentous Bulking Control Strategies
Much work has been done in relating the dominant filament in a bulking sludge with
reactor operating conditions in order to enable implementation of the appropriate
remedial action, as summarised in Jenkins et al. , ( 1 993). However, the dominant
filament in this case, Type 04 1 1 , is not a commonly reported filament, and has not been
related to a particular system operating condition. Therefore no indication can be made
of the most likely course of action to be taken for the prevention of filamentous bulking
in this case.
The secondary filaments identified have been associated with a wide range of.
conditions: Type 1 70 1 - low DO at low to moderate SRT; Type 09 1 4 - high SRT
nutrient removal systems; Type 02 1N - readily metabolisable substrates, low FIM,
nutrient deficiency; Nocardia sp. - slowly hydrolysed substrates, low FIM, low DO.
(Richard et aI. , 1 985; Jenkins et al. 1 993; Strom and Jenkins, 1 984). Therefore the
secondary filaments did not point to a single cause for the filamentous bulking either.

1 20
5.7 Discussion
A range of SR Ts were chosen for initial activated sludge studies so that the effect of
SRT on treatment efficiency could be evaluated. The SRTs used were those commonly
found in full scale nitrifying activated sludge plants: between 5 and 30 days.
As the SR T was increased, an increase in the average TSS and apparent decrease in
vssrrss was observed, with TSS ranging from an average of 3020 g.m-3 at 5d SRT to
5530 g.m-3 at 30d SRT. This was as expected due to the lower biomass wastage rate at
higher SRT. The inert fraction of the mixed liquor suspended solids will increase with increased SR T due to the accumulation of any inert solids in the influent stream (XI)
and of inert particulate products arising from microbial decay. This was indicated by a
decrease in the reactor vssrrss ratio with increasing SRT, but the change seen was not
deemed significant, probably due to the low value of XI (assumed negligible from
results in the previous chapter) and the relatively short time of system operation before
failure.
A high quality effluent in tenns of COD and TSS concentrations was achievable using
the activated sludge systems. Average soluble COD removals of between 92 and 95%
were measured, with the 5, 10 and 30d SRT trials all giving efficiencies of about 95%.
The 20d SRT reactor showed a lower COD removal efficiency, but this was most
probably due to the fact that it failed after only one SRT, so did not reach optimum
operating conditions. The proportion of effluent total COD that was attributable to
suspended solids was low, generally less than 1 0%. The final effluent soluble COD of
approximately 1 00 g.m-3 would have been predominantly due to the presence soluble
microbial products rather than substrate components, as virtually all the soluble
substrate had been estimated to be readily biodegradable or rapidly hydrolysable.
Again, no conclusive effect of SRT on effluent COD could be discerned due to the
relatively short period of system operation in the trials.
From effluent anunonia and nitrate concentrations it was detennined that the effluent
was fully nitrified after the system had operated for at least one SRT indicating that a
significant nitrifying biomass had developed within this timeframe.
A trial conducted at a lower FIM ratio by using a 1 :5 diluted feed showed significantly
lower COD removal efficiencies, with 87% of the soluble COD and 79% of the total
COD removed at 20d SRT. The FIM ratio in this trial was 0.33 gCOD.gVSS-I . do l ,
compared to between 0.45 and 0.80 for the full strength effluent trials, therefore

1 2 1
operating at very low F 1M ratios did not seem to be effective for the treatment of this wastewater. This trial also failed due to filamentous bulking of the biomass.
The decay rate co-efficient was also measured on the reactor mixed liquor. The value
measured seemed to decrease as the trial progressed for the Sd SRT mixed liquor, this
could be due to a higher proportion of undegraded adsorbed organic matter such as fats
on the biomass at the beginning of the trial. The remaining results were relatively
constant and the average value measured for b of 0.23 +/- O.OS d- I compared favourably
to other activated sludge system decay rate co-efficients reported. Using the
temperature relationship reported in Ekama and Marais ( 1 974) other values for b have
been reported at 250C as: 0.28 d-I (Ekama and Marais, 1 976; municipal wastewater),
0.22 to 0.32 d- I (Orhon et aI. , 1 993; dairy processing wastewaters) and 0.22 d- I (Henze
et aI. , 1 987; typical domestic wastewater value).
All trials failed in less than 50 days, or between 1 and 6 SRTs due to the sludge bulking
to such an extent that biomass was lost in the settler overflow. Microscopic
observations confirmed that the increase in SVI was due to the increase in filamentous
microorganism abundance. At the end of each trial the excessive filamentous growth
dominated the activated sludge biomass.
Chudoba et al. ( 1 973a) found that activated sludge system configuration and more
importantly, the concentration of substrate first in contact with the biomass affected
filamentous bulking. These observations were used to propose a theory for filamentous
bacterial growth. The kinetic selection theory first presented by Chudoba et al. ( 1 973 b)
was based on the Monod equation and proposed that activated sludge floes were
comprised of two types of microorganisms, filaments with a low Jlmax and Ks and
nonfilamentous floc formers with a higher Jlmax and Ks.
This theory was experimentally verified by Chudoba el al. ( 1 98S) using the same low
SIX method for the determination of Jlmax and Ks as used in this study. A decrease in
the values obtained for Jlmax and Ks would then be expected as the culture became more
filamentous. Only one test was performed during each SRT trial, but in each case the
mixed liquor had become filamentous when the test was done. The filamentous
cultures gave Jlmax values of 0.67 to 0.87 d- I compared to the average value of 1 .2 d-I
measured from studies on the non-filamentous 2.Sd HRT/SRT reactor, therefore the
results obtained are in line with the kinetic selection theory.
Chudoba ( 1 982) also proposed that floc formers had a higher accumulation capacity for

1 22
substrate than filaments, allowing them to store substrate when the biomass was at
higher substrate concentrations and oxidise the substrate later when the exogenous
substrate had been removed from solution. This was also reviewed by Goronszy and
Eckenfelder ( 1 986), who discussed the relatively slower substrate removal abilities of
filamentous microorganisms compared to floc forming microorganisms.
In batch tests performed with the mixed liquor biomass, between 20% and 54% of the
soluble substrate added was immediately adsorbed on mixing with the biomass,
indicating that this was a significant mechanism for substrate removal, but also that a
large fraction of the substrate was remaining in solution for the growth of other
microorganisms. As the batch tests were not conducted at a constant floc loading, the
effect of SVI on sorptive capacity of the biomass was not able to be assessed. However,
as the batch tests indicated that substrate removal rates were zero order, and that they
decreased as the trial progressed and biomass SVI increased, it is indicated that the
filaments had a decreased substrate removal capacity as compared to the floc formers.
The change in kinetic constants and substrate removal ability with SVI are summarised
in Table 5 . 1 0, with the Ilmax and COD removal rate values plotted against SVI in Figure
5 . 1 6. These results support the theory that filamentous microorganisms have lower
growth and substrate removal rates than floc formers.
Table 5.10 SUmmary of Biomass Characteristics at Various SRI and SVI.
SRT during trial
Days at SRT when tested
SVI (ml.g-I)
Ilmax (d-I)
Ks (g.m-3 COD)
Substrate removal rate
(gCOD.g VSS-I . d-I )
5 5
1 6 1 8
246 478
0.67
2.2
0.86
5 1 0 1 0 1 0
3 1 20 30 46
726 258 357 550
0.60
4.0
0.43 1 .35 0.46
3 0
22
1 79
0.87
3 .5
The most commonly proposed reactor conditions that affect filamentous bacterial
growth are: substrate type, reactor configuration, DO concentration, substrate
concentration and nutrient deficiency (Chudoba, 1 985; Jenkins et al. , 1 993).
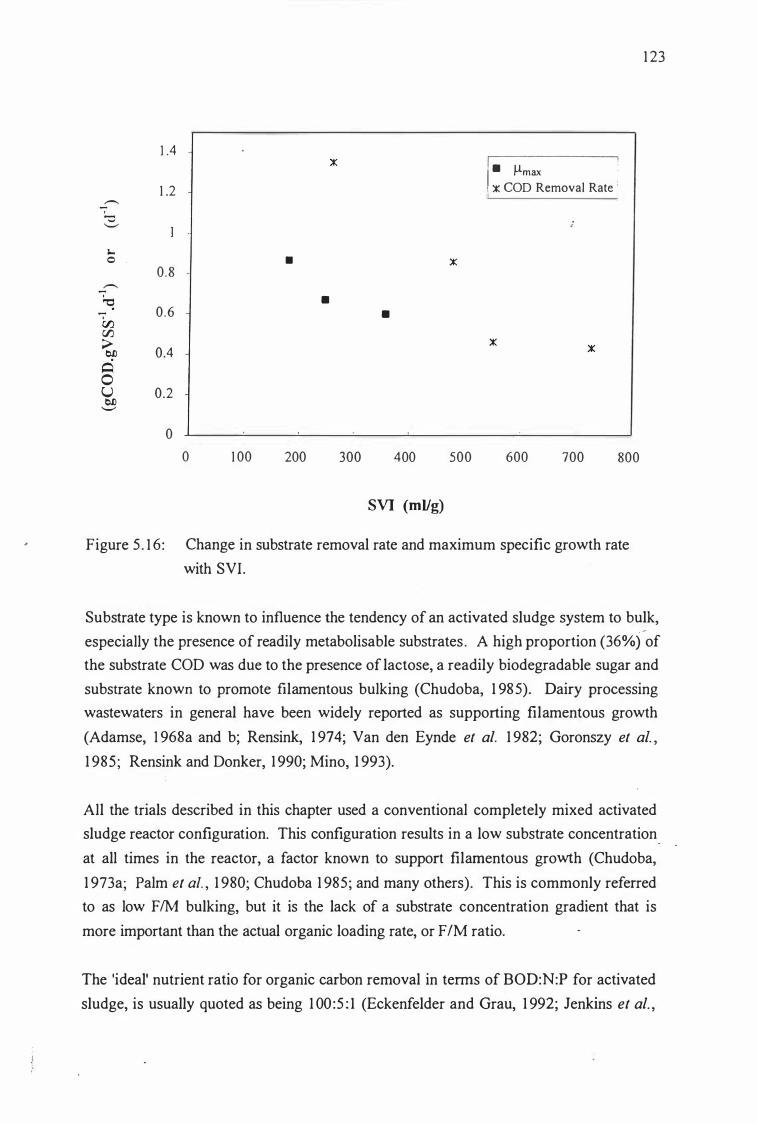
1 .4
1 .2 -. "'0 -.-
J,., 0 0.8
-. "0 00 0 .6 Vl ;> 0.4 bll � 0 U 0.2 bll -.-
0
-
- -
0 1 00 200 300 400
SVI (ml/g)
500
I !
I - Ilmax , ):: COD Removal Rate : !
600 700 800
Figure 5 . 1 6: Change in substrate removal rate and maximum specific growth rate
with SVI.
1 23
Substrate type is known to influence the tendency of an activated sludge system to bulk,
especially the presence of readily metabolisable substrates . A high proportion (36%) of
the substrate COD was due to the presence of lactose, a readily biodegradable sugar and
substrate known to promote filamentous bulking (Chudoba, 1 985). Dairy processing
wastewaters in general have been widely reported as supporting filamentous growth
(Adamse, 1 968a and b; Rensink, 1 974; Van den Eynde et al. 1 982; Goronszy et aI. ,
1 985; Rensink and Donker, 1 990; Mino, 1 993).
All the trials described in this chapter used a conventional completely mixed activated
sludge reactor configuration. This configuration results in a low substrate concentration
at all times in the reactor, a factor known to support filamentous growth (Chudoba,
1 973a; Palm et aI. , 1 980; Chudoba 1 985; and many others). This is commonly referred
to as low F 1M bulking, but it is the lack of a substrate concentration gradient that is
more important than the actual organic loading rate, or FIM ratio.
The 'ideal' nutrient ratio for organic carbon removal in tenns of BOD:N:P for activated
sludge, is usually quoted as being 1 00 :5 : 1 (Eckenfelder and Grau, 1 992; Jenkins et al. ,

1 24
1 993). The COD:N:P ratio measured for this substrate i s 1 00:4:0 .6, and as the
COD:BOD ratio is approximately 2, this indicates that there should be sufficient N and
P available for preventing nutrient deficient bulking. However as Jenkins et af. ( 1 993)
states, there may stil l be a nutrient deficiency if the C source is readi ly metabolizable
but the N source is organical ly bound, as it was in this ca<;e where a third of the COD
was present as lactose but all of the nitrogen was in the form of m i l k proteins (Adamse,
1 968a).
Low dissolved oxygen In the aeration basin is also known to be associated with
filamentous growth, as the filaments protruding from the floes would have a
competitive advantage for the oxygen present in solution over the floc formers inside
the flocs. Chudoba ( 1 985) suggests that the aeration basin DO be kept above 2 g.m·3 to
prevent this, however Jenkins et af. ( 1 993) suggest that the reactor DO level required to
keep the floc biomass aerobic is dependent the applied F/M ratio.
At the FIM ratio's used in these trials of between 0.45 and 0.80 gCOD.g VSS· I . d· l , the
DO concentrations given in Jenkins et af. ( 1 993) required to prevent bulking ranged
from 1 .9 to 3 .7 g.m·3 respectively. Actual reactor DO levels were maintained above 4.5
g.m,3 for all trials, well above the theoretical 'safe operating line' for the FIM ratios used
(Palm et af. , 1 980). The high DO levels are also evidenced by the abundant growth of
rotifers, which are strict aerobes and require environments of at least 3 g.m,3 of oxygen
(WPCF, 1 990) to survive. Therefore it was unlikely that the fi lamentous bulking could
be attributed to low DO conditions.
It was therefore surmised that the growth of filamentous microorganisms was most
likely due to the readily biodegradable nature of the substrate, the low substrate
concentrations in the reactor due to its completely mixed nature, or nutrient limitation
effects.
As activated sludge bulking has many causes, identification of the dominant filament
can be of use in distinguishing the cause of bulking (Eikelboom 1 977, Jenkins el al. ,
1 993). In this case, the dominant filament in all trials was Type 04 1 1 , which is not a
commonly reported filament and has not been definitively associated with a particular
reactor or substrate condition. The secondary filaments identified did not point to a
particular cause for bulking either.
Cases of filamentous bulking due to readily biodegradable substrates and low substrate
concentrations can be overcome by the use of a selector reactor - a small reactor

1 25
upstream of the aeration tank in which the return sludge and incoming wastewater are
mixed, providing a substrate concentration gradient through the activated sludge
system. Therefore, if the growth of fi lamentous microorganisms is caused by either of
these two factors, then the use of a selector should be able to overcome the activated
sludge system operabil ity problems experienced.
5.8 Con clusions
A conventional completely mixed activated sludge reactor configuration could produce
a high quality effluent but the system failed due to filamentous bulking of the biomass.
Total COD removals of 93% to 96% and soluble COD removals of 92% to 95% were
seen at SRTs ranging from 5 to 30 days. There was no obvious effect o f S RT on
effluent quality, but the longer SRT trials failed too soon to make conclusive findings.
The kinetic parameters measured as the trials at different S RT progressed indicated that
both the specific growth rate and substrate removal rate capacities decreased as the trials
progressed and the SVI increased. This supports the theory that filamentous organisms
have slower growth and substrate removal rates than floc forming bacteria.
The dominant filamentous microorganism was the same in all trials, tentatively
identified at Type 04 1 1 . Although this filament can not be positively associated with
any particular condition causing bulking, the trials conducted did use a highly
degradable carbonaceous substrate and a low reactor substrate concentration, two
commonly quoted factors associated with filamentous bulking that can be remedied by
the use of a selector reactor configuration.

1 26

CHAPTER 6
UNAERATED SELECTOR REACTORS
6 . 1 Introduction
1 27
The work presented in the preVIOUS Chapter demonstrated that a conventional
completely mixed activated sludge reactor configuration could - not be used for the
treatment of the defined dairy processing wastewater, due to operability problems
caused by the proliferation of filamentous bacteria.
The use of a selector reactor in which the return activated sludge (RAS) and influent are
mixed prior to the main aeration basin is widely documented as being able to prevent
the growth of many types of filamentous organisms (Chudoba, 1 985 ; Jenkins et al.,
1 993 ; Chudoba and Pujol, 1 994). Selector types utilised include those with aerobic,
anoxic or anaerobic conditions; which may be configured either singly or in series. The
selector type and configuration that would be most effective for the prevention of
bulking is dependent on the causative filament.
The dominant filament associated with the CSTR studies was identified as Type 041 1 ;-a
filament type not commonly reported the literature, or positively associated with any
particular substrate or operating condition. Therefore the appropriateness of various
selector types could not be assessed from identification of the causative organism.
The remaining work in this study involved trials conducted with both unaerated and
aerated selectors of various configurations in an effort to produce a modified activated
sludge system without filamentous bulking problems. The important factors affecting
the ability of a selector system to prevent bulking and possible implications for selector
design criteria were also assessed.
This chapter discusses the trials that were perfonned with unaerated selectors.

1 28
6.2 Selector Design
There has been a great volume of literature published on the use of selector reactors for
the prevention of filamentous bulking on a wide variety of wastewaters (Albertson,
1 99 1 ; Jenkins et aI . , 1 993; Chudoba and Pujol, 1 994 ; Wanner, 1 994). As the successful
operation of a selector is very dependant on substrate composition and system operating
variables, selector design is not straightforward.
The critical factors in selector design include:
- selector type: aerobic, anoxic, anaerobic.
- selector configuration: a single selector, a series of one type of selector, or a
series of a combination of selector types.
- selector size and loading rate.
6.2 . 1 Choice of Selector Type
The use of anoxic or anaerobic selectors is generally favoured over aerobic selectors
(Hoffman, 1 987; Shao and Jenkins, 1 989; Daigger and Nicholson, 1 990; Wanner et al. ,
1 987) due to the additional selective pressures imposed in the former types. Aerobic
selectors are known as 'kinetic' selectors as they confer an advantage to microorganisms
with a high substrate uptake rate and storage capacity due to the alternating 'feed ,
starve' conditions imposed. ' In either anoxic or anaerobic selector types, there is an
additional metabolic selection occurring because only microorganisms which can either
denitrify or utilise intracellular polyphosphate can remove substrate from solution in the
respective selector types (Jenkins et al. , 1 993).
In addition, there are practical advantages of anoxic selectors over aerobic selectors for
implementation in full scale systems, including the opportunity for biological 'N
removal due to denitrification and the absence of selector aeration costs. Therefore it
was decided to trial anoxic selectors first.
Anoxic selectors require the absence of DO and presence of nitrate, as substrate
removal occurs via denitrification and storage (Jenkins et al. , 1 993) . The CSTR trials '
gave a fully nitrified effluent, so the return activated sludge would provide the source of
nitrate and the absence of aeration in the selectors would ensure the absence of DO.

1 29
6.2.2 Selector Configuration
Jenkins et al. ( 1 993) s'tates that usually a single anoxic selector is sufficient for the
prevention of filamentous bulking, so the first two trials used single selectors of
different sizes. The third trial used three equally sized selectors in series v.:pen it became
obvious that additional selection pressure was required.
6.2.3 Selector Size and Organic Loading Rate.
There are two conflicting principles when designing selectors, as discussed in Patoczka
and Eckenfelder ( 1 990). The first is that the higher the substrate gradient in the system,
that is, the higher the substrate concentration (S) in the selector, the greater the
advantage conferred on floc formers that have a faster growth rate at higher S . The
second principle is that high substrate removal efficiencies are required in the selector
to ensure that the amount of available substrate passing into the aeration tank is low.
High selector efficiencies result in low selector substrate concentrations, which reduces
the substrate gradient in the system.
Two of the most commonly used operating parameters used in selector design are floc
loading and F 1M ratio, defined as follows:
Floc Loading (gCOD. gVSS· ' )
where:
substrate mass utilised �-I ) = =
reactor cell mass
QF = feed flowrate (m3.d-l)
So = feed concentration (gCOD.m-3)
QR = RAS flowrate (m3.d-l)
XR = RAS solids concentration (g.m-3 VSS)
e = Hydraulic residence time (d- I ) = V/Q
X = Biomass concentration (gVSS.m-3)
(6. 1 )
(6.2)
Values for all of the above parameters can be obtained either from the system definition
or from component balances around the settler. The feed flowrate was 1 0-2
m3.d-1 and

1 30
all remaining trials were operated at a 1 0 day SRT. As it is the removal of the soluble
fraction of substrate COD (sCOD) that is of interest in selectors, 'So' in equations 6. 1
and 6.2 was equivalent to 1 650 gCOD.m-3. From the data obtained during the CSTR
trial at 1 0d SRT, the MLVSS could be expected to be about 3900 g.m-3 and QR would
be approximately I S x l O-3 m3 .d- 1 for a well settling biomass. Therefore XR would have
a value of about 6500 gVSS.m-3 calculated from a solids balance around the settier
assuming negligible solids in the effluent. The total flowrate through the selector would
be about 25 x l O-3 m3.d- l .
The first approach was to use a desired selector FIM to calculate the required selector
size. Different authors have specified various selector substrate removal efficiencies
that would be required to prevent bulking, ranging from 60% of influent sCOD
(Daigger and Nicholson, 1 990) to a level that would give a selector effluent of 60 g.m-3
sCOD (Shao and Jenkins, 1 989). Using the above parameter values and a
recommended F/M of 2 (Jenkins et aI. , 1 993), the resultant selector volume could be
calculated using Equation 6.2, for 60% sCOD removal :
v ( 1 650 x O.6) . 1 0-2 3 3 = = 1 .27 x 1 0- m 2 . 3900
For substrate removal resulting in a sCOD concentration of 60 g.m-3 :
v = = ( 1 650 - 60) . 1 0-2
2 . 3900
-3 3 2.04 x l 0 m
Therefore a selector size of between 1 .3 x l 0-3 m3 and 2 x 1 0-3 m3 was indicated. The
selector size could also be estimated from batch sCOD removal test data obtained at a
similar floc loading to that expected in the selector, as calculated from Equation 6. 1 :
Floc Loading 1 0 . 1 650
1 5 . 6500 = 0. 1 7 (gCOD.gVSS-I)
Data from batch soluble COD removal rate tests perfonned at a similar floc loading of
0. 1 4 gCOD.gVSS-1 on the 1 0d SRT mixed l iquor, as described in Section 5 .4.5 , was
therefore used to estimate an appropriate selector size. Removable sCOD was depleted.
after a period of 200 minutes, but this was using a filamentous biomass which had a
specific substrate removal rate approximately one third of that of the well settling
biomass. Therefore a nonfilamentous biomass at the same floc loading should be able to
remove the sCOD in approximately 67 minutes. ·At the estimated flowrate through the

Air supply Agitation
Biom ass wastage
.-----��-t---..., '2:(
•• Settler
Selector
Reactor
Feed Reservoir Return ActIvated Sludge Effluent Receiver
Figure 6. 1 Reactor system configuration during the selector reactor trials.
-w -

1 32
selectors of 25 x l O-3 m3.d- 1 , to give a residence time of 67 minutes, the selector volume
would need to be 1 . 1 6 x 1 0-3 m3 .
From the above calculations, a selector volume of 1 .2 litres was chosen for use in the
first trial, in the configuration outlined in Figure 6. 1 . After the results of the first trial
became apparent it was decided firstly to increase the selector size and secondly alter
the selector reactor configuration. It was arbitrarily decided to double the initial
selector volume in the first instance and use three selector in series with a total volume
of 1 .5 times the initial selector volume in the second instance.
The unaerated selector trials that were conducted are as follows:
Trial AN 1 : 1 x 1 .2 I unaerated selector
Trial AN2: 1 x 2.4 I unaerated selector
Trial AN3: 3 x 0.6 I unaerated selectors in series
6.3 Unaerated Selector Reactor Treatment Performan ce
Each unaerated selector trial used the same substrate, aeration tank and settler as the
conventional activated sludge trials, the SRT being maintained at 1 0 days and HRT at 1
day, both parameters being calculated on the 1 0 litre aeration tank volume only. The
return activated sludge (RAS) flowrate was adjusted as necessary to maintain a low
solids inventory in the settler, and therefore was increased if the SVI increased. Data
was recorded with Day 1 of the trial being the first day of reactor operation with the
specified selector configuration and target SRT.
The reactor treatment performance in terms of COD removal, and effluent quality in
terms of TSS and COD remained high, the average results obtained during each trial
being listed in Table 6. 1 . Total COD removals were very similar in all three trials,
varying between 96.5% and 96.7%, and similar to the 96% removal observed for the
CSTR reactor trial operating at 1 0d SRT.
Reactor sCOD concentrations averaged between 46-60 g.m-3 compared to 9 1 g.m-3 in
the l Od SRT CSTR trial, resulting in system removals ranging between 96.4% and
97.2% sCOD. This increased removal efficiency is suggested to be due to the
production of a lower concentration of soluble microbial products (SMP) in the selector

Table 6. 1 Unaerated Selector Reactor Treatment Performance
Trial
Selector configuration (I)
Selector outlet conditions:
pH
TSS (g.m-3)
VSS (g.m-3)
Total COD (g.m-3)
Soluble COD (g.m-3)
Reactor outlet conditions:
pH
TSS (g.m-3)
VSS (g.m-3)
Total COD (g.m-3)
Soluble COD (g.m-3)
Soluble COD Removal (%)
SVI Range
SVI Trend
Effluent conditions:
pH
TSS (g.m-3)
VSS (g.m-3)
Total COD (g.m-3)
Total COD Removal (%)
Proportion of effluent COD due
to TSS (%)
AN I
I x 1 .2
6.95
3360
2970
5300
270
7.65
3770
3440
5300
57
96.5
1 09 - 333
. . mcreasmg
7.80
25
23
77
96.5
25
AN2
I x 2.4
6.90
3250
2960
5 1 00
305
7.65
3460
3 1 30
4900
60
96.4
92 - 244
. .
mcreasmg
7.85
1 7
1 6
75
96.6
20
1 33
AN3
3 x 0.6 ,
.. I
6.90
3590
3280
5 1 00
1 35
7.70
3700
3400
5 1 00
46
97.2
267 - 357
stable
7.70
3 6
32
73
96.7
37 -

1 34
trials. Orhon et af. ( 1 993) found that the effluent sCOD from activated sludge treatment
of similar wastewaters at SRTs longer than 2 days was due almost entirely to SMP and
therefore that the overall system sCOD removal was determined by SMP production.
The SMP production levels reported by Orhon et af. ( 1 993) ranged from 3 . 1 % to 6.8%
of influent sCOD, which would have corresponded to effluent sCOD concentrations of
5 1 to 1 1 2 g.m-3.
Effluent TSS levels were similar for all the l Od SRT reactors, averaging 1 2 g.m-3 for the
CSTR trial and between 1 7 and 36 g.m-3 when unaerated selectors were used. This
resulted in a higher proportion of the effluent COD being attributable to suspended
solids in the unaerated selector reactor trials, due to the lower sCOD and the higher TSS
concentrations obtained.
Although an acceptable effluent quality was obtained, filamentous bacterial growth still
occurred with the unaerated selector configurations trialed, as evidenced by the increase
in SVI with time shown in Figure 6.2.
The extent of sCOD removal occurring in the selector differed for each trial. In selector
systems it is the 'removable' soluble COD that is of importance, defined as the
difference between the substrate influent and reactor effluent sCOD concentrations.
The theoretical sCOD of the selector influent (So) due to the combined RAS and feed
streams could be calculated, asswning that the RAS sCOD concentration was
equivalent to the reactor sCOD concentration. Average selector substrate removai
efficiencies, measured as the proportion of 'removable' sCOD consumed in the
selectors, varied from 47% in Trial ANI to 70% in Trial AN3, as listed in Table 6.2.
The floc loading in the selector varied both during and betwe�n the different trials as the
RAS flowrate was altered in response to changing sludge settleability. Using equation
6. 1 , the floc loading in the selector during each trial was calculated, as listed in Table
6.2. The RAS VSS concentration at a given RAS flowrate was calculated from a solids
balance around the settler using the average mixed liquor and effluent VSS values over
the relevant period.
As the mixed liquor SVI increased, the RAS flowrate increased and the RAS VSS
concentration decreased, resulting in a decrease in selector floc loading which according
to Patoczka and Eckenfelder ( 1 990), should have improved the substrate removal
efficiency in the selector.

400
350
300
250 -. ... 'bfJ -e 200
'-'
5: 00 1 5 0
1 00
50
0
0 1 0 20 30
Day of Trial
Figure 6.2: Change in Sludge Volume Index during Trials AN I , AN2 and AN3 .
4 0 5 0
I
: AN I : I , 1 .2 I selector
-Ir- AN2: 1 x 2.4 1 selector
____ AN3 : 3 x 0.6 I selector ---.- -----.
60 70
....... w VI

1 36
Table 6.2 Selector perfonnance and operation during the unaerated selector trials
Trial Days at RAS HRT Floc Load So Selector removable
SRT Flowrate . - I
gSCOD g sCOD sCOD sCOD, % mm
1 O-3m3d- 1 g VSS -3 g sCOD.m -3 consumed m
AN I 1 - 23 1 1 .5 80 0 .24 800 390 55 .3
24 -3 1 30.3 43 0. 1 1 450 250 50.3
32 -38 34.6 39 0 . 1 0 405 235 47.4
39 -50 37.5 36 0 . 1 0 395 205 57.3
5 1 -56 42.8 33 0.09 360 205 5 1 .3
AN2 1 - 62 1 6.4 1 3 1 0.20 665 3 1 0 58 .5
63 -70 2 1 .0 1 1 1 0 . 1 5 565 265 57.5
AN3 1 - 1 2 46.2 46 0.09 335 2 1 0,200, 1 75 56. i
1 3 -24 53.4 4 1 0.07 300 1 40, 1 3 5, 1 1 0 74.7
25-3 1 44.5 48 0.09 345 1 60, 1 5 5 , 1 40 69.4
32-34 56.2 39 0.07 285 1 25 , 1 20,80 83.9
A decrease in selector effluent COD was observed with increasing RAS flowrate, as
illustrated in Figure 6.3 for Trial ANI , however due to the decreased theoretical initial
substrate concentration in the selector at higher RAS flowrates, the overall sCOD
removal efficiencies in the selector did not increase, varying between 47% and 57%
over the trial. The SVI of the mixed liquor continued to increase even as selector
effluent COD decreased, indicating that sufficient substrate was still flowing into the
aeration tank to support filamentous growth.
The rate and extent of filamentous bacterial growth during Trial AN I was much lower
than that observed in the conventional activated sludge trials, evidence that the use of
some type of selector may be appropriate for solving the sludge bulking problem. The
next two unaerated selector trials used slightly different approaches, Trial AN2 used a
larger selector, and Trial AN3 used three smaller selectors in series.

500
1 2 lId Flow = Return Activated Sludge flowrate (lId) 450 • + • • •
.r 400 • • e • •
3 5 lid bil 350 30 lId
�
'-' = •
.J
0 ''::: 300 � • 38 lid "'" .... =
250 - . • • � I • •
Cj = • • 0 I u 200 - I!II el l • Q • 0 El U 1 50 D � -,Q = 1 00 -0 + + rJ). + + + +
+ + + + + + 50
+ + + + + + + + + + + + + + + +
+ + + + + + + +
0
0 1 0 20 3 0 40
Day of Trial
Figure 6.3 : Change in selector soluble COD concentration with increasing recycle rate during Trial AN I .
43 lId
+
� II
• • • •
• •
+ + + + + + +
50
_ Selector
+ Reactor
60
,.,

1 3 8
Trial AN2 was conducted with a 2.4 I selector in the expectation that increased
residence time in the selector would increase selector sCOD removal efficiency. As can
be seen from the data in Table 6. 1 , the average 'removable' COD consumed in the
selector did not change significantly with the doubling of selector size. The actual
selector effluent COD concentration was higher in Trial AN2 than in Trial AN I , but
RAS flo\\'Yates were lower in Trial AN2, resulting in a higher theoretical So in the
larger selector.
Figure 6.2 indicates that the rate of proliferation of filamentous microorganisms was
much slower when a 2.4 I selector was used rather than a 1 .2 I selector, even though the
concentration of selector effluent COD was higher. This indicated that the success of
the selector system was predicted more accurately by soluble substrate removal
efficiency than by sCOD concentration entering the reactor.
Trial AN3 was conducted using three selectors in series to Increase the substrate
gradient through the system. The sCOD removal efficiency in the selector was
improved using this selector configuration, increasing the average removable COD
consumed to 69.7%. Trial AN3 was conducted on the filamentous biomass resulting
from Trial AN I and seemed to prevent any further increase in SVI.
The RAS flowrate was constant throughout Trial AN3 and Figure 6.4 shows that there
was an initial improvement in selector performance after 1 0 days, then average sCOD
concentrations remained constant in the selector system at 1 48, 1 44 and 1 22 gCOD.m-3
for selectors A, B and C respectively during that period. Most of the sCOD removal
occurred in the first selector, with 88% of the sCOD removed in the selector system
being consumed in the first selector, a further 2% in the second selector and 1 0% in the
last selector. This represents specific sCOD removal rates of 5 .6 g sCOD.g VSS-1 .d- 1
in the first selector.
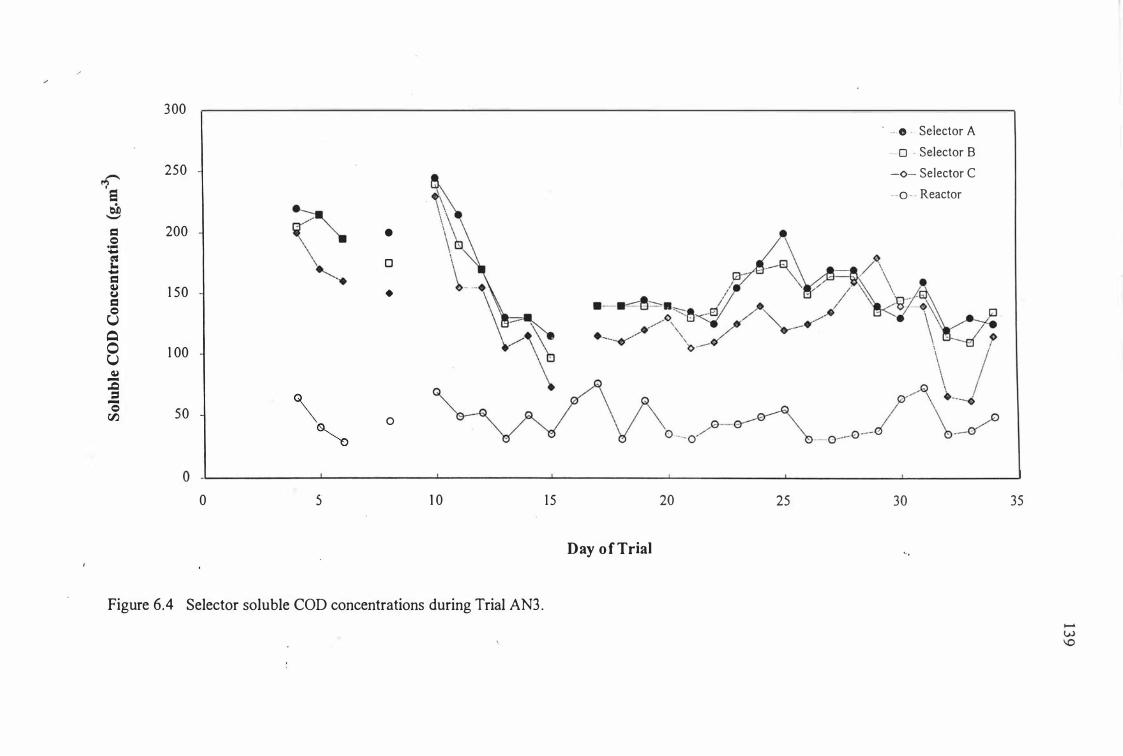
= Q .. -E -= � Cj = Q U
Q o U
�
::;s = -Q
00
300
250
200
1 50
1 00
50
•
o
•
o
' - 0 - Selector A
o . Selector B
-0- Selector C
--0- - Reactor
o _� ________ � __________ � __________ � __________ � __________ � __________ � ________ --J o 5 1 0
Figure 6.4 Selector soluble COD concentrations during Trial AN3 .
1 5
Day of Trial
20 25 30 35
' . .

140
6.4 Identification of Activated Sludge Microorga nisms.
The use of an unaerated selector did not prevent filamentous growth as evidenced by
microscopic observations and the SVI increase shown in Figure 6.2. The single selector
trials both commenced with a well settling mixed liquor having an SVI of
approximately 1 00 mllg. Within 3 SRTs the SVI had increased to around 250 mllg in
Trial AN I , but only to 125 ml/g in Trial AN2. After a further 3 SRTs, the SVI had
increased slowiy to 300 ml/g in Trial AN I and to about 200 ml/g in Trial AN2. Both
trials were concluded at this stage as the selectors were obviously not able to prevent
filamentous growth.
The increase in filamentous bacterial abundance during Trial AN I is illustrated in Table
6.3 and Figures 6.5 to 6.7. All photographs were of wet mounted mixed liquor samples
at I OOx magnification.
Table 6.3 Microscopic Observations of Filament Abundance During Trial AN 1 .
Days at SVI Microscopic Observations
SRT (ml.g-l)
3 1 1 0 No filaments observed protruding from floes.
1 6 1 35 Few filaments observed protruding from floc surface.
23 240 Filaments common, protruding a short distance out from the
flocs. (Figure 6.5)
49 280 Filaments very common, both protruding and free floating,
predominantly in bundles extending from the flocs. (Figure 6.6)
56 300 Abundant filamentous growth, both protruding and free floating.
Filaments exist both singly and in bundles. (Figure 6.7)
'"
. � • 'It.'

1 4 1
Figure 6.5 : Trial AN I after 23 days at SRT. SVI = 240 ml.g- 1 • ( l OOx magnification)
Figure 6 .6 : Trial AN I after 49 days at SRT. SVI = 280 ml.g- I . ( l OOx magnification)

1 43
( .,.. . ."
//
Figure 6.7 : Trial ANI after 56 days at SRT. SVI = 300 ml.g- 1 • ( 1 00x magnification)
Figure 6 . 8 : Trial AN3 after 1 8 days at SRT. SVI = 300 ml.g- l . ( l OOx magnficiation)

Figure 6.9:
. ... . ' ' \
•
r ' :.
.. .
,
•
Figure 6 . 1 0 :
Trial AN3 after 25 days at SRT. SVI unchanged from Figure 6.8 .
, . ..... .. ) , '''' � "
Trial AN3 after 34 days at SRT. SVI unchanged from Figure 6 .8 .
1 45

The dominant filament observed in both trials was observed as being:
- both protruding and free floating; singly and in bundles.
- filament diameter about 1 J.lm, length about 40 - 400 J.lm.
- individuals cells square to disc shaped, indentations at cell septa.
- no attached growth.
- non branching, non motile.
- no sulphur granules.
1 47
Using the keys and descriptions in Jenkins et al. ( 1 993) and LaTrobe University
( 1 993), the filament was identified as being Type 02 1 N. This type is commonly
associated with readily metabolizable substrates at moderate to high SR T and with
nutrient deficiency (Jenkins et aI. , 1 993).
A secondary filament present was observed as being:
- filament present mostly within the floc
- trichome coiled,
- cells rectangular, constrictions at septa, about 0.8 J.lm diameter.
- non branching, non motile.
- Gram stain negative.
- Neisser stain negative.
- no PHB granules observed.
This filament was identified as either Type 1 70 1 or Type 0803 using the key in Jenkins
et d. ( 1 993), however from a comparison with other published photographic
descriptions (LaTrobe University, 1 993) it was considered to be most probably the
former. Type 1 70 1 is characterised by Jenkins et al. ( 1 993) as low DO aerobic zone
grower, present at conditions of low DO and a readily metabolizable substrate.
Unaerated selectors were therefore successful in preventing the proliferation of Type
04 1 1 , but provided an environment in which other undesirable microorganisms could
flourish. As the single selectors obviously gave an improved performance over the .
CSTR trials, Trial AN3 was conducted with a series of selectors, using the bulking
mixed liquor from Trial ANI .
The average SVI remained at 300 ml/g for a period of over 3 SRTs during- Trial AN3,
indicating that this selector configuration could prevent further proliferation of Type
02 1 N. Microscopic observations indicated that the filamentous microorganisms
became less extensive and bundles of filaments were no longer observed. Figure 6.8

148
was taken on Day 1 8 after the serial selector system was put in place and although the
SVI remained at 300 ml/g, a decrease in filament abundance from Figure 6 .7 can be
observed. Figure 6.9 was taken on Day 25 and Figure 6. 1 0 on Day 34, illustrating a
continuing decrease in filament abundance, however the SVI still had not changed
significantly. The dominant filament was still Type 02 1N. As the SVI had still not
decreased after 3 . 5 SRTs, Trial AN3 was discontinued.
6.5 Measu rement of Kinetic Constants
Tests were conducted during each trial to assess microbial growth and decay kinetic
constants as well as substrate removal rates.
6.5. 1 So luble COD Removal Rates
Batch tests were performed to measure the biosorption capacity and substrate removal
rates of the mixed liquor during the selector reactor trials. Each batch test was
conducted by adding 1 5 ml of concentrated soluble feed with a COD of approximately
0.5 g, to one l itre of reactor mixed liquor at 25°C. This resulted in a floc loading of
approximately 0. 1 5 g sCOD per g VSS, similar to that applied in the selectors.
6.5. 1 . 1 Aerobic Batch Tests
A portion of the COD, between 38% and 6 1 % of that added, was again removed
immediately upon contact with the biomass, with the remaining sCOD being removed
within 2 hours as shown in Figure 6. 1 1 . The period of sCOD removal was best fitted
by a first order type relationship, and Figure 6. 1 2 illustrates that a plot of the logarithm
of soluble COD concentration against time indicated a linear relationship until the COD
concentration reached approximately 1 00 g.mo3•
It is thought that this apparent ' first order' removal rate was in fact a 'pseudo first order'
effect resulting from a series of concurrent zero-order removal rates for the various
substrate components (Grau et ai., 1 975; van Niekerk et ai., 1 987a). The resulting
apparent first order removal rate constant however would sti l l be useful as a means of
comparing substrate removal between different mixed cultures.

400 2 .5 0 • Soluble COD
3S0 o Oxygen Uptake Rate 0 0 2
--- 300 .� 0 ---"? , ... = = E ci; 2S0 - l .S '-" • "? Ci • E 0 200 N U • 0 0
<;) 0 - 1 ell - b '-" � 1 50 � := • - 0 � 0 • r/)
1 00 0 0 0 0 0 0 • •
• 0.5 • SO
0 0
0 30 60 90 1 20 I SO 1 80 2 1 0 240
Time (minutes)
Figure 6. 1 1 : Soluble COD removal and OUR during batch tests with AN2 biomass.
6
5 .5 ---"? E bD S '-"
Ci -0 U 4.5 �
- - - - - * --::c := '0 4 r/)
- - - - - - -c
....:l 3 . S • AN I : Day 25
6. AN2: Day 28 - - - - - - ANI (Regression line) --AN2 (Regression line)
• AN3: Day 1 2 - - - AN3 (Regression line) 3
0 20 40 60 80 1 00 1 20
Time (minutes)
i" Figure 6. 12 : Initial soluble COD removal rates during Trials ANI. AN2 and AN3.
I' "
1 49

1 50
Table 6.4 Soluble COD Removal During Aerobic Batch Tests.
Trial Days at Floc Biosorption k gQ2 consumed %02 consumed SRT
loading (gCOD.gVSS-I) (d- l) g sCOD added when COD consumed
(gCOD.gVSS-I) -
AN I 5 0. 1 9 0.09 23 - -
1 2 0. 1 8 0.09 1 2 - -
1 9 0. 1 8 0.07 2 1 - -
25 0 . 1 3 0.06 29 - -
32 0. 1 7 0.07 36 - -
54 0 . 1 6 0.07 32 - -
AN2 1 0 0. 1 6 0.09 32 0.20 96
28 0 . 1 8 0.09 26 0 . 1 8 87
58 0 . 14 0.07 1 9 0. 1 9 89
AN3 1 2 0.25 0.06 2 1 0.2 1 83
1 3 0. 1 5 0.06 38 0. 1 7 8 1
3 1 0. 1 6 0. 1 0 - 0.20 72 -
The values obtained for the apparent first order removal rate constant, k, from a
regression analysis of the straight line portion of the Ln COD concentration versus time
plot for each batch test are given in Table 6.4. Regression R2 values of 0.954 to 0.998
were obtained in each case, except for the final test on the 3 x 0.6 I selector
configuration, where the plot of LnS versus time still resulted in a curve.
As the floc loadings at the beginning of the batch tests were fairly constant, changes in
the apparent biosorption capacity of the biomass could be related to the abundance of
filamentous microorganisms. In trials ANI and AN2 the biosorption capacity of the
biomass decreased as the trial progressed and the SVI increased. The decrease in
filament abundance observed in trial AN3 was accompanied by an increase in the
measured biosorptive capacity. Biosorptive capacities measured during selector reactor
trials were lower than for the CSTR trials at comparable floc loading and SVI,

1 5 1
indicating that a different mixed culture composition was present in the unaerated
selector trials.
The apparent removal rate constant (k), tended to increase during the AN I trial but
decrease during the AN2 trial. As the dominant filament was the same in both trials, a
similar trend would have been expected. The trend from the AN3 trial was inconclusive
as a value could not be obtained for k in the third batch test. The removal rates also did
not appear to be related to the initial floc loading in the batch test.
A comparison of the batch sCaD removal rates from unaerated selector reactor biomass
and CSTR biomass is illustrated in Figure 6. 1 3 . The increased rate of sCaD removal
by biomass which experiences feast / famine conditions or intennittent feeding, such as
that imposed by the selector reactor, as compared to a CSTR biomass, has been reported
by others and has been dubbed the 'selector effect' (Houtmeyers et af. , 1 980; van den
Eynde et af. , 1 984; van Niekerk et af. , 1 987; Chudoba et af. , 1 99 1 ; Jenkins et af. ,
1 993).
3 5 0
-i3- AN2 @ day 5 8 3 0 0 -+- I Od SRT CSTR @ day 46
...... 250 ";l C � '-'
200 � 0 U � 1 50 .Q = '0 00 1 00
5 0 I Floc loading in test = 0. 1 4 g sCOD/g Vssi
0
0 3 0 6 0 90 1 20 1 5 0 1 80 2 1 0
Time (minutes)
Figure 6. 1 3 : Comparison o f batch soluble COD removal rates between biomass from
CSTR and unaerated selector trials.

1 52
The oxygen uptake rate was also measured during batch sCOD removal tests with AN2
and AN3 mixed liquor, an example of which is shown in Figure 6. 1 1 . The OUR
initially increased for the first 1 0 to 20 minutes and then decreased slowly over a period
of approximately two to four hours until a stable OUR was again recorded. The
concurrent COD removal from solution was accomplished in a much shorter time,
usually in less than two hours, an effect also reported by Chudoba et af. ( 1 973);
Chudoba et af. ( 1 982); Chiesa et af. ( 1 985); Goronszy et af. ( 1 985) and Shao and
Jenkins ( 1 989).
The ratio of mass of oxygen consumed to mass of COD added was 0. 1 9 ± 0.02 for both
trials, much lower than the 0.32 value measured during initial biodegradability studies
for the estimation of Ss and Y H. Jenkins et af. ( 1 993) also reported that the oxygen
consumed during COD removal is less in a selector system than a completely mixed
system, indicating that the substrate is being stored by the microorganisms rather than
being oxidised and used for cell growth.
The elevated metabolic rate as evidenced by the measured OUR persisted for a longer
period than it took to remove substrate from bulk solution. The proportion of the
oxygen consumed in response to COD added that coincided with the period of COD
removal was higher in Trial AN2 (86.5% to 96.4%) than in Trial AN3 (7 1 .5% to
83 .2%). This indicated that different oxygen consuming processes such as substrate
accumulation, production of storage compounds and possibly cell replication, must
have been occurring at the same time as sCOD removal from bulk solution during the
aerated batch tests. It was indicated that substrate removal from solution occurred at a
greater rate compared to the production of storage compounds during trial AN3 than
during Trial AN2.
6.5.1 .2 Anoxic Batch Tests
Several sCOD removal batch tests were performed in which the respirometer was not
aerated, simulating selector conditions. It can be seen from Figure 6. 1 4 that COD
removal mechanisms were similar: biosorption followed by a period of first order
substrate removal. Andreadakis and Chatjikonstantinou ( 1 994) also found similar
removal curves under both aerobic and anoxic conditions.
The sCOD removal rates were initially similar, but after a period of about 1 5 minutes,
the sCOD in the unaerated respirometer began to increase rather than decrease. Tests

1 53
for the presence of nitrate and nitrite indicated that there was no nitrate or nitrite remaining in solution after 1 5 minutes. The increase in sCOD concentration indicated that substrate that had been accumulated by the biomass under anoxic conditions was now being released back into solution, an effect that had also been observed by Shao and Jenkins ( 1 989) and Foot ( 1 992).
The residence time in the selector system varied between 34 and 1 40 minutes depending on the return activated sludge (RAS) flowrate and the selector configuration in use, as
listed in Table 6.2. The actual selector residence time at the same floc loadings of 0. 1 3 to 0. 1 6 g sCOD.gVSS-1 as used in the batch test was at least 5 5 minutes, indicating that all nitrate and nitrite would have been removed well within the residence time of the
selector. Conditions in the selector would then have been anaerobic rather than anoxic
and any further COD removal would have had to occur via anaerobic mechanisms.
400
3 5 0
300 ,,-... ";I S 250 b1l -l:s- unaerated batch test
--
� 200 0
--A- aerated batch test
U � -
1 50 ,.Q .E 0 00
1 00
5 0 Floc loading in test = 0. 1 6 g sCOD/gVSS
0
0 20 40 60 80 1 00 1 20
Time (minutes)
Figure 6. 14 : Soluble COD removal in aerated and unaerated batch tests during Trial
AN2.

1 54
6.5.2 Biomass Decay Rates
The traditional decay rate co-efficient, b was estimated periodically from aerated batch
tests using the reactor biomass as previously described in Section 5 .4.4. The results as
listed in Table 6.5 were obtained using biomass with added ATU, so the decay rate
measured was due to the activity of heterotrophic organisms only. The values obtained
for b are similar to those obtained during CSTR trials ranging 0. 1 9 to 0.27 with an
average of 0.23.
Shao and Jenkins ( 1 989) reported that the first order decay rates from prolonged
aeration in batch tests were lower for anoxic selector system biomass (0.22 d-I) than for
CSTR biomass (0.38 d-I) and Chiesa et af. ( 1 985) reported higher decay rate constants
for bulking sludges. Neither of these trends were obvious in the above results.
Table 6.5 Estimation of Decay Rate Co-efficient during unaerated selector trials.
Trial Days at SRT SVI (ml.il) Decay Rate, b (d- I )
AN I 26 3 34 0.2 1
AN2 29 1 24 0.23
AN3 32 30 1 0.26
Shao and Jenkins, ( 1 989) suggest that the decay rate of biomass taken from an anoxic
selector system was lower than for a completely mixed system due to storage
compounds present in the anoxic selector system biomass. The duration of the batch
decay tests was not specified. Chiesa et af. ( 1 985) found that filamentous mixed
cultures exhibited a diphasic decay response composed of a much faster decay rate for
the first 24 hours, followed by a decay rate only slightly faster than that of non
filamentous biomass for the next 2 days. This indicated that any significant differences in b may be due to the period of measurement being relatively short, ie. over only one
day. Any effect due to stored substrate would also be expected to be exhibited over a
period of hours rather than days. The decay rates in this study were estimated over a period of approximately 1 0 days as outlined in Henze et al. ( 1 987), so as implicated
from the results of Chiesa et al. ( 1 985), significant variations in the decay rate may not
be observed.

1 55
The use of A TV may also affect the results obtained as only the respiration rate of heterotrophic organisms is monitored, whereas nitrifiers would have been expected to contribute to a significant proportion of anoxic selector reactor biomass.
6.5.3 Estimation of Biokinetic Parameters llmax and Ks.
A respirometric estimation of �max and Ks was made several times during the single
selector trials and at the conclusion of the serial selector trial. The results from these tests is given in Table 6.6. The value used for Y H was that obtained from a measurement of the oxygen consumed in response to the addition of small amounts of
substrate, as outlined by Cech et al. ( 1 984). Values of between 0.62 and 0.68 g cell
COD per g substrate COD were measured, being similar to the Y H = 0.68 value
obtained from initial biodegradabil ity studies.
Nitrification was inhibited with A TU so that only the heterotrophic biomass 'growth' response was measured. Again, the general trend was for a decrease in .1SpOURnax and
hence the calculated value for Ilmax , with increasing SVI in trials AN 1 and AN2. The
value measured for �SpOURmax at the conclusion of the serial selector trial (AN3) had
not changed significantly from that at the end of the AN 1 trial which proceeded it. The
SVI of the biomass was also unchanged for the duration of the AN3 trial.
Table 6.6 Values Calculated for llmax_illl.dKs During Unaerated Selector Trials
Trial Days at SVI �SpOURmax YH Ilmax Ks SRT (ml.g- 1) ( �1- )
(d- l ) (gCODm-3)
g cell COD.d
AN I 1 1 1 1 3 0.35 0.63 0.60 1 5.5
24 261 0.3 1 0.62 0.50 3 . 1
3 1 239 0.34 - 0.35 0.63 0.58 - 0.6 1 4.3 - 5.0
55 272 0.32 0.63 0.54 5.5
AN2 30 1 24 0.30 0.68 0.65 7.7 -
59 1 63 0.23 0.63 0.40 2.8
AN3 3 3 298 0.26 0.68 0.56 8_6
Ave: 0.52 6.5

1 56
The range of values obtained for Ilmax during the unaerated selector trials of 0.40 to 0.65
do l were lower than the 0.60 to 0.87 do l range measured in the conventional activated
sludge trials, although the SVI ranges of 298 - 1 1 3 mUg and 357 - 1 79 mUg
respectively were similar. The dominant filament in the selector trials was Type 02 1 N
compared to Type 04 1 1 for completely mixed systems, indicating that Type 02 1 N may
have a lower maximum specific growth rate than Type 04 1 1 .
6.6 Nutrient Removal
The concentrations of various nitrogen and phosphorus species were measured on the
selector mixed liquor, aeration basin mixed liquor and settler effluent. Nitrogen
concentrations that were measured included Total Kjeldahl Nitrogen (TKN), ammonia
(NH3), nitrate (N03) and nitrite (N02)' Phosphorus was measured as Total Phosphorus
(TP) and Dissolved Reactive Phosphorus (DRP). The N and P concentrations were
measured over a period of at least 1 0 days, in the later stage of each trial when the
reactor configuration had been in operation for at least two SRTs. The average
concentration of the various species measured during each trial is given in Tables 6.7 to
6.9.
Table 6.7 Average N and P concentrations during Trial AN 1: 1 x 1.2 I selector.
(Days 46 to 5 6) Selector Reactor Effluent
TKN (gN.m-3 ) 430 48 1 5A6
NH3 (gN.m-3 ) 1 .92 0.49 0.43
N03 (gN.m-3 ) < 0. 1 4.83 3 .88
N02 (gN.m-3 ) 0.04 3 .91 3 .03
TP (gP.m-3 ) 5 1 .3 58 .9 7.64
DRP (gP.m-3 ) 8 .5 6.8 6.9
Organic N NSS (g.g- I) 0. 1 36 ± 0.0 1 8 0. 1 37 ± 0.026 -
Organic P NSS (g.g- I ) 0.0 1 3 8 ± 0.002 1 0.0 1 49 ± 0.0029 -

I
Table 6.8 Average N and P concentrations during Trial AN2: 1 x 2 .4 1 selector.
(Days 1 7 to 26) Selector Reactor Effluent
TKN (gN.m-3 ) 420 420 -
.
NH3 (gN.m-3 ) 6.09 <0. 1 0. 1 0
N03 (gN.m-3 ) <0. 1 6 .36 5 .76
N02 (gN.m-3 ) 0 .04 4 .80 3 .87
TP (gP.m-3 ) 55 58 -
DRP (gP.m-3 ) 6.7 4.7 4.8
Organic N NSS (g.g- I ) 0. 1 39 ± 0.023 0. 1 36 ± 0.0 1 7 -
Organic P NSS (g.g- I ) 0.0 1 6 1 ± 0.0024 0 .0 1 72 ± 0.0022 -
Table 6.9 Average Nand P concentrations during Trial AN3: 3 x 0.6 1 selectors.
1 57
(Day 20 to 34) Selector Selector Selector Reactor Effluent
A B C -
TKN (gN.m -3 ) 382 409 443 4 1 6 -
NH3 (gN.m-3 ) 0.39 0.83 1 .30 <0. 1 <0. 1
N03 (gN.m-3 ) <0. 1 <0. 1 <0. 1 2.92 2.79
N02 (gN.m-3 ) 0.008 0.009 0.0 1 5 0.78 0.60
TP (gP.m-3 ) 5 1 56 59 59 -
DRP (gP .m-3 ) 6.2 6.8 6.6 4.8 5 .2
Organic NNSS 0. 1 29 0. 1 28 0. 1 3 1 0. 1 27 -
(g.g-I) ± 0.0 1 6 ± 0.033 ± 0.0 1 8 ± 0.028
Organic PNSS 0.0 1 52 0.0 1 54 0.0 1 57 0.0 1 64 -
(g.g- I) ± 0.00 1 8 ± 0.0028 ± 0.0029 ± 0.0024
i

1 58
During Trial AN I the nitrate and nitrate concentrations III the selector zone were negligible, indicating that all the available oxidised N in the RAS had been util ised for substrate removal. Effluent ammonia concentrations were also low, but not negligible, suggesting that nitrification was not quite complete in the reactor zone. The average DRP concentration in the selector zone was almost 2 gP.m-3 higher than that in the reactor and the biomass P content was indicated as possibly being higher in the reactof.
The reactor and effluent ammonia concentrations were negligible during Trial AN2, indicating that the effluent was now fully nitrified. The selector oxidised N compound
concentrations were again negligible in the selector and the same differences in DRP and biomass P contents in the various zones were observed as in the previous trial.
In Trial AN3 the nitrate and nitrite concentrations were negligible in all three selector
zones, but an increase in ammonia concentration was observed as the mixed liquor progressed through the selectors. The average DRP concentration was increased in the second selector, however differences in DRP and biomass P contents between the selectors and reactor were similar to those noted previously in AN I and AN2.
The nutrient content of the biomass in each trial was similar to that quoted elsewhere
for conventional activated sludge. Biomass N contents averaged between 1 2.7% and
1 3 .9%, close to the value of 1 2.4% based on an analysis of cellular components given in Metcalf & Eddy ( 1 99 1 ). P contents of biomass have been reported to be 1 .5% to 2% (Tetreault et aI. , 1 986; Yeoman, 1 988); therefore the averages of 1 .4 to 1 .7% measured during trials AN I to AN3 were similar to those being quoted for conventional activated sludge.
6.6.1 Ammonification.
For the selector trials conducted, average ammonia concentrations of between 1 .9 and 6. 1 gN.m-3 were measured in the mixed l iquor flowing out of the selector zones. The ammonia concentrations in the effluent and hence the RAS stream were negligible and there was negligible ammonia in the feed stream, indicating that the presence of significant ammonia concentrations in the selectors was due to ammonification of the
feed stream proteins.
As can be seen in Figure 6. 1 5, the selector ammonia concentrations were highest during Trial AN2 which had the highest selector substrate concentration, and hence organic N

Reactor System No. 1 Reactor System No.2 1 2
AN2 AN I
.r 8 1 0 i bIl --
= 8 Q .: = a. -= 6 � CJ = Q U = 4 · . .-= Q
8 e 2
��
<:
0 00 0 N o::t \0 '" 00 0 N o::t
N N N N o::t o::t t.r) lI") lI")
Day of Trial
Figure 6. 1 5 : Ammonia concentration in the reactor zones during Trials AN 1 , AN2 and AN3 .
\0 lI")
I
I I I I I I I I I
0 N
AN3
N o::t \0 00 N N N N

1 60
concentration, as well as the longest selector residence time. In all three trials the
ammonia concentration reached in the first selector was found to be proportional to the COD concentration in that zone, as would be expected since ammonification is reported
to be a first order reaction with respect to organic N (Wong-Chong and Loehr, 1 975).
The ammonia profiles through the serial selectors in Trial AN3, as illustrated in Figure 6. 1 5 , resulted in average concentrations of 0.39, 0.83 , 1 .30 gNHrN.m·3 as the mixed liquor passed through the selector sequence. The stepwise increases of 0.39, 0.44 and 0.47 gNHrN.m-3, indicated an increasing ammonification rate through the selectors suggesting that only a small portion of the feed proteins had been degraded in the
selector zone of the system.
The ammonification rate constant could not be assessed as it was not possible to distinguish between the organic N of mixed liquor cells and the organic N due to
proteins in the feed stream from TKN analysis data. An estimate of the ammonification rate through the selector system in trial AN3 can be gained from a plot of ammonia production (Ln NHrN) against time as shown in Figure 6. 1 6. Values of the rate constant for ammonia production, KNH3 averaged 0.029 min- 1 with a maximum of 0.047
min- I , and were considerably higher than that reported for organic N removal of up to 0.004 min-1 by Wong-Chong and Loehr ( 1 975).
The reactor ammonia concentration was less than 0. 1 gN.m-3 in Trials AN2 and AN3,
and usually below 0.3 gN.m-3 during AN I . As ammonium oxidation i s considered to be the rate limiting step in the conversion of organic nitrogen to nitrate (Wong-Chong and Loehr, 1 975), one would expect the lack of NHrN in the reactor to be a sign of complete ammonification. A comparison of the concentration of NH3-N at the selector
outlet to that of oxidised N (N03 + N02) at the aerated reactor outlet, indicated that a minimum of 2 1 % , 55% and 35% of ammonification occurred in the selectors for trials
ANI , AN2 and AN3 respectively.
6.�.2 Nitrification.
As the selectors were unaerated with an absence of both oxygen and nitrate in bulk
solution, it can be assumed that no nitrification occurred in the selector part of the
system. This would have resulted in all of the nitrification reactions proceeding in the aerobic re�ctor, to produce the nitrate concentrations illustrated in Figure 6. 1 7.

1 .0 -·r--------------------------------------------------------------------�
c o :::::: = a.. -C G,) u C o u = °a o a a <
0.5
0.0
-0.5
- 1 .0 - -
c � - 1 .5 -
selector residence time = 1 6 m i n utes
-2.0L---------------------------------------------------------------------�
o 2
Number of selector residence times
Figure 6. 1 6: Plot of ammonia concentration against selector residence time during Tria l AN3.
3 4
____ Average
-0- Day 20
-0- Day 2 1
--*- Day 23
-x- Day 24
-e- Day 25
-- Day 27
- /). -- Day 2 8
_ . - Day 2 9
-0\ -

Reactor System No. 1 Reactor System No.2 12 .
AN2 AN I
1 0 .
rr e i bll 8 --
c � = .... .... I � s.. I .... 6 I
C • � u c = • U � 4 .... � • s.. .... .... " :z � •
2 I I
. - ---
0 00 0 N '<:t � � 00 0 N '<:t
N N N N '<:t '<:t V) V) V)
Day of Trial
Figure 6. 1 7 : Nitrate concentration in the reactor zones during Trials AN 1 , AN2 and AN3 .
I I I I I I I • I '� . ,
/ I I , /
iI I / ' /
I ..
I � 0 V) C"'l
I
N C"'l
AN3
.. - ... .. - . -.. . -
._+- Reactor N03
- - ___ - Effluent N03
-ts- Selector A N03
--*- Selector B N03
I
-)<- Selector C N03
/ /
1 /
•
/
• / ,
/ , I
' \ \ \j- -'<:t � 00 C"'l C"'l N
..... 0\ N
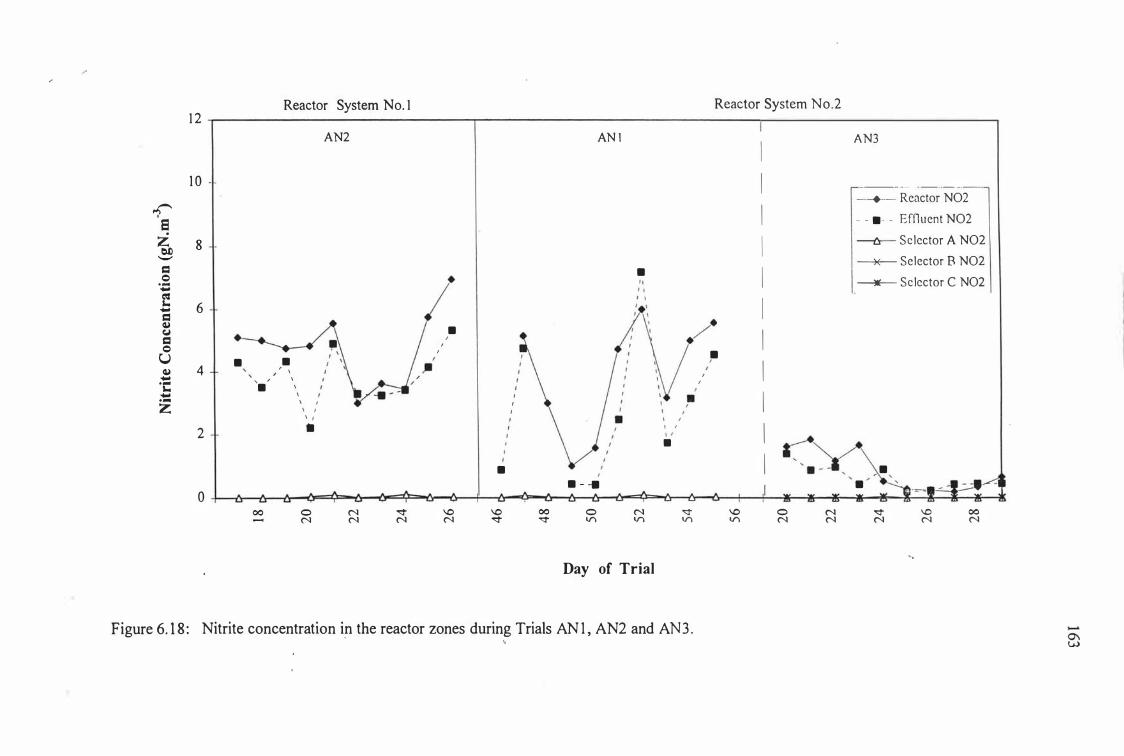
1 2
1 0 -
t{"" 8 i 8 � --= 0 .... -= s.. 6 -= � (,j = 0 U • � 4 -.... s.. -....
Z
2
0
, I •
00
I
Reactor System No. 1
• \
\ \ \
\ \ I
\ I
•
0 N
AN2
,
N '<t N N
AN I
• • "
• I
I I
, , I , I , I " •
• I
• - -II
\0 \0 00 0 N '<t N '<t '<t V) V') V)
Day of Trial
Figure 6. 1 8 : Nitrite concentration in the reactor zones during Trials AN I , AN2 and AN3 .
Reactor System No.2
I
I AN3
I --- _ ... .. _--- _.-
--+- Reactor N02
I - - .- - Efnuent N02
I -(s- Se lector A N02
�- Selector B N02
I -*- Se lector C N02
I • I I I I
I
I I �y I , • , I •
\0 0 N '<t \0 00 V) N N N N N
...

1 64
-3 The ammonia concentrations in the reactor were below the detection limit « 0 . 1 g.m NHrN) during the AN2 and AN3 trials, indicating that the wastewater was fully nitrified. During trial AN I the reactor ammonia concentration was below 0.3 g.m-3
NHrN for all but one sample, and considerably lower than the selector anunonia concentration, indicating that nitrification was also almost complete in this trial.
Both ammonium and nitrite oxidation are reported by Wong-Chong and Loehr ( 1 975) to be zero order reactions, with the formation of nitrate being essentially equal to the rate of ammonium oxidation, however significant nitrite concentrations were also measured in the reactor during all three trials. The actual nitrification rate could not be calculated as it was indicated that both ammonification and nitrification were occurring simultaneously in the aeration tank, and the ammonification rate could not be estimated due to the reasons already given in Section 6.6.3. However, to produce the oxidised N concentrations measured, specific nitrification rates of at least 0 .02 1 , 0.0 1 6 and 0.0 1 1 gN oxidised.g VSS- 1 .d-1 must have occurred in Trials AN 1 , AN2 and AN3 respectively. As these 'worst case' values were considerably lower than those rates determined by other researchers of 0.03 to 0. 1 9 gN.gVSS- 1 .d-1 (McClintock et al. , 1 993) and 2.3 gN.g VSS- 1 .d- 1 (Argaman and Brenner, 1 986), it can be concluded that nitrification was not limited by the residence times provided in the reactor zones.
Significant nitrite concentrations were observed in the reactor zone, as shown in Figure 6. 1 8, particularly in Trials AN I and AN2 where the average nitrite concentrations were 80% and 75% of the nitrate concentration respectively. Trends in the reactor nitrite concentration were matched by variations in reactor nitrate concentrations during Trials AN I and AN3 , suggesting that nitrite was not accumulating due to inhibition of Nitrobacter sp. activity. Also the anunonia concentrations were negligible and pH levels not increased, ruling out two factors commonly reported to result in nitrite accumulation (Wong-Chong and Loehr 1 975; Azimi and Horan, 1 99 1 ). Hoffman ( 1 987) also reported the appearance of nitrite in selectors, which disappeared in the reactor zone, and Nowak et al ( 1 995) found a decrease in nitrite oxidation capacity for activated slupge subjected to anaerobic conditions, such as would have been the case in these trials.
6.6.3 Denitrification.
One of the contributing factors in the decision to trial 'anoxic' selectors was the potential for N removal, due to denitrification when nitrate and nitrite are used as electron

1 65
acceptors for exogenous substrate removal and storage. An overall mass balance for
total nitrogen in the system, assuming 'steady state' had been reached at the time of N
measurements, and therefore assuming no accumulation of N in the system or loss of N
by volatilization, is as follows :
NFEED = N in the effluent + N in the wasted mixed liquor + N lost by denitrification.
Total N in each stream can be measured as:
Total N = organic N + ammonia + nitrate + nitrite
where organic N can be calculated from: organic N = TKN - ammonia.
The total nitrogen content of the feed stream was measured as 89 gN.m-3, therefore the mass of N supplied to the reactor system each day, NFEED, was:
The SRT of each system was based on aeration tank volume only, so the N content of cells wasted per day was equal to the organic N content of one litre of mixed liquor. Using the data stated in Tables 6.7 to 6.9, the nitrogen content of the wasted mixed l iquor (WML) and effluent cells were calculated, as listed in Table 6. 1 0.
The results from the nitrogen balance in Table 6. 1 0 indicate that significant N removals
were occurring from the reactor system. A comparison of the nitrate and nitrite concentrations in the reactor and in the effluent stream as listed in Tables 6.7 to 6.9
indicates that denitrification was occurring in the settler as well as the selector zones. This was also indicated by occasional rising sludge in the settler after sludge accumulation during periods of high SVI. The concentration of oxidised N in the effluent was near or above the critical limit of 6 to 8 gN.m-3 suggested by Henze et al.
( 1 993) to prevent the interference of settling by denitrification, particularly in Trials . AN I and AN2.
An estimate of the N removed by denitrification in the settler and selector parts of the system can be made, assuming that the fate of the nitrate and nitrite flowing out of the
reactor is either: - to flow out in effluent stream
- to be removed by denitrification in the settler

1 66
- to flow out in the RAS and be removed by denitrification in the selectors.
The total oxidised N compounds removed by denitrification in the settler and selector is
therefore the difference between the mass of (nitrate + nitrite) flowing out of the reactor
and the mass of (nitrate + nitrite) in the effluent stream.
Table 6. 10 Estimation ofN Removal during the Unaerated Selector Reactor Trials
Trial AN I AN2 AN3
WML volume ( 1 0-3
m3.d- l) 0.93 0.95 0.90
N content of cells in WML and 0.48 0.42 0 .42
effluent (gN.d-l )
WML: NH3 + N03 + N02 (gN.d- 1 ) 0.009 0.0 1 1 0.003
Effluent: NH3 + N03 + N02 (gN.d-l) 0.07 0.09 0.03
NOUT : WML + Effluent (gN.d-l) 0.55 0.52 0.46
NFEED - NOUT N removed by 0.34 0.38 0.44 denitrification (gN.d- l)
N removed by denitrification (%) 38 42 49
System N removal (%) 9 1 88 92
(NFEED - NEFF ) / NFEED
Table 6. 1 0 indicated an increasing extent of denitrification with increasing ability to
suppress filamentous growth, however the data in Table 6. 1 1 indicates that less of the N
assumed to be removed by denitrification could be attributed to the removal of oxidised
N flowing out of reactor as the extent of denitrification increased.
The amount of N estimated to be removed by denitrification in the settler and selectors
was 1 1 5% of the estimate of system N removal for trial AN I . Barker and Dold ( 1 995)
found that N balances of between 95 to 1 08% could be obtained for anoxic-aerobic AS
systems and 92 to 1 1 0% for AS systems with anaerobic zones. As the mass balances.
used in Tables 6. 1 0 and 6. 1 1 were calculated using average N values over 1 0 days of
operation, the agreement between the two values was not considered to be inconsistent
with other reported findings.

Table 6. 1 1 Estimation of N removed in the settler and selector zones.
Trial AN I AN2
Oxidised N out of reactor zone (gN.d- l ) 0.46 0 .30
Oxidised N in effluent (gN.d- l) 0.07 0. 1 0
Oxidised N out of reactor removed by 0.39 0.20
denitrification In selector and settler
zones (gN.d- l )
Estimated total gN.d-1 removed by 0.34 0.38
denitrification (from Table 6. 10)
% of denitrification due to removal of 1 1 5 53
oxidised N flowing out of reactor zone.
1 67
AN3
0.20
0.03
0. l 7
0 .44
39
However, the difference between the two N removal values obtained for Trials AN2 and
AN3 was outside that expected to be explained by measurement variation. It is
proposed that significant N removal was occurring by either denitrification occurring
simultaneously with nitrification in the reactor zone, or by nitrification occurring
simultaneously with denitrification in the selector zones; but as the selectors were
unaerated the latter scenario was unlikely.
Denitrification rates in the reactor systems could not be accurately determined as the
nitrate concentration in the selectors was generally below the detection limit and any
denitrification in the reactor zone would have been occurring simultaneously with
nitrification reactions. An estimate of the minimum denitrification rate can be obtained
during Trial AN3, where the maximum concentration of 4.6 g.m-3 N03-N measured in
the RAS stream at a flowrate of 44.5 x l O-3m3d-1 must have been removed at a rate in
excess of 0. 1 5 gNOrN.gVSS-I .d-1 to maintain a negligible nitrate concentration in the
selector. This value was slightly above the figures quoted by other researchers of up to ·
O. l l gN03-N.gVSS-I .d-1 (Argaman and Brenner, 1 986; Metcalf and Eddy, 1 99 1 );
however high rates would have been expected in this first selector zone as the
denitrification rate has been found to be proportional to readily biodegradable COD
concentrations (Argaman and Brenner 1 986, Clayton et al. , 1 99 1 ; Isaacs 'and Henze,
1 995).

Reactor System No. 1 Reactor System No.2 0.02
0.0 1 8 I 0.0 1 6 - I I
..:-- I 00 00 0.0 1 4 ;;> I bI) � bI) 0.0 1 2 I --
00 00 0.0 1 I ;;> c... 0 I - 0.008 1:1 � I .-1:1 0 0.006 U I �
0.004 - - I 0.002 - AN2 AN I I
0 00 0 C'l '=t \0 \0 00 0 C'l v \0 0 C'l
C'l C'l C'l C'l '=t '=t V) V) V) V) C'l C'l
Day of Trial
Figure 6. 1 9 : Phosphorus content of biomass in the reactor and selector zones during Tri als AN I , AN2 and AN3 .
..-0\ 00
�=>L?
-.- Biomass PNSS
--6- Selector PNSS
AN3
V \0 00 C'l C'l C'l

Reactor System No. 1 Reactor System No .2 1 0
9 � 8 -.f"'
e � 7 bJl '-' c 6 - -Q .. -� ,. 5 -c � CJ c 4 Q U � 3
� 2 -
AN2 AN I
0 00 0 N '<:t \0 \0 00 0 N '<T
N N N N '<T '<T V'\ V'\ V'\
Day of Trial
Figure 6.20: DRP concentration in the reactor zones during, Trials AN I , AN2 and AN3 .
\0 V'\
I I I I I I I I I I
0 N
AN3
N '<T \0 00 N N N N

1 70
6.6.4 Phosphorus Removal
The effluent DRP concentrations ranged from 3.2 to 7.6 gP.m,3 with averages of 6.9, 4.8 and 5.2 in Trials AN I , AN2 and AN3 respectively. Average DRP concentrations measured in the reactor zones were slightly lower at 6.8, 4 .7 and 4.8 gP'I9,3
respectively. As these values were lower than the 7.5 gP.m,3 measured during the 1 0d
SRT CSTR trial, it was indicated that P removal mechanisms may have been active
under the unaerated selector conditions. Due to the negligible nitrate concentrations indicated, conditions in the selectors could have supported anaerobic activities such as biological P removal via phosphorus accumulating organisms (PAOs).
The variation in total P and DRP levels in the reactor zones as listed in Tables 6.7 to 6.9
also indicated that anaerobic substrate removal may be occurring in the selectors via the activity of P AOs. Although not significantly different at a 95% confidence level, the organic P/vSS ratios measured indicate a possible trend. As seen in Figure 6. 1 9, the
average ratio of organic PI VSS for the mixed liquor was higher in the reactor than it was in the selectors, indicating the possibility of P accumulation by the biomass under aerobic conditions.
The DRP concentrations in the selector zones were higher than that in the reactor, as illustrated in Figure 6.20; which would be consistent with P release during substrate uptake by PAOs under anaerobic conditions. A DRP balance around the first selec�9r could not be performed as substrate DRP was not able to be assessed due to the turbid nature of the feed stream. All reactor system filtrates were free of such turbidity. In most cases, the DRP increased slightly in the settler, which may have been due to release of P in the sludge layer which could be expected to have been anaerobic.
As any phosphorus removed from solution is incorporated into biomass, a P balance should be able to be performed, where:
PFEED = P in the effluent + P in the waste mixed liquor (WML).
The total phosphorus in the substrate was measured as 14 gP.m,3. At an influent
fiowrate of 1 0 J.d' ( , the total mass of P entering the system was therefore 0. 1 4 gP .d,l . The total mass of P leaving the system in the effluent and in the wasted mixed liquor was calculated for the periods represented in Tables 6.7 to 6.9, the results of which are listed in T?ble 6. 1 2. A consistent shortfall was observed in the P balance for all trials, ranging between 1 4% and 28% .

Table 6. 1 2 Phosphorus Removals in the Unaerated Selector Systems
Trial
TP in the influent: PFEED (gP.d- l )
TP in WML + effluent biomass (gP.d- l )
DRP in WML (gP.d- l )
DRP in effluent (gP.d- l )
TP in effluent + WML: POUT (gP.d·l )
POUT / PFEED
6.7 Discussion
AN I AN2
0. 14 0. 14
0.052 0.053
0.006 0.005
0.063 0.043
0. 12 1 0. 1 0 1
0.86 0.72
1 7 1
AN3
0. 1 4
0.054
0.005
0.043
0. 1 02
0.73
The use of various unaerated selector configurations gave slightly increased soluble
COD removals than the CSTR trials. The average reactor sCOD concentrations of 57,
60 and 46 g.m-3 for trials AN I , AN2 and AN3 respectively were considerably lower
than the average 1 0d SRT CSTR value of 9 1 g .m-3, increasing the average sCOD
removal efficiency to 96.5% - 97.2% from 94.5%. Although the HRT was increased by
6, 1 2 and 1 8% respectively in the three selector trials, the batch sCOD removal tests
reported in Chapter 4 indicate that all the sCOD would have been easily biodegradable
within the CSTR HRT of 24 hours, so the increase in residence time would not have
been expected to affect sCOD removal.
The lower effluent sCOD is more likely to have been attributable to a decreased
concentration of soluble microbial product derived sCOD. Orhon et al. ( 1 993) reported
that the sCOD of AS treated dairy wastewaters was due to SMP generated in the '
reactor, at a level of 3 to 7% of the influent sCOD. Assuming all effluent sCOD was
due to SMP, the production levels in the unaerated selector trials would have
represented 2.8% to 3 .6% of the influent sCOD, in agreement with the lo,\¥er level of
that found by Orhon et al. ( 1 993).
Substrate removal rates for the selector reactor biomass differed to that observed for
CSTR biomass, with a 'pseudo first order' substrate removal rate observed. The rates

172
of COD removal were greater and evidence of substrate accumulation and storage was observed. These effects arc commonly reported for sludges exposed to feed / starve situations (Houtmeyers ('/ af. , 1980; Verachtert et af. , 1980; Chiesa et af. , 1985;
Chudoba et af. , 1991), as would be effected by the use of a selector reactor. A decrease in substrate removal rates and �lf11ax was again generally seen accompanying increase in biomass SVI, in agreement with other reported results (Chudoba el af. , 1973b; Van den Eynde et aI. , 1983; Chudoba el af. , 1985; Chiesa et al. , 1985).
The rate and extent of prol ifcration of filan1entous microorganisms was lower for the various selector reactor configurations than for the conventional activated sludge configurations reported in Chapter 5. The l Od SRT CSTR trial failed after 45 days at an SVI of 640 ml.g - 1 , whereas trials AN 1 and AN2 only reached SVls of approximately
250 ml.g - 1 and 150 ml.g" 1 respectively for the same operating period.
The SVI remained stabk at about 300 ml/g during trial AN3, although a visible decrease in filament abwld;U1ce was observed during the 34 days of reactor operation and it was expected that if this trial had been continued for a longer period, a decline in the SVI would have been eventually observed. Trial AN3 was abandoned after 3 SRTs as filament abundance was sti l l significant and it was considered that any system that
took longer than this time period to demonstrate a decrease in SVI would be of limited
use in a full scale system.
The dominant filament observed in the unaerated selector trials differed to that in the CSTR trials. Type 021 N was determined to be the primary organism responsible for the high biomass SVI and a secondary filament present was identified as being Type 1701.
Therefore the incorporation of a selector zone seemed to prevent the proliferation of Type 0411, which had be-en the dominant filament in the CSTR trials. There was also
no red/orange colour change of the biomass as the SVI increased as was observed in the
CSTR trials, indicating that a different filament was responsible for bulking in the
unaerated selector trials.
Both filament types have �n associated with readily metabolisable substrates (Jenkins et al. , 1993), so their domin:ml'c in this series of trials was not surprising as the results detailed in Chapter 4 indi��lte that this substrate could be characterised as such. Type
02 IN has also been comml"lflly reported in nutrient deficient systems (Richard et af. ;
1985; Jenkins et af. , 1993) and as was proposed in Section 5.6., a N deficiency effect may be induced due to the pn.1teinaceous form of substrate nitrogen in combination \\ith
the readily biodegradable C'�rbon source.

1 73
Richard et aI. , ( 1 985) conducted a survey of almost 400 Type 02 1 N bulking incidents
and concluded that this organism was associated with a variety of conditions. Type
02 1N has been associated with low FIM bulking (Richard et al. , 1 985; Shao and
Jenkins, 1 989), but also termed a high organic loading organism by others (Chiesa and
Irvine, 1985). Its growth is reported to be inhibited by anoxic ·or anaerobic conditions
(Wanner and Grau, 1 989), however the use of increased aeration to remove septicity has
also been used as a control strategy for this filament (Richard et aI. , 1 985; Jenkins et aI. ,
1 993).
Growth of the secondary filament, Type 1 70 1 , has been attributed to low DO conditions
(Jenkins et al. , 1 993), which would have been provided in these trials by the unaerated
selector zones. The dissolved oxygen in the aerated reactor was maintained in the 3 .5 to
5.0 g.m-3 DO range, so 'low DO' bulking would not be expected due to conditions in the
reactor (Palm et al. , 1 980).
Both Type 02 1 N (Wanner et aI. , 1 987; Shao and Jenkins, 1 989; Jenkins et al. , 1 993)
and Type 1 70 1 (Goronszy et aI. , 1 985; Jenkins et al. , 1 993) have been successfully
controlled by selectors, therefore the unaerated selector configurations trialed in this
study must not have been able to provide the required selective pressure. The ability of
the various selector configurations to suppress the growth of filamentous bacteria was
found to be related to the soluble COD removal efficiency in the selector zone rather
than the concentration of sCOD leaving the selector zone or selector floc loading.
The selector sCOD removal efficiency can be measured as fraction of 'removable'
sCOD consumed in the selector portion of the system, and it can be seen that the greater
the proportion removed in this zone, the slower the increase in SVI. The fraction of
removable sCOD consumed in the selector zone varied between 47% to 57% in AN I and 5 8% to 59% in AN2. Even though the increased removal i n AN2 was only slight,
there was a marked improvement in the suppression of filamentous growth as seen in
Figure 6.2. The increase in removable sCOD fraction consumed in the selectors to 70%
as achieved in Trial AN3, was able to reduce the visible abundance of filaments, but not.
decrease SVI in a practical time frame. This agrees with the findings of Linne and
Chiesa ( 1 987) who reported than selectors needed to remove more than 80% of soluble
organic material to be effective in preventing filamentous growth. Richard et al. ( 1 985)
reported that Type 02 I N isolates had a high affinity for glucose and lactate, as indicated
by Ks values of less than I g.m-3; suggesting that removals in the selector zone would
have needed to be very high.

1 74
Significant increases in selector volume did not result in the expected increase in sCOD removal, indicating that selector substrate removal was not limited by reaction time. The batch sCOD removal tests exhibited similar initial substrate removal rates for both aerated and unaerated reactors, as long as oxidised N compounds were available in
solution in the unaerated test. Once all the nitrate and nitrite had been consumed in the unaerated reactor, soluble substrate removal from bulk solution ceased, in fact cob measurements indicated that substrate was being released back into the bulk solution
when all oxidised N compounds had been removed.
Substrate removals in the unaerated selectors was therefore limited by the amount of nitrate and nitrite present. Conditions in the selectors were originally intended to be anoxic, but due to the rapid removal of available oxidised N compounds, predominant
selector conditions would have been anaerobic, if the operationally defined criteria of both DO and oxidised N compound concentrations being less than 0.2 g.m-3 (Tetreault
et af. 1 986) is used.
The COD removed from solution via denitrification can be calculated knowing the oxygen reduction equivalent (REQ) of the oxidised N species to be reduced and the yield co-efficient Y H (Siegrist and Gujer, 1 994; Barker and Dold, 1 995):
g COD required per g N oxidised = (6.4)
The reduction equivalents of nitrite and nitrate are 1 .7 1 and 2.86 respectively and the average value of Y H during the unaerated selector trials was 0.63 . Denitrification therefore requires 7 .7 g COD per g N03-N and 4.6 g COD per g NOrN. These values are consistent with the substrate requirement values of 7 to 8 g COD.g N03-N"1 reported
by Argaman and Brenner ( 1 986); Siegrist and Gujer ( 1 994); and Isaacs and Henze
( 1 995).
The value of ( l -Y� represents the mass of O2 consumed per mass of substrate removed and using a value of Y H = 0.63 g cell COD. g substrate COD-I , is equal to 0.37. However the batch sCOD removal tests indicated that this value decreased for the selector reactor biomass, as the substrate removed from solution was being stored rather
than oxidised for biomass growth. The average value obtained during batch tests was'
0. 1 9 g 02.g sCOD removed-I , resulting in increased values of 1 5 . 1 g COD per g NOrN
and 9.0 g COD per g N02-N consumed.

1 75
The amount of sCaD expected to be removed in the selectors due to denitrification
using both values for ( 1 -Y H) was calculated and compared to the total sCOD removal, as listed in Table 6. 1 3 . The results indicated that the majority of substrate removed in the selectors was by mechanisms other than denitrification of RAS nitrate and nitrite.
The mass of sCaD removed due to the reduction of RAS nitrate and nitrite during trial AN I was approximately twice that for trials AN2 and AN3, with the proportion of sCOD removal attributable to denitrification of RAS compounds decreasing as the total mass of sCOD removed increased. This was due to the decrease in reactor nitrate and
nitrite concentrations through the series of trials conducted.
Table 6. 13 Selector soluble COD removal attributable to denitrification.
Trial : AN I AN2
Mass sCaD removed in selectors (g.d- I ) 8.2 9.3
Mass RAS nitrate removed (gN.d-l) 0. 1 7 0.09
Mass RAS nitrite removed (gN.d-l) 0. 1 3 0.06
Total mass of sCOD removed due to 1 .9 1 .0
denitrification (g.d- I) ( 1 -Y H = 0.37)
% COD removal in selectors attributable to 23 1 1
denitrification ( 1 -Y H = 0.37)
Total mass of sCOD removed due to 3.7 2.0
denitrification (g.d-I) ( 1 -Y H = 0. 1 9)
% COD removal in selectors attributable to 45 2 1
denitrification ( 1 -Y H = 0. 1 9)
AN3
1 1 .2
0. 1 2
0.03
1 . 1
1 0
2 . 1
1 9
The mass o f oxidised N species required per mass of substrate removed under anoxic .
conditions may have been even less than that estimated from aerobic batch sCOD removal data, as the results in Table 6.4 indicated that an average of only 90.5% and 78.5% of the O2 consumed in response to sCaD addition was utilised during the period of sCOD removal, in trials AN2 and AN3 respectively. This indicated thai not all the
02 consumed in response to sCOD addition was utilised for substrate removal from bulk solution, O2 was also being utilised for other reactions, probably the production of storage compounds and other increased metabolic activities occurring in response to the

1 76
sorption of available substrate. Assuming that the biomass was able to utilise oxidised
N species in the same manner, a greater proportion of the sCOD removed in the
selectors may have been removed due to denitrification than estimated in Table 6. 1 3 ,
however the existence of other significant sCOD removal mechanisms would still have
been required.
Due to the rapid removal of oxidised N compounds, anaerobic conditions prevailed in
the selector zones during all three trials, providing conditions conducive to anaerobic
substrate removal mechanisms, such as that exhibited by P AOs. A verage pH values
recorded in the selectors were 0:7 to 0.8 units lower than in the reactor, and as the
incoming feed had a pH of 1 1 , the pH drop in the selector zone indicated the production
of acidic compounds as a result of anaerobic activity. The suggestion of PAO activity
was supported by P measurements at various points on the reactor system: the possible
trend in organic P:VSS ratios and the change in DRP through the selector reactor
system are both indicators that P release in the selectors and uptake in the reactor may
have been occurring.
The nutrient content of the biomass in each trial was similar to that quoted elsewhere
for conventional activated sludge. Biomass N contents averaged between 1 2.7% and
1 3 .9%, slightly above the value of 1 2.4% given in Metcalf & Eddy ( 1 99 1 ). Normal P
contents of biomass have been reported to be 1 .5% to 2% (Tetreault et al. , 1 986;
Yeoman, 1 988); therefore the averages of 1 .4% to 1 .7% measured during trials ANI to
AN3 were similar to those being quoted for conventional activated sludge. However,
although the P content of the VSS appeared to be still in conventional AS range; it has
been reported (Tetreault et al. , 1 986) that as the influent sBOD:P ratio increases, the P
content of sludge decreases due to the limited amount of P available per unit of
biomass. As the soluble COD:P ratio was 1 650: 1 3 and assuming an average
BOD:COD ratio of around 0.5 (Marshall and Harper, 1 984), the resultant sBOD:P ratio
of 63 would have resulted in a TSS with a P content of less than 2% (Tetreault et aI. ,
1 986), no higher than that commonly reported for conventional AS levels.
Induction of PAO activity has been stated by Ubukata and Takii ( 1 994) to occur after at
least two anaerobic/aerobic cycles of the biomass, however as the biomass used in the
reactors had not been subjected to anaerobic conditions until the commencement of
Trials ANI and AN2, several SRTs would have been required to increase the fraction of
PAOs in the mixed culture. The development of an increasing proportion of P AOs can
be seen in Figures 6. 1 9 and 6.20, where the reactor DRP concentrations decline from
Trial ANI levels throughout subsequent trial AN3, accompanied by an increasing

1 77
PNSS ratio. The data in Table 6. 1 3 also suggests an increase in the extent of substrate
removal by anaerobic means from Trial AN I through to AN3, as a smaller proportion of sCOD removal could be attributed to anoxic activity as the series of trials progressed .
Total N removals from the unaerated selector reactor systems ranged from 38% in AN I
to 49% in AN3 , indicating that significant denitrification was occurring'. However, a comparison of the oxidised N species removed in the settler and selector zones to the
total N removed from a mass balance indicated that simultaneous nitrification and denitrification must have been occurring in one or more of the reactor system zones
during Trials AN2 and AN3. As there was no oxygen supply to the selectors, nitrification in these zones can be assumed to be non-existent, so it is suggested that denitrification must have been occurring in the reactor zone, simultaneously with
ammonification and nitrification reactions.
It is general ly accepted that denitrification does not occur if dissolved oxygen is
present, however Jenkins el al. ( 1 993) suggest that the activated sludge flocs may
provide an environment in which different types of metabolism can occur concurrently. In this case, even though the bulk liquid DO concentration was maintained between 3 .5
- 5 g.m-3 and therefore aerobic, conditions inside the floc may have been devoid of DO
and therefore anoxic or even anaerobic. Simultaneous nitrification and denitrification has also been reported by other researchers: Suwa el al. ( 1 992) reported denitrification
in aerated reactors, especially for substrates with a BOD:TKN ratio of higher than 1 2 : 1 - a value similar to that provided by the substrate used in these trials. Szpyrkowicz and
Zilio Grandi ( l 995a) also reported simultaneous nitrification and denitrification during
periods of low reactor DO which allowed the interior of the flocs to become anoxic.
The suggestion of denitrification in the reactor is also supported by the decreasing mass
of nitrate and nitrite flowing out of the reactor in Trials AN2 and AN3. As it was
indicated that both ammonification and nitrification were complete in the reactor zone,
a similar mass of oxidised N species would have been expected to produced in the
reactor during all three trials. The data in Table 6. 1 1 indicates that the extent of
denitrification in the reactor zone increased from below 50% in Trial AN2, up to a level
of 60% of total denitrification in Trial AN3 .
N o conclusions can be made on the nutrient removal ability o f the iilamentous
microorganisms that dominated during this set of trials. During AN 1 and AN2 both the
population of filamentous organisms and of organisms with denitrification and P
accumulation abilities increased. However as Trial AN3 progressed, N and P removal

1 78
increased whereas the visible abundance of Type 02 1 N declined. This suggests that Type 02 1 N was not the prime microorganism in denitrification and P accumulation activities, however the ability of either filament type to utilise such metabolic pathways can not be inferred from the results obtained.
The unaerated selector set of trials demonstrate that the rate and extent of proliferation of filamentous microorganisms observed in a CSTR configuration could be reduced by the incorporation of a selector zone. However as results indicated that insufficient substrate removal may have been occurring in the selectors under unaerated conditions to completely inhibit the undesirable filamentous growth, it was considered that aerated selectors may provide a solution to the bulking problem.
6.8 Conclus ions
The use of unaerated selectors decreased both the rate and extent of proliferation of filamentous microorganisms, however high biomass SVls still occurred within the time frame of the trials, with the predominant filament being identified as Type 02 1 N. The ability of a selector configuration to control filamentous bulking was related to the proportion of removable sCOD that was consumed in the selector zone of the reactor system. At least 70% of the sCOD removed in the system needs to be consumed in the unaerated selector zone to suppress filamentous growth.
The selector reactor biomass exhibited . higher substrate removal rates than biomass from CSTR studies and OUR data indicated that significant substrate storage was occurring with biomass that was exposed to an intennittent feed regime. Decreasing substrate removal rates and Jlmax values were again observed with increasing biomass SVI.
Significant overall system N removals of up to 92% of influent values were observed, with between 38% and 49% of system N indicated as being removed via denitrification which was occurring in all zones of the reactor system. However, the mass of nitrate and nitrite present in the selector zone was insufficient to provide the required level of soluble substrate removal via anoxic mechanisms. Denitrification was estimated to only account for approximately 20 to 50% of the sCOD removal occurring in the selectors during the three trials.

1 79
Due to negligible nitrate and nitrite concentrations in the unaerated selectors, anaerobic
conditions resulted in these zones. Substrate removal by anaerobic mechanisms via phosphate accumulating microorganisms was indicated, with the extent of phosphorus removal from solution increasing as the trials progressed. However, the extent of anaerobic substrate removal was not sufficient to prevent soluble substrate carryover
into the reactor zone and subsequent filamentous bacterial growth.

1 80

CHAPTER 7
AERATED SELECTOR REACTORS
7.1 Introduction
1 8 1
Activated sludge systems treating dairy processing effluents have been reported to
result in proliferation of filamentous bacteria (Eikelboom, 1 977; Van den Eynde et al.,
1 982; Rensink and Donker, 1 990), and the results presented in the two previous
Chapters illustrated that both conventional and unaerated selector reactor configurations
could result in bulking problems. The use of a selector reduced the rate and extent of
proliferation of filamentous microorganisms, but could not prevent or cure bulking
under the conditions provided.
The conditions reported as resulting in the suppression of filamentous growth are
diverse (Albertson, 1 991 ; Jenkins et al. , 1 993 ; Chudoba and Pujol, 1 994) and at times
conflicting, however the provision of a substrate gradient which allows the generally
faster growing floc formers to predominate is a commonly proposed strategy, which in
a continuous system may be provided by the use of a selector system. TIle extent of
substrate removal in the selector zone is also proposed to be an important factor
(Chudoba et al., 1 973b; Chudoba et al. , 1 985a; Linne and Chiesa, 1 987; Shao and
Jenkins, 1 989).
The first series of selector configurations trialed were unaerated in an attempt to impose
a defmed period of anoxic conditions, however experimental results indicated that the
mass of oxidised nitrogen compounds in the return activated sludge was insufficient to
remove the required amount of influent substrate, or to · maintain anoxic conditions in
the selector zone; The next step was therefore to try aerated selector configurations so
that selector zone soluble substrate removal would not be limited by the amount of
electron acceptor present. As the filament type that had dominated during CSTR trials
was inhibited by unaerated selector reactor conditions, it seemed likely_ that those
filaments that proliferated under the selector trial conditions could also be inhibited
when exposed to the appropriate selective pressures.

1 82
The use of unaerated selectors in the previous Chapter resulted in significant nitrogen (N) and phosphorus (P) removals from the wastewater. The use of a totally aerated selector system was therefore not expected to result in noticeable nutrient removal due
to the reliance of N and P removal on the existence of defined anoxic and anaerobic
zones respectively.
7.2 Selector Design
The same experimental equipment and operating conditions were used as for the
unaerated selector trials. The first aerated selector trial was initiated by introducing
aeration to the selectors at the conclusion of Trial AN3 . Aeration rate was not measured, but was supplied at a rate that was sufficient to provide vigorous agitation and intended to provide aerobic conditions in bulk solution.
After it became apparent that the serial aerated selector configuration was able to remove nearly all of the 'removable' sCOD(rsCOD) in the selector zone, various combinations of selector sizes and configurations were trialed in an attempt to establish
the critical parameters for the prevention of filamentous bulking.
The configurations that were used are:
Trial AEI : 3 x 0.6 I aerated selectors Trial AE2: 1 x 1 .2 I aerated selectors Trial AE3: 2 x 0.6 1 aerated selectors Trial AE4: 1 x 0.6 1 aerated selectors
Trial AE5: 3 x 0.6 1 aerated selectors
Two identical reactor vessels were used as shown in Figure 7. 1 , with the trials being conducted sequentially as follows: Trials AEI , AE3 and AE5 in one reactor and Trial AE2 and AE4 in the other reactor. Changing from one trial to the next simply involved changing the selector configuration, with the biomass used being that which resulted from the previous trial in that reactor. The aeration rate to the selectors was not measured or controlled, except to ensure that vigorous bubbling and complete mixing in
the selector vessel was maintained.
Trial AE5 employed the same selector configuration as AEI , and was used as a check on the ability of that configuration to consistently cure bulking after Trial AE3 had resulted in filamentous growth.

Figure 7. 1 : Aerated selector reactor equipment configuration.
7.3 Reactor Treatment Performance
1 83
The average reactor performance measured during the five aerated selector tria ls is
l isted in Table 7. 1 . Overa l l system soluble COD removal efficiencies ranged from 97 to
98%, with average reactor sCOD concentrations ranging between 29 and 46 g .m-3 .

1 84
Table 7. 1 Aerobic Selector Reactor Treatment PerfQnnance
Trial AEl AE2 AE3
Selector configuration (1) 3 x 0.6 1 x 1 .2 2 x 0.6
Days at SRT 65 70 46
Selector outlet conditions:
pH 7.50 7.50 7.55
TSS (g.m-3) 4290 4020 4830
VSS (g.m-3) 3860 3670 4340
Total COD (g.m-3) 5 800 5870 6550
Soluble COD (g.m-3) 47 62 53
Reactor outlet conditions:
pH 7.60 7.75 7.75
TSS (g.m-3) 3940 3890 4590
VSS (g.m-3) 3530 3560 4 1 30
Total COD (g.m-3) 5450 5270 6050
Soluble COD (g.m-3) 46 46 37
sCOD Removal (%) 97.2 97.2 97.8
SVI Range 1 1 3 -35 1 1 36 -441 1 00 - 1 75
SVI Trend during Trial decrease decrease increase
Effluent conditions :
pH 7.90 7.85 7.90
TSS (g.m-3) 27 43 1 6
VSS (g.m-3) 24 4 1 1 4
Total COD (g.m-3) 86 94 62
Total COD Removal (%) 96. 1 95.7 97.2
% effluent COD due to TSS 46.5 5 1 . 1 40.3
AE4 AE5
1 x 0.6 3 x 0.6
22 3 0 ,-
7.80 7.65
4870 4980
4420 4450
6450 5500
57 34
7.90 7.80
4840 44 1 0
4400 3940
6700 5850
29 33
98.2 98.0
1 36 -344 200- 1 23
increase decrease
7.80 7.95
1 7 1 9
1 6 1 8
5 1 73 -
97.7 96.7
43. 1 54.8

1 85
Table 7.2 Selector performance and operation during the aerobic selector trials
Trial Days at RAS Total Floc So into Selector % rsCOD SRT Flowrate Selector Load Selector sCOD consumed in
( 1 0-3m3 d·l) HRT ( g sCQI2 ) (gsCODm-3) (g sCOD.m-3) selector (min) g VSS
AE I 1 - 20 56.2 39 0.07 1 296 92, 58, 53 1 00
21 -3 1 54.8 40 0.076 297 92, 63, 46 1 00
32 -34 32.2 6 1 0. 1 09 422 84, 5 1 , 39 1 00
35 -39 37 55 0.095 380 85, 4 1 , 45 98.3
40 -42 28.2 68 0. 1 1 4 457 47, 42, 40 98.6
43 -44 25.0 74 0. 1 3 1 499 76, 54, 50 97.4
45 1 8 . 1 92 0. 1 50 6 1 3 1 35, 58, 58 96.9
46 -65 1 3 .0 1 1 3 0. 1 95 749 1 85, 73, 44 1 00
AE2 1 - 7 23.8 5 1 0. 1 54 528 1 05 90.0
8 - 1 4 28.2 45 0. 1 34 472 92 90.9
1 5 - 1 8 23.8 5 1 0. 1 42 532 73 97.7
1 9 -35 38.2 45 0. 1 00 385 68 95.8
36 -58 1 0.2 86 0.2 1 7 835 44 99
59 -70 1 4.3 7 1 0. 1 67 691 37 98.9
AE3 1 - 9 1 3 .0 75 0. 1 78 737 1 1 0, 55 97.2
1 0 -29 1 0.2 86 0. 1 97 837 1 20, 59 97.4
30 -46 1 2.6 76 0. 1 76 750 1 20, 43 99
AE4 1 - 1 8 1 4.3 36 0. 1 53 691 59 95.6
19 -22 44.7 1 6 0.069 320 4 1 93.6
AE5 1 - 30 1 2.6 1 1 5 0. 1 86 750 69,42,34 99.9
The average sCOD concentration in Trial AEI appears higher than that in AE3,
however as can be seen in Figure 7.2, the sCOD declined during AEl , from an initial

1 00
90
80 .f"
a 70 � -- " Q "
60 ' , 0 ' , u � 50 - ,
,.Q , = \
-0 40 til '"' 0 ..... 30 (J C': �
� 20
1 0
0
0
" " " , " \ I . I, I . " I . I , I I I t , . ' .
, "
20
, , , , , , , , , , ,
" " " " " , ' , ' , '
" ' . . : / . . '"
, ' , " , " , , . "
40
" " " " , , , , , , , ,
I , " " "
60
, " " ,
Time (days)
I "
I '
Figure 7.2 Reactor soluble COD concentrations during aerated selector trials AEI to AE4.
80
. - - - - - Reactor System I , Trial AE2
- - - Reactor System I , Trial AE4
--- Reactor System 2, Trial AE 1
--- Reactor System 2, Trial AE3
1 00 1 20
00 0'\

1 87
average of 63 g.m-3 (days 1 -5) to an average of 30 g.m-3 at the end of the Trial (days 60 - 65). The average sCOD also declined during Trial AE2 - the first aerated selector trial in the second reactor, from an initial average sCOD of 57 g.m-3 to a final average sCOD (days 59 - 70) of 33 g.m-3. The average reactor sCOD values in Trials AE3, AE4 and AE5 remained constant for the duration of the trial. 'Steady state' reactor sCOD values during all five trials ranged from 29 g.m-3 to 37 g.m-3, indicating "iittle effect of selector configuration on final sCOD removal efficiency or SMP formation.
The average TSS concentrations ill the effluent ranged from 1 6 to 43 g.m-3, but as for reactor sCOD, the higher averages were associated with the first aerobic selector trial in each reactor. The average effluent TSS concentrations at the end of the trial were 1 2 and 1 8 g.m-3 for AEI and AE2 respectively. The effluent total COD values for Trials AE 1 and AE2 also appear higher for the same reasons.
As in the previous trials, RAS flowrates were adjusted in response to SVI so as to maintain a minimum level of biomass in the settler. The performance of the selector zone in each trial during varying flow conditions in summarised in Table 72_ The increase in RAS flowrate is accompanied by a decrease in floc loading and theoretical initial sCOD (So) in the selectors. The sCOD concentrations observed during Trial AE5 represent an average value of 6.5 g sCOD. gVSS-I _d- 1 for substrate removal in the initial selector zone.
The proportion of removable sCOD (rsCOD) consumed is calculated using the average reactor sCOD concentration during the same period. The percentage of removable sCOD consumed in the selector zone was above 90% in all the trials, considerably higher than the 47% to 70% values measured in the unaerated selector trials at similar selector HRTs. The addition of oxygen therefore enabled the removal of almost all rsCOD from solution in the selector zone.
7.4 Filamentous Microorganism Growth
Two of the aerobic selector reactor configurations trialed were able to cure filamentous bulking as evidenced in the decrease in SVI shoWfl in Figures 7.3 and 7.4.
Trial AEI directly followed Trial AN3 and began to demonstrate a consistent decline in
SVI after almost 3 SRTs at the new selector configuration. The SVI took 20 days to
decline froin an average of 3 1 O ml.g-I to a stable level of below 130 ml.g-I . The trial was continued for a further 2 SRTs and remained constant in the 1 1 3 to 1 36 ml.g-I range.

1 88
400.------------------,------------�--------_.
3 50
250 'OJ) -E 200
'-" -;> rJJ 1 50 -
1 00
50
AEI AE3 I AE5
I I I I
�jr� �� �
o+-------�------��------+_----�--------� o 30 60 90 1 20
Time (days)
Figure 7.3 : Change in Sludge Volume Index during trials in Reactor System 2.
450
400
350
300 ---, � 250 E '-"
200 -;> rJJ 1 50
1 00
50
0
0 20 40 60 80
Time (days)
. Figure 7.4: Change in Sludge Volume Index during trials in Reactor System 1 .
1 50
1 00

1 89
Trial AE2 directly followed Trial AN2 and the initial SVI of around 280 ml.g-1 increased
to 440 mI.g-1 by day 26 of the trial. The SVI then began to decrease rapidly arid took 26
days to drop to below 1 50 mI.g-l , remaining in the 1 40 - 1 60 ml.g-I rarIge for a further 2
SRTs.
Although both AEI and AE2 resulted in a decrease in selector SVI, the 'serial selector
configuration of AE1 resulted in a lower final stable SVI. In both cases the decline in SVI
began after nearly 3 SRTs at the new reactor conditions, a time frame commonly
considered as that needed to reach a new 'steady state' with activated sludge systems.
The next pair of selector configurations trialed: 2x 0.61 arid 1 x 0.61, resulted in the
proliferation of filamentous microorgarJisms arid increases in SVI. It was expected that
if the I x 1 .21 selector (AE2) could prevent bulking then so would the 2x 0.61 configuration
(AE3) as the volume of the selector zone was the same in both cases, however the SVI
during Trial AE3 steadily rose from 1 00 to 1 75 mI.g-1 over a 46 day period. The use of a
single 0.61 selector in AE4 resulted in a rapid increase in SVI arid the trial was abandoned
after 22 days by which time the SVI had increased from 1 36 to 323 ml.g-I . Figure 7.5 was
taken at the end of the trial and clearly demonstrates the open floc structure resulting from
filamentous growth.
Trial AE5 used the same selector configuration as AEI and was implemented to confirm
the ability of this configuration to cure bulking. As can be seen from Figure 7.3, the Sy,I
decreased slowly for the first 1 5 days, then more rapidly to stabilise between 1 20 arid 1 40
ml/g after less than 2 SRTs from the beginning of the trial. The accomparIying reduction
in the abundance of filamentous bacteria can be seen from the condition of biomass in
Figure 7.6, taken on Day 22 when the SVI had declined to 1 33 ml/g.
Morphology arid staining observations on the biomass indicated that the dorninarIt
filament causing bulking in trials AE3 and AE4 differed to those previously observed in
either the conventional CSTR or anoxic selector trials.
The dominant filament was observed as being:
- short, fine (0.5 Jlm diameter), straight filament protruding from floc surface
- cell septa not discernible
- Gram stain -ve
- Neisser stain -ve - no granules

1 90
Using the keys in Jenkins et a/. ( 1 993) and La Trobe University ( 1 993) this filament was
identified as Haliscomenobacter hydrossis.
Type 02 1N was also present, but as a minor secondary filament, both protruding from the
flocs and free floating. A few filaments of Nocardia sp. were also seen in some trials,
during periods when intermittent foaming was observed at the inlet to the settler. Two
other very minor filaments were also present, tentatively identified as Types 004 1 aild
0092.
The activated sludge mixed liquor changed in hue to a pale yellow when an abundance of
H hydrossis was present. Well settling sludges with a low SVI were still characterised by
a deep gold-yellow colour.
The predominance of H hydrossis has been associated with low DO at low to moderate
SRT (Jenkins et al. , 1 993; La Trobe University, 1 993); low FIM (La Trobe University,
1 993; Chiesa and Irvine, 1 985); soluble, readily metabolizable substrates (Jenkins et al. ,
1 993) and has been proposed to belong to the 'Low DO Aerobic Zone' group of
filamentous organisms (Jenkins et al. , 1 993).
Observations made during morphology and staining procedures also suggested the
presence of biological phosphorus removal processes, as a pink colour was observed in
the flocs when stained with methylene blue, which indicates the occurrence of
polyphosphate accumulation (La Trobe University, 1 993).
The photograph in Figure 7.5 illustrates the very fine nature of the H hydrossis filament
and the resultant open floc structure. The ability of the serial selector configuration to
cure bulking is shown in Figure 7.6 where the disappearance of filaments and restoration
of denser floc uni� is observed. Both photographs were of wet mounts at 1 00x
magnification.

Figure 7.5 : Filamentous bulking at the end of Trial AE4. SVI = 323 ml.il .
( l OOx magnification)
t · /
1 9 1
Figure 7.6: Reduction in filament abundance and SVI during Trial AE5; by Day 22 of
the trial the SVI had decreased to 1 33 ml.g- I . ( l OOx magnification)

7.5 Measurement of kinetic constants
1 93
Substrate removal rates and biomass oxygen uptake rates in response to soluble substrate
addition was again measured during the trials using batch tests.
7.5.1 Soluble COD Removal Rates
An increased rate of substrate removal was expected to be obtained in batch tests on biomass from the aerated selector configurations due to the high rates indicated from
reactor performance data. The very rapid removal of sCOD can be observed in Figure 7.7 which shows the sCOD profile through the reactor system in Trial AE5 . It can be seen
that 95% the rsCOD removal from bulk solution occurs within the 3 8 minute residence time in the first selector.
800
700
--600 '?
5 bD 500 '-""
� 0 400 U �
3 00 :E ::I "0 200 00
1 00
0
Figure 7.7:
S o into Selector A
0 1 00 200 300 400 500
Time (minutes)
600 700
c <) ::> E <) ... � <)
_0::. -
800
Soluble COD concentration in the reactor system zones during Trial AE5.
Batch sCOD removal rate tests were conducted in the same manner as for the unaerated
selector reactor trials. A volume of concentrated GFC filtered substrate containing approximately 500 mg sCOD was added to one litre of biomass that had been aerated

1 94
until a constant endogenous respiration rate had been recorded. Initial substrate
concentrations ranged from 435 to 650 g sCOD.m-3 resulting in floc loadings from 0. 1 0 to
0. 1 7 g sCOD.gVSS- 1 , similar to values obtained in the first selector zone of the reactors.
The same trend of initial biosorption followed by a log decay in sCOD concentration, as
seen in tests on biomass from unaerated selector reactor configurations, was observed;as shown in Figure 7.8 . A summary of the results obtained from batch tests performed,
including the apparent first order removal rate constant (k), are listed in Table 7.3 .
Table 7.3 Batch Soluble COD Removal Rate Tests
Trial Days SVI Floc Biosorption k at (ml.g" l) loading ( g sCOD ) (d·l)
SRT ( g sCOD) gVSS
gVSS
AEI 28 267 0. 1 3 0.08 4 1
48 1 27 0. 1 3 0.05 68
6 1 . 1 24 0. 1 7 0.09 92
AE3 1 7 1 27 0. 1 3 0.07 1 05
45 1 59 0. 1 2 0.08 1 30
AE5 29 1 30 0. 1 5 0.07 1 00
AE2 43 1 95 0. 1 6 0.08 1 45
67 1 5 1 0. 1 0 0.04 1 80
AE4 22 323 0. 1 2 0.08 97
i-,.Q2 �Qnsumed %02 consumed g sCOD added when sCOD
removed
0. 1 6 70
0. 1 2 44
0. 1 3 70
0.22 62
- -
0. 1 5 69
0. 1 5 34
- 0. 1 8 54
0.3 1 64
Comparing tests performed during the same trial and considering the floc loading in each test, it appeared that there was an increase in the apparent substrate removal rate constant
as the trials progressed, indicating that the culture in each case was developing into one
with a greater ability for rapid substrate removal. The biosorption capacity of biomass SUbjected to similar floc loadings seemed to now increase as the SVI and filament
abundance increased, indicating that H hydrossis may also have biosorptive capacity.
The mass of oxygen consumed in response to mass of sCOD added ranged from 0. 1 2 to
0.22 g.g-l , with the exception of one higher value being recorded during the bulking

1 95
conditions. The values were generally lower than those measured during the unaerated
selector trials, reflecting more efficient substrate removal and storage mechanisms.
� .0 = -o '"
6 .-I
5 �_ .-
4 • - - - - - . - - - - - - - - - - - - - - - . - - - - - - - - - - - - - - - .
3
2
= 0 ..J o 20 40 60 80
Time (minutes)
1 00
Figure 7.8: Soluble COD concentration during batch tests using biomass from Day 29
of Trial AE5.
The fraction of the total oxygen consumption that occurred during the period of sCOD removal from bulk solution was also lower in this set of trials, ranging from 0.34 to 0.70
compared to 0.72 to 0.96 in the anoxic selector trials. This indicated that processes involved in substrate removal from bulk solution had increased more rapidly than the rate of substrate storage processes. The increased rate of removal from bulk solution would
then have been largely responsible for the dramatic increase in apparent k values observed when changing from unaerated to aerated selectors.
Similar values for oxygen consumption in response to sCOD added can be calculated from actual reactor performance data measured during trial AE5. The selector DO and OUR values were used to calculate the results listed in Table 7.4.
As virtually all the rsCOD is removed from bulk solution in the selector zone, the specific OUR (SpOUR) in the reactor can be taken as approximating the endogenous' OUR. The difference between the selector OUR and reactor OUR therefore approximates the increased oxygen consumption in response to exogenous substrate removal as measured
in the batch tests. The average mass of oxygen consumed per mass of sCOD removed

1 96
from bulk solution in the selector zone was 0. 1 0 g02.g sCOD-1 , the same value as that obtained in Table 7.3 for O2 consumed in response to sCOD added, during the period of
exogenous substrate removal :
0. 1 5 g 02.g sCOD-1 x 0 .69 = 0 . 1 0 g O2 consumed.g sCOD removed- 1 (7. 1 )
Table 7.4 Oxygen consumption during substrate removal in the selector zone during Trial AE5.
Trial AE5 : Reactor
DO (g02.m-3) 6.50
OUR (g02.m-3min-l ) 0.47
SpOUR ( 1 0-3 g02.gVSS.min- l) 0. 1 2
Elevated SpOUR due to sCOD addition ( 1 0-3 g02.gVSS.min-l)
-
sCOD removed (g.d-I) 0.07
Total O2 consumed (g.d-I) 6.49
Increased g O2 consumed in response to g.sCOD removed
7.5.2 Estimation of Biokinetic Parameters
Sel. A
1 .35
1 .54
0.40
0.28
1 4.97
1 .33
0.06 1
Sel. B Sel. C Total Selector
5 .4 4.68
1 . 1 7 0.95
0.25 0.20
0. 1 3 0.08
0.7 1 0. 1 7 I S .92
0.82 0.75 2.90
0.65 1 . 1 9 0. 1 0-
Decay rates were not measured during the aerobic selector trials, as no significant change in biomass decay rate co-efficients were seen between the CSTR and anoxic selector trials.
The biokinetic parameters Jlmax and Ks were estimated using the low SIX respirometric method as previously defined with A TU added to inhibit nitrification reactions. The values calculated for Jlmax and Ks using Y H = 0.68 g cell COD. g substrate COD-I are listed in Table 7.S below. Although both Trials AEI and AES utilised the same reactor configuration, the values measured for both �SpODRmax and Ks were considerably higher during the later trial.

1 97
It can be seen from the results in Table 7.4 that the mass of oxygen consumed per mass of sCOD removed increased through the selector system, indicating 'unbalanced growth' and that substrate was being removed via accumulation and storage rather than mineralisation. As the ratio of increased mass of O2 consumed in response to mass of sCOD removed was so low in the first selector, the presence of substrate removal mechanisms other than purely aerobic mechanisms is demonstrated.
.
Table 7.5 Kinetic constants determined during aerated selector trials
Trial Days at SVI �SpOURmax �max SRT (ml .g·l ) (g02.gcell COD-
I.d-
I) (d-I )
AE l 28 267 0.22 0.47
49 1 20 0.25 - 0.28 0.53 - 0.58
62 1 1 3 0.28 0.60
AE3 45 1 59 0.78 1 .66
AE5 30 128 0.88 1 .87
AE2 67 1 5 1 0.86 1 .83
Ks (gCOD.m-
3)
1 1 .8
9.5 - 12.9
28.4
26.6
40.9
23.2
The values determined for �SpOURmax increased as the trials in Reactor 2 progresse4 .. from 0.22 to 0.88 g02.g cell COD-1 .d-l , the final values being considerably higher than the 0.23 to 0.35 g02.g cell COD-1 .d-1 values measured during the unaerated selector trials. The values obtained for Ks also increased as the trials progressed. The results during
Trial AE1 again indicated that the value of �ax and Ks increased as the SVI decreased, however only single results were obtained during subsequent trials, so this effect could not be investigated further for the aerated selector configurations.
The very rapid OUR observed in response to substrate addition during these trials was obviously a result of substrate accumulation and storage processes rather than assimilation ' and replication. The increased values of �SpOURmax as the trials progressed was then to be expected as the substrate removal rates increased significantly in the same manner. The use of the low srx respirometric method for estimating traditional 'growth' parameters �max and Ks is therefore limited, being only a reflection of traditional growth parameters when substrate removal is for balanced gro�. However the principle of comparing �SpODRmax as a means of determining the response of biomass to substrate addition and comparing mixed cultures was still considered to be useful and valid.

1 98
7.5.3 Measurement of Biosorbed Substrate
As the batch sCaD removal rate tests and �SpOURmax detenninations indicated that significant substrate biosorption and accumulation was occurring, an attempt was made to assess whether the cel lular and substrate components of the flocs could be easily distinguished.
The two indicators of floc biomass content to be investigated were variations in the CODNSS ratio and in the DNAffSS ratio.
It can be assumed that the VSS fraction of floc solids would be comprised of microbial cells and substrate components. The COD content of cells, (00 has been measured at around 1 .42 gCOD.g cells·l . Batch tests outlined in this section were perfonned using soluble substrate, therefore the COD fraction that would be adsorbed would be the colloidal components (SH)' represented mainly by the protein fraction. Using the data stated in Section 4. 1 .3, the COD of milk proteins is in the order of 2.5 gCOD.g protein-I , considerably higher than the COD content of cell mass. Therefore it could be expected that if a significant quantity of floc VSS was derived from biosorption of substrate, the CODNSS ratio would be higher than 1 .42; and higher in the selectors than in the reactor.
. The data . calculated from the various zones in the aerated selector trials and the value measured during the conventional 1 0 day SRT CSTR trial are listed in Table 7.6.
Table 7.6 Mixed liquor suspended solids COD / VSS Ratios
Reactor Selector A Selector B
IOd SRT 1 .48 ± 0.24 - -
AEI 1 .5 1 ± 0.24 1 .55 ± 0.20 1 .54 ± 0. 1 6
AE2 1 .48 ± 0.22 1 .53 ± 0.29 -
AE3 1 .46 ± 0.24 1 .55 ± 0.25 1 .5 1 ± 0_23
AE4 1 .52 ± 0.08 1 .60 ± 0. 1 9 -
AE5 1 .58 ± 0.22 1 .59 ± 0.23 1 .57 ± 0.24
Selector C
-
1 .53 ± 0.21
-
-
-
1 .56 ± 0.24
Although there are trends in average values calculated, due to the variability in the data values were not significantly different at a 95% CI, so no conclusion about the possibility of the presence of adsorbed substrate onto the floc biomass can be made. The CODNSS

1 99
ratios in the reactor zone during the selector trials were similar to that measured in the conventional CSTR trial at the same SRT.
The second method attempted was to measure the DNA content of mixed liquor solids from various zones in the reactor system. Samples were taken from each selector and the reactor on day 27 of Trial AE5, with a duplicate analysis being carried ou{on the sample from Selector C. The results obtained are listed in Table 7.7 and implied that the DNANSS ratio was higher in the selectors than in the reactor, the opposite of what would have been expected. However, as the two values obtained for Selector C duplicate samples indicated, the analysis was not accurate enough to enable the DNANSS ratio to be detected at the level of precision that would be required.
Table 7.7 DNA content of biomass at different locations in the reactor system.
I Reactor Sel. A Sel. B Sel. C ( 1 ) Sel . C (2)
DNANSS (gig) 0.046 0.082 0.077 0.075 0.084
The reactor value of 4.6% compared favourably to the results reported by Speece et al.
( 1973) of MLSS DNA contents ranging from 1 .3 to 5.6%, with increasing DNA content as the FIM ratio increased.
7.6 Nitrogen and Phosphorus Removal
The concentrations of various nitrogen and phosphorus compounds were measured for a period of approximately one SRT towards the end of each trial, except during Trial AE4
where only limited measurements could be obtained before the trial was abandoned due to filamentous growth. The average concentrations measured during each trial are listed in Tables 7.8 to 7. 1 2, indicating that both nitrogen and phosphorus removal was occurring in the aerated selector reactor systems. The TKN value reported is for the unfiltered mixed' liquor sample and it can be seen that the biomass N content dominated the result, with
variations in TKN reflecting variations in zone MLSS concentration. Anunonia, nitrate and nitrite concentrations in the various reactor zones during the trials are iJIustrated in Figures 7.9 to 7. 14 .
During Trial AE1 the levels of nitrate and nitrite were negligible in the first selector, even though significant quantities of nitrate were supplied via the return activated sludge. This

200
indicated that denitrification was occuning in the first selector even though aeration was being supplied to that zone. The nitrate concentration remained negligible in the second selector, but a measurable nitrate concentration was detected in the third selector, evidence
. that nitrification was also occurring in the final selector zone.
Table 7.8 N and P concentrations during Trial AE l : 3xO.6 I selector configuration
(Days 49 - 64) Selector Selector Selector Reactor Effluent A B C
TKN (gN.m-3) 454 485 568 470 3 .72
NH3
(gN.m-3) 1 .9 1 1 .93 0.74 <0 . 1 0. 1 7
N03
(gN.m-3) < 0. 1 < 0. 1 0.63 6 .9 1 5 .76
N02 (gN.m-3) 0.02 0.05 0.35 0. 1 7 0. 1 7
TP (g.m-3) 95 1 00 1 26 86 2.46
DRP (g.m-3) 3 .43 2.00 1 .35 1 .76 1 .68
Organic N / VSS 0. 1 22 0. 1 2 1 0. 1 2 1 0. 1 28 -
± 0.0 1 6 ± 0.028 ± 0.007 ± 0.026
Organic P / VSS 0.025 0.026 0.026 0.023 -
± 0.006 ± 0.007 ± 0.007 ± 0.002
Nitrite concentrations remained very low throughout all reactor zones. The negligible reactor ammonia concentrations indicated that nitrification was again completed within the reactor residence time. DRP concentrations showed a marked decrease through the
selector zones, with the value in the third selector being lower than that in the reactor for some periods in the trial. Low effluent TP values reflected the low TSS concentrations in the settler overflow.
The data from Trial AE2 also indicated that denitrification was occurring in the selector zone, although both the nitrate and nitrite concentrations coming out of the selector zone were higher in Trial AE2 than AE I . Reactor and effluent DRP concentrations were slightly higher than for AEI , indicating a lower P removal efficiency.
As trials AE2 and AE3 both used a total selector volume of 1 .2 1, similar results were expected, however filamentous bacterial growth occurred during Trial AE3 whereas Trial AE2 was able to cure filamentous bulking.
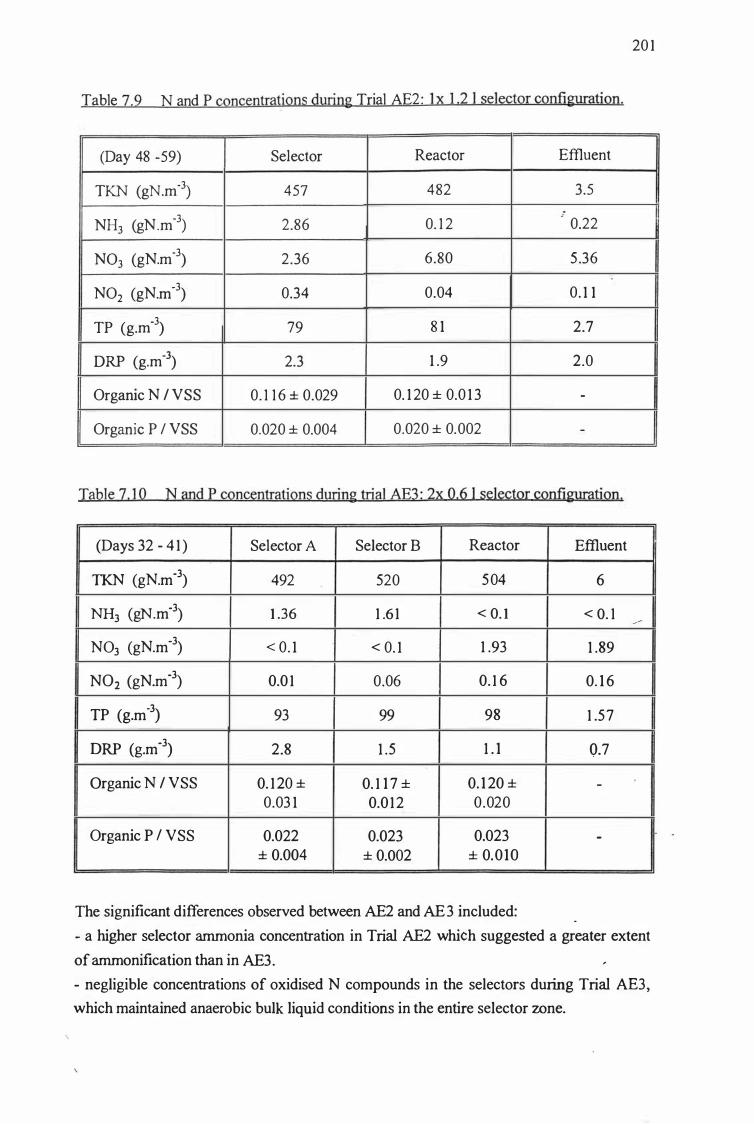
Table 7 .9 N and P concentrations during Trial AE2 : Ix 1 .2 1 selector configuration.
(Day 48 -59) Selector Reactor Effluent
TKN (gN.m-3) 457 482 3.5
NH3
(gN.m-3) 2.86 0. 1 2 0.22
N03
(gN.m-3) 2.36 6.80 5 .36
N02 (gN.m-3) 0.34 0.04 0. 1 1
TP (g.m-3) 79 8 1 2.7
DRP (g.m-3) 2.3 1 .9 2.0
Organic N / VSS 0. 1 1 6 ± 0.029 0. 1 20 ± 0.0 1 3 -
Organic P / VSS 0.020 ± 0.004 0.020 ± 0.002 -
Table 7.10 Nand P concentrations during trial AE3: 2x 0.6 1 selector configuration.
(Days 32 - 4 1 ) Selector A Selector B Reactor Effluent
TKN (gN.m-3) 492 520 5 04 6
NH3
(gN.m-3) 1 .36 1 .6 1 < 0. 1 < 0. 1
N03
(gN.m-3) < 0. 1 < 0. 1 1 .93 1 .89
N02 (gN.m-3) 0.0 1 0.06 0. 1 6 0 . 1 6
TP (g.m-3) 93 99 98 1 .57
DRP (g.m-3) 2.8 1 .5 1 . 1 0.7
Organic N / VSS 0. 1 20 ± 0. 1 1 7 ± 0. 1 20 ± -
0.03 1 0.0 1 2 0.020
Organic P / VSS 0.022 0.023 0.023 -
± 0.004 ± 0.002 ± 0.01O
The significant differences observed between AE2 and AE3 included:
20 1
./
- a higher selector ammonia concentration in Trial AE2 which suggested a greater extent of ammonification than in AE3.
- negligible concentrations of oxidised N compounds in the selectors during Trial AE3, which maintained anaerobic bulk liquid conditions in the entire selector zone.

202
- a peak in reactor system nitrite concentrations in the selector zone during Trial AE2, but
in the reactor zone during Trial AE3.
- lower DRP concentrations and indications of a higher biomass P content during Trial
AE3, suggesting that more substrate was being removed via anaerobic mechanisms than
in AE2.
The single 0.6 1 selector used in Trial AE4 also failed to prevent bulking, the rate of
filament proliferation being so rapid that only six sets ofN and P analyses were perfonned
before the Trial was abandoned. Low concentrations of oxidised N compounds were
measured in the mixed liquor leaving the selector zone, similar to that recorded in AE l ,
however the reactor nitrate and nitrite concentrations were also lower than i n other trials
except for AE3. The low effluent DRP values and low nitrate out of the selector again
indicated that substrate was being removed by both anaerobic and anoxic mechanisms as
well as aerobically.
Table 7. 1 1 N and P concentrations during Trial AE4: I x 0.6 1 selector configuration.
(Days 1 6 - 22) Selector Reactor Effluent
TKN (gN.m-3) 528 5 1 5 1 .8
NH3 (gN.m-3) 1 .48 < 0. 1 < 0. 1
N03 (gN.m-3) 0.64 2.65 2.32
N02 (gN.m-3) 0.50 0.03 0. 1 2
TP (g.m-3) 98 95 1 .24
DRP (g.m-3) 1 .43 0.74 0.73
Organic N / VSS 0. 1 2 ± 0.03 0. 1 2 ± 0.05 -
Organic P / VSS 0.02 1 ± 0.007 0.021 ± 0.007 -
Trials AE 1 and AE5 both used the same selector configuration, so were expected to
exhibit the same trends in nutrient reactions and concentrations throughout the reaction
zones. Both trials resulted in a fully nitrified effluent and a peak ammonia concentration in
Selector B. System nitrate concentrations were highest in the reactor during both AEI .
and AE5, with denitrification obviously occurring in the first selector and to a lesser
extent, in the settler. During Trial AEI the nitrate concentration was negligible in
Selectors A and B, then increased to 0.6 g.m-3 in Selector C, and although the nitrate
concentrations also increased throughout the selector system in Trial AE5, they were

203
maintained at a significantly higher level. Nitrite concentrations were very low but
increasing sequentially through the selector system in Trial AE 1 , slightly higher and
decreasing through the selectors in Trial AE5.
Table 7 . 1 2 N and P concentrations during Trial AE5 : 3x 0.6 I selector configuration.
(Days 22 - 30) Selector Selector Selector Reactor Effluent A B C
TKN (gN.m-3) 473 449 509 460 4.53
NH3 (gN.m-3) 1 .07 1 .73 1 . 59 < 0. 1 < 0. 1
N03 (gN .m-3) 2.80 3.35 3.8 7.85 7.03
N02 (gN.m-3) 0.70 0.54 0.53 0.04 0 .09
TP (g.m-3) 97 93 1 05 93 0.6
DRP (g.m-3) 1 .27 0.59 0.52 0.28 0.38
Organic N / VSS 0. 1 1 8 0. 1 1 3 0. 1 1 6 0. 1 1 5 -
± 0.034 ± 0.01 1 ± 0.0 1 9 ± 0.0 1 4
Organic P / VSS . 0.024 0.024 0.024 0 .024 -
± 0.002 ± 0.003 ± 0.003 ± 0.004
Even though the flowrate through the system remained constant during the period of N
species determinations for both trials, different trends were observed in both cases.
During Trial AEI ammonia concentrations decreased in the selectors, while in AE5 they
increased, reflecting changes in selector sCOD concentrations during the same period.
Both nitrate and nitrite concentrations decreased in the reactor during Trial AEI and in all
zones during AE5, possibly reflecting decreasing nitrification and increasing
denitrification respectively. During the period of increased denitrification in Trial AE5,
selector pH also decreased, which would be consistent with increased anaerobic activity as
well. Any effects due to variations in the selector DO levels could not be checked as these
values were not regularly monitored until Trial AE5, where the Selector A DO
concentrations were found to be highly variable, ranging from 0.2 to 3 .0 g.m-3•

204
Figure 7.9:
-. ":' E i bll '-' = 0 :::::: eo: I-.... = � � = 0 �
.;: = 0 E E <
3 .5
3 -
2.5
2
1 .5
0.5
0
___ Reactor NH3
-0- Effluent NH3
-.- SeIA NH3
�- SeIB NH3
----x- SelC NH3
. . . . , I I I I •
0 VI M M
. , 0 "<:t-
AE l 0
AE3 ��o�J •
• X 0
VI 0 VI 0 "<:t- o-. "<:t- V) VI \0 ....., M
Day of Trial
•
N
AE5
-� " \ 0 l \
0 \ Y ! : 0 • • I I i i I . . . \
, 1
r; 1 A*.
'D N
Ammonia concentration trends during periods of Trials AE I , AE3 and AE5.
-. ":' E i bll '-' = 0 .-.... eo: I-.... c � � c 0 � eo: .-c 0 E E <
6
5
4
3 � 2
1
AE2
\ �
Day of Trial
AE4
___ Reactor NH3
-0- Effluent NH3
--.- SelA NH3
Figure 7. 1 0: . Ammonia concentration trends during periods of Trials AE2 and AE4.

1 2 ,---------------------------,--------,-------,
__ Reactor N03
1 0 -0- Effluent N03
-A-- SelA N03
-<>- SelB N03 0 8 -- -x- SelC N03
6 -
4
2 �
AEI
. . . . . . . . . w\x/.� . . . o V) 0 V) 0 V) 0 M M � � V) V) \0
Day of Trial
AE3
205
Figure 7. 1 1 : Nitrate concentration trends during periods of Trials AE 1 , AE3 and AE5 .
1 4 ,--------------------------,------------------�
1 2
1 0
8
6
4
2
Day of Trial
AE4
____ Reactor N03
-0- Effluent N03
--.- SelA N03
Figure 7. i2: Nitrate concentration trends during periods of Trials AE2 and AE4.

206
..-":' E
2: eLI "-'
C .:: ..... c<: I-..... c Q,I CJ C 0 CJ Q,I ..... .... I-..... Z
3
2.5
2
1 .5
0.5
0 0 M
' , , , , , , VI M
, , , , , 0 �
0
X
•
0 , , VI -.:t
A E I AE3 AE5
__ Reactor N02
-0- Effluent N02 I
-A- SeIA N02
-o- SelB N02
-x- SeIC N02
0 VI 0 -.:t 0\ \0 VI VI \0 M M 0l N
Day of Trial
Figure 7. 1 3 : Nitrite concentration trends during periods of Trials AE I , AE3 and AE5.
1 .4
AE2 AE4 • ..- 1 .2 I ":' __ Reactor N02 E i -0- Effluent N02 I e.o --.- SelA N02 "-'
=
\
0 0.8 .... .... c<: ... I .... = Q,I 0.6 CJ = 0 CJ
Q,I 0.4 .... .... I-..... ....
Z 0.2
0 -.:t \0 00 0 N -.:t \0 00 M VI f"- 0\ -� � � VI VI VI VI VI - 0l
Day of Trial
Figure 7. 1 4: Nitrite concentration trends during periods of Trials AE2 and AE4.

0. 1 8
0. 1 6
Reactor System No. 1 Reactor System No.2
- - - - - - - - - - - - - - - - - - - - - - - - - - - - - - - - - - - - - - - - - - - - - - - - - - - - - - - - - - - - - - - - - - - - - - - - - - - - - - - - - - - - - - - - -
0. 1 4 - - - .- _ ._ - - - - - - - - - - - - - - - - - - - - - - - - - - - - - - - - - - - - - - - - - - - - - - - - - .. _ - - - - - - - - - - - - - - - - - - - - - - - - - - - - - - -
� 0. 12 -rLJ rLJ 0. 1 > .... �
-0.08 1:1 � -
1:1 � Col 0.06 Z
0.04
0.02
0
AN I AN3 AEI AE3 AE5 AN2 AE2 AE4 '"
Figure 7. 1 5 Nitrogen content of VSS during selector trials N o -.....l

208
The average N content of biomass declined as the selector trials progressed, as shown in
Figure 7. 1 5, to a consistent average value of 1 2.0 to 12.2 % which is slightly below the empirical value for the N content of biomass at 1 2.4% (Metcalf & Eddy, 1 99 1 ) but still higher than average values reported for AS biomass of 9.7% (Suwa et al. , 1 992) to 9.8%
(McClintock et al. , 1 993).
7.6.1 Ammonification
As the rate of ammonification has been found to be faster than the rate of ammonia
oxidation (Wong-Chong and Loehr, 1 975), ammonification can be considered to be completed in the reactor as no ammonia was detectable in that zone. Ammonia concentrations in the RAS and feed were negligible, but as seen in Figures 7.9, 7. 1 0 and 7. 1 6, were detectable in the selectors, indicating that ammonification was occurring. As in the unaerated selector trials, the ammonia concentration in the first selector was proportional to the sCOD concentration and hence the substrate organic N concentration,
as well as the selector residence time. In the triple serial selector trials, the ammonia
concentration was highest in the second selector, the decreasing ammonia concentration being accompanied by an increasing concentration of oxidised N compounds, which indicated that nitrification was also occurring in this third selector zone.
As discussed in the previous chapter, it was not possible to measure the ammonification rate directly and in this set of trials it was indicated that both ammonification and nitrification were occurring in the same zones. However an estimate can be obtained
using the data from trials AEI and AE3 which had negligible oxidised N levels in the first
selector, if it assumed that nitrification was also negligible in this zone. By a similar analysis to that used in Section 6.6. 1 , the ariunonification rate constant ranged from 0.005
to 0.028 min-I during Trial AEI and 0.005 to 0.020 min-I during Trial AE3. These estimated values are lower than the 0.024 to 0.048 min-I range estimates obtained during Trial AN I , which may be due to a lower actual ammonification rate or to the assumption of negligible nitrification not being valid.

= o . --C': � -= � tJ = o tJ C': .-= o
3 .---------------------------------------------� � Reactor
o Selector A 2.5 -o Selector B
o Selector C
2 -
1 .5
1 -
S S 0 .5 -
< ::". "� ��.'
o ��_L��-=��--�--��--+-�-L--�--���u AE I AE2 AE3 AE4 AE5
209
Figure 7. 1 6: Average ammonia concentrations in the reactor zones during the aerated
selector trials.
8
7 -. ...., e 6 i bIl '-' = 5 c .--C':
4 � -= � tJ 3 = 0 tJ
� - 2 C': � -.-Z 1
0
AE l AE2 AE3
I!lI Reactor
o Selector A
o Selector B
rn Selector C
AE4 AE5
Figure 7. 1 7: Average nitrate concentrations in the reactor zones during the aerated
selector trials.

2 1 0
7.6.2 Nitrification
Nitrification was occuning in the reactor zone during all trials and in the selector zone in
some trials as evidenced by an increasing concentration of nitrate or nitrite after the first
selector zone. As illustrated in Figures 7. 1 1 , 7. 1 2 and 7. 1 7, the concentration of oxidised
N compounds remained undetectable in the fust two selector zones in Trials AEI and
AE3, but both nitrate and nitrite were present in the selector during trials AE2, AE4 and
AES. It is generally accepted that the DO must be at a level of greater than 1 g.m-3 for
nitrification to proceed (Metcalf & Eddy, 1 99 1 ), therefore nitrification would not be
expected to have occurred in the first two zones of the selector system as the rapid
substrate removal processes resulted in a lack of oxygen in bulk solution. However the
reduction in estimated arrunonification rates determined in the preceding section indicate
that some nitrification may have been occurring. Significant nitrite concentrations were
measured in the reactor during the unaerated selector trials but were negligible during this
set of trials, as seen in Figures 7. 1 3 and 7. 1 4.
Table 7.13 Nitrification rates estimated from reactor N02 and N03 concentrations
Trial : AEI AE2 AE3 AE4 'AES
Average (gN.gVSS-I .d-l) 0.004 0.002 0.001 0.002 0.002
Micimum (gN.gVSS-I .d-l) 0.002 0.001 0.001 0.0002 0.002
Maximum (gN.gVSS-I .d-l) 0.006 0.004 0.002 0.004 0.003
An estimate of the minimum specific nitrification rate can be made by calculating the
increase in oxidised N compound concentrations across the reactor, the values determined
during each trial being listed in Table 7. 1 3 . These values are approximately one tenth of
those estimated in the unaerated selector trials, suggesting that all available arrunonia is
easily oxidised within the reactor residence time available, although it is suspected that
these values are artificially low due to denitrification also taking place in the reactor zone.
7.6.3 Denitrification
The concentrations of nitrate and nitrate were either low or negligible in the first selector
zone during each trial, indicating that denitrification was occurring in this zone. As
effluent nitrate concentrations were lower than reactor nitrate concentrations, it was indicated that denitrification was also occurring in the settler. The average mass of N

.-.. -I '0 Z t)f) --= � t)f) e a.. -
.•
:z .... e CIl CIl co: �
1
0.9
0.8
0.7
0.6
0.5
0.4
0.3
0.2
0. 1
0
ANI AN2 AN3 AEI AE2 AE3 AE4 AE5
Figure 7. 1 8 : Nitrogen balance during the various unaerated and aerated selector reactor trials
o Denitrification - other ox id ised N compounds
m Denitrification of reactor outflow N02 & N03
o NH3, N02, N03 in Effluent o NH3, N02, N03 in WML • N content of wasted cells
N ....-

2 1 2
removed by denitrification during each trial was calculated from a mass balance as in
Section 6.6.3, the results being listed in Table 7. 14 and illustrated in Figure 7. 1 8 . The
mass of nitrate and nitrate flowing out of the reactor that is removed by denitrification in
the settler and selector zones is also calculated and compared to the estimated N removal
by denitrification calculated from the mass balance.
The amount ofN removed by denitrification in the aerobic selector system was constant at
37% to 43%. TIlls was similar to the 37% to 49% N removals observed for the anoxic
selector trials, indicating that although the entire reaction system was aerated, a similar
mass of substrate was still being removed by anoxic activity.
Table 7. 14 Estimation ofN removal during aerobic selector trials.
Trial : AEI AE2 AE3
WML volwne ( l O')m)d'l) 0.97 0.98 0.93
N content of cells In WML and 0.44 1 0.452 0.499 effluent (gN.d'l)
WML: NH) + NO) + N02 (gN.d,l) 0.007 0.007 0.002
Effluent: NH3 + N03 + N02 (gN.d'l) 0.059 0.054 0.02 1
NOUT : WML+ Effluent (gN.d'l) 0.508 0.5 1 2 0.521
NFEED - NOUT : N removed by 0.382 0.378 0.369 denitrification (gN.d,l)
% N removed by denitrification 43 42 4 1
NOx in reactor outflow denitrified in 0. 103 0.082 0.027 Sel.A and settler zones (gN.d,l)
% of denitrification due to removal 27 22 7 of NO) and N02 in reactor outflow
System N removal (%) 92 88 96 (NFEED - NEFF ) / NFEED
AE4 AE5
0.98 0.98
0.530 0.473
0.003 0.008
0.025 0.071
0.558 0.552 , "
0.332 0.338
37 38
0.047 0, 1 07
1 4 32
95 90
The mass of N removed by denitrification in the settler and first selector of oxidised N.
compounds flowing out of the reactor ranged from 0.03 to 0. 1 2 gN.d,l, considerably lower
than the 0. 1 7 to 0.39 gN.d,1 values obtained in the unaerated selector trials. TIlls indicated
that simultaneous nitrification and denitrification in the selector and reactor zones
occurred to a greater extent in the aerated selector trials. The nitrification rates estimated

2 1 3
in Table 7. 1 3 were also very low to those estimated in the previous set of trials, suggesting
that the necessary assumption of negligible denitrification in the reactor was not valid.
Indication of simultaneous nitrification and denitrification in the selector zones was also
supported by occasional DO measurements in the selectors during AE3, where DO
concentrations of 1 -2 g.m-3 were recorded, but the nitrate concentration a{ that time was
negligible. The mass of oxidised N compounds flowing out of the reactor was
considerably lower in the two trials resulting in the growth of filamentous
microorganisms, but as the overall level of N removal was similar, it was indicated that
the extent of simultaneous nitrification and denitrification was much greater during these
two trials.
7.6.4 Phosphorus removal
The average DRP concentration in the effluent decreased as the aerobic selector trials
progressed, as shown in Figures 7. 1 9 and 7.20, indicating an increase in the activity of
phosphate accumulating microorganisms in the biomass with continuing operation. As
can be seen from the data in Tables 7.8 to 7. 12 and Figure 7.2 1 , the P content of the VSS
had also increased, up to 2.0 - 2.4% compared with 1 .4 - 1 .7% in the unaerated selector
trials. This confirmed the occurrence of luxury P uptake as the biomass P content was
now significantly above the 1 .5 - 2% level reported for conventional AS biomass, and was .. -
at the maximum that would be expected considering the high substrate COD:P ratio
(Tetreault et al. , 1 986). Microscopic observations of the stained biomass also indicated
the presence of polyphosphate accumulation. No difference could be discerned between P contents for biomass in different zones of the reactor system.
It can be seen from Figure 7. 1 9 that the DRP concentrations were fairly constant
throughout the reactor zones after 25 days from the beginning of Trial AE I , but after
another two SRTs there was a distinct DRP profile through the system. In all trials, the
DRP was highest in the first selector then generally decreased through the subsequent .
selectors and reactor, consistent with anaerobic substrate uptake and concurrent P release
in the first selector, and aerobic P uptake in the subsequent selectors and reactor. It can be
seen in Figures 7. 1 9 and 7.20 that for a short period during trials AE I , AE2 and AE5 the
final selector DRP concentration was in fact lower than that in the reactor, suggesting that
P release may have also been occurring in the reactor zone under some circumstances.
Reactor and effluent DRP concentrations generally declined as the trials progressed,

214
5
4.5
.- 4 ":'
5 � 3 . 5 b.Il '-' I:: 3 0 .-
-� 2.5 I--I:: Q,I 2 (J I:: 0
1 .5 (J � �
0.5
0
-x
. ,
___ Reactor DRP
-0- Effluent DRP
-l:r- SelA DRP
-¢- SeIB DRP
�- SeIC DRP
' I , , , , . , , , . . ,
0\ f"\ r-01 f"\ f"\ "<t
AEI
, .
V') "<t
0\ "<t
6
�\ 6 M 'hi
f"\ r-V') V') \0
Day of Trial
AE3
f"\ r- 01 f"\ f"\ "<t 01
AE5
\0 01
' , ' .
0 f"\
Figure 7. 19: DRP concentration trends during periods of the trials conducted in Reactor
System 2.
4 AE2 AE4
.- 3.5 ":' 5
� 3 _ Reactor DRP b.Il
-0- Effiuent DRP '-' I:: 2.5 --6- SelA DRP 0 .-
-� 2 I--=
~ Q,I
1 .5 (J = 0 � (J
� � � 0.5
0 "<t \0 00 0 01 "<t \0 00 f"\ .,., r- 0\ "<t "<t "<t .,., .,., .,., .,., .,., 01
Day of Trial
Figure 7.20: DRP concentration trends during periods of the trials conducted in Reactor
System 1 .

-. -I 00. 00. > bIl � bIl --til til � 8 � .. =
.... �
.... = � .... = � u
�
0.030 I Reactor System No.2
• I
I I • 0.025
0.020
• I I • • • • • • • • 1 • • · 1
1 I 0.0 1 5 1 1
1 1 0.0 1 0 1 I 0 .005 I 1
AEI I AE3 I AE5
0.000 I l
Day of Trial
rigure 7.2 1 P content of the biomass in the aerated selector trials
\
Reactor System No. 1
I
I • • I
. 1 • • • • 1 1 1 1 I
AE2 I I
" .
• •
AE4
V) 00
•
tv .-Vl

2 1 6
except for Trial AE3 where the DRP showed an increasing trend. There was no obvious
trend in any of the other parameters with fluctuations in reactor DRP.
The nitrate concentration was negligible in the first selector during Trials AEI and AE3, so anaerobic conditions would have existed in bulk solution, providing the required
anaerobic conditions for PAO activity. However during Trials AE2 and AE5, signifidnt nitrate concentrations were maintained in the first selector, so anaerobic conditions were
no longer sustained in the bulk liquid. As the sCOD concentration was highest at this
point in the system, conditions existing in the floc could be expected to have been
anaerobic, so would have continued to provide the appropriate conditions for the growth
of PAOs.
A mass balance was calculated for total P across the reactor system, as swnmarised in
Table 7. 1 5 . A consistent shortfall of 26 to 3 1 % was obtained in the P balance, similar to
that determined from Trial AN2 and AN3 data. The total P removal for the system was
estimated from the difference between the influent and effluent stream TP contents .
. Table 7. 15 Phosphorus Mass Balance for the Aerated Selector System Trials
Trial: AEI AE2 AE3 AE4
TP in influent, Pin (gP.d-l) 0. 1 40 0. 140 0. 1 40 0_ 1 40
TP ill WML and effluent 0.084 0.075 0.096 0.092 biomass (gP.d-l)
DRP in WML (gP.d-l) 0.002 0.002 0.001 0.001
DRP in effluent (gP.d-l) 0.0 1 7 0.020 0.007 0.007
TPout (gP.d-l) 0. 1 03 0.097 0. 1 04 0. 1 00
TPout / TPin 0.74 0.69 0.74 0.7 1
% P removal (effluent only) 82 8 1 89 9 1
AE5
0. 140
0.095
0
0.004
0.099
0.71
96

7.7 Discussion
2 1 7
The use of aerated selectors provided a reactor configuration that could both prevent and
cure filamentous bulking. Two of the reactor configurations trialed: 3 x 0.61 and 1 x 1 .21
could cure bulking due to Type 02 1 N and prevent the growth of other filamentous
bacteria, whereas two other configurations trialed: 2 x 0.61 and 1 x 0.61, allowed the
proliferation of H hydrossis filaments.
Soluble COD concentrations in the mixed liquor flowing out of the reactor were
consistently lower in the aerated selector trials. The highest reactor sCOD concentrations
were observed at the beginning of the first aerated selector trial in each reactor vessel
apparatus, but steadily declined and remained consistently lower in subsequent trials. The
change in microbial popUlation resulting from imposing anoxic or aerobic rather than
anaerobic conditions in selector zone, must have altered the SMP formed to that having a
lower overall sCOD than when unaerated selectors were used.
The ability of the reactor configuration to prevent the growth of filamentous bacteria did
not seem to relate definitively to either substrate loading or substrate removal criteria as
most often proposed. The anoxic selector trials had indicated that ability to suppress
filamentous growth could be correlated with the fraction of rsCOD consumed in the
selector zone, however this was not observed in the aerobic selector trials. In fact the
results presented in Table 7.2 indicated that the rsCOD removal efficiency occurring in the selectors during bulking trial AE3 was greater than during non-bulking trial AE2.
As listed in Table 7.2, the proportion of removal soluble COD consumed in the selector
zone varied between 90% and 1 00%, being above 94% in all trials, except during the first 14 days of Trial AE2, when removals averaged 90- 9 1%. This was considerably higher
than the 50% to 70% removals observed in the unaerated selector trials, indicating that the
addition of aerobic substrate removal mechanisms allowed almost all exogenous substrate
to be removed in the selector zone.
The trials indicated that for successful selector operation virtually all rsCOD must be
removed in that zone. The SVI in Trial AE2 continued to increase at the beginning of the
trial when rsCOD removals only averaged 90-9 1 % but started to steadily decline after 26
days at SRT, when the removal efficiencies had increased to 96%. However the failure of
Trial AE4 at consistently high rsCOD removal efficiencies demonstrated that substrate
removal in the selector zone was not the sole criteria for success.

2 1 8
Trials AE2 and AE3 both had a selector zone with a total volume o f 1 .21 and were
expected to demonstrate a similar perfonnance, with AE3 possibly exhibiting better
perfonnance due to an increased substrate gradient through the system. Both resulted in
sCOD removal efficiencies of greater than 96%, but only AE2 could prevent filamentous
growth. The rate of SVI increase was reasonably slow, only increasing from 1 00 to 1 75
ml.g- 1 over a period of 46 days, however the trial was abandoned at that stage as the
conditions imposed during this trial were obviously not able to prevent the growth of
filaments.
Floc loadings in Trials AE2 and AE3 were not significantly different either, indicating
that substrate concentration effects were not responsible for causing bulking in AE3 in
this instance. The major difference between the two trials was that the aeration rate to the selectors may have been lower during Trial AE3, as the absence of nitrate or nitrate in
both selectors and pH drop through the selector zones in Trial AE3 indicated that
anaerobic conditions prevailed in bulk solution. Aeration rates in the selectors were not
automatically controlled and selector DO was not routinely monitored until Trial AE5. During Trial AE2 both nitrate and a very low level of nitrite were measurable, indicating
that anoxic or aerobic conditions prevailed in the selector. This suggested H hydrossis,
the dominant filament in Trial AE3, may have been a 'low DO' type filament.
Trial AE4 also resulted in bulking due to H hydrossis, with the rate of proliferation being
much more rapid than in AE3. The HRT in the selector zone was shortest in this trial, but
the rsCOD removal efficiency at 94% to 96%, was only very slightly lower than other
trials where removal efficiencies of between 96% and 1 00% were maintained. The selector HRT was therefore possibly near the minimum required for the removal of all
rsCOD under the conditions imposed. The presence of measurable nitrate and nitrite concentrations in the selector indicated that the conditions in bulk solution were either
anoxic or oxic, however it can be seen in Figure 7. 1 8 that both bulking trials had a lower
concentration of oxidised nitrate compounds entering the selector zone in the RAS than
non-bulking trials.
The use of aeration in the selector zones altered the dominant filament observed. It is
suggested that Type 02 1 N could no longer proliferate under aerated selector conditions either because there were no longer significant quantities of substrate getting through to
the reactor zone, or because bulk conditions in the selectors were no longer anaerobic,
indicating that for this substrate, Type 021 N was either a low F 1M filament or utilised low
molecular weight acids. H hydrossis only proliferated in what was indicated to be low

2 1 9
DO conditions or when there were low nitrate concentrations flowing into the selector zone, suggesting that H. hydrossis was a low DO filament.
Batch substrate removal rate tests indicated considerably higher 'psuedo first order' substrate removal rates for the biomass growing in the aerated selector trials than during
unaerated selector trials, with values for the apparent removal rate constant increasing from 1 0 - 40 d-I to 1 00 - 1 80 d-I . The aerated selectors therefore promoted the growth of bacteria with increased substrate removal rate capabilities. The biosorption capacity of the cultures did not change significantly between the two types of trials, remaining in the
0.05 - O. l g sCOD.g VSS-I range, but biosorption capacity had become positively correlated with SVI, indicating that H. hydrossis may also possess biosorptive capacity. -
A comparison of oxygen uptake data with substrate removal data suggested that the rate of substrate accumulation as opposed to substrate storage occurred more rapidly in the aerated selector trials, indicating that the increased substrate removal rate was due to more rapid substrate accumulation, but that the utilisation of accumulated substrate for storage compounds or metabolic processes had not been increased to the same extent. A lower
oxygen requirement in response to substrate addition indicated that the substrate accumulation and storage processes were more efficient in terms of electron acceptor
requirement for the culture grown under aerated selector conditions. It can be seen from Tables 7.3 and 7. 1 6 that during the two trials when filamentous bulking occurred, the biomass had a lower substrate removal efficiency with respect to oxygen utilised, suggesting that H. hydrossis had a reduced substrate accumulation and storage ability compared to non-filamentous organisms under aerobic conditions.
Although the selectors were aerated, there was evidence that a combination of aerobic,
anoxic and anaerobic substrate removal mechanisms were present. The DO levels and
oxygen uptake rates in the selectors were not routinely monitored except during Trial
AE5, where the results demonstrated that the first selector zone possessed the lowest DO concentration and highest OUR while removing the greatest mass of substrate. From
calculations of mass of oxygen consumed in the selectors per mass of substrate removed, . it was indicated that not all the substrate removal observed could have been due to aerobic processes.
An estimation of the substrate removed via each mechanism can be made assuming the substrate removed aerobically is represented by the data in Table 7.3; the anoxic substrate
removal requirement is 7 gCOD.gN"1 (Henze, 1 99 1 ; Siegrist and Gujer, 1 994; Isaacs and
Henze, 1 995); and the anaerobic substrate removal requirement is 2 gCOD.gP-l ( Isaacs

220
and Henze, 1995). The OUR data in the selector was not regularly measured until Tlial
AES, so the oxygen consumption value used for AE4 is an average of limited data points
obtained. The value for DRP released is made assuming that the DRP in the substrate was
negligible.
Table 7. 1 6 Estimation of substrate removal processes in the first selector zone.
Trial AEI AE2 AE3 AE4
sCOD removed (g.d-I) 1 3 .0 1 6.0 14.2 I S .3
O2 consumed (g.d- I ) ND ND ND 1 .8
RAS N03 + N02 consumed (g.d- I) 0.077 0.OS4 0.026 0.035
DRP released (g.d-I ) 0.OS8 0.026 0.OS4 0.024
gCOD.g02-1 from Table 7.3 1 1 .0 1 0.3 7.3 5 .0
sCOD removed aerobically ND ND ND 9.0 @ rate given above (g sCOD.d- l)
sCOD removed by denitrification 0.S4 0.38 0. 1 8 0.2S @ 7 gCOD.gNI (g sCOD.d-l)
sCOD removed via P release 0. 12 O.OS 0. 1 1 0.05 @ 2 gCOD.gP-1 (g sCOD.d-l)
Total sCOD removed: aerobic + 9.3 anoxic + anaerobic (g sCOD.d-l)
% of sCOD removal accounted for 6 1
ND = could not be determmed from the data collected.
AES
I S .0
1 .33
0.089
0.025
9.7
1 2.85
0.62
0.05
1 3 .52
90
The results in Table 7. 1 6 for Trial AE5 support the proposition that the dominant substrate
removal mechanism was aerobic substrate accumulation. The removal of RAS oxidised
N compounds in the first selector zone indicated that anoxic substrate removal was
occurring, however the mass of oxidised N compounds flowing out of the reactor per day
was lower than that in the unaerated selector trials, resulting in a lower mass of oxidised N
compounds removed by denitrification in the settler and selector zones. However as the
total mass of N removed from the reactor system by denitrification was not different from
the previous series of trials, and the N mass balance implied that only between 7% and·
36% of the denitrification could be accounted for by the removal of oxidised N
compounds from the RAS, it is indicated that both nitrification and denitrification would
have been occurring simultaneously in the selector and reactor zones.

Reactor System No.2 4.0
0 I I
3 .5 1 0 1 0
.f""' 3 .0 e � 2 .5 --
� 2.0 �
<) 1 0 0 0
0 1 • 0 0 0 0 0 0 0 1 1 • 0 0 0
1 1 0 0
1 0 1 0 < ... 0 1 .5 ... CJ � -�
1 .0 00.
• 1 I 0 0 0 I 1 • 0 0 o 0
1 1 0 •
• 0.5 AE I 1 AE3 1 AE5
0.0 I J • ....
Day of Trial
Figure 7.22 Reactor DRP and nitrate concentrations during the aerated selector trials ,
\
0
•
0 0
•
•
AE2
Reactor System No. I
I 6
• 1 - 5
--I ":' o • 1 • 0 1 0 0 1 • 0
0 0 1
1 0
0 0 0
0
- -
- -
- -
4
3
2
• • 1 . - -
•
1 AE4 •
•
I •
o
1 0 Selector A DRP • Sele�tor A nitrate I
e Z bJ) --� ... � ... .� Cl <
... 0 ... CJ � -� 00.
tv tv

3 .5 A E I
3 .0 0 0
..('" 0 0
2.5 6 • 0 � 0 -- 2.0 � Q 1 .5 '"'
• + . 0 · · • •
• 0 � -u � 1 .0 � �
o 0 . 0 •
•
0 0 •
0.5
0.0
Reactor System No.2
I
1 1 1
. 1 1 1 1 I I J
AE3
0 •
• . 0 • • • 0
Q.o o o
0
•
I
1 1 •
•
1 • •
1 0 1 •
1 1
· 1 0 0 0 0 I
0 0
Day of Trial
A E5
•
••
0 0 0 o ("')
Figure 7.23 Reactor DRP and nitrate concentrations during the aerated selector trials
Reactor System No. 1
AE2 •
I
1 0 1
1 0 � 0 0 � · I · 0 0 • 0 0 1 0
• . - 1 • •
• I 1 I
A E4
0
o . •
� . 0
o N
- -
-
- -
-
. <[) 0 -
N N N
1 4
1 2 ---":'
1 0 8 i bJ) '-'
8 � -� '"'
.":: 6 c:
'"' 0 -
4 C.I � � � 2
0

223
The bulk liquid DO in the Selector A ranged between 0.2 and 3.0 g02.m-3 and the nitrate
between 0.2 and 6.0 gN.m-3; but due to the very rapid substrate removal rates observed,
even though the bulk liquid conditions may have been aerobic, conditions inside the floc
couid have been expected to be oxygen deficient (Jenkins et al. , 1 993), providing
adequate conditions for anaerobic activity.
Anaerobic activity seems to have been confmed to the initial selector zone as DRP
concentrations declined through the subsequent selector and reactor zones, consistent with
P uptake under aerobic conditions. The extent of biological P removal increased as the
trials progressed: evidenced by a continued decrease in effluent DRP concentration, a
concurrent increase in biomass P content and the microscopic observation of staining
reactions which indicate accumulated polyphosphate in the mixed liquor.
During the unaerated selector trials the pH of bulk solution dropped in the selector zones,
which may have been due to the production of acidic compounds as a result of anaerobic
activity. However, during all five aerated selector trials, the average pH in the selectors
was only 0. 1 to 0.2 pH units lower than in the reactor, indicating that the bulk solution in
th�se zones did not contain significant quantities of fennentation products and therefore
were not predominantly anaerobic even though nitrate and oxygen deficient conditions
were maintained in the first selector during Trials AEI and AE3.
It is generally accepted that the presence of oxidised N compounds inhibits P release
(Tetreault et al. 1 986; Comeau et aI. , 1 987), and although the selector data shown iii Figure 7.22 may seem to support this, the presence of nitrate in the initial selector zone
did not seem to affect the overall extent of EBPR. Trials AE3, AE4 and AE5 all had
significant concentrations of oxidised N compounds in the first selector, however the
reactor DRP still declined from that seen in AEI and AE2. Figure 7.23 demonstrates that
no positive correlation could be seen between reactor zone nitrate and DRP as was suggested by Tetreault et al. ( 1 986); nor did the increase in selector nitrate concentration
adversely affect biomass P content as has been previously reported (Appeldoom et al. ,
1 992).
The occurrence of both anoxic and anaerobic substrate removal processes in the same
reactor have been proposed by other researchers. Tetreault et al. ( 1986) found that P
removal still occurred in the initial 'anaerobic' stage of a full scale system which contained
nitrate, and suggested that if sufficient substrate was available (influent BOD:TP > 25)
then simultaneous denitrification and P release could occur, with denitrification occurring
outside the floes and anaerobic conditions occurring inside the floc. Other researchers

224
(Szpyrkowicz and Zilio Grandi, 1 995a,b; Kerm-Jespersen and Henze, 1 993) have also
suggested that some PAOs have the ability to denitrify, so the presence of nitrate would
not have been inhibitory.
7.8 Conclusions
The use of aerated selectors could both prevent and cure bulking due to Type 02 1 N
filamentous bacteria, however if the bulk solution in the selector stage of the reaction
system was not aerobic, the growth of H hydrossis was promoted. Therefore for
successful filamentous bulking control two conditions needed to be fulfilled: virtually all
removable soluble COD must be consumed in the selector zone and bulk liquid conditions
for substrate removal must be aerobic.
Substrate removal rates increased significantly over that observed with biomass from the
unaerated selector trials, with indications that the substrate accumulation rates had
increased to a greater extent than substrate storage reaction rates. Even though the
selectors were aerated, the extremely rapid rate of exogenous substrate removal often
resulted in predominantly anoxic or anaerobic conditions in bulk solution in the initial
selector zone.
A combination of substrate removal mechanisms were operating simultaneously in the
selectors. Although the substrate was predominantly removed via aerobic mechanisms,
removal via anoxic and anaerobic mechanisms was also observed. The extent of
denitrification in the reactor systems was similar for the unaerated and aerated selector
trials, but the extent of biologica1 phosphorus removal continued to increase as the aerated
selector trials progressed. The occurrence of simultaneous nitrification and denitrification
was indicated in most, if not all the reactor zones, whereas anaerobic activity seemed to be
Confined to the initial selector zone.

CHAPTER 8
EFFECT OF INFLUENT NITROGEN CONTENT
8.1 Introdu ction
225
The studies presented in the previous chapter demonstrated that aerated selectors were
able to prevent filamentous bulking provided that all of the removable substrate was
consumed in the selector zone under aerobic bulk solution conditions. Even though the
entire reactor system was aerated, significant anoxic and anaerobic activity was
indicated, with simultaneous nitrification and denitrification being indicated in all
reactor system zones.
The role of substrate nitrogen in the performance of the activated sludge system
ut'ilising dairy processing wastewater was seen as important for a variety of reasons
including:
• the possible advantage conferred to filamentous microorganisms due to N limited
conditions. The nitrogen in the original substrate was in the fonn of milk proteins,
which only became readily available to the biomass for growth after ammonificati<rn
had occurred (Jenkins et a/. , 1 993). This may result in N deficient conditions if the
carbonaceous fraction of the substrate is readily metabolizable, and can result in the
proliferation of Type 02 1N (Richard et al. , 1 985; Jenkins et al. , 1 993), which was
observed in both the anoxic and aerobic selector trials.
• the provision of oxidised N in selectors for anoxic substrate removal. Due to the
very rapid rates of substrate removal observed, an adequate supply of oxygen and
oxidised N compounds would have been required to prevent anaerobic conditions in
bulk solution.
• the ability of various types of microorganisms to use nitrate as an electron acceptor
during substrate removal, including filaments (Wanner et al. , 1 987; Shao and Jenkins,
1 989; Casey et ai" 1 994); and P accumulating bacteria (Szpyrkowicz and Zilio-Grandi,
1 995a,b; Kerrn-Jespersen and Henze, 1 993 ; Knight et al. ( 1 995).
In order to more clearly define the role of N in the activated sludge treatment of the
defined dairy processing wastewater, it was decided to increase the N content of the

226
feed and observe the resultant change in N speCIes through the system. The
supplemented N was in the form of ammonia, which could be directly utilised by the
biomass for growth and nitrification reactions.
8.2 Trials at Increased Substrate Nitrogen Con tent
All the trials used the 3 x 0.61 aerated selector configuration as this was the most
successful reactor configuration from the previous set of trials for the prevention of
filamentous bulking and allowed the progression of various reactions through the
selector zone to be more easily defined. The additional N was added in the form of
ammonium sulphate, providing a readily available form of N for cell growth or
nitrification processes. The levels of increased substrate nitrogen were calculated to
provide an increase of 50% and 1 00% in total N content from that initially estimated in
Table 4.3 based on ingredient composition. That initial value was estimated to be 60 gN.m-3, so 1 43 and 286 g(NH4hS04.m-3 were added to the substrate in each case to
provide an extra 30 and 60 gN.m-3 respectively. As the actual N content of the substrate
w� later measured to be 89 gN.m-3, the increased N contents represented increases of
34% and 67% in the nitrogen content respectively.
One trial was conducted with the 34% increase in substrate N, while two trials were
conducted at the highest level of feed N content: one with a well settling biomass, and
the other with a biomass having a 'very common' (Jenkins et al. , 1 993) abundance of
filamentous microorganisms, as indicated by initial SVIs of 1 1 0 and 1 80 ml.g-I
respectively. The trials conducted were:
Reactor System 2: Trial AE6, feed N increased by 3 0 gN.m-3, starting with the
well settling biomass remaining from Trial AE5.
Reactor System 2: Trial AE7, feed N increased by 60 gN.m-3, starting with the
biomass remaining from Trial AE6.
Reactor System 1 : Trial AE8, feed N increased by 60 gN.m-3, started with biomass
in a bulking condition with H hydrossis as the dominant
filament.
The SRTs . were maintained at 1 0 days, based on reactor volwne only, as in previous
trials, with all trials being conducted for a period of 3 SRTs as this is commonly cited as

227
the length of time required for mixed liquor biomass to reach a new 'psuedo steady state' . Concentrations of the various N species and DRP were measured every second
day over the entire period of the trial.
8.3 Reactor Treatment Performance
The average reactor sCOD concentration during Trial AE6 remained unchanged from
the level achieved during the preceding trial with normal substrate N content (AE5);
however as can be seen in Table 8 . 1 and Figure 8. 1 , the reactor sCOD declined from an
average of 35 g.m-3 during Trial AE6 to an average of 28 g.m-3 during Trial AE7.
80
70
60 --"? 5 50 � --
� 0 40 U VJ J,. 0 -
30 CJ c: � �
20
1 0
0
I
0
AE5 - original feed AE6 - 34% increase in N
, J
AE7 - 67% increase in N
1
1
�� 6
20 40 60 80
Time (days)
1 00
Figure 8. 1 : Reactor soluble COD concentrations during Trials AE5, AE6 and AE7_

228
Table 8. I Treatment perfonnance at increased substrate N content.
Trial
N level in feed (gN.m-3)
Selector outlet conditions:
pH
TSS (g.m-3)
VSS (g.m-3)
Total COD (g.m-3)
Soluble COD (g.m-3)
Reactor outlet conditions:
pH
TSS (g.m-3)
VSS (g.m-3)
Total COD (g.m-3)
Soluble COD (g.m-3)
Soluble COD Removal (%)
SVI Range
SVI Trend
Effluent conditions:
pH
TSS (g.m-3)
VSS (g.m-3)
Total COD (g.m-3)
Total COD Removal (%)
Proportion of effluent COD due to
TSS (%)
AE6
1 1 9
7.60
5750
5070
7400
38
7.60
4600
4060
5650
35
97.9
1 1 0 - 1 63 . . mcreasmg
7.70
1 7
1 5
63
97. 1
44.4
AE7
1 49
7.25
5450
48 1 0
7260
35
6. 1 0
4820
4260
5950
28
98.3
54 - 28 1
decreasing
6.65
1 6
1 5
49
97.8
42.8
AE8
1 49
6.95
4500
3940
6050
3 1
6.25
4280
3740
5750
28
98.3 �
94 - 656
decreasing
6.65
32
29
53
97.5
47.2

229
The same lower reactor sCOD concentration was obtained during AE8, the other high
substrate N level trial, as shown in Figure 8.2. Effluent TSS concentrations were
variable, between 5 and 90 g.m -3, but on average were unchanged from the previous set
of trials.
A second difference observed at the 1 50 gN.m-3 feed level but not "at tli� 1 20 gN.m-3
feed level was a change in pH periodically through the reactor system as seen in Figure
8 .3 . The average final selector pH values were 0. 1 0 to 0.�5 units below the average
reactor pH value during Trials AEI to AE5, and equal during trial AE6, but during
periods of Trial AE7 and AE8 the reactor pH was as much as 2 pH units lower than the
selector value. The pH drop in the reactor during Trial AE7 was observed as soon as
the N content was increased, dropping to pH 5.50 within two days of the beginning of
the trial . A similar effect was observed during Trial AE8, although it took 1 2 days for
the pH to drop below a value of pH 6.0.
-. ":' S bb --
Q 0 U
I;f} I-0 -CJ � QJ �
70
60
50
40
30
20
1 0 AE8 - 67% increase in N
o o 1 0 20 30
Time (days)
40
Figure 8.2: Reactor soluble COD concentrations during Trial AE8.
50 60

230
Table 8.2 outlines the selector performance during Trials AE6 to AE8. The low SVI
allowed the recycle rate to remain low during trials AE6 and AE7, but it was much
higher during Trial AE8 as this trial began with a filamentous biomass. The decreased
SVI and increased solids settling rate obtained at the end of Trial AE7 allowed the RAS
flowrate to be reduced to a value lower than the feed flowrate for the first time in this
study. The low recycle rate resulted in floc loading rates of over 0.2 g sCOD.g VSS-I
and theoretical initial substrate concentrations of over 900 g sCOD.m-3 in the first
selector. At higher floc loading rates a higher substrate gradient was observed through
the selector system, but overall selector zone removable sCOD removals were
maintained at above 98.8%. The change in sCOD concentrations through the initial
selector zone represented average- removals of 6.0, 5 . l and 6. l g sCOD.g VSS- I .d- I in
Trials AE6, AE7 and AE8 respectively.
Table 8.2 Selector performance and operation at increased substrate N content.
Trial Days RAS Total Floc load So into Selector % rsCOD
at SRT Flowrate Selector (i! sCQQ) selector sCOD consumed
( I O'3m3d- l) HRT . g VSS (g sCODm·3) (g sCODm-3) in selectors
(min)
AE6 1 - 1 0 1 2.3 1 1 6 0. 1 95 760 90,55,40 99.4
1 1 -30 1 5.9 1 00 0. 1 52 660 7 1 ,43,37 99.7
AE7 1 - 1 6 1 5 .9 1 00 0. l47 650 9 1 ,40,32 98.8
17 -29 9.6 1 32 0. 1 99 860 142,68,40 99.2
30 -32 8.2 142 0.222 9 1 5 1 75,67,3 1 99.4
AE8 1 - 3 32.5 6 1 0.093 400 50,37,36 99.2
4 - 50 47.6 45 0.077 3 1 0 45,32,3 1 98.9
5 1 -53 54.8 40 0.064 275 56,42,32 96.4

1 0.0�----------------------------------------------�------------------------------� AE6 - 34% increase in N AE7 - 67% increase in N
9.0
AE8 - 67% increase in N
. - - - - - - - - - - - - - - - - - - - - - - - - - - - - - - - - - - - - - - - - - - - - - - - - - - - - - - - - - - - - - - - - - - - - - . . _ - - - - - -
.
== 7.0 c.
6.0 - - - - - - -- - - - -- - -- - - -
5 .0
5 9 13 17 21 25 29 5 9 1 3 1 7 2 1 25 29 5 9 1 3 1 7 2 1 25 29 33 37 4 1
Day of Trial
-A- Sel.A pH --+- Sel.B pH -e- Sel.C pH -0- Reactor pH -t:r-- Effluent pH
Figure 8.3 pH in the reactor zones during trials AE6, AE7 �nd AE8. N VJ -

232
8.4 Filamentous m icroorga n ism growth
Although the reactor configuration remained unchanged from the preceding successful
trial, altered feed conditions resulted in changes in the biomass SVI. The changes
during Trials AE5, AE6 and AE7 are shown in Figure 8.4 . Trial AE5 had demonstrated
the ability of the 3x 0.61 serial selector configuration to cure bulking due to H hydrossis
and to prevent the growth of other filamentous microorganisms. After the change to a substrate with a 33% higher N content, the SVI continued to decline slightly from the
initial value of 1 30 ml.g-I to an average of 1 1 5 ml.i l over a period of two SRTs, but the
SVI then steadily increased to 1 63 ml.g- I by the end of the third SRT of Trial AE6.
Trial AE7 was begun after 3 SRTs had elapsed for AE6, by further increasing the
substrate N content to 67% above the original level. This resulted in a continued
increase in SVI which varied between 1 74 and 209 ml.g- I for the next SRT, before
declining once more to a stable level around 60 ml.g- I . Figure 8.5 shows the floc
structure on Day 2 of Trial AE7 when the SVI was 2 1 5 ml.g- I and although the flocs
were quite dense, the occurrence of very fine protruding filaments was very common.
The rapid disappearance of filaments can be observed in Figures 8 .6 and 8 .7 taken on
Days 8 and 1 8 of Trial AE7 respectively.
The biomass as shown in Figure 8 .7 was observed when the SVI had declined to 93
ml.g-1 , but four types of filaments could still be observed in the mixed liquor as follows: • The dominant filament was identified as H hydrossis from the following
characteristi cs:
.- protruding from flocs
- very thin, approximately 0.5 Jlm in diameter, no indentations at cell septa
- stained as: gram -ve, Neisser -ve, PHB -ve • The secondary filament was identified as Type 02 1 N from the following:
- protruding from flocs and free floating - knots and loops in trichome
- discoid shaped cells
- stained as: gram -ve; Neisser -ve; PHB +ve granules • A minor filament comprised of short rectangular gram -ve cells was observed
and tentatively identified as Type 0803 : • A further minor filament with attached growth was observed in a wet mount preparation at 400x , but could not be identified as it was not observed in any of the
stained preparations.

300 AE5
250
200 ¥\ 1\
1 50 � ��
�
1 00 -
50
o -�----�------�------�------�------�------�------�------�------�----� o 1 0 20 30 40 50
Time (days)
_ Figure 8.4 Change in S ludge Volume Index during Trials AE5, AE6 and AE7.
60 70 80 90 1 00
' - ,

234
The final average SVI in Trial AE7 declined to around 60 ml.g-I , considerably lower
than the levels reached at the end of Trials AE I and AE5 of 120 and 1 30 ml.g-I
respectively. In addition to the lower SVI, the biomass at the end of Trial AE7 settled
at a considerably faster rate, with the final sludge volume being reached in the SVI test
well before the 3 0 minute settling period had concluded. The floc size had decreased
and small but very dense units were now observable as shown in Figure 8 .8 . The
filterability of the mixed liquor had also increased markedly and the dried residue from
the TSS detenninations fonned a crumbly mass rather than the coherent disc that had
been observed on the filter during all previous trials. This seemed to indicate that the
extent of extracellular polymeric substarIces in the floc had decreased.
The reactor used for Trial AE8 was seeded with biomass containing some filamentous
bacteria, as evidenced by the SVI of about 1 80 ml/g when the trial began. The reactor
was operated for a total of 12 days at SRT with the originally defined substrate before
the N content of the feed was increased, by which time the SVI of the mixed liquor had
increased to 340 ml.g- I as shown in Figure 8.9. The SVI continued to increase, peaking
at 656 ml.g - I after 1 0 days of operation at increased substrate N concentration, then
declined to 94 ml.g-I after a further 3 1 days. The dominant filament at high SVI during
Trial AE8 was again observed to be H hydrossis, the same as that occurring during the
higher SVI period in Trial AE7.
Figure 8 . 1 0 was taken on Day 24 when the SVI was 3 0 1 ml.g-I , illustrating the very fine
protruding filaments which resulted in an open and disperse floc structure. Figures 8 . 1 1
and 8 . 1 2 show that as the trial progressed the abundance of filaments and SVI
decreased, and the floc structure became more dense. Figure 8 . 1 2 was taken on Day 40
of Trial AE8 when the SVI had declined to 1 1 6 ml.g-I , but microscopic observations
still identified the dominant filament as H hydrossis. Type 02 1N was also present, but
as a minor secondary filament. A very minor gram -ve filament with long rectangular.
cells of approximately 0.8 Jlm diameter was also observed, but could not be identified
further as it was not seen in all the stained preparations. Microscopic observations of
methylene blue stained preparations from both AE7 and AE8 mixed liquor highlighted
the presence of pink coloured cell clusters, indicating the occurrence of accumulated
polyphosphate.
All photographs were taken of wet mounted mixed liquor samples at 1 00x
magnification.

Figure 8 . 5 : Filament abundance on Day 2 of Trial AE7, SVI = 2 19 ml.g· l . ( 1 00x magnification)
��� ���� ' -Figure 8 .6 : Filament abundance on Day 8 of Trial AE7, SVI = 1 79 ml .g- 1 •
( 1 00x magnification)
235

..
r '\ . � �S\o �� �
:;. �
':) . �
Figure 8.7:
' . . . . . -
'.
::"
Filament abundance on Day 1 8 of Trial AE7, SVI = 93 ml.g- I . ( 1 00x magnification)
...., -... '
. ,.
. f .. •
�" . � ,1 ��I
. ot:.
. , ,",� " .
� Figure 8 . 8 : Filament abundance on Day 30 of Trial AE7, SVI = 63 ml.g- I .
( 1 00x magnification)
237

700
600
500
,-... .... ' bl) 400 -S '-"
- 300 ;, 00
200 AE8 - 67% increase in N
1 00
0
0 1 0 20 30
Time (days)
Figure 8.9: Change in SVI during Trial AE8.
40 50
Figure 8 . 1 0: Filament abundance on Day 24 of Trial AE8 , SVI = 301 ml.g- 1 •
( I OOx magnification)
239
60

. . •
Figure 8 . 1 1 :
• 1t
o
o
o
Figure 8 . 1 2 :
.. . . . " ..• : : .
.' .� -t: . # . . '
Filament abundance on Day 37 of Trial AE8, SVI = 1 83 ml.g- 1 •
( 1 00x magnification)
.-, · t , �
.� J 1 ·11· " " '}::r ( . .;
o ..
-.. . .... . -" � ...
Filament abundance on Day 40 of Trial AE8, SVI = 1 1 6 ml.g- l . ( 1 00x magnification)
24 1
,� ... ,
o

8.5 Mea s u rement of Kinetic Constants
8.5. 1 Soluble con Removal Rates
243
Batch soluble COD removal tests were perfonned as for the preceding trials, but a change in the substrate removal mechanisms operating was indicated as the shape of substrate removal rate curves differed from that previously observed. As shown in Figure 8 . 1 3 , the initial biosorption phase was followed by a substrate removal curve that was now best fit as a series of two phases: a log removal phase followed by a linear removal phase; rather than a single log removal phase as observed in Trials AE 1
to AE5. The removal rates calculated from the batch tests conducted are summarised in
Table 8 .3 .
Table 8.3 Results from batch soluble COD removal rate tests.
Trial Days at Floc load Biosorption log removal Time at N level (gCOD.gVSS·J) (gCOD.gVSS·J) rate, k rate
(d·l) change (min) .
AE6 1 0 0. 1 1 0.07 75 1 2
20 0. 1 4 0. 1 0 89 1 8
28 0. 1 1 0.06 86 1 5
AE7 4 0. 1 2 0.06 1 93 6
1 2 0. 1 3 0. 1 0 1 07 1 4
1 8 0. 1 1 0.06 223 7
30 0. 1 3 0.09 83 2 1
AE8 2 0. 1 1 0.08 1 1 0 1 0
1 2 0. 1 6 0. 1 0 1 89 1 1
26 0. 1 0 0.05 225 5
30 0. 1 2 0.07 - 1 0
34 0. 14 0. 1 0 1 07 1 4
40 0. 1 2 0.07 136 7
linear removal rate
(gCOD.gVSS· Jd·J)
0.85
0. 1 2
0.76
0.74
0.56
0.38
0.06
0.04
0.44
0.52
0.50
0.59
0.29

Q o u � ::c = -Q 00
3 5 0 .-------------------------------·--------------------------------�--------------_.
3 00 - -
250 -
200
1 50
1 00
50
substrate 'immediately' removed from bulk solution - attributed to biosorption
'psuedo first order' substrate removal phase - due to concurrent zero order removals
. . . . . • . . . . .
of the various substrate components
zero order substrate removal phase - one substrate component being
I more slowly removed from solution than other components
.. . . . . . . . . . . . . . . . •
O+---------�-----------+----------_r----------�----------+_----------�--------� o 1 0 20 30 40 50 60 70
Time (minutes)
Figure 8 . 1 3 Batch soluble COD removal, Day 1 2 of Trial AE8 .

245
As the 'pseudo first order' removal apparent in previous trials was thought to be due to
the concurrent zero order removals of the various substrate components. The
appearance of a distinct zero order removal period at the end of the test indicated that removal of one component had either been inhibited or not increased in the same
manner as other substrate components and was now removed after, rather than at the
same time as the other components.
Soluble substrate being removed immediately from solution and attributed to
biosorption ranged between 0.05 and O. 1 l g sCOD.gVSS- I , not significantly different
from the 0.05 to 0.09 range measured with the originally defined feed. The apparent log
removal rates were also in similar ranges, but again with some higher values being
measured during the increased feed N content trials. The major difference observed
with the use of the modified substrate was therefore the loss of relative removal ability
from bulk solution for one of the substrate components.
The oxygen consumed in response to substrate added could not be accurately
determined from the above batch tests due to the very high initial OURs resulting in
low bulk liquid DO concentrations. This relationship was determined by a second set of
batch tests conducted under similar conditions, but with a considerably lower floc
loading rate so that initial OURs could still be obtained. The results are listed in Table
8 .4 and are slightly lower than the 0. 1 5 values recorded during AE5.
Table 8.4 OXY2en consumption in response to soluble substrate addition.
Trial Days at SRT g O2 consumed per g COD added
Average Range
AE7 4 0. 1 3 0. 1 22 - 0. 1 4 1
AE7 3 1 0. 14 0. 1 29 - 0. 1 44
AE8 33 0. 1 1 0 . 1 1 4
These figures agree closely with the calculated mass o f additional oxygen consumed in
the selector system listed in Table 8.5 as determined from OURs that were measured
daily in the selector and reactor zones during Trials AE6 to AE8.

Table 8,5 Dissolyed oxygen concentrations and uptake rates in the reactor system,
Trial AE6
Reactor Sel A Sel B Sel C
DO (g02,m-3) 6,6 2.3 3 ,7 4.3
sCOD removed (g,d-I) 0. 1 1 5 . 1 0,7 0,2
Based on Total Oxygen Consumption:
SpOUR (g02,gVSS,d- l ) 0. 1 7 0,56 0.35 0,29
Total 02 consumed (g.d- l ) 6.96 1 .4 1 0,92 0.86
g02 used! g sCOD removed 0,09 1 .23 3,92
Based on Oxygen Consumption above endogenous rates: *
Elevated SpOUR - 0,38 0, 1 8 0, 12
g02 used! g sCOD removed - 0,06 0,95 2,68
Total
Selector
-
1 6,0
3 . 1 9
0. 1 9
0, 1 1
Trial AE7
Reactor
6.3
0,2
0. 1 6
6,69
-
. -
Sel A
3,3
1 4 , 1
0,58
1 .63
0, 1 1
0.42
0,08
Trial AE8
Sel B Sel C Total Reactor Sel A Sel B Selector
3 ,9 5 .2 . - 6,3 1 .7 3 ,7
1 . 5 0.4 16,0 0. 1 1 5 .2 0,7
0,37 0,34 0, 1 7 0,61 0,38
1 .06 0.98 3.67 6.4 1 1 .49 0.92
0,73 2,05 0,23 0,09 1 .4
0,2 1 0. 1 8 - 0.44 0,21
0,54 1 .76 0. 1 4 - 0,07 1 . 1 8
* Assumes that the OUR in the reactor is close to endogenous rates due to negligible substrate removal from solution in this zone,
' . ,
Sel C Total
Selector
4.3 -
0,3 1 6,2
0.3 1
0.75 3 . 1 5
2.44 0, 1 8
0 . 14
1 . 1 6 0 . 12

8.5.2 Measurement of Biokinetic Constants
247
Batch tests to detennine Ks and the maximum �SpOUR were conducted several times
during the two trials at the highest substrate N level, the results obtained are listed in
Table 8 .6. A TU was added to inhibit nitrification and ensure that OUR was due to the
activity of heterotrophic biomass. It can be seen that both �SpOURmax and Ks could
again be related to SVI with the values of both parameters increasing as the SVI
decreased. A value was ca1culate4 for Jlmax using Y H = 0.68 g cell COD. g substrate
COD-I , although again the ability of this Jlmax value to reflect actual microbial growth
rates is questionable. However the values obtained were of use for comparing mixed
cultures exposed to differing substrate conditions, with the �SpOURmax response values
being considerably higher than those obtained at a similar SVI with the originally
defined substrate.
Table 8 .6 Kinetic constants detennined during increased feed N content trials.
Trial Days at SVI �SpOURmax Jlmax Ks
SRT m1 -I .g (g02.gcell COD.d-l) (d-I) (gCOD.m-3)
AE7 4 2 1 7 1 .49 - 1 .54 3 .2 - 3 .3 87-96
1 0 1 75 · 1 .79 3 .8 60
16 142 1 .83 3 .9 120
3 1 56 3 .59 7.6 270
AE8 2 435 0.67 1 .4 27
33 2 14 1 .8 1 3 .8 5 1
38 . 1 78 1 .7 1 3 .6 91
8.5.3 Decay Rate
The biomass decay rate was measured from the decrease in OUR over a 1 0. day period
as in Sections 5 .4.4 and 6.3.4. The results listed in Table 8.7 show a possible trend of
increasing decay rate with decreasing SVI, which would represent the opposite effect to
that reported by Shao and Jenkins ( 1 989) and Chiesa et al. ( 1 985). The actual values
obtained were slightly higher than those measured in previous trials.

248
Table 8.7 Biomass decay rates measured during increased substrate N content trials.
Trial Days at Feed SVI
N Level (ml.g-I )
AE6 2 1 1 1 0
AE7 20 71
AE8 1 3 638
AE8 4 1 - 94
8.6 Nitrogen a n d Phosphorus removal .
Decay rate Co-efficient, b
(d-I)
0.26
0.30
0.24
0.33
Concentrations of various N and P species in the biomass and liquid phases were
measured every second day for the duration of the higher substrate N trials. The
average concentrations observed during each trial are shown in Tables 8.8 to 8 . 1 0.
Ammonia concentrations in the selector zones were higher than those measured during
Trial AE5 with the originally defined substrate, as was expected due to the increased
ammonia loading in the substrate. A low but detectable ammonia concentration of
between 0. 1 and 0.2 gN.m-3 was measured in the reactor zone in just under half of the
data collected, suggesting that reactor residence time was close to the minimum
required for complete nitrification in this trial, assuming that ammonification of feed
stream proteins was complete.
The lower concentration of nitrate in the selectors and effluent compared to that in the
reactor indicated that denitrification was still occurring in the fonner zones, however a
nitrate concentration of above 6 gN.m-3 was consistently measured in the first selector,
considerably higher than the 2.8 gN.m-3 level recorded for Trial AE5. Nitrite
concentrations showed an immediate increase in all reactor zones, declining within 5
days to low levels in the reactor, but remaining higher in all three selector zones.
Variations in the mixed liquor TKN values again reflected variations in the MLSS
concentrations, with the N content of the biomass remaining constant in all reactor
zones.

249
DRP concentrations decreased through the selector and reactor zones, and a decline in
effluent DRP was observed as the trial progressed indicating a continued increase in the
extent of biological P removal. During Trial AE6 the SVI remained at low levels until
Day 25, when an increase in SVI from around 120 to 1 60 ml.g -I was observed. No
obvious trends in the concentration of any N or P species was observed at this time.
Table 8.8 N and P concentrations during Trial AE6 at 33% higher substrate N.
(Days I - 30) Selector A Selector B Selector C Reactor Effluent
TKN (gN.m-3) 505 - 546 566 478 2.7
NH3 (gN.m-3) 9.8 1 1 .4 1 0.7 0.07 0.04
N03 (gN.m-3) 12.4 1 1 .3 1 3 .5 27.6 22.6
N02 (gN.m-3) 2.7 2.0 1 .9 0.98 0.85
TP (gP.m-3) 97 1 05 1 1 1 94 0.70
DRP (gP.m-3) 0.94 0.50 0.34 0.36 0.37
Organic N / VSS 0. 1 14 0. 1 1 6 0 . 1 1 3 0 . 1 1 8 -± 0.027 ± 0.0 1 7 ± 0.01 3 ± 0.0 1 4
Organic P / VSS 0.022 0.023 0.022 0.023 -± 0.004 ± 0.003 ± 0.002 ± 0.003
Trial AE7 introduced a further increase in substrate ammonia concentration, which
resulted in an almost immediate shift to higher ammonia and nitrate concentrations
throughout the whole reactor system, as shown in Figures 8 . 1 4 and 8 . 1 5 . The nitrate
concentrations were similar in the three selector zones and significantly greater in the
reactor, with variations in the selector nitrate levels during the trial being mirrored in
the reactor nitrate variations. Figure 8 . 1 6 shows that nitrite concentrations remained _ _ .
unchanged on average from that measured in the previous trial, although nitrite levels in
all zones demonstrated an increasing trend as the trial progressed.

250
Table 8.9 N and P concentrations during Trial AE7: at 67% higher substrate N.
(Days 1 to 32) Selector A Selector B Selector C Reactor Effluent
TKN (gN.m-3) 61 8 6 1 8 604 506
NH3 (gN.m-3) 27.6 29.6 27.2 9.5
N03 (gN.m-3) 23.7 25.5 27.6 47.7
N02 (gN.m-3) 2.7 1 .8 1 .9 1 . 1
IP (gP.m-3) 1 14 1 1 3 1 1 1 1 02
DRP (gP.m-3) 0.75 0.53 0.26 0. 1 2
Organic N / VSS 0. 1 1 8 0. 1 1 8 0. 1 1 8 0. 1 1 6
± 0.0 1 2 ± 0.0 1 3 ± 0.0 1 7 ± 0.020
Organic P / VSS 0.023 0.023 0.023 0.024
± 0.002 ± 0.003 ± 0.003 ± 0.007
AE5: AE6: originally defined substrate 34% increase in substrate N
AE7:
66% increase in substrate N
1 3
12.8
47.5
1 .2
0.85
0.24
-
-
40 .---------�r---------------�------------------�
35 -.. '7
S 3 0 :i btl -
c 25 .S -('IS
"" 20 -c � (J c 1 5 0 (J � .-
1 0 c 0 S S 5 <
0 0 <""I
Figure 8. 14:
---- Reactor I --8- Effluent
--f:r- Selector A I �- Selector B I --*- Selector C
Day of Trial
Ammonia concentration trends during the trials in Reactor System 2.
,

,-... ":' E
z OJ) '-' c
.� ..... co: I-..... c � u c 0 (J � ..... co: I-..... ....
Z
AE5: AE6:
originally defined substrate 34% increase in substrate N AE7:
66% increase in substrate N 60 .----------.----------------�----------------_.
_ Reactor
50 -e- Effluent
-6- Selector A
-;(- Selector B
40 -x- Selector C
30
20
1 0 � � If, o , .
C> N
, , , V) N
�. 0\ N
I I I I I I I I I I J , , ,
0\
Day of Trial
C> M
Figure 8. 1 5 : Nitrate concentration trends during the trials in Reactor System 2.
AE5: AE6: originally defined substrate 34% increase in substrate N
AE7: 66% increase in substrate N
7 .-----------�--------------�------------------� 6 , _ Reactor
,-... 6 -e- Effluent ":' -fr-- Selector A I E � 5 � Selector B
'-' --)E- Selector C I c 0 4 .... ..... co: I-..... c 3 � (J C 0 u 2 � ..... .... I-..... ....
Z
Day of Trial
Figure 8. 1 6: Nitrite concentration trends during the trials in Reactor System 2.
25 1

252
The reactor ammonia concentration increased to significant levels during two periods of
AE7, reaching a maximwn of 28 gN.m-3
on Day 5 and of 25 gN.m-3 on Day 1 7.
Ammonia concentrations in the selectors also increased during the same periods, but not
to the same extent as in the reactor. Nitrate concentrations in the reactor decreased by a
similar magnitude when the ammonia levels increased, suggesting that nitrification was
being suppressed during those periods.
, Table 8.10 N and P concentrations during Trial AE8: 67% higher substrate N.
(Days 1 1 - 41 ) Selector A Selector B Selector C Reactor Effluent
TKN (gN.m-3) 560 5 1 6 490 459 14.7
NH3 (gN.m-3) 1 8 .06 1 7.49 1 8 .4 1 0.78 1 0.7
N03 (gN.m-3) 34.63 41 .64 42.7 50.55 47.9
N02 (gN.m-3) 5.43 3 .67 3 .86 2.66 2.0
TP (gP.m-3) 1 1 3 1 01 1 0 1 99 2.6
DRJ> (gP.m-3) 2.27 2.06 1 .96 1 .36 1 .7
Organic N / VSS 0. 1 26 0. 12 1 0. 1 1 8 0. 1 2 1 -± 0.027 ± 0.020 ± 0.020 ± 0.0 1 4
Organic P / VSS 0.026 0.026 0.026 0.026 0.026 ± 0.005 ± 0.005 ± 0.005 ± 0.005 ± 0.005
Trial AE8 used the same substrate as AE7, but both the biomass SVI and recycle rate in
AE8 were higher. As can be seen in Figure 8 . 1 7, two periods of high reactor ammonia
were also seen during this trial, however the difference between final selector and .
reactor ammonia concentration remained fairly constant during Trial AE8 unlike in
AE7. The reactor nitrate concentration again showed a decrease during the high reactor
ammonia events, suggesting inhibition of nitrification. Although average nitrate
concentrations in the reactor were similar, concentrations in the selector zones were
significantly higher during Trial AE8 than AE7, reflecting the higher recycle rate and
indicating that the degree of denitrification in the selector zones may have decreased. -
The concentrations of nitrite were also considerably higher throughout the reactor
system in AE8 than in AE6 or AE7, again showing a very high peak in the selectors
after the change in substrate, but settling to lower levels within one SRT_
\ '

45
40
,-... '7 35 E Z bJJ 30 '-'
c: 0 .... 25 .... c:o:= I-.... c: 20 Q) tJ c: 0 tJ 1 5 c:o:= .... c: 0 1 0 8 8 < 5
0
Figure 8 . 1 7:
70
,-... 60 '7 8 Z 50 btl '-'
= 0 40 .-.... c:o:= I--c: 30 Q) tJ c: 0
20 tJ Q) .... c:o:= I- 1 0 .... ....
Z 0
Figure 8. 1 8:
253
AE8: 66% increase in substrate N
__ Reactor -8- Effluent -6- Selector A
-�- Selector B -x- Selector C
Day of Trial
Ammonia concentration trends during the trials in Reactor System 1 .
AE8: 66% increase in substrate N
r--
Day of Trial
__ Reactor -a- Effluent ----fr- Selector A
� Selector B
-*- Selector C
Nitrate concentration trends during the trials in Reactor System 1 .

254
� ":'
E Z bll '-"
c
.� -eo:: I--C � (j c 0 (j � -.-I--Z
20
1 8
1 6
1 4
1 2
1 0
8
6
4
2
0
l1:.
-
V') 0\
AE8:
66% increase in substrate N
Day of Trial
____ Reactor
-8- Effluent
-tr- Selector A
-;(- Selector B -x- Selector C
Figure 8. 1 9: Nitrite concentration trends during the trials in Reactor System 1 .
8.6.1 Ammonification
The ammonia concentrations in the various reactor system zones are shown in Figures
8 . 1 4, 8 . 1 7 and 8 .2 1 . The concentrations measured were similar in all the three selector
zones, generally peaking in Selector B during Trials AE6 and AE7, and in Selector C
during AE8, indicating that ammonification was occurring in the selectors. Figure 8.22
illustrates that the ammonia concentration leaving Selector A was lower than that
calculated to be entering that zone via the substrate and RAS streams, indicating that
nitrification was also occurring.
As the level of organic N in the substrate was unchanged, the ammonification rate
would have been expected to depend on the substrate concentration in the selectors, as
determined by the recycle rate. From the data given in Table 8.2, the highest rate of
ammonification would have been expected in AE7 and the lowest in AE8, however due
to the presence of ammonia in the modified substrate and the occurrence of

255
1 00 Selector A Selector B Selector C Reactor Effluent
,-.... 90 -;- J '7 E Z 80 + N t)J)
70 1 ", ,( '-" N O
"0 ,.:. ...., '( . � _ tor. "<t oJ i -;- � � '" , I 0 1 _ c-::: ""O >-'" c. 60 1 ", "";;; "0 ,
T >- D N03 E '" 50 1 "0
0 (J D N02
Z I : r;' '- 0 ' . NH3 0 40 '( c , - '"
.S: - '" "0
30 ", >-... � COl I- "0 ...
c 20 <l.I
(J C 0
1 0 U
0 \0 r- oo \0 r- oo \() r- oo \() r- oo \() r- oo L!.l L!.l L!.l L!.l L!.l L!.l L!.l L!.l L!.l L!.l L!.l L!.l L!.l L!.l L!.l -< -< -< -< -< -< -< -< -< -< -< -< -< -< -<
Figure 8 .20: Average concentrations of ammonia, nitrate and nitrite during Trials AE6,
AE7 and AE8, by reactor zones.
,-... '7
5 i b.() '-" =
.� -� .. -= � (j = 0
U
90
80 t Trial AE6
70 + !
60 -I-I 50 t
u
40 -<a:i (; ... � e � � i 30
20
10
0
�uu � g. ��CI)e>: e UCI) W ,
0 0 M
Trial AE7
\0 0'1 N
N M M
r- 0 M '" '" � � '" '"
� � 0 0 0 0
Trial AE8
I -I �: I L
00 M
� '" � 0
. 1 ;: 1
�
0'1 M '" ;>. � 0
O N03
O N02 ·
D �lB :
Figure 8.2 1 : Average concentrations of ammonia, nitrate and nitrite in reactor zones
during Trials AE6, AE7 and AE8.

1:1 � .... -f -1:1 � CJ 1:1 � CJ o z ... � == z
AE6: AE7: AE8 :
34% increase in substrate N 66% increase in substrate N 66% increase in substrate N
60.---------------------�----------------------------------------------------�
50 - -
40
30
20
1 0
_ SeIA NH3 in
·--8- SelA NH3 out
. • - SelA N03 in
--tr- SetA N03 out
1 1 1 1 1 ' 1 1 I I 1 1
Day of Trial
Figure 8.22 Concentration of ammonia and nitrate flowing into and out of the first selector zone during Trials AE6, AE7 and AE8 .
...

257
simultaneous nitrification in the selectors, estimates of the ammonification rate and any
evidence of variations in that rate would have been difficult to detennine.
The data in Table 8 . 1 1 lists the change in ammonia concentration through each reactor
zone during the various recycle rates in each trial, where the change in ammonia
concentration represents the ammonia generated via ammonification minus the
ammonia utilised by nitrification. The consistent negative values for Selector A and the
reactor indicate that nitrification exceeded ammonification in these zones during all
trials. The value became less negative as each trial progressed, indicating that either the
ammonification rate increased or nitrification rate decreased in each case. As the
change in Selector A sCOD and reactor - residence time did not consistently increase,
increases in the ammonification rate or extent of ammonification could not be assumed.
8.6.2 Nitrification
In each case, an increase in substrate ammonia concentration resulted in an increased N
compound concentration for all reactor zones. It can be seen from Figures 8 . 1 6 and
8. 1 9 that nitrite concentrations, particularly in the selector zones, increased immediately
in response to an increase in substrate N content, then declined from the initial peak: values to a more stable level within 5 to 1 0 days. This indicated that the increase in
substrate ammonia content may have inhibited Nitrobacter activity for a short period,
causing an accumulation of nitrite.
Increasing the concentration of ammonia in the substrate also resulted in an immediate
increasing trend in effluent nitrate concentration, which reached a stable new level
within the same 5 to 1 0 day period. This gradual increase to a higher effluent nitrate
level indicated there must have been an increase in the number of nitrifying bacteria in
the reactor biomass, otherwise an instantaneous increase to a new higher effluent nitrate
level would have been observed. Azimi and Horan ( 1 99 1 ) suggested that the maximum
specific growth rate of nitrifiers could be estimated from a plot of the logarithm of.
effluent oxidised N species against time. As shown in Figure 8.23, such an analysis
resulted in an estimate of 0.6 to 1 .2 d- I for the nitrifier maximum speCific growth rate,
which compared well to the values of 0.89 to 1 . 1 7 d-I reported by Azimi and Horan
( 1 99 1 ) and 0.3 to 3.0 stated in Metcalf and Eddy ( 1 99 1 ), considering the limited data
available. The value at 'Day 0' was derived as the average value of the last five daily
measurements taken before the substrate was changed.

Table 8,11: Chan�e in mass ofoxidsed N and ammonia throu�h the various reactor zones during Trials AE6. AE7 and AE8,
Trial AE6 AE6 AE7 AE7
Days at SRT 1 - 1 0 1 1 - 3 0 1 - 16 1 7 - 29
Oxidised N in effluent (gN,d' l ) 0,225 0 .248 00455 00492
Change in oxidised N in Selector A (gN,d,l) 0.0 1 5 0.036 -0.065 0.023
Change in oxidised N in Selector B (gN,d'l) -0,024 -0,057 0.035 0,0 1 9
Change in oxidised N in Selector C (gN,d'l) 0.028 0.068 0.049 0.040
Change in oxidised N in Reactor (gN,d, l) 0.286 0,347 00444 004 1 8
Change in oxidised N i n settler (gN,d,l) -0,083 -0. 1 52 -0.008 -0.008
Ammonia in effluent (gN,d,l) 0.0004 0,0005 0. 1 04 0. 1 4 1
Change in ammonia in Selector A (gN.d,l) -0.078 -0.048 -0. 1 1 3 -0. 1 28
Change in ammonia in Selector B (gN.d,l) 0.048 0.032 0.079 0.0 1 6
Change in ammonia in Selector C (gN.d,l) 0.033 -0.049 -0.075 -0.04 1
Change in ammonia in Reactor (gN.d,l) -0.301 -0,234 -00400 -0.360
Change in ammonia in settler (gN.d,l) -0.00 1 -0.0003 0.0 1 5 0.057
Note: 1 , negative values indicate removal and positive values indicate accumulation. 2. change in oxidised N = (nitrification - denitrification) 3 . change in ammonia = (ammonification - nitrification)
AE7 AE8 AE8
30 - 32 1 - 4 4 - 38
0,606 0.2 1 0 0,5 1 9
0, 1 06 0.327 -0.007
-0.009 0,026 0.340
0.070 -0.009 -0.0 1 7
. 0040 1 0. 1 6 1 0,382
0.04 -0,302 -0, 1 85
0. 1 62 0.0 1 2 0.069
-0.268 -0.3 1 8 -0.086
0.036 0.0 1 7 0.0 1 4
-0.033 0 . 144 0.00 1
-00436 -00427 -00439
0.279 -0.004 -0.02 1
'"
AE8
39 - 4 1
0.527
-0.257
-0. 1 82
0.201
00457
0.3 1 3
0 .270
-0.08 1
-0.0 1 7
0.026
-0.272
0. 1 68
N Vl 00

4.5 -
4 -. "? 6 3 . 5 i ell --
- 3 = � =
53 2.5 �
= .... -. 2 M 0 Z + 1 .5 .... 0 �
= � 0.5
;' .... � -------- -- - - ---�_=_=___=_= -· -- · - --.----6-- -·---;' � -- -� ;' ;' ;' ;' ;'
"" �
...,
-------- -. � "" X
"" "" ",, ""y""
",, "
"" /. "" ,/ "" ,/ ,/ ,/
� ,/ ,/ ,/ ,/
------
V ,/ "" ,/ -;(- AES/ AE6 slope for first day: 1 . 1 d-l
-a- AE6/ AE7 slope for first day: 0.6 d- l
-tr- AE8 slope for first day: 1 .2 d- l
o+-----------�-----------+----------�------------+_----------�----------_+----------� o 2 3 4 5 6
Days at increased substrate N level " ,
Figure 8.23 Estimation of maximum growth rate of nitrifiers from effluent nitrate and nitrite concentrations after a change in substrate N level.
7

260
The ammonia concentrations into and out of Selector A as depicted in Figure 8.22 show
a decrease through this zone which indicated that nitrification was occurring, with the
overall mass of ammonia removed being listed in Table 8 . 1 1 . The concentrations of
ammonia flowing into Selector A increased during Trials AE7 and AE8 due to
increasing ammonia in the RAS, and although selector nitrate levels also increased, they
did so to a lesser extent, indicating that the high ammonia levels may have had 'an
inhibitory effect on nitrification rates.
Nitrification in the initial selector zone was expected due to the high ammoma
concentrations, with the bulk liquid DO concentration averaging 2.2, 3.3 and 1 .7 in the
first selector during Trials AE6, AE7 and AE8 respectively. These -values-were above
the minimum DO concentration generally reported as necessary for nitrification to
occur (Stenstrom and Song, 1 99 1 ; Metcalf and Eddy, 1 99 1 ). As nitrification was
occurring in the first selector zone, it would have also been occurring in Selectors B and
C where conditions were more fully aerobic, although the slight increase in ammonia
concentrations through these zones indicated that the rate of nitrate accumulation was
less than the rate of ammonia accumulation in Selector B for all trials and in Selector C
for some trials.
The data in Table 8. 1 1 indicate that the greatest mass of ammonia was consumed and
oxidised N compounds accumulated in the reactor zone, therefore nitrification was the predominant reaction in this zone. The reactor ammonia concentration was less than
<0. 1 gNH3-N.m3 consistently during Trial AE6, periodically during Trial AE7, and very
occasionally during Trial AE8; indicating complete nitrification during the trial at the
fust level of increased substrate N, but intervals of incomplete nitrification when the
substrate ammonia loading was increased further.
As the ammonia concentration- in the reactor was negligible in just over half of the results obtained, it was possible that the reactor residence time was now close to the
minimum required for complete nitrification of incoming ammonia and substrate
proteins undergoing ammonification in the reactor zone. As for previous sets of trials,
an estimate of the minimum nitrification rates can be calculated from the increase in
concentration of oxidised N species across the reactor if it is assumed that
denitrification in the reactor zone is negligible. The results obtained from such an
analysis are given in Table 8 . 1 2.

40 AE6 AE7
3 5
,;.;--6 3 0 bb --= 0 2 5 .... -� a--= 2 0 • � u = 0 • u 1 5 � • .... = 0
6 1 0 6 -< •
5 • • •
• 0
5 9 1 3 1 7 2 1 2 5 2 9 1 5 9 1 3 1 7 2 1 25 29 5 9
Day of Trial
Figure 8.24 Ammonia concentration and pH in the reactor zone during Trials AE6, AE7 and AE8. \
AE8
• •
• •
•
•
• • • •
1 3 1 7 2 1 25 29 33
• Ammonia
. . .
9
8
- - 7
S ::::: Q.
4
- 3
2
0
3 7 4 1
- pH
N 0\ -

262
Table 8. 1 2 Estimation of nitrification rates from reactor N03. and N02 concentrations.
Trial AE6 AE7 AE8
A verage estimated rate 0.005 0.0 1 0.0 1
(gN.g VSS'I .d' l )
Highest estimated rate 0.02 0.02 0.04
(gN.g VSS' I .d' l )
The specific nitrification rates estimated from reactor nitrate and nitrite levels were
higher than those in Trials AEI to AE5 due to the increased ammonia loading, but again
considerably below those reported in the literature (Argaman and Brenner, 1 986;
Metcalf and Eddy, 1 99 1 ; McClintock et aI. , 1 993), of between 0.03 and 2.3 gN.gML VSS' I d' l suggesting that either nitrification was being inhibited or that
denitrification was still occurring in the reactor.
The periods of high ammonia concentration in the reactor zone during Trials AE7 and
AE8 were accompanied by a lower mixed liquor pH as shown in Figure 8 .24. As nitrification reactions consume alkalinity, a low bulk solution pH would have hindered
further nitrification. The optimal pH for nitrification has been found to be around 7.9
(Wong-Chong and Loehr, 1 975; Antoniou et al. , 1 990) with a decrease in nitrification
resulting when the pH drops below 7.2 (Metcalf and Eddy, 1 991) ; therefore the reactor
pH values recorded of below pH 6 would have had a severe negative effect. The nitrification process involves the activity of both Nitrosomonas sp. and Nitrobacter sp. , and in this case the activity o f both microorganisms must have been inhibited as no
nitrite accumulation occurred, as can be expected during elevated ammonia
concentrations (Wong-Chong and Loehr, 1 975; Azimi and Horan, 1 99 1 ). The high
ammonia concentrations seen to therefore have been a result of, rather than the cause of
the decrease in nitrification efficiency.
8.6.3 Denitrification
The mass of nitrogen removed from the system per day by denitrification was
calculated from a mass balance across the entire system as previously, with the results
obtained being shown in Table 8. 1 3 and Figures 8.25 and 8.26. It can be seen that as
the mass of N removed by denitrification remained relatively constant during Trial

1
0.9
..:--0.8 � i � -- 0.7
= 0 .--0.6 tU CJ '= .-\.0 - 0 .5 .-=
�
Q � 0.4
,.Q
"0 � > 0.3 0 e � � 0.2 Z
0 . 1
0
--
. .
0
iii \
\ \
\ \
\ , \ ,
til , \
, \ , \ , ..
5
\ \ \
10 1 5
\ iii
20 25
Day of Trial
Figure 8.25 Comparison of nitrogen removals via denitrification during Trials AE5 to AE8.
30
13 - - - 1il
3 5
\ \
----*- AE5
. . •. - AE6
·-- -t:.- AE7
- .. [3- - AE8
\ \
\ \ ,
0 '
40
' . .
45

Table 8,13 Reactor system nitro2en balance durin2 Trials AE6. AE7 and AE8,
Trial
Days at SRT
NFEED (gN,d, l)
N content of cells in WML and effluent (gN,d,l)
WML: NH) + NO) + N02 (gN,d, l)
Effluent: NH) + NO) + N02 (gN.d,l)
Total NOUT : WML + Effluent (gN,d,l )
NFEED - NOUT : N removed by denitrification
% influent N removed by denitrification
% System N removal : (NFEED - NEFF )/NFEED
(gN.d,l)
AE6
1 - 10
1 .2
0.432
0,026
0, 1 99
0,658
0.532
45
82
AE6 AE7
1 1 - 30 1 - 1 6
1 .2 1 . 5
0.478 0.493
0.030 0.055
0.2 1 8 0.503
0.726 1 .052
0.464 0.438
39 29
80 65
AE7 AE7 AE8 AE8 AE8
1 7 - 29 30 - 32 1 - 3 4 - 38 39 - 4 1
1 .5 1 . 5 1 .5 1 .5 1 .5
0.48 1 0.463 0.456 0.422 0.453
0,061 0.06 1 0.028 0.06 1 0.073
0.571 0.707 0. 1 93 0.522 0.725
1 . 1 1 3 1 .232 0.677 1 .005 1 .250
0.377 0.258 0.8 1 3 0.484 0.240
25 1 7 5 5 3 3 1 6
6 1 52 87 62 50

1 .6
1 .4
1 .2
---I "0 Z e.o '-' - 0.8 = � -= 0.6 Q �
Z 0.4
0.2
0 0 0 100 - 100 M IoO - r---0 '-'.1 o '-'.1 o '-'.1 - < .:: < - <
0\ N r---o '-'.1 ;. <
M oo 0 '-'.1 .:: < 00 M 00 o '-'.1 ... < '<t
I mN in WML & effluent VSS (gN/d) .N in WML (NH4+N03+N02) (gN/d) ONH4+N03+N02 in effluent (gN/d) m N removed by denitrification (gN/d) I
Figure 8 .26 Nitrogen removal balance during the increased feed N content trials.
...

266
AE6, but decreased as Trials AE7 and AE8 progressed, the decrease in N removal producing an increase in the soluble N species in the effluent stream. The increased concentrations of nitrate and nitrite in the RAS were sufficient to enable anoxic or aerobic conditions to be maintained in bulk solution in Selector A at all times.
The change in the mass of oxidised N compounds across Selector A per day, as listed;"in Table 8 . 1 1 , shows decrease during some periods, indicating that denitrification was occurring in this zone. The ammonia balance over the same zone demonstrated that nitrification had been occurring, however as the decrease in ammonia was greater than the increase oxidised N compounds, it is concluded that both nitrification and denitrification were occurring concurrently in the first selector. Figure 8 .3 indicates a significantly higher pH in Selector A than in other zones during some periods of the trials and as denitrification releases alkalinity, it is suggested that these periods reflected intervals when the denitrification rate was in excess of the nitrification rate in the first selector zone.
As can be seen from Figure 8 .2 1 , the concentrations of nitrate and nitrite remained relatively constant through the subsequent selectors, and as nitrification was occurring, it was again indicated that both nitrification and denitrification must have been proceeding simultaneously in these zones as well, although Table 8 . 1 1 demonstrates that the dominant reaction varied throughout the trials.
The extent of denitrification, if any, in the reactor zone was difficult to assess due to the inhibition of nitrification at low reactor pH, although the concentration of nitrate and nitrate dropped across the reactor during some periods of Trial AE8 when reactor pH was low; suggesting that denitrification may have been occurring. In the settler zone, the average concentrations of both nitrate and nitrite decreased, indicating that
denitrification was still occurring in this zone. The results in Tables 8 . 1 1 and 8 . 1 3 indicated that the decrease i n oxidised N compound concentrations i n the settler zone contributed to a varying degree to the total system denitrification, up to a maximum of 3 8% in Trial AE8. Results during the final period of both AE7 and AE8 indicated that either no denitrification was occurring in the settler at that point in the trial, or that the extent of denitrification was less than the extent of nitrification. As the settler pH was greater than that in the reactor during the low pH periods, nitrification would have been able to resume once the mixed liquor flowed into the settler zone.

267
8.6.4 Phosphorus removal
The effluent DRP decreased during Trial AE6 and stayed below 1 gP.m-3 during AE7, but increased during AE8 after staying at or below 1 gP.m-3 for the first 20 days of the trial . DRP concentrations in Trial AE6 were unchanged from the preceding trial with originally defined feed, but declined during Trial AE7, from an average �f 0.37 gP.m-3 to 0.24 gP.m-3, as shown in Figure 8.27. During Trial AE8, the effluent DRP declined for the first 1 3 days to a mi�imum of 0. 1 8 gP.m-3, then increased to above 4 gP.m-3 by the end of the trial 20 days later.
Day of Trial
Figure 8.27: Effluent DRP concentrations during Trials AE6, AE7 and AE8.
Within the reactor system, the DRP concentration was generally highest in the first selector then declined to a minimum in the reactor, as shown in Figure 8 .28, indicating . P release in Selector A and P uptake in the subsequent selector zones and reactor zone. The DRP concentration in the effluent was increased from that measured in the reactor, suggesting release of P from biomass in the settler. It was therefore indicated that anaerobic zones were maintained in the floes, both in the initial selector zone and in the settler sludge layer.

268
5
4 . 5
,,--, 4 '7
E � 3 . 5 btl '-" c
.� 3
-� 2 . 5 I. - -C QJ CJ 2 c
0
U 1 .5 � �
0.5
0
AE6
« ... 0 0 u <J a:! ... 0 u U u ... ' "'0 0 • CI) 0 0 CI
� � �, <n u S' 0:: w:
Days
1 - 1 0
Days
I I - 30
Days
I - 1 6
AE7 AE8
i i , I JlJ I B-'J :: Jni
Days Days Days Days Days
1 7 - 29 30 - 3 2 I - 3 4 - 3 8 3 9 - 4 1
Figure 8.28: DRP concentrations in the various reactor zones during Trials AE6, AE7 and AE8.
Although utilising the same substrate and reactor system configuration, the extent of P removal was quite different between Trials AE7 and AE8, and the reasons for changes in effluent DRP levels were investigated. Tetreault et al. ( 1 986) and Appeldoom et al.
( 1 992) reported a positive correlation between effluent soluble P and effluent oxidised N concentrations, due to a reported inhibition of P AO activity with nitrate, however as can be seen from Figure 8 .30, this effect was not observed during these trials. The fluctuation in effluent DRP levels was not mirrored by any similar fluctuation in reactor nitrate or ammonia concentrations.
The main differences between the two trials were: that the biomass in AE7 had been acclimated for a longer period in a series of prior experiments, and had began with a higher proportion of floc forming microorganisms than that in AE8; and that the recycle ratio was lower in AE7, resulting in a longer residence time in each reactor zone. By the end of Trial AE8, the SVI was similar to that in AE7, but the DRP concentrations inall reactor zones had continued to increase to a level above that observed in any of the other aerated selector reactor trials. As can be seen from Figure 8 .29, the nitrate concentrations in the first selector zone were considerably higher in Trial AE8 than

,-... ";' E i bll --= 0 .--� '"" -= � CJ = 0 CJ t")
0 Z
AE6: AE7:
34% increase in substrate N 66% increase in substrate N
AE8:
66% increase in substrate N
60 ------- ---------,-----------;--- -------,- 9
; 5 0 � I
r I
40 � I 3 0 1
, 2 0
1 0
-fr- SelA N03
-e- SeIA DRP
�-H__l--T-H__i-H_+_+---'-++..J..+_+++__,_�-'-' ++' ++-! +-++1 '--'--'- ' , , ' I ' 1 +-/-' "--:--++ 1 - • • , • i .., , . r-, " t , : , I I - � � � � N M � � � M
- - N M - N N M
Day of Trial
� C")
8
6
5
4
3
2
1
0
269
Figure 8.29: Selector A nitrate and DRP concentrations during Trials AE6, AE7 and AE8.
AE6: AE7: AE8:
34% increase in substrate N 66% increase in substrate N 66% increase in substrate N
70 5 --e-- Reactor N03 ,-... -fr- Reactor NH3 1 4.5 ";'
S 60 i -e- Reactor DRP W ,-...
I 4 "" . bll S --
50 m 3 .5 � =
:V
bll 0 --.... ..- 3 = � 40 '"" 0 ..- ....
= ..-
2.5 t': � '"" CJ I ..-= 30 c 0 2 � CJ CJ t") I c
0 1 .5 0
Z 20 U '"" I � 0
t") 10
Q := I z
Day of Trial
Figure 8.30: Reactor ammonia, nitrate and DRP concentrations during Trials AE6, AE7 and AE8.

270
AE7, which would have decreased the extent of any anaerobic regions in the floes during AE8 . The higher recycle rate also resulted in a lower floc loading in the initial selector zone in AE8 which would have resulted in less substrate being available to micro-organisms in the centre of the floc. Therefore diminishing PAO activity was thought to have been attributable to a decrease in the necessary environmental requirements of a readily metabolizable substrate being available under anaerolJic conditions.
Biomass P content remained constant at 2.2% to 2.4% indicating that lUxury P uptake was continuing, even though bulk conditions in the first selector zone were no longer anaerobic. Figure 8.3 1 demonstrates that the P content of the biomass remained stable during Trials AE6 and AE7 but increased up to a maximum of 3% on Day 1 9 of Trial AE8. The biomass P content in AE8 began to decline after Day 2 1 when the effluent DRP concentration increased, further evidence of a decline in PAO activity.
The review paper by Yeoman et al. ( 1 988) summarised the aerated zone requirements for P uptake to include a pH of between 6 and 8 and a DO of between 2 and 6 g.m -3, however the periods of decreased reactor pH as shown in Figure 8 . 1 8 did not appear to interfere with system P removal . . As the DRP concentration in the final selector zone was usually only slightly above that in the reactor, it was indicated that the majority of P uptake had occurred prior to the reactor zone, so fluctuations in pH would not have been expected to have had an· effect on P uptake as long as they were confined to the reactor zone.
A phosphorus balance over the reactor system was calculated as for previous trials, by summing the P content of wasted cells and the DRP in the effluent and WML volumes, the results being listed in Table 8 . 1 4. The shortfall in the P balance during trials AE6 and AE7 was similar to that reported in Sections 6.6.4 and 7.6.4, but was considerably lower in Trial AE8 which had a higher effluent DRP concentration, resulting in a P balance of 95% during the final stage of Trial AE8. Measurements of the total P in the mixed liquor and effluent were also made throughout Trials AE6 to AE8, therefore a P balance could also be calculated from the total P data rather than from summing P in the solid and liquid phases as previously. The results agreed to within 4% for all trial periods, except for the last period in AE7 in which there were only two data points; indicating that the method of calculation used in Chapters 6 and 7 was valid.

Table 8.14 Reactor system pho&phorus mass balance during Trials AE6 to AE8.
Trial
Days at SRT
P in effluent + WML biomass (gP.d-l)
DRP in effluent and WML (gP.d-l)
TPout from Biomass P + DRP (gP.d- l)
Ratio TP out / TPin
% P removed (TPin - Effluent TP)
TPout from WML TP + Effluent TP (gP.d-l)
AE6
1 - 1 0
0.091
0.004
0.095
0.68
93
0.098
AE6
1 1 - 30
0.096
0.003
0. 1 00
0.7 1
96
0.097
AE7 AE7
1 - 1 6 1 7 - 29
0. 1 00 0. 1 06
0.002 0.003
0. 1 02 0. 1 09
0.73 0.78
96 93
0. 1 0 1 0 . 1 1 4
AE7 AE8 AE8 AE8
30 - 32 1 - 4 4 - 38 39 - 4 1
0.090 0.091 0.098 0.092
0.002 0.008 0.0 1 2 0.042
0.092 0.099 0 . 1 1 0 0. 1 34
0.66 0 .71 0.79 0.95
90 9 1 86 66
0. 1 02 0. 1 00 0. 1 08 0. 1 36
'0 .

0.05
--00 0.04 -rfl >
� 0.03
.... = � .... = o U 0.02 -
� rI) rI) c: 8 o 0.0 1 is
AE6: 3 3% increase in N
. , , , , ,
,
AE7: 67% increase in N
•
+
o - - ---+ - - 1 - - - --+ - - - + - -I - -- I --- -- + -- -r---+ ---- - - 1 ---+ --- 1 - - -f---- +- - - 1 - - 1
AE8 : 67% increase i n N
I - 1 - - I - I 5 9 1 3 1 7 2 1 25 29 5 9 1 3 1 7 2 1 25 29 5 9 1 3 1 7 2 1 25 29 33 37 4 1
Day of Trial
• Reactor PNSS 6 Sel.A PNSS X Sel.B PNSS + Sel.C PNSS
Figure 8.3 1 Phosphorus content of VSS during Trials AE6, AE7 and AE8. '- 0

273
8.7 Discussion
The reactor perfonnance in tenns of effluent quality was unchanged with respect to TSS
concentration but improved in tenns of COD removal at the highest substrate N
concentrations. The 34% increase in feed N did not result in any improvement in COD
removal perfonnance, but a decrease in effluent sCOD was seen during both trials at the
1 20 gN.m -3 feed level, falling to 80% of previous levels. This suggested that the
microbial growth processes resulting from biomass grown at the higher substrate N
contents resulted in a lower level of persistent SMP generation.
The ammonia loading on the system was increased by 33% in Trial AE6 and 67% in
Trials AE7 and AE8. All of the additional substrate ammonia, as well as ammonified
substrate proteins were completely removed by nitrification during Trial AE6, but
ammonia was detectable in the effluent during periods in both AE7 and AE8. Calculated nitrification rates in the reactor were considerably lower than other
published values, so the reactor residence time was considered sufficient, even at the
higher substrate ammonia loadings, for complete nitrification to occur.
During periods of increased reactor ammonia concentration in Trials AE7 and AE8, the
reactor nitrate concentration decreased, indicating that nitrification had been inhibited.
The ammonia concentrations in the selectors reflected the variations in the reactor zone,
as would be expected due to the influence of ammonia being recycled back to the
selectors .in the RAS. The difference between selector and reactor zone ammonia
concentrations remained relatively constant during AE8, but varied during AE7, with
the difference being greater during periods of negligible reactor ammonia
concentrations.
When the concentration of ammonia leaving the selector zone increased to above
approximately 1 0 g.m-3 there was an observed decrease in reactor pH, to a level which
would have been inhibitory to further nitrification. It is suggested that the lower initial
selector DO levels which occurred periodically through the trials, l imited the extent to
which nitrification could occur in the selector zone, thereby increasing the mass of
ammonia to be nitrified in the subsequent reactor zone. It is generally accepted that the
DO must be greater than 1 g.m-3 for nitrification to occur (Metcalf and Eddy, 1 99 1 ) and
although the average DO in the first selector zone was well above this level, Figure 8.32 illustrates that this minimwn was not maintained during some periods during each trial.
274
As nitrification consumes alkalinity, it is suggested that the drop in reactor pH was due to limitations in the available alkalinity, especial ly when the extent of alkalinityreleasing denitrification reactions in the system deceased through Trials AE7 and AE8 . This limitation, resulting in a decrease in reactor pH to well below the optimum of 7.5 to 8.6 for nitrification (Metcalf and Eddy, 1 99 1 ), would have been the main inhibitory factor to further nitrification, rather than the high accumulated ammonia concentratioiis. Zhang and Bishop ( 1 996) have also reported inhibition of nitrification in biofilms when pH decreased due to low alkalinity t? oxygen supply ratios.
The predominant substrate removal mechanisms were again biosorption followed by rapid accumulation and storage. The additional mass of oxygen consumed in response to substrate added was similar to the lowest values obtained during the aerobic selector trials with the originally defined substrate, indicating that substrate removal efficiency in terms of oxygen consumption had not declined. However the substrate removal rates and SpOURmax values observed in the batch tests indicated that both had increased slightly from previous trials. Batch substrate removal curves also indicated that removal could now be characterised by a 'psuedo first order' phase followed by a zero
order phase, rather than a single log phase.
Grau et al. ( 1 975) and Van Niekerk et al. ( l 987a) proposed that the apparently first order substrate removal for multicomponent substrates was due to the summation of zero order removals for the individual components, therefore the appearance of a diphasic response in this set of batch tests could have been due to one component of the substrate being now removed at a slower rate relative to the remaining components. It is indicated then that the biomass population had adapted under the conditions of higher N concentrations to enable more rapid substrate accumulation of selected components. The fastest removed fraction is assumed to have been lactose, followed by the soluble whey proteins, with the colloidal casein micelles expected to constitute the more slowly removed components.
The same 3x 0.61 selector reactor configuration was used in all three trials due to the previously demonstrated ability of this arrangement to prevent the growth of filamentous bacteria. However, a period of increased biomass SVI was observed during all trials in this series: towards the end of AE6 / beginning of AE7, and at the beginning of AE8. In both cases the SVI declined again, stabilising at a new lower level of 6(} ml/g in Trial AE7 and 90 mllg in Trial AE8. Increases in SVI were again caused by H hydrossis, the same filament that had been dominant in some of the aerated selector trials with originally defined feed.

800 AE6
,---------------------r---------------------__ -, ____________________________ -,_ 1 6 AE7 AE8
600
400
-:- 200 bfJ -8 --
5: 0
/l, : /l,/l, ll/l, /l,/l, : 6� t::.t::.M /l,llIl.llIl.M
00.
Se1.A DO
5 9 1 3 1 7 2 1 25 29 5 9 1 3 1 7 2 1 25 29 5 9 13 1 7 2 1 25
Day of Trial
Figure 8.32 Biomass SVI, reactor pH and Selector A DO during Trials AE6, AE7 and AE8.
29 33 3 7
" .
-- 1 5
1 4
1 3
1 2 .-M
1 1 ' s ,..:. . - 1 0 0 OJ)
ilIl.6
4 1
'-"
9 0 8
7
6
5
4
- 3
2
- 1
0
Cl s.. o

276
The increases in SVI could not be closely correlated to changes nitrate or nitrite
concentrations in any particular reactor zone. Although a decrease in nitrate
concentrations was observed when the reactor pH dropped and ammonia levels
increased, Figures 8 . 1 5 and 8 . 1 8 show that significant nitrate concentrations were
maintained in all selector zones due to high nitrate concentrations in the RAS and
concurrent nitrification of substrate ammonia. This resulted in conditions in bu'lk
solution being maintained in at least an anoxic, and usually an aerobic state. The nitrate
concentrations were also significantly above the levels produced in Trial AE5 which
had no periods of increasing SVI. Figure 8.3 1 indicates that the increases in SVI
occurred after periods of low DO in the initial selector zone, and decreases in SVI
coincided with periods of lower pH in the reactor zone.
It was therefore again indicated that a H. hydrossis could be classified as a ' low DO' filament for growth on this substrate. It has been demonstrated by researchers as early
as Adamse ( 1 968c), that the degradability of dairy processing wastewaters is very rapid,
resulting in very high initial oxygen consumption rates. Along with the oxygen demand
for the nitrification of additional substrate ammonia and in some periods, significant
RAS ammonia loadings, the overall oxygen requirement in the initial selector zone was
considerable, and aerobic conditions would have probably been restricted to bulk
solution and the outer surfaces of the flocs.
The drop in SVI and concurrent reactor pH decrease were accompanied by an increase
in ammonia and decrease in nitrate in all reactor zones, due to inhibition of nitrification
at low pH. The pH did not drop to the same extent in Selector A, however ammonia
and nitrite concentration effects were similar to the remainder of the reactor zones. It is
then indicated that H hydrossis may have been either inhibited by high ammonia
concentrations, lower nitrate concentrations, or by decreases in reactor pH. In the
previous set of trials, H hydrossis proliferated at low nitrate concentrations in the initial
selector zone where the majority of substrate was being removed, so this did not seem
to be the likely cause.
Batch substrate removal tests were performed over the same period and the data as
summarised in Table 8.3 illustrates that the higher first order removal rates were
accompanied by the earliest appearance of a change to a linear removal rate in the batch
test. The biomass used in these tests was taken directly from the reactor zone, aerated,'
then injected with a concentrated aliquot of the originally defined substrate. The fastest
k values and earliest change to a linear rate occurred when the test was performed
during periods of the trial when the reactor zone had a low pH.

277
This indicated that for biomass regenerating at the lower pH values of approximately
pH<6, substrate accumulation of the most readily removed substrate components was
able to occur at a faster rate, while the rate of removal of the more slowly accumulated
substrate fraction did not increase to the same extent. Adamse ( 1 968c) also indicated the
more efficient substrate removal in terms of oxygen consumption for dairy wastewaters
under conditions of lower pH. The floc formers may have therefore' been able to
compete more favourably with H hydrossis by more rapid substrate accumulation after
regeneration at a reduced pH.
It was indicated that H hydrossis had substrate biosorption and accumulation ability
and was also able to utilise nitrate as an electron acceptor; attested by its proliferation
under conditions of limited DO. However the floc forming bacteria were able to
compete more successfully for substrate when bulk solution conditions in the initial
selector zone were fully aerobic and were able to accumulate lactose and soluble
proteins more efficiently than the filamentous bacteria after regeneration at decreased
pH. The apparent selective inhibition of filaments may have been due to the
distribution of filaments in the mixed liquor, differences in enzymatic activity when
subjected to low pH or variations in the type of preferred substrate for each
microorganism.
Filamentous bacteria were observed protruding from the flocs, therefore the proximity
of the most filaments to the lower pH bulk solution may have been closer than for the
majority of the floc formers. The inner regions of the floc may have maintained a
higher pH environment when the bulk liquid pH dropped, due to diffusional resistance
in the floc or any localised release of alkalinity due to denitrification as it was also
indicated that denitrification was occurring simultaneously with nitrification in the
reactor zone.
Adamse ( l 968c) reported that for dairy substrates the activity of many proteolytic
enzymes is depressed at low pH. The activity of proteolytic enzymes utilised by H hydrossis may be more susceptible to changes in pH than those of the floc formers, or .
the filament may have had a higher accumulation capacity for specific proteinaceous
components of the substrate than the floc formers. Either situation would have resulted
in the observed selective inhibition of the filamentous microorganisms at the lower pH
conditions in the reactor zone, by having restricted the extent of substrate hydrolysis
and regeneration of accumulation capacity possible.

278
Towards the end of both trials at the highest substrate N level the SVI declined to very
low levels. This was due to changes in both the biomass composition and the floc
structure. The abundance of the filamentous microorganism H. hydrossis decreased and
the average size of the floc units also decreased. It was indicated that the composition
of the floc exopolymers had also changed as the mixed liquor filterability increased
markedly. Analysis of floc biopolymers (Urbain et al., 1 993 ; Jorand et al., 1 995) have
found that the major components were proteins, polysaccharides and DNA; and as
exopolymer production occurs �der endogenous respiration (Surucu and Cetin, 1 990),
which would correspond to the reactor zone in these trials, it is indicated that the high
ammonia concentrations and / or lower pH affected the type of exopolymers produced.
Surucu and Cetin (1 989 and 1 990) reported reduced settling and a higher turbidity, but a
decreased resistance to filtration when the pH was reduced to 5 .7, which was explained
as being due to the reduction of exopolymer charge and size. Jorand et al. ( 1 995)
indicated that the flocs were assemblages of smaller subunits held together by
polymeric substances, so a reduction in exopolymer production or activity would reduce
the average floc size. The conditions in these trials were obviously severe enough to
reduce exopolymer abundance or bridging ability, but were not severe enough to disrupt
flocculation to the extent observed by Surucu and Cetin ( 1 990) at similar pH values.
Even though the selectors were aerated, substrate removal via anoxic and anaerobic
means were again observed. The oxygen supplied was consumed in three main
processes: substrate removal and oxidation; biomass growth and maintenance; and
nitrification. Measurements of oxygen and substrate consumption in each of the
selector zones were made as listed in Table 8.5 and the oxygen uptake rates in each
zone are also shown in Figure 8.33, indicating a similar declining trend through the
selector zones to the reactor, with higher rates observed in the increased substrate N trials. This corresponded to a total oxygen consumption in each zone as given in
Figure 8.34.
As virtually all of the exogenous substrate was removed in the selector zones, it was
previously assumed that the specific OUR in the reactor was approximately equal to
that due to endogenous respiration, however due to the . increased ammonia in the
substrate in trials AE6 to AE8, a significant quantity of oxygen would have also been
consumed for nitrification processes. A summary of the oxygen requirement for
nitrification and the total mass of oxygen consumed in each Trial is listed in Table 8 . 1 5, but as O2 consumption did not increase to the same extent as that required to nitrify the
increased ammonia loading, it is suggested that a greater proportion of the substrate was

-.
:.0 1Z1 1Z1 > b.O N 0 b.O '--"'
Q) ..... co:: � Q) ..!:I:: co:: ..... � � = Q) b.O i'> �
0 (J t::: ·u c;.) P. 1Z1
0.7
0.6
0.5
0.4
0.3
0.2
0 . 1
0
O AE5 ! . AE6 i I § AE7 !
;: Ii AE8 i
279
Reactor Selector A Selector B Selector C
Figure 8.33 : Specific oxygen uptake rate in the various reactor zones.
1 2.-----------------------------------�
1 0 -::' -i::l N 0 8 b.O --
= 0 .... -� 6 e = fI'J = 0 (J = 4 Q) b.O �
0 2
o
AE5 AE6 AE7 AE8
Figure 8 .34: Oxygen consumption in the various reactor zones.
o Selector C
EI Selector B m Selector A
II Reactor

280
removed by means other than aerobic processes, as evidenced by the continued decrease
in effluent DRP from Trial AES through to AE7.
The actual substrate removal due to each type of process in the selector zones could not
be estimated due to the extent of simultaneous ammonification, nitrification and
denitrification, and P release and uptake, indicated as occurring in each zone.
Table 8. 1 S Estimation of oxygen consumption for nitrification and substrate removal .
AES AE6 AE7 AE8
N in feed due to milk proteins (gN.m-3) 90 90 90 90
N in feed due to NH3 added (gN.m-3) 0 30 60 60
Total N in substrate (gN.d- l) 0.9 1 .2 I .S 1 .S
N in wasted cells (gN.d-l ) 0.47 0.48 O.SO 0.44
NH3 in effluent 0 0 0. 1 4 0.08
Total N nitrified (N supplied - N in wasted cells - NH3 in effluent) (gN.d-l)
0.43 0.72 0.70 0.76
Total O2 consumed (g02.d-l) 9.34 9.79 1 0.27 9.82
Total O2 required for nitrification @ 3.43 g02.gN -I (g02.d -I)
1 .49 2.47 2.40 2.60
O2 consumed for processes other than 7.8S 7.32 7 .87 7.22 nitrification
N removed by denitrification (gN.d-l) 0.40 0.49 0.37 0.5 1
DRP in effluent (gP.d-l) 0.004 0.003 0.002 0.0 1 4
Average total ML VSS in reactor and 47.4 49. 1 5 1 .2 44.6 selector zones (g.VSS) ± 2.S ± 3.4 ± 2.5 ± 2.5
The mixed liquor suspended solids levels as indicated in Figures 8.35 and 8 .36 can be also used as an indication of predominant substrate removal mechanisms. Towards the end of AES the ML VSS declined which would have been consistent with a greater: proportion of substrate removal being due to anaerobic activity which has a lower biomass yield than aerobic means. During Trial AE6 the total ML VSS demonstrated a continual increase from 43 to 53 g VSS in the reactor system, and although the effluent

28 1
b.O '-' E c:J .... en ..... en l-0 -(.J � --Q) rF.J l- rF.J Q) ;> ..c � -
.5 :E en en � E 0
Trial AE5: I Trial AE6: J Trial AE7: 1 0 original substrate 33% increase in substrate 67% increase in substrate N
.� � -� .... 0 f-< 0 , I "
0 20 40 60 80 1 00
Time (days)
Figure 8.35 : Total mass of mixed liquor suspended solids in the reactor system during
the trials in Reactor System 2.
60
50
40
30
20
1 0
o o
Startup I (Original substr�te)
1 0 20
Trial AE8: 67% increase in substrate N
3 0 4 0
Time (days)
5 0 60
Figure 8.36: Total mass of mixed liquor suspended solids in the reactor system during the trials in Reactor System 1 .

282
DRP remained Iow a decrease was observed in the extent of denitrification, as was illustrated in Figure 8.25 . It was then indicated that the extent of anaerobic substrate activity has remained unchanged, but that there was a slight decline in anoxic removal and concurrent increase in aerobic removal. The increase in MLVSS may have also been partly due to improved cell yield owing to the availability of substrate ammonia in the initial selector zones. In all previous selector trials, substrate proteins required ammonification before a readily metabolizable form of N was available for biomass growth.
Total ML VSS levels remained stable during AE7 and unchanged from that recorded at
the end of AE6 although denitrification showed a continued declining trend from that initially observed in AE6. The effluent DRP showed a slight decrease, indicating that substrate removal via anaerobic means had not declined. The mass of oxygen consumed in the selectors as illustrated in Figure 8.34 had increased from Trial AE6, however it seems that this was not used to nitrify any of the additional ammonia as Table 8. 1 5 lists a decreased oxygen requirement for nitrification; therefore it is suggested that more substrate was removed via aerobic mechanisms in AE7 than in AE6.
The mass of ML VSS in the reactor system during Trial AE8 was stable as shown in Figure 8.36, but at a significantly lower level than for Trial AE7 which utilised the same substrate. Figure 8.25 indicated a considerably higher mass of N removed via denitrification, so the lower ML VSS level would probably have been due to a greater extent of anoxic substrate removal in AE8. The effluent DRP concentration increased markedly during the second half of the trial indicating loss of P AO activity and anaerobic substrate removal, and this was accompanied by a decline in denitrification, however no significant ML VSS was observed as would have been expected due to the considerable increase in substrate removal via aerobic means.
8.8 Conclusions
An increase in the substrate nitrogen concentration from 90 to 1 50 g.m -3 by the addition of ammonia resulted in a fully nitrified effluent with a decreased effluent soluble COD·
concentration and a well settling biomass, as long as conditions in bulk solution were maintained in a fully aerobic state for the first selector zone.

283
When the dissolved oxygen concentration was not sufficient to maintain adequate
nitrification in the selector zones, the increased nitrification load in the reactor zone was
such that alkalinity was limited and a decrease in pH was observed in that zone. This
acted to inhibit further nitrification and resulted in significant ammonia concentrations
in the effluent.
Filamentous bulking due to the proliferation of H hydrossis was observed after periods
of low dissolved oxygen in the initial selector zone, reinforcing the suggestion that this
filament be classified as a 'Low DO' type filament and that fully aerobic conditions
need to be maintained in bulk solution to prevent filamentous growth with dairy
processing wastewaters. H hydrossis was inhibited by low reactor zone pH and this
was considered to be due to the diminished ability of this filament to regenerate
substrate accumulation capacity under such conditions, compared to the floc fonners
present in the mixed culture.
Although aerobic conditions were maintained in bulk solution during most of the trials,
significant anoxic and anaerobic substrate removals were again observed, resulting in
considerable nutrient removals. Decreases of up to 87% and 96% from influent levels
were observed in the effluent stream for nitrogen and phosphorus respectively.
S imultaneous nitrification and denitrification was observed in all of the selector zones
and indicated during in the reactor and settler zones during some periods; however the
extent of denitrification decreased as the highest level substrate N content trials
progressed. Effluent DRP concentrations continued to decline, with concentrations of
wel l below 1 g.m-3 consistently obtained for two of the three trials. B iological P
removal decreased during one of the trials at the highest substrate N level, when higher
recycle rates provided increased oxidised N compound concentrations and lower floc
loadings in the initial reactor zone, restricting the opportunity for PAO activity.

284

CHAPTER 9
SUMMARY OF RESULTS AND DISCUSSION
9.1 Introd uction
285
The project was undertaken to study the treatability of dairy processing wastewaters in
an activated sludge system. With the trendin· the NZ. dairy industry being towards fewer, but larger processing facilities, the use of reliable and operable higher rate and more compact treatment facilities will be required for future developments.
Dairy processing effluents are readily biodegradable and have been successfully treated in activated sludge systems (Jones, 1 974; Middlebrooks, 1 979; HWlg; 1 984; Marshall and Harper, 1 984; Fang, 1 990; Fang 1 99 1 ). However there have been numerous reports of operability problems due to filamentous bulking when using such substrates (Adamse, 1 968a; Adamse, 1 968b; Rensink, 1 974; Van den Eynde et ai. , 1 982; Strom and Jenkins, 1 984; Chudoba, 1 985; Goronszy et al. , 1 985; Hoffman, 1 987; Rensink and Donker, 1 990) which ·has tended to deter some processors from using activated sludge systems. The growth of filamentous bacteria can be discouraged by either using nonspecific methods, or more desirably by selectively inhibiting the growth of the problematic species.
The trials conducted during this study concentrated on developing a reactor configuration that would prevent the proliferation of filaments, and on defining the operating parameters necessary to prevent bulking from occurring. Many conflicting theories have been proposed as to what the cultural requirements are to ensure nonbulking conditions, but as there are many different types of filamentous bacteria with different growth requirements, no single theory can be used for all substrate types.
A selector reactor configuration was employed to overcome bulking problems, but in addition to certain configurations preventing filamentous growth, significant nutrient removal was observed. As dairy processing wastewaters can contain significant quantities of N and P, and processing facilities in NZ commonly discharge into a river environment, the biological removal of nutrients would be a desirable feature of any new treatment system contemplated. As this additional feature was found in the

286
successful reactor configurations, the conditions under which N and P removal occurred were also studied.
9.2 Oven'iew of trials conducted .
A summary of the trials conducted in this study are listed in Table 9. 1 . The 1 day HRT and 1 0 day SRT values in the 'AN' and 'AE' series trials were based on the main 1 0 1 reactor volume only. The CSTR trials at varying SRT and initial 'AN' trials were all seeded using biomass from the 2.Sd SRT reactm:,.and the biomass was wasted at the end of the trial. The remaining trials were conducted in one of two identical reactor systems utilising the biomass in the reactor remaining from the previous trial as follows:
Reactor 1 : AN2, AE2, AE4, AE8 (AE8 was seeded from AES biomass)
Reactor 2: AN I , AN3, AEI , AE3, AE5, AE6, AE7

287
Table 2. 1 Summary of reactor configurations and conditions for the trials conducted.
Trial HRT SRT Substrate Reactor conditions and configuration
(d) (d)
2.5d SRT 2.5 2.5 . . 1 " 1 Aerated 6.25 I reactor ongll1a .•
5 d SRT I 5 original Aerated 1 0 I reactor
1 0d SRT I 1 0. original Aerated 1 0 I reactor
20d SRT I 20 original Aerated 1 0 I reactor
3 0d SRT I 3 0 original Aerated 1 0 I reactor
20d SRT I 20 1 :5 dilution of original Aerated 1 0 I reactor
AN I I 1 0 original Unaerated 1 .2 1 selector followed by
aerated 1 0 I reactor.
AN2 I 1 0 original Unaerated 2.41 selector followed by
aerated 1 0 I reactor.
AN3 1 1 0 original Unaerated 3 x 0 .61 selectors In senes
fol lowed by aerated 1 0 I reactor.
AEI I 1 0 original Aerated 3 x 0.61 selectors III senes
fol lowed by aerated 1 0 I reactor.
AE2 1 1 0 original Aerated 1 .2 I selector followed by
aerated 1 0 I reactor. ." ,
AE3 1 1 0 original Aerated 2 x 0.61 selectors III senes
followed by aerated 1 0 I reactor.
AE4 I 1 0 original Aerated 0.6 I selector followed by
aerated 10 I reactor.
AE5 I 1 0 original Same as for AE 1 .
AE6 1 1 0 Increase N content In Same as for AEI and AE5.
original by 34% as NH3
AE7 I 1 0 I ncrease N content in Same as for AE 1 and AE5.
original by 66% as NH3
AE8 1 1 0 Increase N content In Same as for AE I and AE5.
original by 66% as NHJ
Note: * 1 original substrate as defined in Table 4.3
I
. .

288
9.3 Effect of reactor configuration on effluent qual ity
The filterable or 'soluble' COD concentration in the stream flowing out of the reactor
zone declined as the trials progressed. The levels measured in each reactor system
during the subsequent trials are shown in Figure 9. 1 . As initial substrate
biodegradability studies indicated that the soluble substrate would have been easily
degraded in the 1 day HRT maintained all trials, the difference in effluent sCaD are
suggested to have been due to a decrease in the production of soluble microbial
products. Orhon et al. ( 1 993) detennined that for configurations with an SRT greater
than 2 days operating on similar dairy processing substrates, the effiueRt-£COD-.l.va5 due ·
almost solely to SMP generation. The consistent decrease in sCaD indicated that the
reduction may not have been due to reactor configuration effects, but rather to the
continuing selection of microorganisms which were able to more efficiently use the
substrate available.
Average effluent sCaD concentrations of less thaI} 30 g.m-3 were obtained in the final
trials, representing sCaD removals of greater than 98%. This is similar to other
minimum effluent COD levels observed when treating dairy processing wastewaters of
30 g.m-3 (Hung 1 984) to 3 9 g.m-3 (Orhon et al., 1 993); and consistent with a report
made by Jones ( 1 974) that effluent BOD concentrations of consistently below 30 g.m-3
were difficult to obtain with this type of wastewater. The effluent sCaD achieved
represents a lower level of SMP generation than that observed by Orhon et al. ( 1 993); who determined a SMP concentration co-efficient (Yp) of 0.03 1 for whey-washwater
and 0.068 for general dairy effluent, as compared to the Yp values of as low as 0.0 1 8 resulting from these trials.
The effluent TSS values during the various trials are shown in Figure 9.2, with higher
values resulting from solids carryover from the settler zone, predominantly during
periods of filamentous bulking, or of rising sludge due to denitrification in the settler.
Effluent TSS levels of less than 1 0 g.m-3 were consistently obtained when non-bulking
conditions were experienced, confirming that the appropriate activated sludge
configurations could result in a high quality effluent in terms of both suspended and
dissolved organic matter.

..- 'Tj Soluble COD concentration out of Soluble COD concentration out of _ . (Jq the reactor zone (g.m,3) ,3) � the reactor zone (g.m �
� - IV IV . . VI 0 VI 0 VI IV N 0 0 0 0 0 0 VI 0 VI 0 VI g tTl 1 2/07/93 0 0 0 0 0 0 EB 1 2/07/93 g. 0 0 �
�� B 0 g W IV 0 0 Q. ° dib 0 0 ... O CtJ Q. (") en Vl ... Ul '" '" 0 0 1 0/09193 _ _ -l -l '"'1 2'" 1 0/09/93
'b �1(80 .� cr
��O Ul -
8 0 v. ;; �
� Q.
ra Jl 0 0 cliP Q. (j 0 en Vl '" '" 0 -l -l 0 09/1 1 /93 _ - 0 0911 1 /93 8 � �S 0 IV � ::3 8 0 0 � � Vl .,., � 08/0 1 /94 _ _
OR/O I /94 0 � � � r::t. 0 ::3 Ul 0
09/03/94 � 09/03/94 . _ 0 � cr
S IV 5' � 0.. 0 � 0.. 5. 08/05/94 08/05/94 )-Jg tn )- IV
tn go VI � 0 <: 07/07/94 _ � 07/07/94 _
100
0 � §. 0- .... 0 )-fi )- tn tn 00 S. ....
05/09/94 e. 05/09/94 _
Ul tv 00 5' '-D

290
Low FfM 20dSRT I OdSRT 20dSRT
AN2 AE2 AE4 AE8
250 0 0 0
200 0 0 0 -. 0 0 '7 0 E olJ 1 50 - aJ 0 '-' 0 0
00 00 0 CO E-c
va .... 1 00 0 c: 0 � 0 0 0 = 0 0
S 0 c.P � 0 10 0 0 � 0 0 0 0
50 0 0 0 0
i\O 0
lO B
� o . M M M V V V V V 0. 0. 0. 0. 0. 0. 0. 0. -- --- -- -- -- -- -- --r--- 0. M V) r--- 0. 0 0 0 0 0 0 0 -- -- -- -- -- -- -- --N 0 0. 00 0. 00 r--- V)
0 0 0 0 0 0
30d SRT 5d SRT AN I AN3 AEI AE3 AE5 AE6 AE7
250 0 0 0 0 0
200 0 -. '7 0 0 E 0 cb 1 50 0
'-' 0 dJ 0 0 00 0 00 0 0 0 0 0 0 E-c .... 1 00 0 0 c: 0 Cb 0 -� 0[11 0 = o 0 I§l 0 S � 0
r.:l 0 0 � 0 50
- g §� i �
0 M M M V V V V V 0. 0. 0. 0. 0. 0. 0. 0. -- -- -- --- -- -- --- ---r--- 0. M V) r--- 0. 0 0 - � 0 0 0 0 -- --- --- --- --- --- ---N 0 0. 00 0. 00 r--- V)
0 0 0 0 0 0
Figure 9.2: Effluent suspended solids concentrations obtained during the various trials in . each reactor system.

2 9 1
9.4 Su bstrate removal mechanisms
A variety of substrate removal mechanisms were indicated in the varIOUS reactor configurations trial ed, with the use of selector configurations increasing the rate at which the biomass removed substrate frol11 bulk solution. The rapid ·removal rates occurring in the zones with high floc loadings resulted in a range of environmental conditions for substrate removal with aerobic, anoxic and anaerobic removals all being observed, even when the entire reactor configuration was aerated.
9.4.1 Comparison of Substrate Removal Mechanisms.
The GFC fi lterable or 'soluble' fraction of the substrate consisted of lactose and milk proteins, and batch sCOD removal tests were employed throughout the study to determine the means and rates of soluble substrate removal . A portion of the substrate was always removed immediately on contact with the biomass, regardless of the reactor configuration from which the cells were taken. This initial period of biosorption during the first few minutes of contact with substrate, as recorded by other researchers (Chiesa et af. , 1 985; Eckenfelder, 1 987; Hoffman, 1 987; Eckenfelder and Grau, 1 992; Pujol and Canler, 1 992), was followed by a longer period of removal in a zero or first order manner until a stable lower sCOD was reached.
Similar substrate removal processes of biosorption followed by first order removal were observed under both aerobic and anoxic conditions, as evidenced during unaerated batch tests conducted with biomass from the unaerated selector trials. This supports the findings of Andreadakis and Chaljikonstantinou ( 1 994), who concluded that substrate removal via accumulation and storage mechanisms occurred with nitrate as the electron acceptor, as it did with oxygen. Soluble substrate removal continued until the oxidised
. N in bulk solution was exhausted, then a slight increase was observed, which seemed to indicate a release of stored substrate. There was a lack of continued substrate removal by anaerobic means during these tests, most probably as a significant popUlation of anaerobic microorganisms had not yet developed in the earlier stages of the 'AN' series trials.

292
9.4. 1 . 1 Substrate Biosorption
The mass of substrate removed via biosorption per unit mass of ML VSS generally
increased with increased floc loading in the batch test, as shown in Figure 9 .3 . This is
in agreement with the results reported by other researchers (Pujol and Canler, 1 992;
Novak, 1 995) and the principles of adsorption (Metcalf and Eddy, 1 99 1 ). From the sets
of data represented it is indicated that the substrate adsorbed at a given floc load was
lower in the 'AN' series trials than in the 'AE' trials, suggesting that the latter trials
selected for microorganisms with a higher biosorption capacity.
0. 1 4
-. 0. 1 2 en 00
;;> 0 . 1 en
� 0 0.08 U en '-'
c: 0.06 .� -Q..
0.04 -0 ell 0 .-� 0.02
0
Figure 9.3 :
•
•
. CSTR
• Aerobic sci
0
• Anoxic sel
X I .S N feed
X 2N feed
0. 1 0.2 0.3 0.4 0.5 0 .6
Floc Loading in Batch Test (gCOD . g VSS-1)
Effect of floc loading in the batch test on substrate biosorption
0 . 7
The effect of SVI on biosorption can be made by comparing batch tests conducted at the
same initial floc loading, during the same trial. The results for the unaerated selector
trials are presented in Figure 9.4 and indicate that biosorption was negatively related to
SVI. It is therefore suggested that the dominant filament during that set of trials, Type
02 1N, had a lower biosorption capacity than the floc formers, an effect similar to that
observed by Chiesa et al. (1 985). However as can be seen from Figure 9.5, the opposite
effect was observed during the aerobic selector trials. This indicated that H hydrossis
possessed significant biosorption ability, as the filamentous populations exhibited a

0. 1
-. 0.09 -00 0 .08 00 ;;> b() 0.07
� 0 .06 -0 U 0 .05 en b() '-'
0.04 = 0 .- 0 .03 .... � � 0 0 .02 en 0 .-P!l 0.0 1
0
0 5 0
0 1 �9. l 8 6 . � 0. 1 9 0 0. 1 8
0 . 1 8 0 0 0. 1 4
;( 0. 1 76 0. 1 6
+ 0. 1 3 .- 0 . 1 5 0 0.25
293
Data label refers to initial floc loading in the batch test
1 00 1 50 200 250 3 0 0 3 5 0 400
Sludge Volume Index (mI.g-1)
Figure 9.4: Effect of SVI on biosorption during batch substrate removal tests utilising biomass from unaerated selector trials. Dominant filament Type 02 1 N.
0. 1 • AE8, 0. 1 3
.r- 0.09 00 00 0.08 ;;>
• AE8, 0. 1 3 ;( AE I , 0. 1 3 l:J. AE8, 0. 1
b() 0.07 Q 0.06 0
6 AE8, 0. 1 2 6 AE8, 0. 1 2
U 0.05 en ;( A E I , 0. 1 3 bi) '-' 0 .04 = 0 0.03 .--e- 0.02 0 en 0
0.0 1 .... P!l Data label refers to trial and initial floc loading in the batch test 0
0 1 00 200 3 00 400 5 00
Sludge Volume Index (ml.g-l)
Figure 9.5: Effect of SVI on biosorption during batch substrate removal tests utilising biomass from aerated selector trials. Dominant filament H hydrossis.

294
higher biosorption at a constant floc load than non-filamentous ones, a trend t�at was in agreement with observations made by Pujol and Canler ( 1 992). Therefore there was no singular effect of SVI on biosorption, as it was dependent on the type of filament present.
9.4 .1 .2 Substrate Removal Rates
Batch soluble COD removal tests demonstrated that after a portion of the substrate was immediately removed on contact with the biomass, remaining substrate was removed gradually over a 30 to 90 minute period. In the initial biodegradation studies and in trials using a conventional CSTR configuration, the sCOD removal observations were best fit by a linear, or zero order relationship. While most of the data could have also
been adequately described by a first order relationship, regression analyses indicated that a linear relationship better described the results obtained. After selector reactor configurations were introduced, the data were clearly best fit as a log removal relationship.
It has been proposed (Grau et al., 1 975; van Niekerk et al. , 1 987) that first order substrate removal rates observed when using multicomponent substrates were due to the cumulative effect of zero order removals for each of the individual components. This concept was supported by the observations that during a set of batch removal tests initially perfonned using lactose alone, substrate removal was best fit as zero order. The changes observed in substrate removals during batch tests for all subsequent trials, as indicated in Table 9.2, would therefore have been due to changes in the relative removals of the different substrate components. All batch tests, including those using biomass from the later trials with modified substrate, were perfonned using the substrate
as originally defmed in Table 4.3 .
The 'psuedo first order' removal rates increased as the trials progressed, indicating that the use of a selector configuration favoured the growth of microbial species with a faster substrate accumulation capacity. This agreed with a previous report by Van den Eynde et al. ( 1 982) who compared dairy wastewater COD uptake rates for continuously and intennittently fed systems.

295
Table 9.2 Substrate removal observed in batch soluble CQD removal tests.
Series of Removal Biosorption Psuedo First order Specific Zero order
Trials: Rate best (g sCOD. g YSS-I ) Removal Rate Removal Rate fit as: constant, k (d- I ) (g sCOD. g YSS-I .d- I )
2.5 d SRT linear o * lactose - 1 .08 - 1 .49 * lactose
2.5 d SRT linear 0.0 1 6 - 0.77 - 1 . 1 3
5 - 3 0 d SRT linear 0.076 - 0.08 1 - 0.43 - 0.46
AN I - AN3 log 0.060 - 0. 1 00 1 2 - 38 -
AE l - AE5 log 0.052 - 0.093 40 - 1 80 -
AE6 - AE8 log, then 0.057 - 0. 1 0 1 75 - 225 0.04 - 0.84 linear
* lactose = tests perfonned using lactose only as the substrate.
The individual substrate components were removed at a greater rate during the aerated selector trials than during the previous unaerated selector trials with the same substrate, but were removed in a similar manner, with a smooth logarithmic decay continuing to be observed until a stable lower plateau was reached. This indicated that the individual substrate components were all removed at either a faster or slower rate to a similar extent, so as to maintain the same first order sCQD removal curve.
In the final set of trials with biomass exposed to an elevated substrate N content, a similar or slightly faster logarithmic removal was initially observed, but this was then
followed by a distinct period of linear substrate removal. This suggested that under the
conditions imposed by increasing the feed N level, most of the components were
- ,- -- removed in the same manner but at an increased rate, except for one major component:-- � The majority of this component was now taken up after the other components had been removed from bulk solution. As the sCQD components were known to be lactose and milk proteins, it is indicated that the lactose and soluble whey proteins were able to be. more rapidly removed, but the more slowly removed component, suggested to be the casein micelles, were not removed at a similar increased rate.
This diphasic substrate removal response was more pronounced when the reactor zone
experienced lower pH « 6) conditions and it is proposed that some proteolytic enzymes could have been inhibited by the decreased pH, preventing regeneration of the

296
organisms .accumulation capacity for casein, and therefore resulting in lower removal of
that protein fraction when the biomass was next exposed to exogenous substrate.
Batch removal tests with soluble substrate were also conducted to detennine average
biomass kinetic parameters for the mixed culture. An estimate of the maximum specific
growth rate was obtained from tests conducted at low initial Sc/Xo ratios (Cech et ai, 1 984). A comparison was made between low and high Sc/Xo ratio methods for the
estimation of biokinetic constants during the initial biodegradation testing phase o f the
study, and it was decided that even though low Sc/Xo tests did not actually measure
' growth' as cell replication (Chudoba et al. 1 992; Grady et al., 1 996), it was the
preferred method as it measured the response of the mixed culture as it existed at the
time of the test.
Table 9.3 Respirometric estimation of biomass kinetic parameters.
Trial Sc/Xo SVI llSpOURMAX
(g sCOD.gVSS· I ) (mJ.g-1 ) (g02.gYSS.min-l )
2.5d SRT 0.003-0. 1 5 - 0.2 - 1 . 1
5 d SRT ( 1 6) 0.007 - 0.0 1 2 246 0.32
1 0 d SRT (30) 0.005 - 0.0 1 2 357 0.28
30 d SRT (22) 0.0003 - 0.0007 1 79 0.4 1
ANI 0.003 - 0.0 1 6 1 1 3 - 272 0.3 1 - 0.35
AN2 0.004 - 0.007 1 24 - 1 63 0.23 - 0.30
AN3 0.003 - 0.007 298 0.26
AEI 0.001 - 0.0 1 4 1 1 3 - 267 0.22 - 0.28
AE2 0.0 1 - 0.02 1 5 1 0.86
AE3 0.02 1 59 0.78
AE5 0.0 1 - 0.02 1 28 0.88
AE7 0.03 - 0.06 56 - 2 1 7 1 .5 - 3.6
AE8 0.006 - 0.06 1 78 - 435 0.67 - 1 .8
Ks
(g sCOD.m-3)
3 .4 - 44
2.2
4
3 .5
4.3 - 1 6
2.8 - 7.7
8.6
2.6 - 28
23
27
4 1
87 - 272
27 - 9 1
.: -.- --

4
3 .5 •
� � 3 -, Q 0 U 2.5 --
� u bJl N 2 0 bJl • •
• • --
>( 1 .5 • « ::; � � 0 Q. X x 00
0.5 A cP
• 6 . 6 6
6 0 o -
0 5 0 1 00 1 50 200 250
Figure 9 �6 Change in maximum-SpOUR with SVI during the various series of trials .
- -. AE7 and AE8
6 AN I to AN3
0 AE I
• CSTR Series
x AE2 to AE5 - - - - - - - -
•
6 •
300 3 5 0 400 450

2.5 -r-------------------------------------------------------------------------�
-- 2 � -Q o u
1 .5
1
0 . 5
):
•
• •
•
•
•
• AE7 and AE8
6 AN I to AN3
o A E l
• CSTR Series
): AE2 to AE5
O+---------r-------�--------_+--------�--------�--------+_--------�--� o 20 40 60 80 1 00
Figure 9.7 Relationship between maximum SpOUR and Ks during the various series of trials.
1 20 1 40
" .
N \0 00

299
The maximum value of specific OUR was used to determine �max which relates to the specific growth rate during periods of 'balanced growth' . However as the selector trials
progressed it became evident that the immediate maximum oxygen uptake response of
the biomass (�SpOURmax) to added substrate was more a measure of a substrate storage response rather than a 'growth' response (�ma:>J The maximum rate, calculated as either t.SpOURmax or �max was still measured in subsequent tests, but was used more as a comparison of the biomass response to substrate addition than a measure of cell growth or replication. The values obtained for �spouRmax and Ks during the various reactor configurations trialed are summarised in Table 9.3.
Figures 9.6 and 9.7 illustrate that in general t.SpOURmax , which is directly proportional to �max , and Ks were positively correlated and that the maximum �SpOUR decreased as the SVI increased, in agreement the 'kinetic selection theory' as first proposed by Chudoba et al., ( 1 973b); and verified by a number of other researchers since that time (Van den Eynde et aI. , 1 983; Chudoba et aI. , 1 985; Chiesa et al. , 1 985; van Niekerk et
al., 1 987b; Chudoba et af. , 1 99 1 ). It can also be seen that as the reactor configuration was changed to impose a greater concentration gradient on the system, selection for micro-organisms with a more rapid substrate accumulation capacity occurred, with . a marked increase in the values obtained for �SpOURmax and Ks.
Biomass decay rates were also determined from batch tests in which the t.SpOUR was followed, but over a longer period. There was a significant increase in the decay rate when selector reactor configurations were employed and nutrient removal was observ·�d; opposite to the results reported by Shao and Jenkins ( 1 989) and McClintock et al.
( 1 993) when comparing biomass from CSTRs to that from selector systems and Biological Nutrient Removal (BNR) systems respectively.
Table 9.4 Trend in biomass decay rates duriDl� the study.
Trial Average Decay co-efficient, b (d·l )
10d SRT CSTR 0.22
AN I 0.2 1
AN2 0.23
AN3 0.26 .
AE6 0.26
AE7 0.30
AE8 0.29

300
9.4.1.3 Substrate presence in the biomass floes
Batch tests only detennined the removal of filterable substrate components. The
removal of the insoluble components, namely the larger milk proteins and milk fat, was difficult to assess as these fractions could not be easily differentiated from the biomass in the analyses conducted. As the liquid phase of the mixed liquor was not turbid in ahy of the reactor zones, it was indicated that the insoluble substrate components were rapidly adsorbed onto or enmeshed in the floc structure.
Evidence of substrate · presence in the floc mass, either as adsorbed filterable components 01' enmeshed insoluble components, was suggested from biomass N content data and the COD content of the MLVSS. Substrate N was in the fonn of milk proteins, existing as either colloidal material in the filterable fraction of the substrate or as larger insoluble material. The average N content of activated sludge biomass has been reported as ranging from 8.7% to 1 0.2%, averaging 9.7% to 9.8% (Suwa et al. , 1 992; McClintock et al. , 1 993) as compared to an empirical value of 1 2.4% (Metcalf and Eddy, 1 99 1 ). The average N:VSS ratio measured during the various trials ranged from 1 1 .3% to 1 3 .9%, as shown in Figure 9.8, considerably above those levels reported by other researchers, and measuring above the theoretical limit in the earlier AN series
trials.
The non-filterable TKN fraction of substrate VSS was determined to be 1 1 .3%, higher than typical biomass N contents; therefore the higher biomass N contents measured iIi this study may have been due to substrate proteins being adsorbed onto or enmeshed in the flocs. The differences in average N contents measured between the various reactor zones were not significant at a 95% confidence level, however there was a significant decline in biomass N contents as the series of trials progressed, as shown in Figure 9.8.
The COD content of the ML VSS also suggested that substrate was being adsorbed as the COD content of the substrate VSS was significantly higher at 3 .67 than the levels of around 1 .42 measured on MLVSS. Figure 9.9 illustrates that the average COD:ML VSS ratios were higher in the selector zones than the reactor zone for all trials, which would be consistent with higher levels of substrate adsorption or enmeshment in the selector zones; although again the data were not significantly different at the 95% confidence level of ± 0.2 gCOD.gVSS-I . ·McClintock et al. ( 1 993) observed higher biomass COD contents during nutrient removal trials than CSTR trials, but no such difference could be
detected in these trials.
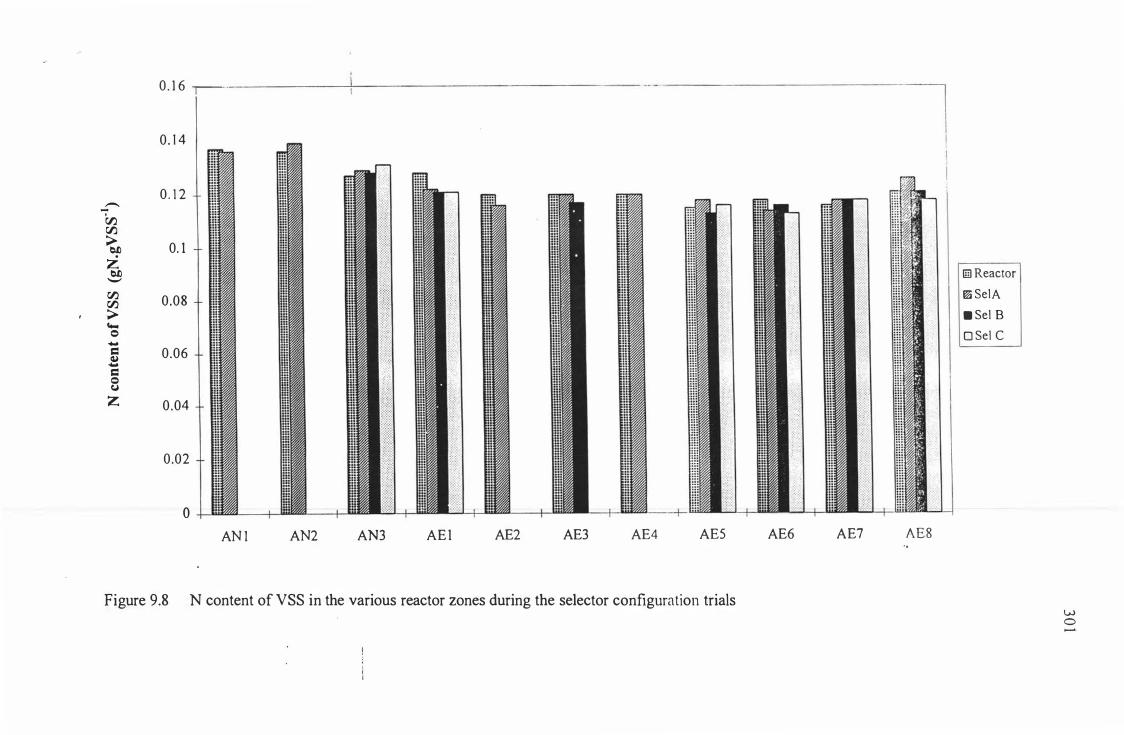
0. 1 6 -r--
0. 1 4
0 . 1 2 --00 rJJ. ;> 0. 1 btl Z btl '-'
rJJ. 0.08 rJJ. ;> ""'" c:> .... = 0.06 � .... = c:> (J
Z 0.04
0.02
o AN I AN2 AN3 AE I AE2 AE3 AE4 AE5
Figure 9.8 N content of VSS in the various reactor zones during the selector configuration trials
--l I I
AE6 AE7 AE8
(ill Reactor
� SeIA
. Sel B
O Sel C
w o

Note: COD content of substrate VSS = 3 .67 gCOD / gVSS 1 .8 r---------------------__________________________________________________ �
1 .6
1 .4
1 .2 .
0 .8 .
0.6
0.4 .
0.2
0 E- f0- E- E- E-� c::z::: p::: � � r/) en r/J r/) r/)
VI -0 "0 -0 -0
N V) 0 0 0 N M
Figure 9.9 COD content of Mixed Liquor Volatile Suspended Solids in the various reactor zones during each trial.
ID Reactor
III Selector A
IlJ Selector B
o Selector C
w o N
303
9.4.2 Comparison of substrate removal under differing environmental conditions
A range of microbial metabolism's was observed in the trials, with anaerobic, anoxic
and anaerobic substrate removals all indicated; sometimes as occurring simultaneously
in a single aerated reactor zone. The initial CSTR trials were fully aerated and only
aerobic substrate removal mechanisms were detected. In the first series of selector trials
the selectors were not aerated as anoxic substrate removals were anticipated due to the
presence of significant quantities .of nitrate in the return activated sludge. However by
the end of the trial some anaerobic activity was also indicated. The next two sets of
trials utilised aerated selectors, but the level of anoxic and more particularly anaerobic
activity increased substantially.
The occurrence of anoxic and anaerobic activity in an aerated system was due to the
degradable nature of the substrate: with just over 40% being determined to be readily
. biodegradable and almost another 30% rapidly hydrolysable; the rate of initial
immediate oxygen demand was very high, and for some microorganisms in the system,
higher than the rate of supply. Under conditions imposed in this study, it is possible that
the availability of substrate in floc inner regions was greater than that of either oxygen
or nitrate, however the extent of this effect would have been dependant on the level of
substrate loading in the initial selector zone and floc characteristics such as floc size and
density. This would have resulted in inner regions of the floc being progressively
anoxic and then anaerobic, supporting the growth of denitrifiers and P accumulating
organisms under aerated reactor conditions.
The evidence for substrate removal under the various environmental conditions was
obtained from measurements of substrate removal, oxygen consumption and biological
nutrient removal. The oxygen and substrate consumption in the selector zone, during
which almost all exogenous substrate was removed from solution, was monitored during
the aerated selector trials. The mass of oxygen consumed above endogenous rates per
mass of substrate removed, was determine� from batch tests in trials AEI to AE5 and
from daily OUR and sCOD data in trials AE5 to AE8. From the low ratios obtained as .
listed in Table 9.5, it was concluded that the oxygen was used for substrate
accumulation and storage rather than for substrate oxidation. The very low ratio in
Selector A indicated that substrate removal by means other than aerobic mechanisms
was also taking place.

304
Table 9.5 Oxygen and substrate -consumption in the aerated selector zones.
Trial Elevated Elevated Elevated Elevated Ave. Total g02.gsCOn-l g02.gsCOD-l g02.gsCOD-l g02·gsCOD-l g02·gsCOD-l in Selector A in Selector B in Selector C in Selector in Selector
Zones Zones
AE I ND ND ND 0.05 - 0. 1 1 ND
AE2 ND - - 0.05 - 0. 1 0 ND
AE3 ND ND - 0. 1 3 ND
AE4 ND - - 0.20 ND
AE5 0.06 0.65 1 .2 0. 1 0 0.20
AE6 0.06 0.95 2.7 0. 1 1 0. 1 9
AE7 0.08 0.54 1 .8 0. 14 0.23
AE8 0.07 1 .2 1 .2 0. 12 0. 1 8
ND = not determined
= not applicable in this trial
Although the selector zone OURs indicated no significant difference in overall oxygen consumption per mass of substrate removed, both the batch tests to determine sCOD removal rates (Table 9.2) and �SpOURmax (Table 9.3), indicated significant increases in substrate removal ability as the trials progressed. Of the two types of batch tests, the latter measured oxygen consumption of heterotrophs alone, while the former did not differentiate between heterotrophic and nitrifier activity. As the proportion of nitrifiers would have been expected to increase as substrate N concentration increased, it is indicated that the activity of both types of organisms were similarly affected.
The actual mass of substrate removed under each type of environmental condition was difficult to assess due to the occurrence of simultaneous nitrification and denitrification in the initial selector zone and also the inability to distinguish influent DRP from released P in that zone. In the aerated selector trials utilising the original substrate it was possible to more closely define the zones in which exogenous substrate removal� via denitrification were occurring, however in the higher substrate N content trials, this was made difficult by the presence of ammonia in the RAS and simultaneous ammonification, nitrification and denitrification.

305
As the varlOUS electron acceptors were being consumed during utilisation of both
exogenous and stored or endogenous substrate, prediction of substrate removal via the
different metabolic pathways was impossible to determine from the parameters
measured during the tests conducted. Some indication of the relative importance of
aerobic, anoxic and anaerobic removals can be gained from mass balances and the
changes in the total reactor system biomass as discussed in the previous chapter,
however further more detailed experimentation would be required to define the extent of
and critical parameters for the various removal mechanisms more clearly.
9.5 Ca uses, cures and prevention of fila mentous bu lki ng
The operability of activated sludge systems can be severely affected by high SVls,
caused by the proliferation of filamentous microorganisms. Bulking sludge was
observed in all three major types of reactor configuration trialed, with a different
microorganism being dominant in each case.
During the first set of trials with a completely mixed reactor configuration, Type 04 1 1
was identified as being the primary filament, increasing in abundance until the trial
failed due to loss of biomass from solids carryover in the effluent. Very little is
recorded in the literature about this filament, as it obviously not commonly encountered as the dominant filament in full scale systems. Eikelboom ( 1 975) makes reference to this filament possibly belonging to the genus Flavobacterium, and Adamse ( 1 968) also refers to Flavobacteria in activated sludge utilising dairy wastewater. Both authors refer to red / orange / brown colouration associated with Flavobacteria, which fits well
with the change in colour of the mixed liquor to a red / orange colour once this
offending filament had become abundant in the trial . . As the DO «oncentration was
maintained above 4.5 gDO.m-3 in the reactor throughout the trials, DO deficiency is unlikely to be the cause and i t is suggested that Type would be classified as a low F 1M,
or Group I I I (Jenkins et al. , 1 993) filament in this situation.
A different filamentous microorganism was responsible for increased SVls in the
unaerated selector trials. This was evidenced by both microscopic examinations and the
observation that bulking events were no longer accompanied by a change in mixed
liquor colour. Although the use of an unaerated selector inhibited the proliferation of Type 04 1 1 , Type 02 1 N was now able to dominate the mixed liquor under the prevailing

3 06
conditions. A secondary filament was also commonly observed, but to a far lesser
extent than Type 02 1 N and was identified as Type 1 70 l .
Wanner and Novak ( 1 990) found that filamentous bulking due to oxic zone growers
such as Type 02 1 N resulted �hen substrate was still available after the selector zone.
This could be due to either incomplete soluble substrate removal in the selectors, or the
hydrolysis of particulate and colloidal material in the main reactor zone, especially if the
selectors were anaerobic. During the unaerated selector trials the conditions in bulk
solution were anaerobic, therefore the opportunity for hydrolysis of the colloidal and particulate substrate, which constituted 59% of influent COD, may have been l imited.
Type 02 1N proliferated in the unaerated selector trials, however the rate and extent of
filamentous growth could be correlated to the extent of removable sCOD consumption
in the selector zone; so it appears that the filament utilised soluble substrate being
carried over to the reactor, rather than that from hydrolysis of particulate substrate.
Type 02 1 N is also reported to proliferate under conditions of N deficiency (Jenkins et
ai., 1 993), which may have been a factor in the trials with originally defined feed, due to
the N source being milk proteins which required ammonification before a directly utilisable N source was available to the biomass. A significant proportion of the C
source was readily degradable and the RAS ammonia concentrations were negligible, so
this may have led to N deficiency problems in the initial selector zones. However Type 02 1N, although stil l present, was not dominant in the aerated selector trials which experienced the same conditions of bioavailability of C and N sources. Therefore although possibly a contributing factor, the proliferation of Type 02 1 N seems to be due
mainly to the maintenance of low FIM conditions in the reactor rather than a possible N
l imitation effect.
The unaerated selectors were intended to be anoxic selectors as it was determined that
there was a significant concentration of nitrate in the effluent during the previous CSTR trials. However, substrate removal in the unaerated selector zone was l imited by the mass of oxidised N compounds available, and batch tests indicated that sCOD removal
from bulk solution ceased once oxidised N compounds were exhausted. Although the
conditions in bulk solution were anaerobic, it is suggested that at this stage in the trials a
significant population of anaerobic microorganisms had not yet developed and therefore
substrate removal was halted until the mixed liquor passed into the aerated reactor zone:
To improve substrate removal in the selectors, these zones of the reactor configuration were also aerated in the remaining trials, with average removals obtained being
illustrated in Figure 9. 1 0.

3 07
83:V
-< a::l u L3:V ..... ..... ..... .... 0 0 0 0 t5 t5 t5 1 t5 I v v v CC Q) v v v 93:V en en en c:::
0 '.' � III •
S3:V
173:V
. , . . . . ;., . £3:V
l3:V
8 1 3:V Q)
..... en >-en I-< 0 .....
£NV u · ro Q) I-< Q) ...c
.....
lNV ......
.:: : :;.;.: . . :;::-. . ... . . ".:.'.;'::.:.:." '-: ".':.: .: : ." 0 en Q) � 0 I NV N
" '::: ;'::,-.: .... . ::-: : en ::::l 0 .�
.DIS P O£ ;> Q) ...c
.....
� . -
.l�S P Ol � 0 .� I-< .....
.l�S PO I � Q) u � 0 u .l�S P S 0
0 U
Q) -.0
.l�S S'l .2 0 C/:J 0 0 0 0 0 0 0 0 V) 0 V) 0 V) 0 V) 0 M M C"I N -
0\ Q) I-< ::s bD <r-w·003s �) OOH�.Il03JOOJ 003 31qnlos 300Z
. -�

308
The use of aerated selectors also resulted in filament growth in some cases, with the · ·
dominant organism this time being identified as Haliscomenobacter hydrossis. The
colour of the mixed liquor could again be associated with changes in SVI, as bulking
incidents attributable to H hydrossis resulting in the mixed liquor changing from a deep
yellow colour to a paler hue. Substrate removal efficiencies in the selector zone were
very high, at above 95%, and could not be directly related to bulking incidents; however
significantly lower concentrations of nitrate and nitrite were recorded in the selector
zones during the two unsuccessful trials with original substrate, indicating that H hydrossis must have been able to compete in low DO conditions. DO had not been
regularly recorded in earlier 'AE' series trials, but would have been negligible in zones
where the nitrate concentration was also low.
Trials conducted at elevated substrate N levels also demonstrated periodic increases in
SVI due to the proliferation of H hydrossis. The increases in filament abundance occurred after periods of low DO in the initial selector zone, even though significant
nitrate concentrations were observed at all times, reinforcing the ' low DO' or Group I
(Jenkins et aI . , 1 993) classification of this filament.
A decline in the abundance of H hydrossis was observed when the ammonia
concentrations in the reactor rose above around 1 0 g.m·3, and pH in the reactor declined
below pH 6. It is proposed that H hydrossis was inhibited by either high ammonia
concentrations or its abi lity to restore accumulation capacity under lowered pH conditions, and although Kampfer et al. (1 995) found inhibition of H hydrossis under
high ammonia concentrations, it was at significantly higher concentrations than those
recorded in these trials. Batch sCOD removal tests also indicated a change in substrate
removal ability for biomass regenerated under lowered pH, indicating that it was the pH
effect that probably had the greater influence.
It is suggested that the low reactor zone pH interfered with the regeneration of substrate acc.umulation capacity for H hydrossis to a greater degree than for the floc formers
present. This may have been due to the closer proximity of the filaments to the lower
pH bulk solution than for the floc formers, as the latter could then have been protected
by diffusional resistance or greater buffering within the floc structure; or it may have
been due to differing susceptibility of the various microbial enzymes to lower pH
conditions.
The substrate removal rate curves indicated that elimination of the more slowly removed filterable substrate components were affected to a greater degree under conditions of

3 09
biomass regeneration at lower pH, and it is proposed that this · fraction would be
represented by the casein micel les. The lower pH may have interfered with filament
enzyme activity, in particular proteolytic enzymes responsible for substrate hydrolysis,
which would have rendered the filament unable to restore accumulation capacity in the
reactor zone.
The substrate removal conditions provided that prevented proliferation of the filaments
types observed is therefore indicated as being: Type 04 1 1 was inhibited by maintenance
of a substrate gradient; Type 02 1 N by efficient substrate removal in the selector zone;
and H hydrossis by well aerated selectors and low pH. It is generally stated that the use
of selectors is effective against both 02 1 N and H hydrossis, particularly if anoxic or
anaerobic selectors are used (Jenkins et aI. , 1 993), however it was found in this study
that the selector performance requirements for the successful prevention of filamentous
growth were more specific and restricted to :
• greater than 95% removable sCOD consumption, and • fully aerobic conditions in bulk solution.
Due to the l imited supply of oxidised N compounds, unaerated selectors were unable to
remove sufficient substrate to prevent bulking. However this type of selector may have
proved successful if the trial had been continued until a significant proportion of P A a's
had developed to consume the remaining removable sCOD in the selectors.
Both single and serial selector configurations were successful, however the serial
selectors were more so, resulting in a more rapid reduction of SVI to a lower level . The
use of serial selectors would also allow greater flexibility and assW"ance of the required
selector performance under the fluctuating substrate conditions that would be
encountered in full scale systems.
The other commonly reported operability problem due to biomass composition I S
foaming. This phenomena was only observed occasionally during the study; resulting in
scum accumulation and biomass carryover in the settler zone. During these periods
some Nocardia was observed to be present in the mixed liquor, but removal of the
accumulated scum on the settler tended to overcome foaming incidents.
Other activated sludge microorganisms commonly seen under the 1 00x and 400x
magnification predominantly used for biomass observations included: rotifers; protozoa,
particularly attached cil iates; and more infrequently, nematodes. The rotifers present
were primarily Philodina sp., although a few Lecaninae sp. were occasionally observed;

3 1 0
the colonial stalked ciliated protozoa were tentatively identified as Opercuiaria sp. ,
Epistylis sp. , and Vorticella sp. . I t has been recently proposed by a number of researchers (Madoni e t ai. , 1 993 ; Salvado and Gracia, 1 993 ; Salvado et ai., 1 995) that
the protozoan species present can be used as an indicator of activated sludge operational conditions, and those identified in this study are commonly associated with high organic
loadings, as were provided in this study by the use of a selector configuration.
Small free swimming ciliates were also often observed, but further identification of
these organisms was not attempted. Rotifers and nematodes were indicated by Salvado
et al. ( 1 995) as being associated with AS plants with a good effluent quality in tenns of
BOD, in agreement with the results in this study. The diversity of higher organisms including free swimming and stalked ciliated protozoa, rotifers and nematodes were as
expected for a SRT of 1 0 days (Jenkins el ai., 1 993); and would have contributed to the
low effluent TSS levels regularly obtained, by consuming unflocculated or dispersed
bacteria.
9.6 Nutrient removal
Due to the rapid rate of substrate removal in the initial selector zone, anoxic and
anaerobic zones were maintained in the floc, even under aeration in that zone. This
resulted in the growth of a significant population of microorganisms that were able to
utilise substrate under anoxic and anaerobic conditions, resulting in denitrification and P accumulation in the biomass respectively. The ability to achieve significant removal of nitrogen and phosphorus from the l iquid effluent stream was considered an additional
benefit of the selector reactor configuration. Average system nutrient removal of up to 96% N and P were measured, due to low soluble N and P concentrations combined with
�.' n+ •
low effluent TSS levels, with the wasted biomass becoming a significant mechanism for both N and P removal from the reactor system. Denitrification was estimated to account
for up to 49% of system N removals.
9.6.1 Nitrogen Removal
Substrate nitrogen was supplied in the form of milk proteins, which required
. ammonification to take place before a readily utilisable fonn of N was available to the
biomass for growth or nitrification. The total BOD:N ratio of the substrate was around

" ,
�
1 4
..r' 1 2 o EffluentVSS N content
a n Effluent N itrite
!Ill Effluent Nitrate Z • Effluent Ammonia btl 1 0 --c 0
".C � 8 a.. ...
CI � Cj CI 0
6 U "0 C = 0 c. 4 a 0 Cj
Z 2
o AN I AN2 AN3 AEI AE2 AE3 AE4 AE5
Figure 9: 1 1 Nitrogen compounds in the effluent stream during Trials AN I to AE5 . " w .......

3 1 2
1 2, a value below the ideal ratio of 20 commonly proposed by a BOD:N:P ratio of
1 00 :5 : 1 for biomass growth (Metcalf and Eddy, 1 99 1 ; Jenkins et al. , 1 993); however
nitrogen removal was observed during al l of the selector reactor configuration trials,
with average N removals via denitrification estimated to range between 1 6% and 49%.
Nitrogen in the influent stream was either removed via denitrification in the reactor
system, flowed out in the waste activated sludge stream, or flowed out in the effluent
stream. The N content of the liquid effluent stream was due to the presence of
ammonia, nitrate, nitrite and biomass cellular nitrogen; and the contribution of each is
shown for the trials with original substrate in Figure 9. 1 1 . It can be seen that the
effluent VSS content can have a significant effect on the total effluent N, emphasising
the importance of good floc structure and settleability on achieving a high quality
effluent.
Henze ( 1 99 1 ) reported typical effluent N concentrations of between 6 and 1 0 gN.m -3 for
biological N removal plants, therefore the results in Figure 9. 1 1 indicate that the aerated
selector trials performed as well as could be expected from a specialised BNR
configuration in terms of effluent quality. The best N removal performances were
recorded during Trials AE3 and AE4, which were indicated as having low selector DO
and therefore more substrate removal via anoxic and/or anaerobic mechanisms; however
both these configurations permitted the proliferation of H hydrossis and consequently
would have resulted in operability problems.
9.6. 1 .1 Ammonification
In the originally defined substrate, N was supplied at a rate of 0.89 gN .d-I
in the form of
_ milk. proteins. Therefore ammonification needed to occur before'the N was in a readily- --
available fonn to the activated sludge microorganisms, either for cell growth or for
nitrification.
Ammonification of feed stream proteins occurred in the selector under all environmental
conditions, as evidenced by the appearance of detectable concentrations of ammonia in
the selector zones during both the aerated and unaerated selector trials. The RAS
ammonia concentration was negligible but ammonia concentrations were observed to
increase through subsequent selector zones. It was indicated that up to 55% of
ammonification occurred in the selector zones, although this would have been

3 1 3
dependant on the RAS recycle rate which determined both floc loading and residence
time in the selector zones.
Ammonia concentrations in the initial selector correlated well to the substrate loading to
that zone, supportIng the theory that ammonification is a first order reaction with the
rate being dependant on organic N concentration (Wong-Chong and 'Loehr, 1 975) . During the unaerated selector trials, no nitrification was possible in the selector zones,
so an estimate of the ammonification rate constant was possible from ammonia
production data and ranged between 0.029 to 0.047 min- l , about ten times greater than
values reported by Wong-Chong and Loehr ( 1 975) on a variety of substrates.
In the aerated selector trials uti lising serial selectors the ammonia concentration reached
a peak in the first or second selector, indicating that in the final selector zone the
nitrification rate exceeded the ammonification rate. Exogenous substrate removal was
almost complete in this zone, so more oxygen would have been available for
nitrification reactions. During the final series of aerated selector trials simultaneous
ammonification and nitrification were observed in all selector zones, which made
further estimates of the ammonification rate difficult to detennine.
9.6.1 .2 Nitrification
During the trials with the originally defined substrate, complete nitrification occ�rred
consistently in the reactor zone resulting in negligible effluent ammonia concentrations
as illustrated in Figure 9. 1 1 . Although nitrification was detennined to be occurring in
all aerated zones during the trials perfonned, the greatest mass of ammonia was oxidised
in the reactor zone. An estimation of the minimum nitrification rates required to
produce the oxidised N compound concentrations obsenred in the reactor zone..i.ndicated
that nitrification was easily completed within the reactor residence times provided . .
Significant nitrite concentrations were recorded during some of the trials. The.
unaerated selector trials produced significant nitrite concentrations in the reactor zone,
which could not be linked to commonly reported causative conditions such as high
ammonia and low pH. Trends in the concentrations of nitrite mirrored those for nitrate
which also seemed to indicate that nitrite accumulation was not caused by the inhibition
of Nitrobacter sp. However it has been reported by Nowak et al. ( 1 995) that exposure
of activated sludge microorganisms to anaerobic conditions did not affect ammonia
oxidation capacity but resulted in a decreased nitrite oxidation capacity.

3 1 4
As the unaerated· selector trials progressed the concentration of nitrite i n the reactor
declined, which would have been expected as the biomass became acclimated by
repeated exposure to the anaerobic selector conditions. During the aerated selector
trials the presence of measurable nitrite concentrations was confined to the selectors,
and to a much lower level than that observed in the series of unaerated selector trials,
which also seemed to indicate that the effect was due to the extent of exposure of the
flocs to anaerobic conditions.
I mmediately after the substrate N concentration was increased, a period of nitrite
accumulation was observed which may have been due to the inhibition by the increased
ammonia concentrations provided via the substrate. An estimate of the maxim-urn
specific growth rate of nitrifiers was obtained from the reactor nitrification response
when the substrate N concentration was increased, and calculated to vary between 0.6 to
1 .2 d- 1 , within the range of values reported by other researchers (Azimi and Horan,
1 99 1 ; Metcalf and Eddy, 1 99 1 ) .
Although complete nitrification was observed with the originally defined substrate,
when substrate N levels were increased, periods of inhibited nitrification were recorded
which resulted in significant effluent ammonia concentrations . . Increasing the substrate
ammonia concentration required an increase in aeration to respond to the increased
nitrification load. When the aeration was at lower levels in the first selector, sCOD
removals did not seem to be adversely affected, suggesting that the availability of
oxygen for nitrification would have been reduced. This increased the nitrification load
in the subsequent reactor zone, to the extent that all available alkalinity was consumed,
thereby reducing the reactor pH and causing an accumulation of ammonia. Therefore
care must be taken to not exceed the system alkalinity if periods of high N loadings in
the influent are possible.
9.6. 1 .3 Denitrification
The extent of denitrification during each trial was estimated from a N balance as
outlined in Barker and Dold ( 1 995), however the mass of N removed via denitrification
was calculated over the entire reactor system and not just unaerated zones, as
denitrification was indicated as occurring in all reactor zones, whether unaerated or
aerated. Bulk solution conditions in the initial selector zones during the 'AN' trials
were anaerobic rather than anoxic due to the supply of oxidised N compounds being
insufficient for complete substrate removal. The aerated selector trials had selector

1 .6 r-----------__________________________________________________________________ -,
.--� � "'I:l = = Q
1 .4
1 .2
Q., 0 . 8 8 Q CJ Z 0.6
0 .2
0 -
AN I AN2 AN3 AEI AE2
ON removed via denitrification mN in WML and effluent cells ED Soluble N in effluent • Soluble N in WML
AE3 AE4 AE5 AE6
Figure 9. 1 2 Reactor system nitrogen balance and trend i n extent of denitrification during Trials AN I to AE8.
AE7 AE8

3 1 6
zones with bulk solutions that were variously anaerobic, anOXIC and aerobic, with
evidence of denitrification processes occurring in each instance.
The average extent of denitrification in each trial, including those at increased substrate
N content is illustrated in Figure 9. 1 2 . Of the N removed as biomass, only
approximately 2% of this value was associated with the effluent stream and tl1e
remainder with the WAS stream . . It can be seen that denitrification was a significant
means of N removal, both in the unaerated and aerated selector trials. The estimated N
removals when using the originally defined substrate averaged from 37% in Trial AE4
to 49% in Trial AN3 ; and while at increased substrate N levels ranged from 1 6% to 55%
during Trial AE8.
Denitrification rates could only be estimated during the unaerated selector trials. Rates
of at least 0. 1 5 gNOrN.gVSS- 1 .d- 1 must have been achieved to remove all the nitrate
and nitrite in the RAS, which is slightly above values commonly reported (Argaman and
Brenner, 1 986; Henze, 1 99 1 ; Metcalf and Eddy, 1 991 ; Wanner, 1 994) but below
maximum levels more recently reported for experiments with readily biodegradable
substrate (Henze el al., 1 994; Carucci el aI. , 1 996).
Denitrification· was first observed during the unaerated selector trials, but a N balance
performed around the reactor system indicated that as the trials progressed the amount
of N removed by denitrification became greater than that accounted for by the removal
of oxidised N compounds in the RAS alone. This indicated that denitrification must
have been occurring together with nitrification in some reactor zones, a situation that
has also been more recently reported by other researchers (Suwa et al. , 1 992;
Szpyrkowicz and Zilio-Grandi, 1 995a; Munch et al., 1 996).
In the unaerated selector trials nitrification was unable to proceed in the selector zones,
which indicated that to account for the N removals observed, denitrification must have
been taking place in the reactor zone. During the aerated selector trials the mass of
influent N removed remained similar at between 37 to 49%, however the proportion of
denitrification that could be attributed to removal of RAS compounds further decreased,
averaging between 7% and 32%. Therefore it was indicated that the extent of
simultaneous nitrification and denitrification had continued to increase, with its
occurrence suggested in all reactor system zones. Although there was no exogenous
substrate in solution in the reactor zone, Carucci et af. ( 1 996) reported that endogenous
or stored substrate was also able to be utilised for denitrification. Other researchers
(Isaacs and Henze, 1 995; Barker and Dold, 1 996; Sorm el aI, 1 996) have concluded that

3 1 7
PAO's can util ise nitrate to restore poly-P reserves. Therefore denitrification may have
been occurring both a means of substrate removal and also as a result of PAO activity.
The DO concentration in the reactor zone was maintained at above 4.5 g.m-3, however
the internal regions of the floc must sti ll have been anoxic for denitrification to occur as
oxygen is generally believed to be inhibitory; although Munch et al. ( 1 996) indicated
that denitrification may still proceed at appreciable rates under low, but measurable, DO
concentrations. Due to the appreciable levels of stored and enmeshed substrate to be
utilised in the reactor zone, and the significant nitrate concentrations, especially during
trials at increased substrate N levels; conditions of limited oxygen but consequential
nitrate in the inner regions of the floc could have been easily achieved.
Denitrification was also a significant reaction in the settler zone, as has been reported by
other researchers (Cizinska et aI. , 1 992; Henze et aI. , 1 993; Siegrist and Gujer, 1 994;
Siegrist et al. , 1 995), and has been reported to cause problems with rising sludge when
the nitrate concentration was above 6 to 8 gNOrN.m-3. A decrease �n the concentration
of oxidised N compounds through the settler zones was observed in most trials and
although the nitrate concentration was as high as 60 gNOrN.m-3 in Trial AE8, rising
sludge was not observed in the later trials. Rising sludge had however been a problem
towards the end of earlier CSTR trials when bulking biomass resulted in long residence
times in the settler zone.
The extent of denitrification decreased in the final aerated selector trials with the
increased substrate N content. It is proposed that this was due to changes in the
diffusional resistances in the floes. Microscopic observations of floc size and visual
observations of mixed liquor filterability indicated that the flocs became smaller and the
extent of extracellular polymeric substances declined as both Trials AE7 and AE8
grogressed; which would have improved the diffusion of oxygen, nitrate and substrate
into the centre of the floc.
It is indicated that the loss of denitrification occurred primarily in the reactor zone as the
extent of denitrification decreased before loss of biological P removal was observed.
Increased oxygen penetration into flocs would have meant that P AOs were then able to
utilise oxygen rather than nitrate for P uptake in the reactor zone. As Trial AE8
progressed, an increase in effluent DRP concentration was observed which indicated
that the extent of anaerobic floc regions in the initial selector had declined, and a
parallel reduction in the reactor zone anoxic regions would also have been expected.

3 1 8
It is therefore suggested that a careful balance between floc characteristics, substrate
loading and environmental conditions needs to be maintained to ensure the occurrence
of simultaneous nitrification and denitrification in a fully aerated system.
9.6.2 Phosphorus Removal
It became evident that phosphorus removal, in excess of that expected for normal
growth requirements, was occurring in the system to an increasing extent during the
selector reactor trials. The trend of declining DRP concentration in the effluent was
accompanied by an increase in biomass P as shown in Figures 9. 1 3 and 9. 1 4. The P
content of the biomass was not measured in the conventional CSTR configurations, but
averaged 0.0 1 5 gP.gVSS-1 in the first unaerated selector trials and increased to a
maximum of 0.026 gP.gVSS- 1 which was observed during Trial AE8.
The time to initiate biological P removal has been observed to be as short as two
anaerobic / aerobic cycles (Ubukata and Takii, 1 994), however the gradual decline in
effluent DRP and increase in biomass P content observed in Figures 9. 1 3 and 9. 1 4
indicated that selection for PAOs, and their increase to a significant proportion o f the
biomass took place over a nwnber of SRTs.
It has been found that the ratio of BOD to P is important in determining the extent of P
removal achievable. A comparison of the substrate requirements detailed by published
reviews of biological P removal (Tetreault et aI. , 1 986; Yeoman et al. , 1 988; Metcalf
and Eddy, 1 99 1 ) to that supplied in this study, reveals that the ratio of carbonaceous
substrate to phosphorus in the wastewater was higher than recommended, to the point of
being possibly P deficient. This implies that the P content of the biomass and extent of
. _ . _ P_.removal achievable would have been l imited, in fact the ratio of P removed to--� -
substrate removed was 0.006 gP.gCOD-1 or approximately 0.0 1 2 gP.gBOD-1 ;
considerably lower than published values of 0.04 to 0.08 gP.gBOD-1 (Tetreault et al. ,
1 986; ) due to the high initial COD:P ratio of the substrate.
The P content of enhanced biological phosphorus removal (EBPR) biomass has been
reported to be as high as 1 1 % (Appeldoom et al. , 1 992), however using the relationship
between substrate COD:P ratio and biomass P content reported in Tetreault et al:
( 1 986), a maximum biomass P content of about 2% would be expected for this
substrate. Therefore P contents observed in the later aerated selector trials did represent

1 0d SRT low FIM AN2 AE2 AE4 AE8
1 o -·r---------.-------------�------------------.-----------.-----�----------� 0.035
9
8
7
6
5 . -
4
3 . .
2
. ,.
•
o .
o . <pCB o
' Li ". . . .
rfJ • rfJ
> � 0.0 1 5 '0
!'II • 6 .... � E .... c 0.0 1 0
(..I
� - - 0 .005 � � 6 ft; 6�
0 +-------��--�------�------�------+_�--��----�--�·--·����----_4 0 05/09/93 1 5/1 0/93 24/1 1 /93 03/0 1 /94 12/02/94 24/03/94 03/05/94 1 2/06/94 22/07/94 3 1 /08/94
6 Effluent DRP • Effluent TP 0 P content ofVSS
Figure 9. 1 3 P content o f biomass and effluent during trials in Reactor System 1 . . \ lJJ

6 Effluent DRP • Effluent TP o P content of VSS
Figure 9. 1 4 Trend in effluent P concentrations and the P content of biomass during trials in Reactor System 2.
" .

\ -
321
luxury P uptake even though they were considerably lower than that observed in
conventional EBPR systems.
Due to the accumulation of P in the biomass, it has also been observed that as the extent
of P removal increased, the VSS/TSS ratio of the MLSS decreased (Heymann and
Potgieter, 1 989). As can be seen in Table 9.6 the VSS/TSS ratio is indicated to have
possibly decreased slightly as the trials progressed, which may have been due to the
increasing fraction of inorganic P in the biomass, from 1 .8% to 2.6% in Reactor 1 trials,
and 1 .5% to 2 .5% in Reactor 2.
As well as P removal due to the activity of poly-P accumulating microorganisms,
additional removal may occur via precipitation of P due to calcium ions in the
wastewater. Heymann and Potgieter (1 989) indicate that this effect may be significant
at elevated pH when the calcium concentration is above 50 g.m-3; but as the Ca
concentration in the substrate was estimated to be 1 7 g.m·3, and the mixed liquor pH
remained less than 9, the opportunity for chemical precipitation of P onto floes would
have been minimal, as supported by the limited extent of decrease in the vssrrss ratio.
Table 9.6 vssrrss ratio of the reactor suspended solids.
R l : Trial VSSITSS R2: Trial
CSTR trials:
20d SRT 0.9 1 ± 0.06 30d SRT
1 0d SRT 0.92 ± 0.05 5d SRT
Selector trials: ( l Od SRT) -
ANI
AN2 0.90 ± 0.04 AN3
AE I
AE2 0.9 1 ± 0.03 AE3
AE4 0.91 ± 0.03 AE5
AE6
AE8 0.87 ± 0.04 AE7
VSSITSS
-'
0.88 ± 0.06
0.92 ± 0.06
0.9 1 ± 0.04
0.92 ± 0.05
0.90 ± 0.04
0.90 ± 0.06
0.89 ± 0:03
0.88 ± 0.03
0.88 ± 0.05
322
Figure 9. 1 4 i l lustrates that the average total P concentration in the effluent stream was
0.6 gP.m-3 in Trials AE5 and AE6, which represented a maximum average P removal of
96 % for the trials conducted. The aerated serial reactor configuration was therefore
efficient in supporting biological P removal even though anaerobic conditions were not
maintained in bulk solution at any point in the system. By the end of trial AE5 the
soluble P in the effluent was consistently below 1 g.m-3 and due to the low level lof
suspended solids in the effluent, the total P concentration was also generally below 1
g.m -3. Due to the relatively low phosphorus content of the bio!l1ass, effluent TSS levels
had a lower effect on total effluent P than commonly reported for EBPR systems.
An increase in the average P content of biomass as it passed from selector to reactor
zones was indicated during most of the selector reactor trials as shown in Figure 9. 1 5 ,
however the difference was not significant at the 95% level of confidence. This would
have been consistent with P release for substrate accumulation in the first selector zone
and subsequent P uptake in downstream zones.
The increase in average DRP concentrations between the reactor and effluent zones
would be consistent with P release into solution in the settler, which would have been
possible as anaerobic conditions would have existed in the settled sludge layer, the
necessary substrate may have been provided by the hydrolysis of enmeshed particulate
substrate. Carlsson et af. ( 1 996) has also reported P release in zones without RBCOD.
The accepted mechanisms for biological P removal require that readily biodegradable
substrate be available to the bacteria in an anaerobic environment: a condition that was
provided in all of the trials possessing a selector configuration. During trials AN 1 to
AN3 anaerobic conditions prevailed in the selector zones, however during Trials AEI to
AE8, bulk conditions in the selector zone were either anoxic or aerobic and the
anaerobic conditions are indicated as having existed within the flocs in the .first selector
zone only.
Generally aerobic conditions are required to follow the anaerobic zone, to allow the
PAO's to regenerate substrate accumulation capacity by restoring P reserves. The
indication of simultaneous nitrification and denitrification in all reactor zones suggests
that floc interiors may have been oxygen deficient even in the reactor zone, however
Comeau et af. ( 1 987) and Kerrn-Jespersen and Henze ( 1 993) demonstrated that some P accumulating bacteria were able to utilise nitrate to oxidise stored substrate and
regenerate poly-P reserves. This would have allowed P uptake to occur along with
denitrification in the reactor zone.

0.03 .,.----________________________ _
-- 0.025 en 00 ::> b.() � 0.02 b.() '-' ." ." • Reactor �
m SelA e 0.0 1 5 0
m Sel.B :Ei eo.. 0 O Sel.C
.. 0.0 1 = � ... = 0 u
� 0 .005
o AN I AN2 AN3 AE I AE2 AE3 AE4 AE5 AE6 AE7 A E8
Figure 9. 1 5 Average phosphorus content of biomass in the various reactor zones during Trials AN I to AE8.

..r 8 � '-' = 0 � ('IS 1.0 .... = � U = 0 u � .... f .... 'a < 1.0 0 .... u � � rIl
AE5: AE6:
original substrate 34% increase in substrate N
60
50
40
' I 30
1 1 1
20 )/ 1 1
1 0 1 ;- �J�+ 0
0 M lI"l r-- 0\ - VI 0\ M r-- lI"l '" C"I N C"I N N N N N
AE7:
66% increase in substrate N
I 1 1 1 1 I 1 1 I 1 Q I V , 0
H- '�++-++' 1
-H--� I I I I VI '" M r-- \0 0
N N M
Day of Trial
I I I I I I I I I I I
I \ lI"l '"
AE8:
66% increase in substrate N
, 2.S ____ Nitrate
-8- DRP
M r--- -++-H-+--l-H-+I
lI"l O\ M r--N N C"I r"l M �
2
I .S
O.S
0
Figure 9. 1 6 Change in initial selector zone DRP with increasing nitrate concentration during Trials AES to AE8. '"
.-.. ., E c.; t)D '-' .-.. rJ'J � -( � rJ'J '-' =
.S .... ('IS 1.0 .... = � u = 0 u
� Q = .-� rIl ('IS � s.. u = -

325
An increase in initial selector zone nitrate concentrations as the higher substrate N trials
progressed did not seem to adversely affect overall system P removal as has been
proposed (Tetreault et aI. , 1 986; Appeldoorn et al. , 1 992). The nitrate concentrations
increased substantial ly during Trials AE6 to AE8, but as can be seen from Figure 9. 1 6,
there was no concurrent decrease in biomass P content, although a declining trend in
first selector zone DRP concentration may have been indicated. However� as the overall
extent of EBPR increased during Trials AE6 and AE7 even though the nitrate levels in
all zones increased, it is indic�ted that the presence of nitrate alone does not inhibit P A 0
activity. This seems to support the suggestion that the presence of nitrate allows
microorganisms to utilise oxidative pathways in preference to fermentative pathways
(Lotter, 1 985), rather than acting as an inhibitor P release. -- --' .
An increasing extent of EBPR was observed as the trials progressed, except for during
AE8, the second trial with a high level of substrate N. The floes were smaller and
contained less viscous polymeric material at the end of Trials AE7 and AE8, so
penetration of oxygen and oxidised nitrogen compounds to the interior of the floes
would have been facilitated and the extent of any anaerobic regions in the floc
decreased. Trials AE7 and AE8 were operated under similar conditions except that the
recycle rate was higher in AE8 . It is proposed that the lower resultant floc loading rate
in AE8, coupled with a higher bulk nitrate concentration in the first selector zone and
lower floc resistance to mass transfer, eliminated the required combination of adequate
substrate supply and anaerobic conditions in the centre of the floes, and as a result the
EBPR declined. �-
9.7 Implications for Design of Ful l Scale Systems
This study has demonstrated that an activated sludge system can be used to effectively
treat the wastewater from a dairy processing facility, however careful design is required
to ensure that operational problems due to filamentous bulking do not result. It was
demonstrated that the use of a selector configuration to impose a concentration gradient
in the system could have a number of benefits: more efficient substrate removal; the
prevention of filamentous microorganism growth; and the opportunity to incorporate
biological N and P removal.
Due to. the readily biodegradable nature of the substrate, under high floc loading
conditions of around 0. 1 to 0.2 g sCOD. gVSS-1 rapid rates of substrate accumulation

326
result in anoxic and anaerobic zones being maintained in the biomass floes, even though
the bulk solution is aerated and may be maintained in an aerobic condition. This effect
can possibly be used to advantage to accomplish biological N and P removal from the
wastewater, without the need to incorporate defined anoxic and anaerobic reactor
system zones or utilise complicated internal recirculating flow regimes.
Although the use of unaerated selectors was not successful within the timeframe of this
study, it is believed that this mode of selector operation could sti ll provide successful
bulking control for dairy processing wastewaters. The ' AN' series of trials stil l resulted
in bulking as a population of PAOs sufficient to remove the substrate remaining after
the consumption of oxidised N compounds had not yet developettby-the end-of the trial .
Further study with combinations of anoxic / aerobic selectors, or the strategy of starting
up the process in this configuration, then converting to completely unaerated selectors
once the slower developing PAO's and denitrifiers were sufficiently developed , should
be investigated
Serial selector configurations were found to be more successful than single selectors and
would provide better assurance of required substrate removal efficiencies under variable
substrate conditions. The use of serial selectors would also allow greater flexibility in
maintenance of anoxic and anaerobic zones within the floc to maximise the opportunity
for providing N and P removal in the selector zone.
The extent of denitrification observed was due not only to anoxic substrate removal
mechanisms in the initial selector zone, but also denitrification in all the other reactor
zones. Simultaneous nitrification and denitrification in zones with appreciable
dissolved oxygen contents suggest that anoxic zones are maintained in the inner regions
of the floes. Denitrification in the reactor zone may have also been due to PAO's
utilising nitrate to restore poly-P reserves, therefore the maintenance of these anoxic
zones was important for both N and P removal performance. The ability to maintain
anoxic regions in the floc would have been dependant upon controllable reactor
characteristics such as DO concentration and floc loading, but also in the less easily
controlled parameters such as floc size, floc density and floc polymer composition.
Conditions for maximum N and P removal required that high substrate loadings be
maintained in the initial selector zone; however filamentous bulking occurred when
conditions of bulk solution in the initial selector were not maintained in an aerobic state.
Therefore a balance between sufficient DO supply to prevent bulking and maintain low

\.
327
RAS recycle rates; but restricted electron acceptor supply to maintain anOXIC and
anaerobic regions in the floc must be struck.
Very high N and P removals from the liquid effluent stream can be achieved, however
in addition to maintaining the requisite floc conditions for biological nutrient removal,
some other contributing factors were highlighted. If the influent is highl)l variable with
regard to N content and full nitrification is essential, the system alkalinity may need to
be monitored. Trials at the highest substrate N content were affected by. alkalinity
limitations which resulted in inhibition of nitrification and accumulation of significant
effluent ammonia concentrations. The wasted mixed liquor removal from the system
contributes' significantly to the system N removal and is the sole point of P removal,
therefore the conditions under which the biomass is removed and point of withdrawal
from the system is important. Settler conditions also affect overall P removal and in
order to maintain low effluent soluble P levels, anaerobic conditions in the settler should
be minimised.
The effluent total N and P levels obtained for the most successful configuration in this
study of less than 1 0 g.m -3 N and less than I g.m-3 P, are close to those that would
generally be required for effluents discharging to freshwater receiving waters. The NZ
Ministry for the Environment ( 1 992) specifies N and P concentrations in freshwater
systems to prevent undesirable biological growth, in particular benthic algae; and the
effluent N and P levels achieved in this study would require receiving water dilution of
approximately 1 00 times and 30 times to achieve the desired N and P levels
respectively. As the N level achieved is l ikely to be closer to any nutrient limits
imposed than the P level, further optimisation of the system to reduce effluent nitrate
concentrations may be of benefit. Effluent ammonia concentrations of <0. 1 g.m-3 were
consistently obtained and therefore did not contribute to the effluent nitrogen load.
As the trials in this study were conducted with the prevention of fi lamentous growth
being the primary concern, and the subsequent high degree of N and P removal
occurring as an unexpected bonus, some of the information required to more adequately
detail the relationships between N, P and substrate compounds was not foreseen. The
critical parameters for maintaining a balance between the needs for a non bulking
biomass and reliable nutrient removal need closer definition before a full scale system
with a variable influent can be considered. In general, a system such as a- sequencing
batch reactor (SBR) could provide the flexibility required to maintain appropriate
conditions for achieving both biomass settleability and nutrient removal objectives, with
the extent of substrate variability for which dairy processing wastewaters are notorious.

328

329
CHAPTER 10
SUMMARY AND CONCLUSIONS
1 . A modified activated sludge treatment system was successfully used to treat a
synthetic wastewater simulating that arising from a milk processing facility
producing butter and milk powder. A high quality effluent with a TSS of less
than 1 0 g.m-3 and soluble COD of less than 30 g.m-3 was achieved, representing
both soluble and total COD removals of greater than 98%.
2 . Biodegradability of the defined substrate was investigated, and detennined to be
42.5% readily biodegradable and 28.5% rapidly hydrolysable. Of the remaining
29%, the maj ority was concluded to be slowly biodegradable, with an almost
negligible non-biodegradable or inert fraction. Approximately 80% of the readily
biodegradable fraction was detennined to be due to lactose, and j ust over half of
the slowly degradable fraction due to milk fat. Milk proteins were present in all
three fractions: comprising virtually all of the rapidly hydrolysable fraction, 20%
of the readily biodegradable fraction, and just under half of the slowly degra��ble
fraction.
3 . Conventional completely mixed reactor configurations could not b e successfully
used due to operational problems resulting from the excessive growth of
filamentous microorganisms. The most successful reactor configuration trialed
included. a_ selector zone comprising three aerated compartments in series, with
greater than 95% of removable COD being consumed in the selector zone: As
well as substrate removal efficiency considerations, conditions in the selector
were also important for the suppression of filamentous growth, with fully . aerobic .
conditions in bulk solution required in the initial selector zone.
4. It was considered that other serial selector configurations could also be viable,
such as completely unaerated zones, or initial unaerated zones followed by
aerated zones. However the success of these configurations would be dependent
on the rapid development of a slower growing population of anaerobic
microorganisms, due to the restricted opportunity for adequate anoxic substrate

3 3 0
removal possible with the carbonaceous substrate to nitrogen ratio typically
provided by the wastewater.
5 . Different types of filamentous bacteria proliferated under different substrate
removal conditions. In a completely mixed reactor configuration, Type 04 1 1
dominated the biomass, which was classified as being a low FIM filament. When
unaerated selectors were used, Type 02 1 N was the dominant filament.
Proliferation under these conditions was considered to be due to readily
biodegradable substrate entering the reactor zone rather than anaerobic conditions
in the selector zone, and hence Type 02 1 N was also indicated as being a low F 1M
filament. Increases in SVI during trials with aerated selectors were due primarily
to Haliscomenobacter hydrossis; with the proliferation of this filament being
related to periods of low dissolved oxygen in the initial selector zone, therefore
indicating that this microorganism could be classified as a low DO filament.
6. Substrate removal from bulk solution occurred by biosorption, followed by a
period of 'psuedo first order' substrate removal. Biosorption capacity of the
biomass increased as the floc loading in the initial contact zone was increased, but
was also dependant on the mixed culture composition. Biomass reSUlting from
the aerated selector trials had a higher biosorption capacity than that from the
unaerated selector trials. The filamentous bacteria demonstrated variable
biosorption abilities; with Type 021 N indicated as having a lower biosorption
capacity than non-filamentous bacteria, however H. hydrossis appeared to have a
higher biosorption capacity than the floc formers present in the mixed culture.
7. Very high substrate removal rates were observed with apparent first order
substrate removal rates of up to 1 80 d-I being measured in batch tests using
biomass from the successful aerated selector reactor trials. During reactor
operation specific removals averaging 6:5 g sCOD. gVSS-I .d-1 were recorded . in
the initial selector zone, at floc loadings of 0. 1 9 g sCOD. gvss-I .
8 . Due to the readily biodegradable nature of the substrate and the very high
substrate removal rates achieved by the biomass that were able to proliferate in
the selector system; aerobic, anoxic and anaerobic substrate removal mechanisms
were observed simultaneously in the initial selector zone. Conditions in bulk
solution were . maintained in aerobic state, but significant anoxic and anaerobic
activities were also indicated, therefore conditions in the internal regions of the
floc must have been progressively less oxic, being firstly anoxic and then

33 1
anaerobic. The high substrate loadings in the initial selector zone resulted in
sufficient substrate diffusing into the internal regions of the floc, whereas both
oxygen and nitrate availability became increasingly limited.
9. Considerable biological nitrogen and phosphorus removals were ob.served due to
anoxic and anaerobic substrate removal mechanisms respectively. Removal of up
to 49% of influent N via denitrification was indicated. Effluent stream nutrient
concentrations represented decreases as high as 96% of both influent nitrogen and
phosphorus levels.
1 0. Phosphorus removals occurred VIa phosphorus accumulating microorganisms
which developed in the mixed culture during the unaerated selector trials and
whose activity continued even when aerated conditions were imposed in the
selector zones. Due to the low nutrient : organic matter ratio in the substrate,
biomass phosphorus contents remained below 3% and effluent total phosphorus
concentrations of less than 1 g.m-3 were consistently achieved.
1 1 . Nitrogen removal via denitrification was indicated as occurring simultaneously
with nitrification in all of the aerated reactor system zones. Nitrate was utilised
for exogenous substrate removal in the initial selector zone, but was also
consumed in the reactor zone where no exogenous substrate was present. Reactor
zone consumption may have been due to phosphorus accumulating organisIp.s
utilising nitrate to restore polyphosphate reserves.
1 2. Wastewater nitrogen and phosphorus removal efficiencies declined at high
substrate nitrogen levels when a combination of reduced floc diffusional
resistance and size, combined with high nitrate concentrations and decreased floc
loadings, resulted in the loss of anaerobic floc zones in the initial selectors and
anoxic floc zones in the reactor. Denitrification declined before phosphorus
removal, indicating that the extent of reactor zone denitrification declined before
selector zone denitrification.
1 3 . The use o f a selector reactor configuration i n an activated sludge system was
therefore beneficial for a number of reasons as it resulted in the control of
filamentous bulking, improved overall substrate removal efficiency and effective
biological nutrient removal. The latter effect was particularly desirable as high
levels of both nitrogen and phosphorus removals were achieved without defined

332
anaerobic or anoxic reactor zones, or complicated internal recirculation strategies
both of which are commonly employed for biological nutrient removal systems.
1 4. The results of this study have several implications for the design of future full
scale treatment systems for dairy processing wastewaters. Conditions for the
control of filamentous growth were defined, however those for efficient nitrogen
and phosphorus removal were found to be a more complex interaction of
substrate, environmental and floc physical conditions. This interaction requires
closer definition so that the nutrient removal processes within an aerated activated
sludge system call be controlled and optimised, especially under the conditions of
variable substrate composition for which dairy processing waStewaters are well
known.

333
APPENDIX
All the reactor operation data, data analysis methodology and calculated results are
included as spreadsheet files in MICROSOFT EXCEL for WINDOWS' (Version S .O)
format. A directory of the file names and file contents on the two data disks is given in
Table A l and Table A2.
TABLE A I : Directory of Appendix Files. Data Disk No.1
Directory Filename Contents
Chapter 4 CODrem4.xls Estimation of lactose and substrate removal rates
using biomass from the 2 .Sd HRT / SRT reactor
Kinest4.xls Estimation of biokinetic parameters using both
High SIX and Low SIX methods.
Substrat.xls Estimation of biodegradable fractions Ss and SH for
the defined substrate .
Trials4.xls Reactor performance parameters measured during
reactor operation at 2 .Sd HRT / SRT.
- -
Chapter S CODreniS .xls Estimation of substrate removal rates during CSTR
trials at varying SRT
DecayS .xls Estimation of biomass decay rates during CSTR
trials at varying SRT
Kinest5 .xls Respirometric estimation of biokinetic parameters
during CSTR trials at varying SRT
Trials5.xls Reactor performance parameters measured during
CSTR trials at varying SRT: 5d, 1 0d, 20d, and 30d.

334
TABLE A I (continued): Directory of Appendix Files, Data Disk No.1
Directory Filename Contents
Chapter 6 CODrem6.xls Estimation of substrate removal rates dl;lril}g
unaerated selector trials: AN I , AN2 and AN3.
Decay6.xls Estimation of biomass decay rates during unaerated
selector trials: AN I , AN2 and AN3.
Kinest6.xls Respirometric estimation of biokinetic parameters
during unaerated selector trials : AN I , AN2 and
AN3.
Trials6.xIs Reactor performance parameters measured during
unaerated selector trials: AN I , AN2 and AN3 .
Chapter 7 CODrem7.xls Estimation of substrate removal rates during aerated
selector trials: AEI , AE2, AE3, AE4 and AE5.
Kinest7 .xls Respirometric estimation of biokinetic parameters
during aerated selector trials: AE I , AE2, AE3 , AE4
and AE5 .
MASSba17.xIs Calculation of mass removals and mass balance for
substrate parameters and oxygen during aerated
selector trials: AEI , AE2, AE3, AE4 and AE5.
Trials7.xls Reactor performance parameters measured during
aerated selector trials: AEI , AE2, AE3, AE4 and
AE5.

TABLE A2 :
Directory
Chapter S
Chapter 9
335
Directory of Appendix Files. Data Disk No.2
Filename Contents
CODremS .xls Estimation of substrate removal rate,s dJlring aerated
selector trials at high substrate N content: AE6,
AE7 and AES.
DecayS.xls Estimation of biomass decay rates during aerated
selector trials at high substrate N content: AE6,
AE7 and AE8 .
Kinest8 .xls Respirometric estimation of biokinetic parameters
during aerated selector trials at high substrate N
content: AE6, AE7 and AE8 .
MASSbal8 .xls Calculation of mass removals and mass balance for
substrate parameters and oxygen during aerated
selector trials: AEl , AE2, AE3, AE4 and AE5.
Trials8.xls Reactor performance parameters measured during
trials at increased substrate N content: AE6, AE7
and AE8.
Summary.xls reactor diary; summary of biosorption results;
summary of biokinetic parameter estimation.

337
BIBLIOGRAPHY
Adamse A.D. ( 1 968a) Formation and final composition of the bacterial flora of a dairy
waste activated sludge. Water Research, 2, 665-67 1 .
Adamse A.D. ( 1 968b) · Bulking of dairy waste activated sludge. Water Research, 2,
7 1 5-722.
Adamse A.D. ( 1 968c) Response of dairy waste activated sludge to experimental
conditions affecting pH and dissolved oxygen concentration. Water Research, 2, 703-
7 1 3 .
Albertson O.E. ( 1 99 1 ) Bulking sludge control - progress, practice and problems. Water
Science and Technology, 23(Kyoto), 835-846.
Andreadakis A.D. and Chatj ikonstantinou G.J. ( 1 994) Fate of readily biodegradable
substrate under anoxic conditions. Water Science and Technology, 29(7), 53-56.
Antoniou P. , Hamilton J., Koopman R, Jain R., Holloway R, Lyberatos G. and
Svoronos S .A. ( 1 990) Effect of temperature and pH on the effective maximum specific
growth rate of nitrifying bacteria. Water Research, 24(1), 97- 1 0 1 .
Azimi A.A. and Horan N.J. ( 1 99 1 ) The influence of reactor mixing characteristics on
the rate of nitrification in the activated sludge process. Water Research, 25(4), 4 1 9-423 . _
APHA, A WWA, WEF. ( 1 992) Standard Methods for the Examination of Water and
Wastewater. ( 1 8th edition), American Public Health Association, Waship.gton DC,
USA.
338
Appeldoorn K.J. , Kortstee G.].]. and Zehnder AlB. ( 1 992) Biological phosphate
removal by activated sludge under defined conditions. Water Research, 26(4), 453-460.
Argaman Y and Brenner A ( 1 986) Single-sludge nitrogen removal : modeling and
experimental results. Journal WPCF, 58(8), 853-860.
Barker P .S . and Dold P.L. ( 1 995) COD and nitrogen mass balances in activated sludge
systems. Water Research, 29(2), 633-643 .
Barker P.S. and Dold P.L. ( 1 996) Denitrification behaviour in biological excess
phosphorus removal activated sludge systems. Water Research, 30(4), 769-780.
Barnett lW., Parkin M.F. and Marshall K.R. ( 1 982) The characteristics and oxygen
demand of New Zealand dairy food plant effluent discharges. In Water and Soil
Miscellaneous Publication No. 29, Water and Soil Division, Ministry of Works and
Development, Wellington, New Zealand, 49-52.
Brenner A. and Argaman Y. ( 1 990a) Effect of feed composition, aerobic volume
fraction and recycle rate on nitrogen removal in the single-sludge system. Water
Research, 24(8), 1 04 1 - 1 049.
Brenner A and Argaman Y. ( l 990b) Control of sludge settling characteristics in the
single-sludge system - A hypothesis. Water Research, 24(8), 1 05 1 - 1 054.
Bunch B. and Griffin D.M. ( 1 987) Rapid removal of colloidal substrate from domestic
wastewaters. Journal WPCF, 59(1 1), 957-963 .
Carawan R.E., Chambers J.V. and Zall R.R. ( 1 979) Spinoff on Dairy Processing Water
and Wastewater Management. Extension Special Report No. AM- 1 8B, North Carolina
Agricultural Extension Service, Raleigh, North Carolina.

339
Carlsson H . , Aspegren H. and Hilmer A . ( 1 996) Interactions between wastewater
quality and phosphorus release in the anaerobic reactor of the EBPR process. Water
Research, 30(6), 1 5 1 7- 1 527.
Carucci A., Ramadori R., Rossetti S. and Tomei M.C. ( 1 996) ; Kinetics of
denitrification reactions in single sludge systems. Water Research, 30(1), 5 1 -56 .
Casey T.G., Wentzel M.e., Ekama G.A., Loewenthal R. E. and Marais GvR. ( 1 994) A
hypothesis for the causes and control of anoxic-aerobic · (AA) filament bulking III
nutrient removal activated sludge systems. Water Science and Technology, 29(7), 203-
2 1 2.
Catunda P.F.e. and van Haandel A.e. ( 1 992) Activated sludge settl ing Part I :
Experimental determination of activated sludge settleability. Water SA, 18(3), 1 65- 1 72.
Cech 1.S. , . Chudoba 1. and Grau P. ( 1 984) Determination of kinetic constants of
activated sludge microorganisms. Water Sci. Techno!. , 17(2/3), 259-272.
Cech 1 .S . and Hartman P. ( 1 993) Competition between polyphosphate and .,�-
polysaccharide accumulating bacteria in enhanced biological phosphate removal
systems. Water Research, 27(7), 1 2 1 9- 1 225.
Chiesa S .e. and Irvine R.L. ( 1 985) Growth and control of filamentous microbes in
activated sludge: an integrated hypothesis. Water Research, 19(4), 47 1 -479.
Chiesa S.C. , Irvine R.L. and Manning 1.F. ( 1 985) Feast / famine growth environments
and activated sludge population selection. Biotechnology and Bioengineering, 27, 562-
569.
Chuang S-H., Ouyang C-F. and Wang Y-B ( 1 996) Kinetic competition between
phosphorus release and denitrification on sludge under anoxic condition. Water
Research, 30(12), 296 1 -2968.

340
Chudoba 1. ( 1 985) Control of activated sludge filamentous bulking - VI. Formulation
of basic principles. Water Research, 19(8), 1 0 1 7- 1 022.
Chudoba 1. ( 1 990) Comment on 'The effect of reactor hydraulics on the performance of
activated sludge systems'. Water Research, 24(1 1) , 1 43 1 - 1 433 .
Chudoba 1 . , Ottova V. and Madera V. ( 1 973a) Control of activated sludge filamentous
bulking - I. Effect of hydraulic regime or degree of mixing in an aeration tank. Water
Research, 7, 1 1 63- 1 1 82.
Chudoba J . , Grau P. , Ottova V. ( 1 973 b) Control of activated sludge filamentous
bulking - I I . Selection of microorganisms by means of a selector. Water Research, 7,
1 3 89- 1 406.
Chudoba 1., Blaha l. and Madera V. ( 1 974) Control of activated sludge filamentous
bulking - III . Effect of sludge loading. Water Research, 8,23 -237 .
Chudoba 1 . , Dohanyos M., Grau P . ( 1 982) Control of activated sludge filamentous
bulking - IV. Effect of sludge regeneration. Water Sci. Techno!. , 14, 73-93 .
Chudoba l., Cech l.S. and Chudoba P. ( 1 985) The effect of aeration tank configuration ·
on nitrification kinetics. Journal WPCF, 57(11), 1 078- 1 083 .
Chudoba l., Cech l.S., Farkac l. and Grau P. ( 1 985a) Control of activated sludge
filamentous bulking - experimental verification of a kinetic selection theory. Water
Research, 19(2), 1 9 1 - 1 96.
Chudoba l., Strakova P. and Kondo M. ( 1 99 1 ) Compartmentalised versus completely
mixed biological wastewater treatment systems. Water Research, 25(8), 973-978.
Chudoba P., Capdeville B. and Chudoba l. ( 1 992) Explanation of the biological
meaning of the SolXo ratio in batch cultivation. Water Sci. Technol. , 26(3/4), 743-75 1 .

34 1
Chudoba P. and Pujol R . (1 994) Kinetic selection of microorganisms by means of a
selector - twenty years of progress: history, practice and problems. Water Science and
Technology, 29(7), 1 77- 1 80.
Cizinska S., Matejo V. , \Vase c., Klasson Y, Krejci J. and Dalhamrpar G. ( 1 992)
Thickening of Waste Activated Sludge by biological flotation. Water Research, 26(2),
1 39- 1 44.
Clayton 1.A., Ekama G.A., Wentzel M.e. and Marais G.v.R. ( 1 99 1 ) Denitrification
kinetics in biological nitrogen and phosphorus removal activated sludge systems
treating municipal waste waters. Water Science and Technology, 23(Kyoto), l O25-
1 035 .
Comeau Y, Rabionwitz B. , Hall K.J. and Oldham W.K. ( 1 987) Phosphate release and
uptake in enhanced biological phosphorus removal from wastewater. J Water Pollut.
Control Fed , 59 (7), 707-7 1 5 .
Daigger G.T, Robbins M.H and Marshall B .R. ( 1 985) The design of a selector to
control low FIM filamentous bUlking. Journal WPCF, 57(3), 220-226 . .---
Daigger G. and Nicholson G. ( 1 990) Performance of four full-scale nitrifying
wastewater treatment plants incorporating selectors. Res. J Water Polin. Control Fedn. ,
62(5), 676-683 .
Deinema M.H, Van Loosdrecht M. and Scholten A. ( 1 985) Some physiological
characteristics of Acinetobacter species accumulating large amounts of phosphate.
Water Sci. Techno!. 17(1 1112), 1 1 9- 125.
De Haast 1. , Britz T.1. and Novello 1. e. ( 1 984) The management of waste water in the
milk processing industry. S. Afr. J. Dairy Techno!. , 16(2), 67-73 .

342
Dold P.L. , Ekama G.A. and Marais G.v.R. ( 1 99 1 ) A general model for the activated
sludge process. Prog. Water Techno!. ,12(6), 47-77.
DR/2000 Spectrophotometer Handbook (1 992). HACH Company, USA.
Drtil M., Bodik I. and Nemeth P. ( 1 993) Regeneration of activated sludge under oxic
and anoxic conditions. Water Research, 27(5), pp 897-901 .
Eckenfelder W.W. ( 1 987) Discussion: The control of bulking sludges - from the early
innovators to current practice. Journal WPCF, 59(7), 735.
Eckenfelder W. W. ( 1 989) Industrial Water Pollution Control. 2nd ed., McGraw Hill ,
New York.
Eckenfelder W.W. and Grau P. ( 1 992) Activated Sludge Process design and Control:
Theory and Practice. Water Quality Management Library, Volume 1 . Technomic
Publishing Company Inc. , Pa, USA.
Eikelboom D.H. ( 1 975) Filamentous organisms observed in activated sludge. Water
Research, (9), 365-388 .
Ekama G.A., Dold P.L. and Marais G.v.R. ( 1 986) Procedures for determining influent
COD fractions and the maximum specific growth rate of heterotrophs in activated
sludge systems. Water Sci. Techno!. , 18(6), 9 1 - 1 1 4.
Elkin J.D. ( 1 984) Dairy effluent disposal. Dairy Industries International, 49(4), 29-3 5 .
Fang H.H.P. ( 1 990) Aerobic treatment of dairy wastewater. Biotechnology Techniques,
4(1), 1 -4 .
Fang H.H.P. ( 1 99 1 ) Treatment of wastewater from a whey processing plant using
activated sludge and anaerobic processes. J Dairy Sci., 74, 20 1 5-20 1 9.

343
Foot R.l. ( 1 992) The effects of process control parameters on the composition and
stabil ity of activated sludge. Journal lWEM, 6, 2 1 5-228 .
Forster C.F. ( 1 992) Oils fats and greases i n wastewater treatment. I n ' Mini review
compilation - biodegradation and biotransformation of oils and fats . ' J/ Chem. Tech.
Biotechnol., 55, 397-4 1 4.
Gaudy A.F., Rozich A.F., Gamiewski S . , Moran N.R., Ekambaram A. ( 1 987)
Methodology for utilizing respirometric data to assess biodegradation kinetics. Proc.
42nd Industrial Waste Conference, Purdue University, West Lafayette, IN, USA. 573-
584.
Gerber A. , Mostert E.S . , Winter e.T., de Villiers R.H. ( 1 987) Interaction be teen
phosphate, nitrate and organic substrate in biological nutrient removal processes. Water
Sci. Techno!. , 19(1I2}, 1 83 - 1 94.
Germirli F . , Orhon D. and Artan N. ( 1 99 1 ) Assessment of initial inert soluble COD in
industrial wastes. Water Sci. Techno!. , 23, 1 077- 1 086.
Goronszy M.e., Eckenfelder W.W., Cevallos lE. ( 1 985) Sludge bulking control for
highly degradable wastewaters using the cyclic activated sludge system. Proc. 40th
Industrial Waste Conference, Purdue University, West Lafayette, IN, USA. pp 3 73 -38 1 .
Goronszy M.C., Eckenfelder W. W. ( 1 986) Floc-loading biosorption criteria for the
treatment of carbohydrate wastewaters. Proc. 41 st Industrial Waste Conference, Purdue
University, West Lafayette, IN, USA. pp 37-47.
Grady c.P.L. and Philbrook D.M. ( 1 984) Discussion of: Detennination of kinetic
constants of activated sludge microorganisms. Water Sci. Technol. , 1 7(Amsterdam},
1 275- 1 279.

344
Grady c.P.L . , Dang 1. S . , Harvey D.M. Jobaggy A. and Wang X.L. ( 1 989)
Determination of biodegradation kinetics through the use of electrolytic respirometry.
Waler Sci. Techno!. , 2 1 (Brighton), 957-968 .
Grady c.P .L . , Barth F.S, . and Barbeau D.S. ( 1 996) Variability in kinetic parameJer
estimates: A review of proposed causes and a proposed terminology. Water Research,
30(3), 742-748.
Grau P. , Dohanyos M. and Chudoba 1. ( 1 975) Kinetics of multicomponent substrate
removal by activated sludge. Water Research, 9, 63 7-642.
Gujer W. and Kappeler 1. ( 1 992) Modell ing population dynamics in activated sludge
systems. Water Science and Technology, 25(6), 93- 1 03 .
Harremoes P. and Sinkjaer O . ( 1 995) Kinetic interpretation of nitrogen removal in pilot
scale experiments. Water Research, 29(3), 899-905.
Henze M. ( 1 99 1 ) Capabilities of biological nitrogen removal processes from
wastewater. Water Science and Technology, 23, 669-679.
Henze M. ( 1 992) Characterisation of wastewater for modelling of activated sludge
processes. Water Sci. Techno!. , 25(6), 1 - 1 5 .
Henze M., Grady C.P.L.Jr. , Gujer W., Marais G.v.R., Matsuo T. ( 1 987) Activated
Sludge Model No. 1 . fA WP RC Scientific and Technical Report No. 1 , IA WPRC, London.
Henze M., Gujer W., Mino T. , Matsuo T., Wentzel M. and Marais G.v.R. ( 1 995)
Activated Sludge Model No.2. fA WQ Scientific and Technical Report No. 1 , IA WQ,
London.
Henze M., Dupont R., Grau P. and De La Sota A. ( 1 993) Rising sludge in secondary
clarifiers due to denitrification. Water Research, 27(2), 23 1 -236.

345
Henze M., Holm Kristensen G. and Strube R. ( 1 994) Rate-capacity characterization of
wastewater for nutrient removal processes. Water Science and Technology, 29(7), 1 0 1 -
1 07 .
Henze M. and Mladenovski C. ( 1 99 1 ) Hydrolysis of particulate substrat;e by actiyated
sludge under aerobic, anaoxic and anaerobic conditions. Water Research,25(1), 6 1 -64.
Hoffman H. ( 1 987) Influence of oxic and anoxic mixing zones in compartment systems
on substrate removal and sludge characteristics in activated sludge plants. Water Sci.
Techno!. , 19(Rio), 897-9 1 0.
Honer C. ( 1 992) Plugging the drain. Dairy Field, 9, 26-35 .
Houtmeyers l . , Van den Eynde E . , Poffe, R . and Verachtert, H. ( 1 980) Relations
between substrate feeding pattern and development of filamentous bacteria in activated
sludge processes: Part 1. Influence of process parameters. Applied Microbiology and
Biotechnology, 9, 63-77.
Hultman B., Lowen M., Karlsson u., Li P.H. and Molina L. ( 1 99 1 ) Prediction 9f
activated sludge sedimentation based on sludge indices. Water Sci. Tech. , 24(7), 33-42.
Hung Y-T. ( 1 984) Batch reactor activated sludge treatment of milk processmg
wastewaters, Process Biochemistry, 2, 25-28.
IDF ( 1 985) Nutrient sources in dairy effluent: (Phosphorus & Nitrogen) Elimination
and treatment. International Dairy Federation Bulletin, 185.
Isaacs S . , Hansen l.A., Schmidt K. and Henze M. ( 1 995) Examination of the Activated
Sludge Model No.2 with an alternating process. Water Sci. Technol. ,31 (2), 55-66.

/
346
[saacs S .H and Henze M. ( 1 995) Controlled carbon source addition to an alternating
.1itrification - denitrification wastewater treatment process including biological P
.·emoval. Water Research, 29(1), 77-89.
fenkins D., Richard M.G. and Daigger G.T. ( 1 993) A1anual on the causes and contlpl
)f activated sludge bulking and foaming (2nd edition) Lewis Publishers, USA.
ring S .R., Benefield L.D. and Hill W.E. ( 1 992) Observations relating to enhanced
Jhosphorus removal in biological systems. Water Research, 26(2), 2 1 3-233 .
Tones H.R ( 1 974) Pollution control in the Dairy Industry. Noyes Data Corp.
iorand F., Zartarian F., Thomas F . , Block le., Bottero lY., Villemin G., Urbain V . ,
md Manem 1 . ( 1 995) Chemical and structural (2D) linkage between bacteria within
lctivated sludge flocs. Water Research, 29(7), 1 639- 1 647.
(ampfer P., Diethelm W., Detlef H. and Dott W. ( 1 995) Growth requirements of
·jlamentous bacteria isolated from bulking and scumming sludge. Water Research,
19(6), 1 585- 1 588.
Zappeler 1. and Gujer W. ( 1 992) .Estimation of kinetic parameters of heterotrophic
'Jiomass under aerobic conditions and characterisation of wastewater for activated
;;ludge modelling. Water Sci. Techno!. , 25(6), 1 25-1 39.
Kavanaugh R.G and Randall C. W. ( 1 994) Bacterial populations In a biological
lutrient removal plant. Water Sci. Techno!. , 29(7), 25-34.
Kerrn-Jespersen J.P. and Henze M. ( 1 993) Biological phosphorus uptake under anoxic
md aerobic conditions. Water Research, 29(4), 6 1 7-624.
Kilani 1.S. ( 1 993) A compatibility study of the effects of dairy and brewery effluents
on the treatability of domestic sewage. Water SA, 19(3), 247-252.
' ..

347
Knight G.c., Seviour RJ., Soddell lA., McDonnell S. and Bayly R.C. ( 1 995)
Metabolic variation among strains of Acinetobacter isolated from activated sludge.
Water Research, 29(9), 208 1 -2084.
Kohno T., Yoshina K. and Satah S. ( 1 99 1 ) The roles of intracel lular omanic storage
materials in the selection of microorganisms in activated sludge. Water Sci. and
Technol., 23(Kyoto), 8 89-898.
La Trobe University ( 1 993) A Course in the Identification of Filamentous Bacteria in
Activated Sludge. Biotechnology Research Centre, La Trobe University, Bendigo,
Australia.
Lee S .E, Koopman B.L . , Jenkins D. and Lewi s R.F. ( 1 982) The effect of aeration basin
configuration on activated sludge bulking at low organic loading. Water Sci. & Technol. , 14, 407-427.
Lie E. and Welander T. ( 1 994) Influence of dissolved oxygen and oxygen-reduction
potential on the dentirification rate of activated sludge. Water Science and Technology,
30(6), 9 1 - 1 00.
Linne S.R. and Chiesa S.c. ( 1 987) Operational variables affecting performance of the
selector complete mixactivated sludge plant. Journal WPCF, 59(7), 7 1 6-72 1 .
Linne S .R., Chiesa S.c., Rieth M.G. and Polta R.C. ( 1 989) The impact of selector
operation on activated sludge settleability and nitrification: Pilot scale results. Journal
WPCF, 6 1(1), 220-226.
Madoni P., Donatella D. and Chierici E. ( 1 993) Comparative analysis of the activated
sludge microfauna in several sewage treatment works. Water Research, 27(9), 1 485-
1 49 1 .

348
Mamais D., lemkins D. and Pitt P. ( 1 993) A rapid physical-chemical method for the
determination of readily biodegradable soluble COD in municipal wastewaters. Water
Research, 27(1) , 1 95- 1 97.
Marshall K.R.and HaIver W.J. ( 1 984) The treatment of wastes from the dairy industQ·.
In Surveys In Industrial Wastewater Treatment Vol 1 : Food and Allied Industries.
Barnes, D., Forster, C.F, and Hrudey S .E. (eds), Pitman Publishing Limited, London,
296 -376.
Marshall R.B . , Wilton B .E. and Robinson A.J . ( 1 98 1 ) Identification of Leptospira
serovars by restriction endonuclease analysis. Journal of Medical Microbiology, 14,
1 63- 1 66 .
McCl intock S .A . , Randall C.W. and Pattarkine Y.M. ( 1 993) Effects of temperature and
mean cell residence time on biological nutrient removal processes. Water Environment
Research, 65(2), 1 1 0- 1 1 8 .
Metcalf & Eddy, Inc ( 1 99 1 ) Wastewater Engineering, Treatment, Disposal and Reuse.
(3rd edition) McGraw-Hill Inc. S ingapore.
Middlebrooks E. J. ( 1 979) Industrial Pollution Control, Volume 1: Agro-Industries.
John Wiley and Sons, New York.
Mino T., Satoh H. and Matsuo T. ( 1 994) Metabolisms of different bacterial populations
in enhanced biological phosphate removal processes. Water Science and Technology,
29(7), 67-70.
Mino T., Liu W-T., Futoshi K and Matsuo T. ( 1 995) Modelling glycogen storage and
denitrification capability of micoorganisms in enhanced biological phosphate removal
processes. Water Science and Technology, 31(2), 25-34.

349
Munch E.V. , Lant P., and Kel ler 1 . ( 1 996) Simultaneous nitrification and denitrification
in bench-scale sequencing batch reactors. Water Research, 30(2), 27 7-284.
Novak L., Larrea L . and Wanner 1 . ( 1 995) Mathematical model for soluble
carbonaceous substrate absorption . Wafer Science and Technology, 3 1 (2) , ,07-77.
Nowak 0. , Svardal K. and Schweighofer P. ( 1 995) The dynamic behaviour of nitrifying
activated sludge systems influenced by inhibiting wastewater compounds. Water Sci.
Techno!. , 3 1 (2), 1 1 5 - 1 24.
NZ Dairy Board ( 1 995). Daily Facts and Figures 1994/95. New Zealand Dairy Board,
Well ington, New Zealand .
NZ Dairy Industry Standard Chemical Methods Laboratory Manual, NZTM3 ( 1 993)
NZ Dairy Board, Well ington. Section 1 5 .0.
Orhon D., Gorgun E., Germirli F., Artan N. ( 1 993) Biological treatability of dairy
wastewaters. Water Research, 27(4), 625-633 .
Palm J.e., Jenkins D., Parker D.S. ( 1 980) Relationship between organic loading,
dissolved oxygen concentration and sludge settleabil ity in the completely mixed
activated sludge process. Journal WPCF, 52(10), 2484 - 2506.
Patoczka 1. and Eckenfelder W.W. ( 1990) Performance and design of a selector for
filamentous bulking control . Journal WPCF, 62(2), 1 5 1 - 1 59 .
Patoczka 1. and Eckenfelder W.W. ( 1 99 1 ) Performance and design of a selector for
bulking control . Water Science and Technology, 24(7), 9- 1 9.
.
Peil K.M. and Gaudy, A.F. ( 1 97 1 ) Kinetic constants · for aerobic growth o f microbial
populations selected with various single compounds and with municipal wastes as
substrates. Applied Microbiology, 2(2), 253-256.

,
3 50
Pujol R. and Canler J.P. ( 1 992) Biosorption and dynamics of bacterial populations in
activated sludge. Water Research, 26(2), 209 - 2 1 2 .
Pujol R. and Canler lP. ( 1 994) Contact zone: French practice with low FIM bulking
control. Water Sci. Techno!. , 29(7), 22 1 - 228.
Rensink lH. ( 1 974) New approach to preventing bulking sludge. Journal WPCF,
46(8), 1 888- 1 894.
Rensink J.R. and Donker H.G.l W. ( 1 990) Control of bulking sludge in agro-industrial
treatment plants. Water Sci. Techno!. , 22(9), 1 0 1 - 1 1 1 .
Rensink lR. and Donker H.G.J.W. ( 1 99 1 ) The effect of contact tank operation on
bulking sludge and biosorption processes. Water Sci. Techno!. , 23, 857-866.
Richard M.G., S himizu G.P. and Jenkins D. ( 1 985) The growth physiology of the
filamentous organism Type 02 1N and its significance to activated sludge bulking.
Journal WPCF, 57(12), 1 1 52- 1 1 62.
Russell J . ( 1 996) NZ Dairy Research Institute, Palmerston North, NZ; pers. comm . .
Salameh M.F and Malina J.F. ( 1 989) The effects of sludge age and reactor
configuration on the control of filamentous bulking in the activated sludge process .
Journal WPCF, 61(9), 1 5 1 0- 1 562.
Salvado H. and Gracia M.P. ( 1 993) Determination of organic loading rate of activated
sludge plants based on protozoan analysis. Water Research, 27(5), 8 9 1 -895 .
Salvado H., Gracia M.P. and Amigo J.M. ( 1 995) Capability of ciliated protozoa as
indicators of effluent quality in activated sludge plants. Water Research, 29(4), 1 04 1 -·
1 050.

3 5 1
Shao Y-J. and Jenkins D . ( 1 989) The use of anoxic selectors for the control o f low F/M
activated sludge bUlking. Water Sci. Technol. , 2 1 , 609-6 1 9 .
Siegrist H. and Gujer W. ( 1 994) Nitrogen removal in activated sludge systems
includ ing denitrification in secondary clarifiers. Water Sci. Tee/mol. , 30(6)� 1 0 1 - 1 1 1 .
Siegrist H. , Krebs P. , Buhler R. , Purtschert I . , Rock C. and Rufer R. ( 1 995)
Denitrification in secondary clarifiers. Water Sci. Techno!. , 31(2), 205-2 1 4 .
Sollfrank, U . and Guj er, W . ( 1 99 1 ) Characterisation o f domestic wastewater for
mathematical modelling of the activated sludge process. Water Sci. Techno!. , 23, 1 057-
1 066.
Sorm R. , Bortone G. , Saltarelli R., Jenicek P., Wanner 1. and Tilche A. ( 1 996)
Phosphate uptake under anoxic conditions and fixed film nitrification in nutrient
removal activated sludge system. Water Research, 30(7), 1 573- 1 584.
Stenstrom M.K. and Song S.S. ( 1 99 1 ) Effects of oxygen transport l imitation on
nitrification in the activated sludge process. Research Journal WPCF, 63(3), 2 08-2 1 9 . .
Stevens N.C.A. and Elkin D.J. ( 1 984) Energy aspects of dairy waste treatment. IDF
Bulletin, 184, 80-85.
Strom P.F. and Jenkins D. ( 1 984) Identificiation and significance of filamentous
microorganisms in activated sludge. Journal WPCF, 56(5), 449 - 459.
Strydom J.P. , Mostert J .F. and Britz T.1. ( 1 993) Effluent production and d isposal in the
South African dairy industry: a postal survey. Water SA,1 9(3), 253-258 .
. Surucu G. and Cetin F.D. ( 1 989) Effect of temperature, pH and DO concentration on
filterability and compressibility of activated sludge. Water Research, 23(1 1) , 1 389-
1 395.

352
Surucu G. and Cetin F.D. ( 1 990) Effects of temperature, pH and DO concentration on
the settleability of activated sludge. Environmental Technology, 1 1 , 205-2 1 2.
Suwa Y, Suzuki T. , Toyohara H., Yamagishi T. and Urushigawa Y ( 1 992) Single
stage, single-sludge nitrogen removal by an activated sludge process with cross-flq.\\'
filtration. WaterResearch, 26(9), 1 1 49- 1 1 57.
Szpyrkowicz L and Zilio-Grandi F ( 1 995a) Phosphorus removal in a Phostrip process -
I . Two years' plant performance. Water Research, 29(10), 23 1 8-2326 .
Szpyrkowicz L and Zil io-Grandi F ( 1 995b) Phosphorus removal in a Phostrip process
-II. Phosphorus fractionation and sludge microbiology during start-up. Water Research,
29(10), 2327-23 38 .
Tetreault M.J . , Benedict A .H. Kaempfer C. and Barth E.F. ( 1 986) Biological
phosphorus removal : A technology evaluation. Journal WPCF , 58(8), 823-837 .
Ubukata Y. and Takii S . ( 1 994) Induction ability of excess phosphate accumulation for
phosphate removing bacteria. Water Research, 28(1), 247-249.
Urbain V. , Block J.C. and Manem J. ( 1 993) Bioflocculation in activated sludge: an
analytical approach. Water Research, 27(5), 829-838 .
Van den Eynde E. , Vriens L . and Verachtert H. ( 1 982) Relation between feeding
pattern and development of filamentous bacteria in activated sludge processes. Part III.
Applications with industrial waste waters. European J Appl. Microbiol. Biotechnol. ,
15, 246-25 1 .
Van den Eynde E. , Geerts J., Maes B . and Verachtert H . ( 1 983) Influence of the
feeding pattern on the glucose metabol ism of Arthrobacter sp. and Sphaerotilus natans
growing in chemostat culture, simulating �ctivated sludge bulking. European J Appl.
Microbiol. Biotechnol. , 17, 35-43 .

3 5 3
Van den Eynde E., Vriens L., D e Cuyper P . and Verachtert H. ( 1 984a) P lug flow
simulating and completely mixed reactors with a premixing tank, in the control of
filamentous bulking. Appl. Microbiol. Biotechnol. , 19, 288-295.
Van den Eynde E . , Vriens L., \\\ants M. and Verachtert H .· ( 1 984p) Transient
behaviour and time aspects of intermittently and continuously fed bacterial cultures
with regard to fi lamentous bulking of activated sludge. Appl. Microbiol. Biotechnol. ,
1 9, 44-52.
van Neikerk A., Jenkins D. and Richard M.G. ( 1 987a) Application of batch kinetic data
to the sizing of continuous flow activated sludge reactors. Water Sci. Technol.,
1 9(Rio), 505-5 1 6.
van Neikerk A., Richard M.G. and Jenkins D. ( 1 987b) The competitive growth of
Zooglea ramigera and Type 02 1 N in activated sludge and pure culture - A model for
low F/M bulking. Journal WPCF., 59, 262.
van Niekerk A.M., Jenkins D. and Richard M.G. ( 1 988) A mathematical model of the
carbon-limited growth of filamentous and floc forming organisms in low FIM sludge.
Journal WPCF, 60(1), 1 00- 1 06.
Verachtert H., Van den Eynde E., Poffe R. and Houtmeyers J. ( 1 980) Relations
between substrate feeding pattern and development of filamentous bacteria in activated
sludge processes: Part II. Influence of substrate present in the influent. Applied
Microbiology and Biotechnology, 9, 1 37- 1 49.
Walstra P. and Jenness R. ( 1 984) Dairy Chemistry and Physics. Wiley, New York,
USA.
Wanner 1. ( 1 994) The implementation of bulking control in the design of activated
sludge systems. Water Science and Technology, 29(7), 1 93-202.

354
Wanner J. , Chudoba J. , Kucman K. and Proske L. ( 1 987) Control of activated sludge
filamentous bulking - VII . Effect of anoxic conditions. Water Research, 21(12), 1 447-
1 45 1 .
Wanner J. and Grau P. ( 1 989) Identification of filamentous micro-organisms frq.m
activated sludge: a compromise between wishes, needs and responsibilities. Water
Research, 23(7), 883-89 1 .
Wanner J. and Novak L. ( 1 990) The influence of a particulate substrate on filamentous
bulking and phosphorus removal in activated sludge systems. Water Research, 24(5),
573-58 1 .
Wentzel M.e. , Ekama G.A. and Marais GvR. ( 1 992) Processes and modelling of
nitrification denitrification biological excess phosphorus removal systems - a review.
Water Science and Technology, 25(6), 59-82.
Williamson K.J. ( 1 985) Rapid measurement of Monod half-velocity co-efficients for
bacterial kinetics. Biotechnology and Bioengineering, 17, 9 1 5-924.
Wong-Chong G.M. and Loehr R.C. ( 1 975) The kinetics of microbial nitrifi cation.
Water Research (9), 1 099- 1 1 06.
WPCF ( 1 990) Wastewater Biology: The Microlife. WPCF Special Publication,
Alexandria, V A, USA.
Yeoman S, Hunter M, Stephenson T, Lester IN. and Perry R. ( 1 988a) An assessment of
excess biological phosphorus removal during activated sludge treatment. Environmental
Technology Letters, 9, 637-646.
Yeoman S., Stephenson T., Lester J. N. and Perry R. ( 1 988b) The ' removal of
phosphorus during wastewater treatment: A review. Environmental Pollution, 49, 1 83-
233 .

355
Zhang T.e. and B ishop P. L . ( 1 996) Evaluation of substrate and pH effects In a
nitrifying biofilm. Water Environment Research, 68(7), 1 1 07- 1 1 1 5 .

Related Documents