Assessment of the status, service delivery infrastructure and governance of drinking water supply in small and medium towns WaterAid/Prashanth Vishwanathan Kanker, Chhattisgarh August 2020

Welcome message from author
This document is posted to help you gain knowledge. Please leave a comment to let me know what you think about it! Share it to your friends and learn new things together.
Transcript
Assessment of the status, service delivery infrastructure and governance of drinking water supply in small and medium towns
WaterAid/Prashanth Vishwanathan
Kanker, Chhattisgarh
August 2020
Assessment of the status, service delivery infrastructure and governance of drinking water supply in small and medium towns
2
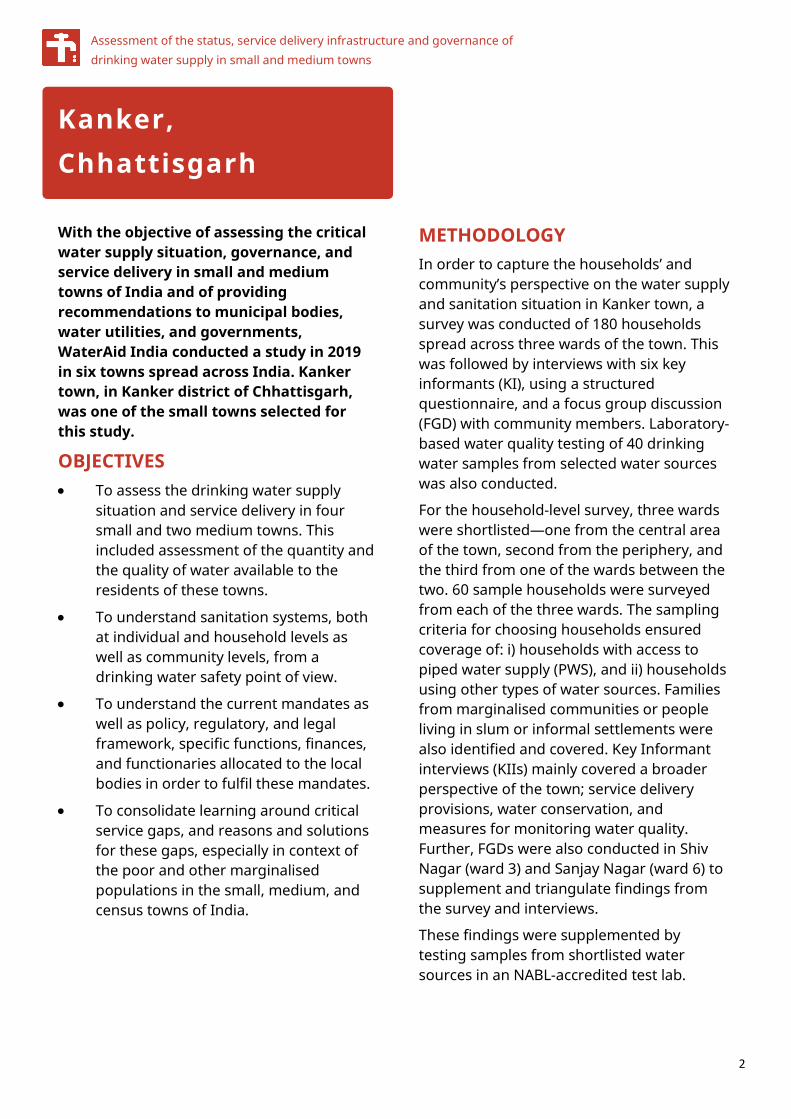
With the objective of assessing the critical water supply situation, governance, and service delivery in small and medium towns of India and of providing recommendations to municipal bodies, water utilities, and governments, WaterAid India conducted a study in 2019 in six towns spread across India. Kanker town, in Kanker district of Chhattisgarh, was one of the small towns selected for this study.
OBJECTIVES • To assess the drinking water supply
situation and service delivery in four small and two medium towns. This included assessment of the quantity and the quality of water available to the residents of these towns.
• To understand sanitation systems, both at individual and household levels as well as community levels, from a drinking water safety point of view.
• To understand the current mandates as well as policy, regulatory, and legal framework, specific functions, finances, and functionaries allocated to the local bodies in order to fulfil these mandates.
• To consolidate learning around critical service gaps, and reasons and solutions for these gaps, especially in context of the poor and other marginalised populations in the small, medium, and census towns of India.
METHODOLOGY In order to capture the households’ and community’s perspective on the water supply and sanitation situation in Kanker town, a survey was conducted of 180 households spread across three wards of the town. This was followed by interviews with six key informants (KI), using a structured questionnaire, and a focus group discussion (FGD) with community members. Laboratory-based water quality testing of 40 drinking water samples from selected water sources was also conducted.
For the household-level survey, three wards were shortlisted—one from the central area of the town, second from the periphery, and the third from one of the wards between the two. 60 sample households were surveyed from each of the three wards. The sampling criteria for choosing households ensured coverage of: i) households with access to piped water supply (PWS), and ii) households using other types of water sources. Families from marginalised communities or people living in slum or informal settlements were also identified and covered. Key Informant interviews (KIIs) mainly covered a broader perspective of the town; service delivery provisions, water conservation, and measures for monitoring water quality. Further, FGDs were also conducted in Shiv Nagar (ward 3) and Sanjay Nagar (ward 6) to supplement and triangulate findings from the survey and interviews.
These findings were supplemented by testing samples from shortlisted water sources in an NABL-accredited test lab.
Kanker, Chhattisgarh

Kanker, Chhattisgarh
3
40 such samples (28 source, and 12 user-level samples) were tested as part of the study. The criteria for short listing water source samples for testing included:
• Samples from each type of drinking water source, including individual households, public water points, and PWS.
• Samples from water sources at varying ground level depths ranging from a hand pump at 50ft to a submersible pump at 120ft and deep boring at a depth of 250ft.
• Samples collected from different locations that present a mix of potentially safe and unsafe sanitary sites.
The entire study was conducted between September and November 2019.
BACKGROUND Policies and regulations for urban water supply and management in Chhattisgarh
Chhattisgarh is the eighth lowest urbanised state of India with an urban population of 23.24 per cent. As per Census 2011, the state has 182 towns (97 in 2001), 168 statutory towns (75 in 2001), and 14 census towns (22 in 2001). There are ten municipal corporations, 32 municipal councils, and 126 nagar panchayats, with a total urban population of 59,36,538. The top seven urban centres in the state are Raipur, Durg, Bhilai, Bilaspur, Korba, Rajnandgaon, and Raigarh1.
Provision of urban services and maintenance of public assets is mainly the responsibility of the Urban Local Bodies (ULBs) made up by municipal corporations, municipalities (nagar palikas), and nagar panchayats. Data from the service-level benchmarking (SLB) carried out by the Ministry of Urban Development, Government of India, for 43 cities and towns in the state shows significant deficit in terms of service levels for water supply, sewerage, solid waste management, and storm water drainage2. For example, water supply delivery typically ranges from two to four hours3.
The SLB data is indicative of the fact that urban agglomerations in Chhattisgarh face the typical problems that plague ULBs elsewhere in India as well—inadequate operations and maintenance (O&M) budgets to run water treatment plants, lack of staff both at the managerial and technical levels to manage the water supply system, and inadequately trained staff ill equipped in modern water utility management and operational techniques. Insufficient revenue is generated from water sales to assist with O&M costs. In the absence of a metered supply, it is difficult to charge commercial and high users of water, and there is no incentive to stop people from wasting water. The extent of non-revenue water (NRW) in the state is as high as 50 per cent, which is also a major issue4.
1 http://cgclimatechange.com/urban-development/ 2 ibid 3 ibid 4 https://pas.org.in/Portal/document/ResourcesFiles/pdfs/Chhattisgarh%20Databook_2015-16.pdf
Assessment of the status, service delivery infrastructure and governance of drinking water supply in small and medium towns
4
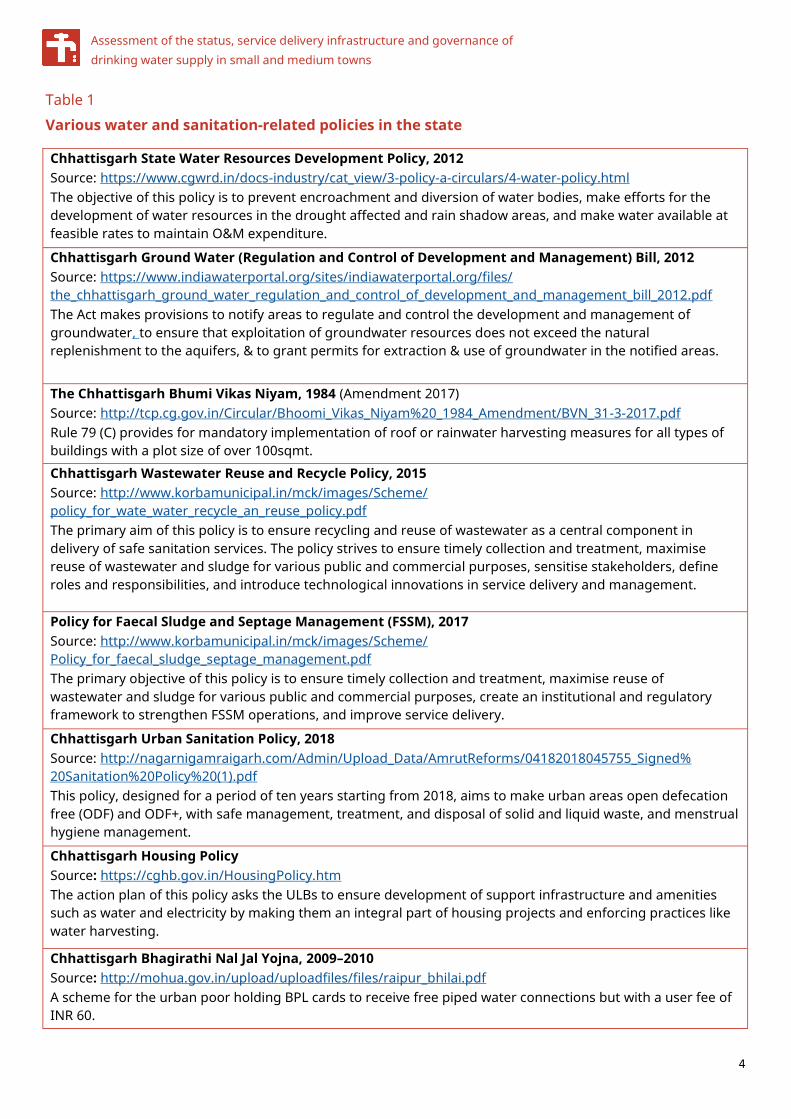
Table 1
Various water and sanitation-related policies in the state
Chhattisgarh State Water Resources Development Policy, 2012 Source: https://www.cgwrd.in/docs-industry/cat_view/3-policy-a-circulars/4-water-policy.html The objective of this policy is to prevent encroachment and diversion of water bodies, make efforts for the development of water resources in the drought affected and rain shadow areas, and make water available at feasible rates to maintain O&M expenditure.
Chhattisgarh Ground Water (Regulation and Control of Development and Management) Bill, 2012 Source: https://www.indiawaterportal.org/sites/indiawaterportal.org/files/the_chhattisgarh_ground_water_regulation_and_control_of_development_and_management_bill_2012.pdf The Act makes provisions to notify areas to regulate and control the development and management of groundwater, to ensure that exploitation of groundwater resources does not exceed the natural replenishment to the aquifers, & to grant permits for extraction & use of groundwater in the notified areas.
The Chhattisgarh Bhumi Vikas Niyam, 1984 (Amendment 2017) Source: http://tcp.cg.gov.in/Circular/Bhoomi_Vikas_Niyam%20_1984_Amendment/BVN_31-3-2017.pdf Rule 79 (C) provides for mandatory implementation of roof or rainwater harvesting measures for all types of buildings with a plot size of over 100sqmt.
Chhattisgarh Wastewater Reuse and Recycle Policy, 2015 Source: http://www.korbamunicipal.in/mck/images/Scheme/policy_for_wate_water_recycle_an_reuse_policy.pdf The primary aim of this policy is to ensure recycling and reuse of wastewater as a central component in delivery of safe sanitation services. The policy strives to ensure timely collection and treatment, maximise reuse of wastewater and sludge for various public and commercial purposes, sensitise stakeholders, define roles and responsibilities, and introduce technological innovations in service delivery and management.
Policy for Faecal Sludge and Septage Management (FSSM), 2017 Source: http://www.korbamunicipal.in/mck/images/Scheme/Policy_for_faecal_sludge_septage_management.pdf The primary objective of this policy is to ensure timely collection and treatment, maximise reuse of wastewater and sludge for various public and commercial purposes, create an institutional and regulatory framework to strengthen FSSM operations, and improve service delivery.
Chhattisgarh Urban Sanitation Policy, 2018 Source: http://nagarnigamraigarh.com/Admin/Upload_Data/AmrutReforms/04182018045755_Signed%20Sanitation%20Policy%20(1).pdf This policy, designed for a period of ten years starting from 2018, aims to make urban areas open defecation free (ODF) and ODF+, with safe management, treatment, and disposal of solid and liquid waste, and menstrual hygiene management.
Chhattisgarh Housing Policy Source: https://cghb.gov.in/HousingPolicy.htm The action plan of this policy asks the ULBs to ensure development of support infrastructure and amenities such as water and electricity by making them an integral part of housing projects and enforcing practices like water harvesting.
Chhattisgarh Bhagirathi Nal Jal Yojna, 2009–2010 Source: http://mohua.gov.in/upload/uploadfiles/files/raipur_bhilai.pdf A scheme for the urban poor holding BPL cards to receive free piped water connections but with a user fee of INR 60.

Kanker, Chhattisgarh
5
FINDINGS OF THE STUDY Introduction to Kanker town
Kanker town is the headquarters of Kanker district in the state of Chhattisgarh. The town was designated as a municipality or nagar palika in the year 1912 but was constitutionally recognised in 1956. According to Census 2011, Kanker has a population of about 27,541 with 6,429 households; therefore, it can be classified under the category of a small town.
Currently, the town is divided into 21 municipal wards spread over 24sqkm. Reportedly there are five notified slums as well. Recent reports estimate the current population at 33,900 with 7,181 households6.
Water supply arrangements Kanker is primarily dependent on groundwater for meeting its water supply needs through sources like piped water supply (PWS), public stand posts, bore wells, and hand pumps. Pipelines were laid in the town in the early 1980s. The town is currently supplying piped water to approx. 1,800 households. In 6 wards, water is also supplied through water tankers owned by the nagar parishad. Five wards depend on water tankers only during the summers when water sources dry up. However, Aghan Nagar ward, a hilly area with low water
5 http://tcp.cg.gov.in/index-Eng.html 6 https://pas.org.in/Portal/document/ResourcesFiles/pdfs/Chhattisgarh%20Databook_2015-16.pdf
Key legal frameworks Administrative bodies Numbers5
Chhattisgarh Municipal Corporation Act, 1956 Municipal Corporations 14
Chhattisgarh Municipalities Act, 1961 Municipal Councils/ Nagar Palikas 43
Chhattisgarh Municipalities Act, 1961 Nagar Panchayats 109
Table 2
Legal framework and regulatory bodies as per law
table, is dependent on tankers throughout the year. For poor pockets, tanker water is supplied free of cost, while others are charged INR 600 per tanker of 4,500 litres’. Private tankers are also available and a tanker of the same capacity costs INR 1,000. During periods of water stress, water of two qualities is supplied through a pipeline. Potable water is supplied on alternate days, and regular water for domestic use is supplied daily.
Assessment of the status, service delivery infrastructure and governance of drinking water supply in small and medium towns
6
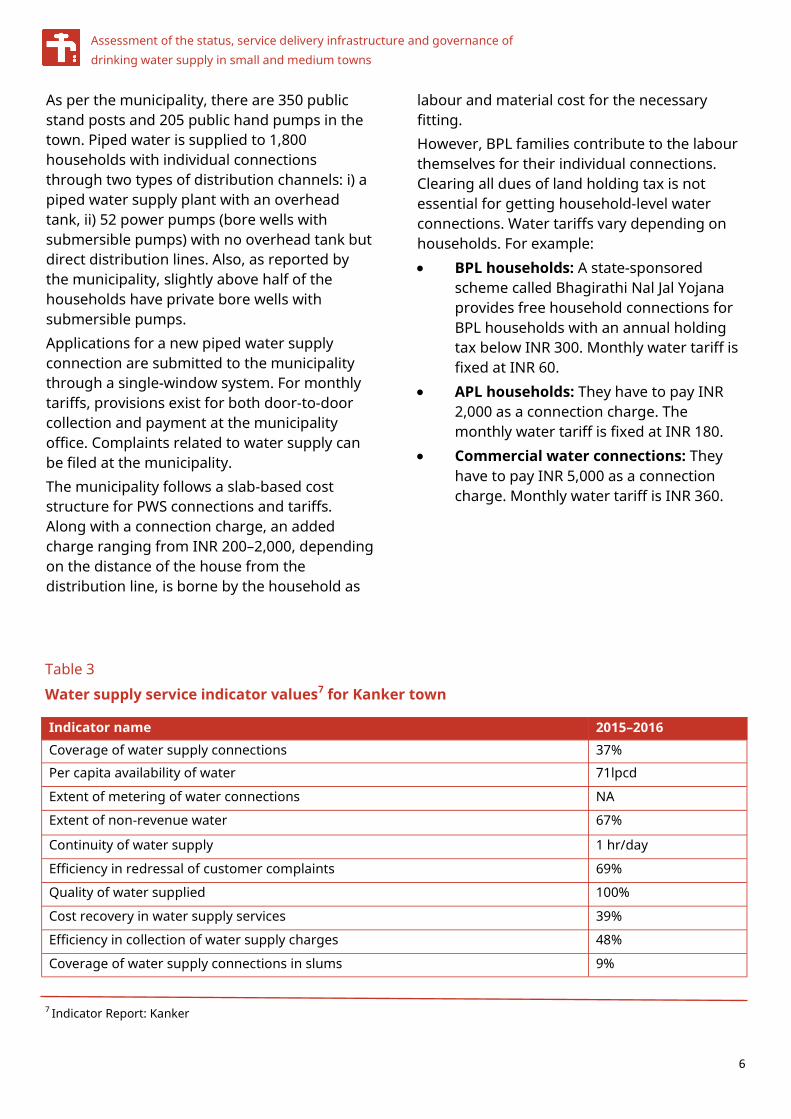
As per the municipality, there are 350 public stand posts and 205 public hand pumps in the town. Piped water is supplied to 1,800 households with individual connections through two types of distribution channels: i) a piped water supply plant with an overhead tank, ii) 52 power pumps (bore wells with submersible pumps) with no overhead tank but direct distribution lines. Also, as reported by the municipality, slightly above half of the households have private bore wells with submersible pumps. Applications for a new piped water supply connection are submitted to the municipality through a single-window system. For monthly tariffs, provisions exist for both door-to-door collection and payment at the municipality office. Complaints related to water supply can be filed at the municipality. The municipality follows a slab-based cost structure for PWS connections and tariffs. Along with a connection charge, an added charge ranging from INR 200–2,000, depending on the distance of the house from the distribution line, is borne by the household as
labour and material cost for the necessary fitting. However, BPL families contribute to the labour themselves for their individual connections. Clearing all dues of land holding tax is not essential for getting household-level water connections. Water tariffs vary depending on households. For example: • BPL households: A state-sponsored
scheme called Bhagirathi Nal Jal Yojana provides free household connections for BPL households with an annual holding tax below INR 300. Monthly water tariff is fixed at INR 60.
• APL households: They have to pay INR 2,000 as a connection charge. The monthly water tariff is fixed at INR 180.
• Commercial water connections: They have to pay INR 5,000 as a connection charge. Monthly water tariff is INR 360.
Indicator name 2015–2016 Coverage of water supply connections 37%
Per capita availability of water 71lpcd
Extent of metering of water connections NA
Extent of non-revenue water 67%
Continuity of water supply 1 hr/day
Efficiency in redressal of customer complaints 69%
Quality of water supplied 100%
Cost recovery in water supply services 39%
Efficiency in collection of water supply charges 48%
Coverage of water supply connections in slums 9%
Table 3
Water supply service indicator values7 for Kanker town
7 Indicator Report: Kanker

Kanker, Chhattisgarh
7
Water service delivery In Kanker, more than half the population is dependent on the public delivery system for meeting its drinking water supply. As revealed in the survey, 34.4 per cent households access water through piped water supply (PWS) with a household connection, 4.4 per cent through public hand pumps and 28.9 per cent through public stand posts. Therefore, a total 67.8 per cent of households have access to water from different public service delivery systems (Graph 1).
Despite the provision of piped water supply in the town since the 1980s, the percentage of households (HH) with individual PWS connection is as low as 34.4 per cent. Not applying for PWS connections can be assigned to reasons like proximity to an alternate water source, the cost associated with taking a fresh connection being as high as INR 2,000 per
household, and unreliable water supply (Graph 2).
An interview with the municipal officer on the grievance redressal mechanism indicated that water supply is restored within 48 hours of breakdown of services. However, meetings with the community brought to light a delay of five to seven days in mending even minor breakdowns. The Public Health Engineering Department (PHED) highlighted a demand–supply mismatch for water services in the town with the per capita demand being as high as 135 litres per capita per day (lpcd) while the supply capacity of the municipality was approximately 65lpcd. The gap was evident from the meagre one-hour supply of water in a day, which was confirmed by almost all the households during the survey (96.7 per cent).
Graph 2
Reasons for lack of access to PWS (n=106)
Graph 1
Public versus private water sources (n=180)
Assessment of the status, service delivery infrastructure and governance of drinking water supply in small and medium towns
8
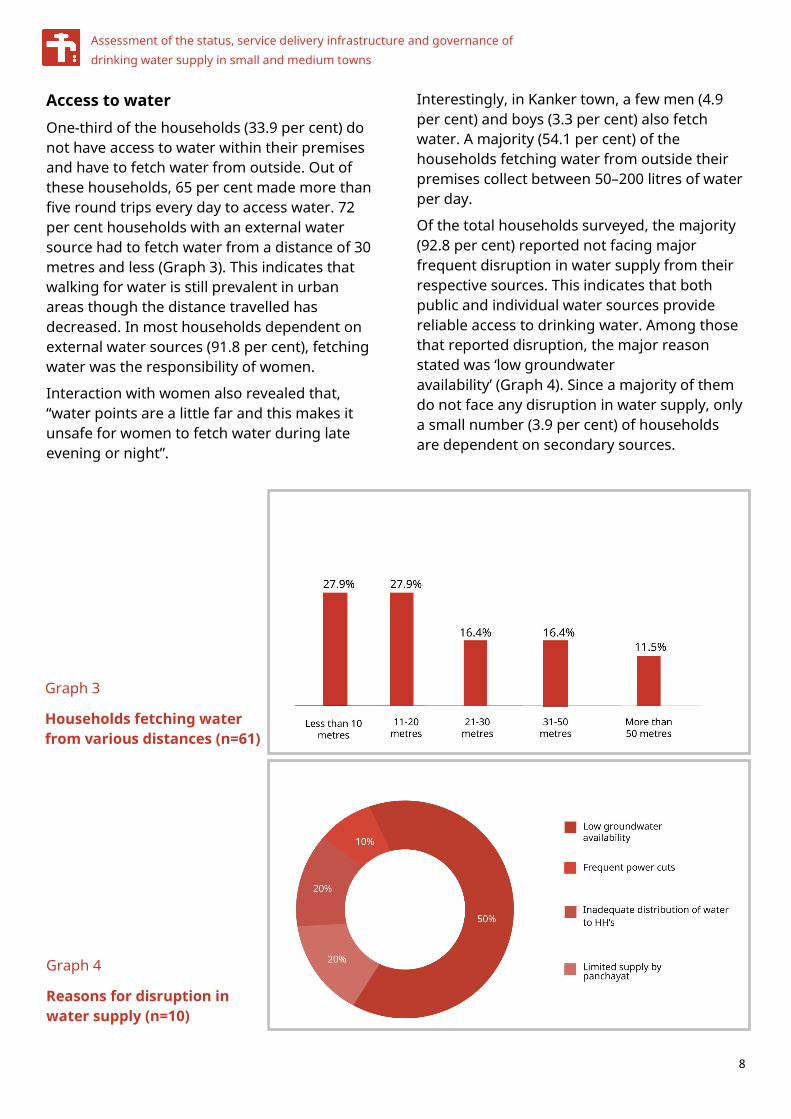
Access to water One-third of the households (33.9 per cent) do not have access to water within their premises and have to fetch water from outside. Out of these households, 65 per cent made more than five round trips every day to access water. 72 per cent households with an external water source had to fetch water from a distance of 30 metres and less (Graph 3). This indicates that walking for water is still prevalent in urban areas though the distance travelled has decreased. In most households dependent on external water sources (91.8 per cent), fetching water was the responsibility of women.
Interaction with women also revealed that, “water points are a little far and this makes it unsafe for women to fetch water during late evening or night”.
Graph 3
Households fetching water from various distances (n=61)
Interestingly, in Kanker town, a few men (4.9 per cent) and boys (3.3 per cent) also fetch water. A majority (54.1 per cent) of the households fetching water from outside their premises collect between 50–200 litres of water per day.
Of the total households surveyed, the majority (92.8 per cent) reported not facing major frequent disruption in water supply from their respective sources. This indicates that both public and individual water sources provide reliable access to drinking water. Among those that reported disruption, the major reason stated was ‘low groundwater availability’ (Graph 4). Since a majority of them do not face any disruption in water supply, only a small number (3.9 per cent) of households are dependent on secondary sources.
Graph 4
Reasons for disruption in water supply (n=10)
Kanker, Chhattisgarh
9
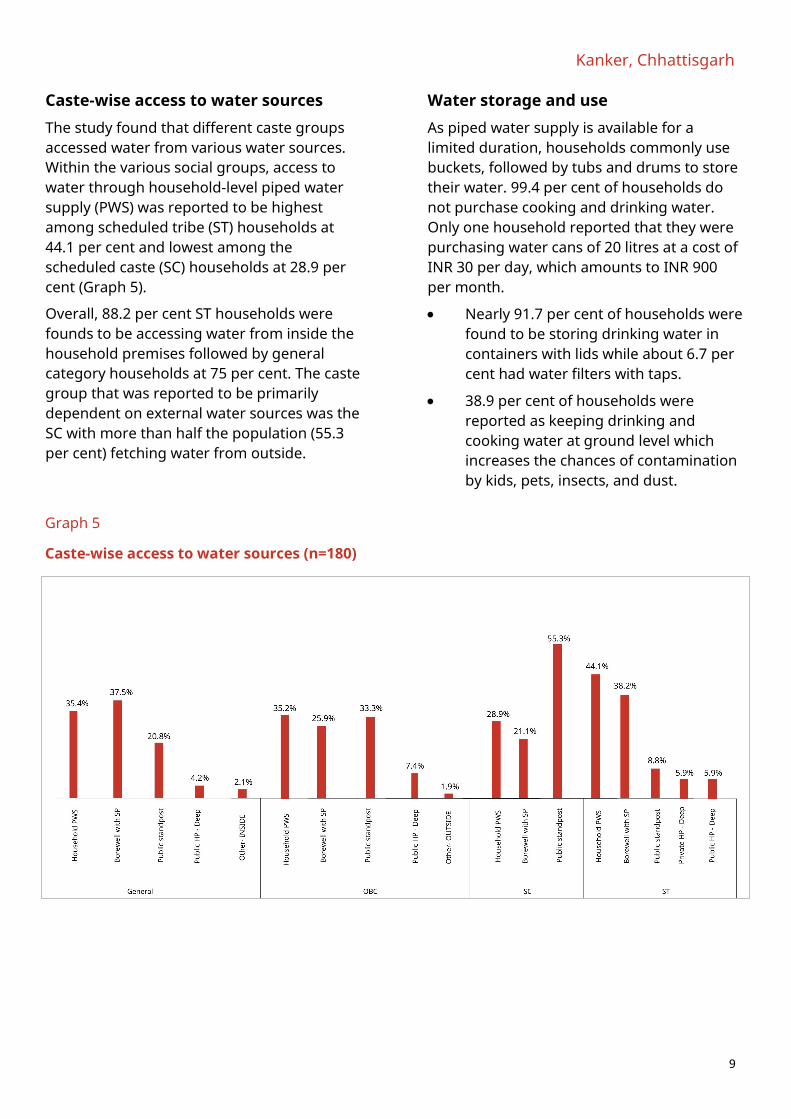
Caste-wise access to water sources The study found that different caste groups accessed water from various water sources. Within the various social groups, access to water through household-level piped water supply (PWS) was reported to be highest among scheduled tribe (ST) households at 44.1 per cent and lowest among the scheduled caste (SC) households at 28.9 per cent (Graph 5).
Overall, 88.2 per cent ST households were founds to be accessing water from inside the household premises followed by general category households at 75 per cent. The caste group that was reported to be primarily dependent on external water sources was the SC with more than half the population (55.3 per cent) fetching water from outside.
Graph 5
Caste-wise access to water sources (n=180)
Water storage and use As piped water supply is available for a limited duration, households commonly use buckets, followed by tubs and drums to store their water. 99.4 per cent of households do not purchase cooking and drinking water. Only one household reported that they were purchasing water cans of 20 litres at a cost of INR 30 per day, which amounts to INR 900 per month.
• Nearly 91.7 per cent of households were found to be storing drinking water in containers with lids while about 6.7 per cent had water filters with taps.
• 38.9 per cent of households were reported as keeping drinking and cooking water at ground level which increases the chances of contamination by kids, pets, insects, and dust.
Assessment of the status, service delivery infrastructure and governance of drinking water supply in small and medium towns
10
• A majority of the households (61.6 per cent) were reported to have poor water handling habits as a non-ladle vessel was used for drawing water from the container.
Water quality monitoring The main piped water supply (PWS) plant at Kanker has a chlorination and filtration unit. In terms of water quality monitoring, PHED officials reported conducting water quality tests of all public hand pumps every six months, i.e., pre and post monsoon. However, local organisations shared that water testing of hand pumps is demand-based and conducted only when health issues are reported. Testing was not being conducted for PWS at either the public or household level. This also emerged in the household survey where 96.1 per cent of the surveyed households confirmed that water quality of their primary water source had not been monitored in the past. Of the households that reported water sample collection, 3.9 per cent shared that the government, private companies, or NGOs did it. However, the results of the samples collected had not been shared with the households.
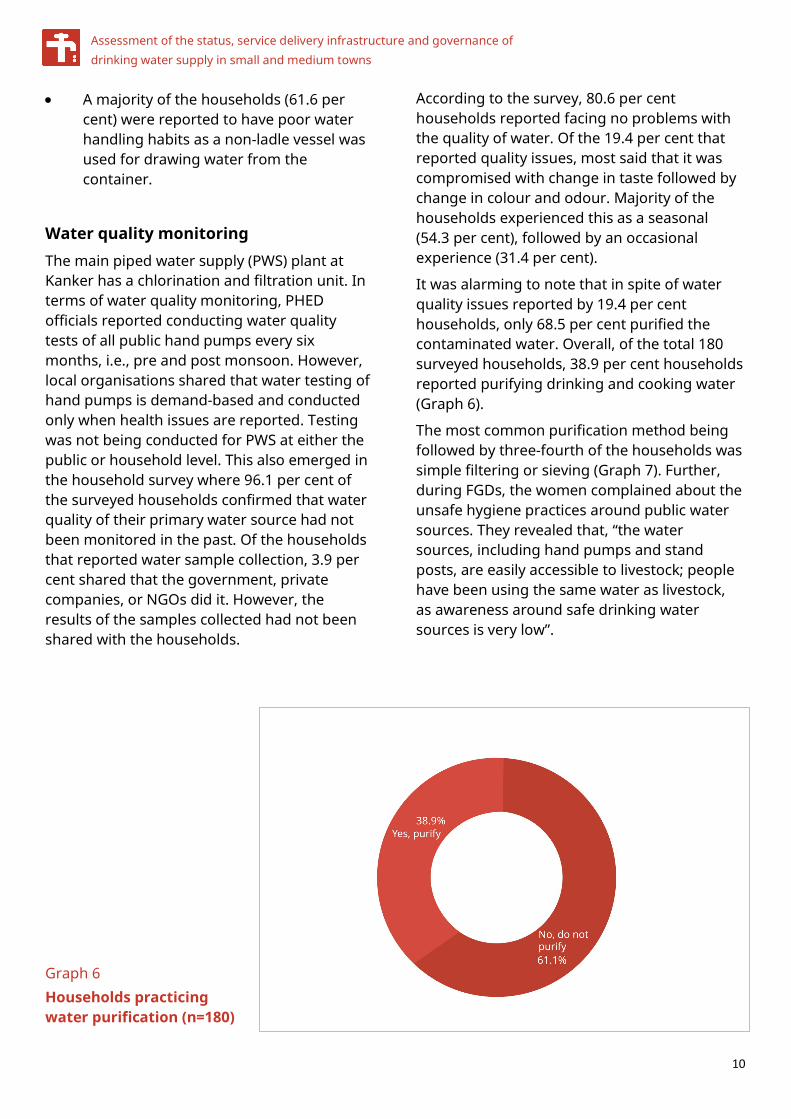
Graph 6 Households practicing water purification (n=180)
According to the survey, 80.6 per cent households reported facing no problems with the quality of water. Of the 19.4 per cent that reported quality issues, most said that it was compromised with change in taste followed by change in colour and odour. Majority of the households experienced this as a seasonal (54.3 per cent), followed by an occasional experience (31.4 per cent).
It was alarming to note that in spite of water quality issues reported by 19.4 per cent households, only 68.5 per cent purified the contaminated water. Overall, of the total 180 surveyed households, 38.9 per cent households reported purifying drinking and cooking water (Graph 6).
The most common purification method being followed by three-fourth of the households was simple filtering or sieving (Graph 7). Further, during FGDs, the women complained about the unsafe hygiene practices around public water sources. They revealed that, “the water sources, including hand pumps and stand posts, are easily accessible to livestock; people have been using the same water as livestock, as awareness around safe drinking water sources is very low”.
Kanker, Chhattisgarh
11
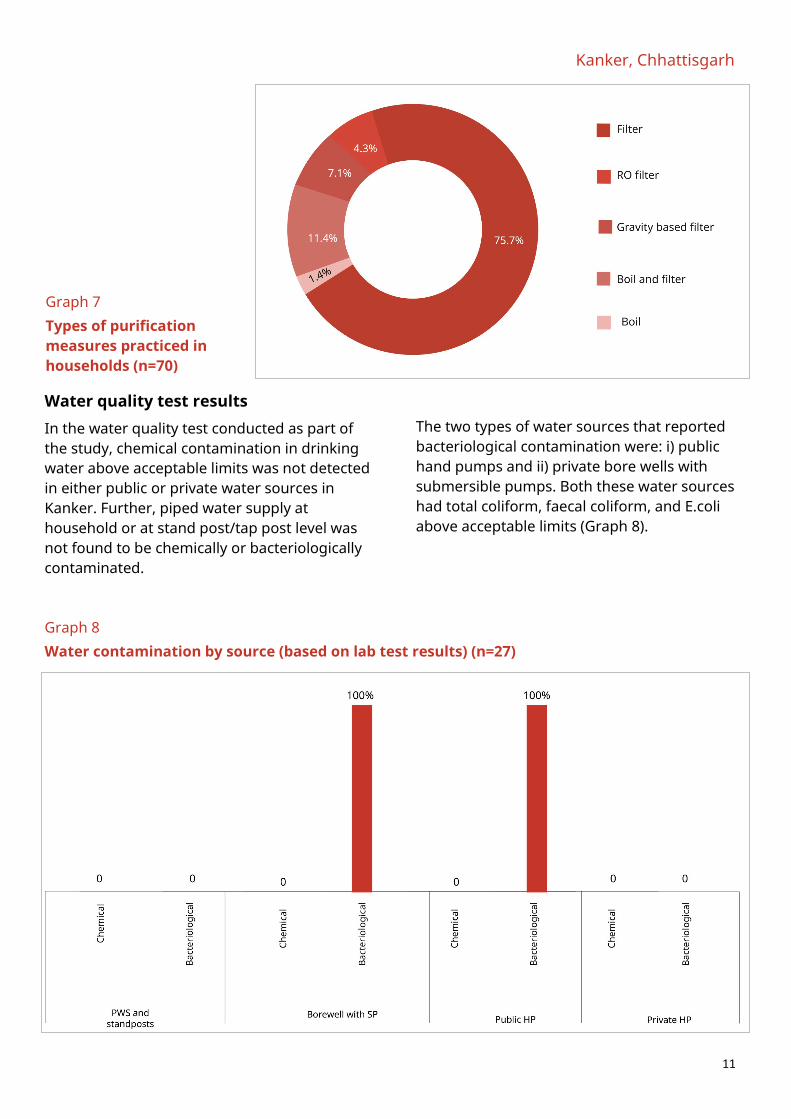
Graph 7 Types of purification measures practiced in households (n=70)
Water quality test results In the water quality test conducted as part of the study, chemical contamination in drinking water above acceptable limits was not detected in either public or private water sources in Kanker. Further, piped water supply at household or at stand post/tap post level was not found to be chemically or bacteriologically contaminated.
Graph 8 Water contamination by source (based on lab test results) (n=27)
The two types of water sources that reported bacteriological contamination were: i) public hand pumps and ii) private bore wells with submersible pumps. Both these water sources had total coliform, faecal coliform, and E.coli above acceptable limits (Graph 8).
Assessment of the status, service delivery infrastructure and governance of drinking water supply in small and medium towns
12
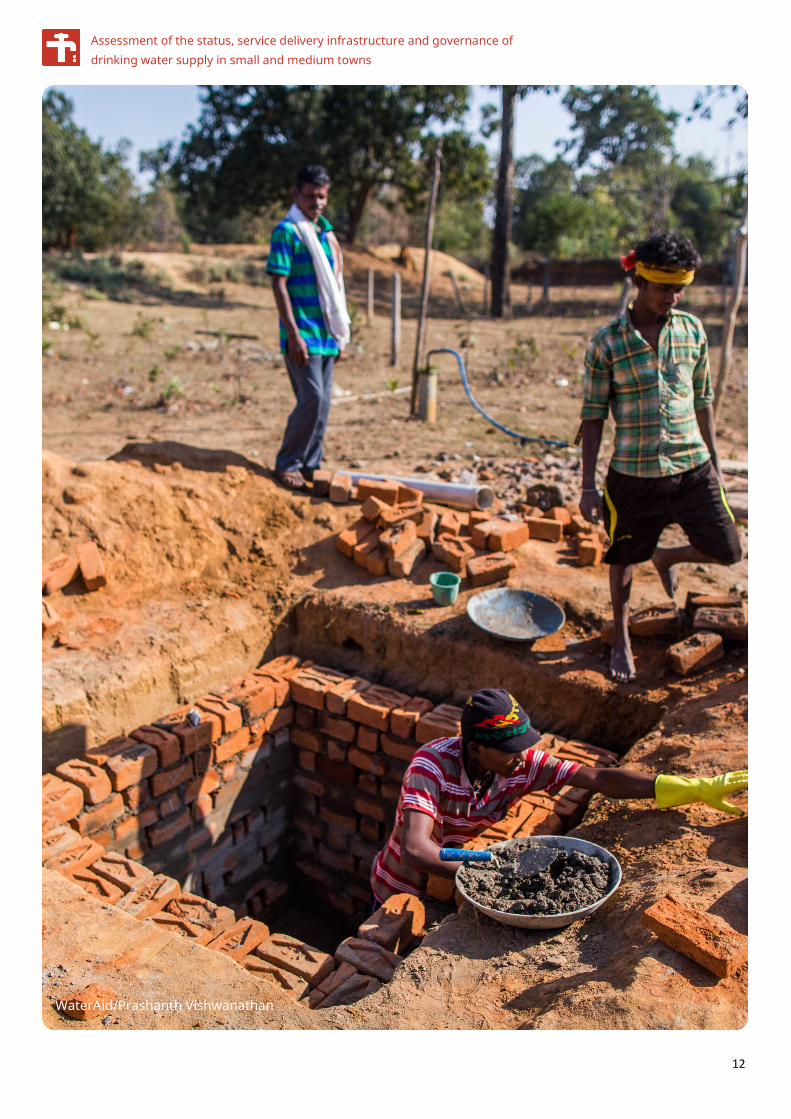
WaterAid/Prashanth Vishwanathan

Kanker, Chhattisgarh
13
Sustainability measures
The groundwater level around Kanker has fallen drastically over the past ten years. According to the interview with interviews, the groundwater which was available at 300ft a decade ago, went down to 700–800ft, depleting at the rate of 30–40ft each year. Presently, the old tube wells at 400–500ft depth dry up in summer and new boring of tube wells goes down to 800ft. Earlier, drinking water shortages started from the month of March but now water scarcity is at its peak right from the months of January and February every year.
The survey results reveal that all households in the town, whether receiving water from PWS and stand posts, public hand pumps, or private bore wells, are dependent on groundwater. Taking note of the excessive withdrawal of groundwater, the town authorities undertook water conservation measures in June 2019 through groundwater recharge, source strengthening, storm water management and greywater management. During interviews, PHED officials stated that they were "working on water recharging through water harvesting and also trying to connect all houses with piped water supply”. During FGDs, participants from two different wards i.e. Sanjay Nagar and Shiv Nagar (wards 3 and 6) confirmed that water harvesting techniques had been initiated with the help of NGO Samarthan and WaterAid; households in both the wards had even installed a rainwater harvesting unit in their courtyards. However, wastewater management is still an unattended area as untreated water from the households flows into the ponds, rivers, and dams, thereby contaminating the surface water bodies.
Understanding these waste management needs of the town, the government is setting up the Daspur Water Treatment Plant which is scheduled to be completed by 2020. Under this plan, water from the river Mahanadi is to be
treated, purified, and supplied to the households. The project is targeted to benefit almost 12 lakh families, supplying them with drinking water and ensuring groundwater sustainability.
Sanitation While the urban areas of Chhattisgarh were declared as ‘open defecation free’ (ODF) on 2 October 2017, the survey results revealed that toilet coverage is not at 100 per cent, as only 91.7 per cent of the surveyed households in Kanker reported a functional toilet at home. During FGDs, respondents with individual household toilets did not report any problem in regular access to sanitation. However, people using community toilets shared their challenges related to emptying the toilet tanks, blockages in the sewage system, insufficient toilets, lack of separate toilets for men and women, lack of sufficient water in the toilets, and lack of safety and privacy as doors and latches were broken.
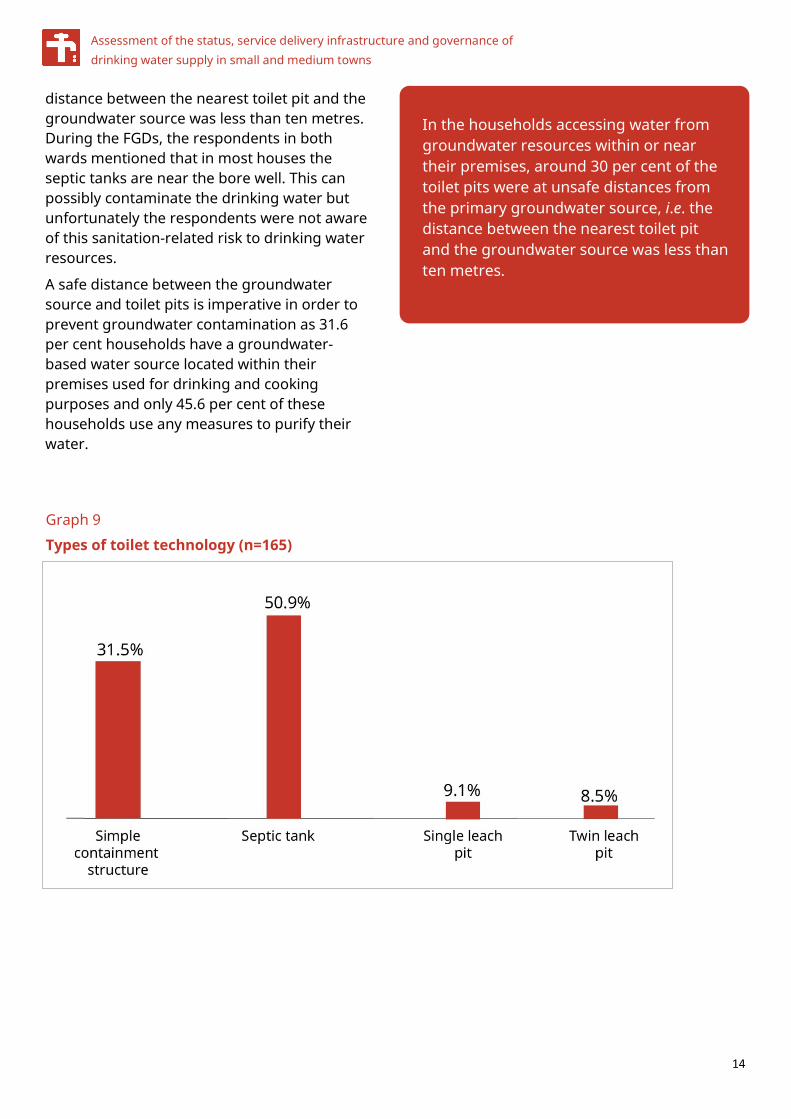
Around 50.9 per cent of the surveyed households were found to have septic tanks. Provided they meet the design standards and the accumulated faecal sludge is periodically removed, these structures are a comparatively safer sanitation option (Fig. 9)8. While toilet coverage was found to be large, faecal sludge management was poor with 87.3 per cent of the households reporting that toilet pits have not been de-sludged yet. This shows very poor management of faecal matters as well as faulty toilet design where faecal waste gets flushed out into the street drains and flows into water bodies, thereby affecting the ecosystem.
In the households accessing water from groundwater resources within or near their premises, around 30 per cent of the toilet pits were at unsafe distances from the primary groundwater source, i.e. the horizontal
8 The data presented is based on the responses of the respondents; verification of toilet substructures was not possible.
Assessment of the status, service delivery infrastructure and governance of drinking water supply in small and medium towns
14
distance between the nearest toilet pit and the groundwater source was less than ten metres. During the FGDs, the respondents in both wards mentioned that in most houses the septic tanks are near the bore well. This can possibly contaminate the drinking water but unfortunately the respondents were not aware of this sanitation-related risk to drinking water resources.
A safe distance between the groundwater source and toilet pits is imperative in order to prevent groundwater contamination as 31.6 per cent households have a groundwater-based water source located within their premises used for drinking and cooking purposes and only 45.6 per cent of these households use any measures to purify their water.
Graph 9
Types of toilet technology (n=165)
In the households accessing water from groundwater resources within or near their premises, around 30 per cent of the toilet pits were at unsafe distances from the primary groundwater source, i.e. the distance between the nearest toilet pit and the groundwater source was less than ten metres.
Kanker, Chhattisgarh
15
INTERVENTIONS NEEDED • For access to PWS connections under the
Bhagirathi Nal Jal Yojana, either the ULB should follow a demand-driven approach and directly reach out to the urban poor beneficiary or establish an institutional mechanism which makes the residents aware of the procedure to get a new connection, pay bills, and register complaints. Moreover, annual targets for PWS connections should be reflected in the town’s annual plans so that the state creates provisions and funds for the same.
• The ULBs in the state have become more like management and operational bodies dependent on the PHED for technical aspects like planning and executing water supply schemes. Like PHED, ULBs should also have skilled officials to look into the technical aspects of water supply arrangement to reduce dependence on the district.
• Organisational restructuring of ULBs is required. The post of an executive engineer rank officer should be created with the authority to approve technical designs and budgets for PWS schemes in the town before it goes to the state level for approval. An accountability framework for ULBs is essential.
• Currently, a water quality testing system at either the public or household level for PWS is absent. Sources like hand pumps and bore wells have been found to be bacteriologically contaminated, as manifested in the test conducted as part of the study. Therefore, periodic water quality monitoring of sources like PWS, stand posts, hand pumps and deep bore wells is recommended.
• Efforts have been made by the town authorities towards improving groundwater recharge and thereby improving source sustainability. However, as groundwater is depleting at the rate of 30–40ft each year, these efforts must be scaled up to all buildings with a total area more than 100sqmts, whether residential or commercial, in line with the National Building By-laws.
• Faecal sludge disposal facilities are particularly poor therefore legislative provisions with regard to water pollution and environment protection should be enforced in the town.
• As the volume of wastewater is increasing at an alarming rate and is contaminating local water bodies, management of wastewater by setting up a decentralised wastewater plant with cost efficient technology is necessary to added help to save the groundwater and surface water sources from further contamination.
• Due to poor water handling habits, there is a need to promote water and hygiene campaigns within the community in the study area to prevent water-related diseases at the household level.
WaterAid India Country Office 2nd floor, RK Khanna Tennis Stadium,
1, Africa Avenue, Safdarjung Enclave,
New Delhi 110029
Tel +91 11 6612 4400
Email [email protected]
WWW.WATERAIDINDIA.IN
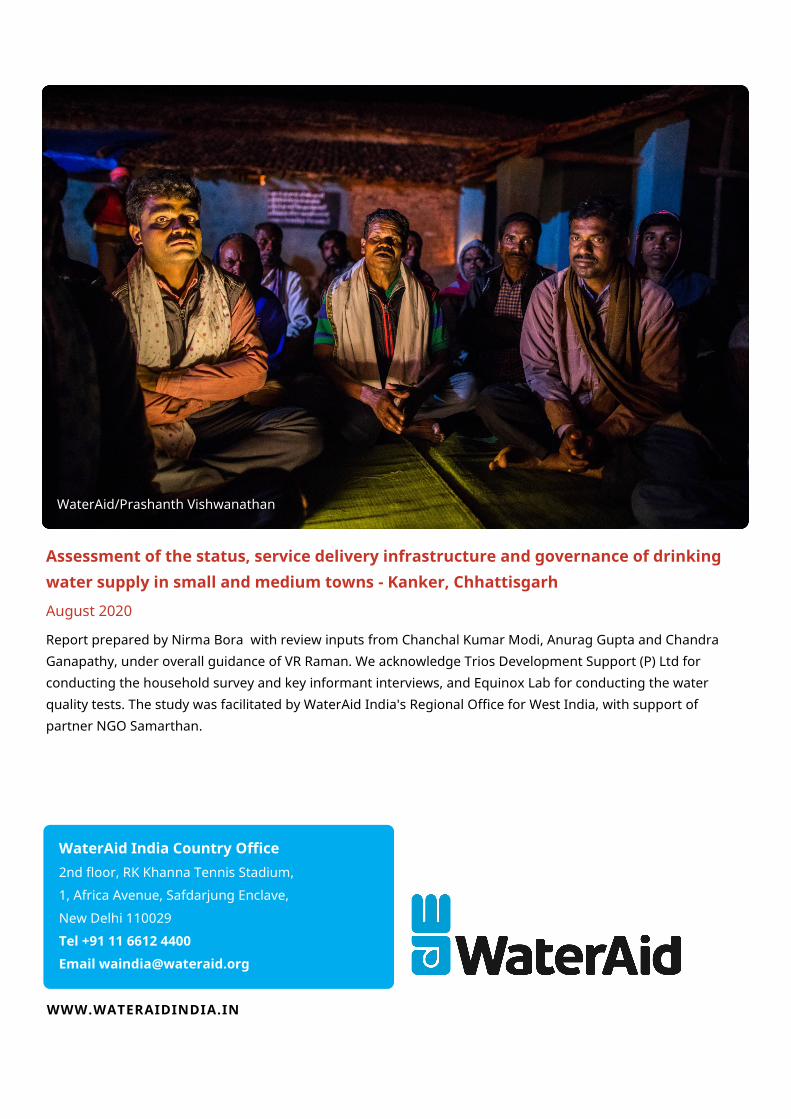
Report prepared by Nirma Bora with review inputs from Chanchal Kumar Modi, Anurag Gupta and Chandra Ganapathy, under overall guidance of VR Raman. We acknowledge Trios Development Support (P) Ltd for conducting the household survey and key informant interviews, and Equinox Lab for conducting the water quality tests. The study was facilitated by WaterAid India's Regional Office for West India, with support of partner NGO Samarthan.
Assessment of the status, service delivery infrastructure and governance of drinking water supply in small and medium towns - Kanker, Chhattisgarh
August 2020
WaterAid/Prashanth Vishwanathan
Related Documents