National Park Service U.S. Department of the Interior Natural Resource Stewardship and Science Assessment of Natural Resources and Watershed Conditions for Delaware Water Gap National Recreation Area and Upper Delaware Scenic and Recreational River Natural Resource Report NPS/NER/NRR—2011/429

Welcome message from author
This document is posted to help you gain knowledge. Please leave a comment to let me know what you think about it! Share it to your friends and learn new things together.
Transcript

National Park Service U.S. Department of the Interior Natural Resource Stewardship and Science
Assessment of Natural Resources
and Watershed Conditions for
Delaware Water Gap National Recreation Area
and Upper Delaware Scenic and Recreational River Natural Resource Report NPS/NER/NRR—2011/429

ON THE COVER
Delaware River from a campground. Photo courtesy of Jennifer Stingelin Keefer.
Assessment of Natural Resources
and Watershed Conditions for
Delaware Water Gap National Recreation Area
and Upper Delaware Scenic and Recreational River Natural Resource Report NPS/NER/NRR—2011/429
Carolyn G. Mahan1, Bruce J. Miller2, Michael C. Saunders3, and John A. Young4
1 The Pennsylvania State University 209 Hawthorn Building Altoona, Pennsylvania
2 11817 Cedar Mill Road North East, Pennsylvania
3 The Pennsylvania State University 514 ASI Building University Park, Pennsylvania
4 U.S. Geological Survey Leetown Science Center Kearneysville, West Virginia
July 2011
U.S. Department of the Interior National Park Service Natural Resource Stewardship and Science Fort Collins, Colorado

ii
The National Park Service, Natural Resource Stewardship and Science office in Fort Collins, Colorado publishes a range of reports that address natural resource topics of interest and applicability to a broad audience in the National Park Service and others in natural resource management, including scientists, conservation and environmental constituencies, and the public.
The Natural Resource Report Series is used to disseminate high-priority, current natural resource management information with managerial application. The series targets a general, diverse audience, and may contain NPS policy considerations or address sensitive issues of management applicability.
All manuscripts in the series receive the appropriate level of peer review to ensure that the information is scientifically credible, technically accurate, appropriately written for the intended audience, and designed and published in a professional manner.
This report received formal peer review by subject-matter experts who were not directly involved in the collection, analysis, or reporting of the data, and whose background and expertise put them on par technically and scientifically with the authors of the information.
Views, statements, findings, conclusions, recommendations, and data in this report do not necessarily reflect views and policies of the National Park Service, U.S. Department of the Interior. Mention of trade names or commercial products does not constitute endorsement or recommendation for use by the U.S. Government.
This report is available from http://www.nps.gov/nero/science/ and the Natural Resource Publications Management website (http://www.nature.nps.gov/publications/nrpm/).
Please cite this publication as:
Mahan, C. G., B. J. Miller, M. C. Saunders, and J. A. Young. 2011. Assessment of natural resources and watershed conditions for Delaware Water Gap National Recreation Area and Upper Delaware Scenic and Recreational River. Natural Resource Report NPS/NER/NRR—2011/429. National Park Service, Fort Collins, Colorado.
NPS 620/108557; 647/108557, July 2011

iii
Contents Page
Figures............................................................................................................................................. v
Tables ............................................................................................................................................ vii
Executive Summary ....................................................................................................................... ix
Acknowledgments and Prologue.................................................................................................... xi
List of Terms ................................................................................................................................ xiii
Introduction / Purpose of Natural Resource Condition Assessment ............................................... 1
Objectives ................................................................................................................................ 1
Study Areas ..................................................................................................................................... 3
Delaware Water Gap National Recreation Area (DEWA) ...................................................... 3
Upper Delaware Scenic and Recreational River (UPDE) ....................................................... 3
Methods........................................................................................................................................... 7
Results and Discussion ................................................................................................................. 13
Scale of Assessment .............................................................................................................. 13
Natural Resource Assessment Model Indicators ................................................................... 16
Watersheds Included in Our Analyses ................................................................................... 36
Major Data Gaps for Our Analyses ....................................................................................... 41
Overall Status of Individual Indicators .................................................................................. 52
Overall Status of Watersheds/Park ........................................................................................ 55
Example Watersheds to Highlight Model - Van Campens and Callicoon ............................ 56
Pros and Cons of a DSS Model to Assess Natural Resource Condition ............................... 63
Literature Cited ............................................................................................................................. 65
Appendix ....................................................................................................................................... 71

v
Figures Page
Figure 1a. Delaware Water Gap National Recreation Area, northeastern Pennsylvania. .................................................................................................................................. 4
Figure 1b. Upper Delaware Scenic and Recreational River, northeastern Pennsylvania and southeastern New York. ..................................................................................... 5
Figure 2. Watershed and subwatershed boundaries associated with Delaware Water Gap National Recreation Area and Upper Delaware Scenic and Recreational River. ......................................................................................................................... 6
Figure 3. A dependency network as represented in NetWeaver. ................................................. 11
Figure 4. A fuzzy argument used for interpreting the pH value of a stream. .............................. 11
Figure 5. The dependency network for the overall assessment of watershed condition. ...................................................................................................................................... 17
Figure 6. The topmost dependency network for WQ - Chemical/Physical. ................................ 19
Figure 7. The dependency network for WQI - Water Quality Index. .......................................... 20
Figure 8. The WQI - Water Quality Index Score calculated data link. A SOR node checks for existing WQI scores in a wiki database. ............................................................. 21
Figure 9. The WQI - Water Quality Index Component Aggregation calculated data link. ........................................................................................................................................ 21
Figure 10. The BOD WQI Q Value calculated data link. ............................................................ 22
Figure 11. The dependency network for WQI-BOD. .................................................................. 22
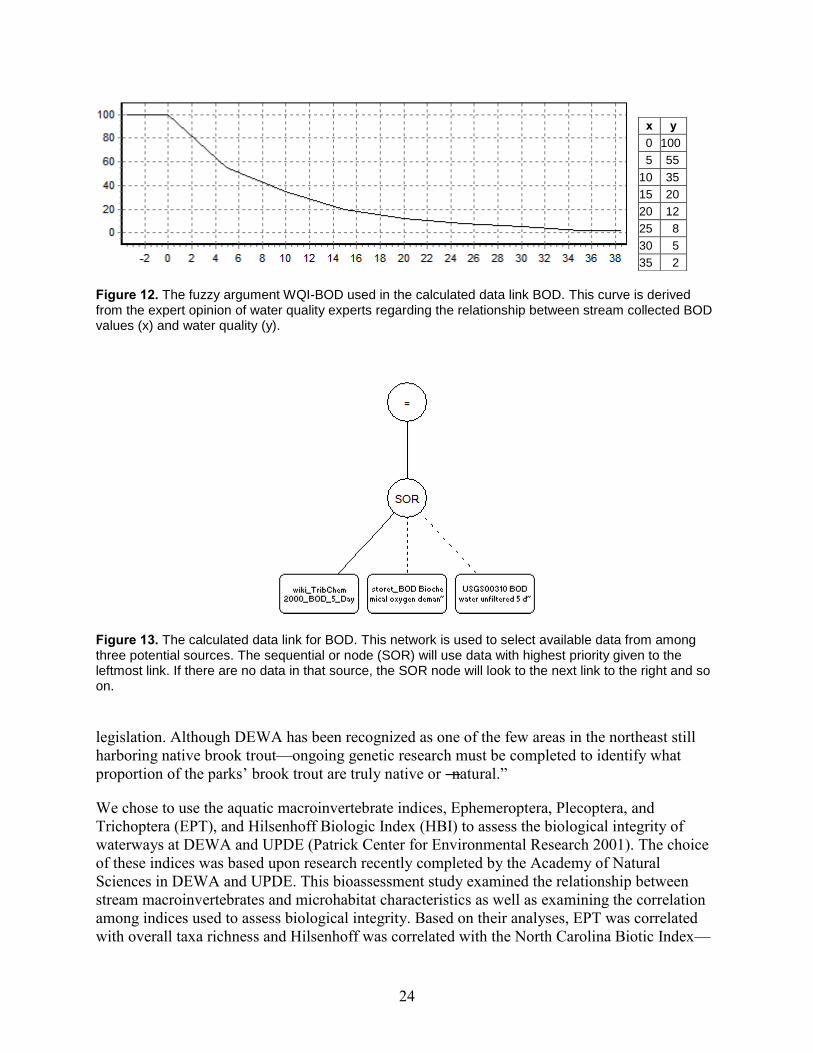
Figure 12. The fuzzy argument WQI-BOD used in the calculated data link BOD. .................... 24
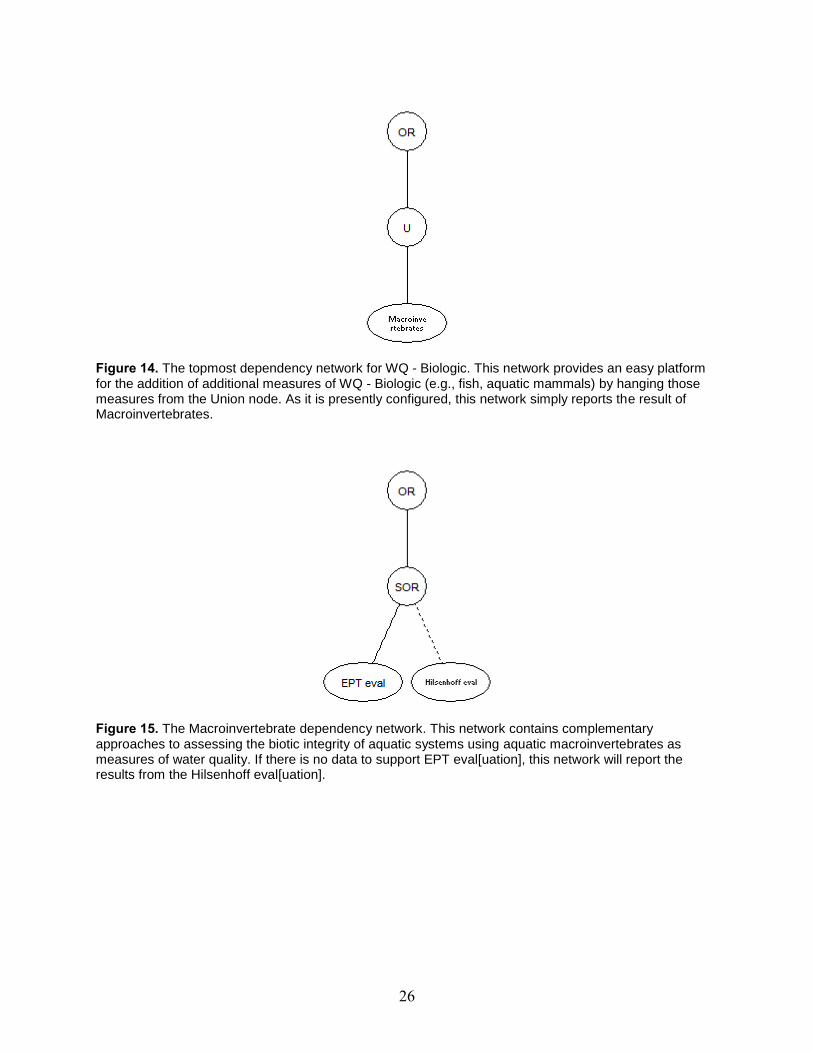
Figure 13. The calculated data link for BOD. .............................................................................. 24
Figure 14. The topmost dependency network for WQ - Biologic. .............................................. 26
Figure 15. The Macroinvertebrate dependency network. ............................................................ 26
Figure 16. The EPT eval[uation] dependency network. .............................................................. 27
Figure 17. The ―EPT Taxa Found‖ calculated data link. ............................................................. 28
Figure 18. The Hilsenhoff eval[uation] dependency network. .................................................... 29
Figure 19. The Hilsenhoff score calculated data link. ................................................................. 29
vi
Figure 20. The Hilsenhoff Score – calc[ulated] dependency network. ........................................ 31
Figure 21. Fuzzy logic argument for percent forest. .................................................................... 37
Figure 22. Fuzzy logic argument for percent impervious surface. .............................................. 37
Figure 23. Watersheds at Delaware Water Gap National Recreation Area and Upper Delaware Scenic and Recreational River depicting the condition of the chemical and physical water quality indicators. ........................................................................... 52
Figure 24. Watersheds at Delaware Water Gap National Recreation Area and Upper Delaware Scenic and Recreational River depicting the condition of the biologic water quality indicators. .................................................................................................. 53
Figure 25. Watersheds at Delaware Water Gap National Recreation Area and Upper Delaware Scenic and Recreational River depicting the condition of the landscape quality indicators. ......................................................................................................... 54
Figure 26. Watersheds at Delaware Water Gap National Recreation Area and Upper Delaware Scenic and Recreational River depicting the overall natural resource assessment (water quality - chemical/physical, water quality - biological, landscape combined) quality indicators. ....................................................................................... 55
Figure 27. Overall natural resource assessment for Callicoon (upper) and VanCampens (lower) watersheds. ................................................................................................ 56
Figure 28. NetWeaver overall evaluation dependency network for Callicoon watershed, Upper Delaware Scenic and Recreational River. ....................................................... 57
Figure 29. NetWeaver overall evaluation dependency network for VanCampens watershed, Delaware Water Gap National Recreation Area. ........................................................ 58
Figure 30. NetWeaver Water Quality - Chemical/Physical network for Callicoon watershed, Upper Delaware Scenic and Recreational River. ....................................................... 59
Figure 31. NetWeaver Water Quality - Chemical/Physical network for VanCampens watershed, Delaware Water Gap National Recreation Area. ................................. 59
Figure 32. NetWeaver macroinvertebrate network for Callicoon watershed, Upper Delaware Scenic and Recreational River. .......................................................................... 60
Figure 33. NetWeaver dependency network for Landscape for Callicoon watershed, Upper Delaware Scenic and Recreational River.. ...................................................... 61
Figure 34. NetWeaver dependency network for Landscape for VanCampens watershed, Delaware Water Gap National Recreation Area. ........................................................ 61
Figure 35. Brook trout presence at Callicoon (upper) and VanCampens (lower). ...................... 62
vii
Tables Page
Table 1. The NetWeaver logical node types and their function. .................................................. 12
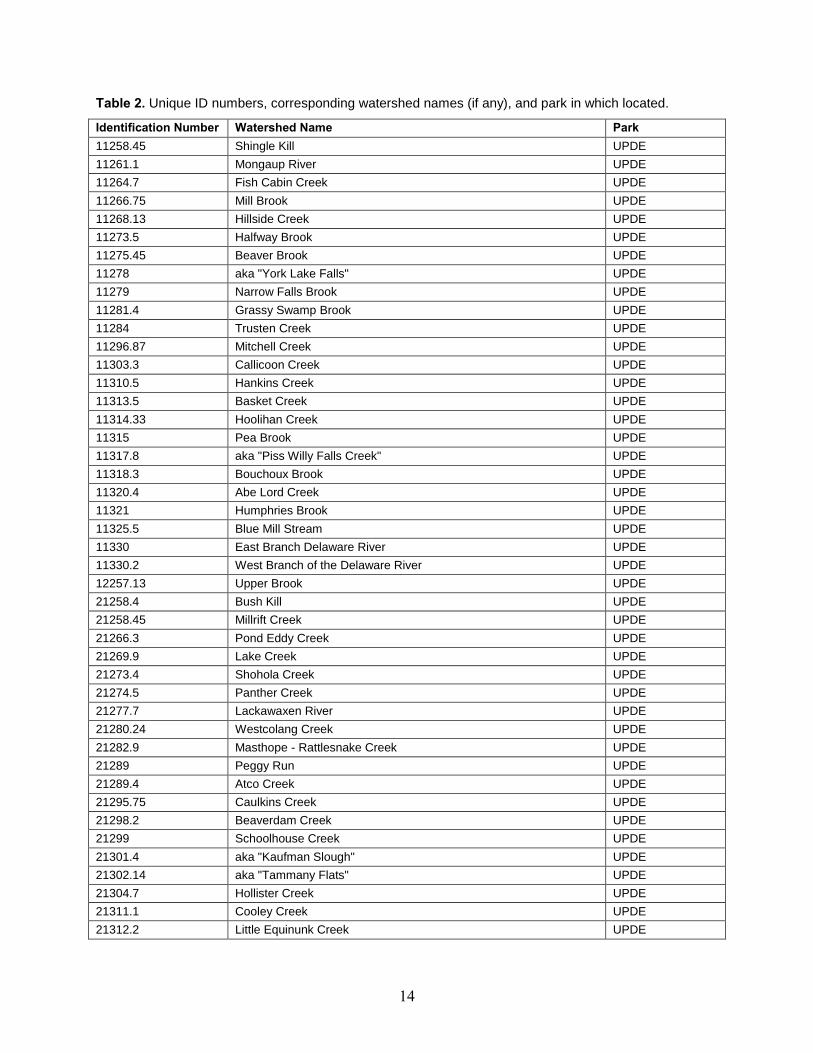
Table 2. Unique ID numbers, corresponding watershed names (if any), and park in which located. ........................................................................................................................... 14
Table 3. Water Quality Index scores and associated water quality based upon Kaurish and Younos (2007). ......................................................................................................... 18
Table 4. Hilsenhoff Biotic Index score and corresponding levels of water quality and organic pollution. ................................................................................................................... 28
Table 5. Suggested landscape measures, their descriptions, and correlation with other landscape measures. ............................................................................................................. 34
Table 6. Landscape fragmentation and disturbance threshold recommendations for a variety of landscape measures based on Kennedy et al. 2003. ............................................. 35
Table 7. Percent impervious surface threshold recommendations based upon aquatic resource and water quality research. ................................................................................ 36
Table 8. Unique ID#, watershed name, and calculated NetWeaver the "trueness" value (-1 to 1 scale) for each natural resource assessment component. ........................................ 38
Table 9. Decision support system dependency networks and/or ecological thresholds, graphical assessment results, and statistical assessment results for the overall natural resource assessment, ecosystem indicators, and their measures at Delaware Water Gap National Recreation Area and Upper Delaware Scenic and Recreational River, 2009. ............................................................................................................. 43


ix
Executive Summary We used a GIS-based decision support system model (DSS) to develop a threshold-based natural resource condition assessment for watersheds at Delaware Water Gap National Recreation Area (DEWA) and Upper Delaware Scenic and Recreational River (UPDE). The purpose of our natural resource assessment was to assist superintendents and natural resource managers with: (1) strategic planning; (2) general management plans; (3) park reporting on land health goals; and (4) overall natural resource management and conservation in these two national parks. Our overall assessment examined a variety of aquatic and terrestrial ecosystem indicators and their interactions. These indicators included: water quality (WQ) – chemical and physical measures, water quality (WQ) – biologic measures, and landscape – forest condition measures. For the water quality chemical and physical measures we used a water quality index (WQI) and each of its nine components to assess the condition of water quality in each watershed. For the water quality biologic measures we used the Ephemeroptera, Plecoptera, Tricoptera (EPT) aquatic macroinvertebrate index and, secondarily, the Hilsenhoff aquatic macroinvertebrate index. Finally, for the landscape condition measures of our model, we used percent forest and percent impervious surface. In addition, our DSS model contains natural resource measures that were not included in the overall assessment per se, but may be useful for management of park resources. For instance, our model includes information on the amount of stream crossings, dams, road miles, water flow, and rare species per watershed in each park.
All data used in our assessment were compiled from relevant reports, scientific literature, and data files and managed using an on-line Wiki tool. We used these data and information available in the scientific research to develop thresholds for our overall natural resource assessment model. We also used a variety of GIS-based analytical models to synthesize landscape data and develop indices of landscape condition across the two parks.
We assessed the condition of 100 watersheds at both parks that represent major and minor tributaries for the mainstem of the Delaware River. Based on our overall assessment, DEWA and UPDE watersheds had an overall natural resource assessment score of 0.433 on a -1 to 1 fuzzy logic scale. This score indicates that, in general, the natural resource condition within watersheds at these two parks is healthy or ecologically unimpaired; however, we had only partial data for many of our indicators. For example, water quality and aquatic macroinvertebrate data are not available for all watersheds in each park; however, our online DSS-based model permits the addition of new data as they become available. Therefore, the model may be run in the future to examine trends in natural resource condition or to obtain a more accurate determination of natural resource condition as more data become available. It is therefore critical that data collection methodology is well documented, metadata are available, and that data collection is on-going. These two natural resource parks are located within a rapidly urbanizing landscape—we recommend that natural resource managers remain vigilant to surrounding land uses that may adversely affect natural resources within the park. Our overall natural resource assessment model is one tool to assist resource managers in identifying declines and improvements in natural resource condition and implementing management strategies for continued conservation of these resources.
jalbright
Text Box
Publisher's Note: Some or all of the work done for this project preceded the revised guidance issued for this project series in 2009/2010. See Prologue (p. xi) for more information.

xi
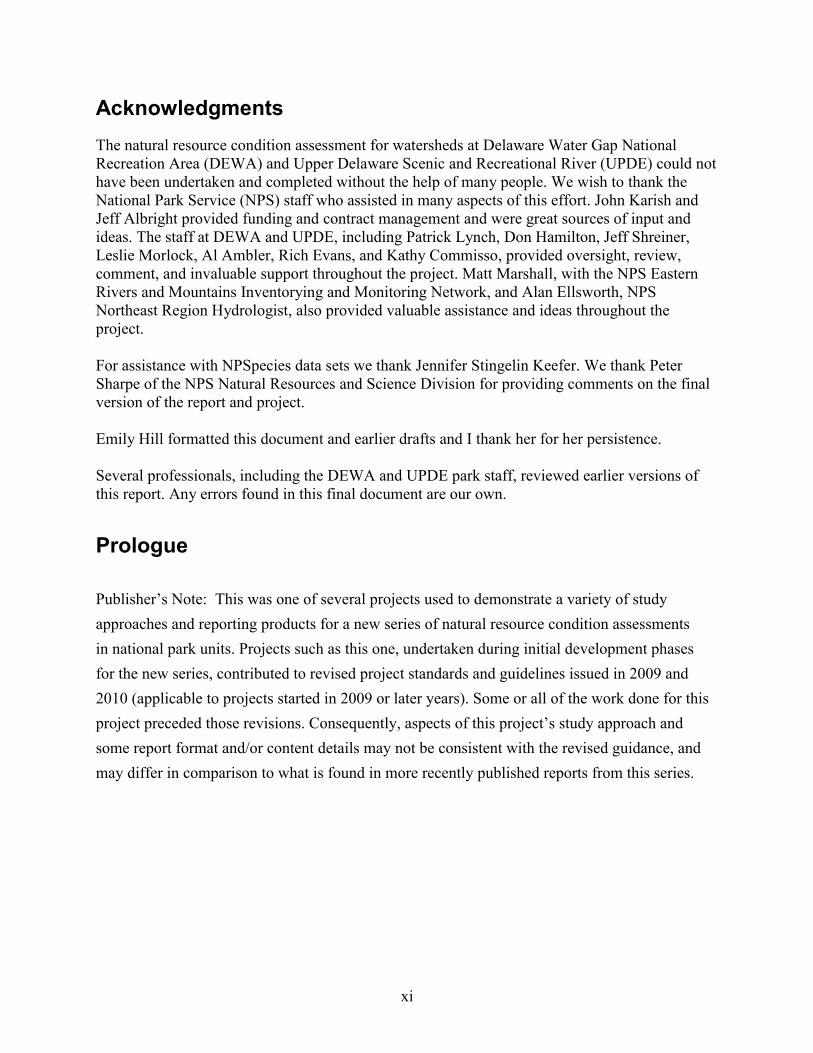
Acknowledgments The natural resource condition assessment for watersheds at Delaware Water Gap National Recreation Area (DEWA) and Upper Delaware Scenic and Recreational River (UPDE) could not have been undertaken and completed without the help of many people. We wish to thank the National Park Service (NPS) staff who assisted in many aspects of this effort. John Karish and Jeff Albright provided funding and contract management and were great sources of input and ideas. The staff at DEWA and UPDE, including Patrick Lynch, Don Hamilton, Jeff Shreiner, Leslie Morlock, Al Ambler, Rich Evans, and Kathy Commisso, provided oversight, review, comment, and invaluable support throughout the project. Matt Marshall, with the NPS Eastern Rivers and Mountains Inventorying and Monitoring Network, and Alan Ellsworth, NPS Northeast Region Hydrologist, also provided valuable assistance and ideas throughout the project. For assistance with NPSpecies data sets we thank Jennifer Stingelin Keefer. We thank Peter Sharpe of the NPS Natural Resources and Science Division for providing comments on the final version of the report and project. Emily Hill formatted this document and earlier drafts and I thank her for her persistence. Several professionals, including the DEWA and UPDE park staff, reviewed earlier versions of this report. Any errors found in this final document are our own.
Prologue Publisher’s Note: This was one of several projects used to demonstrate a variety of studyapproaches and reporting products for a new series of natural resource condition assessmentsin national park units. Projects such as this one, undertaken during initial development phasesfor the new series, contributed to revised project standards and guidelines issued in 2009 and2010 (applicable to projects started in 2009 or later years). Some or all of the work done for thisproject preceded those revisions. Consequently, aspects of this project’s study approach andsome report format and/or content details may not be consistent with the revised guidance, andmay differ in comparison to what is found in more recently published reports from this series.

xiii
List of Terms current conditions: a) the integrity and character of a park's existing natural and cultural resources and the
conditions existing for visitors to understand, enjoy, and appreciate those resources.
b) a qualitative description of the existing integrity and character of a park's resources and values, including visitor experiences.
decision support system: a class of information systems (including, but not limited to computerized systems) that support decision-making activities; a properly designed DSS is an interactive software-based system intended to help decision makers compile useful information from a combination of sources and source types.
desired conditions: a) the integrity and character of a park's natural and cultural resources that the National Park Service aspires to achieve and maintain over time, and the conditions necessary for visitors to understand, enjoy, and appreciate those resources; these conditions are identified through a park's planning process.
b) a qualitative description of the integrity and character for a set of resources ad values, including visitor experiences, that park management has committed to achieve and maintain.
ecological impairment: a detrimental effect of the integrity of an ecosystem or ecosystem component caused by an impact (often human-induced).
ecological integrity: the ability of an ecosystem to support and maintain a balanced adaptive community of organisms having a species composition, diversity, and functional organization comparable to that of natural habitats within a particular region.
ecological threshold: the point at which a relatively small change in external conditions causes a rapid change in an ecosystem.
fuzzy logic: a form of reasoning where a true value need not be exactly zero (false) or one (true), but rather zero, one, negative one, or any value in between.
GeoNetWeaver: software that was developed to run on an independent PC platform using Arc View shapefiles for data inputs. The software provides the ability to graphically create, manipulate, display, and analyze a complex dependency network. The GIS functionality allows the results of the network analysis to be displayed spatially.
indicators: a selected subset of the physical, chemical, and biological measures and processes of natural systems used to represent the overall health of the system.
NetWeaver: a conceptual and analytical modeling software program that is object oriented. It allows the user to link objects (e.g., indicators) in a series of nodes and networks. Relationships (e.g., thresholds) and linkages are not generated by the model but are defined by the user. Professional knowledge rather than mathematical relationships are used to describe the relationships between the variables in the model.
reference conditions: minimally ecologically impaired conditions which provide an estimate of natural variability in biological condition and habitat quality.
measure: the specific variables used to quantify the condition or state of the indicators. For example, water quality-chemical/physical may be the indicator, while pH is one measure.


1
Introduction / Purpose of Natural Resource Condition Assessment In 2005, the National Park Service (NPS) Water Resources Division (WRD) received an increase in funding to conduct natural resource condition assessments at park units. The purpose of these assessments is to assist superintendents and natural resource managers with: 1) strategic planning; 2) general management plans; 3) park reporting on land health goals; and 4) overall natural resource management and conservation in the national parks. These assessments examine aquatic and terrestrial ecosystem indicators and their interactions to best evaluate overall ecological condition of national park units. The assessments should have a strong geospatial component that will effectively communicate the results of the assessment and facilitate park managers’ transition to condition-based resource management.
Objectives Our overall goal was to complete a comprehensive natural resource condition assessment for watersheds at Delaware Water Gap National Recreation Area (DEWA) and Upper Delaware Scenic and Recreational River (UPDE) that effectively communicates the ecological condition of the park to the public, park planners, state and local governments, and other stakeholders. This goal was achieved through a series of objectives:
Objective 1: To determine the subset of ecosystem components (indicators and measures) to represent the overall ecological condition of natural resources within the park.
Objective 2: To identify existing sources of scientific data and information useful for evaluating the current condition and trends of selected natural resources indicators and their measures.
Objective 3: To review, compile, and synthesize these data and information sets to ensure that the most pertinent, relevant, and current data are used in the assessment process. Data and information sets include reports, maps, and data, as well as interviews and input from natural resource managers and subject-matter experts. This synthesis required a prioritization of natural resource information in order to provide a concise but accurate baseline narrative for the natural resource condition assessment.
Objective 4: To determine reference condition and ecological thresholds for selected indicators and their measures. The reference conditions for an indicator represent measures of indicator quality (e.g., pH, water temperature) that the indicator would have in the absence of all but very minor human induced disturbances (Egan and Howell 2001). Ecological thresholds are defined as the point at which there is an abrupt change in an ecosystem attribute (living or nonliving feature of the environment) which may produce large responses in an ecosystem (Groffman et al. 2006).
Objective 5: To develop decision support system (DSS) models (also called knowledge-based system models) that integrate natural resource data and information to provide a comprehensive narrative and graphic (geospatial) assessment of the ecological condition of natural resources in the parks. This watershed-based assessment depicts the current natural resource conditions in relation to threshold conditions as well as identifies gaps in knowledge and potential resource threats.
jalbright
Text Box
Publisher's Note: Some or all of the work done for this project preceded the revised guidance issued for this project series in 2009/2010. See Prologue (p. xi) for more information.

3
Study Areas Delaware Water Gap National Recreation Area (DEWA) DEWA, a 27,192-ha (67,192-ac) NPS unit located in northeastern PA and northwestern NJ (Figure 1a), was legislated in 1965 for the purpose of public outdoor recreation and for the preservation of scenic, scientific, and historic resources. The park straddles the Delaware River, a portion of which is designated as a Wild and Scenic River, and includes a 40-km (25-mi) segment of the Appalachian Trail. Aside from the main stem of the Delaware River, a variety of terrestrial and aquatic natural ecosystems and features are found within the park including: Kittatiny Ridge, Pocono Plateau, NJ Highlands, waterfalls, hemlock ravines, rhododendron glades, rare riparian and wetland plant communities, upland native grasslands, high diversity of neotropical breeding birds, high density of black bears, and rich assemblages of reptiles and amphibians. Threats to these ecosystems and features arise primarily from outside the park and are related to increased residential and commercial development. For example, issues associated with wastewater treatment, stormwater runoff, and forest fragmentation jeopardize natural resource integrity in DEWA.
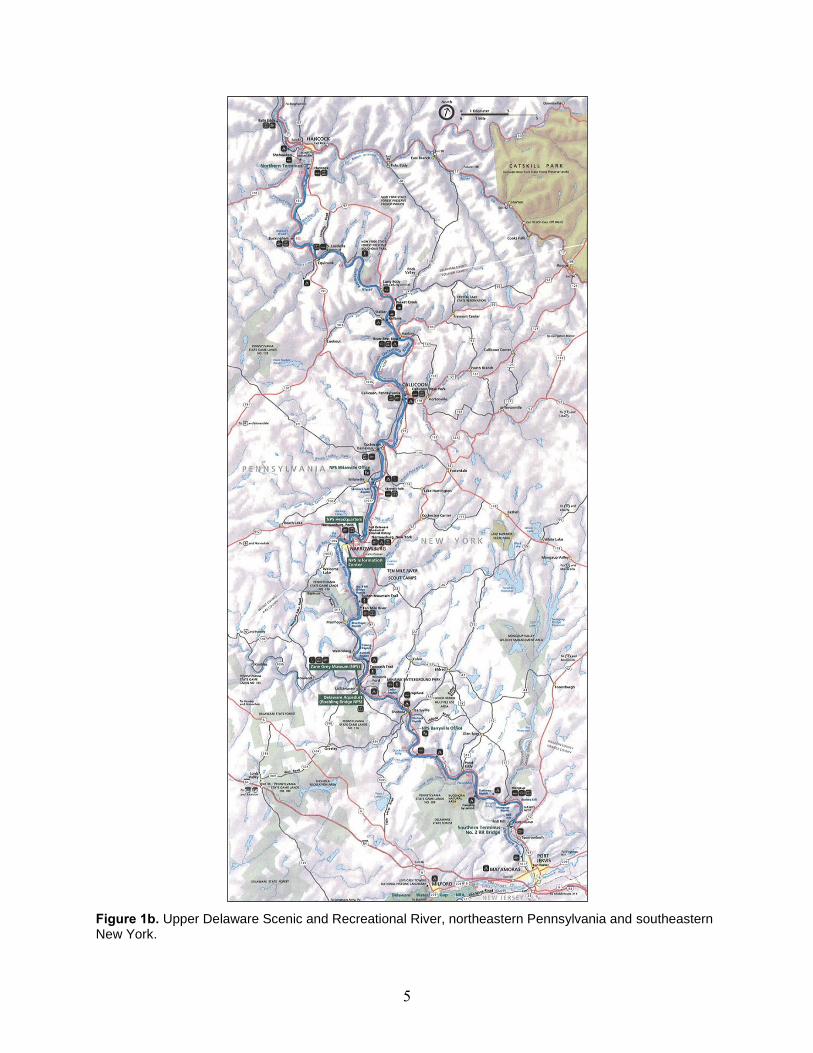
Upper Delaware Scenic and Recreational River (UPDE) UPDE, a park unit with an authorized boundary that encompasses 22,258 ha (55,000 ac), was designated in 1978 as part of the Wild and Scenic Rivers Act for the purpose of protecting outstanding scenic, recreational, geologic, fish, wildlife, historic, cultural, and water resources for the enjoyment of present and future generations. The park straddles the Delaware River in northeastern Pennsylvania and southern New York and currently has 12.5 ha (31 ac) in NPS ownership (Figure 1b). Most of the land within the authorized boundary is forested, although agriculture and low-density residential development also is located within the floodplain. The natural features of note within this park unit are related to the river itself and include outstanding game fish habitat, diverse native aquatic insect communities, and some rare riparian plants. Due to the small size and linear nature of this park unit, threats to its resources arise primarily from outside the park and, as in DEWA, are primarily associated with increased residential and commercial development surrounding the park.
Area of Assessment
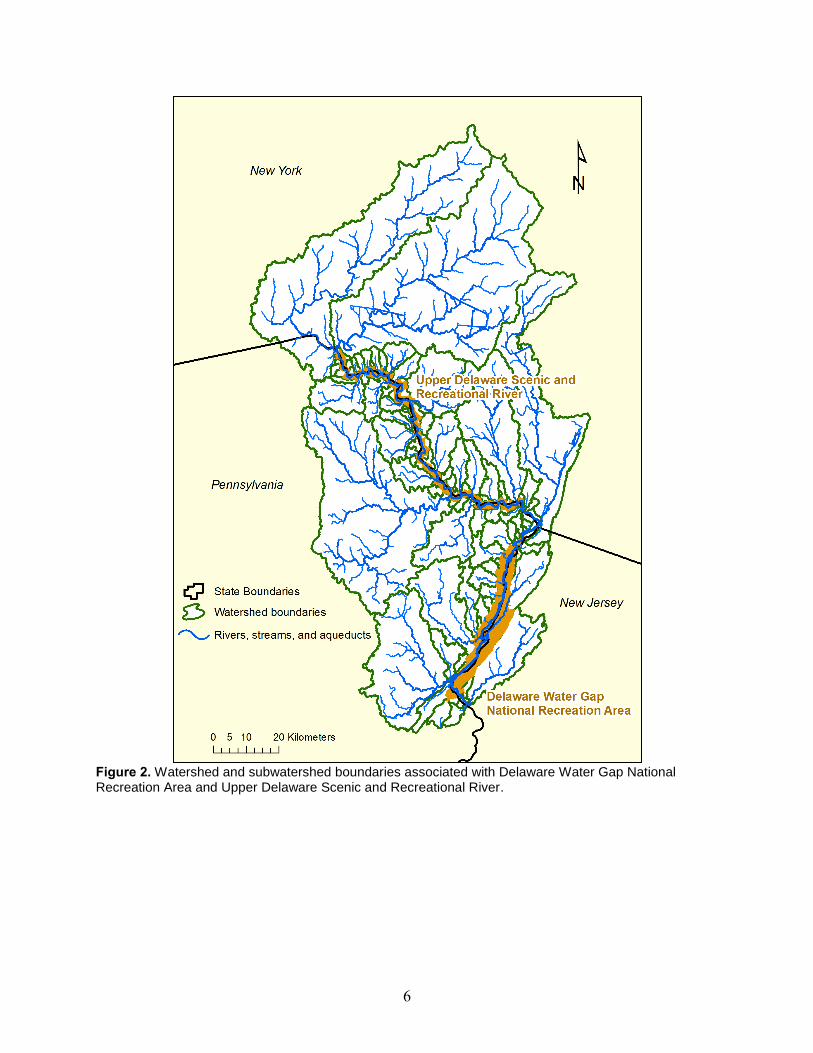
Because the parks both encompass the Delaware River watershed and because subwatersheds within the park are contiguous, we combined the parks into one watershed-based unit for the purpose of the natural resource condition assessment (Figure 2). The watershed scale was selected because watersheds are a well-defined land area having a set of unique features, a system of recurring processes, and a collection of dependent plants and animals.

4
Figure 1a. Delaware Water Gap National Recreation Area, northeastern Pennsylvania.
5
Figure 1b. Upper Delaware Scenic and Recreational River, northeastern Pennsylvania and southeastern New York.
6
Figure 2. Watershed and subwatershed boundaries associated with Delaware Water Gap National Recreation Area and Upper Delaware Scenic and Recreational River.
7
Methods DEWA and UPDE are member parks in the Eastern Rivers and Mountain Network (ERMN) of the Inventory and Monitoring Program of the NPS. This network was formed to facilitate the completion of a comprehensive natural resource inventory and monitoring effort on nine national park lands located within the northeastern United States. Our project builds upon recent work completed by the ERMN that describes and quantifies the indicators of the major ecosystems that occur within parks of this network. These major ecosystems are terrestrial ecosystems (primarily forested uplands), large rivers, and tributary watersheds (Marshall and Piekielek 2005). These three major ecosystems and their indicators became the set of natural resources that were the focus of this natural resource condition assessment.
Objective 1: To determine the subset of ecosystem components (indicators) to represent the overall condition of natural resources within the park.
Through a host of meetings with park natural resource managers and natural resource professionals and researchers, a variety of ecosystem indicators were identified around which to focus inventory and monitoring programs within DEWA and UPDE. Our project built upon recent work completed by the ERMN that described and quantified the indicators of the major ecosystems that occur within parks of this network. These major ecosystems are: terrestrial ecosystems (primarily forested uplands), large rivers, and tributary watersheds (Marshall and Piekielek 2005). These three major indicators of the ecosystems that we chose were: 1) water quality-chemical/physical, 2) water quality-biologic, and 3) landscape. Our project and data collection efforts, therefore, focused on this set of indicators to determine ecological measures, thresholds, and/or reference conditions.
Objective 2: To identify existing sources of scientific data and information useful for evaluating the current condition and trends of selected resources indicators.
To identify existing sources of scientific data and information useful for evaluating the current condition and trends of natural resources all relevant reports and publications were identified by using NatureBIB, cooperation with resource managers, and directly contacting researchers and organizations (e.g., Delaware River Basin Commission [DRBC] and state natural resource agencies) who have conducted projects pertinent to natural resources in the park. In addition, we relied on recently completed conceptual model reports for terrestrial ecosystems, major rivers, and tributaries that were available from the ERMN program (e.g., Marshall and Piekielek 2005). Sources of data included, but were not limited to: DRBC special waters program, water quality and quantity monitoring programs, groundwater studies, and recreational studies. Geo-referenced data needed for the assessment included, but was not limited to, land use type and coverage, current and potential residential/commercial/industrial developments, and watershed boundaries.
We also conducted a limited literature search for articles based on natural resources research conducted in and around DEWA and UPDE. For the literature search, we used electronic databases, reference proceedings of conferences, meetings, and workshops, United States Department of Agriculture (USDA) and NPS technical bulletins, journal articles, and Web sites. Electronic databases used include Agricola, Biological Abstracts®, and Biological and Agricultural Index®. These searches focused on the three major ecosystem indicators (water

8
quality – chemical/physical, water quality – biologic, and landscape) of particular relevance to DEWA and UPDE. Natural resource information was prioritized based on its relevance, importance, and accuracy in order to provide concise and correct baseline narratives and data for the natural resource condition assessment.
Objective 3: To review, compile, and synthesize these data and information sets to ensure that the most pertinent, relevant, and current data are used in the assessment process. Data and information sets include reports, maps, and data, as well as interviews and input from natural resource managers and subject-matter experts. This synthesis required a prioritization of natural resource information in order to provide a concise but accurate baseline narrative for the natural resource condition assessment.
The information contained in the reports and publications was consolidated and synthesized using a Wiki on-line data management tool. The Wiki tool permitted information and data that were extracted from report literature and correspondence to be consolidated and organized. Information on the Wiki was sorted according to natural indicators and measure. The Wiki tool was password protected which permitted the sharing of sensitive data. All data, literature, reports, and personal communication were compiled on the Wiki. This compiled information then became the basis of determining ecological thresholds (if they exist), current condition (if described), prioritizing data, and identifying information gaps for the assessment.
We also used the Wiki tool to standardize and verify Geographic Information Systems (GIS) data layers that would be used for park boundaries, watershed boundaries, and identifying landscape measures in the parks. We worked with DEWA and UPDE staff to ensure that GIS data layers used in our assessment matched those used at the parks. Several land use/land cover data sets exist for DEWA and UPDE, but data that cover the entire watershed condition area of the upper Delaware River are limited. The following should be kept in mind when considering land use and land cover maps used in this effort:
1) Data that cover the entire assessment study area are from national mapping programs using moderate resolution (~1:100,000 scale) Landsat satellite imagery-based interpretations from 2001.
2) Data produced for within park boundaries are from aerial photography (~1:12,000 to ~1:20,000 scale). The finer-scale mapping generally has higher specificity (e.g. land use is mapped in addition to land cover), greater precision (higher number of classes mapped), and more distinct boundaries between classes (vector lines rather than raster pixel representations). However, the limited extent of the fine-scale mapping made it of limited use for this assessment.
3) Generally, Landsat-based satellite land cover maps were used as a primary data source for this assessment, and finer-scale aerial photography based land use and vegetation cover maps were incorporated where possible (for landscape features, for instance). While of coarser scale, the Landsat-based data (MRLC), are consistent over the study area, as well as nationwide.
9
Objective 4. To determine reference condition and ecological thresholds for selected resource indicators. The reference conditions for a resource indicator represent measures of indicator quality (e.g., pH, water temperature) that the indicator would have in the absence of all but very minor human induced disturbances (Egan and Howell 2001). Ecological thresholds are defined as the point at which there is an abrupt change in an ecosystem attribute (living or nonliving feature of the environment) which may produce large responses in an ecosystem (Groffman et al. 2006).
Determining reference conditions can help (1) define what the original or preferred condition (composition, structure, processes, function) was compared to the present; (2) determine what factors caused changes between current and reference condition; (3) define what needs to be done to restore the ecosystem; and (4) develop criteria for determining the success of restoration treatments or experiments (Egan and Howell 2001). There are a variety of ways to determine reference condition; however, we relied primarily on the scientific-based research (literature) and expert opinion. In most cases a well-defined and documented reference condition was not published in the scientific literature. In addition, the DEWA and UPDE watersheds were often assumed in the literature to represent reference condition because they are in the national parks system. Therefore publications (e.g., Van Snik Gray et al. 2005) used these parks to establish a
priori reference conditions. However, for some landscape measures like forest cover and forest fragmentation reference conditions in the northeast have been defined (e.g., Riitters et al. 1999)
In addition to reference condition, ecological thresholds have been suggested for particular ecological measures such as for impervious surface (e.g., Brabec et al. 2002), forest cover (e.g., Kearns et al. 2005), and forest fragmentation (e.g., Riitters et al. 1999). In addition, biological indices have been set for some ecological measures demonstrating when a particular ecological threshold has been exceeded. For example, indices for birds (O’Connell et al. 2000), macroinvertebrates (Klemm et al. 2003), and fish (Van Snik Gray et al. 2005) have been developed to show when a particular watershed or ecosystem has been ecologically impaired.
Objective 5: To develop decision support system (DSS) models (also called knowledge-based system models) that integrate natural resource data and information to provide a comprehensive narrative and graphic (geospatial) watershed-based assessment of the ecological condition of natural resources in the park. This assessment depicts the current natural resource conditions in relation to threshold conditions as well as identifies gaps in knowledge and potential resource threats. These DSS models utilized the analytical capabilities of GIS combined with natural resource data sets to produce graphic (both hardcopy maps and electronic representations) and narrative assessments of watershed conditions in DEWA and UPDE. DSS models have been used extensively in natural resource management to determine condition of ecosystems (http://www.umesc.usgs.gov/dss.html) assist with management decisions (http://www.institute.redlands.edu/emds/) and to prioritize land acquisition based on ecological value (http://www.umass.edu/landeco/research/caps/caps.html) (Boone et al. 2005).
Our objectives and approach may differ from other NRCA conducted at other park units. As a pilot project, our project reflects the original, watershed-focused approach of these assessments. In addition, we decided to use a continuous scale to reflect ecological condition. Assessments conducted at other park units (e.g., Herbert Hoover, Valley Forge) have used discrete cut-off points associated with thresholds. For example, in our approach, a pH above a threshold value is
10
not suddenly ―poor,‖ it is only slightly less ―true‖ (or good) than a pH below our threshold value. Moreover, our assessment examined two natural resource parks that contained 100 watersheds that varied in size and order. We believe it is the only NRCA to provide a tool to examine as many watersheds and ecological features. Finally, we chose only to include indicators in our assessment for which scientifically based (and defendable) thresholds exist. As research progresses on ecological thresholds, more indicators may be added to our model.
To develop our DSS models for natural resource condition assessments at DEWA and UPDE, we used an object-oriented software application developed at Penn State University. This software implements a dependency network approach to develop decision support system models. This software, called NetWeaver™, provides the tools to construct dependency networks within a fully editable graphic representation. When the data associated with an application are spatially referenced, those data and the associated NetWeaver knowledge base can be displayed using the mapping capabilities of GeoNetWeaver™. GeoNetWeaver is able to integrate a variety of support tools (e.g., GIS software, data management software, statistical software), ecological measures (e.g., species richness, species diversity, presence/absence data, biological integrity indices, guild indices), and models (e.g., predictive species models, GAP models) into one system that permits an assessment of watershed conditions at the parks.
As previously mentioned, models in NetWeaver are based on dependency networks which are graphical depictions of rules (Figure 3). At the bottom of a dependency network are data links (e.g., Data 1, Data 2), which are used to hold, fetch, or modify raw data. There are two types of data links; simple and calculated. Simple data links fetch and hold data from various sources (databases, GIS map layers, direct data input, environmental variables, etc.). Calculated data links modify data (e.g., calculate an ecological index from raw data) through networks of calculation nodes chosen from a toolbox of arithmetic, trigonometric, selection, summation, etc. Both types of data link are represented as a square object in a dependency network.
To provide a ―trueness‖ level that can be used in a dependency network, the data within a data link are compared to an ―argument.‖ Arguments can be reference conditions, ecological thresholds or other types of ecological measures (e.g., pH values, water temperature values). NetWeaver provides two types of arguments, the standard argument and the fuzzy argument. The standard argument compares data values against an argument to return a TRUE or FALSE value (or undetermined when the data are absent). An example of a standard argument is presence (TRUE) or absence (FALSE) of a particular species. The fuzzy argument, however, compares data values against a fuzzy set membership function that returns a level of trueness based on the degree of membership in the fuzzy set. In NetWeaver, fuzzy set membership is measured on a scale of -1 (no membership in the fuzzy set TRUE, which is equivalent to 100% FALSE), to 0 (UNDETERMINED in the case of no data or, if there are data provided, it represents 50% membership in the fuzzy set TRUE), to 1 (complete membership in the fuzzy set TRUE which is equivalent to 100% TRUE). There may be up to four break points provided to define a fuzzy argument within a data link. An example of a fuzzy argument is the range of pH that is ideal to support aquatic organisms (Figure 4).

11
Figure 3. A dependency network as represented in NetWeaver. In this dependency network, there are three items of data represented by the squares at the bottom of the figure. Each of the data items is evaluated relative to the degree to which it satisfies its arguments. The network can be read as a rule as follows: “IF Data 1 satisfies the argument Data 1 arg. AND Data 2 satisfies the argument Data 2 arg. OR Data 3 satisfies the argument Data 3 arg. THEN the assertion is true”. The degree to which the assertion is true is a function of the degree(s) to which the individual data satisfy their arguments and the types and arrangements of the logical nodes used within the network.
Figure 4. A fuzzy argument used for interpreting the pH value of a stream. The fuzzy membership is shown on the Y axis with -1 indicating no fuzzy set membership (i.e. False) and 1 indicating complete membership in the fuzzy set (i.e. True). For this example, pH values between 7 and 8 fully satisfy the argument and indicate that the pH is indicative of a healthy stream. pH values less than 5 and greater than 10 are unacceptable pH values for a healthy stream.
Fuzz
y se
t mem
bers
hip
pH Value

12
Within NetWeaver, data links are connected to logical nodes and the whole of a dependency network can be read from left to right as a syllogism or rule (simplest case, IF X THEN Y). The logical nodes typically consist of "AND" and "OR" nodes, but may also include ―SOR‖
(Sequential OR), ―XOR‖ (Exclusive OR), and ―NOT‖ nodes (Table 1). The ability to calculate partial results given incomplete data is useful in making decisions regarding the most effective and efficient means of gathering missing data. This is a powerful tool in the arena of natural resource management, where resource managers commonly deal with missing/incomplete data.
Model development began with defining the set of ecosystem indicators to evaluate. Data and information related to these indicators and their measures were consolidated into the Wiki tool. These data were then screened, cleaned, and checked for accuracy. The screened, cleaned, and accurate data were then transferred into an organized format within the DSS model.
Once we determined reference conditions and potential thresholds for the natural resource condition assessment, the DSS model could compare current and reference conditions or compare current condition to threshold values based on a range of arguments and depict a logical relationship between data and conclusions (Saunders et al. 2005). The overall condition of a particular watershed was determined by elucidating the boundaries of the watershed and calculating a condition assessment of a combination of ecosystem indicators within that boundary via a geospatial analyses. Again, for our DSS model, we used three major ecosystem indicators and associated reference conditions (if known) or ecological thresholds. These ecosystem indicators were water quality - chemical/physical, water quality - biologic, and landscape. These three indicators were weighted equally in the model.
Table 1. The NetWeaver logical node types and their function.
OR An OR node is true when any one of its antecedents is true. It is false when all of its antecedents are false. Functionally, it passes the value of its most true antecedent.
AND An AND node is true when all of its antecedents are true. It is false when any one of its antecedents is false. Functionally, it performs a weighted average of the values of its antecedents unless one of the antecedents is fully false.
NOT A NOT node simply inverts the value of its antecedent.
SOR A SOR node (sequential OR) is a special class of node designed to select between alternative decision scenarios where there is a definite hierarchy of quality level associated with each possible data gathering method. In other words, the SOR node is a data route selector; it provides a method for selecting the best choice of paths within the scope of the currently given data. For example, the preferred path may involve decision making on the basis of acid neutralizing capacity (ANC), but if ANC is missing, then the decision can be based on an alternate parameter such as conductivity or pH. Connections to the antecedents of a SOR node are represented with dotted lines to indicate their relative position in the hierarchy.
XOR A XOR node (exclusive OR) is true when one and only one of its antecedents is true.

13
Results and Discussion Scale of Assessment We developed watershed-specific DSS models at DEWA and UPDE that also could be "rolled-up" into a parkwide assessment of natural resource condition. These watersheds included the 100 major and minor tributaries present at each park in addition to the main stem of the Delaware River. Watersheds were the logical scale at which to direct model development because they naturally incorporate aquatic and terrestrial indicators, are ecologically meaningful, and lend themselves well to comparisons with other natural resource agency programs (e.g., EPA, USFS, Delaware River Basin Commission, NY Department of Environmental Conservation). In addition, many data were already being collected at the watershed level within each park. Despite the use of watersheds as the initial scale of analyses, the DSS models can be utilized to combine watersheds for larger scale analyses. Details of the sources for all individual measures are referenced within the model documentation on the enclosed CD. This documentation can also be generated from GeoNetWeaver when running the DEWA and UPDE Watershed Condition Assessment DSS.
Each watershed boundary roughly corresponds to a named stream flowing into each park and was based primarily on topography using digital elevation maps (L. Morelock, DEWA, pers. comm., 2009). Watersheds can be any size and shape, depending on the outlet (or pour point) selected and land topography. We used topographically based watersheds versus hydrologic unit codes (HUCs-developed by the U.S. Geological Survey) because the topographic watershed was the basis of previous work conducted in the park and the HUC system may not provide the level of resolution desired in our analyses. By using the topographically defined watershed approach, our dataset contains a mix of catchment areas and stream orders. Comparisons across watersheds should therefore be taken with this in mind, as many landscape pattern metrics are area based. For example, there is a greater likelihood of having larger forest patch sizes in larger watersheds, and the diversity of forest habitat types could be larger in larger watersheds just by random chance alone. In addition, measures such as aquatic macroinvertebrate and community composition may not be directly comparable across catchments in this dataset since they are themselves correlated to stream size and flow.
There are 100 watersheds in our dataset, each with a unique identification number (―unique_num‖) (Table 2). These ID numbers were assigned by the NPS. The direct drainages to the Delaware River were divided at water quality sampling locations along the mainstem. Smaller watersheds were merged into the direct drainages if no stream line appeared on USGS topographic maps. Codes for direct drainage ID numbers start with ―4‖ (e.g. 42250.85).
14
Table 2. Unique ID numbers, corresponding watershed names (if any), and park in which located.
Identification Number Watershed Name Park 11258.45 Shingle Kill UPDE
11261.1 Mongaup River UPDE
11264.7 Fish Cabin Creek UPDE
11266.75 Mill Brook UPDE
11268.13 Hillside Creek UPDE
11273.5 Halfway Brook UPDE
11275.45 Beaver Brook UPDE
11278 aka "York Lake Falls" UPDE
11279 Narrow Falls Brook UPDE
11281.4 Grassy Swamp Brook UPDE
11284 Trusten Creek UPDE
11296.87 Mitchell Creek UPDE
11303.3 Callicoon Creek UPDE
11310.5 Hankins Creek UPDE
11313.5 Basket Creek UPDE
11314.33 Hoolihan Creek UPDE
11315 Pea Brook UPDE
11317.8 aka "Piss Willy Falls Creek" UPDE
11318.3 Bouchoux Brook UPDE
11320.4 Abe Lord Creek UPDE
11321 Humphries Brook UPDE
11325.5 Blue Mill Stream UPDE
11330 East Branch Delaware River UPDE
11330.2 West Branch of the Delaware River UPDE
12257.13 Upper Brook UPDE
21258.4 Bush Kill UPDE
21258.45 Millrift Creek UPDE
21266.3 Pond Eddy Creek UPDE
21269.9 Lake Creek UPDE
21273.4 Shohola Creek UPDE
21274.5 Panther Creek UPDE
21277.7 Lackawaxen River UPDE
21280.24 Westcolang Creek UPDE
21282.9 Masthope - Rattlesnake Creek UPDE
21289 Peggy Run UPDE
21289.4 Atco Creek UPDE
21295.75 Caulkins Creek UPDE
21298.2 Beaverdam Creek UPDE
21299 Schoolhouse Creek UPDE
21301.4 aka "Kaufman Slough" UPDE
21302.14 aka "Tammany Flats" UPDE
21304.7 Hollister Creek UPDE
21311.1 Cooley Creek UPDE
21312.2 Little Equinunk Creek UPDE

15
Identification Number Watershed Name Park 21319.5 Weston Brook UPDE
21322 Equinunk Creek UPDE
21322.05 Factory Creek UPDE
21327 Stockport Creek UPDE
21327.75 Shingle Hollow Creek UPDE
22250.3 Rosetown Creek PORT JERVIS
23190.5 Martins Creek DEWA
23209.5 Slateford Creek DEWA
23212.3 Caledonia Creek DEWA
23213 Brodhead Creek DEWA
23213.00.5 Marshalls Creek DEWA
23213.9 Cherry Creek DEWA
23214.5 Shawnee Creek DEWA
23226.5 Bushkill Creek DEWA
23227.5 Randall VanCampens DEWA
23226.90.8 Little Bushkill Creek DEWA
23228.15 Denmark Creek DEWA
23230 Toms Creek DEWA
23232 Heller Creek DEWA
23233 Mill Creek DEWA
23233.5 Alicias Creek DEWA
23234.5 Spackmans Creek DEWA
23236.2 Hornbecks Creek DEWA
23239 Dingmans Creek DEWA
23240.24 Adams Creek DEWA
23241.15 Dry Brook DEWA
23242.65 Conashaugh Creek DEWA
23244.06 Raymondskill Creek DEWA
23247.23 Sawkill Creek DEWA
23247.5 Vandermark Creek DEWA
23249.33 Crawford Branch DEWA
23250.15 Cummins Creek DEWA
24207.5 Jacoby Creek N/A
32253.5 Neverskink River DEWA
33208.8 Stony Brook DEWA
33211.5 Dunnfield Creek DEWA
33220 Vancampens Brook DEWA
33225.15 Flat Brook DEWA
33245.9 Whitebrook Creek DEWA
33246.23 Shimers Creek DEWA
34207.2 Paulins Kill N/A
41209.99 Direct Drainage UPDE
41258.69 Direct Drainage UPDE
41266.37 Direct Drainage UPDE
41279.86 Direct Drainage UPDE
41303.72 Direct Drainage UPDE
16
Identification Number Watershed Name Park 41321.03 Direct Drainage UPDE
42250.85 Direct Drainage PORT JERVIS
42255.18 Direct Drainage PORT JERVIS
43210.52 Direct Drainage DEWA
43212.53 Direct Drainage DEWA
43218.05 Direct Drainage DEWA
43228.36 Direct Drainage DEWA
43239.45 Direct Drainage DEWA
43246.62 Direct Drainage DEWA
44206.9 Direct Drainage N/A
N/A - represents watersheds that drain into the mainstem of the Delaware River but fall outside park boundaries.
Natural Resource Assessment Model Indicators Our natural resource condition assessment for DEWA and UPDE contained two distinct parts. The first was an overall assessment of natural resource condition based upon selected ecosystem indicators for which reference condition and/or ecological thresholds have been independently established and accepted by the scientific community for use in the northeastern or mid-Atlantic United States. The second part of our assessment was inclusion of a large set of natural resource descriptors for which thresholds have not been established but may provide useful natural resource information to park managers.
The overall natural resource condition assessment included threshold-based assessments for three indicators for a particular watershed:
Water quality (WQ) – chemical and physical measures
Water quality (WQ) – biologic measures
Landscape
Overall Assessment
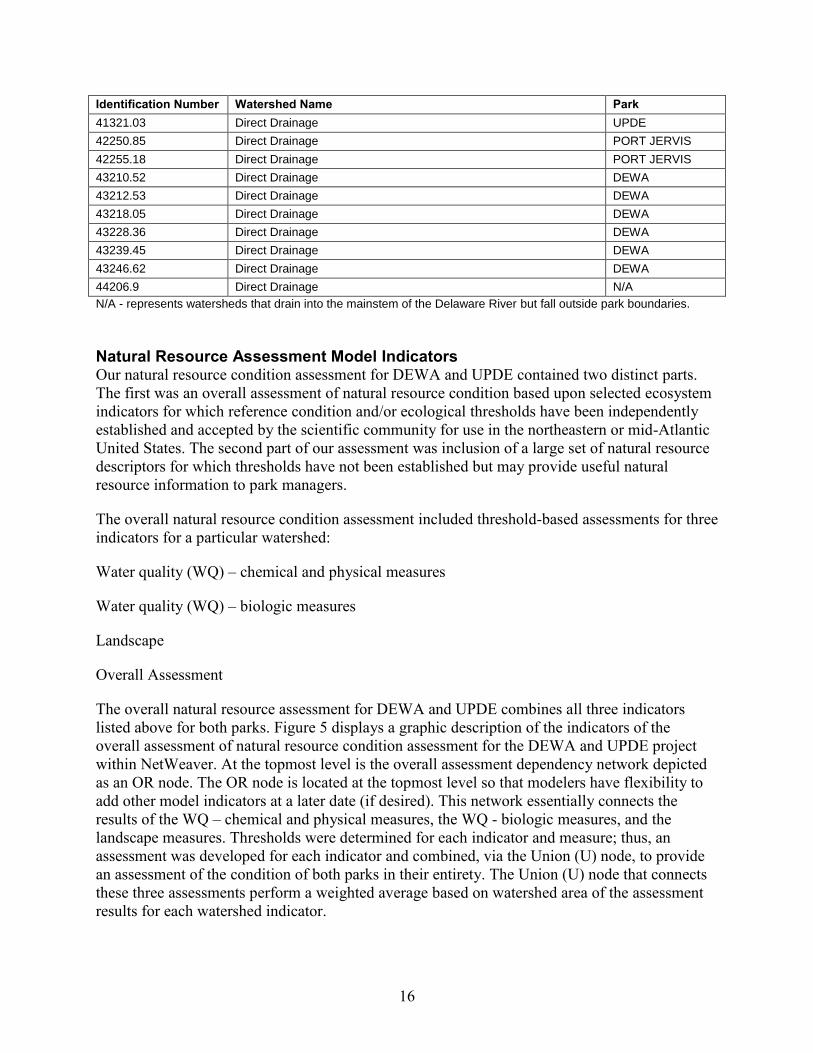
The overall natural resource assessment for DEWA and UPDE combines all three indicators listed above for both parks. Figure 5 displays a graphic description of the indicators of the overall assessment of natural resource condition assessment for the DEWA and UPDE project within NetWeaver. At the topmost level is the overall assessment dependency network depicted as an OR node. The OR node is located at the topmost level so that modelers have flexibility to add other model indicators at a later date (if desired). This network essentially connects the results of the WQ – chemical and physical measures, the WQ - biologic measures, and the landscape measures. Thresholds were determined for each indicator and measure; thus, an assessment was developed for each indicator and combined, via the Union (U) node, to provide an assessment of the condition of both parks in their entirety. The Union (U) node that connects these three assessments perform a weighted average based on watershed area of the assessment results for each watershed indicator.
17
Figure 5. The dependency network for the overall assessment of watershed condition. This network determines the weighted average of the WQ - Chemical/Physical, WQ - Biologic, and the Landscape measures.
To assess the condition of the water quality – chemical and physical indicator, we used a water quality index that combines several physical measures of water quality. For the assessment of water quality-biologic indicator we used macroinvertebrate indices. Finally, for the assessment of the landscape indicator we used percent forest fragmentation and percent impervious surface within a watershed. These indicators and individual measures were chosen based on the availability of data and science-based thresholds and based on best professional opinion of subject matter experts and natural resource managers at the parks.
The second part of our natural resource assessment contains numerous measures of natural resources for which thresholds have not been independently established for comparison. For example, a measure of the ―number of rare species present within a watershed‖ is informative, but there is no reference condition or ecological threshold associated with this number that could be used to assess the overall condition of a park or watershed. For example, the presence of rare species could indicate over-exploitation or it may simply indicate the presence of unique geology (or other natural features) that permit certain rare species to occur. These measures that are not linked to thresholds, however, provide a description of current condition and, over time, may provide a baseline condition against which resource managers can assess natural resource change in the parks. Therefore, these measures are available in the DSS model, primarily as presence/absence data, but are not part of the overall natural resource assessment portion per se.
Water Quality – Chemical/Physical <file:WQ - Chemical/Physical.html (available on enclosed CD)>
Determining what measures to include to assess the condition of water quality in DEWA and UPDE was a difficult task. To date, several commissions and agencies have attempted to evaluate the chemical and physical measures of water quality in and around the parks. For example, the Delaware River Basin Commission (DRBC) uses 14 measures to determine standards of existing water quality for the Delaware River. In addition, these measures are used to designate the Delaware River as special protection waters. As special protection waters, these

18
measures may not decline from existing values. The special protection waters measures are: dissolved oxygen, biological oxygen demand, fecal coliform, conductivity, total phosphorus, total nitrogen, ammonia nitrogen, total suspended solids, total dissolved solids, pH, hardness/heavy metals, turbidity, manganese, and iron. Again, these measures are used to determine the existing water quality standards in the mainstem of the Delaware river only and there are no thresholds associated with these measures to indicate water quality in relation to a reference condition. Data are currently being collected by the DRBC to re-evaluate the existing condition to determine if current water quality is appropriate for designating special protection waters. Work on these data should be completed in 2012.
In addition to special protection waters status, the USGS, in cooperation with the New Jersey Department of Environmental Protection (NJ DEP) and the North Jersey Resource Conservation and Development Council, evaluated surface water quality in and around DEWA and UPDE by examining nine measures: temperature, pH, dissolved oxygen, dissolved solids, suspended solids, nitrate plus nitrite, un-ionized ammonia, total phosphorus, and fecal coliform bacteria. These values were compared to water quality standards for the state of New Jersey which are consistent with the protection of aquatic life or drinking water standards—they do not necessarily represent reference or natural condition. Such standards are mirrored by New York Department of Natural Resources (NY DNR) and Pennsylvania Department of Environmental Protection (PA DEP). In fact, all states have set some water quality standards that are based upon values using threshold concentration (TEC) below which adverse effects on aquatic organisms (plants, fish, invertebrates) and aquatic sediment dwelling organisms are not expected to occur. These are not necessarily reflective of the reference condition for streams in and around DEWA and UPDE. In all of these approaches (DRBC, USGS, NJ DEP, NY DNR, PA DEP), water quality indicators are evaluated separately (not combined). In order to assess the overall health of water quality in DEWA and UPDE, we searched for an index that would combine a variety of water quality measures into one interpretable value.
Kaurish and Younos (2007) developed a standardized water quality index for evaluating surface water quality that combines nine water quality measures (biological oxygen demand [BOD], dissolved oxygen [DO], fecal coliforms, nitrate, pH, temperature change, total suspended solids, total phosphate, and turbidity) into one value. This water quality index (WQI) is a science-based approach to interpreting water monitoring data and may be used to facilitate rapid transfer of information to water resource managers and the general public. The proposed WQI also provides a scientifically credible means to determine the cause/effect relationship between water quality and health condition of streams. The 100-point WQI can be divided into several ranges corresponding to general descriptive terms for water quality (Table 3).
Table 3. Water Quality Index scores and associated water quality based upon Kaurish and Younos (2007).
Range Water Quality 90-100 Excellent
70-90 Good
50-70 Medium
25-50 Bad
0-25 Very bad

19
Like the DRBC and state approaches to developing standards for water quality measures, the WQI is based upon threshold concentration values below which adverse effects on aquatic organisms are not expected to occur. Therefore, the WQI is not necessarily reflective of the reference condition of streams in and around DEWA and UPDE. Furthermore, the WQI is often used to assess wastewater discharge standards—so may be more conservative for water quality measures than reference condition of DEWA and UPDE streams. However, the WQI does permit the calculation of an overall index to combine multiple water quality measures.
Upon opening the network for WQ – chemical and physical measures within NetWeaver, we find the topmost level of the logic model is an OR node (Figure 6). Again, an OR node is provided to permit easy addition to the Union node of other measures (if developed or desired) to this indicator. As it currently is structured, this network simply reports the result of the calculation of the Water Quality Index (WQI) as that is the index we used to assess the chemical and physical indicators of water quality in the parks.
Figure 6. The topmost dependency network for WQ - Chemical/Physical. This network provides an easy platform for the addition of additional measures of WQ - Chemical/Physical by hanging those measures from the Union node. As it is presently configured, this network simply reports the result of WQI - Water Quality Index score.
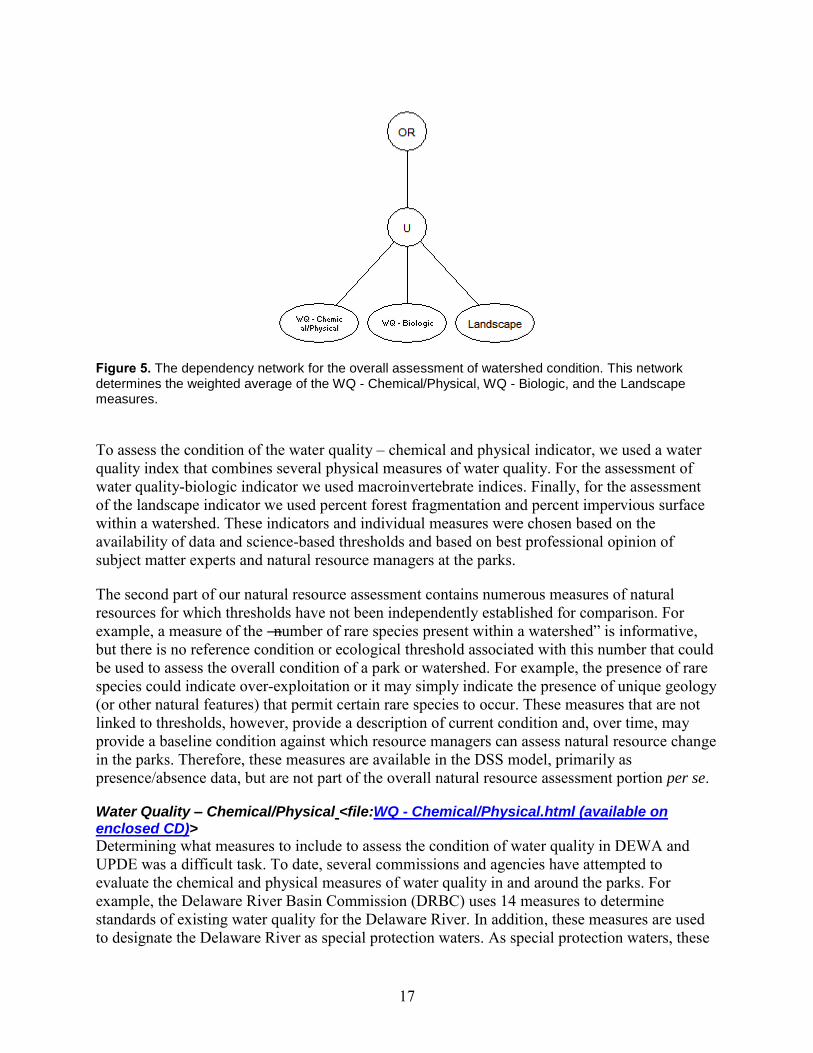
Upon opening the network for WQI - Water Quality Index, we see a calculated data link named WQI-Score (Figure 7). Within this datalink are the calculations associated with determining the Water Quality Index, depicted as "Q" values. The result of these calculations is then compared to a fuzzy argument that assigns a fully false value for WQI values less than or equal to 25, and a fully true value for WQI values greater than or equal to 90. This argument was derived from information provided from the internet site; http://www.water-research.net/watrqualindex/index.htm and from the original WQI model proposed by Kaurish and Younos (2007). For WQI values between 25 and 90 there is an increasing level of ―trueness‖
as the value approaches 90 (excellent water quality).
20
Figure 7. The dependency network for WQI - Water Quality Index. This network contains a calculated data link that contains the rubric for determining the Water Quality Index. The argument establishes breakpoints for evaluating the WQI score with False assigned to scores of 25 or less and True assigned to scores of 90 or more.
Opening the WQI-Score calculated data link reveals the WQI rubric (Figure 8). This network uses a Sequential OR node (SOR) to choose among two options. The preferred option is always oriented to the left of the SOR node and, in this case, the ―Wiki_TribChem2000_WQI database‖ (NY DEC 2004) is the preferred source of the WQI score. If no published WQI score for a watershed is contained in this database, the network provides the option to enter raw data in order to calculate a WQI score. The WQI-Component Aggregation value (discussed below) is added to 1 and multiplied by 50 to achieve a WQI Q score. Details of this calculation can be found at: http://www.water-research.net/watrqualindex/index.htm.
When opened, the WQI-Component Aggregation reveals the individual measures used in calculating a WQI and the weighting applied to those measures (Figure 9). All these weighted component values (except for missing data, which have a value of zero, not -1) are averaged via the ave-nz (average - non zero) node. An ave-nz node in NetWeaver aggregates the individual measures to calculate an overall WQI score. However, an ave-nz node only considers measures whose values are non-zero. In the case of the WQI, a missing value (no data) also has a value of zero, so it is not figured in the result. Each individual measure in this network potentially can be supplied with data from several sources. For illustration purposes, we will show how data sources are connected to the component that deals with one of nine individual measure in the WQI: biological oxygen demand (WQI-BOD).

21
Figure 8. The WQI - Water Quality Index Score calculated data link. A SOR node checks for existing WQI scores in a wiki database. If present, this score is used. If not present, another calculated datalink permits the entry of raw data (either by hand or from existing databases) where an aggregate value is derived. This value is added to one and multiplied by 50 to achieve the WQI score.
Figure 9. The WQI - Water Quality Index Component Aggregation calculated data link. This permits the values for each component of the WQI calculation to be acquired from data sources (if available) and multiplied by the weighting factor associated with the calculation of a WQI. Weighting factors can be seen on the lines connecting the individual component to the ave-nz node, which will calculate the average of all non-zero weighted values (i.e. all values but those which are absent from data bases).

22
Figure 10. The BOD WQI Q Value calculated data link. As configured, this simply reports the value for the BOD data link, but contains a sequential or node (SOR) for attaching future alternatives to calculating this value.
Figure 11. The dependency network for WQI-BOD. This network contains a single calculated data link that contains the calculations needed to derive the WQI Q value for BOD.
23
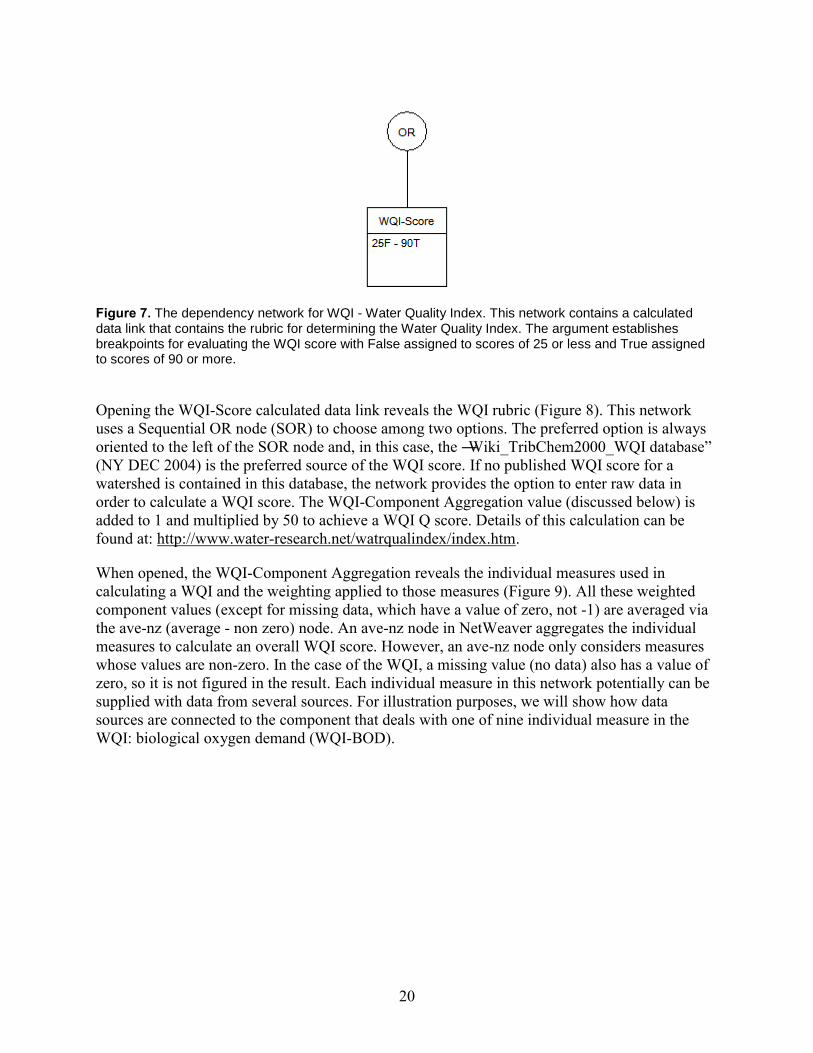
Opening the BOD WQI Q Value calculated data link, we find again an ―=‖ network node designed to facilitate future additions to this model (figure 10). This network also contains a sequential or SOR node from which other approaches to calculating BOD values (or other sources of BOD data) can be attached. As the network is currently configured, it simply reports a calculated value for BOD that was developed for the WQI by Kaurish and Younos (2007); http://www.water-research.net/watrqualindex/index.htm. Relationships between field measurements of BOD and expert opinion regarding the ecological thresholds for BOD are depicted in Figures 11 and 12. The x-axis represents the field measurement of BOD, and the y-axis represents the consensus value for the water quality this measure indicates. It is this value, ranging from near zero (i.e. 2) for high BOD measures to 100 for very low BOD values that is then compared to the 25F–90T argument used in the BOD WQI Q Value calculated data link (Figure 11).
If one opens the BOD calculated data link, it reveals the data sources and the order in which those sources are used (Figure 13). The sequential or (SOR) node looks at the databases hanging beneath it from left to right. Once data for BOD are found for a particular watershed it is used, and any values present in the databases to the right are ignored. In order of use, the most desired source of data is ―Wiki_TribChem2000_BOD_5_Day‖ (NY DEC 2004), followed by ―Storet_BOD_Biochemical oxygen demand mg_l‖, and finally river gauge data ―USGS00310 BOD water unfiltered 5 days at 20C mg_l.‖ The prioritization of datasets was determined from input from natural resource staff at DEWA and UPDE.
For all the other measures (e.g., dissolved oxygen [DO], fecal coliforms) of the WQI Component Aggregation calculated data link (Figure 9) similar approaches are used. Each approach uses an expert opinion to derive fuzzy argument for how to relate the various measure scores to water quality (e.g., Figure 12), as well as an array of available data sources to supply the information for that individual measure. For complete descriptions of these arguments and data sources, please refer to the complete model documentation on the enclosed CD.
Water Quality - Biologic (Macroinvertebrates) <file:WQ - Biologic.html (available on enclosed CD)>
We wanted to incorporate a second method of evaluating water quality. We were not just interested in the physical aspects of the water but the biological integrity of the waterways as well. Biological integrity in the context of waterways is defined as the ability of the stream/river to support and maintain a balanced, integrated, adaptive community of organisms having a species composition, diversity, and functional organization comparable to that of a natural habitat of the region (Daniels et al. 2002, Karr 1991, Southerland et al. 2007). In waterways, biological integrity has been measured using biotic indices related to macroinvertebrates and fish communities. At DEWA and UPDE we chose not to use fish indices (although they have been developed for PA and the mid-Atlantic–see Van Snik et al. 2005) because it was difficult to determine what the natural community of fish in DEWA and UPDE should be. In addition, in the mid-Atlantic, DEWA and UPDE were used to develop fish indices; thus, assuming a priori that the DEWA and UPDE streams were not ecologically impaired. Currently, approximately 60% of the fish present in the park are nonnative (hence, not representative of natural community). However, these fish are important in fulfilling the recreational objective of the parks’ founding
24
Figure 12. The fuzzy argument WQI-BOD used in the calculated data link BOD. This curve is derived from the expert opinion of water quality experts regarding the relationship between stream collected BOD values (x) and water quality (y).
Figure 13. The calculated data link for BOD. This network is used to select available data from among three potential sources. The sequential or node (SOR) will use data with highest priority given to the leftmost link. If there are no data in that source, the SOR node will look to the next link to the right and so on.
legislation. Although DEWA has been recognized as one of the few areas in the northeast still harboring native brook trout—ongoing genetic research must be completed to identify what proportion of the parks’ brook trout are truly native or ―natural.‖
We chose to use the aquatic macroinvertebrate indices, Ephemeroptera, Plecoptera, and Trichoptera (EPT), and Hilsenhoff Biologic Index (HBI) to assess the biological integrity of waterways at DEWA and UPDE (Patrick Center for Environmental Research 2001). The choice of these indices was based upon research recently completed by the Academy of Natural Sciences in DEWA and UPDE. This bioassessment study examined the relationship between stream macroinvertebrates and microhabitat characteristics as well as examining the correlation among indices used to assess biological integrity. Based on their analyses, EPT was correlated with overall taxa richness and Hilsenhoff was correlated with the North Carolina Biotic Index—
x y 0 100
5 55
10 35
15 20
20 12
25 8
30 5
35 2

25
an index developed using east coast taxa. Due to these correlations and the availability of data in the parks, EPT and Hilsenhoff Index (HBI) were chosen as indicator measures and to avoid redundancy. EPT taxa richness is the number of taxa from the insect orders Ephemeroptera, Plecoptera, and Trichoptera. These orders are generally considered pollution sensitive and values are usually depressed in polluted ecosystems.
The EPT index also is being used in other countries and continents (e.g., New Zealand [Quinn and Hickey 1990]). Widespread use of this metric may be due to its inclusion in EPA' s rapid bioassessment protocols (Plafkin et al. 1989). Wallace et al. (1996) endorsed use of the EPT metric because it was easy to use, it was stable at reference sites and it effectively tracked changes in water quality. An EPT index of > 27 indicates excellent water quality; 21-27 good water quality; 14-20 good-fair water quality; 7-13 fair water quality; and 0-6 poor or ecologically impaired water quality.
The HBI uses the relative organic pollution tolerance of all taxa and their relative abundance to assign a numerical value to aquatic communities. As opposed to the EPT index, the HBI value ranges from 0-10 with lower values indicative of a community dominated by highly sensitive organisms and high values indicative of dominance by pollution-tolerant organisms (Hilsenhoff 1987; Plafkin et al. 1989).
Upon opening WQ - Biologic in NetWeaver, we again find a network that simply reports the value of lower level network(s) represented by an OR node (Figure 14). This level is provided to permit easy addition to the Union node of other measures (if developed or desired) to the WQ - biologic indicator. As it currently is structured, this network simply reports the result of the calculation of the dependency network, Macroinvertebrates.
When the dependency network Macroinvertebrates is opened, it is found to contain a sequential or (SOR) node connected to EPT eval[uation] and HBI eval[uation] networks (Figure 15). Given its position on the left side of the SOR node, the EPT eval[uation] routine is given priority over the Hilsenoff eval[uation] routine. Resource managers at DEWA and UPDE chose to use EPT over HBI because EPT is a better index for the type of threats that affect water quality in the parks. In addition, research by the Philadelphia Academy of Sciences determined that within DEWA and UPDE many macroinvertebrate indices are redundant and EPT provided the best index of biologic health at the parks (Patrick Center for Environmental Research 2001).
EPT Species Richness: The EPT eval[uation] network contains a fuzzy node that compares EPT values present in various data sources for watersheds within DEWA and UPDE (Figure 16). In this example, the argument against which the calculated data link ―EPT Taxa Found‖ is compared ranges from 0 (= False) to greater than or equal to 16 (=True). The ―EPT Taxa Found‖ calculated data link will search the various data sources for reported EPT scores for the parks.
26
Figure 14. The topmost dependency network for WQ - Biologic. This network provides an easy platform for the addition of additional measures of WQ - Biologic (e.g., fish, aquatic mammals) by hanging those measures from the Union node. As it is presently configured, this network simply reports the result of Macroinvertebrates.
Figure 15. The Macroinvertebrate dependency network. This network contains complementary approaches to assessing the biotic integrity of aquatic systems using aquatic macroinvertebrates as measures of water quality. If there is no data to support EPT eval[uation], this network will report the results from the Hilsenhoff eval[uation].

27
Figure 16. The EPT eval[uation] dependency network. This network compares values returned from various data sources vial the calculated data link EPT Taxa Found, against a fuzzy argument ranging from False at 0, to True for values of 16 or greater.
Opening the calculated data link, ―EPT Taxa Found‖ reveals the data sources and their priority for use. Data sources include (from most preferred to least preferred) wiki_PatrickCenter_EPT_Taxa_Richness (Patrick Center for Environmental Research 2001), wca_wiki_Macroinvertebrate_EPT_Richness (NY DEC 2002), EPT Taxa – Lit 3 (Kennen and Ayers 2002), and EPT Taxa – Lit 4 (Ersbak 2006) (Figure 17).
Hilsenhoff Biotic Index: The less preferred routine for calculating biologic water quality is the Hilsenoff Biotic Index. This index is considerably more complicated than EPT, in that it considers not only the various taxa found, but also factors in the organic pollution tolerance of the various species. From the macroinvertebrates dependency network (Figure 14), one can open the Hilsenhoff eval[uation] dependency network (Figure 15). As in EPT eval[uation], we used a fuzzy node to construct our argument for interpreting Hilsenhoff scores. In this argument (lower scores are better than higher scores), values of 3.5 or less are ideal (i.e. True), and values of 5.51 or greater indicate some ecological impairment (i.e. False; Table 4). Note that the structure of this network is very similar to that of EPT eval[uation] (Figure 18)
The calculated data link, Hilsenhoff score opens to reveal that there are two sources from which it can acquire data (Figure 19). The preferred source is wiki_PatrickCenter_Hilsenhoffs_BI_mean (Patrick Center for Environmental Research 2001).

28
Figure 17. The “EPT Taxa Found” calculated data link. This network provides the data to be compared to the fuzzy argument detailed in Figure 12. The priority with which the data are selected goes from left to right (i.e. most preferred to least preferred)
Table 4. Hilsenhoff Biotic Index score and corresponding levels of water quality and organic pollution.
Biotic Index Water Quality Degree of Organic Pollution
0.00-3.50 Excellent No apparent organic pollution
3.51-4.50 Very good Possible slight organic pollution
4.51-5.50 Good Some organic pollution
5.51-6.50 Fair Fairly significant organic pollution
6.51-7.50 Fairly poor Significant organic pollution
7.51-8.50 Poor Very significant organic pollution
8.51-10.00 Very poor Severe organic pollution
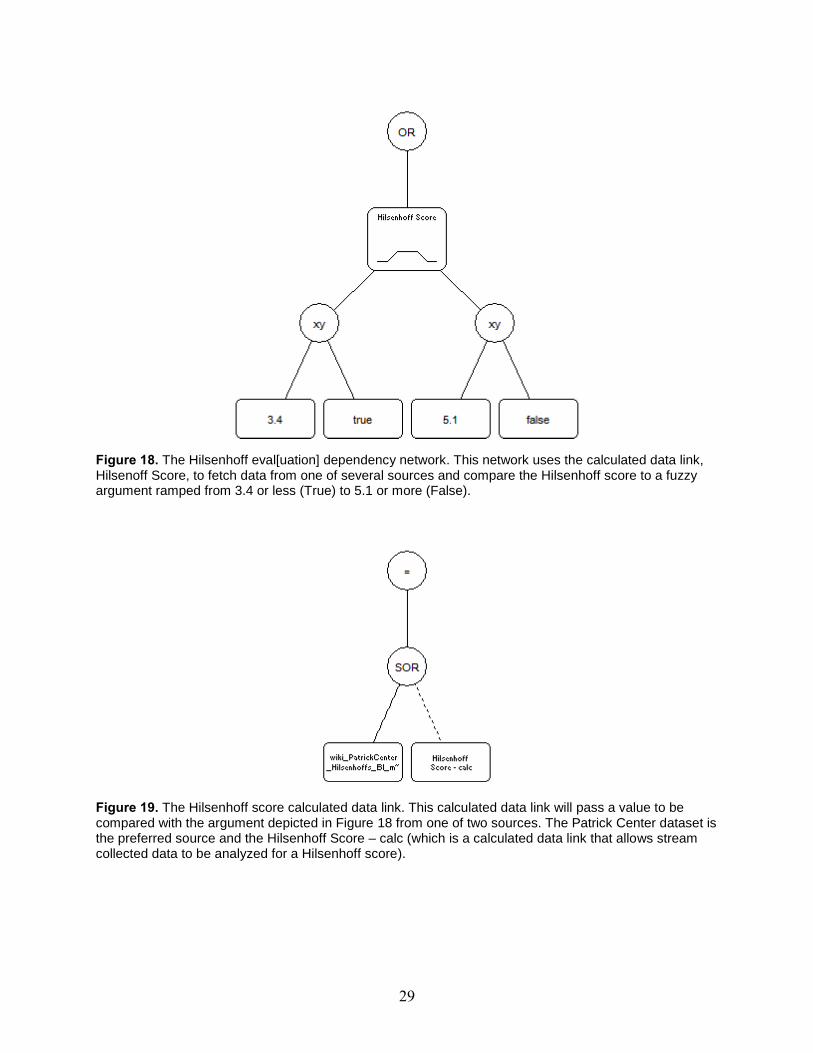
29
Figure 18. The Hilsenhoff eval[uation] dependency network. This network uses the calculated data link, Hilsenoff Score, to fetch data from one of several sources and compare the Hilsenhoff score to a fuzzy argument ramped from 3.4 or less (True) to 5.1 or more (False).
Figure 19. The Hilsenhoff score calculated data link. This calculated data link will pass a value to be compared with the argument depicted in Figure 18 from one of two sources. The Patrick Center dataset is the preferred source and the Hilsenhoff Score – calc (which is a calculated data link that allows stream collected data to be analyzed for a Hilsenhoff score).
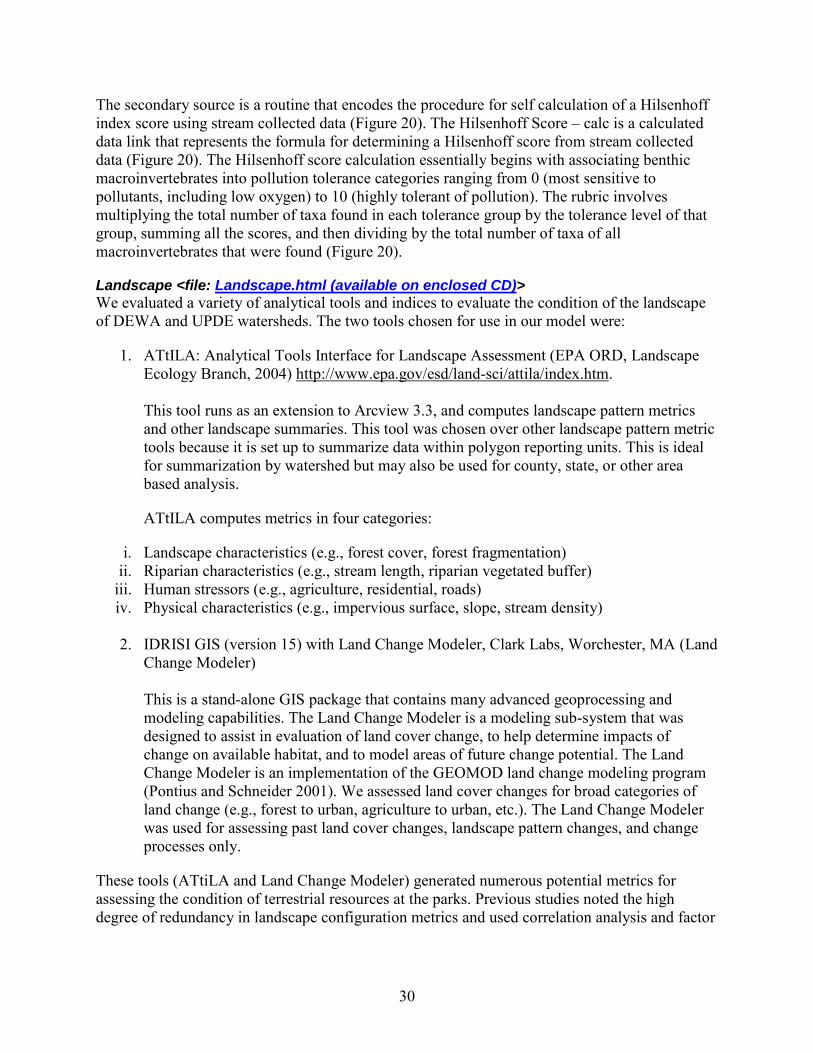
30
The secondary source is a routine that encodes the procedure for self calculation of a Hilsenhoff index score using stream collected data (Figure 20). The Hilsenhoff Score – calc is a calculated data link that represents the formula for determining a Hilsenhoff score from stream collected data (Figure 20). The Hilsenhoff score calculation essentially begins with associating benthic macroinvertebrates into pollution tolerance categories ranging from 0 (most sensitive to pollutants, including low oxygen) to 10 (highly tolerant of pollution). The rubric involves multiplying the total number of taxa found in each tolerance group by the tolerance level of that group, summing all the scores, and then dividing by the total number of taxa of all macroinvertebrates that were found (Figure 20).
Landscape <file: Landscape.html (available on enclosed CD)>
We evaluated a variety of analytical tools and indices to evaluate the condition of the landscape of DEWA and UPDE watersheds. The two tools chosen for use in our model were:
1. ATtILA: Analytical Tools Interface for Landscape Assessment (EPA ORD, Landscape Ecology Branch, 2004) http://www.epa.gov/esd/land-sci/attila/index.htm.
This tool runs as an extension to Arcview 3.3, and computes landscape pattern metrics and other landscape summaries. This tool was chosen over other landscape pattern metric tools because it is set up to summarize data within polygon reporting units. This is ideal for summarization by watershed but may also be used for county, state, or other area based analysis.
ATtILA computes metrics in four categories:
i. Landscape characteristics (e.g., forest cover, forest fragmentation) ii. Riparian characteristics (e.g., stream length, riparian vegetated buffer)
iii. Human stressors (e.g., agriculture, residential, roads) iv. Physical characteristics (e.g., impervious surface, slope, stream density)
2. IDRISI GIS (version 15) with Land Change Modeler, Clark Labs, Worchester, MA (Land
Change Modeler) This is a stand-alone GIS package that contains many advanced geoprocessing and modeling capabilities. The Land Change Modeler is a modeling sub-system that was designed to assist in evaluation of land cover change, to help determine impacts of change on available habitat, and to model areas of future change potential. The Land Change Modeler is an implementation of the GEOMOD land change modeling program (Pontius and Schneider 2001). We assessed land cover changes for broad categories of land change (e.g., forest to urban, agriculture to urban, etc.). The Land Change Modeler was used for assessing past land cover changes, landscape pattern changes, and change processes only.
These tools (ATtiLA and Land Change Modeler) generated numerous potential metrics for assessing the condition of terrestrial resources at the parks. Previous studies noted the high degree of redundancy in landscape configuration metrics and used correlation analysis and factor
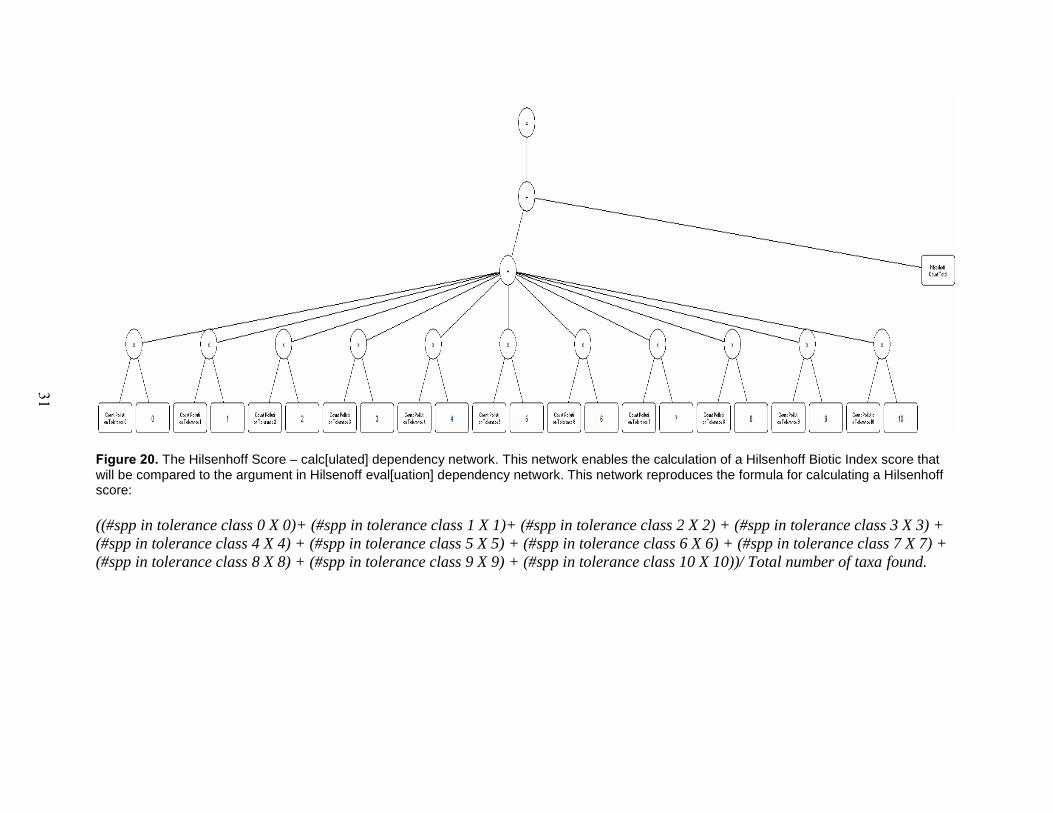
31
Figure 20. The Hilsenhoff Score – calc[ulated] dependency network. This network enables the calculation of a Hilsenhoff Biotic Index score that will be compared to the argument in Hilsenoff eval[uation] dependency network. This network reproduces the formula for calculating a Hilsenhoff score:
((#spp in tolerance class 0 X 0)+ (#spp in tolerance class 1 X 1)+ (#spp in tolerance class 2 X 2) + (#spp in tolerance class 3 X 3) +
(#spp in tolerance class 4 X 4) + (#spp in tolerance class 5 X 5) + (#spp in tolerance class 6 X 6) + (#spp in tolerance class 7 X 7) +
(#spp in tolerance class 8 X 8) + (#spp in tolerance class 9 X 9) + (#spp in tolerance class 10 X 10))/ Total number of taxa found.
32
analysis to determine metrics that provide unique information (Riitters et al. 1999; Kearns et al. 2005). Turner et al. (2001) group landscape metrics into three basic types; metrics of landscape composition, metrics of pattern, and metrics of fractals. Landscape composition metrics are those that quantify proportional area in specific landcover types (e.g. percent of forest); pattern metrics quantify configuration and shape of landscape measures (i.e. patch density, patch shape); and fractal metrics quantify space-filling and scale-independent relationships of landscape measures. Riitters et al. (1999) conducted an analysis of 55 landscape metrics, and through correlation and factor analysis were able to reduce the set to 26 unique metrics, representing six general groupings of landscape measures: average patch-compaction, overall image texture, average patch shape, patch-perimeter area scaling, number of attribute classes, and large-patch density-area scaling. Furthermore, they recommend six metrics that capture the major factors of landscape composition (Riitters 1999): average perimeter-area ratio, contagion, standardized patch shape, patch perimeter-area scaling, number of attribute classes, and large-patch density-area scaling.
Kearns et al. (2005) used principal indicators analysis to investigate seven classes of pattern metrics for use in quantifying landscape patterns in 85 catchments for watershed research and management. These were patch size distribution and density, patch shape complexity, isolation/proximity, contrast, contagion and interspersion, subdivision, and landscape composition. They found two main factors that explained 85% of the variation in pattern metrics for distinguishing between catchments—patch density and distribution, and patch shape and landscape subdivision (Kearns et al. 2005). Kearns et al. (2005) also identified a reduced set of metrics that represent these factors: patch density, contagion, mean shape index, and the interspersion and juxtaposition index.
In a similar study, Cifaldi et al. (2004) assessed 25 pattern metrics for a study of 109 catchments in Michigan; they found that three principal indicators explained 80% of the total variation and these three indicators represented a gradient of landscape patchiness as quantified by patch density and edge density, a gradient of patch sizes quantified by patch size coefficient of variation and agricultural land use edge density, and landscape level-interspersion and juxtaposition. All three studies used correlation analysis initially to determine redundancy in pattern metrics; although, unlike Riitters et al. (1999) and Kearns et al (2005), the Cifaldi et al. (2004) study did not find any metrics with correlations greater than 90%. Additionally, several studies (Saura and Martinez-Millan 2001; Kearns et al. 2005) warn against using pattern metrics that are sensitive to spatial extent (i.e., those that vary in relation to size of the watershed under study), as these metrics are not good discriminators of landscape structure between catchments that vary in size.
Many studies have computed pattern metrics using the ―Fragstats‖ program of McGarigal and Marks (1995), and recommendations on informative pattern metrics (Cifaldi et al. 2004; Kearns et al. 2005) are somewhat specific to this program. Since we computed pattern metrics using the ATtILA program (Ebert and Wade 2004), we conducted our own correlation analysis to determine redundancy of pattern metrics, mindful of the problem comparing pattern metrics that vary with spatial extent. Since ATtILA computes metrics in four groups (landscape characteristics, riparian characteristics, human stressors, and physical factors), we assessed metrics for redundancy and sensitivity to spatial extent by group. Our goal was to identify a subset of unique metrics that represent landscape configuration in each of ATtILA’s major

33
subgroups. We computed a Pearson correlation matrix between all pairs of metrics computed by ATtILA, and flagged positive correlations 0.75, and negative correlations <−0.75.
Of the metrics generated by ATtILA, twelve are representative of landscape and riparian composition and human stressors, without being redundant or correlated (0.75 < × > -0.75) with changes in spatial extent and are recommended as watershed condition metrics for further examination (Table 5). Note that metric correlations presented here are specific to DEWA and UPDE natural resource condition assessment and may or may not translate to other datasets.
Alternative metric selections can be made depending on the desire to focus on a particular feature of the landscape, but the corresponding correlated metric from the list above should be dropped so as to not overly emphasize the landscape component under consideration in any statistical analysis. For example, if status of the riparian zone forests were of interest, than the ―Rfor120‖ (percent of 120-meter riparian zone in forest) metric could be substituted for the Nindex (Naturalness index) metric since they are highly correlated.
Aside from these terrestrial landscape measures, two additional data sets were included that were calculated outside of the ATtILA generated metrics. These are density of dams by watershed (from the National Inventory of Dams database) and the occurrence of rare species by watershed. Rare species were tabulated in a spreadsheet by Jeff Schreiner of the NPS (Delaware Water Gap NRA) and linked to watershed condition assessment boundary identifiers (unique_num attribute). Six types of rare species occurrence were tabulated: rare ambystomatid salamanders, rare fish, rare mussels, bog turtle (Glyptemys muhlenbergii), timber rattlesnake (Crotalus horridus), and cobblestone tiger beetle (Cicindela marginipennis). For the rare ambystomatid salamanders, two species were tabulated: Jefferson salamander (Ambystoma jeffersonianum) and marbled salamander (Ambystoma opacum). Three types of rare fish are noted: bridle shiner (Notropis
bifrenatus), eastern mudminnow (Umbra pygmaea), and slimy sculpin (Cottus cognatus). Presence of five rare mussel species are noted: dwarf wedgemussel (Alasmidonta heterodon), triangle floater (Alasmidonta undulata), brook floater (Alasmidonta varicosa), alewife floater (Anondonta implicata), and yellow lampmussel (Lampsilis cariosa). Each watershed was noted only as having presence of rare species. No specific coordinate data were provided due to sensitivity of rare species locations. With this in mind, we indicated only whether there was occurrence of any rare species within a watershed.
Assigning thresholds to landscape metrics to denote ecological integrity is a difficult task (Tierney et al. 2009). Past reviews of literature demonstrate widely varying ranges of potential thresholds and show marked differences between thresholds for different species and groups of species (i.e. mammals vs. birds). For example, in a comprehensive review of literature on landscape pattern-based thresholds, Kennedy et al (2003) found threshold values for proportion of suitable habitat remaining in the landscape ranging from 5%–80% for birds, 6%–15% for mammals, and 20–60% for invertebrates. Similar variability in reported thresholds is evident for minimum patch area, edge influence, and riparian buffer widths (Kennedy et al. 2003). In spite of this variability, Kennedy et al. (2003) were able to distill the range of reported values and cautiously recommended four thresholds for land use planners (Table 6).
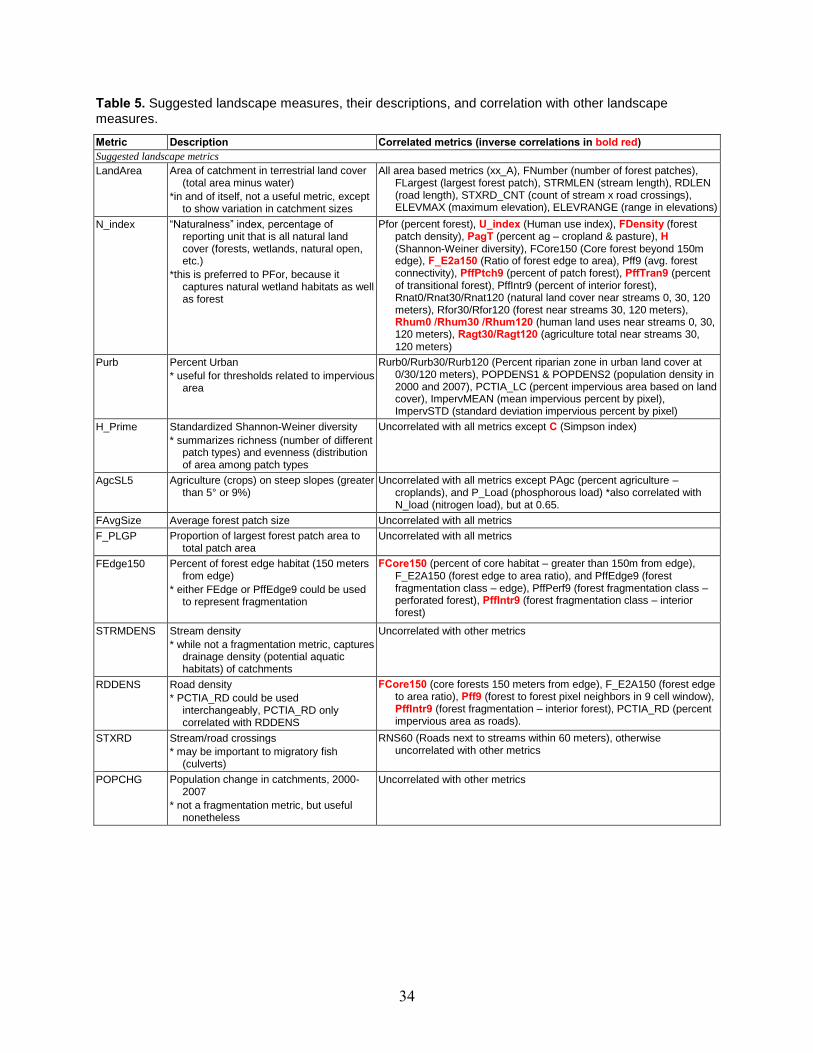
34
Table 5. Suggested landscape measures, their descriptions, and correlation with other landscape measures.
Metric Description Correlated metrics (inverse correlations in bold red) Suggested landscape metrics LandArea Area of catchment in terrestrial land cover
(total area minus water)
*in and of itself, not a useful metric, except to show variation in catchment sizes
All area based metrics (xx_A), FNumber (number of forest patches), FLargest (largest forest patch), STRMLEN (stream length), RDLEN (road length), STXRD_CNT (count of stream x road crossings), ELEVMAX (maximum elevation), ELEVRANGE (range in elevations)
N_index “Naturalness” index, percentage of reporting unit that is all natural land cover (forests, wetlands, natural open, etc.)
*this is preferred to PFor, because it captures natural wetland habitats as well as forest
Pfor (percent forest), U_index (Human use index), FDensity (forest patch density), PagT (percent ag – cropland & pasture), H (Shannon-Weiner diversity), FCore150 (Core forest beyond 150m edge), F_E2a150 (Ratio of forest edge to area), Pff9 (avg. forest connectivity), PffPtch9 (percent of patch forest), PffTran9 (percent of transitional forest), PffIntr9 (percent of interior forest), Rnat0/Rnat30/Rnat120 (natural land cover near streams 0, 30, 120 meters), Rfor30/Rfor120 (forest near streams 30, 120 meters), Rhum0 /Rhum30 /Rhum120 (human land uses near streams 0, 30, 120 meters), Ragt30/Ragt120 (agriculture total near streams 30, 120 meters)
Purb Percent Urban
* useful for thresholds related to impervious area
Rurb0/Rurb30/Rurb120 (Percent riparian zone in urban land cover at 0/30/120 meters), POPDENS1 & POPDENS2 (population density in 2000 and 2007), PCTIA_LC (percent impervious area based on land cover), ImpervMEAN (mean impervious percent by pixel), ImpervSTD (standard deviation impervious percent by pixel)
H_Prime Standardized Shannon-Weiner diversity
* summarizes richness (number of different patch types) and evenness (distribution of area among patch types
Uncorrelated with all metrics except C (Simpson index)
AgcSL5 Agriculture (crops) on steep slopes (greater than 5° or 9%)
Uncorrelated with all metrics except PAgc (percent agriculture – croplands), and P_Load (phosphorous load) *also correlated with N_load (nitrogen load), but at 0.65.
FAvgSize Average forest patch size Uncorrelated with all metrics
F_PLGP Proportion of largest forest patch area to total patch area
Uncorrelated with all metrics
FEdge150 Percent of forest edge habitat (150 meters from edge)
* either FEdge or PffEdge9 could be used to represent fragmentation
FCore150 (percent of core habitat – greater than 150m from edge), F_E2A150 (forest edge to area ratio), and PffEdge9 (forest fragmentation class – edge), PffPerf9 (forest fragmentation class – perforated forest), PffIntr9 (forest fragmentation class – interior forest)
STRMDENS Stream density
* while not a fragmentation metric, captures drainage density (potential aquatic habitats) of catchments
Uncorrelated with other metrics
RDDENS Road density
* PCTIA_RD could be used interchangeably, PCTIA_RD only correlated with RDDENS
FCore150 (core forests 150 meters from edge), F_E2A150 (forest edge to area ratio), Pff9 (forest to forest pixel neighbors in 9 cell window), PffIntr9 (forest fragmentation – interior forest), PCTIA_RD (percent impervious area as roads).
STXRD Stream/road crossings
* may be important to migratory fish (culverts)
RNS60 (Roads next to streams within 60 meters), otherwise uncorrelated with other metrics
POPCHG Population change in catchments, 2000-2007
* not a fragmentation metric, but useful nonetheless
Uncorrelated with other metrics
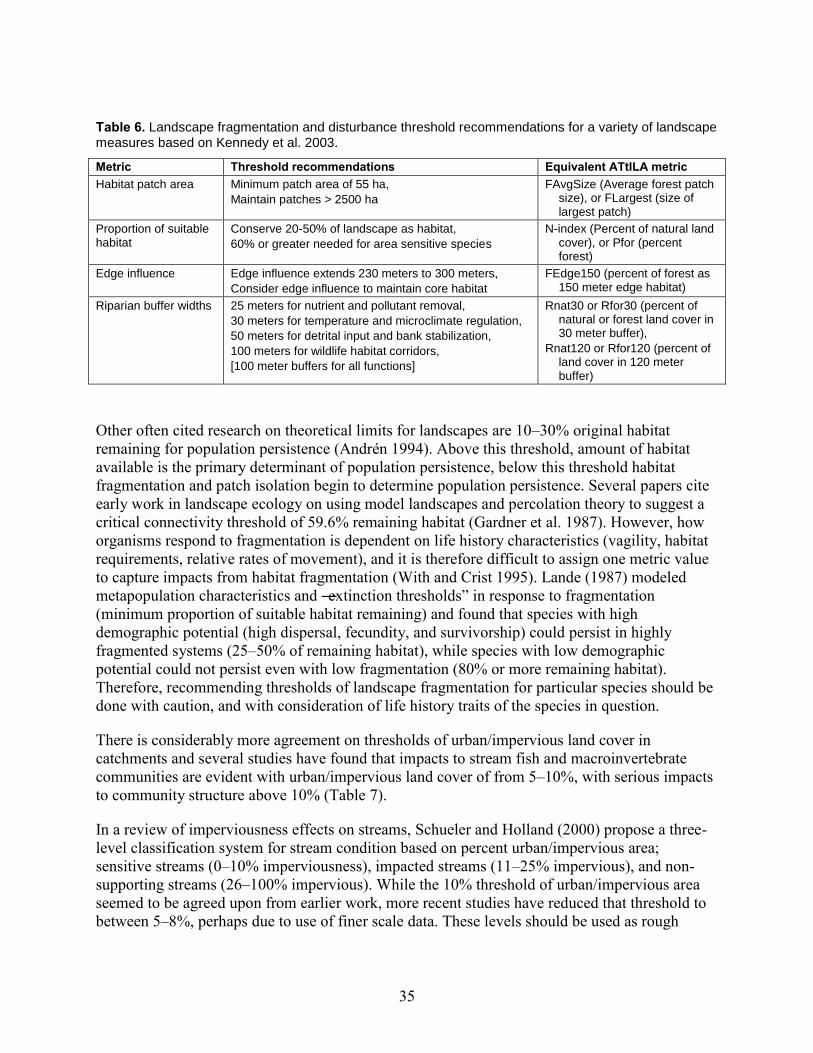
35
Table 6. Landscape fragmentation and disturbance threshold recommendations for a variety of landscape measures based on Kennedy et al. 2003.
Metric Threshold recommendations Equivalent ATtILA metric Habitat patch area Minimum patch area of 55 ha,
Maintain patches > 2500 ha
FAvgSize (Average forest patch size), or FLargest (size of largest patch)
Proportion of suitable habitat
Conserve 20-50% of landscape as habitat,
60% or greater needed for area sensitive species
N-index (Percent of natural land cover), or Pfor (percent forest)
Edge influence Edge influence extends 230 meters to 300 meters,
Consider edge influence to maintain core habitat
FEdge150 (percent of forest as 150 meter edge habitat)
Riparian buffer widths 25 meters for nutrient and pollutant removal,
30 meters for temperature and microclimate regulation,
50 meters for detrital input and bank stabilization,
100 meters for wildlife habitat corridors,
[100 meter buffers for all functions]
Rnat30 or Rfor30 (percent of natural or forest land cover in 30 meter buffer),
Rnat120 or Rfor120 (percent of land cover in 120 meter buffer)
Other often cited research on theoretical limits for landscapes are 10–30% original habitat remaining for population persistence (Andrén 1994). Above this threshold, amount of habitat available is the primary determinant of population persistence, below this threshold habitat fragmentation and patch isolation begin to determine population persistence. Several papers cite early work in landscape ecology on using model landscapes and percolation theory to suggest a critical connectivity threshold of 59.6% remaining habitat (Gardner et al. 1987). However, how organisms respond to fragmentation is dependent on life history characteristics (vagility, habitat requirements, relative rates of movement), and it is therefore difficult to assign one metric value to capture impacts from habitat fragmentation (With and Crist 1995). Lande (1987) modeled metapopulation characteristics and ―extinction thresholds‖ in response to fragmentation (minimum proportion of suitable habitat remaining) and found that species with high demographic potential (high dispersal, fecundity, and survivorship) could persist in highly fragmented systems (25–50% of remaining habitat), while species with low demographic potential could not persist even with low fragmentation (80% or more remaining habitat). Therefore, recommending thresholds of landscape fragmentation for particular species should be done with caution, and with consideration of life history traits of the species in question.
There is considerably more agreement on thresholds of urban/impervious land cover in catchments and several studies have found that impacts to stream fish and macroinvertebrate communities are evident with urban/impervious land cover of from 5–10%, with serious impacts to community structure above 10% (Table 7).
In a review of imperviousness effects on streams, Schueler and Holland (2000) propose a three-level classification system for stream condition based on percent urban/impervious area; sensitive streams (0–10% imperviousness), impacted streams (11–25% impervious), and non-supporting streams (26–100% impervious). While the 10% threshold of urban/impervious area seemed to be agreed upon from earlier work, more recent studies have reduced that threshold to between 5–8%, perhaps due to use of finer scale data. These levels should be used as rough

36
Table 7. Percent impervious surface threshold recommendations based upon aquatic resource and water quality research.
Author Pub Year Response Threshold Klein 1979 biotic diversity 10%
Booth and Jackson 1997 stream habitat 10%
Wang et al. 2000 fish index of biologic integrity (IBI) 10%
Wang et al. 2001 fish IBI 8–12%
Stepenuck et al. 2002 aquatic macroinvertebrates 8%
Morse et al. 2003 ephemeroptera, plecoptera, and trichoptera (EPT) 6%
Snyder et al. 2003 fish IBI 7%
Ourzo & Frensel 2003 aquatic macroinvertebrates 4.4–5.8%
Morgan et al. 2007 Water quality (nutrients) 10–30%
guides to classify watersheds from this study using metrics from ATtILA (Purb – percent urban area, or PCTIA_LC – percent impervious based on land cover, or ImpervMean (mean imperviousness percent by pixel). Population density has also been suggested as a surrogate for urban/impervious land use, and thresholds of from 1–1.6 persons/ha (2.5–4 persons/ac) have been reported (Jones and Clark 1987; Couch et al. 1997). We computed population density by watershed in (#/km2) for this study in 2000 (metric POPDENS1) and 2007 (metric POPDENS2), and these metrics could be used in addition to urban/impervious area to assess potential impacts to streams. Fewer studies have determined thresholds for percent agriculture in a watershed, but
Wang et al. (1997) report that watersheds in Wisconsin with greater than 50% agriculture had lower fish IBI scores. From the ATtILA metrics calculated for this study, PAgc – percent agriculture/croplands, or AgcSL5 – percent agriculture on slopes greater than five degrees could be used (interchangeably) to assess these thresholds.
After reviewing the literature, availability of data, and the science-based evidence for thresholds, we decided to use percent forest fragmentation and percent impervious surface as the measures used to assess the landscape indicator in our model. The fuzzy logic argument used for percent forest is < 30% is unacceptable (false) and > 70% is ideal (true) (Figure 21). The fuzzy logic argument used for percent impervious surface ranges from 0% (ideal; true) to 10% (unacceptable; false). These thresholds were determined based upon aquatic research and published thresholds for the northeastern United States (Figure 22).
Watersheds Included in Our Analyses We assessed the condition of 100 watersheds at DEWA and UPDE. All watersheds had some data to complete the assessment; however, no watershed had all the needed data (Table 8). Completeness of data sources ranged from 100% for the Toms Creek watershed, for example, to 48% for the Heller Creek watershed. This absence of complete data sets is due, in part, to uneven sampling across the park. In particular, for aquatic measures, macroinvertebrates were only sampled at a limited number of sites. For water chemistry, samples were not taken in all watersheds, nor did all watersheds have USGS gauge data. Despite the gaps in aquatic measures, terrestrial data were available for all watersheds. However, these terrestrial data were gathered
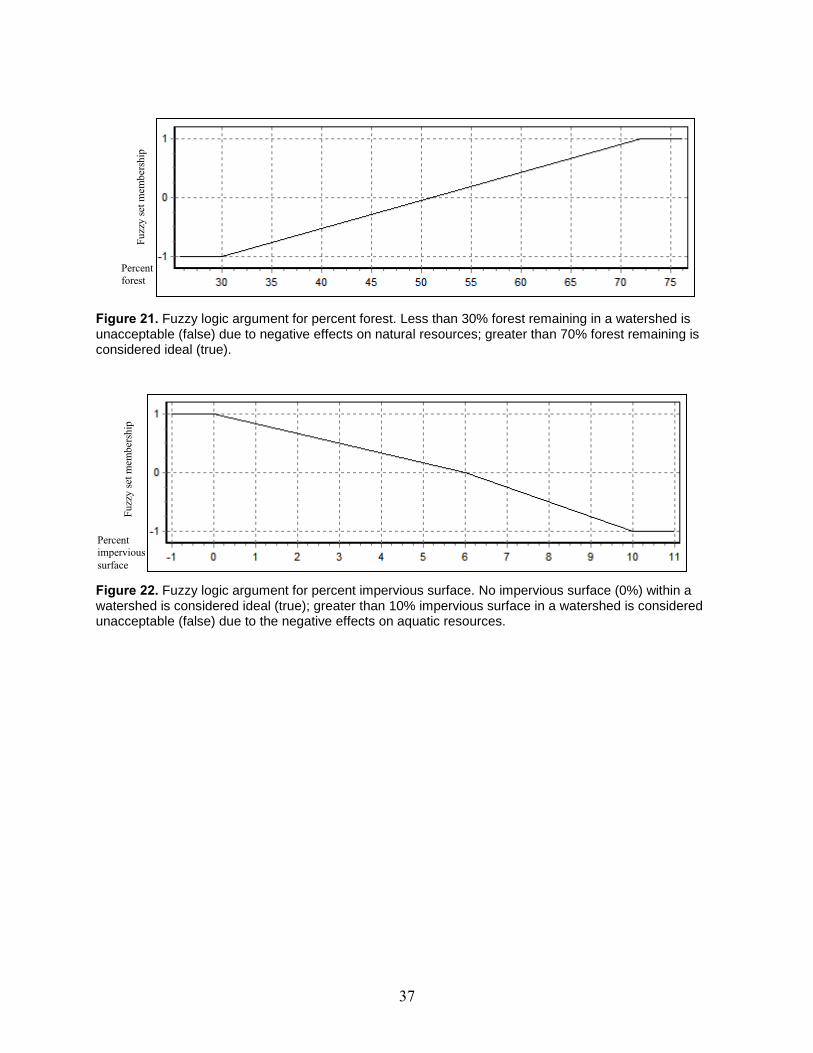
37
Figure 21. Fuzzy logic argument for percent forest. Less than 30% forest remaining in a watershed is unacceptable (false) due to negative effects on natural resources; greater than 70% forest remaining is considered ideal (true).
Figure 22. Fuzzy logic argument for percent impervious surface. No impervious surface (0%) within a watershed is considered ideal (true); greater than 10% impervious surface in a watershed is considered unacceptable (false) due to the negative effects on aquatic resources.
Fuzz
y se
t mem
bers
hip
Percent forest
Percent impervious surface
Fuzz
y se
t mem
bers
hip

38
Table 8. Unique ID#, watershed name, and calculated NetWeaver the "trueness" value (-1 to 1 scale) for each natural resource assessment component. In addition, the amount (%) of data upon which the value is based is presented.
ID Watershed Name Overall Assessment WQ - Chemical/Physical WQ - Bioloic Landscape
Park Value Data Value Data Value Data Value Data 11258.45 Shingle Kill UPDE 0.11 49% -0.64 46% 0 0% 0.97 100%
11261.10 Mongaup River UPDE 0.36 49% 0.17 48% 0 0% 0.92 100%
11264.70 Fish Cabin Creek UPDE 0.14 49% -0.56 46% 0 0% 0.98 100%
11266.75 Mill Brook UPDE 0.14 49% -0.56 46% 0 0% 0.98 100%
11268.13 Hillside Creek UPDE 0.32 48% 0 45% 0 0% 0.97 100%
11273.50 Halfway Brook UPDE 0.56 82% 0.17 48% 0.52 100% 0.98 100%
11275.45 Beaver Brook UPDE 0.14 49% -0.56 46% 0 0% 0.99 100%
11278.00 aka "York Lake Falls" UPDE 0.33 48% 0 45% 0 0% 1 100%
11279.00 Narrow Falls Brook UPDE 0.33 48% 0 45% 0 0% 0.98 100%
11281.40 Grassy Swamp Brook UPDE 0.33 48% 0 45% 0 0% 0.99 100%
11284.00 Trusten Creek UPDE 0.71 100% 0.67 100% 0.48 100% 0.98 100%
11296.87 Mitchell Creek UPDE 0.33 48% 0 45% 0 0% 0.98 100%
11303.30 Callicoon Creek UPDE 0.6 100% 0.77 100% 0.25 100% 0.79 100%
11310.50 Hankins Creek UPDE 0.02 49% -0.94 46% 0 0% 0.98 100%
11313.50 Basket Creek UPDE 0.33 48% 0 45% 0 0% 0.99 100%
11314.33 Hoolihan Creek UPDE 0.33 48% 0 45% 0 0% 0.99 100%
11315.00 Pea Brook UPDE 0.14 49% -0.56 46% 0 0% 0.98 100%
11317.80 aka "Piss Willy Falls Creek" UPDE 0.33 48% 0 45% 0 0% 1 100%
11318.30 Bouchoux Brook UPDE 0.32 48% 0 45% 0 0% 0.97 100%
11320.40 Abe Lord Creek UPDE 0.33 48% 0 45% 0 0% 0.99 100%
11321.00 Humphries Brook UPDE 0.33 48% 0 45% 0 0% 0.99 100%
11325.50 Blue Mill Stream UPDE 0.33 48% 0 45% 0 0% 1 100%
11330.00 East Branch Delaware River UPDE 0.29 50% -0.1 48% 0 0% 0.98 100%
11330.20 West Branch of the Delaware River UPDE 0.67 83% 0.24 49% 0.79 100% 0.97 100%
12257.13 Upper Brook PORT 0.32 48% 0 45% 0 0% 0.95 100%
21258.40 Bush Kill UPDE 0.66 49% 1 48% 0 0% 0.98 100%
21258.45 Millrift Creek UPDE 0.33 48% 0 45% 0 0% 0.99 100%
21266.30 Pond Eddy Creek UPDE 0.33 48% 0 45% 0 0% 1 100%
21269.90 Lake Creek UPDE 0.32 48% 0 45% 0 0% 0.96 100%
21273.40 Shohola Creek UPDE 0.54 82% -0.15 47% 0.81 100% 0.95 100%
21274.50 Panther Creek UPDE 0.33 48% 0 45% 0 0% 0.99 100%
21277.70 Lackawaxen River UPDE 0.3 50% -0.03 48% 0 0% 0.93 100%
21280.24 Westcolang Creek UPDE 0.31 48% 0 45% 0 0% 0.94 100%
21282.90 Masthope - Rattlesnake Creek UPDE 0.59 82% 0 45% 0.81 100% 0.97 100%
21289.00 Peggy Run UPDE 0.32 48% 0 45% 0 0% 0.95 100%
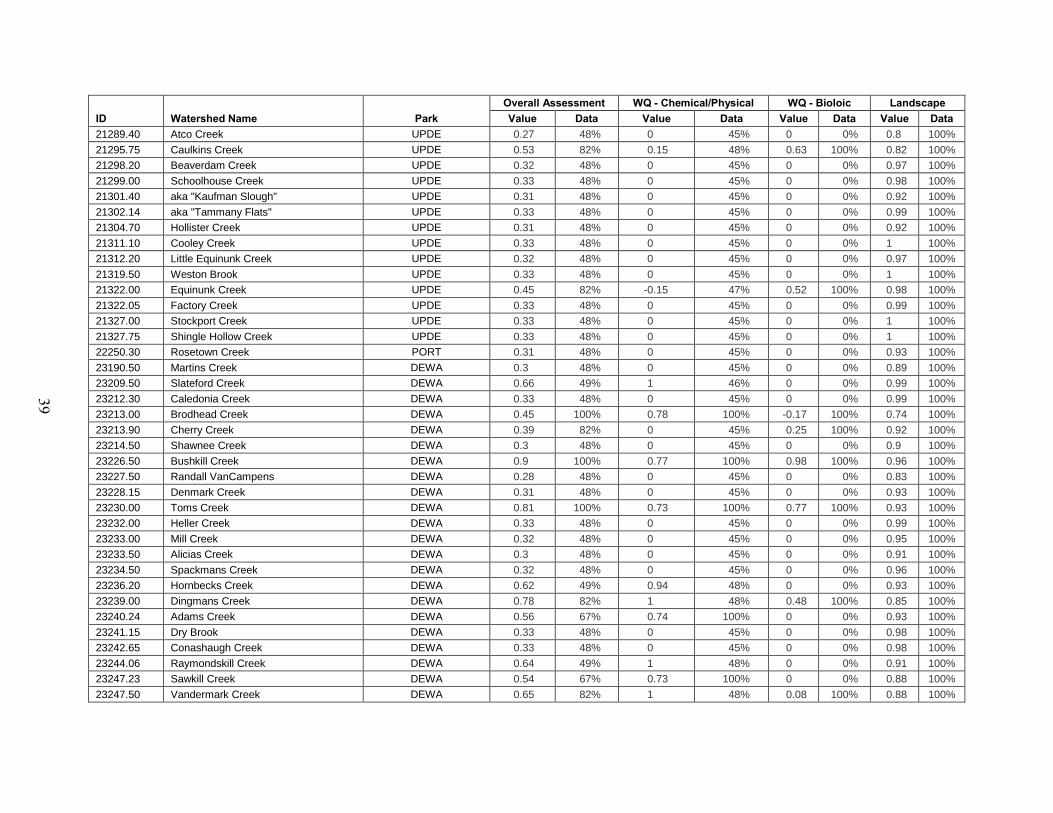
39
ID Watershed Name Overall Assessment WQ - Chemical/Physical WQ - Bioloic Landscape
Park Value Data Value Data Value Data Value Data 21289.40 Atco Creek UPDE 0.27 48% 0 45% 0 0% 0.8 100%
21295.75 Caulkins Creek UPDE 0.53 82% 0.15 48% 0.63 100% 0.82 100%
21298.20 Beaverdam Creek UPDE 0.32 48% 0 45% 0 0% 0.97 100%
21299.00 Schoolhouse Creek UPDE 0.33 48% 0 45% 0 0% 0.98 100%
21301.40 aka "Kaufman Slough" UPDE 0.31 48% 0 45% 0 0% 0.92 100%
21302.14 aka "Tammany Flats" UPDE 0.33 48% 0 45% 0 0% 0.99 100%
21304.70 Hollister Creek UPDE 0.31 48% 0 45% 0 0% 0.92 100%
21311.10 Cooley Creek UPDE 0.33 48% 0 45% 0 0% 1 100%
21312.20 Little Equinunk Creek UPDE 0.32 48% 0 45% 0 0% 0.97 100%
21319.50 Weston Brook UPDE 0.33 48% 0 45% 0 0% 1 100%
21322.00 Equinunk Creek UPDE 0.45 82% -0.15 47% 0.52 100% 0.98 100%
21322.05 Factory Creek UPDE 0.33 48% 0 45% 0 0% 0.99 100%
21327.00 Stockport Creek UPDE 0.33 48% 0 45% 0 0% 1 100%
21327.75 Shingle Hollow Creek UPDE 0.33 48% 0 45% 0 0% 1 100%
22250.30 Rosetown Creek PORT 0.31 48% 0 45% 0 0% 0.93 100%
23190.50 Martins Creek DEWA 0.3 48% 0 45% 0 0% 0.89 100%
23209.50 Slateford Creek DEWA 0.66 49% 1 46% 0 0% 0.99 100%
23212.30 Caledonia Creek DEWA 0.33 48% 0 45% 0 0% 0.99 100%
23213.00 Brodhead Creek DEWA 0.45 100% 0.78 100% -0.17 100% 0.74 100%
23213.90 Cherry Creek DEWA 0.39 82% 0 45% 0.25 100% 0.92 100%
23214.50 Shawnee Creek DEWA 0.3 48% 0 45% 0 0% 0.9 100%
23226.50 Bushkill Creek DEWA 0.9 100% 0.77 100% 0.98 100% 0.96 100%
23227.50 Randall VanCampens DEWA 0.28 48% 0 45% 0 0% 0.83 100%
23228.15 Denmark Creek DEWA 0.31 48% 0 45% 0 0% 0.93 100%
23230.00 Toms Creek DEWA 0.81 100% 0.73 100% 0.77 100% 0.93 100%
23232.00 Heller Creek DEWA 0.33 48% 0 45% 0 0% 0.99 100%
23233.00 Mill Creek DEWA 0.32 48% 0 45% 0 0% 0.95 100%
23233.50 Alicias Creek DEWA 0.3 48% 0 45% 0 0% 0.91 100%
23234.50 Spackmans Creek DEWA 0.32 48% 0 45% 0 0% 0.96 100%
23236.20 Hornbecks Creek DEWA 0.62 49% 0.94 48% 0 0% 0.93 100%
23239.00 Dingmans Creek DEWA 0.78 82% 1 48% 0.48 100% 0.85 100%
23240.24 Adams Creek DEWA 0.56 67% 0.74 100% 0 0% 0.93 100%
23241.15 Dry Brook DEWA 0.33 48% 0 45% 0 0% 0.98 100%
23242.65 Conashaugh Creek DEWA 0.33 48% 0 45% 0 0% 0.98 100%
23244.06 Raymondskill Creek DEWA 0.64 49% 1 48% 0 0% 0.91 100%
23247.23 Sawkill Creek DEWA 0.54 67% 0.73 100% 0 0% 0.88 100%
23247.50 Vandermark Creek DEWA 0.65 82% 1 48% 0.08 100% 0.88 100%

40
ID Watershed Name Overall Assessment WQ - Chemical/Physical WQ - Bioloic Landscape
Park Value Data Value Data Value Data Value Data 23249.33 Crawford Branch DEWA 0.23 48% 0 45% 0 0% 0.69 100%
23250.15 Cummins Creek DEWA 0.32 48% 0 45% 0 0% 0.97 100%
24207.50 Jacoby Creek DEWA 0.43 49% 1 46% 0 0% 0.28 100%
32253.50 Neverskink River PORT 0.27 50% -0.11 48% 0 0% 0.93 100%
33208.80 Stony Brook DEWA 0.64 49% 0.93 46% 0 0% 0.99 100%
33211.50 Dunnfield Creek DEWA 0.66 50% 0.99 48% 0 0% 1 100%
33220.00 Vancampens Brook DEWA 0.6 67% 0.81 100% 0 0% 1 100%
33225.15 Flat Brook DEWA 0.72 83% 0.59 48% 0.58 100% 0.98 100%
33245.90 Whitebrook Creek DEWA 0.15 48% 0 45% 0 0% 0.44 100%
33246.23 Shimers Creek DEWA 0.63 83% 0.77 48% 0.5 100% 0.6 100%
34207.20 Paulins Kill N/A 0.5 50% 0.7 49% 0 0% 0.79 100%
41209.99 Direct Drainage UPDE 0.54 83% 0.03 48% 0.63 100% 0.96 100%
41258.69 Direct Drainage UPDE 0.32 48% 0 45% 0 0% 0.97 100%
41266.37 Direct Drainage UPDE -0.02 82% -0.87 46% -0.13 100% 0.94 100%
41279.86 Direct Drainage UPDE 0.42 82% -0.56 46% 0.88 100% 0.95 100%
41303.72 Direct Drainage UPDE 0.59 49% 0.8 48% 0 0% 0.98 100%
41321.03 Direct Drainage UPDE 0.57 82% 0 45% 0.73 100% 0.98 100%
42250.85 Direct Drainage PORT -0.12 49% 0.28 48% 0 0% -0.64 100%
42255.18 Direct Drainage PORT 0.06 83% 0.09 48% 0.25 100% -0.18 100%
43210.52 Direct Drainage DEWA 0.29 48% 0 45% 0 0% 0.88 100%
43212.53 Direct Drainage DEWA 0.31 48% 0 45% 0 0% 0.94 100%
43218.05 Direct Drainage DEWA 0.32 82% 0 45% -0.02 100% 0.99 100%
43228.36 Direct Drainage DEWA 0.32 48% 0 45% 0 0% 0.96 100%
43239.45 Direct Drainage DEWA 0.25 48% 0 45% 0 0% 0.75 100%
43246.62 Direct Drainage DEWA 0.32 83% 0.23 48% 0.54 100% 0.19 100%
44206.90 Direct Drainage N/A 0.46 50% 0.87 49% 0 0% 0.51 100%
23213.00.5 Marshalls Creek DEWA 0.33 49% 0.17 48% 0 0% 0.81 100%
23226.90.8 Little Bushkill Creek DEWA 0.65 49% 0.98 48% 0 0% 0.96 100%
1=watershed ID#; 2=watershedName; 3=WQIValue; 4=%DataUsed; 5=Chemical/Physical; 6= %DataAssociatedw/That; 7=Biologic; 8=%DataAssociatedw/That; 9=OverallScore.

41
from 2001 satellite landcover data and, therefore, may not completely reflect current condition of terrestrial landscape indicators.
Major Data Gaps for Our Analyses Water Quality – Chemical/Physical <file:WQ - Chemical/Physical.html (available on enclosed CD)>
For both parks, 55% of the data were available for calculating at least a partial WQI score. However, the particular data available for calculating a WQI score differed among individual watersheds. For example watershed Brodhead Creek (#23213.00) had a previously calculated WQI score (82.8 out of 100; a ―good‖ water quality rating)—therefore, our assessment model indicates that 100% of data were available to calculate the score for that watershed. In contrast, for watershed Mongaup River (#11261.10) a partial score was calculated from existing data (USGS gauge data) of which only 53% are present. The resulting partial WQI was 63—an intermediate score for water quality. Furthermore, for watershed Hankins Creek (#11310.50) the WQI was based solely on pH (the only data available), resulting in a WQI score 27.1—a poor score for water quality. Therefore, due to these data gaps, we recommend that resource managers examine individual values for model indicators and not rely completely on overall scores. In general, the more data available for calculating a partial WQI score, the more robust the result.
Please note that the water quality score is not diluted due to missing data—just that the assessment is based on only one measure.
Water Quality – Biologic (Macroinvertebrates) <WQ - Biologic.html (available on enclosed CD)> starthere w/reading, editing, grammar, punctuation
For the aquatic biologic (macroinvertebrate) portion of the model, approximately 38% of the watershed area for the parks had some data. Complete macroinvertebrate datasets were available for 23 watersheds. In contrast to partial data (USGS gauge data) available for calculation WQI scores, no raw, geo-referenced data were found for calculating macroinvertebrate indices; therefore, only previously calculated macroinvertebrate indices present in the literature were used in our model. Since the index values used in the model were pulled from the literature (we did not include data from before 1995), they may not reflect current, real-time conditions; however, we do provide the utility for resource managers to enter raw macroinvertebrate data into the model to calculate EPT or Hilsenhoff values.
Landscape – Forested Percent <LandscapeForestedPercentChange.html (available on enclosed CD)>
Because landscape indicators were calculated from aerial data (photographs, satellite imagery) all watersheds had complete data sets. However, the data were not current (2009) but only reflect the condition at the time (2001) that the images were available. Therefore, there may be significant gaps in the actual current condition of the landscape of the parks and that which is depicted in the model.

42
In summary, our overall natural resource assessment for DEWA and UPDE contained three indicators (water quality_chemical_physical, water quality_biologic, landscape) with several measures for each indicator. These three indicators then could be combined to achieve an overall assessment for the watersheds for both parks (Table 9). The dependency networks, graphical assessment, and statistical assessments for each indicator and each measure may be examined separately or as one overall assessment (Table 9). The graphical assessments are presented in the decision support system model on a continuous scale with red representing poor quality (ecologically impaired) and green representing excellent quality. The statistical assessments are presented as a continuous fuzzy logic scale with -1 representing poor quality (false) and 1 representing excellent quality (true). In addition, the statistical assessments indicate where data needs are. For example, for the measure pH, there are data available for 92% of the park area (Table 9). For the water quality_chemical physical measures, dissolved oxygen and fecal coliforms are areas of concerns in terms of ecological impairement for watersheds in both parks (Table 9). For water quality_biologic, the Brodhead watershed in the southern portion of DEWA seems to have some ecological impairment (Table 9). However, all watersheds indicate excellent quality when evaluating landscape measures (Table 9).

43
Table 9. Decision support system dependency networks and/or ecological thresholds, graphical assessment results, and statistical assessment results for the overall natural resource assessment, ecosystem indicators, and their measures at Delaware Water Gap National Recreation Area and Upper Delaware Scenic and Recreational River, 2009.
Decision support system dependency networks and thresholds for indicators and measures
Graphic assessment results for indicators and measures
Statistical assessment results for indicators and measures on a -1 to 1 continuous fuzzy logic scale with -1 indicating poor quality and 1 indicating excellent quality.
Overall
interpreted
min -0.12
max 0.90
mean 0.43
s.d. 0.18
geo area used 100%
Chemical/Physical (WQI)
interpreted
min -0.94
max 1.00
mean 0.16
s.d. 0.36
geo area used 100%

44
Decision support system dependency networks and thresholds for indicators and measures Graphic assessment results for indicators and measures
Statistical assessment results for indicators and measures on a -1 to 1 continuous fuzzy logic scale with -1 indicating poor quality and 1 indicating excellent quality.
Biological Oxygen Demand
raw interpreted
min 0.32 0.80
max 1.85 1.00
mean 0.89 0.98
s.d. 0.35 0.05
geo area used 35%
Dissolved Oxygen
raw interpreted
min 6.07 -1.00
max 113.70 1.00
mean 15.94 -0.83
s.d. 24.18 0.56
geo area used 92%

45
Decision support system dependency networks and thresholds for indicators and measures Graphic assessment results for indicators and measures
Statistical assessment results for indicators and measures on a -1 to 1 continuous fuzzy logic scale with -1 indicating poor quality and 1 indicating excellent quality.
Fecal Coliforms
raw interpreted
min 6.00 -1.00
max 1978 0.67
mean 149.61 -0.28
s.d. 270.64 0.39
geo area used 77%
Nitrate
raw interpreted
min 0.00 1.00
max 0.50 1.00
mean 0.07 1.00
s.d. 0.10 0.00
geo area used 85%

46
Decision support system dependency networks and thresholds for indicators and measures Graphic assessment results for indicators and measures
Statistical assessment results for indicators and measures on a -1 to 1 continuous fuzzy logic scale with -1 indicating poor quality and 1 indicating excellent quality.
pH
raw interpreted
min 6.40 0.32
max 8.40 1.00
mean 7.44 0.92
s.d. 0.40 0.15
geo area used 92%
Water Temperature Change
raw interpreted
min
max
mean
s.d.
geo area used 0%
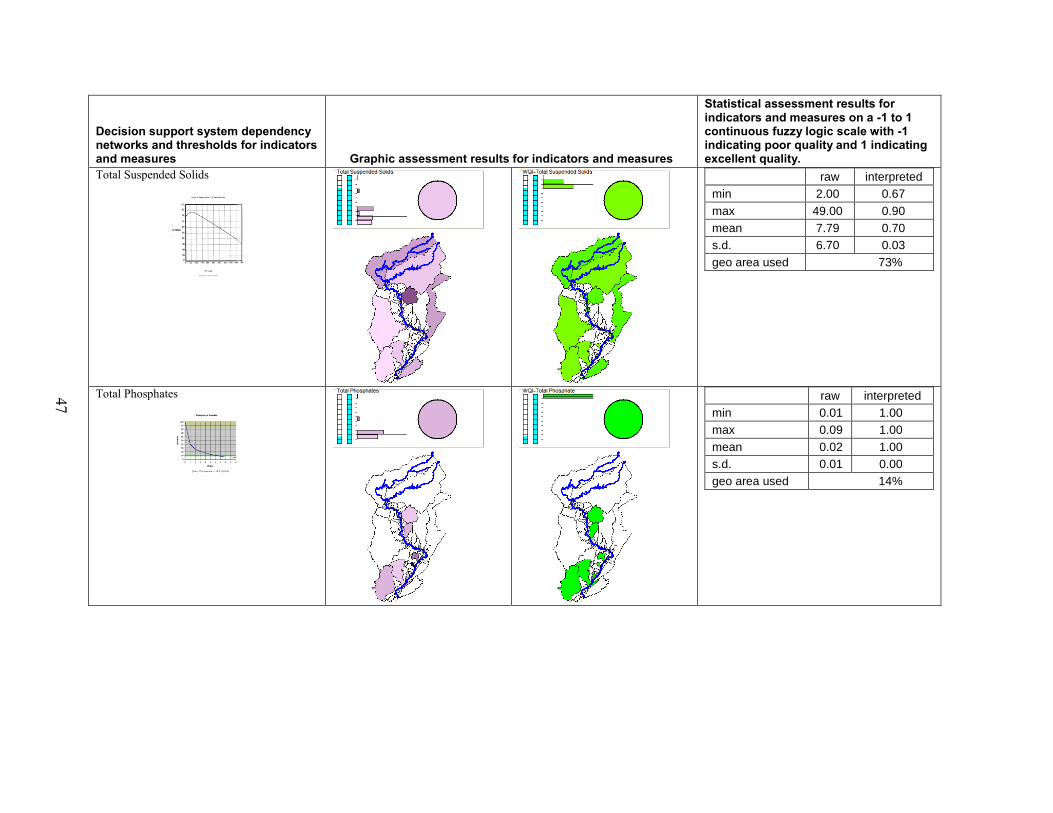
47
Decision support system dependency networks and thresholds for indicators and measures Graphic assessment results for indicators and measures
Statistical assessment results for indicators and measures on a -1 to 1 continuous fuzzy logic scale with -1 indicating poor quality and 1 indicating excellent quality.
Total Suspended Solids
raw interpreted
min 2.00 0.67
max 49.00 0.90
mean 7.79 0.70
s.d. 6.70 0.03
geo area used 73%
Total Phosphates
raw interpreted
min 0.01 1.00
max 0.09 1.00
mean 0.02 1.00
s.d. 0.01 0.00
geo area used 14%

48
Decision support system dependency networks and thresholds for indicators and measures Graphic assessment results for indicators and measures
Statistical assessment results for indicators and measures on a -1 to 1 continuous fuzzy logic scale with -1 indicating poor quality and 1 indicating excellent quality.
Turbidity
raw interpreted
min 0.68 0.00
max 24.00 1.00
mean 4.14 0.93
s.d. 2.74 0.12
geo area used 89%
Biologic
interpreted
min -0.17
max 0.98
mean 0.55
s.d. 0.37
geo area used 39%
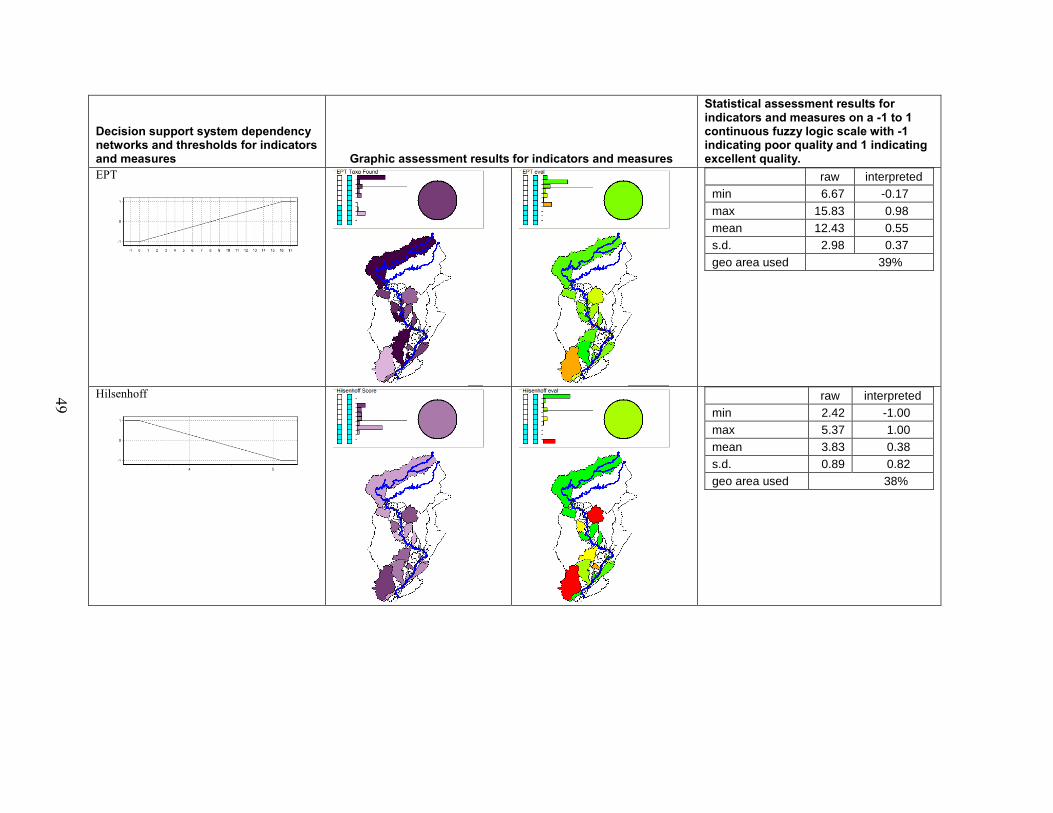
49
Decision support system dependency networks and thresholds for indicators and measures Graphic assessment results for indicators and measures
Statistical assessment results for indicators and measures on a -1 to 1 continuous fuzzy logic scale with -1 indicating poor quality and 1 indicating excellent quality.
EPT
raw interpreted
min 6.67 -0.17
max 15.83 0.98
mean 12.43 0.55
s.d. 2.98 0.37
geo area used 39%
Hilsenhoff
raw interpreted
min 2.42 -1.00
max 5.37 1.00
mean 3.83 0.38
s.d. 0.89 0.82
geo area used 38%
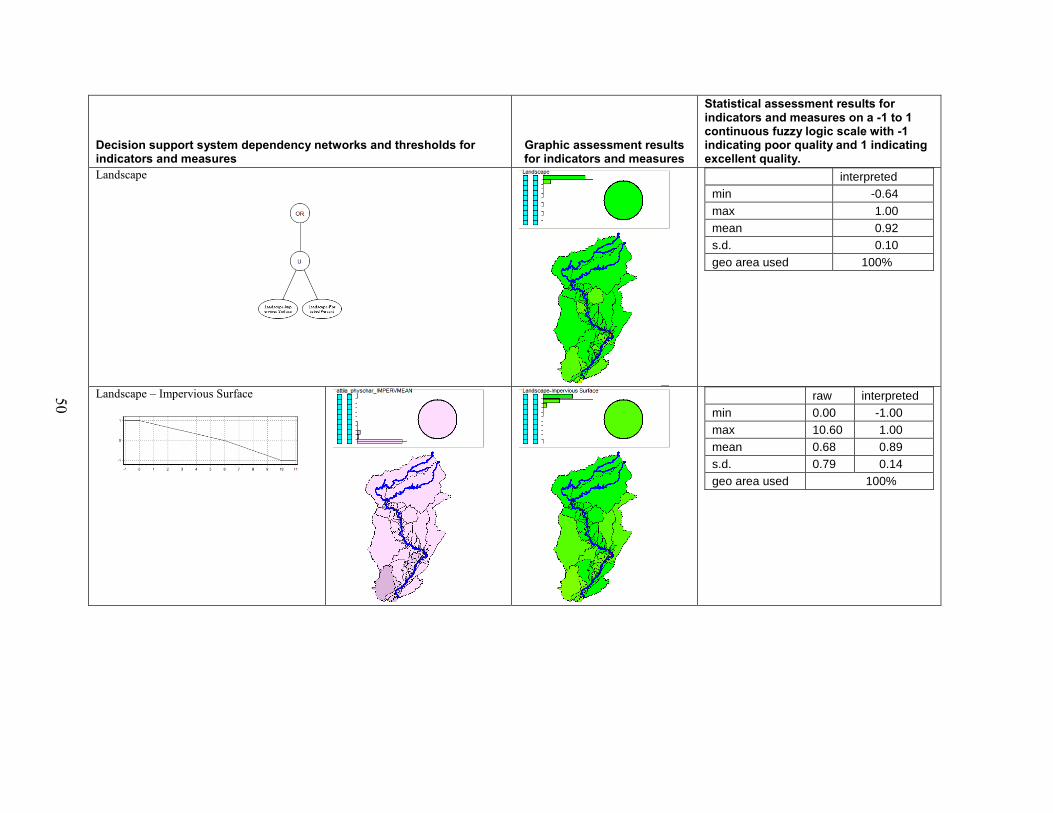
50
Decision support system dependency networks and thresholds for indicators and measures
Graphic assessment results for indicators and measures
Statistical assessment results for indicators and measures on a -1 to 1 continuous fuzzy logic scale with -1 indicating poor quality and 1 indicating excellent quality.
Landscape
interpreted
min -0.64
max 1.00
mean 0.92
s.d. 0.10
geo area used 100%
Landscape – Impervious Surface
raw interpreted
min 0.00 -1.00
max 10.60 1.00
mean 0.68 0.89
s.d. 0.79 0.14
geo area used 100%

51
Decision support system dependency networks and thresholds for indicators and measures Graphic assessment results for indicators and measures
Statistical assessment results for indicators and measures on a -1 to 1 continuous fuzzy logic scale with -1 indicating poor quality and 1 indicating excellent quality.
Landscape – Forested Percent
raw interpreted
min 45.25 -0.27
max 100.00 1.00
mean 79.31 0.96
s.d. 8.78 0.12
geo area used 100%
Notes: All information reported in this summary are borrowed directly from the html-based documentation, although the size of the visuals has been scaled down. Legends for maps were omitted in the interest of limiting clutter. Legends can be found in html-based documentation and are discussed in this report. Interpreted values range from -1 (poor/failure) to +1 (good/optimal). All statistics are area-weighted. Only watersheds with SOME data were considered for any given parameter (if a watershed’s missing data is 100%, it is not aggregated into the missing data calculation for the entire map). In the graphic assessment: the left-most vertical gauge represents the relative geographic area included in the evaluation (areas with no data are excluded from the analysis); the other, right-most, vertical gauge represents the relative amount of data needs met within the geographic area used; the histogram represents the area-weighted distribution of values; the circle represents the aggregate value for the map, it is an area-weighted average for geographic area used.
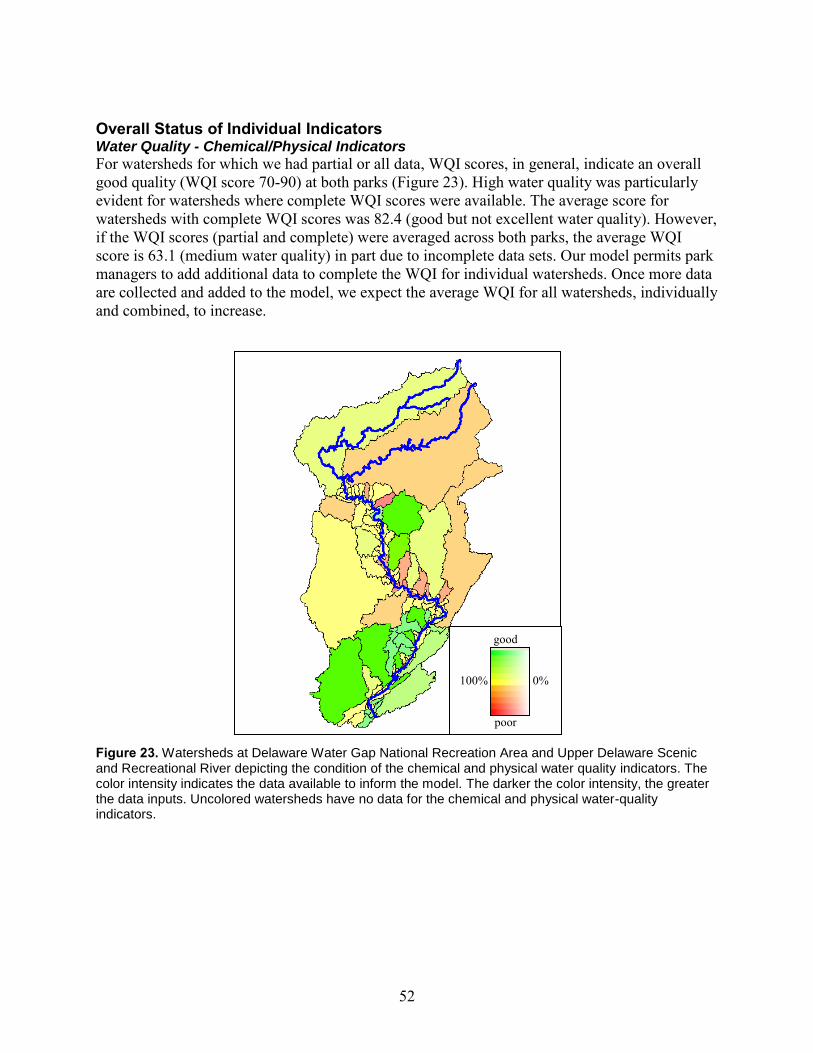
52
Overall Status of Individual Indicators Water Quality - Chemical/Physical Indicators
For watersheds for which we had partial or all data, WQI scores, in general, indicate an overall good quality (WQI score 70-90) at both parks (Figure 23). High water quality was particularly evident for watersheds where complete WQI scores were available. The average score for watersheds with complete WQI scores was 82.4 (good but not excellent water quality). However, if the WQI scores (partial and complete) were averaged across both parks, the average WQI score is 63.1 (medium water quality) in part due to incomplete data sets. Our model permits park managers to add additional data to complete the WQI for individual watersheds. Once more data are collected and added to the model, we expect the average WQI for all watersheds, individually and combined, to increase.
Figure 23. Watersheds at Delaware Water Gap National Recreation Area and Upper Delaware Scenic and Recreational River depicting the condition of the chemical and physical water quality indicators. The color intensity indicates the data available to inform the model. The darker the color intensity, the greater the data inputs. Uncolored watersheds have no data for the chemical and physical water-quality indicators.
good 100% 0%
poor
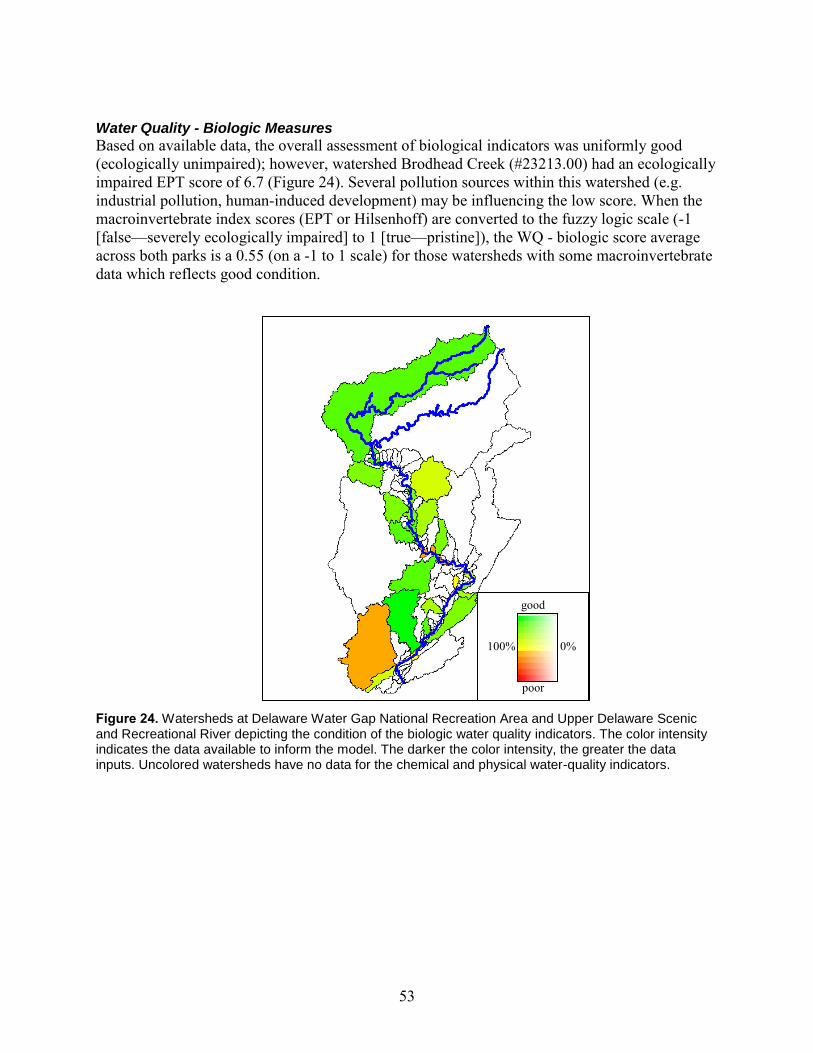
53
Water Quality - Biologic Measures
Based on available data, the overall assessment of biological indicators was uniformly good (ecologically unimpaired); however, watershed Brodhead Creek (#23213.00) had an ecologically impaired EPT score of 6.7 (Figure 24). Several pollution sources within this watershed (e.g. industrial pollution, human-induced development) may be influencing the low score. When the macroinvertebrate index scores (EPT or Hilsenhoff) are converted to the fuzzy logic scale (-1 [false—severely ecologically impaired] to 1 [true—pristine]), the WQ - biologic score average across both parks is a 0.55 (on a -1 to 1 scale) for those watersheds with some macroinvertebrate data which reflects good condition.
Figure 24. Watersheds at Delaware Water Gap National Recreation Area and Upper Delaware Scenic and Recreational River depicting the condition of the biologic water quality indicators. The color intensity indicates the data available to inform the model. The darker the color intensity, the greater the data inputs. Uncolored watersheds have no data for the chemical and physical water-quality indicators.
good 100% 0%
poor
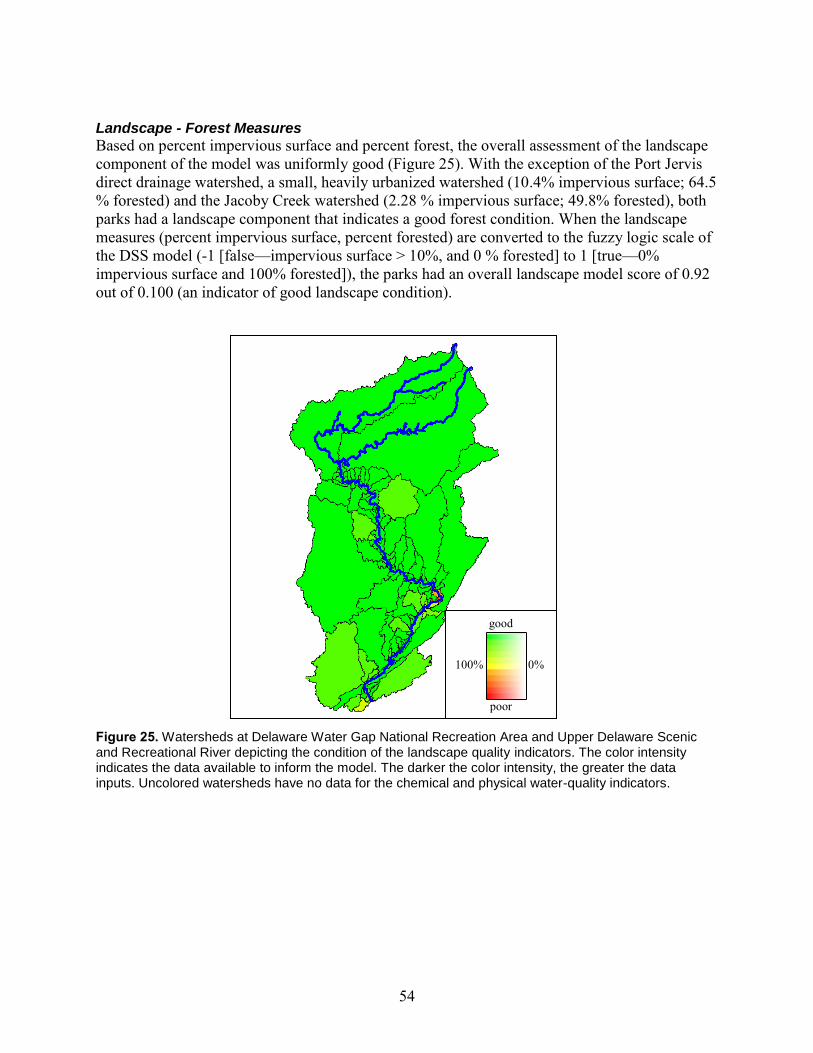
54
Landscape - Forest Measures
Based on percent impervious surface and percent forest, the overall assessment of the landscape component of the model was uniformly good (Figure 25). With the exception of the Port Jervis direct drainage watershed, a small, heavily urbanized watershed (10.4% impervious surface; 64.5 % forested) and the Jacoby Creek watershed (2.28 % impervious surface; 49.8% forested), both parks had a landscape component that indicates a good forest condition. When the landscape measures (percent impervious surface, percent forested) are converted to the fuzzy logic scale of the DSS model (-1 [false—impervious surface > 10%, and 0 % forested] to 1 [true—0% impervious surface and 100% forested]), the parks had an overall landscape model score of 0.92 out of 0.100 (an indicator of good landscape condition).
Figure 25. Watersheds at Delaware Water Gap National Recreation Area and Upper Delaware Scenic and Recreational River depicting the condition of the landscape quality indicators. The color intensity indicates the data available to inform the model. The darker the color intensity, the greater the data inputs. Uncolored watersheds have no data for the chemical and physical water-quality indicators.
good 100% 0%
poor
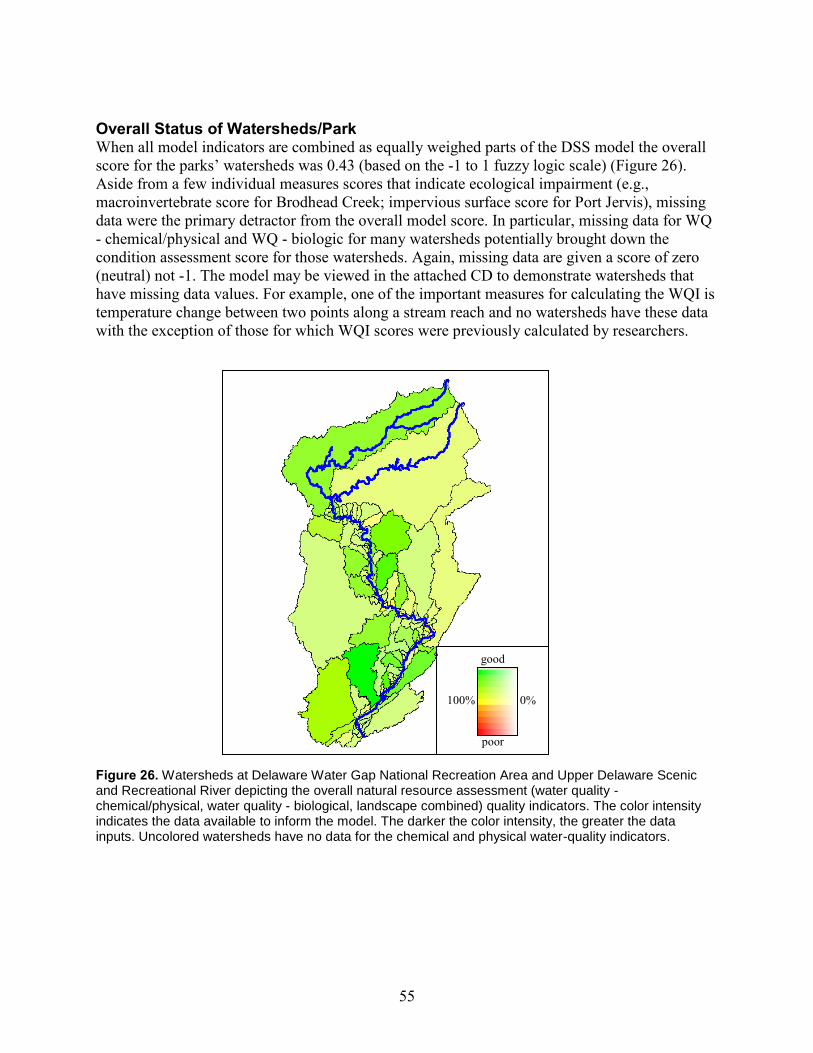
55
Overall Status of Watersheds/Park When all model indicators are combined as equally weighed parts of the DSS model the overall score for the parks’ watersheds was 0.43 (based on the -1 to 1 fuzzy logic scale) (Figure 26). Aside from a few individual measures scores that indicate ecological impairment (e.g., macroinvertebrate score for Brodhead Creek; impervious surface score for Port Jervis), missing data were the primary detractor from the overall model score. In particular, missing data for WQ - chemical/physical and WQ - biologic for many watersheds potentially brought down the condition assessment score for those watersheds. Again, missing data are given a score of zero (neutral) not -1. The model may be viewed in the attached CD to demonstrate watersheds that have missing data values. For example, one of the important measures for calculating the WQI is temperature change between two points along a stream reach and no watersheds have these data with the exception of those for which WQI scores were previously calculated by researchers.
Figure 26. Watersheds at Delaware Water Gap National Recreation Area and Upper Delaware Scenic and Recreational River depicting the overall natural resource assessment (water quality - chemical/physical, water quality - biological, landscape combined) quality indicators. The color intensity indicates the data available to inform the model. The darker the color intensity, the greater the data inputs. Uncolored watersheds have no data for the chemical and physical water-quality indicators.
good 100% 0%
poor

56
Example Watersheds to Highlight Model - Van Campens and Callicoon We chose two watersheds, Callicoon (UPDE #11303.3) and Van Campens (DEWA #33220), to illustrate how the assessment of natural resource condition at the parks works using the DSS model approach. These two watersheds were chosen at the suggestion of park managers and represent areas in the parks that are relatively free of human modifications and watersheds for which multiple datasets were available (Figure 27).
Figure 27. Overall natural resource assessment for Callicoon (upper) and VanCampens (lower) watersheds. The color intensity indicates the data available to inform the model. The darker the color intensity, the greater the data inputs. Uncolored watersheds have no data for the chemical and physical water-quality indicators.
good 100% 0%
poor

57
Data Availability for Each Watershed
The colored ovals in the dependency network for Callicoon indicate that data sets are available for each of the three assessment indicators (Figure 28). Based upon the green shades of colors in this network; there is strong evidence for good chemical and physical water quality and good condition of landscape measures. The biological water quality is of fair condition. On the -1 to 1 fuzzy logic scale of the DSS model, the WQI is 0.76, the landscape component 0.79, and the water quality biologic indicator is 0.25. An equal weighting of these three indicators results in an overall watershed condition score of 0.60 on the -1 to 1 fuzzy logic scale. This score is reflected by the green color in the dependency network and in the Callicoon polygon (Figure 27).
Figure 28. NetWeaver overall evaluation dependency network for Callicoon watershed, Upper Delaware Scenic and Recreational River.

58
The dependency network for VanCampens (Figure 29) indicates that there are no data for macroinvertebrates (biologic). Although some macroinvertebrate data are available from studies conducted by Snyder et al. (2003), no EPT or Hilsenhoff was calculated from these data. However, the model score for the WQI in this watershed is 0.80 on the -1 to 1 fuzzy logic scale and the model score for landscape is 0.99 on the fuzzy logic scale. These scores indicate that VanCampens watershed is in excellent condition for those indicators. However, the lack of data for macroinvertebrates results in a calculated overall score of 0.60. Therefore, the overall condition for the VanCampens watershed is reported as slightly less than for Callicoon –however, this may be due to the effects of missing data on the final assessment score.
Figure 29. NetWeaver overall evaluation dependency network for VanCampens watershed, Delaware Water Gap National Recreation Area.
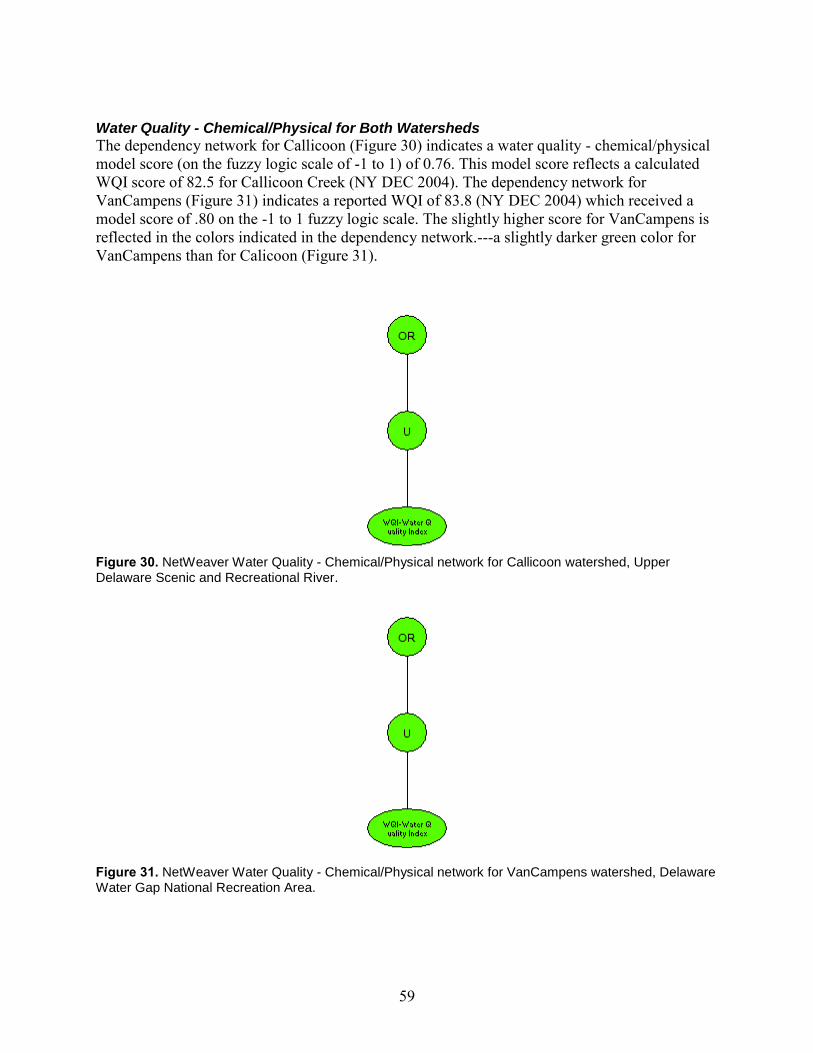
59
Water Quality - Chemical/Physical for Both Watersheds
The dependency network for Callicoon (Figure 30) indicates a water quality - chemical/physical model score (on the fuzzy logic scale of -1 to 1) of 0.76. This model score reflects a calculated WQI score of 82.5 for Callicoon Creek (NY DEC 2004). The dependency network for VanCampens (Figure 31) indicates a reported WQI of 83.8 (NY DEC 2004) which received a model score of .80 on the -1 to 1 fuzzy logic scale. The slightly higher score for VanCampens is reflected in the colors indicated in the dependency network.---a slightly darker green color for VanCampens than for Calicoon (Figure 31).
Figure 30. NetWeaver Water Quality - Chemical/Physical network for Callicoon watershed, Upper Delaware Scenic and Recreational River.
Figure 31. NetWeaver Water Quality - Chemical/Physical network for VanCampens watershed, Delaware Water Gap National Recreation Area.
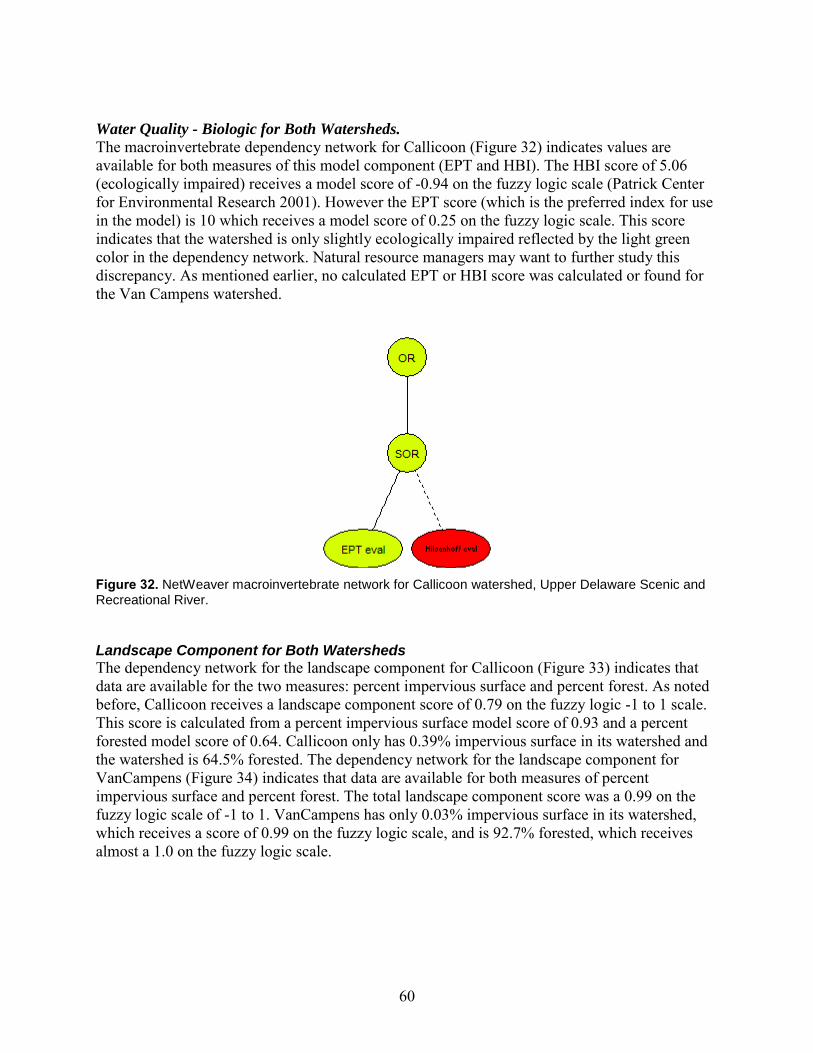
60
Water Quality - Biologic for Both Watersheds.
The macroinvertebrate dependency network for Callicoon (Figure 32) indicates values are available for both measures of this model component (EPT and HBI). The HBI score of 5.06 (ecologically impaired) receives a model score of -0.94 on the fuzzy logic scale (Patrick Center for Environmental Research 2001). However the EPT score (which is the preferred index for use in the model) is 10 which receives a model score of 0.25 on the fuzzy logic scale. This score indicates that the watershed is only slightly ecologically impaired reflected by the light green color in the dependency network. Natural resource managers may want to further study this discrepancy. As mentioned earlier, no calculated EPT or HBI score was calculated or found for the Van Campens watershed.
Figure 32. NetWeaver macroinvertebrate network for Callicoon watershed, Upper Delaware Scenic and Recreational River.
Landscape Component for Both Watersheds
The dependency network for the landscape component for Callicoon (Figure 33) indicates that data are available for the two measures: percent impervious surface and percent forest. As noted before, Callicoon receives a landscape component score of 0.79 on the fuzzy logic -1 to 1 scale. This score is calculated from a percent impervious surface model score of 0.93 and a percent forested model score of 0.64. Callicoon only has 0.39% impervious surface in its watershed and the watershed is 64.5% forested. The dependency network for the landscape component for VanCampens (Figure 34) indicates that data are available for both measures of percent impervious surface and percent forest. The total landscape component score was a 0.99 on the fuzzy logic scale of -1 to 1. VanCampens has only 0.03% impervious surface in its watershed, which receives a score of 0.99 on the fuzzy logic scale, and is 92.7% forested, which receives almost a 1.0 on the fuzzy logic scale.

61
Figure 33. NetWeaver dependency network for Landscape for Callicoon watershed, Upper Delaware Scenic and Recreational River..
Figure 34. NetWeaver dependency network for Landscape for VanCampens watershed, Delaware Water Gap National Recreation Area.
Other Assessment Resources
Aside from the indicators used in the overall natural resource condition assessment, information regarding other natural resource features of watersheds is available with our models. For example, VanCampens has rare species present [timber rattlesnakes, breeding salamanders] and Callicoon has no rare species (at least none have been documented to date). The Callicoon watershed has some of the highest road densities in the parks (based on a quintile analysis) resulting in a DSS model score of -0.906 and appears red for this natural resource element. In contrast, VanCampens has intermediate road density and receives a 0.289 model score and, therefore, appears light green for this natural resource element (in this analysis, we assume low road densities reflect reference condition).

62
Brook trout are the only native salmonid in the Appalachians and have been the focus of recent conservation efforts at both DEWA and UPDE (Hudy et al. 2008). If a resource manager at the parks wanted to examine the presence or absence of brook trout in the parks, our model can be used. Even though brook trout are not part of our assessment per se they do provide natural resource information of interest to the parks. In our watershed comparison, the VanCampens watershed contains brook trout and therefore receives a DSS model score of 1 (present) and appears dark green for this resource element (brook trout are indicating good or a reference condition) (Figure 35). Brook trout are not found or have not been documented or searched for to our knowledge in the Callicoon watershed and therefore receives a DSS model score of 0 and appears white for this resource element (Patrick Center for Environmental Research 2001; Figure 35).
Figure 35. Brook trout presence at Callicoon (upper) and VanCampens (lower).
good 100% 0%
poor
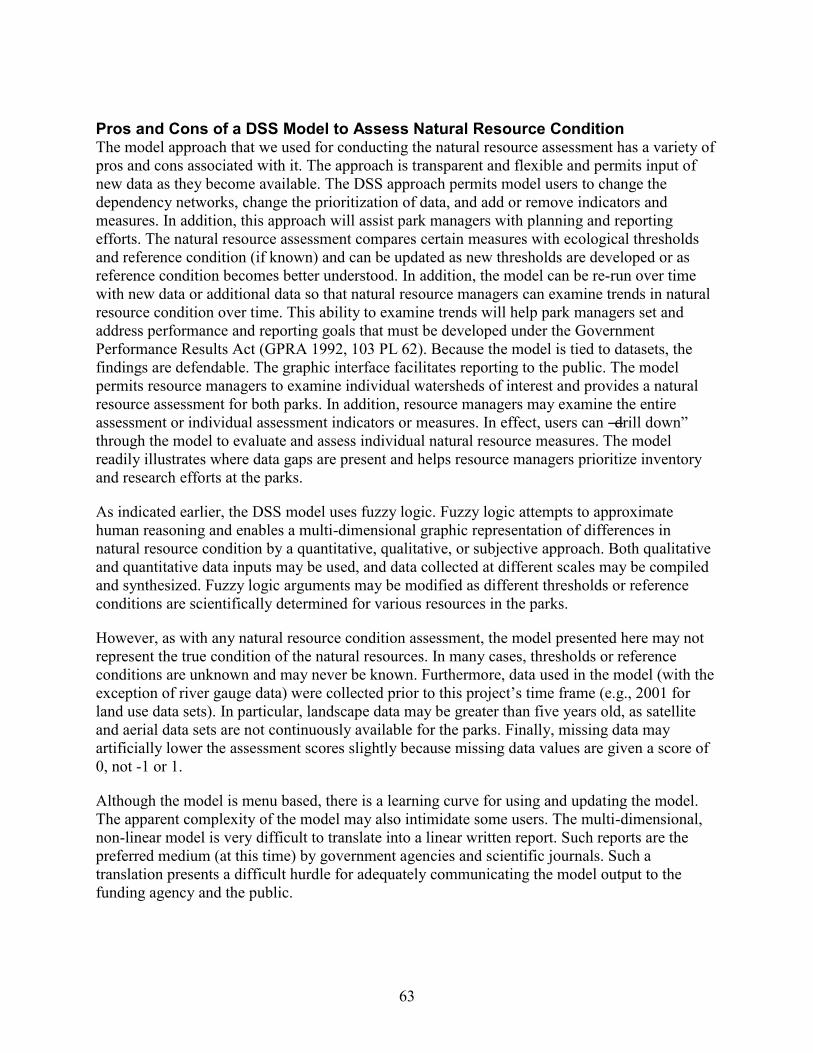
63
Pros and Cons of a DSS Model to Assess Natural Resource Condition The model approach that we used for conducting the natural resource assessment has a variety of pros and cons associated with it. The approach is transparent and flexible and permits input of new data as they become available. The DSS approach permits model users to change the dependency networks, change the prioritization of data, and add or remove indicators and measures. In addition, this approach will assist park managers with planning and reporting efforts. The natural resource assessment compares certain measures with ecological thresholds and reference condition (if known) and can be updated as new thresholds are developed or as reference condition becomes better understood. In addition, the model can be re-run over time with new data or additional data so that natural resource managers can examine trends in natural resource condition over time. This ability to examine trends will help park managers set and address performance and reporting goals that must be developed under the Government Performance Results Act (GPRA 1992, 103 PL 62). Because the model is tied to datasets, the findings are defendable. The graphic interface facilitates reporting to the public. The model permits resource managers to examine individual watersheds of interest and provides a natural resource assessment for both parks. In addition, resource managers may examine the entire assessment or individual assessment indicators or measures. In effect, users can ―drill down‖ through the model to evaluate and assess individual natural resource measures. The model readily illustrates where data gaps are present and helps resource managers prioritize inventory and research efforts at the parks.
As indicated earlier, the DSS model uses fuzzy logic. Fuzzy logic attempts to approximate human reasoning and enables a multi-dimensional graphic representation of differences in natural resource condition by a quantitative, qualitative, or subjective approach. Both qualitative and quantitative data inputs may be used, and data collected at different scales may be compiled and synthesized. Fuzzy logic arguments may be modified as different thresholds or reference conditions are scientifically determined for various resources in the parks.
However, as with any natural resource condition assessment, the model presented here may not represent the true condition of the natural resources. In many cases, thresholds or reference conditions are unknown and may never be known. Furthermore, data used in the model (with the exception of river gauge data) were collected prior to this project’s time frame (e.g., 2001 for land use data sets). In particular, landscape data may be greater than five years old, as satellite and aerial data sets are not continuously available for the parks. Finally, missing data may artificially lower the assessment scores slightly because missing data values are given a score of 0, not -1 or 1.
Although the model is menu based, there is a learning curve for using and updating the model. The apparent complexity of the model may also intimidate some users. The multi-dimensional, non-linear model is very difficult to translate into a linear written report. Such reports are the preferred medium (at this time) by government agencies and scientific journals. Such a translation presents a difficult hurdle for adequately communicating the model output to the funding agency and the public.

64
Finally, like all research, our model is only as good as the input data. It is therefore critical that data collection methodology is well documented, metadata are available, and that data collection is on-going.
65
Literature Cited Andrén, H. 1994. Effects of habitat fragmentation on birds and mammals in landscapes with
different proportions of suitable habitat: A review. Oikos 71:355–366.
Boone, J. H., C. G. Mahan, and K. C. Kim. 2005. Biodiversity inventory: approaches, analysis, and synthesis. Natural Resource Technical Report NPS/NER/NRTR—2005/015.
Booth, D. B., and C. R. Jackson. 1997. Urbanization of aquatic systems: degradation thresholds, stormwater detection, and the limits of mitigation. Journal of American Water Resource Association. 33:311–323.
Brabec, E., S. Schulte, and P. L. Richards. 2002. Impervious Surfaces and Water Quality: A Review of Current Literature and Its Implications for Watershed Planning. Journal of Planning Literature 16:4:499–514.
Chutter, F. M. 1972. An empirical biotic index of the quality of water in south African streams and rivers. Water Research 6:19–30.
Cifaldi R. L., J. D. Allan, J. D. Duh, and D. G. Brown. 2004. Spatial patterns in land cover of exurbanizing watersheds in southeastern Michigan. Landscape and Urban Planning 66:107–123.
Couch, C., et al. 1997. Fish Dynamics in Urban Streams Near Atlanta, Georgia. Technical Note 94. Watershed Protection Techniques. 2(4):511–514.
Daniels, R. A., K. Riva-Murray, D. B. Halliwell, D. L. Vana-Miller, and M. D. Bilger. 2002. An index of biological integrity for northern mid-Atlantic slope drainages. Transactions of the American Fisheries Society 131:1044–1060.
Egan, D., and E. A. Howell. 2001. The historical ecology handbook: a restorationist’s guide to reference ecosystems. Society for Ecological Restoration. Island Press, Washington DC. 457 pages.
Ebert, D. W., and T. G. Wade. 2004. Analytical tools interface for landscape assessments. EPA/600/R-04/083. Washington, DC. U.S. Environmental Protection Agency. Office of Research and Development.
Ersbak, K. 2006. Environmental quality of Pike County streams using bioassessment techniques. Aquatic Resource Consulting, Saylorsburg, PA. 23+ pp.
Gardner, R., B. Milne, M. Turner, and R. O’Neill. 1987. Neutral models for analysis of broad-scale landscape pattern. Landscape Ecology 1:19–28.
Gaufin, A. R., and C. M. Tarzwell. 1952. Aquatic invertebrates as indicators of stream pollution. Publ. Health Repts. 67(1): 57-64.

66
Groffman, P. M., J. S. Baron, T. Blett, A. J. Gold, I. Goodman, L. H. Gunderson, B. M. Levinson, M. A. Palmer, H. W. Paerl, G. D. Peterson, N. LeRoy Poff, D. W. Rejeski, J. F. Reynolds, M. G. Turner, K. C. Weathers, and J. Wiens. 2006. Ecological thresholds: The key to successful environmental management or an important concept with no practical application? Ecosystems 9:1–13.
Hilsenhoff, W. L. 1977. Use of arthropods to evaluate water quality of streams. Wisconsin Department of Natural Resources. Technical bulletin No. 100:15 pp.
Hilsenhoff, W. L. 1987. An improved biotic index of organic stream pollution. Great Lakes Entomologist. 20:31–39.
Hudy, M., T. M. Thieling, N. Gillespie, and E. P. Smith. 2008. Distribution, status, and land use characteristics of subwatersheds within the native range of brook trout in the eastern United States. North American Journal of Fisheries Management 28:1069–1085. American Fisheries Society.
Jones, R., and C. Clark. 1987. Impact of Watershed Urbanization on Stream Insect Communities. American Water Resources Association. Water Resources Bulletin. 15(4).
Karr, J. R. 1991. Biological integrity: a long-neglected aspect of water resource management. Ecological Applications 1:66–84.
Kaurish, F. W., and T. Younos. 2007. Developing a standardized water quality index for evaluating surface water quality. Journal of the American Water Resources Association. 43:533–545.
Kearns, F. R., N. M. Kelly, J. L. Carter, and V. H.Resh. 2005. A method for use of landscape metrics in freshwater research and management. Landscape Ecology 20:113–125.
Kennedy C, J. Wilkinson, and J. Balch. 2003. Conservation thresholds for land use planners. Washington, DC. Environmental Law Institute.
Kennen, J. G., and M. A. Ayers. 2002. Relation of environmental characteristics to the composition of aquatic assemblages along a gradient of urban land use in New Jersey, 1996–1998. U.S. Geological Survey, Water-Resources Investigations Report 02-4069, West Trenton, NJ. 78 pp.
Klein, R. 1979. Urbanization and stream quality impairment. American Water Resources Association. Water Resources Bulletin 15(4).
Klemm D. J., K. A. Blocksom, F. A. Fulk, A. T. Herlihy, R. M. Hughes, P. R. Kaufmann, D. V. Peck, J. L. Stoddard, W. T. Thoeny, M. B. Griffith, and W. S. Davis. 2003. Development and Evaluation of a Macroinvertebrate Biotic Integrity Index (MBII) for Regionally Assessing Mid-Atlantic Highlands Streams. Environ. Manage. 31:656–669.
67
Lande, R. 1987. Extinction thresholds in demographic models of terrestrial populations. American Naturalist 130:624–635.
Lutz, J. A., J. W. van Wagtendonk, A. E. Thode, J. D. Miller, and J. F. Franklin. 2009. Climate, lightning ignitions, and fire severity in Yosemite National Park, California, USA. International Journal of Wildland Fire 18(7):765–774.
Marshall, M., and N. Piekielek. 2005. ERMN vital signs monitoring program: phase II report. USDI. National Park Service.
McGarigal K., and B. J. Marks. 1995. FRAGSTATS. Spatial analysis program for quantifying landscape structure. USDA Forest Service General Technical Report PNW-GTR-351.
Morgan, R. P., K. M. Kline, and S. F. Cushman. 2007. Relationships among nutrients, chloride, and biological indices in urban Maryland streams. Urban Ecosyst. 10:153–166.
Morse, C. C., A. D. Huryn, and C. Cronan. 2003. Impervious surface area as a predictor of the effects of urbanization on stream insect communities in Maine, U.S.A. Environmental Monitoring and Assessment 89:95–127.
New York Department of Environmental Conservation (NY DEC). 2004. 30-year trends in water quality of rivers and streams in New York state based on macroinvertebrate data 1972-2002. Report prepared by the Division of Water. 338 pp.
New York Department of Environmental Conservation (NY DEC). 2004. The Delaware River drainage basin: sampling years 1999-2000. Report prepared by the statewide monitoring section. 254 pp.
O'Connell, T. J., L. E. Jackson, and R. P. Brooks. 2000. Bird Guilds as Indicators of Ecological Condition in the Central Appalachians. Ecological Applications. 10:1706—1721
Patrick Center for Environmental Research. 2001. Bioassessment study for the Delaware Water Gap National Recreation Area and the Upper Delaware Scenic and Recreational River 1997–Year 3. Academy of Natural Sciences, Philadelphia, PA. 72pp.
Plafkin, J. L., M. T. Barbour, K. D. Porter, S. K. Gross, and R. M. Hughes. 1989. Rapid Bioassessment Protocols for Use in Streams and Rivers: Benthic Macroinvertebrates and Fish. U.S. EPA, Office of Water. EPA/444/4-89-001. Washington, DC.
Pontius, Jr, R. G., and L. Schneider. 2001. Land-use change model validation by a ROC method for the Ipswich watershed, Massachusetts, USA. Agriculture, Ecosystems & Environment 85:239–248.
Quinn, J. M., and C. W. Hickey. 1990. Magnitude of effects of substrate particle size, recent flooding, and catchment development on benthic invertebrates in 88 New Zealand rivers. New Zealand Journal of Marine and Freshwater Research Vol. 24:411–427.

68
Richardson, R.E. 1928. The bottom fauna of the middle Illinois River, 1913–1925—Its distribution, abundance, valuation, and index value in the study of stream pollution. Illinois State Natural History Survey 17:392–475.
Riitters, K. H., R. V. O’Neill, C. T. Hunsaker, J. D. Wickham, D. H. Yankee, S. P. Timmins, K. B. Jones, and B. L. Jackson. 1999. A factor analysis of landscape pattern and structure metrics. Landscape Ecology 10(1):23–39.
Saunders, M. C., T. J. Sullivan, B. L. Nash, K. A. Tonnessen, and B. J. Miller. 2005. A knowledge-based approach for classifying lake water chemistry. Knowledge Based Systems 18(1)47–54.
Saura, S., and J. Martinez-Millan. 2001. Sensitivity of landscape pattern metrics to map spatial extent. Photogrammetric Engineering & Remote Sensing 67:1027–1036.
Schueler, T., and H. K. Holland (Eds.). 2000. The Importance of Imperviousness. Center for Watershed Protection. Watershed Protection Techniques 1(3):100–111.
Snyder, C. D., J. A. Young, R. Villella, and D. P. Lemarié. 2003. Influences of upland and riparian land use patterns on stream biotic integrity. Landscape Ecology 18:647–664.
Southerland, M. T., G. M. Rogers, M. J. Kline, R. P. Morgan, D. M. Boward, P. F. Kazyak, R. J. Klauda, and S. A. Stranko. 2007. Improving biological indicators to better assess the condition of streams. Ecological Indicators 7:751-767.
Stepenuck, K. F., R. L. Crunkilton, and L. Z. Wang. 2002. Impacts of urban land use on macroinvertebrate communities in southeastern Wisconsin streams. Journal of American Water Works Association 38:1041–1051.
Surber, E. W. 1953. Biological effects of pollution in Michigan waters. Sew. Industr. Wastes. 25:79–86.
Tierney, G. L., D. Faber-Langendoen, B. R. Mitchell, W. G. Shriver, and J. P. Gibbs. 2009. Monitoring and evaluating the ecological integrity of forest ecosystems. Frontiers in Ecology and the Environment 2009; 7, DOI: 10.1890/070176.
Turner, M. G., R. H. Gardner, and R. V. O’Neill. 2001. Landscape Ecology in Theory and Practice: Pattern and Process. Springer-Verlag, New York.
Van Snik Gray, E., R. M. Ross, and R. M. Bennett. 2005. Bioassessment of Fish Communities of the Upper Delaware River Northeastern Naturalist 12(2):203–216.
Wallace, J. B., J. W. Grubaugh, and M. R. Whiles. 1996. Biotic indices and stream ecosystem processes: Results from an experimental study. Ecological Applications 6(1):140–151.
69
Wang, L., J. Lyons, P. Kanehl, R. Bannerman, and E. Emmons. 2000. Watershed urbanization and changes in fish communities in southeastern Wisconsin streams. Journal of American Water Works Association 36:1173–1189.
Wang, L., J. Lyons, and P. Kanehl. 2001. Impacts of urbanization on stream habitat and fish across multiple spatial scales. Journal of Environmental Management 28:255–266.
Wang, L., J. Lyons, and R. Gatti. 1997. Influences of watershed land use on habitat quality and biotic integrity in Wisconsin streams. Fisheries 22(6)6–12.
Weber, C. I. (ed.). 1973. Biological Field and Laboratory Methods for Measuring the Quality of Surface Waters and Effluents. EPA-670/4-73-001. U.S. Environmental Protection Agency. Cincinnati, OH.
With, K., and T. Crist. 1995. Critical thresholds in species responses to landscape structure. Ecology 76:2446–2459.


71
Appendix Major ecosystems, indicators, and measures of condition evaluated to develop a natural resource condition assessment for Delaware Water Gap National Recreation Area and Upper Delaware Scenic and Recreational River. These indicators were considered for inclusion in our natural resource assessment.
Ecosystem Component
(Natural Resource Set) Measures of Condition Terrestrial uplands Forest plants* Amount of contiguous forest
Fragmentation indices
Plant community diversity--includes small, isolated wetland communities
Disturbance regimes and succession
Invasive organisms* Extent and distribution of non-native plants
Presence of plant pathogens (e.g., disease and insects)
Extent and distribution of damage caused by plant pathogens
Breeding birds* Richness, diversity, and abundance of native upland (e.g., shrub, forest, grassland) breeding birds
Reproductive success of native upland breeding birds
Presence of birds that are rare, or identified on Partners in Flight (PIF) list
Reptiles and amphibians Richness, diversity, and abundance of native reptiles and amphibians
Reproductive success of native reptiles and amphibians
Presence of rare reptiles and amphibians including Abystoma salamanders, timber rattlesnakes, spadefoot toad, etc.
Select mammals Richness, diversity, and abundance of native mammals (including bats, small mammals, bears)
Reproductive success of select native mammals (e.g., black bears)
Presence of rare mammals (e.g., Allegheny woodrat, northern flying squirrel, small-footed myotis)
Land use and ownership* Amount of impervious surface
Amount (%) of lands owned by natural resource agencies
Amount of developed lands
Ecosystem Component Measures of condition
Large Rivers Water Quality/Chemistry* Status and trend of pH, dissolved oxygen, specific conductance, temperature
Status and trend in expanded suite of water quality parameters (e.g., cations, anions, suspended sediments, bacteria, etc.)
Water Quantity* Flow rate of main stem--status, trend, variability
Ground water levels and recharge rates
Aquatic invertebrates* Richness, diversity, and abundance of aquatic macroinvertebrates
Presence of rare aquatic invertebrate communities including freshwater mussels, native crayfish
Evaluate invertebrate biotic integrity indices (IBI)
Presence and abundance of non-native invertebrates (e.g., crayfish, shellfish)
Fish Richness, diversity, and abundance of native fish communities
Presence of migratory fish (e.g., American eel, shad, lampreys)
Presence of rare fish assemblages (e.g., darters, shiners)
Evaluate coldwater fish integrity index
Presence and abundance of non-native fish communities (some may be game fish)
Riparian plants* Plant community diversity in riparian/floodplain areas
Presence and extent of rare floodplain plant communities (e.g., Appalachian riverscour)
Presence and extent of nonnative plant communities

72
Ecosystem Component
(Natural Resource Set) Measures of Condition Tributaries Water Quality/Chemistry* Status and trend of pH, dissolved oxygen, specific conductance, temperature
Status and trend in expanded suite of water quality parameters (e.g., cations, anions, suspended sediments, bacteria, etc.)
Water Quantity Flow rate of major tributaries--status, trend, variability
Ground water levels and recharge rates
Aquatic invertebrates* Richness, diversity, and abundance of aquatic macroinvertebrates
Presence of rare aquatic invertebrate communities including native crayfish
Evaluate invertebrate biotic integrity indices (IBI)
Presence and abundance of non-native invertebrates (e.g., crayfish)
Fish Richness, diversity, and abundance of native fish communities
Presence of rare fish assemblages (e.g., darters, shiners)
Evaluate coldwater fish integrity index
Presence and abundance of non-native fish communities
Riparian plants Plant community diversity in riparian and associated wetland areas
Presence and extent of non-native plant communities
*Ecosystem component has been selected as a vital sign for monitoring ecosystem condition within the Eastern Rivers and Mountain Network. For breeding birds, however, only riparian birds are being monitored with the ERMN.

The Department of the Interior protects and manages the nation’s natural resources and cultural heritage; provides scientific and other information about those resources; and honors its special responsibilities to American Indians, Alaska Natives, and affiliated Island Communities. NPS 620/108557; 647/108557, July 2011
National Park Service U.S. Department of the Interior Natural Resource Stewardship and Science
1201 Oakridge Drive, Suite 150 Fort Collins, CO 80525 www.nature.nps.gov
EXPERIENCE YOUR AMERICA TM
EXPERIENCE YOUR AMERICA TM
Related Documents