ORIGINAL ARTICLE Assessment of effect of recharge from a check dam as a method of Managed Aquifer Recharge by hydrogeological investigations S. Parimalarenganayaki • L. Elango Received: 18 November 2013 / Accepted: 9 October 2014 Ó Springer-Verlag Berlin Heidelberg 2014 Abstract Check dams are often used as a method of Managed Aquifer Recharge (MAR) and are generally preferred in non-perennial rivers for intentional storage of the water. The objective of this study is to evaluate the efficacy of a check dam constructed as a MAR initiative across Arani River, North of Chennai, India by long-term hydrogeological investigations. Electrical resistivity survey and drilling of borehole helped to understand the subsur- face geology. Water level and water quality measurements were carried out periodically from July 2010 to May 2012. Groundwater occurs in unconfined condition in the alluvial formations extending up to a depth of about 50 m below the ground surface. Water table is at a depth ranging from 3 to 12 m below the ground level. The electrical conductivity and concentration of major ion were less in water stored in the dam and hence the recharge of this water has led to improvement in groundwater quality. Rainfall recharge of this study area was estimated to be about 17 % of annual rainfall. About 63 % of water stored in the check dam resulted in groundwater recharge. This has led to an increase in groundwater level from 1 to 3.5 m until a dis- tance of about 2 km. The cost of 1 m 3 of water stored by the check dam will be Rs. 1.20/-. The comparison of groundwater level, water level in the check dam and water quality assisted in demarcating the areas benefited by the storage of water in the check dam. Thus, the electrical conductivity and major ion concentration of water, which are inexpensive, rapid and easy to measure, were used as a tool for understanding the area that is benefited by the water stored in the check dam. The study brought out the efficiency of check dam as a method of MAR in improving the groundwater recharge and groundwater quality. Keywords Chennai MAR Recharge estimation Water level Electrical conductivity Major ions Introduction Demand for groundwater is ever increasing due to the limited availability of surface water resources in several parts of the world. This has led to depletion of groundwater resources and there are several reports on decline in groundwater head over the last two decades (Shankar et al. 2011; Gun 2012). Excessive extraction of groundwater for irrigation where it is slowly renewed is the main cause of the depletion and climate change has the potential to exacerbate the problem in some regions (Vaux 2011; Hertig and Gleeson 2012). Qin et al. (2011), Rahman et al. (2013) and Bocanegra et al. (2013) emphasise the impor- tance of assessing natural recharge on the renewability of the groundwater resources for sustainable development. Adaption of Managed Aquifer Recharge (MAR) will be helpful to overcome the continuous depletion of ground- water resources. Gale et al. (2006) describe MAR as intentional storage and treatment of water in aquifers. MAR methods include aquifer storage and recovery; aquifer storage, transfer and recovery; infiltration ponds; infiltration galleries; soil aquifer treatment; percolation tanks and check dams (Dillon et al. 2009). Amongst these check dams are generally considered as a viable method of MAR to conserve excess runoff during monsoons. This method is especially beneficial in the non-perennial rivers in which runoff is much higher than the natural recharge. S. Parimalarenganayaki L. Elango (&) Department of Geology, Anna University, Chennai 600 025, Tamil Nadu, India e-mail: [email protected] URL: http://www.elango.5u.com 123 Environ Earth Sci DOI 10.1007/s12665-014-3790-8

Welcome message from author
This document is posted to help you gain knowledge. Please leave a comment to let me know what you think about it! Share it to your friends and learn new things together.
Transcript
ORIGINAL ARTICLE
Assessment of effect of recharge from a check dam as a methodof Managed Aquifer Recharge by hydrogeological investigations
S. Parimalarenganayaki • L. Elango
Received: 18 November 2013 / Accepted: 9 October 2014
� Springer-Verlag Berlin Heidelberg 2014
Abstract Check dams are often used as a method of
Managed Aquifer Recharge (MAR) and are generally
preferred in non-perennial rivers for intentional storage of
the water. The objective of this study is to evaluate the
efficacy of a check dam constructed as a MAR initiative
across Arani River, North of Chennai, India by long-term
hydrogeological investigations. Electrical resistivity survey
and drilling of borehole helped to understand the subsur-
face geology. Water level and water quality measurements
were carried out periodically from July 2010 to May 2012.
Groundwater occurs in unconfined condition in the alluvial
formations extending up to a depth of about 50 m below
the ground surface. Water table is at a depth ranging from 3
to 12 m below the ground level. The electrical conductivity
and concentration of major ion were less in water stored in
the dam and hence the recharge of this water has led to
improvement in groundwater quality. Rainfall recharge of
this study area was estimated to be about 17 % of annual
rainfall. About 63 % of water stored in the check dam
resulted in groundwater recharge. This has led to an
increase in groundwater level from 1 to 3.5 m until a dis-
tance of about 2 km. The cost of 1 m3 of water stored by
the check dam will be Rs. 1.20/-. The comparison of
groundwater level, water level in the check dam and water
quality assisted in demarcating the areas benefited by the
storage of water in the check dam. Thus, the electrical
conductivity and major ion concentration of water, which
are inexpensive, rapid and easy to measure, were used as a
tool for understanding the area that is benefited by the
water stored in the check dam. The study brought out the
efficiency of check dam as a method of MAR in improving
the groundwater recharge and groundwater quality.
Keywords Chennai �MAR � Recharge estimation �Water
level � Electrical conductivity � Major ions
Introduction
Demand for groundwater is ever increasing due to the
limited availability of surface water resources in several
parts of the world. This has led to depletion of groundwater
resources and there are several reports on decline in
groundwater head over the last two decades (Shankar et al.
2011; Gun 2012). Excessive extraction of groundwater for
irrigation where it is slowly renewed is the main cause of
the depletion and climate change has the potential to
exacerbate the problem in some regions (Vaux 2011;
Hertig and Gleeson 2012). Qin et al. (2011), Rahman et al.
(2013) and Bocanegra et al. (2013) emphasise the impor-
tance of assessing natural recharge on the renewability of
the groundwater resources for sustainable development.
Adaption of Managed Aquifer Recharge (MAR) will be
helpful to overcome the continuous depletion of ground-
water resources. Gale et al. (2006) describe MAR as
intentional storage and treatment of water in aquifers.
MAR methods include aquifer storage and recovery;
aquifer storage, transfer and recovery; infiltration ponds;
infiltration galleries; soil aquifer treatment; percolation
tanks and check dams (Dillon et al. 2009). Amongst these
check dams are generally considered as a viable method of
MAR to conserve excess runoff during monsoons. This
method is especially beneficial in the non-perennial rivers
in which runoff is much higher than the natural recharge.
S. Parimalarenganayaki � L. Elango (&)
Department of Geology, Anna University,
Chennai 600 025, Tamil Nadu, India
e-mail: [email protected]
URL: http://www.elango.5u.com
123
Environ Earth Sci
DOI 10.1007/s12665-014-3790-8

Increase in contact time between the water impounded and
the riverbed will facilitate the infiltration of water in the
groundwater zone, which otherwise would have been lost
as runoff. This will replenish the groundwater abstracted
before the onset of monsoon rains. Further, the replenish-
ment may result in the availability of sufficient ground-
water during the subsequent non-monsoon periods. Review
on impact of check dams as a method of MAR in
improving the groundwater quantity, quality and livelihood
was carried out by Parimalarenganayaki and Elango
(2013a). The effect of MAR by check dam on improving
the groundwater potential can be assessed by several
methods. Isotopes and temperature of water were used as a
tracer to estimate groundwater recharge by Anderson
(2005), Michalski (2007) and Sprenger et al. (2014). Birk
et al. (2004) made use of the variation in electrical con-
ductivity (EC) of water to quantify groundwater recharge.
Sophocleous (1991), Healy and Cook (2002) and Bocane-
gra et al. (2013) used groundwater level fluctuation method
to quantify the recharge by rainfall and surface water. Raju
et al. (2006), Muralidharan et al. (2007) and Abdalla and
Al-Rawahi (2013) assessed the efficiency of a recharge
structure by groundwater table response. Many researchers
(Meigs and Bahr 1993; Woessner 2000) used tracer tests to
understand the interaction between the groundwater and
surface water. Based on the microbiological load the effect
of riverbank filtration on groundwater quality was studied
by Dash et al. (2008), Singh et al. (2010) and Sandhu et al.
(2010). Even though researchers have used temperature
measurements and tracer test to study the efficacy of
storage water in the check dams, these methods have some
limitations. Temperature measurements require sophisti-
cated tools to be installed in the field and it is difficult to
maintain them. Tracer tests are expensive and may be time
consuming which also has environmental and legal issues,
whereas, on the other hand, measurement of water level,
electrical conductivity and concentration of major ions will
be less expensive, easy to measure and can also be used to
study the efficacy of check dams. To mitigate the problem
of groundwater depletion due to over exploitation a number
of check dams are constructed across the rivers flowing
north of Chennai city, India (Fig. 1). About 80 % of water
requirement in India is met by pumping groundwater,
which is the case in and around Chennai, especially to meet
irrigation requirement. Previous studies in this region
include assessment of groundwater quality (Elango and
Manickam 1986), hydrogeochemistry (Elango 1986),
hydrogeological and artificial recharge studies (UNDP
1987), aquifer restoration from seawater intrusion (Rao
et al. 2004), groundwater augmentation by flood mitigation
(Anuthaman 2009) and augmentation of groundwater by
MAR (Parimalarenganayaki and Elango 2013b). However,
no studies have been carried out on hydrogeological
investigation based on long-term frequent interval to assess
the region benefitted by the storage of water in check dam.
Long-term studies have been carried out only on induced
infiltration rate and sampling issues by Gollnitz (1999) and
a few others (Kuhn 1999; Ray 1999) only with the inten-
tion of quality control for public drinking water supply
from riverbank filtration project. It is essential to carry out
a detailed study based on field measurements of water level
and water quality parameters to understand the effect of
impoundment of water in the dams. Hence, the present
study was carried out with the objective of evaluating the
effect of check dam on groundwater potential using the
water level fluctuation, EC, and concentration of major
ions around a check dam across a river north of Chennai,
India.
Description of the study area
Chennai, the fourth largest city in India, receives an aver-
age rainfall of around 1,200 mm/year, 35 % of which
falling in the southwest monsoon (June–September) and
60 % during the northeast monsoon (October–December)
based on the rainfall data collected from Tamil Nadu
Public Works Department. Rainfall is the major source of
groundwater recharge in this area. Atmospheric tempera-
ture of this area varies from 38 to 42 �C during May–June
and from 18 to 36 �C during December–January. The
monthly average potential evaporation ranges from 2.2 to
7.7 mm (Meteorological department, Chennai). Chennai
city’s water requirement is met mostly from the surface
reservoirs and extracting groundwater from the well fields
located (Fig. 1) in alluvial aquifers north of Chennai con-
tribute about 5–10 % of the water supply. Even though
contribution of groundwater to meet the city’s water supply
is comparatively less, this gains great importance when the
reservoir storage dwindles after summer period of April
and May. Over pumping of groundwater from the alluvial
aquifer north of Chennai to meet city’s water supply and
local irrigational use has lead to lowering of groundwater
table. Hence, to augment the groundwater resources a
series of check dams are being constructed across the Arani
and Koratallai rivers flowing north of the city. These rivers
will flow only for a few days during October–December
after severe monsoonal rains and are generally influent.
The check dams will reduce the river discharge and thus
contain flooding on the downstream side. These check
dams are expected to increase the groundwater recharge by
storing the river runoff during monsoonal rains. One such
check dam across the Arani River was chosen to take up
the present study (Fig. 1). Construction of this check dam
was completed in August 2010. This is a masonry structure
of 260 m length and a height of 3.5 m from the riverbed.
Environ Earth Sci
123

Width on the top was 1 m and upstream face vertical with
rear slope of 0.85:1. The storage capacity of this check dam
is 0.8 Mm3 with its full capacity and the water spread will
extend up to 2 km on the upstream side. This check dam
generally begins to fill up from the month of October and
depends on rainfall in the catchment and release of water
from Pichature reservoir located at a distance of about
40 km on the upstream side of this check dam. Agriculture
is practised over most part of this area and the major crops
include rice, sugarcane, jasmine, rose, watermelon, spin-
ach, cucumber, radish, etc. Rice is cultivated twice a year.
Sugarcane and flowers are grown throughout the year.
Seasonal crops such as watermelon, spinach, cucumber and
radish are cultivated once in a year.
Materials and methods
Geological investigation techniques
Subsurface geological characterisation was made by ver-
tical electrical resistivity soundings, drilling of three bore
holes and study of borehole logs. One-dimensional (1D)
and two-dimensional (2D) vertical sounding with Sch-
lumberger configuration was performed at three locations
using ABEM Terrameter (SAS 1000) and Imaging system
(ES 10-64C). Locations of 1D, 2D and borehole logs are
shown in Fig. 2. This survey was done to measure the
variation in the electrical resistivity of the ground, by
applying electrical current across arrays of electrodes. In
Fig. 1 Study area with location
of check dam and monitoring
wells
Environ Earth Sci
123

1D resistivity survey, the changes in the apparent resistivity
with depth below the centre point of the electrode spread
were obtained by progressively increasing the distance
between the outer electrodes in Schlumberger method. In
2D survey, the variation in resistivity of the subsurface was
obtained along a profile by automatically switching the
connections over an array of 75 electrodes. The subsurface
image was obtained by inversion modelling (Adegbola
et al. 2010). As part of this study three boreholes were also
drilled. The resistivity soundings were carried out at
locations where the borehole logs were not available.
The interpreted subsurface geology from the electrical
resistivity survey was also validated by comparing it with a
nearby three boreholes. Further, four borehole logs (BH1,
BH2, BH3 and BH7) of the study site were obtained from
the private drilling companies.
Water level, electrical conductivity and geochemical
measurements
Initially an intensive field survey was carried out during
July 2010, to study the nature of well, type of cropping
pattern and usage of water for various purposes in this area.
Based on this survey, 19 wells located in regions with
similar land use were chosen for periodical monitoring.
Groundwater level in the wells was measured once in
3 months from July 2010 (before the construction of check
dam) to December 2010 and once in a month from January
2011 to May 2012 using the water level meter (Solinist
101). Groundwater and water from the check dam were
also collected during the field visits. EC of the water
samples was measured in the field using multi-parameter
probe (YSI 556). Alkalinity was measured in the field using
MERCK alkalinity kit (111109). Collected water samples
were analysed in the laboratory for sodium, potassium,
calcium, magnesium, chloride and sulphate using a Metr-
ohm 861 advanced compact ion chromatograph. Daily
water level in the check dam was measured from October
2010 to May 2011 (first filling up time to until water in the
check dam is empty for one season) using staff gauge
installed in the check dam. River bed elevation was mea-
sured using the differential global positioning system
(DGPS) (Leica GS09 GNSS). Length of the impounded
water extents up to 2 km when the check dam reaches its
maximum capacity. Measurement on width of riverbed and
DGPS survey was carried out until this distance. The data
measured through DGPS were imported and processed
using LEICA Geo Office 8.2 to obtain co-ordinates and
elevation. Triangular Irregular Network (TIN) model was
created using ArcGIS 9.2 software based on the elevation
data obtained through DGPS survey. Three-dimensional
analytical capability of ArcGIS 9.2 was used to calculate
the surface area and volume corresponding to different
stages of water in the check dam using this TIN model.
Estimation of natural groundwater recharge
and recharge from check dam
Natural groundwater recharge in the study area was esti-
mated using the various empirical formulae [Chaturvedi,
UP Irrigation Research Institute, Roorkee (UPRI), Bhatta-
charjee, Krishna Roa, Kumar and Seethapathi] as referred
by Gontia and Patil (2012). These empirical formulas are
derived for the areas with semiarid, alluvium and annual
rainfall similar to the present study site.
Quantum of recharge from the check dam was calcu-
lated using water balance method as given in Eq. (1). In
this study site, water stored in the check dam is not pumped
for irrigation or any other purpose and hence the change in
volume was considered due to infiltration and evaporation.
Recharge (m3Þ ¼ change in storage (m3Þ� potential evaporation (m3Þ ð1Þ
Results and discussion
Borehole logs and electrical resistivity survey helped to
bring out the subsurface geology of the study area. The
water level, EC and concentration of major ions of the
surface water stored in the check dam and groundwater in
the monitoring wells are the major data inputs for this
study.
Geology and hydrogeology
Topographically this region gently slopes towards the east
(Fig. 3). Geologically, this region comprises less perme-
able Gondwana clay of Jurassic–Cretaceous period (UNDP
1987) at the bottom. This is overlain by sandy silt
belonging to tertiary. This tertiary deposit is overlain by
alluvial deposit comprising sand, conglomerates and clayey
Fig. 2 Map showing the locations of 1D, 2D and borehole logs
Environ Earth Sci
123

sand of quaternary period. These quaternary deposits are
formed by the alluvial action for a thickness of about 50 m.
The actual subsurface geology of the study site was
understood from the borehole logs and resistivity survey.
1D and 2D resistivity sounding was carried out at locations
where there were no borehole logs. The resistivity data
obtained were processed using 1XID software and the
lithological variation was brought out by inverse model-
ling. Lithological information obtained from the resistivity
data modelling compares well with the nearby borehole
logs. As an example, resistivity curve of location 1D3
along with a nearby borehole log is shown in Fig. 4. The
resistivity image obtained by inverse modelling at location
2D1 along a north–south profile and borehole log of BH6 is
shown in Fig. 5. Figures 4 and 5 indicate that the inter-
preted lithological information from the resistivity data
compares well with the borehole logs. The resistivity sur-
vey indicates the presence of three different layers until the
depth of penetration. The top most layer comprises sand
with resistivity ranging from 20 to 145 Xm extending up to
a depth of about 6.5 m. The second layer is clayey sand
with resistivity ranging from 5 to 20.6 Xm and it extends
from 6.5 to 16.5 m below ground level. The third layer
consists of sand from a depth of 16.5–20 m. A geological
cross-section along X–X0 (Fig. 2) from west to east across
the river derived from the borehole logs and resistivity
survey is shown in Fig. 6.
These three layers of alluvial deposit overlying the
Gondwana clay function as an unconfined aquifer. As the
clay lenses present in the alluvial formation of this area are
only localised and do not extent to a large region, the
groundwater occurs under unconfined condition. Intensive
agriculture practised throughout this area depends mostly
on the use of groundwater. Groundwater level measure-
ments made during the study indicate that the water table
occurs generally at a depth from 3 to 12 m below the
ground surface. The groundwater in general flows towards
eastern direction (Fig. 8).
Groundwater and surface water level variation
To understand the efficacy of the check dam on improving
the groundwater level of this area, the temporal variation in
groundwater level in the wells and the surface water level
in the check dam was compared. Based on this comparison,
the monitoring wells were divided into two groups. In the
first group of wells, the temporal groundwater level fluc-
tuation responds to the variation in rainfall (Fig. 7a). These
wells are located away from the check dam. For example,
the trend of groundwater level similar to that of rainfall of
two wells (well Nos. 25 and 29) is shown in Fig. 7b. This
similarity indicates that the rainfall is the primary source of
groundwater recharge at these locations. In these wells, the
groundwater level raises twice in a year coinciding with the
southwest and northeast monsoon periods. The water table
rose to 1.12 and 2.69 m during southwest monsoon and
northeast monsoon periods respectively in well No. 25. The
raise in water table was 1.5 and 2.07 m during southwest
monsoon and northeast monsoon periods respectively in
well No. 29.
In the second group of wells (example well Nos. 2
and 27) located closer to the check dam, the recharge
begins during the first monsoon of the year (southwest
monsoon, July–September) and this can be seen from the
rise in groundwater level or decrease in the declination
rate in the groundwater level after rain. The recharge
continues in these wells as the rains during this monsoon
result in collection of water in the depression of the river
bed in the upstream of the check dam. As the rain
continues during the northeast monsoon (October–
December) storage in the structure begins to increase and
hence the recharge process continues resulting in steady
rise of groundwater level in the wells located closer to it.
In these wells, the trend of temporal groundwater level is
similar to that of the water level fluctuation in the check
dam rather than the rainfall variation (Fig. 7c). This
similarity indicates that the surface water stored in the
check dam serves as the primary source of recharge. The
water level in these wells rises only once during a year
than the previous group of wells. The groundwater table
rose about 8 m in well No. 2 and was about 6.5 m in
well No. 27. Thus, the comparison of groundwater level,
water level in the check dam and rainfall aided to
Fig. 3 Topographic contour (m msl) of the region
Environ Earth Sci
123

delineate the regions benefited due to the storage of
water in the check dam. The groundwater table map of
the region before the construction of the check dam and
after its construction with its full storage is shown in
Fig. 8. This figure indicates the background of natural
groundwater flow and the influence of the check dam.
The groundwater levels are more or less symmetrical
during the month of July 2010 before the construction of
the dam. There is no rainfall recharge and no flow in the
river during this month, and hence in general the
groundwater flow follows the topography. The ground-
water level in the month of December 2011 clearly
indicates the influence of recharge of water stored in the
check dam. That is the groundwater level very close to
the bund of the rivers is same as that of the surface
water level. During this month the groundwater water
flows away in all directions, as the water level in the
dam is about 24 m msl and the groundwater level at a
distance of 1 km is about 19 m.
Electrical conductivity measurements
Electrical conductivity measurements of groundwater in
the wells and the water in the check dam have been used to
identify the surface water and groundwater interaction.
Fresh surface water and mineralised local groundwater
commonly differ with respect to their EC values (Stiefel
et al. 2009; Rautio and Niemi 2011). As discussed earlier,
the two groups of wells are considered for the study of
variation in EC. Figure 9a shows the temporal variation in
EC of water stored in the check dam and groundwater of
the wells that are primarily recharged by rainfall. This
figure indicates that the EC of groundwater of these wells is
much higher than that of the EC of water in the check dam.
EC of groundwater of these wells varied between 904 and
3,269 lS/cm. The EC of water in the check dam varied
from 397 to 1,197 lS/cm. Figure 9b shows the temporal
variation in the EC of the groundwater of the wells that are
primarily recharged by the water stored in the check dam
Fig. 4 One-dimensional
resistivity curve of location 1D3
Fig. 5 Two-dimensional resistivity image by inverse modelling at location 2D1 along with a nearby the borehole (BH6)
Environ Earth Sci
123

along with the EC of water in the check dam. The EC of
groundwater of these wells varied between 514 and
1,568 lS/cm, which is very similar to the EC of the water
in the check dam. The similarity in the EC of water in the
check dam and groundwater confirms the recharge from
this structure. This also supports the inference made from
the comparison of temporal variation in the water levels
(Fig. 7b, c).
The variation in EC of the groundwater with respect to
distance from the dam is also helping to demarcate the
region as three zones. This was done by plotting the
minimum, maximum and median values of EC measured
in groundwater of wells located at different distances in
the form of a box and whisker plot (Fig. 10a). The
maximum measured EC of water in the dam was
1,197 lS/cm. Hence, a horizontal line was drawn as a
reference line at 1,200 lS/cm in Fig. 10a. The median
values of EC of well Nos. 1, 2, 3, 4 and 27 are below this
reference line, indicating that these groups of wells are
highly benefitted by the recharge from check dam and
EC of these wells varied between 397 and 1,567 lS/cm.
The median values of EC of well Nos. 7, 13, 14, 17, 20,
21, 25, 29, 30, 31, 33 and 36 are above this reference
line, indicating that these wells are not significantly
influenced by the recharge of water from the check dam.
EC of these wells varied between 904 and 3,269 lS/cm.
The wells (well Nos. 5, 15, 16 and 18) in which the
median values are very close to the horizontal reference
line indicating that these wells are partially benefitted by
the recharge of water from the check dam. These wells
are located either on the western side or in the directions
away from the general groundwater flow path from west
to east. Thus, these wells are partially benefited, when
water in the check dam is at the maximum level. The
Fig. 6 Geological cross-section
from west to east across the
river derived from the borehole
logs and resistivity survey
Fig. 7 a Temporal variation in rainfall, b temporal variation in
groundwater level in wells similar to the rainfall and c temporal
variation in groundwater level in wells similar to the water level in the
check dam
Environ Earth Sci
123

inferences made from the EC measurements compare
well with the inferences made from the water level
observations as seen in Fig. 10b.
Major ion concentration
Schoeller plot was used to compare the water stored in the
check dam, groundwater from the wells located closer
(well Nos. 1, 2 and 27) and away (well Nos. 7, 14, 25 and
29) from the check dam for the month of October 2010
and January 2011 (Fig. 11). The water from the check
dam is exhibiting very low ionic concentrations, whilst
the wells away from check dam show significantly higher
concentration of ions. The major ion concentration of the
wells located closer to the structure is more or less similar
pattern as that of water in the check dam, which indicates
that groundwater is primarily derived from the dam.
Further, effect of recharge on the drinking water and
irrigation water quality of this site was already reported
by Parimalarenganayaki and Elango (2014) which is also
in accordance with these observations. Thus, the EC and
major ion concentration of water, which are inexpensive,
rapid and easy to measure, were used as a tool for the
understanding the area that are benefited by the water
stored in the check dam. The results based on EC were
also comparable with the results of major ion concentra-
tion of water.
Fig. 8 Groundwater table map
of the region before and after
construction of the check dam
Fig. 9 Temporal variation of electrical conductivity of water in
check dam, a groundwater of the wells primarily recharged by rainfall
and b groundwater of the wells primarily recharged by surface water
in the check dam
Environ Earth Sci
123

Estimation of natural groundwater recharge and recharge
from check dam
The estimated percentage groundwater recharge by
empirical formula for the years 2005–2012 is given in
Table 1. These empirical formulas had been used to
estimate groundwater recharge in different parts of India.
In the absence of any formula for the present study area
the already published empirical formula was used. The
variation in the estimated groundwater recharge using
different empirical formula was generally around 2 %.
However, for the year 2012 the empirical formula sug-
gested by Krishna Rao underestimates the groundwater
recharge, as this formula is applicable for annual rainfall
of 600–1,000 ml. These analyses indicate that the UPRI,
Bhattacharjee and Chaturvedi formula estimates the
groundwater recharge as expected for this region. Per-
centage of rainfall contributed to groundwater recharge of
this area varied from 14.8 to 17.3 % with an average
value of 16.77 %.
Recharge from check dam was calculated for the period
between 2010 and 2011. The water levels in the check dam
vary from 20.3 to 23.8 m (Fig. 12). Area of water spread
and volume of water stored in the check dam were esti-
mated on daily basis using TIN model (Fig. 13). Maximum
storage capacity corresponding to maximum water level in
the check dam was estimated to be 0.8 Mm3. Change in
volume (DV) of water stored in the check dam is given by
DV = Vt – Vt-1, where Vt is volume of water stored at time
t, Vt-1 is volume of water stored at time t - 1 and t is day.
The monthly average potential evaporation data of this site
were used to calculate the daily evaporation. Daily volume
of water evaporated during the period of storage is a
product of daily evaporation and water surface area. Vol-
ume of water infiltrated into the ground was calculated by
subtracting the daily volume of water evaporated from the
check dam with the daily change in volume of water stored
in the check dam. As there was no other loss from the
check dam, it was considered that the water is lost only
from infiltration and evaporation. Daily cumulative
Well number
Ele
ctri
cal c
ondu
ctiv
ity (µ
S/cm
)
0
500
1000
1500
2000
2500
3000
3500
4000
4500
CD 1 2 3 4 27 5 15 16 18 7 13 14 17 20 21 25 29 30 31 33 36
Zone ILow EC
Zone IIModerate EC
Zone IIIHigh EC
MaxMin75th %25th %
Median
Che
ck d
am
a
Well number
Wat
er le
vel (
msl
)
12
14
16
18
20
22
24
26
28
CD 1 2 3 4 27 5 15 16 18 7 13 14 17 20 21 25 29 30 31 33 36
Zone IIModerate GWL fluctuation
MaxMin75th %25th %Median
Zone III Low GWL fluctuation
Zone IHigh GWL fluctuation
Che
ck d
am
b
Fig. 10 Box and whisker diagram of a electrical conductivity of water in the check dam and groundwater in different wells, b water level
fluctuation of surface and groundwater in different wells
Environ Earth Sci
123

storage, volume of water evaporated and volume of water
infiltrated as groundwater recharge with respect to time are
shown in Fig. 14. A quantum of 2 Mm3 of water was
harvested due this dam during the period from October
2010 to May 2011. At the end of May 2011 the dam was
empty. It was estimated that about 1.3 Mm3 of water stored
(63 % of cumulative storage) was infiltrated as a ground-
water recharge. As the storage capacity of this dam is
0.8 Mm3, it is clear that about two times of this volume
was harvested during this year. Hence, it is reasonable to
assume that all the check dams in this region would have
harvested two times of its storage capacity in years with
about 1,200 mm of rainfall.
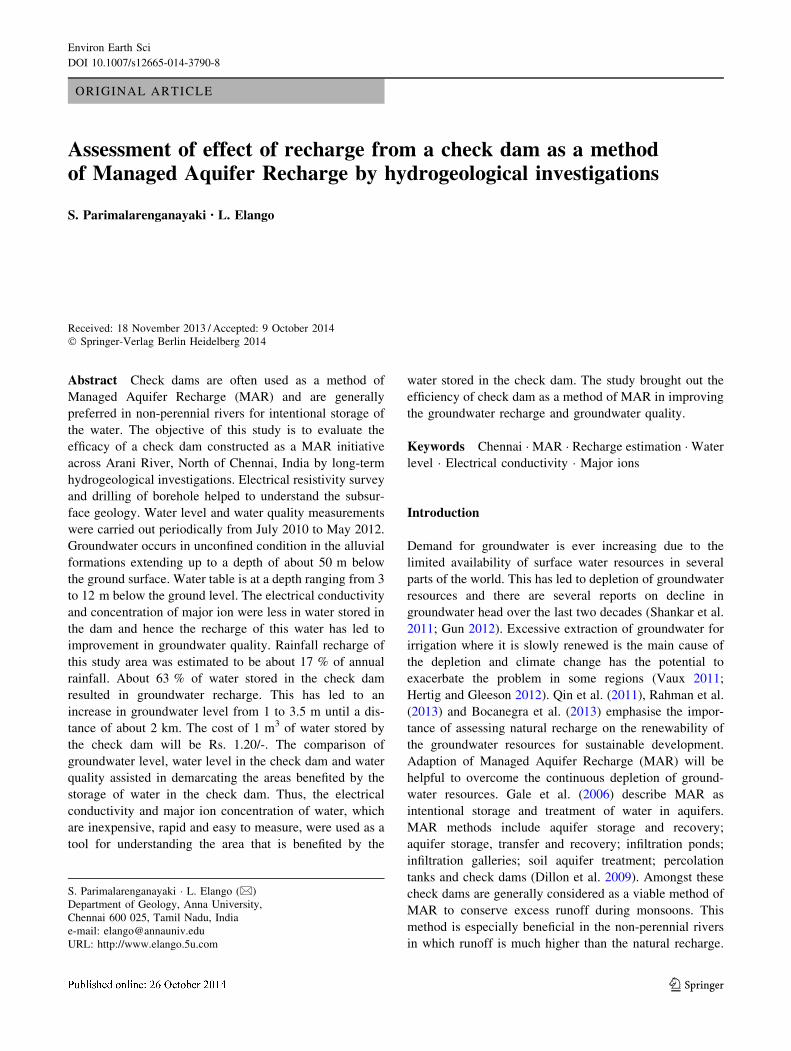
Delineation of region benefitted
Water level fluctuation, EC and concentration of major
ions were used to classify the region based on the benefit
that it has acquired due to storage of water in the check
dam. The region was classified into three zones as high,
moderate and minimal benefit due to the storage of water in
the dam, which is shown in Fig. 15. After the construction
of check dam the wells within a distance of about 1.25 km
in zone I are highly benefited by the recharge from the
dam. The groundwater level in this zone has increased by
3.5 m and the EC was ranging from 514 to 1,568 lS/cm.
The zone II extending from 1.25 to 1.75 km is moderately
benefited by the check dam. The groundwater level in this
zone has increased by about 1 m and the EC ranging from
800 to 1,700 lS/cm. The groundwater of the zone III which
is not directly benefited by the check dam has the ambient
EC ranging from 904 to 3,269 lS/cm. Thus, the effect of
recharge on improvement in groundwater quality with
respect to ionic concentration is evident. Further, the
quantum of recharge from the dam was estimated by the
daily water level measurements using water balance
method. About 1.3 Mm3 of water has recharged during the
period from October 2010 to May 2011. The construction
of check dam will result in reduction in volume of water
discharged to the sea by 2 Mm3 per annum. However, this
is only a very small fraction of the present discharge from
this river into the sea, which is 94.4 Mm3 per annum as
estimated by UNDP (1987). As only a very small fraction
of runoff is harvested due to this structure there will not be
any major changes in the hydrological balance. Further, the
check dam is designed with the sluice gates at either end,
opening of these gates for a brief period of time results in
prevention of siltation.
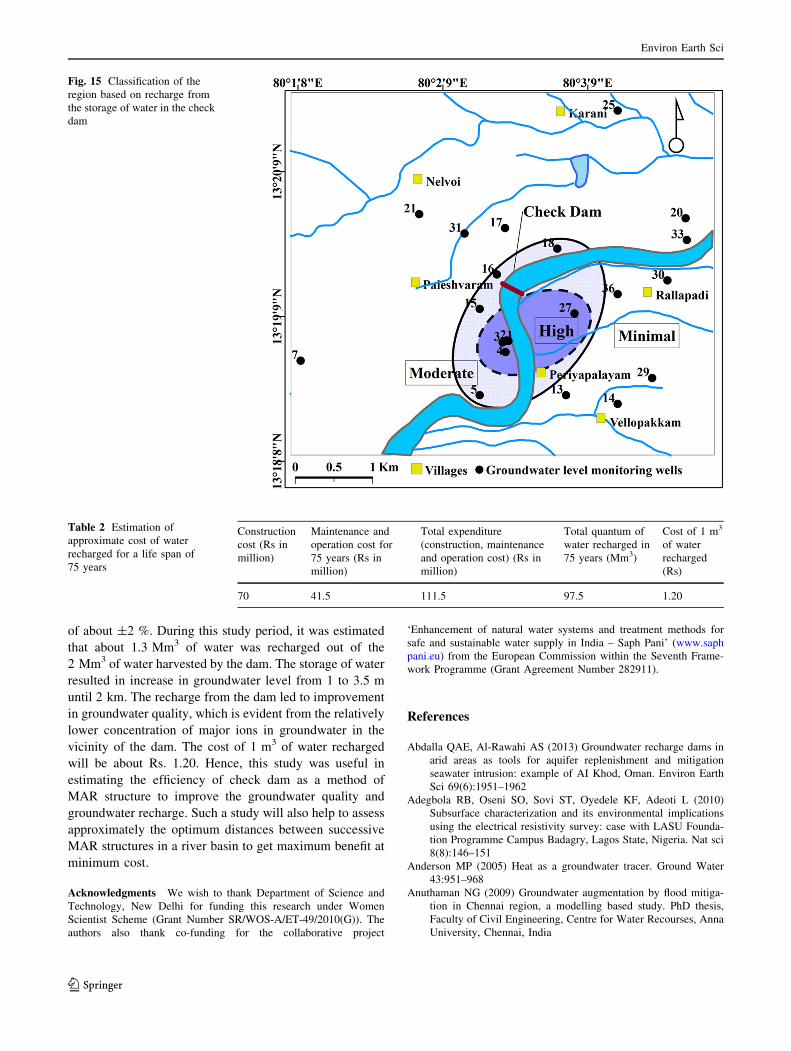
Estimation of cost of recharged water
Cost of recharged water was estimated approximately by
considering the costs of construction of the dam, annual
operation and maintenance. As per the Public Works
Department, Government of Tamil Nadu the cost of con-
struction of this dam was Rs. 70.00 million (1 US $ = Rs.
60.26 as on September 2014 as per Reserve Bank of India).
It is assumed that the life of this check dam is about
75 years. The annual cost for maintenance and operation of
this check dam was considered as Rs. 0.5 million. The
annual average rate of inflation is about 10 % based on the
inflation rate between the years 2001 and 2010 (Nadhanael
and Pattanaik 2010). Benefit from structure was estimated
in terms of the volume of water recharged per year. Based
on the present study, it was estimated that 1.3 Mm3 of
water is recharged from check dam when the annual
average rainfall is about 1,200 mm. Assuming that this will
be the quantum of recharge every year, a quantity of
97.5 Mm3 of water would have recharged during 75 years.
Based on these, the cost of 1 m3 of water recharged will be
about Rs. 1.20 (Table 2).
Conclusion
The efficiency of a check dam constructed as a method of
MAR was assessed by water level, EC, major ion con-
centration and recharge estimation. The electrical resistiv-
ity methods were used to understand the subsurface
Fig. 11 Schoeller diagram of water stored in the check dam and
groundwater from the wells located closer to the check dam, away
from check dam: a October 2010 b January 2011
Environ Earth Sci
123

lithology in this region. The lithological interpretation
arrived based on electrical resistivity investigations com-
pared well with the borehole logs. The comparison of
groundwater levels, water level in the check dam and
rainfall assisted in demarcating the area that is highly
benefited by the storage of water in the check dam. The
inferences made from EC measurements, major ion con-
centration also indicate that the water in the dam and the
aquifer is similar. These inferences are also accordance
with the interpretation arrived from the comparison of
groundwater and surface water level variations. Rainfall
recharge of this study area is about 17 % of annual rainfall.
All the empirical formulas used to estimate rainfall
recharge gave more or less similar results with a variationTa
ble
1A
nn
ual
gro
un
dw
ater
rech
arg
eas
per
cen
tag
eo
fra
infa
llu
sin
gem
pir
ical
form
ula
Yea
rR
ain
fall
(Rf)
mm
Ch
atu
rved
i%
GW
R=
[2(R
f-
15
)0.4
/
Rf]
91
00
(Rf
inin
ch)
UP
RI
%
GW
R=
[1.3
5(R
f-
14
)0.5
/Rf]
91
00
(Rf
in
inch
)
Bh
atta
char
je%
GW
R=
[3.4
7(R
f-
38
)0.4
/Rf]
91
00
(Rf
incm
)
Kri
shn
aR
ao%
GW
R=
[0.2
5(R
f-
40
0)/
Rf]
91
00
(Rf
inm
m)
Ku
mar
and
See
thap
ath
i%
GW
R=
[0.6
3(R
f-
15
.28
)0.7
6/
Rf]
91
00
(Rf
inin
ch)
Av
erag
e
%G
WR
20
05
11
95
17
.01
16
.50
16
.88
16
.63
18
.55
17
.11
20
06
14
19
15
.79
15
.64
15
.67
17
.95
18
.82
16
.77
20
07
13
56
16
.12
15
.87
15
.99
17
.63
18
.77
16
.87
20
08
1,1
95
17
.01
16
.50
16
.88
16
.63
18
.55
17
.11
20
09
90
71
8.8
21
7.6
11
8.6
81
3.9
71
7.4
71
7.3
1
20
10
1,3
87
15
.95
15
.75
15
.83
17
.79
18
.80
16
.82
20
11
1,0
35
18
.00
17
.13
17
.86
15
.34
18
.10
17
.29
20
12
54
11
9.6
11
7.1
21
9.4
96
.52
11
.57
14
.86
To
tal
aver
age
rech
arg
e1
6.7
7
Fig. 12 Water level fluctuation in check dam
Fig. 13 Daily volume of water and corresponding water surface area
in the check dam
0.00
0.50
1.00
1.50
2.00
2.50
Oct Nov Dec Jan Feb Mar Apr May
stor
age
(Mm
3 )
Time
Storage Recharge Evaporation
20112010
Cum
ulat
ive
Fig. 14 Cumulative volume of water stored, evaporated and infil-
trated from the check dam
Environ Earth Sci
123
of about ±2 %. During this study period, it was estimated
that about 1.3 Mm3 of water was recharged out of the
2 Mm3 of water harvested by the dam. The storage of water
resulted in increase in groundwater level from 1 to 3.5 m
until 2 km. The recharge from the dam led to improvement
in groundwater quality, which is evident from the relatively
lower concentration of major ions in groundwater in the
vicinity of the dam. The cost of 1 m3 of water recharged
will be about Rs. 1.20. Hence, this study was useful in
estimating the efficiency of check dam as a method of
MAR structure to improve the groundwater quality and
groundwater recharge. Such a study will also help to assess
approximately the optimum distances between successive
MAR structures in a river basin to get maximum benefit at
minimum cost.
Acknowledgments We wish to thank Department of Science and
Technology, New Delhi for funding this research under Women
Scientist Scheme (Grant Number SR/WOS-A/ET-49/2010(G)). The
authors also thank co-funding for the collaborative project
‘Enhancement of natural water systems and treatment methods for
safe and sustainable water supply in India – Saph Pani’ (www.saph
pani.eu) from the European Commission within the Seventh Frame-
work Programme (Grant Agreement Number 282911).
References
Abdalla QAE, Al-Rawahi AS (2013) Groundwater recharge dams in
arid areas as tools for aquifer replenishment and mitigation
seawater intrusion: example of AI Khod, Oman. Environ Earth
Sci 69(6):1951–1962
Adegbola RB, Oseni SO, Sovi ST, Oyedele KF, Adeoti L (2010)
Subsurface characterization and its environmental implications
using the electrical resistivity survey: case with LASU Founda-
tion Programme Campus Badagry, Lagos State, Nigeria. Nat sci
8(8):146–151
Anderson MP (2005) Heat as a groundwater tracer. Ground Water
43:951–968
Anuthaman NG (2009) Groundwater augmentation by flood mitiga-
tion in Chennai region, a modelling based study. PhD thesis,
Faculty of Civil Engineering, Centre for Water Recourses, Anna
University, Chennai, India
Fig. 15 Classification of the
region based on recharge from
the storage of water in the check
dam
Table 2 Estimation of
approximate cost of water
recharged for a life span of
75 years
Construction
cost (Rs in
million)
Maintenance and
operation cost for
75 years (Rs in
million)
Total expenditure
(construction, maintenance
and operation cost) (Rs in
million)
Total quantum of
water recharged in
75 years (Mm3)
Cost of 1 m3
of water
recharged
(Rs)
70 41.5 111.5 97.5 1.20
Environ Earth Sci
123

Birk S, Liedl R, Sauter M (2004) Identification of localised recharge
and conduit flow by combined analysis of hydraulic and physico-
chemical spring responses (Urenbrunnen, SW-Germany).
J Hydrol 286:179–193
Bocanegra E, Londona OMQ, Martinez DE, Romanelli A (2013)
Quantification of the water balance and hydrogeological pro-
cesses of groundwater–lake interactions in the Pampa Plain,
Argentina. Environ Earth Sci 68:2347–2357
Dash RR, Mehrotra I, Kumar P, Grischek T (2008) Lake bank
filtration at Nainital, India: water-quality evaluation. Hydrogeol
J 16(6):1089–1099
Dillon P, Pavelic P, Page D, Beringen H, Ward J (2009) Managed
aquifer recharge: an introduction. (waterlines report No. 13),
Australia: National water commission. http://archive.nwc.gov.
au/__data/assets/pdf_file/0011/10442/Waterlines_MAR_comple
teREPLACE.pdf. Accessed 16 Oct 2014
Elango L (1986) Hydrogeochemical studies in an aquifer north of
Madras. Abstract. Ground Water 24:555
Elango L, Manickam S (1986) Groundwater quality of Madras
aquifer: a study on Panjetti–Ponneri–Minjur area. Indian Geog J
61:41–49
Gale IN, Macdonald DMJ, Calow RC, Moench M, Kulkarni H,
Mudrakartha S, Palanisami K (2006) Managed aquifer recharge:
an assessment of its role and effectiveness in watershed
management, British Geological Survey, commissioned report,
CR/06/107 N. http://nora.nerc.ac.uk/7453/1/CR06107N.pdf.
Accessed 15 December 2011
Gollnitz WD (1999) Cincinnati water works, Ohio induced infiltration
rate variability and water quality sampling issues. In: Proceed-
ings of the international river bank filtration conferences,
Louisville
Gontia NK, Patil PY (2012) Assessment of groundwater recharge
through rainfall and water harvesting structures in Jamka
microwatershed using remote sensing and GIS. J Indian Soc
Remote Sens 40(4):639–648
Gun JVD (2012) Groundwater and global change: trends, opportu-
nities and challenges. United Nations Educational, Scientific and
Cultural Organization (UNESCO), Paris
Healy WR, Cook PG (2002) Using groundwater levels to estimate
recharge. Hydrogeol J 10:91–109
Hertig AW, Gleeson T (2012) Regional strategies for the accelerating
global problem of groundwater depletion. Nat Geosci 5:853–861
Kuhn W (1999) Overview of riverbank filtration issues. In: Proceed-
ings of the international river bank filtration conferences,
Louisville
Meigs lG, Bahr MJ (1993) Tracer test evaluation of groundwater—
surface water interactions, tracers in hydrology. In: Proceedings
of Yokohama symposium, 20–23 July, IAHS Publ. No. 215.
http://iahs.info/redbooks/a215/iahs_215_0235.pdf. Accessed 20
May 2012
Michalski A (2007) Application of temperature and electrical-
conductivity logging in ground water monitoring. Groundw
Monit remediat 9:112–118
Muralidharan D, Andrade R, Rangarajan R (2007) Evaluation of
check-dam recharge Through water-table response in ponding
area. Curr Sci 92(10):1350–1352
Nadhanael GK, Pattanaik S (2010) Measurement of inflation in India:
issues and associated challenges for the conduct of monetary
policy. Reserve Bank of India (RBI) staff studies. http://rbidocs.
rbi.org.in/rdocs/PublicationReport/Pdfs/STNADA020910.Pdf.
Accessed 8 August 2014
Parimalarenganayaki S, Elango L (2013a) A review on managed
aquifer recharge by check dams: a case study near Chennai,
India. Int J Res Eng Tech 2(4):416–423. http://ijret.org/volumes/
2013_04_Vol_02_Iss_04/P2013_04_02_04_002.pdf. Accessed
10 April 2013
Parimalarenganayaki S, Elango L (2013b) Augmentation of ground-
water by managed aquifer recharge around a non perennial river,
In: Efficient water management: Challenges and opportunities.
https://indiawaterweek.water.tallyfox.com/documents/augmenta
tion-groundwater-managed-aquifer-recharge-around-non-perennial-
river. Accessed 10 June 2013
Parimalarenganayaki S, Elango L (2014) Impact of recharge from a
check dam on groundwater quality and assessment of suitability
for drinking and irrigation purposes. Arab J Geosci 7(8):3119–
3129
Qin AD, Qian BY, Han CL, Wang AZ, Li AC, Zhao Z (2011)
Assessing impact of irrigation water on groundwater recharge
and quality in arid environment using CFCs, Tritium and stable
isotopes in the Zhangye Basin, Northwest China. J Hydrol
405:194–208
Rahman MA, Wiegand BA, Badruzzaman ABM, Ptak T (2013)
Hydrogeological analysis of the upper Dupi Tila aquifer, towards
the implementation of a managed aquifer-recharge project in
Dhaka city, Bangladesh. Hydrogeol J 21(5):1071–1089
Raju JN, Reddy TVK, Munirathnam P (2006) Subsurface dams to
harvest rainwater—a case study of the Swarnamukhi River
basin, Southern India. Hydrogeol J 14:526–531
Rao SVN, Saheb S M, Ramasastri KS (2004) Aquifer restoration from
seawater intrusion: a field-scale study of Minjur aquifer
system—north of Chennai, Tamilnadu, India. In: Proceedings
of 18th Salt Water Intrusion Meet (SWIM), Cartagena (Spain).
Available via http://www.swim-site.nl/pdf/swim18/swim18_064.
pdf. Accessed 15 February 2012
Rautio A, Niemi KK (2011) Characterization of groundwater-lake
water interaction at Pyhajarvi, a lake in SW Finland. Boreal
Environ Res 16:363–380
Ray C (1999) Pesticide and nitrate issues at selected bank filtration
sites in Illinois. In: Proceedings of the international river bank
filtration conferences, Louisville
Sandhu C, Grischek T, Kumar P, Ray C (2010) Potential for riverbank
filtration in India. Clean Tech Environ Policy. doi:10.1007/
s10098-010-0298-0
Shankar VPS, Kulkarni H, Krishnan S (2011) India’s groundwater
challenge and the way forward. Econ Polit Wkly
XLVI(2):37–45. http://environmentportal.in/files/groundwater.
pdf. Accessed 29 April 2013
Singh P, Kumar P, Mehrotra I, Grischek T (2010) Impact of riverbank
filtration on treatment of polluted river water. J Environ Manage
91(5):1055–1062
Sophocleous MA (1991) Combining the soil water balance and water-
level fluctuation methods to estimate natural ground-water
recharge: practical aspects. J Hydrol 124:229–241
Sprenger C, Parimalarenganayaki S, Schneider M, Elango L (2014)
Hydrochemistry and stable isotopes during salinity ingress and
refreshment in surface- and groundwater from the Arani-
Koratallai (A-K) basin north of Chennai (India). Environ Earth
Sci. doi:10.1007/s12665-014-3269-7
Stiefel MJ, Melesse MA, McClain EM, Price MR, Anderson PE,
Chauhan KN (2009) Effects of rainwater-harvesting-induced
artificial recharge on the groundwater of wells in Rajasthan,
India. Hydrogeol J 17:2061–2073
UNDP (1987) Hydrogeological and artificial recharge studies,
Madras, technical report, UNDP, technical report number DP/
UN/IND-78-029/2
Vaux G (2011) Groundwater under stress: the importance of
management. Environ Earth Sci 62:19–23
Woessner WW (2000) Stream and fluvial plain ground water
interactions: rescaling hydrogeologic thought. Ground Water
38(3):423–429
Environ Earth Sci
123
Related Documents