33 Page 33-54 © MAT Journals 2019. All Rights Reserved Journal of Water Resources and Pollution Studies e- ISSN: 2581-5326 Volume 4 Issue 1 Assessment and Control Measures for Jayanti Stream to Control Water Pollution of Panchganga River, Maharashtra, India 1 Rohan Sandeep Ghatage, 2 Ar. Vandana Pusalkar 1 UG Student Department of Civil Engineering Sardar Patel College of Engineering affiliated to University of Mumbai, Maharashtra, India 2 Assistant Professor SPSMBH's College Of Architecture, Kolhapur, Maharashtra, India Email: 1 [email protected], 2 [email protected] DOI: Abstract In the upcoming years we might experience scarcity of water; hence it is the need of the hour to protect the water bodies from getting polluted. Polluted water will not only affect the human health but will also disturb the ecological balance of the river. More industrialization and increased population results in everlasting demands which finally gives rise to water pollution. In this research paper, Panchganga River of Kolhapur City in Maharashtra Stateis taken as the part of study work. Kolhapur City is blessed to have Panchganga River flowing within the city. But water quality of Panchganga River is becoming a more cause of concern than pride for the past 10-15 years. The water in the Panchganga River is polluted due to direct discharge of many streams, CETP Plants of MIDC industrial hub, chemical fertilizers used for agriculture and lack of awareness among the people. The polluted water of Panchganga has given rise to many some dangerous infectious diseases like Diarrhea, jaundice, gastro and fever etc. in Kolhapur city. As more than half the polluted water comes from the Jayanti stream to the Panchganga River so an innovative concept is suggested to deal with the problem of Jayanti stream which will not solve the problem of water pollution but will also rejuvenate the Jayanti Stream more effectively. A typical portion of the Jayanti Stream is been considered and a working model of that entire portion of the Jayanti Stream is been specifically elaborated with its 3D model including the water treatment facilities of the surrounding houses, waste material trapping devices, new approach towards ground water treatment, pipeline systems for the evacuation of the treated water from the houses to the Jayanti Stream. This whole development of the project will improve the water quality standards and will also continue the development of the ecological cycle for the rest of the remaining years. Keywords: Industrialization, Rejuvenate, Ecological INTRODUCTION Kolhapur is the adjacent urban body located along the bank of the river with a population of 549283 and this city is located at 16° 42' N and 74° 14' E, having mean sea level of 570 m. Area of Kolhapur city is around 6682 Ha. Panchganga flows from the borders of Kolhapur. It originates in Western Ghats and is a major tributary to Krishna. It starts from Prayag Sangam. The Kasari, the Kumbhi, the Tulsi and the Bhogawati are the major four streams due to which the Panchganga River is formed. One more river stream Saraswati is believed to flow underground and together with the other four streams make river Panchganga. The confluence of the Prayag Sangam gives an imprint of the beginning of the Panchganga River which after receiving the waters from the four tributaries continues in a larger flow pattern of waters received from the rivers in the vicinity of the Panchganga River. The Northern region of Kolhapur district consists of an alluvial plain spreading over a wider part in the surrounding regions.

Welcome message from author
This document is posted to help you gain knowledge. Please leave a comment to let me know what you think about it! Share it to your friends and learn new things together.
Transcript
33 Page 33-54 © MAT Journals 2019. All Rights Reserved
Journal of Water Resources and Pollution Studies
e- ISSN: 2581-5326
Volume 4 Issue 1
Assessment and Control Measures for Jayanti Stream to Control
Water Pollution of Panchganga River, Maharashtra, India
1Rohan Sandeep Ghatage,
2Ar. Vandana Pusalkar
1UG Student
Department of Civil Engineering
Sardar Patel College of Engineering affiliated to University of Mumbai, Maharashtra, India 2Assistant Professor
SPSMBH's College Of Architecture, Kolhapur, Maharashtra, India
Email: [email protected],
DOI:
Abstract In the upcoming years we might experience scarcity of water; hence it is the need of the hour to protect the water bodies from getting polluted. Polluted water will not only affect the human health but will also disturb the ecological balance of the river. More industrialization and increased population results in everlasting demands which finally gives rise to water pollution. In this research paper, Panchganga River of Kolhapur City in Maharashtra Stateis taken as the part of study work. Kolhapur City is blessed to have Panchganga River flowing within the city. But water quality of Panchganga River is becoming a more cause of concern than pride for the past 10-15 years. The water in the Panchganga River is polluted due to direct discharge of many streams, CETP Plants of MIDC industrial hub, chemical fertilizers used for agriculture and lack of awareness among the people. The polluted water of Panchganga has given rise to many some dangerous infectious diseases like Diarrhea, jaundice, gastro and fever etc. in Kolhapur city. As more than half the polluted water comes from the Jayanti stream to the Panchganga River so an innovative concept is suggested to deal with the problem of Jayanti stream which will not solve the problem of water pollution but will also rejuvenate the Jayanti Stream more effectively. A typical portion of the Jayanti Stream is been considered and a working model of that entire portion of the Jayanti Stream is been specifically elaborated with its 3D model including the water treatment facilities of the surrounding houses, waste material trapping devices, new approach towards ground water treatment, pipeline systems for the evacuation of the treated water from the houses to the Jayanti Stream. This whole development of the project will improve the water quality standards and will also continue the development of the ecological cycle for the rest of the remaining years.
Keywords: Industrialization, Rejuvenate, Ecological
INTRODUCTION Kolhapur is the adjacent urban body located along the bank of the river with a population of 549283 and this city is located at 16° 42' N and 74° 14' E, having mean sea level of 570 m. Area of Kolhapur city is around 6682 Ha. Panchganga flows from the borders of Kolhapur. It originates in Western Ghats and is a major tributary to Krishna. It starts from Prayag Sangam. The Kasari, the Kumbhi, the Tulsi and the Bhogawati are the major four streams due to which the Panchganga River is formed. One more river stream Saraswati is
believed to flow underground and together with the other four streams make river Panchganga. The confluence of the Prayag Sangam gives an imprint of the beginning of the Panchganga River which after receiving the waters from the four tributaries continues in a larger flow pattern of waters received from the rivers in the vicinity of the Panchganga River. The Northern region of Kolhapur district consists of an alluvial plain spreading over a wider part in the surrounding regions.
34 Page 33-54 © MAT Journals 2019. All Rights Reserved
Journal of Water Resources and Pollution Studies
e- ISSN: 2581-5326
Volume 4 Issue 1
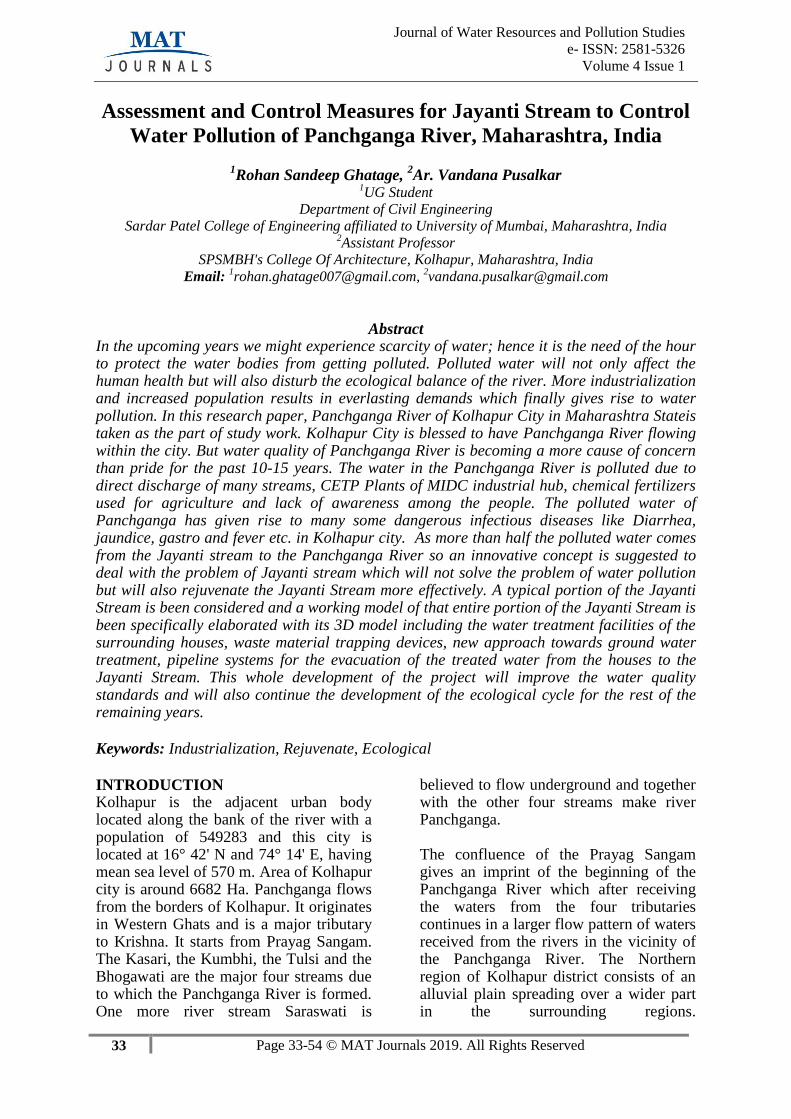
Figure 1: Rivers of Kolhapur City.
On development of the alluvial plain the
Panchganga River again continues its path
towards the eastwards. From Kolhapur the
Panchganga River, flows east about forty
five kms. and then it meets the Krishna at
Kurundvad. During its course to the east of
Kolhapur, the Panchaganga River receives
considerable streams of nallas within
Kolhapur and Ichalkaranji.
The nallas like Jayanti, Dudhali, Line
Bazar, Raman Mala, Rajhans in Kolhapur
and Kabnur, Chandur, Tilavani, Talange
and Kala odha in Ichalkaranji carries
significant volume of treated and untreated
domestic wastewater and waste from
Textile industries (CETP) and joins the
Panchganga River. The inadequate
domestic wastewater treatment facilities
have resulted in increase in pollution
resulting in serious the health impacts.
High incidents of Jaundice and other
diseases were recorded since 2011.
Though the attempts have been made to
minimize the pollution, significant
improvement is expected only when new
STPs and sewer lines for collection of
sewage are functional. However, there was
delay in construction and implementation
of new STP at KasbaBawada, Kolhapur
and river water quality was not meeting
the stipulated standards due to discharge of
untreated wastewater. In the year 2012,
more than 500 new cases of Jaundice were
reported from the textile town of
Ichalkaranji in Kolhapur district and many
deaths were recorded. The Health
Department of the Kolhapur City surveyed
that maximum number of people in
Ichalkaranji are been suffering from
Jaundice due to the consumption of
contaminated water of Panchganga River.
In May-June 2012, schools were declared
closed for some time.

35 Page 33-54 © MAT Journals 2019. All Rights Reserved
Journal of Water Resources and Pollution Studies
e- ISSN: 2581-5326
Volume 4 Issue 1
Figure 2: Kolhapur City.
SCOPE OF WORK • Collection of secondary data for
existing situation of water quality, wastewater systems as a whole.
• Reconnaissance survey of the river for the affected stretches as also upstream
• Assessment of water quality of the river as also all natural streams which are converted into nalla carrying wastewater.
• Suggest remedial measures to restore and maintain the river ecology for its designated use.
• Finalize the appropriate monitoring stations in the identified river stretch
and work plan for regular monitoring. • Evaluation of existing Sewage
Treatment Plants. • Methods for recycle and reuse of
treated effluents from wastewater treatment plants.
RECORDS OF NALLA FLOWS IN
KOLHAPUR
The information on nallas which directly
joins the river, their flow details is given in
Table 1. Following figures shows the
photographs of different nallas received
the waste water at Kolhapur City.

36 Page 33-54 © MAT Journals 2019. All Rights Reserved
Journal of Water Resources and Pollution Studies
e- ISSN: 2581-5326
Volume 4 Issue 1
Table 1: Nallas at Kolhapur with Flow Details Directly Discharging Sewage in the River
(MLD)
Sr. Name of the Nalla Flow (MLD) Length (km) Status of
1 Jayanti stream 0* 9 Sewered
2 Dudhali 5 2 30 % Sewered
3 Jamdar 0.4 4
4 Sidhharth Nagar 0.1 1
5 CPR 0.5 1.5 Sewered
6 Rajhans 1 1.2 Sewered
7 Ramanmala 1 1.8 Sewered
8 Dream world 0.4 1.4 Unsewered
9 Line Bazaar 3 1.3 Unsewered
10 KasbaBawda Treated Effluent 0.2 Unsewered
11 Vithbhatti Nalla 0.5
* Arrangements are made to stop the flow by constructing bunds and lifting nalla water to STP
[Source: Kolhapur Municipal Corporation]
Description of nallas: Jayanti Stream: A Kalamba Lake overflow is the original starting point of Jayanti nalla. At Hutatmapark, Gomati nalla mixes Jayanti nalla to form a big nalla basin. It receives sewage from nearby areas. It is the largest catchment and accounts for more than 60% of the total sewage generated in the city. A small tannery belt is also located in the basins which discharge the waste in nalla. At present a bund has been constructed on Jayanti nalla near Shahu Maratha pumping station. Hence the sewage flowing through Jayanti nalla is pumped to this pumping station and is eventually sent to STP at Kasba Bawda. An attempt has been made to treat the wastewater flowing through nalla using chlorine dosing. Though all the sewage flowing upstream to bund is being pumped from Jayanti nalla, two more nallas meet Jayanti nalla basin downstream the bund. These nallas include CPR nalla and Budhwar Peth nalla. CPR nalla receives sewage from
CPR hospital and other areas like Town Hall, Sonya Maruti Chouk, Shaniwar Peth, Burudgalli etc.
Dudhali Nalla: Dudahali nalla
comprises of many small drains and
gutters. This nalla receives sewage from
areas near Rankala tank, Lakshateerth,
parts of areas in Ravawar and Shankar.
From Shivaji Peth onwards this Nalla
becomes larger Dudhali nalla receives
the overflow of Rankala lake water
throughout the year which is approx. 5
MLD. The effectiveness of chlorination
has not been tested for reduction of
microbial population. The time taken by
these chlorinated nalla flows to reach
river stretch is inadequate to confirm the
contact time of 30 minutes for
evaluation of chlorination treatment.
Laboratory experiments should be
conducted to decide the chlorine dose
and reduction in coliforms.

37 Page 33-54 © MAT Journals 2019. All Rights Reserved
Journal of Water Resources and Pollution Studies
e- ISSN: 2581-5326
Volume 4 Issue 1
Chlorination at Jayanti Nalla after meeting CPR Nalla
Line Bazaar Nalla Rajaram Nalla
Bapat Camp Nalla Dudhali Nalla Chlorination at Raman Mala
Figure 3: Different Nallas at Kolhapur City.
At present a temporary bund is constructed
across Dudhali nalla just before the nalla
meets river. At the bund, some part of the
sewage is pumped to Dudhali nalla
pumping station and is pumped to Shahu
Maharaj pumping station and is finally
sent to STP at KasbaBawada. Bleaching
powder dose is applied to the wastewater
flowing through this nalla. A small portion
of sewage from nalla is used for irrigation
near the pumping station.
Line Bazar Nalla Basin: At present sewage
from KasbaBawda flows through this
nalla. The nalla joins the river upstream of
the intake well in the river Panchganga
38 Page 33-54 © MAT Journals 2019. All Rights Reserved
Journal of Water Resources and Pollution Studies
e- ISSN: 2581-5326
Volume 4 Issue 1
which supplies water to Bawda Water
treatment plant. A large portion of land
between KasbaBawda locality and the
river is used for agriculture. Significant
portion of sewage generated in this area is
used for irrigation.
3.1.4 Bapat Camp Nalla (Kawala Naka
Nalla): Sewage generated in the region
present in the catchment of Bapat camp
nalla flows through this nalla. The nalla is
quite narrow at a distance of about 250m
upstream of confluence with the river.
Another nalla called Kawla Naka Nalla
carrying major part of domestic sewage of
the city meets Bapat camp nalla. Main
Bapat camp nalla carries discharge for
sewage treatment plant at KasbaBawda. A
large portion of sewage flowing through
Bapat camp nalla is being used for
irrigation by installation of pumps in the
nalla.
Quantification and Flow Estimation of
Nallas
Surface water flow is the continuous
movement of water in runoff or open
channels. This surface water flow is thus
taken to be the discharge and is then
defined as the rate of flow of water or the
volume of water passing through a
specified channel cross section in a
stipulated period of time. Discharge can
expressed as the total volume in acre-feet
or millions of gallons or also as the rate of
flow in cubic feet per second (ft3/s) or
meter cube per second (m3/s)
Objectives of nalla flow estimation:
• To quantify the flow entering the river
through nallas
• To suggest appropriate treatment
technology and evaluate the adequacy
of the proposed Sewerage system.
Methodology: The Nalla flow estimation
was done using Ping Pong ball method as
prescribed by USEPA. Following steps
were carried out while flow measurement.
Flow measurement of nallas was carried
out at for three times in a day i.e.in the
morning between 8 to 10 am, in the
afternoon between 1 to 3pm and in the
evening between 5 to 7 pm to get the
approximate flow during the day.
As the cross section of streams is irregular
and flow also varies accordingly, a straight
stretch of the nalla was selected to carry
out the flow measurement studies. As per
the USEPA protocol, the selected stretch
should be having minimum length of 20
feet.
Depth and width were noted at three places
in the specified stretch to get the average
depth and width.
The time required for a Ping Pong ball to
travel the specified distance was noted
using stopwatch.
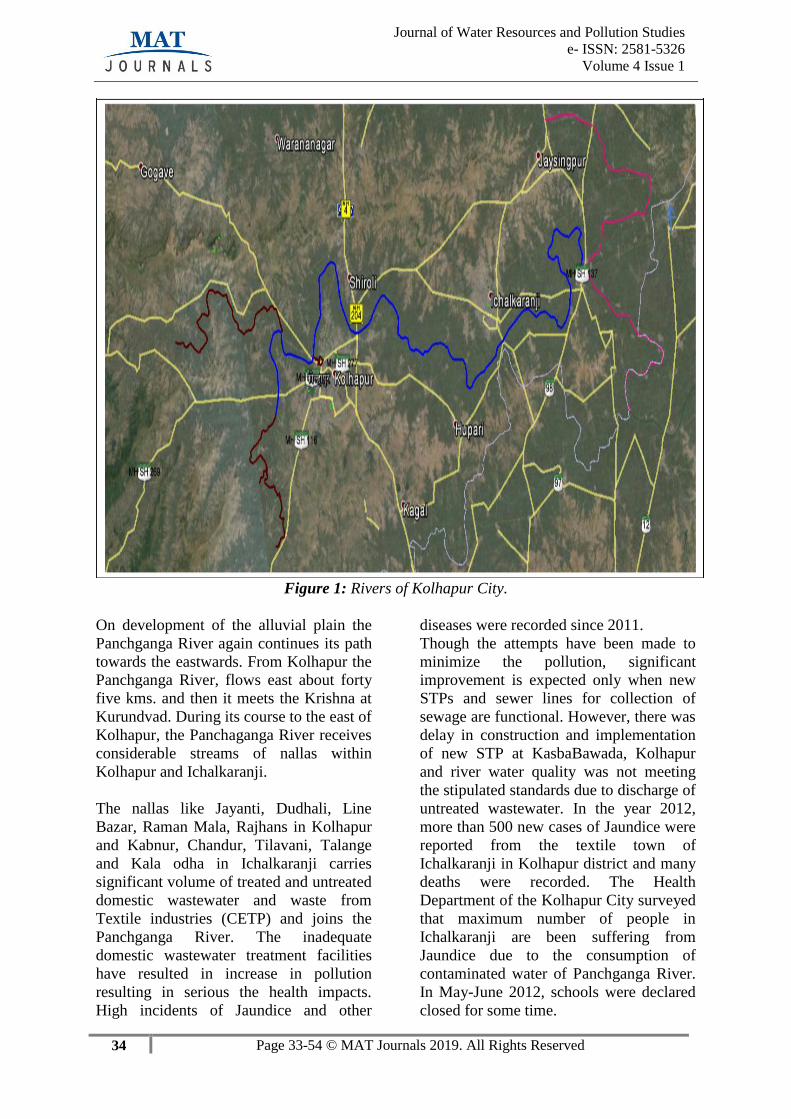
Flow measurement at Bapat Camp nalla Flow Measurement at Jayanti nalla

39 Page 33-54 © MAT Journals 2019. All Rights Reserved
Journal of Water Resources and Pollution Studies
e- ISSN: 2581-5326
Volume 4 Issue 1
Flow measurement at Rajaram Nalla
Figure 4: Flow measurements at different nallas.
The flow rate of the stream was
calculated using the following formula,
and estimated flows are presented in
Table 2.
Flow rate= ALC/T
A: Average cross sectional area of
stream
L: Length of the selected stretch
C: Correction factor (0.87 for rocky -
bottom streams and 0.93 for muddy
bottom streams)
Time taken to travel the particular
distance
This is used to state that surface water
travelsmore faster than near the stream
bottom due to external resistance of
gravels, cobble, etc.
Table 2: Estimated Flow at Different Nallas of Kolhapur City Kolhapur Flow Rate (million liters per hr.) Flow Flow
City Nallas 8am- 1pm-3pm 5pm-7pm Rate(MLD) Rate(MLD)
10am as reported
by KMC for
2003-04*
Dudhalinalla 3 2.8 5.1 72 15.7
Jayantinalla 0.8 1.5 1.4 24 70.1
Line bazaar 1 0.74 0.53 15 2.0
Rajaram 1.2 1.3 0.72 21 5.0
Bapat camp 5.5 7.8 5.9 128 3.8
Total 260 97
*Flows and Characteristics of sewage in Nalla Basins in Kolhapur Report
Significant variation in nalla flows is observed during the study. The increase in flow can be attributed to increased water supply and use of ground water by population and also industries. According to the Environmental status report of Kolhapur 2012-13, the total water supply for the city is around 137 MLD. The water sources for Kolhapur city are: Panchganga river (80 mld), Bhogwati (41 mld), Kalamba (8 mld), and Borewells (8 mld). The estimated sewage generation would be 110 MLD considering the generation of sewage to be 80% of total water supply.
The Excess wastewater generation can be attributed to excess water consumption other than water supplied by KMC.
PANCHAGANGA RIVER
POLLUTION AND PUBLIC HEALTH
ISSUES IN KOLHAPUR CITY
Panchaganga is the main river along the
Kolhapur City which is now facing water
pollution problems and considered to be
one of the most polluted rivers in
Maharashtra. An average of about 70- 80
million liters/day of waste water is being
produced in Kolhapur City on daily basis

40 Page 33-54 © MAT Journals 2019. All Rights Reserved
Journal of Water Resources and Pollution Studies
e- ISSN: 2581-5326
Volume 4 Issue 1
as it exceeds its daily capacity of 20 million liters/day. The present drainage system constructed by KMC is 35years old and any defects in the drainage system should be rectified and repairs should be done.Industrial waste water which is being left out without any treatment from CETP’s (Common Effluent Treatment Plants), Jayanti and Dudhali nallas, domestic waste water released directly from the houses along the river, waste from the houses on the encroached area of the nallas are the main sources of the Panchaganga River pollution. Due to huge amount of waste water in river which becomes unhygienic for the people living in the surrounding places, Kolhapur Municipal Corporation (KMC) got number of complaints and 130 written notices from the public. 170 metric ton/day solid waste was being produced on daily bases in Kolhapur City. These solid wastes directly go to the river because there is no solid waste management facility properly working at
present in the city. Besides Panchaganga river , there are about Twelve MIDCs with inefficient CETP’s, seven sugar factories whose waste directly discharges into the river and the waste from 174 gram panchayat villages together adds up to the Panchganga River. So, the improper management of waste from the Kolhapur City and lack of public awareness is the cause of Panchganga River Pollution.
Discharge of large amount of untreated
domestic sewage from the city
The discharge of large amount of sewage
from the houses are carried out by four
major sewers in the city which are Jayanti
nalla, Dudhalinalla, Line Bazaar nalla and
Bapat Camp nalla and then it is finally
discharged into the river due to which it gets
polluted. Since most of the sewage is
untreated, it increases the organic load of the
river water. The river water becomes highly
polluted due to toxicants, bacterial
contamination, plastic litters, solid waste,
etc.
Table 3: Panchganga Basin Pollution study MPCB report, 2009
Panchganga River
Total Population of
Kolhapur City ( 2001
Census )
Water Usage ( per day ) Waste water without
treatment ( per day )
4.93 Lakhs 120 Million Litres 100 Million Litres
(Panchganga Basin Pollution study MPCB report, 2009)
Disposal of Industrial effluents
Table 4: Industrial Effluents Panchganga River Total No. of Industries Total waste water without
Treatment
2953 18.59302 Million Liter per day
The small scale industrial units without
CETP’s, foundries, chemical industries in
Udyamnagar and Jawahar Nagar disturbs
the quality of river water. The ground
water quality also changes due to the
industrial effluent.
Sewage from different hospitals,
pathological laboratories
In Kolhapur City there are about total of
493 hospitals and 57 dispensaries
(governmental, semi-governmental and
private) and 38 pathological laboratories
for proper public health. Among which
Chhtrapati Pramilaraje Hospital (CPR) is
taking an initiative to develop Sewage
Treatment Plant (STP) rest all the hospitals
discharge their waste water into the river
mains without any treatment. The
untreated sewage about 1, 25,000 liters per
day gets mixed into the river through nalla.

41 Page 33-54 © MAT Journals 2019. All Rights Reserved
Journal of Water Resources and Pollution Studies
e- ISSN: 2581-5326
Volume 4 Issue 1
Effluent from other sources
There are about 43 servicing stations in the
entire Kolhapur city which generates on an
average of 49,000 liters of waste water on
daily basis. The quality of water gets
changed due to oil and grease content,
various petrochemicals, etc. released from
the automotive industries. The waste water
from the slaughter houses and fish
markets with high organic load directly
discharges into the nearby sewers and
then finally meets the river through
nallah. The other sources like hotels,
restaurants, hawkers, food corners,
roadside food stalls etc. also contribute
for water pollution of the river.
Other sources of River Pollution
Table 5: Sources of River Pollution and waste generated Sources Total No. Total amount of waste generated
Servicing Stations 41 2,00,000 liters/ day
Hotels, restaurants and hawkers 1044 1,49,400 liters/ day
Slaughter houses waste 02 800 Kg/ day
Meat shops and Fish 76 1000 Kg/ day
Agro – chemicals used in the fields
Large quantities of agrochemicals are used
in the agricultural sector in the upstream as
well as in surrounding areas of the river.
The residues of these chemicals mix in to
the river due to excess use, flooding, heavy
rainfall, excess irrigation, etc. Many
pesticides and chemicals when dissolved
in the river water enter in the food chain.
Studies have shown that many vegetables
and fruits contain harmful residue of
agrochemicals.
Table 6: Types of Agro Chemical used and Solid waste Sr. No Type of Agro - Chemical Solid State ( per year ) Liquid State ( per year)
1 Chemical fertilizers 78,244 Tones
2 Pesticides 1,41,764 Tones 22,068 Liters
3 Weedicides 34,995 Tones 21,664 Liters
4 Fungicides 6771 Tones 1828 Liters
Crematorium ash Crematorium sites in Kolhapur City are also one of the rising issue of water pollution as the crematorium ash is been directly thrown into the water bodies. There are almost four crematorium sites present in the city. Every year around 140 tons of crematorium ash is being let out from the crematoriums which pollutes the river water. The crematorium affecting the quality of river water are Vaishvadham Crematorium which is located near Prince Shivaji Bridge and Bapat Camp crematorium. By the Indian rituals the ash is disposed directly into the water after burning of dead bodies due to which a layer is formed on the water surface. This ash traps the sun’s rays and prevents circulation of oxygen into the water i.e. it prevents the water from aeration process. So, when there is no mixing of air into the water it thus changes the physiochemical properties of the
water bodies. The amount of total solids, total dissolved solids, toxic heavy metals, phosphate and nitrate level increases. At the same time, amount of dissolved oxygen decreases. The river ecosystem gets completely affected as well as the water becomes unsuitable for our day-to-day use and drinking purpose. The downstream areas and the river basin also gets affected as well as the aesthetic beauty of the site decreases and thus reduces the importance of the entire Panchganga River as a State’s Heritage Religious activities The people of Kolhapur City are very sentimental and attached to their religious beliefs. And very religious festivals in Kolhapur City are celebrated with joy and happiness but during the span of these festivals the environment is hampered a lot. These religious activities slightly increases

42 Page 33-54 © MAT Journals 2019. All Rights Reserved
Journal of Water Resources and Pollution Studies
e- ISSN: 2581-5326
Volume 4 Issue 1
the amount of solid waste than the normal seasons. These religious festivals produce solid waste in the form of Nirmalaya and idols. The idols are made up of Plaster of Paris, so when these idols are disposed into
the water it changes the properties of water. For disposing of the idols there are about 12 sites in the city of which many of them is highly polluted developing water hyacinth on the surface of water.
Table 7: Solid waste Sr. No Components Amount per year Amount per 90 tonnes
1 Nirmalaya 90 Tonnes
2 Idols (domestic) 27000
3 Idols (Sarvajanik) 600
The idols are made up of Plaster of Paris
or Shadoo and coloured with chemicals.
When these idols immersed in water the
chemicals dissolve in water body altering
water quality. Thepaints are having heavy
metals such as copper, zinc, lead,
chromium and iron. The other constituents
of the idols like bamboo, flowers, cotton,
clothes and other pollutants arising from
the food stalls such as eatables like Prasad,
coir, plastic, etc. increases the nutrients in
the lake which thus enhances the process
of growing bacteria. The water column is
disturbed completely during the idol
immersion due to which it leads to
eutrophication.
Discharge of nallah in the river basin:
There are four nallahs in the city viz.
Jayanti Nallah, Dudhali Nallah, Line
Bazaar nallah and Bapat Camp Nallah.
Jayanti nallah commences from the eastern
part of the city and covers a total area of
2357 hectares of the city. During its course
through the heart of the city, it receives
waste water from tanneries from Jawahar
Nagar, domestic waste from the city,
effluent from fabrication units; spray
painting units and foundries from
Udyamnagar.
Patients suffering from water – borne diseases
Table 8: Patients suffering from water – borne diseases Year Jaundice Diarrhea Dysentery Gastro Other
2005 - 06 146 221 48 223 15
2006 - 07 85 298 84 132 23
2007 - 08 103 320 94 51 10
2008 - 09 139 241 79 79 7
Total 473 1090 305 485 55
CURRENT SCENARIO OF WATER
TREATMENT PLANTS IN
KOLHAPUR
At present water is supplied to Kolhapur
city through water treatment plants: For
the treatment of waste water Kolhapur
Municipal Corporation (KMC) has
provided four water treatment plants to
provide potable and safe drinking water to
the citizens of Kolhapur City. The
treatment plants are - Kalamba water
treatment plant, Puikhadi water treatment
plant, Bawda water treatment plant and
Balinga water treatment plant.
Kalamba water treatment plant: It is the
oldest water treatment plant and started in
pre independence days. An earthen dam
about 4300 ft. long and 27 ft. high was
constructed during 1881- 83 on the
southern side of the city. The treatment
plant is of 8 MLD capacities. The water of
the Kalamba tank is pure and wholesome
and is filtered and chlorinated. The water
from Kalamba water treatment plant is
available only to a certain limited portion
of the city i.e. to B ward.

43 Page 33-54 © MAT Journals 2019. All Rights Reserved
Journal of Water Resources and Pollution Studies
e- ISSN: 2581-5326
Volume 4 Issue 1
Puikhadi water treatment plant: - This
treatment plant is located at Puikhadi,
which is about 14 km. from the
Shingnapur pumping station. This is the
newly plant which is a recent development
by the KMC to cover the section of area
which started functioning in the year 2001.
The capacity of this plant is 50 MLD.
Bawada water treatment plant: - This
water works is commissioned in the year
1978. It is located 5 km away from
Bawada pumping station. Initially the
treated water from this plant was served to
E ward and to 6 villages of eastern
outskirts of city. The capacity of this plant
is 38 MLD and presently this treatment
plant only supplies water to E ward of the
Kolhapur City.
Balinga water treatment plant: The water
works of Balinga was commissioned in the
year 1949 with the total capacity of 10.90
MLD and was later increased by providing
augmentation schemes due to
consideration of future rise in population.
Now the current total capacity of this plant
is designed to be 42MLD and basically the
source of the water is from the Bhogawati
River.
Table 9: All the parameters except pH, MPN and turbidity are expressed in mg/l
Kalamba WTP
Balinga
WTP
Parameter Puikhadi WTP Bawda WTP WHO
standards
Inlet Outlet Inlet Outlet Inlet Outlet Inlet Outlet
pH 7.78 7.74 7.31 7.36 7.2 7.08 7.02 7.10 6.5-8.5
Turbidity 20.3 4.4 21.6 4.6 26.6 4.3 24.31 4.9 5-25
(NTU)
Hardness 154 124 76 60 68 52 84 60 100-500
Chloride 25.7 17.04 25.56 20.1 51.12 30.1 48.2 19.22 20-500
TDS 200 110 245 135 505 100 400 100 500-1000
MPN 1600> nil 1600> nil 1600> nil 1600> nil 0/100 ml
(Dept. of Environmental Science, SUK)
The results of the treated drinking water in
the WTP are within the standard limits but
further analysis of piped water shows
presence of coli form bacteria due to
leakages in the system.
RECOMMENDATIONS
Rejuvenating a stream
This solution is not just regarding treating
of the waste water but it is moreover a
concept of rejuvenating a stream i.e.
making the ecosystem alive. The process
of making the ecosystem alive is not a
time bound concept, but it’s a process
which goes on years to years to form that
certain ecological cycle. The main
ideology of this proposed concept is not
only to make the stream pollution free but
also to make the surrounding environment
clean and hygienic and to re-invent the
stream with all the aquatic life.
The main problems with the Jayanti
streams are the huge amount of plastic
waste and other waste materials flowing
with water or stagnated at one side.
Another problem is land encroachment
which is been taking place due to
increased population due to which the
width of the stream is even getting reduced
day-by-day. Due to direct discharge of the
sewage water into the stream the Jayanti
stream is getting polluted and due to which
the entire ecosystem is getting hampered.
So, in this concept certain arrangements
are done to primarily treat the waste water
which is being released from the
residential spaces and also to collect the
plastic waste and other waste materials
flowing with the water so as to make the
flow of water circulated within the entire
city without of the clogging of waste.

44 Page 33-54 © MAT Journals 2019. All Rights Reserved
Journal of Water Resources and Pollution Studies
e- ISSN: 2581-5326
Volume 4 Issue 1
Soil washing – The flow of waste water
through the stream have made the bed
level contaminated due to which the 0.20
meters of top layer of soil have become
infertile. Now, this infertile layer of soil
obstructs the growth of aquatic plants. So,
a top layer of about 0.20 to 0.30m is taken
off and soil washing is done. The process
of soil washing is an ex-situ remediation
technique which removes hazardous
contaminants and other foreign
materialsfrom the soil by washing the soil
with a liquid (most probably with a
chemical additive), then scrubbing the
washed soil, and lastly separating the clean
soils from the contaminated soil and wash
water. Soil washing is based on the theory
that contaminants from the soil are prone
to bind to fine grained soils (silts and
clays), which thus results in binding with
the coarse grained soils. So the end result
of this technique should be separation of
the contaminated fines and wash water
from the cleaned coarse grained soils
(sands and gravels). After the process of
soil washing it is then reused to form the
bed level of the Jayanti stream. Now, soil
washing will be done in six different steps
–
Pretreatment
Separation
Coarse – grained treatment
Fine – grained treatment
Process water treatment
Residuals management
Figure 5: Schematic view of soil washing process.
Construction of certain stream
amenities
After the soil washing process is completed,
the washed soil is then laid on the bed level of
the stream. A total of 6 loops are been
constructed along the sides of the stream i.e. 3
on one side and remaining 3 on the other side
so as to collect the flowing plastic waste and
other waste material.
Loops: These loops are constructed
entirely with a combination of partly soil
and stone walls to a depth of 6m and a
diameter of 4.5m. The consecutive
distance between the two loops is 12m.
Certain arrangement is done by creating an
offset just at the entrance of the loop so
that the incoming waste materials in the
loops are intact and only the water is
evacuated from the gap provided at the
entrance. Due to which the loops gets
stacked only with the waste materials.
Now as these waste materials collected
in the loops contain plastic waste, other
waste from household and commercial

45 Page 33-54 © MAT Journals 2019. All Rights Reserved
Journal of Water Resources and Pollution Studies
e- ISSN: 2581-5326
Volume 4 Issue 1
spaces it thus forms a minimal quantity
of leachate when it comes in contact
with the water. And this leachate
contaminates the surrounding soil, so as
a result of this geosynthetic clay liner
(GCL) is been used under the loops to
break the contact of the leachate and the
surrounding soil. And also steel cage of
certain diameter is been provided over
the GCL so that the plastic waste
especially are intact into the block-like
structure of steel cage.
Figure 6: Loops filled with plastic waste and other waste materials
(a)
(b)
Figure 7: Loops with Geosynthetic clay liner (GCL) and Steel cage.
46 Page 33-54 © MAT Journals 2019. All Rights Reserved
Journal of Water Resources and Pollution Studies
e- ISSN: 2581-5326
Volume 4 Issue 1
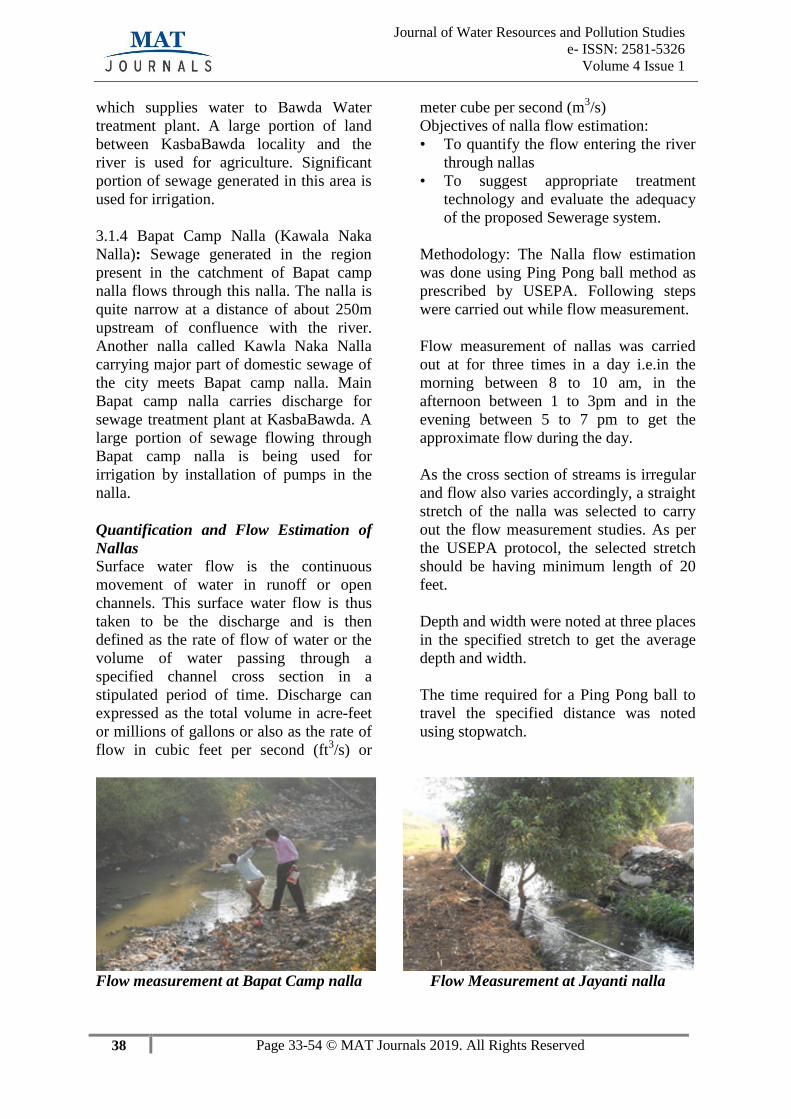
Curtain walls: Are basically constructed with a combination of partly soil and stone with proper grade and profile. These walls are provided so as to prevent side slopes from erosion problem. The entire section with the curtain walls is made straight rather than zigzag so as to have a uniform flow throughout the section and to provide the construction amenities. The height of these
walls from the bed level of stream is 5m. Excluders: Excluders are provided to
divert the plastic and other waste materials
into the loops. These excluders are
constructed with concrete in a curved
shape which is connected to the outer edge
of the loops. The heights of the excluders
are 2m from the bed level of the stream.
Figure 8: Excluders connected to the outer edge of the loop.
Check dams: Check dams are provided
with 30m intervals so as to ensure
sufficient space for the aquatic life in the
stream. These check dams are made
hollow in which a bio filter sheet is placed
just at a sufficient height from the base.
The straight and inclined portion of the
check dams are made with the normal
concrete and the upper portion which
comes in contact with crest are done in
pervious concrete. The jet of water flowing
over the dams passes directly through the
pervious concrete and then filtrates by the
filtration media and finally gets settled at
the bottom of the dam. Then, this settled
water is then converted into air by a
complex mechanism in the check dam and
a pipe known as sparge well is then
provided to circulate the air and thus inject
it into the water table. Now this sparge
well injects the air into the water table due
to which it converts the pollutants
associated with petroleum hydrocarbons,
crude oil, and many other contaminants
from dissolved to vaporized state. And
later this vapour is extracted; it is treated
and then released off into the atmosphere
as a fresh air. Now, this entire process of
purifying the water table and thus
releasing a fresh air into the atmosphere is
known as air sparging technique. For a
better plumbing connection and to get the
required range of water these check dams
are provided in a single alignment with the
air sparging stations. Periodic maintenance
is to be done for removal of the Bio filter
sheet which may result in a tedious process
but has to be done frequently so as to
inject contaminant free air into the water
table.

47 Page 33-54 © MAT Journals 2019. All Rights Reserved
Journal of Water Resources and Pollution Studies
e- ISSN: 2581-5326
Volume 4 Issue 1
Figure 9: Hollow check dams with Bio filter sheet and plumbing connections.
Figure 10: The connection of air sparging stations and the check dam.
Fish ladder: Will be provided through
the check dams for the movement of
aquatic animals. These fish ladders are
provided with baffle walls. These baffle
walls spaced at 1.5m and provided in
such a manner so as to prevent it from
clogging of any type of waste.
48 Page 33-54 © MAT Journals 2019. All Rights Reserved
Journal of Water Resources and Pollution Studies
e- ISSN: 2581-5326
Volume 4 Issue 1
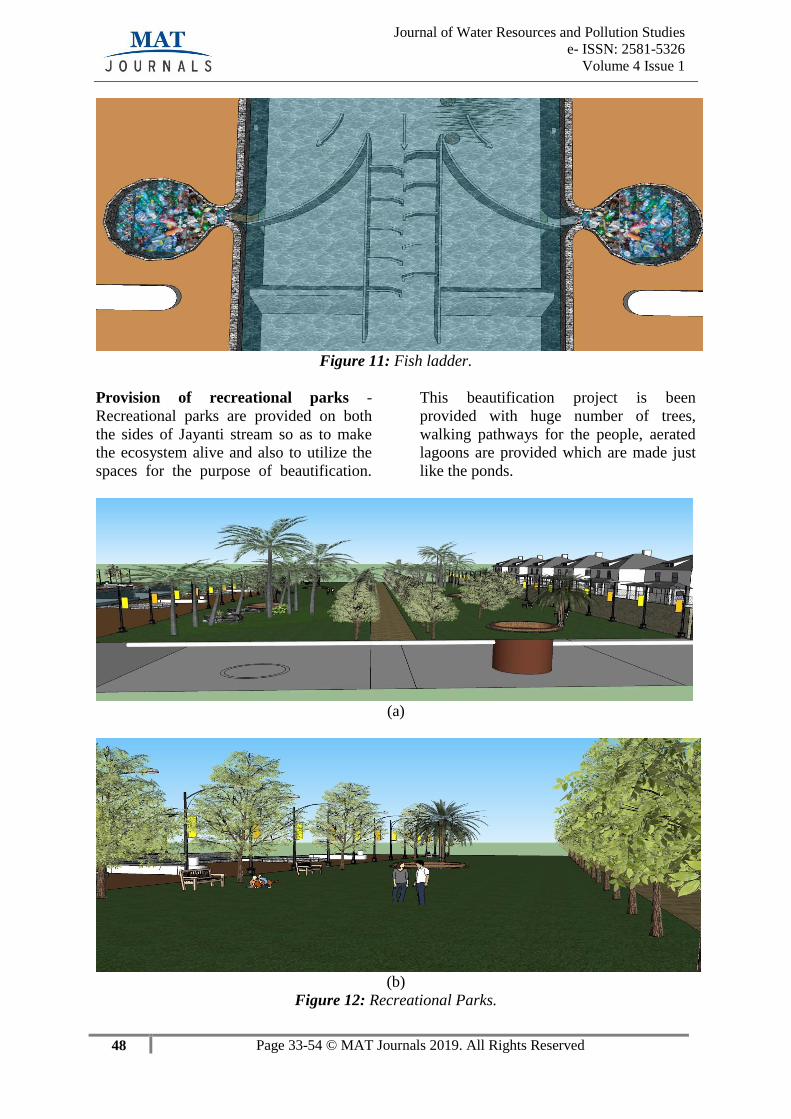
Figure 11: Fish ladder.
Provision of recreational parks -
Recreational parks are provided on both
the sides of Jayanti stream so as to make
the ecosystem alive and also to utilize the
spaces for the purpose of beautification.
This beautification project is been
provided with huge number of trees,
walking pathways for the people, aerated
lagoons are provided which are made just
like the ponds.
(a)
(b)
Figure 12: Recreational Parks.

49 Page 33-54 © MAT Journals 2019. All Rights Reserved
Journal of Water Resources and Pollution Studies
e- ISSN: 2581-5326
Volume 4 Issue 1
Aerated Lagoons - Are constructed in a
circular shape as a simple wastewater
Treatment system consisting of a pond
with artificial aeration to promote the
biological oxidation of wastewaters
coming from the nearby houses. The depth
of the lagoons is kept at 4m and a diameter
of 4m is provided. The inlet zone of the
aerated lagoons consists of a depressed
floor level and it is reinforced, so that
settled sludge and grit can easily be
pumped off without risk of damage at
normal water level. Now to prevent
damages caused by plants or erosion the
sides are properly paved with bricks. The
lagoons in which the processed water is to
be collected which are the final
clarification chambers or the polishing
lagoons may vary in shapes and sizes. The
depth of the polishing lagoon is kept at
2.50m.Aerators are placed in the centre for
thorough mixing and oxygen supply in the
entire water body at minimal power input.
These aerators are preferably mounted on
float assemblies. And they are very sturdy
and maintenance free. These lagoons are
very well integrated into the surrounding
landscapes. They have the following
advantages –
- High circulation and mixing capacity.
- Maintenance free
- No risk of clogging of any particulate
or even at any intermittent operation.
- No chances of power failure.
- No spray water - no aerosols and
odours
- Low noise
- Trouble – free operation during frost
The plumbing arrangement is made in
such a way that two chambers are
provided under the ground for each
house at a depth of 1.53m. (0.30m
above the ground and 1.23m below the
ground). In one chamber partition is
made due to which the black water is
collected in one side and the grey water
is collected at another side. The grey
water is sent forward through pipe into
the treatment chamber in which it is
treated for household use and then it is
circulated upwards for gardening and
other purposes, and the black water
excluding the human solid waste which
is normally the waste water it is then
sent directly to the lagoons i.e. waste
stabilization ponds for primary
treatment. After the treatment the water
from the lagoons is sent to the stream
and discharged under normal flow
conditions. And the Human Solid waste
is then collected in another chamber
adjacent to the grey water chamber in
which methane is extracted from the
waste to generate electricity through
Human Solid Waste.
Figure 13: Lagoons.

50 Page 33-54 © MAT Journals 2019. All Rights Reserved
Journal of Water Resources and Pollution Studies
e- ISSN: 2581-5326
Volume 4 Issue 1
Air sparging stations: The check dam
and the air sparging stations are connected
in the same alignment, as the pipe in the
check dam converts the filtered water
collected at the bottom into air and then it
is circulated through the pipe and injected
into the contaminated zone of the water
table. The pipe injecting the air is called
the air sparging well which is mainly taken
below the hollow check dam. The process
of air sparging mainly includes a sparge
well pipe for injecting the compressed air
into the targeted contaminated zone of the
water table, with an expectation of
conversion of the volatile and semi-
volatile contaminants (volatilization) from
the groundwater to the air bubbles.
Because of the effect of buoyancy, the air
bubbles from the water table generally
starts to move in upward direction
towards the vadose zone, where a soil-
venting system known as the soil vapour
extraction pipe is usually equipped to
capture the contaminated air stream. This
pipe uses multiple air injection points and
multiplesoil vapor extraction points that
are being installed in contaminated zones
of soils to extract the vapor phase
contaminants above the water table. The
Contaminations in the water table must be
at least 3 - 4 feet deep beneath the ground
surface in order to make the system more
efficient. A blower is attached to wells,
usually taken through the manifold of the
system from below the water table for
creating that amount of pressure. The
pressurized air from the blower then
results in formation of small air bubbles
that travel through the contaminated zone
in and above water column. The bubbles
of air volatilize the contaminants which
are in the water table and then carry them
in the upward direction to the unsaturated
soils. Vacuum points are installed above
the saturated zones. The vacuum points
extract the vapors through to a Soil Vapor
Extraction system. In order for the vacuum
to avoid pulling the air from the surface,
the ground has to be covered with a tarp or
other method of sealing out surface air.
Surface air intrusion into the system may
reduce the efficiency to some extent. A
tarp is used to stop vapors from
breakthrough to the surface above.
The air sparging system thus treats the off-
gases (referred as contaminated vapors and
extracted air). The vapor is treated with
granulated activated carbon prior to release
to the atmosphere. For example, arsenic-
contaminated groundwater were treated by
air sparging and what the treatment does is
remove arsenic at certain percentage using
solution of iron and arsenic only at a molar
ratio of 2. Treatment using air sparging is
beneficial for groundwater contamination
which contains high amounts of dissolved
iron.
Figure 14: Schematic view of air sparging systems.

51 Page 33-54 © MAT Journals 2019. All Rights Reserved
Journal of Water Resources and Pollution Studies
e- ISSN: 2581-5326
Volume 4 Issue 1
Figure 15: The internal structure of the Air Sparging Stations at the Jayanti Stream.
Figure 16: Air sparging stations installed at both sides of the Jayanti stream with a pipe
vertically taken out to release the treated pure air.
Figure 17: Developed plan of the Jayanti stream.
52 Page 33-54 © MAT Journals 2019. All Rights Reserved
Journal of Water Resources and Pollution Studies
e- ISSN: 2581-5326
Volume 4 Issue 1
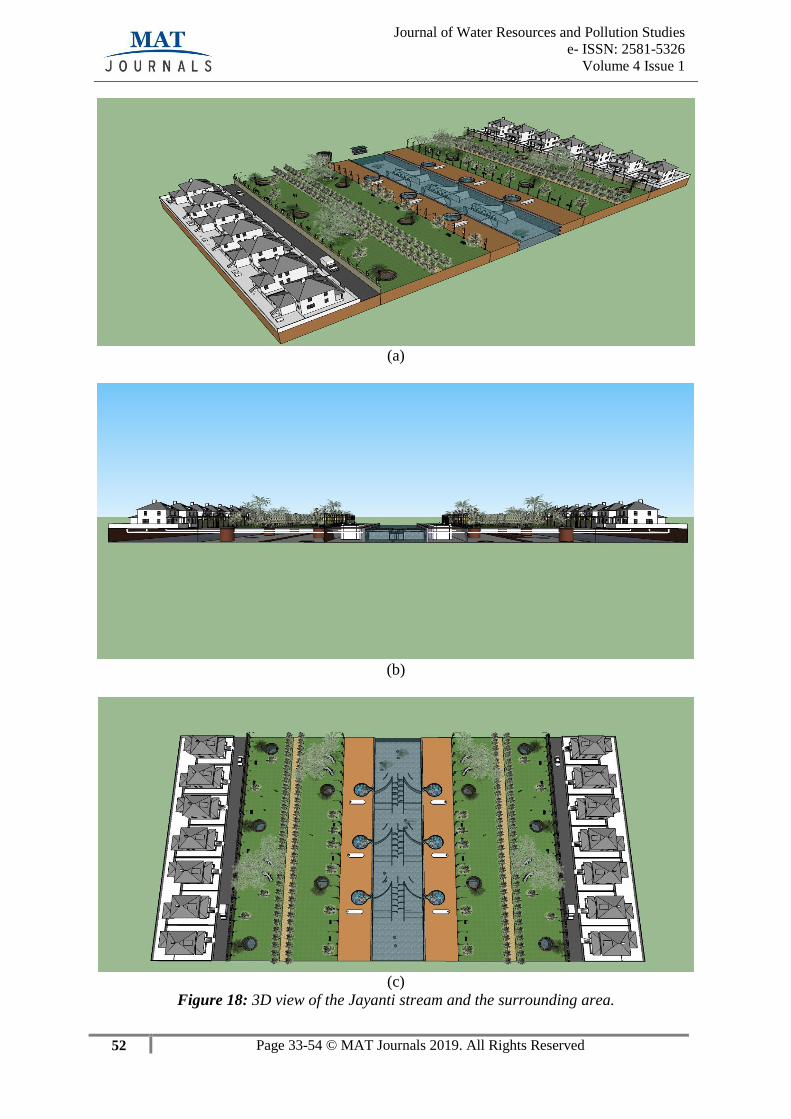
(a)
(b)
(c)
Figure 18: 3D view of the Jayanti stream and the surrounding area.

53 Page 33-54 © MAT Journals 2019. All Rights Reserved
Journal of Water Resources and Pollution Studies
e- ISSN: 2581-5326
Volume 4 Issue 1
ACKNOWLEDGEMENT
I would like to thank Dr. Vandana
Pusalkar for all her assistance in my
research work. And also the organizations
of Kolhapur City like Association of
Architects and Engineers (AE), Kolhapur
for giving me such an opportunity to
present my idea on such a local level for
the betterment of the Kolhapur City. The
Architects and Engineers from the
Association and all also experts from
certain colleges in Kolhapur City have also
helped me in understanding the nature of
the Panchganga River and its problems.
FUNDING ORGANIZATIONS
This entire concept is been suggested to
the Kolhapur Municipal Corporation
(KMC) as a remedy for the current
problems of Jayanti Stream. So, funding
will be provided in the upcoming years for
this work by Kolhapur Municipal
Corporation (KMC) for the
implementation of the work at the ground
level.
CONCLUSION
In today’s scenario, there are lot many
river rejuvenation projects are been taking
place in every corner of the world. But in
the process of making a certain river
rejuvenate, we are only focusing to the
treating of that wastewater which is being
directly discharged into those rivers and
the main purpose of river rejuvenation is
left aside. The main purpose of river
rejuvenation is to make the ecosystem
alive. So, we have to come up with certain
innovative concepts which will not only
increase the importance of the river
creating it as a state’s heritage but will also
restore the ecological cycle. This concept
is basically suggested for Jayanti Stream
of Panchganga River because more than
50% of the polluted water in the
Panchganga River comes from the Jayanti
stream. In this research paper, all the
environmental parameters are studied and
according to it the sampling of the waste
water is done so as to implement a certain
productive concept.
REFERENCES
For Catchment area of Panchganga river
1. A copy of district map
2. Pollution abatment of Panchganga
River
For Kolhapur
1. Environmental Status Report of
Kolhapur 2012-13
2. Environmental status report 2008-09
3. Measures to reduce pollution of river
Panchganga June 2012
4. Panchganga river pollution report 2009
5. Temporary arrangements made to
manage wastewater flowing through
nallas 2012-2013
6. Nalla map
7. NagrikanchaParyavarniyaJahirnama
8. MPCB river monitoring stations and
Water quality data of River water,
CETP, STP
9. Patil S. et al Study of Physicochemical
and biological characteristics of lakes
from Shivaji
a. University Campus, Maharashtra,
Advances in Applied Science
Research, 2011, 2 (6):505-519
10. Report on Flows and Characteristics of
sewage in Nalla basins in Kolhapur
2003-04 prepared By K.I.T’ college of
Engineering, Kolhapur
11. Kolhapur Municipal Corporation
“Jayanti Nalla Shuddhi karan Yojana”.
Recommended Readings
1. Griffiths, Richard A. (1995). “Soil –
washing technology and practice.”
Journal of
2. Hazardous Materials. 40. 175 – 189
3. USEPA. (1993, November).
“Innovative Site Remediation
Technology: Soil washing/ Soil
Flushing.” EPA 542-B-012.
Other references
1. Middlebrooks, E.J. (1982). Waste
Water Stabilization Lagoon Design,

54 Page 33-54 © MAT Journals 2019. All Rights Reserved
Journal of Water Resources and Pollution Studies
e- ISSN: 2581-5326
Volume 4 Issue 1
Performance and Upgrading. Mcmillan
Publishing. ISBN 0-02-949500-8
2. Ashworth, J; Skinner, M (19 December
2011). “Waste Stabilization Pond
Design Manual “(PDF). Power and
Water Corporation. Retrieved 11
February 2017.
3. Hosetti B.B.; Kulkarni A.R.; Patil H.S.
(1994), Water quality in Jayanti Nalla
and Panchganga at Kolhapur. Indian
Environ. Hlth. 36(2): 124-127.
4. Johnson, R.L.; et al. (Nov 1993). "An
Overview of In Situ Air Sparging".
Groundwater Monitoring &
Remediation. John Wiley & Sons, Inc.
13 (4): 127–135.DOI:10.1111/j.1745 –
6592.1993. Tb00456.x
5. Bass, David H; et al. (2000).
"Performance of air sparging systems:
a review of case- studies". Journal of
Hazardous Materials. Elsevier. 72 (2–
3): 101–119 doi:10.1016/S0304-
3894(99)00136-3.
6. Marley, Michael C.; Hazebrouck,
David J.; Walsh, Matthew T. (1992-05-
01). "The Application of In Situ Air
Sparging as an Innovative Soils and
Ground Water Remediation
Technology". Ground Water
Monitoring & Remediation. 12 (2):
137– 145. DOI: 10.1111/j.1745-
6592.1992.tb00044.x. ISSN 1745-6592
7. Environment in Indian Society-
Problems and Prospects: R.B. Patil, A.
Mittal Publication, New Delhi (India),
2009, pp. (45-52).
8. State of Environment Report:
Maharashtra, Indira Gandhi Institute of
Development Research Mumbai-
400065 (India), Sponsored by
Maharashtra Pollution Control Board
Ministry of Environment and Forests,
Govt. of India Prepared by Indira
Gandhi Institute of Development
Research, Mumbai.
9. Water Pollution: Impact of Pollutants
and New Promising Techniques in
Purification Process, Ramandeep
Singh Gambhir1*, Vinod Kapoor2,
Ashutosh Nirola3, Raman Sohi4 and
Vikram Bansal4, J Hum Ecol, 37(2):
103-109 (2012).
10. www.cpcb.nic.in Annual Report of
Central Pollution Control Board 2008-
09
11. www.mpcb.gov.in Annual Report of
ministry of environment and forest
2009-10
12. www.mohfw.nic.in Annual Report of
ministry of health and family welfare
2009-10
13. www.kolhapurcorporation.gov.in
Related Documents


![US Marine Engine Air Pollution Control Measures [Lowell]](https://static.cupdf.com/doc/110x72/62065ae18c2f7b173006f875/us-marine-engine-air-pollution-control-measures-lowell.jpg)