Assessing USAF Primary Care Colonoscopy Training and Outcomes Using Quality Indicators Brian Crownover, M.D., FAAFP Ethan Zimmerman, M.D. Family Medicine Residency Nellis AFB, NV

Welcome message from author
This document is posted to help you gain knowledge. Please leave a comment to let me know what you think about it! Share it to your friends and learn new things together.
Transcript
Assessing USAF Primary Care Colonoscopy Training and
Outcomes Using Quality Indicators
Brian Crownover, M.D., FAAFP Ethan Zimmerman, M.D.
Family Medicine Residency Nellis AFB, NV
Goals of QI review
Describe training experience of Family Medicine colonoscopy trainers in USAF
Use outcomes based indicators to represent quality of USAF primary care colonoscopy
Measure results against national standard quality indicators

USAF Primary Care Endoscopists
Who? ● Teaching faculty at 4 US Air Force Family
Medicine residency locations who perform colonoscopy
● NW Florida, N Calif, Las Vegas, St Louis
What? ● Type and amount of training received● Self-collected procedure log data – post training

Primary Quality Indicators
Adenoma Detection Rate
Cecal Intubation Rate● Recommended ≥ 95% for screening
colonoscopy

Primary Care Endoscopy
Why evaluate quality indicators?
● Primary care under attack from Gastroenterology
● Polypectomy reduces CRC mortality 53%● NEJM 2012; 366(8):687
● Only 65% Americans receive appropriate CRC screening
● https://healthmeasures.aspe.hhs.gov/measure/25
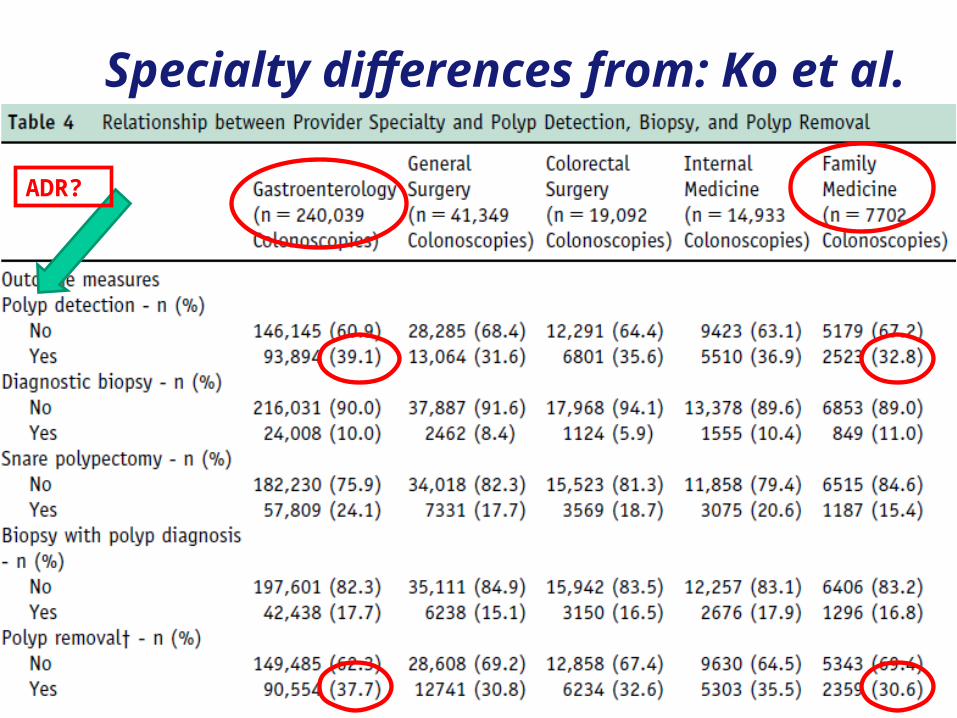
Specialty differences from: Ko et al.
ADR?
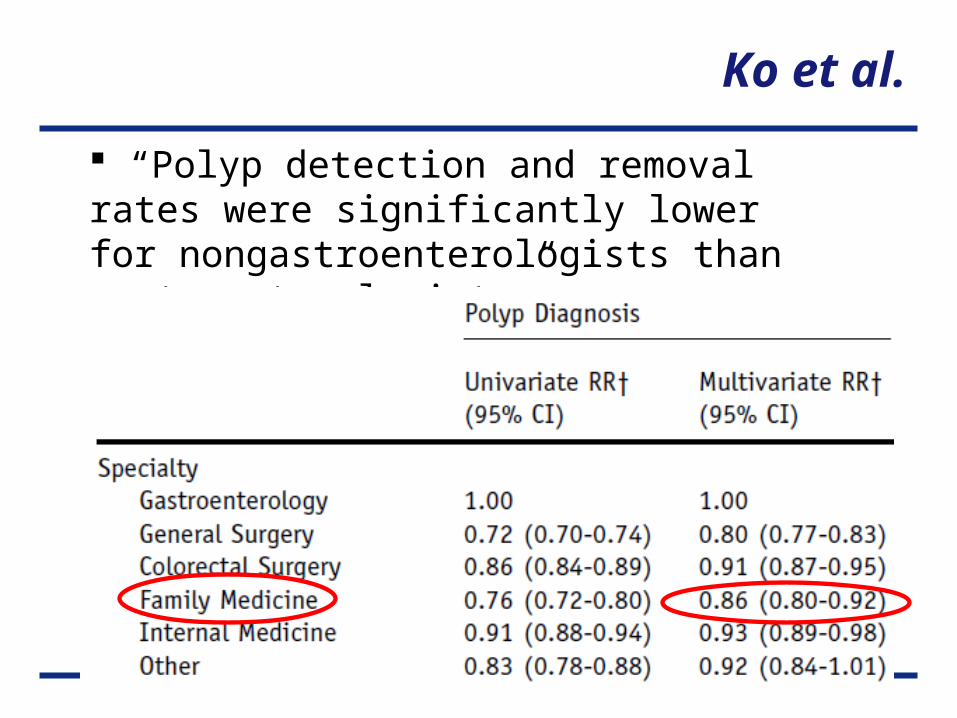
Ko et al.
“Polyp detection and removal rates were significantly lower for nongastroenterologists than gastroenterologists”

ACG/AGA/ASGE – ADR Working Gp
Screening Colonoscopy Adenoma Detection Rate Measure- Draft: Public Comment (6/2012)
Numerator: Number of patients age 50‐75 with at least one adenoma detected during screening
Denominator: Patients age 50‐75 undergoing a screening colonoscopy
Exclusions: Incomplete colonoscopy Measure: The percentage of patients age 50‐75
with at least one adenoma detected Adobe Acrobat
Document

Published GI Norms (PDR Surrogate for ADR)
Screening Williams JE 2011
Number patients 2,706
Location USA - VA
Number endoscopists 15 @ 1 site
Specialty Gastroenterology
Years Experience (mean) 18
Cecal intubation rate 97
PDR / ADR – all (%) Not reported
PDR / ADR mean – male (%) 43.5 (18-66) / 29.5 (15-45)
PDR / ADR mean – female (%) 25.8 (11-43) / 12.7 (6-26)
Cancer detection rate (%) 0.36
PRs correlated well with ADRs (r(s) = 0.86, P < .001).
To attain the established benchmark ADRs for men (25%) and women (15%), endoscopists needed PDRs of 40% and 30%, respectively.

Published GI Norms
Screening Cooper 2005
Number patients 1.8 Million – all ≥ 65yo
Location US Medicare Claims data
Number endoscopists Not reported
Specialty Not reported
Years Experience mean Not reported
Cecal intubation rate Not reported
PDR / ADR mean– all (%) 35.7 / ----
PDR / ADR mean – male (%) 41.2 / ----
PDR / ADR mean – female (%) 31.5 / ----
Cancer detection rate (%) Not reported
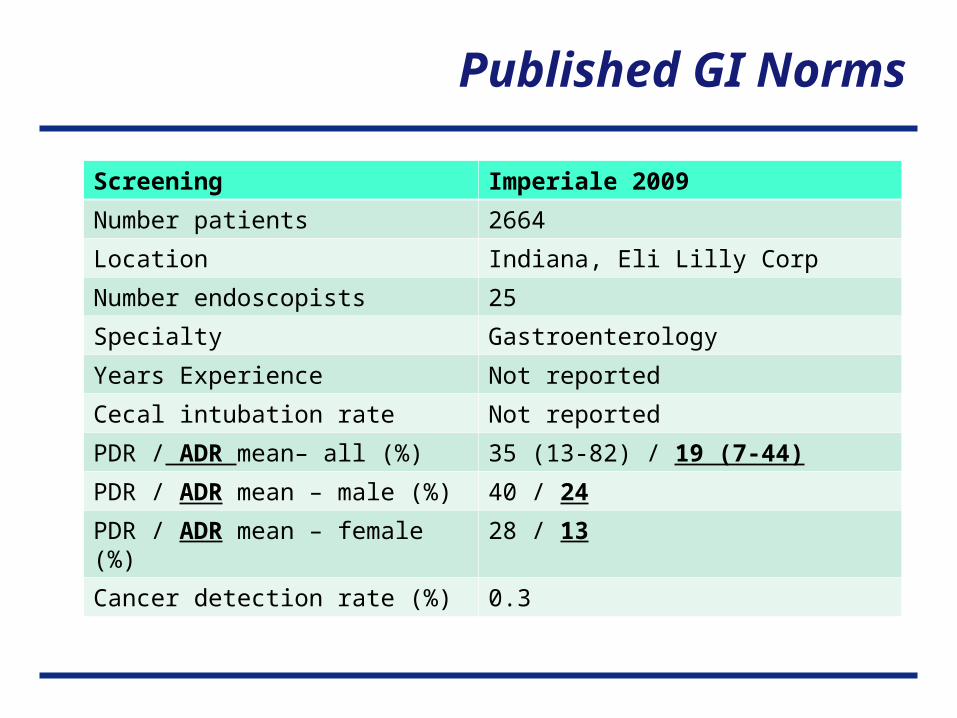
Published GI Norms
Screening Imperiale 2009
Number patients 2664
Location Indiana, Eli Lilly Corp
Number endoscopists 25
Specialty Gastroenterology
Years Experience Not reported
Cecal intubation rate Not reported
PDR / ADR mean– all (%) 35 (13-82) / 19 (7-44)
PDR / ADR mean – male (%) 40 / 24
PDR / ADR mean – female (%) 28 / 13
Cancer detection rate (%) 0.3
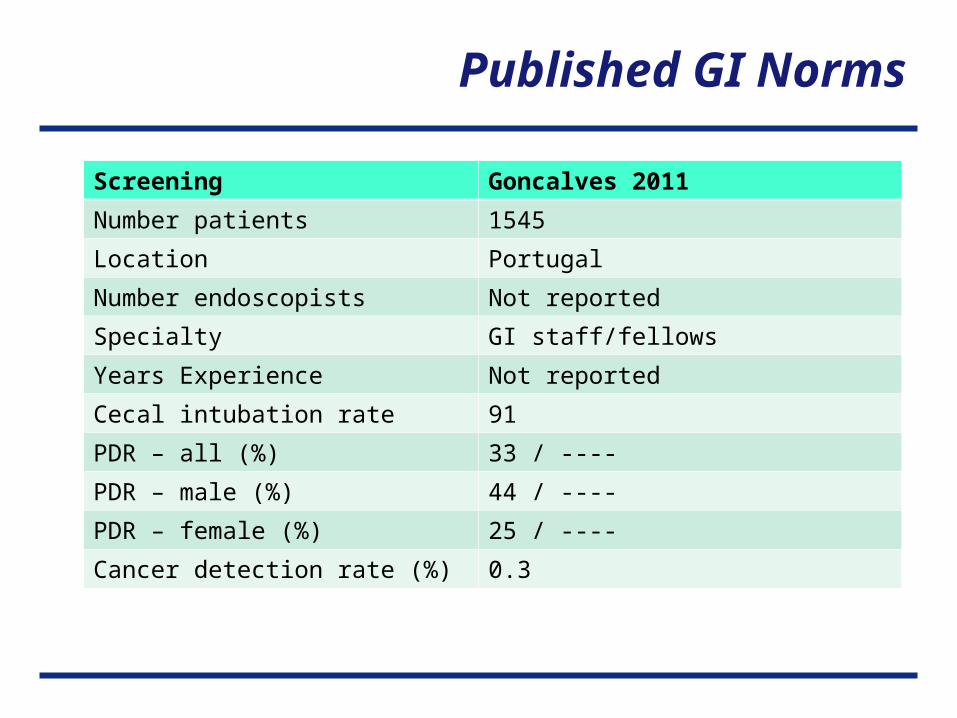
Published GI Norms
Screening Goncalves 2011
Number patients 1545
Location Portugal
Number endoscopists Not reported
Specialty GI staff/fellows
Years Experience Not reported
Cecal intubation rate 91
PDR – all (%) 33 / ----
PDR – male (%) 44 / ----
PDR – female (%) 25 / ----
Cancer detection rate (%) 0.3

Published GI Norms
Screening Chen, Rex 2007
Number patients 10,034
Location Indiana
Number endoscopists 9
Specialty Gastroenterology staff
Years Experience mean 9
Cecal intubation rate ≥ 93
PDR / ADR mean– all (%) ---- / (15.5-41.1)
PDR / ADR mean – male (%) ---- / 28.1
PDR / ADR mean – female (%) ----/ 19.2
Cancer detection rate (%) Not reported

Published GI Norms
Screening Lieberman 2000
Number patients 3121 VA pts (98% men)
Location 13 VA centers
Number endoscopists Not reported
Specialty Gastroenterology
Years Experience mean “Extensive”
Cecal intubation rate 97.7
PDR / ADR mean– all (%) ---- / ----
PDR / ADR mean – male (%) 53.8 / 37.5
PDR / ADR mean – female (%) ---- / ----
Cancer detection rate (%) 1.0

Published GI Norms
Screening Heitman 2009 Meta-Analysis
Number patients 18 pooled studies Avg Risk Pts
Location Various
Number endoscopists Not reported
Specialty Gastroenterology
Years Experience mean Not reported
Cecal intubation rate Not reported
PDR / ADR mean– all (%) ---- / 30.2 (random effects model)
PDR / ADR mean – male (%) ---- / ----
PDR / ADR mean – female (%) ---- / ----
Cancer detection rate (%) 0.3

Published GI Norms
Screening Cotton 2003
Number patients 17,868
Location 7 Academic Centers N. America
Number endoscopists 69 using GI-TRAC software
Specialty Gastroenterology
Years Experience mean All > 50 cases
Cecal intubation rate 88
PDR / ADR mean– all (%) ---- / ---- (none reported)
PDR / ADR mean – male (%) ---- / ----
PDR / ADR mean – female (%) ---- / ----
Cancer detection rate (%) ----
Data reported in arbitrary group thresholds, not comparable to other published data
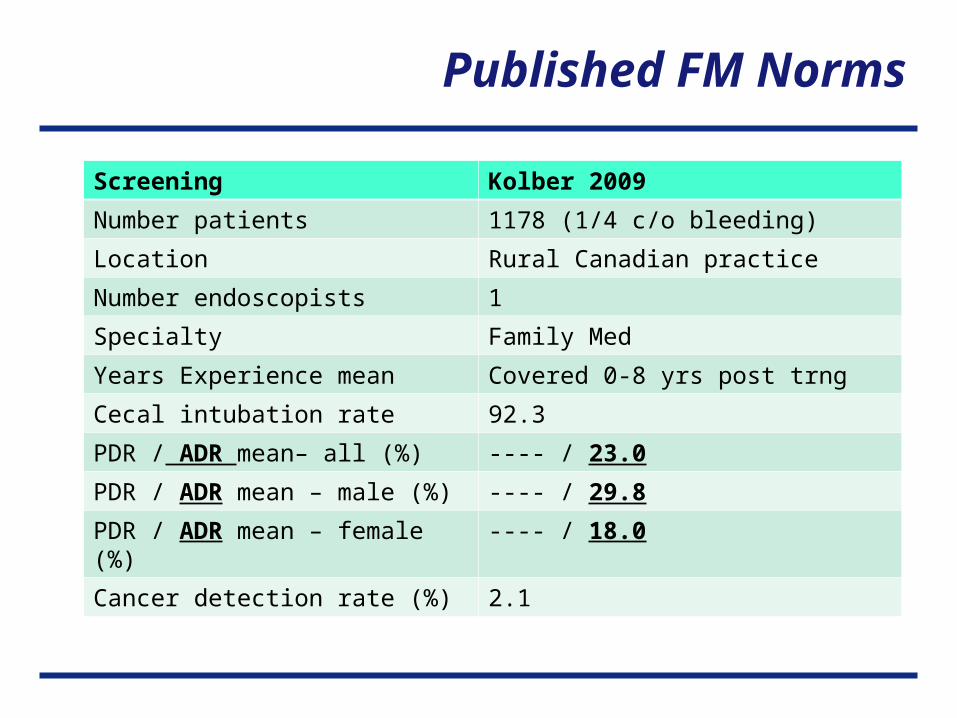
Published FM Norms
Screening Kolber 2009
Number patients 1178 (1/4 c/o bleeding)
Location Rural Canadian practice
Number endoscopists 1
Specialty Family Med
Years Experience mean Covered 0-8 yrs post trng
Cecal intubation rate 92.3
PDR / ADR mean– all (%) ---- / 23.0
PDR / ADR mean – male (%) ---- / 29.8
PDR / ADR mean – female (%) ---- / 18.0
Cancer detection rate (%) 2.1

Published FM Norms
Screening Kolber 2010
Number patients 577 over 2 months
Location Multisite Canada
Number endoscopists 10
Specialty Family Med – 8, Internal Med - 2
Years Experience mean Not reported
Cecal intubation rate 96.5
PDR / ADR mean– all (%) ---- / ----
PDR / ADR mean – male (%) ---- / 46.4
PDR / ADR mean – female (%) ---- / 30.2
Cancer detection rate (%) ----
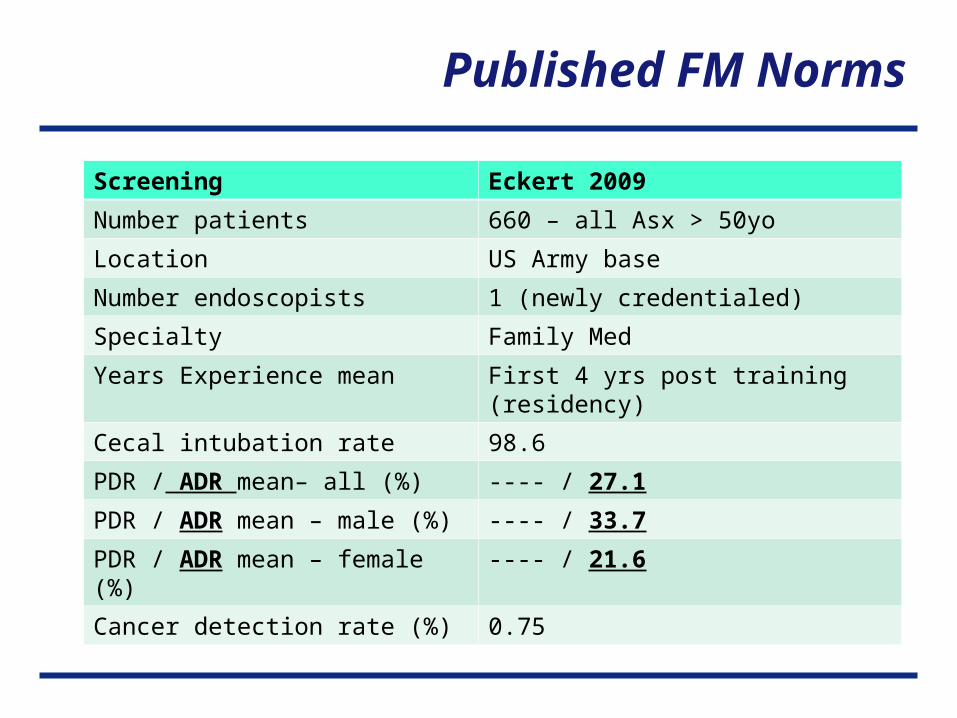
Published FM Norms
Screening Eckert 2009
Number patients 660 – all Asx > 50yo
Location US Army base
Number endoscopists 1 (newly credentialed)
Specialty Family Med
Years Experience mean First 4 yrs post training (residency)
Cecal intubation rate 98.6
PDR / ADR mean– all (%) ---- / 27.1
PDR / ADR mean – male (%) ---- / 33.7
PDR / ADR mean – female (%) ---- / 21.6
Cancer detection rate (%) 0.75

Published FM Norms
Screening Wilkins 2009
Number patients 18,292
Location Misc: Meta-analysis
Number endoscopists 73
Specialty Primary Care – mostly Family Med
Years Experience mean Not reported
Cecal intubation rate 89.2 (92.0 if only include sedated cases)
PDR / ADR mean– all (%) ---- / 28.9
PDR / ADR mean – male (%) ---- / ----
PDR / ADR mean – female (%) ---- / ----
Cancer detection rate (%) 1.7

Published Norms
Screening Denis 2011
Number patients 5852 (all were FOBT +)
Location France
Number endoscopists 100
Specialty Gastroenterology
Years Experience mean “Extensive”
Cecal intubation rate 97.7
PDR / ADR mean– all (%) 43 / 35.6 (14.3-53.4)
PDR / ADR mean – male (%) 52 / 45.2
PDR / ADR mean – female (%) 33 / 26.3
Cancer detection rate (%) 6.5

So what did we find???

Descriptive Statistics
Location Number of Teaching Faculty
Eglin AFB (NW Florida) 5
Nellis AFB (Las Vegas) 4
Scott AFB (St Louis) 2
Travis AFB (N. California) 3
14 total

Descriptive Statistics prior to independent practice
Preceptor for training cases Mean % (sd)
General Surgeon 6 (16)
Gastroenterologist 32 (33)
Family Physician 62 (31)

Descriptive Statistics prior to independent practice
Additional Training N (%)
Fellowship 0 (0)
Simulator 8 (57)
CME conference (NPI, State chapter) 6 (43)

Descriptive Statistics
Experience in training Mean (sd)
Cases prior to independent practice
117 (60)
Years of practice post training 2.6 (1.3)
Post training cases - all 207 (191)
- males 101 (91)
- females 83 (87)
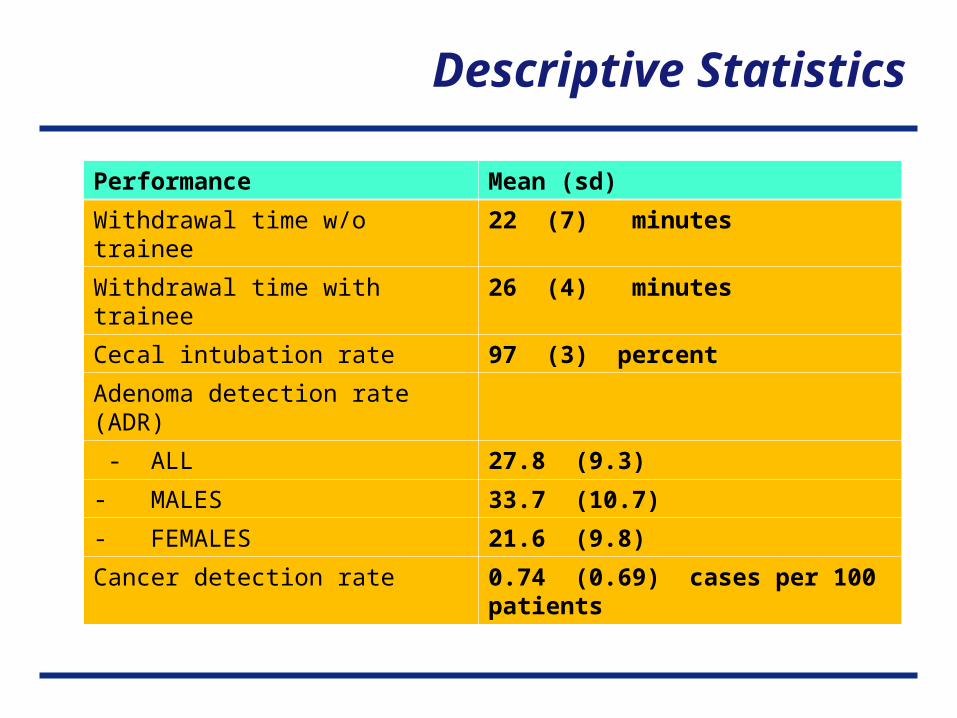
Descriptive Statistics
Performance Mean (sd)
Withdrawal time w/o trainee 22 (7) minutes
Withdrawal time with trainee 26 (4) minutes
Cecal intubation rate 97 (3) percent
Adenoma detection rate (ADR)
- ALL 27.8 (9.3)
- MALES 33.7 (10.7)
- FEMALES 21.6 (9.8)
Cancer detection rate 0.74 (0.69) cases per 100 patients

Specialty Comparison
Gastroenterology Family Medicine
USAF GME FM Faculty
ADR – total 19, 32, 15.5-41.1 23, 27.1, 28.9 27.8
ADR – male 24, 28, 29.5, 37.5 29.8, 33.7, 46.4 33.7
ADR – female 12.7, 13, 19.2 18, 21.6, 30.2 21.6
Cecal intubation rate 88, 91, 97, 98 89, 92, 97, 98.6 97
Cancer detection 0.3, 0.36, 1.0 0.75, 1.7, 2.1 0.74

Descriptive Statistics
Indication for colonoscopy N (%) Mean (sd) per faculty
Average Risk 1819 (82) 165 (152)
High Risk (prior polyps, +Fam hx) 359 (16) 33 (36)
Extreme Risk (genetic syndrome, IBD, CA) 2 (0) 0 (1)
Diagnosis of symptoms (bleeding, pain) 43 (2) 3 (8)
Total (indication tracked) 2223
TOTAL CASES DONE 2893
*Small % Diagnostic cases d/t GI input into referral mgt process

Descriptive Statistics
Complications N (mean per 100 cases)
Nausea/Vomiting 27 (1.2)
Rescue (need assist to complete) 25 (2.0)
Hypotension 17 (1.1)
Bradycardia 13 (0.8)
Inability to biopsy/remove polyps 7 (0.6)
Agitation 5 (0.3)
Bleeding endoscopic cautery req 3 (0.1)
Bleeding admitted postop 2 (0.1)
Perforation 1 (0.1)
Post-polypectomy Syndrome 0
OVERALL 100 (3.9)
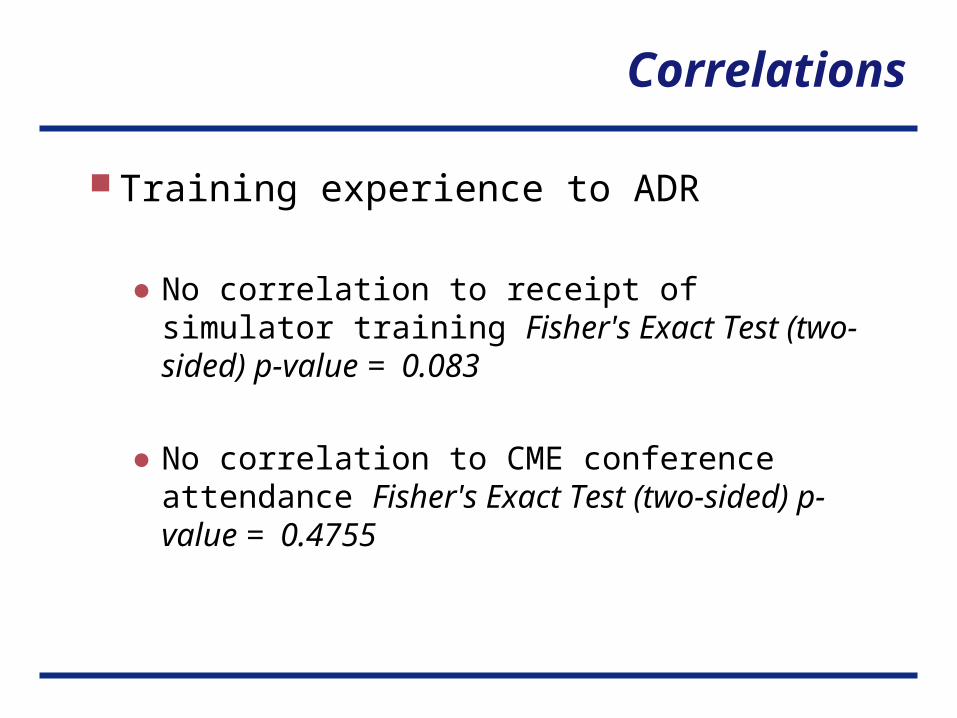
Correlations
Training experience to ADR
● No correlation to receipt of simulator training Fisher's Exact Test (two-sided) p-value = 0.083
● No correlation to CME conference attendance Fisher's Exact Test (two-sided) p-value = 0.4755
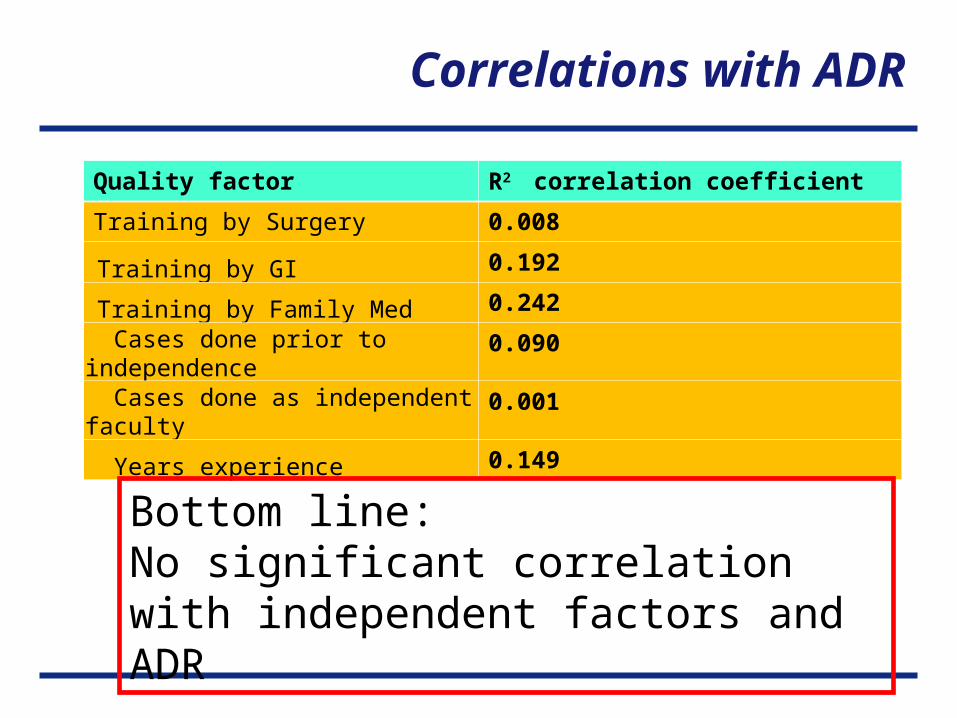
Correlations with ADR
Quality factor R2 correlation coefficient
Training by Surgery 0.008
Training by GI 0.192
Training by Family Med 0.242
Cases done prior to independence 0.090
Cases done as independent faculty 0.001
Years experience 0.149
Bottom line: No significant correlation with independent factors and ADR

Take home points
Recently trained faculty working with residents achieve high quality ADR rates (27.8%) comparable to published GI and FM numbers● Mean 2.6 years experience, 207 cases post training
(117 cases in training)
Complications rates were low No correlations were found between training
experience variables and ADR

Questions?

Biblio
Rex DK, Petrini JL, Baron TH, et al. Quality Indicators for Colonoscopy. Am J Gastroenterol 2006;101:873–885
Kaminski MF, Regula J, Kraszewska E, et al. Quality Indicators for Colonoscopy and the Risk of Interval Cancer. N Engl J Med 2010; 362: 1795‐803.

Biblio
Cooper GS, Chak A, Koroukian S. The polyp detection rate of colonoscopy: A national study of Medicare beneficiaries. American Journal of Medicine 2005; 118, 1413.e11‐1413.
Lieberman DA, Weiss DG, Bond JH, et al. Use of colonoscopy to screen asymptomatic adults for colorectal cancer. NEJM 2000; 343: 162-8.

Biblio
Zauber AG, Winawer SJ, O'Brien MJ, et al. Colonoscopic polypectomy and long-term prevention of colorectal-cancer deaths. N Engl J Med. 2012 Feb 23;366(8):687-96.
Imperiale TF, Glowinski EA, Juliar BE, et al. Variation in polyp detection rates at screening colonoscopy. Gastrointest Endosc.2009 Jun;69(7):1288–95

Biblio
Williams JE, Le TD, Faigel DO. Polypectomy rate as a quality measure for colonoscopy. Gastrointest Endosc 2011;73(3):498–506.
Chen SC, Rex DK. Endoscopist can be more powerful than age and male gender in predicting adenoma detection at colonoscopy. Am J Gastroenterol 2007;102(4):856-61.
Biblio
Goncalves AR, Ferreira C, Marques A, et al. Assessment of quality in screening colonoscopy for colorectal cancer. Clin Experimental Gastroenterology 2011;4: 277–281.
Denis B, Sauleau EA, Gendre I, et al. Measurement of adenoma detection and discrimination during colonoscopy in routine practice: an exploratory study. Gastrointest Endosc. 2011;74(6):1325-36.
Biblio
Ko CW, Dominitz JA, Green P, et al. Specialty differences in polyp detection, removal, and biopsy during colonoscopy. Am J Med 2010;123 (6): 528–35.
Kolber M, Szafran O, Suwal J, et al. Outcomes of 1949 endoscopic procedures. Can Fam Physician 2009; 55(2): 170–175.

Biblio
Kolber M. Prospective Study of the Quality of Colonoscopies performed by Primary Care Physicians in Alberta, Canada – The Alberta Primary Care Endoscopy (APC –Endo) Study. ClinicalTrials.gov Identifier: NCT01320826. Publication pending
Eckert LD, Short MW, Domagalski JE, et al. Assessing Colonoscopy Training Outcomes Using Quality Indicators. J Grad Med Educ 2009;1(1):89-92.
Biblio
Wilkins T, LeClair B, Smolkin M, et al. Screening colonoscopies by primary care physicians: a meta-analysis. Ann Fam Med 2009;7(1):56-62.
Cotton PB, Connor P, McGee D, et al. Colonoscopy: practice variation among 69 hospital-based endoscopists. Gastrointest Endosc 2003;57(3):352-357.

Biblio
Heitman SJ, Ronksley PE, Hilsden RJ, et al. Prevalence of adenomas and colorectal cancer in average risk individuals: a systematic review and meta-analysis. Clin Gastroenterol Hepatol. 2009 Dec;7(12):1272-8.
Related Documents