Work Stream 3 – Phase 2 Assessing the Impact of Low Carbon Technologies on Great Britain’s Power Distribution Network 2. Main Findings and Conclusions 12 th November 2012

Welcome message from author
This document is posted to help you gain knowledge. Please leave a comment to let me know what you think about it! Share it to your friends and learn new things together.
Transcript
Work Stream 3 – Phase 2
Assessing the Impact of Low Carbon
Technologies on Great Britain’s
Power Distribution Network
2. Main Findings and Conclusions
12th November 2012
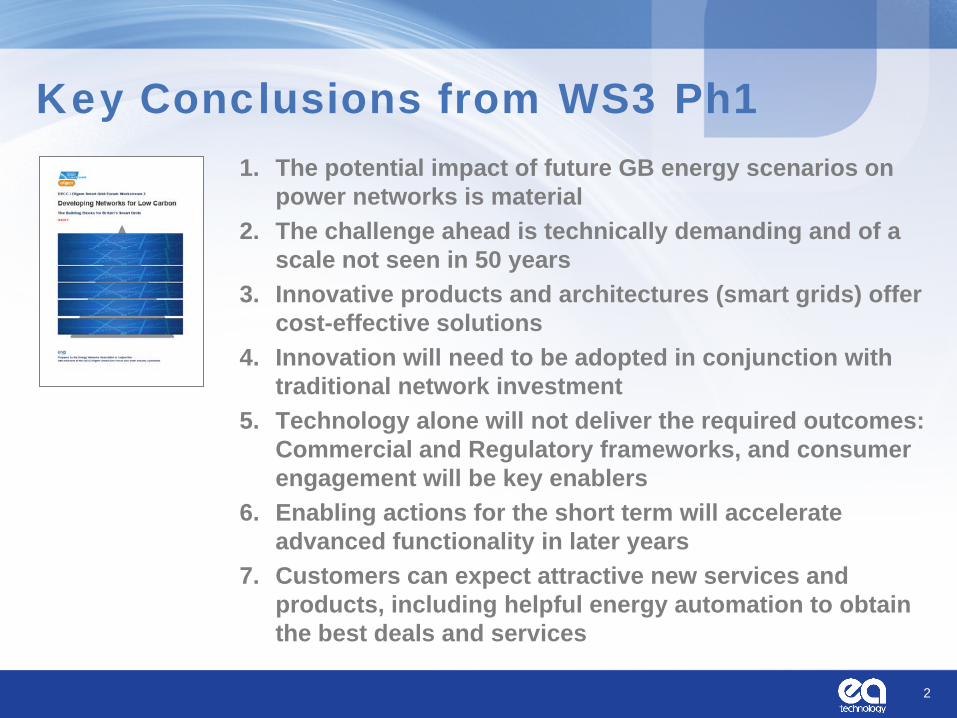
Key Conclusions from WS3 Ph1 1. The potential impact of future GB energy scenarios on
power networks is material 2. The challenge ahead is technically demanding and of a
scale not seen in 50 years 3. Innovative products and architectures (smart grids) offer
cost-effective solutions 4. Innovation will need to be adopted in conjunction with
traditional network investment 5. Technology alone will not deliver the required outcomes:
Commercial and Regulatory frameworks, and consumer engagement will be key enablers
6. Enabling actions for the short term will accelerate advanced functionality in later years
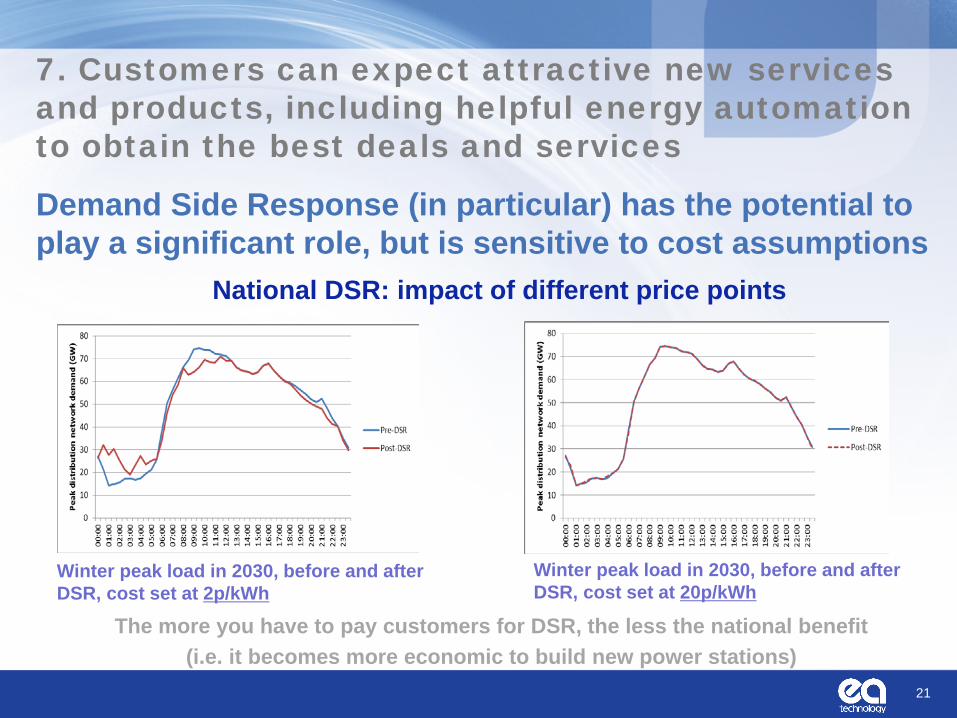
7. Customers can expect attractive new services and products, including helpful energy automation to obtain the best deals and services
2
3
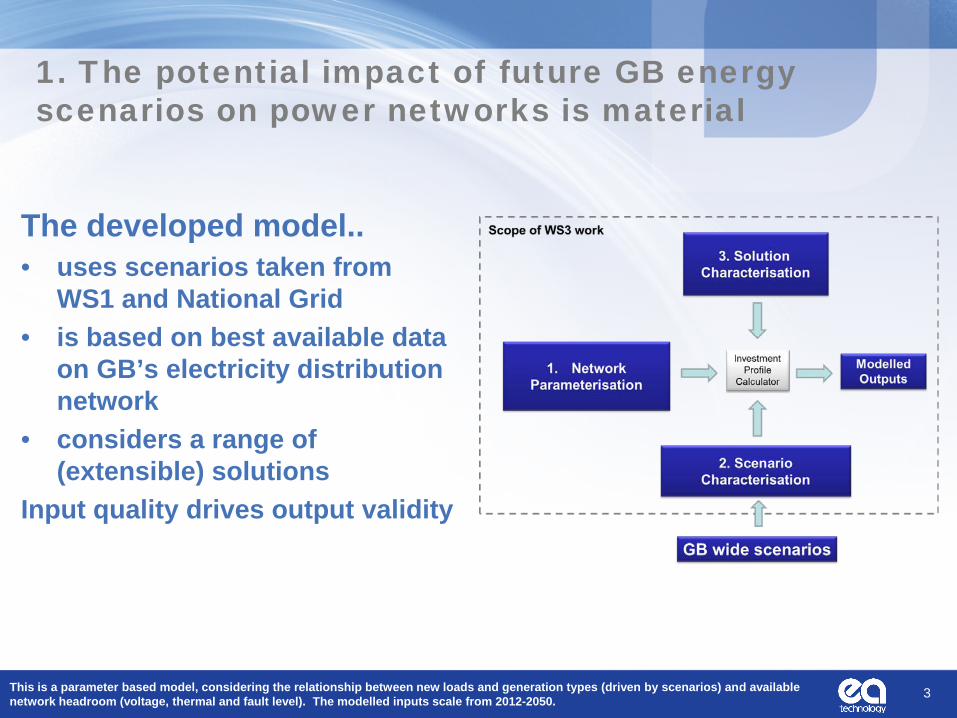
The developed model.. • uses scenarios taken from
WS1 and National Grid • is based on best available data
on GB’s electricity distribution network
• considers a range of (extensible) solutions
Input quality drives output validity
1. The potential impact of future GB energy scenarios on power networks is material
This is a parameter based model, considering the relationship between new loads and generation types (driven by scenarios) and available network headroom (voltage, thermal and fault level). The modelled inputs scale from 2012-2050.
4
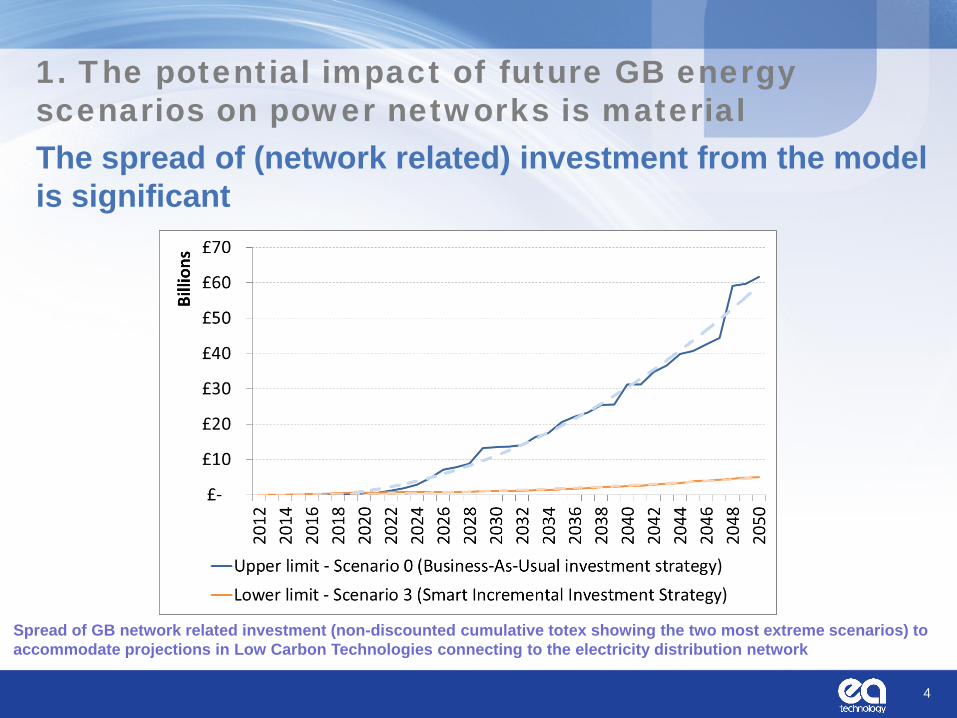
The spread of (network related) investment from the model is significant
Spread of GB network related investment (non-discounted cumulative totex showing the two most extreme scenarios) to accommodate projections in Low Carbon Technologies connecting to the electricity distribution network
1. The potential impact of future GB energy scenarios on power networks is material
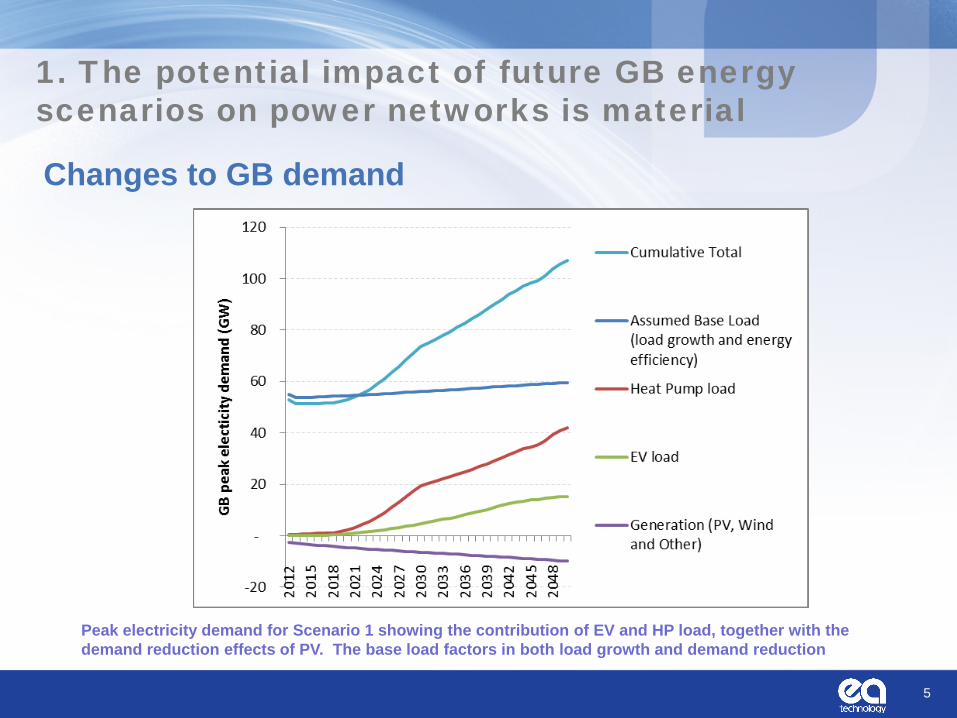
Changes to GB demand
5
Peak electricity demand for Scenario 1 showing the contribution of EV and HP load, together with the demand reduction effects of PV. The base load factors in both load growth and demand reduction
1. The potential impact of future GB energy scenarios on power networks is material
1. The potential impact of future GB energy scenarios on power networks is material
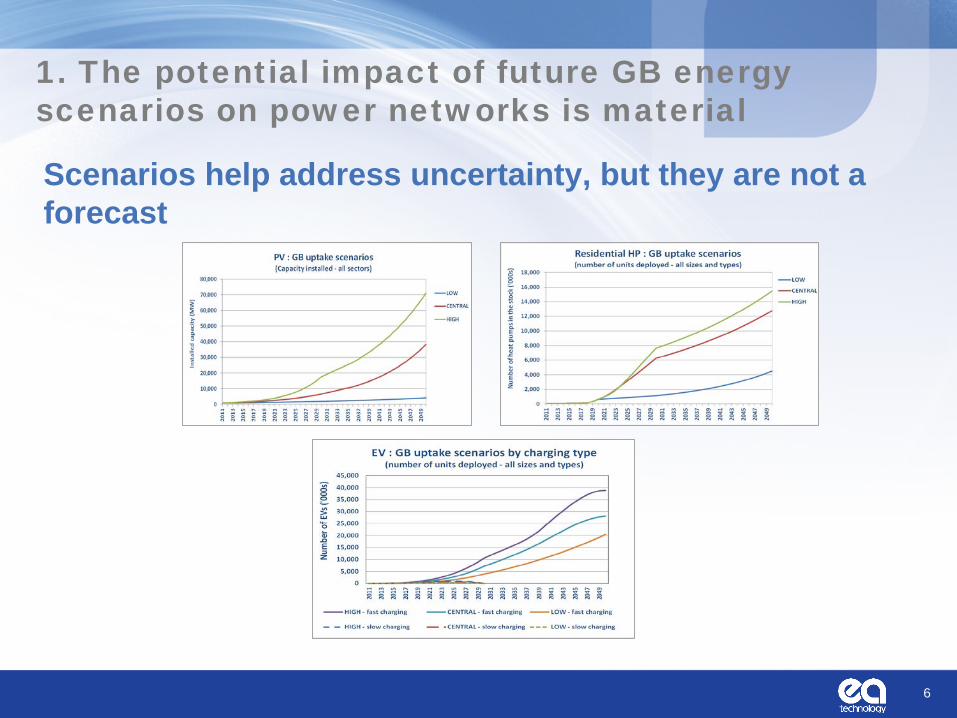
Scenarios help address uncertainty, but they are not a forecast
6
2. The challenge ahead is technically demanding and of a scale not seen in 50 years
7
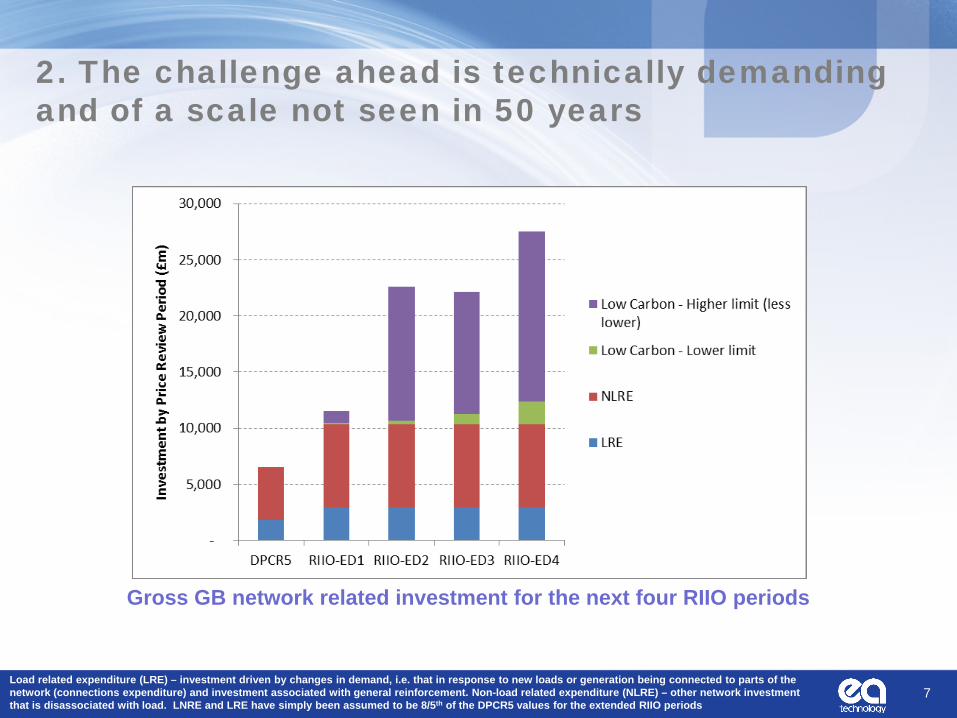
Gross GB network related investment for the next four RIIO periods
Load related expenditure (LRE) – investment driven by changes in demand, i.e. that in response to new loads or generation being connected to parts of the network (connections expenditure) and investment associated with general reinforcement. Non-load related expenditure (NLRE) – other network investment that is disassociated with load. LNRE and LRE have simply been assumed to be 8/5th of the DPCR5 values for the extended RIIO periods
2. The challenge ahead is technically demanding and of a scale not seen in 50 years
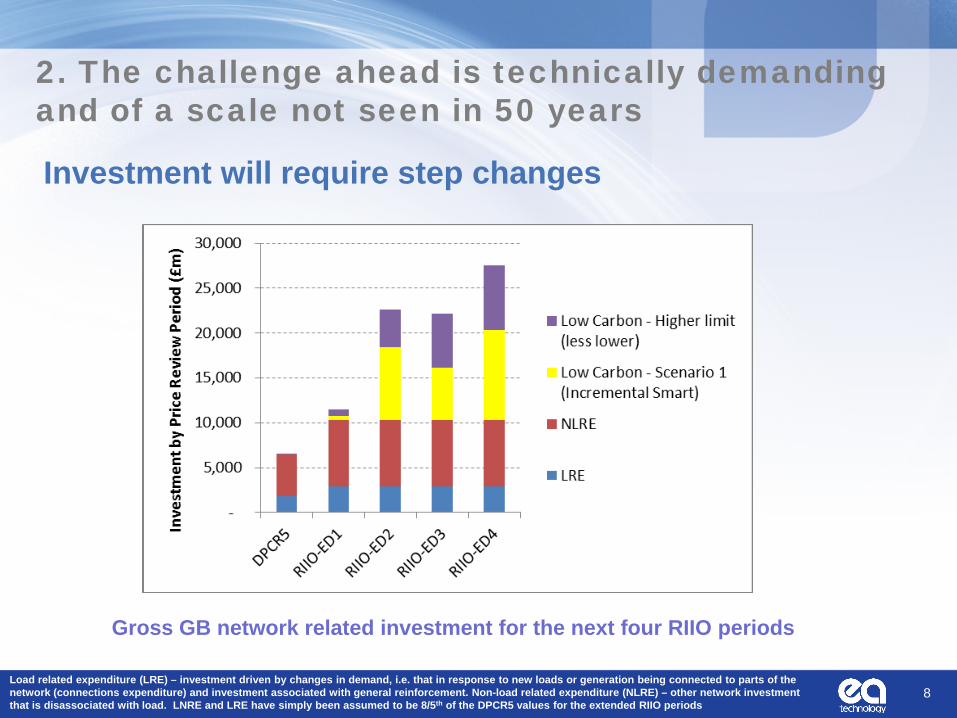
Investment will require step changes
8
Gross GB network related investment for the next four RIIO periods
Load related expenditure (LRE) – investment driven by changes in demand, i.e. that in response to new loads or generation being connected to parts of the network (connections expenditure) and investment associated with general reinforcement. Non-load related expenditure (NLRE) – other network investment that is disassociated with load. LNRE and LRE have simply been assumed to be 8/5th of the DPCR5 values for the extended RIIO periods
3. Innovative products and architectures (smart grids) offer cost-effective solutions
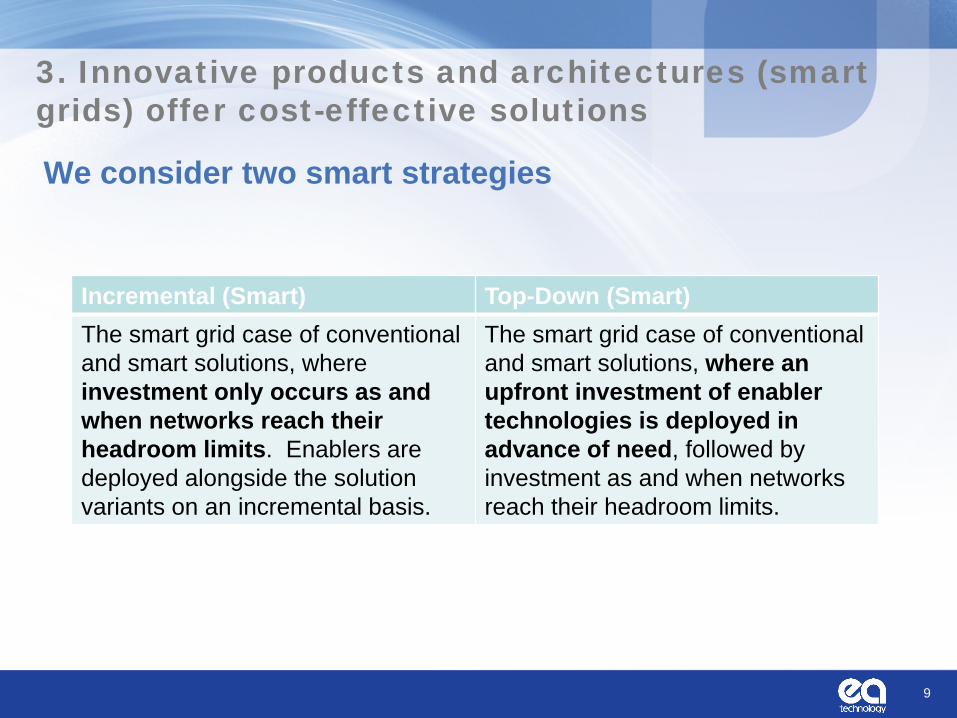
We consider two smart strategies
9
Incremental (Smart) Top-Down (Smart) The smart grid case of conventional and smart solutions, where investment only occurs as and when networks reach their headroom limits. Enablers are deployed alongside the solution variants on an incremental basis.
The smart grid case of conventional and smart solutions, where an upfront investment of enabler technologies is deployed in advance of need, followed by investment as and when networks reach their headroom limits.
3. Innovative products and architectures (smart grids) offer cost-effective solutions
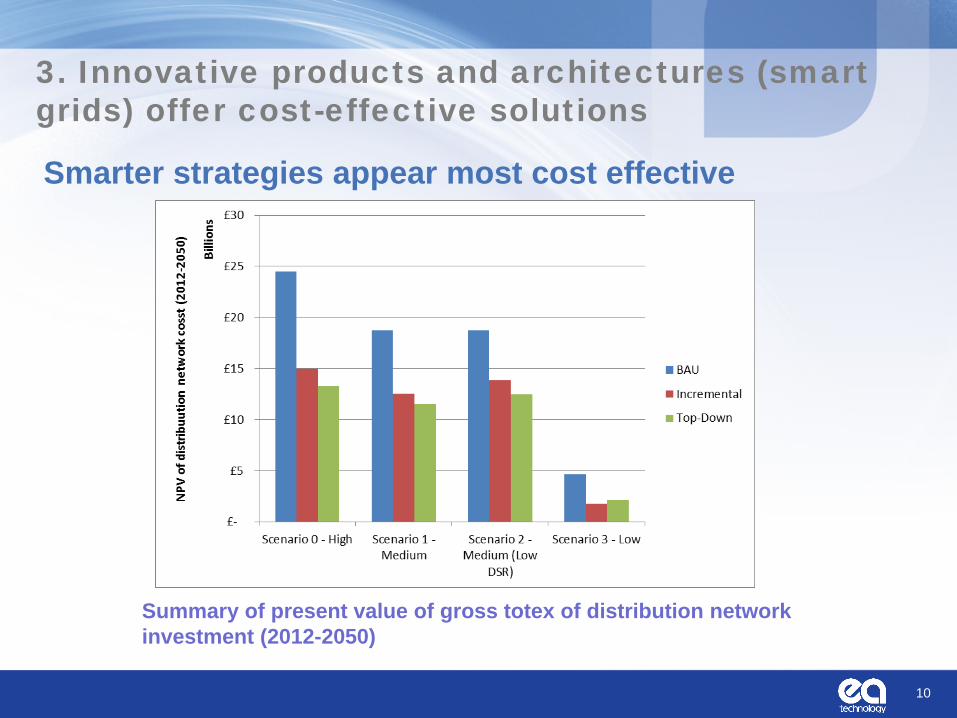
Smarter strategies appear most cost effective
10
Summary of present value of gross totex of distribution network investment (2012-2050)
3. Innovative products and architectures (smart grids) offer cost-effective solutions
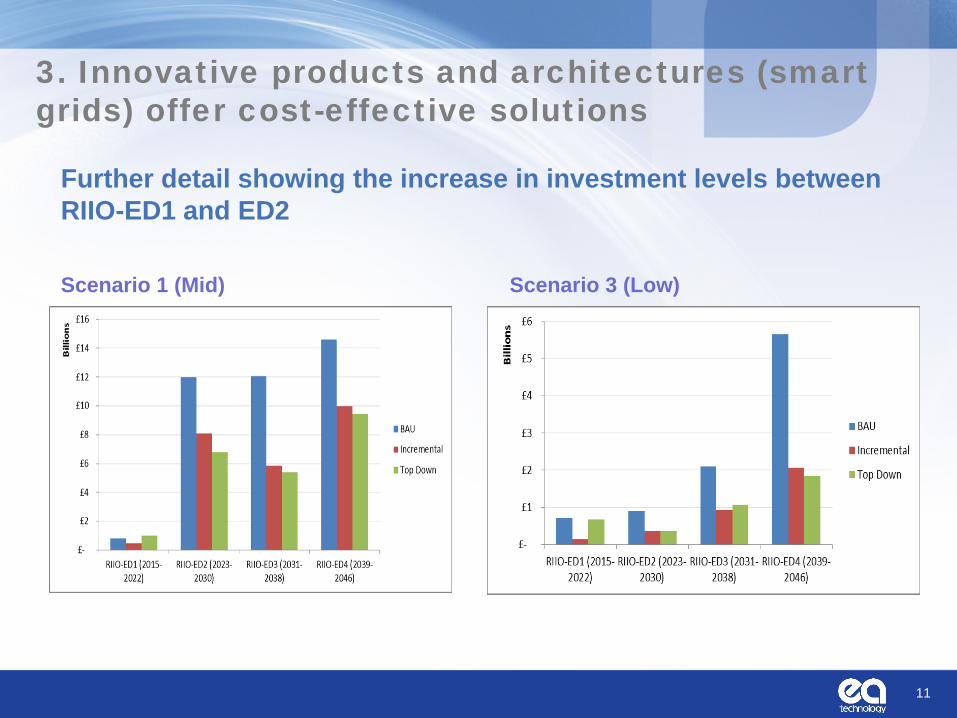
Further detail showing the increase in investment levels between RIIO-ED1 and ED2
11
Scenario 1 (Mid) Scenario 3 (Low)
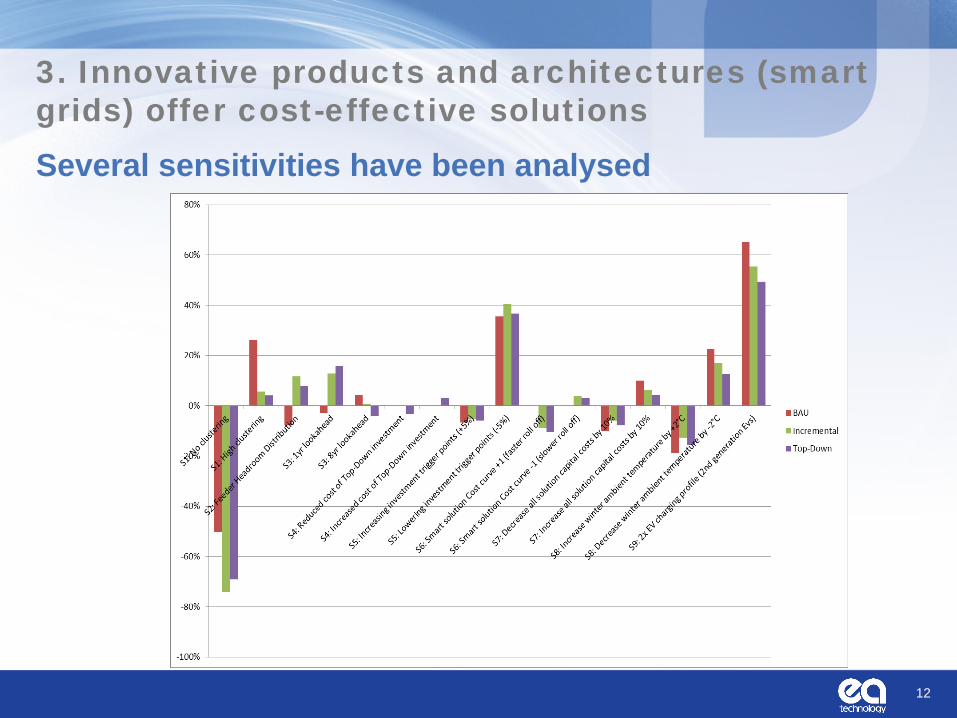
Several sensitivities have been analysed
12
3. Innovative products and architectures (smart grids) offer cost-effective solutions
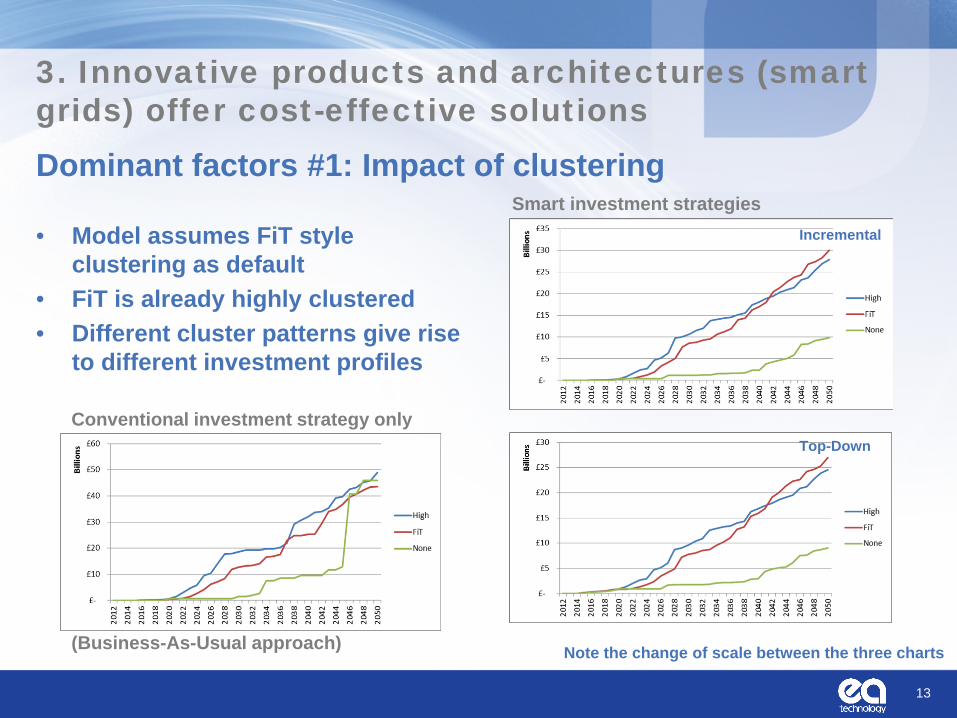
Dominant factors #1: Impact of clustering
13
3. Innovative products and architectures (smart grids) offer cost-effective solutions
Conventional investment strategy only (Business-As-Usual approach)
Smart investment strategies Incremental
Top-Down
• Model assumes FiT style clustering as default
• FiT is already highly clustered • Different cluster patterns give rise
to different investment profiles
Note the change of scale between the three charts
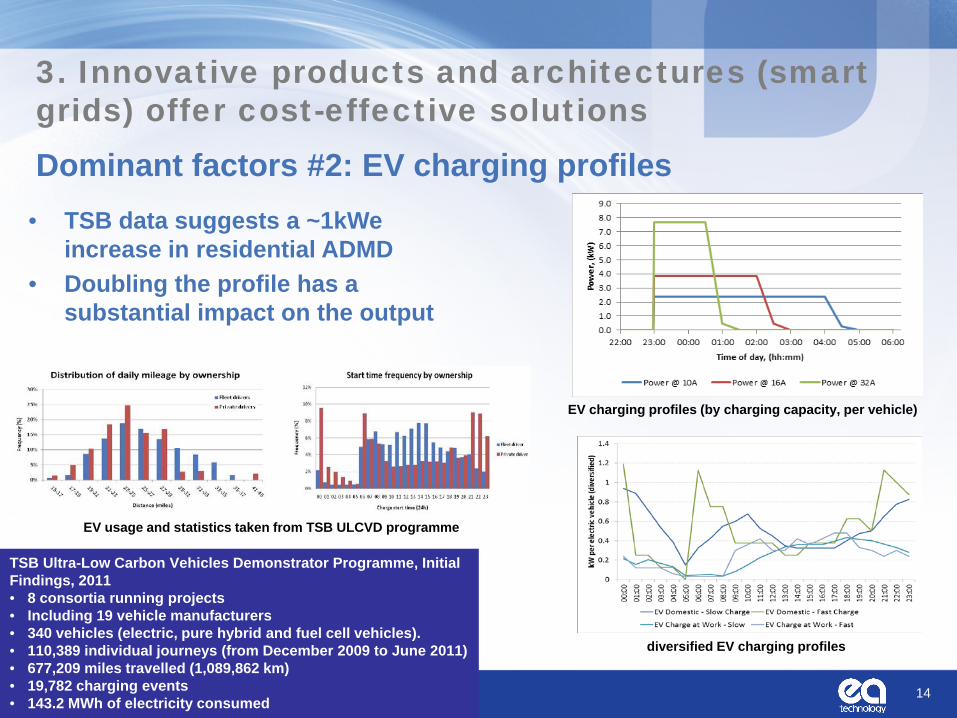
Dominant factors #2: EV charging profiles
14
3. Innovative products and architectures (smart grids) offer cost-effective solutions
• TSB data suggests a ~1kWe increase in residential ADMD
• Doubling the profile has a substantial impact on the output
TSB Ultra-Low Carbon Vehicles Demonstrator Programme, Initial Findings, 2011 • 8 consortia running projects • Including 19 vehicle manufacturers • 340 vehicles (electric, pure hybrid and fuel cell vehicles). • 110,389 individual journeys (from December 2009 to June 2011) • 677,209 miles travelled (1,089,862 km) • 19,782 charging events • 143.2 MWh of electricity consumed
diversified EV charging profiles
EV charging profiles (by charging capacity, per vehicle)
EV usage and statistics taken from TSB ULCVD programme
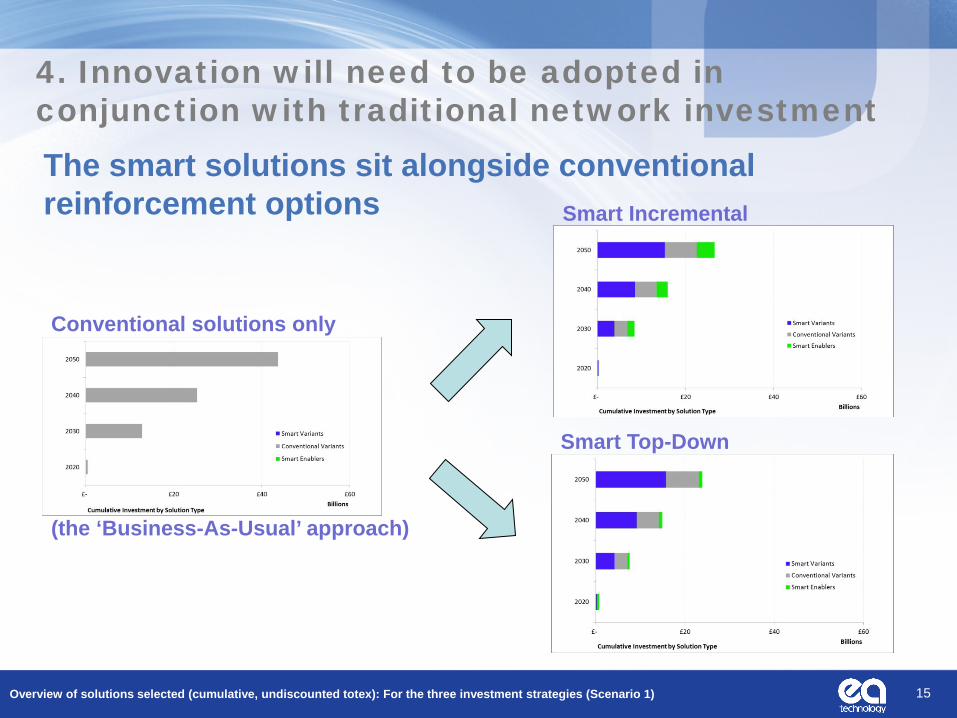
4. Innovation will need to be adopted in conjunction with traditional network investment The smart solutions sit alongside conventional reinforcement options
15
Conventional solutions only (the ‘Business-As-Usual’ approach)
Overview of solutions selected (cumulative, undiscounted totex): For the three investment strategies (Scenario 1)
Smart Incremental
Smart Top-Down
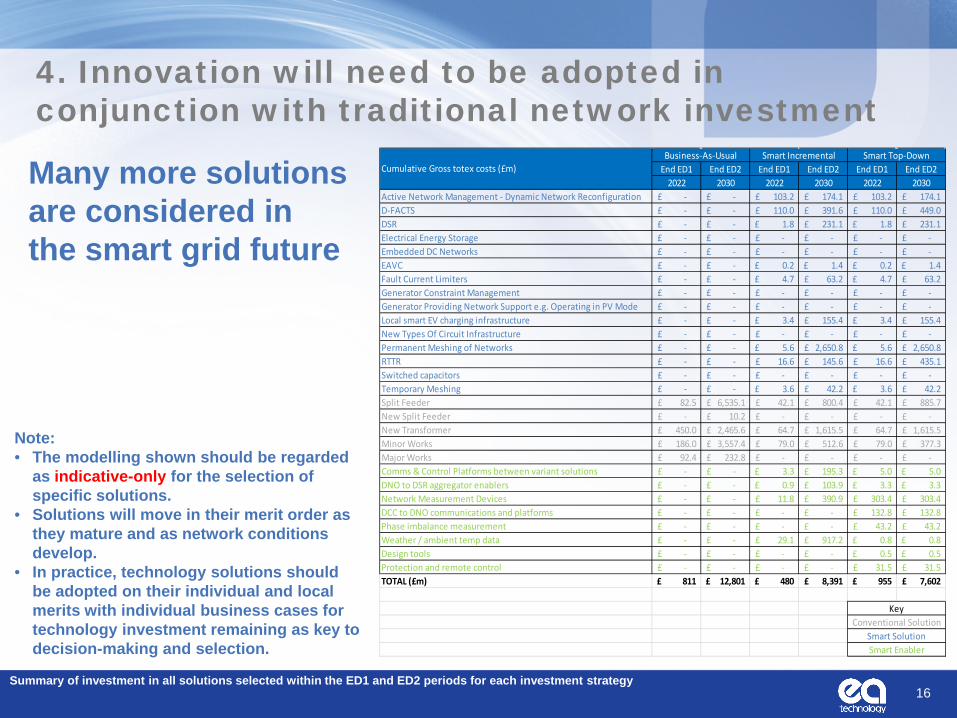
4. Innovation will need to be adopted in conjunction with traditional network investment
Many more solutions are considered in the smart grid future
16
Note: • The modelling shown should be regarded
as indicative-only for the selection of specific solutions.
• Solutions will move in their merit order as they mature and as network conditions develop.
• In practice, technology solutions should be adopted on their individual and local merits with individual business cases for technology investment remaining as key to decision-making and selection.
Summary of investment in all solutions selected within the ED1 and ED2 periods for each investment strategy
End ED1 End ED2 End ED1 End ED2 End ED1 End ED22022 2030 2022 2030 2022 2030
Active Network Management - Dynamic Network Reconfiguration -£ -£ 103.2£ 174.1£ 103.2£ 174.1£ D-FACTS -£ -£ 110.0£ 391.6£ 110.0£ 449.0£ DSR -£ -£ 1.8£ 231.1£ 1.8£ 231.1£ Electrical Energy Storage -£ -£ -£ -£ -£ -£ Embedded DC Networks -£ -£ -£ -£ -£ -£ EAVC -£ -£ 0.2£ 1.4£ 0.2£ 1.4£ Fault Current Limiters -£ -£ 4.7£ 63.2£ 4.7£ 63.2£ Generator Constraint Management -£ -£ -£ -£ -£ -£ Generator Providing Network Support e.g. Operating in PV Mode -£ -£ -£ -£ -£ -£ Local smart EV charging infrastructure -£ -£ 3.4£ 155.4£ 3.4£ 155.4£ New Types Of Circuit Infrastructure -£ -£ -£ -£ -£ -£ Permanent Meshing of Networks -£ -£ 5.6£ 2,650.8£ 5.6£ 2,650.8£ RTTR -£ -£ 16.6£ 145.6£ 16.6£ 435.1£ Switched capacitors -£ -£ -£ -£ -£ -£ Temporary Meshing -£ -£ 3.6£ 42.2£ 3.6£ 42.2£ Split Feeder 82.5£ 6,535.1£ 42.1£ 800.4£ 42.1£ 885.7£ New Split Feeder -£ 10.2£ -£ -£ -£ -£ New Transformer 450.0£ 2,465.6£ 64.7£ 1,615.5£ 64.7£ 1,615.5£ Minor Works 186.0£ 3,557.4£ 79.0£ 512.6£ 79.0£ 377.3£ Major Works 92.4£ 232.8£ -£ -£ -£ -£ Comms & Control Platforms between variant solutions -£ -£ 3.3£ 195.3£ 5.0£ 5.0£ DNO to DSR aggregator enablers -£ -£ 0.9£ 103.9£ 3.3£ 3.3£ Network Measurement Devices -£ -£ 11.8£ 390.9£ 303.4£ 303.4£ DCC to DNO communications and platforms -£ -£ -£ -£ 132.8£ 132.8£ Phase imbalance measurement -£ -£ -£ -£ 43.2£ 43.2£ Weather / ambient temp data -£ -£ 29.1£ 917.2£ 0.8£ 0.8£ Design tools -£ -£ -£ -£ 0.5£ 0.5£ Protection and remote control -£ -£ -£ -£ 31.5£ 31.5£ TOTAL (£m) 811£ 12,801£ 480£ 8,391£ 955£ 7,602£
Conventional SolutionSmart SolutionSmart Enabler
Cumulative Gross totex costs (£m)Business-As-Usual Smart Incremental Smart Top-Down
Key
4. Innovation will need to be adopted in conjunction with traditional network investment
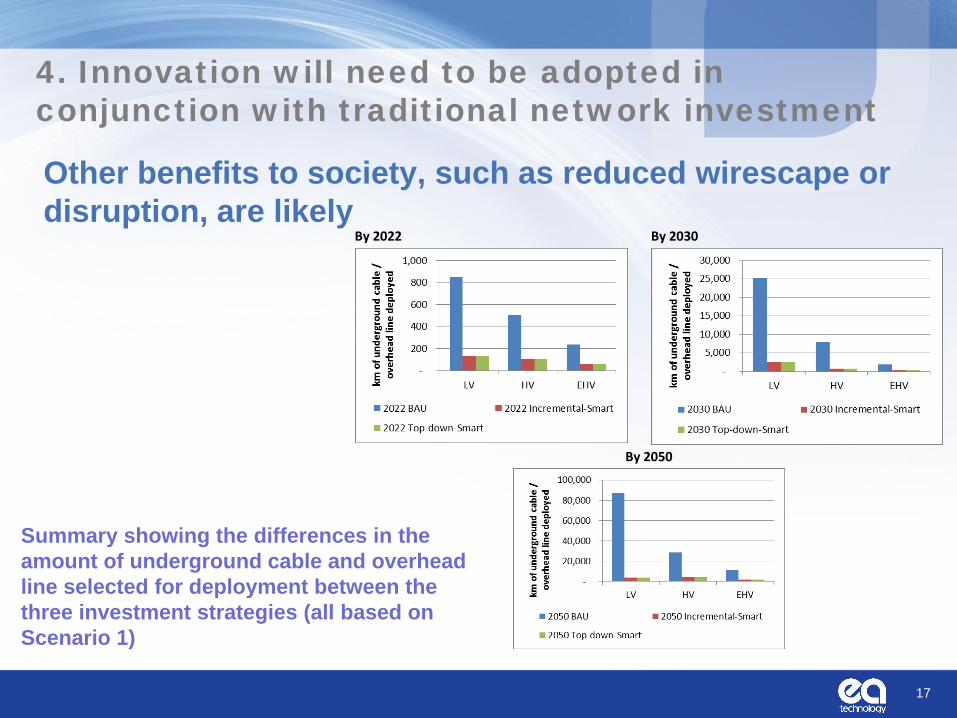
Other benefits to society, such as reduced wirescape or disruption, are likely
17
Summary showing the differences in the amount of underground cable and overhead line selected for deployment between the three investment strategies (all based on Scenario 1)
By 2022
By 2030
By 2050
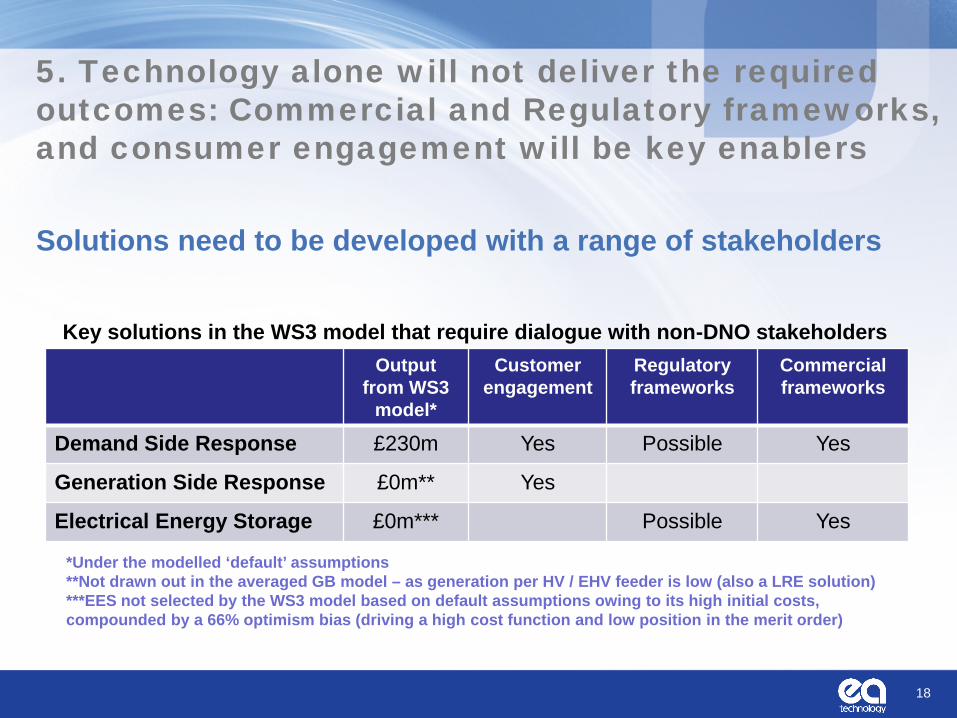
5. Technology alone will not deliver the required outcomes: Commercial and Regulatory frameworks, and consumer engagement will be key enablers Solutions need to be developed with a range of stakeholders
18
*Under the modelled ‘default’ assumptions **Not drawn out in the averaged GB model – as generation per HV / EHV feeder is low (also a LRE solution) ***EES not selected by the WS3 model based on default assumptions owing to its high initial costs, compounded by a 66% optimism bias (driving a high cost function and low position in the merit order)
Output from WS3
model*
Customer engagement
Regulatory frameworks
Commercial frameworks
Demand Side Response £230m Yes Possible Yes
Generation Side Response £0m** Yes
Electrical Energy Storage £0m*** Possible Yes
Key solutions in the WS3 model that require dialogue with non-DNO stakeholders
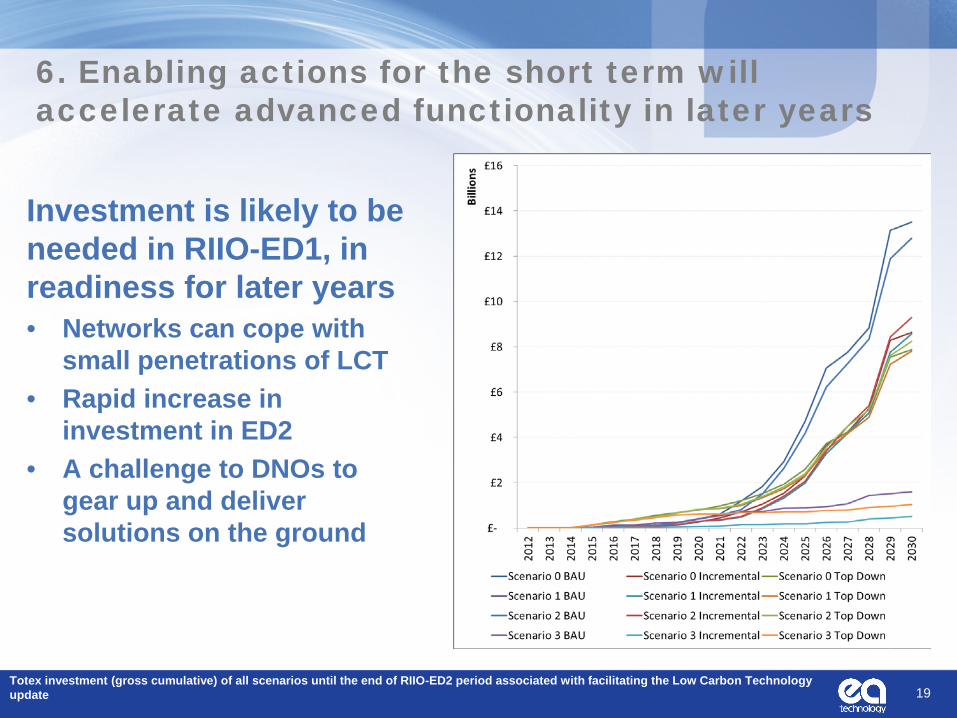
6. Enabling actions for the short term will accelerate advanced functionality in later years
Investment is likely to be needed in RIIO-ED1, in readiness for later years • Networks can cope with
small penetrations of LCT • Rapid increase in
investment in ED2 • A challenge to DNOs to
gear up and deliver solutions on the ground
19 Totex investment (gross cumulative) of all scenarios until the end of RIIO-ED2 period associated with facilitating the Low Carbon Technology update
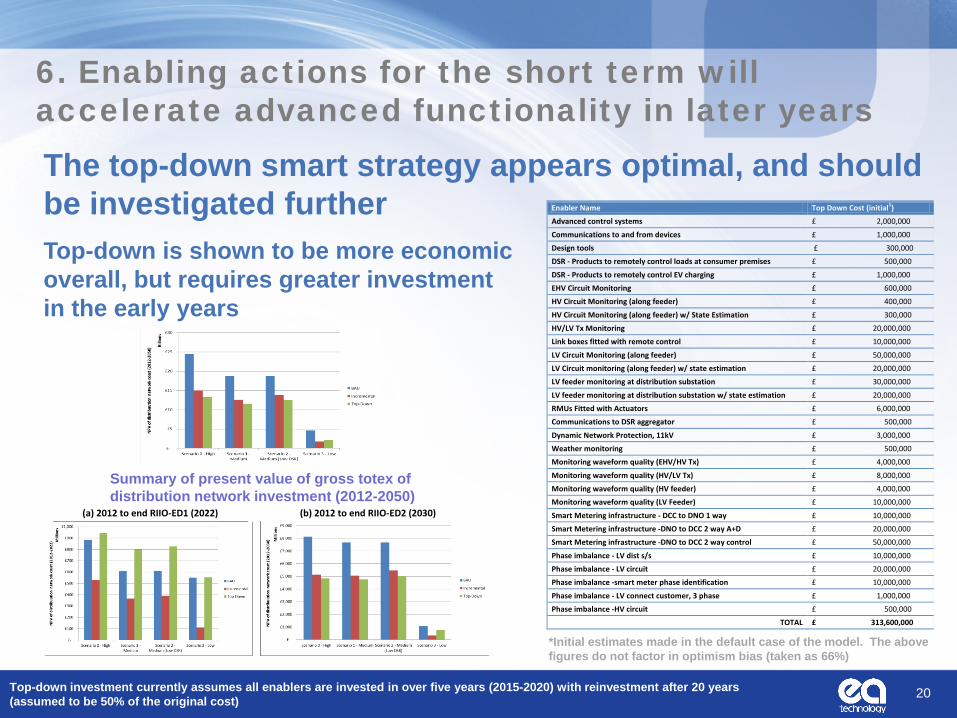
6. Enabling actions for the short term will accelerate advanced functionality in later years The top-down smart strategy appears optimal, and should be investigated further
20 Top-down investment currently assumes all enablers are invested in over five years (2015-2020) with reinvestment after 20 years (assumed to be 50% of the original cost)
Enabler Name Top Down Cost (initial1)
Advanced control systems £ 2,000,000
Communications to and from devices £ 1,000,000
Design tools £ 300,000
DSR - Products to remotely control loads at consumer premises £ 500,000
DSR - Products to remotely control EV charging £ 1,000,000
EHV Circuit Monitoring £ 600,000
HV Circuit Monitoring (along feeder) £ 400,000
HV Circuit Monitoring (along feeder) w/ State Estimation £ 300,000
HV/LV Tx Monitoring £ 20,000,000
Link boxes fitted with remote control £ 10,000,000
LV Circuit Monitoring (along feeder) £ 50,000,000
LV Circuit monitoring (along feeder) w/ state estimation £ 20,000,000
LV feeder monitoring at distribution substation £ 30,000,000
LV feeder monitoring at distribution substation w/ state estimation £ 20,000,000
RMUs Fitted with Actuators £ 6,000,000
Communications to DSR aggregator £ 500,000
Dynamic Network Protection, 11kV £ 3,000,000
Weather monitoring £ 500,000
Monitoring waveform quality (EHV/HV Tx) £ 4,000,000
Monitoring waveform quality (HV/LV Tx) £ 8,000,000
Monitoring waveform quality (HV feeder) £ 4,000,000
Monitoring waveform quality (LV Feeder) £ 10,000,000
Smart Metering infrastructure - DCC to DNO 1 way £ 10,000,000
Smart Metering infrastructure -DNO to DCC 2 way A+D £ 20,000,000
Smart Metering infrastructure -DNO to DCC 2 way control £ 50,000,000
Phase imbalance - LV dist s/s £ 10,000,000
Phase imbalance - LV circuit £ 20,000,000
Phase imbalance -smart meter phase identification £ 10,000,000
Phase imbalance - LV connect customer, 3 phase £ 1,000,000
Phase imbalance -HV circuit £ 500,000
TOTAL £ 313,600,000
*Initial estimates made in the default case of the model. The above figures do not factor in optimism bias (taken as 66%)
Summary of present value of gross totex of distribution network investment (2012-2050)
(a) 2012 to end RIIO-ED1 (2022)
(b) 2012 to end RIIO-ED2 (2030)
Top-down is shown to be more economic overall, but requires greater investment in the early years
7. Customers can expect attractive new services and products, including helpful energy automation to obtain the best deals and services
Demand Side Response (in particular) has the potential to play a significant role, but is sensitive to cost assumptions
21
Winter peak load in 2030, before and after DSR, cost set at 2p/kWh
Winter peak load in 2030, before and after DSR, cost set at 20p/kWh
National DSR: impact of different price points
The more you have to pay customers for DSR, the less the national benefit (i.e. it becomes more economic to build new power stations)
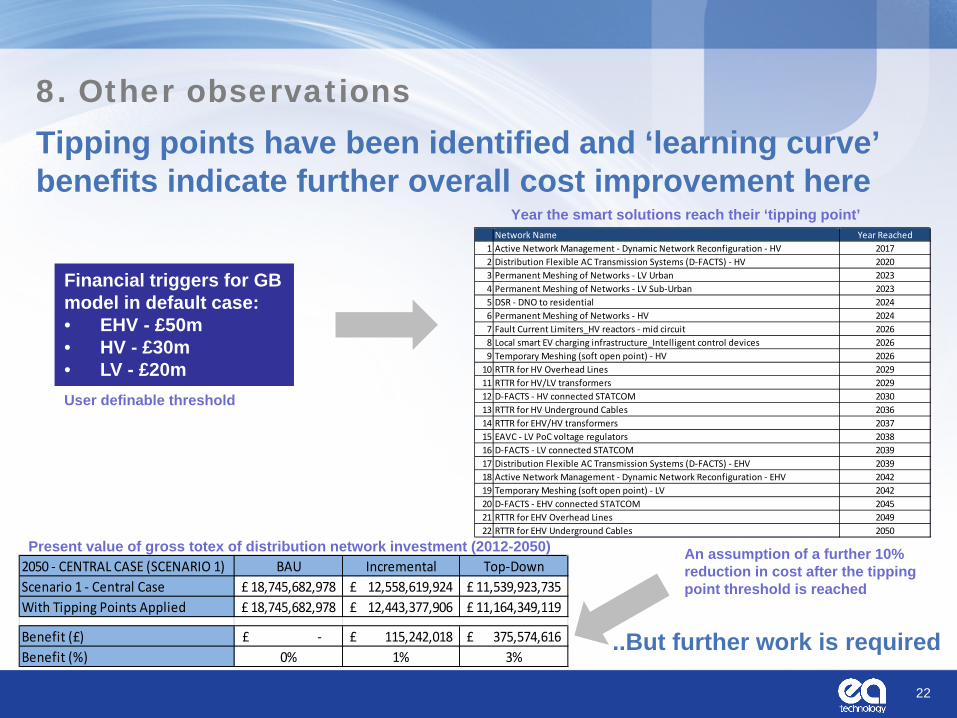
Tipping points have been identified and ‘learning curve’ benefits indicate further overall cost improvement here
22
2050 - CENTRAL CASE (SCENARIO 1) BAU Incremental Top-DownScenario 1 - Central Case 18,745,682,978£ 12,558,619,924£ 11,539,923,735£ With Tipping Points Applied 18,745,682,978£ 12,443,377,906£ 11,164,349,119£
Benefit (£) -£ 115,242,018£ 375,574,616£ Benefit (%) 0% 1% 3%
Network Name Year Reached1 Active Network Management - Dynamic Network Reconfiguration - HV 20172 Distribution Flexible AC Transmission Systems (D-FACTS) - HV 20203 Permanent Meshing of Networks - LV Urban 20234 Permanent Meshing of Networks - LV Sub-Urban 20235 DSR - DNO to residential 20246 Permanent Meshing of Networks - HV 20247 Fault Current Limiters_HV reactors - mid circuit 20268 Local smart EV charging infrastructure_Intelligent control devices 20269 Temporary Meshing (soft open point) - HV 2026
10 RTTR for HV Overhead Lines 202911 RTTR for HV/LV transformers 202912 D-FACTS - HV connected STATCOM 203013 RTTR for HV Underground Cables 203614 RTTR for EHV/HV transformers 203715 EAVC - LV PoC voltage regulators 203816 D-FACTS - LV connected STATCOM 203917 Distribution Flexible AC Transmission Systems (D-FACTS) - EHV 203918 Active Network Management - Dynamic Network Reconfiguration - EHV 204219 Temporary Meshing (soft open point) - LV 204220 D-FACTS - EHV connected STATCOM 204521 RTTR for EHV Overhead Lines 204922 RTTR for EHV Underground Cables 2050
8. Other observations
Financial triggers for GB model in default case: • EHV - £50m • HV - £30m • LV - £20m
..But further work is required
Present value of gross totex of distribution network investment (2012-2050)
Year the smart solutions reach their ‘tipping point’
User definable threshold
An assumption of a further 10% reduction in cost after the tipping point threshold is reached
8. Other observations
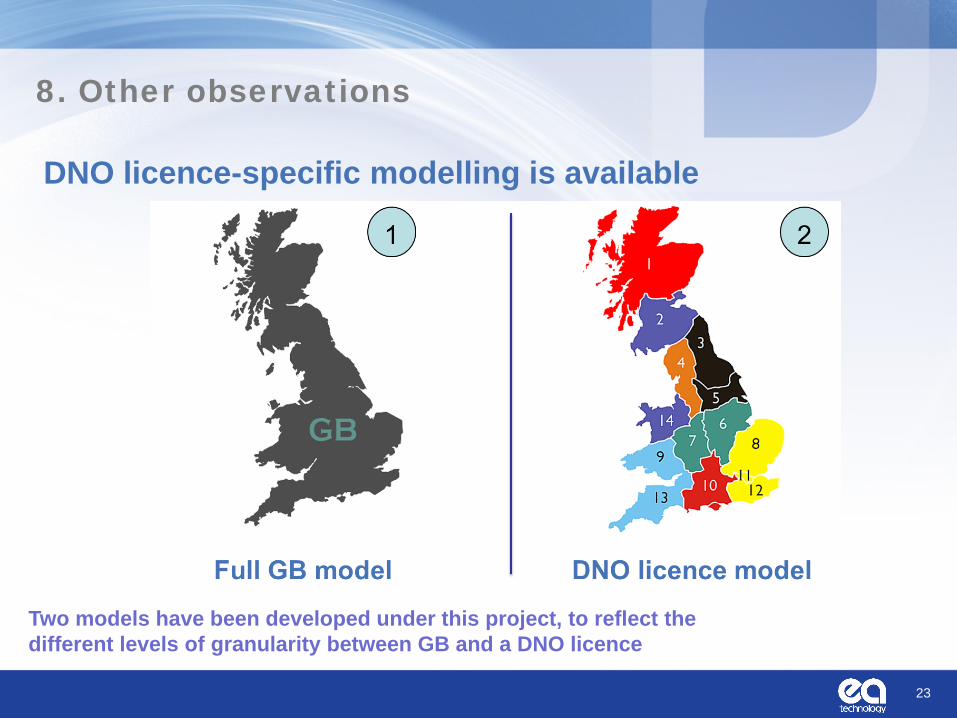
DNO licence-specific modelling is available
23
Two models have been developed under this project, to reflect the different levels of granularity between GB and a DNO licence
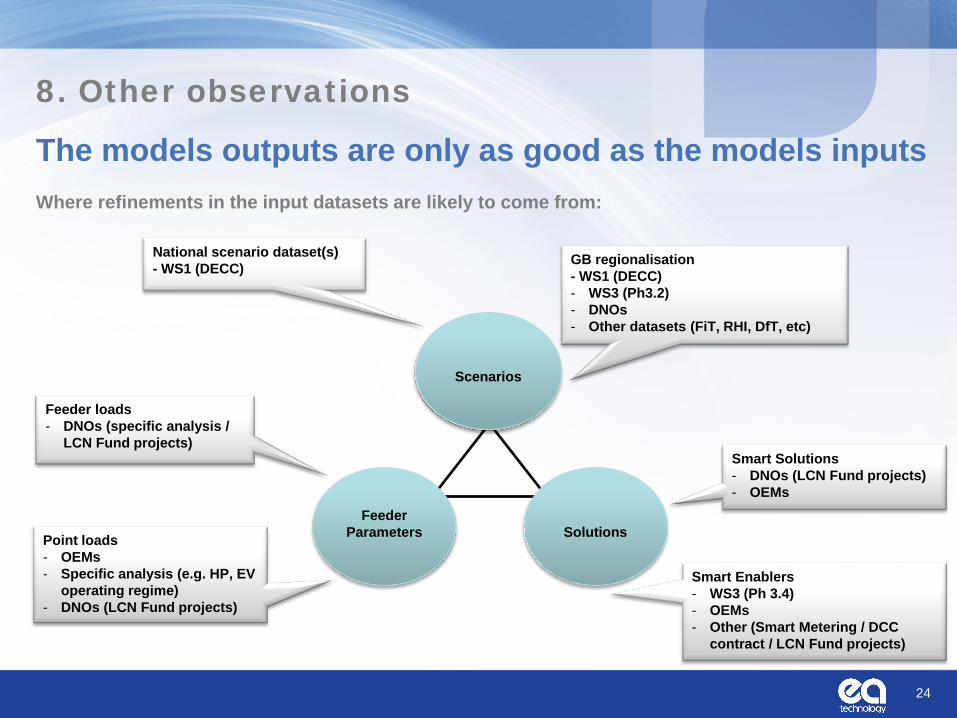
The models outputs are only as good as the models inputs
24
Feeder
Parameters
Scenarios
Solutions
National scenario dataset(s) - WS1 (DECC) GB regionalisation
- WS1 (DECC) - WS3 (Ph3.2) - DNOs - Other datasets (FiT, RHI, DfT, etc)
Feeder loads - DNOs (specific analysis /
LCN Fund projects) Smart Solutions - DNOs (LCN Fund projects) - OEMs
Smart Enablers - WS3 (Ph 3.4) - OEMs - Other (Smart Metering / DCC
contract / LCN Fund projects)
Point loads - OEMs - Specific analysis (e.g. HP, EV
operating regime) - DNOs (LCN Fund projects)
Where refinements in the input datasets are likely to come from:
8. Other observations

Further Questions
25

Appendix
27
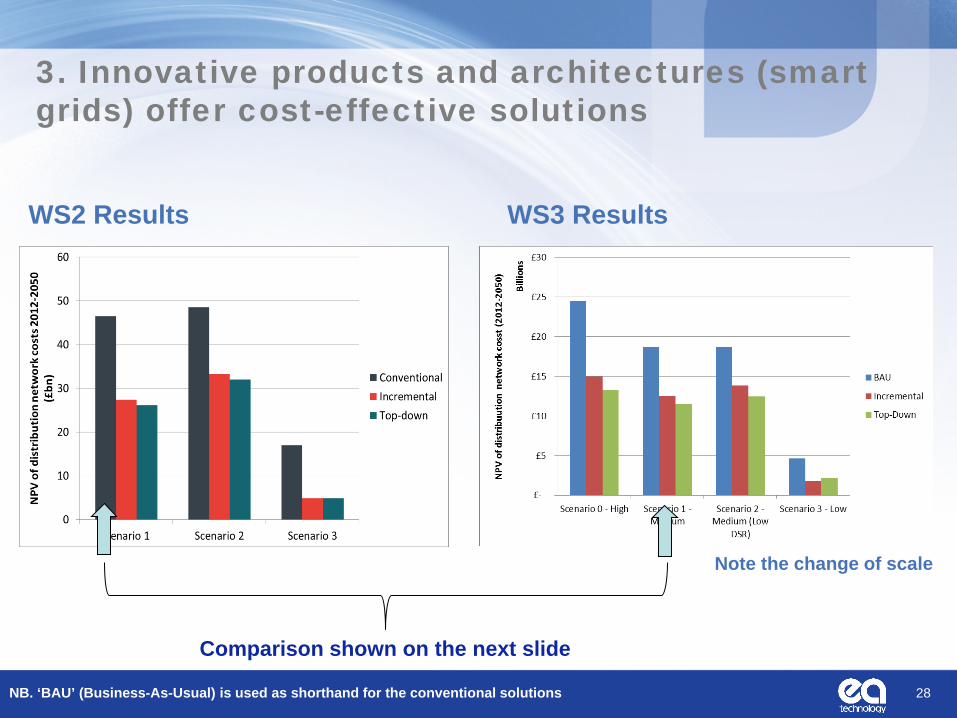
3. Innovative products and architectures (smart grids) offer cost-effective solutions
WS2 Results WS3 Results
28 NB. ‘BAU’ (Business-As-Usual) is used as shorthand for the conventional solutions
Comparison shown on the next slide
Note the change of scale
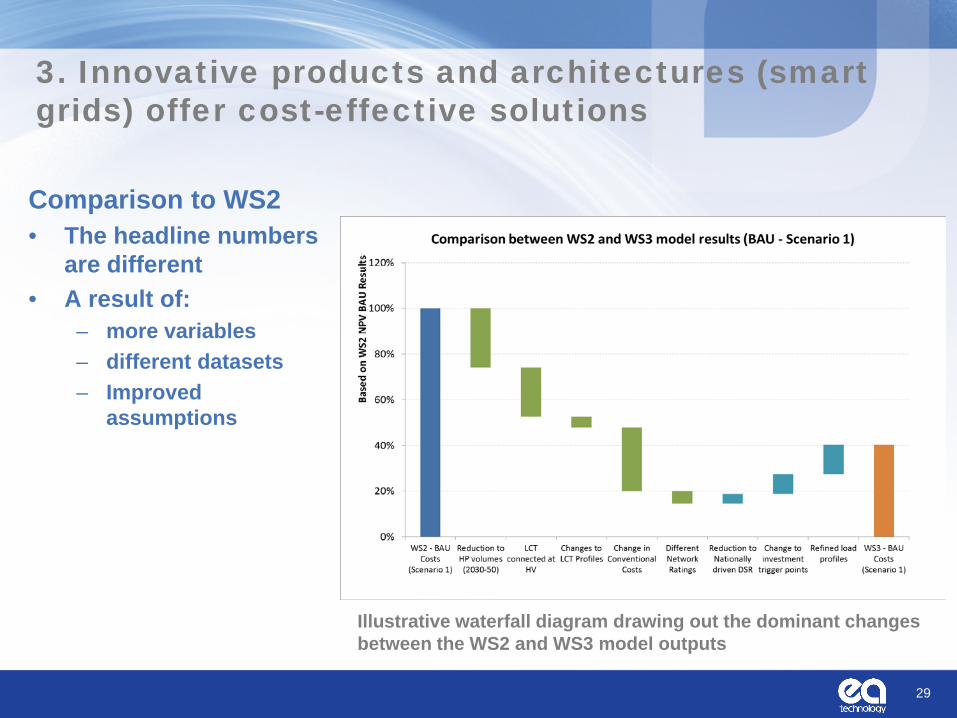
3. Innovative products and architectures (smart grids) offer cost-effective solutions
Comparison to WS2 • The headline numbers
are different • A result of:
– more variables – different datasets – Improved
assumptions
29
Illustrative waterfall diagram drawing out the dominant changes between the WS2 and WS3 model outputs
Related Documents