Virginia Commonwealth University Virginia Commonwealth University VCU Scholars Compass VCU Scholars Compass Theses and Dissertations Graduate School 2020 Assessing the feasibility of freshwater mussel restoration in Assessing the feasibility of freshwater mussel restoration in urban streams. urban streams. John-Reid Ryan Follow this and additional works at: https://scholarscompass.vcu.edu/etd Part of the Terrestrial and Aquatic Ecology Commons © The Author Downloaded from Downloaded from https://scholarscompass.vcu.edu/etd/6405 This Thesis is brought to you for free and open access by the Graduate School at VCU Scholars Compass. It has been accepted for inclusion in Theses and Dissertations by an authorized administrator of VCU Scholars Compass. For more information, please contact [email protected].

Welcome message from author
This document is posted to help you gain knowledge. Please leave a comment to let me know what you think about it! Share it to your friends and learn new things together.
Transcript
Virginia Commonwealth University Virginia Commonwealth University
VCU Scholars Compass VCU Scholars Compass
Theses and Dissertations Graduate School
2020
Assessing the feasibility of freshwater mussel restoration in Assessing the feasibility of freshwater mussel restoration in
urban streams. urban streams.
John-Reid Ryan
Follow this and additional works at: https://scholarscompass.vcu.edu/etd
Part of the Terrestrial and Aquatic Ecology Commons
© The Author
Downloaded from Downloaded from https://scholarscompass.vcu.edu/etd/6405
This Thesis is brought to you for free and open access by the Graduate School at VCU Scholars Compass. It has been accepted for inclusion in Theses and Dissertations by an authorized administrator of VCU Scholars Compass. For more information, please contact [email protected].

P a g e |1
©John-ReidRyan2020AllRights
Reserved

P a g e |2
Assessingthefeasibilityoffreshwatermusselrestorationinurbanstreams.
AthesissubmittedinpartialfulfillmentoftherequirementsfortheDegreeofMasterofScienceinEnvironmentalStudiesatVirginiaCommonwealthUniversity
ByJohn-ReidRyan,B.S.EnvironmentalStudiesVirginiaCommonwealthUniversityCenterforEnvironmentalStudies,VirginiaCommonwealthUniversity,
ThesisAdvisor:PaulBukaveckasPh.D.Professor,VCUCenterforEnvironmentalStudies
VirginiaCommonwealthUniversityRichmond,Virginia
July,2020

P a g e |3
Acknowledgements
Iwouldliketothank my advisorPaulBukaveckasforhisextensivepatienceandadvicethat
movedtheprojectintherightdirection,aswellasfundingthisresearch. RachelMair,Amy
Maynard,BryceMaynard,BenDavisfromHarrisonLakeFishHatcheryforsupplyingAlewife
Floaterandadditionalguidance. TheRiceRiversResearchGrantorganizationforprovidedme
withfundingandsupportduring2019withIamverythankfulfor.MacLee,SpencerTassone,
andRachelHendersonfromtheVCUAnalyticalLabgreatlycontributedtothisprojectby
processingwaterqualitysamplesanddata. Additionally,JoeWoodandotherCBFstaffassisted
intheinitialliteraturereviewandmusselconferencethatgreatlyhelpedmegetthisproject
focusedandmovingearly.Dr.Vonesh,AlbertByers,ElizabethEdmondson,SuzanneKirk,Todd
Janeski,CaseyJohnsonandtheirinvolvementonNOAABivalveprojectatVCUhelpedmerefine
mypresentationofthisresearch.Also,FamilyandFriendswhoIdraggedouttohelpmewith
samplingsitesandGrandparentsforloaningmemetalstakestosecurecages,Icouldnothave
donethiswithoutyou.
P a g e |4
TableofContents
Abstract……………………………………………………………………………………………….5
Introduction…………………………………………………………………………………………6-9
Methods………………………………………………………………………………………………9-12
Results…………………………………………………………………………………………………12-15
Discussion……………………………………………………………………………………………15-17
Conclusion…………………………………………………………………………………………..17-18
References…………………………………………………………………………………………..19-22
Tables…………………………………………………………………………………………………..23-25
Figures………………………………………………………………………………………………….26-33

P a g e |5
Abstract
Themainobjectiveofthisstudywastodeterminewhetherintroducedfreshwater
mussels(Alewifefloater,Utterbackianaimplicata)cansurviveandgrowinurbanstreamsinthe
JamesRiverwatershed.AsecondaryobjectivewastoassessdifferencesinU.implicatasurvival
andgrowthofinthecontextofdifferingwaterqualityandfoodresourceconditionsamong
threeurbansitesandthreeruralsites.Resultsfromthisstudyshowlargedifferencesingrowth
andsurvivorshipofmusselsacrosssites.Highersurvivorshipwasobservedamongmussels
stockedintoruralstreams(35%and44%)incomparisontourbanstreams(3%,6%and14%).
Highmortalityinurbanstreamswaslargelyduetowashoutandburialofmussels.These
findingssuggestthatthe“flashy”hydrologytypicallyassociatedwithurbanstreamsisa
significantimpedimenttosuccessfulintroductionatthesesites.Highgrowthrateswere
observedinoneoftheruralstreams(HerringCreek:57mg/d),whereasgrowthrateswereless
than15mg/datallothersites.Foodresourcemetricsshowedstatisticallysignificant
differencesamongsiteswithhighervaluesofTSS,particledensity,organicmattercontentand
chlorophyll-acontentatruralsitesrelativetourbansites.Thesefindingssuggestthatrural
siteshadmorefavorablefoodresourcesthanruralstreams,thoughwedidnotfindthatfood
metricswereasignificantpredictorofvariationingrowthratesamongsites.Wedidnotfind
thatwaterqualitymetrics(temperature,dissolvedoxygen)wereasignificantpredictorof
variationinmusselgrowthrates.Overall,thesefindingssuggestthathydrologicconditionsin
urbanstreamsposeasignificantchallengetothesuccessfulreintroductiononnativemussels.
P a g e |6
Introduction
NorthAmericahasthelargestfreshwatermusseldiversityintheworld(Williamsetal.,
1993).Inadditiontobeingadiverseanduniquefauna,musselsprovideimportantecosystem
servicesbyremovingparticulatematterfromthewatercolumn(Vaughn,2018).Nutrients
containedinparticulatemattermaybestoredinmusselshellsandtissues,orexcretedas‘bio
deposits’(Vaughn,2018).Thetransferofnutrientsfromsuspendedparticulatematterto
benthicdepositsmakesmusselsanimportantlinkwithinnitrogenandphosphorouscyclesasit
increasesthelikelihoodthatnutrientswillbesequestered(throughin-streamburial)orlostvia
denitrification(Hoelleinetal.,2017).Priorworkonurbanriversshowedthatfreshwater
musselsstimulatemicrobialactivityanddenitrificationthroughwasteproduction.Hoelleinet
al.(2017)showedthatnitrogenuptakeanddenitrificationratesinsedimentalonewerearound
2%,whileratesinsedimentswithmusselswere8-12%.Ecosystemservicesprovidedby
freshwatermusselsmaybebeneficialtomitigatinganthropogenicpollutionofChesapeakeBay.
Humanactivitiessuchasagricultureandurbandevelopmentincreasesedimentandnutrient
transportviatributarystreamstransportingsedimenttotheBay(Eshleman&Sabo,2016).
Thesenon-pointsources,coupledwithpointsourceinputssuchaswastewatertreatment
plantshavedegradedwaterqualitywithintheBayanditstributaries(Eshleman&Sabo,2016).
ReducingsedimentandnutrientloadstotheBaytoimprovewaterclaritywilldependon
implementationofbestmanagementpracticesinuplandareasandtributarystreams
(McConnell,2017).
MusselpopulationshavedeclinedinmanywatershedsthroughouttheUnitedStates
overthepast50years(Williamsetal.,1993).TheNatureConservancyestimatesthat55%of
musselspeciesinNorthAmericahaveprogressedtoextinctionorimperiledstatus(Williamset
al.,1993).Declinesinmusselpopulationsarepartlyduetohabitatdegradationassociatedwith
landusechange(urbanizationandagriculture).Urbanstreamsareoftendevoidofmussel
populations,andinunrestoredurbanstreamstheirbiodiversitycanbe47%lessthanreference
streams(Smucker&Detenbeck,2014).Recentadvancesintheabilitytopropagatemussels
providesanopportunitytorestorepopulations,howeverlittleisknownregardingin-stream
conditionsthatwouldinfluencethesuccessofrestoration(e.g.foodandwaterquality
P a g e |7
conditions).Generally,musselsrequirewell-oxygenatedflowingwaterwithsuitablesubstrate
conditions(amixtureofsand,gravelandsilt;NRCS,2007).Foodquantityandqualityislikelyto
bedependentontheabundanceofsuspendedparticulatematteranditscomposition,
includingcontributionsfromsuspendedalgae(JeagerandCherry,1994).Thepresenceof
impoundments,suchasstormwaterretentionponds,mayincreasefoodquantityandquality
astheytrapinorganicparticulatematter,andmaypromotegrowthofphytoplankton(Winter
andDuthie1998).Furtherresearchisneededtodocumentthesuccessofmusselintroduction
effortsindiversestreamhabitatconditionstobetterinformmanagementefforts.
Conditionsfoundinurbanstreamsmaypresentspecialchallengestomusselrestoration
(Walshetal.,2016).Theseinclude“flashy”streamflowconditionsduetorapidrunofffrom
impervioussurfaces(Nedeauetal.,2003;Walshetal.,2016).Highdischargeeventsalterstream
morphologyduetoincreasedbankerosionwhichcausesunstablesedimentsandburialof
mussels(Walshetal.,2016).Urbanstreamsarealsosubjecttoscouringeventswherethe
streambottomisremoved(Walshetal.,2016).Thisremovessubstratesincludingleaflitterand
organicdepositsthatmakeupmusselhabitat(Walshetal.,2016).Theabsenceofmusselsin
urbanstreamsmayalsobefromyearsofpoorwaterqualityconditions(lowdissolvedoxygen,
toxicpollutants)thatwereprevalentpriortopassageoftheCleanWaterAct.
TheChesapeakeBayhassufferedfromeutrophicationandsedimentpollutionfora
numberofdecades.Inordertoproperlymanagethisissue,thereisaneedforrestoration
practicesthatreducesedimentandnutrientloads.Thisisaccomplishedbyimplementingbest
managementpractices(BMPs).Improvementsinstreamconditionhavebeenbroughtaboutby
avarietyofmanagementpracticesthatseektoreduceurbanrunoff(e.g.,viastormwater
retention),improvewaterquality(e.g.,bypreventingCSOevents),and,insomecasesby
undertakingstreamrestorationprojects,whichreshapethestreamchanneltoreduceerosion
andwithstand“flashy”hydrology(NRCS,2007).Typically,streamrestorationprojectsfocuson
thegeomorphologyofthechannelanddonotconsiderthepotentialforbiologicalrestoration
asameanstoimproveecosystemservices(NRCS,2007).Incontrast,biologicalrestorationis
usedwithintheBayitselftoachievewaterqualitytargets.Forexample,theChesapeakeOyster
BMP(Cornwelletal.,2016)wasestablishedonthebasisthatoystersfilterparticulatematter
P a g e |8
fromthewatercolumnandincreasenitrogenremovalthroughenhanceddenitrification
(Cornwelletal.,2016).ResearchfromthePartnershipforDelawareEstuary(PDE)hasshown
thattheclearanceandfiltrationratesoffreshwatermusselsrivalthatofoysters.Kreegeretal.
(2017)reportedthatmass-specificclearanceratesforfreshwatermusselsrangedfrom0.5to
3.4lh-1g-1,whileEasternOystershadaclearancerateof6to6.4lh-1g-1.Thesamestudy
suggestedthatmusselbedshaveahigherclearanceratethanoysterbeds,duetohigher
populationdensity.Thecriticalecosystemservicesthatoysterscontributetotheenvironment
arepotentiallythesameecosystemservicesthatfreshwatermusselscouldprovideinupstream
areas.Thesefindingssuggestthatstockingfreshwatermusselsintributarystreamsmaybea
usefulmeansforreducingnutrientandsedimentinputstotheBay.
MusselrestorationeffortshaveoccurredthroughouttheAtlanticslope,thoughthese
typicallyfocusonspeciesthatareapriorityforconservation,andinhighqualityhabitats.In
additiontostateandfederalfacilities,someenvironmentalgroupshavealsobegunmussel
restorationactivitiestoaugmentthepopulationofAlewifeFloater,Utterbackiaimplicata,
mussels(DelawareEstuary,2016).TheNationalStrategyforConservingFreshwaterMussels
enumeratesseveralgoalsforpropagatingmusselsandunderstandingwhatfactorsdegradethe
population(Haag&Williams,2014).However,thestrategyprovideslittleguidanceastowhere
therestorationsshouldoccur(Haag&Williams,2014).Manystockingprogramsfocusonlyon
augmentingpopulation,andonlyinareaswhereothermembersofthesamespeciescanbe
found.Asaresult,propagationprogramsleaveoutstreamswheremusselsareorwere
historicallyabsent,andwhichmaybenefitfrommusselrestorationtoimprovelocaland
downstreamwaterquality.Dataareneededtoassesstheviabilityofstockingmusselsinto
impairedstreamssuchasthosefoundinurbanenvironmentsandtobetterunderstandthe
factorswhichaffecttheirperformance(e.g.,survivorship,growthrate).
ObjectivesandHypothesis
Mythesisprojectfocusedonthequestion:Canfreshwatermusselsberestoredinurban
streams?Toaddressthisquestion,A.implicatawerestockedinthreeurbanstreamsinthe
metroareaofRichmond,Virginia.Asacontrolforcomparison,A.implicatawerestockedintwo
ruralstreamsandahatcherypond.Allofthestreamsusedinthisstudyaretributariesofthe
P a g e |9
JamesRiver.Oneoftheruralstreams(HerringCreek)isalsothesourceofwaterforthefish
hatcherypond.Datawerecollectedtoassessmusselsurvivorshipandgrowth(massand
length)at1-2monthintervals.Theprimaryobjectivewastodeterminewhetherfreshwater
musselscansurviveandgrowinurbanstreams.Asecondaryobjectivewastoassessinter-
streamdifferencesinsurvivorshipandgrowthinrelationtoin-streamhabitatconditionssuch
aswaterquality,foodquantity,andfoodquality.Waterqualitymetricsofinterestincluded
watertemperature,pHanddissolvedoxygen.Inurbanstreams,lowpHandoxygenconditions
mayarisefromchronicorepisodicinputsofwastewater(e.g.,CSOevents),whichmayhave
detrimentaleffectsonmusselgrowthandsurvivorship.Temperaturewouldgenerallybe
expectedtohaveapositiveeffectongrowthrates,thoughhightemperatureconditions(e.g.,in
theabsenceofaripariancanopy)maybedetrimental.MetricsoffoodquantitysuchasTotal
SuspendedSolids(TSS)orparticledensity,maybepositivelyrelatedtogrowthandsurvivorship,
thoughinurbanstreams,bedandbankerosionmaysuspendedmaterialsoflowfoodquality
(e.g.,sand,siltandclay).Therefore,measuresoffoodquality(organicmatterandchlorophyll-a
content)werealsousedtoassesstheirrelationshiptogrowthrates.
Methods
JuvenileA.implicatamussels(meanlength42mmSTDdependentonsite)wereplaced
incagesinstalledineachofthreeurbanstreamsandtwonon-urbanstreams.AlewifeFloater
musselswerechosenduetotheiravailabilityfromHarrisonLakeNationalFishHatchery
(CharlesCity,VA),becausetheyarenativetotheregionandhavebeenusedinprior
restorationprojects(Kreegeretal.,2017).Themusselswereindividuallytaggedandmonitored
onamonthlybasisforsurvivorshipandgrowth.Waterquality,substratecharacteristicsand
foodqualityweredocumentedforeachstreamtointerpretdifferencesinsurvivorshipand
growth.Thesamedatawerecollectedfromcontrolsites:arearingpondattheHarrisonLake
FishHatchery,andtwonon-urbanstreams(KimagesCreek,HerringCreek).TheHatcherypond
waschosenasacontrolsiteasithasbeenusedtosuccessfullyrearmusselsforlocalstocking
efforts.HerringCreekandKimagesCreekarelocatednearbyandwerechosenbasedontheir
rurallocationandaccess.KimagesCreekislocatedattheVCURiceRiversCenterandhasa
long-termrecordofbi-monthlywaterqualitymonitoring.

P a g e |10
TheRichmondurbanstreamsselectedforthisstudywerepartofanetworkof7sites
currentlymonitoredbyVCU.Bi-monthlydataarecollectedtomeasuredischargeandwater
quality(temperature,pH,conductivity,turbidity,dissolvedoxygenandTSS).Individualstreams
werechosenbasedontheiraccessibilityandpriordatacharacterizinghydrology,
geomorphologyandwaterquality.Habitatconditions(hydrology)andfoodavailability
(quantityandqualityofparticulatematter)wereexpectedtodifferamongthestudysites.
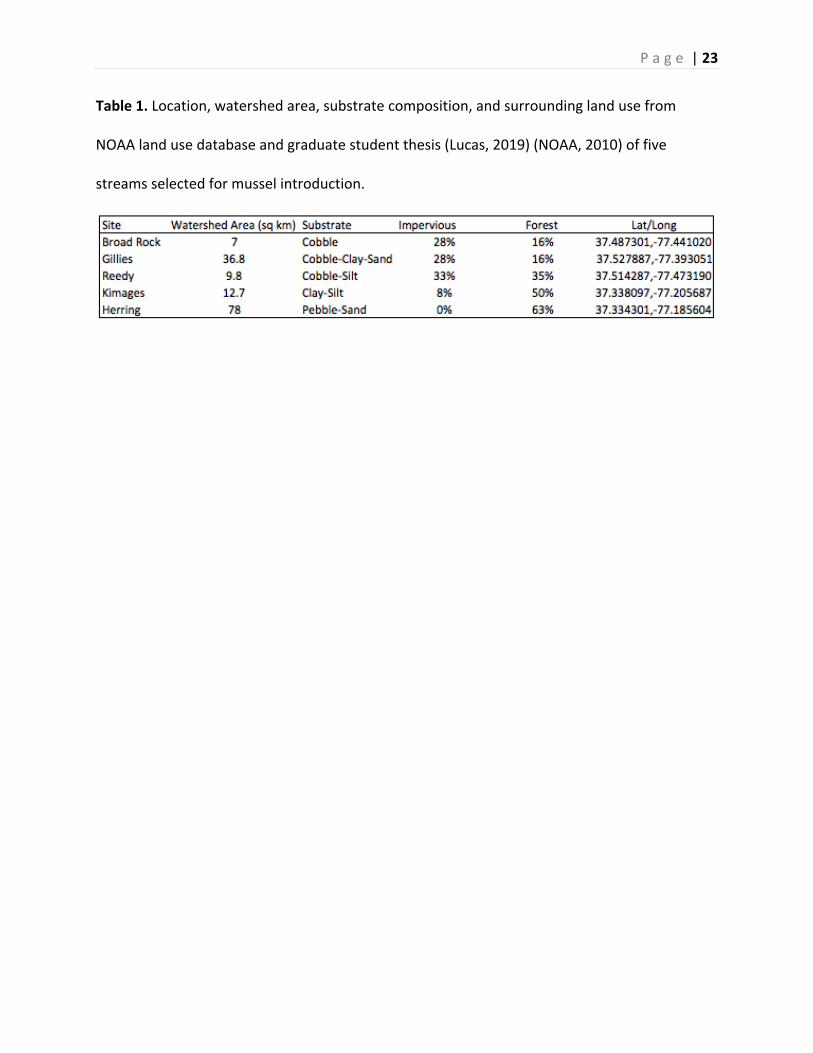
BroadRockCreek,ReedyCreekandGilliesCreekdrainpredominantlyurbanareaswithahigh
proportionofimpervioussurfacesandlowproportionofforestedareasintheirwatershed
(Table1).AtBroadRock,thepresenceofanupstreamimpoundmentwasexpectedtoprovide
morestableflowconditions,andpotentiallyimprovefoodqualitybytrappingsedimentand
allowingforphytoplanktonproductionthatcouldhavepossiblyimitatedimpoundmentsat
HerringCreek.Itwasexpectedfromlandusedatathatruralstreamswouldharborimproved
musselsurvivalandgrowthrates,buttheriseinimpervioussurfacesatKimagescreekcould
showvariationinmusselsurvivorshipandgrowthbetweenruralsites.
In-StreamDeploymentofMussels
JuvenileA.implicatamusselswerestockedatallsitesinApril-May2019withstocking
ratesrangingfrom106to129persite.Supplementalstockings(20-60mussels)werecarried
outatsomesitesfollowinglossofindividualsduetowashout.Atotalof880musselswere
usedinthisstudy.Sixenclosures(Figure1)containing~19individualsperenclosurewere
placedateachsite.Streamenclosureswereconstructedfromplasticcrates(approx.25x25x
25cm)withplasticwiremesh(1cm)addedalongthesides(2layers),bottom(3layers)andtop
(1layer).Twometalpoleswithflattopscommonlyusedtosecuremulchbarrierswereplaced
atthefronttwocornerstosecuretheenclosuretothestreambottom.Musselenclosuresat
thefishhatcherysiteconsistedoffloatingbaskets(Pattersonetal.2018).Threeenclosures
containing40musselsperbasketwereplacedintoapondattheHarrisonLakeNationalFish
Hatchery.AllmusselsweregivenauniqueIDtag(number1to1,300)ontheirshellbelowthe
umbousingaZinglaserengraver.

P a g e |11
DataCollection
Survivorshipandgrowthweremonitoredat1-2monthintervalsfromthetimeof
stocking(April-May2019)totheconclusionoftheexperiment(December2019).Survivorship
wasdeterminedfromthenumberofalivemusselsinallenclosuresatasiteforagivencensus
date.Separatetallieswererecordedfordeadmussels(recoveryofemptyshells)vs.lost
mussels(arisingfromlossofcagesormissingmusselswithinrecoveredcages).Duetolossof
enclosures,andinsomecases,thelownumberofsurvivingindividualsperenclosure,wedid
notderiveseparateestimatesofsurvivalforeachenclosure.Length(mm)andweight(wet
mass;g)weremeasuredforallindividuals.Growthrates(mm/dandmg/d)werederivedfor
eachmonitoringintervalbasedonrepeatmeasurementsoftaggedindividuals.Inthelater
stagesoftheexperiment,sometagsbecameunreadable.Werecordedlengthandweightfor
theseunknowns,andderivedpopulation-basedestimatesofgrowthratebasedonthechange
inmeanlengthandmassduringthemonitoringinterval.Waterqualitydata(temperature,pH,
conductivity,turbidityanddissolvedoxygen)weremeasuredinconjunctionwithmonitoringof
musselsusingaYSIProDSSsonde.Watersampleswerecollectedtoassessfoodquantityand
qualitybasedontotalsuspendedsolids(TSS),organicmatter(OM)content,andchlorophyll-a
(CHLa)content.SampleanalysisfollowedprotocolsdevelopedfortheVCUEnvironmental
AnalysisLab,astate-accreditedwaterqualitytestingfacility.SamplesforTSSandCHLawere
filteredthroughaGF/Aglassfiberfilters(0.5-μmnominalporesize).FiltersforCHLaanalyses
wereextractedfor18hinbufferedacetoneandanalyzedonaTurnerDesignTD-700
Fluorometer.FiltersforTSSweredriedat60oCfor48handanalyzedusingaPerkin-ElmerCHN
Analyzertodeterminetheorganicmattercontent,expressedasparticulateorganicC(POC).
Particlesizeanddensityweremeasuredbetween2.16and60µmusingaCoulterCounter
Multisizer4e(BeckmanCoulter,Pasadena,California).SampleswerepreservedwithLugol’s
iodinesolutionandrefrigerated.Samplesweredilutedwithelectrolytesolutionstartingwith
5mlofsampleto5mlofelectrolyteandrepeatedthreetimesforarangeofconcentrations(2x,
4x,8x,and16x).TheCoulterCountermeasuresallparticleswithinthespecifiedsizerange
inclusiveofcells(bacteria,phytoplankton)andnon-livingparticulates(e.g.,silt,clay,etc.)with
resultsreportedasnumberofparticlesperunitvolume.
P a g e |12
StatisticalAnalysis
Waterqualitydataandmetricsoffoodquantityandqualitywereanalyzedusingaone-
wayANOVAtodeterminewhetherdifferencesamongsiteswerestatisticallysignificant.
Statisticalanalysiswaslimitedtothe4sitesforwhichbi-monthlydatawereavailable;Reedy
Creek,GilliesCreek,BroadRockCreekandKimagesCreek.
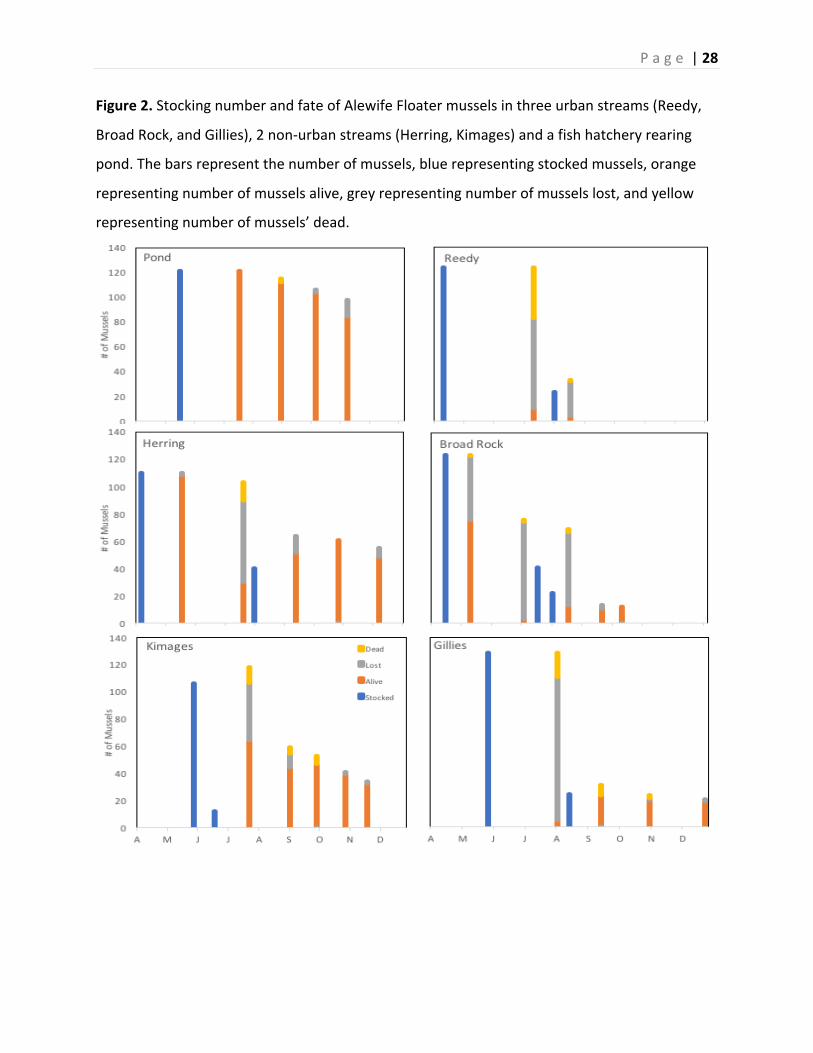
ResultsSurvivorshipofmusselsvariedamongthe6sites(Figure2).Highestsurvivorshipwas
observedatthefishhatcherypondwhere88%ofthestockedmusselssurvivedthroughtheend
oftheexperiment(May-November).Onlyasmallnumber(N=3)werelostduetomortality
(presenceofdeadmussels),whileotherswereunaccountedforanddesignatedaslost.
Survivorshipattheruralsites(KimagesandHerringCreeks)was35%and44%,respectively.At
thesesites,relativelyfewmusselswerelostduetomortality(Kimages=21individuals;Herring
=13individuals),butalargernumberofindividuals(40-60musselspersite)werelostdueto
washoutofcagesfollowingaJulystormevent.Lowestsurvivorshipwasobservedamongthe
threeurbansites.AtReedyCreek,only4musselssurvivedthroughmid-August(3%
survivorship),whileatBroadRockandGilliesCreek,thenumberofsurvivingmusselswas12
and20individuals(6%and14%survivorship,respectively).Attheurbansites,themajorityof
thedecline(84%)wasduetolossofcageseitherthroughwashoutorburial,thoughhigher
ratesofmortalitywerealsoobserved(Reedy=42individuals,Gillies=28individuals).
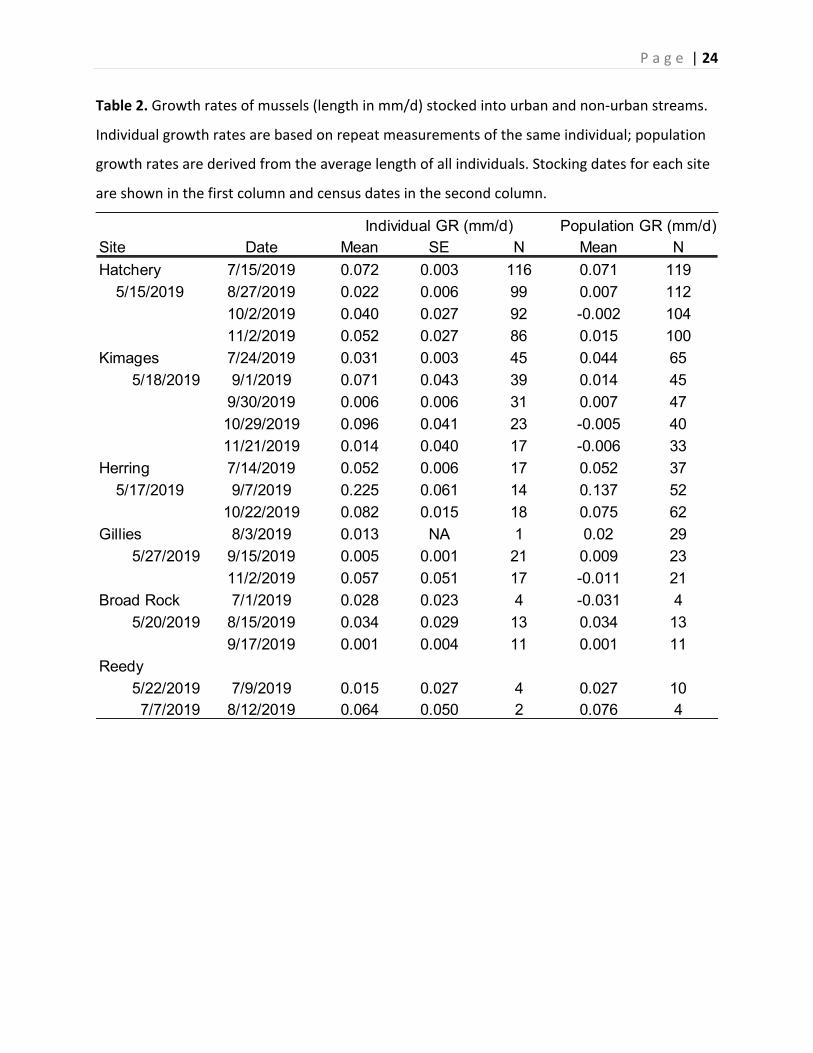
Length-basedgrowthratesvariedseasonallyandamongsites(Table2;Figure3).
Highestindividual-basedgrowthrates(0.23±0.06mm/d)weremeasuredinHerringCreek
duringJulytoSeptember.Averagegrowthratesatthissitewere0.093mm/dacrossallcensus
periods.Bycomparison,growthratesatthehatcherypondandKimagesCreekwere0.047
mm/dand0.044mm/d,respectively.ThehighgrowthratesatHerringCreekcorrespondtoan
increaseinlengthof31%(from45.4±0.3mmto59.5±0.8mm)overthe5-monthperiod
(May-October).MusselsstockedatthehatcherypondandKimagesCreekincreasedinlengthby
10%and9%,(respectively)overthesameperiod.Thelownumberofsurvivingindividuals
limitedthenumberofdatesforwhichgrowthratescouldbecalculatedattheurbansites.
Averagegrowthrateswereloweramongtheurbanstreamsincomparisontothenon-urban
sites:0.025mm/d(Gillies),0.021mm/d(BroadRock)and0.015mm/d(Reedy).
P a g e |13
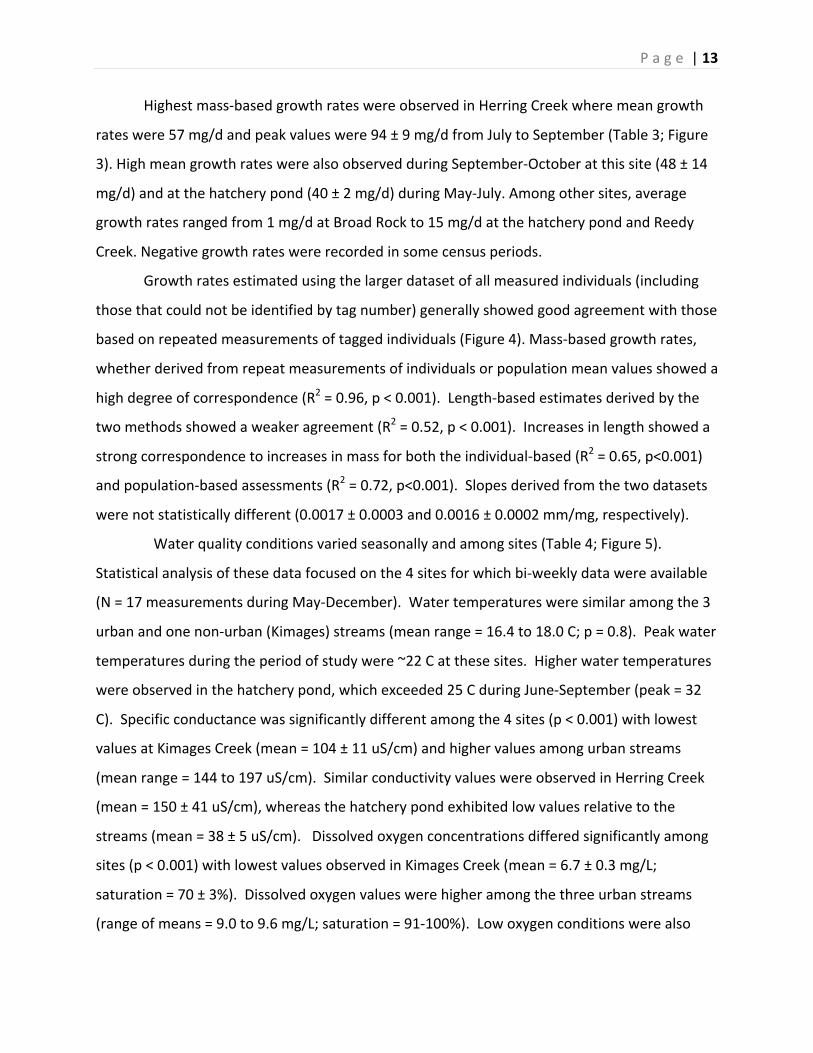
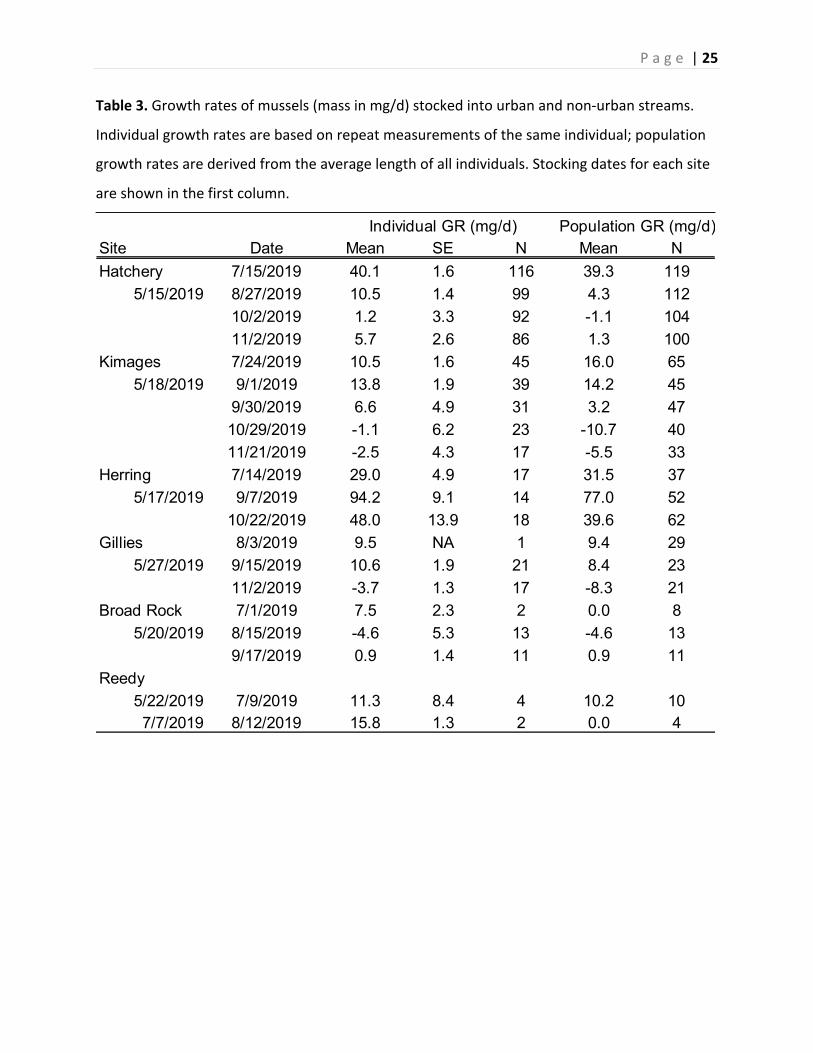
Highestmass-basedgrowthrateswereobservedinHerringCreekwheremeangrowth
rateswere57mg/dandpeakvalueswere94±9mg/dfromJulytoSeptember(Table3;Figure
3).HighmeangrowthrateswerealsoobservedduringSeptember-Octoberatthissite(48±14
mg/d)andatthehatcherypond(40±2mg/d)duringMay-July.Amongothersites,average
growthratesrangedfrom1mg/datBroadRockto15mg/datthehatcherypondandReedy
Creek.Negativegrowthrateswererecordedinsomecensusperiods.
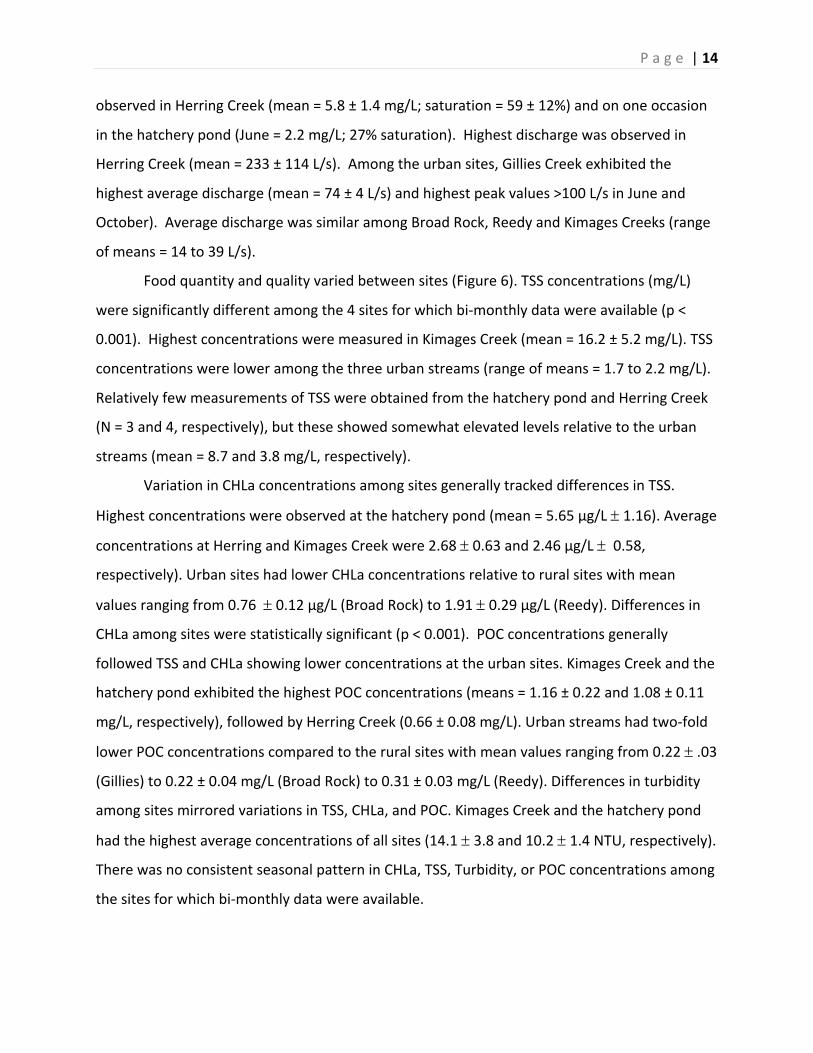
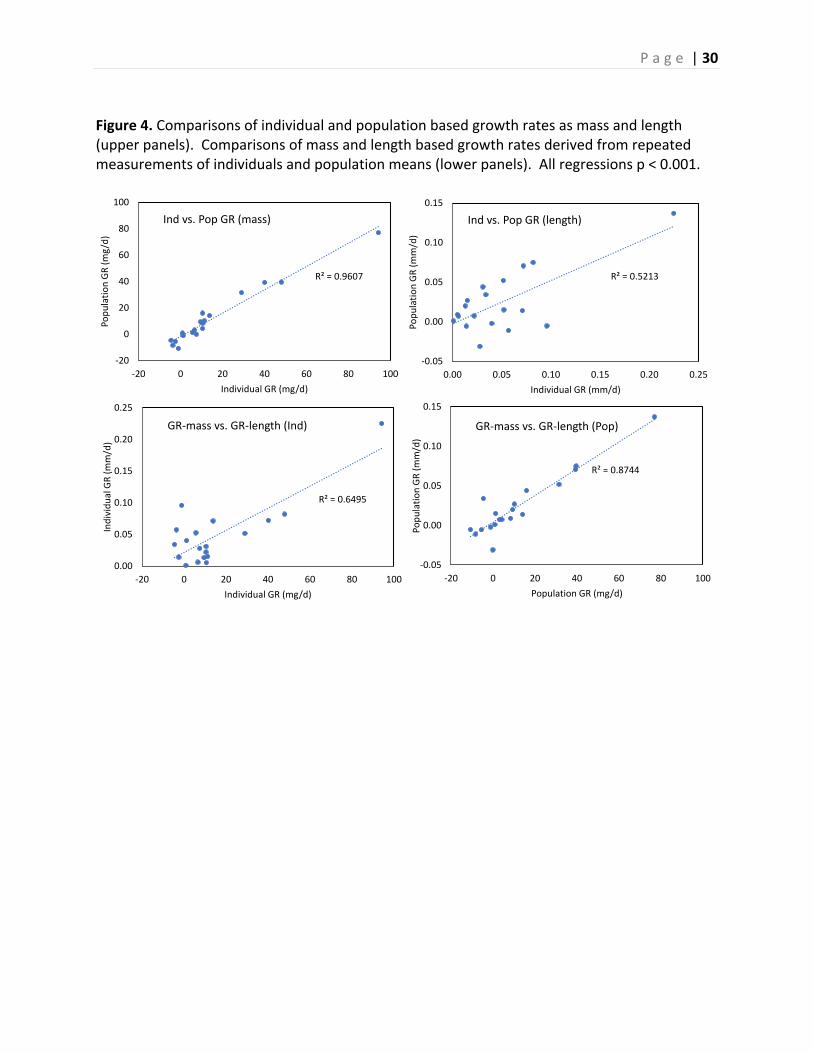
Growthratesestimatedusingthelargerdatasetofallmeasuredindividuals(including
thosethatcouldnotbeidentifiedbytagnumber)generallyshowedgoodagreementwiththose
basedonrepeatedmeasurementsoftaggedindividuals(Figure4).Mass-basedgrowthrates,
whetherderivedfromrepeatmeasurementsofindividualsorpopulationmeanvaluesshoweda
highdegreeofcorrespondence(R2=0.96,p<0.001).Length-basedestimatesderivedbythe
twomethodsshowedaweakeragreement(R2=0.52,p<0.001).Increasesinlengthshoweda
strongcorrespondencetoincreasesinmassforboththeindividual-based(R2=0.65,p<0.001)
andpopulation-basedassessments(R2=0.72,p<0.001).Slopesderivedfromthetwodatasets
werenotstatisticallydifferent(0.0017±0.0003and0.0016±0.0002mm/mg,respectively).
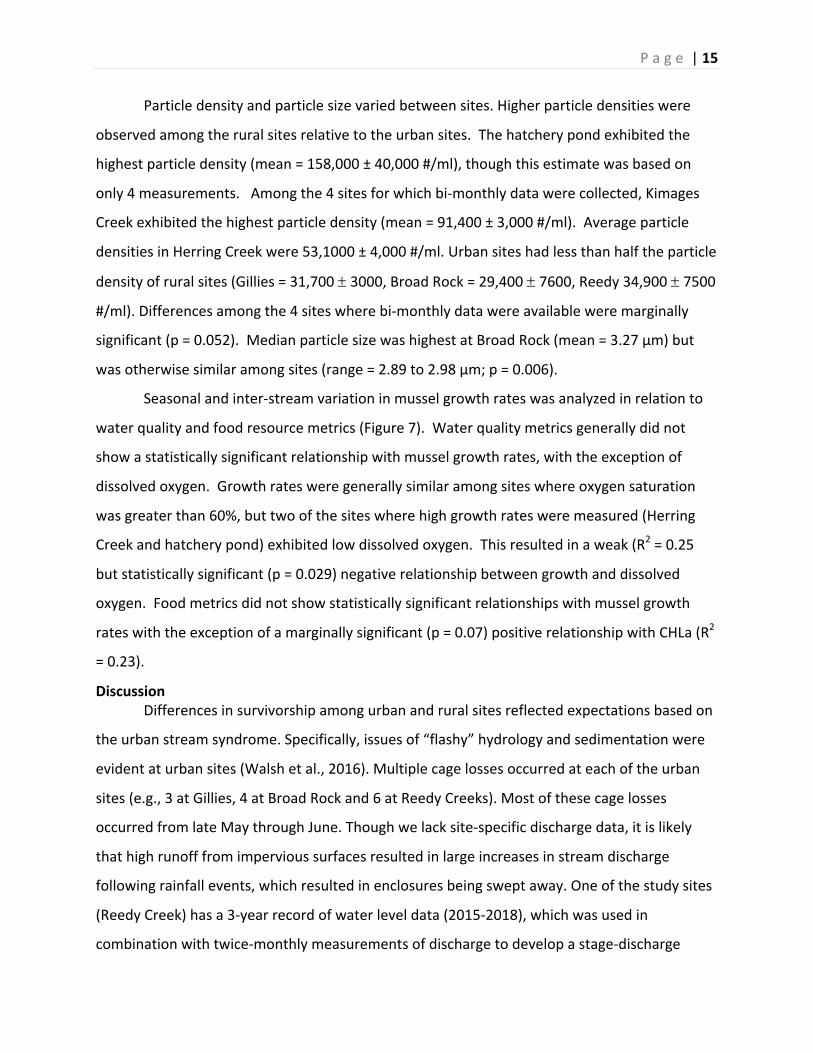
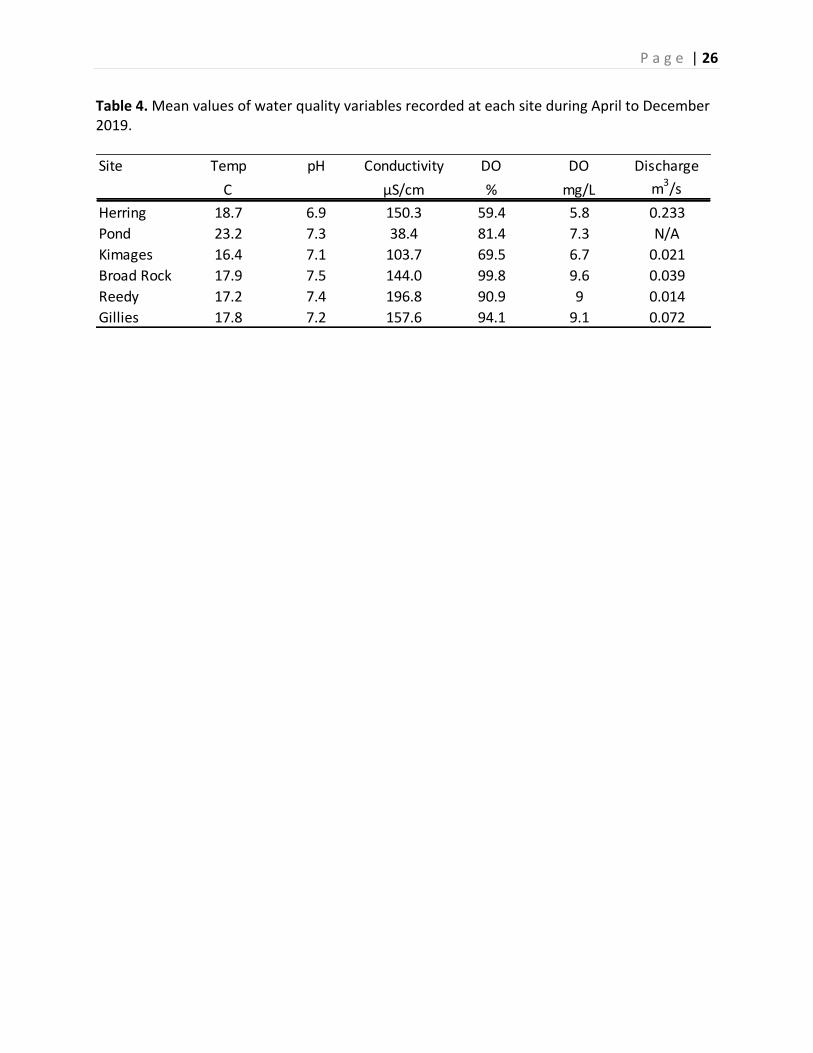
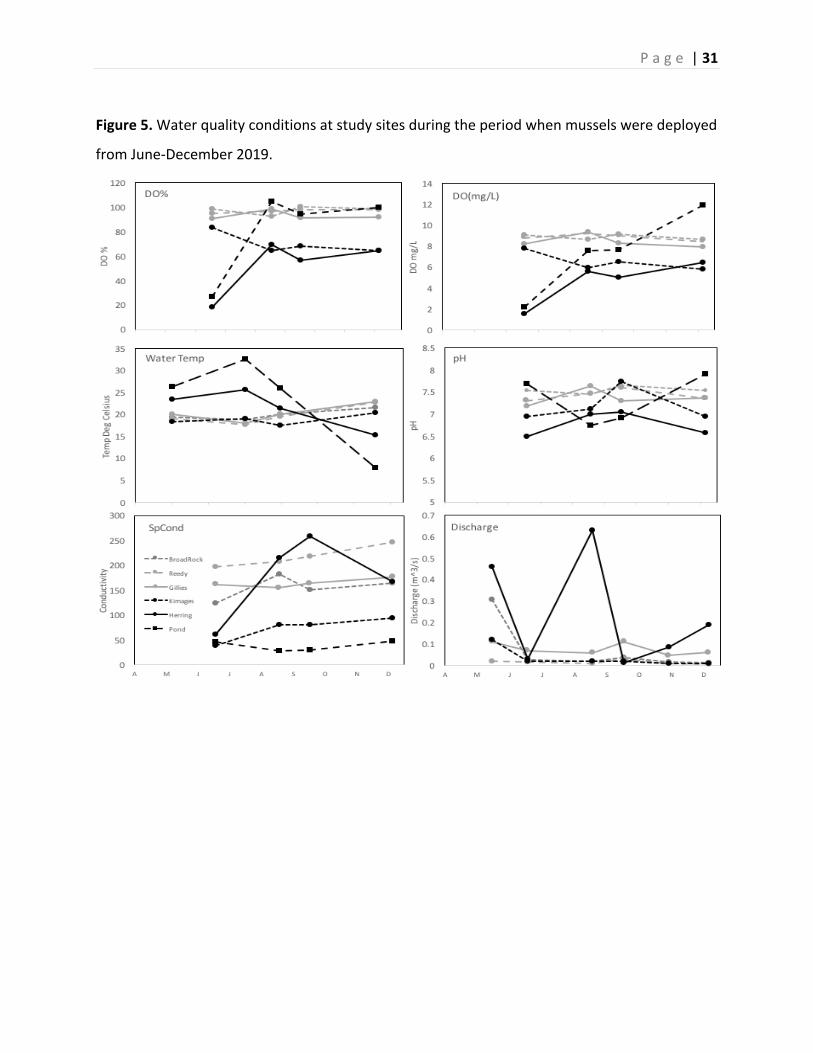
Waterqualityconditionsvariedseasonallyandamongsites(Table4;Figure5).
Statisticalanalysisofthesedatafocusedonthe4sitesforwhichbi-weeklydatawereavailable
(N=17measurementsduringMay-December).Watertemperaturesweresimilaramongthe3
urbanandonenon-urban(Kimages)streams(meanrange=16.4to18.0C;p=0.8).Peakwater
temperaturesduringtheperiodofstudywere~22Catthesesites.Higherwatertemperatures
wereobservedinthehatcherypond,whichexceeded25CduringJune-September(peak=32
C).Specificconductancewassignificantlydifferentamongthe4sites(p<0.001)withlowest
valuesatKimagesCreek(mean=104±11uS/cm)andhighervaluesamongurbanstreams
(meanrange=144to197uS/cm).SimilarconductivityvalueswereobservedinHerringCreek
(mean=150±41uS/cm),whereasthehatcherypondexhibitedlowvaluesrelativetothe
streams(mean=38±5uS/cm).Dissolvedoxygenconcentrationsdifferedsignificantlyamong
sites(p<0.001)withlowestvaluesobservedinKimagesCreek(mean=6.7±0.3mg/L;
saturation=70±3%).Dissolvedoxygenvalueswerehigheramongthethreeurbanstreams
(rangeofmeans=9.0to9.6mg/L;saturation=91-100%).Lowoxygenconditionswerealso
P a g e |14
observedinHerringCreek(mean=5.8±1.4mg/L;saturation=59±12%)andononeoccasion
inthehatcherypond(June=2.2mg/L;27%saturation).Highestdischargewasobservedin
HerringCreek(mean=233±114L/s).Amongtheurbansites,GilliesCreekexhibitedthe
highestaveragedischarge(mean=74±4L/s)andhighestpeakvalues>100L/sinJuneand
October).AveragedischargewassimilaramongBroadRock,ReedyandKimagesCreeks(range
ofmeans=14to39L/s).
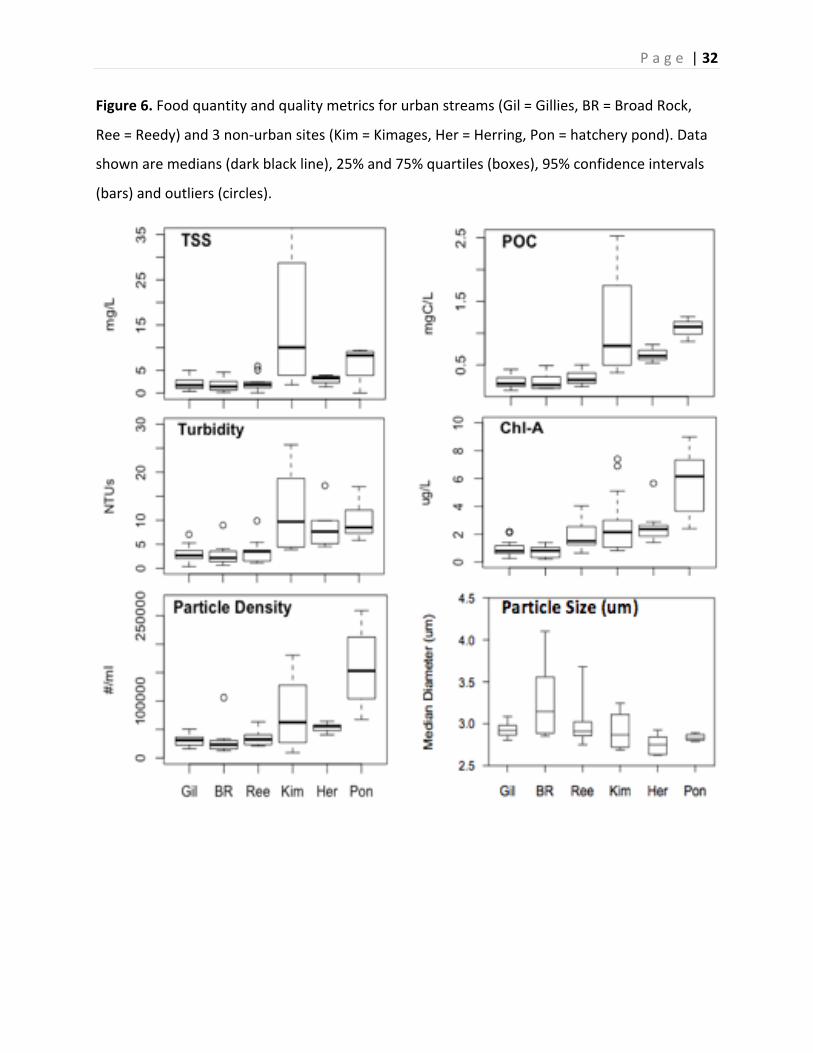
Foodquantityandqualityvariedbetweensites(Figure6).TSSconcentrations(mg/L)
weresignificantlydifferentamongthe4sitesforwhichbi-monthlydatawereavailable(p<
0.001).HighestconcentrationsweremeasuredinKimagesCreek(mean=16.2±5.2mg/L).TSS
concentrationswereloweramongthethreeurbanstreams(rangeofmeans=1.7to2.2mg/L).
RelativelyfewmeasurementsofTSSwereobtainedfromthehatcherypondandHerringCreek
(N=3and4,respectively),buttheseshowedsomewhatelevatedlevelsrelativetotheurban
streams(mean=8.7and3.8mg/L,respectively).
VariationinCHLaconcentrationsamongsitesgenerallytrackeddifferencesinTSS.
Highestconcentrationswereobservedatthehatcherypond(mean=5.65µg/L±1.16).Average
concentrationsatHerringandKimagesCreekwere2.68±0.63and2.46µg/L±0.58,
respectively).UrbansiteshadlowerCHLaconcentrationsrelativetoruralsiteswithmean
valuesrangingfrom0.76±0.12µg/L(BroadRock)to1.91±0.29µg/L(Reedy).Differencesin
CHLaamongsiteswerestatisticallysignificant(p<0.001).POCconcentrationsgenerally
followedTSSandCHLashowinglowerconcentrationsattheurbansites.KimagesCreekandthe
hatcherypondexhibitedthehighestPOCconcentrations(means=1.16±0.22and1.08±0.11
mg/L,respectively),followedbyHerringCreek(0.66±0.08mg/L).Urbanstreamshadtwo-fold
lowerPOCconcentrationscomparedtotheruralsiteswithmeanvaluesrangingfrom0.22±.03
(Gillies)to0.22±0.04mg/L(BroadRock)to0.31±0.03mg/L(Reedy).Differencesinturbidity
amongsitesmirroredvariationsinTSS,CHLa,andPOC.KimagesCreekandthehatcherypond
hadthehighestaverageconcentrationsofallsites(14.1±3.8and10.2±1.4NTU,respectively).
TherewasnoconsistentseasonalpatterninCHLa,TSS,Turbidity,orPOCconcentrationsamong
thesitesforwhichbi-monthlydatawereavailable.
P a g e |15
Particledensityandparticlesizevariedbetweensites.Higherparticledensitieswere
observedamongtheruralsitesrelativetotheurbansites.Thehatcherypondexhibitedthe
highestparticledensity(mean=158,000±40,000#/ml),thoughthisestimatewasbasedon
only4measurements.Amongthe4sitesforwhichbi-monthlydatawerecollected,Kimages
Creekexhibitedthehighestparticledensity(mean=91,400±3,000#/ml).Averageparticle
densitiesinHerringCreekwere53,1000±4,000#/ml.Urbansiteshadlessthanhalftheparticle
densityofruralsites(Gillies=31,700±3000,BroadRock=29,400±7600,Reedy34,900±7500
#/ml).Differencesamongthe4siteswherebi-monthlydatawereavailableweremarginally
significant(p=0.052).MedianparticlesizewashighestatBroadRock(mean=3.27µm)but
wasotherwisesimilaramongsites(range=2.89to2.98µm;p=0.006).
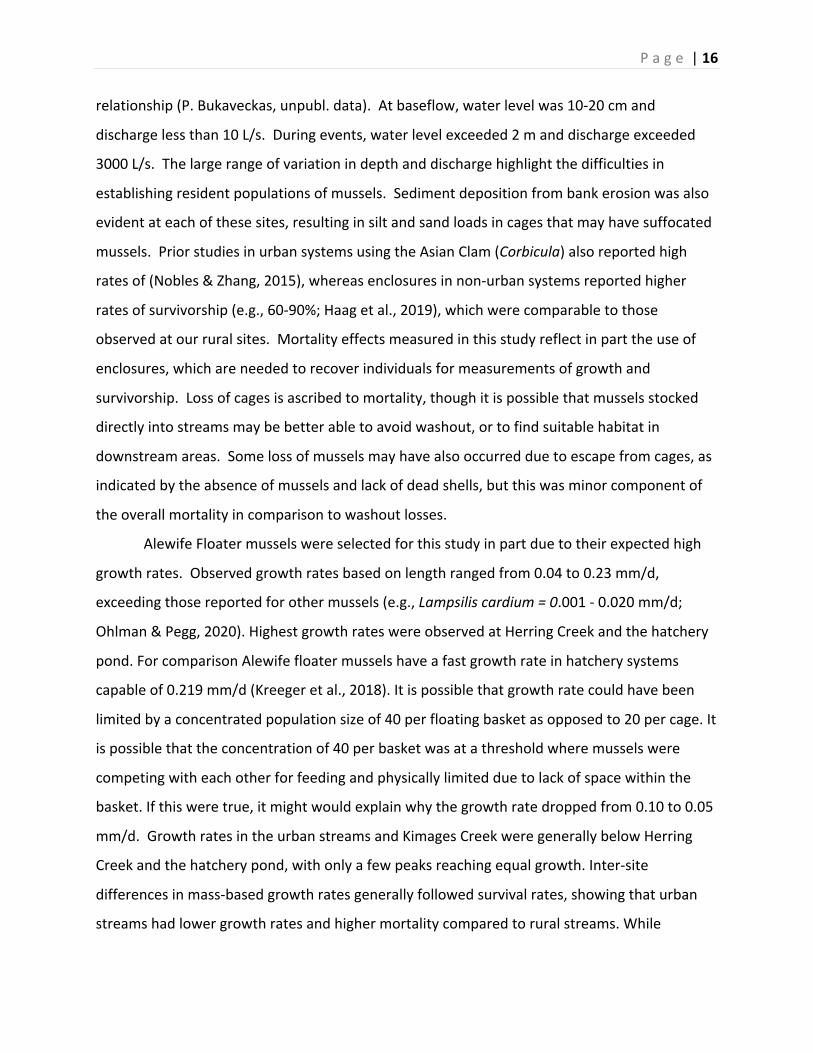
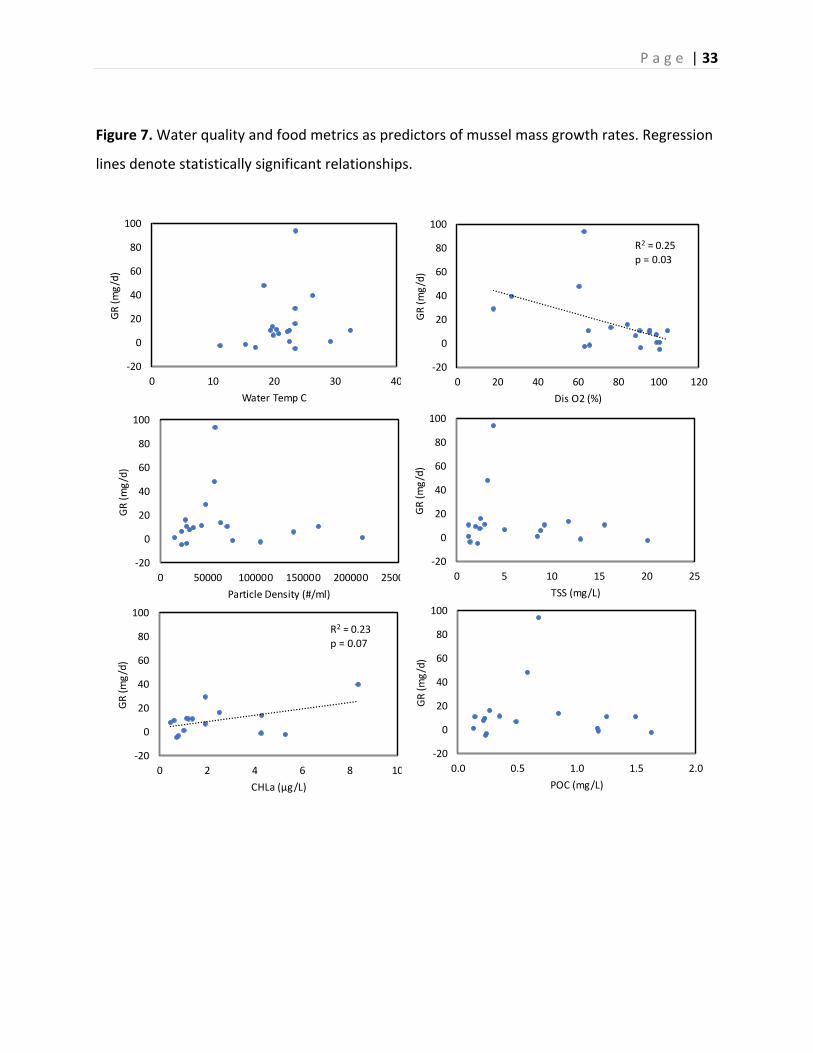
Seasonalandinter-streamvariationinmusselgrowthrateswasanalyzedinrelationto
waterqualityandfoodresourcemetrics(Figure7).Waterqualitymetricsgenerallydidnot
showastatisticallysignificantrelationshipwithmusselgrowthrates,withtheexceptionof
dissolvedoxygen.Growthratesweregenerallysimilaramongsiteswhereoxygensaturation
wasgreaterthan60%,buttwoofthesiteswherehighgrowthratesweremeasured(Herring
Creekandhatcherypond)exhibitedlowdissolvedoxygen.Thisresultedinaweak(R2=0.25
butstatisticallysignificant(p=0.029)negativerelationshipbetweengrowthanddissolved
oxygen.Foodmetricsdidnotshowstatisticallysignificantrelationshipswithmusselgrowth
rateswiththeexceptionofamarginallysignificant(p=0.07)positiverelationshipwithCHLa(R2
=0.23).
DiscussionDifferencesinsurvivorshipamongurbanandruralsitesreflectedexpectationsbasedon
theurbanstreamsyndrome.Specifically,issuesof“flashy”hydrologyandsedimentationwere
evidentaturbansites(Walshetal.,2016).Multiplecagelossesoccurredateachoftheurban
sites(e.g.,3atGillies,4atBroadRockand6atReedyCreeks).Mostofthesecagelosses
occurredfromlateMaythroughJune.Thoughwelacksite-specificdischargedata,itislikely
thathighrunofffromimpervioussurfacesresultedinlargeincreasesinstreamdischarge
followingrainfallevents,whichresultedinenclosuresbeingsweptaway.Oneofthestudysites
(ReedyCreek)hasa3-yearrecordofwaterleveldata(2015-2018),whichwasusedin
combinationwithtwice-monthlymeasurementsofdischargetodevelopastage-discharge
P a g e |16
relationship(P.Bukaveckas,unpubl.data).Atbaseflow,waterlevelwas10-20cmand
dischargelessthan10L/s.Duringevents,waterlevelexceeded2manddischargeexceeded
3000L/s.Thelargerangeofvariationindepthanddischargehighlightthedifficultiesin
establishingresidentpopulationsofmussels.Sedimentdepositionfrombankerosionwasalso
evidentateachofthesesites,resultinginsiltandsandloadsincagesthatmayhavesuffocated
mussels.PriorstudiesinurbansystemsusingtheAsianClam(Corbicula)alsoreportedhigh
ratesof(Nobles&Zhang,2015),whereasenclosuresinnon-urbansystemsreportedhigher
ratesofsurvivorship(e.g.,60-90%;Haagetal.,2019),whichwerecomparabletothose
observedatourruralsites.Mortalityeffectsmeasuredinthisstudyreflectinparttheuseof
enclosures,whichareneededtorecoverindividualsformeasurementsofgrowthand
survivorship.Lossofcagesisascribedtomortality,thoughitispossiblethatmusselsstocked
directlyintostreamsmaybebetterabletoavoidwashout,ortofindsuitablehabitatin
downstreamareas.Somelossofmusselsmayhavealsooccurredduetoescapefromcages,as
indicatedbytheabsenceofmusselsandlackofdeadshells,butthiswasminorcomponentof
theoverallmortalityincomparisontowashoutlosses.
AlewifeFloatermusselswereselectedforthisstudyinpartduetotheirexpectedhigh
growthrates.Observedgrowthratesbasedonlengthrangedfrom0.04to0.23mm/d,
exceedingthosereportedforothermussels(e.g.,Lampsiliscardium=0.001-0.020mm/d;
Ohlman&Pegg,2020).HighestgrowthrateswereobservedatHerringCreekandthehatchery
pond.ForcomparisonAlewifefloatermusselshaveafastgrowthrateinhatcherysystems
capableof0.219mm/d(Kreegeretal.,2018).Itispossiblethatgrowthratecouldhavebeen
limitedbyaconcentratedpopulationsizeof40perfloatingbasketasopposedto20percage.It
ispossiblethattheconcentrationof40perbasketwasatathresholdwheremusselswere
competingwitheachotherforfeedingandphysicallylimitedduetolackofspacewithinthe
basket.Ifthisweretrue,itmightwouldexplainwhythegrowthratedroppedfrom0.10to0.05
mm/d.GrowthratesintheurbanstreamsandKimagesCreekweregenerallybelowHerring
Creekandthehatcherypond,withonlyafewpeaksreachingequalgrowth.Inter-site
differencesinmass-basedgrowthratesgenerallyfollowedsurvivalrates,showingthaturban
streamshadlowergrowthratesandhighermortalitycomparedtoruralstreams.While
P a g e |17
KimagesCreekdoesnothavealltheattributesoftheurbansitessuchasflashyhydrologyora
watershedwithhighamountsofimpervioussurfaces,thegrowthrateandsurvivorshipof
musselsismorecomparabletourbansitesthanruralsites.
Trendsinfoodqualityandquantityindicatethatdifferencesbetweensitesmaypartly
accountfordifferencesinsurvivalandgrowth.Theresponseoffreshwatermusselstoincreased
algalorsuspendedmatterfluxwithwatervelocityiscomplexandvariesbyspeciesdueto
morphology(Mistry&Ackerman,2015.;Tuttle-raycraft&Ackerman,2019).High
concentrationsofsuspendedparticulatematterareindicativeofpotentiallygreaterfood
resources,thoughmuchofthisparticulatemattermaybeoflowquality(e.g.,siltandclay).
Studieshaveshownthattheclearancerate(numberofparticlesfiltered)ofmusselsdecreases
withhighlevelsofTSS(Tuttle-raycraft&Ackerman,2019).Itisthereforeimportanttoalso
considermetricsoffoodqualitysuchasorganicmattercontentandchlorophyllacontent.
RuralsitesexhibitedhigherTSS,POC,chlorophyll-aandparticledensityrelativetourbansites.
Morefavorablefoodresourceconditionsmayaccountforhighergrowthratesobservedat
someofthenon-urbansites(HerringCreek,Hatcherypond)thoughwedidnotfindsignificant
relationshipsforthese,orwaterqualityparameters,inpredictingvariationingrowthrates.
Conclusion
Priorstudieshavedocumentedtheeffectsofurbanizationonstreamhydrologyand
geomorphology.Typically,theseareassociatedwithhighrunofffromimpervioussurfaces
duringstormevents,whichleadtobedandbankerosion.Theseconditionsareoften
associatedwithimpairmentofstreamfunction(e.g.,reducedsedimentandnutrientretention;
lowbiodiversity).Resultsfromthisstudyfurtherhighlightthechallengestorestoringurban
streamsasexemplifiedbythehighrateofwashoutandburialofintroducedmussels.
Restorationeffortswithinthecatchmentareneededtoreduceurbanrunoff,whichmaythen
allowforsuccessfulre-introductionofmusselsandassociatedimprovementsinstream
ecosystemservices.Datafromthisstudyshowthatwhileintroductionofmusselstourban
streamshadlimitedsuccess,growthandsurvivorshipinnearbyruralstreamswasindicativeof
greaterpotentialforsuccess.Thestockingoffreshwatermusselsintothese,andpotentially,
restoredurbanstreams,maybeausefulapproachtomitigatingnutrientandsediment

P a g e |18
transporttoChesapeakeBay.Furtherstudiesareneededtobetterunderstandwaterquality
andfoodconditionsthatareconducivetosuccessfulestablishmentofmussels,andhowstream
restorationeffortsmaybegearedtoaccommodatingmusselintroduction.
P a g e |19
References
Cornwell,J.C.,Rose,J.,Kellogg,M.L.,Luckenbach,M.W.,Bricker,S.B.,Paynter,K.T.,…
Hudson,K.(2016).PanelrecommendationsontheoysterBMPnutrientandsuspended
sedimentreductioneffectivenessdeterminationdecisionframeworkandnitrogenand
phosphorusassimilationinoystertissuereductioneffectivenessforoysteraquaculture
practices.OysterBMPExpertPanelFirstIncrementalReport.
Eshleman,K.N.,&Sabo,R.D.(2016).Decliningnitrate-NyieldsintheUpperPotomacRiver
Basin:WhatisreallydrivingprogressundertheChesapeakeBayrestoration?Atmospheric
Environment,146,280–289.https://doi.org/10.1016/j.atmosenv.2016.07.004
Estuary,D.,Estuary,N.,December,P.,&No,P.D.E.R.(2016).FreshwaterMussel
ReintroductionResearchProject2016 :AdvancementsinFreshwaterMusselRestoration
atLongwoodGardensFreshwaterMusselReintroductionResearchProject2016 :
AdvancementsinFreshwaterMusselRestorationatLongwoodGardens,(16).
Haag,W.R.,Culp,J.J.,Mcgregor,M.A.,Bringolf,R.,&Stoeckel,J.A.(2019).Growthand
survivalofjuvenilefreshwatermusselsinstreams :Implicationsforunderstanding
enigmaticmusseldeclines.FreshwaterScience38:753–770.
https://doi.org/10.1086/705919.
Haag,W.R.,&Williams,J.D.(2014).Biodiversityonthebrink:Anassessmentofconservation
strategiesforNorthAmericanfreshwatermussels.Hydrobiologia,735(1),45–60.
https://doi.org/10.1007/s10750-013-1524-7
Hoellein,T.J.,Zarnoch,C.B.,Bruesewitz,D.A.,&DeMartini,J.(2017).Contributionsof
freshwatermussels(Unionidae)tonutrientcyclinginanurbanriver:filtration,recycling,

P a g e |20
storage,andremoval.Biogeochemistry,135(3),307–324.https://doi.org/10.1007/s10533-
017-0376-z
Kreeger,D.A.,Gatenby,C.M.,&Bergstrom,P.W.(2017).Comparativeevaluationofnative
bivalvespeciesrestorationforwaterqualityimprovementintheChesapeakeBayand
othermid-Atlanticwatersheds.PartnershipfortheDelawareEstuaryReport,(17-05),96.
Kreeger,D.A.,Gatenby,C.M.,Bergstrom,P.W.,Service,W.,Great,L.,Fish,L.,…Road,C.
(2018).Restorationpotentialofseveralnativespeciesofbivalvemolluscsforwaterquality
improvementinMid-Atlanticwatersheds.JournalofShellfishResearch37(5),1121–1157.
https://doi.org/10.2983/035.037.0524
Lucas,R.(2019).CharacterizingwaterqualityandhydrologicpropertiesofUrbanStreamsin
CentralVirginia.,VCURichmond,VA.
McConnell,K.A.(2017).LimitsofAmericanFarmBureauFederationv.EPAandtheClean
WaterAct’sTMDLProvisionintheMississippiRiverBasin.EcologyLawQuarterly,44(2),
469–501.https://doi.org/10.15779/Z38M61BP5N
Nedeau,E.J.,Merritt,R.W.,&Kaufman,M.G.(2003).Theeffectofanindustrialeffluentonan
urbanstreambenthiccommunity:Waterqualityvs.habitatquality.Environmental
Pollution,123(1),1–13.https://doi.org/10.1016/S0269-7491(02)00363-9
Nobles,T.,&Zhang,Y.(2015).Survival,growthandconditionoffreshwatermussels:Effectsof
municipalwastewatereffluent.PLoSONE,10(6),1–20.
https://doi.org/10.1371/journal.pone.0128488
NRCS.(n.d.).Chapter1:Introduction:EcologicalandPhysicalConsiderationsforStream
Projects.NationalEngineeringHandbook,654.
P a g e |21
Ohlman,L.M.,&Pegg,M.A.(2020).Handlingeffectsonsurvivalandgrowthofplain
pocketbookLampsiliscardium(Rafinesque,1820)freshwatermussels.Hydrobiologia,
847(2),457–467.https://doi.org/10.1007/s10750-019-04106-y
Patterson,M.A.,Mair,R.A.,Eckert,N.L.,Gatenby,C.M.,Brady,T.,Jones,J.W.,Simmons,B.
R.,Devers,J.L..(2018)Freshwatermusselpropagationforrestoration.Cambridge
UniversityPress,334pp.ISBN-13:978-1108445313.
Smucker,N.J.,&Detenbeck,N.E.(2014).Meta-analysisoflostecosystemattributesinurban
streamsandtheeffectivenessofout-of-channelmanagementpractices.Restoration
Ecology,22(6),741–748.https://doi.org/10.1111/rec.12134
Tuttle-Raycraft,S.,&Ackerman,J.D.(2019).Livingthehighturbiditylife :Theeffectsoftotal
suspendedsolids,flow,andgillmorphologyonmusselfeeding,Limnology&
Oceanography64:2526–2537.https://doi.org/10.1002/lno.11202
Vaughn,C.C.(2018).Ecosystemservicesprovidedbyfreshwatermussels.Hydrobiologia,
810(1),15–27.https://doi.org/10.1007/s10750-017-3139-x
Walsh,C.J.,Roy,A.H.,Feminella,J.W.,Cottingham,P.D.,Groffman,P.M.,Ii,R.P.M.,&Ii,R.
A.P.M.O.(2016).Theurbanstreamsyndrome :currentknowledgeandthesearchfora
cure.JournaloftheNorthAmericanBenthologicalSociety,24(3),706–723.
https://doi.org/10.1016/B978-0-12-801231-4.00027-6
Williams,J.D.,Warren,Jr.,M.L.,Cummings,K.S.,Harris,J.L.,&Neves,R.J.(1993).
ConservationStatusofFreshwaterMusselsoftheUnitedStatesandCanada.Fisheries,
18(9),6–22.https://doi.org/10.1577/1548-8446(1993)018<0006
Winter,J.G.,&Duthie,H.C.(1998).Effectsofurbanizationonwaterquality,periphytonand
P a g e |22
invertebratecommunitiesinasouthernOntariostream.CanadianWaterResources
Journal23:245-257.https://doi.org/10.4296/cwrj2303245
Yeager,M.M.,Cherry,D.S.,&Neves,D.J.(1994).Feedingandburrowingbehaviorsofjuvenile
RainbowMussels,Villosairis(Bivalvia :Unionidae).JournaloftheNorthAmerican
BenthologicalSociety,13:217–222.
P a g e |23
Table1.Location,watershedarea,substratecomposition,andsurroundinglandusefrom
NOAAlandusedatabaseandgraduatestudentthesis(Lucas,2019)(NOAA,2010)offive
streamsselectedformusselintroduction.
P a g e |24
Table2.Growthratesofmussels(lengthinmm/d)stockedintourbanandnon-urbanstreams.
Individualgrowthratesarebasedonrepeatmeasurementsofthesameindividual;population
growthratesarederivedfromtheaveragelengthofallindividuals.Stockingdatesforeachsite
areshowninthefirstcolumnandcensusdatesinthesecondcolumn.
Site Date Mean SE N Mean NHatchery 7/15/2019 0.072 0.003 116 0.071 119
5/15/2019 8/27/2019 0.022 0.006 99 0.007 11210/2/2019 0.040 0.027 92 -0.002 10411/2/2019 0.052 0.027 86 0.015 100
Kimages 7/24/2019 0.031 0.003 45 0.044 655/18/2019 9/1/2019 0.071 0.043 39 0.014 45
9/30/2019 0.006 0.006 31 0.007 4710/29/2019 0.096 0.041 23 -0.005 4011/21/2019 0.014 0.040 17 -0.006 33
Herring 7/14/2019 0.052 0.006 17 0.052 375/17/2019 9/7/2019 0.225 0.061 14 0.137 52
10/22/2019 0.082 0.015 18 0.075 62Gillies 8/3/2019 0.013 NA 1 0.02 29
5/27/2019 9/15/2019 0.005 0.001 21 0.009 2311/2/2019 0.057 0.051 17 -0.011 21
Broad Rock 7/1/2019 0.028 0.023 4 -0.031 45/20/2019 8/15/2019 0.034 0.029 13 0.034 13
9/17/2019 0.001 0.004 11 0.001 11Reedy
5/22/2019 7/9/2019 0.015 0.027 4 0.027 107/7/2019 8/12/2019 0.064 0.050 2 0.076 4
Individual GR (mm/d) Population GR (mm/d)
P a g e |25
Table3.Growthratesofmussels(massinmg/d)stockedintourbanandnon-urbanstreams.
Individualgrowthratesarebasedonrepeatmeasurementsofthesameindividual;population
growthratesarederivedfromtheaveragelengthofallindividuals.Stockingdatesforeachsite
areshowninthefirstcolumn.
Site Date Mean SE N Mean NHatchery 7/15/2019 40.1 1.6 116 39.3 119
5/15/2019 8/27/2019 10.5 1.4 99 4.3 11210/2/2019 1.2 3.3 92 -1.1 10411/2/2019 5.7 2.6 86 1.3 100
Kimages 7/24/2019 10.5 1.6 45 16.0 655/18/2019 9/1/2019 13.8 1.9 39 14.2 45
9/30/2019 6.6 4.9 31 3.2 4710/29/2019 -1.1 6.2 23 -10.7 4011/21/2019 -2.5 4.3 17 -5.5 33
Herring 7/14/2019 29.0 4.9 17 31.5 375/17/2019 9/7/2019 94.2 9.1 14 77.0 52
10/22/2019 48.0 13.9 18 39.6 62Gillies 8/3/2019 9.5 NA 1 9.4 29
5/27/2019 9/15/2019 10.6 1.9 21 8.4 2311/2/2019 -3.7 1.3 17 -8.3 21
Broad Rock 7/1/2019 7.5 2.3 2 0.0 85/20/2019 8/15/2019 -4.6 5.3 13 -4.6 13
9/17/2019 0.9 1.4 11 0.9 11Reedy
5/22/2019 7/9/2019 11.3 8.4 4 10.2 107/7/2019 8/12/2019 15.8 1.3 2 0.0 4
Individual GR (mg/d) Population GR (mg/d)
P a g e |26
Table4.MeanvaluesofwaterqualityvariablesrecordedateachsiteduringApriltoDecember2019.
Site Temp pH Conductivity DO DO DischargeC µS/cm % mg/L m3/s
Herring 18.7 6.9 150.3 59.4 5.8 0.233Pond 23.2 7.3 38.4 81.4 7.3 N/AKimages 16.4 7.1 103.7 69.5 6.7 0.021BroadRock 17.9 7.5 144.0 99.8 9.6 0.039Reedy 17.2 7.4 196.8 90.9 9 0.014Gillies 17.8 7.2 157.6 94.1 9.1 0.072

P a g e |27
Figure1.Designofinstreammusselenclosures
P a g e |28
Figure2.StockingnumberandfateofAlewifeFloatermusselsinthreeurbanstreams(Reedy,
BroadRock,andGillies),2non-urbanstreams(Herring,Kimages)andafishhatcheryrearing
pond.Thebarsrepresentthenumberofmussels,bluerepresentingstockedmussels,orange
representingnumberofmusselsalive,greyrepresentingnumberofmusselslost,andyellow
representingnumberofmussels’dead.

P a g e |29
Figure3.Lengthandmassbasedgrowthrates(withstandarderror)ofAlewifeFloatermussels
inurbanandruralstreamsaswellasthehatcherypond.Datashownareaveragevaluesbased
onrepeatmeasurementsofindividuallytaggedmussels.
-20
0
20
40
60
80
100
120
Jul Aug Oct Nov Jul Aug Sep Oct Nov Jul Sep Oct
GR(m
g/d)
GR-mass
-20
0
20
40
60
80
100
120
Aug Sep Nov Jul Aug Sep Jul Aug
GR(m
g/d)
GR-mass
-0.05
0.00
0.05
0.10
0.15
0.20
0.25
0.30
0.35
Jul Aug Oct Nov Jul Aug Sep Oct Nov Jul Sep Oct
GR(m
m/d)
GR-length
Non-UrbanSites UrbanSites
-0.05
0.00
0.05
0.10
0.15
0.20
0.25
0.30
0.35
Aug Sep Nov Jul Aug Sep Jul Aug
GR(m
m/d)
GR-length
JulAugOctNovJulAugSepOctNovJulSepOctHatcheryKimagesHerring
AugSepNovJulAugSepJulAugGilliesBroadRockReedy
P a g e |30
Figure4.Comparisonsofindividualandpopulationbasedgrowthratesasmassandlength(upperpanels).Comparisonsofmassandlengthbasedgrowthratesderivedfromrepeatedmeasurementsofindividualsandpopulationmeans(lowerpanels).Allregressionsp<0.001.
R²=0.9607
-20
0
20
40
60
80
100
-20 0 20 40 60 80 100
Popu
latio
nGR
(mg/d)
IndividualGR(mg/d)
Indvs.PopGR(mass)
R²=0.5213
-0.05
0.00
0.05
0.10
0.15
0.00 0.05 0.10 0.15 0.20 0.25
Popu
latio
nGR
(mm/d)
IndividualGR(mm/d)
Indvs.PopGR(length)
R²=0.6495
0.00
0.05
0.10
0.15
0.20
0.25
-20 0 20 40 60 80 100
Individu
alGR(m
m/d)
IndividualGR(mg/d)
GR-massvs.GR-length(Ind)
R²=0.8744
-0.05
0.00
0.05
0.10
0.15
-20 0 20 40 60 80 100
Popu
latio
nGR
(mm/d)
PopulationGR(mg/d)
GR-massvs.GR-length(Pop)
P a g e |31
Figure5.Waterqualityconditionsatstudysitesduringtheperiodwhenmusselsweredeployed
fromJune-December2019.
P a g e |32
Figure6.Foodquantityandqualitymetricsforurbanstreams(Gil=Gillies,BR=BroadRock,
Ree=Reedy)and3non-urbansites(Kim=Kimages,Her=Herring,Pon=hatcherypond).Data
shownaremedians(darkblackline),25%and75%quartiles(boxes),95%confidenceintervals
(bars)andoutliers(circles).
P a g e |33
Figure7.Waterqualityandfoodmetricsaspredictorsofmusselmassgrowthrates.Regression
linesdenotestatisticallysignificantrelationships.
-20
0
20
40
60
80
100
0 10 20 30 40
GR(m
g/d)
WaterTempC
-20
0
20
40
60
80
100
0 20 40 60 80 100 120
GR(m
g/d)
DisO2(%)
-20
0
20
40
60
80
100
0 50000 100000 150000 200000 250000
GR(m
g/d)
ParticleDensity(#/ml)
-20
0
20
40
60
80
100
0 5 10 15 20 25
GR(m
g/d)
TSS(mg/L)
-20
0
20
40
60
80
100
0 2 4 6 8 10
GR(m
g/d)
CHLa(µg/L)
R2 = 0.23p=0.07
-20
0
20
40
60
80
100
0.0 0.5 1.0 1.5 2.0
GR(m
g/d)
POC(mg/L)
R2 = 0.25p=0.03
Related Documents