1 Assessing the Benefits of Levees: An Economic Assessment of U.S. Counties with Levees Prepared by: Ezra Boyd December 23, 2009 Commissioned by: Levees.org A. Introduction The recent list of U.S. Counties with levee protection obtained by Levees.org provides an opportunity to examine the economic benefits associated with levees. Compiled by FEMA from a National Flood Insurance Program database, this list includes 881 U.S. counties that have flood protection levees. As coastal Louisiana faced recovery from devastating flooding, the nation questioned the wisdom of massive public investment in levees and other flood risk reduction infrastructure. This question reflected a long running debate regarding human settlement in floodplains that have been modified by levees and related flood reduction structures. Now we have the data needed to more thoroughly assess the economic benefits of using levees and other structures to protect populations that reside and work in floodplains. From the onset, the data provided by FEMA shows an interesting and illustrative fact: US counties with levees, which account for only 28% of all counties in the country and only 37% of the total US land area, are home to a whopping 55% of the US population. In 2004, a majority of Americans, over 156 million citizens, resided in these counties. This simple fact suggests the influence of a strong “pull factor,” that is social and/or economic benefits that encourages migration to and settlement within these counties. Naturally, the levees themselves do not form a pull factor. Rather it is the landscape features associated with levees that explain this observed population trend.

Welcome message from author
This document is posted to help you gain knowledge. Please leave a comment to let me know what you think about it! Share it to your friends and learn new things together.
Transcript
1
Assessing the Benefits of Levees:
An Economic Assessment of U.S. Counties with Levees
Prepared by:
Ezra Boyd
December 23, 2009
Commissioned by:
Levees.org
A. Introduction
The recent list of U.S. Counties with levee protection obtained by Levees.org provides an
opportunity to examine the economic benefits associated with levees. Compiled by FEMA from
a National Flood Insurance Program database, this list includes 881 U.S. counties that have flood
protection levees. As coastal Louisiana faced recovery from devastating flooding, the nation
questioned the wisdom of massive public investment in levees and other flood risk reduction
infrastructure. This question reflected a long running debate regarding human settlement in
floodplains that have been modified by levees and related flood reduction structures. Now we
have the data needed to more thoroughly assess the economic benefits of using levees and other
structures to protect populations that reside and work in floodplains.
From the onset, the data provided by FEMA shows an interesting and illustrative fact: US
counties with levees, which account for only 28% of all counties in the country and only 37% of
the total US land area, are home to a whopping 55% of the US population. In 2004, a majority
of Americans, over 156 million citizens, resided in these counties. This simple fact suggests the
influence of a strong “pull factor,” that is social and/or economic benefits that encourages
migration to and settlement within these counties. Naturally, the levees themselves do not form
a pull factor. Rather it is the landscape features associated with levees that explain this observed
population trend.
2
Bodies of water -- rivers, lakes, and seas – along with their associated flood plains have long
been an engine of economic development. These diverse and productive ecosystems provide a
number of services crucial to maintaining populations and improving their wellbeing. Such
services include maritime trade, municipal and industrial water supply, irrigation for farming,
sustainable seafood harvests, and recreation. Studies that have evaluated on a global scale the
goods and services provided by ecosystems have found that aquatic based ecosystems provide
the most valuable goods and services (Constanza 1997, Brauman 2007.)
In a world of both risks and opportunities, access to the benefits of these ecosystems entails
exposure to certain risks. Most notably, damaging and deadly flood disasters can occur when
fluctuations in the river’s water level results in the floodplain being inundated. So that humans
can settle within and enjoy the benefits provided by floodplains, a number of structural
adjustments to landscapes have been utilized. Levees are the most common such adjustment,
though locks, floodgates, spillway diversions, retention ponds, and pump stations are also
common. By minimizing the frequency and severity of flood events, these structural
modifications to the landscape have allowed humans maximum access to the benefits of
floodplains while reducing to flood risk.
As such, it is postulated that, by allowing human settlement into a productive and valuable type
of ecosystem, levees are associated with economic well-being, and that populations that live near
levees are more productive, have higher incomes, and less poverty. Naturally, the levees
themselves do not determine these outcomes. Rather, it is the requisite proximity of the levees to
bodies of water, or more specifically the proximity of levees to ports, municipal water intake
systems, seafood markets, and employers of all trades and sizes, that leads to an expected
association between levees and economic productivity.
Some academics have argued that, because levees encourage settlement in floodplains and
contribute to flood losses, the drawbacks outweigh the benefits of such settlement locations.
Planning expert Raymond Burby argues that this pattern forms a “safe development paradox”
(Burby 2006), while social scientist and critic Denis Miletti writes that flood losses are
3
“primarily the consequence of narrow and shortsighted development patterns, cultural premises,
and attitudes” (Mileti 1999). While these authors do give cursory mention to the economic
benefits of floodplains, a more robust analysis would not focus exclusively on the sensational
losses witnessed during flood disasters while ignoring the tangible day-in, day-out benefits of
settling within flood prone areas. By and large, this body of literature fails to assess the risk of
floods relative to the benefits of floodplains, and does not answer the simple question of whether
the risks outweigh the benefits.
Perhaps, the benefits of settling floodplains are real and substantial, and once the risks of floods
are assessed in light of the benefits of floodplains in turns out that public and private investment
into levees that facilitate settlement into floodplains yields positive net returns. While flood
losses are unfortunate and should be minimized, the economic benefits – including increased
income and decreased poverty -- of direct access to the most productive types of ecosystem may
still outweigh the risk of flood losses.
Using the list of US Counties with levees along with data obtained from the 2000 Census, the
differential economic benefits associated with levees can be quantified, thus allowing for a more
accurate assessment of the risks of settling in floodplains relative to the benefits. At the onset, it
needs to be noted that the county level data only identifies counties that have a levee somewhere
inside that county, and our analysis looks at the entire county population not just the population
that resides in levee protected areas. However, in this regard, the “multiplier effect,” where
primary industries generate additional employment in non-primary sectors, should also be noted.
In other words, while the entire population of a county with a levee may not reside in areas
protected by that levee, much of the population benefits from the direct and secondary jobs
supported by the port (which is located near the levee). Likewise, nearly everyone utilizes the
municipal water supply drawn from the water body adjacent to the levee.
B. Hypotheses, Data and Methods
Census indicators of economic productivity and well-being and a basic statistical test can be used
to evaluate where populations protected by levees exhibit greater productivity and well-being.
4
Total productivity, personal income, and percent of the population living in poverty are three
important measures that are readily available from the decennial Census. Using the list of US
Counties with Levees, the U.S. population can be divided into the 55% that live in those counties
and the 45% that live in counties without levee protection. A statistical procedure known as the
“t-test” can be used to measure the difference in means between these two populations, and
determine is there is a significant difference between the two.
Three specific hypotheses will be tested:
Hypothesis 1 – Total productivity is greater in counties with levees.
Hypothesis 2 – Personal income is greater in counties with levees.
Hypothesis 3 – Poverty rates are less in counties with levees.
In testing these three hypotheses, we are comparing how counties, specifically two groups of
counties, score on these indicators of economic productivity and well-being. Total productivity
is a dollar amount that refers to the sum total of all income earned by the county’s population,
while personal income is an average value for the county’s population. Poverty is reported as a
population rate. While the Census data shows some discrepancies with other sources, this
standardized dataset still allows for robust comparisons.
Naturally, the potential benefits of levees extend well beyond these three indicators. However,
assessing these three hypotheses is an important first step in a more informed assessment of the
cost and benefits of using levees and other control structures to settle floodplains. It should also
be noted that from the Federal government’s perspective, all three of these measures impact
revenues and expenditures, and thus how the government weighs the costs and benefits of levee
programs and policies regarding the settlement of floodplains.
Using the 2000 US Census and the counties list from FEMA, a county level dataset, meaning
that each case refers to a county, was created that includes an attribute for whether or not the
county has a levee, the county’s basic population and housing attributes, and select Census
characteristics related to the county’s economic wellbeing. The Census data was obtained from
5
the Summary File 3 (SF 3), which contains numerous population, housing, demographic, social,
and economic data obtained from the Census “Long Form” which was administered to a random
sample of households. From the SF3 responses, the Census has compiled county levee data
tables that includes the following attributes which were included in the study dataset: total
population; urban, rural, and farm population; the total number of workers; total number of
households; total number of urban, rural, farm, and occupied households; per capita income;
family aggregate income; population 15 years and older aggregate income; and median year that
homes were built. In addition to these attributes directly obtained from the Census, others have
been calculated based on the Census data:
- Economic productivity = Per capita income x Total population
- Poverty Rate = Population determined to be Poor / Population for which poverty status
was determined
- Occupancy Rate = Occupied houses / Total houses
- Employment Rate = Total workers / Total population
This dataset allows a robust assessment of the three hypotheses above, while other related
observations are also noted.
While the 2000 Census data, which reflects 1999 employment and income, is dated at the current
time, we judged this data source best for the current purposes because of its completeness,
standardization, and availability. This government source provides a readily available,
comprehensive dataset that includes a number of standardized population indicators that covers
the entire U.S. population. While updated data is available from the Census’ American
Community Survey, this source does not provide complete coverage of all U.S. counties.
Representative of a snapshot in time, the 2000 Census data provides a good picture of the
nation’s economic condition in 1999, which is described in the next few paragraphs.
According to the Economic Report of the President: 2000 (CITE), the “U.S economy performed
very well in 1999,” a year that continued a nine year period of “record breaking expansion that
has brought strong and equitable growth.” During 1999, 2.7 million payroll jobs were added,
part a job growth trend that added 20 million new jobs since 1993. According to the report,
6
national average income in 1999 was $33,740, while the national poverty rate in 1998 averaged
12.7%. Real GDP increased 4.2% that year, while the unemployment rate dropped to 4.2
percent.
The Economic Report of the President: 2000 describes four engines that had driven the period of
expansion. Naturally, technology development helped drive economic growth during the 1990s,
but the report also lists “Trade and Competition” as an important engine of economic expansion.
Because of “trade policies [that] have worked to expand trade and open markets,” trade as a
share of GDP rose by 4.8 percentage points between 1991 and 1999, accounting for nearly $2.25
trillion, or 25% of the nation’s GDP, in 1999.
Table 1: Data sources and variables.
From FEMA:
List of 881 U.S. counties that contain levees. Based on a National Flood Insurance Program database.
From Census SF3:
Land Area Families: Aggregate family income in 1999
Water Area Population 15 years and over: Aggregate Income in 1999
Total Population Population for whom poverty status is determined: Total
Total Population: Urban Population for whom poverty status is determined: Income in 1999 below poverty level
Total Population: Urban Housing units: Total
Total population: Rural Housing units: Urban
Total population: Rural: Farm Housing units: Rural
Total population: Per Capita Income in 1999
Housing units: Rural: Farm
Workers 16 years and over: Total Housing units: Occupied
Households: Total Housing unites: Median year structure built
Households: Median household income in 1999
Owner-occupied housing units: Total
Households: Aggregate household income in 1999
Owner-occupied housing units: Aggregate value
Households: Aggregate earnings in 1999
Calculated from Census SF3:
Total Income Housing Vacancy Rate
Poverty Rate Employment Rate
7
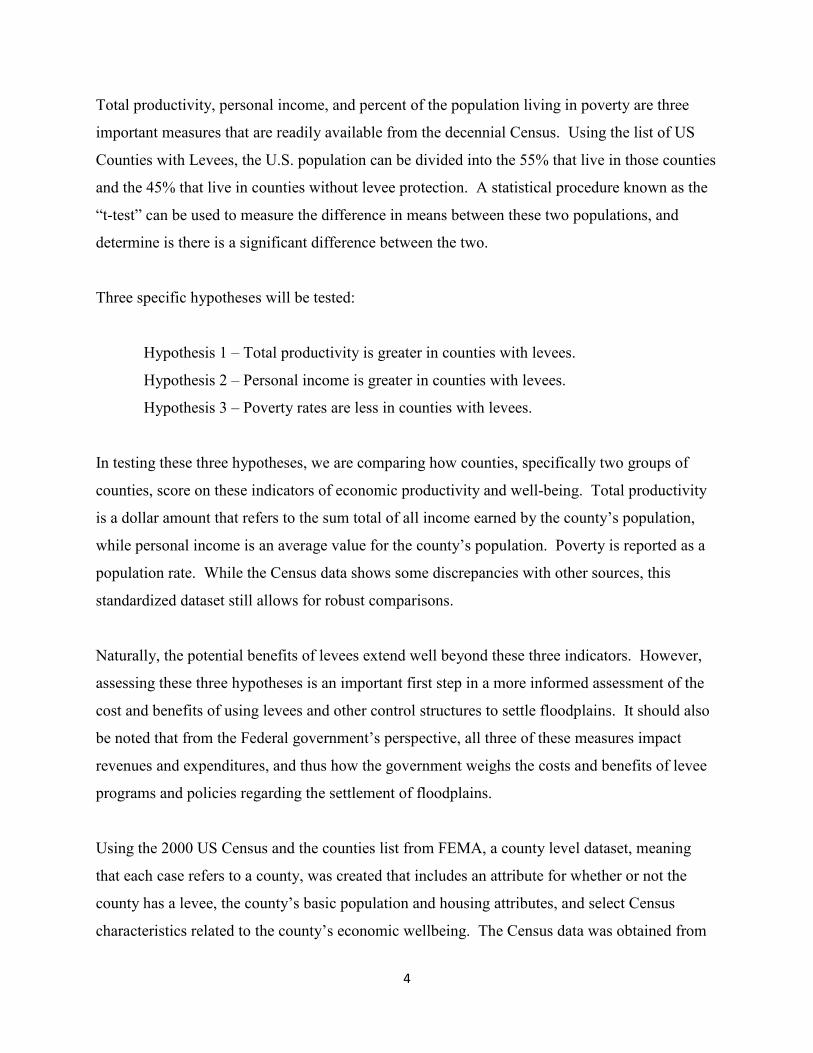
Figure 1 – U.S. Counties with Levees
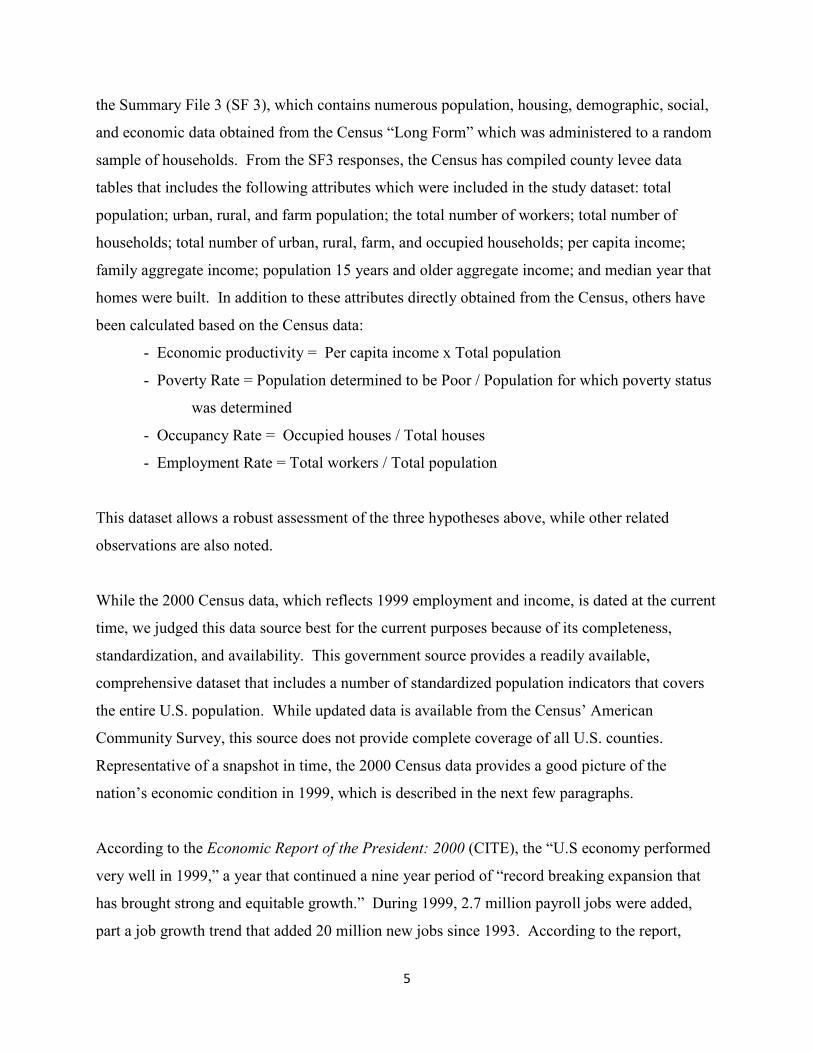
Figure 2 – U.S. population at the county level. Counties with levees are outlined in red.
8
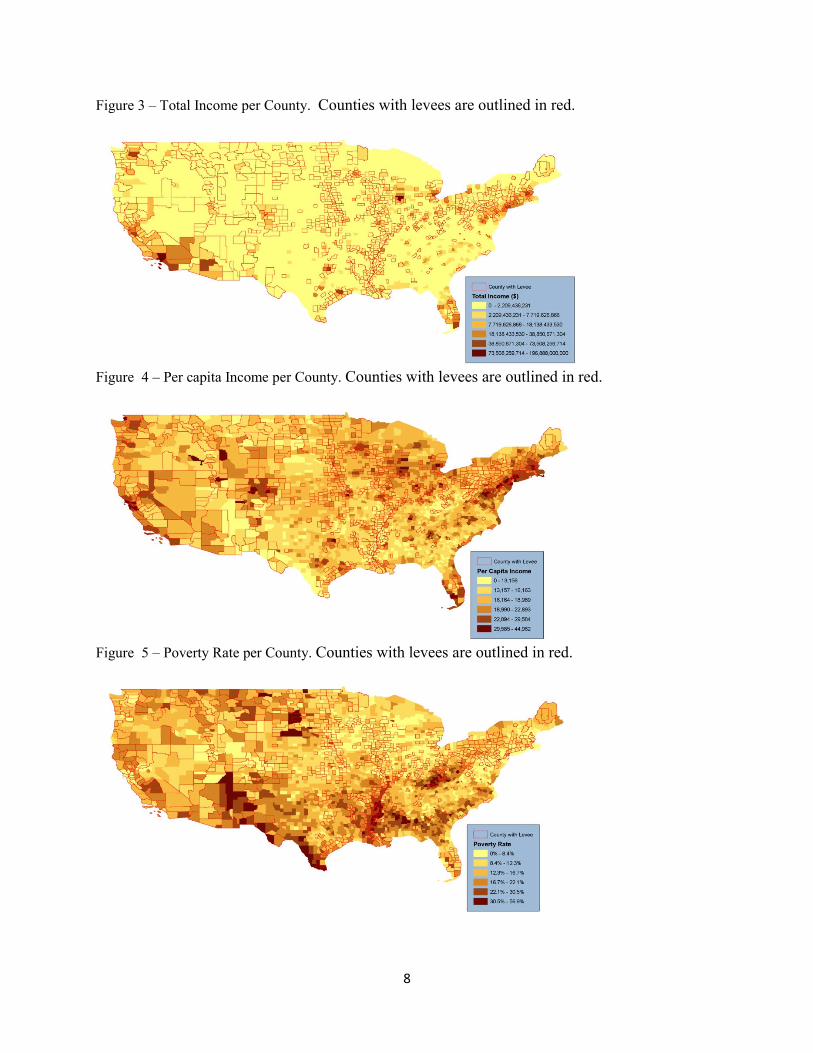
Figure 3 – Total Income per County. Counties with levees are outlined in red.
Figure 4 – Per capita Income per County. Counties with levees are outlined in red.
Figure 5 – Poverty Rate per County. Counties with levees are outlined in red.
9
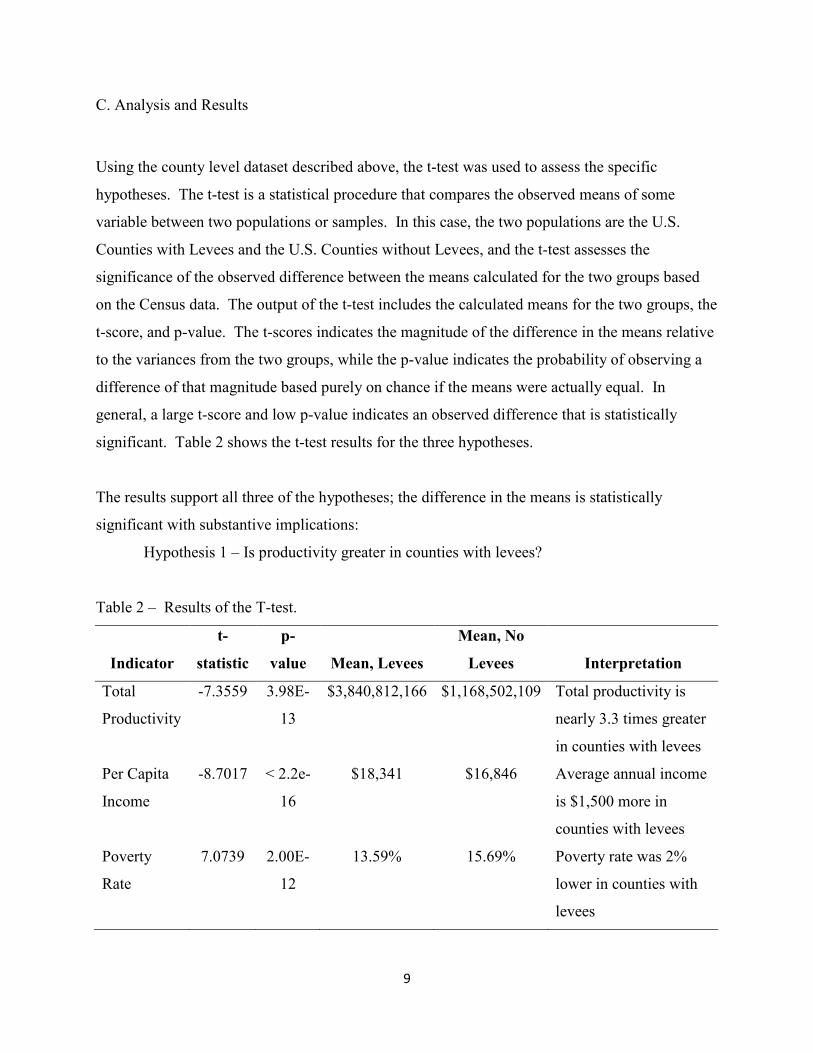
C. Analysis and Results
Using the county level dataset described above, the t-test was used to assess the specific
hypotheses. The t-test is a statistical procedure that compares the observed means of some
variable between two populations or samples. In this case, the two populations are the U.S.
Counties with Levees and the U.S. Counties without Levees, and the t-test assesses the
significance of the observed difference between the means calculated for the two groups based
on the Census data. The output of the t-test includes the calculated means for the two groups, the
t-score, and p-value. The t-scores indicates the magnitude of the difference in the means relative
to the variances from the two groups, while the p-value indicates the probability of observing a
difference of that magnitude based purely on chance if the means were actually equal. In
general, a large t-score and low p-value indicates an observed difference that is statistically
significant. Table 2 shows the t-test results for the three hypotheses.
The results support all three of the hypotheses; the difference in the means is statistically
significant with substantive implications:
Hypothesis 1 – Is productivity greater in counties with levees?
Table 2 – Results of the T-test.
Indicator
t-
statistic
p-
value Mean, Levees
Mean, No
Levees Interpretation
Total
Productivity
-7.3559 3.98E-
13
$3,840,812,166 $1,168,502,109 Total productivity is
nearly 3.3 times greater
in counties with levees
Per Capita
Income
-8.7017 < 2.2e-
16
$18,341 $16,846 Average annual income
is $1,500 more in
counties with levees
Poverty
Rate
7.0739 2.00E-
12
13.59% 15.69% Poverty rate was 2%
lower in counties with
levees
10
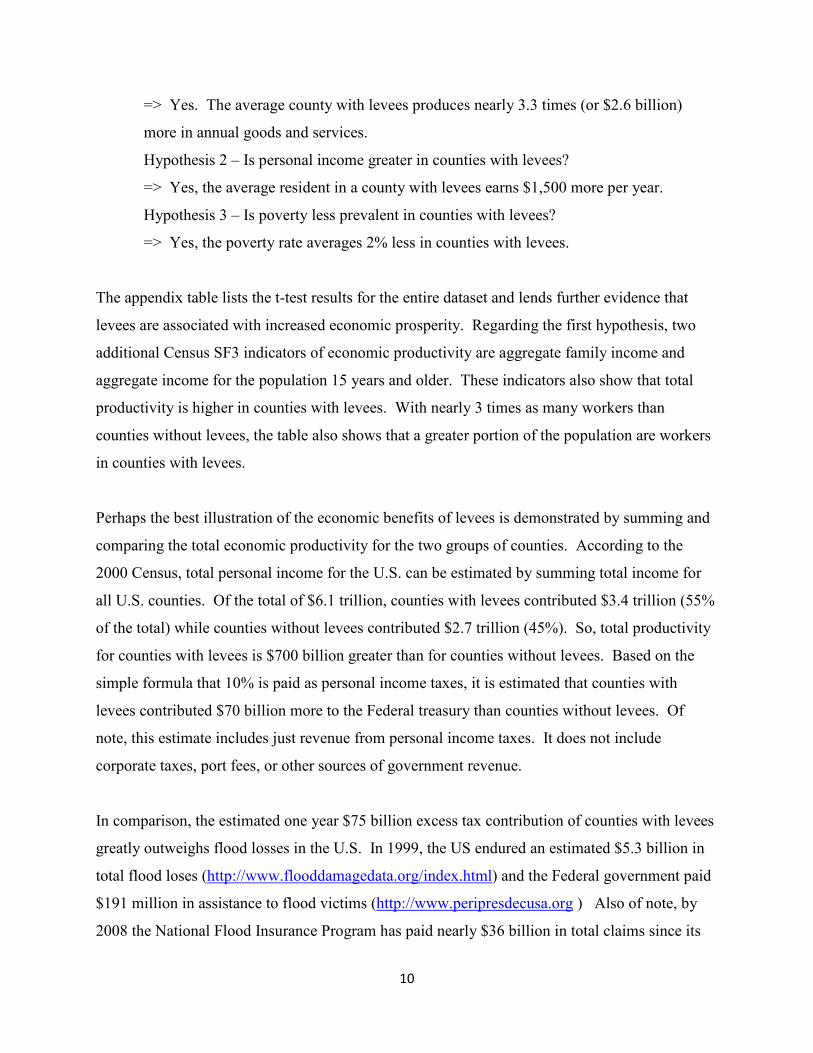
=> Yes. The average county with levees produces nearly 3.3 times (or $2.6 billion)
more in annual goods and services.
Hypothesis 2 – Is personal income greater in counties with levees?
=> Yes, the average resident in a county with levees earns $1,500 more per year.
Hypothesis 3 – Is poverty less prevalent in counties with levees?
=> Yes, the poverty rate averages 2% less in counties with levees.
The appendix table lists the t-test results for the entire dataset and lends further evidence that
levees are associated with increased economic prosperity. Regarding the first hypothesis, two
additional Census SF3 indicators of economic productivity are aggregate family income and
aggregate income for the population 15 years and older. These indicators also show that total
productivity is higher in counties with levees. With nearly 3 times as many workers than
counties without levees, the table also shows that a greater portion of the population are workers
in counties with levees.
Perhaps the best illustration of the economic benefits of levees is demonstrated by summing and
comparing the total economic productivity for the two groups of counties. According to the
2000 Census, total personal income for the U.S. can be estimated by summing total income for
all U.S. counties. Of the total of $6.1 trillion, counties with levees contributed $3.4 trillion (55%
of the total) while counties without levees contributed $2.7 trillion (45%). So, total productivity
for counties with levees is $700 billion greater than for counties without levees. Based on the
simple formula that 10% is paid as personal income taxes, it is estimated that counties with
levees contributed $70 billion more to the Federal treasury than counties without levees. Of
note, this estimate includes just revenue from personal income taxes. It does not include
corporate taxes, port fees, or other sources of government revenue.
In comparison, the estimated one year $75 billion excess tax contribution of counties with levees
greatly outweighs flood losses in the U.S. In 1999, the US endured an estimated $5.3 billion in
total flood loses (http://www.flooddamagedata.org/index.html) and the Federal government paid
$191 million in assistance to flood victims (http://www.peripresdecusa.org ) Also of note, by
2008 the National Flood Insurance Program has paid nearly $36 billion in total claims since its
11
inception in 1978 (http://www.fema.gov/news/newsrelease.fema?id=45682), which is less than
half of the one year excess tax revenue contributed by counties with levees. In other words, the
public costs associated with flood disasters are considerably less than the excess tax
contributions of flood prone counties.
D. Case Study: The catastrophic 2005 flooding in Southeast Louisiana compared to the benefits
of the Mississippi Delta.
A southern state located along the Gulf Coast and transected by a number of major rivers,
Louisiana was home to nearly 4 million people in 2000, many of whom reside within floodplains
and within counties with levees. Persistent poverty in Louisiana reflects the historical trend of
poverty throughout the former plantation country along the Lower Mississippi River valley.
Being a poor state, decent paying jobs are less common. They are also highly dependent upon
the state’s water bodies, and, by necessity, associated with levees along the water bodies. Figure
7 shows Louisiana’s water bodies, urban areas, and counties with levees. Out of ten noticeable
urban areas, only 4 (Lake Charles, Hammond, Lafayette, and Denham Springs) are not located
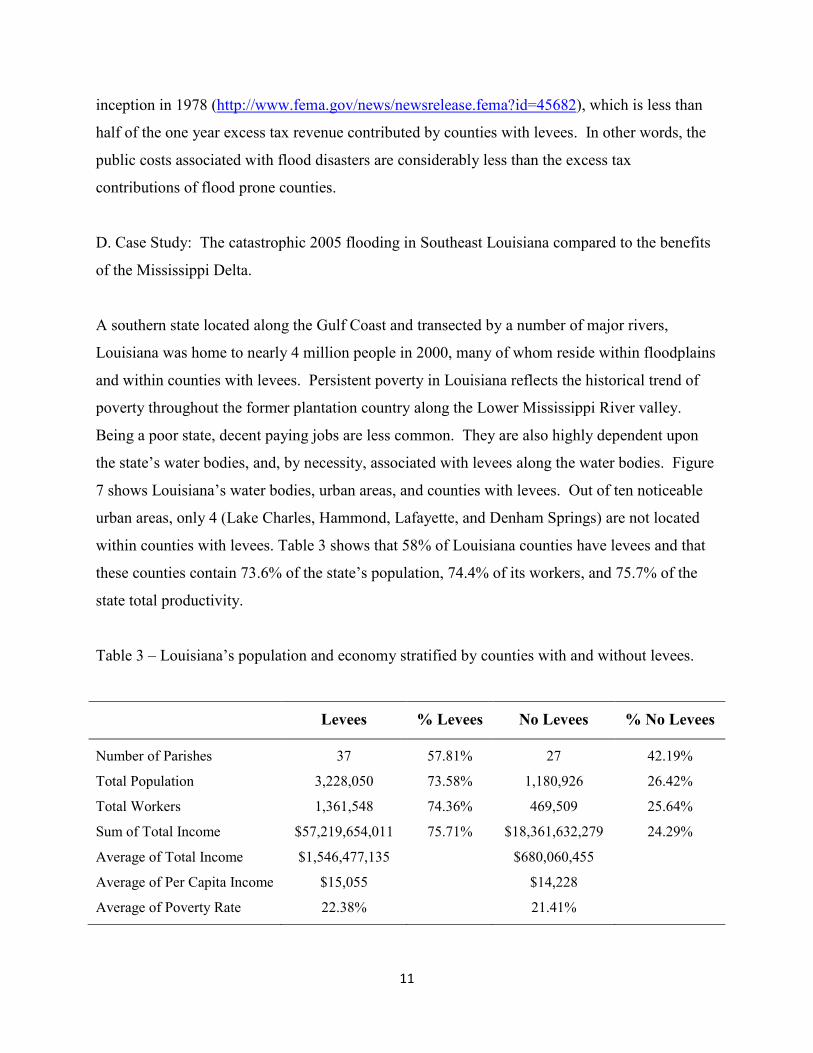
within counties with levees. Table 3 shows that 58% of Louisiana counties have levees and that
these counties contain 73.6% of the state’s population, 74.4% of its workers, and 75.7% of the
state total productivity.
Table 3 – Louisiana’s population and economy stratified by counties with and without levees.
Levees % Levees No Levees % No Levees
Number of Parishes 37 57.81% 27 42.19%
Total Population 3,228,050 73.58% 1,180,926 26.42%
Total Workers 1,361,548 74.36% 469,509 25.64%
Sum of Total Income $57,219,654,011 75.71% $18,361,632,279 24.29%
Average of Total Income $1,546,477,135 $680,060,455
Average of Per Capita Income $15,055 $14,228
Average of Poverty Rate 22.38% 21.41%
12
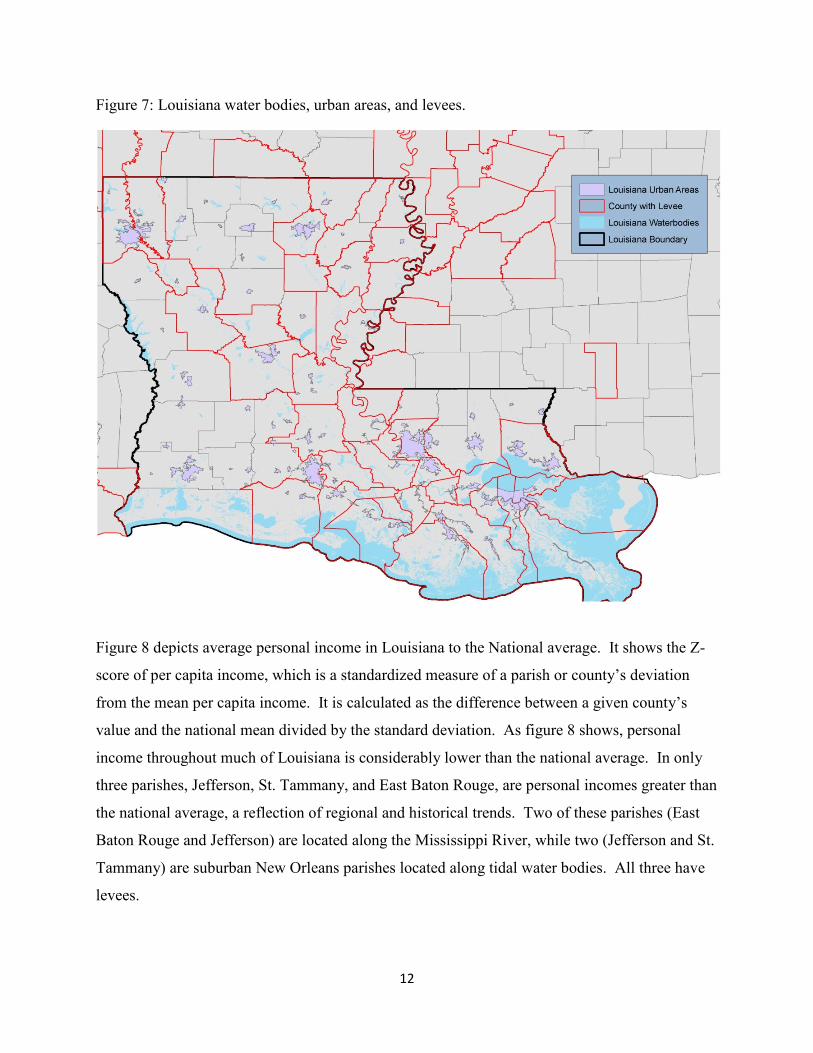
Figure 7: Louisiana water bodies, urban areas, and levees.
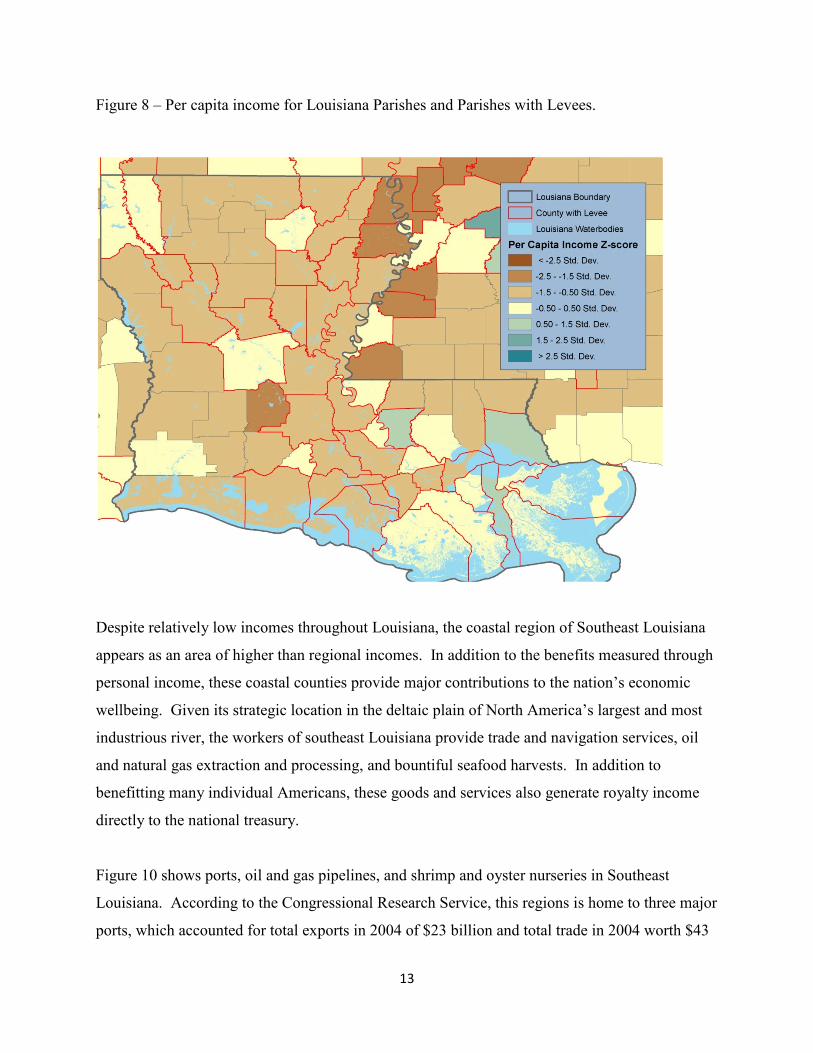
Figure 8 depicts average personal income in Louisiana to the National average. It shows the Z-
score of per capita income, which is a standardized measure of a parish or county’s deviation
from the mean per capita income. It is calculated as the difference between a given county’s
value and the national mean divided by the standard deviation. As figure 8 shows, personal
income throughout much of Louisiana is considerably lower than the national average. In only
three parishes, Jefferson, St. Tammany, and East Baton Rouge, are personal incomes greater than
the national average, a reflection of regional and historical trends. Two of these parishes (East
Baton Rouge and Jefferson) are located along the Mississippi River, while two (Jefferson and St.
Tammany) are suburban New Orleans parishes located along tidal water bodies. All three have
levees.
13
Figure 8 – Per capita income for Louisiana Parishes and Parishes with Levees.
Despite relatively low incomes throughout Louisiana, the coastal region of Southeast Louisiana
appears as an area of higher than regional incomes. In addition to the benefits measured through
personal income, these coastal counties provide major contributions to the nation’s economic
wellbeing. Given its strategic location in the deltaic plain of North America’s largest and most
industrious river, the workers of southeast Louisiana provide trade and navigation services, oil
and natural gas extraction and processing, and bountiful seafood harvests. In addition to
benefitting many individual Americans, these goods and services also generate royalty income
directly to the national treasury.
Figure 10 shows ports, oil and gas pipelines, and shrimp and oyster nurseries in Southeast
Louisiana. According to the Congressional Research Service, this regions is home to three major
ports, which accounted for total exports in 2004 of $23 billion and total trade in 2004 worth $43
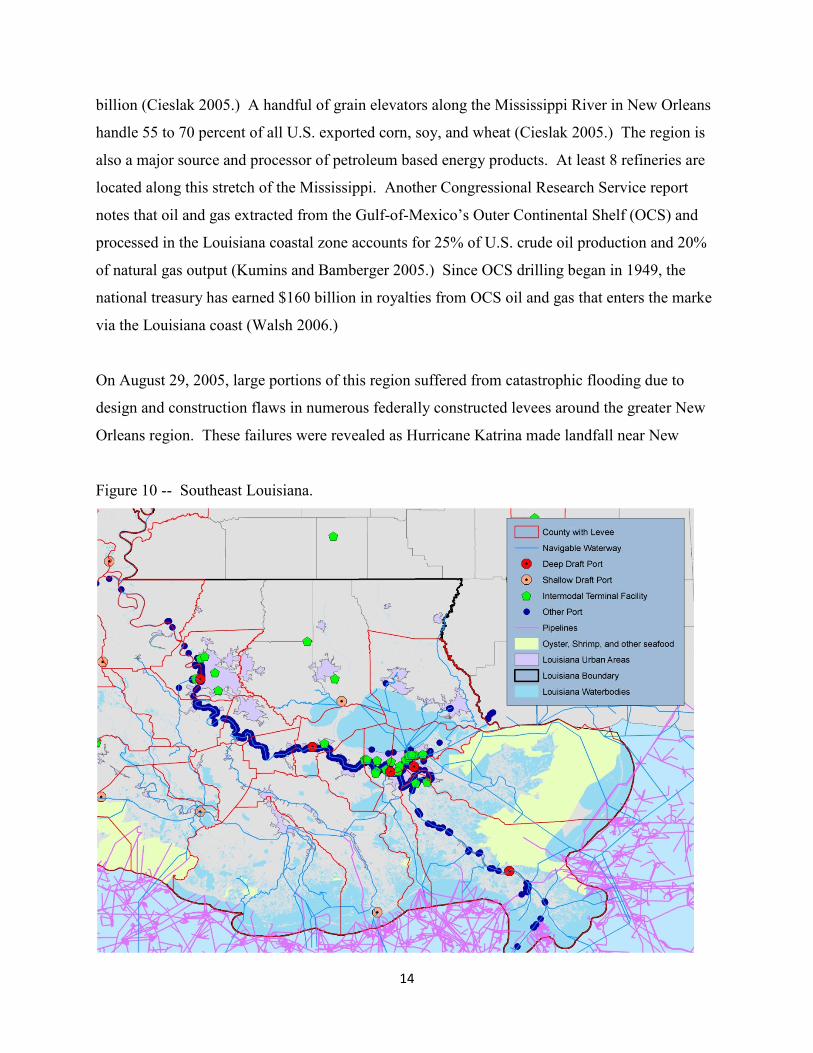
14
billion (Cieslak 2005.) A handful of grain elevators along the Mississippi River in New Orleans
handle 55 to 70 percent of all U.S. exported corn, soy, and wheat (Cieslak 2005.) The region is
also a major source and processor of petroleum based energy products. At least 8 refineries are
located along this stretch of the Mississippi. Another Congressional Research Service report
notes that oil and gas extracted from the Gulf-of-Mexico’s Outer Continental Shelf (OCS) and
processed in the Louisiana coastal zone accounts for 25% of U.S. crude oil production and 20%
of natural gas output (Kumins and Bamberger 2005.) Since OCS drilling began in 1949, the
national treasury has earned $160 billion in royalties from OCS oil and gas that enters the marke
via the Louisiana coast (Walsh 2006.)
On August 29, 2005, large portions of this region suffered from catastrophic flooding due to
design and construction flaws in numerous federally constructed levees around the greater New
Orleans region. These failures were revealed as Hurricane Katrina made landfall near New
Figure 10 -- Southeast Louisiana.
15
Orleans. As a result of this disruption, large portion of the nation experienced drastic rises in gas
prices, while Midwest farmers lost income when their gateway to world markets closed. During
the weeks that followed, the U.S. had to import 30 million barrels of oil to avoid costly energy
shortages (Kummins and Bamberger 2005.)
The direct cost of damage to tangible assets in the greater New Orleans region due to the levee
failures and flooding are estimated at $21 billion, most of which reflects damage to residential
structures (IPET 2009.) Total wind and flood damages in Louisiana associated with Hurricane
Katrina are estimated to be around $100 billion (Lipton 2006, Bennedetto 2006) while FEMA
paid roughly $45 billion in disaster assistance to Louisiana for the 2005 disasters (Smith 2006.)
While significant, these costs are still not larger than the $149 billion in Louisiana OCS oil and
gas royalties, which reflects just one form of contribution from just one industry in coastal
Louisiana to the national treasury and economic well being.
D. Discussion
This assessment provides broad based evidence that levees provide important economic benefits,
and safe and responsible development of floodplains is important for maintaining the economic
well being of a majority of American. In comparing the economic productivity and wellbeing of
the 55% of Americans that reside in counties with levees to the 45% of the population that live in
counties without levees, it was found that total productivity and personal incomes are greater and
poverty less in the counties with levees. The observed differences, based on 2000 Census SF3
data tables were found to be highly statistically significant. Further, the $1,500 increase in per
capita income and the $650 billion in additional total income is a substantial difference that
positively impacts government revenues, while the 2% reduction in poverty rate reduces
government expenditures. Additionally, it is estimated that US counties with levees contributed
$70 billion in excess tax revenue for 1999, a contribution that greatly outweighs the flood related
costs for that year. In fact, just half of this one year excess tax contribution could have covered
all claims paid by the National Flood Insurance Program during its entire existence. Of note,
economists described 1999 as a good year for the American economy that continued a nearly
decade long trend of job and income growth, much of it fueled by rising international trade.
16
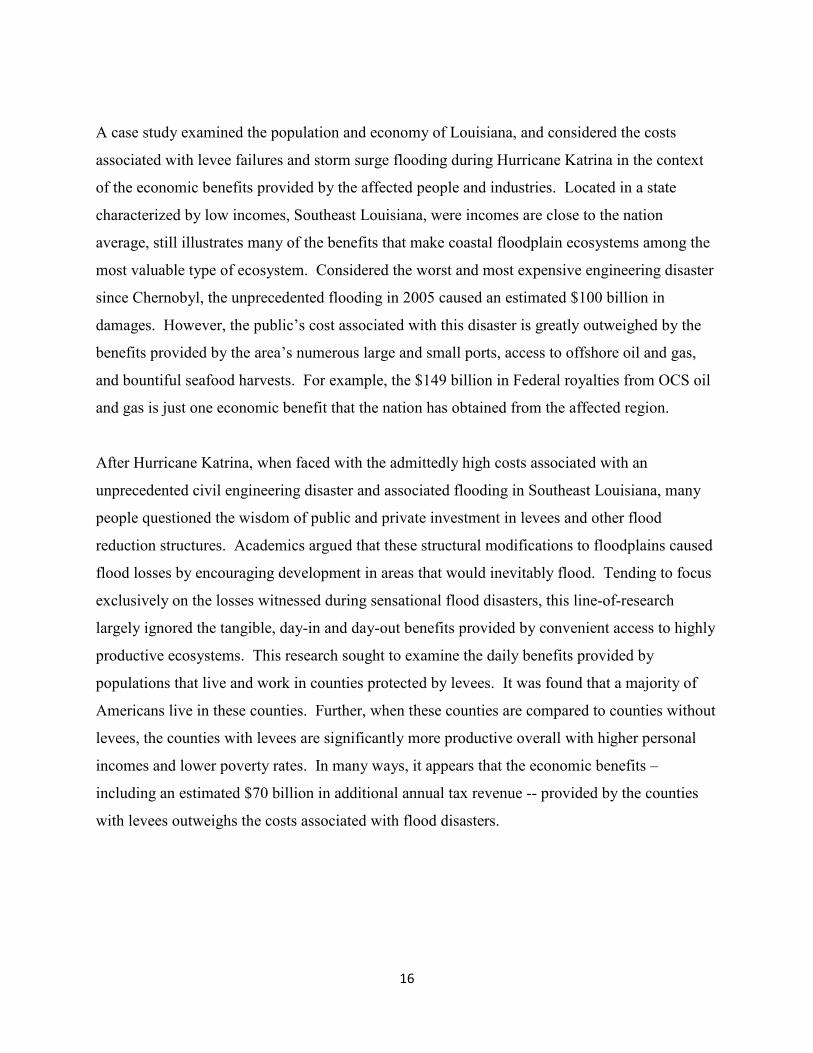
A case study examined the population and economy of Louisiana, and considered the costs
associated with levee failures and storm surge flooding during Hurricane Katrina in the context
of the economic benefits provided by the affected people and industries. Located in a state
characterized by low incomes, Southeast Louisiana, were incomes are close to the nation
average, still illustrates many of the benefits that make coastal floodplain ecosystems among the
most valuable type of ecosystem. Considered the worst and most expensive engineering disaster
since Chernobyl, the unprecedented flooding in 2005 caused an estimated $100 billion in
damages. However, the public’s cost associated with this disaster is greatly outweighed by the
benefits provided by the area’s numerous large and small ports, access to offshore oil and gas,
and bountiful seafood harvests. For example, the $149 billion in Federal royalties from OCS oil
and gas is just one economic benefit that the nation has obtained from the affected region.
After Hurricane Katrina, when faced with the admittedly high costs associated with an
unprecedented civil engineering disaster and associated flooding in Southeast Louisiana, many
people questioned the wisdom of public and private investment in levees and other flood
reduction structures. Academics argued that these structural modifications to floodplains caused
flood losses by encouraging development in areas that would inevitably flood. Tending to focus
exclusively on the losses witnessed during sensational flood disasters, this line-of-research
largely ignored the tangible, day-in and day-out benefits provided by convenient access to highly
productive ecosystems. This research sought to examine the daily benefits provided by
populations that live and work in counties protected by levees. It was found that a majority of
Americans live in these counties. Further, when these counties are compared to counties without
levees, the counties with levees are significantly more productive overall with higher personal
incomes and lower poverty rates. In many ways, it appears that the economic benefits –
including an estimated $70 billion in additional annual tax revenue -- provided by the counties
with levees outweighs the costs associated with flood disasters.
17
Works Cited
Benedetto, R. (2006.) “White House study outlines Katrina 'lessons'.” USA Today. 2/23/2006. http://www.usatoday.com/news/washington/2006-02-23-white-house-katrina_x.htm Brauman, K., G. Daily, T. Ka’eo Duarte, and H. Mooney. (2007.) “The Nature and Value of Ecosystem Services: An Overview Highlighting Hydrologi Services.” Annual Review of Environment and Resources. 32, pp 67 – 98. Burby, R. (2006.) “Hurricane Katrina and the Paradoxes of Government Disaster Policy: Bringing About Wise Governmental Decisions for Hazardous Areas.” The Annals of the American Academy of Political and Social Science. 604(1), pp. 171 - 191. Cieslak, V. (2005.) “Ports in Louisiana: New Orleans, South Louisiana, and Baton Rouge.” CRS Report for Congress (RS22297. October 14, 2005. Costanza, R., R. d’Arge, et al. (1997). "The value of the world’s ecosystem services and natural capital." Nature 387 8. Council of Economic Advisors. (2000.) The Economic Report of the President: 2000. U.S. Government Printing Office. IPET (Interagency Performance Evaluation Taskforce.( (2009.) Performance evaluation of the New Orleans and Southeast Louisiana Hurricane protection system. Volume VII – the
Consequences. (Final Report), June 2009. Kumins, L. and R. Bamberger. (2005.) “Oil and Gas Disruption from Hurricanes Katrina and Rita.” CRS Report for Congress (RL33124.) October 21, 2005.
Lipton, E. (2006.) “White House Declines to Provide Storm Papers.” The New York Times. January 25, 2006. http://www.nytimes.com/2006/01/25/politics/25katrina.html?pagewanted=all Mileti, D. (1999). Disasters by Design: A Reassessment of Natural Hazards in the United States. National Academies Press. Smith, J. (2006.) “Hurricane Katrina – Long term recovery challenges.” Governor’s Office of Homeland Security & Emergency Preparedness. September 22, 2006. Walsh, B. (2006.) “State takes long road to share in oil revenue, Louisiana rejected Truman’s 1949 offer.” The Times-Picayune Sunday, December 10, 2006.
18
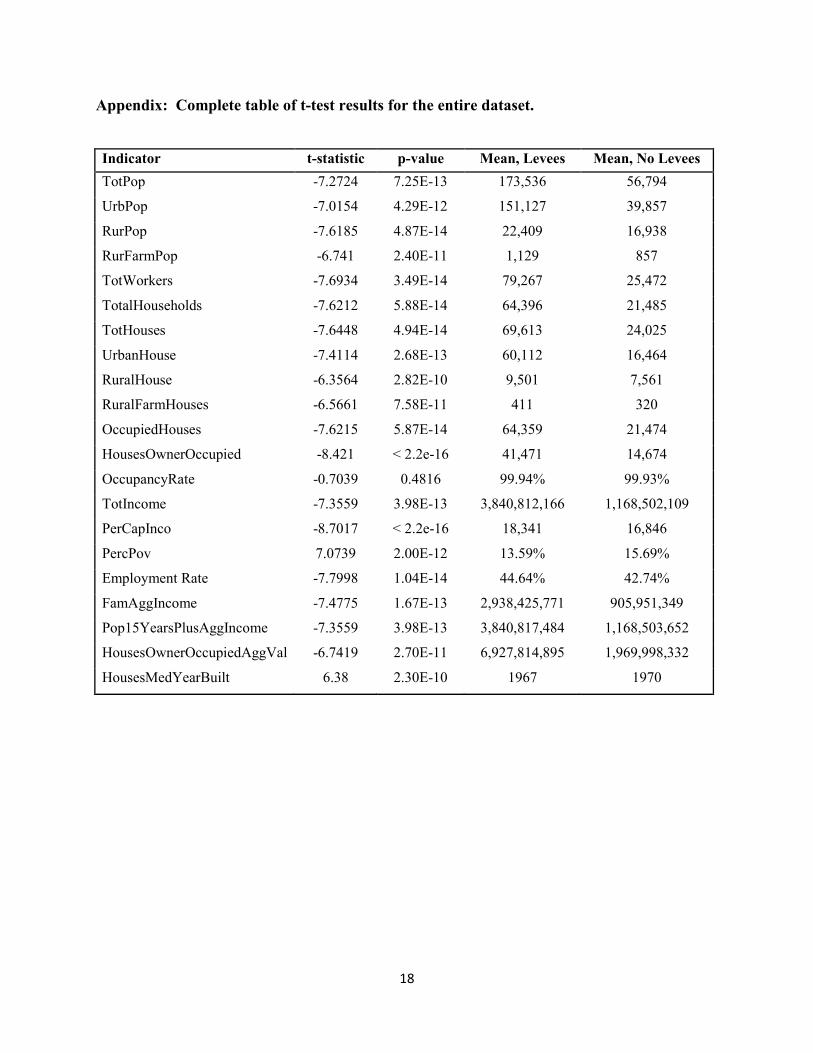
Appendix: Complete table of t-test results for the entire dataset.
Indicator t-statistic p-value Mean, Levees Mean, No Levees
TotPop -7.2724 7.25E-13 173,536 56,794
UrbPop -7.0154 4.29E-12 151,127 39,857
RurPop -7.6185 4.87E-14 22,409 16,938
RurFarmPop -6.741 2.40E-11 1,129 857
TotWorkers -7.6934 3.49E-14 79,267 25,472
TotalHouseholds -7.6212 5.88E-14 64,396 21,485
TotHouses -7.6448 4.94E-14 69,613 24,025
UrbanHouse -7.4114 2.68E-13 60,112 16,464
RuralHouse -6.3564 2.82E-10 9,501 7,561
RuralFarmHouses -6.5661 7.58E-11 411 320
OccupiedHouses -7.6215 5.87E-14 64,359 21,474
HousesOwnerOccupied -8.421 < 2.2e-16 41,471 14,674
OccupancyRate -0.7039 0.4816 99.94% 99.93%
TotIncome -7.3559 3.98E-13 3,840,812,166 1,168,502,109
PerCapInco -8.7017 < 2.2e-16 18,341 16,846
PercPov 7.0739 2.00E-12 13.59% 15.69%
Employment Rate -7.7998 1.04E-14 44.64% 42.74%
FamAggIncome -7.4775 1.67E-13 2,938,425,771 905,951,349
Pop15YearsPlusAggIncome -7.3559 3.98E-13 3,840,817,484 1,168,503,652
HousesOwnerOccupiedAggVal -6.7419 2.70E-11 6,927,814,895 1,969,998,332
HousesMedYearBuilt 6.38 2.30E-10 1967 1970
Related Documents