Jim Johannessen 135 Assessing Littoral Sediment Supply (Feeder Bluffs) and Beach Condition in King and Southern Snohomish Counties, Puget Sound, Washington Jim Johannessen 1 Introduction Bluffs are present along the majority of Puget Sound shores (Shipman, 2004 and 2008), and the input of sediment from these bluffs is thought to account for the large majority of the total sediment input to Puget Sound beaches (Keuler, 1988; Shipman, 2004). Beaches, or accumulations of loose sand and gravel, are present along almost all of Central Puget Sound (fig. 1). Beaches here typically consist of mixed gravel and sand deposits at the toe of bluffs or along low elevation backshores. Beaches and bluffs are components of littoral cells, a concept that has been employed in coastal studies to represent a coastal sediment transport sector from a source area to depositional area at the cell terminus (Inman and Chamberlain, 1960), and which emphasizes a systems approach to understanding coastal evolution. An idealized littoral cell in Puget Sound is defined as consisting of three components: a site (usually along erosional bluffs) that serves as the sediment source and origin of a drift cell; a zone of transport, where sediment may be deposited temporarily and waves transport sediment alongshore; and an area of deposition (and transport), which is the terminus of a drift cell (Jacobson and Schwartz, 1981). Littoral cells are often called net shore-drift cells in Puget Sound (Jacobsen and Schwartz, 1981) or just drift cells. Littoral cells have been mapped throughout the greater Puget Sound area using geomorphic indicators of long-term, littoral sediment supply and transport (Schwartz and others, 1991, Johannessen 1992). 1 Coastal Geologic Services Inc., Bellingham Washington, www.coastalgeo. com, phone 360 647-1845. Abstract. The term feeder bluff, as defined by Wolf Bauer in the mid-1970s, refers to eroding bluffs that provide the majority of sediment to Puget Sound beaches and littoral cells. Shore modifications such as shoreline armoring/bulkheads have substantially changed Puget Sound nearshore conditions and impacted nearshore habitats. Feeder bluff mapping was completed to allow for “process-based” restoration, the strategy adopted in Puget Sound to restore and protect self-sustaining processes that create and sustain valued nearshore habitats. The geomorphic mapping methods developed by Coastal Geologic Services entail assessment of individual shore reaches using data from present and historic times separately, using a geomorphic systems approach. Methods were developed to efficiently identify feeder bluff segments for protection (conservation) and restoration (armor removal) at both the site-specific and drift cell levels. The study discussed here evaluated bluff and beach segments within 121 miles of shore in King and southern Snohomish Counties in Central Puget Sound. Highlights of current and historic geomorphic (feeder bluff) mapping and sediment supply-based conservation and restoration prioritizations are presented to demonstrate the uses and value of this dataset. Shore modifications were present along 59 percent of the total study area length in current conditions. When comparing current to historic sediment sources, there was a 63.4 percent loss for the entire study area. On a broader scale, current conditions mapping has been completed along more than 800 miles and historic conditions along 385 miles out of approximately 2,000 miles of greater Puget Sound shore to date. Of 99 littoral cells with current and historic feeder bluff mapping data (250 miles) from this study area and others, 14 drift cells no longer had any intact nearshore sediment sources, 29 drift cells had lost 50 percent or more of the (linear extent) of historic sediment sources, 23 drift cells had lost 1–50 percent of the of historic sediment sources, and 33 drift cells had not incurred a loss of sediment sources. These data illustrate the magnitude of sediment impoundment in the Puget Sound region and the necessity of restoring (removing armoring) and conserving (protecting) bluff sediment sources in order to maintain the processes that create and maintain nearshore habitats. Completing the dataset Sound-wide would enable systematic restoration and conservation planning based on coastal processes.

Welcome message from author
This document is posted to help you gain knowledge. Please leave a comment to let me know what you think about it! Share it to your friends and learn new things together.
Transcript
Jim Johannessen 135
Assessing Littoral Sediment Supply (Feeder Bluffs) and Beach Condition in King and Southern Snohomish Counties, Puget Sound, Washington
Jim Johannessen1
IntroductionBluffs are present along the majority of Puget Sound
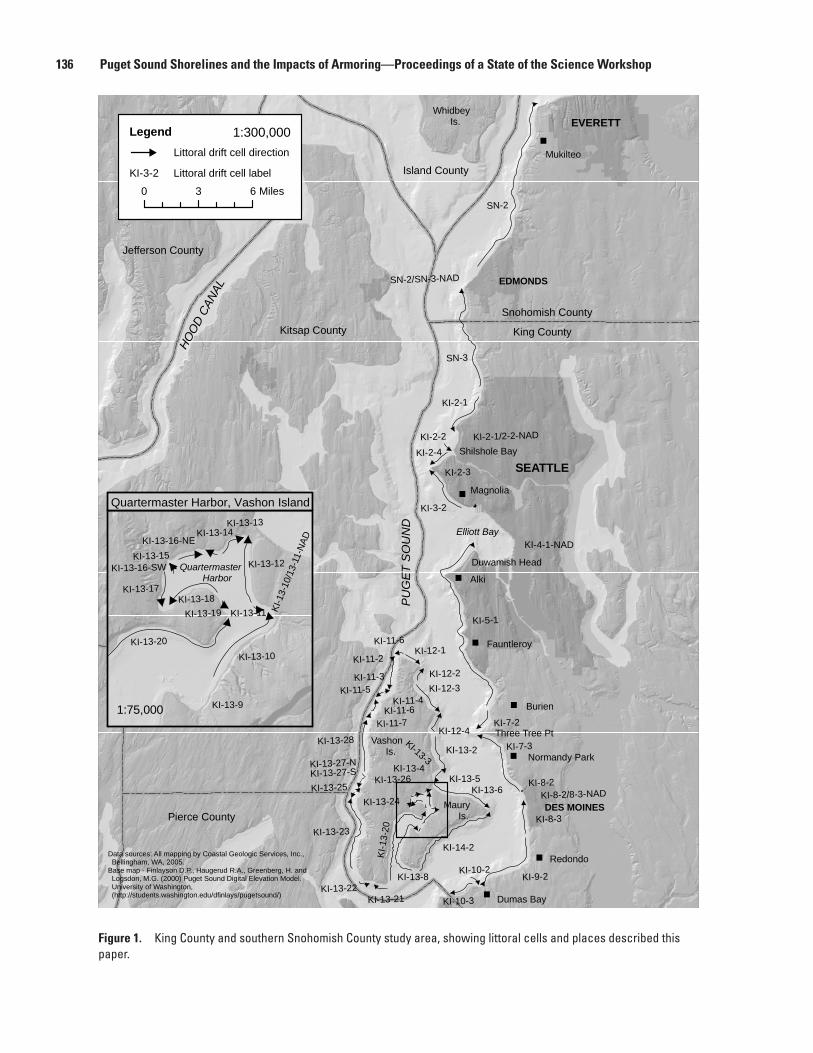
shores (Shipman, 2004 and 2008), and the input of sediment from these bluffs is thought to account for the large majority of the total sediment input to Puget Sound beaches (Keuler, 1988; Shipman, 2004). Beaches, or accumulations of loose sand and gravel, are present along almost all of Central Puget Sound (fig. 1). Beaches here typically consist of mixed gravel and sand deposits at the toe of bluffs or along low elevation backshores. Beaches and bluffs are components of littoral cells, a concept that has been employed in coastal studies to represent a coastal sediment transport sector from a source area to depositional area at the cell terminus (Inman
and Chamberlain, 1960), and which emphasizes a systems approach to understanding coastal evolution. An idealized littoral cell in Puget Sound is defined as consisting of three components: a site (usually along erosional bluffs) that serves as the sediment source and origin of a drift cell; a zone of transport, where sediment may be deposited temporarily and waves transport sediment alongshore; and an area of deposition (and transport), which is the terminus of a drift cell (Jacobson and Schwartz, 1981). Littoral cells are often called net shore-drift cells in Puget Sound (Jacobsen and Schwartz, 1981) or just drift cells. Littoral cells have been mapped throughout the greater Puget Sound area using geomorphic indicators of long-term, littoral sediment supply and transport (Schwartz and others, 1991, Johannessen 1992).
1 Coastal Geologic Services Inc., Bellingham Washington, www.coastalgeo.com, phone 360 647-1845.
Abstract. The term feeder bluff, as defined by Wolf Bauer in the mid-1970s, refers to eroding bluffs that provide the majority of sediment to Puget Sound beaches and littoral cells. Shore modifications such as shoreline armoring/bulkheads have substantially changed Puget Sound nearshore conditions and impacted nearshore habitats. Feeder bluff mapping was completed to allow for “process-based” restoration, the strategy adopted in Puget Sound to restore and protect self-sustaining processes that create and sustain valued nearshore habitats. The geomorphic mapping methods developed by Coastal Geologic Services entail assessment of individual shore reaches using data from present and historic times separately, using a geomorphic systems approach. Methods were developed to efficiently identify feeder bluff segments for protection (conservation) and restoration (armor removal) at both the site-specific and drift cell levels. The study discussed here evaluated bluff and beach segments within 121 miles of shore in King and southern Snohomish Counties in Central Puget Sound. Highlights of current and historic geomorphic (feeder bluff) mapping and sediment supply-based conservation and restoration prioritizations are presented to demonstrate the uses and value of this dataset. Shore modifications were present along 59 percent of the total study area length in current conditions. When comparing current to historic sediment sources, there was a 63.4 percent loss for the entire study area. On a broader scale, current conditions mapping has been completed along more than 800 miles and historic conditions along 385 miles out of approximately 2,000 miles of greater Puget Sound shore to date. Of 99 littoral cells with current and historic feeder bluff mapping data (250 miles) from this study area and others, 14 drift cells no longer had any intact nearshore sediment sources, 29 drift cells had lost 50 percent or more of the (linear extent) of historic sediment sources, 23 drift cells had lost 1–50 percent of the of historic sediment sources, and 33 drift cells had not incurred a loss of sediment sources. These data illustrate the magnitude of sediment impoundment in the Puget Sound region and the necessity of restoring (removing armoring) and conserving (protecting) bluff sediment sources in order to maintain the processes that create and maintain nearshore habitats. Completing the dataset Sound-wide would enable systematic restoration and conservation planning based on coastal processes.
136 Puget Sound Shorelines and the Impacts of Armoring—Proceedings of a State of the Science Workshop
Figure 1. King County and southern Snohomish County study area, showing littoral cells and places described this paper.
KI-11-6KI-12-1
KI-12-4
KI-12-3
KI-11-2
KI-11-3
KI-11-4KI-11-5
KI-11-6KI-11-7
KI-13-28KI-13-2
KI-13-27-NKI-13-27-S
KI-13-3KI-13-4
KI-13-5KI-13-6
KI-14-2
KI-13-8
KI-1
3-20
KI-13-21KI-13-22
KI-13-23
KI-13-24
KI-13-26KI-13-25
SN-2
SN-3
KI-2-1
KI-2-1/2-2-NADKI-2-2
KI-2-3
KI-2-4
KI-3-2
KI-4-1-NAD
KI-5-1
KI-12-2
KI-7-2
KI-7-3
KI-8-2KI-8-2/8-3-NAD
KI-8-3
KI-9-2KI-10-2
KI-10-3
SN-2/SN-3-NAD
Snohomish County
King County
Jefferson County
Kitsap County
Island County
EVERETT
EDMONDS
SEATTLE
Mukilteo
Shilshole Bay
Magnolia
Alki
Fauntleroy
Burien
Normandy Park
DES MOINES
Redondo
Dumas Bay
Maury Is.
Vashon Is.
Three Tree Pt
Duwamish Head
Whidbey Is.
Elliott Bay
PU
GE
T S
OU
ND
HOO
D CA
NAL
Pierce County
Data sources: All mapping by Coastal Geologic Services, Inc., Bellingham, WA, 2005.Base map - Finlayson D.P., Haugerud R.A., Greenberg, H. and Logsdon, M.G. (2000) Puget Sound Digital Elevation Model. University of Washington, (http://students.washington.edu/dfinlays/pugetsound/)
KI-13-9
KI-1
3-10
/13-
11-N
AD
KI-13-10
KI-13-13
KI-13-12KI-13-15
KI-13-14
KI-13-11
KI-13-16-NE
KI-13-16-SW
KI-13-17KI-13-18
KI-13-19
KI-13-20
Quartermaster Harbor
1:75,000
Quartermaster Harbor, Vashon Island
1:300,000Legend
KI-3-2 Littoral drift cell label
Littoral drift cell direction
0 3 6 Miles
Jim Johannessen 137
Geomorphic based mapping of littoral cells has been widely accepted and used in Puget Sound studies, and littoral cells comprised the basic unit for the recently completed shore typology “change analysis” completed for the Puget Sound Nearshore Ecosystem Restoration Project (PSNERP) and US Army Corps of Engineers (Simenstad and others, 2010). However, feeder bluff mapping differs from this recent typology mapping in that feeder bluffs define a landform specifically linked with a physical process—the delivery of new sediment to the littoral system. Feeder bluff mapping follows some of the same general geomorphic principles of littoral/net shore-drift mapping completed in Washington State. Examples of geomorphic indicators used in both net shore-drift mapping and feeder bluff mapping include the direction of spit progradation (Hunter and others, 1979), progressive change in bluff morphology and vegetation cover (McGreal, 1979), and alongshore sediment size gradation (Self, 1977). Less rigorous methods for feeder bluff mapping were developed by Bauer (1976) in Whatcom County in the 1970s. These data have been superseded by recent mapping by Coastal Geologic Services (Johannessen and Chase, 2005b).
The declining health of Pacific salmon and other species has been linked to habitat loss resulting from the proliferation of shore modification structures such as bulkheads. Bluff sediment input to littoral cells is critical to the integrity of nearshore habitats associated with beaches (MacDonald and others, 1994), such as tidal wetlands. However, detailed studies of bluff erosion rates, feeder bluff mapping, and littoral sediment budget work have been very limited in the complex Puget Sound region (Johannessen and MacLennan, 2007). Recent feeder bluff mapping was carried out to partially fill the data gap of accurate locations of feeder bluffs and related geomorphic shoretypes that has hindered restoration and conservation planning efforts to maintain physical processes. Additionally, most local shoreline management programs prohibit or substantially limit armoring of feeder bluffs, yet these areas were not even mapped for current conditions (Johannessen and Chase, 2005a). Detailed historic pre-development feeder bluff mapping also was lacking. The most detailed historic data source is the topographic (T-sheet) maps produced in the late 1800s by government surveyors (University of Washington, 2009, at http://riverhistory.ess.washington.edu/). However, when examined in detail, this map set highlighted only those areas that were the most obviously erosional. Also, bluff mapping was inconsistent from one T-sheet to the next, which further limited their use to map historic bluffs. Efforts to recreate historic conditions by relying heavily on T-sheets such as Simenstad and others (2010) did not result in an accurate representation of feeder bluffs. Hence, the studies discussed herein continue to be initiated county by county to allow for management and planning for protecting and restoring natural sediment processes. These local feeder bluff mapping results have been utilized by a wide variety of groups working in the Puget Sound nearshore, including counties, Native American Tribes,
Marine Resource Committees (MRCs), Watershed Resources Inventory Areas (WRIAs), regional salmon enhancement groups and others.
We evaluated our method of mapping feeder bluffs to methods used in previous work by comparing results for a 44-mi section of shoreline on Whidbey Island (Johannessen and Chase, 2005a). The comparison revealed that mapped “eroding bluff” and “feeding” areas in the Coastal Zone Atlas of Washington (Washington Department of Ecology, 1979) agreed very poorly with those determined by other methods (as also pointed out by Keuler, 1988). Mapping at the coarse scale of 1:100,000 by Keuler (1988) did not capture many shorter feeder bluff segments and the study results did not fully agree with the new data (Johannessen and Chase, 2005a). A different unpublished comparative analysis examined how the occurrence of littoral cell “divergence zones” (areas contributing sediment to two adjacent littoral cells; Schwartz and others, 1991) matched mapped feeder bluffs in the same Whidbey Island area. That analysis revealed that divergence zones generally were within mapped feeder bluffs, but accounted for only 24 percent of mapped feeder bluffs.
Feeder Bluff Mapping in King and Southern Snohomish Counties
Feeder bluff mapping within Water Resources Inventory Areas (WRIA) 8 and 9 was funded by the King County Department of Natural Resources and Parks in order to provide process-based data and analysis for the Puget Sound shore (Johannessen and others, 2005). The study entailed field mapping to document the current geomorphic conditions within the study area (fig. 1), followed by research into the historic condition of all currently modified shores within this mostly urban marine environment. Detailed mapping of feeder bluff and accretion shoreforms was carried out for both current and historic conditions at 1:24,000 scale for the approximately 121 lineal mi of the King County and southern Snohomish County study area.
Mapping Current ConditionsSpecific mapping rules for feeder bluff delineation
were developed by an advisory board that contained U.S. Geological Survey coastal and upland mappers, the Washington Department of Ecology coastal geologist, and Coastal Geologic Services (CGS) for one of the first modern feeder bluff mapping projects (Johannessen and Chase, 2005a). Field personnel working from a small boat throughout the King County and southern Snohomish County study area assigned segments of the shore to one of six different shoretypes on the basis of geomorphic evidence, as defined below and summarized in table 1.
138 Puget Sound Shorelines and the Impacts of Armoring—Proceedings of a State of the Science Workshop
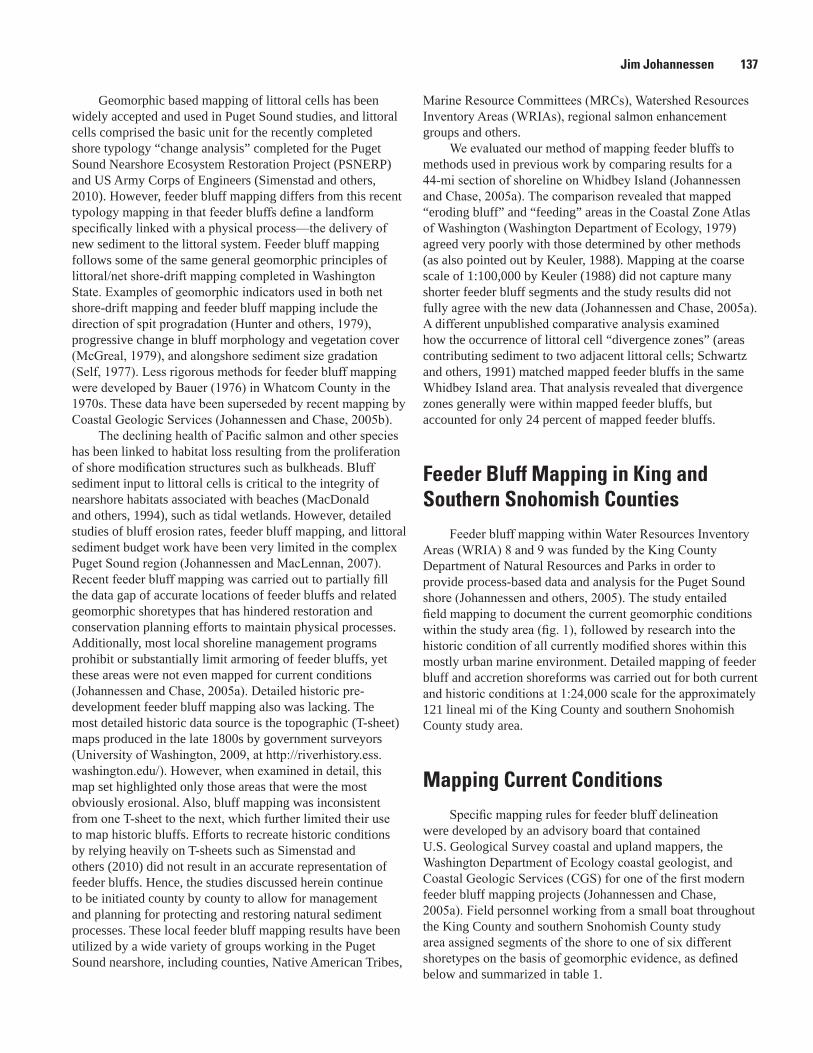
Table 1. Mapping criteria for geomorphic shoretypes.
[Developed from Johannessen and Chase 2005a]
Presence of (priority in order)
Absence of
Feeder Bluff Exceptional (FBE)
1. Bluff/ bank 1. Shoreline bulkhead/ fill2. Recent landslide scarps 2. Backshore3. Bluff toe erosion 3. Old/ rotten logs4. Abundant sand/gravel in bluff 4. Coniferous bluff veg.5. Colluvium/ slide debris 6. Primarily unvegetated or vegetated slumps7. Trees across beach8. Boulder/ cobble lag9. Steep bluff (relative alongshore)
Feeder Bluff (FB)
1. Bluff/ bank 1. Shoreline bulkhead/ fill 2. Past landslide scarps 2. Backshore3. Intermittent toe erosion 3. Old/ rotten logs4. Moderate amount sand/gravel in bluff 4. Coniferous bluff veg.5. Intermittent Colluvium 6. Minimal vegetation7. Trees across beach8. Boulder/ cobble lag9. Steep bluff (relative alongshore)
Transport Zone (TZ)
1. Coniferous bluff vegetation 1. Visible landslide scarps2. Apparent relative bluff stability 2. Toe erosion 3. Gentle slope bluff (relative alongshore) 3. Backshore & backshore vegetation4. Unbulkheaded transport zone adjacent 4. Old/ rotten logs5. Bulkhead may be present 5. Colluvium
6. Trees across beach 7. Bulkhead may be absent
Modified (MOD or MOD-BNSF)
1. Bluff/ bank 1. Backshore & backshore vegetation2. Shoreline bulkhead (mostly intact) 2. Lagoon/ wetland/ marsh behind berm 3. Substantial shoreline fill 3. Backshore “platform”
4. Old/ rotten logs5. Fine, well-sorted sediment
(relative alongshore)
Accretion Shoreform (AS)
1. Backshore & backshore vegetation 1. Bank/ bluff in backshore2. Lagoon/ wetland/ marsh behind berm 2. Toe erosion at bank3. Backshore “platform” 3. Landslide scarps4. Old/ rotten logs 4. Boulders on beachface5. Fine, well-sorted sediment
(relative alongshore)
No Appreciable Drift (NAD)
1. NAD mapping (WWU-Ecology) 1. Active beachface2. Embayment/ lagoon shore 2. Accretion shoreform indicators3. Low wave energy
Jim Johannessen 139
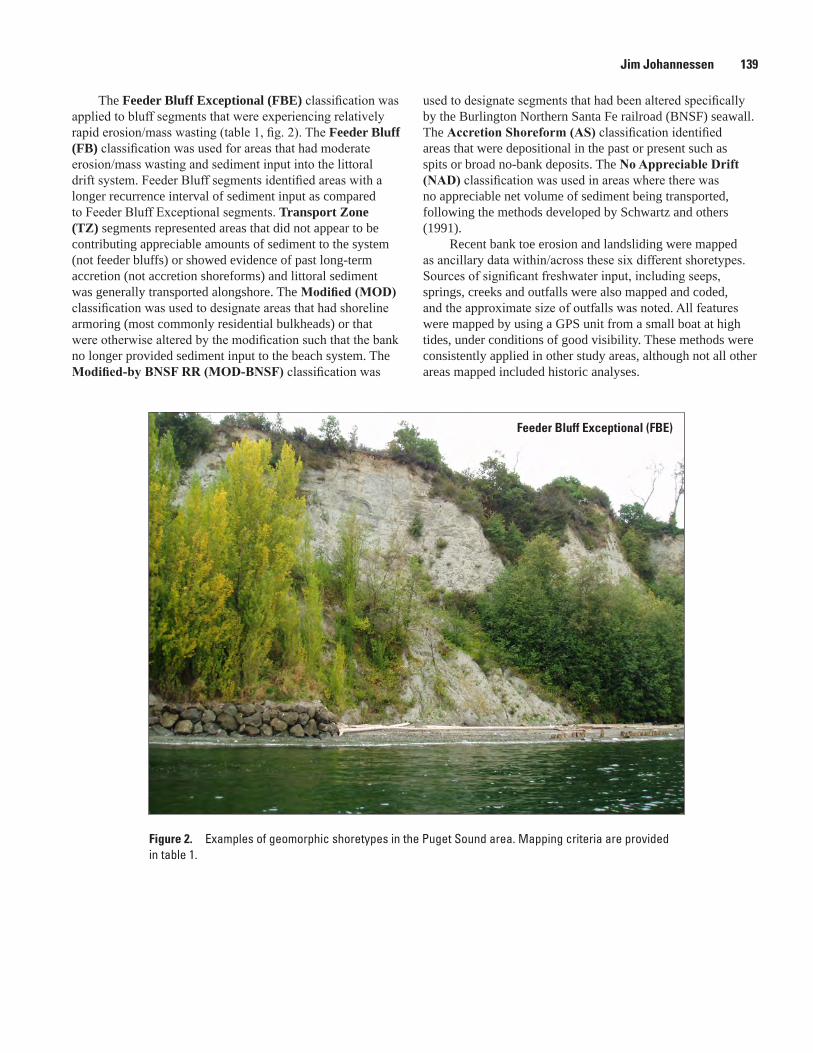
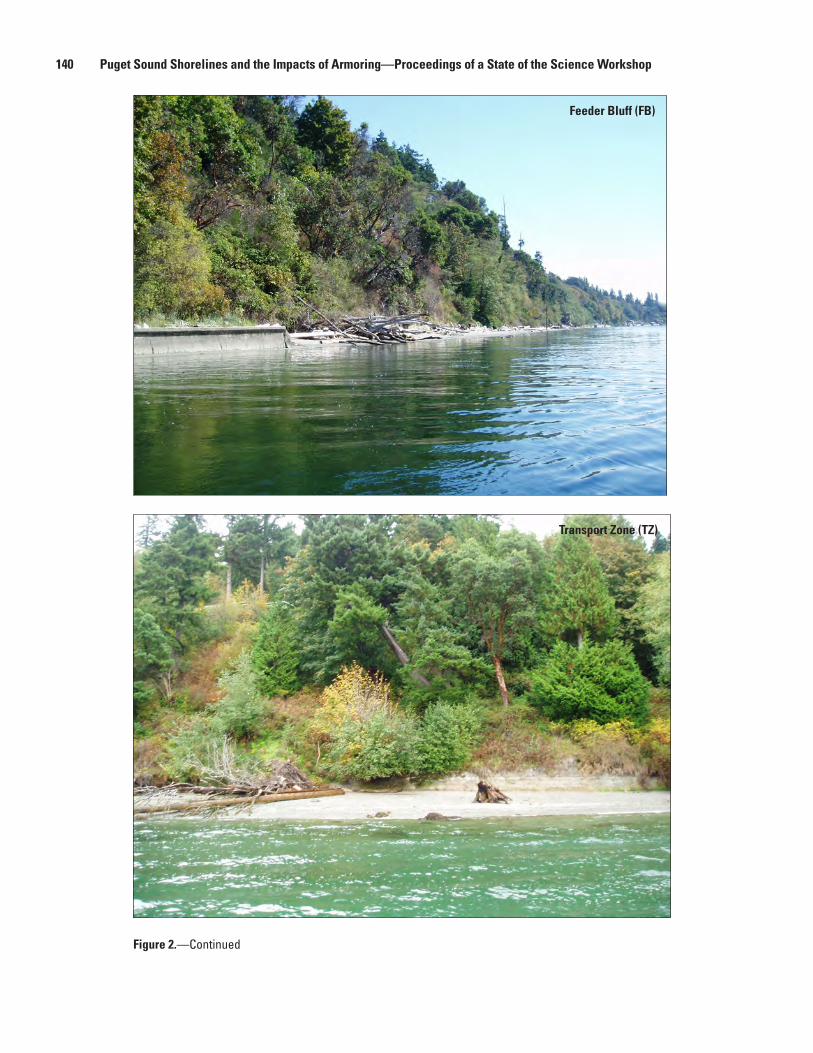
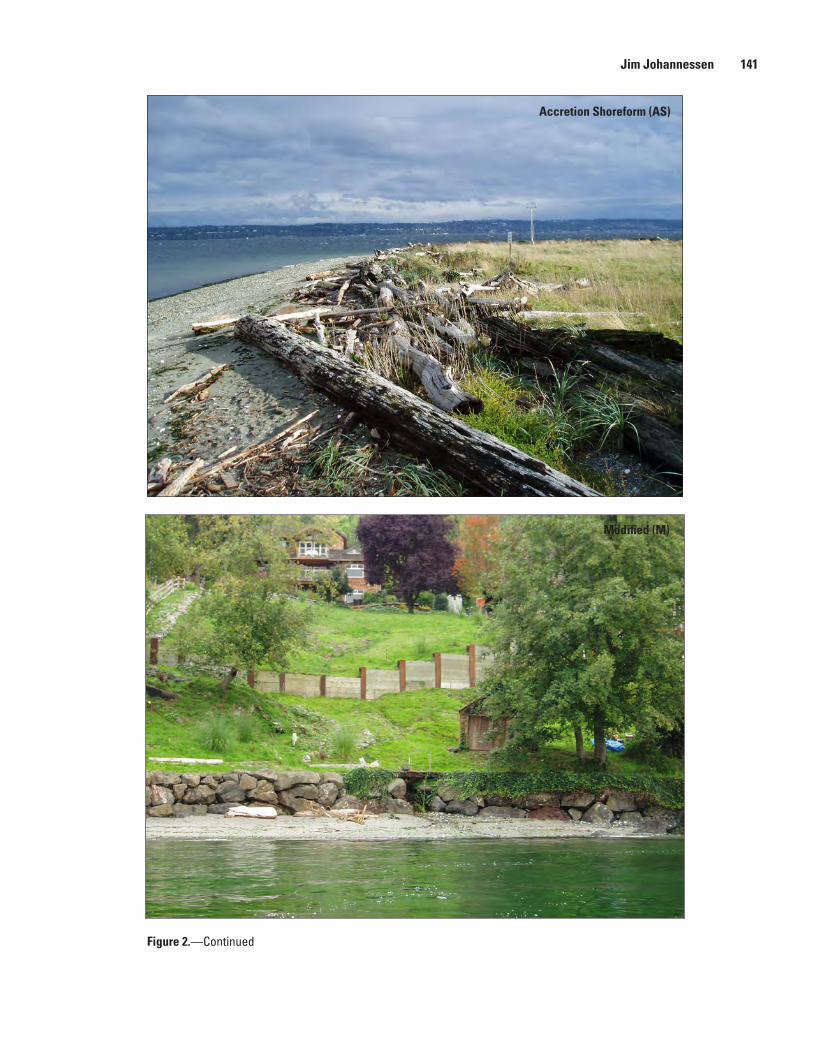
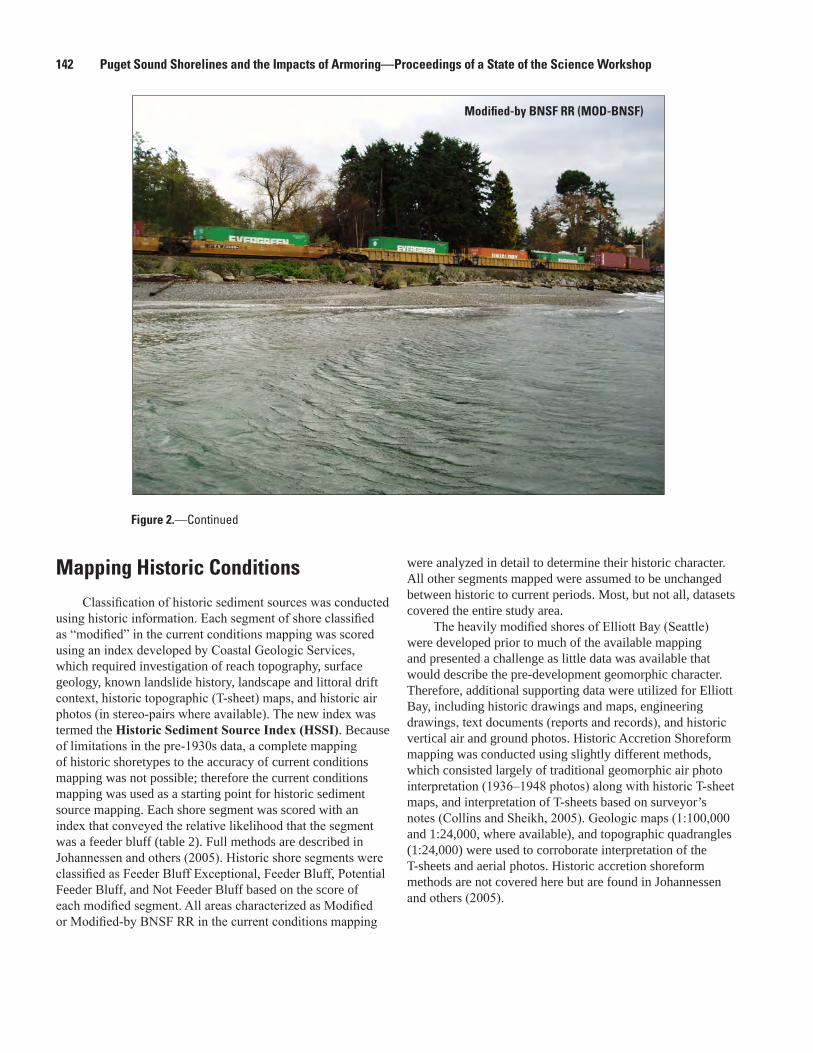
The Feeder Bluff Exceptional (FBE) classification was applied to bluff segments that were experiencing relatively rapid erosion/mass wasting (table 1, fig. 2). The Feeder Bluff (FB) classification was used for areas that had moderate erosion/mass wasting and sediment input into the littoral drift system. Feeder Bluff segments identified areas with a longer recurrence interval of sediment input as compared to Feeder Bluff Exceptional segments. Transport Zone (TZ) segments represented areas that did not appear to be contributing appreciable amounts of sediment to the system (not feeder bluffs) or showed evidence of past long-term accretion (not accretion shoreforms) and littoral sediment was generally transported alongshore. The Modified (MOD) classification was used to designate areas that had shoreline armoring (most commonly residential bulkheads) or that were otherwise altered by the modification such that the bank no longer provided sediment input to the beach system. The Modified-by BNSF RR (MOD-BNSF) classification was
used to designate segments that had been altered specifically by the Burlington Northern Santa Fe railroad (BNSF) seawall. The Accretion Shoreform (AS) classification identified areas that were depositional in the past or present such as spits or broad no-bank deposits. The No Appreciable Drift (NAD) classification was used in areas where there was no appreciable net volume of sediment being transported, following the methods developed by Schwartz and others (1991).
Recent bank toe erosion and landsliding were mapped as ancillary data within/across these six different shoretypes. Sources of significant freshwater input, including seeps, springs, creeks and outfalls were also mapped and coded, and the approximate size of outfalls was noted. All features were mapped by using a GPS unit from a small boat at high tides, under conditions of good visibility. These methods were consistently applied in other study areas, although not all other areas mapped included historic analyses.
Figure 2. Examples of geomorphic shoretypes in the Puget Sound area. Mapping criteria are provided in table 1.
Feeder Bluff Exceptional (FBE)
140 Puget Sound Shorelines and the Impacts of Armoring—Proceedings of a State of the Science Workshop
Figure 2.—Continued
Feeder Bluff (FB)
Transport Zone (TZ)
Jim Johannessen 141
Figure 2.—Continued
Modified (M)
Accretion Shoreform (AS)
142 Puget Sound Shorelines and the Impacts of Armoring—Proceedings of a State of the Science Workshop
Mapping Historic ConditionsClassification of historic sediment sources was conducted
using historic information. Each segment of shore classified as “modified” in the current conditions mapping was scored using an index developed by Coastal Geologic Services, which required investigation of reach topography, surface geology, known landslide history, landscape and littoral drift context, historic topographic (T-sheet) maps, and historic air photos (in stereo-pairs where available). The new index was termed the Historic Sediment Source Index (HSSI). Because of limitations in the pre-1930s data, a complete mapping of historic shoretypes to the accuracy of current conditions mapping was not possible; therefore the current conditions mapping was used as a starting point for historic sediment source mapping. Each shore segment was scored with an index that conveyed the relative likelihood that the segment was a feeder bluff (table 2). Full methods are described in Johannessen and others (2005). Historic shore segments were classified as Feeder Bluff Exceptional, Feeder Bluff, Potential Feeder Bluff, and Not Feeder Bluff based on the score of each modified segment. All areas characterized as Modified or Modified-by BNSF RR in the current conditions mapping
were analyzed in detail to determine their historic character. All other segments mapped were assumed to be unchanged between historic to current periods. Most, but not all, datasets covered the entire study area.
The heavily modified shores of Elliott Bay (Seattle) were developed prior to much of the available mapping and presented a challenge as little data was available that would describe the pre-development geomorphic character. Therefore, additional supporting data were utilized for Elliott Bay, including historic drawings and maps, engineering drawings, text documents (reports and records), and historic vertical air and ground photos. Historic Accretion Shoreform mapping was conducted using slightly different methods, which consisted largely of traditional geomorphic air photo interpretation (1936–1948 photos) along with historic T-sheet maps, and interpretation of T-sheets based on surveyor’s notes (Collins and Sheikh, 2005). Geologic maps (1:100,000 and 1:24,000, where available), and topographic quadrangles (1:24,000) were used to corroborate interpretation of the T-sheets and aerial photos. Historic accretion shoreform methods are not covered here but are found in Johannessen and others (2005).
Figure 2.—Continued
Modified-by BNSF RR (MOD-BNSF)
Jim Johannessen 143
Results of Current Conditions Mapping A total of 858 individual shoreline segments were
delineated for the study area (table 3), based on 1:24,000 mapping according to the rules described above (Johannessen and others, 2005). An example of mapping in a small portion of King County is shown in figure 3. The total length of modified shore was far greater than any other shoretype, representing 45.6 percent of the total study area length. In addition, the BNSF railway line and seawall north of Shilshole was mapped separately. “Modified-by BNSF RR” was the dominant mapped feature of the WRIA 8 portion of the study area, as it comprised an additional 13.4 percent of the entire study area shore. Cumulatively, modified shores (including those along Accretion Shoreforms (9.9 percent of the study area) and those along the BNSF railway) comprised 69 percent of the study area shore length. Only three drift cells in the study area remain completely unmodified.
Feeder Bluff Exceptional segments (highest sediment input into the nearshore) represented 3.3 percent of the study area and were mapped in only 29 individual segments in 10 drift cells under current conditions mapping (including Magnolia Bluffs, Maury Island, and southwest Vashon Island). Feeder Bluff segments were mapped along 15.1 percent of the study area shore cumulatively (table 3). Twenty-two drift cells (of 61 total cells and NAD areas mapped) had no intact sediment sources as a result of armoring. These represent a substantial number of drift cells generally considered as not properly functioning. Feeder Bluffs were more prevalent along the shores of Vashon and Maury islands as a result of a lesser extent of modification. Transport zone segments were mapped along only 4.1 percent of the study area (table 3) shore likely a result of the overall sediment-starved nature of most drift cells in the study area.
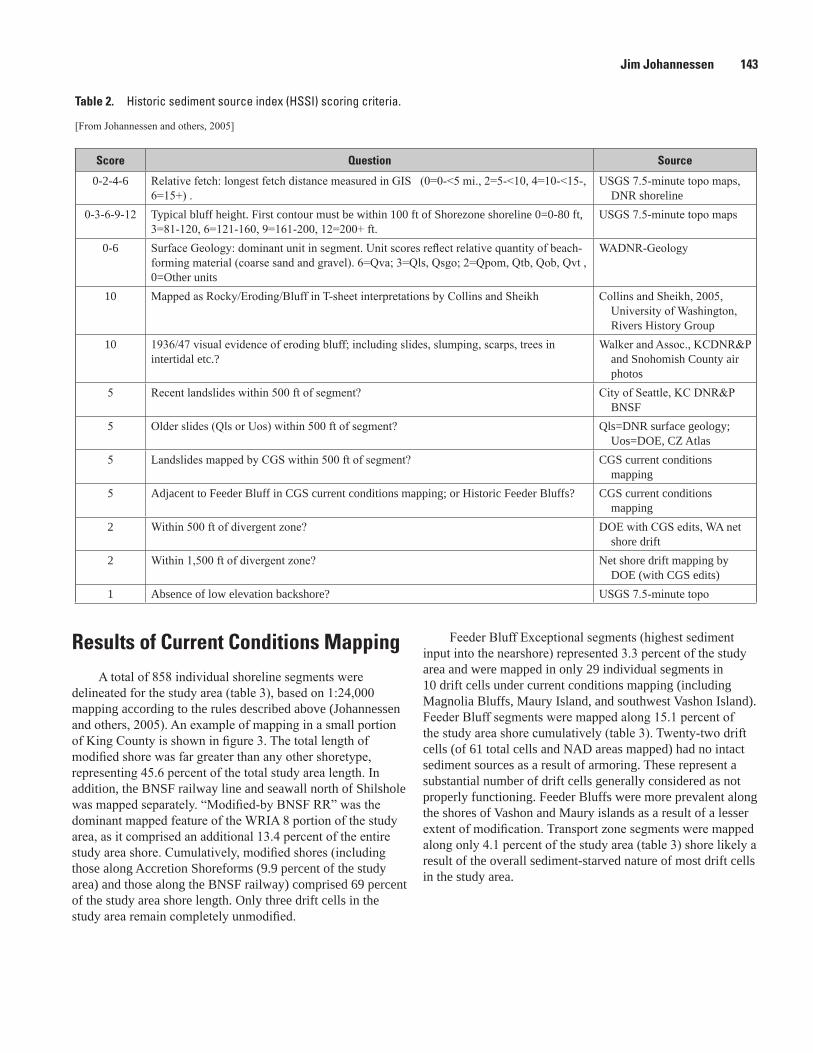
Table 2. Historic sediment source index (HSSI) scoring criteria.
[From Johannessen and others, 2005]
Score Question Source
0-2-4-6 Relative fetch: longest fetch distance measured in GIS (0=0-<5 mi., 2=5-<10, 4=10-<15-,6=15+) .
USGS 7.5-minute topo maps, DNR shoreline
0-3-6-9-12 Typical bluff height. First contour must be within 100 ft of Shorezone shoreline 0=0-80 ft,3=81-120, 6=121-160, 9=161-200, 12=200+ ft.
USGS 7.5-minute topo maps
0-6 Surface Geology: dominant unit in segment. Unit scores reflect relative quantity of beach-forming material (coarse sand and gravel). 6=Qva; 3=Qls, Qsgo; 2=Qpom, Qtb, Qob, Qvt ,0=Other units
WADNR-Geology
10 Mapped as Rocky/Eroding/Bluff in T-sheet interpretations by Collins and Sheikh Collins and Sheikh, 2005, University of Washington, Rivers History Group
10 1936/47 visual evidence of eroding bluff; including slides, slumping, scarps, trees inintertidal etc.?
Walker and Assoc., KCDNR&P and Snohomish County air photos
5 Recent landslides within 500 ft of segment? City of Seattle, KC DNR&P BNSF
5 Older slides (Qls or Uos) within 500 ft of segment? Qls=DNR surface geology; Uos=DOE, CZ Atlas
5 Landslides mapped by CGS within 500 ft of segment? CGS current conditions mapping
5 Adjacent to Feeder Bluff in CGS current conditions mapping; or Historic Feeder Bluffs? CGS current conditions mapping
2 Within 500 ft of divergent zone? DOE with CGS edits, WA net shore drift
2 Within 1,500 ft of divergent zone? Net shore drift mapping by DOE (with CGS edits)
1 Absence of low elevation backshore? USGS 7.5-minute topo

144 Puget Sound Shorelines and the Impacts of Armoring—Proceedings of a State of the Science Workshop
Figure 3. Example of current conditions mapping from Normandy Park in southern King County, Washington.
•
Jim Johannessen 145
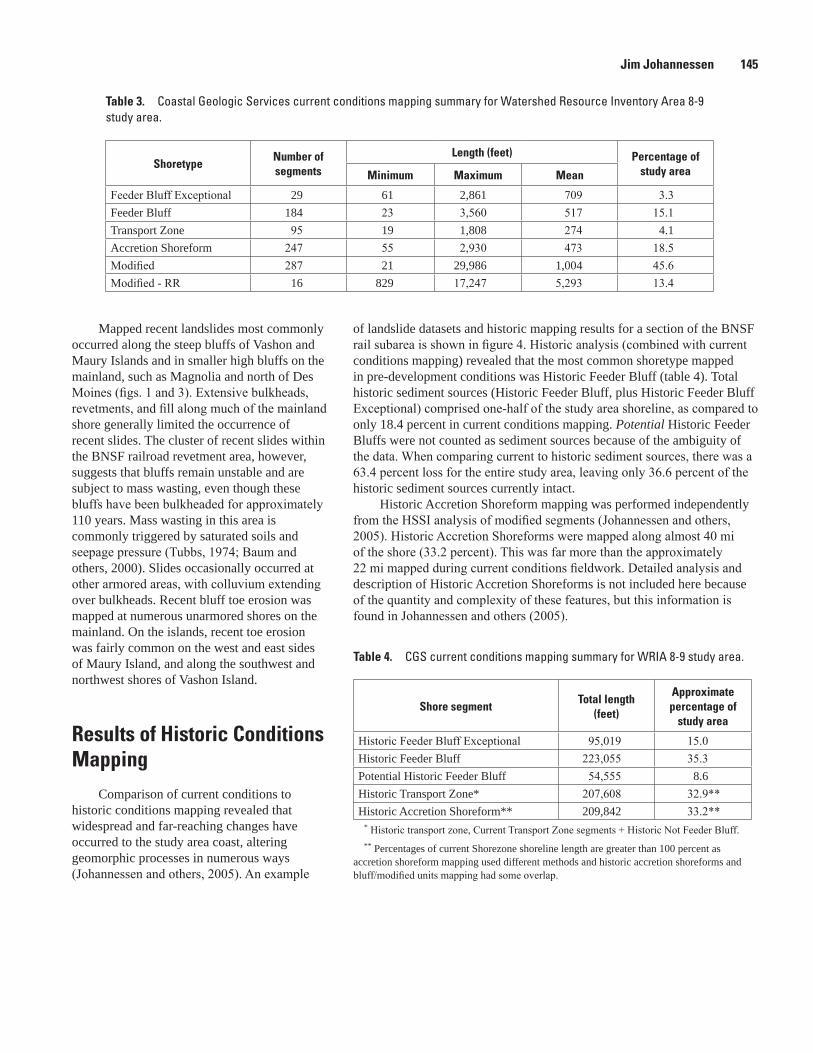
Table 3. Coastal Geologic Services current conditions mapping summary for Watershed Resource Inventory Area 8-9 study area.
ShoretypeNumber of segments
Length (feet) Percentage of study areaMinimum Maximum Mean
Feeder Bluff Exceptional 29 61 2,861 709 3.3Feeder Bluff 184 23 3,560 517 15.1Transport Zone 95 19 1,808 274 4.1Accretion Shoreform 247 55 2,930 473 18.5Modified 287 21 29,986 1,004 45.6Modified - RR 16 829 17,247 5,293 13.4
Mapped recent landslides most commonly occurred along the steep bluffs of Vashon and Maury Islands and in smaller high bluffs on the mainland, such as Magnolia and north of Des Moines (figs. 1 and 3). Extensive bulkheads, revetments, and fill along much of the mainland shore generally limited the occurrence of recent slides. The cluster of recent slides within the BNSF railroad revetment area, however, suggests that bluffs remain unstable and are subject to mass wasting, even though these bluffs have been bulkheaded for approximately 110 years. Mass wasting in this area is commonly triggered by saturated soils and seepage pressure (Tubbs, 1974; Baum and others, 2000). Slides occasionally occurred at other armored areas, with colluvium extending over bulkheads. Recent bluff toe erosion was mapped at numerous unarmored shores on the mainland. On the islands, recent toe erosion was fairly common on the west and east sides of Maury Island, and along the southwest and northwest shores of Vashon Island.
Results of Historic Conditions Mapping
Comparison of current conditions to historic conditions mapping revealed that widespread and far-reaching changes have occurred to the study area coast, altering geomorphic processes in numerous ways (Johannessen and others, 2005). An example
of landslide datasets and historic mapping results for a section of the BNSF rail subarea is shown in figure 4. Historic analysis (combined with current conditions mapping) revealed that the most common shoretype mapped in pre-development conditions was Historic Feeder Bluff (table 4). Total historic sediment sources (Historic Feeder Bluff, plus Historic Feeder Bluff Exceptional) comprised one-half of the study area shoreline, as compared to only 18.4 percent in current conditions mapping. Potential Historic Feeder Bluffs were not counted as sediment sources because of the ambiguity of the data. When comparing current to historic sediment sources, there was a 63.4 percent loss for the entire study area, leaving only 36.6 percent of the historic sediment sources currently intact.
Historic Accretion Shoreform mapping was performed independently from the HSSI analysis of modified segments (Johannessen and others, 2005). Historic Accretion Shoreforms were mapped along almost 40 mi of the shore (33.2 percent). This was far more than the approximately 22 mi mapped during current conditions fieldwork. Detailed analysis and description of Historic Accretion Shoreforms is not included here because of the quantity and complexity of these features, but this information is found in Johannessen and others (2005).
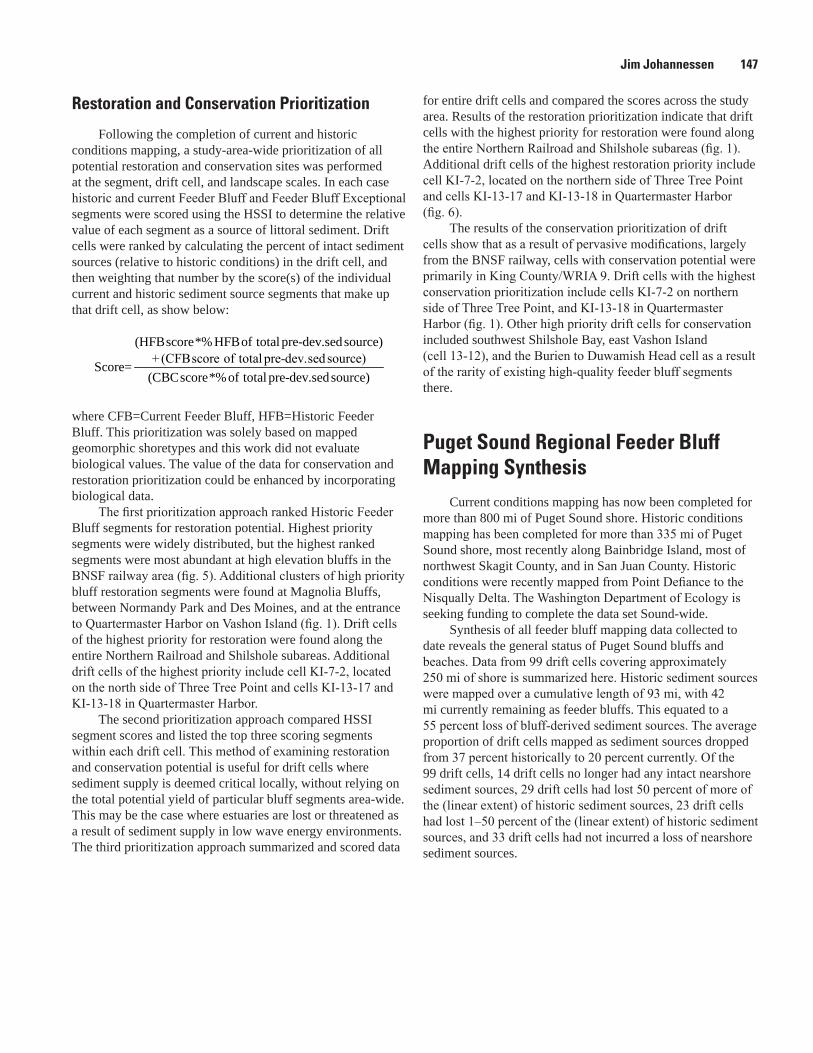
Table 4. CGS current conditions mapping summary for WRIA 8-9 study area.
Shore segmentTotal length
(feet)
Approximate percentage of
study area
Historic Feeder Bluff Exceptional 95,019 15.0Historic Feeder Bluff 223,055 35.3Potential Historic Feeder Bluff 54,555 8.6Historic Transport Zone* 207,608 32.9**Historic Accretion Shoreform** 209,842 33.2**
* Historic transport zone, Current Transport Zone segments + Historic Not Feeder Bluff.** Percentages of current Shorezone shoreline length are greater than 100 percent as
accretion shoreform mapping used different methods and historic accretion shoreforms and bluff/modified units mapping had some overlap.

146 Puget Sound Shorelines and the Impacts of Armoring—Proceedings of a State of the Science Workshop
Figure 4. Comparison of landslide map (A) with feeder bluff map (B) developed in this study for a portion of the BNSF railroad line in southern Snohomish County. Current conditions are mapped at the shoreline whereas historic conditions are shown slightly offshore.
B.A.
Jim Johannessen 147
Restoration and Conservation Prioritization
Following the completion of current and historic conditions mapping, a study-area-wide prioritization of all potential restoration and conservation sites was performed at the segment, drift cell, and landscape scales. In each case historic and current Feeder Bluff and Feeder Bluff Exceptional segments were scored using the HSSI to determine the relative value of each segment as a source of littoral sediment. Drift cells were ranked by calculating the percent of intact sediment sources (relative to historic conditions) in the drift cell, and then weighting that number by the score(s) of the individual current and historic sediment source segments that make up that drift cell, as show below:
(HFBscore*% HFBof total pre-dev.sedsource)+(CFBscore of total pre-dev.sedsource)Score=
(CBCscore*%of total pre-dev.sedsource)
where CFB=Current Feeder Bluff, HFB=Historic Feeder Bluff. This prioritization was solely based on mapped geomorphic shoretypes and this work did not evaluate biological values. The value of the data for conservation and restoration prioritization could be enhanced by incorporating biological data.
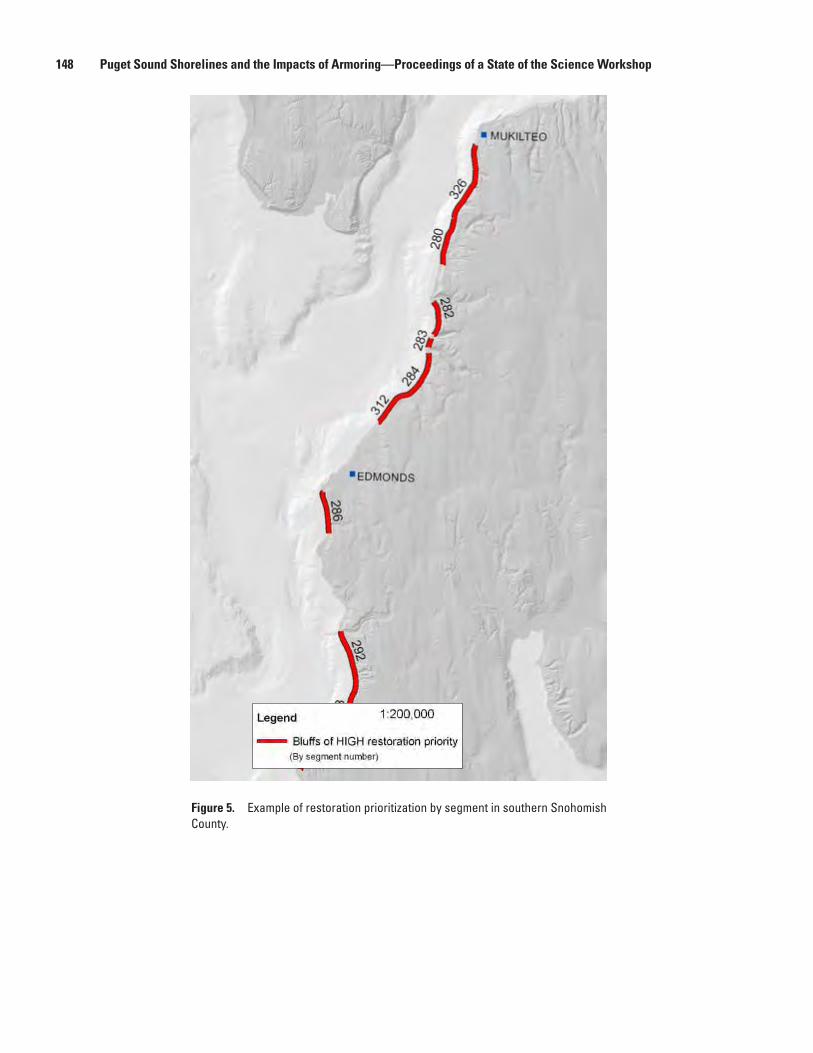
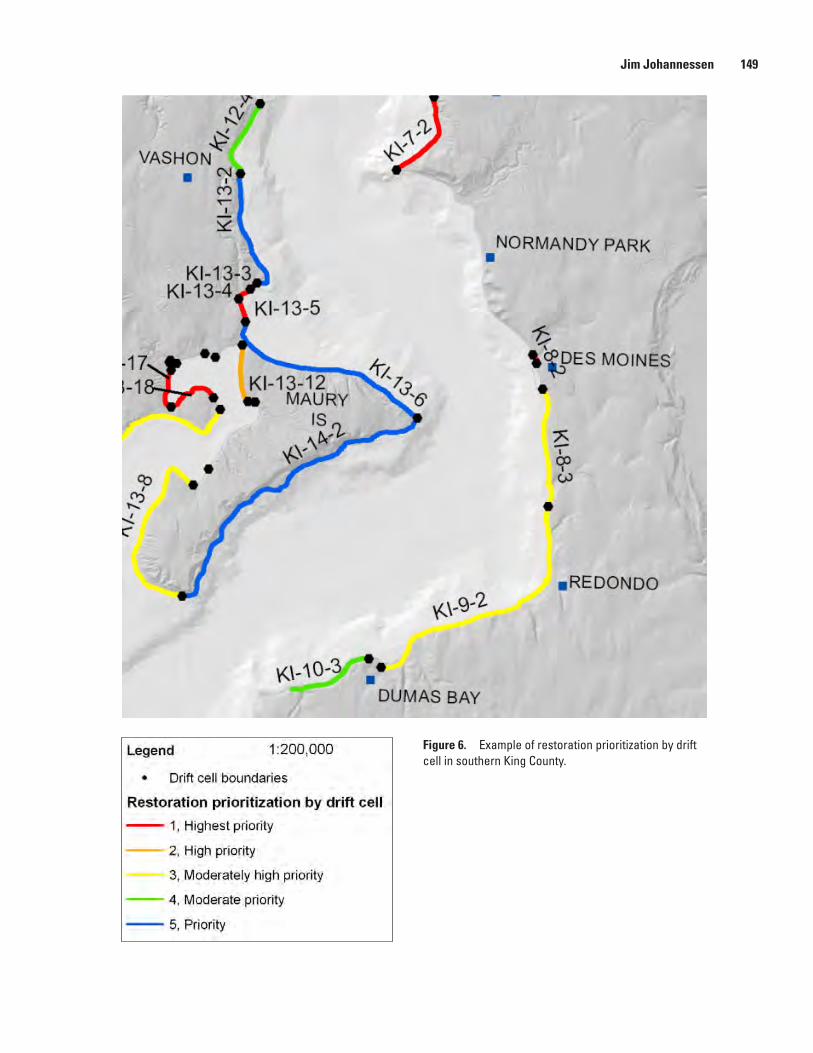
The first prioritization approach ranked Historic Feeder Bluff segments for restoration potential. Highest priority segments were widely distributed, but the highest ranked segments were most abundant at high elevation bluffs in the BNSF railway area (fig. 5). Additional clusters of high priority bluff restoration segments were found at Magnolia Bluffs, between Normandy Park and Des Moines, and at the entrance to Quartermaster Harbor on Vashon Island (fig. 1). Drift cells of the highest priority for restoration were found along the entire Northern Railroad and Shilshole subareas. Additional drift cells of the highest priority include cell KI-7-2, located on the north side of Three Tree Point and cells KI-13-17 and KI-13-18 in Quartermaster Harbor.
The second prioritization approach compared HSSI segment scores and listed the top three scoring segments within each drift cell. This method of examining restoration and conservation potential is useful for drift cells where sediment supply is deemed critical locally, without relying on the total potential yield of particular bluff segments area-wide. This may be the case where estuaries are lost or threatened as a result of sediment supply in low wave energy environments. The third prioritization approach summarized and scored data
for entire drift cells and compared the scores across the study area. Results of the restoration prioritization indicate that drift cells with the highest priority for restoration were found along the entire Northern Railroad and Shilshole subareas (fig. 1). Additional drift cells of the highest restoration priority include cell KI-7-2, located on the northern side of Three Tree Point and cells KI-13-17 and KI-13-18 in Quartermaster Harbor (fig. 6).
The results of the conservation prioritization of drift cells show that as a result of pervasive modifications, largely from the BNSF railway, cells with conservation potential were primarily in King County/WRIA 9. Drift cells with the highest conservation prioritization include cells KI-7-2 on northern side of Three Tree Point, and KI-13-18 in Quartermaster Harbor (fig. 1). Other high priority drift cells for conservation included southwest Shilshole Bay, east Vashon Island (cell 13-12), and the Burien to Duwamish Head cell as a result of the rarity of existing high-quality feeder bluff segments there.
Puget Sound Regional Feeder Bluff Mapping Synthesis
Current conditions mapping has now been completed for more than 800 mi of Puget Sound shore. Historic conditions mapping has been completed for more than 335 mi of Puget Sound shore, most recently along Bainbridge Island, most of northwest Skagit County, and in San Juan County. Historic conditions were recently mapped from Point Defiance to the Nisqually Delta. The Washington Department of Ecology is seeking funding to complete the data set Sound-wide.
Synthesis of all feeder bluff mapping data collected to date reveals the general status of Puget Sound bluffs and beaches. Data from 99 drift cells covering approximately 250 mi of shore is summarized here. Historic sediment sources were mapped over a cumulative length of 93 mi, with 42 mi currently remaining as feeder bluffs. This equated to a 55 percent loss of bluff-derived sediment sources. The average proportion of drift cells mapped as sediment sources dropped from 37 percent historically to 20 percent currently. Of the 99 drift cells, 14 drift cells no longer had any intact nearshore sediment sources, 29 drift cells had lost 50 percent of more of the (linear extent) of historic sediment sources, 23 drift cells had lost 1–50 percent of the (linear extent) of historic sediment sources, and 33 drift cells had not incurred a loss of nearshore sediment sources.
148 Puget Sound Shorelines and the Impacts of Armoring—Proceedings of a State of the Science Workshop
Figure 5. Example of restoration prioritization by segment in southern Snohomish County.
Jim Johannessen 149
Figure 6. Example of restoration prioritization by drift cell in southern King County.
150 Puget Sound Shorelines and the Impacts of Armoring—Proceedings of a State of the Science Workshop
Summary and DiscussionFeeder bluffs refer to eroding bluffs that provide
significant sediment to Puget Sound beaches and littoral cells (Bauer, 1976). Shore modifications such as bulkheads and fill have substantially changed Puget Sound sediment supply and nearshore habitats. Feeder bluffs were mapped in King and southern Snohomish counties for current conditions using field-based mapping rules based on Johannessen and Chase (2005a) and for historic conditions using a new Historic Sediment Source Index (HSSI) developed for the 121 mile coast of the Central Puget Sound study area (Johannessen and others 2005).
The total length of modified (armored residential/commercial shores) shore in the King County and Snohomish County study area was far greater than any other segment, representing 45.6 percent of the total study area length. In addition, the BNSF railway line and seawall north of the Shilshole comprised an additional 13.4 percent of the shore (Johannessen and others 2005). Twenty-two drift cells (of 61 total cells) currently have no intact sediment sources. When comparing current to historic feeder bluff mapping, there was a 63.4 percent loss of feeder bluff length over the entire study area, leaving only 36.6 percent of the historic sediment sources currently intact. This trend likely has lead to significant impacts such as increased shoreline erosion and a loss of beach and nearshore habitat area.
Feeder bluff mapping was completed to allow for in-depth prioritizing and planning for strategic protection of sediment supply (conservation) and for shoreline armor removal (restoration) to protect and restore self-sustaining physical processes, which then create and sustain valued nearshore habitats. By using the current and historic feeder bluff mapping in a GIS, a framework was developed for setting shoreline habitat conservation and restoration priorities based on sediment supply. This is the single most important process for maintaining, enhancing, or restoring nearshore habitat.
An example of restoration actions that apply feeder bluff data is the removal of shore armoring at important historic feeder bluffs (Clancy and others, 2009). Several of these efforts are underway at present, such as a bulkhead removal at the top scoring feeder bluff segment in King County. Beach enhancement efforts are underway as a direct result of feeder bluff mapping, including a large beach nourishment being designed for the east shore of Fidalgo Bay in Skagit County and several beach nourishment projects underway or about to begin along the BNSF railroad grade in Snohomish and Pierce counties. A number of smaller restoration projects have been identified as a result of the mapping and are working their way through the design and permit phases in Island and San Juan Counties. Feeder bluff data is being used for restoration planning in Skagit, Island, and San Juan Counties, with emphasis on sediment supply for estuaries.
As the majority of Puget Sound shores are in private ownership, and unmodified bluffs will gradually recede through erosion and landsliding, there likely will be a continued desire for landowners to build bulkheads. If carried out, this would lead to further sediment impoundment and further reduction of the natural sediment input to the nearshore system, as well as site-specific impacts to beaches. The possibility of further decreasing sediment supply for littoral cells along with the lag time of impacts from past modifications would likely lead to substantially-increased negative, cumulative impacts to nearshore habitats.
Aside from restoration, practical application of the data includes attempting to minimize additional long-term negative impacts to nearshore habitats by preserving the function of sediment source bluffs. This is occurring in the form of denial of permit applications by local jurisdictions based on existing codes and new feeder bluff mapping, and also by acquisition by NGOs. As an example of management that likely will become more common in the future, moving houses landward may be the only means to both preserve habitat and allow for preservation of houses in coming decades with predicted sea level rise (Clancy and others, 2009). Conservation actions underway that utilize feeder bluff data include acquisition of high priority feeder bluff parcels, such as those with high volume sediment input that are located near the origin of long littoral cells and/or those cells with critical habitats. Implementation of bluff sediment supply restoration and conservation has begun in the Puget Sound region but certainly will have to be accelerated for reactivation of physical processes to improve nearshore habitats. Completing the feeder bluff dataset Sound-wide would allow for systematic restoration and conservation planning across the region.
References Cited
Bauer, W., 1976, The drift sectors of Whatcom County marine shores—Their shoreforms and geo-hydraulic status: Bellingham, Wash., Whatcom County Planning Commission, 74 p., 1 map.
Baum, R.L., Harp, E.L, and Hultman, W.A., 2000, Map showing recent and historic landslide activity on coastal bluffs of Puget Sound between Shilshole Bay and Everett, Washington: U.S. Geological Survey Miscellaneous Field Studies Map MF-2346.
Clancy, M., Logan, I., Lowe, J., Johannessen, J., MacLennan, A., Van Cleve, F.B., Dillon, J., Lyons, B., Carman, R., Cereghino, P., Barnard, B., Tanner, C., Myers, D., Clark, R., White, J., Simenstad, C., Gilmer, M., and Chin, N., 2009, Management measures for protecting the Puget Sound nearshore: Olympia, Wash., Washington State Department of Fish and Wildlife, Puget Sound Nearshore Ecosystem Restoration Project Report No. 2009-01.
Jim Johannessen 151
Collins, B., and Sheikh, A., 2005, Historic reconstruction, classification and change analysis of Puget Sound tidal marshes: Olympia, Wash., Washington Department of Natural Resources, Aquatic Resources Division.
Hunter, R.E, Sallenger, A.H., and Dupre, W.R., 1979, Methods and descriptions of maps showing the direction of longshore sediment transport along the Alaskan Bering Seacoast: U.S. Geological Survey Miscellaneous Field Studies Map MF-1049, 5 sheets.
Inman, D.L., and Chamberlain, T.K., 1960, Littoral sand budget along the southern California coast [abs.]: Copenhagen, Denmark, Volume of Abstracts, International Geological Congress, 21st, p. 245–246.
Jacobson, E.E., and Schwartz, M.L., 1981, The use of geomorphic indicators to determine the direction of net shore-drift: Shore and Beach, v. 73, no. 1, p. 13–22.
Johannessen, J.W., 1992, Net shore-drift in San Juan County and parts of Jefferson, Island and Snohomish counties, Washington: Olympia, Wash., Washington Department of Ecology, Western Washington University, Shorelands and Coastal Zone Management Program final report, 58 p., 25 maps.
Johannessen, J.W., and Chase, M.A., 2005a, Feeder Bluff and Accretion Shoreform Mapping in Island County, WA: Coupeville, Wash., Island County Marine Resources Committee, prepared by Coastal Geologic Services Inc.
Johannessen, J.W., and Chase, M.A., 2005b, Whatcom County Feeder Bluff Mapping and Drift Cell Ranking Analysis: Bellingham, Wash., Whatcom County Planning and Development Services Administration and Parametrix, Final Technical Memorandum, 25 p. plus appendices.
Johannessen, J.W., and MacLennan, A.M., 2007, Beaches and bluffs of Puget Sound—A valued ecosystem component: Seattle, Wash., US Army Corps of Engineers and Washington Sea Grant.
Johannessen, J.W., MacLennan, A.M., and McBride, A., 2005, Inventory and assessment of current and historic beach feeding sources/erosion and accretion areas for the marine shorelines of Water Resource Inventory Areas 8 & 9: Seattle, Wash., King County Department of Natural Resources and Parks, prepared by Coastal Geologic Services.
Keuler, R,F., 1988, Map showing coastal erosion, sediment supply, and longshore transport in the Port Townsend 30- by 60-minute quadrangle, Puget Sound region, Washington: U.S. Geologic Survey Miscellaneous Investigations Map I-1198-E, scale 1:100,000.
MacDonald, K., Simpson, D., Paulsen, B., Cox, J., and Gendron, J., 1994, Shoreline armoring effects on physical coastal processes in Puget Sound, Washington: Olympia, Wash., Washington Department of Ecology, Coastal Erosion Management Studies, Volume 5, Shorelands Program, Department of Ecology Report 94-78.
McGreal, W.S., 1979, Marine erosion of glacial sediments from a low-energy cliffline environment near Kilkeel, Northern Ireland: Marine Geology, v. 32, p. 89–103.
Schwartz, M.L., Harp, B.D., Taggart, B.E., and Chrzastowski, M., 1991, Net shore-drift in Washington State: Olympia, Wash., Washington Department of Ecology, Shorelands and Coastal Zone Management Program.
Self, R.P., 1977, Longshore variation in beach sands, Nautlare, Veracruz, Mexico: Journal of Sedimentary Petrology, v. 47, p. 1437–1443.
Shipman, H., 2004, Coastal bluffs and sea cliffs on Puget Sound, Washington, in Formation, evolution, and stability of coastal cliffs-status and trends: U.S. Geological Survey Professional paper 1693, 123 p.
Shipman, H., 2008, A geomorphic classification of Puget Sound nearshore landforms: Seattle, Wash., U.S. Army Corps of Engineers, Puget Sound Nearshore Partnership, Report No. 2008-01 (also available at www.pugetsoundnearshore.org).
Simenstad, C.A., Ramirez, M., Burke, J., Logsdon, M., Shipman, H., Tanner, C., Davis, C., Fung, J., Bloch, P., Fresh, K., Myers, D., Iverson, E., Bailey, A., Schlenger, P., Kiblinger, C., Myre, P., Gerstel, W., and MacLennan, A., 2010, Historic change of Puget Sound shorelines: Olympia, Wash., Washington Department of Fish and Wildlife, and Seattle, Wash., U.S. Army Corps of Engineers, Puget Sound Nearshore Ecosystem Project Change Analysis, Puget Sound Nearshore Report.
Tubbs, D.W., 1974, Landslides in Seattle: Washington Division of Mines and Geology Information Circular 52, 15 p., scale 1:31,680.
University of Washington, 2009, Puget Sound river history project: University of Washington website, accessed December 4, 2010, at http://riverhistory.ess.washington.edu/.
Washington Department of Ecology, 1979, Coastal zone atlas of Washington, vol. 4: Coupeville, Wash., Island County, and Olympia, Wash., Washington Department of Ecology, Shorelands and Coastal Zone Management Program.

152 Puget Sound Shorelines and the Impacts of Armoring—Proceedings of a State of the Science Workshop
Suggested Citation
Johannessen, J., 2010, Assessing littoral sediment supply (feeder bluffs) and beach condition in King and southern Snohomish Counties, Puget Sound, Washington, in Shipman, H., Dethier, M.N., Gelfenbaum, G., Fresh, K.L., and Dinicola, R.S., eds., 2010, Puget Sound Shorelines and the Impacts of Armoring—Proceedings of a State of the Science Workshop, May 2009: U.S. Geological Survey Scientific Investigations Report 2010-5254, p. 135-152.
Related Documents