, <. "{ ',,, LBL-32380 Vol. III UC-350 ASEAN-USAID Buildings Energy Conservation Project FINAL REPORT VOLUME III: AUDITS Series Editors: M.D. Levine and J.F. Busch Editor: J.M. Loewen June 1992 Association of South East Asian Nations Secretariat: Jakarta, Indonesia Energy Analysis Program Energy and Environment Division Lawrence Berkeley Laboratory University of California Berkeley, CA 94720 USA This work was supported by the U.S. Agency for International Development through the U.S. Department of Energy under Contract No. DE-AC03-76SFOOO98.

Welcome message from author
This document is posted to help you gain knowledge. Please leave a comment to let me know what you think about it! Share it to your friends and learn new things together.
Transcript
,<. ~ "{ ',,,
LBL-32380Vol. III
UC-350
ASEAN-USAID
Buildings Energy Conservation Project
FINAL REPORT
VOLUME III: AUDITS
Series Editors: M.D. Levine and J.F. Busch
Editor: J.M. Loewen
June 1992
Association ofSouth East Asian Nations
Secretariat:Jakarta, Indonesia
Energy Analysis ProgramEnergy and Environment Division
Lawrence Berkeley LaboratoryUniversity of California
Berkeley, CA 94720 USA
This work was supported by the U.S. Agency for International Development through the U.S. Department of Energy underContract No. DE-AC03-76SFOOO98.
Table of Contents
Preface: The ASEAN-USAID Buildings Energy Conservation Project iv
Project Philosophy and Context iv
A Brief History of the ASEAN-USAID Project v
Executive Summary vii
Introduction: The AUditing Project 1-1
J.M. Loewen
Appendices:
Appendix A. ASEAN Building Energy Database A-1
J.F. Busch
Appendix B. Energy Management, Singapore B-1
Y.W. Wong
Appendix C. Survey of Energy Use in Commercial Buildings, Indonesia C-1
L. Presetio et a/.
Appendix D. Office Building Audit Report, The Philippines D-1
M.L. Soriano et a/.
Appendix E. Hotel Intercontinental Manila Audit Report, The Philippines E-1
M.L. Soriano et a/.Appendix F. Cham Issara Shopping Arcade Audit Report, Thailand F-1
P. Hungspreug et a/.
Appendix G. Holiday Inn City Center Audit Report, Malaysia G-1
A.H.H.A. Rahman
Appendix H. Ughting Study, Singapore H-1
P. Wood
Appendix I. ASEAN Commercial Building Energy Survey Form 1-1
J.J. Deringer, S. Greenberg, and H. Misuriello
iii
,
IT
PREFACE
THE ASEAN-USAID BUILDINGS ENERGY CONSERVATION PROJECT
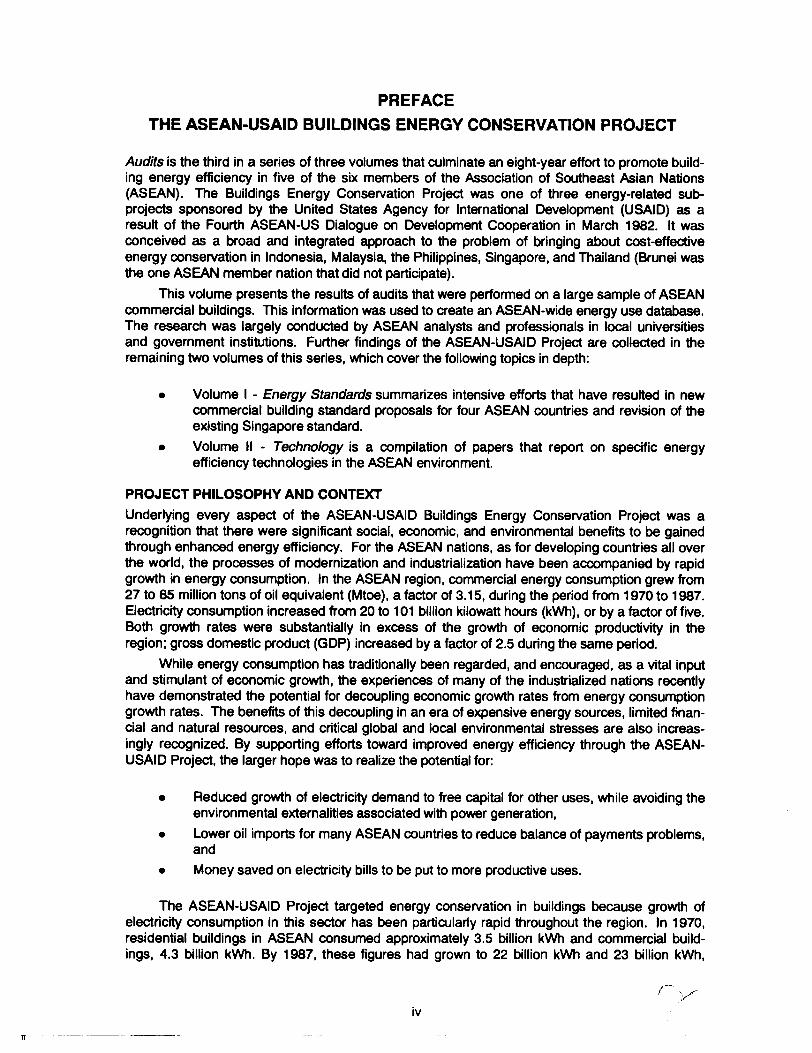
Audits is the third in a series of three volumes that culminate an eight-year effort to promote building energy efficiency in five of the six members of the Association of Southeast Asian Nations(ASEAN). The Buildings Energy Conservation Project was one of three energy-related subprojects sponsored by the United States Agency for International Development (USAID) as aresult of the Fourth ASEAN-US Dialogue on Development Cooperation in March 1982. It wasconceived as a broad and integrated approach to the problem of bringing about cost-effectiveenergy conservation in Indonesia, Malaysia, the Philippines, Singapore, and Thailand (Brunei wasthe one ASEAN member nation that did not participate).
This volume presents the results of audits that were performed on a large sample of ASEANcommercial buildings. This information was used to create an ASEAN-wide energy use database.The research was largely conducted by ASEAN analysts and professionals in local universitiesand government institutions. Further findings of the ASEAN-USAID Project are collected in theremaining two volumes of this series, which cover the following topics in depth:
• Volume I - Energy Standards summarizes intensive efforts that have resulted in newcommercial building standard proposals for four ASEAN countries and revision of theexisting Singapore standard.
• Volume II - Technology is a compilation of papers that report on specific energyefficiency technologies in the ASEAN environment.
PROJECT PHILOSOPHY AND CONTEXT
Underlying every aspect of the ASEAN-USAID Buildings Energy Conservation Project was arecognition that there were significant socia', economic, and environmental benefits to be gainedthrough enhanced energy efficiency. For the ASEAN nations, as for developing countries all overthe world, the processes of modernization and industrialization have been accompanied by rapidgrowth in energy consumption. In the ASEAN region, commercial energy consumption grew from27 to 85 million tons of oil equivalent (Mtoe), a factor of 3.15, during the period from 1970 to 1987.Electricity consumption increased from 20 to 101 billion kilowatt hours (kWh), or by a factor of five.Both growth rates were substantially in excess of the growth of economic productivity in theregion: gross domestic product (GOP) increased by a factor of 2.5 during the same period.
While energy consumption has traditionally been regarded, and encouraged, as a vital inputand stimulant of economic growth, the experiences of many of the industrialized nations recentlyhave demonstrated the potential for decoupling economic growth rates from energy consumptiongrowth rates. The benefits of this decoupling in an era of expensive energy sources, limited financial and natural resources. and critical global and local environmental stresses are also increasingly recognized. By supporting efforts toward improved energy efficiency through the ASEANUSAID Project, the larger hope was to realize the potential for:
• Reduced growth of electricity demand to free capital for other uses, while avoiding theenvironmental externalities associated with power generation,
• Lower oil imports for many ASEAN countries to reduce balance of payments problems,and
• Money saved on electricity bills to be put to more productive uses.
The ASEAN-USAID Project targeted energy conservation in buildings because growth ofelectricity consumption in this sector has been particularly rapid throughout the region. In 1970,residential buildings in ASEAN consumed approximately 3.5 billion kWh and commercial buildings, 4.3 billion kWh. By 1987. these figures had grown to 22 billion kWh and 23 billion kWh,
iv
n
Table of Contents
Preface: The ASEAN-USAID Buildings Energy Conservation Project iv
Project Philosophy and Context iv
A Brief History of the ASEAN-USAID Project v
Executive Summary vii
Introduction: The Auditing Project 1-1
J.M. Loewen
Appendices:
Appendix A. ASEAN Building Energy Database A-1
J.F. Busch
Appendix B. Energy Management, Singapore B-1
Y.W. Wong
Appendix C. Survey of Energy Use in Commercial Buildings, Indonesia C-1
L. Presetio et a/.
Appendix D. Office Building Audit Report, The Philippines D-1
M.L. Soriano et al.
Appendix E. Hotel Intercontinental Manila Audit Report, The Philippines E-1
M.L. Soriano et al.
Appendix F. Cham Issara Shopping Arcade Audit Report, Thailand F-1
P. Hungspreug et a/.
Appendix G. Holiday Inn City Center Audit Report, Malaysia G-1
A.H.H.A. Rahman
Appendix H. Ughting Study, Singapore H-1
P. Wood
Appendix I. ASEAN Commercial Building Energy Survey Form 1-1
J.J. Deringer, S. Greenberg, and H. Misuriello
iii
11
respectively. Thus, buildings in ASEAN--;esidential and commercial----<:urrently make up 45% ofthe demand for electricity in the region. Their consumption has grown almost six-fold during this17-year period, or at an annual rate of 10.9%.*
One of the immediate implications of increasing energy consumption is financial expense.The total annual cost of electricity for buildings in ASEAN (45 billion kWh) is about $4 billion(U.S.), and if industrial buildings, self-generation, and "public consumption" are counted, the totalannual bill may be as high as $5 billion (U.S.). Since electricity consumption in buildings hasgrown rapidly and is likely to continue to do so, utility costs in the sector are likely to increasemarkedly over time. Because buildings represent such a significant fraction of electricity consumption in the region. they represent an important target sector for national efforts aimed at reapingthe economic and environmental benefits of increased energy efficiency.
The ASEAN-USAID Project focussed on commercial buildings because of the magnitude ofpotential savings in this energy use sector. As described in greater detail elsewhere in this series,the potential for electricity savings in commercial buildings is significant:
• 10% savings achievable in the near term,
• 20% savings achievable in the intermediate term (5 to 10 years), and
• 40% or more savings achievable in the longer term.
A 10% reduction in commercial building energy use in ASEAN represents $200 million(U.S.) savings in fuel bills per year. Deducting the costs of investments needed to achieve thesesavings yields net annual savings to ASEAN of $100 to $150 million (U.S.).
A BRIEF HISTORY OF THE ASEAN-USAID BUILDINGS ENERGY CONSERVATION PROJECT
The first phase of the Project was initiated in 1982 with a collaboration by U.S. researchers atLawrence Berkeley Laboratory (LBL) and the Singapore government. This first effort had severalpurposes, namely:
• to transfer to Singapore a computer code (DOE-2) to analyze the energy performanceof buildings,
• to analyze measures to increase the energy efficiency of buildings in Singapore,
• to use the analysis results to extend and enhance Singapore's standards on energyefficiency in buildings, and
• to establish a process whereby the other ASEAN members can benefit from theexperience in Singapore, including the use of DOE-2, the analysis to support energystandards, and the process of adapting and implementing building energy standards.
Detailed results of this first phase were presented at a conference in Singapore in May 1984.The proceedings from this conference are available in a separately bound volume. They includetechnical studies supporting recommended overall thermal transfer value (OnY) refinements aswell as energy performance simulation results, descriptions of existing energy conservation activities within ASEAN, and papers on several topics related to energy conservation in commercialbuildings.
With the initiation of a second phase in 1985, the focus of the ASEAN-USAID Project wasexpanded to include the other participating ASEAN nations. Its purpose remained to promote thedevelopment and implementation of policies to improve the energy efficiency of commercial buildings. In pursuit of this goal, the Project funded 22 different research sub-projects within the five
* Indeed, these consumption estimates underestimate the actual electricity demand attributable to buildings forat least three reasons: (1) a sizeable portion of industrial electricity consumption is for building services, (2)electricity generated on site, either as backUp power or for normal use,ls counted as self-production even If it isused in bUildings, and (3) the category "public electricity consumption" may include considerable use of electricity In buildings. Thus, it is likely that buildings in ASEAN account for considerably more than 45% of total electricity dernand-probably in the range of 55 to 60%.
v...,..,-

11
participating ASEAN countries. The current series represents a compilation and synthesis ofseveral of the many research papers that grew out of the overall Project.
Since its inception, the ASEAN-USAID Project has provided training to ASEAN participants,supported research projects throughout ASEAN, conducted research at LBL. and engaged U.S.consultants to work with ASEAN governments and private sector participants to design programsand policies [1]. Within the Project. a key policy focus has been the application of technical toolsto the development and assessment of efficiency standards and guidelines. The Project hasstressed training (especially in computer simulation of building energy use and energy auditing)and the enhancement of research and development capabilities in ASEAN. Much of the datagathering, analysis, and research activity conducted under Project auspices was directed towardthe eventual implementation of energy efficiency standards for ASEAN commercial buildings.
\
vi
EXECUTIVE SUMMARY
The auditing subproject of the ASEAN-USAID Buildings Energy Conservation Project has generated a great deal of auditing activity throughout the ASEAN region. Basic building characteristicand energy consumption data were gathered for over 200 buildings and are presented in theDatabase appendix of this volume. A large number of buildings were given more detailed auditsand were modeled with either the ASEAM-2 computer program or the more complex DOE-2 program. These models were used to calculate the savings to be generated by conservation measures. Specialty audits were also conducted, including lighting and thermal comfort surveys. Especially significant, many researchers in the ASEAN region were trained to perform energy audits ina series of training courses and seminars.
The electricity intensities of various types of ASEAN buildings have been calculated. A comparison to the electricity intensity of the U.S. building stock tentatively concludes that ASEANoffice buildings are comparable, first class hotels and retail stores are more electricity intensivethan their U.S. counterparts, and hospitals are less intensive. Philippine and Singapore lightingsurveys indicate that illuminance levels in offices tend to be below the minimum accepted standard. Computer simulations of the energy use in various building types generally agree that formost ASEAN buildings, electricity consumption for air-conditioning (inclUding fan power) consumes approximately 60% of total building electricity.
A review of the many studies made during the Project to calculate the savings from energyconservation opportunities (ECOs) shows a median potential savings of approximately 10%. withsome buildings saving as much as 50%. Singapore buildings. apparently as a result of previouslyimplemented efficient energy-use practices. shows a lower potential for savings than the otherASEAN nations. Air-conditioning ECOs hold the greatest potential for savings, starting with theno-cost measure of raising the thermostat setpoint and the almost no-cost measure of minimizingoutside air intake. Variable air volume controls and heat exchangers for incoming air save over10% of electric use and also have very low payback periods. Installing power factor-correctingcapacitors saves more than 5% of electricity on average. Two Philippine studies done on cogeneration potential - one for a hotel and one for a hospital - show that energy can be saved while netcost savings of from 40% to 60% and paybacks of 1.5 to 2.6 years are achieved.
The breadth and detail of the auditing sUbproject has made it clear that energy use can bereduced in the ASEAN region. with no reduction in productivity or comfort. Some of those reductions will be a result of simple behavioral changes. Others will involve replacement of technology.Inevitably. each country will have to find the mix of technique and implementation procedure thatresults in the maximum reductions for the minimum cost.
vii
IT
INTRODUCTION
This volume provides an overview of the energy audit work that was done for the ASEAN-USAIDBuildings Energy Conservation Project. Specifically, the following Introduction details the purpose,history, and methodology of the project, and includes the key findings on energy consumption andthe potential for energy conservation in ASEAN commercial buildings.
The bulk of this volume, however, is composed of nine appendices. The first, and perhapsmost useful, is a database containing building characteristic and energy consumption informationfor over 200 buildings in the ASEAN region. Other appendices include the final report of theSingapore audit group, which summarizes their activities and findings, a number of audits-withvarying degrees of detail-on individual buildings, and the report of a lighting survey. An examplesurvey questionnaire form used for collecting data is included at the end.
Before concluding this introduction, a disclaimer is in order. The project has proved so effective in instigating energy audit activity that fully documenting the audit work or comprehensivelycapturing its results is virtually impossible. Still, we hope this volume will do some justice to theefforts of the researchers who participated in the project.
THE PROJECT
Project Rationale
In brief, the goals of the project have been to conduct energy studies of commercial buildings in the ASEAN nations, and then to analyze the findings. The energy studies of individualbUildings have ranged in complexity from simple mailed surveys to intensive, detailed modeling.Simple surveys-which gather such data as building type, conditioned floor area, annual energyconsumption, and other building characteristics-are sufficient to give an initial indication ofwhether a building is energy-efficient or not. Computer modeling the building's energy use canfurther clarify how a building uses or wastes energy. Modeling becomes especially useful inestimating the energy savings to be gained by implementing energy conservation opportunities(ECOs).
Energy studies of individual buildings are valuable to their owners or operators because theinformation can help them save money by reducing energy consumption. These studies can alsohelp the utility or energy supplier who wants to reduce demand for energy. Finally, individualaudits are beneficial to the nations in which they take place, since, by spurring conservation, theyease pollution problems, lower energy imports required, and free money for consumption orinvestment in other areas.
The results of a group of individual studies can reveal larger truths as well. On the simplestlevel, the analysis identifies the average electricity intensity of the various types of buildings ineach country and in ASEAN as a whole. A comparison of these intensities both among theASEAN nations and against the averages of industrialized countries indicates potential energysavings. A tabulation of modeled ECOs provides information about typical savings that may beavailable per building. An examination of savings and paybacks for various ECO types highlightsthose ECOs which are especially attractive and should receive special attention in a conservationprogram.
The audit analysis, which is the focus of this volume, is intended to be of assistance primarily to national energy planners. A determination of the feasibility of various types of conservation measures should point toward the national potential for conservation. This information is crucial in planning the matrix of Mure energy supply options. By identifying those ECO types whichsave the most energy or have the shortest paybacks, this analysis will also reveal areas whereconservation investment, incentives, or regulation should be directed. Furthermore, the analysiscan be useful to other building owners and operators, because it details typical electricity intensities and typical ECO savings.
Because the goal of energy conservation is such an important national priority, it is crucialthat energy conservation as an on-going effort be encouraged. An important way to do this is to
1-1
train energy professionals in the skills of energy auditing.
Training
To support project efforts, a training program to develop and enhance the energy auditingskills of building professionals in Indonesia, Malaysia, the Philippines, Singapore, and Thailandwas carried out. The primary goal of this program was to transfer the skills and analytical toolsrequired for the production of effective energy audit reports.
The scope of the basic and advanced energy audit training programs included: establishment of two-week training programs to develop skills in energy auditing and report production;training in the use of diagnostic instrumentation for energy audits; determination of appropriateretrofit measures for tropical climates; and adaptation of the U.S. Department of Energy'sASEAM-2.1 (A Simplified Energy Analysis Method) microcomputer program for analysis of tropicalretrofit opportunities. The training was intended as the first phase of national energy audit programs for buildings in the ASEAN countries. Energy audit data collected for ASEAM-2 analysisare expected to be used for assessing potential national and regional conservation projects for theASEAN commercial building sector. A manual of reference material was also prepared to assistparticipants in the training sessions.
From November 1986 to November 1988 seven different training courses and workshopswere held throughout the ASEAN region. These courses lasted from one to two weeks each andranged from preliminary training to advanced seminars. In the three basic two-week trainingcourses, an average of approximately 30 participants received instruction in building energy auditing and were introduced to the ASEAM-2 microcomputer program. Participants were grouped intosix teams to collaborate on and produce energy audit reports on actual bUildings, using a buildingenergy data collection form and working with the ASEAM-2 program.
In a workshop for eight key researchers representing each of the ASEAN countries, specialists from LBL gave presentations focusing on energy standards, policy objectives, data gatheringmethods, natural ventilation and air-conditioning research, and the use of auditing, monitoring andweather station equipment. A two-week advanced course was held for 22 successful participantsin the basic auditing course (or equivalent). This advanced course was intended to provideinstruction in the use of advanced features of ASEAM-2, improve field data collection skills, andtrain participants in the use of field instrumentation for building monitoring. A limited number ofclassroom lectures complemented a significant amount of hands-on field survey and computer labwork.
The Audit Work
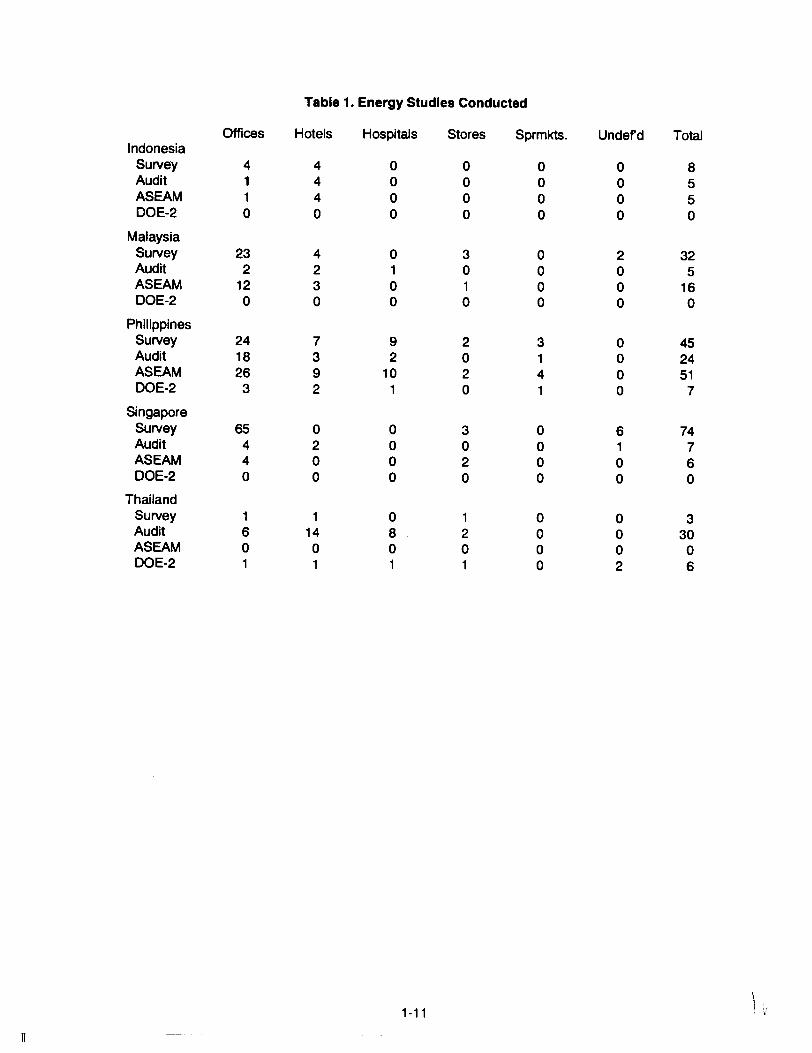
The amount of energy audit work conducted under the auspices of the project has been considerable. Basic information on over 200 buildings was gathered (See Appendix A). Auditorsinvestigated several types of buildings, including hotels, hospitals, retail stores, supermarkets, andothers, but focused on office buildings.
Many different types of audits were conducted (see Table 1-1). Energy audits can becharacterized by how they gather data, and how they analyze it. There are a number of differentways to gather building data. Questionnaires can be mailed to the building owners or managers,requesting information about air-conditioning, lighting, elevators, and energy conservation measures being implemented. Relevant data also can be garnered from blueprints and other documents available from government agencies. Neither of these investigative routes requires a sitevisit. The Singapore research team gathered information on 65 buildings using these approaches.
Another way to gather data is to perform a simple walk-through survey and record basicinformation about mechanical systems, envelope characteristics, and patterns of operation. Thistype of building study is fairly brief and does not involve making detailed observations or monitoring the use of systems over time. Alternatively, more time can be spent gathering more detailedinformation about the building. Most of the data gathered under the project auspices were collected in one of these latter two ways.
1-2
IT
Finally, bUilding systems can be monitored for periods ranging from 24 hours to a year,depending on the variability of the use pattern and the level of accuracy desired. One office building in Malaysia, for example, was monitored for a one-week period before and one after conservation retrofits were implemented.
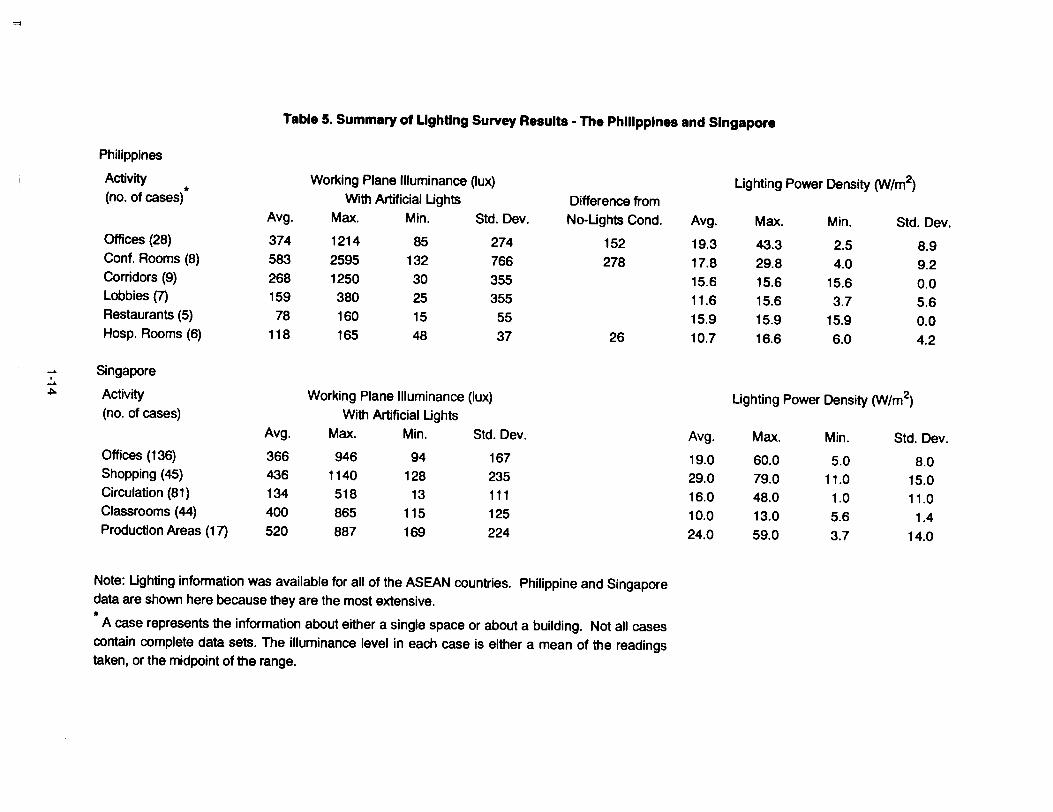
Specialty audits can also be conducted. While most of the audit work conducted under theproject sought to provide a comprehensive overview of the buildings' energy performance, somework was focused on particular features related to energy consumption. One Philippine researchteam surveyed the thermal comfort of building occupants in a number of bUildings, by measuringsuch variables as dry- and wet-bulb temperatures, relative humidity, and indoor airspeed. Theresearchers' intention was to determine the effectiveness of natural ventilation. Another Philippineresearch team surveyed lighting levels in a number of buildings. The most extensive effort in thisarea was conducted by the Singapore researchers, partly under the aegis of this project. Thatlighting study can be found in Appendix H.
In order to gather the information for the database (Appendix A), the LBL research team sentout a questionnaire to the ASEAN participants regarding the buildings they had investigated. TheASEAN participants either returned the completed questionnaire to LBL, where the data wereentered, or they entered the data directly into the database.
In support of the ASEAN in-country research projects, LBL reviewed each project's equipment needs, and developed an extensive listing of precision instruments, data acquisition equipment, and accompanying tools. The list of equipment sent to the ASEAN nations is shown inTable 1-2.
Once collected, the data can be used in several ways. Most simply, the data can bepresented as they are, as has been done in the database. The data can also be used as inputsfor computer models that simulate the building's energy use. The two software packages usedmost commonly in this project are ASEAM-2 and DOE-2. The DOE-2 model is a sophisticatedanalytic tool, but the gathering and entering of data and the fine-tuning of the simulation makemodeling with this program difficult and laborious. Still, the research team in Thailand used iteffectively in modeling the ventilating and air conditioning CVAC) systems of five buildings, each ofa different building type.
The ASEAM-2 program is easier and quicker to use, and therefore allows researchers tomodel more buildings. The inputs required are fewer, and the program even provides defaultvalues when required. Most of the modeling done under the project was executed using theASEAM-2 model.
Data also can be used to calculate the potential savings to be gained by implementingEGOs. Sometimes these calculations can be executed adequately by hand. Generally, however,it is a good practice to calculate potential savings with the help of a computer model, because theinteractions between bUilding systems-such as lighting and air-conditioning-can be quite complex. Most of the EGO savings shown in this report were calculated with the aid of the computermodels.
Finally, financial feasibility studies of proposed EGOs can be performed. This was done bythe Thai investigative team for air-conditioning EGOs (Appendix F) and by the Philippine team forcogeneration scenarios (see Table 1-11 and Appendix E).
THE FINDINGS
Background IssuesElectricity Intensity Index:
For the purpose of comparing building stocks, probably the most useful index is the energyintensity, or energy per unit floor area. In this stUdy, the energy ~pe that has been most closelymonitored is electricity. Thus, the index that will be used is kWh/m .
1-3
The concept of "floor area," however. presents some difficulty. Should floor area includeonly the portion directly supplied with conditioned air, or should it include the total area within theconfines of the building's walls, including parking garages. mechanical rooms, and storagespaces? Would an intermediate definition--including non-conditioned areas like stairways, halls.and storerooms, but not the parking garag&--be more appropriate?There is no simple answer to this question. But examining the exact purpose of the electricity intensity index can help solve the problem of its definition. As noted above, the index allowsus to compare the energy performance of a building either to a standard or to other buildings. Thatmeans the index can be thought of as a kind of inverse efficiency ratio, With the output on the bottom and the input on the top. It measures how much energy is put into the building compared tohow much output-amount of comfortable, usable, well-lit space equipped with the necessaryservices-is obtained. Floor area for calculating the electricity intensity, then, should be the floorarea associated directly with the function of the building. For an office building, this corresponds tothe area used by people doing office work-roughly, the conditioned area.Another way to view the problem is simply as one of comparing the energy use in similarspaces. A parking garage is clearly a different type of space; by this criterion it should not beincluded. But what about stairwells, hallways, and small storerooms which receive little or no airsupply? Ideally, these spaces should be excluded from the floor area since they too are distinctlydifferent from conditioned spaces. To calculate the conditioned floor area, however, it is mucheasier to simply subtract the area of the parking garage from the total floor area than it is to calculate and then subtract the area of all the unconditioned interior spaces. In the ASEAN database.there is not a consistently followed rule for determining "conditioned area.· In this study, the term"conditioned area· remains a somewhat ambiguous term. That is, we have used the "conditionedspace· to calculate electricity intensity. This generally excludes parking garages, and it mayormay not include stairwells, hallways, and storerooms without supply air.It may offer some consolation to note that the ASEAN database is not alone with its slightlyambiguous ·conditioned area. • The Nonresidential Buildings Energy Consumption Survey(NBECS) pUblished by the U.S. Energy Information Administration (U.S. EIA 1989) uses aclassification for the proportion of area that is cooled, with one category being "100% cooled.· Yetwhen NBECS survey respondents claimed that their building was 100% cooled, the data collectors had no way to verify that all hallways. stairwells, etc. were in fact conditioned.Respondents to ASEAN surveys also probably overstate the ·conditioned area,· of theirbuildings. But the discrepancy is less striking. Nearly all ASEAN buildings have ·gross area"figures which differ significantly from their ·conditioned area· figures. whereas the majority ofNBECS office buildings were categorized as 100% cooled. As an approximation, therefore, thisstudy supposes that for the purpose of comparing the U.S. stock to the ASEAN stock, only 90% ofthe floor area belonging to NBECS ·100% cooled· buildings actually is conditioned. This effectively raises all electricity intensity values for U.S. buildings, because values are divided by 0.9.
Statistical Significance:
What is the statistical significance of the ASEAN sample? This is a crucial question, as oneof the project's primary purposes--namely, the characterization of the building stock-hinges onit. Unlike the statistical analysis of the NBECS study, which involved an intense effort to collect asignificant and unbiased sample of the U.S. building stock, the ASEAN project used Virtually nosampling methodology. We are confident, however. that the ASEAN sample as a whole isrepresentative, especially for offices and hotels, because the sample is so large in comparison tothe ASEAN commercial building stock, and because there seems to be little bias in the sample.
Survey ResultsElectricity's Part in Total Energy:
Almost all of the data that were collected in the project relate to electricity consumption. Thatmakes electricity's proportion of total bUilding energy use less clear than would be desirable. Still,some useful generalizations can be made.
1-4
First, office buildings and stores in ASEAN nations use electricity almost exclusively. Anon-electric fuel source, if used at all. would be only for domestic hot water. The energy requiredfor this end use in these building types is negligible. second. and conversely. non-electric buildingenergy use can be considerable in other building types. Non-electric fuels are often used for thehotel laundry service, for cooking, and for producing domestic hot water for guests. For example,a study of four hotels in Indonesia shows that expenditures for electricity as a proportion of totalenergy expenditures range between 57 and 86% (see Table 1-3). When the energy types areconverted to common energy units (with electricity measured at 3413 BtuIkWh). electricity's shareranges between 50 and 62%. (The one exception to this is the one hotel in Indonesia, where theshare was 6%, due to its use of an absorption chiller.)
Hospitals also use considerable amounts of non-electric fuels, for steam, cooking heat, andhot water. For this reason, hospitals and hotels are often good candidates for cogeneration.
Following the pattern of the ASEAN buildings. but allowing for more non-electric fuels usedfor heating purposes, electricity in U.S. office buildings comprises 63% of total bUilding energyconsumption (NBECS p.29). Electricity for "lodging," "health care," and "mercantile and service"buildings is 39%,29%, and 53%, respectively.
Electricity Intensity in ASEAN:
Based on a survey of 128 office buildings throughout the ASEANregion, we found that, onaverage, they have an electricity intenSi% of 233 kWh/m2 (see Table 1-4). Hotels averaged ahigher electricity intensity, of 318 kWh/m . Hospitals were higher still. at 379 kWh/m2. Retailstores were nearly as high as hospitals, at 352 kWh/m2.
Comparison among the five countries reveals that Indonesia has by far the lowest electricityintensity among the office buildings sampled. and nearly the lowest average for hotels. Thefigures for Indonesia are not necessarily significant, however. given the small sample size. Comparisons among the other four countries reveals no pattern of higher or lower indices. At firstglance, it may seem surprising that Singapore, which has the most thoroughly implemented building conservation program, does not exhibit the lowest average electricity index. It is possible thatSingapore's office buildings have higher internal electric loads from office equipment and lighting.Such loads would raise over-all building consumption even higher. were it not for its nationalenergy policy.
Comparison to U.S. Stock:
It is instructive to compare the ASEAN consumption figures to those of U.S. buildings. It canalso be difficult. This is partly because of the tremendous climate difference between the twogroups of buildings. It is also because the electricity intensities supplied in the published NBECSreport are not disaggregated enough to make a valid comparison between the two building stocks.The response to the first problem is to look only at buildings in the South census region of theU.S., since the weather in this hot and humid area corresponds most closely to that of the ASEANregion. This is not an ideal solution, however, for the weather in the U.S. South is still muchcooler than in the ASEAN region. Consequently, U.S. buildings will require more heating and lesscooling. The comparative weights of these two counteracting biases is unclear.
To solve this latter problem, we obtained the 1983 NBECS data, and examined severalmore disaggregated sample groups. The results of this data search are shown in Table 1-4. Toprovide a better comparison to ASEAN buildings, only those buildings in each size category whichmatched the typical sizes of ASEAN buildings in the sample are included in the U.S. sample.(These sizes are noted on the table.) Finally, the table displays two sets of U.S. averages-thatfor bUildings built between 1971 and 1983. and that for all buildings standing in 1983. The ASEANbuildings tend to be of more recent vintage, and perhaps should be compared to the more recentlybuilt U.S. stock.
Table 1-4 shows a very close match between the electricity intensities of office buildings inthe ASEAN region and in the southern United States. Electricity intensity in ASEAN hotels (318kWh/m2
), however, is higher than the U.S. value for buildings of all vintages (252 kWh/m2). (The
value for U.S. hotels built between 1971 and 1983, 82 kWh/m2• is based on a relatively small
1-5
sample size and may be a statistical anomaly). U.S. hospitals are far more electricity-intensive(571 kWh/m2 average for hospitals of any vintage) than their ASEAN counterparts (379 kWh/m2
).This is probably due to the higher level of equipment consumption in U.S. hospitals. Finally,ASEAN retail stores consume electricity at a higher level than do U.S. stores-352 versus 198and 270 kWh/m2
.
In summary, ASEAN office buildings consume energy at about the same rate as U.S.offices, ASEAN hospitals use less electricity than their U.S. counterparts, and ASEAN hotels andretail stores use more.
Ughting Surveys:
Table 1-5 summarizes the results of the lighting surveys conducted by investigators in thePhilippines and in Singapore. A more in-depth discussion of the Singapore results can be foundin Appendix H. The average illuminance levels in offices for both the Philippines and for Singapore is approximately 370 lux, while the average installed lighting power density for both is 19W/m2• Most of the Philippine lighting reports noted that illuminance levels in the offices were toolow. The Singapore report notes that 40% of the offices surveyed had illuminance levels below theminimum SISIR standard.
Building Simulations
Breakdown of Electricity Use by Component:
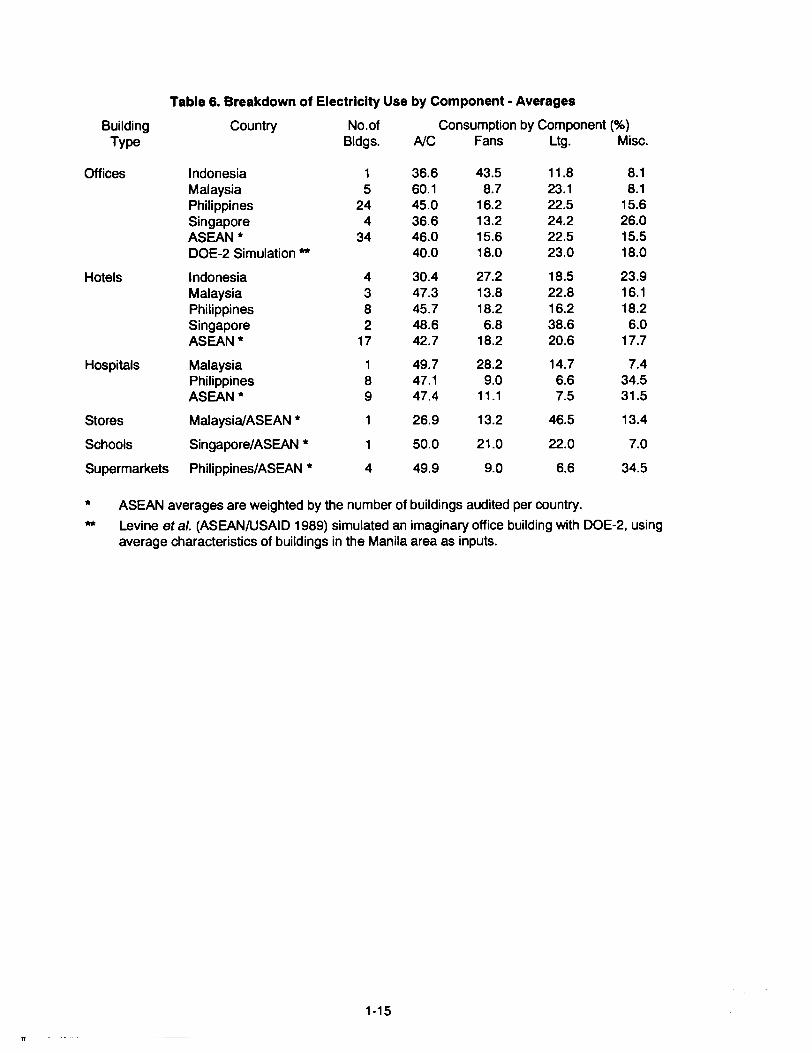
Table 1-6 shows a summary of the breakdown of electric use by component for differentbuilding types in the different ASEAN countries, as calculated by end-use ASEAM-2 simulations.For offices, hotels, hospitals, schools, and supermarkets, the sum of air conditioning and fans liesroughly between 55 and 70% of total electric use. Lighting and miscellaneous equipment make upthe remainder.
Only stores deviate from this pattern, with an air-conditioning and fan total of only 40%. Thisresult may be anomalous, however, as the sample consists of only one building.
levine et al. performed a DOE-2 simulation of a prototypical imaginary office building(ASEAN/USAID 1989, pp. 49-62) based on average building characteristics obtained from a survey of office buildings in the Manila metropolitan area. The simulated building, as shown in Table1-6, showed an energy consumption pattern similar to the average of the simulated values.
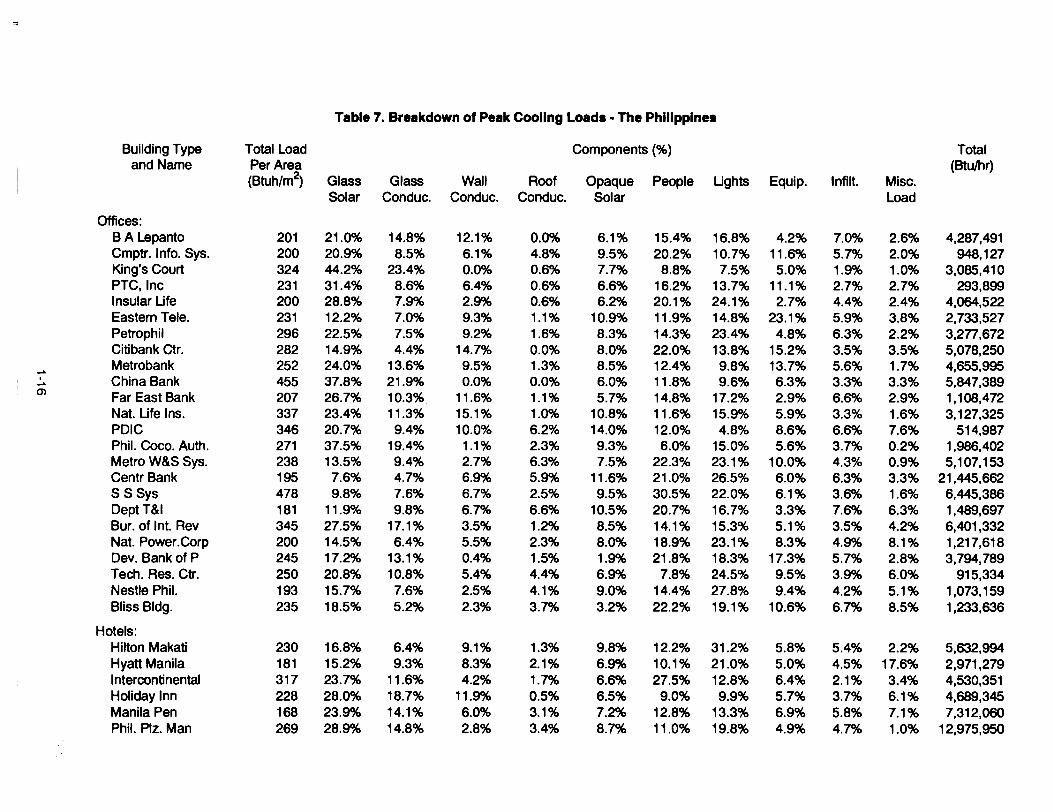
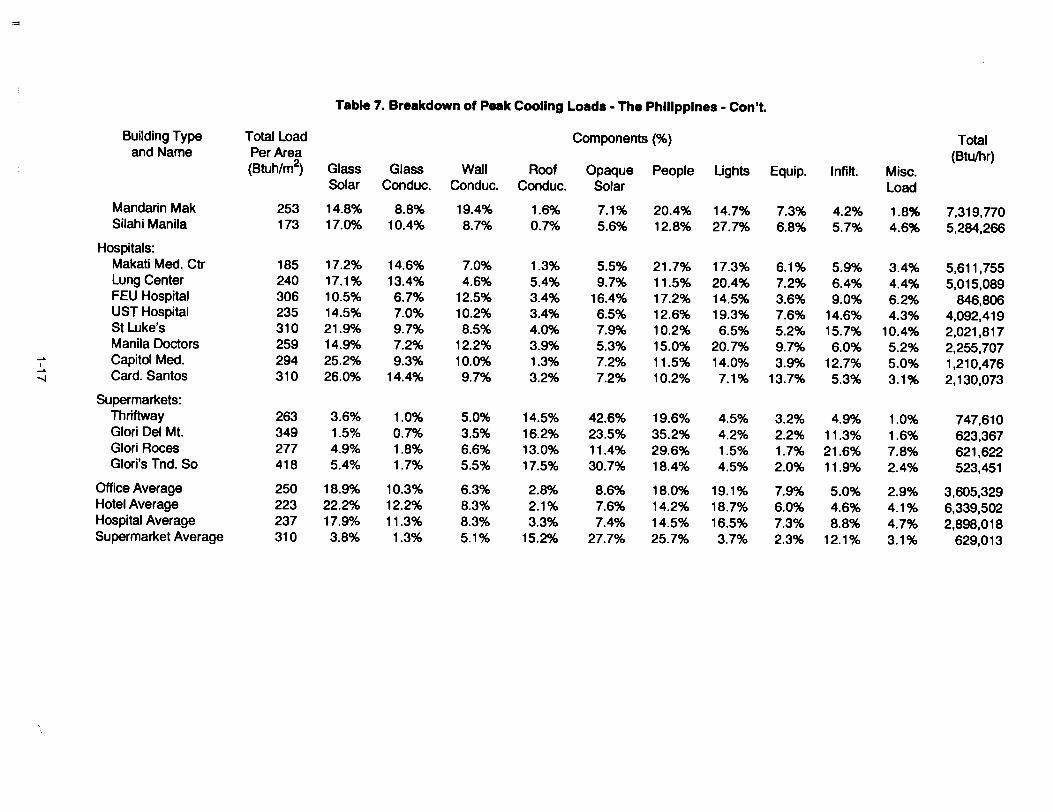
Breakdown of Cooling Load by Component:
The ASEAM-2 program calculates a breakdown of the peak cooling load in the modeledbuilding. The Philippine research team modeled more buildings with ASEAM-2 than any othercountry. Table 1-7 summarizes the output from their work.
ECOs
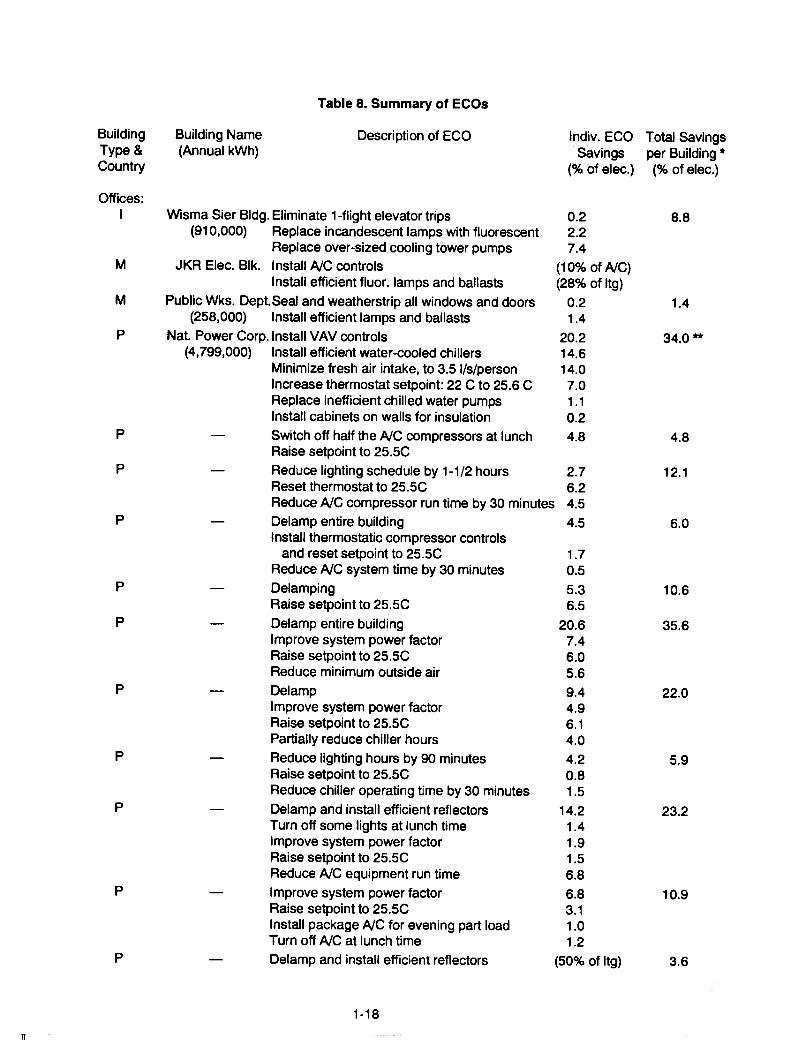
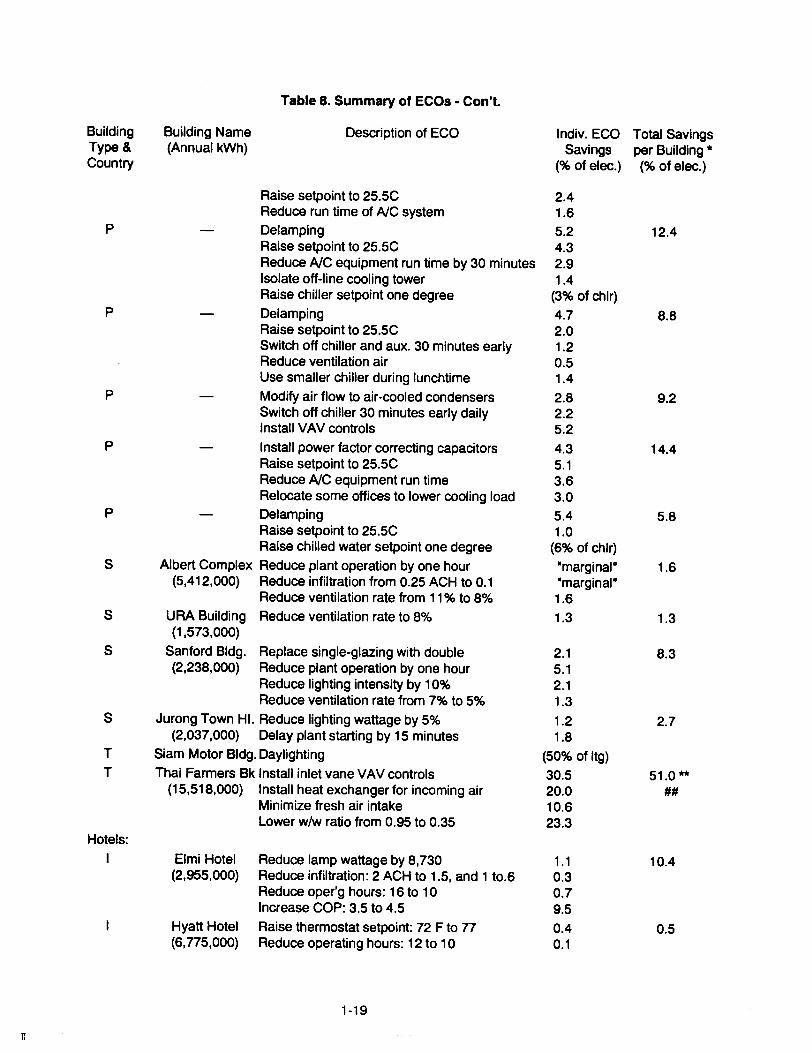
Summary of ECOs Studied:
Table 1-8 shows a list of ECO measures for which estimated savings were calculated. Theprojected savings vary considerably from building to building. Nearly half the buildings have projected savings of more than 10% of total electricity, almost one-quarter show savings of more than20%, and one office building has a savings potential of more than 50%. The Philippine researchgroup prepared apprOXimately 20 audit reports in which ECOs were identified and savings calculations were made. It is interesting to note that the savings calculations for ECOs in Singapore arequite small. This could be due to the relatively high standard of energy efficiency in their buildings.
A brief examination of Table 1-9 reveals that the measures which save the most energy arethose that affect the VAC system. The most highly recommended measure for any building is toraise the thermostat setpoint as far as possible while staying within the comfort zone. Actually,many audit reports note that occupants complain that their building is too cold. This measuresaved an average of 3.6% of total building electricity in those cases where it was calculated. Inactuality, however, its magnitUde depends on the size of the change in the setpoint.
1-6
n
Minimizing outside air intake is also an attractive measure, not the least of which is its lowcost. This action generally consists of merely changing the pUlleys on the fans. Yet it saved anaverage of 6.0% for those cases where it was calculated. Maintaining clean air-handling unitfilters and cooling coils also garners significant savings.
The three biggest saving air-conditioning measures are variable air-volume 'YAY) controls,heat exchangers, and new, efficient chillers. The first two are generally cost-effective (see nextsection), while the latter may be too expensive to be feasible in many cases, especially thoseinvolving retrofits.
Ughting measures have a significant potential for saving energy (an average of 5.1 %), butcaution is prescribed. Both the Philippine and Singapore lighting surveys found generally low lighting levels. Further reductions in installed capacity must be balanced against the need for goodlighting for workers.
Electrical systems can be made more efficient in two ways: by raising the power factor byinstalling new capacitors. and by reducing transformer energy loss by lowering excess capacity.These strategies also have the potential for considerable savings, although the initial cost of thesemeasures was not mentioned in the reports.
One drawback of the information presented in Table 1-9 is that it does not show whether ornot the measure is cost-effective. Some of this information is presented in the following section.
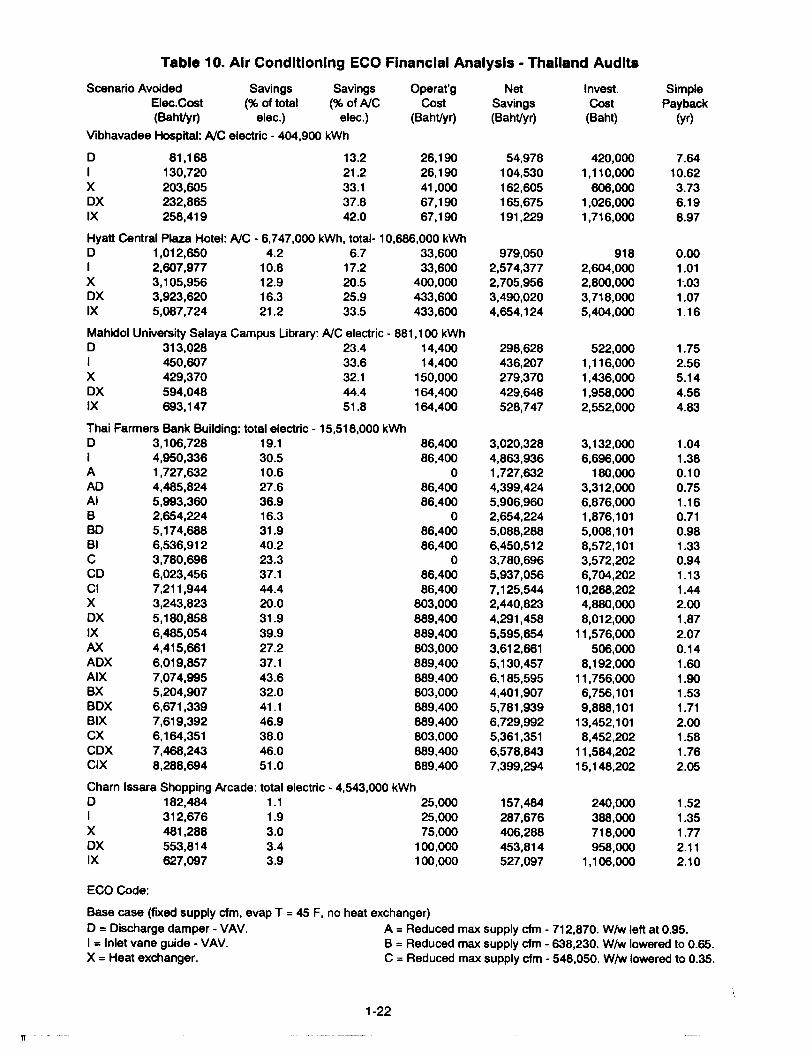
Analysis ofAir-Conditioning ECOs:
Table 1-10 shows a summary of ECO financial analyses performed for commercial buildingsin Thailand. The air-conditioning systems for an office building, a hotel, a hospital, a library, and ashopping center were modeled using DOE-2. ECOs related to the air-conditioning systems werealso modeled. A simplified version of the financial analysis is provided here.
Of the five building types examined, hotel ECOs have the shortest paybacks, followed by theoffice building, the shopping center, the university library, and the hospital. This order roughly follows the total electric consumption of the buildings, with the largest total consumers having ECOswith the shortest paybacks. This is apparently due to the relatively lower investment cost for largerECOs. This order is also parallel to the electric intensity of the buildings. The university libraryand the hospital-the buildings with the lowest electric intensities---have the longest paybacks. Insummary, buildings with low electricity consumption and intensity will have the longest paybackperiods.
All of the ECOs modeled have the potential to save substantial amounts of energy and payfor themselves qUickly. Indeed, each ECO type has at least one application where its payback isless than 1.1 years. The ECOs can be combined to provide additional savings, but because oftheir overlapping nature, the payback periods will increase with combinations.
Clearly the cheapest. quickest way to save energy is to reduce the intake of outside air tothe minimum required. This measure was calculated for the office building. Because of the lowinvestment cost involved, the payback is very quick (0.1 years). This measure could not berecommended for the other bUildings, since their outside air intake was judged to be already at aminimum.
Two types of VAV ECOs were modeled. The inlet guide vane method of effecting VAV control typically saves nearly twice as much money as the discharge damper method, but because itsinitial cost is far higher, the inlet guide vane ECO typically has slightly longer paybacks.
Heat exchangers to precondition incoming air with outgoing exhaust air are also costeffective, with gross savings and investment costs comparable to the amounts for the inlet guidevane ECOs. However, fairly high operating costs lower net savings, and extend payback periodsslightly.
In the office building, two ECOs, which involved reducing the amount of window area, weremodeled. These measures result in lowered cooling loads and lowered requirements for cool supply air. The office building has a window-to-wall ratio of 0.95. The two measures decreased thisratio to 0.65 and to 0.35 by inserting insulating panels in portions of the windows. Both measures
1-7
Il
had a payback period of less than one year.
The savings modeled in these buildings are substantial. The individual measure typeswhich produce the greatest savings are the inlet guide vanes and the heat eXchangers. Combinations of ECOs-such as in the office building-can eliminate over half of the total electric consumption. In the university library, ECOs save over half of the electricity used by the airconditioning system.
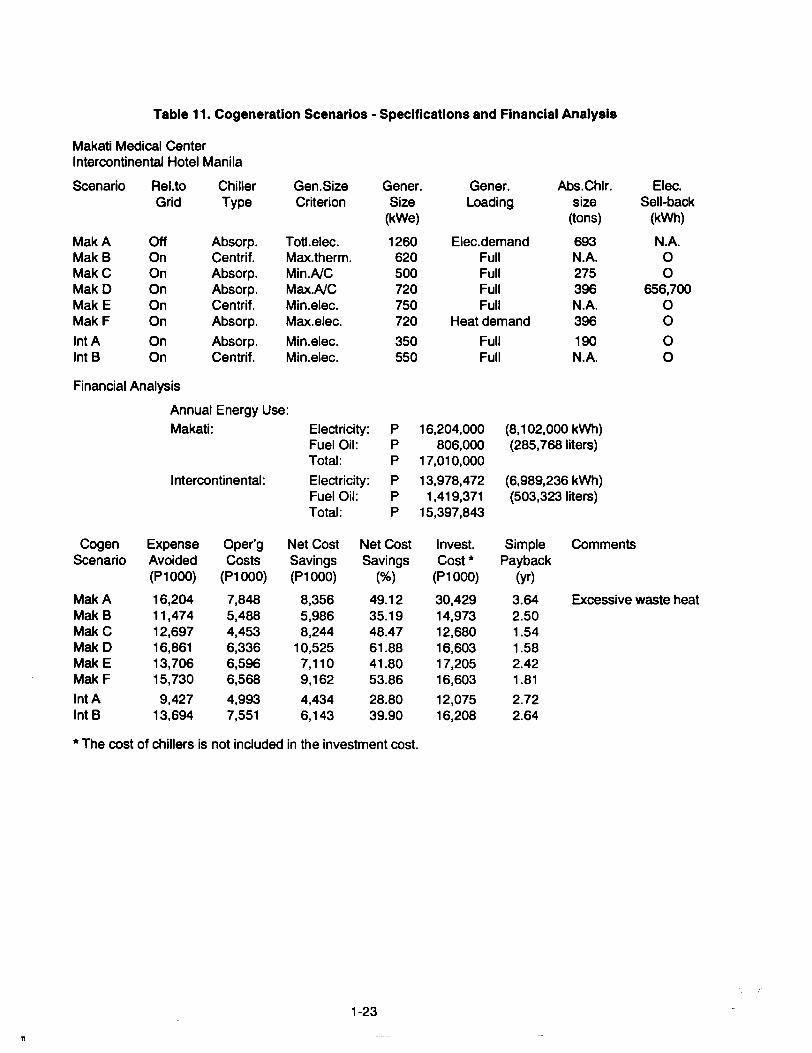
Cogeneration Analysis:
Philippine analysts performed feasibility studies for cogeneration at a hotel and at a hospital(see Table 1-11). These types of facilities are often suited for cogeneration because of their largeheat requirements-for domestic hot water, laundry, and cooking. several scenarios were investigated at each facility, involving varying chiller types. sizing criteria, and relationships to the utilitygrid. A number of financing schemes were also investigated, but for simplicity of presentation, thissection limits the financial discussion to savings, investment, and payback.
All of the cogeneration scenarios save considerable energy. Net monetary savings rangefrom 28% to 62% of total energy costs. In the hospital, the two scenarios with the lowest paybacks (1.54 and 1.58 years) incorporate absorption chillers to make use of generator waste heat.One of these scenarios. with the generator sized to meet maximum air-conditioning need,includes a sell-back of electricity to the utility. It should be noted that the cost of the chillers wasnot included in the investment cost, for either the absorption or for the centrifugal chiller cases.The hospital scenarios using centrifugal chillers have a somewhat longer payback. The scenariowith the hospital isolated from the utility grid appears to be the worst investment choice, since it isthe only one with a payback of more than three years.
The paybacks for the two scenarios for the hotel are not as short as the best hospitalscenarios, but are still under three years. The generators in both scenarios are sized to meet theminimum electric demand, but the generators are different sizes because one scenario usesabsorption and the other uses centrifugal chiller equipment.
Daylighting Simulation Results:
Philippine analysts have modeled the existing lighting in four office buildings. incorporatingboth artificial and natural light (see Table 1-12). They have also modeled the buildings' electricityuse for the hypothetical case in which there is only artificial light. The resulting analysis, while notexactly a calculation of potential savings from daylighting measures, provides an indication of theeffects of natural lighting on building energy use. In brief, natural lighting SUbstantially lowers theneed for artificial light, while slightly raising the need for cooling. The overall effect of natural lighting is to lower building energy use.
THE VOLUME
It would be impossible to represent all the auditing work done throughout ASEAN in thisvolume. Instead, we chose seven studies to provide a sample of both country activities and different building types (Appendices B-H). We also included the ASEAN BUilding Energy Database.and a sample energy survey form for those analysts interested in doing similar auditing work intheir own countries.
BIBLIOGRAPHY
Indonesia
Kurisman, Soegijanto. Affendi. M., and Irvan. 1988. Building Control and Monitoring for Commercial Buildings in Indonesia. ASEAN - USAID Project on Energy Conservation in Buildings.
Surabaya Energy Audit Group. 1989. A Survey on the Energy Use in a Commercial Building.Energy Audit Report, Indonesia.
1-8
Surabaya Energy Audit Group. 1988. A Survey on the Energy Use in Hotels. ASEAN - USAIDProject on Energy Conservation in Buildings, Indonesia.
Malaysia
Abd. Rahman, H.H.J. and Kannan, KS. 1988. Preliminary Energy Audit Report: Holiday Inn CityCentre, Kuala Lumpur, Malaysia. Energy Group Research. Faculty of MechanicalEngineering, Universiti Teknologi Malaysia, Kuala Lumpur.
Kannan, KS. Energy Conservation Opportunities in Existing BUildings in Malaysia. UniversitiTeknologi Malaysia, Kuala Lumpur.
Kannan, K.S., and Yaacob, K 1989. Energy Audit Studies and Development of Energy Conservation Requirements in Malaysian Buildings. ASEAN-US Project on Energy Conservation inBuildings, FaCUlty of Mechanical Engineering, Universiti Teknologi Malaysia, Kuala Lumpur.
Kannan, KS., and Yaacob, AK Final Report: Project M3.
Philippines
Soriano, M.L., Ang Co, A.U. Gonzalez, AJ. ASEAN-US Project on Energy Conservation in Buildings: Annual Report (1987-1988)
Soriano, M.L. et al. National Power Corporation. Energy Audit Report.
Soriano, M.L. & Ang Co. 1988. A Feasibility StUdy on Cogeneration at Makati Medical Center. P5- Assessment, Analysis & Policy.
Summary of Building Envelope Characteristics and Peak Load Components of Office Buildings inthe Philippines. Office of Energy Affairs, Conservation Division.
Summary on Cogeneration Study in Buildings. ASEAN - US Project on Energy Conservation inBuildings.
P1 Group Researchers, 1990. The following reports: DOE-2.1 B Simulation Reports of Four OfficeBuildings, Daylighting Manual, Section 2.0 Office Buildings (parts 1 and 2), section 3.0 Mercantile Buildings, Section 5.0 Assembly Buildings, Section 4.0 Lodging Facilities, Section 6.0Health Facilities, Section 7.0 Food sales and Services. ASEAN-US Project on Energy Conservation in Buildings, Philippines.
Soriano, M., Gonzalez, A, Marasigan, B., Mata, D., Marante, B., and Ang, A. Preliminary EnergyAudit Report on the following buildings: China Bank, Citibank Centre, Computer InformationSystem, Eastern Telecoms Philippines Inc., Hotel Intercontinental Manila, Insular Ufe,Manila Peninsula, Metrobank Plaza, Metropolitan Waterworks and Sewerage System,National Ufe Insurance Company, Petrophil Corporation, Philippine Coconut Authority, Philippine Deposit Insurance Corporation, Phinma, Social Security System, St. Luke's Hospital,Technology and Livelihood Resource Center, and Thriftway Supermarket.
Soriano, M., Divinagracia, I., Ang, A., Gonzalez, A., Uu, A, Marasigan, B., Mats, D., and salVO, J.1988. Hotel Intercontinental Manila: Energy Audit Report. Makati, Metro Manila, Philippines.
Singapore
Kee, G.L., and Peng, HK 1987. Study on the Energy Consumption of Office BUildings in Singapore. School of Mechanical and Production Engineering, National University of Singapore,Singapore.
Woods, P. Singapore Lighting Study.
Wong, Y.W.. 1989. Final Report: Project S3 - Energy Management: Phase II ASEAN-US EnergyCooperation Programme. School of Mechanical and Production Engineering, Nanyang
1-9
-11
Technological Institute, Singapore.
Thailand
Hungspreug, P., Kijwatanachai, B., Kongsakpaibul, C., and Kanchanajongkol, C. Progress ReportASEAN - USAID Project on Energy Conservation in Buildings, Air-Conditioning System andProgress Report ASEAN - USAID Project on Energy Conservation in BUildings AirConditioning System on the following buildings: Central Plaza Hotel, Mahidol University,Salaya campus Library, Thai Farmers Bank Head Quarter, Vibhavadee Hospital.
Jiraratananon, S. Daylighting: Annual Report. ASEAN - US Project on Energy Conservation inBUildings.
Jiraratananon, S. The Potential for Energy Efficiency Improvements in Thailand's Building Sector.
United States
ASEAN/USAID, 1989. Proceedings of the ASEAN Special Sessions of the ASHRAE Far EastConference on Air Conditioning in Hot Climates, Kuala Lumpur, Malaysia, Oct. 26-28,1989.Lawrence Berkeley Laboratory, Berkeley, CA, USA, LBL-28639.
U.S. EIA (Energy Information Administration), 1989. Nonresidential Buildings Energy Consumption Survey: Commercial Buildings Consumption and Expenditures 1986. U.S. GovernmentPrinting Office (GPO), Washington D.C., USA.
1-10
n
Table 1. Energy Studies Conducted
Offices Hotels Hospitals Stores Sprmkts. Undefd TotalIndonesia
Survey 4 4 0 0 0 0 8Audit 1 4 0 0 0 0 5ASEAM 1 4 0 0 0 0 5DOE-2 0 0 0 0 0 0 0
MalaysiaSurvey 23 4 0 3 0 2 32Audit 2 2 1 0 0 0 5ASEAM 12 3 0 1 0 0 16DOE-2 0 0 0 0 0 0 0
PhilippinesSurvey 24 7 9 2 3 0 45Audit 18 3 2 0 1 0 24ASEAM 26 9 10 2 4 0 51DOE-2 3 2 1 0 1 0 7
SingaporeSurvey 65 0 0 3 0 6 74Audit 4 2 0 0 0 1 7ASEAM 4 0 0 2 0 0 6DOE-2 0 0 0 0 0 0 0
ThailandSurvey 1 1 0 1 0 0 3Audit 6 14 8 2 0 0 30ASEAM 0 0 0 0 0 0 0DOE-2 1 1 1 1 0 2 6
1-11,,'".
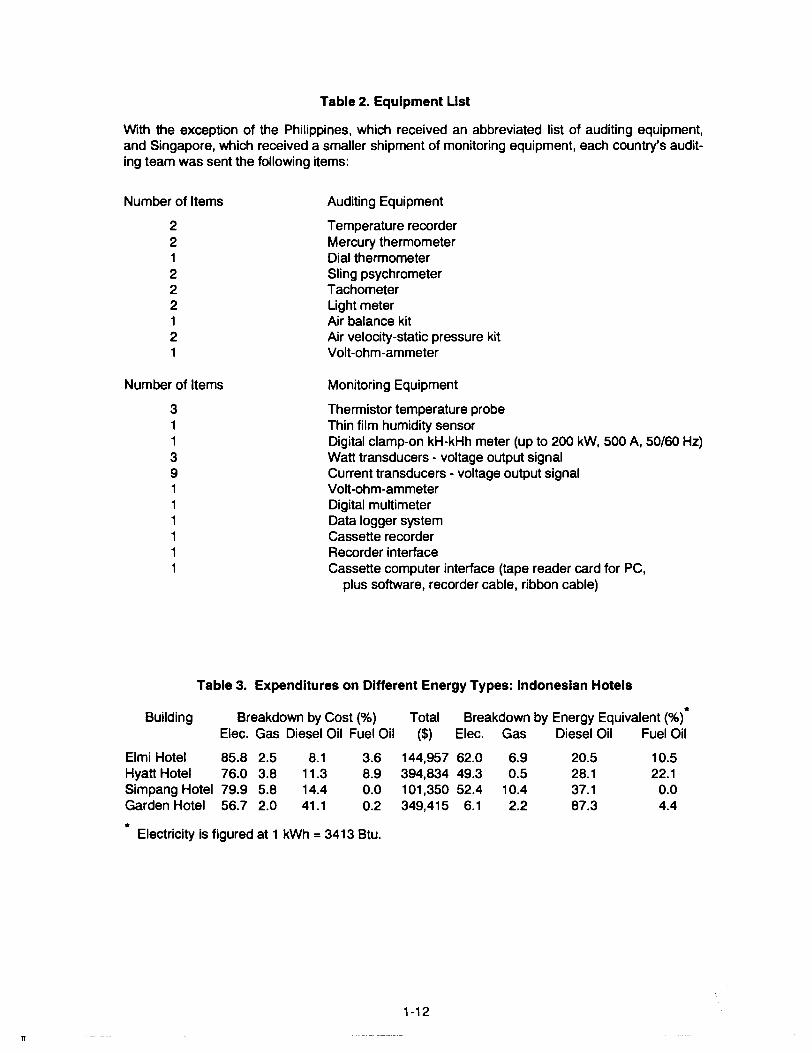
Table 2. Equipment List
With the exception of the Philippines, which received an abbreviated list of auditing equipment,and Singapore, which received a smaller shipment of monitoring equipment, each country's auditing team was sent the following items:
Number of Items
221222121
Number of Items
31139111111
Auditing Equipment
Temperature recorderMercury thermometerDial thermometerSling psychrometerTachometerLight meterAir balance kitAir velocity-static pressure kitVolt-ohm-ammeter
Monitoring Equipment
Thermistor temperature probeThin film humidity sensorDigital clamp-on kH-kHh meter (up to 200 kW, 500 A, 50/60 Hz)Watt transducers - voltage output signalCurrent transducers - voltage output signalVolt-ohm-ammeterDigital multimeterData logger systemCassette recorderRecorder interfaceCassette computer interface (tape reader card for PC,
plus software, recorder cable, ribbon cable)
11
Table 3. Expenditures on Different Energy Types: Indonesian Hotels
*Building Breakdown by Cost (%) Total Breakdown by Energy Equivalent (%)Elec. Gas Diesel Oil Fuel Oil ($) Elec. Gas Diesel Oil Fuel Oil
Elmi Hotel 85.8 2.5 8.1 3.6 144,957 62.0 6.9 20.5 10.5Hyatt Hotel 76.0 3.8 11.3 8.9 394,834 49.3 0.5 28.1 22.1Simpang Hotel 79.9 5.8 14.4 0.0 101 ,350 52.4 10.4 37.1 0.0Garden Hotel 56.7 2.0 41.1 0.2 349,415 6.1 2.2 87.3 4.4
* Electricity is figured at 1 kWh = 3413 Btu.
1-12
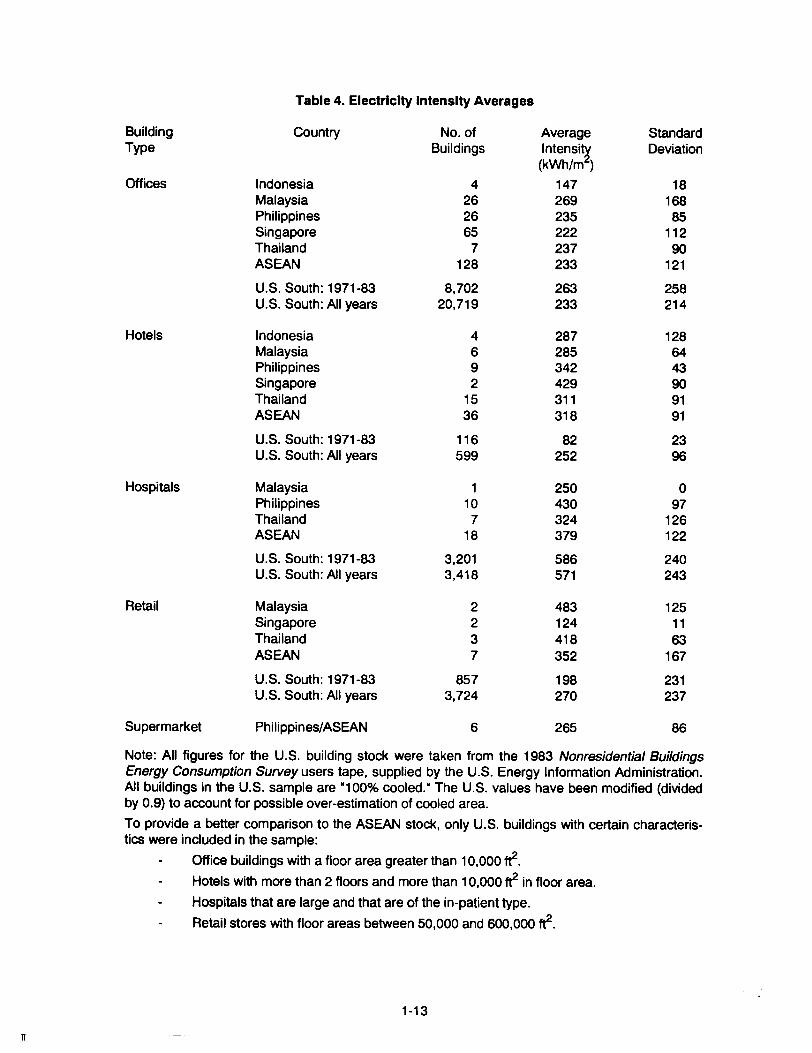
Table 4. Electricity Intensity Averages
Country No. of Average StandardBuildings Intensi~ Deviation
(kWh/m)
Indonesia 4 147 18Malaysia 26 269 168Philippines 26 235 85Singapore 65 222 112Thailand 7 237 90ASEAN 128 233 121
U.S. South: 1971-83 8,702 263 258U.S. South: All years 20,719 233 214
Indonesia 4 287 128Malaysia 6 285 64Philippines 9 342 43Singapore 2 429 90Thailand 15 311 91ASEAN 36 318 91
U.S. South: 1971-83 116 82 23U.S. South: All years 599 252 96
Malaysia 1 250 0Philippines 10 430 97Thailand 7 324 126ASEAN 18 379 122
U.S. South: 1971-83 3,201 586 240U.S. South: All years 3,418 571 243
Malaysia 2 483 125Singapore 2 124 11Thailand 3 418 63ASEAN 7 352 167
U.S. South: 1971-83 857 198 231U.S. South: All years 3,724 270 237
Philippines/ASEAN 6 265 86
Offices
Supermarket
Note: All figures for the U.S. building stock were taken from the 1983 Nonresidential BuildingsEnergy Consumption Survey users tape, supplied by the U.S. Energy Information Administration.All buildings in the U.S. sample are "100% cooled." The U.S. values have been modified (dividedby 0.9) to account for possible over-estimation of cooled area.
To provide a better comparison to the ASEAN stock, only U.S. buildings with certain characteristics were included in the sample:
Office buildings with a floor area greater than 10,OOO~.
Hotels with more than 2 floors and more than 10,000~ in floor area.
Hospitals that are large and that are of the in-patient type.
Retail stores with floor areas between 50,000 and 600,000~.
Retail
Hotels
Hospitals
BuildingType
1-13
n
=l
Table 5. Summary of Lighting Survey Results - The Philippines and Singapore
Philippines
Activity*
Working Plane Illuminance (lux) Lighting Power Density (W/m2)
(no. of cases) With Artificial Lights Difference fromAvg. Max. Min. Std. Dev. No-Lights Condo Avg. Max. Min. Std. Dev.
Offices (28) 374 1214 85 274 152 19.3 43.3 2.5 8.9Cont. Rooms (8) 583 2595 132 766 278 17.8 29.8 4.0 9.2
Corridors (9) 268 1250 30 355 15.6 15.6 15.6 0.0Lobbies (7) 159 380 25 355 11.6 15.6 3.7 5.6
Restaurants (5) 78 160 15 55 15.9 15.9 15.9 0.0
Hosp. Rooms (6) 118 165 48 37 26 10.7 16.6 6.0 4.2
.... Singapore,....Lighting Power Density (W/m2)~ Activity Working Plane Illuminance (lux)
(no. of cases) With Artificial Lights
Avg. Max. Min. Std. Dev. Avg. Max. Min. Std. Dev.
Offices (136) 366 946 94 167 19.0 60.0 5.0 8.0Shopping (45) 436 1140 128 235 29.0 79.0 11.0 15.0Circulation (81) 134 518 13 111 16.0 48.0 1.0 11.0
Classrooms (44) 400 865 115 125 10.0 13.0 5.6 1.4
Production Areas (17) 520 887 169 224 24.0 59.0 3.7 14.0
Note: Lighting information was available for all of the ASEAN countries. Philippine and Singapore
data are shown here because they are the most extensive.
* A case represents the information about either a single space or about a bUilding. Not all cases
contain complete data sets. The illuminance level in each case is either a mean of the readings
taken, or the midpoint of the range.
IT
Table 6. Breakdown of Electricity Use by Component - Averages
Building Country NO.of Consumption by Component (%)Type Bldgs. NC Fans Ltg. Misc.
Offices Indonesia 1 36.6 43.5 11.8 8.1Malaysia 5 60.1 8.7 23.1 8.1Philippines 24 45.0 16.2 22.5 15.6Singapore 4 36.6 13.2 24.2 26.0ASEAN* 34 46.0 15.6 22.5 15.5DOE-2 Simulation ** 40.0 18.0 23.0 18.0
Hotels Indonesia 4 30.4 27.2 18.5 23.9Malaysia 3 47.3 13.8 22.8 16.1Philippines 8 45.7 18.2 16.2 18.2Singapore 2 48.6 6.8 38.6 6.0ASEAN* 17 42.7 18.2 20.6 17.7
Hospitals Malaysia 1 49.7 28.2 14.7 7.4Philippines 8 47.1 9.0 6.6 34.5ASEAN* 9 47.4 11.1 7.5 31.5
Stores Malaysia/ASEAN * 1 26.9 13.2 46.5 13.4
Schools Singapore/ASEAN * 1 50.0 21.0 22.0 7.0
Supermarkets Philippines/ASEAN * 4 49.9 9.0 6.6 34.5
* ASEAN averages are weighted by the number of buildings audited per country.
** Levine at al. (ASEAN/USAID 1989) simulated an imaginary office building with DOE-2. usingaverage characteristics of buildings in the Manila area as inputs.
1-15
"
Table 7. Breakdown of Peak Cooling Loads· The Philippines
Building Type Total Load Components (%) Totaland Name Per Area (Btu/hr)
(Btuh/m2) Glass Glass Wall Roof Opaque People Ughts Equip. Infilt. Misc.Solar Conduc. Conduc. Conduc. Solar Load
Offices:BA Lepanto 201 21.0% 14.8% 12.1% 0.0% 6.1% 15.4% 16.8% 4.2% 7.0% 2.6% 4,287,491Cmptr. Info. Sys. 200 20.9% 8.5% 6.1% 4.8% 9.5% 20.2% 10.7% 11.6% 5.7% 2.0% 948,127King's Court 324 44.2% 23.4% 0.0% 0.6% 7.7% 8.8% 7.5% 5.0% 1.9% 1.0% 3,085,410PTC,lnc 231 31.4% 8.6% 6.4% 0.6% 6.6% 16.2% 13.7% 11.1% 2.7% 2.7% 293,899Insular Ufe 200 28.8% 7.9% 2.9% 0.6% 6.2% 20.1% 24.1% 2.7% 4.4% 2.4% 4,064,522Eastern Tele. 231 12.2% 7.0% 9.3% 1.1% 10.9% 11.9% 14.8% 23.1% 5.9% 3.8% 2,733,527Petrophil 296 22.5% 7.5% 9.2% 1.6% 8.3% 14.3% 23.4% 4.8% 6.3% 2.2% 3,2n,672Citibank Ctr. 282 14.9% 4.4% 14.7% 0.0% 8.0% 22.0% 13.8% 15.2% 3.5% 3.5% 5,078,250
..... Metrobank 252 24.0% 13.6% 9.5% 1.3% 8.5% 12.4% 9.8% 13.7% 5.6% 1.7% 4,655,995,
China Bank 455 37.8% 21.9% 0.0% 0.0% 6.0% 11.8% 9.6% 6.3% 3.3% 3.3% 5,847,389.....m Far East Bank 207 26.7% 10.3% 11.6% 1.1% 5.7% 14.8% 17.2% 2.9% 6.6% 2.9% 1,108,472
Nat. Ufe Ins. 337 23.4% 11.3% 15.1% 1.0% 10.8% 11.6% 15.9% 5.9% 3.3% 1.6% 3,127,325PDIC 346 20.7% 9.4% 10.0% 6.2% 14.0% 12.0% 4.8% 8.6% 6.6% 7.6% 514,987Phil. Coco. Auth. 271 37.5% 19.4% 1.1% 2.3% 9.3% 6.0% 15.0% 5.6% 3.7% 0.2% 1,986,402Metro W&S Sys. 238 13.5% 9.4% 2.7% 6.3% 7.5% 22.3% 23.1% 10.0% 4.3% 0.9% 5,107,153Centr Bank 195 7.6% 4.7% 6.9% 5.9% 11.6% 21.0% 26.5% 6.0% 6.3% 3.3% 21,445,662S SSys 478 9.8% 7.6% 6.7% 2.5% 9.5% 30.5% 22.0% 6.1% 3.6% 1.6% 6,445,386DeptT&1 181 11.9% 9.8% 6.7% 6.6% 10.5% 20.7% 16.7% 3.3% 7.6% 6.3% 1,489,697Bur. of Int. Rev 345 27.5% 17.1% 3.5% 1.2% 8.5% 14.1% 15.3% 5.1% 3.5% 4.2% 6,401,332Nat. Power.Corp 200 14.5% 6.4% 5.5% 2.3% 8.0% 18.9% 23.1% 8.3% 4.9% 8.1% 1,217,618Dev. Bank of P 245 17.2% 13.1% 0.4% 1.5% 1.9% 21.8% 18.3% 17.3% 5.7% 2.8% 3,794,789Tech. Res. Ctr. 250 20.8% 10.8% 5.4% 4.4% 6.9% 7.8% 24.5% 9.5% 3.9% 6.0% 915,334Nestle Phil. 193 15.7% 7.6% 2.5% 4.1% 9.0% 14.4% 27.8% 9.4% 4.2% 5.1% 1,073,159Bliss Bldg. 235 18.5% 5.2% 2.3% 3.7% 3.2% 22.2% 19.1% 10.6% 6.7% 8.5% 1,233,636
Hotels:Hilton Makati 230 16.8% 6.4% 9.1% 1.3% 9.8% 12.2% 31.2% 5.8% 5.4% 2.2% 5,632,994Hyatt Manila 181 15.2% 9.3% 8.3% 2.1% 6.9% 10.1% 21.0% 5.0% 4.5% 17.6% 2,971,279Intercontinental 317 23.7% 11.6% 4.2% 1.7% 6.6% 27.5% 12.8% 6.4% 2.1% 3.4% 4,530,351Holiday Inn 228 28.0% 18.7% 11.9% 0.5% 6.5% 9.0% 9.9% 5.7% 3.7% 6.1% 4,689,345Manila Pen 168 23.9% 14.1% 6.0% 3.1% 7.2% 12.8% 13.3% 6.9% 5.8% 7.1% 7,312,060Phil. Plz. Man 269 28.9% 14.8% 2.8% 3.4% 8.7% 11.0% 19.8% 4.9% 4.7% 1.0% 12,975,950
""
Table 7. Breakdown of Peak Cooling Loads· The Philippines· Con't.
Building Type Total Load Components (%) Totaland Name Per Area (Btulhr)
(Btuh/m2) Glass Glass Wall Roof Opaque People Lights Equip. Infilt. Misc.
Solar Conduc. Conduc. Conduc. Solar Load
Mandarin Mak 253 14.8% 8.8% 19.4% 1.6% 7.1% 20.4% 14.7% 7.3% 4.2% 1.8% 7,319,770Silahi Manila 173 17.0% 10.4% 8.7% 0.7% 5.6% 12.8% 27.7% 6.8% 5.7% 4.6% 5,284,266
Hospitals:Makati Mad. Ctr 185 17.2% 14.6% 7.0% 1.3% 5.5% 21.7% 17.3% 6.1% 5.9% 3.4% 5,611,755Lung Center 240 17.1% 13.4% 4.6% 5.4% 9.7% 11.5% 20.4% 7.2% 6.4% 4.4% 5,015,089FEU Hospital 306 10.5% 6.7% 12.5% 3.4% 16.4% 17.2% 14.5% 3.6% 9.0% 6.2% 846,806UST Hospital 235 14.5% 7.0% 10.2% 3.4% 6.5% 12.6% 19.3% 7.6% 14.6% 4.3% 4,092,419St Luke's 310 21.9% 9.7% 8.5% 4.0% 7.9% 10.2% 6.5% 5.2% 15.7% 10.4% 2,021,817Manila Doctors 259 14.9% 7.2% 12.2% 3.9% 5.3% 15.0% 20.7% 9.7% 6.0% 5.2% 2,255,707
...... Capitol Med. 294 25.2% 9.3% 10.0% 1.3% 7.2% 11.5% 14.0% 3.9% 12.7% 5.0% 1,210,476I......
Card. Santos 310 26.0% 14.4% 9.7% 3.2% 7.2% 10.2% 7.1% 13.7% 5.3% 3.1% 2,130,073""'"
Supermarkets:Thriftway 263 3.6% 1.0% 5.0% 14.5% 42.6% 19.6% 4.5% 3.2% 4.9% 1.0% 747,610Glori Del Mt. 349 1.5% 0.7% 3.5% 16.2% 23.5% 35.2% 4.2% 2.2% 11.3% 1.6% 623,367Glori Races 277 4.9% 1.8% 6.6% 13.0% 11.4% 29.6% 1.5% 1.7% 21.6% 7.8% 621,622Glori's Tnd. So 418 5.4% 1.7% 5.5% 17.5% 30.7% 18.4% 4.5% 2.0% 11.9% 2.4% 523,451
Office Average 250 18.9% 10.3% 6.3% 2.8% 8.6% 18.0% 19.1% 7.9% 5.0% 2.9% 3,605,329Hotel Average 223 22.2% 12.2% 8.3% 2.1% 7.6% 14.2% 18.7% 6.0% 4.6% 4.1% 6,339,502Hospital Average 237 17.9% 11.3% 8.3% 3.3% 7.4% 14.5% 16.5% 7.3% 8.8% 4.7% 2,898,018Supermarket Average 310 3.8% 1.3% 5.1% 15.2% 27.7% 25.7% 3.7% 2.3% 12.1% 3.1% 629,013
BuildingType &Country
Building Name(Annual kWh)
Table 8. Summary of ECOs
Description of ECO Indiv. ECO Total SavingsSavings per Building *
(% of elec.) (% of elec.)
2.76.24.5
4.5
0.22.27.4
(10% ofNC)(28% of Itg)
0.21.4
20.214.614.0
7.01.10.2
4.8
Offices:I
M
M
P
P
P
P
P
P
P
P
P
P
P
Wisma Sier Bldg. Eliminate 1-flight elevator trips(910,000) Replace incandescent lamps with fluorescent
Replace over-sized cooling tower pumps
JKR Elec. Blk. Install NC controlsInstall efficient fluor. lamps and ballasts
Public Wks. Dept.Seal and weatherstrip all windows and doors(258,000) Install efficient lamps and ballasts
Nat. Power Corp. Install VAV controls(4,799,000) Install efficient water-cooled chillers
Minimize fresh air intake, to 3.5 I/s/personIncrease thermostat setpoint: 22 C to 25.6 CReplace inefficient chilled water pumpsInstall cabinets on walls for insulation
Switch off half the NC compressors at lunchRaise setpoint to 25.5C
Reduce lighting schedule by 1-1/2 hoursReset thermostat to 25.5CReduce NC compressor run time by 30 minutes
Delamp entire buildingInstall thermostatic compressor controls
and reset setpoint to 25.5CReduce NC system time by 30 minutes
DelampingRaise setpoint to 25.5C
Delamp entire buildingImprove system power factorRaise setpoint to 25.5CReduce minimum outside air
DelampImprove system power factorRaise setpoint to 25.5CPartially reduce chiller hours
Reduce lighting hours by 90 minutesRaise setpoint to 25.5CReduce chiller operating time by 30 minutes
Delamp and install efficient reflectorsTurn off some lights at lunch timeImprove system power factorRaise setpoint to 25.5CReduce NC equipment run time
Improve system power factorRaise setpoint to 25.5CInstall package NC for evening part loadTurn off NC at lunch timeDelamp and install efficient reflectors
1.70.5
5.36.5
20.67.46.05.6
9.44.96.14.0
4.20.81.5
14.21.41.91.56.8
6.83.11.01.2
(50% of Itg)
8.8
1.4
34.0**
4.8
12.1
6.0
10.6
35.6
22.0
5.9
23.2
10.9
3.6
11
1-18
11
Table 8. Summary of ECOs • Con'l
Building Building Name Description of ECO Indiv. ECO Total SavingsType & (Annual kWh) Savings per Building *Country (% ofelec.) (% ofelec.)
Raise setpoint to 25.5C 2.4Reduce run time of AlC system 1.6
P Delamping 5.2 12.4Raise setpoint to 25.5C 4.3Reduce AlC equipment run time by 30 minutes 2.9Isolate off-line cooling tower 1.4Raise chiller setpoint one degree (3% of chlr)
P Delamping 4.7 8.8Raise setpoint to 25.5C 2.0Switch off chiller and aux. 30 minutes early 1.2Reduce ventilation air 0.5Use smaller chiller during lunchtime 1.4
P Modify air flow to air-cooled condensers 2.8 9.2Switch off chiller 30 minutes early daily 2.2Install VAV controls 5.2
P Install power factor correcting capacitors 4.3 14.4Raise setpoint to 25.5C 5.1Reduce AlC equipment run time 3.6Relocate some offices to lower cooling load 3.0
P Delamping 5.4 5.8Raise setpoint to 25.5C 1.0Raise chilled water setpoint one degree (6% of chlr)
S Albert Complex Reduce plant operation by one hour "marginal" 1.6(5,412,000) Reduce infiltration from 0.25 ACH to 0.1 "marginal"
Reduce ventilation rate from 11 % to 8% 1.6
S URABuilding Reduce ventilation rate to 8% 1.3 1.3(1,573,000)
S Sanford Bldg. Replace single-glazing with double 2.1 8.3(2,238,000) Reduce plant operation by one hour 5.1
Reduce lighting intensity by 10% 2.1Reduce ventilation rate from 7% to 5% 1.3
S Jurong Town HI. Reduce lighting wattage by 5% 1.2 2.7(2,037,000) Delay plant starting by 15 minutes 1.8
T Siam Motor Bldg. Daylighting (50% of Itg)
T Thai Farmers Bk Install inlet vane VAV controls 30.5 51.0 **(15,518,000) Install heat exchanger for incoming air 20.0 ##
Minimize fresh air intake 10.6Lower w/w ratio from 0.95 to 0.35 23.3
Hotels:
I Elmi Hotel Reduce lamp wattage by 8,730 1.1 10.4(2,955,000) Reduce infiltration: 2 ACH to 1.5, and 1 to.6 0.3
Reduce oper'g hours: 16 to 10 0.7Increase COP: 3.5 to 4.5 9.5
Hyatt Hotel Raise thermostat setpoint: 72 F to 77 0.4 0.5(6,775,000) Reduce operating hours: 12 to 10 0.1
1-19
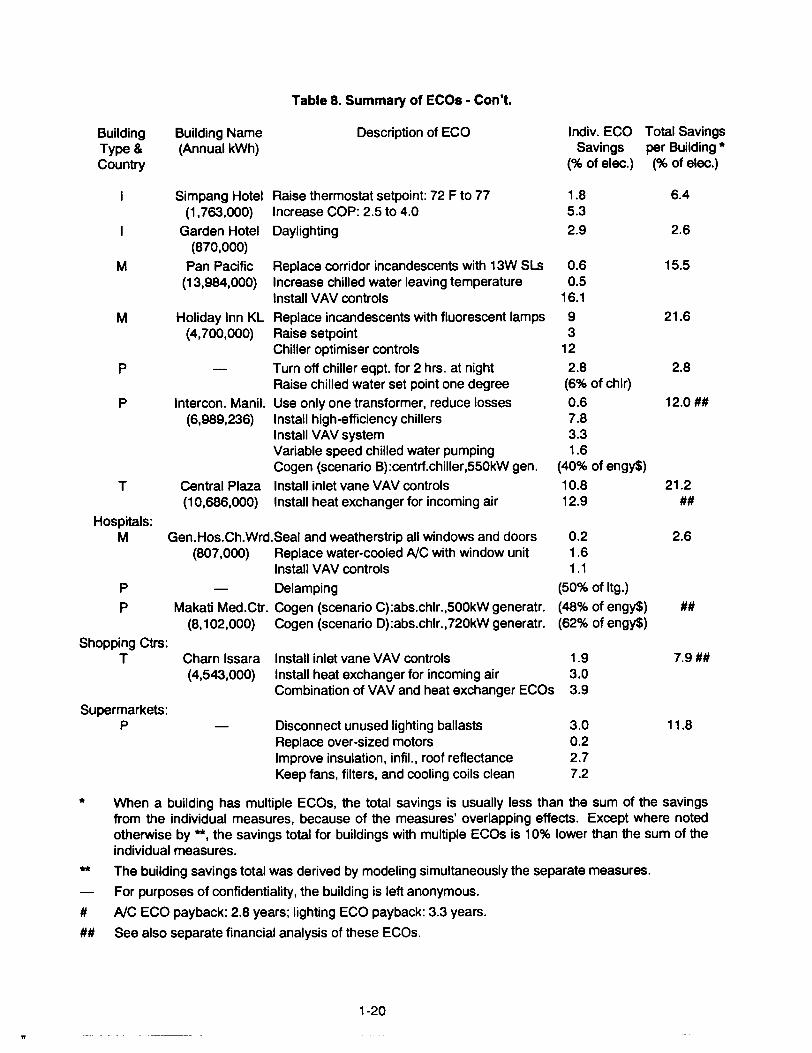
Table 8. Summary of ECOs • Con't.
Building Building Name Description of ECO Indiv. ECO Total SavingsType & (Annual kWh) Savings per Building *Country (% ofelec.) (% ofelec.)
Simpang Hotel Raise thermostat setpoint: 72 F to 77 1.8 6.4(1,763,000) Increase COP: 2.5 to 4.0 5.3
Garden Hotel Daylighting 2.9 2.6(870,000)
M Pan Pacific Replace corridor incandescents with 13W SLs 0.6 15.5(13,984,000) Increase chilled water leaving temperature 0.5
Install VAV controls 16.1
M Holiday Inn KL Replace incandescents with fluorescent lamps 9 21.6(4,700,000) Raise setpoint 3
Chiller optimiser controls 12
P Turn off chiller eqpt. for 2 hrs. at night 2.8 2.8Raise chilled water set point one degree (6% of chlr)
P Intercon. Manil. Use only one transformer, reduce losses 0.6 12.0 ##(6,989,236) Install high-efficiency chillers 7.8
Install VAV system 3.3Variable speed chilled water pumping 1.6Cogen (scenario B):centrf.chiller,550kW gen. (40% of engy$)
T Central Plaza Install inlet vane VAV controls 10.8 21.2(10,686,000) Install heat exchanger for incoming air 12.9 ##
Hospitals:M Gen.Hos.Ch.Wrd.Seal and weatherstrip all windows and doors 0.2 2.6
(807,000) Replace water-cooled NC with window unit 1.6Install VAV controls 1.1
P Delamping (50% of Itg.)
P Makati Med.Ctr. Cogen (scenario C):abs.chlr.,500kW generatr. (48% of engy$) ##(8,102,000) Cogen (scenario D):abs.chlr.,720kW generatr. (62% of engy$)
Shopping Ctrs:T Cham Issara Install inlet vane VAV controls 1.9 7.9##
(4,543.000) Install heat exchanger for incoming air 3.0Combination of VAV and heat exchanger ECOs 3.9
Supermarkets:P Disconnect unused lighting ballasts 3.0 11.8
Replace over-sized motors 0.2Improve insulation, infil., roof reflectance 2.7Keep fans, filters, and cooling coils clean 7.2
*
**
#
##
When a building has multiple ECOs, the total savings is usually less than the sum of the savingsfrom the individual measures, because of the measures' overlapping effects. Except where notedotherwise by **, the savings total for buildings with multiple ECOs is 10% lower than the sum of theindividual measures.
The building savings total was derived by modeling simultaneously the separate measures.
For purposes of confidentiality, the building is left anonymous.
NC ECO payback: 2.8 years; lighting ECO payback: 3.3 years.
See also separate financial analysis of these ECOs.
1-20

ECOType
Table 9. Summary of Savings by ECO Type
No. ofCases
Average SavingsPerECO
(% of Bldg. Elec.)
11
Electrical System:Raise power factorlower excess transformer capacity
Air Conditioning System:Install VAV controlsInstall heat-exchanger for incoming airInstall high-efficiency chillersMaintain clean AHU filters, cooling coilsMinimize outdoor air intakeOptimize multiple chiller operationRaise AlC condenser temperatureReplace over-sized electric motorsRaise setpoint to 25.5CRelocate offices to lower cooling loadModify airflow to condensersReduce AlC equipment run timeInstall variable speed pumpsInstall small AlC for separate spacesInstall high-efficiency pumps
Lighting:lower lighting wattageReduce lighting hours
Envelope modifications:lower window-wall ratioInstall double-glazed windowsInsulation, infiltration, roof absorption
Elevators:Eliminate 1-floor elevator trips
1-21
51
83417312
1711
17122
173
115
1
5.1%3.3%
12.6%12.0%9.6%7.2%6.0%4.9%4.1%3.8%3.6%3.0%2.8%2.3%1.6%1.3%1.3%
5.1%2.8%
12.7%2.1%0.8%
0.2%
IT
Table 10. Air Conditioning ECO Financial Analysis - Thailand Audits
Scenario Avoided Savings Savings Operat'g Net Invest. SimpleElec.Cost (% of total (% of AlC Cost Savings Cost Payback(Baht/yr) elec.) elec.) (Baht/yr) (Bahtlyr) (Baht) (yr)
Vibhavadee Hospital: AlC electric - 404,900 kWh
D 81,168 13.2 26,190 54,978 420,000 7.64I 130,720 21.2 26,190 104,530 1,110,000 10.62X 203,605 33.1 41,000 162,605 606,000 3.73DX 232,865 37.8 67,190 165,675 1,026,000 6.19IX 258,419 42.0 67,190 191,229 1,716,000 8.97
Hyatt Central Plaza Hotel: AlC - 6,747,000 kWh, total- 10,686,000 kWhD 1,012,650 4.2 6.7 33,600 979,050 918 0.00I 2,607,977 10.8 17.2 33,600 2,574,377 2,604,000 1.01X 3,105,956 12.9 20.5 400,000 2,705,956 2,800,000 l.03DX 3,923,620 16.3 25.9 433,600 3,490,020 3,718,000 1.07IX 5,087,724 21.2 33.5 433,600 4,654,124 5,404,000 1.16
Mahidol University Salaya Campus Library: AlC electric - 881,100 kWhD 313,028 23.4 14,400 298,628 522,000 1.75I 450,607 33.6 14,400 436,207 1,116,000 2.56X 429,370 32.1 150,000 279,370 1,436,000 5.14DX 594,048 44.4 164,400 429,648 1,958,000 4.56IX 693,147 51.8 164,400 528,747 2,552,000 4.83
Thai Farmers Bank Building: total electric - 15,518,000 kWhD 3,106,728 19.1 86,400 3,020,328 3,132,000 1.04I 4,950,336 30.5 86,400 4,863,936 6,696,000 1.38A 1,727,632 10.6 0 1,727,632 180,000 0.10AD 4,485,824 27.6 86,400 4,399,424 3,312,000 0.75AI 5,993,360 36.9 86,400 5,906,960 6,876,000 1.16B 2,654,224 16.3 0 2,654,224 1,876,101 0.71BO 5,174,688 31.9 86,400 5,088,288 5,008,101 0.98BI 6,536,912 40.2 86,400 6,450,512 8,572,101 1.33C 3,780,696 23.3 0 3,780,696 3,572,202 0.94CD 6,023,456 37.1 86,400 5,937,056 6,704,202 1.13CI 7,211,944 44.4 86,400 7,125,544 10,268,202 1.44X 3,243,823 20.0 803,000 2,440,823 4,880,000 2.00DX 5,180,858 31.9 889,400 4,291,458 8,012,000 1.87IX 6,485,054 39.9 889,400 5,595,654 11,576,000 2.07AX 4,415,661 27.2 803,000 3,612,661 506,000 0.14ADX 6,019,857 37.1 889,400 5,130,457 8,192,000 1.60AIX 7,074,995 43.6 889,400 6,185,595 11,756,000 1.90BX 5,204,907 32.0 803,000 4,401,907 6,756,101 1.53BDX 6,671,339 41.1 889,400 5,781,939 9,888,101 1.71BIX 7,619,392 46.9 889,400 6,729,992 13,452,101 2.00CX 6,164,351 38.0 803,000 5,361,351 8,452,202 1.58COX 7,468,243 46.0 889,400 6,578,843 11,584,202 1.76CIX 8,288,694 51.0 889,400 7,399,294 15,148,202 2.05
Cham Issara Shopping Arcade: total electric - 4,543,000 kWhD 182,484 1.1 25,000 157,484 240,000 1.52I 312,676 1.9 25,000 287,676 388,000 1.35X 481,288 3.0 75,000 406,288 718,000 1.77DX 553,814 3.4 100,000 453,814 958,000 2.11IX 627,097 3.9 100,000 527,097 1,106,000 2.10
ECOCode:
Base case (fixed supply cfm, evap T =45 F, no heat exchanger)D =Discharge damper - VAV. A =Reduced max supply cfm - 712,870. W/W left at 0.95.I =Inlet vane guide - VAV. B =Reduced max supply cfm - 638,230. W/W lowered to 0.65.X =Heat exchanger. C =Reduced max supply cfm - 548,050. W/W lowered to 0.35.
1-22
11
Table 11. Cogeneration Scenarios - Specifications and Financial Analysis
Makati Medical CenterIntercontinental Hotel Manila
Scenario Rel.to Chiller Gen.Size Gener. Gener. Abs.Chlr. Elec.Grid Type Criterion Size Loading size Sell-back
(kWe) (tons) (kWh)
MakA Off Absorp. Totl.elec. 1260 Elec.demand 693 N.A.MakB On Centrif. Max.therm. 620 Full N.A. 0MakC On Absorp. Min.NC 500 Full 275 0MakD On Absorp. Max.NC 720 Full 396 656,700MakE On Centrif. Min.elec. 750 Full N.A. 0MakF On Absorp. Max.elec. 720 Heat demand 396 0IntA On Absorp. Min.elec. 350 Full 190 0Int B On Centrif. Min.elec. 550 Full N.A. 0
Financial Analysis
Annual Energy Use:
Makati: Electricity: P 16,204,000 (8,102,000 kWh)Fuel Oil: P 806,000 (285,768 liters)Total: P 17,010,000
Intercontinental: Electricity: P 13,978,472 (6,989,236 kWh)Fuel Oil: P 1,419,371 (503,323 liters)Total: P 15,397,843
Cogen Expense Oper'g Net Cost Net Cost Invest. Simple CommentsScenario Avoided Costs Savings Savings Cost * Payback
(P1000) (P1000) (P1000) (%) (P1000) (yr)
MakA 16,204 7,848 8,356 49.12 30,429 3.64 Excessive waste heatMakB 11,474 5,488 5,986 35.19 14,973 2.50MakC 12,697 4,453 8,244 48.47 12,680 1.54MakD 16,861 6,336 10,525 61.88 16,603 1.58MakE 13,706 6,596 7,110 41.80 17,205 2.42MakF 15,730 6,568 9,162 53.86 16,603 1.81
IntA 9,427 4,993 4,434 28.80 12,075 2.72Int B 13,694 7,551 6,143 39.90 16,208 2.64
* The cost of chillers is not included in the investment cost.
1-23
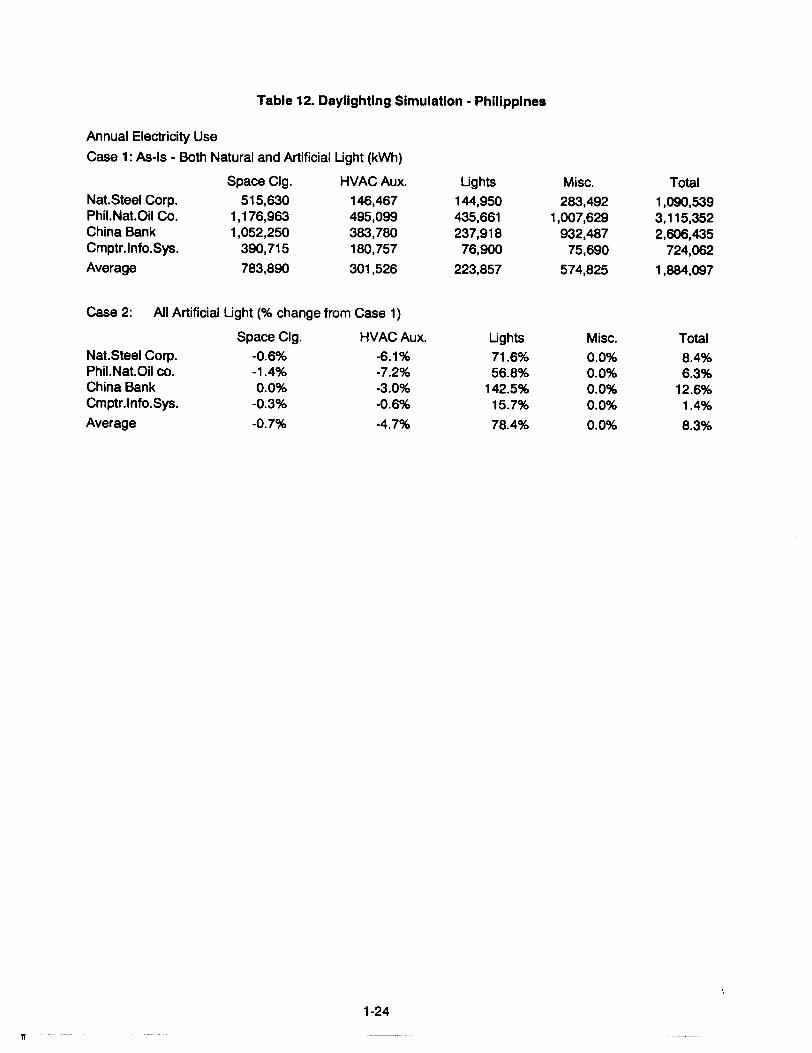
Table 12. Dayllghting Simulation - Philippines
Nat.Steel Corp.Phil.Nat.Oil Co.China BankCmptr.lnfo.Sys.
Average
Annual Electricity Use
Case 1: As-Is - Both Natural and Artificial Light (kWh)
Space Clg. HVAC Aux.
515,630 146,4671,176,963 495,0991,052,250 383,780
390,715 180,757
783,890 301,526
Lights
144,950435,661237,91876,900
223,857
Misc.
283,4921,007,629
932,48775,690
574,825
Total
1,090,5393,115,3522,606,435
724,062
1,884,097
Total
8.4%6.3%
12.6%1.4%
8.3%
Misc.
0.0%0.0%0.0%0.0%
0.0%
Lights71.6%56.8%
142.5%15.7%
78.4%
All Artificial Light (% change from Case 1)
Space Clg. HVAC Aux.-0.6% -6.1%-1.4% -7.2%0.0% -3.0%
-0.3% -0.6%
-0.7% -4.7%
Nat.Steel Corp.Phil.Nat.Oil co.China BankCmptr.lnfo.Sys.
Average
Case 2:
1-24
II
IT
APPENDIX A
ASEAN BUILDING ENERGY DATABASE
n
ASEAN BUILDING ENERGY DATABASE
Prepared by:
J.F. Busch
Lawrence Berkeley LaboratoryUniversity of California
Berkeley, California, USA
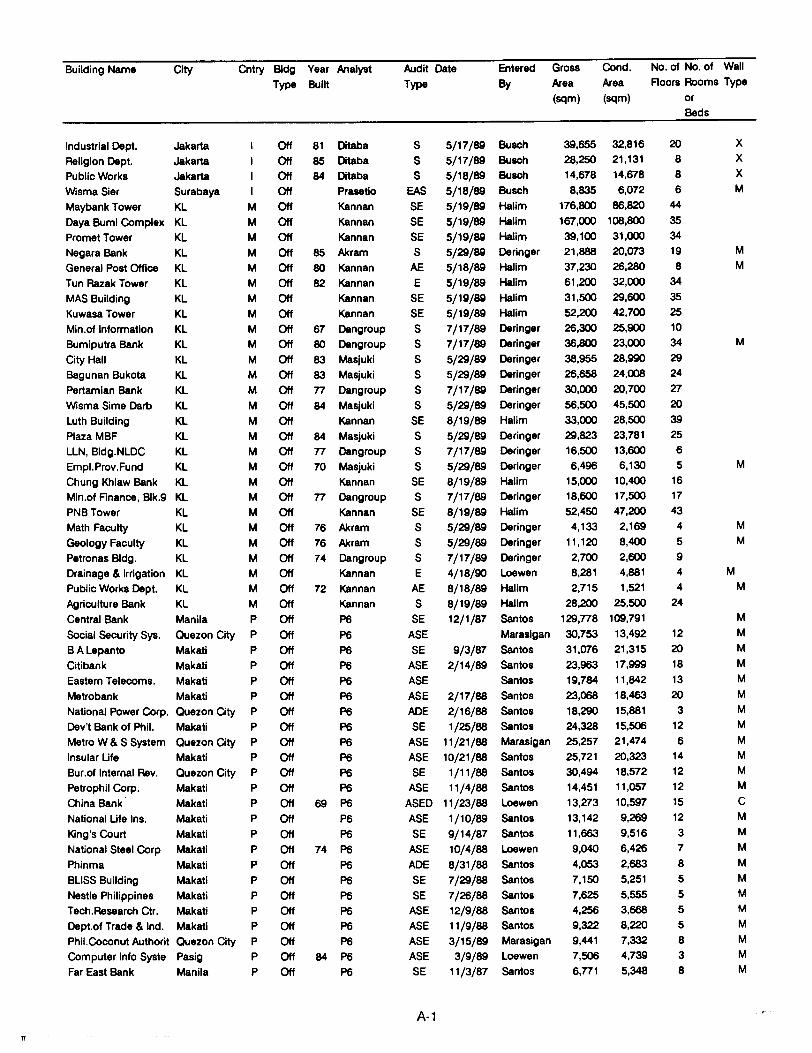
Building Name City Cntry Bldg Year Analyst Audit Date Entered Gross Cond. No. of No. of Wall
Type Built Type By Atea Atea Aoors Rooms Type
(sqm) (sqm) or
Beds
Industrial Dept. Jakarta I Off 81 Ditaba S 5/17/89 Busch 39,655 32,816 20 XReligion Dept. Jakarta I Off 85 Ditaba S 5/17/89 Busch 28,250 21,131 8 XPublic Works Jakarta I Off 84 Ditaba S 5/18/89 Busch 14,678 14,678 8 XWisma Sier Surabaya I Off Prasetio EAS 5/18/89 Busch 8,835 6,072 6 M
Maybank Tower KL M Off Kannan SE 5/19/89 Halim 176,800 86,820 44
Daya Bumi Complex KL M Off Kannan SE 5/19/89 Halim 167,000 108,800 35Promet Tower KL M Off Kannan SE 5/19/89 Halim 39,100 31,000 34Negara Bank KL M Off 85 Akram S 5/29/89 Deringer 21,888 20,073 19 M
General Post Office KL M Off 80 Kannan AE 5/18/89 Halim 37,230 26,280 8 M
Tun Razak Tower KL M Off 82 Kannan E 5/19/89 Halim 61,200 32,000 34MAS Building KL M Off Kannan SE 5/19/89 Halim 31,500 29,600 35
Kuwasa Tower KL M Off Kannan SE 5/19/89 Halim 52,200 42,700 25
Min.of Information KL M Off 67 Dangroup S 7/17/89 Deringer 26,300 25.900 10
Bumiputra Bank KL M Off 80 Dangroup S 7/17/89 Deringer 36,800 23,000 34 M
City Hall KL M Off 83 Masjuki S 5/29/89 Deringer 38,955 28,990 29Bagunan Bukota KL M Off 83 Masjuki S 5/29/89 Deringer 26,658 24,008 24
Pertamian Bank KL M Off n Dangroup S 7/17/89 Deringer 30,000 20,700 27
Wisma Sime Darb KL M Off 84 Masjuki S 5/29/89 Deringer 56,500 45,500 20Luth Building KL M Off Kannan SE 8/19/89 Halim 33.000 28,500 39Plaza MBF KL M Off 84 Masjuki S 5/29/89 Deringer 29.823 23,781 25LLN, Bldg.NLDC KL M Off n Dangroup S 7/17/89 Deringer 16,500 13,600 6Empl.Prov.Fund KL M Off 70 Masjuki S 5/29/89 Deringer 6,496 6,130 5 M
Chung Khiaw Bank KL M Off Kannan SE 8/19/89 Halim 15,000 10,400 16Min.of Finance, Blk.9 KL M Off n Dangroup S 7/17/89 Deringer 18,600 17,500 17
PNB Tower KL M Off Kannan SE 8/19/89 Halim 52,450 47,200 43Math Faculty KL M Off 76 Akram S 5/29/89 Deringer 4,133 2,169 4 M
Geology Faculty KL M Off 76 Akram S 5/29/89 Deringer 11,120 8,400 5 M
Petronas Bldg. KL M Off 74 Dangroup S 7/17/89 Deringer 2,700 2,600 9Drainage & Irrigation KL M Off Kannan E 4/18/90 Loewen 8,281 4.881 4 M
Public Works Dept. KL M Off 72 Kannan AE 8/18/89 Halim 2,715 1,521 4 M
Agriculture Bank KL M Off Kannan S 8/19/89 Halim 28,200 25,500 24
Central Bank Manila P Off P6 SE 12/1/87 Santos 129,n8 109,791 M
Social Security Sys. Quezon City P Off P6 ASE Marasigan 30,753 13,492 12 M
B A Lepanto Makati P Off P6 SE 9/3/87 Santos 31,076 21,315 20 M
Citibank Makati P Off P6 ASE 2/14/89 Santos 23,963 17,999 18 MEastern Telecoms. Makati P Off P6 ASE Santos 19,784 11,842 13 M
Metrobank Makati P Off P6 ASE 2/17/88 Santos 23,068 18,463 20 M
National Power Corp. Quezon City P Off P6 ACE 2/16/88 Santos 18,290 15,881 3 M
Dev't Bank of Phil. Makati P Off P6 SE 1/25/88 Santos 24.328 15,506 12 M
Metro W &S System Quezon City P Off P6 ASE 11/21/88 Marasigan 25,257 21,474 6 MInsular Ufe Makati P Off P6 ASE 10/21/88 Santos 25,721 20,323 14 MBur.of Internal Rev. Quezon City P Off P6 SE 1/11/88 Santos 30,494 18,572 12 M
Petrophil Corp. Makati P Off P6 ASE 11/4/88 Santos 14,451 11,057 12 M
China Bank Makati P Off 69 P6 ASED 11/23/88 Loewen 13,273 10.597 15 C
National Ufe Ins. Makati P Off P6 ASE 1/10/89 Santos 13,142 9.269 12 MKing's Court Makati P Off P6 SE 9/14/87 Santos 11,663 9,516 3 M
National Steel Corp Makati P Off 74 P6 ASE 10/4/88 Loewen 9,040 6,426 7 M
Phinma Makati P Off P6 ACE 8/31/88 Santos 4.053 2,683 8 M
BLISS Building Makati P Off P6 SE 7/29/88 Santos 7,150 5,251 5 M
Nestle Philippines Makati P Off P6 SE 7/26/88 Santos 7,625 5,555 5 M
Tech.Research Ctr. Makati P Off P6 ASE 12/9/88 Santos 4,256 3,668 5 M
Dept.of Trade & Ind. Makati P Off P6 ASE 11/9/88 Santos 9,322 8,220 5 M
Phil.Coconut Authorit Quezon City P Off P6 ASE 3/15/89 Marasigan 9,441 7,332 8 M
Computer Info Syste Pasig P Off 84 P6 ASE 3/9/89 Loewen 7,506 4,739 3 M
Far East Bank Manila P Off P6 SE 11/3/87 Santos 6,n1 5,348 8 M
A-1n
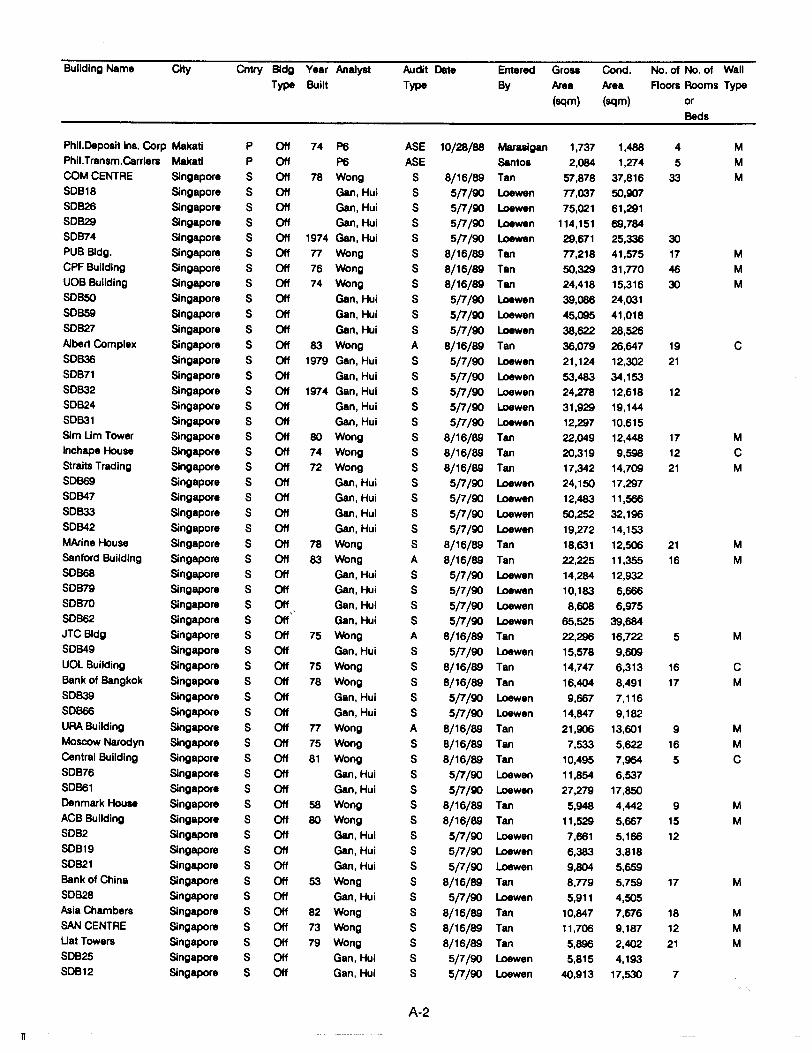
Building Name City Cntry Bldg Year Analyst Audit Date Entered Gross Cond. No. of No. of Wall
Type Built Type By Atea Atea Aoors Rooms Type
(sqm) (sqm) or
Beds
Phil.Depoait Ina. Corp Makati P Off 74 P6 ASE 10/28/88 Maruigan 1,737 1,488 4 M
Phil.Tranam.Carrlers Makatl P Off P6 ASE Santoa 2,084 1,274 5 M
COM CENTRE Singapore S Off 78 Wong S 8/16/89 Tan 57,878 37,816 33 M
SOB18 Singapore S Off Gan, Hui S 5/7/SO Loewen n,037 5O,S07
SOB26 Singapore S Off Gan, Hui S 5/7/SO Loewen 75,021 61,291
SOB29 Singapore S Off Gan, Hui S 5/7/SO Loewen 114,151 69,784SOB74 Singapore S Off 1974 Gan, Hui S 5/7/SO Loewen 29,671 25,336 30
PUB Bldg. Singapore S Off n Wong S 8/16/89 Tan n,218 41,575 17 M
CPF Building Singapore S Off 76 Wong S 8/16/89 Tan 50,329 31,no 46 M
UOB Building Singapore S Off 74 Wong S 8/16/89 Tan 24,418 15.316 30 M
SOB50 Singapore S Off Gan, Hui S 5/7/SO Loewen 39,086 24,031
SOB59 Singapore S Off Gan, Hui S 5/7/SO Loewen 45,095 41,018
SOB27 Singapore S Off Gan, Hui S 5/7/SO Loewen 38,622 28,526
Albert Complex Singapore S Off 83 Wong A 8/16/89 Tan 36,079 26,647 19 C
SOB36 Singapore S Off 1979 Gan, Hui S 5/7/SO Loewen 21,124 12,302 21
SOB71 Singapore S Off Gan, Hui S 5/7/SO Loewen 53,483 34,153
SOB32 Singapore S Off 1974 Gan, Hui S 5/7/SO Loewen 24,278 12,618 12
SOB24 Singapore S Off Gan, Hui S 5/7/SO Loewen 31.929 19,144
SOB31 Singapore S Off Gan, Hui S 5/7/SO Loewen 12.297 10,615Sim Um Tower Singapore S Off 80 Wong S 8/16/89 Tan 22,049 12,448 17 M
Inchape House Singapore S Off 74 Wong S 8/16/89 Tan 20.319 9,598 12 C
Straits Trading Singapore S Off 72 Wong S 8/16/89 Tan 17.342 14,709 21 M
SOB69 Singapore S Off Gan, Hui S 5/7/SO Loewen 24,150 17,297
SOB47 Singapore S Off Gan, Hui S 5/7/SO Loewen 12,483 11,566
SOB33 Singapore S Off Gan, Hui S 5/7/SO Loewen 50,252 32,196
SOB42 Singapore S Off Gan, Hui S 5/7/SO Loewen 19,272 14,153
MArine House Singapore S Off 78 Wong S 8/16/89 Tan 18,631 12,506 21 M
Sanford Building Singapore S Off 83 Wong A 8/16/89 Tan 22,225 11,355 16 M
SOB68 Singapore S Off Gan, Hui S 5/7/SO Loewen 14,284 12,932SOB79 Singapore S Off Gan, Hui S 5/7/SO Loewen 10,183 6,666SOB70 Singapore S Off Gan, Hui S 5/7/SO Loewen 8,608 6,975
.'SOB62 Singapore S Off Gan, Hui S 5/7/SO Loewen 65,525 39,684JTC Bldg Singapore S Off 75 Wong A 8/16/89 Tan 22,296 16,722 5 M
S0849 Singapore S Off Gan, Hui S 5/7/SO Loewen 15,578 9.609UOL Building Singapore S Off 75 Wong S 8/16/89 Tan 14,747 6.313 16 C
Bank of Bangkok Singapore S Off 78 Wong S 8/16/89 Tan 16,404 8,491 17 M
SOB39 Singapore S Off Gan, Hui S 5/7/SO Loewen 9,667 7,116SOB66 Singapore S Off Gan, Hui S 5/7/SO Loewen 14,847 9,182
URABuilding Singapore S Off n Wong A 8/16/89 Tan 21,906 13,601 9 M
Moscow Narodyn Singapore S Off 75 Wong S 8/16/89 Tan 7,533 5,622 16 M
Central Building Singapore S Off 81 Wong S 8/16/89 Tan 10,495 7.964 5 C
SOB76 Singapore S Off Gan, Hui S 5/7/SO Loewen 11,854 6,537SOB61 Singapore S Off Gan, Hui S 5/7/SO Loewen 27,279 17,850Denmark House Singapore S Off 58 Wong S 8/16/89 Tan 5,948 4,442 9 MACB Building Singapore S Off 80 Wong S 8/16/89 Tan 11.529 5,667 15 M
SOB2 Singapore S Off Gan, Hui S 5/7/SO Loewen 7,661 5,166 12SOB19 Singapore S Off Gan, Hui S 5/7/SO Loewen 6,383 3,818SOB21 Singapore S Off Gan, Hui S 5/7/90 Loewen 9,804 5,659Bank of China Singapore S Off 53 Wong S 8/16/89 Tan 8,n9 5,759 17 MSOB28 Singapore S Off Gan, Hui S 5/7/SO Loewen 5,911 4,505Asia Chambers Singapore S Off 82 Wong S 8/16/89 Tan 10,847 7,676 18 M
SAN CENTRE Singapore S Off 73 Wong S 8/16/89 Tan 11,706 9,187 12 M
UatTowers Singapore S Off 79 Wong S 8/16/89 Tan 5,896 2,402 21 M
SOB25 Singapore S Off Gan. Hui S 5/7/SO Loewen 5.815 4.193SOB12 Singapore S Off Gan, Hui S 5/7/SO Loewen 40,913 17,530 7
A-2
n
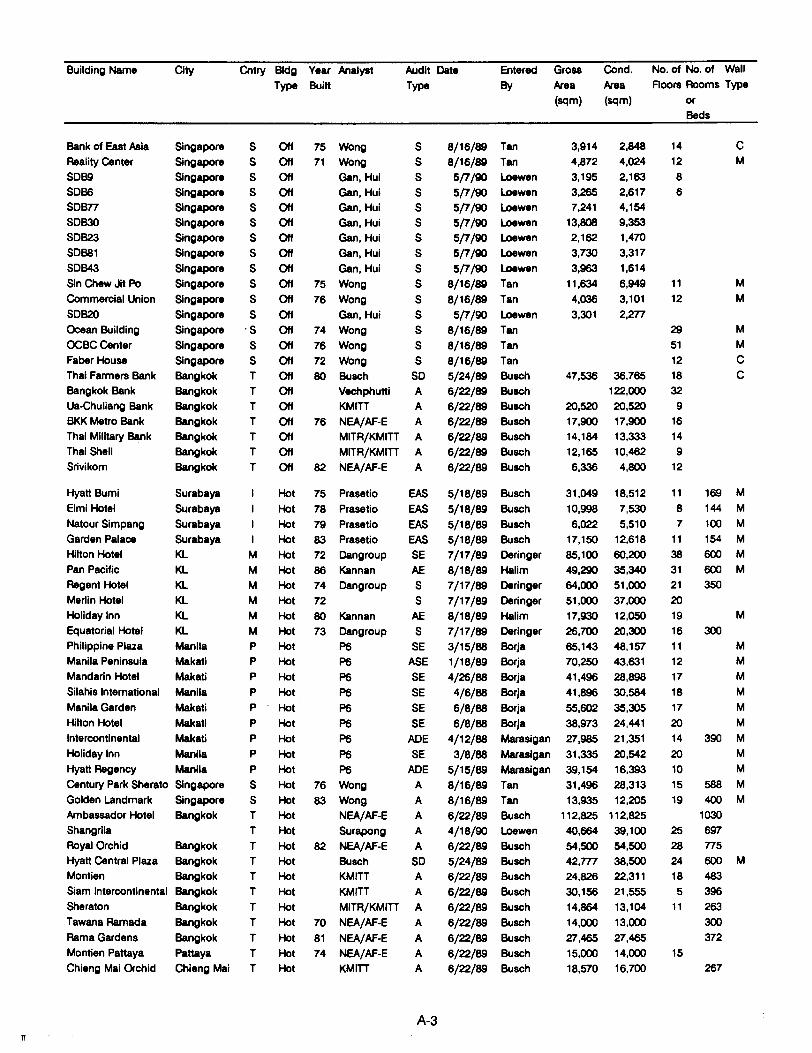
Building Name City Cntry Bldg Year Analyst Audit Date Entered Gross Cond. No. of No. of Wall
Type Built Type By Area Area Aoora Rooms Type
(sqm) (sqm) or
Beds
Bank of East Asia Singapore S Off 75 Wong S 8/16/89 Tan 3,914 2,848 14 C
Reality Center Singapore S Off 71 Wong S 8/16/89 Tan 4,872 4,024 12 M
SOB9 Singapore S Off Gan, Hui S 5/7/90 Loewen 3,195 2,163 8
SOB6 Singapore S Off Gan, Hui S 5/7/9IJ Loewen 3,265 2,617 6
SOB77 Singapore S Off Gan, Hui S 5/7/90 Loewen 7,241 4,154
SOB30 Singapore S Off Gan, Hui S 5/7/90 Loewen 13,808 9,353
SOB23 Singapore S Off Gan, Hui S 5/7/9IJ Loewen 2,162 1,470
SOBS1 Singapore S Off Gan, Hui S 5/7/90 Loewen 3,730 3,317
SOB43 Singapore S Off Gan, Hui S 5/7/90 Loewen 3,963 1,614
Sin Chew Jit Po Singapore S Off 75 Wong S 8/16/89 Tan 11,634 6,949 11 M
Commercial Union Singapore S Off 76 Wong S 8/16/89 Tan 4,036 3,101 12 M
SOB20 Singapore S Off Gan, Hui S 5/7/90 Loewen 3,301 2,277
Ocean Building Singapore 'S Off 74 Wong S 8/16/89 Tan 29 M
OCBCCenter Singapore S Off 76 Wong S 8/16/89 Tan 51 M
Faber House Singapore S Off 72 Wong S 8/16/89 Tan 12 C
Thai Farmers Bank Bangkok T Off 80 Busch SO 5/24/89 Busch 47,536 36,765 18 C
Bangkok Bank Bangkok T Off Vechphutti A 6/22/89 Busch 122,000 32Ua-Chuliang Bank Bangkok T Off KMITI A 6/22/89 Busch 20,520 20,520 9
BKK Metro Bank Bangkok T Off 76 NEAjAF-E A 6/22/89 Busch 17,900 17,900 16
Thai Military Bank Bangkok T Off MITR/KMITI A 6/22/89 Busch 14,184 13,333 14
Thai Shell Bangkok T Off MITR/KMITI A 6/22/89 Busch 12,165 10,462 9
Srivikorn Bangkok T Off 82 NEA/AF-E A 6/22/89 Busch 6,336 4,800 12
Hyatt Bumi Surabaya I Hot 75 Prasetio EAS 5/18/89 Busch 31,049 18,512 11 169 M
Elmi Hotel Surabaya I Hot 78 Prasetio EAS 5/18/89 Busch 10,998 7,530 8 144 M
Natour Simpang Surabaya I Hot 79 Prasetio EAS 5/18/89 Busch 6,022 5,510 7 100 M
Garden Palace Surabaya I Hot 83 Prasetio EAS 5/18/89 Busch 17,150 12,618 11 154 M
Hilton Hotel KL M Hot 72 Dangroup SE 7/17/89 Deringer 85,100 60,200 38 600 M
Pan Pacific KL M Hot 86 Kannan AE 8/18/89 Halim 49,290 35,340 31 600 M
Regent Hotel KL M Hot 74 Oangroup S 7/17/89 Deringer 64,000 51,000 21 350
Merlin Hotel KL M Hot 72 S 7/17/89 Deringer 51,000 37,000 20
Holiday Inn KL M Hot 80 Kannan AE 8/18/89 Halim 17,930 12,050 19 M
Equatorial Hotel KL M Hot 73 Oangroup S 7/17/89 Deringer 26,700 20,300 16 300
Philippine Plaza Manila P Hot P6 SE 3/15/88 Borja 65,143 48,157 11 M
Manila Peninsula Makati P Hot P6 ASE 1/18/89 Borja 70,250 43,631 12 M
Mandarin Hotel Makati P Hot P6 SE 4/26/88 Borja 41,496 28,898 17 M
Silahis International Manila P Hot P6 SE 4/6/88 Borja 41,896 30,584 18 M
Manila Garden Makati P Hot P6 SE 6/8/88 Borja 55,602 35,305 17 M
Hilton Hotel Makati P Hot P6 SE 6/8/88 Borja 38,973 24,441 20 M
Intercontinental Makati P Hot P6 ADE 4/12/88 Marasigan 27,985 21,351 14 390 M
Holiday Inn Manila P Ho1 P6 SE 3/8/88 Marasigan 31,335 20,542 20 M
Hyatt Regency Manila P Hot P6 ADE 5/15/89 Marasigan 39,154 16,393 10 M
Century Park Sherato Singapore S Hot 76 Wong A 8/16/89 Tan 31,496 28,313 15 588 M
Golden Landmark Singapore S Hot 83 Wong A 8/16/89 Tan 13,935 12,205 19 400 M
Ambassador Hotel Bangkok T Hot NEAjAF-E A 6/22/89 Busch 112,825 112,825 1030
Shangrila T Hot Surapong A 4/18/9IJ Loewen 40,664 39,100 25 697
Royal Orchid Bangkok T Hot 82 NEA/AF-E A 6/22/89 Busch 54,500 54,500 28 775
Hyatt Central Plaza Bangkok T Hot Busch SO 5/24/89 Busch 42,777 38,500 24 600 M
Montien Bangkok T Hot KMITI A 6/22/89 Busch 24,826 22,311 18 483Siam Intercontinental Bangkok T Hot KMITI A 6/22/89 Busch 30,156 21,555 5 396
Sheraton Bangkok T Hot MITR/KMITI A 6/22/89 Busch 14,864 13,104 11 263
Tawana Ramada Bangkok T Hot 70 NEA/AF-E A 6/22/89 Busch 14,000 13,000 300
Rama Gardens Bangkok T Hot 81 NEA/AF-E A 6/22/89 Busch 27,465 27,465 372
Montien Pattaya Pattaya T Hot 74 NEA/AF-E A 6/22/89 Busch 15,000 14,000 15
Chieng Mai Orchid Chieng Mai T Hot KMITI A 6/22/89 Busch 18,570 16,700 267
A-311
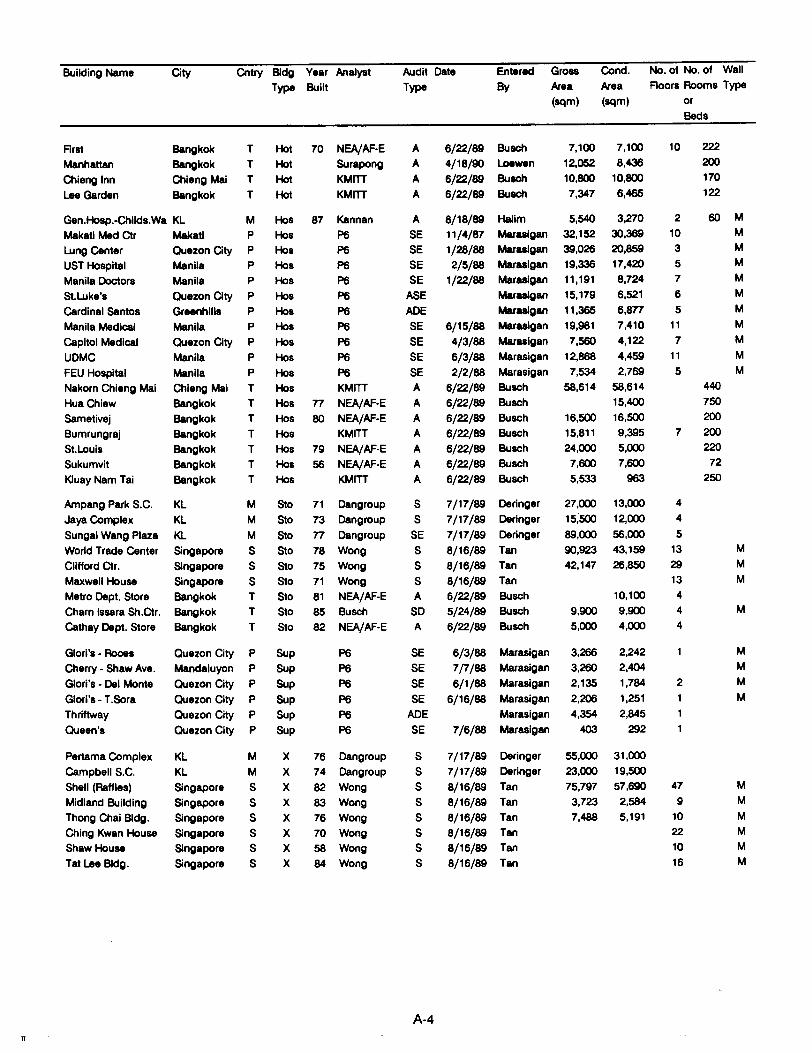
n
Building Name City Cntry Bldg Year Analyst Audit Date Entered Gross Cond. No. of No. of Wall
Type Built Type By Alea Alea Aoors Rooms Type
(sqm) (sqm) or
Beds
First Bangkok T Hot 70 NEA/AF·E A 6/22/89 Busch 7,100 7,100 10 222
Manhattan Bangkok T Hot Surapong A 4/18/90 Loewen 12,052 8,436 200Chieng Inn Chieng Mal T Hot KMITT A 6/22/89 Busch 10,800 10,800 170
Lee Garden Bangkok T Hot KMITT A 6/22/89 Busch 7,347 6,465 122
Gen.Hosp.·Childs.Wa KL M Hos 87 Kannan A 8/18/89 Hallm 5,540 3,270 2 60 M
Makati Meet Ctr Makat! P Hos P6 SE 11/4/87 Maraaigan 32,152 30,369 10 M
Lung Center auezon City P Hos P6 SE 1/28/88 Maraaigan 39,026 20,859 3 M
UST Hospital Manila P Hos P6 SE 2/5/88 Maraaigan 19,336 17,420 5 M
Manila Doctors Manila P Hos P6 SE 1/22/88 Maraalgan 11,191 8,724 7 M
St.Luke's Quezon City P Hos P6 ASE Maraalgan 15,179 6,521 6 M
Cardinal Santos Greenhills P Hos P6 ACE Maraalgan 11,365 6,8n 5 M
Manila Medical Manila P Hos P6 SE 6/15/88 Maraalgan 19,981 7,410 11 M
Capitol Medical Quezon City P Hos P6 SE 4/3/88 Maraaigan 7,560 4,122 7 M
UOMC Manila P Hos P6 SE 6/3/88 Marasigan 12,868 4,459 11 M
FEU Hospital Manila P Hos P6 SE 2/2/88 Marasigan 7,534 2,769 5 M
Nakorn Chieng Mai Chieng Mai T Hos KMITT A 6/22/89 Busch 58,614 58,614 440HuaChiew Bangkok T Hos n NEA/AF·E A 6/22/89 Busch 15,400 750Sametivej Bangkok T Hos 80 NEA/AF·E A 6/22/89 Busch 16,500 16,500 200Bumrungraj Bangkok T Hos KMITT A 6/22/89 Busch 15,811 9,395 7 200St.Louis Bangkok T Hos 79 NEA/AF-E A 6/22/89 Busch 24,000 5,000 220Sukumvit Bangkok T Hos 56 NEA/AF-E A 6/22/89 Busch 7,600 7,600 72K1uay Nam Tai Bangkok T Hos KMITT A 6/22/89 Busch 5,533 963 250
Ampang Park S.C. KL M Sto 71 Oangroup S 7/17/89 Deringer 27,000 13,000 4Jaya Complex KL M Sto 73 Dangroup S 7/17/89 Deringer 15,500 12,000 4Sungai Wang Plaza KL M Sto n Dangroup SE 7/17/89 Deringer 89,000 56,000 5World Trade Center Singapore S Sto 78 Wong S 8/16/89 Tan 90,923 43,159 13 M
Clifford Ctr. Singapore S Sto 75 Wong S 8/16/89 Tan 42,147 26,850 29 M
Maxwell House Singapore S Sto 71 Wong S 8/16/89 Tan 13 M
Metro Dept. Store Bangkok T Sto 81 NEA/AF-E A 6/22/89 Busch 10,100 4Charn Issara Sh.Ctr. Bangkok T Sto 85 Busch SO 5/24/89 Busch 9,900 9,900 4 M
Cathay Dept. Store Bangkok T Sto 82 NEA/AF-E A 6/22/89 Busch 5,000 4,000 4
Glori's· Rocea Quezon City P Sup P6 SE 6/3/88 Maraslgan 3,266 2,242 M
Cherry - Shaw Ave. Mandaluyon P Sup P6 SE 7/7/88 Marasigan 3,260 2,404 M
Glori's· Del Monte Quezon City P Sup P6 SE 6/1/88 Marasigan 2,135 1,784 2 M
Glori's· T.Sora Quezon City P Sup P6 SE 6/16/88 Marasigan 2,206 1,251 1 MThriftway Quezon City P Sup P6 ACE Marasigan 4,354 2,845 1Queen's Quezon City P Sup P6 SE 7/6/88 Marasigan 403 292 1
Pertama Complex KL M X 76 Dangroup S 7/17/89 Deringer 55,000 31,000Campbell S.C. KL M X 74 Oangroup S 7/17/89 Deringer 23,000 19,500Shell (Raffles) Singapore S X 82 Wong S 8/16/89 Tan 75,797 57,690 47 M
Midland Building Singapore S X 83 Wong S 8/16/89 Tan 3,723 2,584 9 M
Thong Chai Bldg. Singapore S X 76 Wong S 8/16/89 Tan 7,488 5,191 10 M
Ching Kwan House Singapore S X 70 Wong S 8/16/89 Tan 22 M
Shaw House Singapore S X 58 Wong S 8/16/89 Tan 10 M
Tat Lee Bldg. Singapore S X 84 Wong S 8/16/89 Tan 16 M
A·4
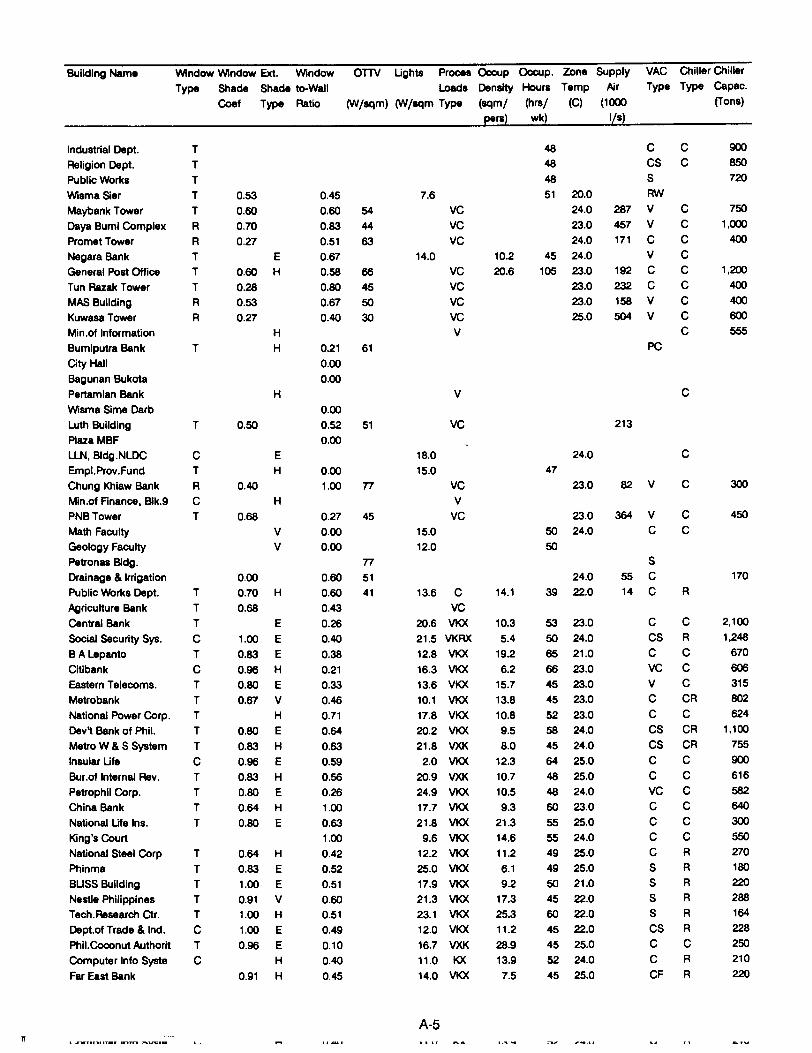
Building Name INindow INindow Ext. INindow OTTV Ughts Proces Occup Occup. ZOne Supply VAC Chiller Chiller
Type Shade Shade to-Wall Loads Density Hours Temp PJr Type Type Capac.
Coef Type Ratio (W/sqm) (W/sqm Type (sqml (hrsl (e) (1000 (Tons)
pers) wk) lis)
Industrial Dept. T 48 C C 900Religion Dept. T 48 CS C 850Public Works T 48 S 720
INisma Sier T 0.53 0.45 7.6 51 20.0 RWMaybank Tower T 0.60 0.60 54 VC 24.0 287 V C 750
Daya Bumi Complex R 0.70 0.83 44 VC 23.0 457 V C 1,000
Promet Tower R 0.27 0.51 63 VC 24.0 171 C C 400Negara Bank T E 0.67 14.0 10.2 45 24.0 V C
General Post Office T 0.60 H 0.58 66 VC 20.6 105 23.0 192 C C 1,200
Tun Razak Tower T 0.28 0.80 45 VC 23.0 232 C C 400MAS Building R 0.53 0.67 50 VC 23.0 158 V C 400Kuwasa Tower R 0.27 0.40 30 VC 25.0 504 V C 600Min.of Information H V C 555Bumiputra Bank T H 0.21 61 PC
City Hall 0.00Bagunan Bukota 0.00Pertamian Bank H V CINisma Sime Darb 0.00Luth Building T 0.50 0.52 51 VC 213
Plaza MBF 0.00LLN, B1dg.NLDC C E 18.0 24.0 CEmpl.Prov.Fund T H 0.00 15.0 47Chung Khiaw Bank R 0.40 1.00 T7 VC 23.0 82 V C 300Min.of Finance, B1k.9 C H VPNB Tower T 0.68 0.27 45 VC 23.0 364 V C 450
Math Faculty V 0.00 15.0 50 24.0 C CGeology Faculty V 0.00 12.0 50Petronas Bldg. T7 SDrainage & Irrigation 0.00 0.60 51 24.0 55 C 170Public Works Dept. T 0.70 H 0.60 41 13.6 C 14.1 39 22.0 14 C RAgricuhure Bank T 0.68 0.43 VCCentral Bank T E 0.26 20.6 VKX 10.3 53 23.0 C C 2,100
Social Security Sys. C 1.00 E 0.40 21.5 VKRX 5.4 50 24.0 CS R 1,248
BA Lepanto T 0.83 E 0.38 12.8 VKX 19.2 65 21.0 C C 670
Citibank C 0.96 H 0.21 16.3 VKX 6.2 66 23.0 VC C 606Eastern Telecoms. T 0.80 E 0.33 13.6 VKX 15.7 45 23.0 V C 315Metrobank T 0.67 V 0.46 10.1 VKX 13.8 45 23.0 C CR 802
National Power Corp. T H 0.71 17.8 VKX 10.8 52 23.0 C C 624Dev't Bank of Phil. T 0.80 E 0.64 20.2 VKX 9.5 58 24.0 CS CR 1,100
Metro W &S System T 0.83 H 0.63 21.8 VXK 8.0 45 24.0 CS CR 755
Insular Ufe C 0.96 E 0.59 2.0 VKX 12.3 64 25.0 C C 900Bur.of Internal Rev. T 0.83 H 0.56 20.9 VXK 10.7 48 25.0 C C 616
Petrophil Corp. T 0.80 E 0.26 24.9 VKX 10.5 48 24.0 VC C 582China Bank T 0.64 H 1.00 17.7 VKX 9.3 60 23.0 C C 640National Ufe Ins. T 0.80 E 0.63 21.8 VKX 21.3 55 25.0 C C 300King's Court 1.00 9.6 VKX 14.6 55 24.0 C C 550National Steel Corp T 0.64 H 0.42 12.2 VKX 11.2 49 25.0 C R 270Phinma T 0.83 E 0.52 25.0 VKX 6.1 49 25.0 S R 180
BLISS Building T 1.00 E 0.51 17.9 VKX 9.2 50 21.0 S R 220Nestle Philippines T 0.91 V 0.60 21.3 VKX 17.3 45 22.0 S R 288Tech.Research Ctr. T 1.00 H 0.51 23.1 VKX 25.3 60 22.0 S R 164
Dept.of Trade & Ind. C 1.00 E 0.49 12.0 VKX 11.2 45 22.0 CS R 228
Phil.Coconut Authorit T 0.96 E 0.10 16.7 VXK 28.9 45 25.0 C C 250
Computer Info Syste C H 0.40 11.0 KX 13.9 52 24.0 C R 210
Far East Bank 0.91 H 0.45 14.0 VKX 7.5 45 25.0 CF R 220
A-5I! • ..-,........... 1._.- ......ra ~......... _
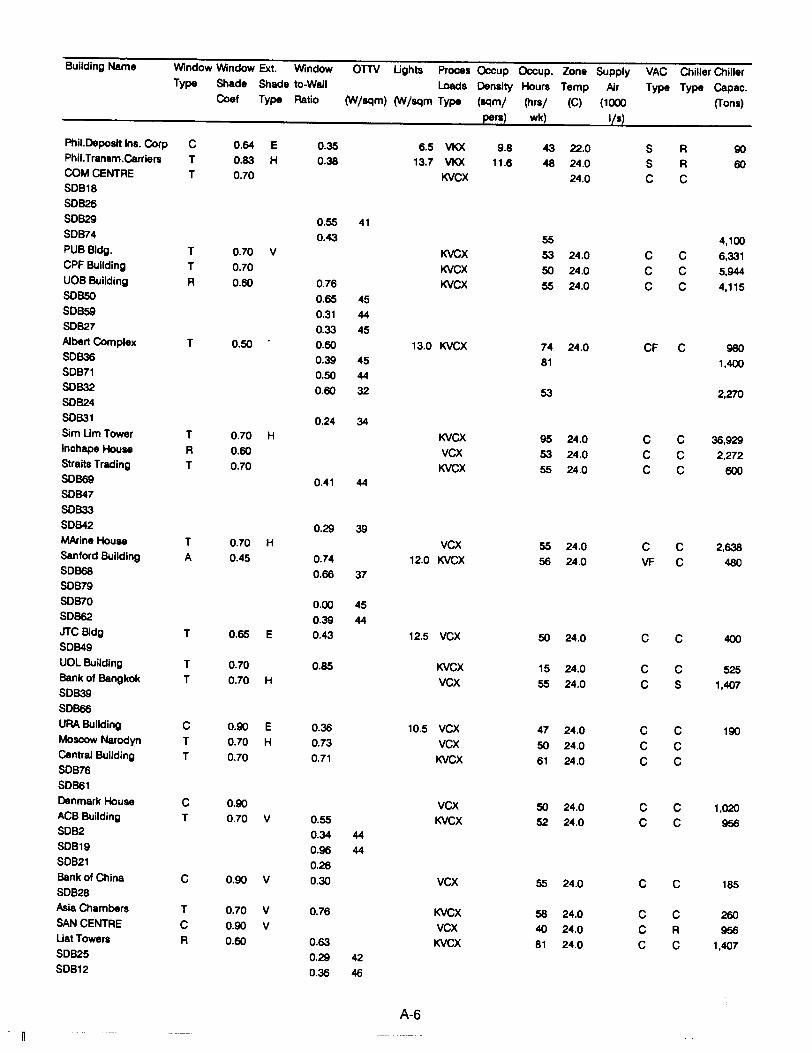
Building Name Window Window Ext. Window OTTV Ughts Proces Occup Occup. Zone Supply VAC Chiller Chiller
Type Shade Shade to-Wall Loads Density Hours Temp P-Jr Type Type Capac.
Caef Type Ratio f'N/sqm) f'N/sqm Type (sqm/ (hrs/ (C) (1000 (Tons)
pers) wk) I/s)
Phil.Deposit Ins. Corp C 0.64 E 0.35 6.5 VKX 9.8 43 22.0 S R 90
Phil.Transm.Carrlers T 0.83 H 0.38 13.7 VKX 11.6 48 24.0 S R 60
COM CENTRE T 0.70 KVCX 24.0 C CSDB18
SDB26
SDB29 0.55 41
SDB74 0.43 55 4,100
PUB Bldg. T 0.70 V KVCX 53 24.0 C C 6,331
CPF Building T 0.70 KVCX 50 24.0 C C 5,944
UOBBuilding R 0.60 0.76 KVCX 55 24.0 C C 4,115
SDB5Q 0.65 45
SOB59 0.31 44
SDB27 0.33 45Albert Complex T 0.50 0.60 13.0 KVCX 74 24.0 CF C 980
SOB36 0.39 45 81 1,400
SOB71 0.50 44
SDB32 0.60 32 53 2,270
SOB24
SOB31 0.24 34Sim UmTower T 0.70 H KVCX 95 24.0 C C 36,929Inchape House R 0.60 VCX 53 24.0 C C 2,272
Straits Trading T 0.70 KVCX 55 24.0 C C 600SDB69 0.41 44
SOB47
SOB33
SOB42 0.29 39
MArine House T 0.70 H VCX 55 24.0 C C 2,638Sanford Building A 0.45 0.74 12.0 KVCX 56 24.0 VF C 480SOB68 0.66 37SOB79
SOB70 0.00 45SOB62 0.39 44
JTC Bldg T 0.65 E 0.43 12.5 VCX 50 24.0 C C 400SOB49
UOL Building T 0.70 0.85 KVCX 15 24.0 C C 525Bank of Bangkok T 0.70 H vex 55 24.0 C S 1,407SOB39
SOB66
URABuilding C 0.90 E 0.36 10.5 VCX 47 24.0 C C 190Moscow Narodyn T 0.70 H 0.73 VCX 50 24.0 C CCentral Building T 0.70 0.71 KVCX 61 24.0 C CSOB76
SOB61
Denmark House C 0.90 VCX 50 24.0 C C 1,020ACB Building T 0.70 V 0.55 KVCX 52 24.0 C C 956SDB2 0.34 44
SOB19 0.96 44
SOB21 0.26Bank of China C 0.90 V 0.30 VCX 55 24.0 C C 185SOB28
Asia Chambers T 0.70 V 0.76 KVCX 58 24.0 C C 260SAN CENTRE C 0.90 V VCX 40 24.0 C R 956Uat Towers R 0.60 0.63 KVCX 81 24.0 C C 1,407
SDB25 0.29 42SOB12 0.36 46
A-6
n
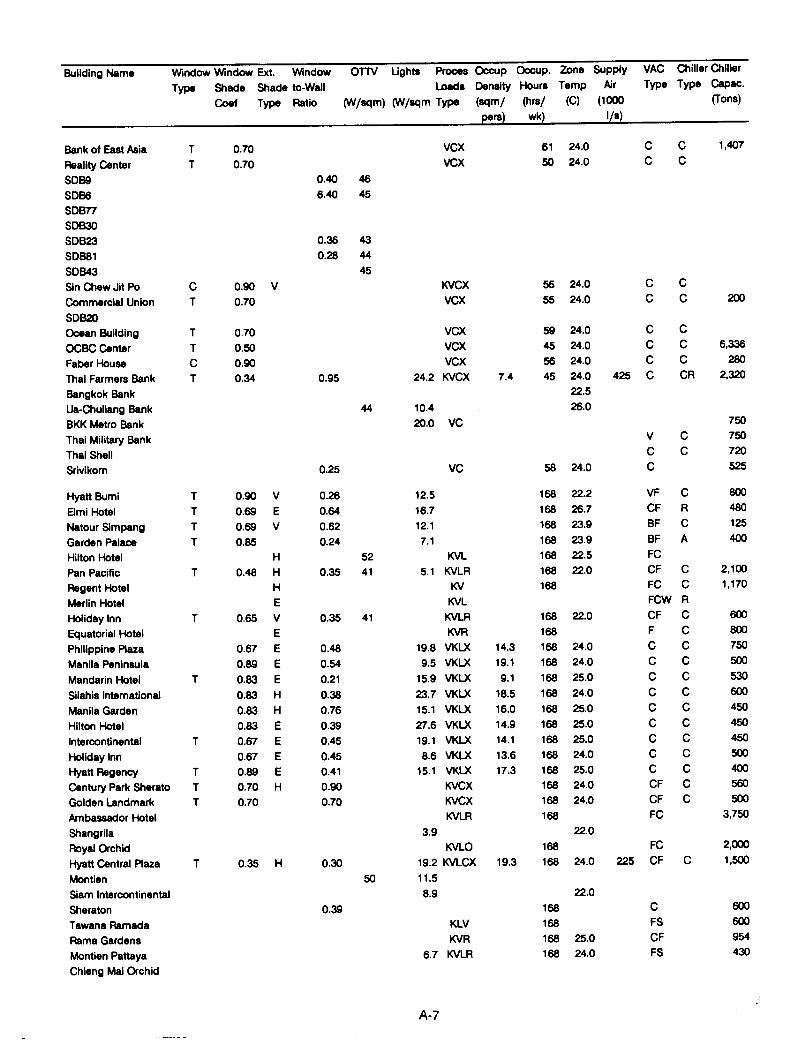
Building Name Window Window Ext. Window OTTV Ughta Proces Occup Occup. ZOne Supply VAC Chiller Chiller
Type Shade Shade to-Wall Loads Density Hours Temp fiJr Type Type Capac.
Coef Type Ratio (W/sqm) ftN/sqm Type (sqml (hrsl (C) (1000 (Tons)
pers) wk) lIs)
Bank of East Asia T 0.70 vcx 61 24.0 C C 1,407
Reality Center T 0.70 vex 50 24.0 C C
SDB9 0.40 46SDB6 6.40 45SDB77
SDB30
SDB23 0.36 43SDB81 0.28 44
SDB43 45
Sin Chew Jit Po C 0.90 V KVCX 55 24.0 C C
Commercial Union T 0.70 vex 55 24.0 C C 200SDB20
Ocean Building T 0.70 VCX 59 24.0 C C
OCBCCenter T 0.50 VCX 45 24.0 C C 6,336
Faber House C 0.90 VCX 56 24.0 C C 280Thai Farmers Bank T 0.34 0.95 24.2 KVCX 7.4 45 24.0 425 C CR 2,320
Bangkok Bank 22.5
Ua-Chuliang Bank 44 10.4 26.0
BKK Metro Bank 20.0 VC 750
Thai Military Bank V C 750
Thai Shell C C 720
Srivikorn 0.25 VC 58 24.0 C 525
Hyatt Bumi T 0.90 V 0.26 12.5 168 22.2 VF C 800Elmi Hotel T 0.69 E 0.64 16.7 168 26.7 CF R 480Natour Simpang T 0.69 V 0.62 12.1 168 23.9 BF C 125
Garden Palace T 0.85 0.24 7.1 168 23.9 BF A 400
Hilton Hotel H 52 KVL 168 22.5 FCPan Pacific T 0.48 H 0.35 41 5.1 KVLR 168 22.0 CF C 2,100
Regent Hotel H KV 168 FC C 1,170
Merlin Hotel E KVL FCW R
Holiday Inn T 0.65 V 0.35 41 KVLR 168 22.0 CF C 600Equatorial Hotel E KVR 168 F C 800Philippine Plaza 0.67 E 0.48 19.8 VKLX 14.3 168 24.0 C C 750
Manila Peninsula 0.89 E 0.54 9.5 VKLX 19.1 168 24.0 C C 500
Mandarin Hotel T 0.83 E 0.21 15.9 VKLX 9.1 168 25.0 C C 530Silahis International 0.83 H 0.38 23.7 VKLX 18.5 168 24.0 C C 600
Manila Garden 0.83 H 0.76 15.1 VKLX 16.0 168 25.0 C C 450
Hilton Hotel 0.83 E 0.39 27.6 VKLX 14.9 168 25.0 C C 450Intercontinental T 0.67 E 0.45 19.1 VKLX 14.1 168 25.0 C C 450Holiday Inn 0.67 E 0.45 8.6 VKLX 13.6 168 24.0 C C 500Hyatt Regency T 0.89 E 0.41 15.1 VKLX 17.3 168 25.0 C C 400Century Park Sherato T 0.70 H 0.90 KVCX 168 24.0 CF C 560Golden Landmark T 0.70 0.70 KVCX 168 24.0 CF C 500Ambassedor Hotel KVLR 168 FC 3,750
Shangrila 3.9 22.0Royal Orchid KVLO 168 FC 2,000
Hyatt Central Plaza T 0.35 H 0.30 19.2 KVLCX 19.3 168 24.0 225 CF C 1,500
Montien 50 11.5Siam Intercontinental 8.9 22.0Sheraton 0.39 168 C 600Tawana Ramada KLV 168 FS 600Rama Gardens KVR 168 25.0 CF 954Montien Pattaya 6.7 KVLR 168 24.0 FS 430Chieng Mai Orchid
A-7

"
Building Name Window Window Ext. Window CnY Ughts Proces Occup Occup. ZOne Supply VAC Chiller Chiller
Type Shade Shade to-Wall Loads Density Hours Temp PJr Type Type Capac.
Coef Type Ratio (w/sqm) (W/sqm Type (sqml (hrsl (C) (1000 (Tons)
pers) wk) lis)
First VKL 168 22.5 R 350
Manhattan
Chieng Inn
Lee Garden
Gen.Hosp.-Childs.Wa T 1.00 H 0.80 42 X 23.0 31 C R 140Makati Med Ctr E 0.52 12.1 VKX 10.7 168 22.0 ON C 450
Lung Center H 0.64 19.5 VKX 8.8 168 24.0 ON C 600
UST Hospital H 0.34 17.4 VKX 16.4 168 24.0 CSW R 292Manila Doctors E 0.23 19.1 VKX 11.7 168 24.0 SW 222
St.Luke's E 0.37 8.6 VX 6.0 168 25.0 W 219
Cardinal Santos E 0.48 7.2 VKX 11.6 168 25.0 CSW C 236Manila Medical 0.42 10.6 VKX 13.3 168 24.0 SW 292Capitol Medical 0.33 16.9 VKX 14.4 168 26.0 CF R 300
UDMC H 0.31 9.6 VX 17.8 168 24.0 W 174FEU Hospital E 0.29 17.1 VX 7.9 168 25.0 W 143Nakorn Chieng Mai
HuaChiew KVL 168 CFS 750Sametivej KLV 168 FSC 656Bumrungraj 58 9.2 26.0St.Louis KL 168 SFW 100Sukumvit 320
K1uay Nam Tai
Ampang Park S.C. V 84 C 750Jaya Complex V CR C 800Sungai Wang Plaza 31 34.0 V 26.0 C C 456World Trade Center T 0.70 H 0.43 KVCX 93 24.0 C C 15,488Clifford Ctr. T 0.70 0.66 KVCX 60 24.0 C C 1,482Maxwell House T 0.70 KVCX 60 24.0 C C 1,231Metro Dept. Store 74 26.0 CS 600Charn Issara Sh.Ctr. T 0.63 S 0.35 53.6 VC 19.8 63 25.0 128 CS R 294Cathay Dept. Store FSR 165
Glori's - Roces H 0.10 1.5 KR 7.5 84 24.0 S 105Cherry - Shaw Ave. H 0.12 13.4 AX 11.0 n 26.0 S 32Glori's· Del Monte 0.07 7.4 AX 4.0 n 24.0 SW 75Glori's - T.Sora H 0.16 12.7 AX 7.9 84 25.0 SW 62Thrlftway H 0.14 4.0 AX 71.1 28 26.0 SW 33Queen's H 0.24 7.8 AX 11.2 60 26.0 W 54
Pertama Complex V C 1,200Campbell S.C. V CS C 525Shell (Raffles) T 0.50 KVCX 55 24.0 V C 6.330Midland Building T 0.70 0.85 VCX 79 24.0 C C 1nThong Chai Bldg. C 0.90 0.39 VCX 55 24.0 C CChing Kwan House T 0.70 E VCX 55 24.0 C C 3,517Shaw House C 0.90 V KVCX 55 24.0 C C 878Tat Lee Bldg. T 0.70 KVCX 51 24.0 C S 2,110
A-8
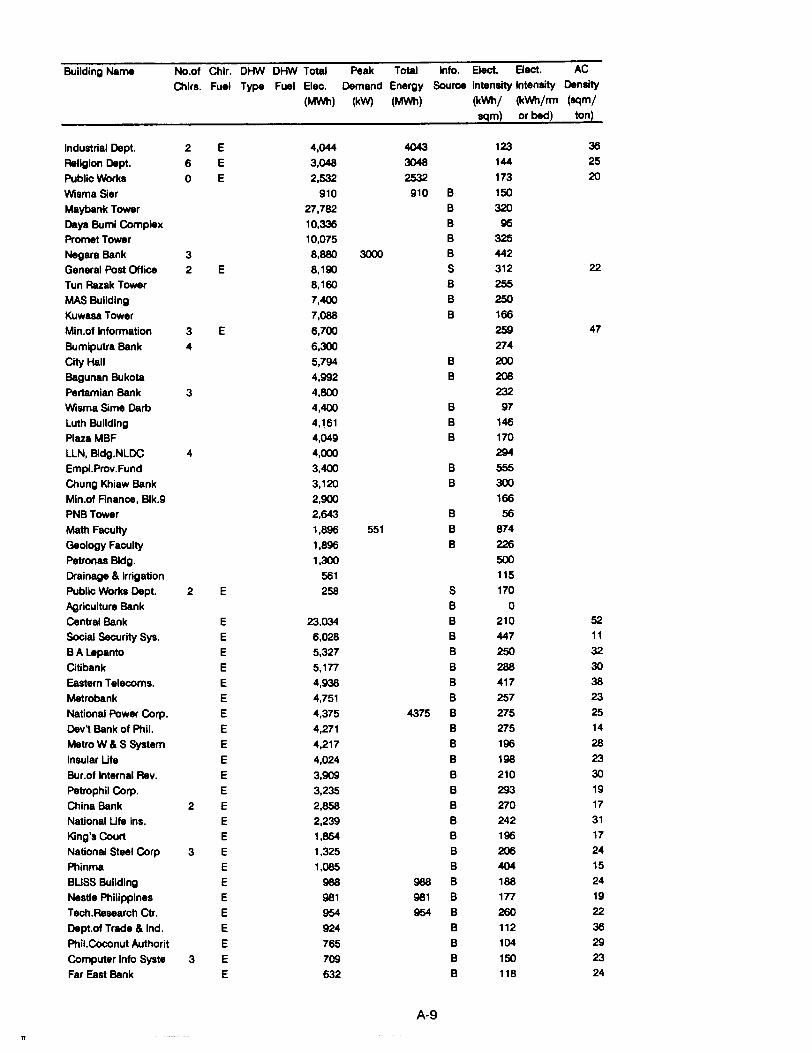
Building Name No.of Chlr. DHW DHW Total Peak Total Info. Elect. Elect. AC
Chlrs. Fuel Type Fuel Elec. Demand Energy Source Intensity Intensity Density
(MWh) (kW) (M\Nh) Ct<\Nh/ Ct<\Nh/rm (sqm/
sqm) or bed) ton)
Industrial Dept. 2 E 4,044 4043 123 36Religion Dept. 6 E 3,048 3048 144 25
Public Works 0 E 2,532 2532 173 20
Wisma Sier 910 910 B 150
Maybank Tower 27,782 B 320
Daya Bumi Complex 10,336 B 95Promet Tower 10,075 B 325Negara Bank 3 8,880 3000 B 442
General Post Office 2 E 8,190 S 312 22Tun Razak Tower 8,160 B 255MAS Building 7,400 B 250Kuwasa Tower 7,088 B 166
Min.of Information 3 E 6,700 259 47
Bumiputra Bank 4 6,300 274
City Hall 5,794 B 200
Bagunan Bukota 4,992 B 208
Pertamian Bank 3 4,800 232Wisma Sime Darb 4,400 B 97
Luth Building 4,161 B 146
Plaza MBF 4,049 B 170
LLN, Bldg.NLDC 4 4,000 294Empl.Prov.Fund 3,400 B 555
Chung Khiaw Bank 3,120 B 300
Min.of Finance, B1k.9 2,900 166
PNB Tower 2,643 B 56
Math Faculty 1,896 551 B 874
Geology Faculty 1,896 B 226Petronas Bldg. 1,300 500Drainage & Irrigation 561 115
Public Works Dept. 2 E 258 S 170
Agriculture Bank B 0
Central Bank E 23,034 B 210 52
Social Security Sys. E 6,028 B 447 11
BA Lepanto E 5,327 B 250 32Citibank E 5,1n B 288 30
Eastern Telecoms. E 4,938 B 417 38Metrobank E 4,751 B 257 23
National Power Corp. E 4,375 4375 B 275 25
Dev't Bank of Phil. E 4,271 B 275 14
Metro W &S System E 4,217 B 196 28Insular Ufe E 4,024 B 198 23
Bur.of Internal Rev. E 3,909 B 210 30
Petrophil Corp. E 3,235 B 293 19
China Bank 2 E 2,858 B 270 17
National Ufe Ins. E 2,239 B 242 31
King's Court E 1,864 B 196 17
National Steel Corp 3 E 1,325 B 206 24
Phinma E 1,085 B 404 15
BUSS Building E 988 988 B 188 24
Nestle Philippines E 981 981 B 1n 19
Tech.Research Ctr. E 954 954 B 260 22Dept.of Trade & Ind. E 924 B 112 36Phil.Coconut Authorit E 765 B 104 29
Computer Info Syste 3 E 709 B 150 23
Far East Bank E 632 B 118 24
A-9
Il
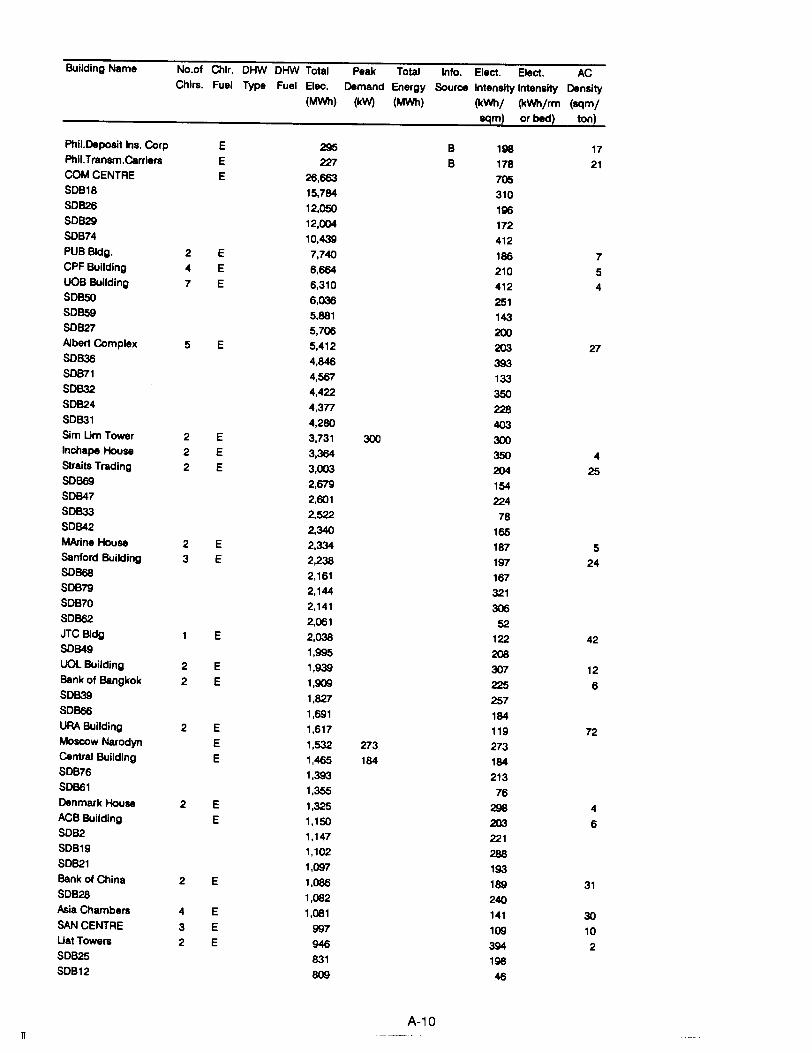
Building Name No.of Chlr. DHW DHW Total Peak Total Info. Elect. Elect. AC
Chlrs. Fuel Type Fuel Elee. Demand Energy Source Intensity Intensity Density
(MWh) (kW) (M'Ml) (k'Ml/ (k'Ml/rm (sqm/
sqm) or bed) ton)
Phil.Deposit Ins. Corp E 295 B 198 17
Phil.Transm.Carriers E 22:7 B 178 21
COM CENTRE E 26,663 705
SDB18 15,784 310
SDB26 12,050 196
SDB29 12,004 172
SDB74 10,439 412
PUB Bldg. 2 E 7,740 186 7
CPFBuilding 4 E 6,664 210 5
UOBBuilding 7 E 6,310 412 4
SDB5Q 6,036 251
SDB59 5,881 143
SDB27 5,706 200Albert Complex 5 E 5,412 203 27
SDB36 4,846 393SDB71 4,567 133
SDB32 4,422 350SDB24 4,3n 228SDB31 4,280 403Sim Um Tower 2 E 3,731 300 300Inchape House 2 E 3,364 350 4
Straits Trading 2 E 3,003 204 25
SDB69 2,679 154
SDB47 2,601 224
SDB33 2,522 78SDB42 2,340 165MArine House 2 E 2,334 187 5
Sanford Building 3 E 2,238 197 24
SDB68 2,161 167SDB79 2,144 321SDB70 2,141 306SDB62 2,061 52JTC Bldg E 2,038 122 42
SDB49 1,995 208UOLBuilding 2 E 1,939 307 12
Bank of Bangkok 2 E 1,909 225 6
SDB39 1,827 257SDB66 1,691 184URABuildlng 2 E 1,617 119 72
Moscow Narodyn E 1,532 273 273Central Building E 1,465 184 184SDB76 1,393 213SDB61 1,355 76Denmark House 2 E 1,325 298 4
ACBBuilding E 1,150 203 6SDB2 1,147 221SDB19 1,102 288SDB21 1,097 193Bank of China 2 E 1,086 189 31
SDB28 1,082 240Asia Chambers 4 E 1,081 141 30
SAN CENTRE 3 E 997 109 10
UatTowers 2 E 946 394 2SDB25 831 198
SDB12 809 46
A-10n ------_...•
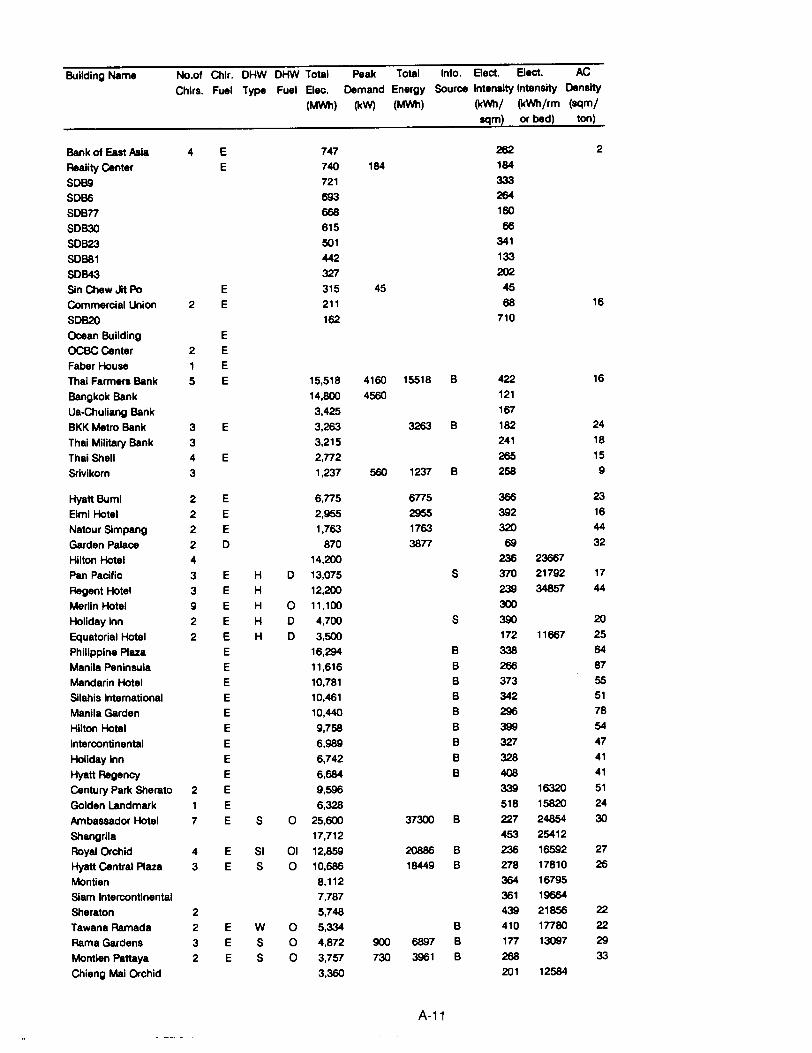
Building Name No.of Chlr. DHW DHW Total Peak Total Info. Elect. Elect. AC
Chlrs. Fuel Type Fuel E1ec. Demand Energy Source Intensity Intensity Density
(MWh) (kW) (MWh) (kWh/ (kWh/rm (sqm/
sqm) or bed) ton)
Bank of East Asia 4 E 747 262 2
Reality Center E 740 184 184
SDB9 721 333SDB6 693 264SDBn 668 160
SDB30 615 66
SDB23 501 341
SDB81 442 133
SDB43 327 202Sin Chew Jit Po E 315 45 45Commercial Union 2 E 211 68 16
SDB20 162 710
Ocean Building E
OCBCCenter 2 E
Faber House 1 E
Thai Farmers Bank 5 E 15,518 4160 15518 B 422 16
Bangkok Bank 14,800 4560 121
Ua-Chuliang Bank 3,425 167BKK Metro Bank 3 E 3,263 3263 B 182 24
Thai Military Bank 3 3,215 241 18
Thai Shell 4 E 2,n2 265 15Srivikorn 3 1,237 560 1237 B 258 9
Hyatt Bumi 2 E 6,n5 6n5 366 23Elmi Hotel 2 E 2,955 2955 392 16Natour Simpang 2 E 1,763 1763 320 44Garden Palace 2 D 870 38n 69 32Hilton Hotel 4 14,200 236 23667Pan Pacific 3 E H D 13,075 S 370 21792 17
Regent Hotel 3 E H 12,200 239 34857 44Merlin Hotel 9 E H 0 11,100 300Holiday Inn 2 E H D 4,700 S 390 20Equatorial Hotel 2 E H D 3,500 172 11667 25Philippine Plaza E 16,294 B 338 64Manila Peninsula E 11,616 B 266 87Mandarin Hotel E 10,781 B 373 55Silahis International E 10,461 B 342 51Manila Garden E 10,440 B 296 78Hilton Hotel E 9,758 B 399 54Intercontinental E 6,989 B 327 47
Holiday Inn E 6,742 B 328 41Hyatt Regency E 6,684 B 408 41Century Park Sherato 2 E 9,596 339 16320 51Golden Landmark 1 E 6,328 518 15820 24
Ambassador Hotel 7 E S 0 25,600 37300 B 227 24854 30Shangrila 17,712 453 25412Royal Orchid 4 E SI 01 12,859 20886 B 236 16592 27Hyatt Central Plaza 3 E S 0 10,686 18449 B 278 17810 26Montien 8,112 364 16795Siam Intercontinental 7,787 361 19664Sheraton 2 5,748 439 21856 22Tawana Ramada 2 E W 0 5,334 B 410 1n80 22Rama Gardens 3 E S 0 4,872 900 6897 B 1n 13097 29Montien Pattaya 2 E S 0 3,757 730 3961 B 268 33Chieng Mai Orchid 3,360 201 12584
A-11
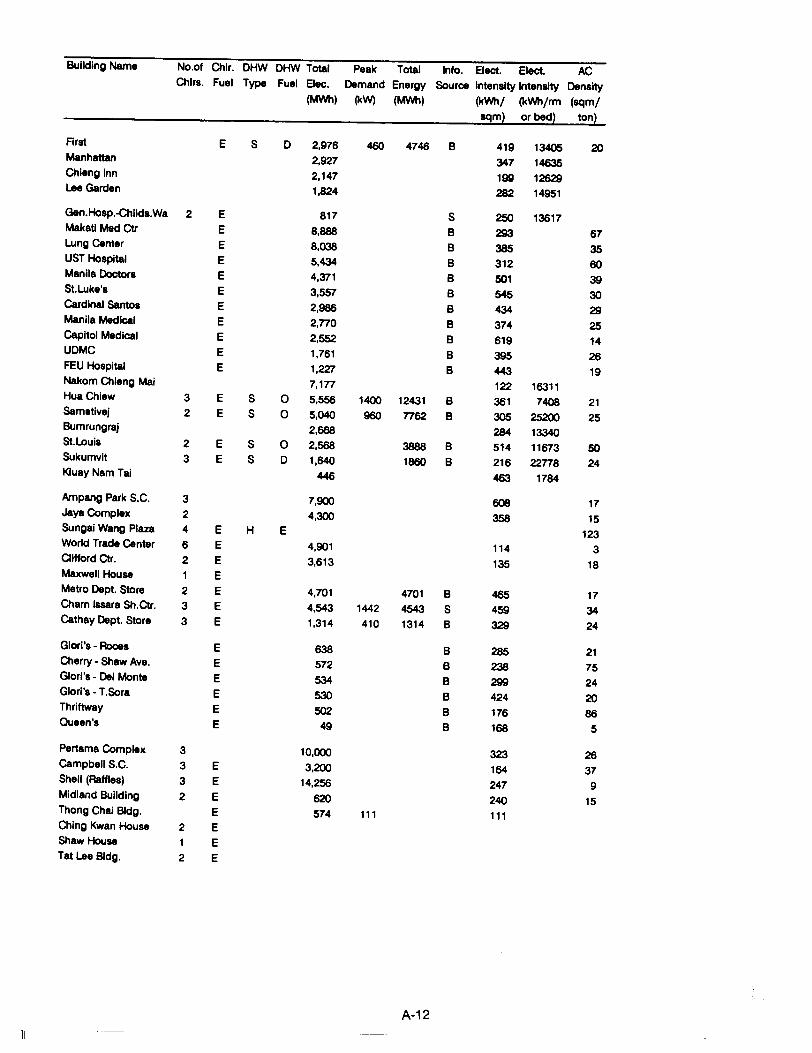
n
Building Name No.of Chlr. DHW DHW Total Peak Total Info. Elect. Elect. AC
Chlrs. Fuel Type Fuel Bec. Demand Energy Source Intensity Intensity Density
(MWh) (kW) (MWh) (kWhI (kWh/rm (sqmlsqm) or bed) ton)
First E S 0 2,976 460 4746 B 419 13405 20Manhattan 2,927 347 14635Chieng Inn 2,147 199 12629Lee Garden 1,824 282 14951
Gen.Hosp.-Childs.Wa 2 E 817 S 250 13617Makatl Med Ctr E 8,888 B 293 67Lung Center E 8,038 B 385 35UST Hospital E 5,434 B 312 60Manila Doctors E 4,371 B 501 39St.Luke's E 3,557 B 545 30Cardinal Santos E 2,986 B 434 29Manila Medical E 2,nO B 374 25Capitol Medical E 2,552 B 619 14UDMC E 1,761 B 395 26FEU Hospital E 1,227 B 443 19Nakorn Chieng Mai 7,1n 122 16311HuaChiew 3 E S 0 5,556 1400 12431 B 361 7408 21Sametivej 2 E S 0 5,040 960 n62 B 305 25200 25Bumrungraj 2,668 284 13340St.Louis 2 E S 0 2,568 3888 B 514 11673 50Sukumvit 3 E S 0 1,640 1860 B 216 22n8 24K1uay Nam Tai 446 463 1784
Ampang Park S.C. 3 7,900 608 17Jaya Complex 2 4,300 358 15Sungai Wang Plaza 4 E H E 123World Trade Center 6 E 4,901 114 3Clifford Ctr. 2 E 3,613 135 18Maxwell House 1 EMetro Dept. Store 2 E 4,701 4701 B 465 17Charn Issara Sh.Ctr. 3 E 4,543 1442 4543 S 459 34Cathay Dept. Store 3 E 1,314 410 1314 B 329 24
Glori's - Roces E 638 B 285 21Cherry - Shaw Ave. E 572 B 238 75Glori's - Del Monte E 534 B 299 24Glori's - T.Sora E 530 B 424 20Thriftway E 502 B 176 86Queen's E 49 B 168 5
Pertama Complex 3 10,000 323 26Campbell S.C. 3 E 3,200 164 37Shell (Raffles) 3 E 14,256 247 9Midland Building 2 E 620 240 15Thong Chai Bldg. E 574 111 111Ching Kwan House 2 EShaw House 1 ETat Lee Bldg. 2 E
A-12
11
APPENDIX B
ENERGY MANAGEMENT
SINGAPORE
This report provides an excellent summary of Singapore's energy auditing activities and findingsundertaken during the joint ASEAN-USAID Project. Singapore, which already had a welldeveloped energy policy prior to the Project, used the opportunity to enhance its auditing skills.
FINAL REPORT
PROJECT S3 - ENERGY MANAGEMENT
PHASE III ASEAN-US ENERGY CO-OPERATION PROGRAMME
Y.W. Wong
School of Mechanical and Production Engineering
Nanyang Technological Institute
Nanyang Avenue
Singapore 2263
Republic of Singapore
December 1989
I!
ABSTRACTThis report presents the findings of Project S3 on Energy Management under Phase III of theASEAN-US Energy Co-operation Programme. The work included a survey on office buildingenergy performance and energy audits on several selected buildings. The Singapore averageenergy Intensity for office buildings was found to be 210 kWh/m2/yr, about 15% lower than theASEAN average for office buildings. Broad guidelines for energy management and conservationopportunities were identified. Recommendations were made for incorporation of these guidelinesinto a revised handbook and for the establishment of performance targets and indicators for otherclasses of commercial buildings.
ACKNOWLEDGEMENTS
The author wishes to thank the following organisations for their support in the course of this project.
1. The Government of the United States of America through the US Agency for InternationalDevelopment (USAID), for the funding support.
2. The ASEAN Working Group on Non-Conventional Energy Research, for administering theEnergy Project.
3. The Science Council of Singapore, for in-country administration.
4. The Building Control Division, Public Works Department, Singapore, for project coordination and collaboration.
5. The Applied Science Division of Lawrence Berkeley Laboratory, University of California, fortheir technical administration and co-ordination.
6. Nanyang Technological Institute, Singapore, for providing computer facilities and time, andother in-kind contributions.
Finally, the author is indebted to the following persons for their support of the project:
Mr. P.S. Loh, who was the Principal Investigator from the initiation of this project to March,1989, and Mr. K.S. Tan, Project Research Technician, who performed the field and laboratory work in this project.
B-1
1f
INTRODUCTION
This project on Energy Management is sponsored under the Singapore Workplan for Phase III ofthe ASEAN-US Energy Co-operation Programme. The objective of this project is to prepare amanual on energy management in buildings for use by building owners and professionals in thebuilding construction and maintenance industry.
The scope of work includes energy audits of existing buildings in order to collect sufficientdata to establish the specific energy consumption of various categories of buildings. Energy simulation studies on selected buildings, including simulation of energy conservation options, are to beperformed to consider the viable options in these studies. Finally, a manual on energy management would be prepared based on the findings of the studies.
Energy Survey
A preliminary stUdy of 81 office buildings in Singapore was conducted [1,2]. These buildingswere identified from a list of about 200 buildings classified as public buildings. Public buildingsare mostly commercial buildings, housing offices, retail stores, and hotels. Questionnaires weresent to building managers requesting details of the air-conditioning, lighting, vertical transportation, and other mechanical services in their buildings. Questions were also asked about alsoenergy conservation or management measures in use. Of these, 38 replies, about 44%, werereceived by the due date in September 1986.
Some findings of the postal survey are shown in Table B-1. Energy conservation measurestaken by the buildings' management included de-Iamping in car parks and in areas of light humantraffic; increasing use of fluorescent lamps, power factor correction; and retro-fitting chiller loadoptimization and management systems. It was also noted that the increased use of microcomputers and mini-computer systems for data processing in the office has resulted in a generalrise in equipment load within bUildings.
Besides data collected from the postal survey, a compilation of data on each of the buildingsfrom records made available by the Building Control Division (BCD) of the Public Works Department (PWD) was made. These data included floor area based on architectural plans, separatedinto air-conditioned and non-air-conditioned areas; Overall Thermal Transmittance Value (OTTV);fenestration and wall areas; and overall energy consumption based on metered tariff records.Altogether, data from 65 buildings were obtained.
The data were analysed to determine the average building energy performance based onannual energy use per unit gross area (kWh/m2/yr). Figure B-1 shows the distribution of the buildings in the survey by gross floor area. Areas used for parking cars were not included in the computation. The majority of buildings were found to be in the small to medium-size range with builtin areas ranging from 5,000 m2 to 20,000. On average, the net conditioned area is about 75% ofthe gross area. Figure B-2 shows the distribution of buildings according to annual energy use perunit gross area. The average energy intensity was found to be about 170 kWh/m2/yr and mostbuildings in the sample would lie within the range of 130 to 210 kWh/m2/yr. The intensities on thebasis of the net conditioned area were 210 kWh/m2/yr, and 163 to 262 kWh/m2/yr, for the averageintensity and the range, respectively. The annual energy consumption for 1983, 1984, and 1985were used in the computation. The data collected in this survey formed the Singapore contribution to the ASEAN Commercial Building Energy Database [3].
Energy Audits
Complete audits were conducted on four office buildings. The emphasis of the study was onoffice buildings, as these formed the largest group within the stock of public buildings in Singapore. The other criteria of selection were building age and building size. The office buildings monitored were about 20,000 m2 in gross area. As can be seen from Figure B-1, most office buildingsin the survey were within this size range. Constraints of monitoring equipment in the quantity oftransducers available and measuring capacity of the transducers also limited the study to buildings within this size range. The buildings should also not be too old and two of the buildings
B-2
11
selected were built in late 1970s, while the other two buildings were more recent. This would givesome indication of any changes due to technical progress on building energy performance. Consent and co-operation of the building management in an al:Jdit were sought before the audit process began. Even after obtaining agreement to audit a building, the audit may not be conducted.In one case, the audit was abandoned after a preliminary visit to the site showed that it wasbeyond the capability of the equipment to monitor the installation.
Each complete audit could be divided into three stages. Stage one consisted of a preliminaryaudit, where the architectural plans and plans for the air-conditioning and mechanical ventilationsystems, as well as the electrical system, were studied to plan the instrumentation and zoning forthe next two stages. Data on electrical billings for the period of the previous one year wasobtained to check the consumption pattern. A building survey form was used as a check-list forcollection of information such as air-conditioning plant data and building operation schedules. Thiswas followed by a walkthrough of the building to confirm and augment information collected.
The next stage was diagnostic monitoring of the electrical system. This took place over aperiod of about two weeks. The building's main and sub-distribution circuits were monitored. Atthe same time, air flow measurements in the air-conditioning system were taken and checkedagainst the design values.
The final stage was energy consumption simulation. The ASEAM-2.1 [4J software was usedin the project. The simulation results were matched with the building data to obtain the base simulation case against which parametric runs to test the viability of various energy conserving opportunities were conducted. Energy-conserving opportunities such as reduction of system operatinghours, adjusting space temperature and humidity, adjusting ventilation rates, and improvement ofchiller COP were considered.
In addition, electrical consumption monitoring was conducted on two hotels and an institutional building. The hotels were of 400 rooms and 588 rooms capacity and were completed in1983 and 1976, respectively. The institutional building houses a professional school in a university.
Brief information of the office buildings and other buildings audited are shown in Tables B-2and B-3, while the detailed description of each building and the analyses performed can be foundin the section on Case Studies.
DiscussionThe energy intensities of the four office buildings audited ranged from 96.6 to 201.9
kWh/m2/yr. This is below the Singapore average of 210 kWh/m2/yr, based on conditioned area.Comparing these values, in Table B-4, against the ASEAN office building average of 246kWh/m2/yr [3] and setting the latter to an index value of 100, it was noted that the Singapore average intensity results in a significantly lower value of 85.4.
The difference between the ASEAN average and the Singapore average can be attributed toseveral factors. The first explanation is that the Singapore climate is milder than the other ASEANsites. It was noted by Levine et al [3] that in DOE-2 computer simulations on a generic office building model, using weather tapes from the four ASEAN cities of Bangkok, Manila, Jakarta, andSingapore, the results for the Singapore model had the lowest energy intensity. Secondly, the factthat the Singapore buildings were already complying to the existing regulations [5J and standardsof OTTV, air-conditioning, and lighting intensities could possibly explain the lower intensities.Thirdly, it was noted in the audits that the building management had already adopted some energ~
conservation measures, such as the generally low lighting intensities of between 12 to 15 W/m(albeit at an illuminance level of the range of 200 - 300 lux only), extensive use of fluorescent lighting, de-lamping, and reduced operation of air handling units (AHUs) fans during lunch break,among others. .
However, some consideration must also be given to contributing factors such as below average occupancy in the case of URA building, change to high COP chillers in Jurong Town Hall, andthe generally above average quality of building maintenance.
B-3
IT
Energy use according to systems are shown in Table B-5 to be of a similar order in the officebuildings, subject to the site monitoring constraints that were imposed by the electrical distributionsystem serving the various services in each building.
In summary, the limited number of cases of full audits conducted in the present projectprevents identification of the specific energy conservation opportunities in Singapore. Nevertheless, it is possible to make several broad observations. These are:
• Good maintenance practices will result in improved building energy performance.
• Computer simulations using ASEAM-2.1 have shown that energy cost savings couldbe obtained in reducing plant operation time.
• Measures like raising the setpoint temperature and reducing infiltration produced onlymarginal results.
• Reducing AHU operation during lunch breaks is effective.
• Replacement of old chillers with ones having high COP should be considered in olderbuildings.
• Reduced lighting energy intensity by using high-efficiency fluorescent lighting is effective.
• Energy monitoring helps in identifying waste. Long-term energy monitoring is useful inbuilding management.
Experience gained in the project has shown the advantages of short-term monitoring ofenergy consumption in buildings. As a result, a requirement for the provision of facilities for shortterm energy monitoring in commercial buildings was incorporated into the 1989 revision of theBuilding Regulations [5].
In the long term, the broad guidelines on energy management and conservation would berefined and incorporated into a revised energy handbook. Energy performance indicators and targets for all building types would be established.
CASE STUDIES
Albert ComplexThe Albert Complex, Figure B-3, is a new building, having been completed in early 1987.
This building has retail space with a net conditioned area of 12,454 m2 (21,308 m2 gross area,including 8,854 m2 basement carpark) in a three-story podium, above which sits office space witha net conditioned area of 14,129 m2 (14,784 m2 gross area) distributed in 14 stories. The wholebuilding is clad with a curtain wall with double-glazed panes at the window areas.
There are two air-conditioning plants serving this building because of a difference in operating schedules; the retail space operates from 1000 hour to 2130 hour all year round. and the officespace operates from 0830 hour to 1900 hour on weekdays and 0830 hour to 1300 hour on Saturdays. The retail space and the office space are each served by a constant volume central airconditioning system.
The building was first audited in early January 1988 during the fit-up for the major tenant inthe office space. A second audit was performed in April 1988 after the building was fully occupied.
The electrical consumption profile for the building is shown in Figure B-4. The base casesimulation energy intensity of the building was 319.6 kWh/m2/year for the retail space and 96.9kWh/m2/year for the office space. The overall performance was 198.7 kWh/m2/year. The energyintensities are computed from the energy consumed by the building per unit area over the periodof one year. Areas for car parks are not included in the computation.
The energy consumed by the various building services are shown in Figure 8-5. The percentages are as follows:
B-4
42.5%
12.8%
15.5%
29.3%
11
Air-conditioning plants
AHU fans and cooling towers
Lighting and Power (tenants)
Miscellaneous (lifts, general lighting, waterpumps, basement ventilation fans, restaurantstand-alone air-conditioning units).
As the building is new, many energy-conserving features have been incorporated into itsdesign. These include the use of high-efficiency fluorescent lighting for all areas and chillers ofhigh COP. A chiller optimization controller was installed but not put into operation. Neverthelessenergy conservation measures studied included:
• Shorten plant operating hours (average 1 hour per day);
• Reduce infiltration rate from 0.25 to 0.1 air change per hour; and
• Reduce ventilation rate from 11% to 8%.
It was found that savings from the first two measures were marginal. The saving fromreduced ventilation was about 85,595 kWh per annum - a 1.6% reduction in energy consumed.
One noteworthy benefit shown by the diagnostic monitoring was that it demonstrated to thebuilding operator that the load from facade decorative lighting installed for the festive season fromDecember to January was 50 kW.
URA Building
The URA Building, Figure B-6, is about ten years old. It houses the administrative offices ofthe Urban Redevelopment Authority. It has 11,987 m2 of office space spread over one basementlevel and four upper levels. A mechanically-ventilated carpark of 6,900 m2 is sandwichedbetween the first story and the fifth story. The bUilding is rectangular in form with one of theshorter walls abutting an adjoining building and the opposite short wall is without any windows.The windows on the long side walls are shaded by deep fins and horizontal overhangs.
The air-conditioning system consists of a central chilled water plant serving a constantvolume central air system. There were several stand-alone water-cooled packages used for cooling the computer installation.
The building was 60% occupied at the time of the study and the energy intensity based onenergy billings the previous year was about 131.2 kWh/m2/year. This low value could be due tothe energy-conserving measures already adopted by the building operator. These include:
• De-Iamping surplus fluorescent tubes,
• Installing solar control films on all windows, and
• Close monitoring of chillers and running only one chiller whenever possible. Thechiller COP was a 4.2.
The annual energy performance from the base simulation run was 1,672,216 kWh, 6.3%higher than the past year's energy bills. The base run suggests that operating one chiller was notsufficient for the load. Yet there were no complaints from the occupants. Further investigationsare in progress. The energy intensity was 139.5 kWh/m2/year based on the simulation results.
Again, reducing the ventilation to 8% air supply rate gave a marginal saving in energy of1.3% annual consumption. Reducing the air supply rate was another alternative, as the designventilation rates seemed high. Site measurements, however, showed that these already had beenadjusted down.
The electrical consumption profile is shown in Figure B-7. The stand-alone air-conditioningfor the computer system can be seen to be frequently shut down at night, whereas it wasassumed in the simulation that constant 24-hour cooling was provided. This could be the cause ofthe discrepancy in the estimate.
B-5
32.3%
8.6%
30.8%
28.4%
IT
Figure B-8 shows the electricity consumption by the various services. These are as follows:
Air-conditioning plants 30.7%
AHU fans 10.0%
Computer Services 6.9%
Air-conditioning for computers 9.6%
Lighting, Power and miscellaneous 42.8%(lifts, water pumps, ventilation fans)
Sanford Building
Sanford Building, Figure B-9, is a 16-storel office building of 11,357 m2 net conditionedspace (22,233 m2 gross area, including 10,874 m carpark). It consists of a central core connecting two hexagonal shaped wings. The building envelope consists of a reinforced concrete structure with infill panels of dark tint laminated glass at the windows and insulated glazed spandrelpanels.
The air-conditioning plant consists of a central chilled water plant serving a central variableair volume system in the conditioned space. The chillers COP is 4.70. The bUilding was firstoccupied in mid-1983. The building is fitted with energy-conserving mirror optics fluorescentluminaires. These fittings are ventilated by return air. The lighting energy intensity was about 12W/m2
.
The annual energy consumption simulated from the base run was 2,292,974 kWh whichgave an intensity of 201.9 kWh/m2/year. Current occupancy is about 85%.
Electrical consumption profile is shown in Figure B-10. Nothing unusual was discovered inthe consumption pattern during the period of the monitoring. Percent consumption by services isshown in Figure B-11. These are as follows:
Air-conditioning plant
AHU fans
Lighting and Power (Tenants)
Miscellaneous (lifts, water pumps,general lighting, carpark ventilation fans)
Various energy-conserving measures were simulated: the corresponding reduction in energyconsumption were as follows:
Replace single-glazing with double-glazing 2.1 %Reduce plant and system operation by one hour daily 5.1 %Reduce lighting intensity by further 10% 2.1 %Reduce ventilation from 7% to 5% air supply rate 1.3%Combined measures 2, 3 and 4 8.3%
Jurong Town Hall Building
The Jurong Town Hall building, Figure B-12, is about 13 years old, having been completedin the mid-1970s. This building sits on a hill site. It has a gross area of 22,300 m2
, of which about16,700 m2 is conditioned area. The building has a semi-basement level and four upper levels. Apenthouse is situated on the fifth level. The building has a unique design whereby the floors onthe upper levels overhang the lower one. This, combined with side fins on either side of the windows, provide very effective solar shading. The exterior was painted an off-white colour.
The building houses the administrative offices of the government body responsible for thedevelopment of industrial infrastructure in Singapore. These offices are located at the basementlevel, and the first, third, and fourth levels of the building. The second level is leased as officespace to commercial tenants. In addition, there is one large hall, one theatrette, and the
B-6
29.0%
21.2%
26.3%
23.5%
IT
penthouse. These latter facilities are leased to civic groups for their gatherings on weekends.There is also a staff sports and recreation clubhouse located on the grounds of the building. Thisclubhouse draws its electrical power supplies from the Town Hall building. Power supplied to theclubhouse was recorded manually everyday. The annual consumption was subtracted from thevalues for the main building and hence not considered.
The building is served by a central chilled water plant supplying chilled water to central airconditioning systems in the building. The central chilling plant has two 400 RT chillers with COPof 5.87 (0.6 kW/RT). At anyone time, one chiller would be operating. The central chilling plant isnew, having been completely replaced about three years ago. The chillers, condenser and chilledwater pumps, and cooling tower fans are provided with frequency-controlled variable speeddrives, their capacities being controlled by monitoring the systems' load on the plant. However, atthe time of the audit, these energy saving features were not operational. The reason for manualcontrol of the system was that monitoring work was being conducted by the building operators.
Typically, the offices from the second to the fourth levels are divided into four zones on eachlevel, each served by an AHU. The mall meeting rooms on the first story are served by chilledwater fan coils while central systems serve the large hall and theatrette. There is also a packagedchiller serving the theatrette. This either augments the central system or operates independent ofthe central plant during the off period. Finally, there are several unitary air-conditioning units thatserve the basement offices and the penthouse.
The plant is operated from 0720 to 1640 hour every weekday, and to 1240 hour on Saturday. On Sundays, the plant is operated from 0830 to 1240 hour. On weekdays, AHU fans servingnon-essential zones are switched off for one half hour at 1300 as an energy-conserving means.All the switching operations are controlled from a central programmable time controller.
The electrical consumption profile for the building is shown in Figure B-13. From monthlyrecords of electrical energy use, the annual consumption for the 12 months September 1987 toAugust 1988 was about 2,037.6 MWh. The base case simulation energy use of the building was2,608.3 MWh, givin~an estimate of about 28% over the metered value. The actual energy intensity was 122 kWh1m Iyear against a value of 142 kWh/m2/year based on the base case estimate.The energy intensities are computed from the energy consumed by the building per unitconditioned-area over the period of one year.
The energy consumed by the various building services obtained from metered consumptiondata are shown in Figure B-14. The percentages are as follows:
Air-conditioning plant. inclUding cooling towers
AHU fans and general power
General Lighting
Miscellaneous (lifts, security lighting, waterpumps, mechanical ventilation fans, and(stand-alone air-conditioning units)
Although the building was completed before the introduction of energy saving measuressuch as OITV into Singapore building regulations in 1979, it has several features already incorporated into its design. The list of energy-conserving features noted in the building were:
• Effective shading by the use of side fins and floor overhang on the upper floors.
• Weather seals were installed in all windows.
• Replacement chillers with COP of 5.87. Benefiting from hind-sight, the building operators were able to select the optimum-sized chillers to meet the system demand.
• Use of variable speed controllers for chillers, chilled and condenser water pumps, andcooling tower fans.
• Use of programmable timers for control of the air-conditioning plant and AHU fans.This enabled non-essential zones of the air-conditioning system to be switched off forone half hour during lunch. It was estimated from the monitored energy use profile
B-7
11
that an annual saving of 20,642 kWh or about 1% annual energy saving could be realised by this measure alone.
While most of the energy conservation opportunities listed above are already in practice,there were some areas that could still be considered. Some of these are as follows:
• It was noted that while the average lighting power use intensity was about 12 W/m2,
the luminaires were not giving the necessary lighting level at the working planebecause most diffusers were removed. It is recommended that new mirror-optics typeluminaires that could produce adequate lighting level while maintaining or even lowering energy use should be considered. It was estimated that a 5% reduction in connected lighting wattage would reduce overall annual consumption by 31 MWh or 1.2%of annual consumption.
• By delaying the start-up of the plant by 15 minutes each day, savings of about 45.6MWh per year, or 1.8% annual consumption, could be realized.
It was found that savings from other measures were marginal. These included reduction ofoutside air ventilation rate and increasing wall insulation, among others.
Century Park Sheraton Hotel
The Century Park Sheraton Hotel, Figure 8-15, is a deluxe class hotel with 588 guestrooms. It has 28,313 m2 of conditioned space out of 31,496 m2 gross area. The hotel was completed in 1976. The building consists of a slightly curved block housing the guest rooms abovethe slightly larger podium occupied by the public areas and function rooms. The hotel occupancywas above 80%.
The chiller plant serving the AHUs in the public areas and fan coil units in the guest roomsconsists of three centrifugal chillers of which one is a stand-by machine. Each machine has acapacity of 915 kW (260 RT) at the rated COP of 4.3. Although the maintenance was generallygood, the age of the system has began to affect the building performance. This could be seen inthe power consumption profile, Figure 8-16, and the percentage use by individual systems in Figure B-17. The consumption profile was regular throughout the week, peaking at 1.3 MW between1900 to 2200 hour and a minimum of 0.9 MW between 0100 to 0600 hour.
The chiller plant took up 50% of the energy consumed followed by 41 % for lighting andpower. It was observed that the air-conditioning to the function rooms and restaurants wereoperating at constant flow throughout the day. Conservation opportunity in the form of reduced airflow to these areas duling off-peak hours could be considered. It was also noted that reheat hadto be applied in the guest rooms to maintain the relative humidity. There were some problemsencountered with formation of moulds in the guest rooms caused by the high humidity. The longterm solution lies in controlling the infiltration to these spaces.
The extensive use of incandescent lighting in the hospitality industry was evident from theresults. Some recognition of energy conservation opportunities was shown in the change tofluorescent lamps wherever possible or removal of excessive bulbs where not required. Theannual energy intensity was found to be 339 kWh/m 2/yr. Computer simulation was not carried outfor this audit.
Golden Landmark Hotel
The Golden Landmark Hotel, Figure 8-18, was completed in 1988. It has 400 rooms in12,205 m2 of conditioned space out of 13,935 m2 gross area. The hotel is situated in the tower ofthe Golden Landmark Building. The podium of this building is a shopping complex. Part of thehotel lobby and entrance is in the podium. The hotel has it own mechanical and electrical systemsand is functionally independent of the shopping complex.
The chiller plant serving the AHUs in the public areas and the fan coil units in the guestrooms consists of two centrifugal chillers of which one is a stand-by machine. Each machine has acapacity of 1760 kW (500 RT) at the rated COP of 5.1. Hotel operation had only begun shortlybefore the time of the audit and room occupancy was rather low. This caused the chiller to operate
8-8
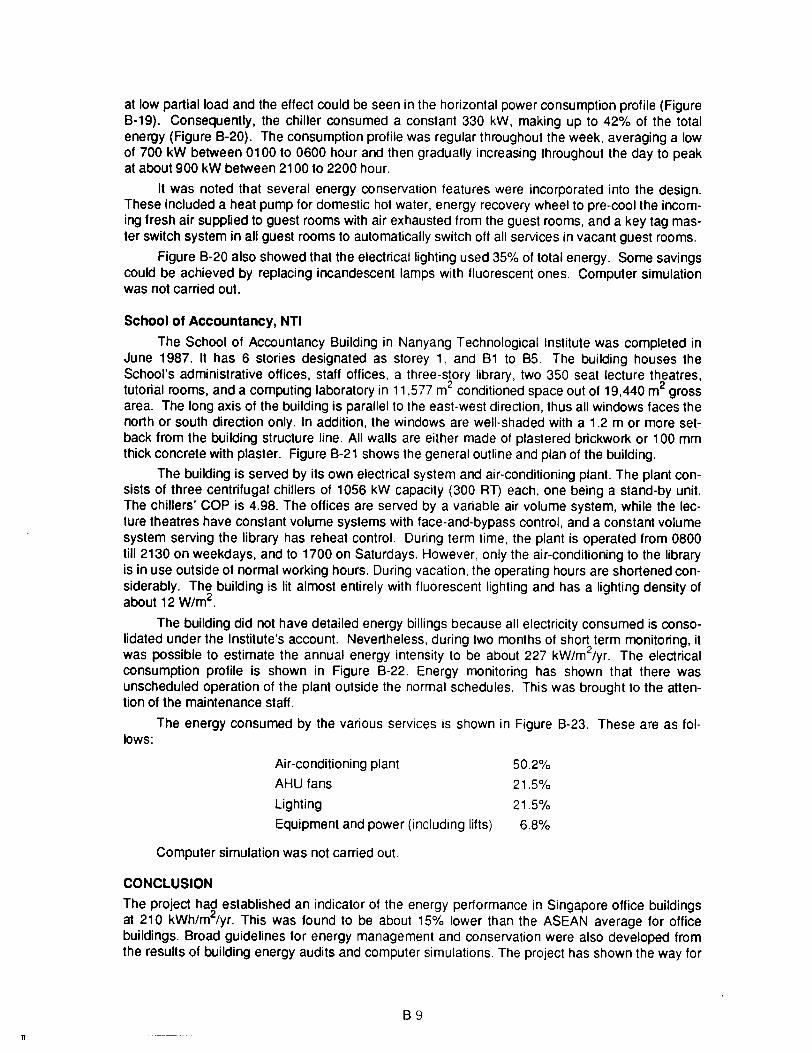
at low partial load and the effect could be seen in the horizontal power consumption profile (FigureB-19). Consequently, the chiller consumed a constant 330 kW, making up to 42% of the totalenergy (Figure B-20). The consumption profile was regular throughout the week, averaging a lowof 700 kW between 0100 to 0600 hour and then gradually increasing throughout the day to peakat about 900 kW between 2100 to 2200 hour.
It was noted that several energy conservation features were incorporated into the design.These included a heat pump for domestic hot water, energy recovery wheel to pre-cool the incoming fresh air supplied to guest rooms with air exhausted from the guest rooms, and a key tag master switch system in all guest rooms to automatically switch off all services in vacant guest rooms.
Figure B-20 also showed that the electrical lighting used 35% of total energy. Some savingscould be achieved by replacing incandescent lamps with fluorescent ones. Computer simulationwas not carried out.
School of Accountancy, NTI
The School of Accountancy Building in Nanyang Technological Institute was completed inJune 1987. It has 6 stories designated as storey 1, and B1 to B5. The building houses theSchool's administrative offices, staff offices, a three-story library, two 350 seat lecture theatres,tutorial rooms, and a computing laboratory in 11,577 m2 conditioned space out of 19,440 m2 grossarea. The long axis of the building is parallel to the east-west direction, thus all windows faces thenorth or south direction only. In addition, the windows are well-shaded with a 1.2 m or more setback from the building structure line. All walls are either made of plastered brickwork or 100 mmthick concrete with plaster. Figure B-21 shows the general outline and plan of the building.
The building is served by its own electrical system and air-conditioning plant. The plant consists of three centrifugal chillers of 1056 kW capacity (300 RT) each, one being a stand-by unit.The chillers' COP is 4.98. The offices are served by a variable air volume system, while the lecture theatres have constant volume systems with face-and-bypass control, and a constant volumesystem serving the library has reheat control. During term time, the plant is operated from 0800till 2130 on weekdays, and to 1700 on Saturdays. However, only the air-conditioning to the libraryis in use outside of normal working hours. During vacation, the operating hours are shortened considerably. The building is lit almost entirely with fluorescent lighting and has a lighting density ofabout 12 W/m2.
The building did not have detailed energy billings because all electricity consumed is consolidated under the Institute's account. Nevertheless, during two months of short term monitoring, itwas possible to estimate the annual energy intensity to be about 227 kW/m2/yr. The electricalconsumption profile is shown in Figure B-22. Energy monitoring has shown that there wasunscheduled operation of the plant outside the normal schedules. This was brought to the attention of the maintenance staff.
The energy consumed by the various services is shown in Figure B-23. These are as follows:
Air-conditioning plant
AHU fans
lighting
Equipment and power (inclUding lifts)
Computer simulation was not carried out.
50.2%
21.5%
21.5%
6.8%
11
CONCLUSION
The project had established an indicator of the energy performance in Singapore office buildingsat 210 kWh/m2lyr. This was found to be about 15% lower than the ASEAN average for officebuildings. Broad guidelines for energy management and conservation were also developed fromthe results of building energy audits and computer simulations The project has shown the way for
8-9

future work on establishing indicators for other building types and on establishing energy targetson building energy performance.
Other achievements of the project may be summarised as follows:
• Dissemination of information to professionals on energy usage in bUildings through seminars, and through publication of technical papers in proceedings of conferences (See List ofPublications at the end of this Appendix).
• Transfer of knowledge on building energy auditing through participation in courses under theASEAN project (See Courses Attended section at the end of this chapter), and throughexperience gained on the field.
• The creation of the ASEAN Commercial Building Energy Database for reference and furtherwork by researchers and professionals.
• Transfer of ASEAM-2.1 software analysis tool to Singapore.
Several valuable contacts had been established during the many opportunities provided during courses, conferences, and collaboration with the following organisations:
With the United States:
• Lawrence Berkeley Laboratory, University of California.
• ASEAM-2 and audit course supervisors in W.S Fleming and Associates, Inc., Albany,NY.
Within ASEAN:
• Universiti Teknologi Malaysia, Malaysia
• King Mongkut's Institute of Technology, Thonburi, Thailand
• Chiang Mai University, Thailand
• Departmen Pekerjaan Umum, Direktorat Jendral Cipta Karya, Direktorat TataBangunan, Indonesia
Within Singapore:
• The Building Control Division, Public Works Department, Ministry of National Development
• Public Utilities Board
B-10
n
REFERENCES
1. Wong, Y.W., "An Energy Index for Office Buildings in Singapore," Proceedings of the 4thASEAN Energy Conference - Energy Technology, Singapore: ASEAN Working Group onNon-conventional Energy Research, 1987.
2. Wong, Y.W., "Energy Performance of Office Buildings in Singapore," ASHRAE Transactions. Vol. 94, Part 2, 1988.
3. Levine, M.D., Busch, J.F., and Deringer, J.J., "Overview of Building Energy ConservationActivities in ASEAN," Proceedings of the ASH RAE Far East Conference on Air Conditioningin Hot Climates, Kuala Lumpur Malaysia, 1989.
4. Fireovid, J.A. and Fryer, L.R. "ASEAM-2.1 - A Simplified Energy Analysis Method - UserManual," American Consulting Engineers Research and Management Foundation, 2nd Ed.,Washington DC, 1987.
5. "The Building Control Regulations, 1989," Government Gazette No. 15, Singapore, 1989.
LIST OF PUBLICATIONS
1. Wong, Y.W., "An Energy Index for Office Buildings in Singapore," Proceedings of the 4thASEAN Energy Conference - Energy Technology, Singapore: ASEAN Working Group onNon-conventional Energy Research, 1987.
2. Wong, Y.W., "Energy Performance of Office Buildings in Singapore," ASHRAE Transactions, Vol. 94, Part 2, 1988.
3. Wong, Y.W., "Energy Conservation in Buildings through the Energy Audit," DTG TechnologySeminar on Building and Infrastructure, Ministry of Defence, Singapore, 1989.
COURSES ATTENDED
1. Building Energy Audit Course, Kuala Lumpur, Malaysia, September 14 - 25, 1987 conductedby W.S. Fleming and Associates, Albany, NY.
2. Advanced Energy Audit Course, Singapore, November 7 - 18, 1988 conducted by W.S.Fleming and Associates, Albany, NY.
B-11
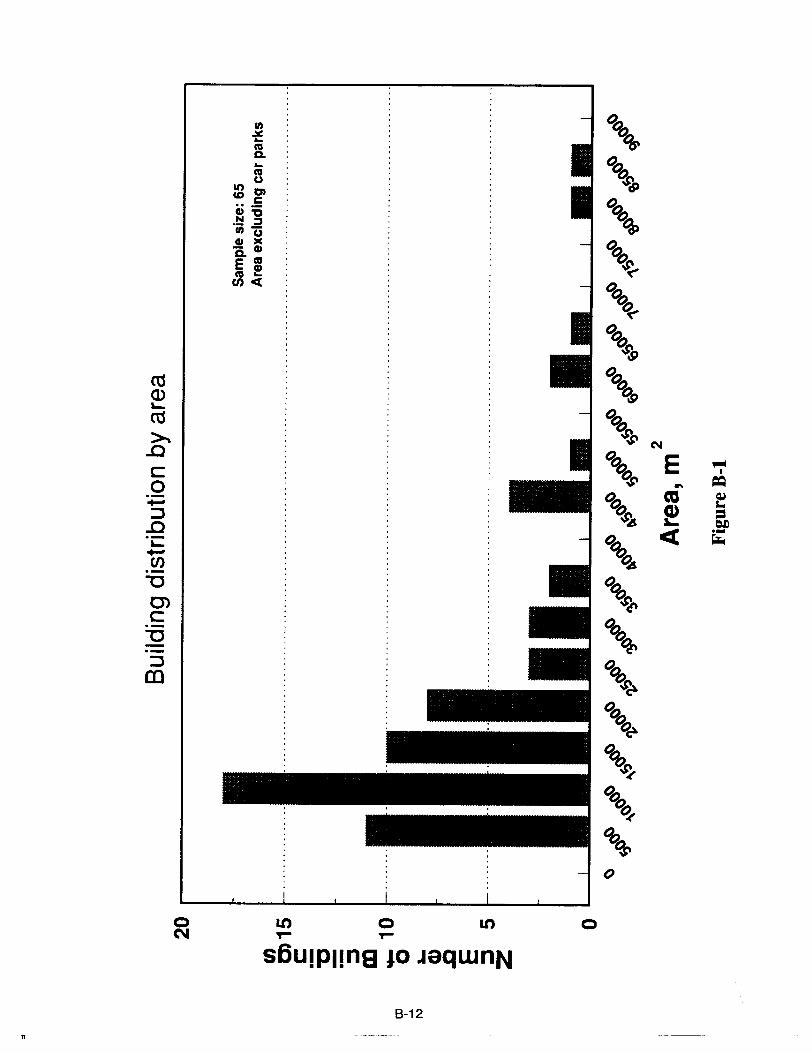
n
.....:::J.0.~.....en.--00>c-0.-:::J
en
ooX...!....ftSto)
11)0)CD ca;:g.~ :s01jCI) )(
- CI)Q.e as
CI)ftS ...U)«
o a.n 0 a.nN ,.... ,....
SDUIPUn9 jO JaqwnN
8-12
~~
o~~
0(2t)~
~~
~~
o~~
o~t)19
O~~ N
~ E ~I
~ .. =~
CO ~(1) =~ L. C.Il« .-o~ ~
~
0(2~C!'
~~
~~~
o~t)~
~\.C}
~~
t:ba~
0
0
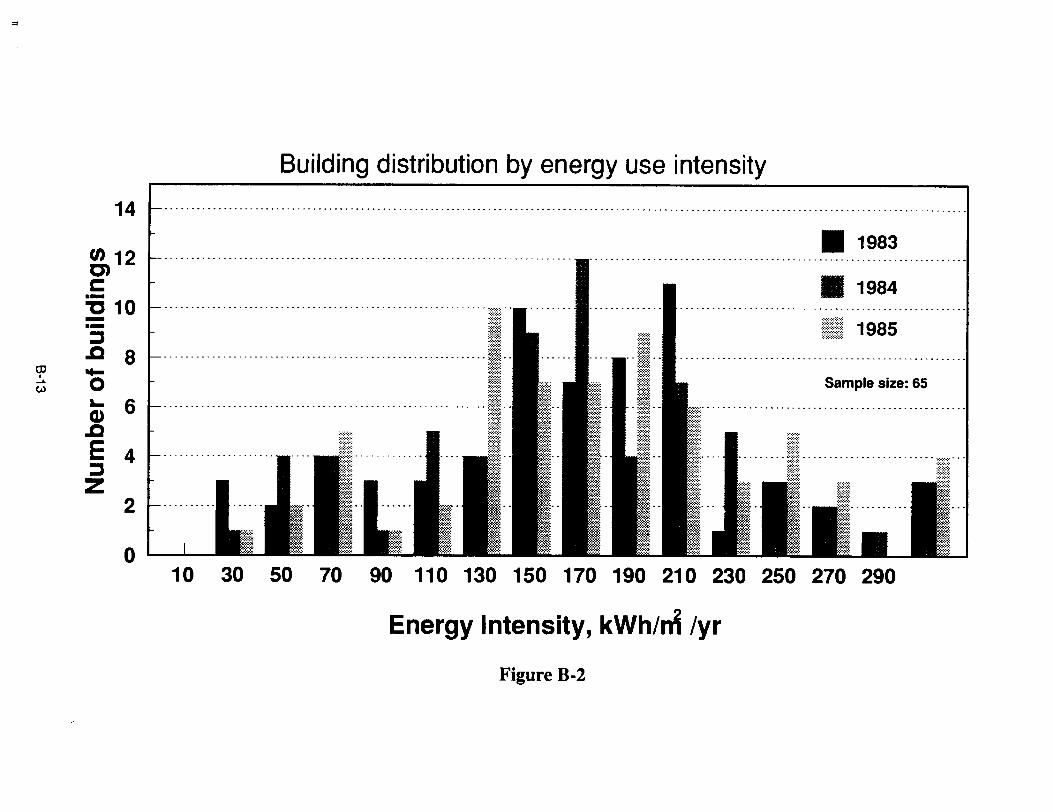
'"
Building distribution by energy use intensity
14 0-- ••••••••••••••••.••••••.•...••••••••••••.•.•••••••••.••........•........•..•..•••••••.....•••••.•••....•.••••••••••.....•....••...••••...•.•....••....•
II 1983_ .. ~ _ _ _. __ .. _ .. _ .. _. __ .. _. __ - - -._ __ .. __ .
II 1984
IIII....
W
UJ 12C)s:::::c 10---:::s.c 8~
o~ 6CD.cE 4 _ .....................:::sZ 2 _ ..........
010 30 50 70
~l~~tl~lli~~t~~ 1985
Sample size: 65
90 110 130 150 170 190 210 230 250 270 290
Energy Intensity, kWh/1'rl Iyr
Figure B-2
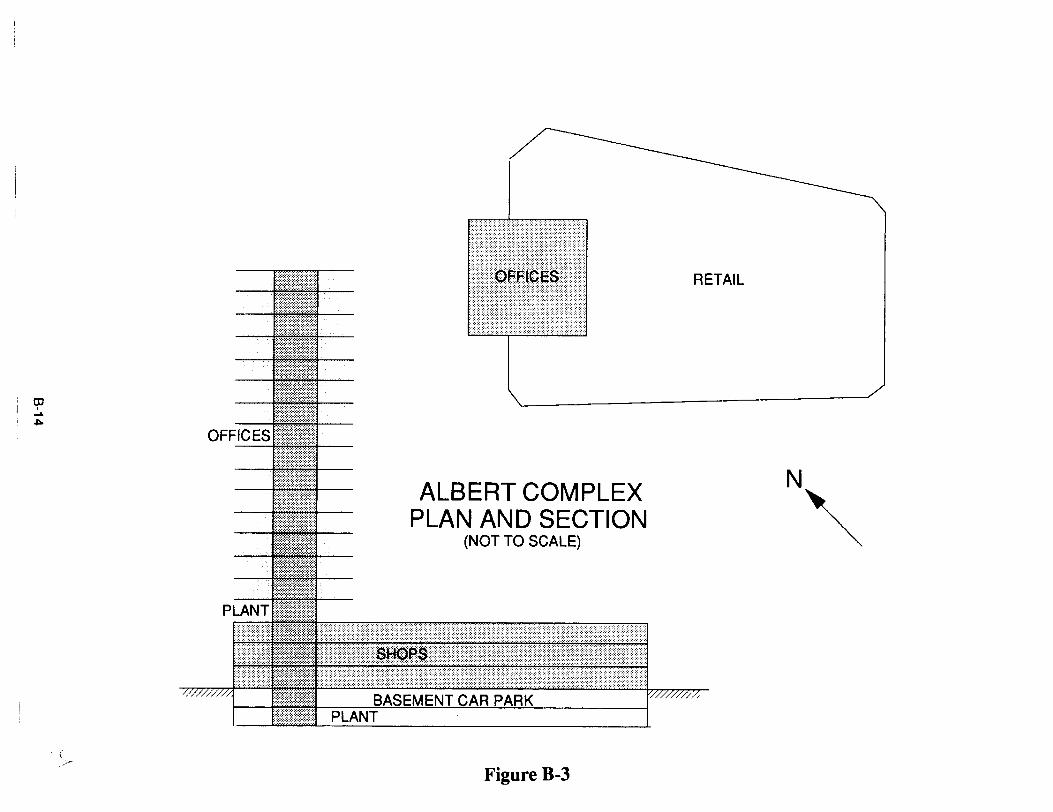
N"
RETAIL
ALBERT COMPLEXPLAN AND SECTION
(NOT TO SCALE)~1ili~~;~~ili~~l~~~l~lji~jj.
::i:i!!!::!!i::!!!:!::!::!!!!::
::!:;!:!:!:!:!:::::::::!!:::::
OJI......~
:~jjj~~~j~i~~~~~~~~i~i~l~l~~~~\:~~~~~j~ili1Ijili1I1jjW~
PLANT t:!:::;::!]:!:;::;.::!:!::;::
BASEMENT CAR PARKPLANT
Figure B-3

.,.,
ALBERT COMPLEX
1600
1500
1400
1300
1200
1100
1000
;: 900~
OJ~ 800I
Q)-"U1
~7000
a..600
500
400
300
200
100
0.00
Power Consumption, 21-27 April 1988
~j ~ !~ ~r'\ ~.,.,,.., JJr" I,1 "" 0../1 ' \; , rJ I
! ~ f I~~ I , I II I , j I. f l~I I I ~ I 00
I '! 0 I ' I ' Ii ,I I 0
• I
~ , I j 1 ! ,r! I 0 ~ I 0
'1._ ~,,-r''''''''',I , l~'~ ( . ".,1 I , "'.. l... " \,' '- •••• f \ f\, •
~ '''' t II .j fr \ I \ \ "\,, .,'r\ ... ~ ",t \" " I. .il,)· , " ~' '\'\~W A
J' "'" 'I"
I t'. ''''!/'''' _-I·'.,..,~. 1"'''- .~ ~
;t •. ... "\ i .. I
" :'" I ..-r "1\~~I '"
:.-~ va:;:.;.. I . I . -- I f-- f-- T- I I I I I I I I
12 24 36 48 60 72 84 96 108 120 132 144 156 168
- Total -- -- Chiller Plant
Time, h
Lighting & Power
Figure B-4
.. . .... AHU Fans & Aux. - - - - Miscellaneous
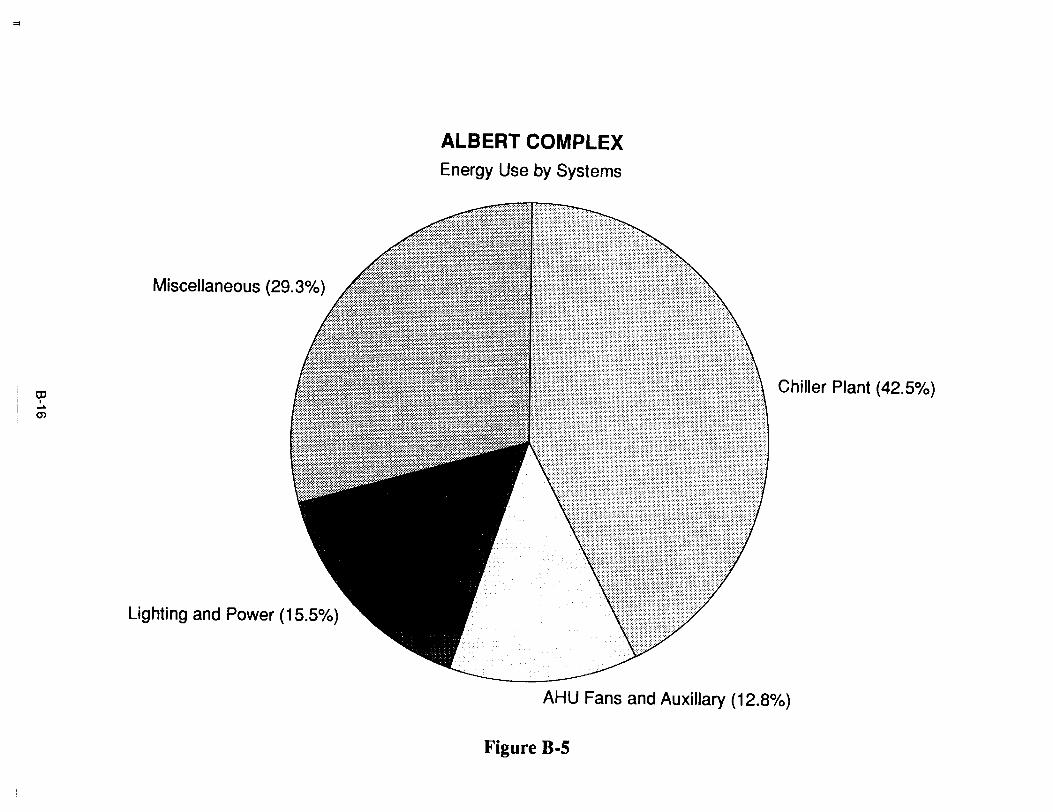
'"
OJ,~
0>
Miscellaneous (29.3%)
Lighting and Power (15.5%)
ALBERT COMPLEXEnergy Use by Systems
Chiller Plant (42.5%)
AHU Fans and Auxiliary (12.8%)
Figure B-5
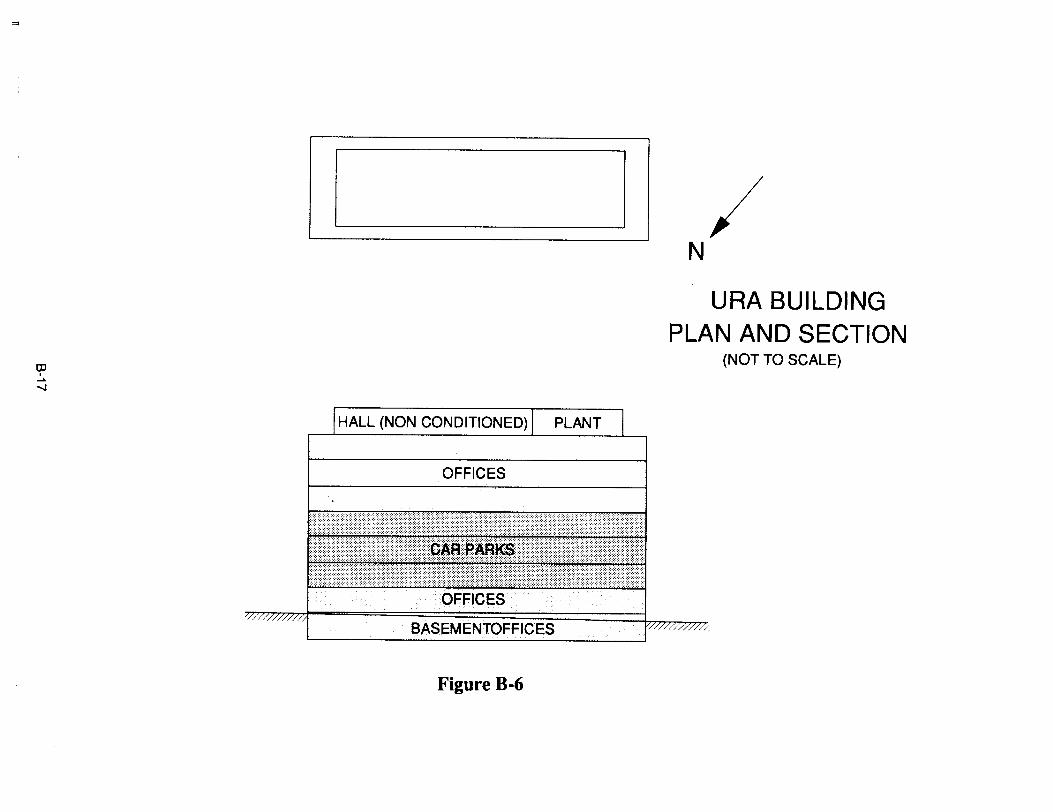
""
rp.....-.J
I I
HALL (NON CONDITIONED) I PLANT
OFFICES
OFFICES
BASEMENTOFFICES
Figure B·6
/N
URA BUILDINGPLAN AND SECTION
(NOT TO SCALE)
/,
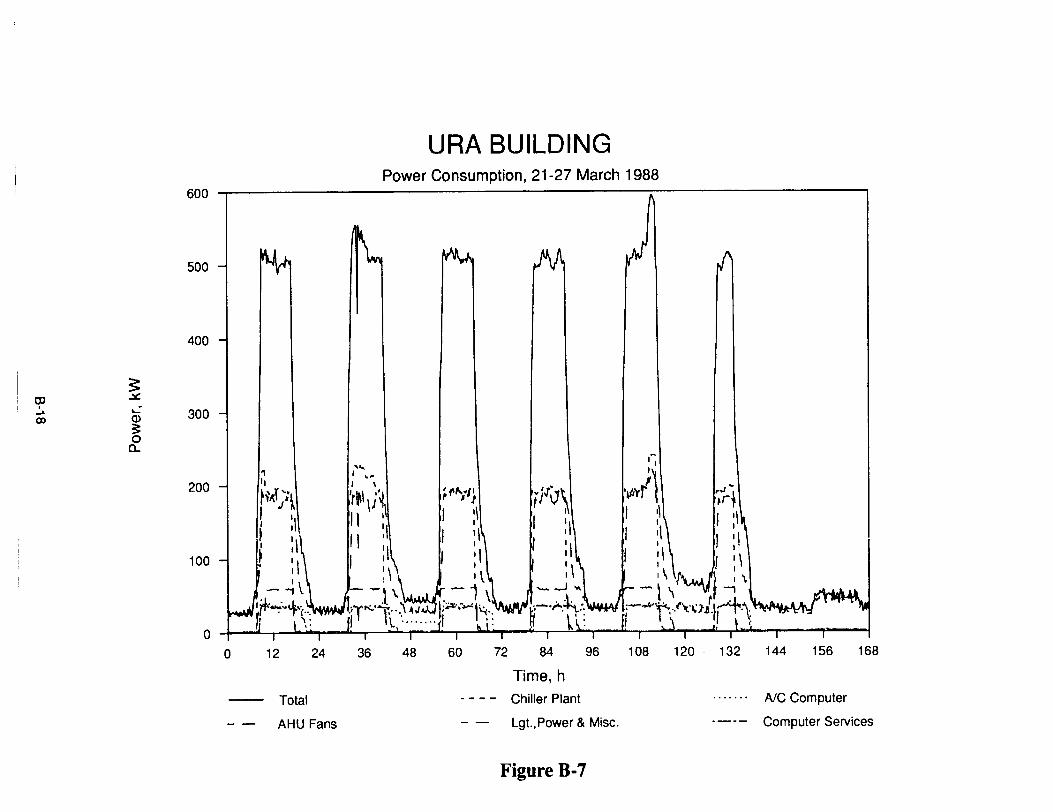
URA BUILDINGPower Consumption, 21-27 March 1988
600 li---------~=~:.--=.:.-=::::~;--------I
500
144 156 168
NC Computer
Computer Services
13212072 84 96 108
Time, h
Chiller Plant
Lgt..Power & Misc.
604836
Total
AHU Fans
12 24o
""'vI \
'r~\ \/~ 'fI~;I.t
11:\ 1:\II ,I I 1\II I
I I I 'I1\ 'i 1\
- --I \ -1...... ,. \""lal.u.t.l~I,r..::..·~··.qJ~ li~ ....,..<1'-=<..,···.. ."
_~ U L· jl \l·· .. · .. j .:O
.,...L I),L.. ..~ f· ~ t II I I r- I' .,"", ..J'.'I I I i ~ i i .., -
100
400
;:to ~
I->. ~~
(Xl Q) 300~0a..
200
Figure B-7
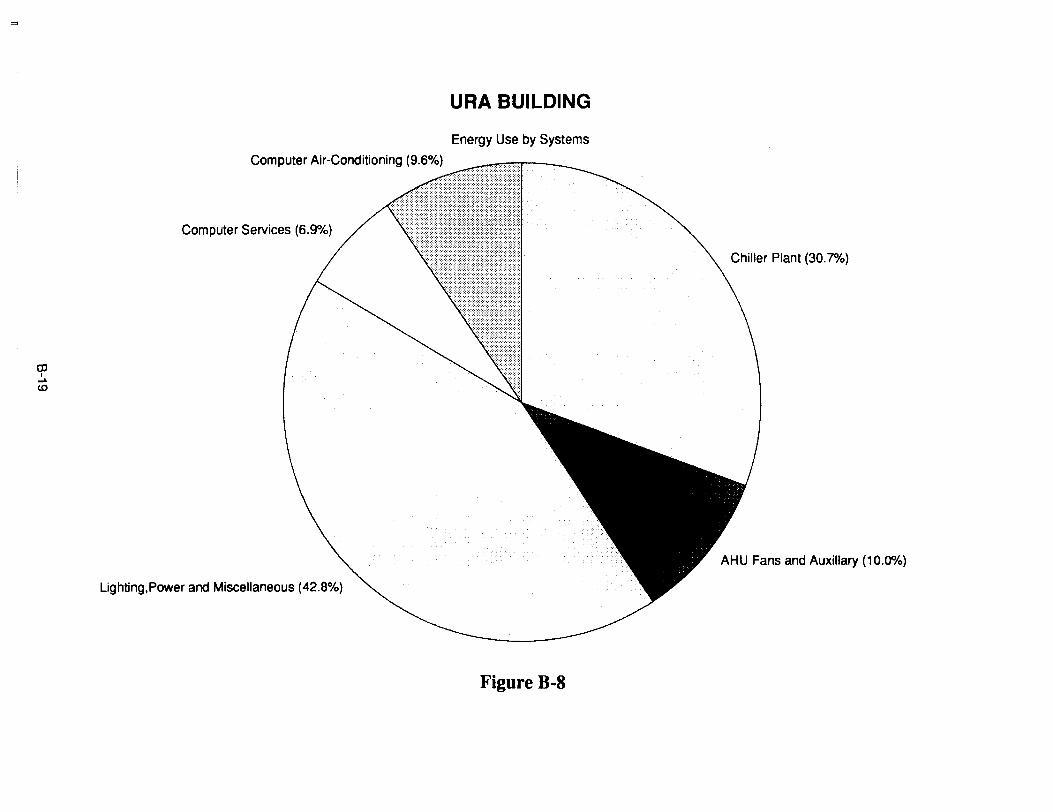
=l
URA BUILDING
Energy Use by Systems
Computer Air-Conditioning (9.6%)
Chiller Plant (30.7%)
AHU Fans and Auxiliary (10.0%)
Computer Services (6.9%)
Lighting,Power and Miscellaneous (42.8%)
OJI~
to
Figure B-8
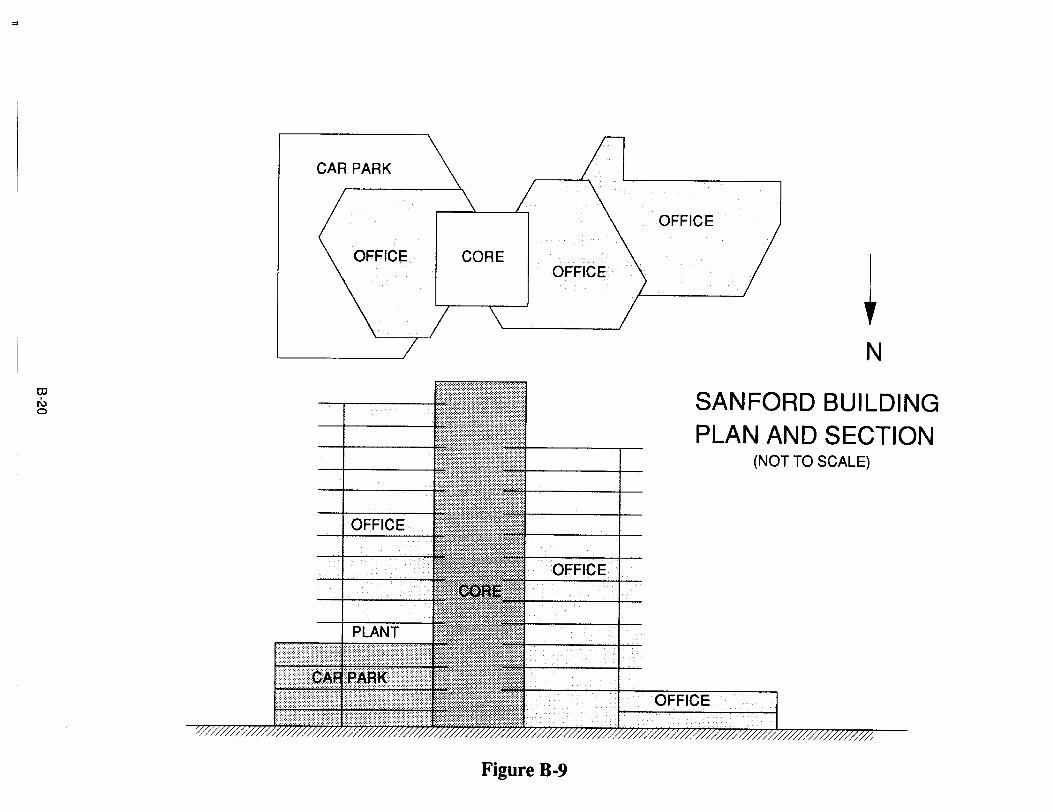
'"
CDI
I\:)o
CAR PARK
OFFICE
OFFICE
COREOFFICE
OFFICE
~N
SANFORD BUILDINGPLAN AND SECTION
(NOT TO SCALE)
OFFICE
Figure B·9
;;
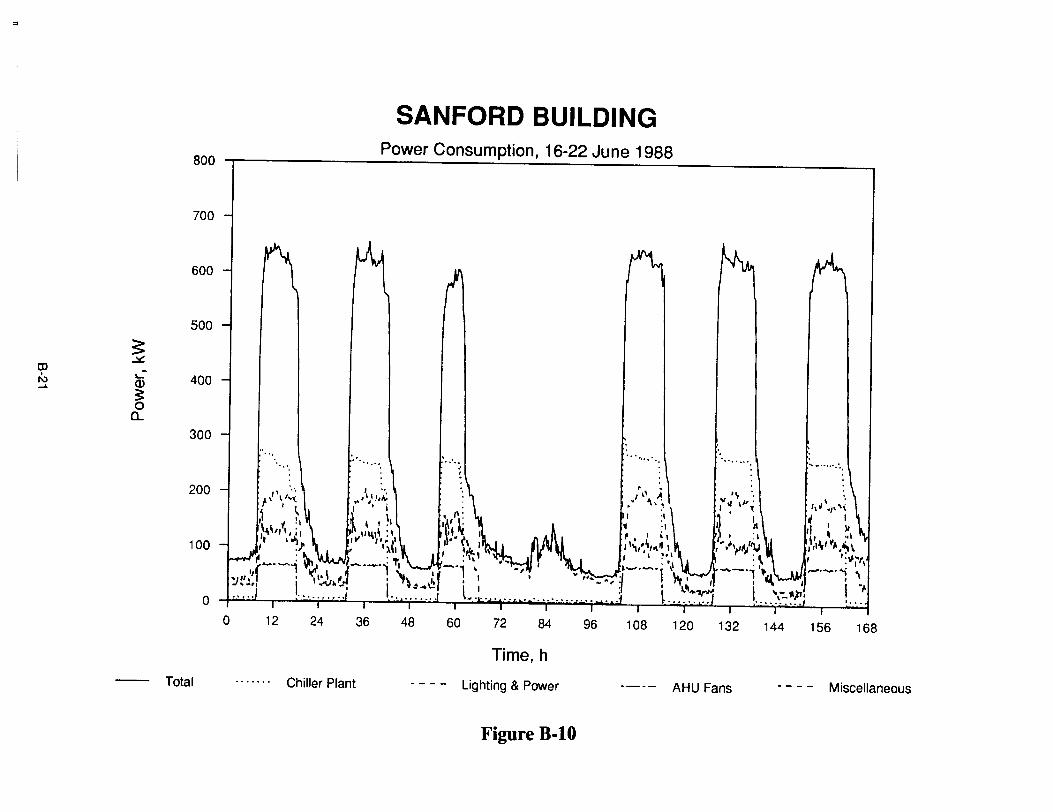
'"
SANFORD BUILDING
800Power Consumption, 16-22 June 1988
700
600
500
;:...::c:
OJ - 400'-I
Q)I\).....~0a..
300I I.,
f'". \ . ......,'.'
..... .......... ...............
168
I .f......156
I, ~\"J\'it
~ I )II ~ .1
\',\IV~ "'''" ',:oJ",1 • 1\
1441321201089684726048362412
,····U/~111'i;,,I ,1,\ .. I. , \ :
~ I , I. , '~, 1\, I •,1 ~!I , I:, .,
'-\\11', ;, ,ylJ~\\,;lIU~'"f\ I ,II ~"':I~ ':\" 1 ~t{r-, 'II .; '. . \
.~ : \. 1-..._. ...;. ", _., \r ....-~i \'I, 1 I'" " I
~ ,,:if '~'~)o~ I \~ ..I!! 'l'':J~~" I . I J J.,.., .•...··· ·.1· .
oa
100
200
Time, h
Total Chiller Plant Lighting & Power AHU Fans Miscellaneous
Figure B·I0
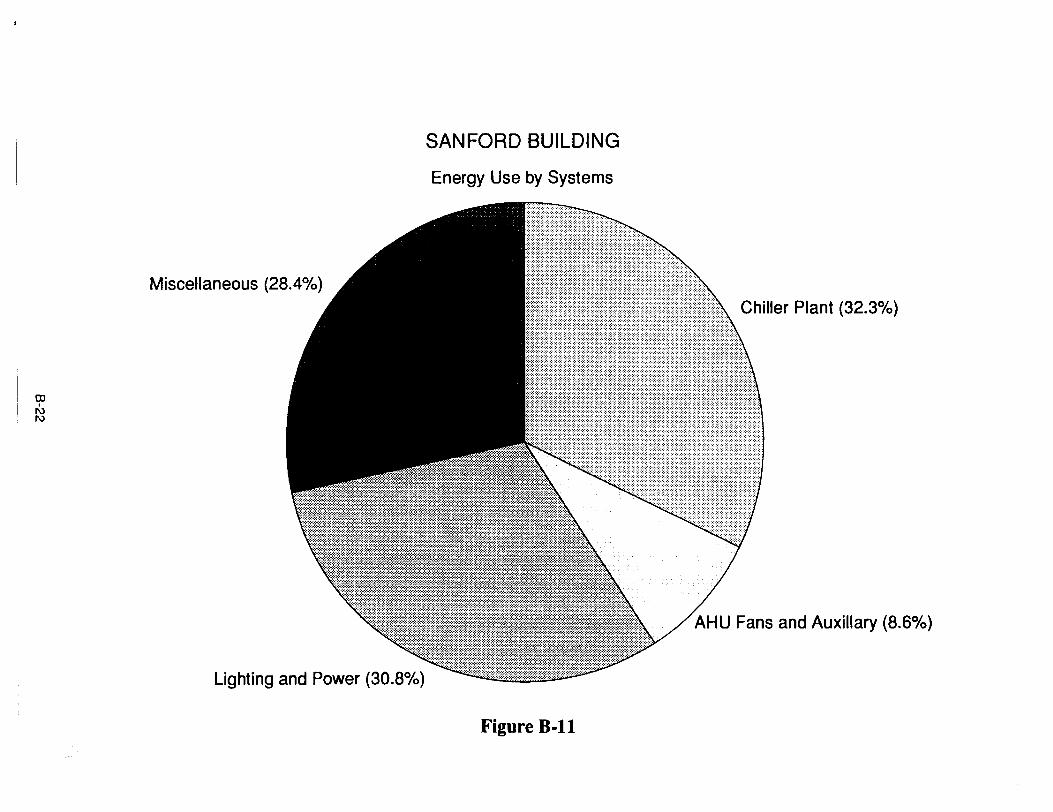
OJI
l\)l\)
Miscellaneous (28.4%)
Lighting and Power (30.8%)
SANFORD BUILDING
Energy Use by Systems
Figure B-l1
Chiller Plant (32.3%)
AHU Fans and Auxiliary (8.6%)
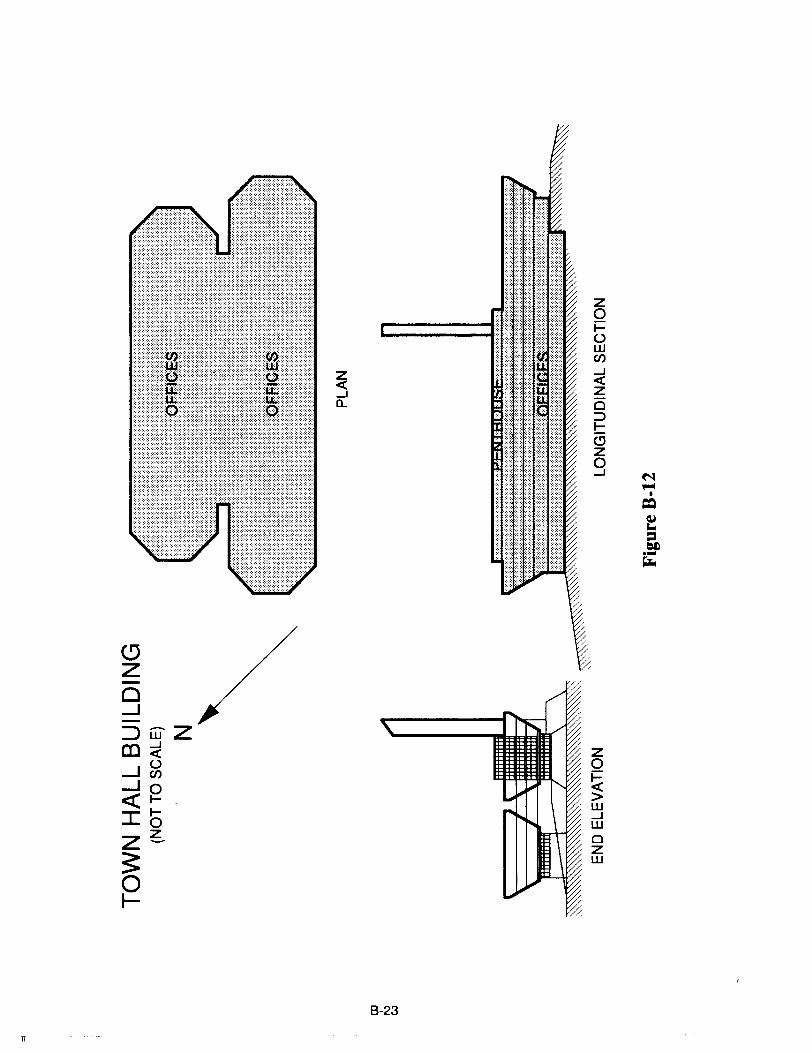
~...JCl..
zoIoWen...J<:Zo::>l-e"z9
1T
C}Zo---1
:JwZca<i---1&5---10«I-
IbzZ-
~o~
/
B-23
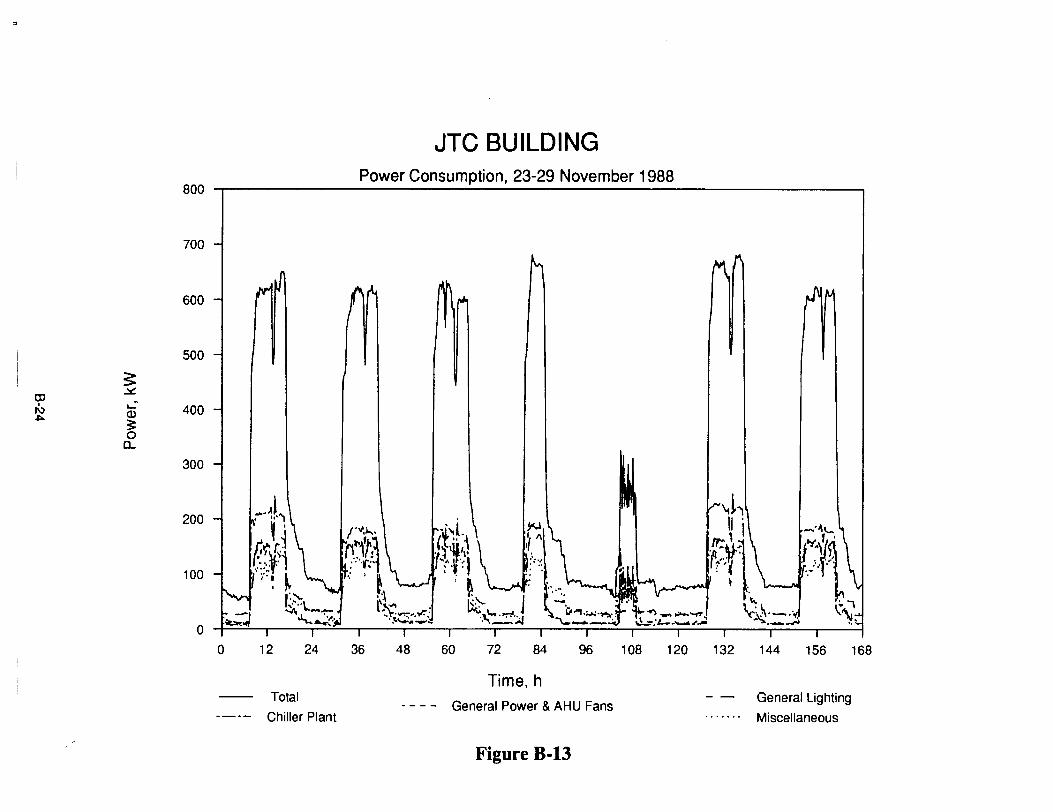
"
JTC BUILDINGPower Consumption, 23-29 November 1988
MO i i
700
600
% 100 1~ 1~ 1« 1~ 1~84726048362412o
F""~'
h~~~~:"'r;~
'. ' ~
i~' '"o t-<"" ~,,,,,:"~.,r.J
i .---7t '4~"""''''''''''Iii I....... .--I I ....-....iii" "lI I
100
200
500
~OJ
~
I ..:N 400~
(1)
~0
D..
300
Total
Chiller Plant
Time, h
General Power & AHU FansGeneral Lighting
Miscellaneous
Figure B-13
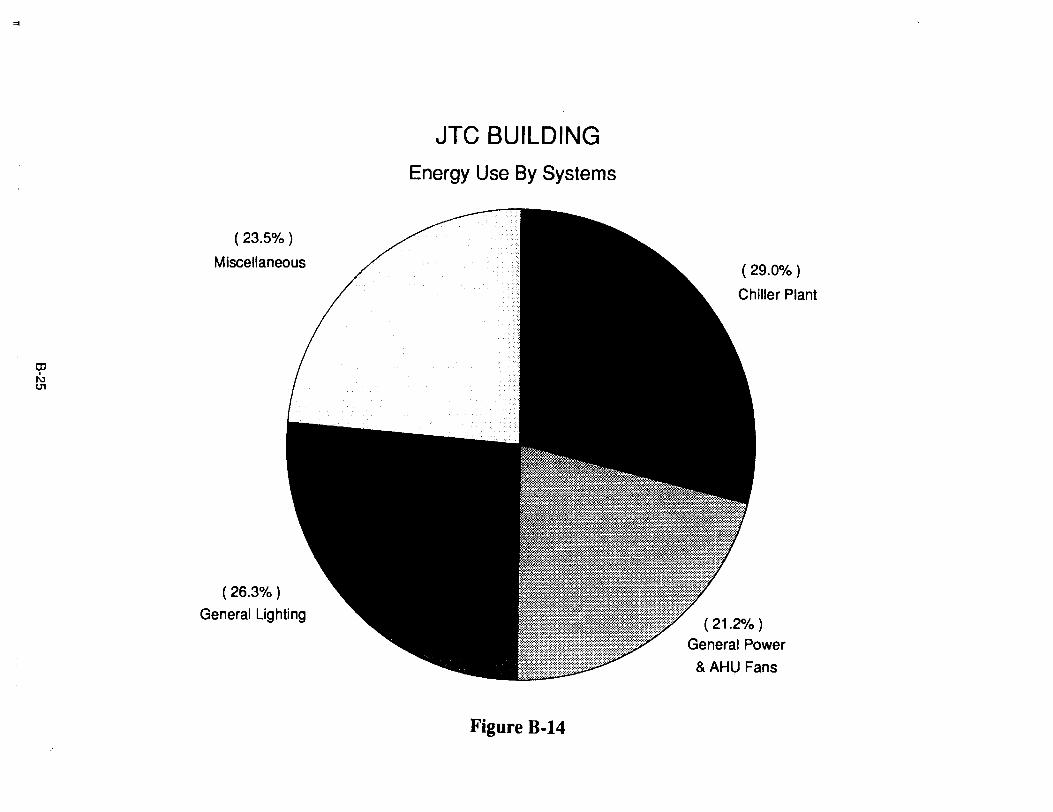
.,.
OJI
I\)01
(23.5% )
Miscellaneous
(26.3% )
General Lighting
JTC BUILDING
Energy Use By Systems
Figure B-14
(29.0% )
Chiller Plant
(21.2% )
General Power
& AHU Fans
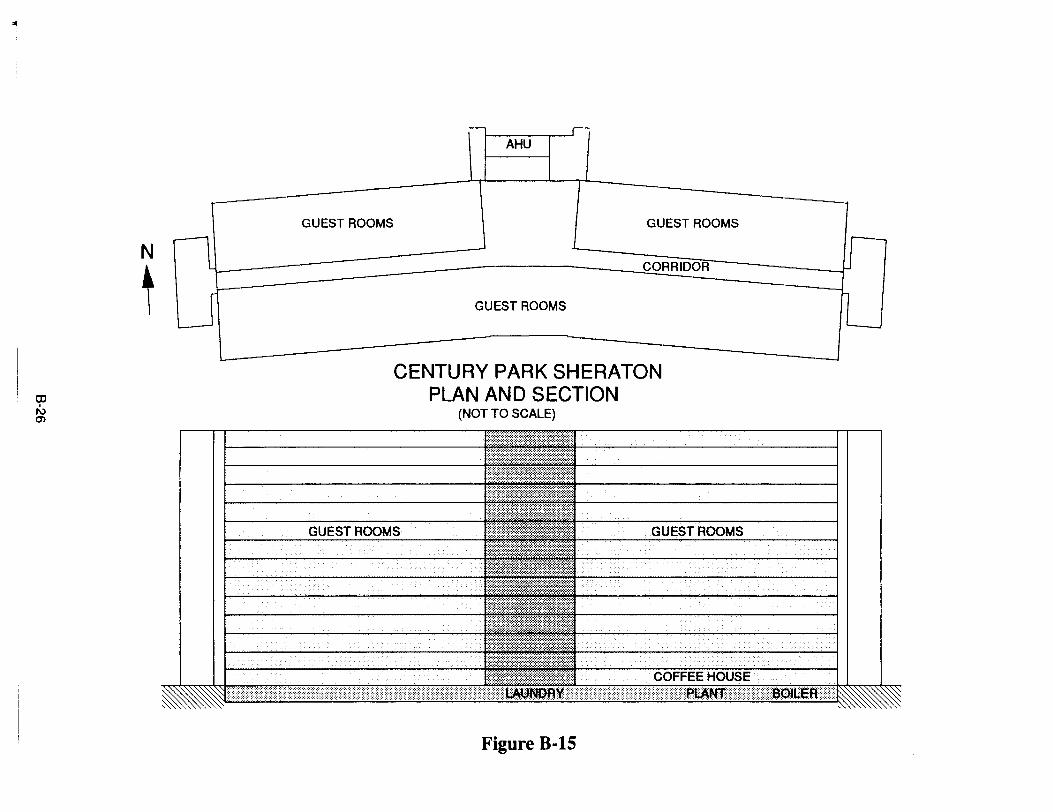
'"
OJNm
N
t
-
\AHU I
- -GUEST ROOMS GUEST ROOMS
-1 -CORRIDOR- -
U GUEST ROOMS LJ.-- -
CENTURY PARK SHERATONPLAN AND SECTION
(NOT TO SCALE)
IIIIIEJI;[:;;t]IIKJii~~~~~~~~~~~~~~~~~~~~~~~~~~~~~~~~~~~~~~~~~~~~~~~~~~~~~~~~~~~~I~:
:~II~~~~giillE~~~ili~~~~t~~~j!~~~~~j~~~~~~rI~~~~~~~I~~~~~~~~]~~~~~~~~~~~~~~j~~I~·
~~~Ijili~~iill~~~tl~j~~~~~j~~I~~~~:GUEST ROOMS ~~j~1~~j~j~i~I]~~~~~~~i~~~~~i~~~ii~~~~1~~~1~:
l:ti,~!l:!~~~i~:~i~i~i~f~~:ft::;:fMl
~~~;';'~~i~~f;';'i~:~i~:~:;':;':Ilm:m!:
Figure B-15
GUEST ROOMS
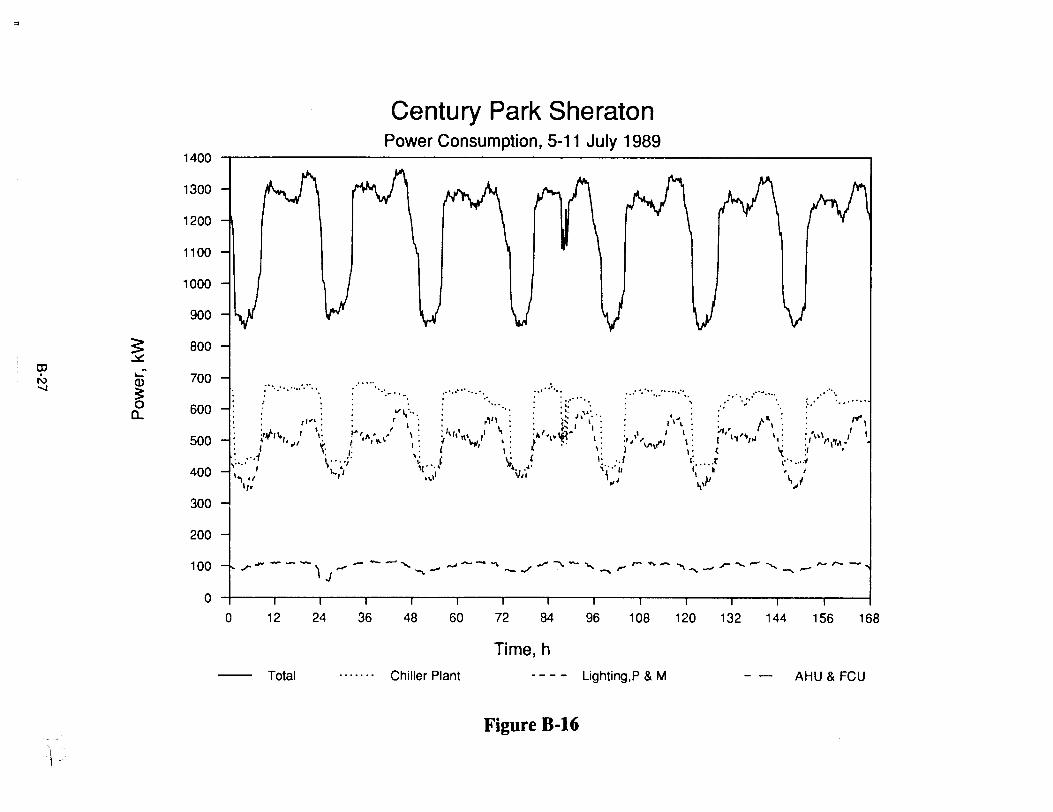
'"
Century Park SheratonPower Consumption, 5-11 July 1989
168
. ..'.
156
,'.
14413212010896847260
..............
48
....-..
362412
;".: ....: .....
,.,.,-_....- J-----, ..-I,,--~ ""..,-...., ,..-""'""......... .r~,..,..."" r-r.._.". \ J - ...... ..... - ../ -.. '"' '\ .... ..." ....... -
.~.' •••• : •.••• 0... •••• ", ••••••••. .: •..; .
1/' 0. - •• '0. ::~ \~: • :.\, ° 0
,\, h'"' • ~ . \ow. ,..,.
""' : ' I:' ,"1. i~ I I,: ,I l· ., I' . / I•.~ I· • I • • '1/' I l,. . I~. • I I \: "". '\ I • • \11 , I"",'10 / \. t '/I' - I, . 'II" • '~'I"Y' ,. :, '-, \. I I., /,./ ,. 'I "",.• I. I ' /' I ""\ • ~ I.f( \ . I ,.. . • \II\{", • • , ,I oJ ~.: I: i ' I: ': l I: r. 1,::"
,·.1 . J. \. ~ ~, \. ·.1 I, r \' ~I:'" / \"':' \1"" ~.." 'i.... " ('''j, _ J
'- / , '1., 1 \ II 1 J1'1 ., I ,,\ "J I,lr ~",rI,.
o
1400
1300
1200
1100
1000
900
~ 800
OJ.:s::.
, '--I\) 700...... Q)
~0 600a..
500
400
300
200
100
a
Time, h
-- Total Chiller Plant Lighting,P & M AHU & FCU
Figure B-16
\ -
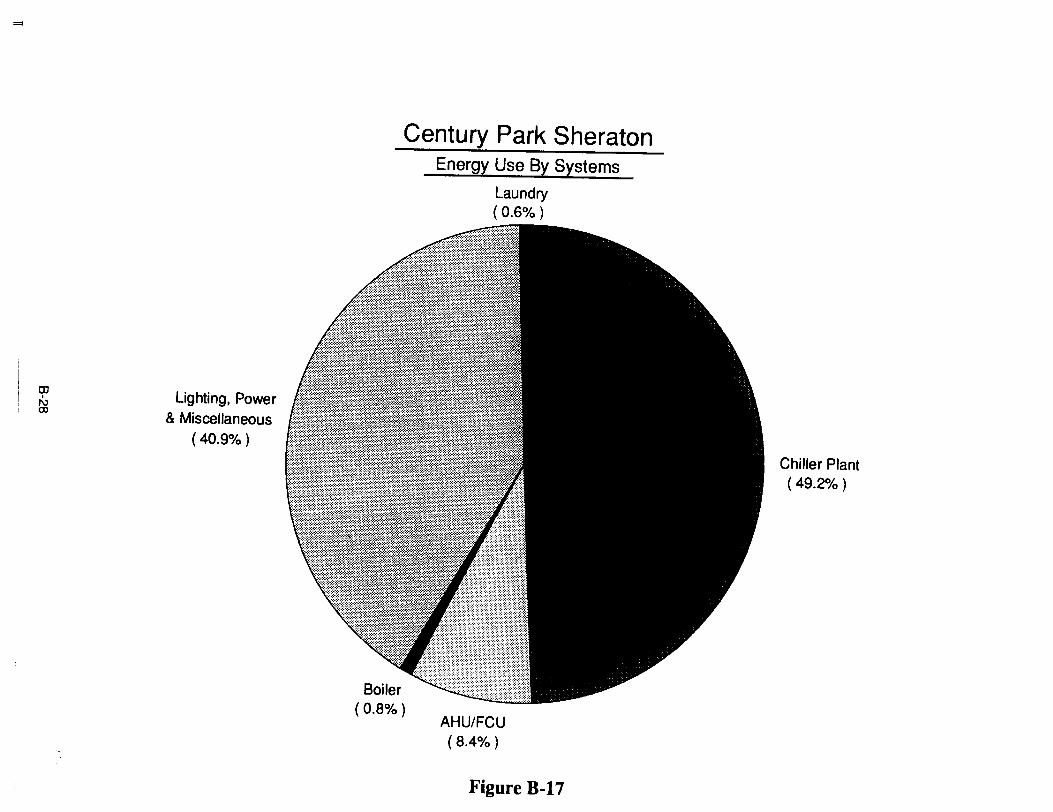
=
Century Park SheratonEnergy Use By Systems
Laundry( 0.6% )
IJ)
S5Lighting, Power
& Miscellaneous(40.9% )
Boiler(0.8% )
AHUlFCU(8.4% )
Figure B-17
Chiller Plant(49.2% )
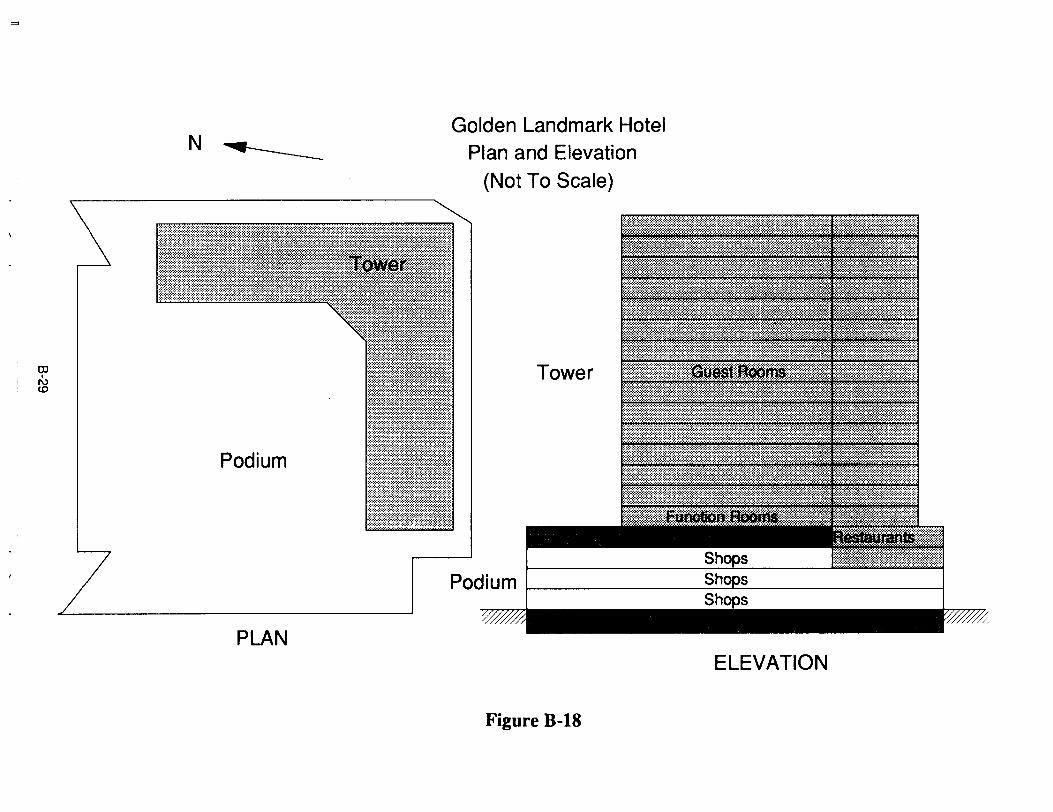
....
N~
Golden Landmark HotelPlan and Elevation
(Not To Scale)
~
'Imim1lMfi~'J_.t@f!ltllil!Ii:!llll!I~~1!ii:
i:::!i!if::~!~~:~:~:~!:~~::i:~~~:::i:~:~:::~~~!:~~~ii:::~::M@~tiri:::r~:l::~glMm:::i::mtlt::::I~~I~~I~f~~~~~~~~~~~~~~~~~~~~~~~~~~f~~~~~~~I~~~l~~~~l~~f~f:i~~~~f:f:~~~]~~~~~r~~~~~~ili~~~~1*~~~~~lt1*~ ~~~~~~~~r~ilm~i[~J~~~~~~j~~~1~j.~~~~~~~~~~~~~~~~1~~~~~~~~11~j~I~~I~f:~~j~~Il~~l~~~~~~~~~~~~~~~~~~~~~~~~~~i~~j~~~~~f:~~~~~~@i~l~fJ.ilifJ~~r~fJ~1~~I ~~i~~~~fJllftJm~*~j~1:~j~f:~j~~~i:~~~~~~~~*~riliI~~~~~~j~j~~~j~~1I~~j~~~~~~~f:r~~~~~~~j~~~~~j~~1~~1~~~~f~ilii~~j~~~~11j]~~ili~~~~1~~~1~~~~~~~~~~~f~~~~~iili~ ·~I~~j~~~®~i~~~j~1~~~~~~~~~~~II~j~~~~~iI~j~~~~~1:
11~~~~1t~~j~j~~jI~~ij~~~j~~~1~~~1~~~~~~~111~~~1~rf:1~~~~~~~~~~j~j~1~~~~1~1jlj~~~f~~~~~~j~~~*~~~~~j~1~r~~~~j~~~~ff~~ ~JfJ~~r~~~~~j~j~~~~1~~1~~1fJ~~~~~j1~~1~IifI~i:
~~~~j~1~~~~~~~1~~~j~~l~~I{j~~~I~1~~~~~~1~~~~~~~~~1~~~~~~~~~~~~~~~1~i~~~~1jm1i~j~~~~~~~~~j1i~r~~rt~~1~~~11f~~~~~1~~~~~~[~~~t~~ ~~I~i1~~~~~~i~~I~~~~~~111~~~~~1~j1j~~~j~11~~I~[~~r~~~j~1~1~~~~~~~~~1~~~~~111II~j~1~I~~~jj~1~~~~~1~f~1~~~1~i~I~~~111~~~~~~~~~~~jt~11~lli~ll~ili~~1i~iii~II~~~!wl(~~~f~ffiill~1f~~1~1~1~1~1~~1~~1~~j1~1I~~::.:.~.~.:.:.~."j,~•••~.~.~.~.'.~.~.. • • • ~...~.:.~.y.'.:.'.z..~.~.'.:.".:.'."j,' ••••...~."j,~.~.:.:.:.~..,.~.
1~~ili~l~~I[~fJ1ii~~i~~j~~~~~~~~~~lliili~~~~f~iliill~~~~~~~~~1r~l~i~~~~~~li~f}JlM~~JfJ~~mmrI~i~~~~~ffi~~~~~~~~~~~~~~1~1~~jj~~:~~~~~~f~~~~~fff:~~r~fii~~~~ii~~i~f:~*~~j~~~~j~if:[~~~~i~i~f.J~~~~II~~~~gf1!fl~~.l~~tfl1:f~i~1Iij~~~~t~~~~~~~1~t~~~~~~~~~~~f:1~ilif:~r~J~J~~~~~~~~~~~~~~~~~~~~~ili~~~J~~~~~ir~~fJ~~~~~~jlai~~ill~~~~~~~~~tjJi~~ri~ijgJlf~~~~l~~~~~~~~~~l~~~~~I~~~j~rII~l~~~~~~~~f:~~~~t~~i~lI~~~~1i~~~~~~~~~~1ff:~if~~*~i~i~f~if~~lf~®1~~rMlt.IJ.~ffji!l~~~~~f:r~~~~~~~~~~~~f~~~~~~~~~~
~~~~~~~~~]~~~jj~~j~~ili~~~~~j1~~~~~~~1~~~1~1i~~~1~j~1~11~~~jj~~1~~1~~[~1~~1~~~~~~1~~~~J~~j~~~~~~~~~~111~1~~~1~i~~~i~~II~~~~~~~~~~~~~~1~~1~~~~~~11~~~1~1~1~1I~i'.:.~."j,y.:.z.•••~.~. ~,:.~.~.~.~.~,:.~.: .~."j,~.:.~.y,'~.:.:.:.~,~.~.:,:.~.z..~.~.:.~."j,:U~.~,~.:.~.:."j,~.:.
Tower
Podium
PLAN
Podium
OJ,N(0
ELEVATION
Figure B-18
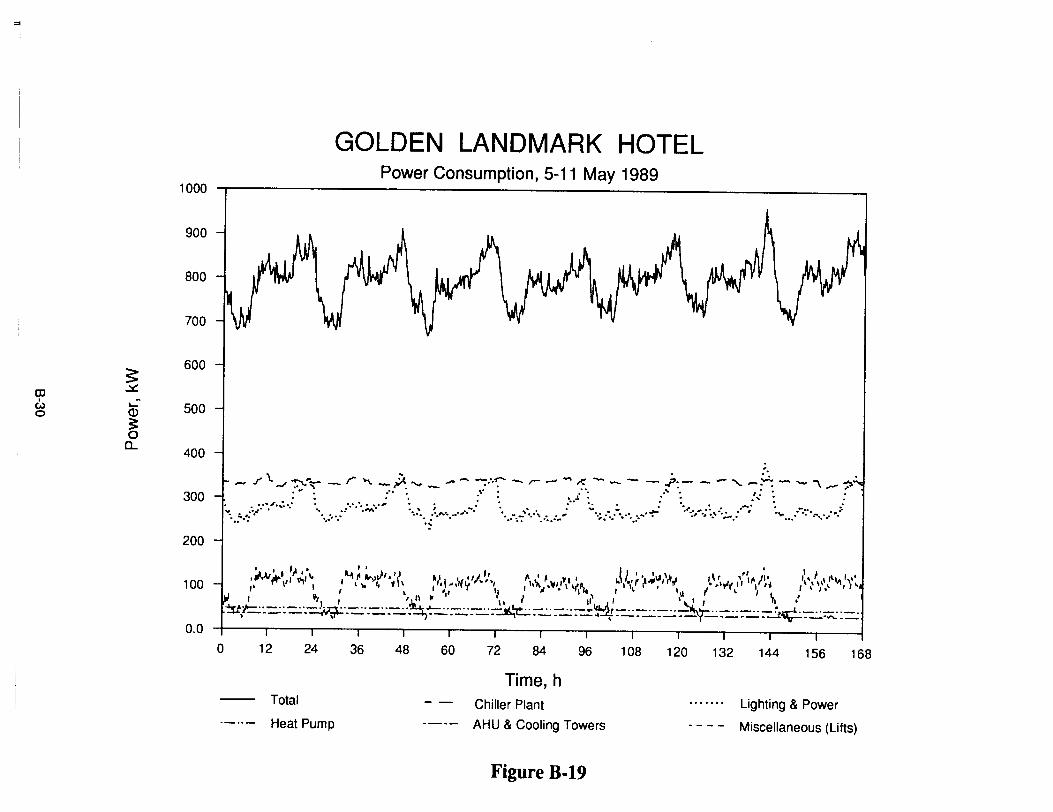
=l
1000
900
800
700
600~...::.:OJ~ 500W Q)03:0a.. 400
300
200
100
GOLDEN LANDMARK HOTELPower Consumption, 5-11 May 1989
.\
.. ..',.., /' "J ........ ~__ r- ~ _ ~ ......, ". - ...<' -... ,,- --.J "llI""\ ~ --. -- - - .J'.. - - ..,..... ""' ~~ - "- '"\ ~.
-' ,//.,."j"-\..:..r"" >.j' .:"" ..J..- -:~. :..,.,0•••.,'• ........'..' .~••: : -'.".-,., -<," \-~.,:..';..:~/ \...••:".,.".:;
I I '10' I. J I 'I. I I \ ," I I, I'I "''''",.'" ~,,, ,A.\ ~ ....1, f. ~f\ .,1.\ ~ "(~/1. ,"/ 1',,\ '-""YII ~II. .." '{' ~",II,,~~ " :'ylf ,', \J'/~'~ /I'~ I\'~\'I\, )\" , If'\0 I , I 'I' 'T II I ,,'. "fI., ' \ . III f • I I • ,.
-:ub. .._.._....!.:J~._ .. _.._.~~:... .._.._.. !.·.t:rL-··_··_~'!t!li-··_··_·.:-'-J...!-"_··_··"':'~'ir;'-'·:-··-'.. _ .._._ ... -.... .. y-- .. _ .. _ ... _ ..~ ... _ ... ~ .. _ ... _ ... _ ... '\ ... 40-::.:...y-_ .. _ .. ~ ... - """"'- ... _
0.0o 12 24 36 48 60 72 84 96 108 120 132 144 156 168
Total
Heat Pump
Time, hChiller Plant
AHU & Cooling Towers
Figure B-19
Lighting & Power
Miscellaneous (Lifts)
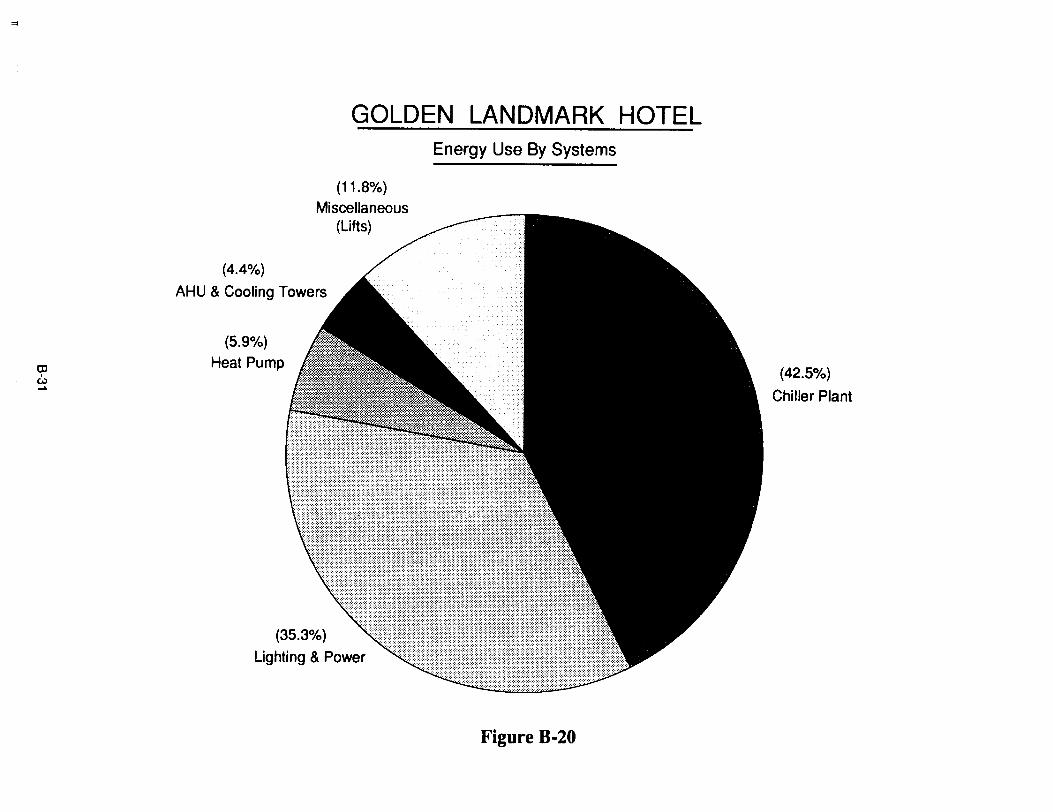
,..,
OJI
W...
GOLDEN LANDMARK HOTELEnergy Use By Systems
(11.8%)
Miscellaneous(Lifts)
(4.4%)
AHU & Cooling Towers
(5.9%)
Heat Pump
(35.3%)
Lighting & Power
Figure B·20
(42.5%)
Chiller Plant
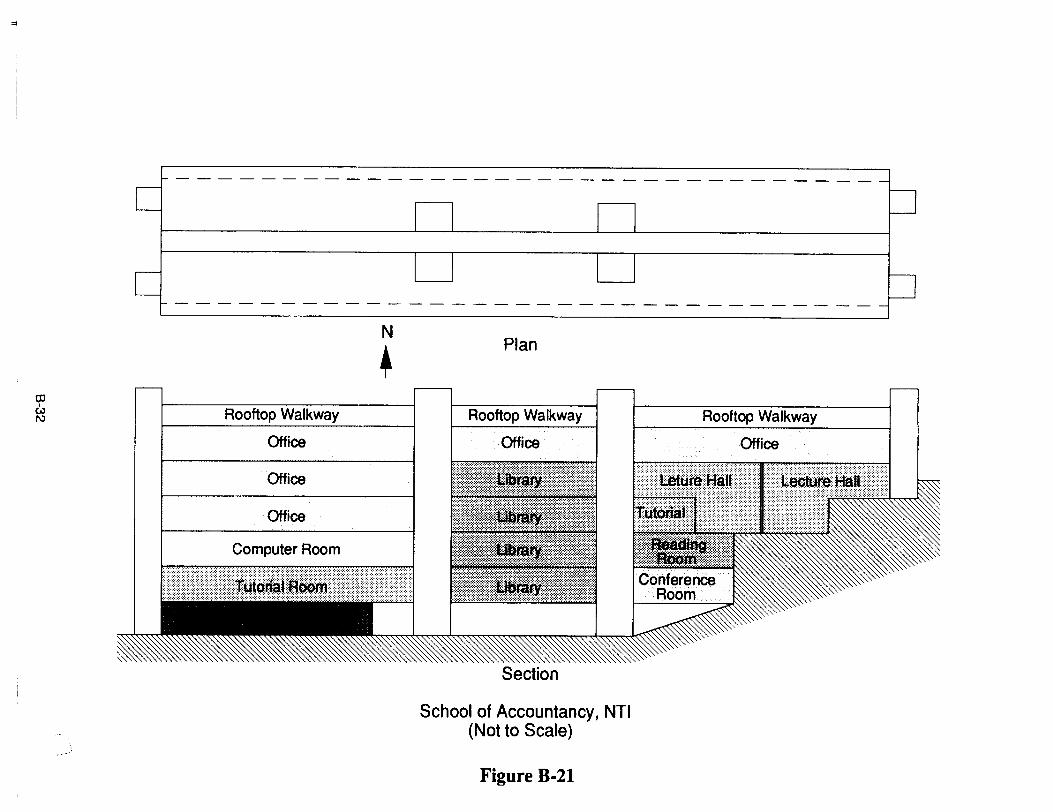
=t
OJI
UJI\) Rooftop Walkway
Office
Office
Office
Computer Room
N
+Plan
Rooftop Walkway
Office
~
Section
School of Accountancy, NTI(Not to Scale)
Figure B-21
Rooftop Walkway
Office
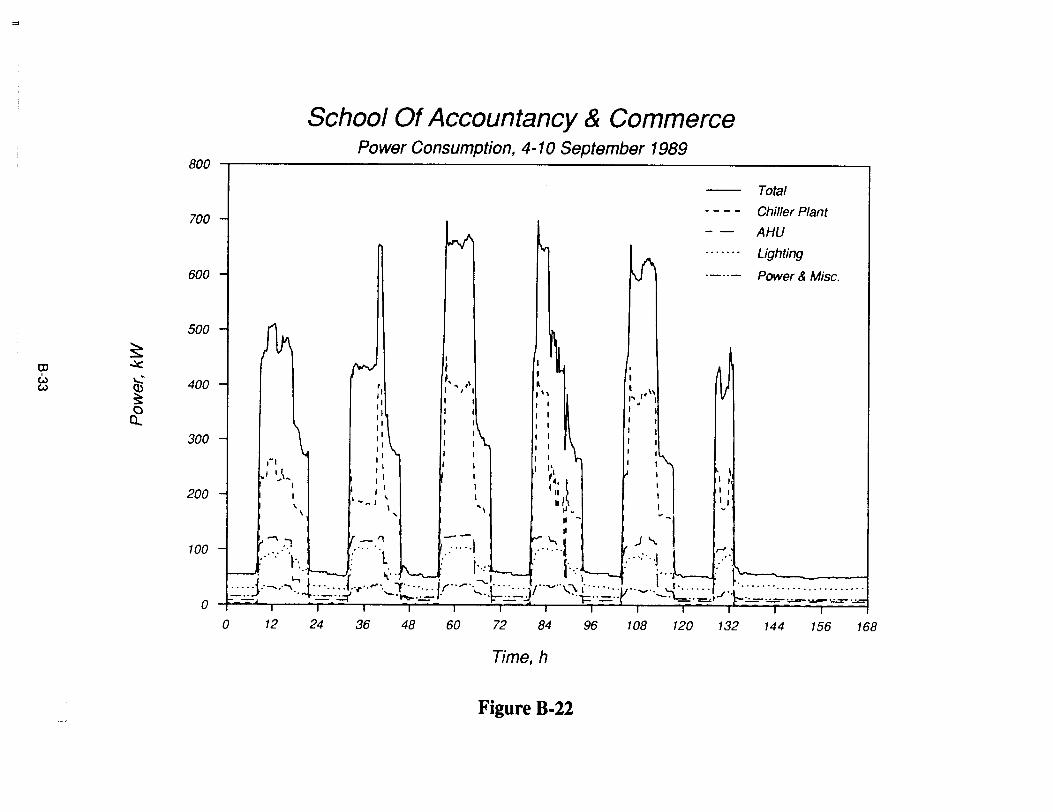
'"
School Of Accountancy &CommercePower Consumption, 4-10 September 1989
800
700 -
600 -
-- Total
-- - - Chiller Plant
- - AHUM ~
~........ Lighting.._.. - Power & Misc.
I ~I III
~II ,\,I' I 1
" II II II ,, I
I I
~ II
II
f'-'V~ I I ~.
, I 'lI, ... " RI " I"I I I IJ I I II I I II, I II I I I
- "' I I I
I I I I I I I "", I./ J\~ I I , #4. t
I , I I '11
, • - - I ' I .1
-< ~::'·)\U··"CC·O"U7:::1"U ~ru),,-·ul ~.;" }" : \. ; I·... . <-.. :' .J :' '.~ ~
f------I! .. . '. . '. • '. . .. . . . ~
....J.. -.. ..-,~ ~""" .C.·· · -y j 1' ....,. ..-:--: r""··'y. : y ...., ..1 --! t../".1························ .;:- •• J ,4..:,.=-'.:..:( '-· ~l· ..1=""".:.:....--4 '1="=" --."=.:.-.~ t-:.:.=- .. -....-- ......-~.-'=- I . i I I I f I I I I I r Io
100
500 -
400 -
200 -
300 -
S:~
"-~
~Q
Q
OJW(,..)
o 12 24 36 48 60 72 84 96 108 120 132 144 156 168
Time, h
Figure 8-22
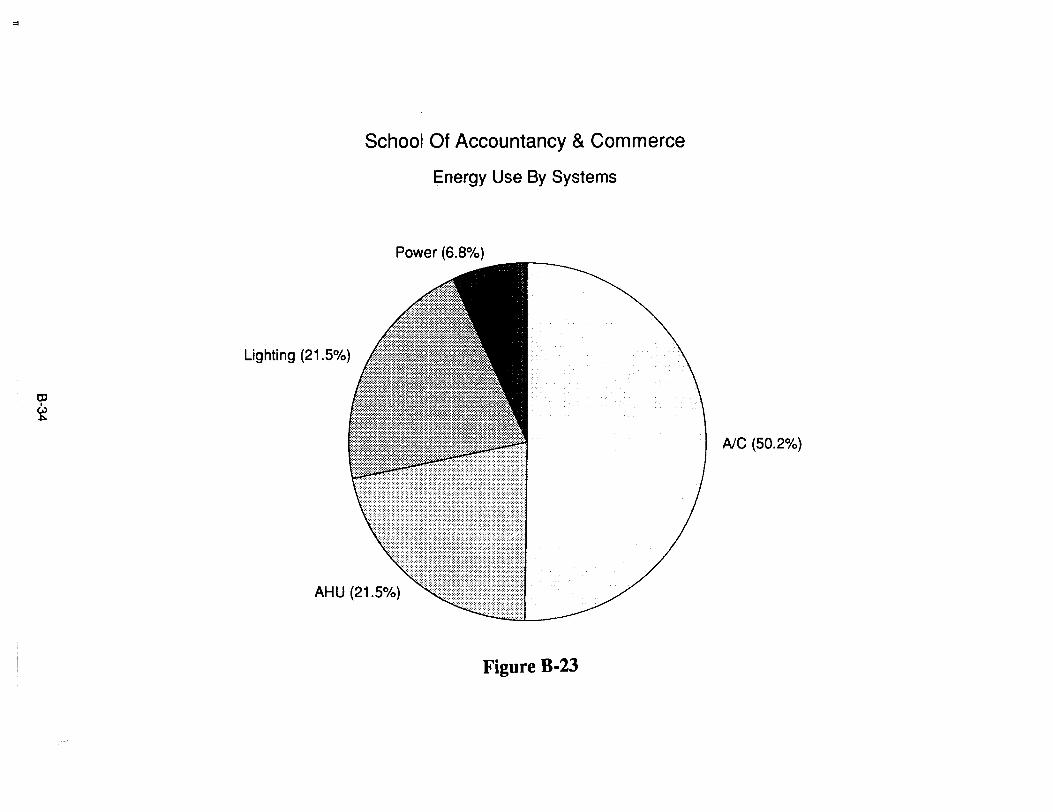
=l
OJIc.u~
School Of Accountancy & Commerce
Energy Use By Systems
Power (6.8%)
Lighting (21.5%)
AHU (21.5%)
Figure B-23
Ale (50.2%)
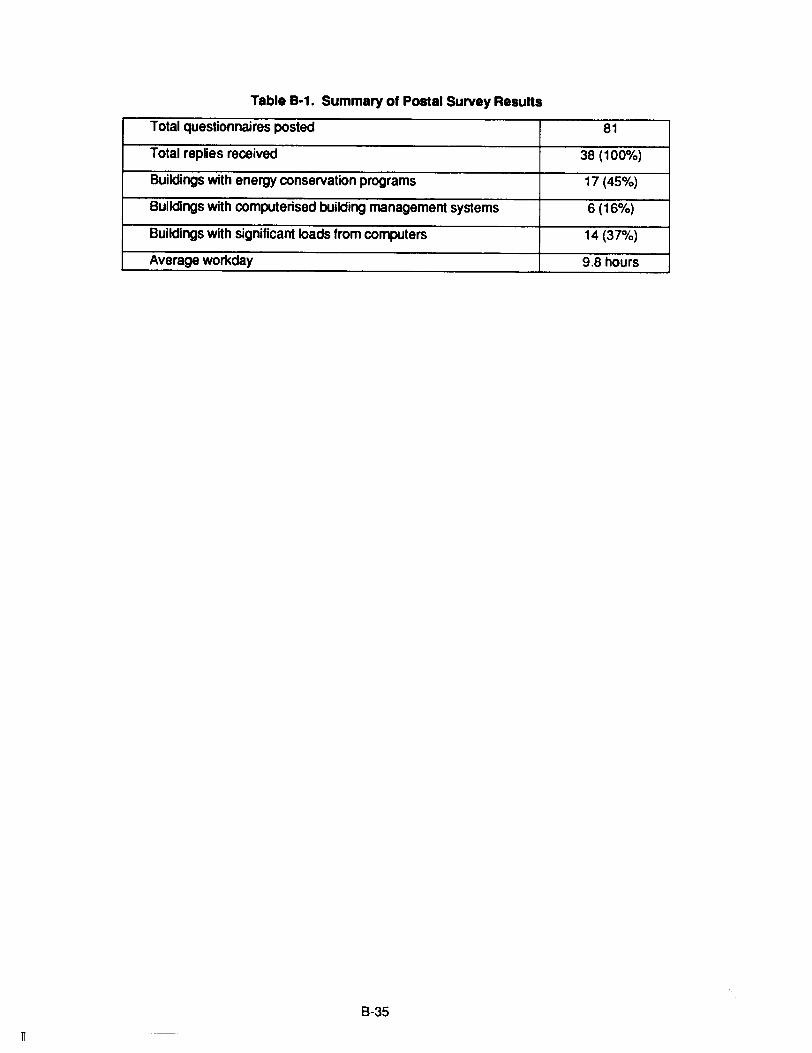
Table B-1. Summary of Postal Survey Results
Total questionnaires posted 81
Total replies received 38 (100%)
Buildings with energy conservation programs 17 (45%)
Buildings with computerised building management systems 6 (16%)
Buildings with significant loads from computers 14 (37%)
Average workday 9.8 hours
8-35
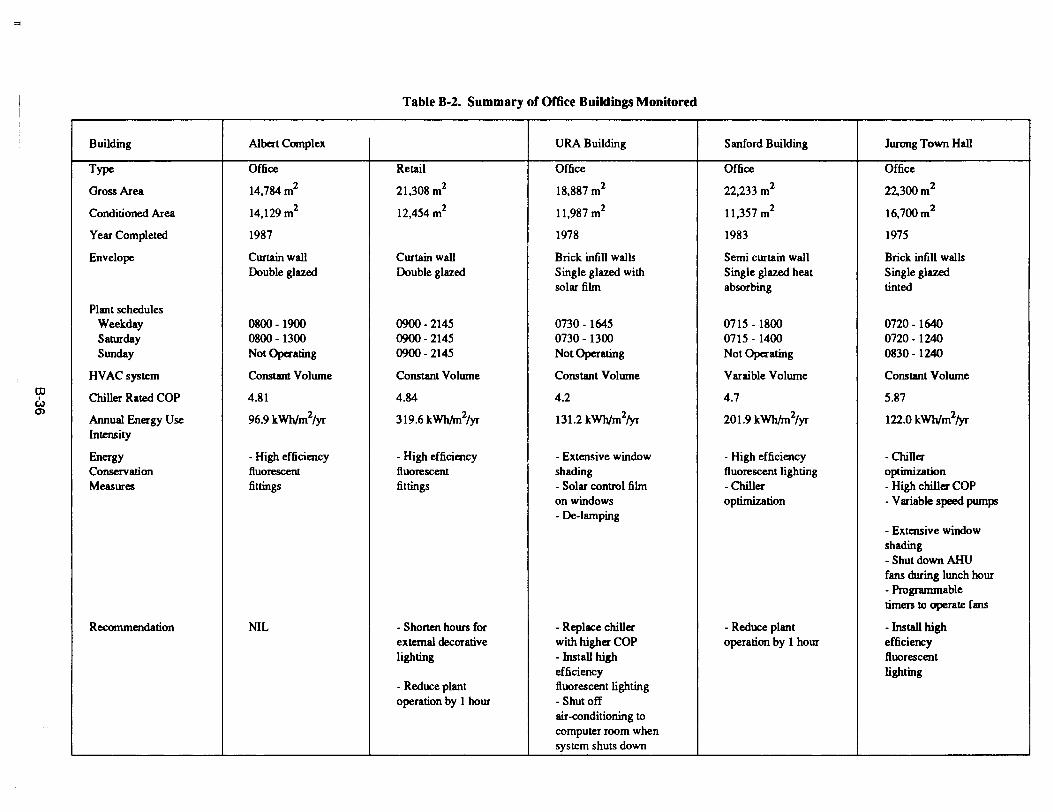
.",
Table B-2. Summary or Office Buildings Monitored
Building Albert Complex URA Building Sanford Building Jurong Town Hall
Type Office Retail Office Office Office
Gross Area 14,784m2 21.308 m2 18,887 m2 22,233 m2 22,3OOm2
Conditioned Area 14,129m2 12,454 m2 11,987 m2 11,357 m2 16,7oom2
Year Completed 1987 1978 1983 1975
Envelope Curtain wall Curtain wall Brick intill walls Semi curtain wall Brick intiU wallsDouble glazed Double glazed Single glazed with Single glazed heat Single glazed
solar film absorbing tinted
Plant schedulesWeekday 0800 - 1900 0900 - 2145 0730 -1645 0715 - 1800 0720 - 1640Saturday 0800 -1300 0900 - 2145 0730 - 1300 0715 - 1400 0720 -1240Sunday Not Operating 0900 - 2145 Not Operating Not Operating 0830 -1240
HVAC system Constant Volume Constant Volume Constant Volume Varaible Volume Constant VolumeCD
I Chiller Rated COP 4.81 4.84 4.2 4.7 5.87to>a>
96.9 kWhlm2/yr 319.6 kWh/m2/yr 131.2 kWhlm2/yr 201.9 kWh/m2/yr 122.0 kWhlm2/yrAnnual Energy UseIntensity
Energy - High efficiency - High efficiency - Extensive window - High efficiency -ChillerConservation fluoreSCenl fluoreSCenl shading fluorescent lighting optimizationMeasures fittings fittings - Solar control film - Chiller - High chiller COP
on windows optimization - Variable speed pumps- De-lamping
- Extensive windowshading- Shut down AHUfans during lunch hour- Programmabletimers to operate fans
Recommendation I NIL I - Shorten hours for - Replace chiller - Reduce plant - Install highexternal decorative with higher COP operation by 1 hour efficiencylighting - Install high fluorescent
efficiency lighting- Reduce plant
Ifluorescent lighting
operation by 1 hour - Shut offair-conditioning tocomputer room whensystem shuts down
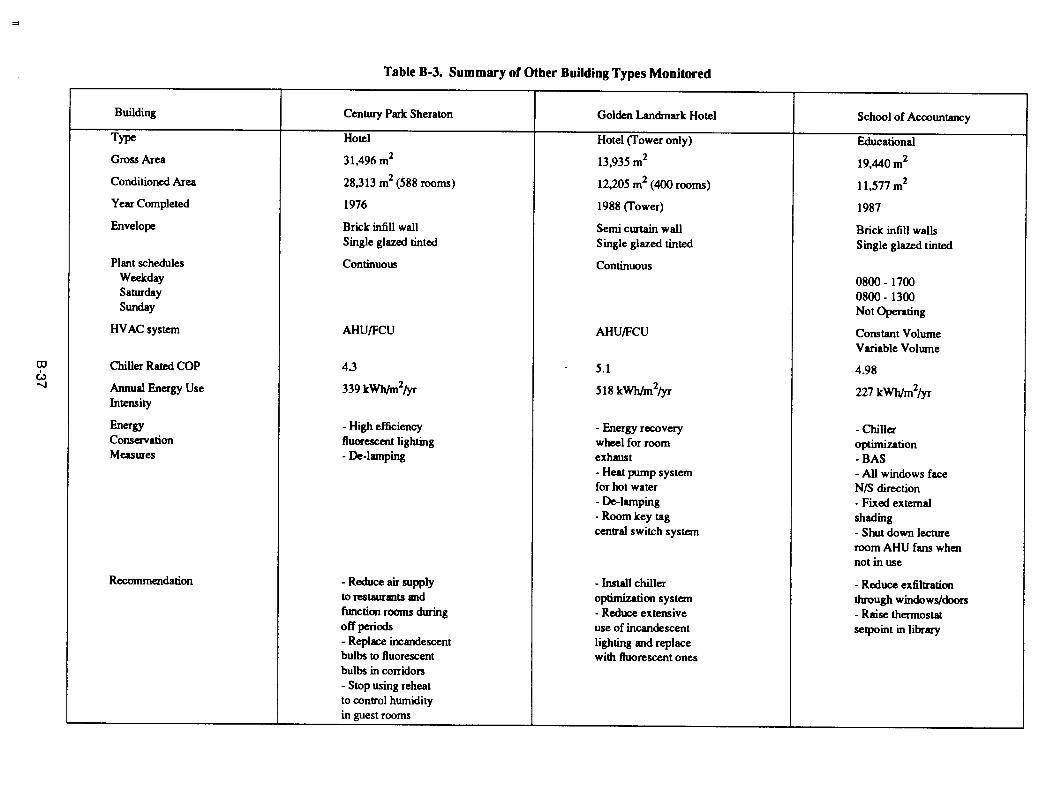
=0
OJW--.J
Table B-3. Summary of Other Building Types Monitored
Building Centwy Park Sheraton Golden Landmark Hotel School of Accountancy
Type Hotel Hotel (rower only) Educational
Gross Area 31,496 m2 13,935 m2 19,440 m2
Conditioned Area 28,313 m2 (588 rooms) 12,205 m2 (400 rooms) 11,577 m2
Year Completed 1976 1988 (rower) 1987
Envelope Brick infill wall Semi curtain wall Brick infill wallsSingle glazed tinted Single glazed tinted Single glazed tinted
Plant schedules Continuous ContinuousWeekday 0800 - 1700Saturday 0800 -1300Sunday Not Operating
HVACsystem AHU/FCU AHU/FCU Constant VolumeVariable Volume
Chiller Rated COP 43 0' 5.1 4.98
Annual Energy Use 339 kWh/m2/yr 518 kWh/m2/yr 227 kWhlm2/yrIntensity
Energy - High efficiency - Energy recovery - ChillerConservation fluorescent lighting wheel for room optimizationMeasures - De-Iamping exhaust -BAS
- Heat pump system - All windows facefor hot water NIS direction- De-Iamping - Fixed external- Room key tag shadingcentral switch system - Shut down lecture
room AHU fans whennot in use
Recommendation - Reduce air supply - Install chiller - Reduce exfiltrationto restaurants and optimization system through windows/doorsfimction rooms during - Reduce extensive - Raise thermostatoff periods use of incandescent setpoint in library- Replace incandescent lighting and replacebulbs to fluorescent with fluorescent onesbulbs in corridors- Stop using reheatto control humidityin guest rooms
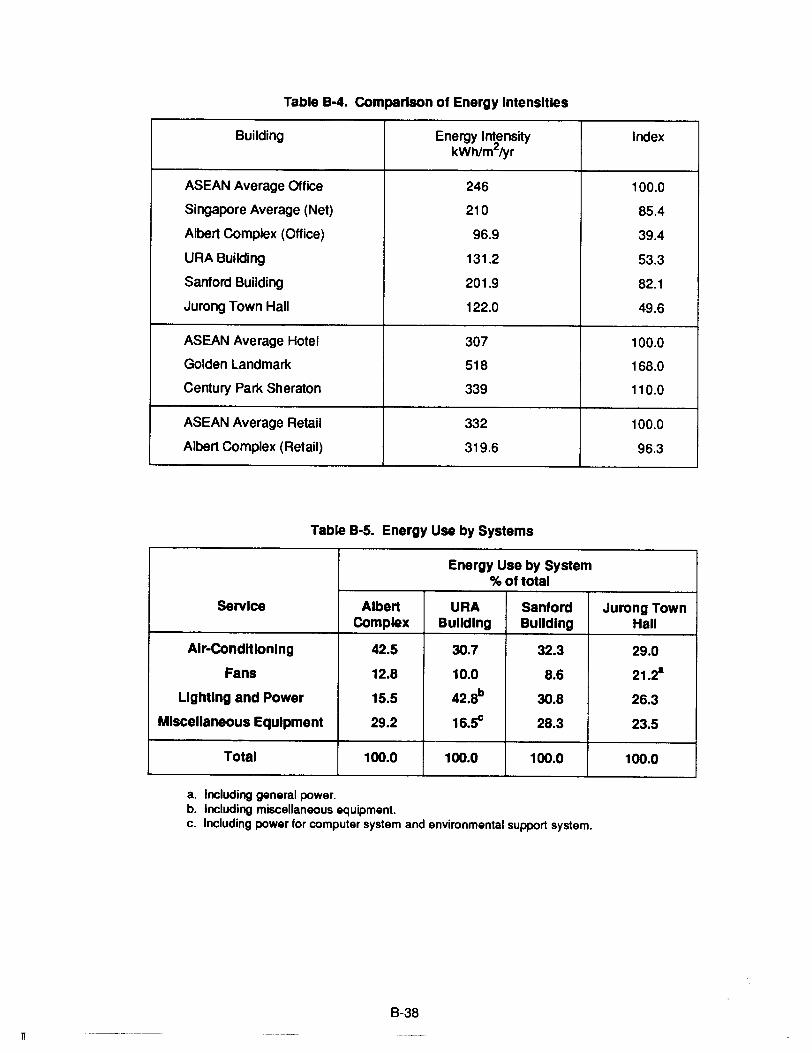
n
Table B-4. COmparison of Energy Intensities
Building Energy Intensity IndexkWhlm2lyr
ASEAN Average Office 246 100.0
Singapore Average (Net) 210 85.4
Albert Complex (Office) 96.9 39.4
URA Building 131.2 53.3
Sanford Building 201.9 82.1
Jurong Town Hall 122.0 49.6
ASEAN Average Hotel 307 100.0
Golden Landmark 518 168.0
Century Park Sheraton 339 110.0
ASEAN Average Retail 332 100.0
Albert Complex (Retail) 319.6 96.3
Table B-5. Energy Use by Systems
Energy Use by System% of total
Service Albert URA Sanford Jurong TownCOmplex Building Building Hall
Air-COnditioning 42.5 30.7 32.3 29.0
Fans 12.8 10.0 8.6 21.~
Lighting and Power 15.5 42.8b 30.8 26.3
Miscellaneous Equipment 29.2 16.SC 28.3 23.5
Total 100.0 100.0 100.0 100.0
a. Including general power.b. Including miscellaneous equipment.c. Including power for computer system and environmental support system.
B-38
I!
APPENDIX C
A SURVEY OF ENERGY USE IN COMMERCIAL BUILDINGS
INDONESIA
This report summarizes an extensive energy audit performed on five Indonesian commercialbuildings. Energy conservation opportunities are identified and potential energy savings from themare estimated.
ASEAN-USAID PROJECT ON ENERGY CONSERVATION IN BUILDINGS
PROJECT 1.2
ENERGY AUDIT SUMMARY REPORT
A SURVEY OF ENERGY USE IN COMMERCIAL BUILDINGS
Performed by:
The Surabaya Energy Audit Group
Ora. Lea Prasetio, Principal Researcher
Ir. Didiek Basuki RakhmatIr. Jimmy PriatmanIr. Nugroho Susilo
Drs. Gontjang PrajitnoDrs. Doni Djatikusumo
Drs. Eko Budi PurwantoDrs. Bagus Jaya Santosa
Dr. Ir. Mas SantosaDrs. SudirmanNining LutmiatiM. Zainul Asrori
Dino KiliaanHariyono
Tjioe Tji UekUna Tjendrawasih
Rudy Markie
December 1989
11
ACKNOWLEDGEMENT
This research work was sponsored by USAID under the ASEAN-USAID BUildings Energy Conservation Project.
We extend special thanks to the following institutions which have contributed to this project:
• The Research and Development Centre for Applied Physics - The Indonesian Institute ofSciences, for giving us the opportunity to be involved in this project.
• DITABA - Public Works Department, for its kind coordination efforts and support.
• Lawrence Berkeley Laboratory, for its helpful guidance and for sending us relevant literature.
• P.T. Sier, the Natour Simpang Hotel, the Hyatt Bumi Surabaya Hotel, the Garden PalaceHotel, and the Elmi Hotel, for their willingness to have their buildings audited.
C-1
INTRODUCTION AND SUMMARY OF RESULTS
Scope
An energy consumption audit is a study conducted to determine a building's energy consumption. This study includes energy consumption audits for five commercial buildings: one officeand four hotels.
The buildings audited were:
•••••
The Wisma Sier
The Elmi Hotel
The Garden Palace Hotel
The Hyatt Bumi Hotel
The Natour Simpang Hotel
a six-story, 8,835 m2 suburban office building
an eight-story, 11,000 m2 hotel
an eleven-story, 17,190 m2 hotel
an eleven-story, 31,079 m2 hotel
a seven-story, 6,028 m2 hotel
n
Objectives
The primary objective of this study was to gain a better understanding of energy consumption levels and energy use patterns in commercial buildings. However, the study was alsodesigned to increase our understanding of the mechanics of performing an audit and the workingsof the ASEAM-2 (A Simplified Energy Analysis Method), an energy simulation program used toanalyse a building's annual energy consumption.
Commercial buildings typically have high energy consumption, for a number of reasons.First, commercial buildings many end uses. Second, commercial bUildings are usually designedand constructed with little consideration of their energy use. And third, because building managersalways aim for high customer satisfaction, they sometimes overconsume energy, either by providing excessive cooling or lighting, or through general operating inefficiencies. The audit and retrofitchallenge, then, is to use energy more efficiently, while maintaining and even improving comfortconditions in the bUilding.
This report, which summarizes the audit findings, shows the pattern and amount of energyconsumption in the chosen commercial buildings during 1986 and 1987, the amount of energyused by the buildings' air-conditioning systems, lighting systems, elevators, and electrical equipment.
General Description of the BUildings
Table C-1 provides a brief description of the buildings audited. Detailed audits are availablethat provide more in-depth information about each building.
Summary of Results
Distribution of Types of Energy:
Table C-2 shows total kWh consumption by fuel type, and Table C-3 shows the costs ofthose different fuels. Figures C-1 a & b diagram the energy consumption per m2 of conditionedspace and per room. The prices of energy per m2 and per room are shown in Figures C-2a & b.
Only electricity consumption was analysed in the energy audits conducted. This is because,although diesel oil consumption in the buildings was sometimes quite high, it costs very little interms of rupiah. The Garden Palace is an exception, for its diesel oil consumption is extremelyhigh and the cost of the diesel oil used is significant. This is because the Garden Palace used anabsorption chiller, which accounts for its radically different energy use, as seen in Tables C-2 andC-3, and Figures C-1a & band C-2a & b.
The electrical energy consumption of the other three hotels is in the range of the electricalconsumption measured for the sample of 34 hotels surveyed throughout ASEAN (see Vol. I of thisreport, Policy, Chapter ?). >From that data base, the average of all 34 hotels surveyed was 307
C-2
kWhJm2 per year. The Elmi and Simpang are slightly higher and the Hyatt is slightly lower.
The electrical consumption of the Wisma Sier office building, at 166 kWh/m2, is lower than
the average office building consumption of 246 kWh/m2 from a similar survey of 71 ASEAN officebuildings. A likely reason is the very low installed lighting power at 10.3 W/m2
, whereas the average W/m2 for lighting in the buildings surveyed throughout ASEAN was in the range of 17 W/m2
.
Monthly Distribution of Electricity Consumption:
The distribution of electricity consumption was quite uniform from month to month, as FigureC-3 shows (the maximum deviation from the mean was only 10%).
Distribution of Electricity Consumption by Building End-Use:
Table C-4 shows, for the buildings' base case, the estimated annual electricity consumptionby end-use. Figures C-4a & b present the same information in bar graph form, allowing for easiercomparison among both buildings and end-uses.
ENERGY ANALYSIS METHODS
The Energy Audit
An energy audit, which reveals energy use patterns in a building, should identify where andhow energy waste occurs. Possible improvements to building operations, maintenance, andequipment can then be recommended.
This study chose to use the following auditing process:
• Auditing historical data.
• Conducting a walk-through survey.
• Conducting detailed investigations and analyses.
Each of these steps is briefly described below. Figure C-S shows the overall process.
The Audit of Historical Data:
Historical data was collected from electricity or other fuel bills, or, as a last resort, from therecords sometimes maintained by a bUilding's utility department. When conducting the detailedinvestigations and analyses, the data gathered served as a useful reference, since it could becompared to the computer-based simulation of the building's energy consumption per year (usingthe ASEAM-2 program).
The Walk- Through Survey:
A site survey-a fairly quick, low-cost preliminary investigation of the existing data on actualconditions in the building-was conducted after each historical audit. To make these surveysefficient, the architectural, mechanical, and electrical blueprints for the buildings were obtained.The surveys revealed obvious energy inefficiencies and highlighted priority areas for further investigation of likely inefficient or inappropriate energy systems.
Detailed Investigation and Analysis:
Finally, and most importantly, one must conduct detailed analyses of the areas identified inthe walk-through survey as inefficient. A main challenge in this part of the process is to identify allpossible candidate ECOs and to perform appropriate analysis on each one. Such analyses caninclude parametric analyses of the impacts of various potential ECOs.
The ASEAM·2 Computer Program
Most of the data collected were analysed using ASEAM-2, a simplified DOE-2 computer program most suitable for analysing simple buildings. The buildings were divided into "thermalzones," areas with similar thermal and system loads. Thermal zones were then subdivided intolighting zones.
The data were entered into ASEAM-2 for each zone and each system, as were any factorsaffecting energy consumption, (e.g., type and conditions of windows and doors, typical lighting,
C-3
people density, comings and goings out of the building). All the information allowed the computerto simulate the buildings' energy consumption under various weather conditions and schedules ofoccupancy and use. Possible ECOs identified at this time were examined.
The ASEAM-2 results were validated by comparing them to the reference data gatheredfrom the historical audit. When significant differences existed between the historical data and calculated consumptions, benchmarking was necessary; the parameters of the program wereadjusted until the two sets of data matched well. The computer-generated data was then used asthe reference or base case data in the ASEAM-2 program.
The most important application of the building analyses was allowing comparison among theefficiencies of different alternatives. An input data file for each ECO identified was created, and itspotential energy savings then determined by comparing the ECO analysis results with the basecase results. Combining the potential savings from all the ECOs gave the total potential savingsthat could be obtained in one year. Even when the base case runs were not quite in agreementwith the historical data, the estimated comparative savings from different ECOs should have beenreasonably accurate.
Energy Prices
As the data description makes clear, most of the energy used was in the form of electricity,though some non-electrical energy was used as well.
The prices of various energy forms are as follows:
Non-electrical:
• City gas• Elpiji (LPG)• Diesel Oil• Kerosene
175 Rp/litre •580 Rp/litre210 Rp/litre225 Rp/litre
II
Electrical:
• The Wisma Sier office building, in the U-3 electricity tariff group (all commercial buildings are in Group U), had a fixed tariff of 2,300 Rp/kVA, a peak load tariff from 6:00P.M. to 10:00 P.M. of 158 Rp/kWh, and an off-peak tariff of 99 Rp/kWh.
• The hotels, which belong to the 1-3 Group (which includes all industrial buildings), hadrather different tariffs: 90 Rp/kWh for the peak load and 56 Rp/kWh for the off-peakload. (See Table C-l 0 for more information).
Weather Data
Running the ASEAM-2 program requires weather and solar data. The hourly Surabayaweather data were not available, so Jakarta's 1986 weather data were obtained from Ir. Soegijanto t and was reformatted into the format required by ASEAM-2. A printout of the weather datain ASEAM-2 format can be found in Appendix 2 of the original Indonesian Project 1.2 Final Reporton auditing tasks.
ANALYSIS AND CONCLUSION
Impact of Energy Conservation Opportunities (ECOs)
Figure C-6 gives a summary of the ECOs and their potential impact on total annual energy consumption for all the bUildings audited. Table C-11, which compares the energy consumption ofthe five buildings in the study, makes analysing the data simpler. For reasons of consistency,comparative analysis was performed only on the hotels. This survey did not evaluate the cost of
• The conversion rate used. as of June, 1990, was 1,836 Indonesian Rupiah to 1 U.S. Dollar.t See Vol. III, Chapter 5. of this report for a full description of the Jakarta data.
C-4
n
implementing the various ECOs, so payback periods were not calculated.
The Wisma Sier Office Building:
Since the air-conditioning and ventilation systems accounted for 83% of the energy consumed in the building (see Table C-4), these areas provided the most likely ECOs, a hypothesisconfirmed by the analysis in this study.
The ECOs examined that had the most potential were a reduction in cooling capacity from265 to 166 TR (2.4% energy savings or a 24,564 kWh annual energy reduction) and an improvement in pump efficiency from 30 kW to 18.5 kW (a 5% or 49,920 kWh savings).
Considering that the fourth floor and some of the third floor were not being used, WismaSier's cooling capacity is larger than necessary (see Table C-5), and energy was obviouslywasted. A serious effort should be made to rent the empty space. Further, the occupants of thebuilding complained of being too cold.
Lighting and elevator ECOs were also identified and analysed. However, since these enduses accounted for only a small portion of total energy consumption, such ECOs would have arelatively small impact on total energy consumption. Table C-5 summarizes the ECOs mentionedand their potential savings.
ECOs for improving lighting systems are often very effective for office buildings. However,because the lighting installed in the Wisma Sier was already very energy-efficient at 10.3 W/m 2
,we did not identify significant lighting ECOs to be used for this building.
Likewise, we did not identify cost-effective building envelope ECOs, even though the building has 45% glass, which has a high solar heat gain load through the tinted glass and no externalshading. While external shading devices would be less effective ECOs for retrofitting, they wouldbe good strategies to incorporate into new office design.
Comparatively little could be determined about the Wisma Sier since it was the only officebuilding audited. The Wisma Sier consumed the least amount of non-electrical energy (see TableC-11), and had the highest electricity-to-total-energy-usage ratio (item M divided by P). Becausethe office is used for fewer hours per week, and possibly because the building had a large amountof unrented floor space, the total electricity costs and costs of energy-per-unit-f1oor-area were farless than those of the hotels. Consequently, the Wisma Sier had relatively high total energy costsper kWh, especially compared to the Garden Palace's (item 0).
The Hotels:
The Natour Simpang Hotel. All the hotels presented mainly housekeeping ECOs, or elseECOs which only require additional sensors to limit unnecessary operation of a system (fans, forinstance). Lighting ECOs were recommended as well. Table C-6 summarizes the ECOs for theNatour Simpang and their potential savings.
The Hyatt Bumi Hotel. Because an already energy-conscious staff runs this hotel, the ECOsrecommended mainly concerned lighting replacements (see Table C-7).
The Garden Palace Hotel. Because the Garden Palace used an absorption chiller, whichreduces electricity consumption, the electricity ECOs were limited (see Table C-8).
The Elmi Hotel. The Elmi provided a chance to audit a hotel that had been audited just ayear before, in 1987. Energy awareness among the management appeared to have improvedsince the first audit. In one policy switch, unnecessary lamps are now switched off. Anotherrecommended ECO, replacing light bulbs with ones of lower wattage, has been at least partiallyadopted. The hotel now keeps only 40 Watt and 60 Watt incandescent bulbs in its stockroom,whereas it formerly kept lots of 100 Watt bulbs. As each old bulb burns out, it is replaced by anew, more efficient one. Also, the number of bulbs in use appeared to have declined. Table C-9shows the recommended ECOs.
C-5
Observations on the Hotels
The existing total and proportional conditioned and non-conditioned areas of the differenthotels were measured and compared, as follows:
• Items A, B, C, F and H of Table C-11 show that the Hyatt and the Garden Palace had thelargest gross conditioned area. They also had more rooms than did the Elmi or the Simpang.However, the Hyatt and Garden Palace did not have the highest percentage of airconditioned spaces-29% of the total floor area in the Hyatt was not air-conditioned.
• The Hyatt and Garden Palace, despite having only slightly more rooms than the other twohotels, had floor-to-room ratios between 1.5 and 3.5 times higher than those of the Elmi andSimpang (item H).
• Although the Simpang had the smallest amount of gross and conditioned floor space (1/5 ofthe Hyatt's), it had the highest percentage of air-conditioned space.
• The Simpang's comparatively small conditioned and gross floor area per room (items G andH) is explained by its paucity of-albeit usually air-conditioned-non-bedroom spaces (e.g.,function rooms, banquet hall, restaurants, lobbies, etc.).
Our explanations for the hotels' different energy consu mption patterns follow:
• The Hyatt had the highest total energy costs per room (Item I) because it used a comparatively high percentage of its floor space for purposes other than guest rooms (shoppingarcades, a bar, a coffee shop, a restaurant, large banquet halls, a fitness centre, lobbies,and other function rooms).
• The Garden Palace had the second highest cost-per-room ratio, an expected finding sincethe hotel had the second largest total and conditioned floor space.
• Items L, M, and N show that the Garden Palace consumed the most energy (in kWh) perroom and per unit of floor area. The frequent usage of its banquet halls and other functionrooms may have been responsible, since the hotel's room occupancy rate was lower thanthe Elmi's. The Garden Palace's room occupancy rate and number of rooms occupied werestill quite high, however.
• Although the Garden Palace consumed more energy than the other hotels, (see Table C-1and preceding paragraph), most of its energy was generated from diesel oil rather than coming from the city's electricity supply. This caused the hotel's electricity consumption to berather low. The Garden Palace consumed the least electricity among these four hotels(items 0 and P), and its consumption per room was less than half of the Hyatt's.
• The Hyatt may have consumed more energy per room than the other hotels because of itshuge floor-area-to-room ratio.
• The Elmi had the highest occupancy and equivalent occupancy rates of the four hotels, making it the largest consumer of electricity per unit floor space, even though the Garden Hotelconsumed more total energy. However, since the Garden Palace owns a non-electricallypowered air-conditioning system, it did use less electricity than the Elmi and Hyatt.
Some Concluding Thoughts
One general rule of thumb for gauging energy costs is that as the ratio of air-conditioned togross floor area increases, the energy costs per unit floor area also increase.
Higher occupancy rates increased energy usage. However, data show that the cost perroom became cheaper when the occupancy rate was higher (compare the Garden to the Hyattand the Elmi to the Simpang). Even so, the cost per floor area when occupancy rates rose wasnot always lower, since the costs also depended on the activities in the non-bedroom areas.
Although the window-to-wall ratio influenced a building's energy consumption, neither thisratio nor the orientation and shading type of the windows had a major effect on overall energyconsumption. Lighting too, proved relatively unimportant. The space conditioning design proveditself the key to total consumption. Even though the Hyatt and Garden Palace had the lowest
C-6
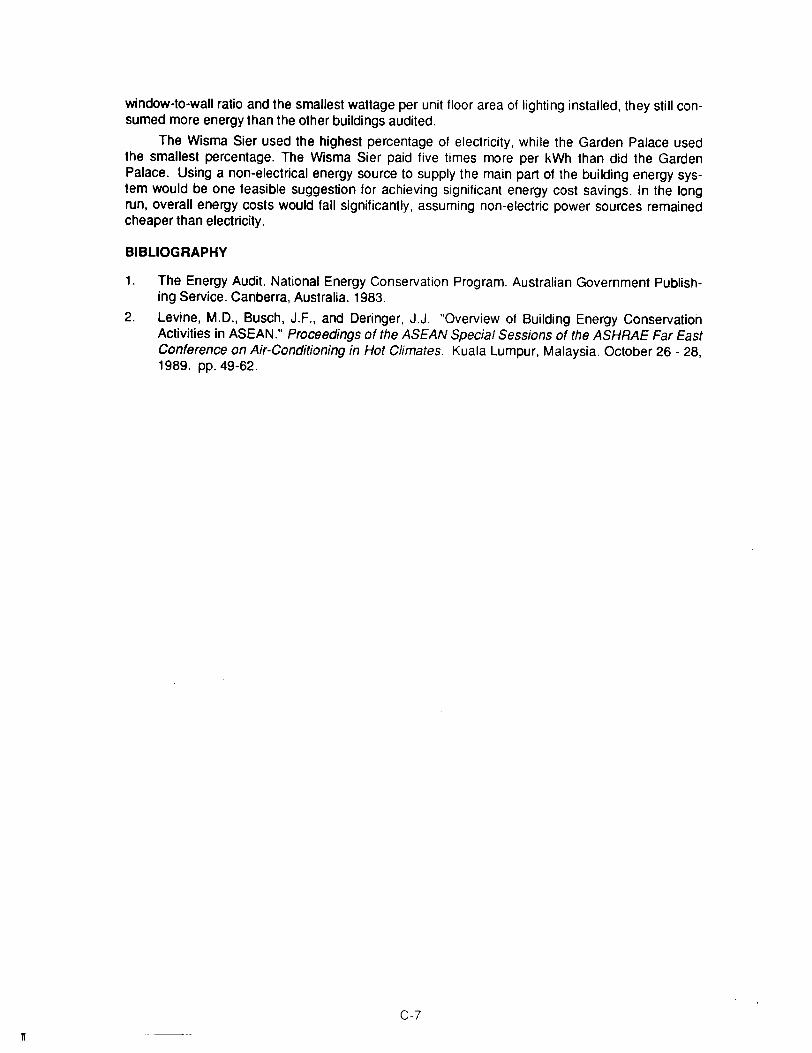
11
window-to-wall ratio and the smallest wattage per unit floor area of lighting installed, they still consumed more energy than the other buildings audited.
The Wisrna Sier used the highest percentage of electricity, while the Garden Palace usedthe smallest percentage. The Wisma Sier paid five times more per kWh than did the GardenPalace. Using a non-electrical energy source to supply the main part of the building energy system would be one feasible suggestion for achieving significant energy cost savings. In the longrun, overall energy costs would fall significantly, assuming non-electric power sources remainedcheaper than electricity.
BIBLIOGRAPHY
1. The Energy Audit. National Energy Conservation Program. Australian Government Publishing Service. Canberra, Australia. 1983.
2. Levine, M.D., Busch, J.F., and Deringer, J.J. "Overview of Building Energy ConservationActivities in ASEAN." Proceedings of the ASEAN Special Sessions of the ASHRAE Far EastConference on Air-Conditioning in Hot Climates. Kuala Lumpur, Malaysia. October 26 - 28,1989. pp.49-62.
C-?
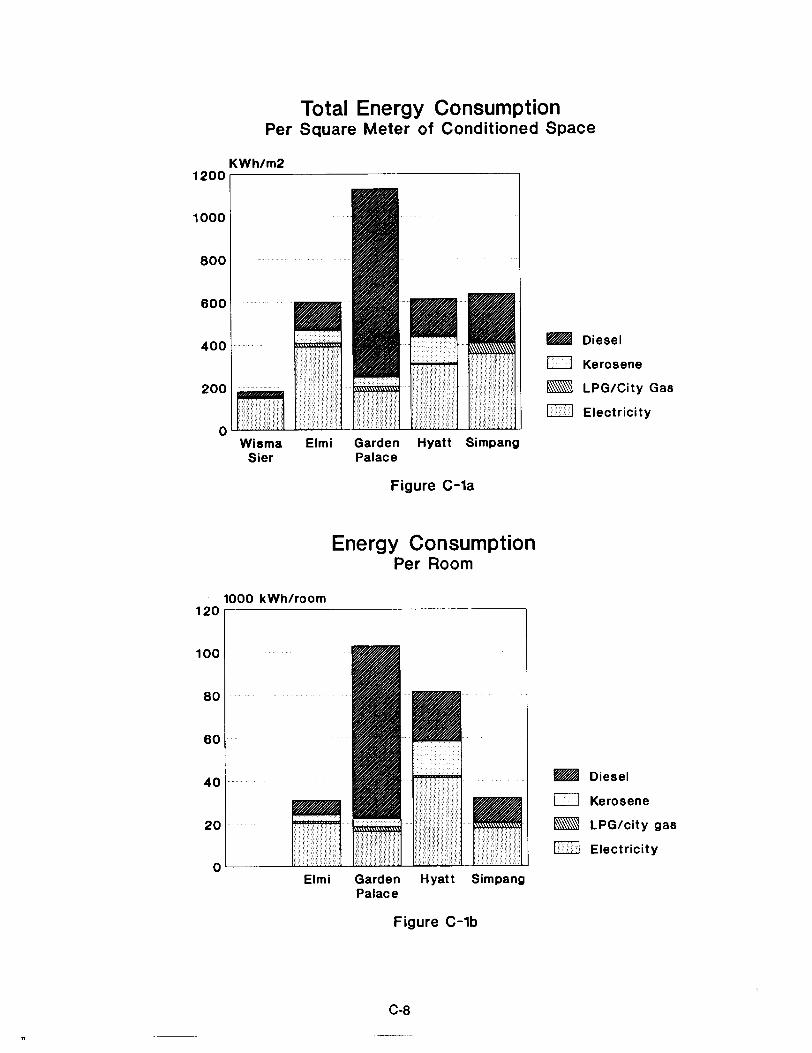
Total Energy ConsumptionPer Square Meter of Conditioned Space
_ Diesel
Idl Kerosene
_ LPG/City Gas
Electricityo
600
200
400
800
1000
KWh/m21200,..-------------------,
Wisma Elmi Garden Hyatt SimpangSier Palace
Figure C-1a
Energy ConsumptionPer Room
1000 kWh/room120,..-------------------,
100
80
60
40
20
0'-----
a Diesel
o Kerosene
_ LPG/city gas
Electricity
Elmi Garden Hyatt SimpangPalace
Figure C-1b
C-8
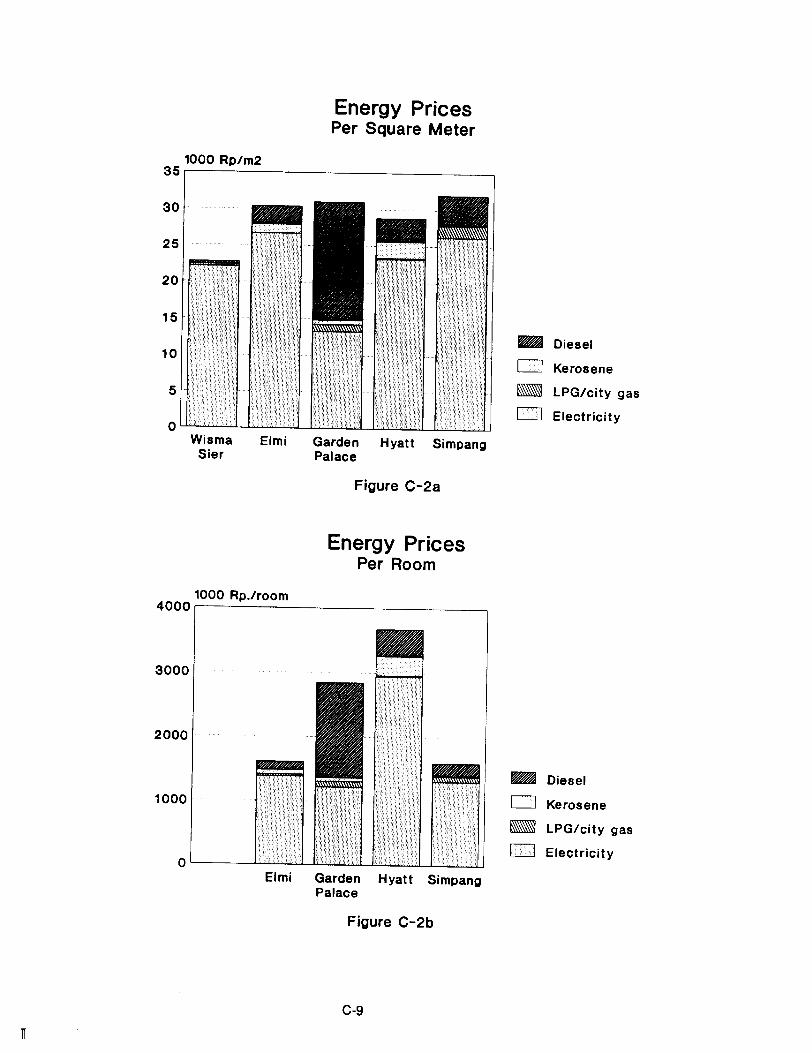
Energy PricesPer Square Meter
1000 Rp/m235~-----------------,
30
25
20
15
10
5
oWisma
SierElmi Garden Hyatt Simpang
Palace
Figure C-2a
Energy PricesPer Room
_ Diesel
1·<1 Kerosene
_ LPG/city gas
II Electricity
1000 Rp.lroom4000,.-----------------~
3000
2000
1000
O'-----...L..Elmi Garden Hyatt Simpang
Palace
Figure C-2b
C-9
_ Diesel
o Kerosene
_ LPG/city gas
Electricity
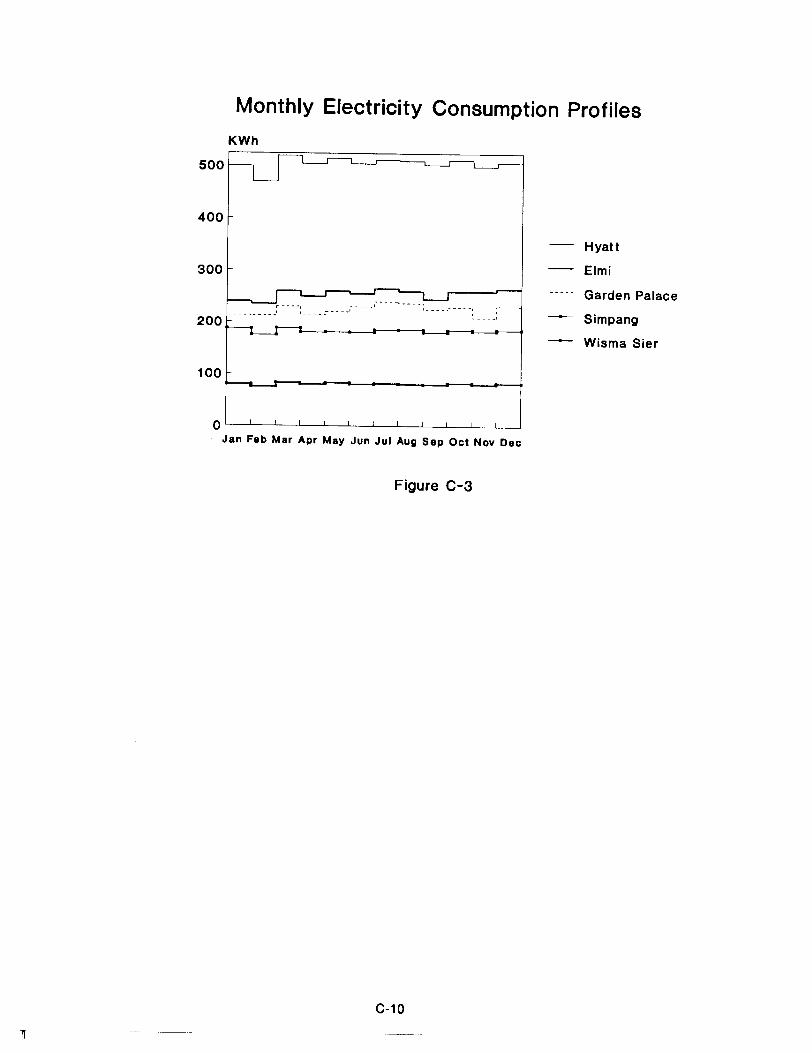
Monthly Electricity Consumption Profiles
KWh
500
11
400
300
~ f"" - - - _: • ; - - - _1- - - - -. - - - -: .- - - - -~ :
200
100~------,"----'I--------------'---"""
o '------L------L.----l_..L...--L.......-L_'----L--------L-----l_L.----!
Jan Feb Mar Apr May Jun Jul Aug Sep Oct Noy Dec
Figure C-3
C-10
Hyatt
Elm;
Garden Palace
Simpang
Wisma Sier
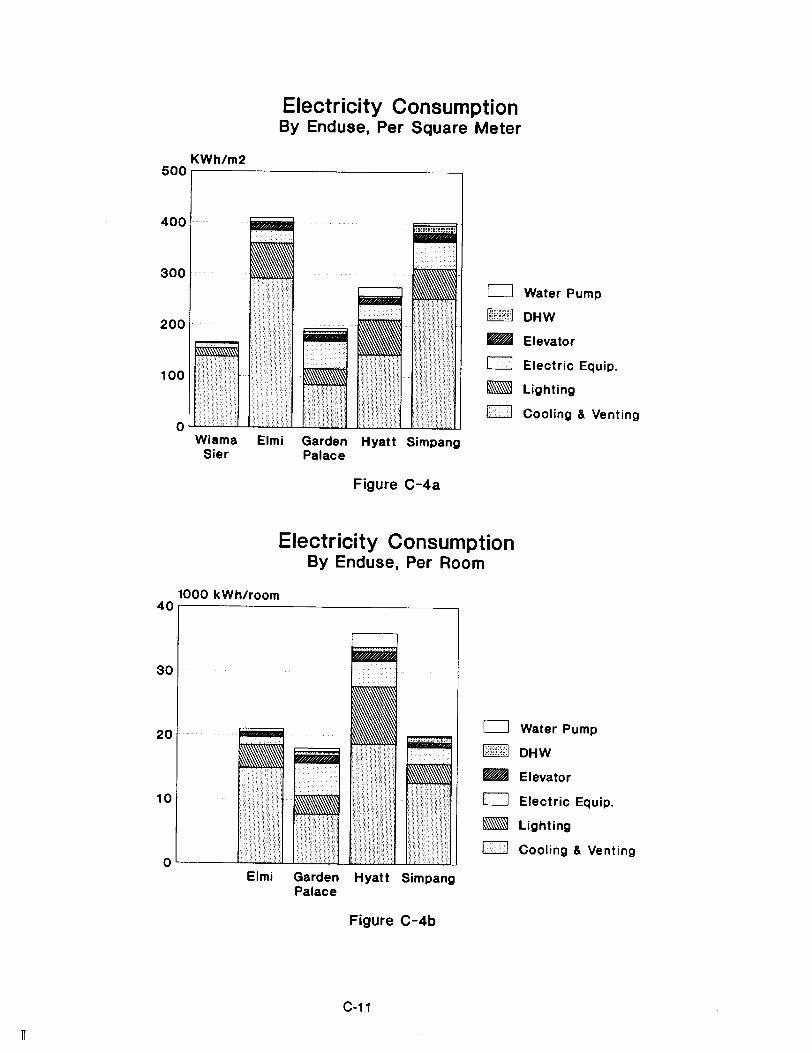
Electricity ConsumptionBy Enduse, Per Square Meter
o Water Pump
l~i1gj11'1 DHW
_ Elevator
o Electric Equip.
_ Lighting
Cooling & Venting
Wisma Elmi Garden Hyatt SimpangSier Palace
o
100
400
200
KWh/m2500,.-----------------,
300
Figure C-4a
Electricity ConsumptionBy Enduse, Per Room
o Water Pump
mijj'.]!;1 DHW
_ Elevator
o Electric Equip.
_ Lighting
I/il Cooling & Venting
Elmi Garden Hyatt SimpangPalace
0'----
10
20
1000 kWh/room40,.------------------,
30
Figure C-4b
C-11
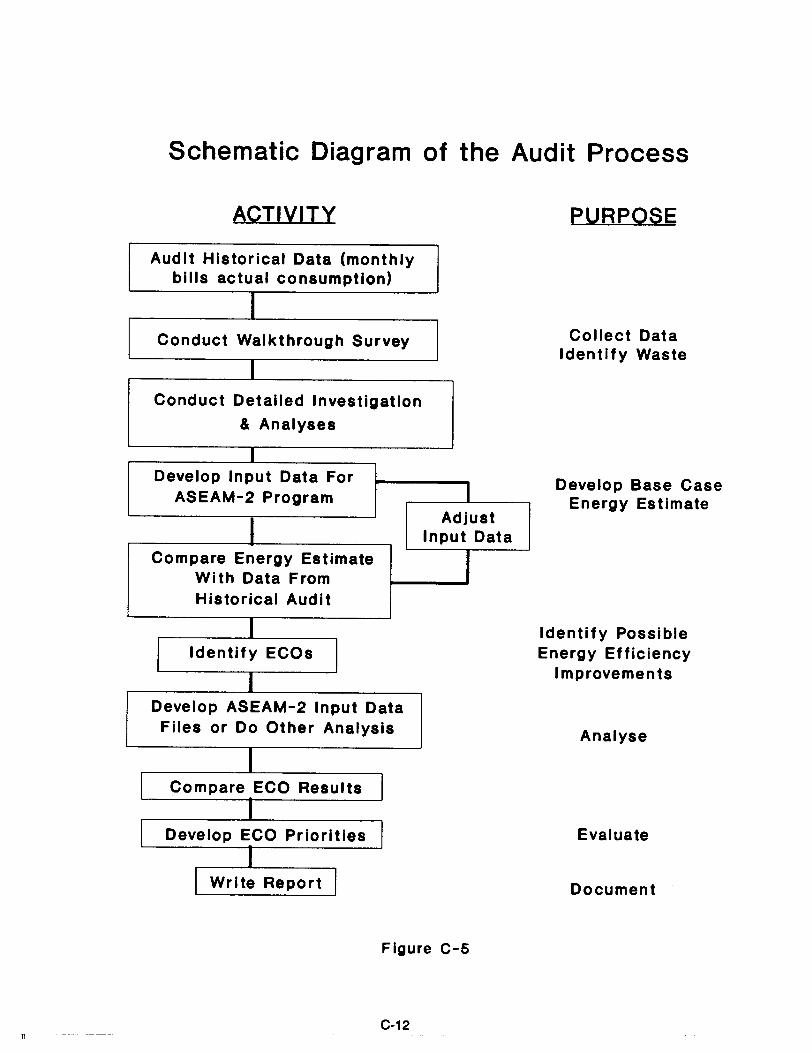
Schematic Diagram of the Audit Process
Audit Historical Data (monthlybills actual consumption)
IConduct Walkthrough Survey
IConduct Detailed Investigation
& Analyses
IDevelop Input Data For
ASEAM-2 Program IAdjust
I Input DataCompare Energy Estimate IWith Data From
Historical Audit
II Identify ECOs I
IDevelop ASEAM-2 Input DataFiles or Do Other Analysis
II Compare ECO Results I
II Develop ECO Priorities I
II Write Report I
PURPOSE
Collect DataIdentify Waste
Develop Base CaseEnergy Estimate
Identify PossibleEnergy Efficiency
Improvements
Analyse
Evaluate
Document
If
Figure C-5
C-12
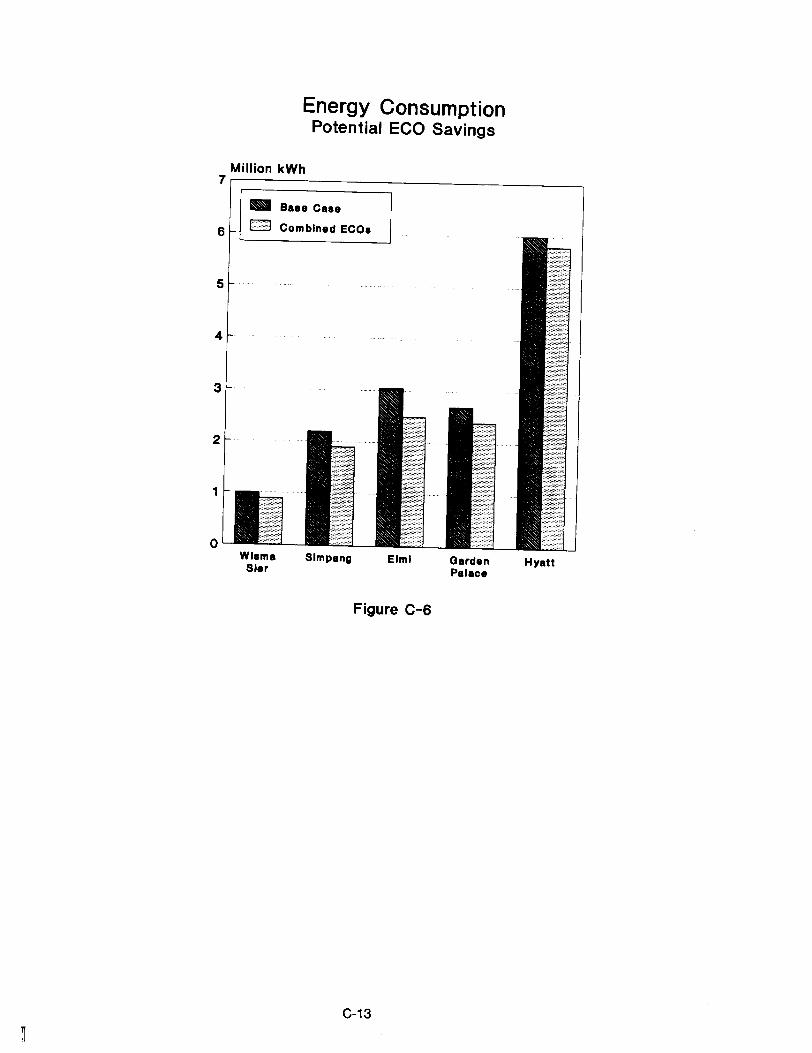
Energy ConsumptionPotential ECO Savings
Million kWh7~-------------------'
_ Sa.e Ca.e
h/r/I Combined ECO.6
5
4
3
2
1
oWI.ma
SlerSimpang Elml aarden
PalaceHyatt
Figure C-6
C-13
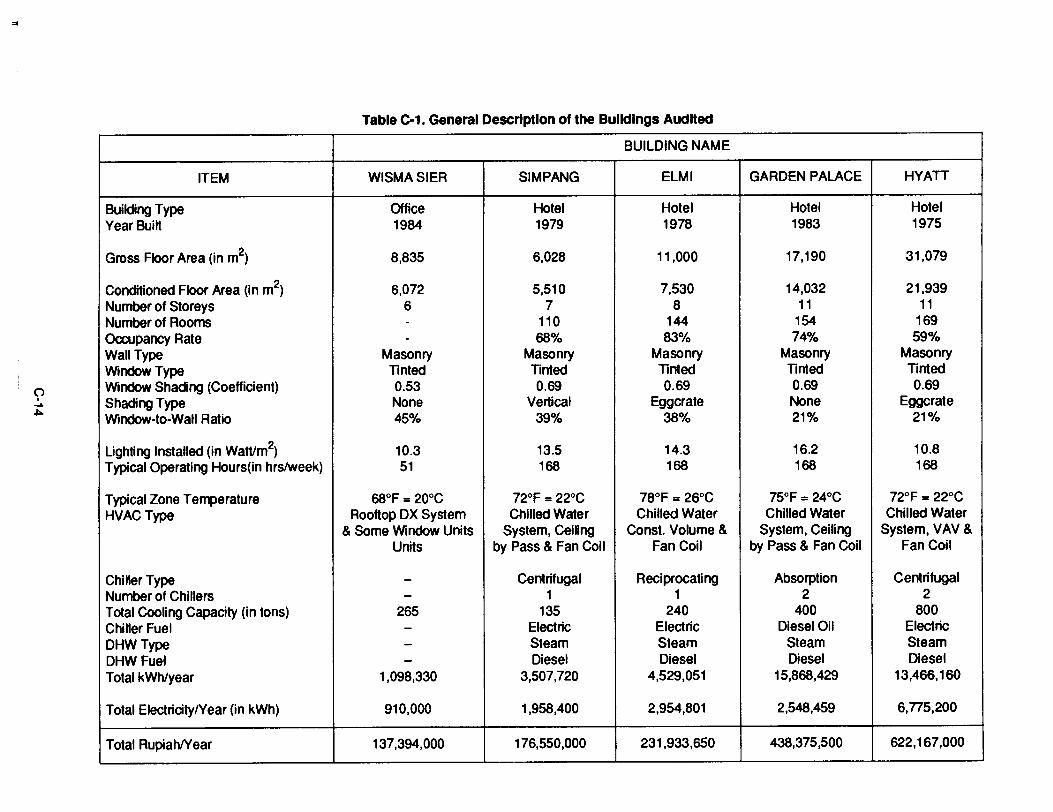
i
()I
...A
~
Table c-1. General Description of the BUildings Audited
BUILDING NAME
ITEM WISMASIER SIMPANG ELMI GARDEN PALACE HYATT
Building Type Office Hotel Hotel Hotel HotelYear Built 1984 1979 1978 1983 1975
Gross Floor Area (in m2) 8,835 6,028 11,000 17,190 31,079
Conditioned Floor Area (in m2) 6,072 5,510 7,530 14,032 21,939
Number of Storeys 6 7 8 11 11Number of Rooms - 110 144 154 169OCCUpancy Rate - 68% 83% 74% 59%Wall Type Masonry Masonry Masonry Masonry MasonryWindow Type Tinted Tinted linted Tinted lintedWindow Shading (Coefficient) 0.53 0.69 0.69 0.69 0.69Shading Type None Vertical Eggcrate None EggcrateWindow-to-Wall Ratio 45% 39% 38% 21% 21%
Lighting Installed (in Watt/m2) 10.3 13.5 14.3 16.2 10.8Typical Operating Hours(in hrsJweek) 51 168 168 168 168
Typical Zone Temperature 68°F =20°C 72°F =22°C 78°F =26°C 75°F =24°C 72°F =22°CHVAC Type Rooftop DX System Chilled Water Chilled Water Chilled Water Chilled Water
& Some Window Units System, Ceiling Const. Volume & System, Ceiling System, VAV &Units by Pass & Fan Coil Fan Coil by Pass & Fan Coil Fan Coil
Chiller Type - Centrifugal Reciprocating Absorption CentrifugalNumber of Chillers - 1 1 2 2Total Cooling Capacity (in tons) 265 135 240 400 800Chiller Fuel - Electric Electric Diesel Oil ElectricDHWType - Steam Steam Steam SteamDHW Fuel - Diesel Diesel Diesel DieselTotal kWh/year 1,098,330 3,507,720 4,529,051 15,868,429 13,466,160
Total ElectricitylYear (in kWh) 910,000 1,958,400 2,954,801 2,548,459 6,n5,200
Total RupiahlYear 137,394,000 176,550,000 231,933,650 438,375,500 622,167,000
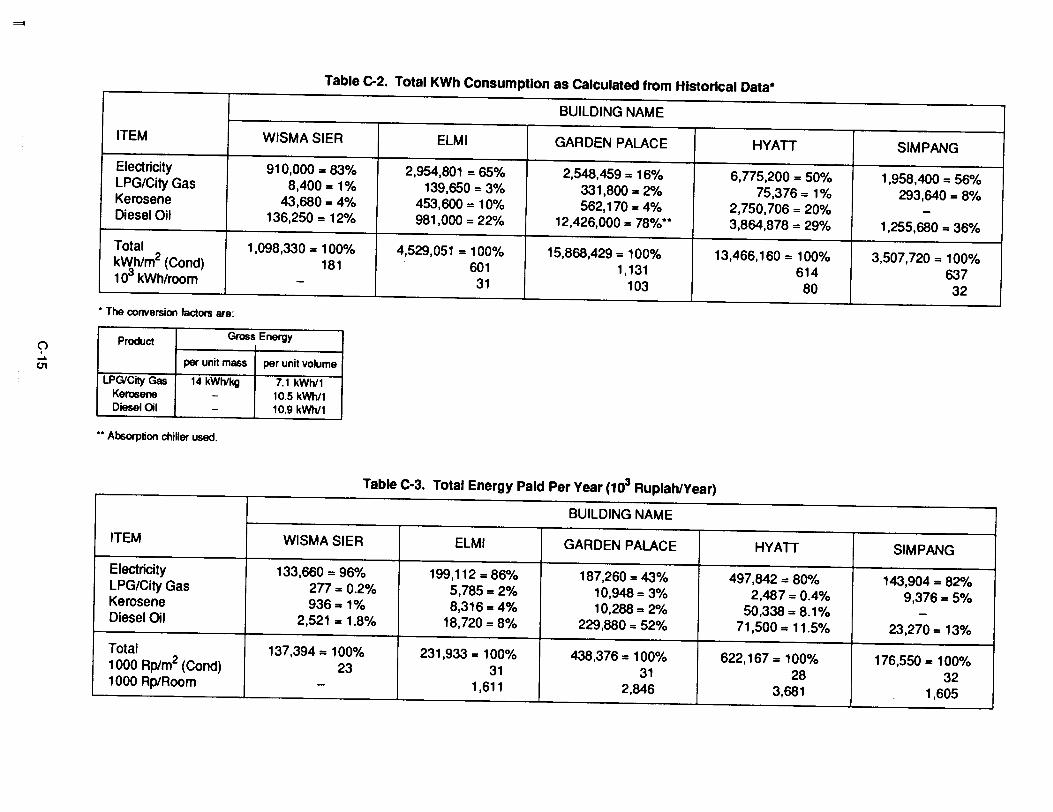
"",.
oI.....
U1
Table c-2. Total KWh Consumption as calculated from Historical Data*
BUILDING NAME
ITEM WISMASIER ELMI GARDEN PALACE HYATI SIMPANG
Electricity 910,000 = 83% 2,954,801 = 65% 2,548,459 = 16% 6,775,200 = 50% 1,958,400 = 5SOioLPG/City Gas 8,400 = 1% 139,650 = 3% 331,800 = 2% 75,376 = 1% 293,640 =8%Kerosene 43,680= 4% 453,600 = 10% 562,170 = 4% 2,750,706 = 20% -Diesel Oil 136,250 = 12% 981,000 = 22% 12,426,000 = 78%** 3,864,878 = 29% 1,255,680 = 36%
Total 1,098,330 = 100% 4,529,051 = 100% 15,868,429 = 100% 13,466,160 = 100% 3,507,720 = 100%kWhlm2 (Cond) 181 601 1,131 614 637103 kWh/room - 31 103 80 32
• The conversion factors are:
ProductGross Energy
per unit mass per unit volume
LPG/City Gas 14 kWh/kg 7.1 kWh/lKerosene - 10.5 kWh/lDiesel Oil - 10.9 kWh/l
•• Absorption chiller used.
Table C-3. Total Energy Paid Per Year (103 Rupiah/Year)
BUILDING NAME
ITEM WISMASIER ELMI GARDEN PALACE HYATI SIMPANG
Electricity 133,660 = 96% 199,112=8SO/o 187,260 = 43% 497,842 = 80% 143,904 = 82%LPG/City Gas 277=0.2% 5,785= 2% 10,948= 3% 2,487= 0.4% 9,376=5%Kerosene 936 = 1% 8,316 = 4% 10,288= 2% 50,338 = 8.1% -Diesel Oil 2,521 = 1.8% 18,720 = 8% 229,880 = 52% 71,500 = 11 .5% 23,270 = 13%
Total 137,394 = 100% 231,933 = 100% 438,376 = 100% 622,167 = 100% 176,550 = 100%1000 Rplm2 (Cond) 23 31 31 28 321000 RplRoom - 1,611 2,846 3,681 1,605
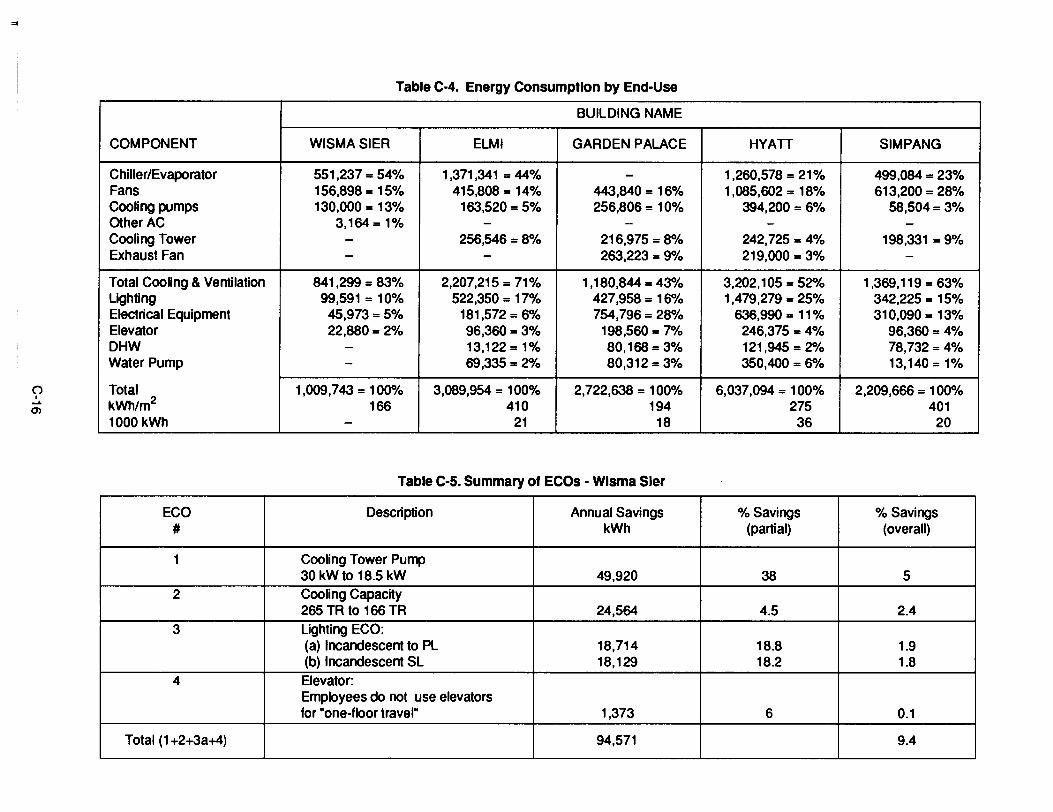
"'l
()I.....
m
Table C-4. Energy Consumption by End-Use
BUILDING NAME
COMPONENT WISMASIER ELMI GARDEN PALACE HYAIT SIMPANG
Chiller/Evaporator 551,237 = 54% 1,371 ,341 = 44% - 1,260,578 = 21% 499,084 .. 23%Fans 156,898 = 15% 415,808 = 14% 443,840 = 16% 1,085,602 = 18% 613,200 = 28%Cooling pumps 130,000 = 13% 163,520 = 5% 256,806 = 10% 394,200 = 6% 58,504=3%Other AC 3,164= 1% - - - -Cooling Tower - 256,546=8% 216,975 = 8% 242,725 = 4% 198,331 = 9%Exhaust Fan - - 263,223 = 9% 219,000 = 3% -
Total CooHng & Ventilation 841,299 = 83% 2,207,215 = 71% 1,180,844 - 43% 3,202,105 = 52% 1,369,119 = 63%Lighting 99,591 = 10% 522,350 = 17% 427,958 = 16% 1,479,279 = 25% 342,225 = 15%Electrical Equipment 45,973= 5% 181,572 = 6% 754,796 = 28% 636,990 = 11% 310,090 = 13%Elevator 22,880= 2% 96,360= 3% 198,560 = 7% 246,375 = 4% 96,360=4%DHW - 13,122 = 1% 80,168 = 3% 121,945 = 2% 78,732= 4%Water Pump - 69,335 = 2% 80,312 = 3% 350,400 = 6% 13,140 = 1%
Total 1,009,743 = 100% 3,089,954 = 100% 2,722,638 = 100% 6,037,094 = 100% 2,209,666 = 100%kWh/m2 166 410 194 275 4011000 kWh - 21 18 36 20
Table C-S. Summary of ECOs - Wisma Sier
ECO Description Annual Savings % Savings % Savings# kWh (partial) (overall)
1 Cooling Tower Pump30 kW to 18.5 kW 49,920 38 5
2 Cooling Capacity265 TR to 166 TR 24,564 4.5 2.4
3 Lighting ECO:(a) Incandescent to PL 18,714 18.8 1.9(b) Incandescent SL 18,129 18.2 1.8
4 Elevator:Employees do not use elevatorsfor "one-floor travel" 1,373 6 0.1
Total (1 +2+3a+4) 94,571 9.4
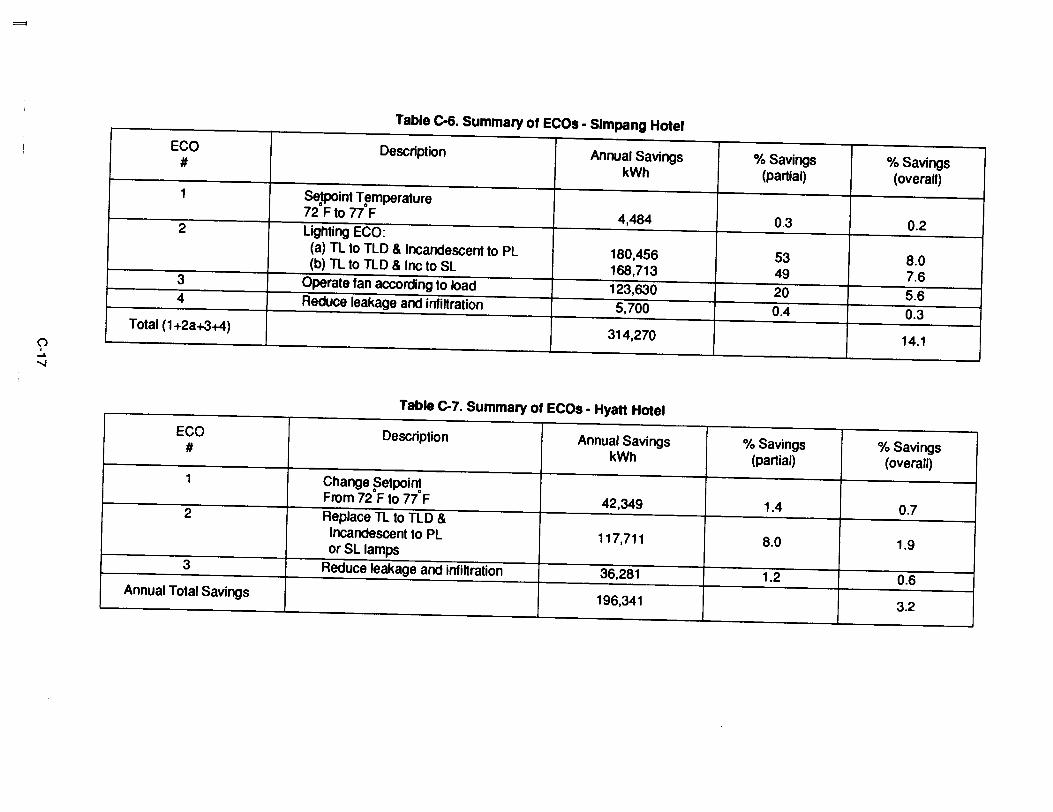
=
(),..........,
Table c-6. Summary of ECOs • Simpang Hotel
ECO Description Annual Savings 0/0 Savings 0/0 Savings#kWh (partial) (overall)
1 Setpoint Temperature• •72 Fto n F 4,484 0.3 0.22 lighting ECO:(a) TL to TLD & Incandescent to PL 180,456 53 8.0(b) TL to TLD & Inc to SL 168,713 49 7.63 Operate fan according to load 123,630 20 5.64 Reduce leakage and infiltration 5,700 0.4 0.3
Total (1 +2a+3+4) 314,270 14.1
Table c-7. Summary of ECOs • Hyatt Hotel
ECO Description Annual Savings % Savings % Savings# kWh (partial) (overall)1 Change Setpoint• •From 72 F to n F 42,349 1.4 0.72 Replace TL to TLD &
Incandescent to PL 117,711 8.0 1.9orSL lamps3 Reduce leakage and infiltration 36,281 1.2 0.6
Annual Total Savings 196,341 3.2
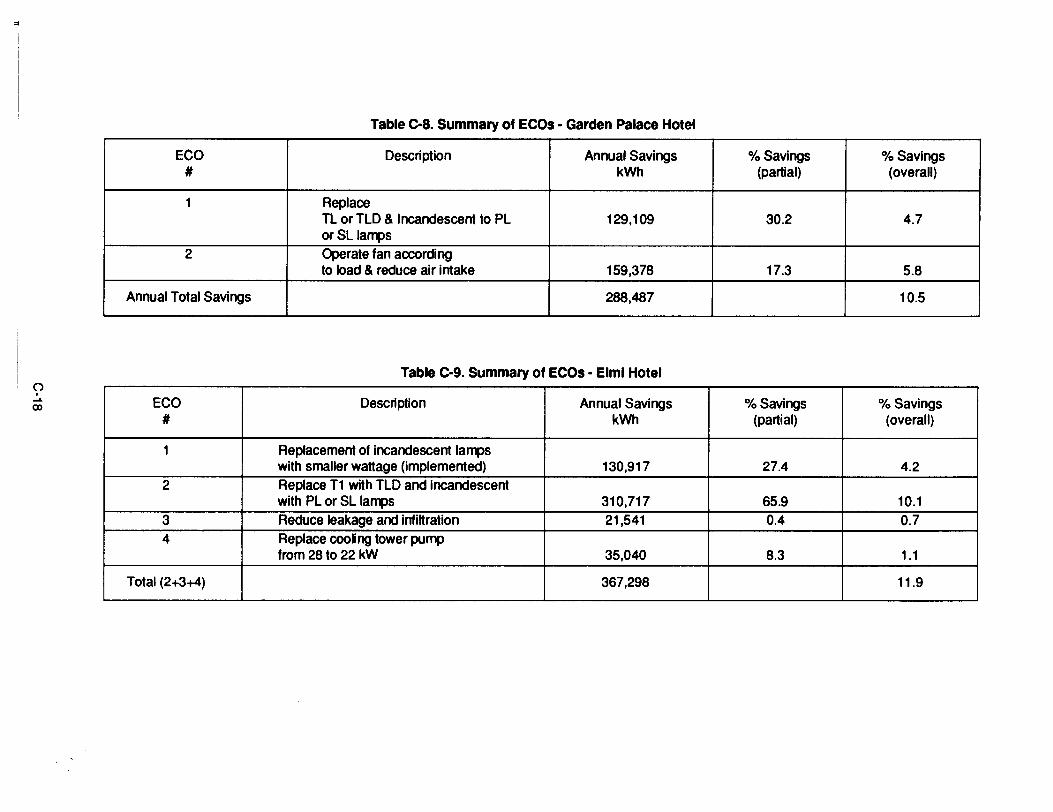
'"
(')I...
00
Table ~8. Summary of ECOs • Garden Palace Hotel
ECO Description Annual Savings % Savings % Savings# kWh (partial) (overall)
1 ReplaceTL or TLD & Incandescent to PL 129,109 30.2 4.7orSL lamps
2 Operate fan accordingto load & reduce air intake 159,378 17.3 5.8
Annual Total Savings 288,487 10.5
Table ~9. Summary of ECOs • Elml Hotel
ECO Description Annual Savings % Savings % Savings# kWh (partial) (overall)
1 Replacement of incandescent lampswith smaller wattage (implemented) 130,917 27.4 4.2
2 Replace T1 with TLD and incandescentwith PL or SL lamps 310,717 65.9 10.1
3 Reduce leakage and infiltration 21,541 0.4 0.74 Replace cooUng tower pump
from 28 to 22 kW 35,040 8.3 1.1
Total (2+3+4) 367,298 11.9
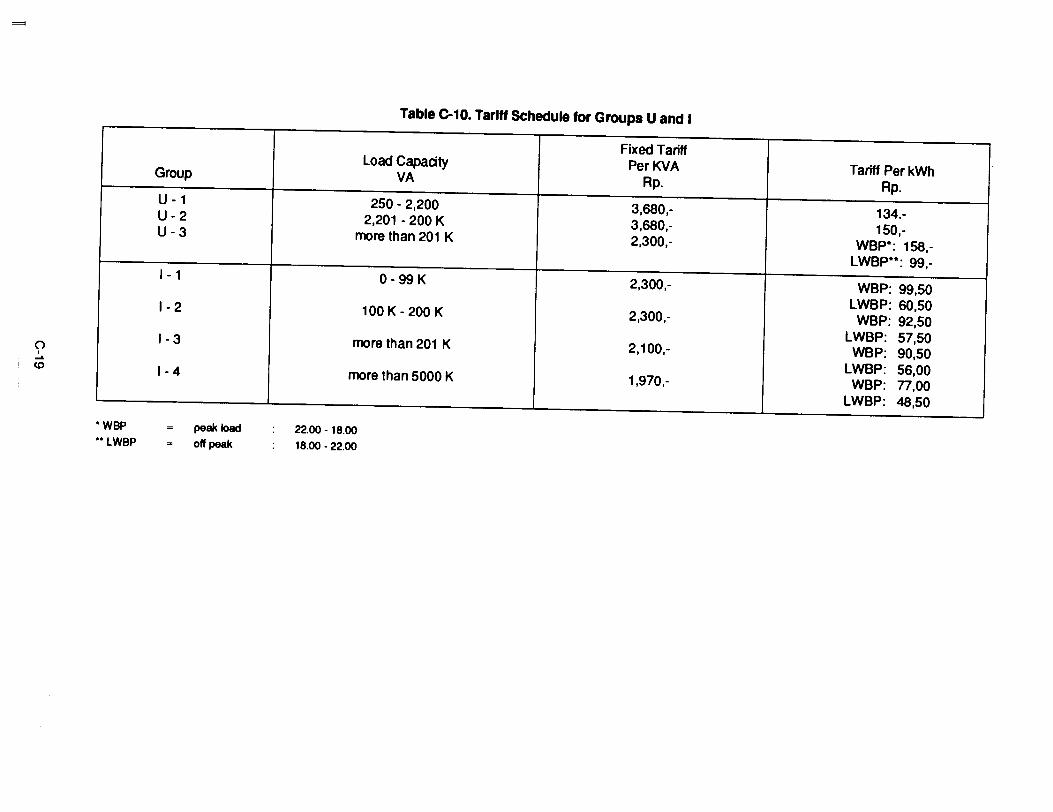
=
(),...<0
Table e-10. Tariff Schedule for Groups U and I
Fixed TariffLoad Capacity PerKVA Tariff Per kWhGroup VA Rp. Rp.
U - 1 250 - 2,200 3,680,- 134.-U-2 2,201 - 200 K 3,680,- 150,·U-3 more than 201 K 2,300,- WBP*: 158,-LWBP**: 99,-
1- 1 0- 99 K 2,300,- WBP: 99,50LWBP: 60,501- 2 100 K· 200 K 2,300,- WBP: 92,50
LWBP: 57,501- 3 more than 201 K 2,100,· WBP: 90,50LWBP: 56,001- 4 more than 5000 K 1,970,- WBP: n,ooLWBP: 48,50
·WBP•• LWBP
peak loadoff peak
22.00 - 18.00
18.00 - 22.00
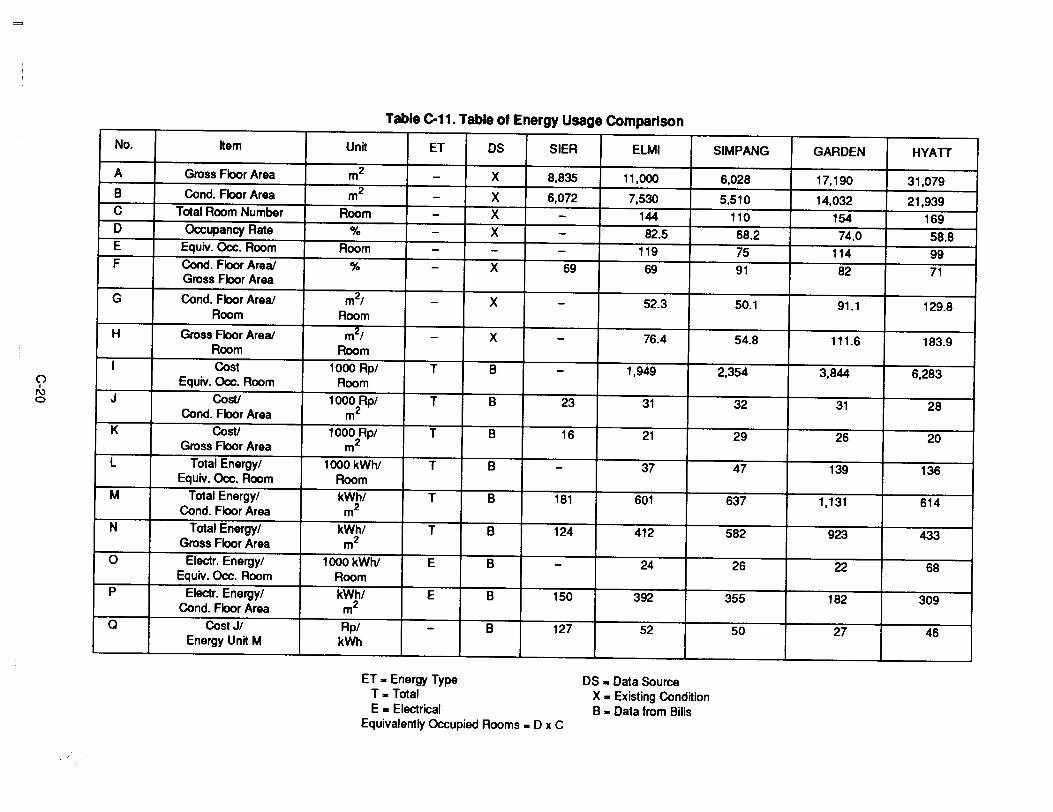
=
(")I
I\)o
Table C11. Table of Energy Usage Comparison
No. hem Unit ET OS SIER ELMI SIMPANG GARDEN HYAIT
A Gross Floor Area m2 - X 8,835 11,000 6,028 17,190 31,079
B Cond. Floor Area m2 - X 6,072 7,530 5,510 14,032 21,939C Total Room Number Room - X - 144 110 154 169
0 Occupancy Rate % - X - 82.5 68.2 74.0 58.8E Equiv. Occ. Room Room - - - 119 75 114 99
F Cond. Floor Areal % - X 69 69 91 82 71Gross Floor Area
G Cond. Floor Areal m21 - X - 52.3 50.1 91.1 129.8Room Room
H Gross Floor Areal m21 - X - 76.4 54.8 111.6 183.9Room Room
I Cost 1000 Rpl T B - 1,949 2,354 3,844 6,283Equiv. Occ. Room Room
J Cost! 1000 Rpl T B 23 31 32 31 28Cond. Floor Area m2
K Cost! 1000 Rpl T B 16 21 29 26 20Gross Floor Area m2
L Total Energyl 1000 kWh! T B - 37 47 139 136Equiv. Occ. Room Room
M Total Energyl kWhl T B 181 601 637 1,131 614Cond. Floor Area m2
N Total Energyl kWhl T B 124 412 582 923 433Gross Floor Area m2
0 Electr. Energyl 1000 kWh! E B - 24 26 22 68Equiv.Occ.Room Room
p Electr. Energyl kWhl E B 150 392 355 182 309Cond. Floor Area m2
a CostJI Rpl - B 127 52 50 27 46Energy Unit M kWh
ET .. Energy TypeT .. TotalE .. Electrical
Equivalently Occupied Rooms .. D x C
OS .. Data SourceX • Existing ConditionB .. Data from Bills
n
APPENDIX D
OFFICE BUILDING
AUDIT REPORT
THE PHILIPPINES
This report is one of approximately twenty audit reports prepared by the Philippine group focusingmainly on office buildings. While not as detailed as the Intercontinental Hotel report (Appendix E),these studies provide an excellent, concise overview of the building's energy use patterns andconservation opportunities. For purposes of confidentiality, the building's name has beenremoved from this report for publication.
OFFICE BUILDING
PRELIMINARY ENERGY AUDIT REPORT
Prepared by:
Eng~ Manuel L.SorianoArcht. Annabelle J. GonzalezEngr. Benjamin A. Marasigan
Engr. Darryl B. MataEngr. Benjamin F. Marante
Engr. Alberto U. Ang Co
Noted by:
Charisse B. TablanteChief, Conservation Division
Office of the PresidentOffice of Energy Affairs
Makati, Metro ManilaThe Philippines
EXECUTIVE SUMMARYAn audit team from the Office of Energy Affairs (OEA) conducted an energy audit of an officebuilding in line with OEA's on-going Project on Energy Conservation in Buildings. This report isthe outcome of an extensive data collection and bUilding inspection made possible with the assistance and cooperation of the building administration staff.
This report focuses on three major aspects of energy analysis, namely, the structural andarchitectural systems (or the building envelope design), lighting and electrical systems, and theair-conditioning systems. The data gathered by the audit team were analyzed using computersimulations and manual computations, on which recommendations for energy conservation werebased.
The energy conservation opportunities, or ECOs, are classified under three major energyconsuming components: office equipment, lighting and electrical systems, and air-conditioningsystems. Below is a summary of the energy cost-saving measures recommended.
Recommendations
OFFICE EQUIPMENT
• Turn off office equipment(computers, typewriters, etc.)when not in use.
ELEVATOR SYSTEM
• Consider inclusion ofelevator in building energyconservation program throughconsultation with elevatoroperating and maintenancepersonnel as well as withmanufacturer.
LIGHTING SYSTEM
• Reduce lighting operating hours by1-1/2 hours.
• Install high-efficiency reflectorsand remove diffusers whereverthe consequent glare can be tolerated.
• Reduce or switch off lights in areas notrequiring higher levels.
• Implement a lighting maintenance programand motivate personnel to conserveenergy.
Potential Benefits
Minimize office equipmentenergy wastage along withless cooling load for theair-conditioning equipment.
More energy cost savingsthrough more efficientelevator operation.
Annual energy savings of168,280 kWh or annual energycost savings of 277,660 pesos:
Improvement of illuminancelevels in workplace.
Energy savings derived fromthe number of lights switchedoff or reduced .
Attain optimum efficiencyof lighting system.
• The conversion rate used, as of June, 1990, was 22.885 Philippine pesos to 1 US Dollar.
0-1
ELECTRICAL SYSTEM POWER FACTOR
• Repair defective power factorcorrection capacitors.
AIR-CONDITIONING SYSTEM
• Reset thermostat setpoint to25.55°C.
• Reduce air-conditioning equipmentoperating time.
• Operate the chiller at fullload capacity, recalibrate allair-conditioning system controls,check chiller manufacturer's data,check air handling units' conditionand proper maintenance ofequipment.
BACKGROUND
Avail of bonus for high PF.
Annual energy savings of31 ,548 kWh or annual energycost savings of 52,054 pesos.
Annual energy savings of 61,691 kWhor annual energy cost savings of101,790 pesos.
Efficient operation of equipmentsince maintenance is consideredan essential element of energyconservation.
The ASEAN·USAID BUildings Energy Conservation Project
The U.S. Government through its Agency for International Development is sponsoring a project called the ASEAN-USAID Buildings Energy Conservation Project in the ASEAN region. Theproject aims to appraise the energy use patterns and characteristics as well as potential energysavings in local existing buildings in the Philippines through computer simulations, and subsequently recommend a framework for setting cost-effective "Building Energy Use Standards" to beincorporated in the National Building Code.
The project involves both public and private sectors in various aspects of its implementationto ensure the development of practical and acceptable guidelines or policies on energy conservation in buildings.
Part of the work program of this project is the conduct of preliminary energy audits in 30buildings that were previously surveyed during the first year of the project implementation. Theaim of the preliminary energy audits is to further identify energy conservation potentials in thebuilding sector and to quantify these potential savings. The results of the audits will be submittedto the administrator/manager of the building audited. All recommendations will also be consolidated and will serve as inputs to the "Building Energy Use Standards" that will be formulated.
This report deals with the energy audit of an office building conducted on October 21, 1988.The report includes all the findings in the various energy-consuming facilities of the bUilding aswell as the pertinent recommendations to improve the building energy utilization efficiency.
Office BUilding: Profile
The office building is a 14-story building, including the basement. It has a gross floor area of25,711 m2, with 19,860 m2 or approximately 77% of the gross area comprising the conditionedoffice space.
The building is L-shaped with its frontage facing the southwest and southeast direction.Adjacent to the building are vacant lots: therefore, the building is not in direct contact with other
0-2
n
buildings. Nearby buildings are of similar height as the bUilding. The building's rear, facing thenortheast and northwest orientations, faces a business area with buildings of smaller height.As in a typical office building, greater occupancy loads occur during weekdays during officehours from 8:00 in the morning to 5:00 in the afternoon.
METHODOLOGY
The Preliminary SurveyA visit to the office building for an energy audit was made by the audit team. The audit isactually a follow-up to the energy survey conducted on September 23, 1987. Data required forbuilding energy usage simulation runs were obtained during the previous visit. Results of thesimulation runs using the utility program ASEAM2.1 were submitted to the administrator lastDecember, 1987.
A walkthrough of the various energy-consuming facilities in the bUilding was conducted.During the walkthrough, observations were made and random interviews with building occupantswere conducted regarding operating practices. Observations on room temperatures, lighting levels, equipment layout, and energy-consuming equipment/appliances operating conditions werealso taken.
Based on the energy audit findings and ASEAM2.1 simulation results, the audit team hascome up with recommendations to conserve energy in the building.
ANALYTIC TOOL
The ASEAM·2 ProgramA Simplified Energy Analysis Method, Version 2.1 (ASEAM2.1) is a modified bin methodprogram for calculating the energy consumption of a building. It uses as part of its database thefloor, wall and fenestration areas, the air-conditioning, the lighting and electrical equipment, andother specifications for the subsequent software calculations and simulation. If the annual totalenergy requirements from the program output report differs by not more than 10% from the actualkWh/yr bill of the building, then it is accepted as representative of the overall building characteristics in terms of cooling load (watts), energy consumption (kWh/yr) as well as the building envelope(U-values, shading coefficient. etc.).
AUDIT FINDINGS AND RECOMMENDATIONS
Structure
Findings:
The building is L-shaped with the longer sides exposed to the northeast and southwestorientations. Service areas and mechanical equipment rooms on each floor are situated at thebuilding's rear facing the northeast. Since the building has no adjacent buildings, placement ofthe service areas and equipment rooms act as buffer zones in the northeast direction, therebyreducing the amount of direct solar heat gain entering the building.Reinforced concrete construction is used throughout the bUilding as external walls which arepainted cream and gray. Lighter-colored or reflective exterior building colors such as white, beige,or silver could be used to reflect more direct sunlight, thereby reducing the air-conditioning load.Windows are the clear glass type for all fenestration areas; the northeast. northwest,southeast and southwest orientations. The windows on the southeast and southwest orientationsare floor to ceiling fixed clear glass windows. These windows are recessed and adequatelyshaded by vertical fins running down the length of the bUilding from the twelfth floor to the secondfloor. Indoor shading devices vary from f1oor-to-ceiling venetian blinds, to single and double draperies. These devices lessen the amount of solar heat gain, but on the other hand. they also limitthe amount of daylighting entering the office areas.
0-3
Doors leading from conditioned areas to the non-conditioned areas could be kept closed toreduce infiltration of warm air into the cooled spaces. As observed, doors facing non-conditionedareas such as elevators, lobbies, corridors, and canteen kitchen from the conditioned offices anddining area are kept open. When asked about this, employees cited as reason the lack of adequate interior illumination or daylighting and/or extremely low temperatures in their respectiveoffices.
The roof is a concrete slab provided with an insulation blanket. It is medium colored andhas a low heat transmission value of 0.14.
LightingFindings:
The entire office space is lighted by fluorescent lamp fixtures. Almost all of the fixtures havetwo fluorescent tubes in place, each with a rating of 40 watts. In addition, these fixtures are alsoprovided with diffusers designed to minimize glare.
The office lighting layout allows almost uniform illumination of all areas irrespective of thekind of task in the workplace. In some office areas it was observed that the manner of partitioninghas allowed some lights to be concentrated in non-working areas. This limitation is a usualcharacteristic of the typical lighting layout which does not make use of task lighting as a primarydesign consideration.
In general, the illuminance readings taken in the office areas show much lower illuminancelevels when compared to the Illuminating Engineering Society (IES) recommended values. Thefollowing is a tabulation of the illuminance (lux) readings for the different areas in the building.
Illuminance (LUX)Area Actual IES Recommended
Office
Hallways, Corridors
Canteen
110-320
50-80
140-180
320-1076
215
110-1076
Almost all of the corridor spaces, stairwells, and even some comfort rooms utilize only daylighting for illumination during the daytime or when enough sunlight is available. Glass windowswithout any shading mechanism such as draperies or venetian blinds allow the most daylight. Itwas observed that these sunlit spaces are not air-conditioned so that additional cooling load dueto daylighting is minimized. As a result, substantial energy savings in lighting and air-conditioningare realized.
Recommendations:
As mentioned above, a good deal of energy is already saved through the extensive use ofdaylighting instead of electric lighting in such areas as corridors and hallways. Still, more lightingenergy can be conserved by simply turning off unnecessary lights during lunchtime and at coffeebreaks. If this measure is practiced religiously, turning off, say, 90% of the lights at an equivalentof 1-% hours a day could easily translate to an energy savings of about 15% of the total lightingenergy usage! This amounts approximately to a cost savings of 277,659 pesos annually.
It is also recommended that high-efficiency reflectors be installed in the fixtures, particularlyin those work areas where illuminance levels are very low. As much as 100% more light could bedirected back to the workplace, thereby improving the illuminance levels.
Another practicable energy conservation measure can be made by removing the diffuserswherever the consequent glare can be tolerated. An obvious drawback of this measure-asidefrom the glare-is that the lamps will then be visually exposed-a possible detriment to the general appearance of the office space. A compromise between what is pleasing to look at andenergy reduction should be found.
D-4
n
As a rule. it is good practice to reduce the lighting energy consumption such as by diminishing operating hours and/or reducing the lighting system connected load as is practicable. This willnot only reduce the lighting energy consumption, but will also reduce the cooling energy required.
Further recommendations are as follows:
• Implement a lighting maintenance program. Clean lamps regularly to assure maximumefficiency; clean those exposed to dirt, dust, grease, or other contaminants more frequently. Clean fixtures can produce as much as 50% more light than dirty ones.
• Reduce or switch off lights in areas not requiring higher levels: stockrooms, corridors,unused conference rooms, parking lots, etc.
• Motivate personnel to conserve lighting energy. Use letters, memos, posters, and personal contact to campaign for lighting energy conservation. Stress:
The use of lighting only when it is needed.
The importance of switching off lights when they are not needed.
Electrical System Power FactorThe metered power factor has been high due to the installation of power factor (PF) correc
tion capacitors. For the past six months, the PF of the air-conditioning system has been relativelylow. averaging 82.5% to 87.4% since three capacitor units are not working, according to themaintenance staff. A tabulation of the metered PF for the year 1988 is presented in Table 0-1.
It is clearly shown by Table 0-1 that the system PF of the air-conditioning load has been leftuncorrected for the past six months. As a result, the monthly metered PF for the load is muchlower than when the connected capacitors were still working. It is known that the local utility company penalizes very low PFs while giving an equivalent bonus to those users with high PFs byawarding a much lower billing factor (e.g., 0.951 for 0.96 PF or higher).
In order to avail again the bonus for high PFs, it is recommended that the installed PFcorrecting capacitors be recommissioned as soon as possible to serve the air-conditioning supplysystem.
Office EquipmentIt is recommended that office equipment (computers, typewriters, etc.) be turned off when
not in use. Unwarranted usage of this equipment will not only result in wasted electrical energy,but will also result in an additional cooling load for the air-conditioning equipment if the officeequipment is situated in an air-conditioned space. In other words, the air-conditioning equipmenthas to do more work than is necessary to remove the heat generated by the "idling" office equipment.
ElevatorsThe building utilizes several passenger elevators for all the floors. Elevator traffic is busy for
almost the whole duration of office hours.
As a built-in measure, the elevators are designed to stop only at every other floor. Forexample, one elevator stops only at even-numbered floors while another elevator stops only atodd-numbered floors. Such a mode of operation allows a reduction in the possible number ofelevator stops, thus reducing the associated energy consumption.
Recommendations:
As in other building systems, it is advisable to have an understanding of the operations ofthe particular elevator system in use-how much power is being consumed by the equipmentbefore exploring the opportunities for energy conservation. A meeting, therefore, with the technical people operating and maintaining the elevators is suggested. Because of the highly technicalnature of the elevator, their opinion must be solicited on how to include elevators in the energyconservation scheme.
0-5
Since the building is being served by several elevators, it is advisable to schedule the operation of a unit mix for rush hours, and for low traffic hours. This can be done automatically ormanually. The equipment manufacturer should be consulted on this.
Also, certain programmable controls can be installed to limit the floor stops further for operation of each elevator unit for energy conservation. Again, the elevator manufacturer must be consulted on this.
AIr-CondItionIng System
Findings:
Each floor of the building, from the ground to the 11th floor, uses two constant volume airhandling units (AHUs) which provide a constant volume of air at temperatures that vary accordingto the load. The canteen located on the 12th floor is served by a 7.46 kW(10hp) AHU utilizingchilled water from the central plant. The AHUs maintain the rooms as 25°C(7rF). The centralair-conditioning system operates from 6:30 A.M. to 4:30 P.M. Monday to Friday, which is the regular working period. During weekends, no air-conditioning is provided.
The cold supply air from the AHU is distributed through insulated ducts and dischargedthrough ceiling diffusers while the return air passes through a common ceiling plenum.
The thermostat of each AHU is placed in the return air path in the machine room. It is connected to a three-way valve which controls the chilled water flow to the cooling coils of the AHU.A problem with such systems with one thermostat per AHU (also called single-zone system) isthat some areas are undercooled. This problem is solved by installing damper control in the AHU,although the mechanism for controlling the damper of the AHU serving the mezzanine is not functioning due to rust. (Note: this was the only AHU seen by the audit team).
The cooling plant equipment consists of two 450-ton centrifugal chillers, a four-cell coolingtower, one 93.25 kW chilled water pump, and two 55.95 kW condenser pumps (one standby).The operation of the chillers depends upon the outside temperature. This means that during thesummer months two chillers are operating simultaneously to meet the cooling load. During theconduct of the audit, only one chiller was operating at 90% capacity. This is good, given that chillers operate more efficiently at higher loads (80 - 100%).
An energy conservation measure already effected is the shutting off of the chiller, coolingtowers, and condenser pump during lunchtime. Computations show that the savings generatedby this measure is about 473.25 kWh/day, or 135,721.33 kWh/yr. This measure will be mosteffective when all unnecessary lights are turned off and no windows are opened during the onehour lunch break, to prevent bUildUp of cooling load which will be carried by the central plant atstartup at 1:00 P.M.
Recommendations:
A thorough assessment of the motor load performance characteristics for the purpose of isolating energy conservation opportunities is not expected since the survey conducted was not adetailed energy audit. The following recommendations, therefore, are based only on the surveyobservations and general considerations.
• Reset Thermostat Setpoint. The thermostat setpoint should be reset to 25.55°C(78°F),which is the recommended thermal comfort level. This can be done by adjusting thethermostat located in the return air path of the AHU until a temperature of 25.55°C isattained in the conditioned space. To minimize complaints from occupants, they shouldbe advised to wear lighter clothing.
The projected savings derived from resetting the thermostat setpoint, as computed bycomputer simulations, is 31,548 kWh/yr.
• Reduction of Air-Conditioning Operating Time. Study the possibility of reducing theoperating time of the centrifugal chiller, cooling towers, and condenser pump by 15 to30 minutes before 4:30 P.M., while operating the AHUs and chilled water pumps.Generally, the temperature of the cooling water is enough to carry the load before
0-6
shutdown.
Projected savings: (See Attachment D for computations).
A.1 Switch off chillers, cooling towers, and condenser pump 15 minutes before4:30 P.M. (assume COP = 4.15)Savings in kWh/yr : 30,845.63Percent of total : 0.77
A.2 Switch off chillers, cooling towers, and condenser pump 30 minutes before4:30 P.M. (assume COP = 4.15)Savings in kWh/yr : 61,691.52Percent of total : 1.53
Further recommendations are as follows:
• Continue to Operate the Chiller at Full Load Capacity. As a rule, it is good to operatethe compressor at its full-load capacity at which its motor is most efficient. During thesummer months, try to delay as much as possible the simultaneous operation of two450-ton chillers as this is likely to result in a low kW/ton refrigerating effect. Onemethod of solving this problem is to consider the purchase of a small chiller in the 150- 250 ton class. Instead of operating another 450-ton chiller when one 450-ton chilleroperating at full capacity can no longer supply the necessary cooling energy, a smallbackup chiller will be operated parallel with one 450-ton chiller. The combined operation of a small chiller and one 450-ton chiller will give a much higher kW/ton than two450-ton chiller operating simultaneously.
• Recalibrate All Air-Conditioning System Controls. Thermostats should be locked toprevent resetting by unauthorized persons.
• Check Chiller Manufacturer's Data. It is recommended that the efficiencies of the chillers be verified by checking the water temperatures in and out of condensers and chillers against design specifications, and by checking the amperage on compressor motoragainst manufacturer's data, and then making the necessary adjustments to operatethe chiller efficiently.
• Check Air Handling Units' Condition. Check alignment of motor and fan, and whenbelts are used for power transmission, see to it that all are equally tensioned. Whenbelts are frayed, loose, or need replacement, the entire set should be replaced.
• Properly Sized Motors. Energy savings could also be affected by replacing oversizedfan motors with motors that properly match actual loads. Check if the existing motorsare underloaded. If so, technically evaluate whether energy savings could be realizedif existing oversized motors are replaced with properly sized motors.
• Proper Maintenance of Equipment. Dirty or poorly maintained equipment may continue to operate, but only by consuming greater amounts of energy. Therefore, maintenance is considered an essential element of energy conservation.
Cleaning of Filters. The manually-serviced type air filter requires periodiccleaning or replacement. The usual indication that cleaning or replacementis required is either a decrease in air flow through the filter or an increase inresistance across the filter. Dirty filters not only lower the power consumption of the fan, they will also lower the overall cooling capacity of the AHUs.
Cleaning of Coils. The efficient operation of both cooling and heating coilsdepends largely upon the cleanliness of the heat transfer surfaces. Thecoils can be cleaned with detergents and high pressure water using portable units.
Fan Maintenance. Thoroughly clean the fan (or blower) blades and checkfor damages in the blades that may cause out-of-balance running andexcessive noise. Lubrication of bearings will reduce frictional losses.Adjust tension of belt drives whenever necessary.
D-7
.,..------------
Check Strainer Screens in Pumping Systems. Regular cleaning of strainerscreens keeps pressure losses in liquid systems to a minimum, thus savingpumping energy. It may be possible to replace fine-mesh strainer basketswith a much larger mesh, without endangering the operation of the system.This again will reduce pressure loss in the system and save energy.
Check cooling tower bleed-off periodically to ensure that water and chemicals are not being wasted.
• Turn-off unnecessary equipment.
D-8
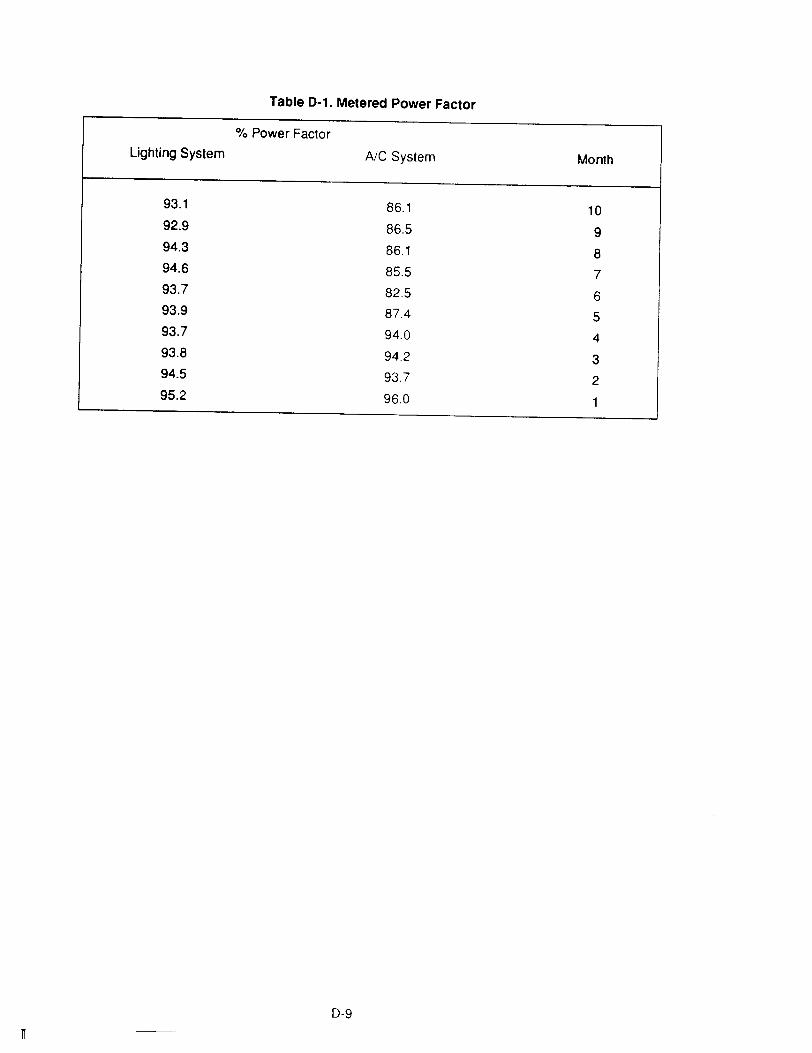
Lighting System
93.1
92.9
94.3
94.6
93.7
93.9
93.7
93.8
94.5
95.2
Table 0·1. Metered Power Factor
% Power Factor
Ale System
86.1
86.5
86.1
85.5
82.5
87.4
94.0
94.2
93.7
96.0
D-9
Month
10
9
8
7
6
5
4
3
2
1
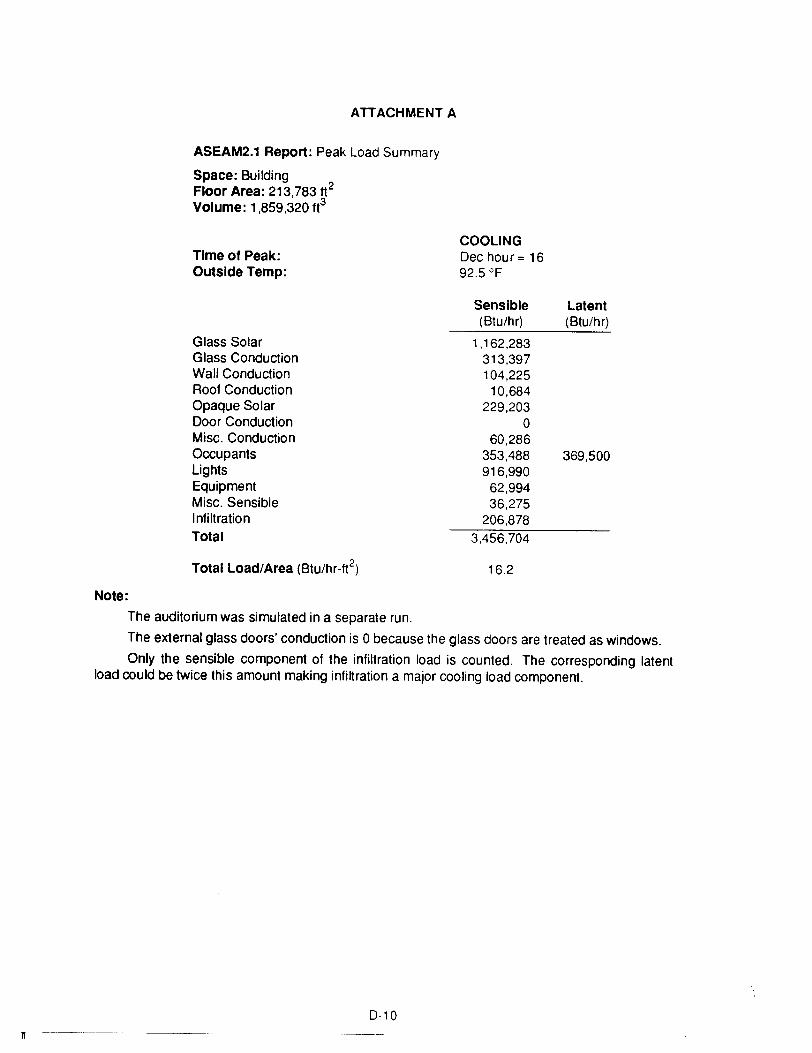
ATTACHMENT A
ASEAM2.1 Report: Peak Load Summary
Space: BuildingFloor Area: 213,783 ft2Volume: 1,859,320 ft3
Time of Peak:Outside Temp:
Glass SolarGlass ConductionWall ConductionRoof ConductionOpaque SolarDoor ConductionMisc. ConductionOccupantsLightsEquipmentMisc. SensibleInfiltrationTotal
Total Load/Area (Btu/hr-ft2)
COOLINGDec hour= 1692.5 of
Sensible(Btu/hr)
1,162,283313,397104,225
10,684229,203
o60,286
353,488916,990
62,99436,275
206,8783,456,704
16.2
Latent(Btu/hr)
369,500
Note:
The auditorium was simulated in a separate run.
The external glass doors' conduction is 0 because the glass doors are treated as windows.
Only the sensible component of the infiltration load is counted. The corresponding latentload could be twice this amount making infiltration a major cooling load component.
0-10
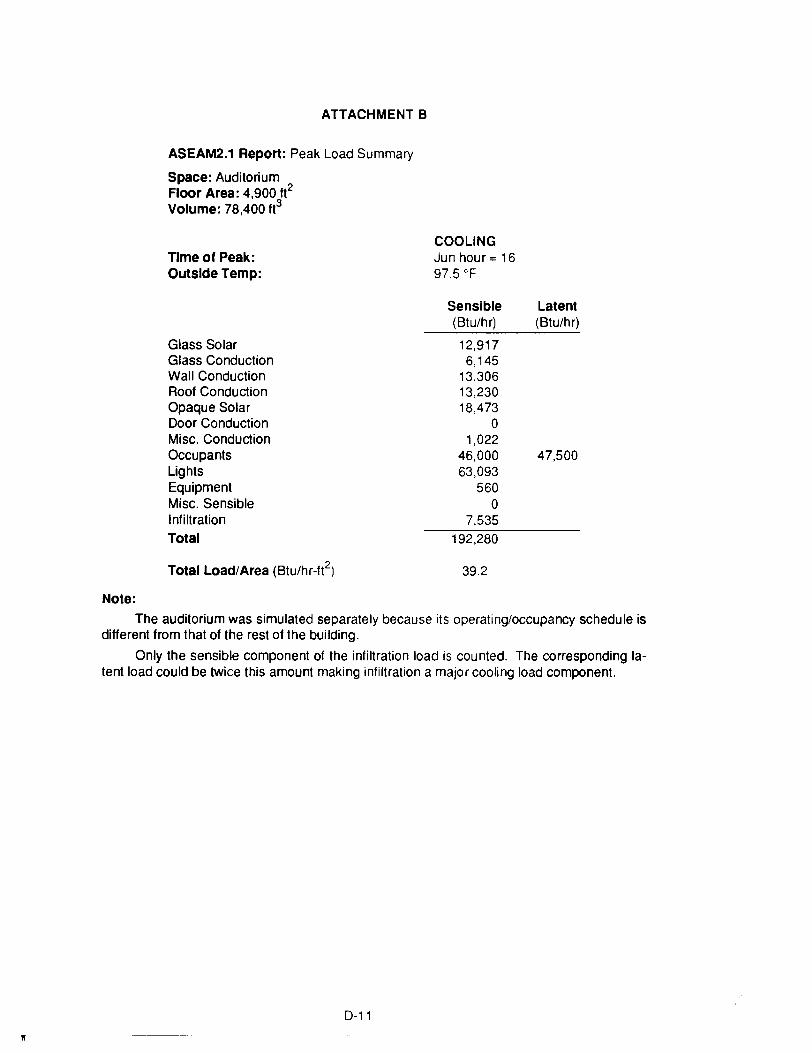
ATTACHMENT B
ASEAM2.1 Report: Peak Load Summary
Space: AuditoriumFloor Area: 4,900 ft2Volume: 78,400 ft3
Time of Peak:Outside Temp:
Glass SolarGlass ConductionWall ConductionRoof ConductionOpaque SolarDoor ConductionMisc. ConductionOccupantsLightsEquipmentMisc. SensibleInfiltrationTotal
Total Load/Area (Btu/hr-tt2)
COOLINGJun hour = 1697.5 of
Sensible(Btu/hr)
12,9176,145
13,30613,23018,473
o1,022
46,00063,093
560o
7,535
192,280
39.2
Latent(Btu/hr)
47,500
11
Note:
The auditorium was simulated separately because its operating/occupancy schedule isdifferent from that of the rest of the building.
Only the sensible component of the infiltration load is counted. The corresponding latent load could be twice this amount making infiltration a major cooling load component.
0-11
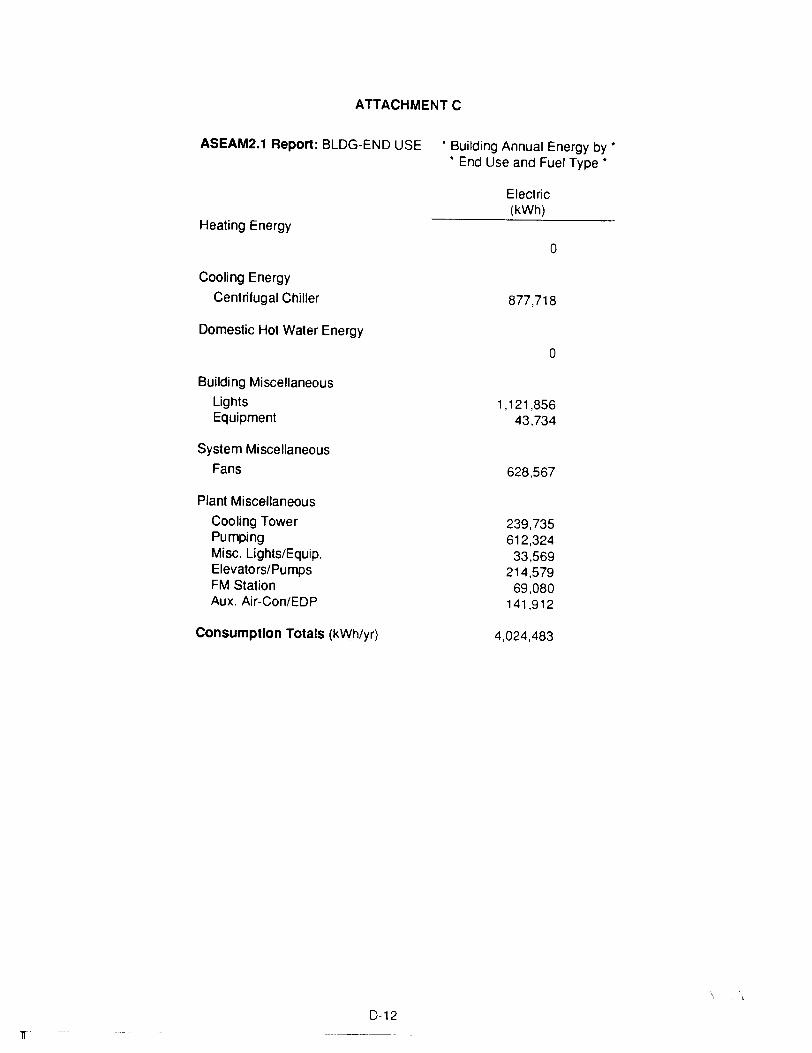
ATTACHMENT C
ASEAM2.1 Report: BLDG-END USE • Building Annual Energy by'• End Use and Fuel Type •
Electric(kWh)
Heating Energy
o
Cooling Energy
Centrifugal Chiller
Domestic Hot Water Energy
Building Miscellaneous
LightsEquipment
System Miscellaneous
Fans
Plant Miscellaneous
Cooling TowerPumpingMisc. Lights/Equip.Elevators/PumpsFM StationAux. Air-Con/EDP
Consumption Totals (kWh/yr)
D-12
877,718
o
1,121,85643,734
628,567
239,735612,324
33,569214,579
69,080141,912
4,024,483
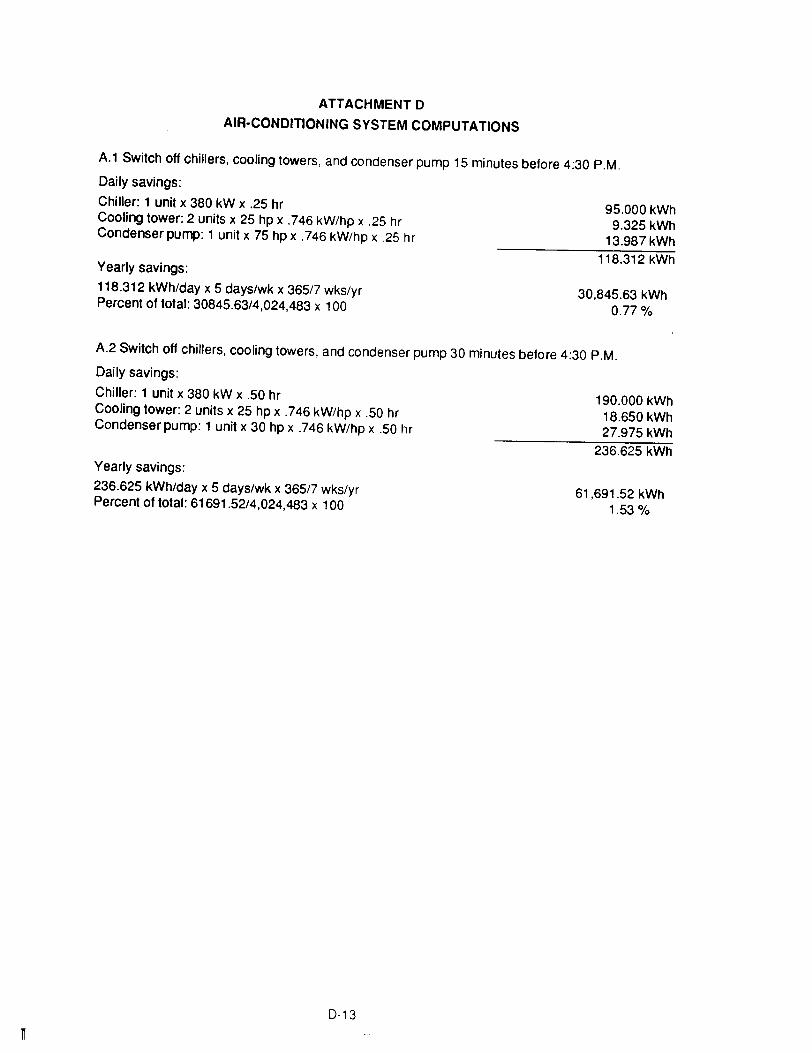
95.000 kWh9.325 kWh
13.987 kWh
ATTACHMENT 0
AIR-CONDITIONING SYSTEM COMPUTATIONS
A.1 Switch off chillers, cooling towers, and condenser pump 15 minutes before 4:30 P.M.
Daily savings:
Chiller: 1 unit x 380 kW x .25 hrCooling tower: 2 units x 25 hp x .746 kW/hp x .25 hrCondenser pump: 1 unit x 75 hp x .746 kW/hp x .25 hr
118.312 kWhYearly savings:
118.312 kWh/day x 5 days/wk x 365/7 wks/yrPercent of total: 30845.63/4,024,483 x 100
30,845.63 kWh0.77%
190.000 kWh18.650 kWh27.975 kWh
A.2 Switch off chillers, cooling towers, and condenser pump 30 minutes before 4:30 P.M.
Daily savings:
Chiller: 1 unit x 380 kW x .50 hrCooling tower: 2 units x 25 hp x .746 kW/hp x .50 hrCondenser pump: 1 unit x 30 hp x .746 kW/hp x .50 hr
236.625 kWh
Yearly savings:
236.625 kWh/day x 5 days/wk x 365/7 wks/yrPercent of total: 61691.52/4,024,483 x 100
D·13
61,691.52 kWh1.53%
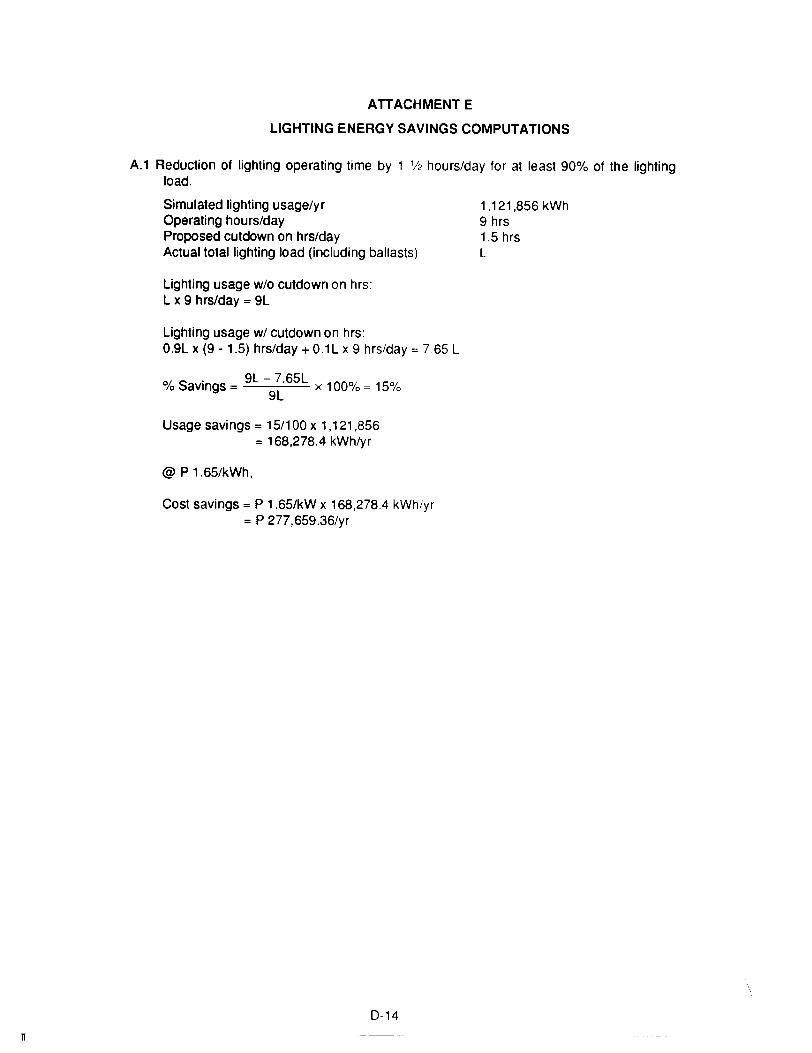
ATTACHMENT E
LIGHTING ENERGY SAVINGS COMPUTATIONS
A.1 Reduction of lighting operating time by 1 % hours/day for at least 90% of the lightingload.
n
Simulated lighting usage/yrOperating hours/dayProposed cutdown on hrs/dayActual total lighting load (including ballasts)
Lighting usage w/o cutdown on hrs:Lx 9 hrs/day =9L
Lighting usage w/ cutdown on hrs:0.9L x (9 - 1.5) hrs/day + 0.1 Lx 9 hrs/day == 7.65 L
% Savings == 9L -9~65L x 100% = 15%
Usage savings = 15/100 x 1,121,856== 168,278.4 kWh/yr
@ P 1.65/kWh,
Cost savings = P 1.65/kW x 168,278.4 kWh/yr= P 277,659.36/yr
D-14
1,121,856 kWh9 hrs1.5 hrsL
APPENDIX E
HOTEL INTERCONTINENTAL MANILA
AUDIT REPORT
THE PHILIPPINES
This report is one of eight detailed audit reports prepared by the Philippine group focusing onhotels. This report is an excellent in-depth study of the building's energy use patterns. It alsopresents detailed calculations of energy consumption and the potential savings through energyconservation opportunities.
HOTEL INTERCONTINENTAL MANILA
AUDIT REPORT
Prepared by
Assessment, Analysis and Policy Studies Group:
Engr. Manuel L. Soriano - Project LeaderEngr. Alberto U. Ang Co
Engr. Benjamin A. MarasiganEngr. Darryl B. MataJohn James V. Salvo
Air-Conditioning Equipment Group:
Engr. Iryzhar Divinagracia - Project LeaderArch. Annabelle J. Gonzalez
Arch. Alice R. Liu
\
BACKGROUND
The ASEAN-USAID Buildings Energy Conservation ProjectThe U.S. Government through its Agency for International Development is sponsoring a project called the ASEAN-USAID Buildings Energy Conservation Project in the ASEAN region. Theproject aims to use computer simulations to appraise energy use patterns and characteristics, aswell as the potential energy savings, in existing buildings in the Philippines, and subsequently torecommend the framework for setting cost-effective "Building Energy Use Standards" to be incorporated in the National Building Code.The project involves both public and private sectors in various aspects of its implementationto ensure the development of practical and acceptable guidelines or policies on energy conservation in buildings.
A technical committee and project staff compose the project management structure. Thetechnical committee, represented by both public and private sector organizations, provides technical guidance and support in the formulation and implementation of building energy conservationpolicies. The project staff, on the other hand, is responsible for the day-to-day operation of theproject, performing all energy surveys/audits, computer simulations, and research work.
The Audit TeamThe project staff is divided into four subgroups assigned to deal with several aspects ofenergy conservation. Two of these subgroups are now working in close association to undertakea study on air-conditioning in buildings and to analyze, assess, and develop policies which will bethe final output of the project.Specifically, the group is tasked to:
• Identify ways in which cooling systems can be configured and installed in localbUildings to reduce energy use;• Utilize computer tools to evaluate periormance of air-conditioning and control
equipment;
• Prepare and gather base-line data on building energy use;• Compile existing building energy audit results; and,• Conduct detailed energy audits of selected buildings.
The two subgroups compose the audit team that conducted the detailed energy audit of theHotel Intercontinental Manila last April 12, 14, and 18, 1988. The subgroups are the Assessment,Analysis and Policy Studies Group and the Air-Conditioning Equipment Group.
Selection of BUildings for the Detailed Energy AuditThe audit team has conducted energy surveys of several buildings within Metro Manila inorder to gather base-line data on the trend of energy usage in local buildings. From the set ofbUildings surveyed, six buildings of the following classifications-hospital, office, hotel andsupermarket-were selected for a detailed energy audits. The latest techniques in energy auditing were applied to identify energy conservation measures which are then assessed using available computer programs. An economic feasibility analysis of each energy conservation opportunity (ECO) identified was also performed.A set of criteria was formulated by the audit team as a basis in the selection of buildings forthe detailed energy audit. These are as follows:• The annual energy consumption of the building should be more than 3.8 million
kilowatt-hours or 1 million fuel oil equivalent liters of energy, inclusive of liquid fuelsand electricity (as per requirement of Rule VII of Batas Pambansa (BP) Big. 73 asamended by BP BIg. 872 which requires all commercial, industrial, and transportestablishments consuming the aforementioned amount of energy to submit quarterly
E-'

n
energy consumption reports to the Bureau of Energy Utilization, (now Office of EnergyAffairs)).
• The window-to-wall ratio should be between 0.2 to 0.6
• The air-conditioning system should be centralized.
• The building's cooling energy requirement should make up 50% of the total energyconsumption of the building (based on ASEAM-2 output on breakdown of energy consumption).
• All equipment should be accessible for testing and inspection.
• All pertinent documents and data needed for evaluation should be available.
• The staff should be willing and cooperative.
• A potential for energy conservation should exist (based on the energy survey andASEAM-2 output).
• An energy management program should exist.
Hotel Intercontinental Manila: Profile
The Hotel Intercontinental Manila is one of more than 80 Intercontinental Hotels all over theworld. The hotel is centrally located in Makati, Metro Manila's financial and commercial district. Ithas 390 air-conditioned guestrooms that offer accommodations for single, double, or triple occupancy.
There are seven meeting and function rooms that can accommodate up to 1,500 people forbanquets, receptions, meetings, exhibits, and shows. Other hotel facilities include two specialtyrestaurants, the Jeepney Coffee Shop and LaTerrasse; a cocktail lounge; bars; a pool; snack bar;and a discotheque.
A shopping arcade is located on the ground floor and includes souvenir shops, travel agencies, car rentals, a photo shop, and a flower shop. A beauty parlor and a barber shop are alsoprovided on the second floor. As in other five-star hotels, room service is provided 24 hours aday.
METHODOLOGY
The Preliminary Survey
A visit to the Hotel Intercontinental Manila for an energy survey was made by the audit teamon March 2,1988. Data required to fill in the input forms of a computer program, ASEAM-2, wereobtained (e.g., conditioned and unconditioned floor areas, construction materials, walls, windows,electrical equipment, air-conditioning equipment, and others). The computer program simulatesthe building energy usage throughout a year.
Prior to computer simulation, and even before the ASEAM-2 input forms are filled in, thebuilding is "zoned." This is an important step in any building energy analysis program. Zoningrequires a building to be divided into small areas with similar thermal and system characteristics.A zone is defined to be at a uniform space temperature, has one operating schedule, and servedby one air-conditioning system.
The data gathered from the preliminary survey indicate that the Hotel Intercontinental ManilabUilding has satisfied the set of criteria for the selection of bUildings for the detailed energy audit.Initial findings show that the hotel, which was constructed during the late 1960s, has a window-towall ratio of 0.446. It uses a centralized air-conditioning system that consumes about 50.7% of itsannual energy consumption of 6.989 million kilowatt-hours.
Furthermore, the availability of pertinent documents and cooperative staff to facilitate theconduct of the detailed energy audit were contributing factors in considering Hotel IntercontinentalManila for the detailed energy audit.
E-2
n
The Detailed Energy AuditThe detailed energy audit involved a comprehensive bUilding inspection to determine exactlywhere and at what times energy was being consumed and where opportunities for conservationexist. The audit entailed several procedures for data collection. Among these are the following:• Inventory of building structural features as well as mechanical and electrical equipmentinstalled;
• Conduct of interviews and random surveys of the building occupants;• Actual head count of building occupants at certain time intervals; and• Actual measurements of important equipment operating parameters.To facilitate the conduct of the detailed energy audit, the team was divided into three subgroups assigned to deal with the several audit procedures on three major energy-consuming systems in the bUilding: the air-conditioning system, the electrical system, and architectural and structural systems.
ANALYTICAL TOOLS
The ASEAM·2 ProgramA Simplified Energy Analysis Method, Version 2.0 (ASEAM-2) is a modified bin method program for calculating the energy consumption of a building. As part of its database, the programuses the floor, wall and fenestration areas, the air-conditioning, the lighting and electrical equipment, and other specifications for the subsequent software calculations and simulation. For thePhilippine audit project, if the annual total energy requirements from the program's summaryannual output report has a difference of not more than 10% from the actual kWh/yr bill of the building, then it is accepted as representative of the overall building characteristics, in terms of coolingload (watts), energy consumption (kWh/yr), and the building envelope (U-values, shadingcoefficient, etc.).
The Carrier Program
Carrier Corporation's Hourly Analysis Program (HAP) evaluates loads and system operationon an hourly basis, utiliZing a nine-step procedure. The first three steps consist of definingweather data, day and schedule data, and defining spaces. Once these basic data are defined,the energy analysis procedure begins. The fourth and fifth steps define air system characteristicsand control. Then air system operation for average weather and load conditions are simulated.This analysis generates the hourly cooling and heating coil data as well as fan input power quantities. The sixth step defines the plant's capacity, contrOl, and operating characteristics, togetherwith the air systems served by the plant. In the seventh step, plant operation is simulated usingaverage weather data and coil load data from the air system simulations. Results include hourlyinput power data for equipment components such as compressors, pumps, cooling tower fans,heating elements, and boilers. In the final input stage, all the energy-consuming systems in thebUilding are defined, as are cost and currency parameters. The ninth step develops a cost calculation based on the hourly power data for all energy-consuming systems in the building.
The DOE·2 Program
DOE-2 is a building energy use analysis program which also uses the hourly method in performing its calculations. First, LOADS calculation computes the heat loss and gain to the buildingspaces, and the heating and cooling loads imposed upon the building HVAC systems. Then theSYSTEMS calculation determines energy demand of the building. Finally, the PLANT calculationis the third step calculates the energy requirements of primary equipment-such as boilers andchillers, cooling towers. and others-in the attempt to supply the energy demand of HVAC anddomestic steam and hot water systems:
• For see a more detailed description of DOE-2. see Vol. II. Chapter 2. of thiS report
E-3
11
Comparison of Analytical Tools
The ASEAM-2 software has a limited capability for modeling architectural and mechanicalsystems. Although it only takes a few minutes to run the program, such relatively quick outputresults in a proportionate loss of accuracy.
Carrier, on the other hand, offers a more flexible scheduling of lights, people, and equipmentwith a run time approximately the same as ASEAM-2. Its hour-by-hour simulation is more accurate than ASEAM-2's monthly modified bin method.
DOE-2 is a much more complex utility program than ASEAM-2 and Carrier. Although it alsoutilizes an hourly analysis method of computation and simulation, DOE-2 is more accurate thanCarrier since it provides more options for simulation including various correction factors. Thus,run time will take about one hour for a 15-zone building using a 16Mh, 386 cpm personal computer.
BUILDING DESCRIPTION
General
Hotel Intercontinental Manila was constructed in the late 1960s. It has 14 floors, including abasement, with a gross floor area of 27,985 m2. Seventy-one percent of the gross floor area(about 20,000 m2
) comprises the conditioned areas, including guestrooms, function rooms, ballroom, lobby, shops, restaurants, and offices. The 390 guestrooms make up the bulk of the conditioned area and occupy the top ten floors with an area of 1,530 m2 per floor.
The Site
Hotel Intercontinental Manila is located at the heart of busy Makati Commercial Complex, amajor urban business and commercial district in Metro Manila. It is bounded on the northeast by amain road, Ayala Avenue, and a block away, on the southeast, by E. de los Santos Avenue(EDSA).
Nearby buildings, within a SOD-meter radius of the hotel, consist mainly of a 15-storyresidential condominium across Ayala Avenue, a two-story shopping arcade, and a four-storycommercial building on the southwest. At the rear of the hotel, along EDSA, is a three-story parking garage, and fronting the hotel is a parking lot.
The level of density of nearby construction is moderate, with only about ten buildings withina half-kilometer radius, and with ample clearances between structures. The hotel is not in directcontact with any adjacent buildings.
Form and Space Organization
In general, large hotels are characterized by a complex functional space mix: service areas,guestrooms, assembly areas, etc. The blend of these functional spaces yields an energy mix ofboth internally load-dominated service areas and externally load-dominated guestrooms.
Space organization, or how spaces are arranged or grouped together, plays a significantrole in the control of thermal loads. The building plan can have a major effect on the energyrequirements for maintaining specified comfort conditions.
It is noted that the so-called "back of the house," which includes most of the service areasand equipment rooms of Hotel Intercontinental, is located in the southeastern and southwesternexposure e.g., the fan room near the ballroom on the second floor, and the kitchen and storageareas on the ground floor. These are strategic locations for service areas because they act asunconditioned buffer zones for control of solar gain in adjacent conditioned spaces.
The hotel is basically rectangular in shape, from the third floor to the topmost level, and Lshaped on the ground and second floor levels. The building's longer side is oriented along thenortheast-southwest axis, which admits reduced direct solar radiation from the east-west exposure.
E-4
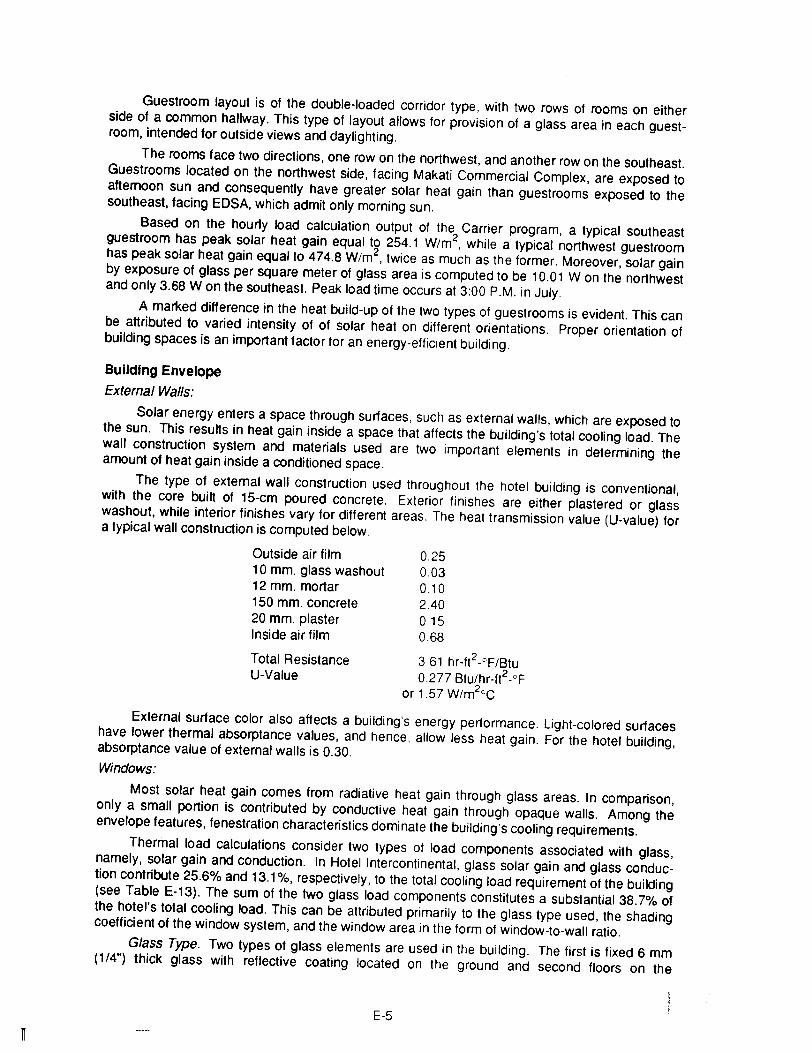
Guestroom layout is of the double-loaded corridor type, with two rows of rooms on eitherside of a common hallway. This type of layout allows for provision of a glass area in each guestroom, intended for outside views and daylighting.The rooms face two directions, one row on the northwest, and another row on the southeast.Guestrooms located on the northwest side, facing Makati Commercial Complex, are exposed toafternoon sun and consequently have greater solar heat gain than guestrooms exposed to thesoutheast, facing EDSA, which admit only morning sun.Based on the hourly load calculation output of the Carrier program, a typical southeastguestroom has peak solar heat gain equal to 254.1 W/m2
, while a typical northwest guestroomhas peak solar heat gain equal to 474.8 W/m 2, twice as much as the former. Moreover, solar gainby exposure of glass per square meter of glass area is computed to be 10.01 Won the northwestand only 3.68 Won the southeast. Peak load time occurs at 3:00 P.M. in July.
A marked difference in the heat build-up of the two types of guestrooms is evident. This canbe attributed to varied intensity of of solar heat on different orientations. Proper orientation ofbuilding spaces is an important factor for an energy-efficient building.
0.250.030.102400150.68
361 hr-ft2-oF/Btu0.277 Btu/hr-ft2-oF
or 1.57 W/m 20C
Total ResistanceU-Value
Building EnvelopeExternal Walls:
Solar energy enters a space through surfaces, such as external walls, which are exposed tothe sun. This results in heat gain inside a space that affects the building's total cooling load. Thewall construction system and materials used are two important elements in determining theamount of heat gain inside a conditioned space.The type of external wall construction used throughout the hotel building is conventional,with the core built of 15-cm poured concrete. Exterior finishes are either plastered or glasswashout, while interior finishes vary for different areas. The heat transmission value (U-value) fora typical wall construction is computed below.
Outside air film10 mm. glass washout12 mm. mortar150 mm. concrete20 mm. plasterInside air film
External surface color also affects a building's energy performance. Light-colored surfaceshave lower thermal absorptance values, and hence, allow less heat gain. For the hotel building,absorptance value of external walls is 0.30.Windows:
Most solar heat gain comes from radiative heat gain through glass areas. In comparison,only a small portion is contributed by conductive heat gain through opaque walls. Among theenvelope features, fenestration characteristics dominate the building's cooling requirements.Thermal load calculations consider two types of load components associated with glass,namely, solar gain and conduction. In Hotel Intercontinental, glass solar gain and glass conduction contribute 25.6% and 13.1 %, respectively, to the total cooling load requirement of the building(see Table E-13). The sum of the two glass load components constitutes a substantial 38.7% ofthe hotel's total cooling load. This can be attributed primarily to the glass type used, the shadingcoefficient of the window system, and the window area in the form of window-to-wall ratio.Glass Type. Two types of glass elements are used in the building. The first is fixed 6 mm(1/4") thick glass with reflective coating located on the ground and second floors on the
E-5
northwestern, southeastern, and part of the northeastern exposures of the building. The heattransmission value for this type of window is 4.6 W/m2°C. The second type of glass is 5 mm(3/16") thick clear glass used in the guestroom windows, also with a heat transmission value of4.6 W/m2oC.
Windows are found to be tight-fitting, weather-stripped, and most are fixed in their frames.These factors allow for reduced air infiltration due to cracks or leakages.
Shading Coefficient. The shading coefficient is the ratio of the solar heat gain of fenestrationto the solar heat gain of reference glass, which is a single sheet of clear glass. The shadingcoefficient depends in general not only on the type of glass but also on whether venetian blinds,shades, draperies, etc., are used on the windows. Values for a range of commonly used glasstypes can be found in the ASHRAE Handbook of Fundamentals.
Curtains of various weaves are used extensively on almost all windows. Taking this, and theglass type used, into account, the shading coefficient for the clear glass is 0.64, and for thereflective-coated glass it is 0.42.
Window-to-Wall Ratio. Window-to-wall ratio is the total glass area divided by the sum of thetotal fenestration area and the total opaque wall area of the building. Hotel Intercontinental has awindow-to-wall ratio of 0.4458, an average value for most of the bUildings surveyed by the team.A relatively large window area may account for the significant load due to heat gain through glass.
Roof:
The roof is a flat concrete slab provided with a 2 in. fiberglass insulation blanket. The computed heat transfer coefficient (U-value) is 0.477 W/m2°C. The addition of an insulating material tothe roof construction caused a significant reduction in the heat transmittance value of the roof system.
Total roof area is 3020 m2, which is only 10% of gross floor area. The thermal absorptance
value of the roof is a high 0.91 because the external surface is dark-colored. A light-colored finishis advantageous for maximum reflectivity or lower absorptance. This allows less heat gain intothe conditioned space.
External/Internal Shading:
The effect of solar heat on fenestration may be significantly reduced by installing variousshading devices, such as overhangs, horizontal and vertical architectural projections, awnings,louvers. and other types of sun baffles.
External shadings of the eggcrate type are used in the guestrooms. This form of shading ischaracterized by horizontal projections or overhangs, and vertical projections or fins on both sidesof the window. This type combines the effect of an overhang, which works well on southerlyorientations, and the effect of fins, which are effective on easterly and westerly orientations.
Precast sunshades with glass washout finish are connected to 75 em. deep concreteoverhangs. The sunshades, with a depth of 96 em., sufficiently cover the window area againstsolar radiation.
Indoor shading devices for most windows consist of double draperies. Nearest to the glassareas is a thin white lacy curtain for outward vision and daylight when desired. A dark-coloredclose-weave curtain for blocking out sunlight and providing privacy lies over this. However, tomost effectively reduce solar heat gain, drapery exposed to sunlight should have high reflectanceand low transmittance. That means it is better to have the open weave drapery (the white curtain)on the room side.
Advantages gained through proper use of double draperies are: (1) extreme flexibility ofvision and light intensity; (2) a lowered shading coefficient leading to lowered solar heat gain; and(3) an improved comfort condition, as the room side drapery is more nearly at room temperature.
E-6
\
Interior Partitions:
To offset infiltration and heat transmission between conditioned and unconditioned spaces,thermally-resistant materials must be installed as partitions, leakages in door openings must beminimized, and practical housekeeping measures must be adopted.The hotel's wall partitions are constructed of 10 em. (4 in.) concrete hollow blocks plasteredand with paint finish. It was noted during the survey that some areas, like the restaurants andbars, use special types of wall finishing materials such as bamboo, stone, brick, etc. Heattransmission values (U-values) of wall partitions range between 1.36 and 2.32 W/m2°C.
Occupancy ScheduleUsage patterns. perhaps the most significant determinant in energy usage, differ for differenttypes of buildings. Hotel Intercontinental is inherently energy intensive because it operates 24hours a day.
Offices, function rooms, and shops have greater occupancy densities during the workingdays. Shops are open from 8:00 A.M. to 9:00 P.M. with peak hours usually in the morning. Lobbies, on the other hand, have a more diverse occupancy density for the 24-hour day. The groundfloor lobby usually fills up with people during the afternoons and mid-mornings.Restaurants are generally occupied during mealtimes. Even then, the hotel's restaurantsoccupancy seldom reach their maximum capacity, except for the Jeepney Coffee shop on theground floor, which was observed to have a regUlar influx of patrons. The disco and ballroom havemaximum occupancies during the week-end evening hours.Internal heat gain due to occupants contributes 23.1 % to the total cooling load of the building. A significant percentage of the building's cooling load due to people may be attributed to thenature of services offered by the hotel.
AUDIT FINDINGS AND RECOMMENDATIONS
General
Hotel Intercontinental's annual energy consumption is 349 kWh/yr m2. This value typifies theaverage energy consumption of hotels in Metro Manila, which is 351 kWh/yr m2
, based on theenergy surveys conducted by the ASEAN-USAID project staff on eight other hotels.The air-conditioning system constitutes the largest installed power load, at 50.7% of the totalelectrical consumption per year. The air-conditioning system as an energy-consuming componentcontributes significantly to the annual electrical consumption of any building. Lighting follows nextat 21.5°/~, and electrical equipment at 9.6%.Each of these energy-consuming components will be discussed in more detail later.
Electrical SystemFindings:
Distribution System. The main normal power is supplied by the utility grid, MERALCO, at34.5 KV three-phase primary lines through two transformer banks, each with a rated capacity of1500 KVA and which step down the primary voltage to 460 volts and 208 volts at the secondaryterminals. A nominal voltage of 440 volts, 60 Hz, is utilized for large motor loads. which includethe chiller compressor motors and other large motors. The 208 volt system serves the generallighting load and convenience outlets as well as small motor loads, such as refrigerators and shopequipment.
In general, the distribution system layout is adequate to serve the electrical power needs ofthe various building facilities. Line efficiency is assumed high, allowing only minimal line losseswhich are estimated to account for roughly 28,649 kWh/yr.Indoor Lighting System. The lighting system consists mostly of incandescent lamp fixtures,as is typical of hotel buildings where the aesthetic and color-rendering properties of incandescent
E-7
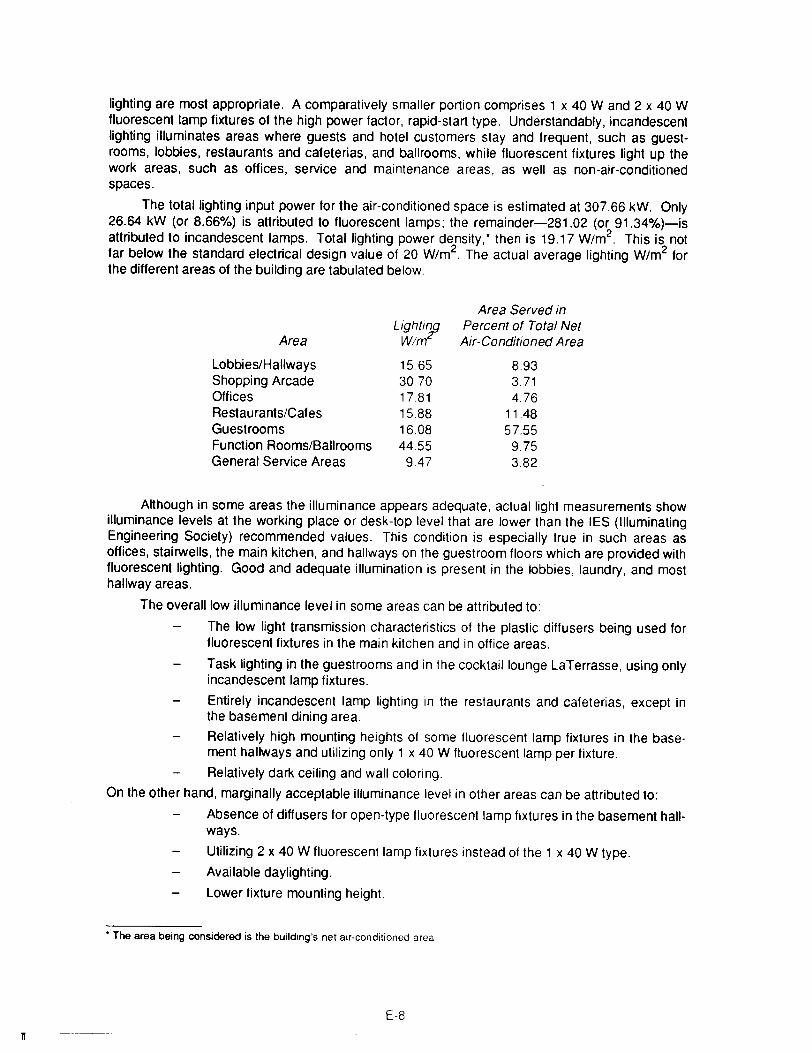
lighting are most appropriate. A comparatively smaller portion comprises 1 x 40 Wand 2 x 40 Wfluorescent lamp fixtures of the high power factor, rapid-start type. Understandably, incandescentlighting illuminates areas where guests and hotel customers stay and frequent, such as guestrooms, lobbies, restaurants and cafeterias, and ballrooms, while fluorescent fixtures light up thework areas, such as offices, service and maintenance areas, as well as non-air-conditionedspaces.
The total lighting input power for the air-conditioned space is estimated at 307.66 kW. Only26.64 kW (or 8.66%) is attributed to fluorescent lamps; the remainder-281.02 (or 91.34%)-isattributed to incandescent lamps. Total lighting power density,· then is 19.17 W/m2
. This is notfar below the standard electrical design value of 20 W/m2
. The actual average lighting W/m2 forthe different areas of the building are tabulated below.
Area
Lobbies/HallwaysShopping ArcadeOfficesRestaurants/CafesGuestroomsFunction Rooms/BallroomsGeneral Service Areas
LightirpWlm
15.65307017.8115.8816.0844.559.47
Area Served inPercent of Total NetAir-Conditioned Area
8933.714.76
11.4857.559.753.82
Although in some areas the illuminance appears adequate, actual light measurements showilluminance levels at the working place or desk-top level that are lower than the IES (IlluminatingEngineering Society) recommended values. This condition is especially true in such areas asoffices, stairwells, the main kitchen, and hallways on the guestroom floors which are provided withfluorescent lighting. Good and adequate illumination is present in the lobbies, laundry, and mosthallway areas.
The overall low illuminance level in some areas can be attributed to:
The low light transmission characteristics of the plastic diffusers being used forfluorescent fixtures in the main kitchen and in office areas.
Task lighting in the guestrooms and in the cocktail lounge LaTerrasse, using onlyincandescent lamp fixtures.
Entirely incandescent lamp lighting in the restaurants and cafeterias, except inthe basement dining area.
Relatively high mounting heights of some fluorescent lamp fixtures in the basement hallways and utiliZing only 1 x 40 W fluorescent lamp per fixture.
Relatively dark ceiling and wall coloring.
On the other hand, marginally acceptable illuminance level in other areas can be attributed to:
Absence of diffusers for open-type fluorescent lamp fixtures in the basement hallways.
Utilizing 2 x 40 W fluorescent lamp fixtures instead of the 1 x 40 W type.
Available daylighting.
Lower fixture mounting height.
• The area being considered is the bUilding's net air-conditioned area
E-81r --- --_._-~--
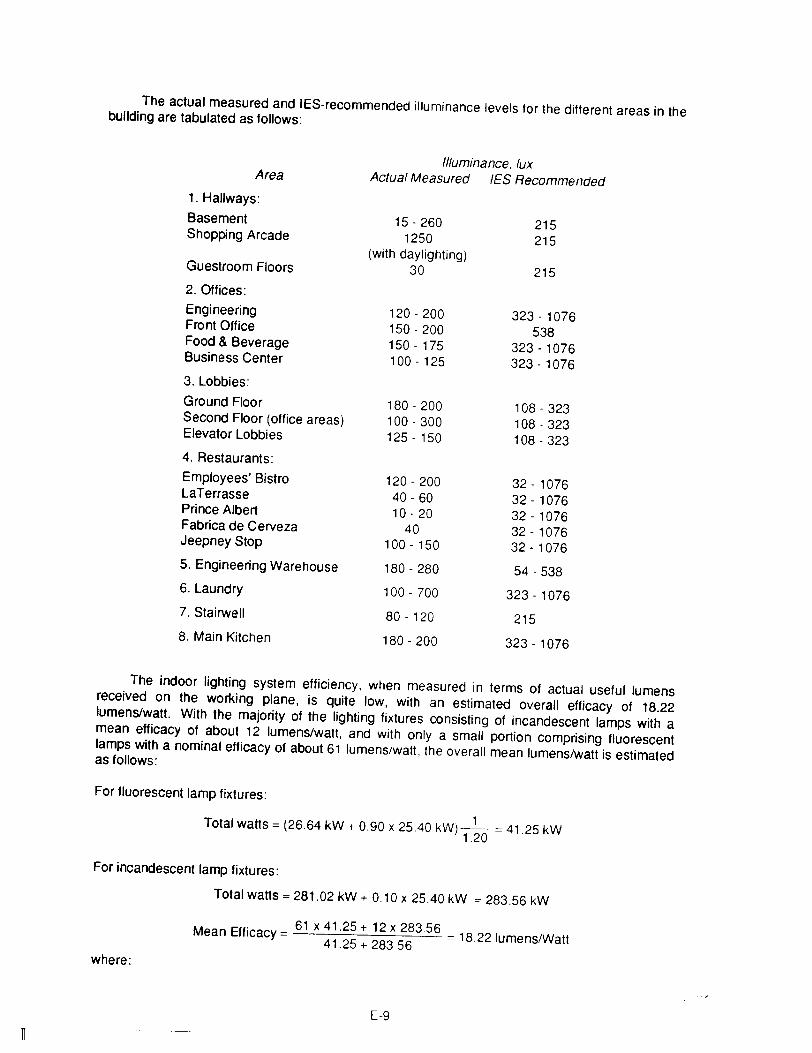
The actual measured and IES-recommended illuminance levels for the different areas in thebuilding are tabulated as follows:
Illuminance, luxArea Actual Measured IES Recommended
1. Hallways:
Basement 15 - 260 215Shopping Arcade 1250 215
(with daylighting)Guestroom Floors 30 2152. Offices:Engineering 120 - 200 323-1076Front Office 150 - 200 538Food & Beverage 150 - 175 323 - 1076Business Center 100 - 125 323 - 10763. Lobbies:
Ground Floor 180 - 200 108 - 323Second Floor (office areas) 100 - 300 108 - 323Elevator Lobbies 125 - 150 108 - 3234. Restaurants:Employees' Bistro 120 - 200 32 - 1076LaTerrasse 40 - 60 32 - 1076Prince Albert 10 - 20 32 - 1076Fabrica de Cerveza 40 32-1076Jeepney Stop 100 - 150 32 - 10765. Engineering Warehouse 180 - 280 54 - 5386. Laundry 100 - 700 323 - 10767. Stairwell 80 - 120 2158. Main Kitchen 180 - 200 323 - 1076
The indoor lighting system efficiency, when measured in terms of actual useful lumensreceived on the working plane, is quite low, with an estimated overall efficacy of 18.22lumens/watt. With the majority of the lighting fixtures consisting of incandescent lamps with amean efficacy of about 12 lumens/watt, and with only a small portion comprising fluorescentlamps with a nominal efficacy of about 61 lumens/watt, the overall mean lumens/watt is estimatedas follows:
For fluorescent lamp fixtures:
1Total watts = (26.64 kW + 0.90 x 25.40 kW)--O = 41.25 kW1.2
For incandescent lamp fixtures:
Total watts =281.02 kW + 0.10 x 2540 kW = 283.56 kW
Mean Efficacy = 61 x 41.2~+ 12 x 28356 = 18.22 lumens/Watt41.2 + 283.56
where:
E-9
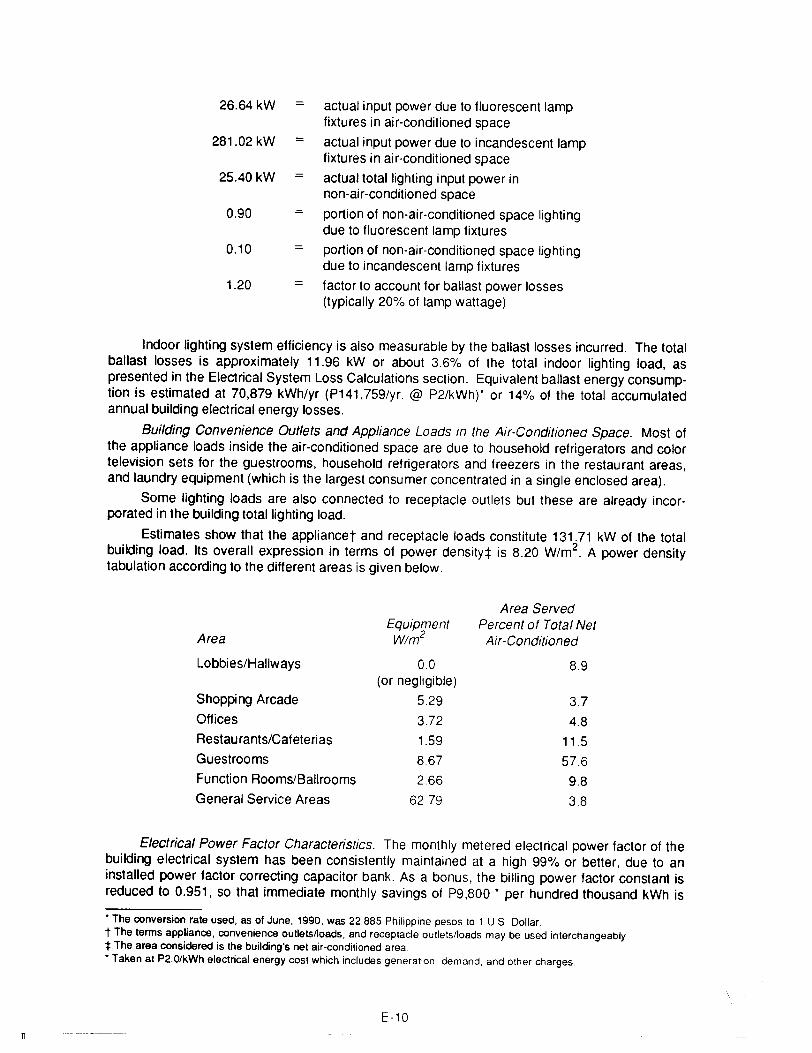
26.64kW
281.02 kW
25.40 kW
0.90
0.10
1.20
actual input power due to fluorescent lampfixtures in air-conditioned space
actual input power due to incandescent lampfixtures in air-conditioned space
actual total lighting input power innon-air-conditioned space
portion of non-air-conditioned space lightingdue to fluorescent lamp fixtures
portion of non-air-conditioned space lightingdue to incandescent lamp fixtures
factor to account for ballast power losses(typically 20% of lamp wattage)
Indoor lighting system efficiency is also measurable by the ballast losses incurred. The totalballast losses is approximately 11.96 kW or about 3.6% of the total indoor lighting load, aspresented in the Electrical System Loss Calculations section. Equivalent ballast energy consumption is estimated at 70,879 kWh/yr (P141 ,759/yr. @ P2/kWh)* or 14% of the total accumulatedannual building electrical energy losses.
Building Convenience Outlets and Appliance Loads in the Air-Conditioned Space. Most ofthe appliance loads inside the air-conditioned space are due to household refrigerators and colortelevision sets for the guestrooms, household refrigerators and freezers in the restaurant areas,and laundry equipment (which is the largest consumer concentrated in a single enclosed area),
Some lighting loads are also connected to receptacle outlets but these are already incorporated in the building total lighting load.
Estimates show that the appliancet and receptacle loads constitute 131.71 kW of the totalbuilding load. Its overall expression in terms of power density:t is 8.20 W/m2
. A power densitytabulation according to the different areas is given below.
Area
Lobbies/Hallways
Shopping Arcade
Offices
Restaurants/Cafeteri as
Guestrooms
Function Rooms/Ballrooms
General Service Areas
EquipmentW/m2
0.0(or negligible)
5.29
3.72
1.59
8.67
2.66
62.79
Area ServedPercent of Total Net
Air-Conditioned
8.9
3.7
4.8
11.5
57.6
9.8
3.8
IT
Electrical Power Factor Characteristics. The monthly metered electrical power factor of thebuilding electrical system has been consistently maintained at a high 99% or better, due to aninstalled power factor correcting capacitor bank. As a bonus, the billing power factor constant isreduced to 0.951, so that immediate monthly savings of P9,800 • per hundred thousand kWh is
• The conversion rate used, as of June, 1990, was 22.885 Philippine pesos to 1 US Dollart The terms appliance, convenience outlets/loads, and receptacle outlets/loads may be used interchangeably.;: The area considered is the building's net air-conditioned area• Taken at P2.0/kWh electrical energy cost which includes generation, demand, and other charges.
E-10

obtained.
Building Motor Loads. Table E-7 shows that motor loads compose approximately 76.9% ofthe building total load and require 73.6% of the building annual total electrical energy consumption. This indicates that the system is a major source of EGOs.As expected, the air-conditioning equipment accounts for the largest proportion of motorinput power, being rated at a total of approximately 823.61 kW, whereas other motors comprisingexhaust fans and blowers, elevators, etc .. only contribute about half as much at approximately417.81 kW.
Based on the detailed analysis of the air-conditioning system using computer simulations,average yearly operating and loading characteristics of the relevant motors can be evaluated.Other motors not included in the air-conditioning system are evaluated in a less sophisticated anddetailed manner, without benefit of computer simulation, and using only base-line and approximate values in order to come up with acceptable yearly energy usage estimates.The entire motor usage calculations, including usage factor (UF), load ratio (LR) determination, and energy losses breakdown are presented in the Electrical System sub-section.Further investigation of the motor operating characteristics, shown in Table E-7, reveals theprevalence of high motor LR characteristics, i.e., more or less 1.0 for those in the air-conditioningsystem. The highest LR values are registered by the chiller motors and fan coil units (FGUs),which are assumed to operate at full load continuously. Only the cooling tower fan motors havenoticeably low LR values. Miscellaneous motors such as boiler feed pumps and air compressorhave varying LR values, since they are assumed to operate at widely varying loads and have verylow UF values, due to their intermittent usage over a 24-hour period. Water pumps and hot waterpumps with varying LR values, but with UF values of 0.6042 and 0.3333. are assumed to operateat variable loads at different time intervals equivalent to a total of 14.5 and 8 hours at peak loaddaily, respectively.
As a method of analysis, the UF values may be taken as representative of the motor loadingratios, provided the motor operates almost continuously for 24 hours a day. Such a condition istrue for the motors of the air-conditioning system, exhaust fans, and blowers as well as miscellaneous kitchen equipment and refrigerators which have almost equal UF and LR values.Based on the UF values, in addition to actual LR determination, it can be seen that the fanmotors of the air handling units are operating at underloaded conditions. Maintaining a lower fancfm may actually be part of an energy conservation plan. Still, an energy conservation opportunityexists here, as these motors are usually oversized. A similar case is evident in the cooling towerfan motors' loading performance. These motors were found to have very low computed LRvalues-at 0.3425-which shows that these are also oversized.Motor losses contribute roughly 84.3% to total energy losses incurred (see Table E-11).This figure implies that a good deal of energy savings can be realized just by reducing the losses.Again, the larger portion of these losses (55.4%) comes from the air-conditioning motor equipment.
Building Load Demand and Energy Usage Profile. Figures E-1 and E-2 show the loaddemand profile for the year 1987 as well as the first quarter report on the same data for the year1988 (see Table E-10). Illustrated are the behaviors of the monthly kW demand and kWh consumption, and load factor. The highest peak demand kW at 1416 kW was registered during themonth of June and the lowest at 1050 kW on January. The monthly usage averaged over elevenmonths (Le., excluding the month of February, when usage is too low) is 582,436 kWh. This average can now be used to obtain a yearly reference usage value. i.e., 6,989,236 kWh/yr, which isused to validate the simulated yearly usage of 6,989,083 kWh/yr. (see Table E-12) with a percentage error of only 0.002.The efficiency of maximum demand use is measured by the parameter Load Factor (LF). Inan ideal situation, the LF value is 1.0 and this means that, for the period (i.e., one month) at whichthe peak demand was taken, the load demand was constant at the value equal to the maximumdemand. This, therefore, is an optimized situation, wherein the demand charge costs do not have
E-11
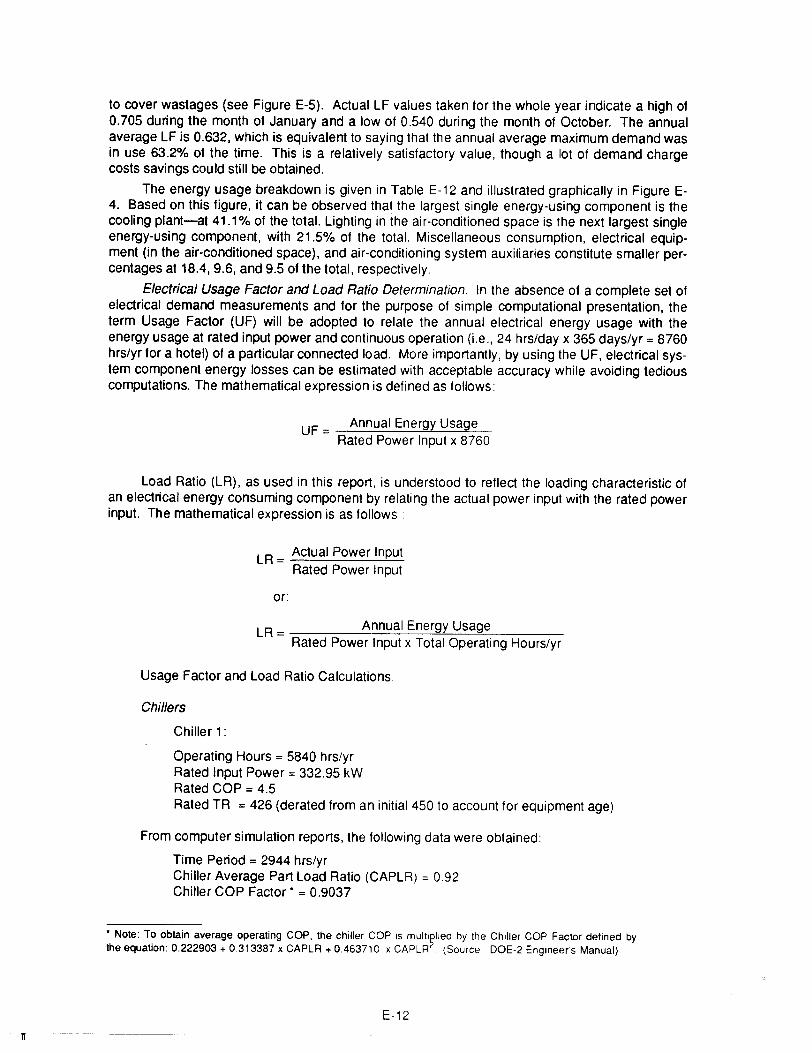
n
to cover wastages (see Figure E-5). Actual LF values taken for the whole year indicate a high of0.705 during the month of January and a low of 0.540 during the month of October. The annualaverage LF is 0.632, which is equivalent to saying that the annual average maximum demand wasin use 63.2% of the time. This is a relatively satisfactory value, though a lot of demand chargecosts savings could still be obtained.
The energy usage breakdown is given in Table E-12 and illustrated graphically in Figure E4. Based on this figure, it can be observed that the largest single energy-using component is thecooling plant-at 41.1% of the total. Lighting in the air-conditioned space is the next largest singleenergy-using component, with 21.5% of the total. Miscellaneous consumption, electrical equipment (in the air-conditioned space), and air-conditioning system auxiliaries constitute smaller percentages at 18.4,9.6, and 9.5 of the total, respectively.
Electrical Usage Factor and Load Ratio Determination. In the absence of a complete set ofelectrical demand measurements and for the purpose of simple computational presentation, theterm Usage Factor (UF) will be adopted to relate the annual electrical energy usage with theenergy usage at rated input power and continuous operation (i.e., 24 hrs/day x 365 days/yr = 8760hrs/yr for a hotel) of a particular connected load. More importantly, by using the UF, electrical system component energy losses can be estimated with acceptable accuracy while avoiding tediouscomputations. The mathematical expression is defined as follows:
UF = Annual Energy UsageRated Power Input x 8760
Load Ratio (LR), as used in this report, is understood to reflect the loading characteristic ofan electrical energy consuming component by relating the actual power input with the rated powerinput. The mathematical expression is as follows:
LR = Actual Power InputRated Power Input
or:
LR = Annual Energy UsageRated Power Input x Total Operating Hours/yr
Usage Factor and Load Ratio Calculations
Chillers
Chiller 1:
Operating Hours = 5840 hrs/yrRated Input Power = 332.95 kWRated COP =4.5Rated TR = 426 (derated from an initial 450 to account for equipment age)
From computer simulation reports, the following data were obtained:
Time Period = 2944 hrs/yrChiller Average Part Load Ratio (CAPLR) = 0.92Chiller COP Factor' = 0.9037
• Note: To obtain average operating COP, the chiller COP is mUlti~lled by the Chiller COP Factor defined bythe equation: 0.222903 + 0.313387 x CAPlR + 0.463710 x CAPlR (Source DOE-2 Engineer'S Manual)
E-12
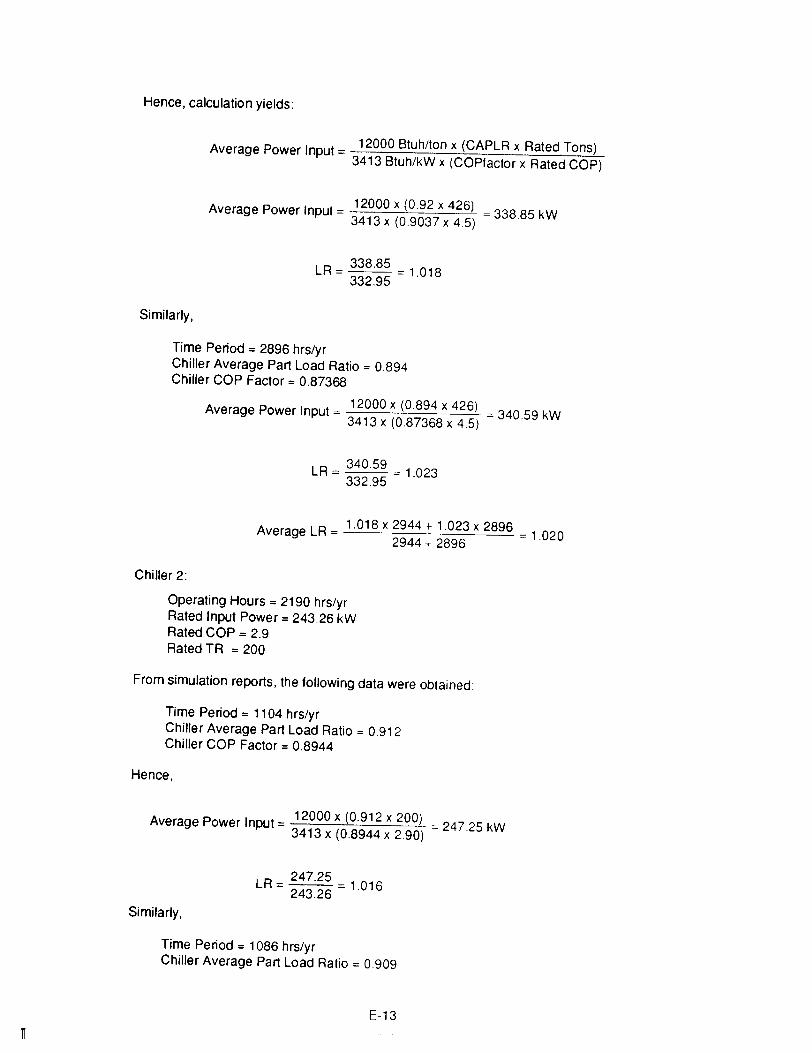
Hence. calculation yields:
A P I t12000 Btuh/ton x (CAPLR x Rated Tons)verage ower npu = .3413 Btuh/kW x (COP!actor x Rated COP)
Average Power Input = 12000 x (0.92 x 426) = 338.85 kW3413 x (0.9037 x 4.5)
LR = 338.85 = 1.018332.95
Similarly.
Time Period = 2896 hrs/yrChiller Average Part Load Ratio =0.894Chiller COP Factor = 0.87368
Average Power Input = 12000 x (0.894 x 426) = 340.59 kW3413 x (0.87368 x 4.5)
LR = 340.59 = 1.023332.95
Avera e LR = 1.018 x 2944 + 1.023 x 2896 = 1.020g 2944 T 2896
Chiller 2:
Operating Hours = 2190 hrs/yrRated Input Power = 243.26 kWRated COP = 2.9Rated TR = 200
From simulation reports, the following data were obtained:
Time Period = 1104 hrs/yrChiller Average Part Load Ratio = 0.912Chiller COP Factor =0.8944
Hence.
LR = 247.25 = 1.016243.26
Similarly.
Time Period = 1086 hrs/yrChiller Average Part Load Ratio = 0.909
E-13
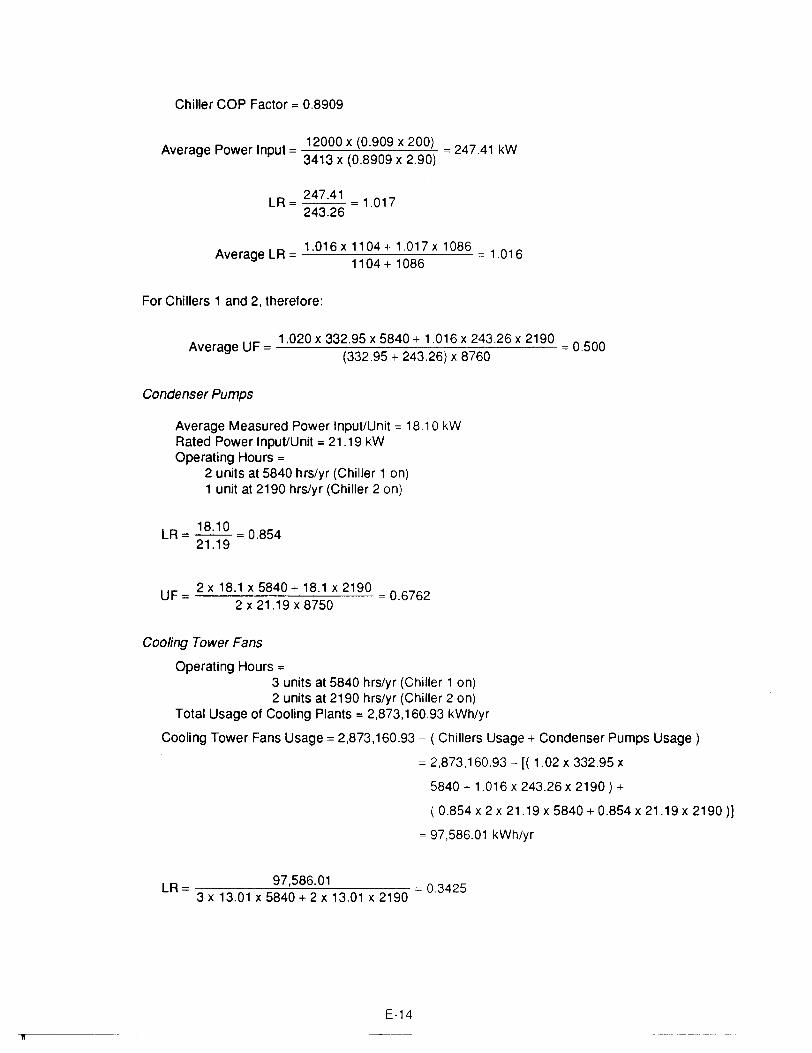
Chiller COP Factor = 0.8909
Avr Pwrln t= 12000x(0.909x200) =:247.41kWe age 0 e pu 3413 x (0.8909 x 2.90)
LR =: 247.41 = 1.017243.26
A LR= 1.016x 1104+ 1.017x 1086 = 1.016verage 11 04 + 1086
For Chillers 1 and 2, therefore:
Av r UF = 1.020 x 332.95 x 5840 + 1.016 x 243.26 x 2190 =: 0.500e age (332.95 + 243.26) x 8760
Condenser Pumps
Average Measured Power Input/Unit = 18.10 kWRated Power InpuVUnit = 21 .19 kWOperating Hours =
2 units at 5840 hrs/yr (Chiller 1 on)1 unit at 2190 hrslyr (Chiller 2 on)
LR= 18.10 =0.85421.19
UF = 2 x 18.1 x 5840 + 18.1 x 2190 = 0.67622 x 21.19 x 8750
Cooling Tower Fans
Operating Hours =3 units at 5840 hrs/yr (Chiller 1 on)2 units at 2190 hrs/yr (Chiller 2 on)
Total Usage of Cooling Plants =2,873,160.93 kWh/yr
Cooling Tower Fans Usage =: 2,873,160.93 - ( Chillers Usage + Condenser Pumps Usage)
= 2,873,160.93 - [( 1.02 x 332.95 x
5840 + 1.016 x 243.26 x 2190) +
( 0.854 x 2 x 21.19 x 5840 + 0.854 x 21.19 x 2190 ))
= 97,586.01 kWh/yr
LR = 97,586.01 = 0.34253 x 13.01 x 5840 + 2 x 13.01 x 2190
E-14
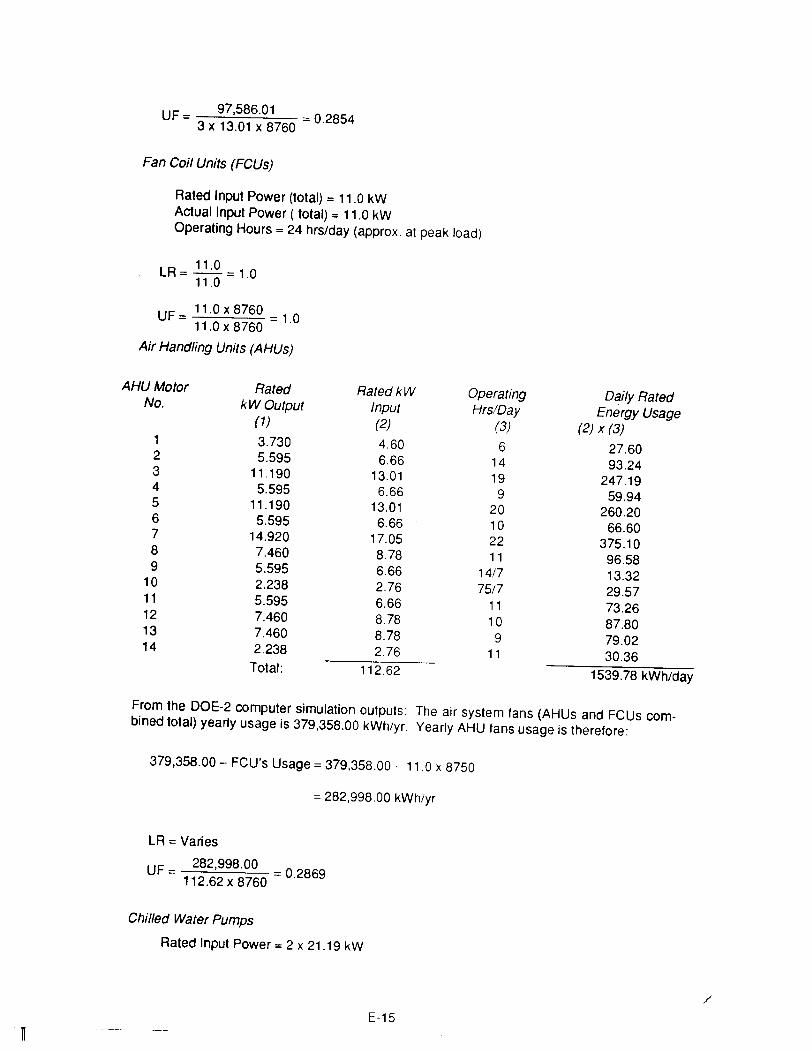
UF = 97,586.01 = 0.28543 x 13.01 x 8760
Fan Coil Units (FCUs)
Rated Input Power (total) = 11.0 kWActual Input Power ( total) = 11.0 kWOperating Hours = 24 hrslday (approx. at peak load)
LR = l!.:Q. = 1.011.0
UF= 11.0x8760 =1.011.0 x 8760
Air Handling Units (AHUs)
AHUMotor Rated RatedkW OperatingNo. kWOutput Input Hrs/Day
(1) (2) (3)1 3.730 4.60 62 5.595 6.66 143 11.190 13.01 194 5.595 6.66 95 11.190 13.01 206 5.595 6.66 107 14.920 17.05 228 7.460 8.78 119 5.595 6.66 14/7
10 2.238 2.76 75/711 5.595 6.66 1112 7.460 8.78 1013 7.460 8.78 914 2.238 2.76 11
Total: 112.62
Daily RatedEnergy Usage
(2) x (3)
27.6093.24
247.1959.94
260.2066.60
375.1096.5813.3229.5773.2687.8079.0230.36
1539.78 kWh/day
From the DOE-2 computer simulation outputs: The air system fans (AHUs and FCUs combined total) yearly usage is 379,358.00 kWh/yr. Yearly AHU fans usage is therefore:
379,358.00 - FCU's Usage = 379,358.00 - 11.0 x 8750
=282,998.00 kWh/yr
LR = Varies
UF = 282,998.00 = 0.2869112.62 x 8760
Chilled Water Pumps
Rated Input Power =2 x 21.19 kW
E-15
.J"
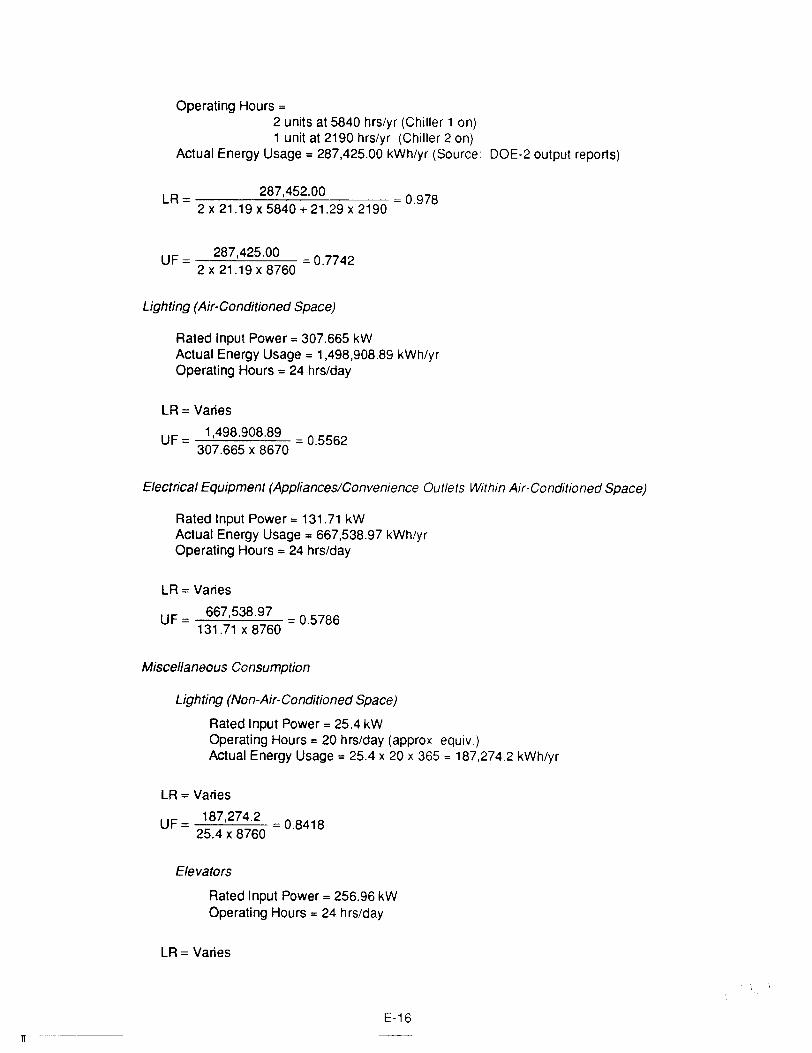
Operating Hours =
2 units at 5840 hrs/yr (Chiller 1 on)1 unit at 2190 hrs/yr (Chiller 2 on)
Actual Energy Usage = 287,425.00 kWh/yr (Source: DOE-2 output reports)
LR = 287,452.00 = 0.9782 x 21.19 x 5840 + 21.29 x 2190
UF = 287,425.00 =0.77422 x 21.19 x 8760
Lighting (Air-Conditioned Space)
Rated Input Power = 307.665 kWActual Energy Usage = 1,498,908.89 kWh/yrOperating Hours = 24 hrs/day
LR = Varies
UF = 1,498.908.89 = 0.5562307.665 x 8670
Electrical Equipment (Appliances/Convenience Outlets Within Air-Conditioned Space)
Rated Input Power = 131.71 kWActual Energy Usage = 667,538.97 kWh/yrOperating Hours =24 hrs/day
LR = Varies
UF = 667,538.97 =0.5786131.71 x 8760
Miscellaneous Consumption
Lighting (Non-Air-Conditioned Space)
Rated Input Power =25.4 kWOperating Hours = 20 hrs/day (approx. equiv.)Actual Energy Usage = 25.4 x 20 x 365 = 187,274.2 kWh/yr
LR = Varies
UF = 187,274.2 =0.841825.4 x 8760
Elevators
Rated Input Power =256.96 kWOperating Hours = 24 hrs/day
LR = Varies
E-16
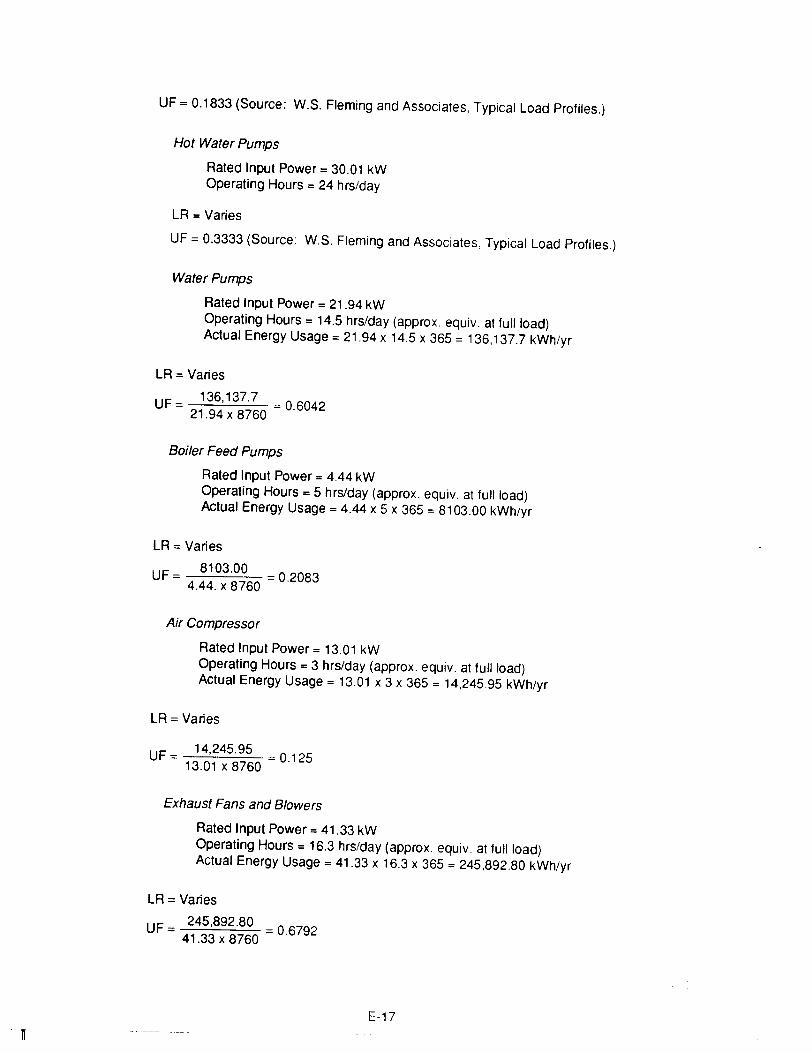
n
UF = 0.1833 (Source: W.S. Fleming and Associates, Typical Load Profiles.)
Hot Water Pumps
Rated Input Power = 30.01 kWOperating Hours = 24 hrs/day
LR = Varies
UF = 0.3333 (Source: W.S. Fleming and Associates, Typical Load Profiles.)
Water Pumps
Rated Input Power = 21.94 kWOperating Hours = 14.5 hrs/day (approx. equiv. at full load)Actual Energy Usage = 21.94 x 14.5 x 365 = 136,137.7 kWh/yr
LR = Varies
UF = 136,137.7 = 0.604221.94 x 8760
Boiler Feed Pumps
Rated Input Power = 4.44 kWOperating Hours =5 hrsJday (approx. equiv. at full load)Actual Energy Usage =4.44 x 5 x 365 = 8103.00 kWh/yr
LR = Varies
UF = 8103.00 = 0.20834.44. x 8760
Air Compressor
Rated Input Power = 13.01 kWOperating Hours = 3 hrsJday (approx. equiv. at full/oad)Actual Energy Usage = 13.01 x 3 x 365 = 14,245.95 kWh/yr
LR = Varies
UF= 14,245.95 =0.12513.01 x 8760
Exhaust Fans and Blowers
Rated Input Power =41.33 kWOperating Hours = 16.3 hrs/day (approx. equiv. at full load)Actual Energy Usage = 41.33 x 16.3 x 365 = 245,892.80 kWh/yr
LR = Varies
UF = 245,892.80 = 0.679241.33 x 8760
E-17
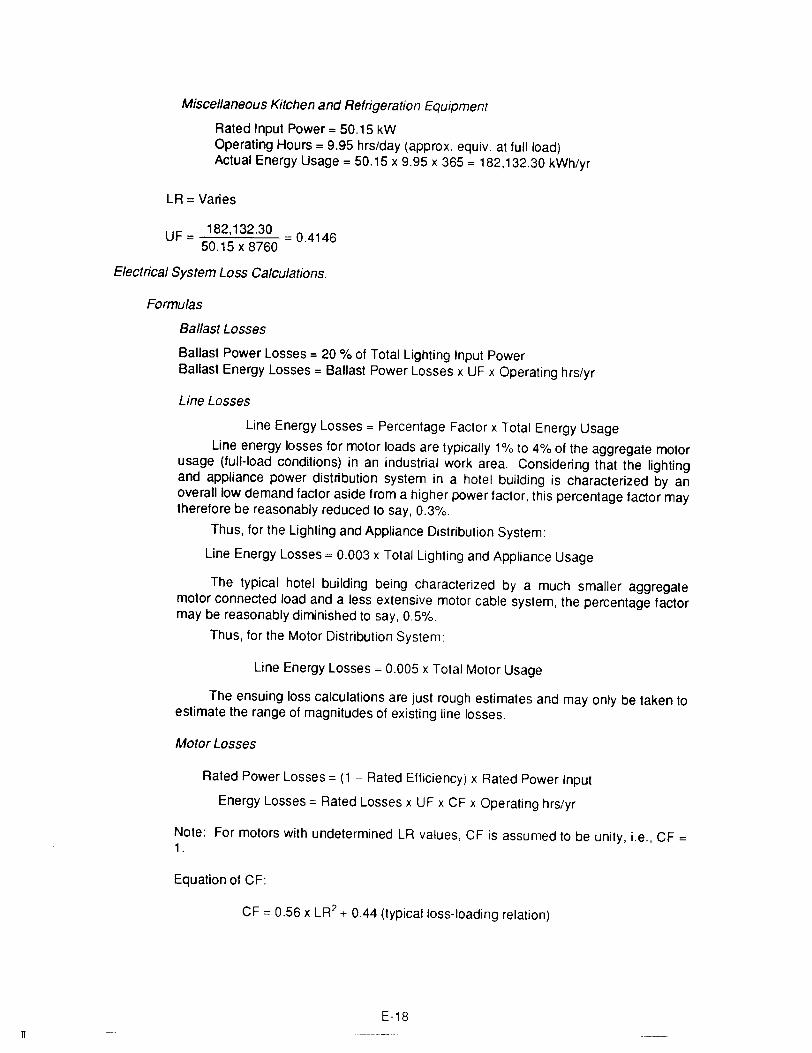
11
Miscellaneous Kitchen and Refrigeration Equipment
Rated Input Power = 50.15 kWOperating Hours =9.95 hrs/day (approx. equiv. at full load)Actual Energy Usage =50.15 x 9.95 x 365 = 182,132.30 kWh/yr
LR = Varies
UF = 182,132.30 = 0.414650.15 x 8760
Electrical System Loss Calculations.
Formulas
Ballast Losses
Ballast Power Losses = 20 % of Total Lighting Input PowerBallast Energy Losses =Ballast Power Losses x UF x Operating hrs/yr
Line Losses
Line Energy Losses = Percentage Factor x Total Energy Usage
Line energy losses for motor loads are typically 1% to 4% of the aggregate motorusage (full-load conditions) in an industrial work area. Considering that the lightingand appliance power distribution system in a hotel building is characterized by anoverall low demand factor aside from a higher power factor, this percentage factor maytherefore be reasonably reduced to say, 0.3%.
Thus, for the Lighting and Appliance Distribution System:
Line Energy Losses = 0.003 x Total Lighting and Appliance Usage
The typical hotel building being characterized by a much smaller aggregatemotor connected load and a less extensive motor cable system, the percentage factormay be reasonably diminished to say, 0.5%.
Thus, for the Motor Distribution System:
Line Energy Losses =0.005 x Total Motor Usage
The ensuing loss calculations are just rough estimates and may only be taken toestimate the range of magnitudes of existing line losses.
Motor Losses
Rated Power Losses = (1 - Rated Efficiency) x Rated Power Input
Energy Losses =Rated Losses x UF x CF x Operating hrs/yr
Note: For motors with undetermined LR values, CF is assumed to be unity, i.e., CF =1.
Equation of CF:
CF =0.56 x LR2 + 0.44 (typical less-leading relation)
E-18
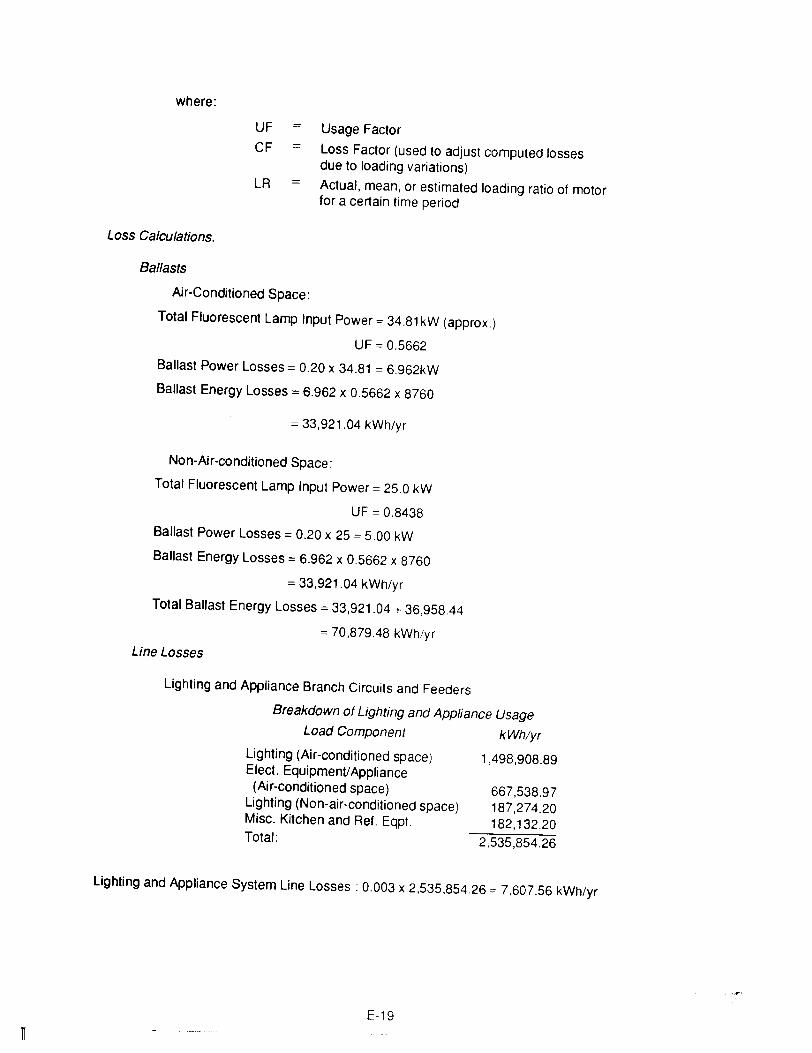
667,538.97187,274.20182,132.20
2,535,854.26
n
where:
UF Usage FactorCF Loss Factor (used to adjust computed losses
due to loading variations)LR Actual, mean, or estimated loading ratio of motor
for a certain time period
Loss Calculations.
Ballasts
Air-Conditioned Space:
Total Fluorescent Lamp Input Power =34.81 kW (approx.)
UF =0.5662
Ballast Power Losses = 0.20 x 34.81 = 6.962kW
Ballast Energy Losses = 6.962 x 0.5662 x 8760
= 33,921.04 kWh/yr
Non-Air-conditioned Space:
Total Fluorescent Lamp Input Power = 25.0 kW
UF = 0.8438
Ballast Power Losses = 0.20 x 25 = 5.00 kW
Ballast Energy Losses =6.962 x 0.5662 x 8760
= 33,921.04 kWh/yr
Total Ballast Energy Losses = 33,921.04 + 36,958.44
= 70,879.48 kWh/yr
Line Losses
Lighting and Appliance Branch Circuits and Feeders
Breakdown of Lighting and Appliance UsageLoad Component kWhlyr
Lighting (Air-conditioned space) 1,498,908.89Elect. Equipment!Appliance
(Air-conditioned space)Lighting (Non-air-conditioned space)Misc. Kitchen and Ref. Eqpt.Total:
Lighting and Appliance System Line Losses: 0.003 x 2,535,854.26 =7,607.56 kWh/yr
E-19
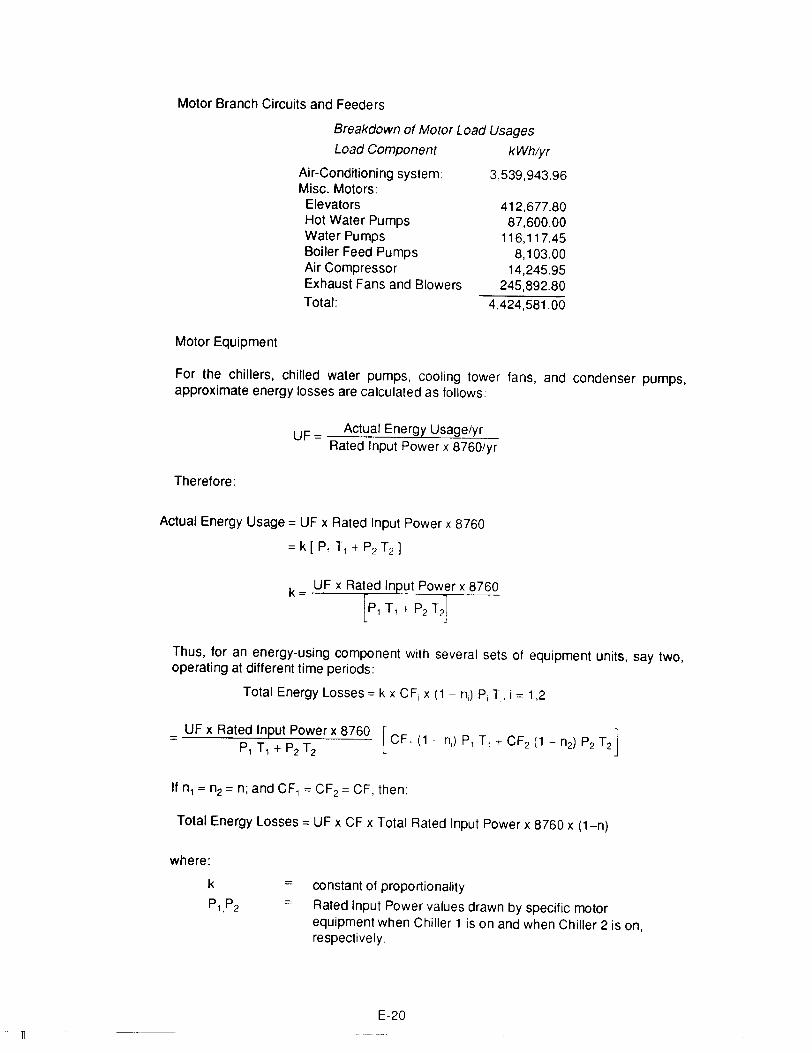
412,677.8087,600.00
116,117.458,103.00
14,245.95245,892.80
4,424,581.00
Motor Branch Circuits and Feeders
Breakdown of Motor Load Usages
Load Component kWhlyr
Air-Conditioning system: 3,539,943.96Misc. Motors:
ElevatorsHot Water PumpsWater PumpsBoiler Feed PumpsAir CompressorExhaust Fans and Blowers
Total:
Motor Equipment
For the chillers, chilled water pumps, cooling tower fans, and condenser pumps,approximate energy losses are calculated as follows:
UF = Actual Energy Usage/yrRated Input Power x 8760/yr
Therefore:
Actual Energy Usage = UF x Rated Input Power x 8760
= k [ P, T, + P2 T2 ]
k = UF x Rated Input Power x 8760
[P1 T, + P2 T2]
Thus. for an energy-using component with several sets of equipment units, say two,operating at different time periods:
Total Energy Losses =k x CF, x (1 - n,) Pi T" i = 1,2
= UF x Rated Input Power x 8760 [CF. (1 - n,) P, T, + CF2 (1 - n2) P2 T2J
P, T, + P2 T2
If n, = n2 = n; and CF, =CF2 =CF, then:
Total Energy Losses =UF x CF x Total Rated Input Power x 8760 x (1-n)
where:
n
==
constant of proportionality
Rated Input Power values drawn by specific motorequipment when Chiller 1 is on and when Chiller 2 is on,respectively.
E-20
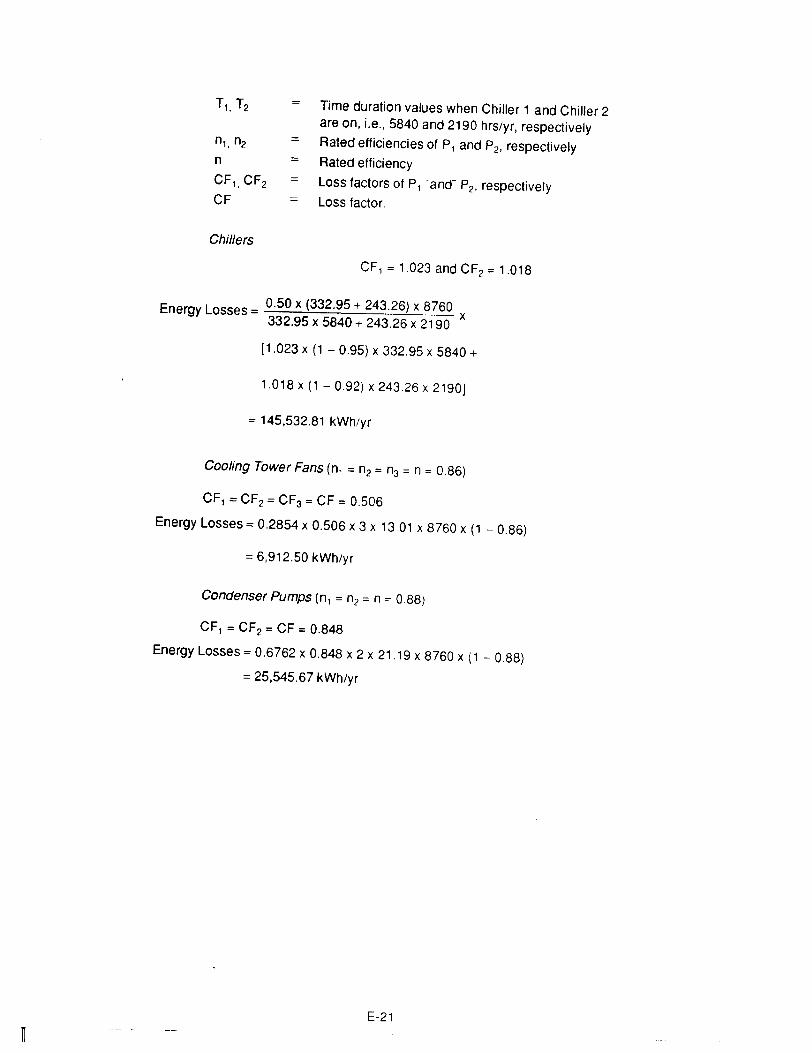
Chillers
=
Time duration values when Chiller 1 and Chiller 2are on, i.e., 5840 and 2190 hrs/yr, respectivelyRated efficiencies of P, and P2, respectivelyRated efficiencyLoss factors of P1 -and- P2, respectivelyLoss factor.
CF, =1.023 and CF2 =1.018
E L 0.50 x (332.95 + 243.26) x 8760nergy asses = 332.95 x 5840 + 243.26 x 2190 x
[1.023 x (1 - 0.95) x 332.95 x 5840 +
1.018 x (1 - 0.92) x 243.26 x 2190]
= 145,532.81 kWh/yr
Cooling Tower Fans (n, = n2 = n3 = n = 0.86)
CF1 = CF2= CF3 =CF =0.506
Energy Losses = 0.2854 x 0.506 x 3 x 13.01 x 8760 x (1 - 0.86)
= 6,912.50 kWh/yr
Condenser Pumps (n, = n2 = n = 0.88)
CF1 =CF2 =CF =0.848
Energy Losses = 0.6762 x 0.848 x 2 x 21.19 x 8760 x (1 - 0.88)
=25,545.67 kWh/yr
E-21
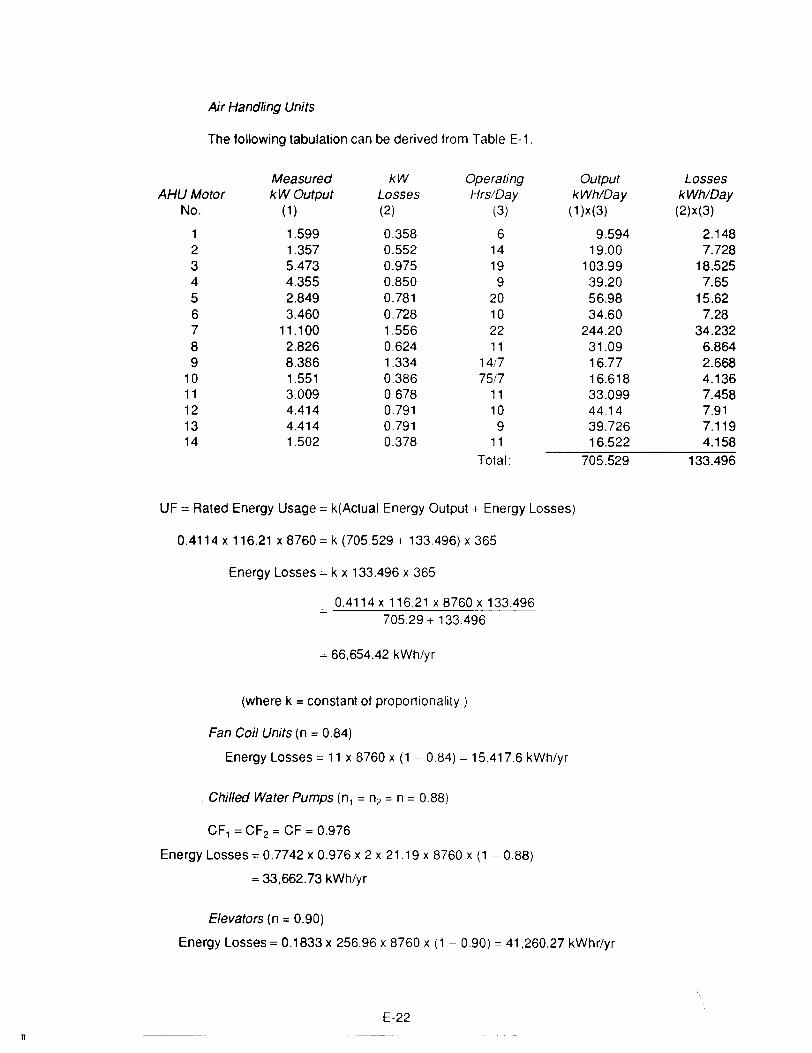
n
Air Handling Units
The following tabulation can be derived from Table E-1,
Measured kW Operating Output LossesAHU Motor kWOutput Losses Hrs/Oay kWh/Day kWh/Day
No. (1 ) (2) (3) (1)x(3) (2)x(3)
1 1.599 0.358 6 9.594 2.1482 1.357 0.552 14 19.00 7.7283 5.473 0.975 19 103.99 18.5254 4.355 0.850 9 39.20 7.655 2.849 0.781 20 56.98 15.626 3.460 0.728 10 34.60 7.287 11.100 1.556 22 244.20 34.2328 2.826 0.624 11 31.09 6.8649 8.386 1.334 14/7 16.77 2.668
10 1.551 0.386 75/7 16.618 4.13611 3.009 0,678 11 33.099 7.45812 4.414 0,791 10 44.14 7.9113 4.414 0,791 9 39.726 7.11914 1.502 0.378 11 16.522 4.158
Total: 705.529 133.496
UF = Rated Energy Usage =k(Actual Energy Output + Energy Losses)
0.4114 x 116.21 x 8760 =k (705529 + 133.496) x 365
Energy Losses =k x 133.496 x 365
0.4114x 116.21 x8760x 133.496= 705,29 + 133.496
=66,654.42 kWh/yr
(where k = constant of proportionality)
Fan Coil Units (n = 0.84)
Energy Losses =11 x 8760 x (1 - 0,84) =15,417.6 kWh/yr
Chilled Water Pumps (n, = n2 = n = 0,88)
CF1 = CF2 = CF = 0.976
Energy Losses = 0.7742 x 0.976 x 2 x 21 19 x 8760 x (1 - 0,88)
= 33,662.73 kWh/yr
Elevators (n = 0.90)
Energy Losses = 0.1833 x 256,96 x 8760 x (1 - 0,90) = 41,260.27 kWhr/yr
E-22
Hot Water Pumps (n =0.87)
Energy Losses = 0.3333 x 30.01 x 8760 x (1 - 0.87) =0 11,390.66 kWh/yr
Water Pumps (n =0.85)
Energy Losses =0.6042 x 21.941 x 8760 x (1 - 0.85) =17,418.58 kWh/yr
Boiler Feed Pumps (n = 0.84)
Energy Losses = 0.2083 x 4.44 x 8760 x (1 - 0.84) =0 1296.27 kWh/yr
Air Compressor (n = 0.86)
Energy Losses = 0.125 x 13.01 x 8760 x (1 - 0.86) =0 1994.43 kWh/yr
Miscellaneous Kitchen and Refrigeration Equipment (n =0.83)Energy Losses =0.4146 x 50.15 x 8760 x (1 - 0.83) =0 30,963.73 kWh/yr
Exhaust Fans and Blowers (n = 0.84)
Energy Losses =0.6792 x 41.33 x 8760 x (1 - 0.84) =0 39,344.78 kWh/yr
Recommendations:
Distribution System.
Distribution Imbalance. Distribution imb.alances, such as voltage imbalance across thephases and line current imbalance, will cause inefficiencies in all motors connected to thedistribution system. Hence, it is always important to check if system voltage imbalance orline current imbalance is present. If these defects are found to be occurring in the system,adequate steps should be taken to improve the balance of the loads on each panel. As abenchmark, it is acceptable to have the panelboard loading (amperes) balanced within 10%or lesser of each phase. Voltage imbalance tolerance, as a rule, is much smaller as compared to "allowable" current imbalance.Under-Utilized Transformer Capacity. The hotel building's electrical loads are suppliedvia two transformers with a capacity of 1500 KVA each and are located in the same substation. From the utility billing receipts, it was found that the highest maximum demandregistered was 1416 kW during June 1987 (see Table E-10) Since this value is less than therated capacity of one transformer operating at a high power factor, the total transformerlosses could be substantially reduced by connecting all loads to a single 1500 KVAtransformer. The other transformer then becomes a standby unit and the losses associatedwith it are avoided.
Savings are calculated as follows:
Annual Savings = 1,500(1 - 0.984)0.20 x 8760
= 42,048 kWh/yr
where:
1500
0.984
0.20
8760
=
=
KVA rating of the transformer to be taken off.rated efficiency of the transformer (typical).iron loss factoroperating hours per year
E-23
11
Note that these values should be treated only as a partial guide. Further technicalevaluation should be conducted in order to come up with actual measured data and supporting analysis.
Indoor Lighting System.
• Low illumination levels, especially in work areas, can initially be improved at minimalcost by:
Cleaning of lamps, diffusers and reflectors regularly as accumulation of dirtreduces the efficacy of the fixture.
Repainting of fixture reflectors, if necessary.
Repainting the ceiling with lighter finishes.
Cleaning walls regularly to avoid accumulation of light-absorbing dirt.
• Low illumination levels in the hotel spaces occupied or frequented by hotel guests andcustomers are due mostly to incandescent lighting. Therefore, further steps toincrease these illumination levels could either result in more capital expenditures, suchas by increasing the number of connected incandescent lamps; reducing the localizedambience provided by incandescent lighting; and more capital outlay for lamps withreduced color-rendering properties but higher efficacy, such as fluorescents. Hence,further study should be conducted in order to decide on a feasible compromise. Tomention one possible solution, in such places where natural light is available, theincandescent fixtures should be controlled by a suitable lighting control mechanism,such as a manually or automatically operated light dimmer, so as to optimize theusage of sunlight by dimming the artificial lighting whenever sufficient daylight is available.
• Further optimization measures could be undertaken-especially in areas wherefluorescent lighting is present-with minimal cost, by:
Removing all louvers and diffusers in areas where the illumination is low and theconsequent glare can be tolerated, such as in the kitchen, service elevators, andstorage areas.
Turning off lights during daytime in areas where their light is hardly noticeable, asin the shopping arcade (with incandescent lighting), particularly in the areasclosest to the windows.
Checking if the ballasts of delamped fluorescent fixtures are still connected. Fora two-lamp fixture, where one lamp is removed but the associated ballast stillconnected, energy still consumed by the ballast amounts to 20% of the lampusage. It is important to cut the black and white leads of the relevant ballastsonce these are found in order to effectively disconnect them from the circuit.
Small Appliance and Convenience Outlets. Employees should be encouraged to turn offelectrical office equipment, such as copiers, typewriters, calculators, and water heaters when notin use. Avoid "idling" of shop and kitchen electrical machines and tools. Refrigerators should belocated so as to allow sufficient air circulation at their back portions where the associated aircooled condensers are installed. Regular cleaning routines for this equipment will allow furtherenergy savings.
Electrical Power Factor Characteristics. The existing power factor (PF) correcting capacitorbank is-as is usual -installed at the main distribution panel. This, however, requires automaticsensing of the prevailing PF and automatic switching of the capacitors. This is due to the variablecharacteristic of the overall system PF which is dependent on the percent loading of the connected loads-specifically, the motors-and the turning on and off of the loads. Therefore, it issuggested that the automatic sensing and switching device, if there is one, be investigated.Without this device, turning off a large portion of the motor loads can cause over-correction of thesystem PF. This, in turn, leads to overvoltage that is both harmful to equipment and can causemomentary inefficiencies, which will accumulate with the passage of time.
E-24
Another way to achieve PF correction is to connect individual capacitors to each motor. Thismethod ensures that the motor line losses will be considerably reduced, due to the PF improvement of the motor distribution system. Notice that although the system PF is improved by theinstallation of a capacitor bank at the main distribution panel, the PF of the motor distribution system is uncorrected-with comparatively higher line losses than if it were PF corrected. The onlydrawback to this method is the higher cost per capacitor KVAR as compared to the other method.It is therefore suggested that, upon thorough technical evaluation, the value of avoidingovervoltage in the electrical system through capacitor automatic sensing and switching be seriously considered, and if such measures are not yet in effect, that relevant actions be undertaken.Furthermore, it may also be worth considering connecting individual capacitors to motors, particularly those with very low measured PFs.Building Motor Loads. ECOs in motor loads may be found and isolated in the underloadedmotors of the AHUs and cooling tower fans.Table E-1 presents the findings on the AHUs and the cooling tower fan motors. Inputpowers (kW) for all the motors were measured at actual loading conditions, except for the coolingtower fan motors, due to their inaccessibility. Estimated input power for each cooling tower fanmotor was obtained by multiplying the motor input kW rating by the computed average loadingratio (LR is 0.3425, see Table E-7). Motor nameplate HP ratings and typical efficiencies at fullload, three-quarter load, and half-load were also tabulated. These data were then input to a computer program specifically developed to generate the motors' loss equations and from these, calculate the actual motor output powers, losses, percent efficiencies, and loadings. Tables E-1 andE-2 are reproductions of the software's output showing data needed for evaluation of motor lossesand sizing. From these tables, the motors are identified only by their respective motor numbers.Thus, for proper identification as to the area served, Table E-8 should be consulted. Motor No. 15is not the AHU motor in the pre-cooler area (which is not operational), but is, rather, a single motorunit representing each of the three cooling tower fan motors. In the absence of actual measurements, the assumption is that the three cooling tower fan motors have identical actual operatingdata to that of motor No. 15. Hence, operating hours of motor No. 15 in Table E-6 is the aggregate operating hours of the three cooling tower fan motors.
Using these processed data, the motors' typical efficiency vs. loading curves can be easilyplotted, as in Figure E-6. Notice the shape of the curves. As the loading progresses from zeroupwards, the losses increase as the variable losses increase in proportion to the percent loading.The characteristic is also illustrated by the equations below:
where:
L
L100
A
BX
===
=
L = L100 (Ax2 + B) : Motor Loss Equation
losses at any load
losses at full load
constant (variable losses coefficient)constant (fixed losses coefficient)loading ratio = actual output power/rated output power
(1 )
Further mathematical manipulation yields the equation of the efficiency vs. percent loadingcurves as follows:
where:
100 1 k (A PL 1OOB) Eft'· P L d' E 'PE = + x 100 +~: IClency VS. ercent oa mg quatlon
PE actual efficiency (%)
E-25
(2)
1l
k L,oofrated output (kW)
PL percent actual loading
Given the loss equation constants A and B and using Equations 1 and 2, simulation of thelosses and efficiency at any load can be undertaken for the purpose of proper motor sizing andoptimized loading.
Tables E-1 and E-2 present the processed data based on actual input power measurements(except for the cooling tower fan motors). However, the basis for further detailed technical evaluation (i.e., sizing of replacement motors) is the measured input power data of AHU motors multiplied by the factor C (0.924) to account for deviations from the measured actual input power dataof each AHU motor. These are based on the computer simulation results of the motors' kWh/yrusage. This new set of input power data is then computer-processed, as presented in Tables E-3and E-4. Utilizing the resulting data, calculations using a computer spreadsheet software packagesuch as the Lotus 123 program are generated in a tabular format as seen in Table E-6. The procedure is to size the approximate replacement motor by dividing the present motor output (kW) by0.746 (the conversion factor from kW to HP). As a rule, a replacement motor is sized according tothe nearest higher HP rating, in anticipation of future increase in loads. Table E-6 shows the calculated sizes of the replacement motors. The kWh usage savings are derived by calculating theusage differences between the existing and the replacement motors. Those replacements withnegative savings are canceled and the corresponding existing motors then considered properlysized, whereas those with positive values are considered for possible replacement. Those HP ratings are given in Table E-6.
Referring to Table E-6, motors numbered 2,6,8,10, 11, 14 and 15 (3 units) are now preliminarily considered as candidates for replacement. Upon replacement with HP ratings of 2.0, 5.0,5.0, 2.0, 5.0, 2.0, and 5.0 (3 units), respectively, estimated kWh savings of 2307.47 kWh/yr areobtained. These results, however, should be reinforced by further technical evaluations which usea more extensive set of actual measurements to come up with more conclusive results.
Building Load Demand and Energy Usage Profile:
Load Demand Rescheduling. Rescheduling the use of electrical equipment can lower thedemand peaks. This action may not actually reduce the total energy used. But it will reduce thedemand charge paid to the power company.
Theoretically, reduction in power demand reduces the required standby capacity, which inturn may postpone the utility company's need to install costly additional capacity to meet anincreasing load on its systems.
A graph of load demand versus time before re-scheduling (see Figure E-5a) could assist inthe evaluation of possible savings. It is therefore suggested that adequate monitoring and datarecording equipment, such as submetering (see next recommendation below), be installed toobtain the load profiles of large electrical equipment, as well as that of the lighting system. If theoverall plot shows some high cyclical peaks, usually some savings are possible by altering equipment usage during off-peak hours in order to shave off the peak demands.
A sample graphical analysis is shown in Figure E-5b. Just by leveling off the peak from abefore-demand high of 1400 kW to 1100 kW after rescheduling will produce cost savings of:
(1400 - 11 OO)kW x (P12.60/kW demand per month) x 12 mos./yr.
= P45,360.00/yr.
Another simple but effective way of emphasizing the savings benefits attainable through thedemand-saving scheme is by determining the annual savings that can be obtained per kW as inthe following:
Cost savings = (P12.60/kW demand per month) x 12 mos./yr.
E-26
= P8,612.11 kW/yr.
A qUick matter-of-fact analysis should easily point out how much more could be saved, justby learning to lower the usually neglected peaks by a few more kilowatts.Install Submetering. Submetering is helpful in monitoring the loading behaviors of motorsand other large equipment, as well as lighting systems. Appropriate demand control can then beachieved by referring to data acquired by submetering and subsequently performing the relevantpeak-reducing schemes.
AIr CondItionIng SystemFindings:
General Space. The function of air-conditioning is to provide the desired thermal comfortconditions for the occupants inside a building. The attainment of these conditions requires theconsumption of electricity to operate the air-conditioning equipment. Due to the present energycrisis experienced in many countries, the study of more efficient designs for buildings becomes acontinuous process even though energy conservation measures have been already implemented.Indoor Design Temperature. To conserve energy, the suggested inside temperature of conditioned spaces is 25.6°C (78°F). Based on the actual measurements during the survey, the temperatures maintained in the public areas inside the hotel is already more or less 25.6°C. Temperatures maintained in the guestrooms, controlled by the thermostat and fan speed selector,depend on the occupants' preference.Ventilation Requirements. Admission of outdoor air and exhausting a portion of recirculatedair is necessary to maintain the quality of air inside the space. However, the amount of outdoor airadmitted must be kept to a minimum in order to conserve energy.It was observed that efforts have been made by the hotel's staff to reduce ventilation air.With the exception of the laundry's AHU, which uses 100% outdoor air, the outdoor air dampers ofall AHUs are closed, thereby admitting somewhat lower quantities of ventilation air than thosecalled for by the design.
Infiltration. During the conduct of the detailed energy audit, all windows and doors werechecked for possible infiltration of outside air. The windows are generally tight-fitting, therebypreventing infiltration and reducing cooling energy.Internal Loads. The primary sources of internal loads are people, lights, and equipment0p.erating in the conditioned spaces. Hotel Intercontinental has conditioned areas of 23.7m2/person for guestrooms (based on 68% average occupancy), 14.3 m2/person for lobbies, and2.4 m2/person for the remaining function areas such as restaurants, offices, etc. Lighting andequipment densities are 19.17 W/m2 and 8.21 W/m2
, respectively.External Loads. The external loads are composed of the heat gains through windows, walls,and roofs. External, as well as internal, shading devices are utilized to limit the solar transmissionthrough windows. The walls and roof are of light color to decrease solar absorption.The hotel's space conditions discussed previously were used in the calculation of the cooling load. The cooling load is the rate at which heat must be removed from the conditioned spacesinside the building in order to maintain the desired thermal comfort conditions. The load wasestimated through the three computer programs, ASEAM-2, Carrier, and DOE-2 (see Table E-13).The percentages of the cooling load components are important as guides in energy conservation, since they indicate the potential areas where cooling energy can be reduced. However,reduction of cooling load has its limitations or restrictions. For example, heat gain through glass isthe biggest component but use of additional external shading devices presents, at the least, anarchitectural problem, and internal shading such as curtains in the guestrooms are not readilycontrolled.
Reduction in lighting has a great impact since it affects both cooling and electrical consumption. Use of exhaust fans in unconditioned spaces and exhaust hoods in some heat-emitting
E-27
n
devices will reduce excessive heat build-up, decreasing loss of cooling energy through the partitions (next to conditioned areas) and increasing comfort and therefore efficiency of the employeesin these areas.
Air Distribution System. For the public areas (restaurants, lobbies, offices, and others). thehotel uses a conventional constant volume AHU which provide a constant volume of air at temperatures that vary according to the load. Fan coil units are used in the guestrooms, functionrooms, and some offices to provide the necessary cooling.
For the cooling load variations, each AHU is equipped with a thermostat, located in thereturn air path in the machine room and connected to a water-regulating valve, which controls theamount of chilled water flowing through the cooling coils. Temperatures in the zones are well controlled since a single AHU serves only one zone, that is, a space with a single load profile. Adjusting the thermostat for single AHU will only affect the zone served by that AHU.
Fan coil units found in the hotel have varied capacities and fan motor ratings, ranging fromabout 0.023 to 0.373 kW (1/32 to 1/2 HP). Each FCU has a thermostat and a 3-speed fan controllocated in the room or space it serves.
Typical among buildings in the Philippines, the air-conditioning system in the hotel has nohumidity control.
An interesting survey finding was the large discrepancy between measured and rated powerof the motors used to drive the fans of the AHUs. Compared to other buildings, the overall fanW/m3/hr is low, probably because the AHUs are located near the areas they serve. However, allof the motors were observed to be operating at loads which are less than the rated load. Anexample is the motor serving the laundry AHU. Its measured power is 1.7 kW. This is 70% lowerthan the rated motor capacity of 5.6 kW. Thus, either the AHU motors are oversized or the filtersand coils are dirty and clogged.
It is known that, in an installed fan and duct system, the fan power and flow rate decrease asthe pressure increases. Usually the pressure is increased by restricting the air flow, e.g., use ofVAV dampers, clogged and dirty AHU filters and coils. That is why some air-conditioners maintenance personnel sometimes intentionally allow AHUs to get dirty to obtain energy savings fromthe reduced motor power until the occupants complain about the increased temperatures resultingfrom the reduced effectiveness of the air distribution system.
This strategy, however, results in "hidden" energy wastage, due to reduced motorefficiencies. Generally, motor efficiency decreases as actual load is reduced, relative to ratedload. This inefficiency is a major drawback to reducing motor power by allowing reduced air flowfrom dirt buildup. Alternative strategies to achieve both energy efficiency and some temperaturecontrol (reduce overcooling of the spaces) are by adjusting the thermostats and/or trying to raisethe chilled water temperature.
The amount of cooling energy required in a space depends on the total cooling load andnumber of hours of operation. A decrease in either of the two will reduce consumption of the airconditioning equipment, which accounts for about 50.7% of the total building electrical consumption. Table E-14 presents cooling energy requirements in percentages.
It was found that instrumentation used for monitoring the air temperatures and chilled watertemperatures and pressures entering and leaving the AHUs need replacement. These instruments are important in determining whether the system is performing efficiently and for identifyinginefficiencies.
Cooling Plant Equipment. For hotels and other buildings with daily 24-hour operatingschedules, a common problem encountered is over-designed cooling plant equipment. In amachine room, it is common to find multiple chillers of equal capacity, whereas one unit would beenough to handle the maximum cooling load of the building, making the others act as standbyunits. During periods when the cooling load decreases, the chiller will unload or reduce its capacity. However, at this unloaded condition, the chiller operates at very low efficiency and mighteven surge, causing damage to the compressor.
E-28
The design of the cooling plants for the Hotel Intercontinental solved this problem. For theair-conditioning requirements of the hotel, three centrifugal chillers with rectangular induced-draftcooling towers are utilized. One chiller has a capacity of 450 tons, while the other two are 200tons each. The 450-ton chiller is usually operated from 8:00 AM. to 10:00 P.M., the period ofmaximum cooling load occurrence. A 200-ton chiller is operated from 10:00 P.M. to 3:00 AM.,shut off from 3:00 AM. to 5:30 AM., and operated again from 5:30 AM. to 8:00 AM. With thisoperating strategy, the average operating ratio of the chillers is about 87%, which is about theoptimum for centrifugal chillers.The cooling plant equipment, including the monitoring instruments, are well-maintained.Each chiller has working flowmeters (not usually found in buildings' cooling plant installments),thermometers, and pressure gages for the chilled water and condenser water system, voltage andcurrent measuring instruments for the chiller, and other chiller gages which are important inchecking the proper system operation.It was also noted that the hotel Engineering Staff are conscious of energy savings. Scheduling equipment operation based on demand, such as turning off of AHUs and chillers, is one oftheir energy conserving measures.
Recommendations:
Using the data gathered from the preliminary and detailed energy audit, computer programswere used to determine the annual energy consumption of Hotel Intercontinental. Knowledge ofthe breakdown of energy consumption is crucial to identifying potential areas for ECOs.Relative to other buildings, the percentage consumption of the air-conditioning is low. However, further reduction of energy consumption can still be obtained. The following is a list of theECOs identified. Several computer simulations using DOE-2 were made to analyze the effects ofthese ECOs on the total energy consumption of the building.
Air Distribution System/Cooling Plant Equipment• Rehabilitate Instrumentation in the Air Distribution System. Entering and leaving chilledwater temperatures and pressures, and entering and leaving air temperatures, are importantparameters that must be monitored to check the system performance (air and water sides)and sources of losses. Losses in chilled water lines due to corrosion and faults in the insulation can be detected if a few thermometers and pressure gages are strategically installed(e.g., near the fan coils on certain floors). Computer simulations show that losses couldhave occurred in the air distribution ducts or chilled water fines. The installation of monitoring instruments would verify these losses.• Retrofit With High Efficiency Chillers. Since the chiller is the largest single energy consumerin the building, improvement in its performance will have a significant effect on energy consumption. Good design, installation, and proper maintenance will make a chiller operate atoptimum. However, the improvement of efficiency in chillers has its limits.
Newer chillers have higher efficiencies than those currently installed in the hotel. Still, aconsiderable amount of investment is needed for a retrofit. The existing baffle-type (woodslats as tower fills) cooling towers can also be replaced by PVC cellular till types which arecommonly used in neWly-constructed buildings. This type of cooling tower is compact andefficient. It can provide lower condenser water temperatures as required by the new chillers,thereby increasing overall plant efficiency. The estimated savings per year was based onthe following:
The chillers were replaced with those of COP = 5.0.The existing cooling towers were replaced with PVC cellular-type towers of the samesize, with two-speed fans.
Replacement of two chillers (both the 450-ton and the 200-ton) is estimated to have a payback period of about 8 years. An alternative is to replace the smaller and less efficient 200ton chiller and have a lower payback period. Using a COP of 4.45 tor the 200-ton chiller,computer simulations show a payback period of about 4.5 years.
E-29
Possible replacement of chillers can be done in conjunction with cogeneration using anappropriate liquid absorption refrigeration unit. This will also result in the elimination of theuse of cooling towers.
• Consider Variable Air Volume System. The variable air volume system provides a variablevolume of air at a constant discharge temperature. When the space demands peak cooling,maximum air flow is supplied. As the space cooling requirement decreases, the air flow tothe space is reduced proportionately to a specified minimum flow rate. Air volume is controlled by VAV boxes which throttle the air flow in the air distribution ducts. Each VAV boxhas its own thermostat.
New designs are already moving towards VAV systems, for they offer significant fan savings. AHU fans can have variable speed drives, inlet vane, or discharge damper control.Variable speed drives are the most efficient but most expensive to purchase. Dischargedamper control is the least efficient and least expensive to purchase. Inlet vane control is inthe middle both for efficiency and cost. No estimate of payback period was made becausethe building plans for the duct layout or air distribution system was unavailable during theaudit.
• Consider Variable Speed Chilled Water System. Most of the time the chilled water pumpsoperate at loads lower than design. Substantial savings can be obtained by using variablespeed controllers for pump motors. However, they are known to be expensive and requirecareful matching of the motor and drive.
• Investigate Rescheduling of Chillers. Since the 450-ton chiller has a higher rated COP (thatis, at design load), it may even be economical to use it for longer periods if the managementfinds the investment for new chillers to be too costly. Computer simulations show savings ofabout 45,954 kWh/yr, assuming the part-load performance of the chillers are simulatedaccurately.
Boller SystemThe hotel's thermal energy requirements (aside from cooking) are provided by the boilers.
There are two firetube boilers installed in the hotel basement. Each has a rated capacity of 2950kgs/hr of steam (based on 10.3 bars, 200 bhp rating). Normally, only one boiler is operating. Onaverage, the boilers operate 16.5 hours per day.
Steam is raised at 6.2 barg and is used mainly in the calorifiers which supply the hot waterrequirements of the hotel. Industrial fuel oil (IFO) is used as fuel and, in 1987, the total IFO consumption was 503,323 lits.
The results of the combustion tests conducted during the energy audit are shown in TablesE-17, E-18, E-19, and E-20.
Table E-18 summarizes the observed average surface temperature of the boiler. Note thatthe surface coating of the boiler is aluminum oxide paint.
Based on the data shown in Table E-18, the radiation heat loss from the boiler is about0.44% of the fuel gross heating value. See Table E-19 for the summary of computations forradiation-convection heat loss.
The efficiency of the boiler was evaluated using the indirect method (i.e., Heat LossMethod). Table E-20 summarizes the computed efficiencies of Boiler NO.1 at various operatingloads.
Other Observations/Recommendations:
The boiler operates at very high excess air levels. No combustion monitoring is being done.Hence, the operators are not aware of such uneconomical operation. Adjustments were madeduring the combustion testings but the lowest percent O
2level obtained was only 7.5%. Reducing
the air supply further resulted in unstable and smoky flames. The high excess air level is alsomanifested in the flue gas temperature, which at the observed level, is considered dangerous fromthe standpoint of corrosion. Locally available IFO contains a minimum of 3% sulfur. To avoid cold
E-30
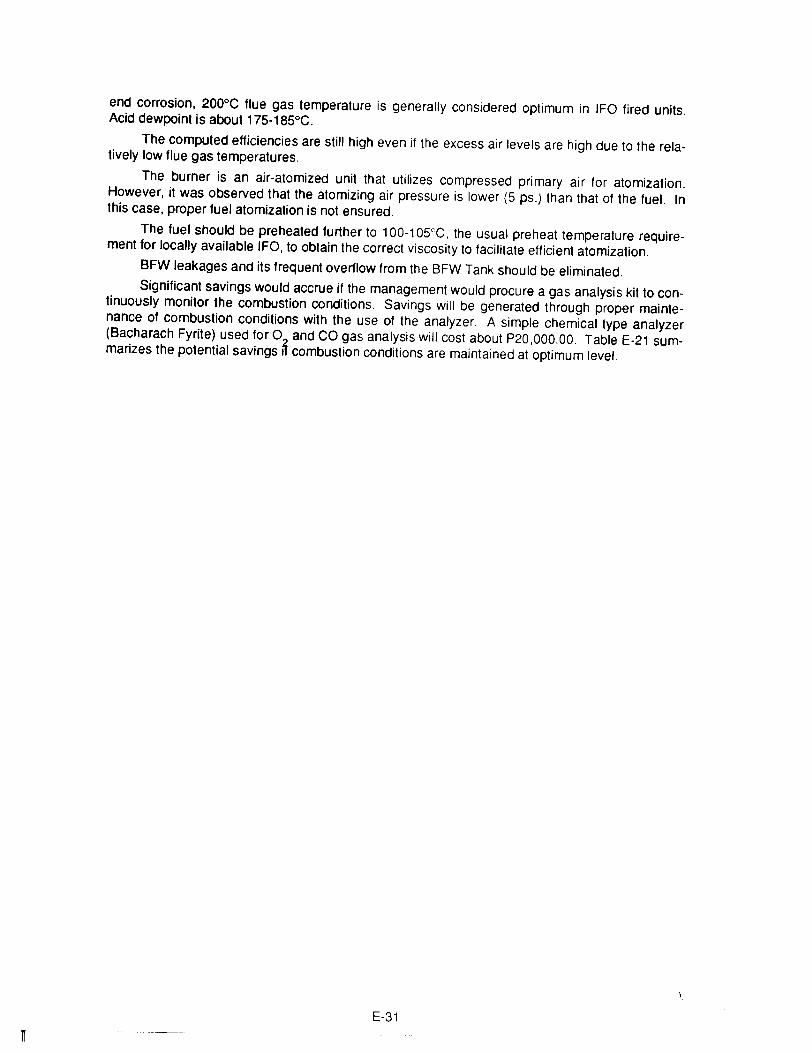
end corrosion, 200°C flue gas temperature is generally considered optimum in IFO fired units.Acid dewpoint is about 175-185°C.
The computed efficiencies are still high even jf the excess air levels are high due to the relatively low flue gas temperatures.
The burner is an air-atomized unit that utilizes compressed primary air for atomization.However, it was observed that the atomizing air pressure is lower (5 ps.) than that of the fuel. Inthis case, proper fuel atomization is not ensured.
The fuel should be preheated further to 100-105°C, the usual preheat temperature requirement for locally available IFO, to obtain the correct viscosity to facilitate efficient atomization.
BFW leakages and its frequent overflow from the BFW Tank should be eliminated.
Significant savings would accrue if the management would procure a gas analysis kit to continuously monitor the combustion conditions. Savings will be generated through proper maintenance of combustion conditions with the use of the analyzer. A simple chemical type analyzer(Bacharach Fyrite) used for O
2and CO gas analysis will cost about P20,OOO.OO. Table E-21 sum
marizes the potential savings if combustion conditions are maintained at optimum level.
E-31
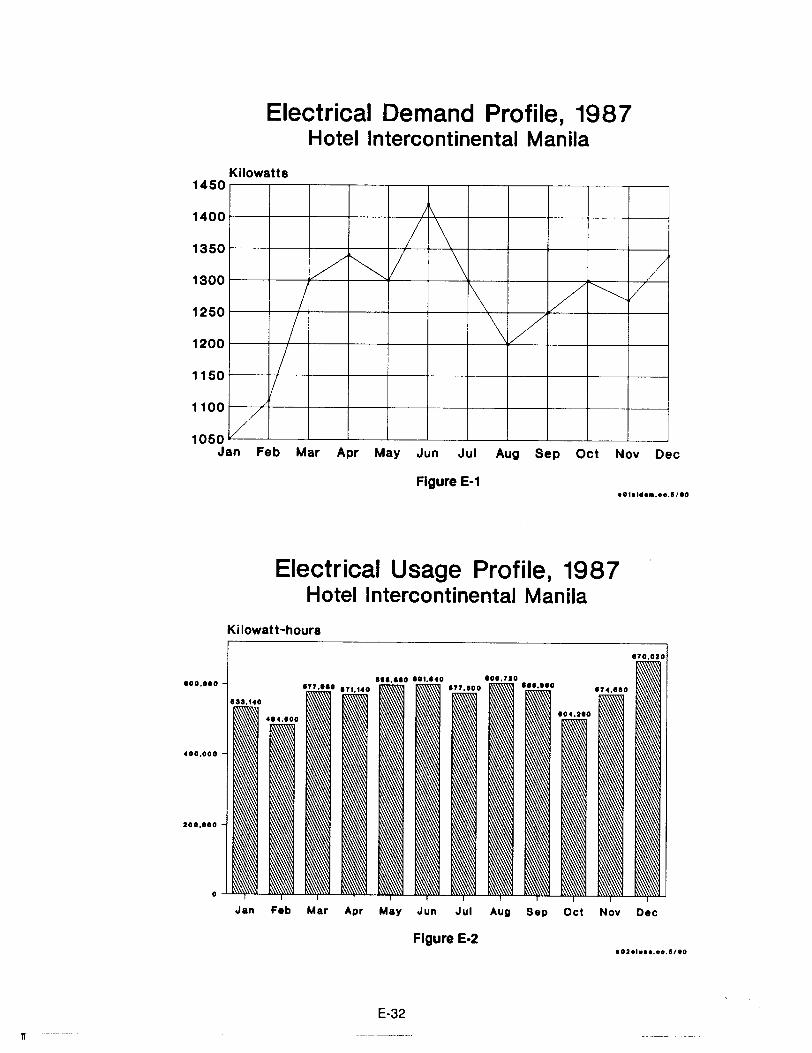
Electrical Demand Profile, 1987Hotel Intercontinental Manila
/1\
/ \/ ~if \ /
/ 1\ 1/~V
/ \ //
1/
/1050Jan Feb Mar Apr May Jun Jul Aug Sep Oct Nov Dec
1100
1150
1200
1250
1300
Kilowatts1450
1350
1400
Figure E·1e01eld••.oo.l/eo
Electrical Usage Profile, 1987Hotel Intercontinental Manila
Ki lowatt-hours
170.020
100.000
400.000
200.000
o
Jan Feb Mar Apr May Jun Jul Aug Sep Oct Nov Dec
Figure E·2
E-32
II
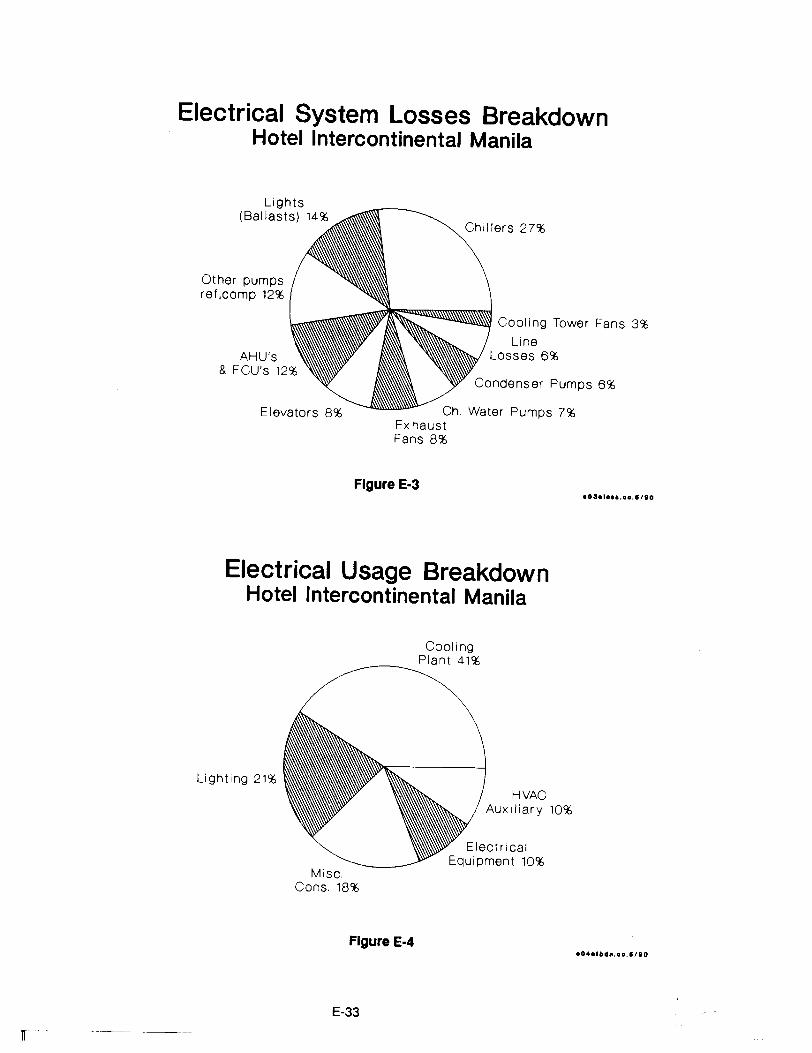
Electrical System Losses BreakdownHotel Intercontinental Manila
Other pumpsref. camp 12%
Chillers 27%
Cooling Tower Fans 3%
LineLosses 6%
Condenser Pumps 6%
Ch. Water Pumps 7%Ex haustFans 8%
Figure E-3
Electrical Usage BreakdownHotel Intercontinental Manila
Cooling~_~ Plant 41%
.0•• 10••.00.1/&0
n
Lighting 21%HVAC
Aux iliary 10%
ElectricalEquipment 10%
Misc.Cons. 18%
Figure E-4
E-33
.04elltdft.oCl. lItO
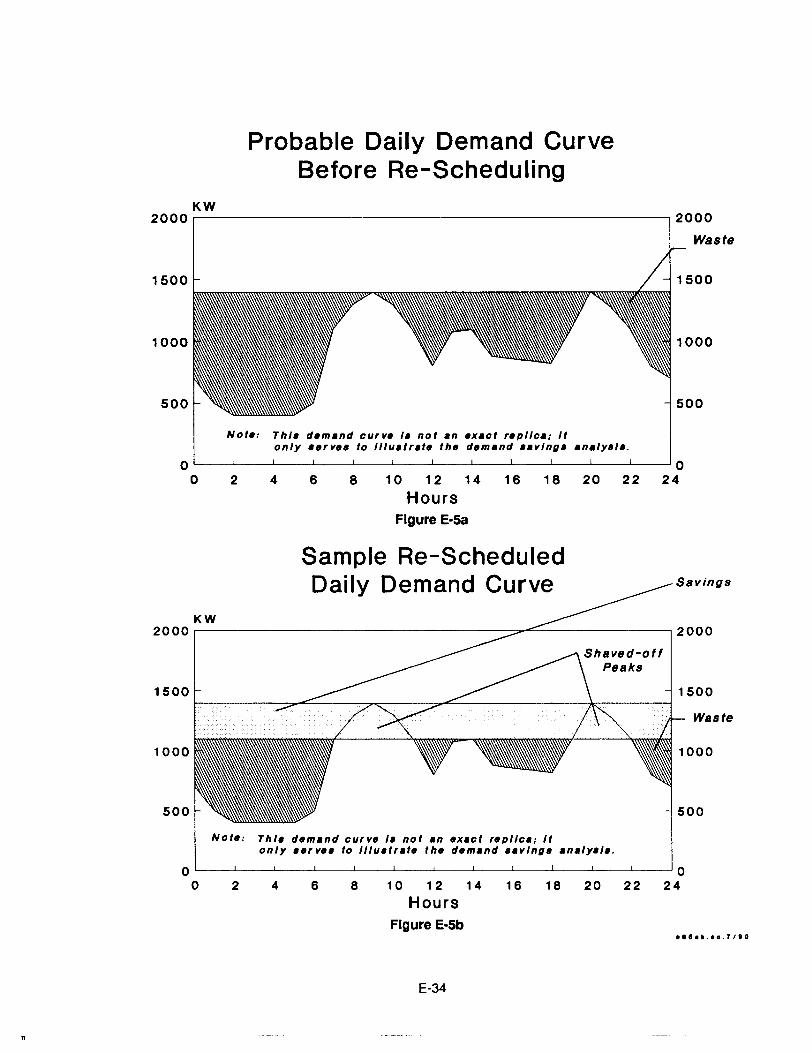
Probable Daily Demand CurveBefore Re-Scheduling
KW2000 ,------------------------------, 2000
Waste
1500 1500
1000 1000
500 500
Note: Thl. demand curve I. not an exact replica; Itonly aervea to IIlu.trate the demand aavlnga ana/y./a.
o l--_-'--_----'--_-----JL--_-L-_----'--_---'__-'--_---'-_----'-__L-_-'--_---' 0o 2 4 6 8 10 12 14 16 18 20 22 24
HoursFigure E·5a
Savings
Sample Re-ScheduledDaily Demand Curve
KW2000 ,--------------------::;;..-:::::.----------, 2000
Waste
1500
Shaved-offPeaks
500 500
1500
1000 1000
Note: Thl. demand curve I. not an exact replica; Itonly aerve. to IIlu.trate the demand aavlnga ana/ya/a.
0 00 2 4 6 8 10 12 14 16 18 20 22 24
HoursFigure E-5b
.O'.~ .•o.7/'O
E-34
11
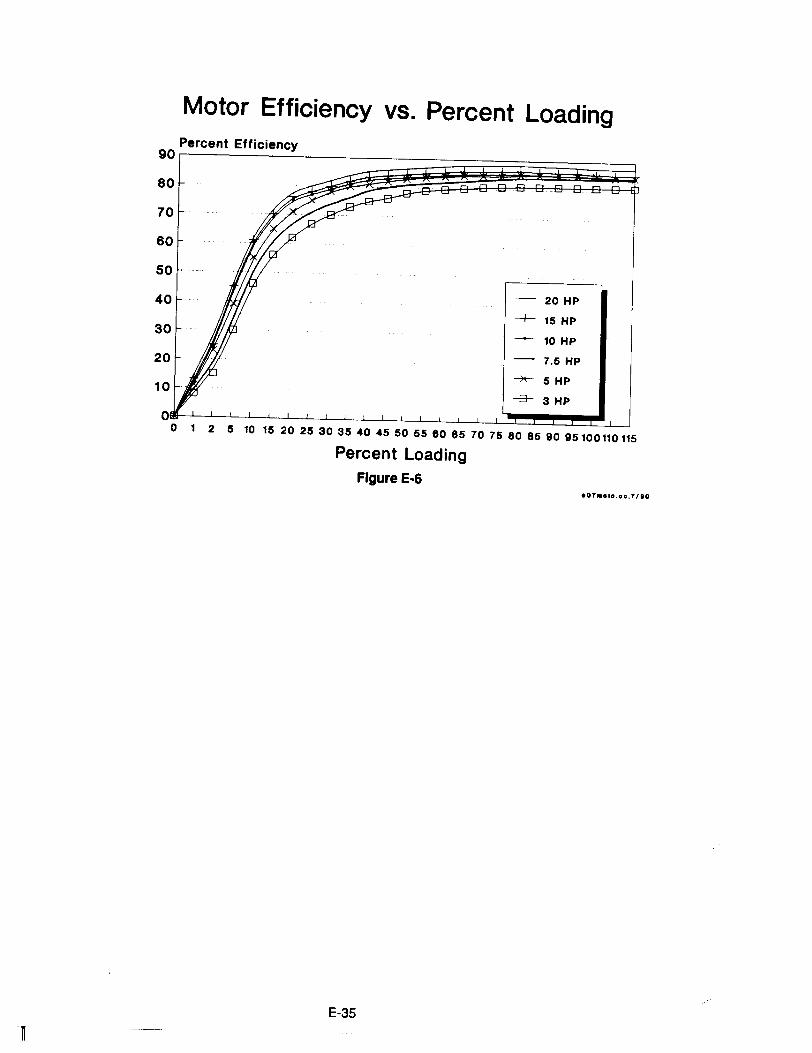
Motor Efficiency vs. Percent LoadingPercent Efficiency
90r--~~~~~80~ .
70
60
50
40
30
20
10
- 20 HP
-f- 15 HP
~ 10HP
- 7.5 HP
-*- 5 HP
-B- 3 HP
1 2 5 10 15 20 25 30 35 "0 ..5 50 55 60 65 70 75 80 85 90 95100110115
Percent LoadingFigure E·6
.07.oto.GO.7,10
E-35
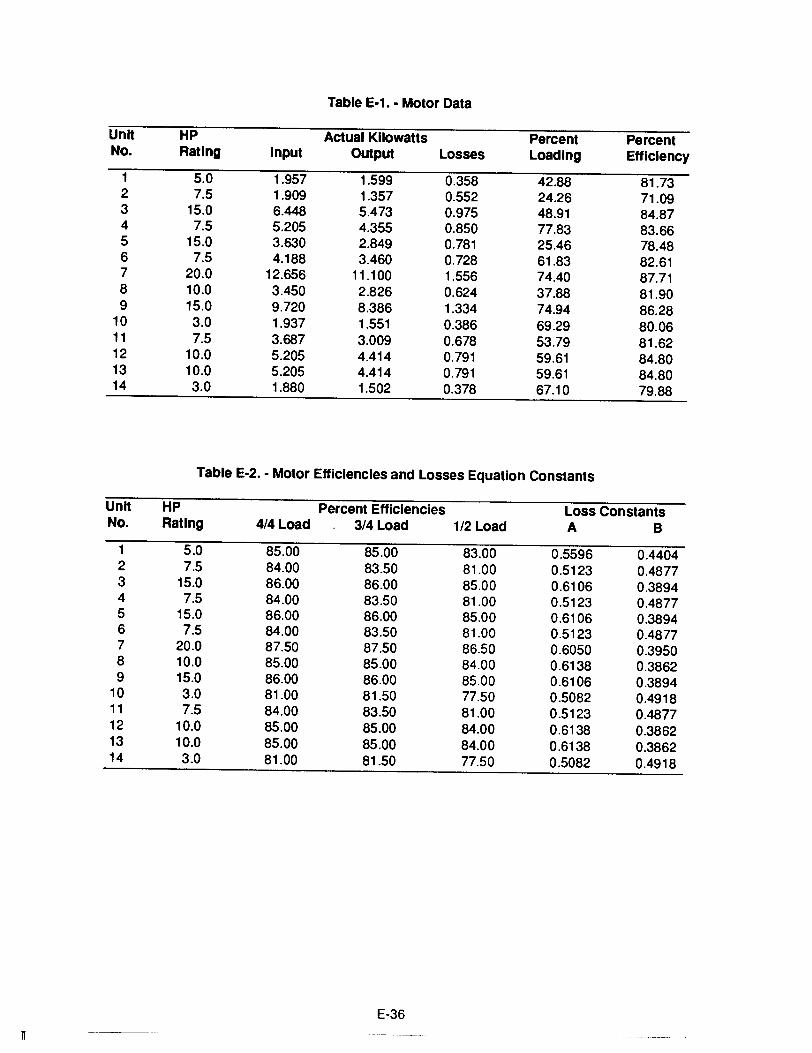
n
Table E·l.· Motor Data
Unh HP Actual Kilowatts Percent PercentNo. Rating Input Output Losses Loading Efficiency
1 5.0 1.957 1.599 0.358 42.88 81.732 7.5 1.909 1.357 0.552 24.26 71.093 15.0 6.448 5.473 0.975 48.91 84.874 7.5 5.205 4.355 0.850 77.83 83.665 15.0 3.630 2.849 0.781 25.46 78.486 7.5 4.188 3.460 0.728 61.83 82.617 20.0 12.656 11.100 1.556 74.40 87.718 10.0 3.450 2.826 0.624 37.88 81.909 15.0 9.720 8.386 1.334 74.94 86.28
10 3.0 1.937 1.551 0.386 69.29 80.0611 7.5 3.687 3.009 0.678 53.79 81.6212 10.0 5.205 4.414 0.791 59.61 84.8013 10.0 5.205 4.414 0.791 59.61 84.8014 3.0 1.880 1.502 0.378 67.10 79.88
Table E·2.• Motor Efficiencies and Losses Equation Constants
Unh HP Percent Efficiencies Loss ConstantsNo. Rating 4/4 Load 3/4 Load 1/2 Load A B
1 5.0 85.00 85.00 83.00 0.5596 0.44042 7.5 84.00 83.50 81.00 0.5123 0.48773 15.0 86.00 86.00 85.00 0.6106 0.38944 7.5 84.00 83.50 81.00 0.5123 0.48775 15.0 86.00 86.00 85.00 0.6106 0.38946 7.5 84.00 83.50 81.00 0.5123 0.48777 20.0 87.50 87.50 86.50 0.6050 0.39508 10.0 85.00 85.00 84.00 0.6138 0.38629 15.0 86.00 86.00 85.00 0.6106 0.3894
10 3.0 81.00 81.50 77.50 0.5082 0.491811 7.5 84.00 83.50 81.00 0.5123 0.487712 10.0 85.00 85.00 84.00 0.6138 0.386213 10.0 85.00 85.00 84.00 0.6138 0.386214 3.0 81.00 81.50 77.50 0.5082 0.4918
E-36
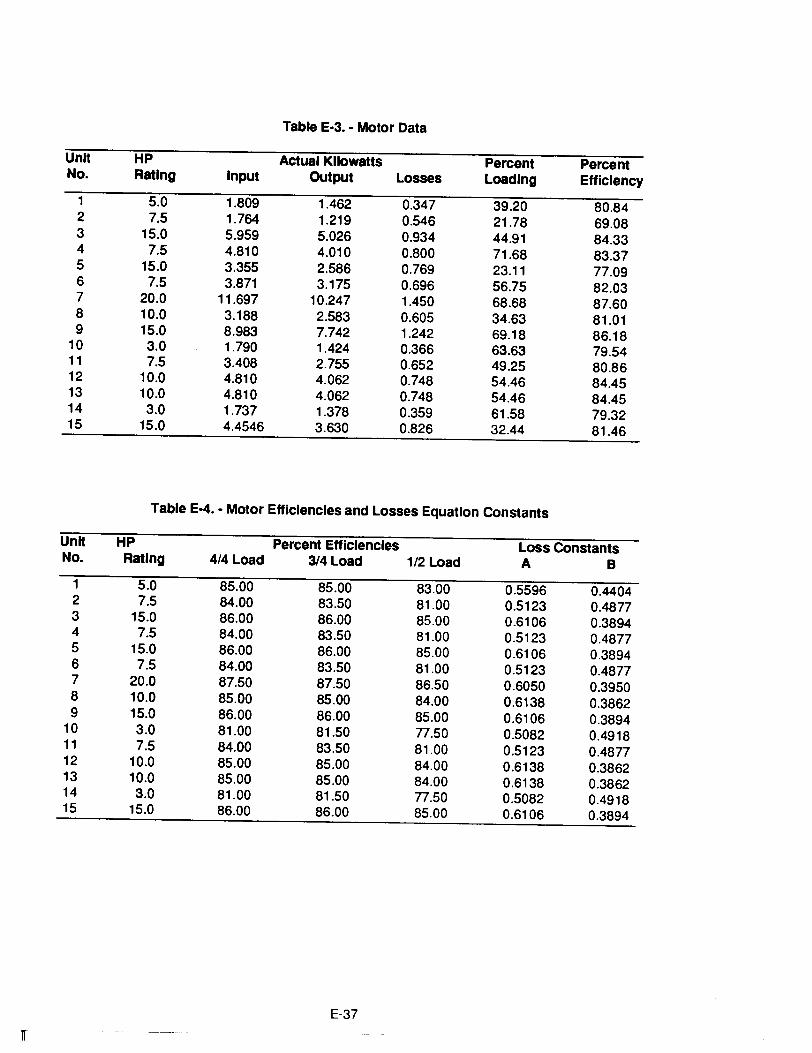
Table E·3.• Motor Data
Unit HP Actual Kilowatts Percent PercentNo. Rating Input Output Losses Loading Efficiency
1 5.0 1.809 1.462 0.347 39.20 80.842 7.5 1.764 1.219 0.546 21.78 69.083 15.0 5.959 5.026 0.934 44.91 84.334 7.5 4.810 4.010 0.800 71.68 83.375 15.0 3.355 2.586 0.769 23.11 77.096 7.5 3.871 3.175 0.696 56.75 82.037 20.0 11.697 10.247 1.450 68.68 87.608 10.0 3.188 2.583 0.605 34.63 81.019 15.0 8.983 7.742 1.242 69.18 86.18
10 3.0 1.790 1.424 0.366 63.63 79.5411 7.5 3.408 2.755 0.652 49.25 80.8612 10.0 4.810 4.062 0.748 54.46 84.4513 10.0 4.810 4.062 0.748 54.46 84.4514 3.0 1.737 1.378 0.359 61.58 79.3215 15.0 4.4546 3.630 0.826 32.44 81.46
Table E·4.• Motor Efficiencies and Losses Equation Constants
Unit HP Percent Efficiencies Loss ConstantsNo. Rating 4/4 Load 3/4 Load 1/2 Load A B
1 5.0 85.00 85.00 83.00 0.5596 0.44042 7.5 84.00 83.50 81.00 0.5123 0.48773 15.0 86.00 86.00 85.00 0.6106 0.38944 7.5 84.00 83.50 81.00 0.5123 0.48775 15.0 86.00 86.00 85.00 0.6106 0.38946 7.5 84.00 83.50 81.00 0.5123 0.48777 20.0 87.50 87.50 86.50 0.6050 0.39508 10.0 85.00 85.00 84.00 0.6138 0.38629 15.0 86.00 86.00 85.00 0.6106 0.3894
10 3.0 81.00 81.50 77.50 0.5082 0.491811 7.5 84.00 83.50 81.00 0.5123 0.487712 10.0 85.00 85.00 84.00 0.6138 0.386213 10.0 85.00 85.00 84.00 0.6138 0.386214 3.0 81.00 81.50 77.50 0.5082 0.491815 15.0 86.00 86.00 85.00 0.6106 0.3894
E-37
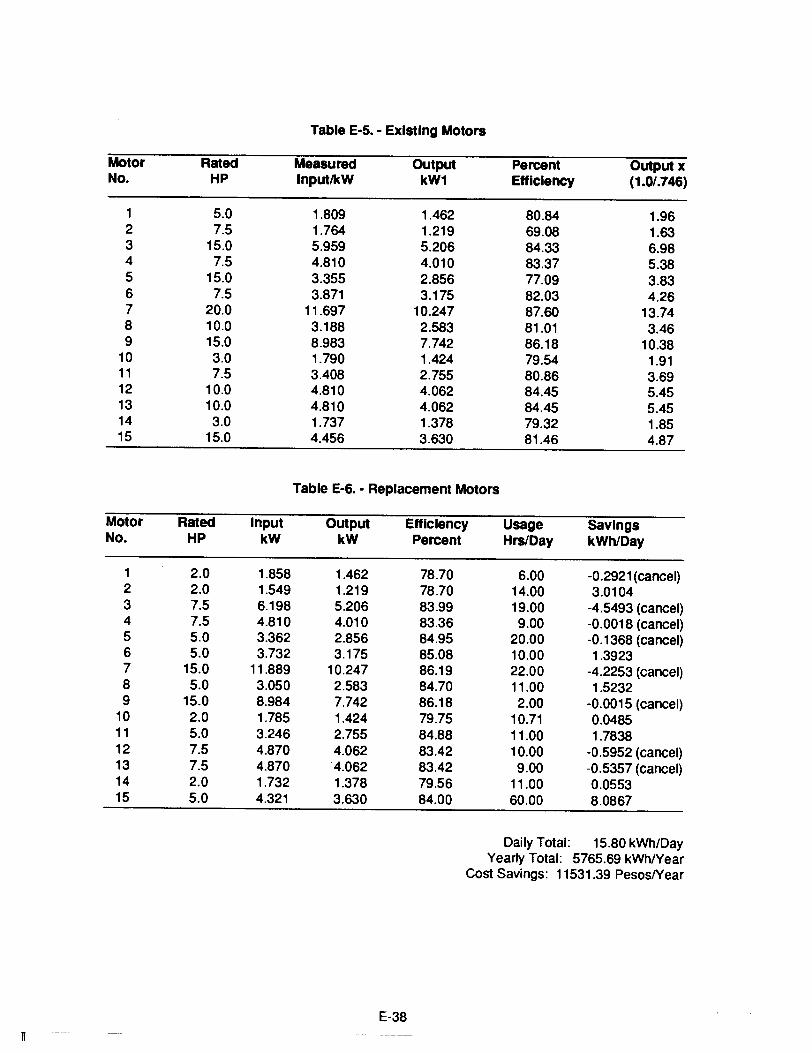
Table E·5•• Existing Motors
Motor Rated Measured Output Percent Output xNo. HP InputlkW kW1 Efficiency (1.0/.746)
1 5.0 1.809 1.462 80.84 1.962 7.5 1.764 1.219 69.08 1.633 15.0 5.959 5.206 84.33 6.984 7.5 4.810 4.010 83.37 5.385 15.0 3.355 2.856 77.09 3.836 7.5 3.871 3.175 82.03 4.267 20.0 11.697 10.247 87.60 13.748 10.0 3.188 2.583 81.01 3.469 15.0 8.983 7.742 86.18 10.38
10 3.0 1.790 1.424 79.54 1.9111 7.5 3.408 2.755 80.86 3.6912 10.0 4.810 4.062 84.45 5.4513 10.0 4.810 4.062 84.45 5.4514 3.0 1.737 1.378 79.32 1.8515 15.0 4.456 3.630 81.46 4.87
Table E·6.• Replacement Motors
Motor Rated Input Output Efficiency Usage SavingsNo. HP kW kW Percent HrslDay kWh/Day
1 2.0 1.858 1.462 78.70 6.00 -0.2921 (cancel)2 2.0 1.549 1.219 78.70 14.00 3.01043 7.5 6.198 5.206 83.99 19.00 -4.5493 (cancel)4 7.5 4.810 4.010 83.36 9.00 -0.0018 (cancel)5 5.0 3.362 2.856 84.95 20.00 -0.1368 (cancel)6 5.0 3.732 3.175 85.08 10.00 1.39237 15.0 11.889 10.247 86.19 22.00 -4.2253 (cancel)8 5.0 3.050 2.583 84.70 11.00 1.52329 15.0 8.984 7.742 86.18 2.00 -0.0015 (cancel)
10 2.0 1.785 1.424 79.75 10.71 0.048511 5.0 3.246 2.755 84.88 11.00 1.783812 7.5 4.870 4.062 83.42 10.00 -0.5952 (cancel)13 7.5 4.870 4.062 83.42 9.00 -0.5357 (cancel)14 2.0 1.732 1.378 79.56 11.00 0.055315 5.0 4.321 3.630 84.00 60.00 8.0867
Oai Iy Total: 15.80 kWh/DayYearly Total: 5765.69 kWh/Year
Cost Savings: 11531.39 PesosNear
E-38
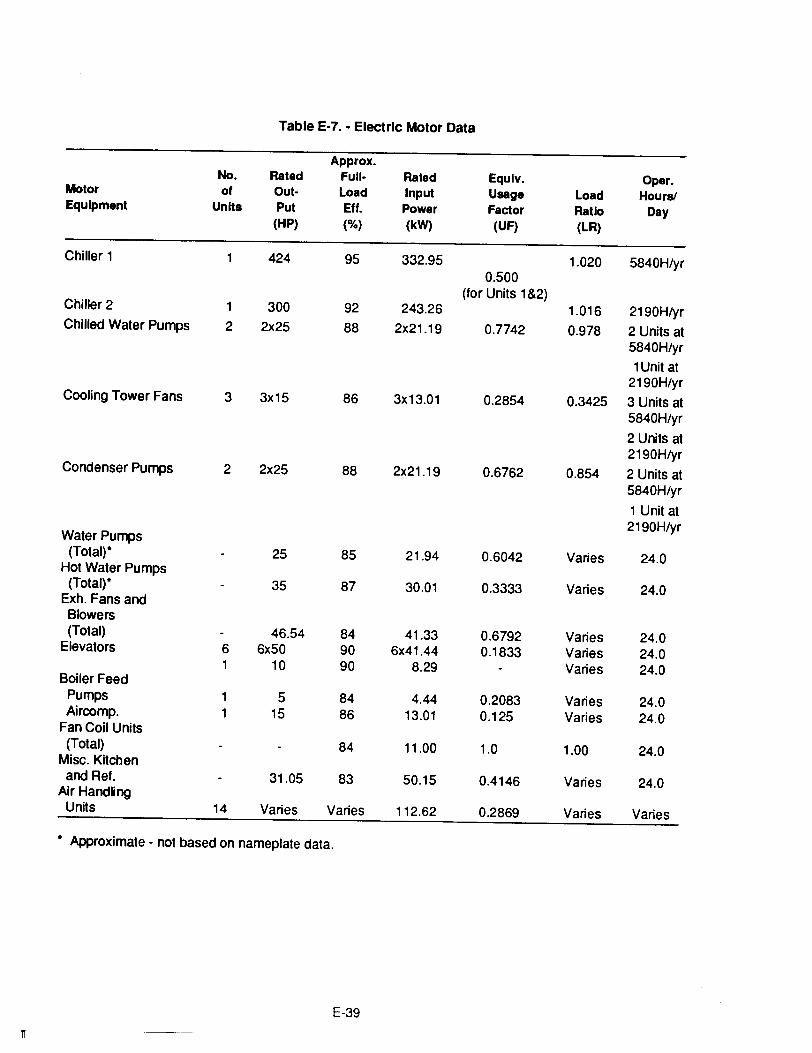
Table E-7. - Electric Motor Data
Approx.No. Rated Full- Rated Equlv. Oper.
Motor of Out- Load Input Usage Load Hours!Equipment Units Put Eft. Power Factor Ratio Day
(HP) (%) (kW) (UF) (LR)
Chiller 1 424 95 332.95 1.020 5840H/yr0.500
(for Units 1&2)Chiller 2 1 300 92 243.26 1.016 2190Hlyr
Chilled Water Pumps 2 2x25 88 2x21.19 0.7742 0.978 2 Units at5840H/yr
1Unit at2190H/yr
Cooling Tower Fans 3 3x15 86 3x13.01 0.2854 0.3425 3 Units at5840H/yr
2 Units at2190H/yr
Condenser Pumps 2 2x25 88 2x21.19 0.6762 0.854 2 Units at5840H/yr
1 Unit at2190H/yr
Water Pumps(Total)* 25 85 21.94 0.6042 Varies 24.0
Hot Water Pumps(Total)* 35 87 30.01 0.3333 Varies 24.0
Exh. Fans andBlowers(Total) 46.54 84 41.33 0.6792 Varies 24.0
Elevators 6 6x50 90 6x41.44 0.1833 Varies 24.01 10 90 8.29 Varies 24.0
Boiler FeedPumps 1 5 84 4.44 0.2083 Varies 24.0Aircomp. 1 15 86 13.01 0.125 Varies 24.0
Fan Coil Units(Total) 84 11.00 1.0 1.00 24.0
Misc. Kitchenand Ref. 31.05 83 50.15 0.4146 Varies 24.0
Air HandfingUnits 14 Varies Varies 112.62 0.2869 Varies Varies
* Approximate - not based on nameplate data.
E-39
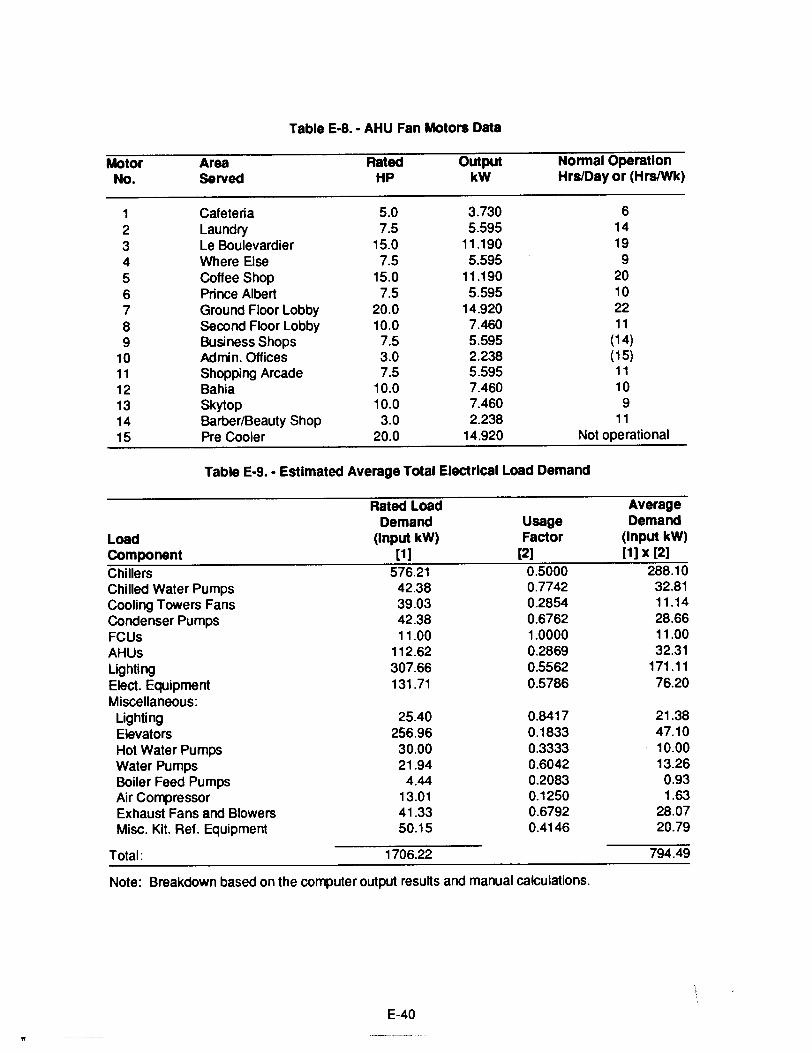
Table E-8. - AHU Fan Motors Data
Motor Area Rated Output Nonnal OperationNo. served HP kW HrslDay or (HrsIWk)
1 Cafeteria 5.0 3.730 62 Laundry 7.5 5.595 143 Le Boulevardier 15.0 11.190 194 Where Else 7.5 5.595 95 Coffee Shop 15.0 11.190 206 Prince Albert 7.5 5.595 107 Ground Floor Lobby 20.0 14.920 228 Second Floor Lobby 10.0 7.460 119 Business Shops 7.5 5.595 (14)
10 Admin. Offices 3.0 2.238 (15)11 Shopping Arcade 7.5 5.595 1112 Bahia 10.0 7.460 1013 Skytop 10.0 7.460 914 Barber/Beauty Shop 3.0 2.238 1115 Pre Cooler 20.0 14.920 Not operational
Table E-9. - Estimated Average Total Electrical Load Demand
LoadCOmponentChillersChilled Water PumpsCooling Towers FansCondenser PumpsFCUsAHUsLightingElect. EquipmentMiscellaneous:
LightingElevatorsHot Water PumpsWater PumpsBoiler Feed PumpsAir CompressorExhaust Fans and BlowersMisc. Kit. Ref. Equipment
Total:
Rated LoadDemand
(Input kW)[1]
576.2142.3839.0342.3811.00
112.62307.66131.71
25.40256.96
30.0021.94
4.4413.0141.3350.15
1706.22
UsageFactor
[2]0.50000.77420.28540.67621.00000.28690.55620.5786
0.84170.18330.33330.60420.20830.12500.67920.4146
AverageDemand
(Input kW)[1] x [2]
288.1032.8111.1428.6611.0032.31
171.1176.20
21.3847.1010.0013.26
0.931.63
28.0720.79
794.49
Note: Breakdown based on the computer output results and manual calculations.
E-40
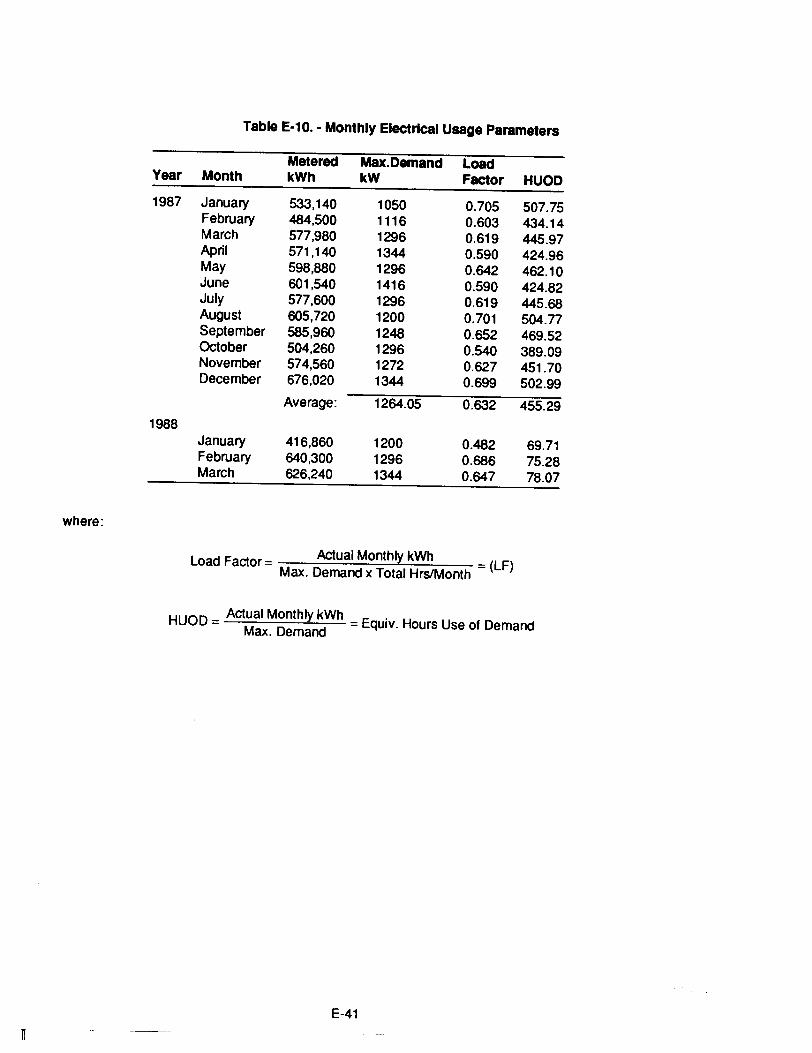
n
Table E-10. - Monthly Electrical Usage Parameters
Metered Max.Demand LoadYear Month kWh kW Factor HUOD
1987 January 533,140 1050 0.705 507.75February 484,500 1116 0.603 434.14March 577,980 1296 0.619 445.97April 571,140 1344 0.590 424.96May 598,880 1296 0.642 462.10June 601,540 1416 0.590 424.82July 577,600 1296 0.619 445.68August 605,720 1200 0.701 504.77September 585,960 1248 0.652 469.52October 504,260 1296 0.540 389.09November 574,560 1272 0.627 451.70December 676,020 1344 0.699 502.99
Average: 1264.05 0.632 455.29
1988January 416,860 1200 0.482 69.71February 640,300 1296 0.686 75.28March 626,240 1344 0.647 78.07
where:
Load Factor = Actual Monthly kWh = (LF)Max. Demand x Total HrslMonth
Actual Monthly kWh .HUOD = M D nd = EqUiv. Hours Use of Demandax. ema
E-41
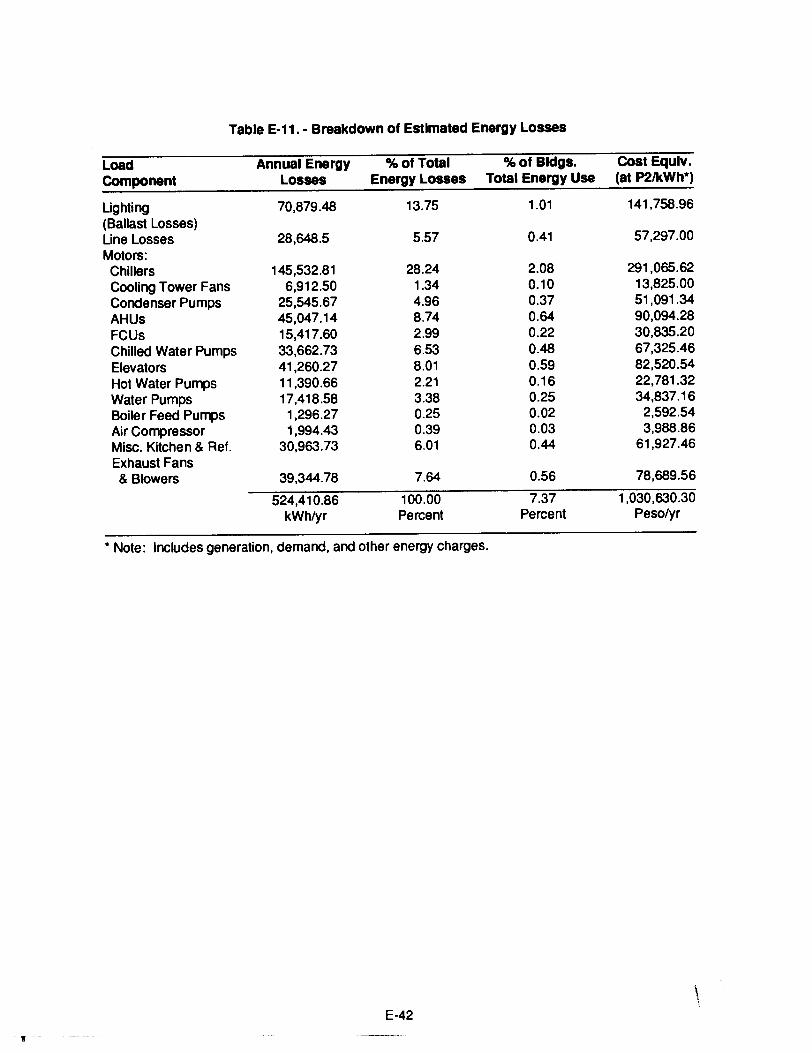
Table E-11. - Breakdown of Estimated Energy Losses
Load Annual Energy % of Total %of Bldgs. Cost Equlv.Component Losses Energy Losses Total Energy Use (at P2/kWh*)
Lighting 70,879.48 13.75 1.01 141,758.96(Ballast Losses)Line Losses 28,648.5 5.57 0.41 57,297.00Motors:Chillers 145,532.81 28.24 2.08 291,065.62Cooling Tower Fans 6,912.50 1.34 0.10 13,825.00Condenser Pumps 25,545.67 4.96 0.37 51,091.34AHUs 45,047.14 8.74 0.64 90,094.28FCUs 15,417.60 2.99 0.22 30,835.20Chilled Water Pumps 33,662.73 6.53 0.48 67,325.46Elevators 41,260.27 8.01 0.59 82,520.54Hot Water Pumps 11,390.66 2.21 0.16 22,781.32Water Pumps 17,418.58 3.38 0.25 34,837.16Boiler Feed Pumps 1,296.27 0.25 0.02 2,592.54Air Compressor 1,994.43 0.39 0.03 3,988.86Misc. Kitchen & Ref. 30,963.73 6.01 0.44 61,927.46Exhaust Fans
& Blowers 39,344.78 7.64 0.56 78,689.56
524,410.86 100.00 7.37 1,030,630.30kWh/yr Percent Percent Pesolyr
• Note: Includes generation, demand, and other energy charges.
I
E-42\
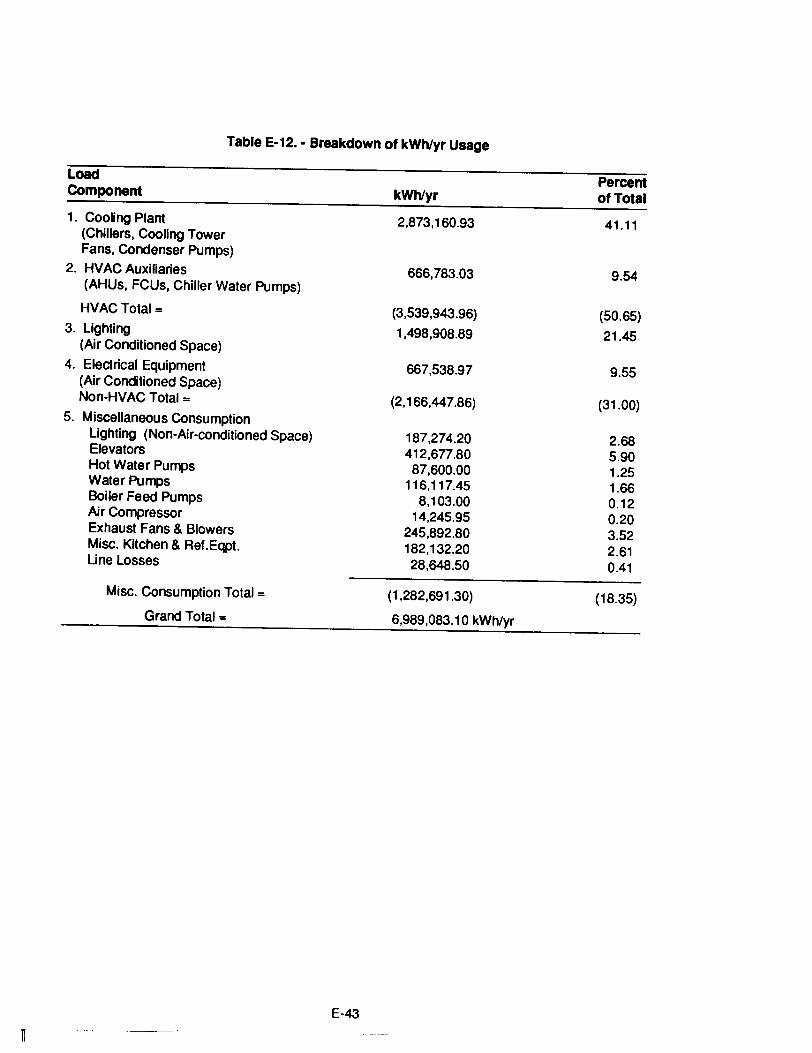
Table E-12. - Breakdown of kWh/yr Usage
Load PercentComponent kWh/yr of Total
1. Cooling Plant 2.873,160.93 41.11(Chillers. Cooling TowerFans, Condenser Pumps)
2. HVAC Auxiliaries 666,783.03 9.54(AHUs, FCUs, Chiller Water Pumps)
HVACTotal = (3,539.943.96) (50.65)
3. lighting 1,498.908.89 21.45(Air Conditioned Space)
4. Electrical Equipment 667.538.97 9.55(Air Conditioned Space)Non-HVAC Total = (2,166,447.86) (31.00)
5. Miscellaneous Consumptionlighting (Non-Air-conditioned Space) 187,274.20 2.68Elevators 412,677.80 5.90Hot Water Pumps 87,600.00 1.25Water Pumps 116,117.45 1.66Boiler Feed Pumps 8,103.00 0.12Air Compressor 14,245.95 0.20Exhaust Fans & Blowers 245,892.80 3.52Misc. Kitchen & Ref.Eqpt. 182,132.20 2.61Line Losses 28.648.50 0.41
Misc. Consumption Total = (1,282,691.30) (18.35)
Grand Total = 6,989,083.10 kWh/yr
E-43
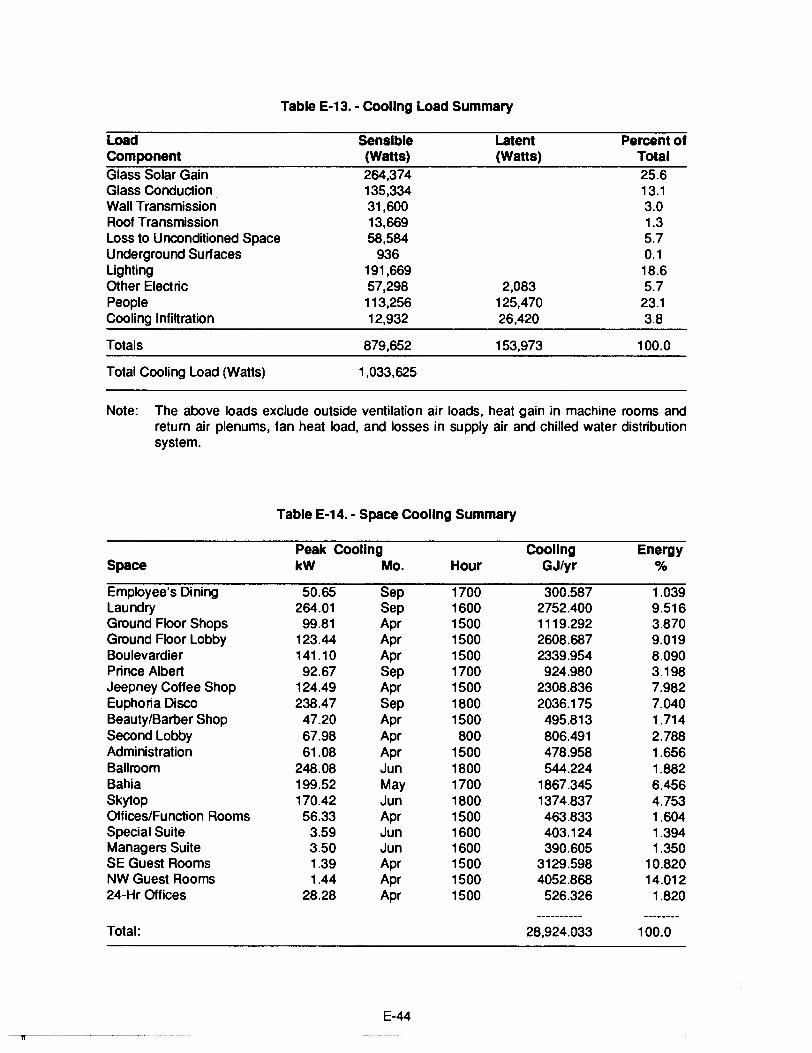
--,r--------
Table E-13. - Cooling Load Summary
Load Sensible Latent Percent ofComponent (Watts) (Watts) TotalGlass Solar Gain 264,374 25.6Glass Conduction 135,334 13.1Wall Transmission 31,600 3.0Roof Transmission 13,669 1.3Loss to Unconditioned Space 58,584 5.7Underground Surfaces 936 0.1Lighting 191,669 18.6Other Electric 57,298 2,083 5.7People 113,256 125,470 23.1Cooling Infiltration 12,932 26,420 3.8
Totals 879,652 153,973 100.0
Total Cooling Load (Watts) 1,033,625
Note: The above loads exclude outside ventilation air loads, heat gain in machine rooms andreturn air plenums, fan heat load, and losses in supply air and chilled water distributionsystem.
Table E-14. - Space Cooling Summary
Peak Cooling Cooling EnergySpace kW Mo. Hour GJ/yr %
Employee's Dining 50.65 Sep 1700 300.587 1.039Laundry 264.01 Sep 1600 2752.400 9.516Ground Floor Shops 99.81 Apr 1500 1119.292 3.870Ground Floor Lobby 123.44 Apr 1500 2608.687 9.019Boulevardier 141.10 Apr 1500 2339.954 8.090Prince Albert 92.67 Sep 1700 924.980 3.198Jeepney Coffee Shop 124.49 Apr 1500 2308.836 7.982Euphoria Disco 238.47 Sep 1800 2036.175 7.040Beauty/Barber Shop 47.20 Apr 1500 495.813 1.714Second Lobby 67.98 Apr 800 806.491 2.788Administration 61.08 Apr 1500 478.958 1.656Ballroom 248.08 Jun 1800 544.224 1.882Bahia 199.52 May 1700 1867.345 6.456Skytop 170.42 Jun 1800 1374.837 4.753Offices/Function Rooms 56.33 Apr 1500 463.833 1.604Special Suite 3.59 Jun 1600 403.124 1.394Managers Suite 3.50 Jun 1600 390.605 1.350SE Guest Rooms 1.39 Apr 1500 3129.598 10.820NW Guest Rooms 1.44 Apr 1500 4052.868 14.01224-Hr Offices 28.28 Apr 1500 526.326 1.820
----------Total: 28,924.033 100.0
E-44
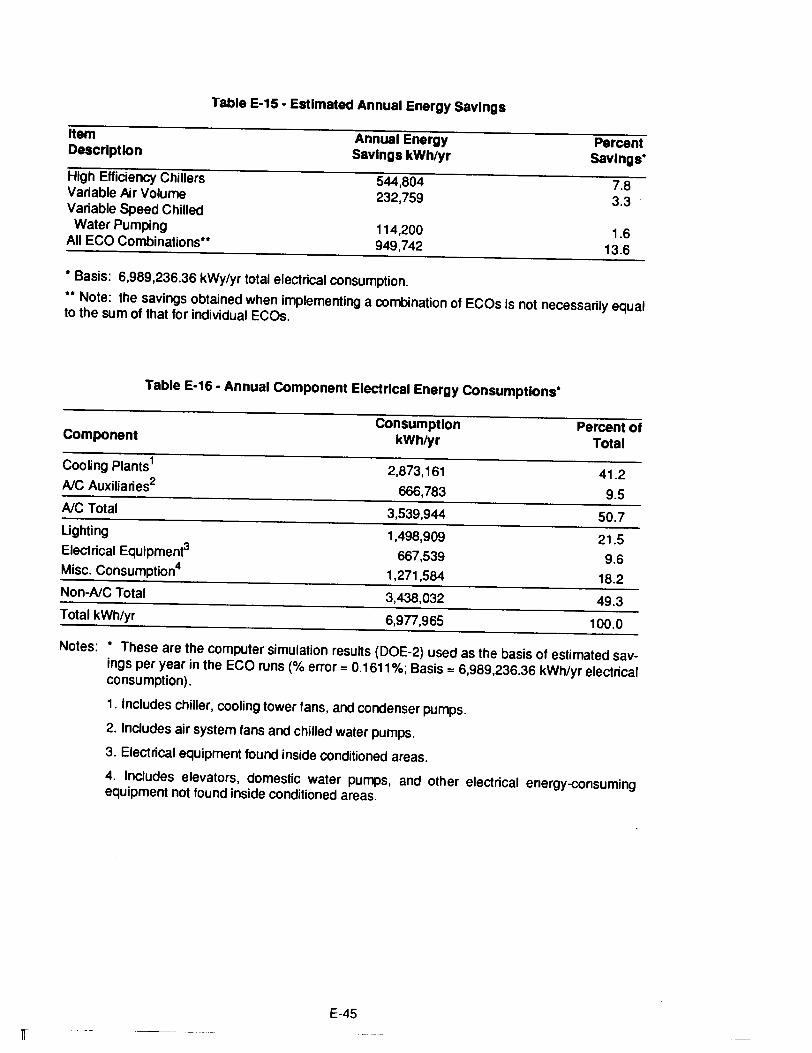
n
Table E-15 - Estimated Annual Energy Savings
Item Annual Energy PercentDescription Savings kWh/yr Savings·High Efficiency Chillers 544,804 7.8Variable Ajr Volume 232,759 3.3Variable Speed ChilledWater Pumping 114,200 1.6All ECO Combinations" 949,742 13.6
• Basis: 6,989,236.36 kWy/yr total electrical consumption... Note: the savings obtained when implementing a combination of ECOs is not necessarily equalto the sum of that for individual ECOs.
Table E-16 - Annual Component Electrical Energy Consumptions·
Consumption Percent ofComponent kWh/yr Total
Cooling Plants12,873,161 41.2
AlC Auxiliaries2666,783 9.5
AlC Total 3,539,944 50.7Lighting 1,498,909 21.5Electrical Equipment3 667,539 9.6Misc. Consumption4
1,271,584 18.2Non-AiC Total 3,438,032 49.3Total kWh/yr 6,9n,965 100.0
Notes: • These are the computer simulation results (DOE-2) used as the basis of estimated savings per year in the ECO runs (% error =0.1611 %; Basis =6,989,236.36 kWh/yr electricalconsumption).
1. Includes chiller, cooling tower fans, and condenser pumps.2. Includes air system fans and chilled water pumps.3. Electrical equipment found inside conditioned areas.4. Includes elevators, domestic water pumps, and other electrical energy-eonsumingequipment not found inside conditioned areas.
E-45
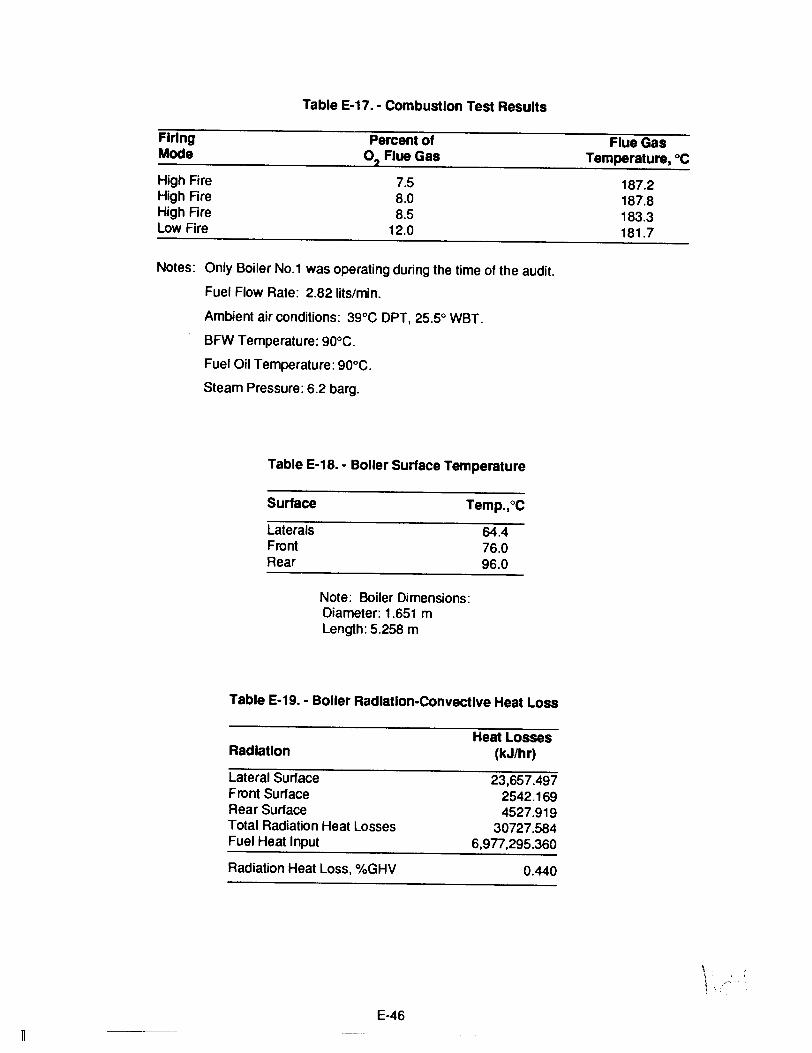
FiringMode
High FireHigh FireHigh FireLow Fire
Table E-17. - Combustion Test Results
Percent of0, Flue Gas
7.58.08.5
12.0
Flue GasTemperature,oC
187.2187.8183.3181.7
Notes: Only Boiler No.1 was operating dUring the time of the audit.
Fuel Flow Rate: 2.82 lits/min.
Ambient air conditions: 39°C OPT, 25.5° WBT.
BFW Temperature: 90°C.
Fuel Oil Temperature: 90°C.
Steam Pressure: 6.2 barg.
Table E-18. - Boller Surface Temperature
Surface
LateralsFrontRear
Temp.,oC
64.476.096.0
Note: Boiler Dimensions:Diameter: 1.651 mLength: 5.258 m
Table E-19. - Boller Radiation-Convective Heat Loss
n
Radiation
Lateral SurtaceFront SurtaceRear SurtaceTotal Radiation Heat LossesFuel Heat Input
Radiation Heat Loss, %GHV
E-46
Heat Losses(kJ/hr)
23,657.4972542.1694527.919
30727.5846,977,295.360
0.440
\
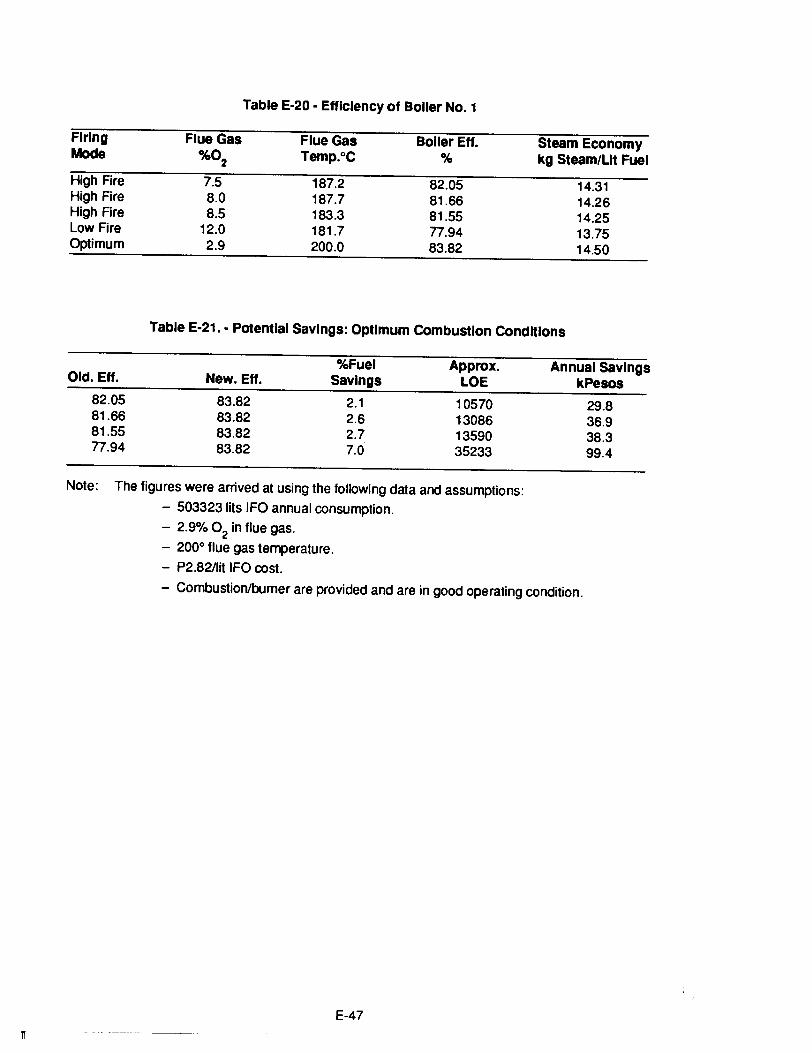
1l
Table E·20 • Efficiency of Boller No. 1
Firing Flue Gas Flue Gas Boller Eft. Steam EconomyMode %0
2Temp.oC % kg Steam/Lit Fuel
High Fire 7.5 187.2 82.05 14.31High Fire 8.0 187.7 81.66 14.26High Fire 8.5 183.3 81.55 14.25Low Fire 12.0 181.7 77.94 13.75Optimum 2.9 200.0 83.82 14.50
Table E·21 •• Potential Savings: Optimum Combustion Conditions
%Fuel Approx. Annual savingsOld. Eff. New. Eft. Savings LOE kPesos
82.05 83.82 2.1 10570 29.881.66 83.82 2.6 13086 36.981.55 83.82 2.7 13590 38.377.94 83.82 7.0 35233 99.4
Note: The figures were arrived at using the following data and assumptions:
- 503323lits IFO annual consumption.
- 2.9% O2
in flue gas.
- 200° flue gas temperature.
- P2.8211it IFO cost.
- Combustion/bumer are provided and are in good operating condition.
E-47

Table E·22.• Boller Efficiency: Boller No.1
Site: Manila Intercon Date: May 1988Location Makatl, Metro Manila Engr.: ASEAN·US Staff
Firing Mode: High Fire
Test Data Fuel Analysis
Flue Gas %02 7.500 %C 85.000Flue Gas CO 0.000 %H 11.200Flue Gas Temp.(C) 187.200 %0 0.000Amb. Air Temp.(C) 39.000 %N 0.000Abs. Humidity 0.015 %S 3.000P/H Air Temp.(C) 39.000 %Ash 0.800Fuel Temp.(C) 90.000 Fuel%H ° 0.500Stm. Press (barg) 6.206 Fuel HV,~Jlkg 43262.000BFW Temp.(C) 90.000 Rad. Loss, %GHV 0.440
Stoich.Air, kgs 13.788 %Excess Air 52.853
Fuel Input, kgs 1.005 Air Input, kgs 21.075H20 in Fuel, kgs 0.005 H20 in Air, kgs 0.316
Total Input. kgs 22.396 Total Output, kgs 22.397
Flue Gas Analysis
Gas %Vol. (Dry) %Vol.(Wet)
CO2 10.076 9.119CO 0.000 0.000
°2 7.500 6.787N2 82.290 74.467
S02 0.133 0.121H2O 9.506Total 100.000 100.000
Summary of Boller Heat Losses
11
Flue Gas Sensible Heat, %Ash Sensible Heat, %Inc. Combustion, %Comb. H20 Latent Heat, %Radiation Heat Loss, %
Total Losses, %
Boiler Efficiency, %Steam Economy,kg.Steamlkg.Fuel
82.04714.815
8.8570.0030.0007.3011.792
17.953
E-48
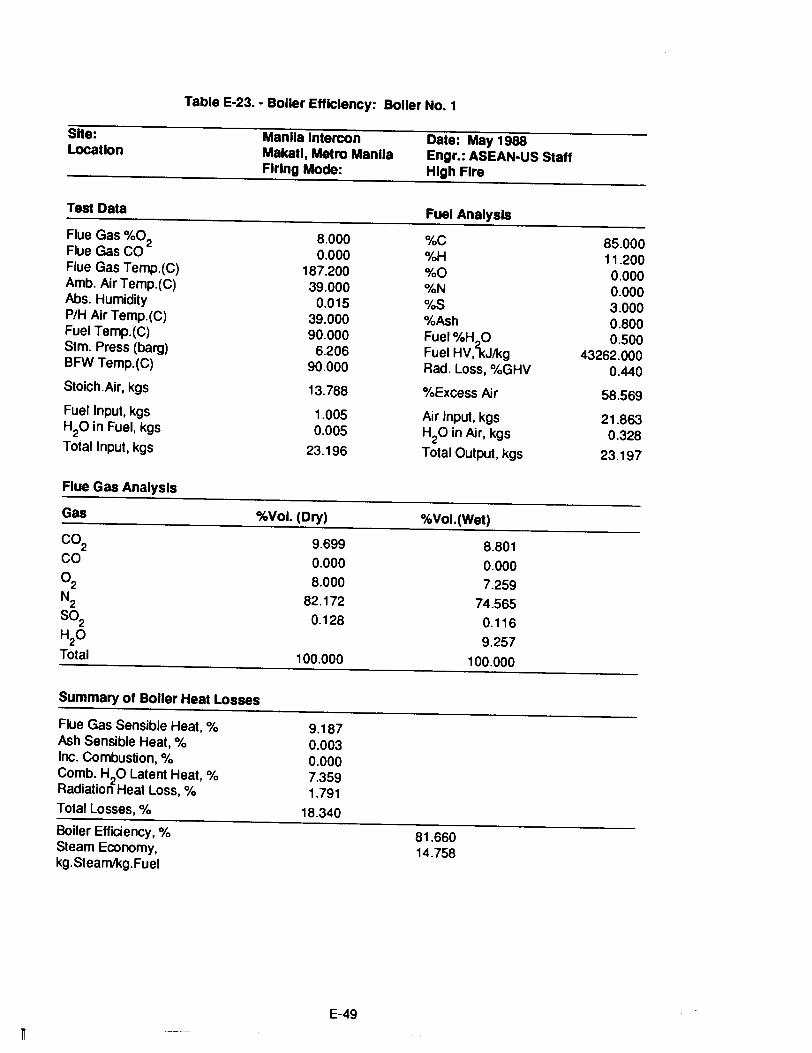
Table E-23. - Boller Efficiency: Boller No.1
Site: Manila Intercon Date: May 1988Location Makatl, Metro Manila Engr.: ASEAN-US Staff
Firing Mode: High Fire
Test Data Fuel Analysis
Flue Gas %02 8.000 %C 85.000Flue Gas CO 0.000 %H 11.200Flue Gas Temp.(C) 187.200 %0 0.000Amb. Air Temp.(C) 39.000 %N 0.000Abs. Humidity 0.015 %S 3.000P/H Air Temp. (C) 39.000 %Ash 0.800Fuel Temp.(C) 90.000 Fuel%H ° 0.500Stm. Press (barg) 6.206 Fuel HV,\Jlkg 43262.000BFW Temp.(C) 90.000 Rad. Loss, %GHV 0.440Stoich.Air, kgs 13.788 %Excess Air 58.569Fuel Input, kgs 1.005 Air Input, kgs 21.863H20 in Fuel, kgs 0.005 H20 in Air, kgs 0.328Total Input, kgs 23.196 Total Output, kgs 23.197
Flue Gas Analysis
Gas %Vol. (Dry) %Vol.(Wet)
CO2 9.699 8.801CO 0.000 0.000°2 8.000 7.259N
2 82.172 74.565S02 0.128 0.116H2O 9.257Total 100.000 100.000
Summary of Boller Heat Losses
1f
Flue Gas Sensible Heat, %Ash Sensible Heat, %Inc. Combustion, %Comb. H20 Latent Heat, %Radiation Heat Loss, %Total Losses, %
Boiler Efficiency, %Steam Economy,kg.Steamlkg.Fuel
9.1870.0030.0007.3591.791
18.340
E-49
81.66014.758
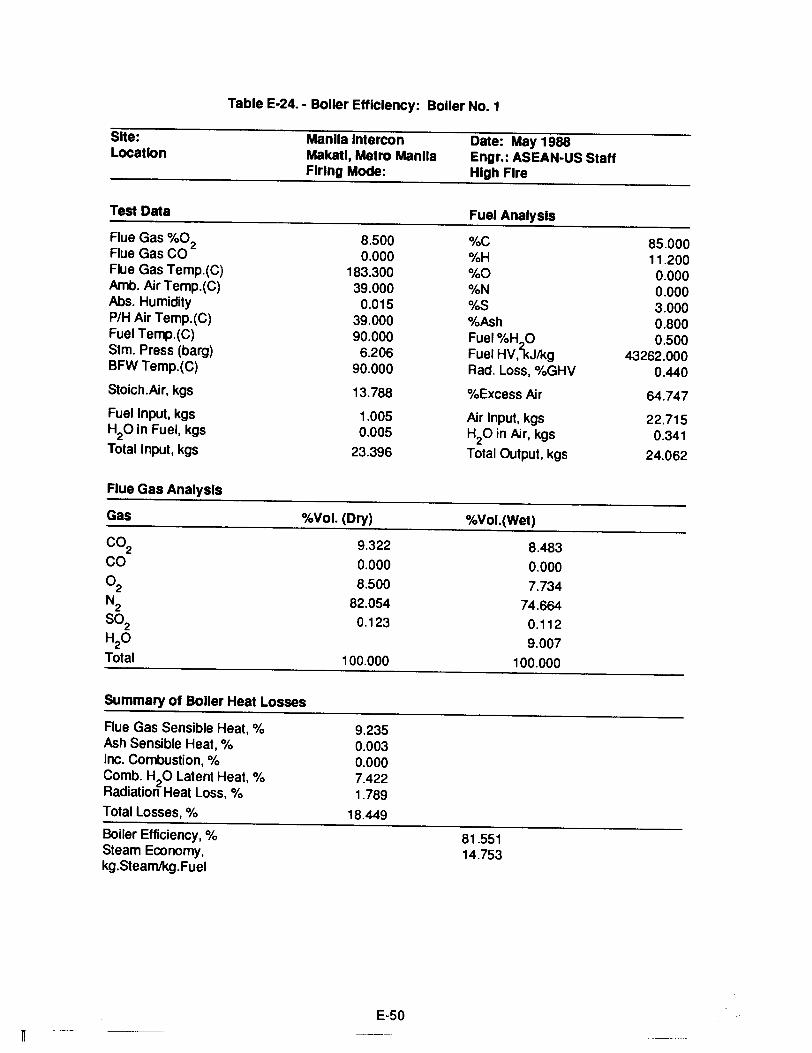
Table E-24. - Boller Efficiency: Boller No.1
Site: Manila Intercon Date: May 1988Location Makatl, Metro Manila Engr.: ASEAN-US Staff
Firing Mode: High Fire
Test Data Fuel Analysis
Flue Gas %02 8.500 %C 85.000Flue Gas CO 0.000 %H 11.200Flue Gas Temp.(C) 183.300 %0 0.000Amb. Air Temp.(C) 39.000 %N 0.000Abs. Humidity 0.015 %S 3.000P/H Air Temp.(C) 39.000 %Ash 0.800Fuel Temp.(C) 90.000 Fuel%H ° 0.500Stm. Press (barg) 6.206 Fuel HV,'kJlkg 43262.000BFW Temp.(C) 90.000 Rad. Loss, %GHV 0.440
Stoich.Air, kgs 13.788 %Excess Air 64.747
Fuel Input, kgs 1.005 Air Input, kgs 22.715H
20 in Fuel, kgs 0.005 H20 in Air, kgs 0.341
Total Input, kgs 23.396 Total Output, kgs 24.062
Flue Gas Analysis
Gas %Vol. (Dry) %Vol.(Wet)
CO2 9.322 8.483
CO 0.000 0.000
°2 8.500 7.734N2 82.054 74.664
S02 0.123 0.112H2O 9.007
Total 100.000 100.000
Summary of Boller Heat Losses
Flue Gas Sensible Heat, %Ash Sensible Heat, %Inc. Combustion, %Comb. H20 Latent Heat, %Radiation Heat Loss, %
Total Losses, %
Boiler Efficiency, %Steam Economy,kg.Steamlkg.Fuel
9.2350.0030.0007.4221.789
18.449
E-50
81.55114.753
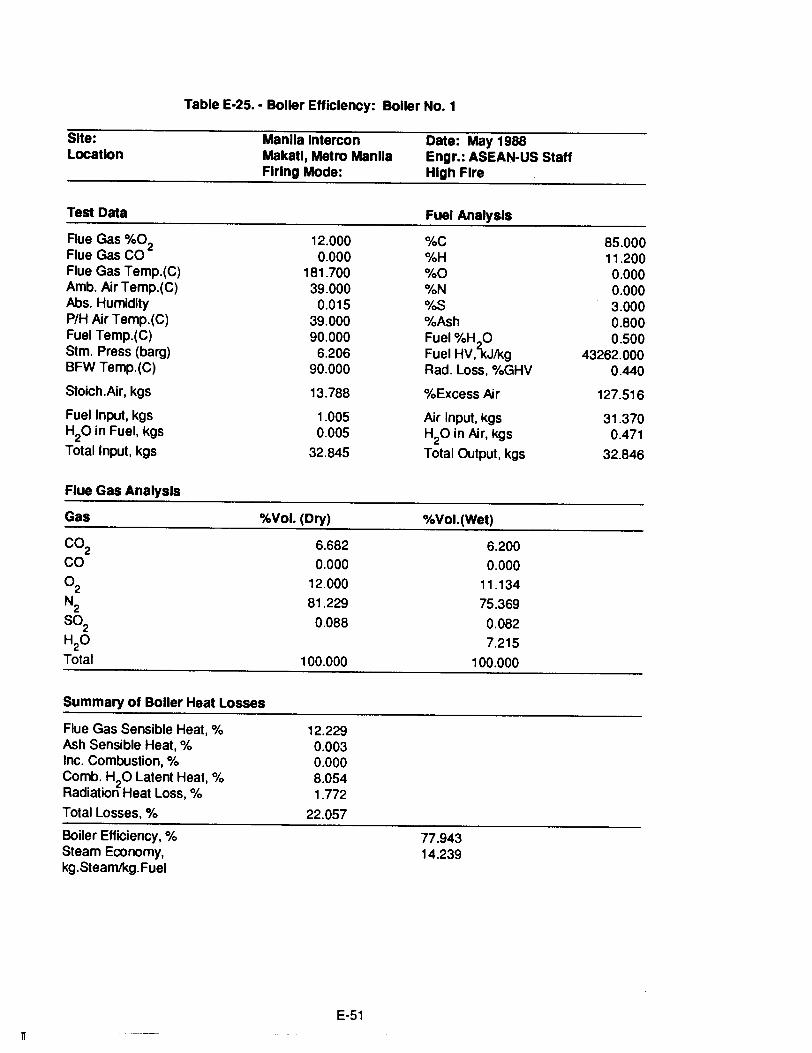
Table E·25.• Boller Efficiency: Boller NO.1
Site: Manila Intercon Date: May 1988Location Makatl, Metro Manila Engr.: ASEAN·US Staff
Firing Mode: High Fire
Test Data Fuel Analysis
Flue Gas %02 12.000 %C 85.000Flue Gas CO 0.000 %H 11.200Flue Gas Temp.(C) 181.700 %0 0.000Amb. Air Temp.(C) 39.000 %N 0.000Abs. Humidity 0.015 %S 3.000P/H Air Temp.(C) 39.000 %Ash 0.800Fuel Temp.(C) 90.000 Fuel%H ° 0.500Stm. Press (barg) 6.206 Fuel HV,\Jlkg 43262.000BFW Temp.(C) 90.000 Rad. Loss, %GHV 0.440
Stoich.Air, kgs 13.788 %Excess Air 127.516
Fuel Input, kgs 1.005 Air Input, kgs 31.370H20 in Fuel, kgs 0.005 H20 in Air, kgs 0.471
Total Input, kgs 32.845 Total Output, kgs 32.846
Flue Gas Analysis
Gas %Vol. (Dry) %Vol.(Wet)
CO2 6.682 6.200CO 0.000 0.000
°2 12.000 11.134N2 81.229 75.369
S02 0.088 0.082H2O 7.215
Total 100.000 100.000
Summary of Boller Heat Losses
IT
Flue Gas Sensible Heat, %Ash Sensible Heat, %Inc. Combustion, %Comb. H20 Latent Heat, %Radiation Heat Loss, %
Total Losses, %
Boiler Efficiency, %Steam Economy,kg.Steamlkg.Fuel
12.2290.0030.0008.0541.772
22.057
E-51
77.94314.239

Table E·26.· Boller Efficiency: Boller No.1
Site: Manila Intercon Date: May 1988Location Makatl, Metro Manila Engr.: ASEAN·US Staff
FIring Mode: High Fire
Test Data Fuel Analysis
Flue Gas %02 2.900 %C 85.000Flue Gas CO 0.000 %H 11.200Flue Gas Temp.(C) 200.000 %0 0.000Amb. Air Temp.(C) 39.000 %N 0.000Abs. Humidity 0.015 %S 3.000P/H Air Temp.(C) 39.000 %Ash 0.800Fuel Temp.(C) 90.000 Fuel%H ° 0.500Stm. Press (barg) 6.206 Fuel HV,\J/kg 43262.000BFW Temp.(C) 90.000 Rad. Loss, %GHV 0.440
Stoich.Air, kgs 13.788 %Excess Air 15.202
Fuel Input, kgs 1.005 Air Input, kgs 15.884H20 in Fuel, kgs 0.005 H20 in Air, kgs 0.238
Total Input, kgs 17.127 Total Output, kgs 17.128
Flue Gas Analysis
Gas %Vol. (Dry) %Vol.(Wet)
CO2 13.546 11.956
CO 0.000 0.000
°2 2.900 2.560
N2 83.375 73.591
S02 0.179 0.158H2O 11.734
Total 100.000 100.000
Summary of Boller Heat Losses
H
Flue Gas Sensible Heat, %Ash Sensible Heat, %Inc. Combustion, %Comb. H20 Latent Heat, %Radiation Heat Loss, %
Total Losses, %
Boiler Efficiency, %Steam Economy,kg.Steamlkg.Fuel
7.4630.0030.0006.9141.803
16.183
E-52
83.81715.045
APPENDIX F
CHARN ISSARA SHOPPING ARCADE
AUDIT REPORT
THAILAND
This report is one of five excellent energy audits conducted by the Thailand investigative team.
The five audits focused on the buildings' air-conditioning systems and used DOE-2 for the
analysis. The bUilding types covered by the other audits were: office, hotel, hospital, and academ
ic library.
PROGRESS REPORT
ASEAN-USAID PROJECT
ON
ENERGY CONSERVATION IN BUILDINGS
AIR-CONDITIONING SYSTEM
CHARN ISSARA SHOPPING ARCADE, BANGKOK, THAILAND
Researchers:
Dr. Pibool HungspreugBoonpong Kijwatanachai
Chairit KongsakpaibulChanthip Kanchanachongkol
King Mongkut's Institute of TechnologyThonburi, Bangkok 10140
Thailand
ABSTRACT
Shopping arcades in tropical countries require air-conditioning systems both for the comfort of the
occupants and to keep dust and dirt out of shops.
Investigation of the energy consumption and air-conditioning loads of a typical first-class
shopping arcade in Bangkok showed that the air-conditioning system accounted for about 60% of
the total energy consumption. The investigation also showed that considerable amounts of energy
could be conserved, without sacrificing comfort, by taking the followinQ-steps:
• Using a variable air volume system to supply air according to the air-conditioning load
requirement.
• Using an air-to-air heat exchanger to reduce heat load of the fresh air intake.
• Raising the leaving chilled water temperature as high as possible.
Since most of the time the enthalpy of the outside air is much higher than that of the exhaust
air, considerable energy could be conserved by using the cool and dry exhaust air to reduce the
enthalpy of the warm and humid outside air brought into the air-conditioning system.
OBJECTIVE AND SCOPE OF WORK
Introduction
The rapid growth in the economy of Thailand has led to a rapid increase in the number of
large, air-conditioned commercial buildings. Air-conditioning equipment consumes more than
70% of the total electrical energy consumption of commercial buildings. They also contribute
immensely to the electricity peak load. Thus, energy conservation in air-conditioning is a
significant developmental strategy, the ASEAN-USAID Project on Buildings Energy Conservation
focus on air-conditioning equipment and systems in Thailand is quite timely.
Objective
This research aims to assess the performance of air-conditioning equipment in use in the
major cities of Thailand, and to explore possible approaches to increasing efficiencies of the air
conditioning systems in buildings. The activities of the research project included the use of PC
DOE-2.1 B in parametric analysis and actual physical evaluation of the air-conditioning equipment
under different control sequences.
Scope of Work
The scope of work includes the following subjects
Baseline Information on Air-Conditioning Use:
This study was made in collaboration with the daylighting research group to acquire the
baseline information on the configuration and type of air-conditioning equipment in use. In addi
tion, the study included a survey and energy audit of buildings as a continuation of an earlier
study.
The study also furnishes information on the relative number of each class of air-conditioning
equipment and the typical construction of the air-conditioned space for which the equipment is
used, and identifies a number of buildings which might be classified as typical.
This activity aims to provide baseline information for use in DOE-2 analysis and for use in
evaluating air-conditioning performance. The study evaluates configurations and conditions of
existing air-conditioning systems, determines the potential for energy conservation and electrical
load reduction, and provides recommendations for energy conservation based on the above
evaluations.
Expected results from this research will be
1. A set of baseline information on air-conditioning equipment and building construction.
F-1
2. Radiation and weather data for the local area.
3. The training of a technician who will be experienced in the parametric study of airconditioning system performance.
4. A parametric study of air-conditioning equipment for each major city, available for policy consideration.
5. A physical evaluation of the air-conditioning equipment performance.
BUILDING SELECTION
Reasons for the selection of the Cham Issara Shopping Arcade for this research are as follows:
• There are many shopping arcades in Thailand and many more will be built.
• Shopping arcades are a type of building which needs to have an air-conditioning system for the comfort of its occupants.
• Cham Issara Shopping Arcade is a typical shopping arcade in Thailand and it uses atypical air-conditioning system.
BUILDING DESCRIPTION AND DATA COLLECTION FORMS
Building Description
General:
Cham Issara Shopping Arcade and Office Condominium was built in 1985. The first fourstorys house an arcade with total floor area of 4,800 m2 and an atrium in the center. The atrium issurrounded by corridors and shops. The shops face the atrium. The fifth floor is a trade exhibitioncenter. The 6th to 26th floors are offices.
Shops are air-conditioned mainly by small split-type air conditioners. The cost of operatingthe air conditioner is the responsibility of the owner of the shop. The atrium, corridors, and someof the shops are air-conditioned by the central air-conditioning system, which consists of threeair-cooled water chillers. Each air-cooled water chiller has 1,200,000 Btu/hr cooling capacity.Chilled water is circulated by three sets of centrifugal pumps, each of which has a pumping capacity of 240 gpm. There are eight air handling units and eight fan coil units supplying 66,000 cfm ofcooled air to the air-conditioned spaces. Air handling units are controlled by two-way motorizedvalves with proportional thermostats. Offices are air-conditioned by split-type air conditioners.
Building Envelope:
Walls. Exterior walls are four-in. hollow brick with plaster on both sides and tinted glass.
Doors. Main entrance doors are nine-mm. thick tinted glass.
Roof. The roof is a four-in. thick concrete slab and is insulated with two-in. thick fiberglassinsulation.
Ceiling. The ceiling is constructed with nine-mm thick gypsum board with a metal studframe.
Floor. The floor is a four-in. thick concrete slab
Data Collection Forms
The PC-DOE 2.1 B program consist of four parts: load input, system input, plant input, andeconomics. Data collection forms, using ASEAM-2 input forms as a guideline, provide the framework for the field surveys.
Load Input:
1. Information about building shading obstructions
2. People schedule.
\ \F-2
3. Lighting schedule.
4. Lighting fixture type.
5. Lighting load or task lighting.
6. Equipment schedule.
7. Equipment load.
8. Zone number, sizes, locations, construction materials, and locations (exterior and interior).
9. Glass type.
10. Ground and roof construction materials.
System Input:
1. Reset control temperature setting.
2. Design zone volumetric air flow.
3. Design zone outside air flow.
4. Design zone exhaust air flow.
5. Zone temperature setting.
6. Zone thermostat type, throttling range.
7. Supply air temperature setpoint.
8. Supply air temperature control.
9. Outside air control.
10. System fan control.
11. Fan schedule.
12. Static pressure for fan, efficiency and brake horse power.
13. Total and sensible cooling coil capacity.
14. Coil bypass factor.
15. Return air routing.
Plant Input:
1. Type, size, quantity, run period schedule, electric input ratio, and performance curve.
2. Temperature and capacity control setpoint.
3. Cooling tower design wet bulb temperature, fan control, and type of cooling tower.
4. Pump type, flow rate capacity, efficiency, and brake horse power.
FIELD SURVEY TASKS AND DATA COLLECTION
General
To analyze the building energy consumption using PC-DOE-2.1 S, it is necessary to collectall data required by the program. A considerable amount of time was spent getting details of thebuilding envelope. The bUilding envelope includes walls, windows, doors, roof, and bottom floor.All these isolate the space inside from the outside environment. Since heat load makes up asignificant amount of the total energy consumption, it was very important that the buildingenvelope be examined in great detail to find areas where it could be improved. Mechanical andelectrical systems were also analyzed as part of the field survey. These systems include airconditioning equipment, piping, ducting, fans, pumps, lighting, and power systems. All systemswere checked for method of contrOl, operating efficiency, maintenance scheduling, leaks, insulation, and discussions were held with workers or employees who influenced their energy consumption. The field survey included acquiring information on structural and architectural features, aswell as mechanical and electrical equipment. Whenever possible, interviews were conducted with
F-3
-- - --- --,--" -- .... _.~_.. _. __ • __•••_.- ...... F"'O ..
• - ."'._.- _'r-=•• __ ••••
the workers and employees associated with the building's various functions in order to gain moreinsight into the overall operation.
Steps to Collect the Data
Modeling the building's energy consumption requires that certain data be collected. Steps tocollect the data are described below:
Pre-Survey Information:
In this step, the building's drawings-which include the architectural, structural, mechanical,electrical, sanitary (plumbing), and elevator systems-are obtained. The building's existingenergy bills are also obtained and analyzed. The researcher contacts the person who takes careof the building's facilities, such as the chief engineer, to ask about equipment. operation, andmaintenance schedules.
Field Survey Tasks:
This step consists of several items as described below:
Load Input.
1. Review the building's drawings and perform field visit.
2. Survey the building envelope, including walls, windows, roof, floors, etc.
3. Assign zone spaces in the building.
4. Measure space and construction materials in zones
5. Measure temperature and check the thermostat setpoints in zones
6. Count occupants and activities.
7. Measure electrical system, including lighting and power, in the zones.
8. Assign occupancy schedule of zones.
9. Measure infiltration in zones.
System Input.
1. Consider type and configuration of air-conditioning system in the building and zones.
2. Measure leaving temperature of cooling equipment and check the cooling coil tem-perature setpoint.
3. Check total consumption of fan power in zones.
4. Check total supply air to spaces or zones.
5. Check temperature rise of discharge air from fan.
6. Check air control method, fan control method, and motor drive.
7. Check scheduling of fans.
8. Check the optimizer.
Plant Input.
1. Consider chiller type, cooling capacity design coefficient of performance, entering andleaving water setpoint, part load ratio of the machine, and power consumption.
2. Check number, sequencing, and load management of chillers
3. Check scheduling of machines.
4. Check chilled water pumps and condenser water pumps for capacity, consumption,number, and operation.
5. Check cooling towers for design wet bulb temperature, fan control, and type.
6. Check cooling towers for number and mode of operation.
Final Check for Complete Data Collection:
F-4
This step will review and finalize all data to compile into loads, system, and plant forms.
Data Summary of the Building and Its Operation
The analysis is limited to the air-conditioning systems in the shopping arcade and to the central air-conditioning system using air-cooled water chillers
Total air-conditioned floor area: 4,800 m2.
Air-conditioning equipment:
3 x 100 tons air-cooled water chillers
3 x 240 gpm. centrifugal chilled water pumps
8 air handling units and 8 fan coil units with a total supply air of 66,000 cfm.
EVALUATION OF ENERGY CONSERVATION OPPORTUNITIES
Air-conditioning systems and equipment of the Charn Issara Shopping Arcade were simulated tofind opportunities for energy conservation.
Supply Air of Air Handling Units
Analysis of the load suggests that the minimum supply of air to the air handling units shouldbe 68,400 cfm. The survey showed that the existing supply of air to the air handling units to be66,000 cfm. No energy could therefore be saved by adjusting the speed of the blowers of the airhandling units to supply the minimum amount of air to the space.
Fresh Air Intake
Survey data showed that fresh air intake into the building was 7,660 cfm. This amount offresh air was considered to be the minimum amount for ventilation for the 4,800 m2 total floor areaof the building. The existing amount of fresh air was therefore kept constant throughout.
Variable Air Volume System
A simulation was run in which the supply air volume of the air handling units was controlledto meet the cooling loads by discharge air dampers or inlet guide vanes. Comparing the energyconsumed by the existing air-conditioning system with a variable air volume system usingdischarge air dampers or inlet guide vanes for controlling air quantity showed that much energycould be saved using the variable air volume system. Investment in a variable air volume systemis considerable, but still economically feasible.
Air-to-Air Heat Exchanger
Fresh air taken into the building was 7,660 cfm. If this amount of warm and humid fresh aircould exchange heat to the cool and dry exhaust air, the cooling load needed to cool fresh airwould be greatly reduced.
Raising Leaving Chilled Water Temperature
Theoretically, the coefficient of performance of the refrigeration system will increase with anincrease in the evaporating temperature. However, in the central air-conditioning system, thepower to pump chilled water and the power to blow air through the cooling coils must be added tothe power of the refrigeration system. If the water temperature is increased, more water and moreair will have to be passed through the cooling coils for the same cooling loads.
Analysis of the Cham Issara Shopping Arcade air-conditioning system showed little changein power consumption when the leaving chilled water temperature was varied between 45°F and52°F. The power consumption was lowest when the leaving chilled water temperature was 49°F.
F-5
RESULTS
[The original report contains all of the tables and figures listed below. For the sake of brevity, onlyone table, summarizing the findings of Tables 1 and 2, is presented at the end of this report.]
Table 1.
Table 2.
Table 3.
Table 4.
Table 5.
Table 6.
Table 7.
Table 8.
Table 9.
Table 10.
Table 11.
Figure 1.
Figure 2.
Figure 3.
Figure 4.
Figure 5.
Figure 6.
Figure 7.
Figure 8.
Figure 9.
Figure 10.
Abbreviation of conditions
Comparison of various conditions against condition CIC
Plant cooling and electrical energy inputs per year of CIC at variousleaving chilled water temperatures.
Plant cooling and electrical energy inputs per year of CID at variousleaving chilled water temperatures.
Plant cooling and electrical energy inputs per year of CII at variousleaving chilled water temperatures.
Economic comparison of various conditions against CIC condition.
Economic comparison of CID vs CIC
Economic comparison of CII vs CID
Economic comparison of CIC-ATA vs. CII
Economic comparison of CID-ATA vs. CII-ATA.
Economic comparison of CID-ATA vs. CII-ATA.
Space load components of CI.
Monthly Ventilation Load of Various Conditions.
Monthly Cooling Energy of Various Air-Conditioning Systems.
Monthly System Electrical Energy.
Monthly Plant Electrical Energy of Various Air-Conditioning Systems.
Total Monthly Electrical Energy of Various Air-Conditioning Systems.
Monthly Cooling Energy Saving of Various Air Conditioning systems.
Total Monthly Electrical Energy Saving of Various Air-ConditioningSystems vs. CIC.
Plant Electrical Energy Inputs of Various Air-Conditioning Systems inkWh/year at Various Leaving Chilled Water Temperatures.
Plant Electrical Energy Inputs of Various Air-Conditioning Systems inkWh/year at Various Leaving Chilled Water Temperatures.
1l
CONCLUSION
Comparison of various conditions against the base case condition showed that:
• By installing discharge air dampers in the existing air-conditioning system, coolingenergy saving would be 964.66 MBtu/yr, electrical energy saving 120,055 kWh/yr andmoney saving 182,483 BahVyr: Equivalence at 12% interest rate would be 1.79 yearsand IRR would be 65.18.
• By installing inlet guide vanes in the existing air-conditioning system, cooling energysaving would be 1,443.48 MBtu/yr, electrical energy saving 205,708 kWh/yr, andmoney saving 312,676.16 Baht/yr. Equivalence at 12% interest rate would be 1.57
• The conversion rate used. as 01 June, 1990. was 2586 Thai Bahls to 1 US Dollar
F-6
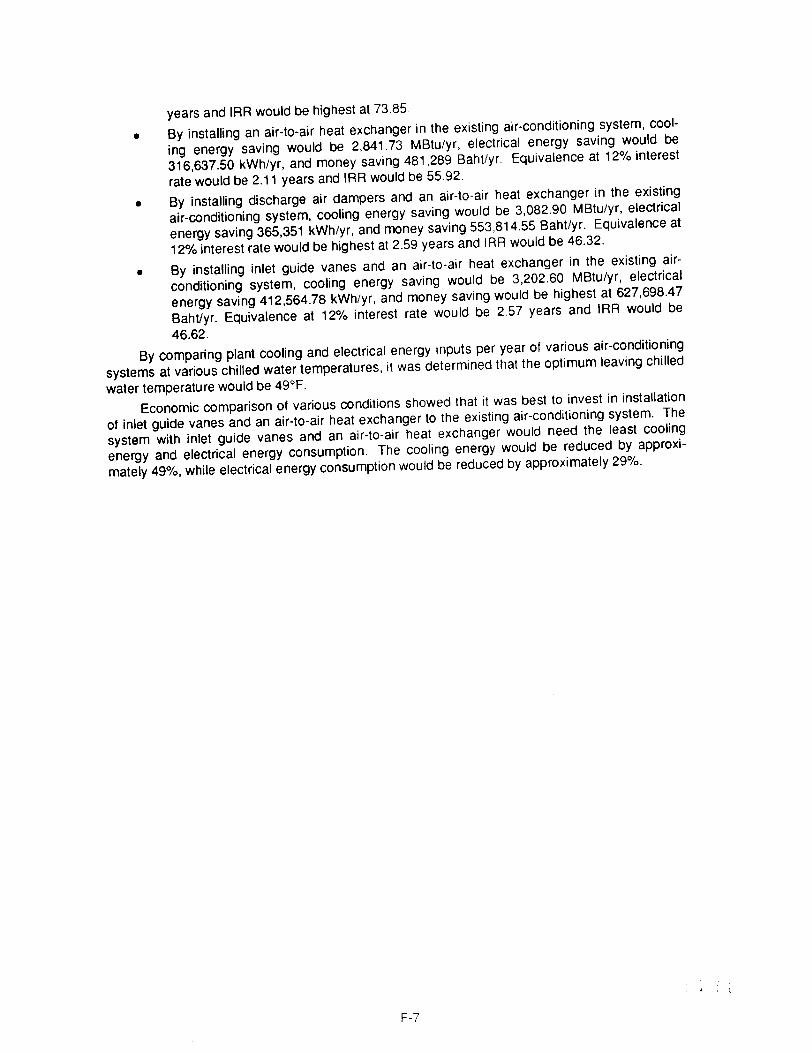
years and IRR would be highest at 73.85.
• By installing an air-to-air heat exchanger in the existing air-conditioning system, cool
ing energy saving would be 2,841.73 MBtu/yr, electrical energy saving would be
316,637.50 kWh/yr, and money saving 481,289 Baht/yr. Equivalence at 12% interest
rate would be 2.11 years and IRR would be 55.92.
• By installing discharge air dampers and an air-to-air heat exchanger in the existing
air-conditioning system, cooling energy saving would be 3,082.90 MBtu/yr, electrical
energy saving 365,351 kWh/yr, and money saving 553,814.55 Baht/yr. Equivalence at
12% interest rate would be highest at 2.59 years and IRR would be 46.32.
• By installing inlet guide vanes and an air-to-air heat exchanger in the existing air
conditioning system, cooling energy saving would be 3,202.60 MBtu/yr, electrical
energy saving 412,564.78 kWh/yr, and money saving would be highest at 627,698.47
Baht/yr. Equivalence at 12% interest rate would be 2.57 years and IRR would be
46.62.
By comparing plant cooling and electrical energy inputs per year of various air-conditioning
systems at various chilled water temperatures, it was determined that the optimum leaving chilled
water temperature would be 49°F.
Economic comparison of various conditions showed that it was best to invest in installation
of inlet guide vanes and an air-to-air heat exchanger to the existing air-conditioning system. The
system with inlet guide vanes and an air-to-air heat exchanger would need the least cooling
energy and electrical energy consumption. The cooling energy would be reduced by approxi
mately 49%, while electrical energy consumption would be reduced by approximately 29%.
F-7
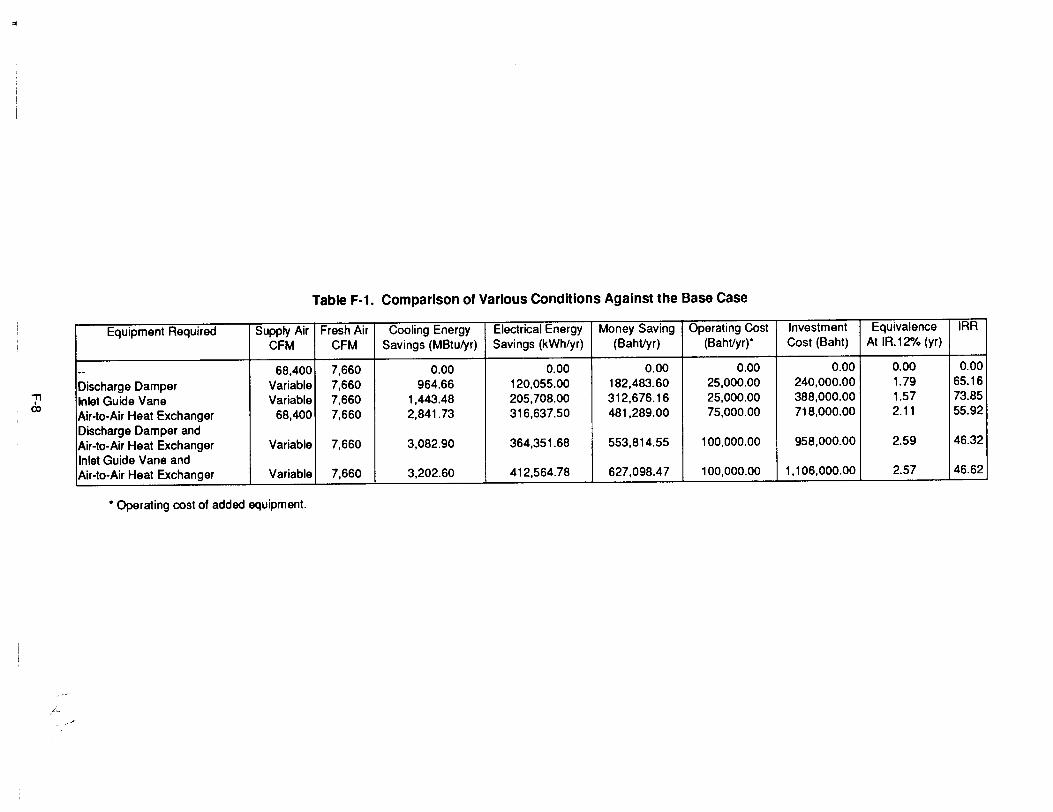
"
"T1I
(Xl
,,,;":...
.'./
Table F·1. Comparison of Various Conditions Against the Base Case
Equipment Required Supply Air Fresh Air Cooling Energy Electrical Energy Money Saving Operating Cost Investment Equivalence IRRCFM CFM Savings (MBtulyr) Savings (kWh/yr) (BahVyr) (BahVyr)* Cost (Baht) At 1R.12% (yr)
-- 68,400 7,660 0.00 0.00 0.00 0.00 0.00 0.00 0.00Discharge Damper Variable 7,660 964.66 120,055.00 182,483.60 25,000.00 240,000.00 1.79 65.16Inlet Guide Vane Variable 7,660 1,443.48 205,708.00 312,676.16 25,000.00 388,000.00 1.57 73.85Air-to-Air Heat Exchanger 68,400 7,660 2,841.73 316,637.50 481,289.00 75,000.00 718,000.00 2.11 55.92Discharge Damper andAir-to-Air Heat Exchanger Variable 7,660 3,082.90 364,351.68 553,814.55 100,000.00 958,000.00 2.59 46.32Inlet Guide Vane andAir-to-Air Heat Exchanger Variable 7,660 3,202.60 412,564.78 627,098.47 100,000.00 1,106,000.00 2.57 46.62
* Operating cost of added equipment.

APPENDIX G
HOLIDAY INN CITY CENTRE
AUDIT REPORT
MALAYSIA
This report is an example of the aUditing work conducted by the Malaysian team. The auditorsused ASEAM-2, a software tool appropriate to an intermediate level of analysis.
n
PRELIMINARY ENERGY AUDIT REPORT
HOLIDAY INN CITY CENTRE
KUALA LUMPUR, MALAYSIA
Preformed by:
Abd. Halim Hj. Abd. Rahman
Supervised by:
Associate Professor K.S. KannanUniversiti Teknologi Malaysia
Kuala Lumpur, Malaysia
February 27, 1988
INTRODUCTION
The energy audit is a study which determines how, when, and where energy is used in an existing
building and identifies opportunities for conservation.
OBJECTIVES
The objectives of the commercial audits performed are as follows:
• Evaluate the existing configuration and condition of the building energy systems and
determine the potential for energy conservation and/or electrical load reduction;
• Evaluate the existing operating and maintenance practices for potential energy conser
vation and electrical load reduction; and
• Provide recommendations for cost-effective energy conservation based on the above
evaluation.
METHOD OF ANALYSIS
Data Collection
Before starting the study in detail, it was first necessary to understand how the building uses
energy. To do this, utility bills of the building were analyzed, and compiled into an energy history.
Examination and analysis of the utility bills before, during, and after an energy audit were also
useful. Once the energy history was established and analYZed, a comprehensive building inspec
tion was undertaken to determine where conservation measures were needed. In addition, inter
views were conducted with maintenance engineers and employees associated with various func
tions to gain insight into overall building operations. A large part of inspection time was spent exa
mining the building envelope, including walls, windows, doors, roof, and floors. Since cooling
makes up a significant amount of the total energy consumption, it was very important to examine
the building envelope in detail to find areas where it could be improved. Building mechanical and
electrical systems also were examined and analyzed. These systems included cooling equip
ment, piping and ducting, fans, domestic hot water, steam boiler, and lighting. All systems were
checked for control methods, operating efficiency, maintenance scheduling, leaks, insulation, and
other factors which influenced energy consumption.
Energy Conservation Opportunities (ECO) Analysis
Using the information gathered from the energy history and building inspections, a list of
energy and cost-saving opportunities and recommendations was developed. Many of the cost
effective energy conservation measures required little or no capital outlay because significant sav
ings could be obtained through minor operational changes. Future changes would be broader in
scope and more capital intensive. All calculations in this study were performed by the ASEAM
Version 2.0 computer simulation program developed by W. S. Fleming & Associates, Inc. Costs
are estimated in 1987 Malaysian Ringgit.
BUILDING DESCRIPTION
General
The building consisted of a four-story podium block with parking floors and a 14-story hotel
tower (see Figures G-1 and G-2). It is joined to an adjacent building at the northeast comer. The
building's facades are oriented to the northeast, southwest, and northwest, with the front facing
the southeast. The building has apprOXimately 130,000 ft2 of floor area and was commissioned in
1980.
Building Envelope
Walls:
The exterior walls were brickwork and finished by rough cast plaster, marble. and tiles. The
walls outside the hotel guest rooms were a dark color.
G-1
Windows:All windows contained single-pane glass. The hotel guest rooms, function rooms, and
shops had internal shading. The first floor facades on the southeast were shaded by overhangs.
Doors:The main entrance was an automatic sliding door of single-pane glass. Internal doors were
of the swinging type and were made of wood.
Roof:
The roofing material was eight-inch concrete slab and finished with rubber insulation.
Floor:The floor material was six-inch concrete slab and finished by cement, tile, marble, and car
pet, except for staff canteen, food store, and housekeeping areas.
Air-Conditioning SystemThe refrigeration plant of the main air-conditioning system serving the hotel guest rooms
consisted of two Mitsubishi centrifugal chiller units, with one normally in operation and one onstandby. Chilled water from the operational unit was circulated to individual cooling coils found ineach guest room of the hotel. Conference rooms and restaurant areas were also served by thechilled water plant. The chillers work on R-12, and typically operated at 80% of the full load capacity; at night the load imposed was less.
Lighting
The building used two types of lighting.
Fluorescent:
• 4 x 2: 4 fluorescent tubes, 2-foot
• 2 x 4 : 2 fluorescent tubes, 4-foot
• 3 x 4 : 3 fluorescent tubes, 4-foot
The fluorescent lights were used in offices, the staff canteen, toilets, kitchen, and car-parks.
Incandescent:The building used different intensities of fixtures, Le., 25W, 40W, 60W, 80W, and 100W.
The incandescent lights were used in hotel guest rooms, room corridors, front lift lobby, functionrooms, the restaurant, bar, coffee house, and the hotel lobby.
ELECTRICITY BILL
Monthly bills were supplied by the National Electricity Board of Malaysia (NEB). The buildingused Tariff E1 - Medium Voltage General Industrial Tariff. The NEB charge for each unit was M$0.161US$ 0.06. The NEB also charged for each kilowatt of maximum demand per month. Thecharge was M$12.00/US$ 4.65 and the minimum charge was M$ 500/US$ 194. The buildingowner was also required to pay a Connected Load Charge when using supplies at medium or highvoltages. The chargeable maximum demand (MD) was the shortfall between 75% of the declaredMD and the actual MD measured in anyone month. The charge for the monthly connected loadwas M$ 4/US$ 1.55 for each kW of chargeable MD.
ENERGY END-USE
The building's electricity consumption for the first nine months in 1987 was M$ 894,906lUS$346,796. The energy consumption totaled 3,809,150 kWh which cost M$ 707,544/US$ 274,189,of which M$ 99,880/US$ 38,706 was the maximum fee. LPG (liquefied petroleum gas) waslargely used for cooking. The consumption was 150 cylinders per month which cost M$57.80/US$ 22.40 per cylinder. Diesel was used for hot water and the steam boiler. The consumption was 8,900 Iitres, at M$ 0.561US$ 0.22 per litre.
G-2
BASE CASE
The base case sirrulation result showed only a slight difference when compared with actual bills,
not including the maxirrum demand fee. This is shown below:
Total electricity consumption for
the first nine months from actual bill = 3,797,900 kWh
Total electricity consumption for
the first nine months from base case = 3,452,981 kWh
Percentage of variation = 10%
The distribution of electricity consumption was analyzed trom the result of this base case.
The last two months showed slightly higher electricity use compared to other months. Possible
causes included the following:
• Higher than anticipated appliance electricity usage;
• Variation in building electricity use;
• Increased use ot the five lifts because of maintenance work; and
• Increased infiltration rates because of inefficient use of entrance/exit doors.
RECOMMENDATIONS
The following is a list with brief descriptions ot Operation and Maintenance (O&M) procedures and
ECOs identified during our stUdy which, if implemented. could save a significant amount of
energy. The O&M items can generally be performed by maintenance staff or maintenance con
tractors.
Building Envelope
Keep Boundary Doors Closed:
Both doors that separate conditioned space from the outside environment or unconditioned
space, and doors that mark the boundary between areas kept at different temperatures should
always be closed. Doors for food stores, control rooms, and meeting rooms were always open,
and this increases the rate of infiltration. The use of revolving doors should be investigated.
Lighting
Use High-Efficiency Ballasts:
Fluorescent lighting was Widely used in administration offices, corridors, staircases, toilets,
and car-parks. The electricity consumption can be reduced if present ballasts are replaced with
high-efficiency ballasts, i.e., 8W.
Reduce Number of Light Fixtures at Windows:
The front staircase, back staircase, and office corridor have daylighting access. The number
of light fixtures can be reduced to 30% of the present installed capacity.
Replace Incandescents with SL Lamps:
The lamps in hotel guest rooms and corridors can be replaced with SL lamps without affect
ing output or color. This can be described as below:
present incandescent replace with
GLS40WGlS60WGlS 100W
SLlamp
SL9WSL 13WSl25W
The replacement of incandescents in hotel guest rooms could reduce the installed capacity
by 62.5%. This is shown below:
G-3
Total wattage for 255 guest roomswith different categories whichuse incandescent
Total wattage for 255 guest roomswith different categories whichuse SL lampsWattage of reduction
Percentage of reduction
=126,030 Watts
= 47,242 Watts= 78,788 Watts
= 62.5%
= 7,680 Watt
= 1,728 Watt
= 5,952 Watt
= 77.5%
IT
The number of lamps replaced will be 2,207. 1,258 of these are SL 9W; 653 are SL 13Wand 298 are SL 25W. Total investment for this replacement is:
Total investment@ M$ 30/each = 2,209 x 30= M$ 66,270= US$25,682
The replacement of incandescent lamps in corridors would reduce the installed capacity by77.5%. This is shown below:
Total wattage for hotelcorridors which use incandescents
Total wattage for hotelcorridors which use SL lamps
Wattage of reduction
Percentage of reduction
The number of SL 9W lamps replaced will be 192. The investment for this replacement is:
Total investment@ M$ 30 = 192 x 30= M$5,760= US$2,232
Air-Conditioning System
Increase Thermostat Setting:
Set all thermostat setting temperatures to 24°C.
Optimize Operating Time:
The operating time of cooling systems could be optimized by starting the air handing units(AHUs) one-and-one-half hours before daily activities begin, and by turning it off during the lasthalf-hour of occupancy. This can be done for function rooms, meeting rooms, and administrationoffices.
Optimize Refrigeration System Operation:
Details of Recommendation. Considerable cost savings could be achieved by optimizing theoperation of the refrigeration chiller unit. It is recommended that the two chiller units be providedwith an optimizer unit that would cause the units to operate at peak efficiency. After monitoringthe load imposed by the chiller unit in operation, and adjusting the setpoints accordingly, theoptimizer would ensure low electrical usage.
Principle of Optimization. The coefficient of performance factor is a measure of theefficiency of operation of any chiller unit.
COP = cooling produced (refrigeration load)electrical power required (by chiller compressor motor)
COP varies not only with the amount of load, but also with the temperature of the chilledwater produced and the temperature of the condenser water circulated. COP increases with the
G-4
temperature at which chilled water can be circulated to the air handling plant. A good operational
control should provide a higher COP, and, therefore, reduce the power requirements of the
compressor motor. The optimizer would monitor all the factors affecting COP and other related
parameters, and could reset the machine to operate at a revised condition, resulting in the best
COP factor possible.
Cost SaVing Calculation. It is estimated that the recommended optimizer control system
would save 12% of chiller energy, assuming that the chiller operated at approximately 260 amps,
and at a power factor of 0.9.
Power consumed = 3 x 415 x 260 x 0.9= 168 kW
Annual energy consumed
at an average of 80%of normal operation
Annual operating costsat M$ 0.16 per kWh
Estimated saving @ 12%
=0.8x 168x8760= l,ln,344 kWh
= M$188,375= US$ 73,000
= M$ 22,605= US$ 8,760
Resource/Investment Required. Approximately M$ 60,000/US$ 23,252 would be required
for the following work:
installation of a limited monitoring system to determine load variation of the chiller dur
ing a typical day;
interlocking of the optimizer with the chiller electronic operating and safety controls;
and
testing, balancing, and recommissioning the system.
Payback Period.
Simple payback period = investment req~iredannual cost savings
= 60,000/22,605
= 2.65 years
Installation of a speed control device is also recommended. It would regulate the capacity of
the compressor refrigeration unit to meet the exact requirements of the hotel's building load.
Equipment
Turn Off Kitchen and Office Equipment:
Workers should be encouraged to keep electricity-consuming kitchen equipment off when
not in use. Staff should minimize use of office equipment such as the copiers, typewriters, and
computers.
Refrigerator: Clean Condenser Coils:
Clean coils and fans to increase heat transfer efficiency. The energy consumption of refri
gerators and freezers is directly related to the temperature at which they are kept. If possible,
temperature settings should be increased as much as possible while maintaining food-storage
quality. Every degree can mean large savings.
G-5
n
ENERGY CONSERVATION OPPORTUNITIES (ECOs)
Single ECOs (SECOs)
Three potential SECOs are identified:
SECD #1. Replace incandescent lamps in hotel guest rooms with SL lamps.
SECD #2. Replace incandescent lamps in guest room corridors with SL lamps.
SECD #3. Increase thermostat settings.
MUltiple ECO (MECO)
Two potential MECOs are identified:
MECD #1. Replace incandescent lamps in hotel guest rooms and increase thermostat settings.
MECD #2. Replace incandescent lamps in guest room corridors and increase thermostat settings.
The resuhs are shown in Tables G-1 and G-2.
COMMENT
Submeters should be installed to track the energy use of the large consumers, i.e., chillers,pumps, and AHUs, thereby discovering any unpredicted large increase in electricity consumption.With sufficient recorded submetering, immediate action could be taken when excess consumptionwas noted. At a minimum, submetering should be installed for each cooling tower, for each chillerinstallation, and for the individual AHUs. Daily kWhs should be recorded by the maintenancedepartment and evaluated by the maintenance officer. At a minimum, the chiller log-forms mustcontain the following:
• entering/leaving chiller water temperature;
• entering/leaving condenser water temperature;
• condenser pressures;
• chiller pressures; and
• amps.
Daily boiler logs containing information on temperature and efficiency would provide usefulinformation for the calculation of possible energy savings. The maintenance department shouldreview the manuals, and if necessary, update them. The maintenance department must be surethat the staff is familiar with the manuals and schedules, and that they follow them as closely aspossible. Plant cooling instruments must be maintained properly, and this is not being done at thepresent time. Training should be given on the proper use of equipment, and on the basic principles of building energy conservation.
CONCLUSION
The ECO implementation would reduce the total energy consumption for the building. Of course,the ECO with the lowest payback period should be implemented first, and the evaluation of theECO with longer payback period should await consequent re-examinations. If modifications weremade to the existing mechanical installations, the above-mentioned energy savings would beaffected.
G-6
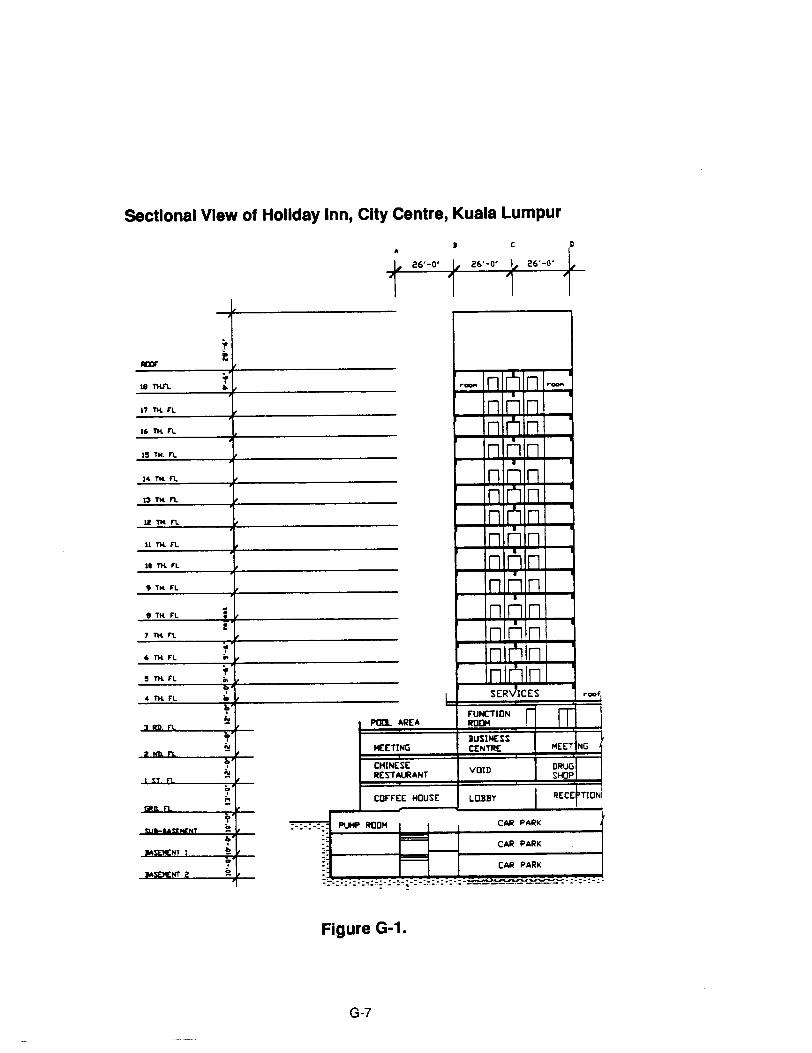
sectional View of Holiday Inn, City Centre, Kuala Lumpur
I' TKI"I.
17 TH. F'l
..- nln n ..nlnn
16TH.F'l nlnnIS TH. F'l nln1n14 Til. n nnln13 TH. n nn'n
nnlnlITH.n nnlnII TH. rl nnln9 Til. F'l nnln
7 TH. F'l nnlnIn riln
S TH. F'l n r'lln4 TH. F'l
PlI1. AREA
I SERVICES
FUNCTIONROOM
..oof
rr.~
MEETINCi
CHINESERESTAURANT
BUSINESSCENTRE
VOID
MEET NCi
COFFEE HOUSE LOBBY RECE nON
CAR PARK
CAR PARK
_.t- -i:~==---r_--C-AR-PA-R-K---...,0_ F=
":,,,:--:-.:--:-.>-:-:--:1 PUMP ROOM:t----...._..--~-------_iNT
Figure G·1.
Go 7
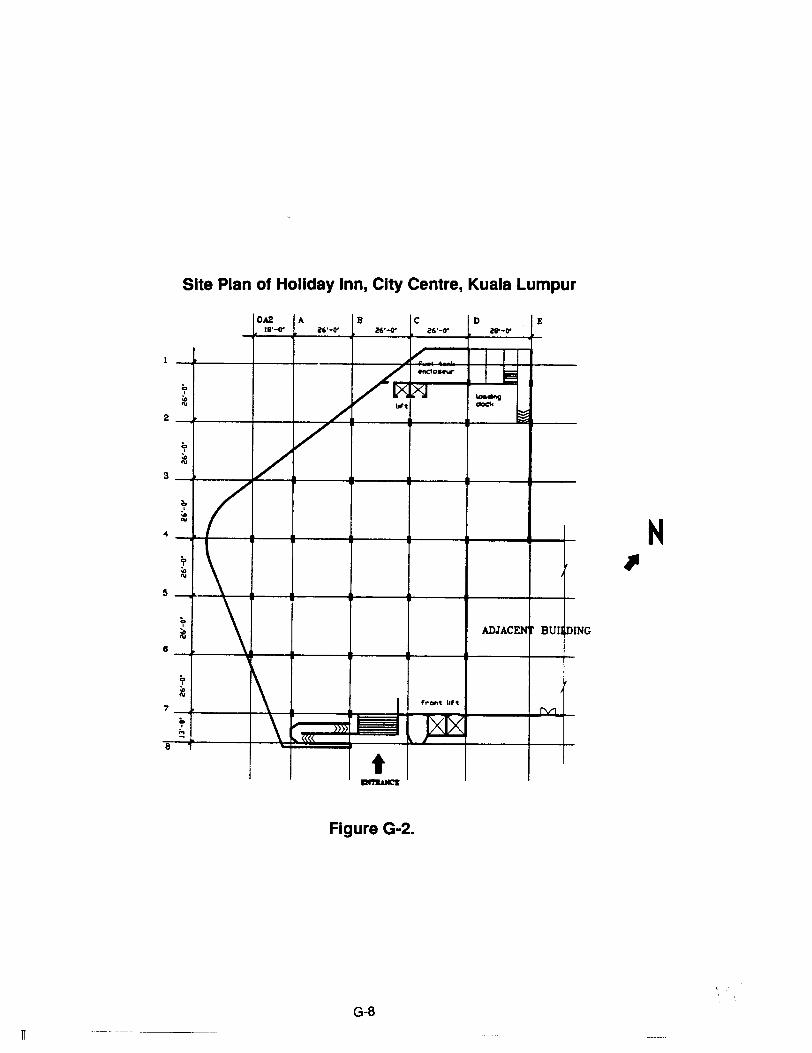
Site Plan of Holiday Inn, City Centre, Kuala Lumpur
ING
OA2 A B C D E18'-ll" 26'-0' 26'-ll" 26'-ll" 28'-ll"
1 1/ I I I
~.nc:tos.ur I~
c N ~~ UI
'"'" /.2
~
1/V
'"'"3
C /I;:"..
•I
lj>
\;:"
'"5
lj> \ ADJACEN.. BUI ~lill8
~
~ill7
'rOtlt II'tfV1
l;> \ lXJXt! «(
8
t
Figure G·2.
G-8
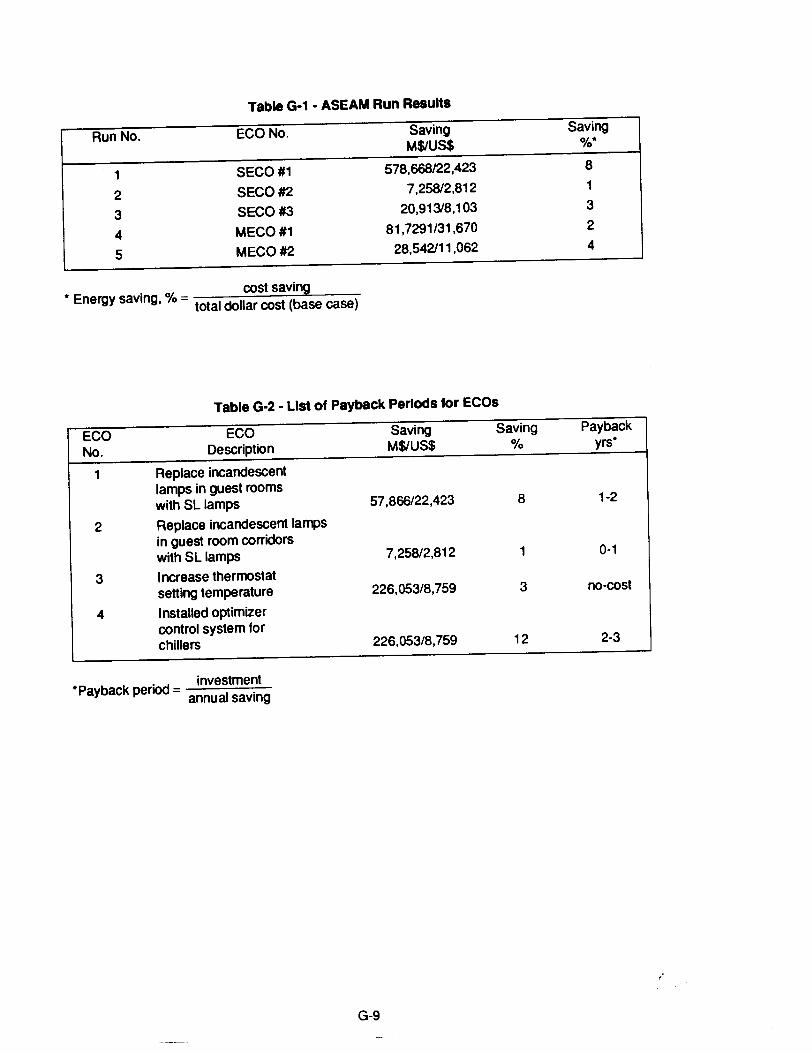
Table G-1 • ASEAM Run Results
Run No. ECONo. Saving Saving
M$lUS$ 0/0"
1 SECO#1 578,668122,423 8
2 SECO#2 7,25812,812 1
3 SECO#3 20,913/8,103 3
4 MECO#1 81,7291/31,670 2
5 MECO#2 28,542/11,062 4
" E . 01 cost savingnergy saving, 10 =
total dollar cost (base case)
Table G·2 • List of Payback Periods for ECOs
ECO ECO Saving Saving Payback
No. Description M$lUS$ 0/0 yrs"
1 Replace incandescentlamps in guest roomswith SL lamps 57,866/22,423 8 1-2
2 Replace incandescent lamps
in guest room corridorswith SL lamps 7,258/2,812 1 0-1
3 Increase thermostatsetting temperature 226,053/8,759 3 no-cost
4 Installed optimizercontrol system forchillers 226,053/8,759 12 2-3
"Pa back period = investme~ty annual saving
G-9
APPENDIX H
LIGHTING STUDY
SINGAPORE
This report concisely summarizes the results of an extensive lighting survey conducted for over
300 buildings in Singapore including a number of different building types. The report also docu
ments the policy discussion regarding future lighting standards and shows how existing lighting
conditions compare to standards in Singapore, Malaysia, and Thailand.
IT
SINGAPORE LIGHTING STUDY
Prepared by:
Peter Woods
Senior Lecturer
School of Architecture
National University of Singapore
Kent Ridge
Republic of Singapore
PURPOSE OF REPORT
This report is the final report of Subproject 1.1 - Lighting Survey and is a summary of the principal
researcher's findings and recommendations arising from discussions with the Lighting Subcom
mittee of the Singapore Public Works Department (PWD), Energy Conservation Committee.
LIGHTING SUBCOMMITTEE TASKS
At the first meeting of the Lighting Subcommittee, on 24th July 1984, the following objectives and
procedures were agreed:
Objectives
The objectives of this Subcommittee are:
• To review present provisions of lighting loads in buildings.
• To examine current lighting design and installations
• To examine the viability of the introduction of natural lighting as a means of energy
saving in building design.
• To devise a method of calculation of the availability of daylight in buildings.
• To recommend a revision of building regulations to include daylighting.
Procedure
The procedures laid down by the Subcommittee to achieve the above objectives are:
• To conduct a survey of major buildings in Singapore and to evaluate the present prac
tice of lighting design and installation.
• To run the DOE 2.1B program on several building forms and to evaluate energy saving
due to the introduction of daylighting.
• To draft calculation procedures and building regulations for daylighting.
SCOPE OF REPORT
The areas covered in the report include:
• A review of the programme of surveys undertaken in Singapore, including details of
buildings visited and the format of survey data.
• Results of the survey data, including details of lighting power densities for various
types of activity, associated levels of illuminance achieved for these activities, and
measures of lighting efficacy.
• Analysis of results to indicate distribution of values with respect to prevailing regulatory
limits and accepted design standards in Singapore.
• Comparison of results from survey data with existing and proposed standards for other
ASEAN countries.
• Proposals for revisions to regulatory standards in Singapore.
• Appraisals of the impact of such revisions with particular reference to compliance and
design implications.
THE FIELD SURVEY
To establish a significant database from which it would be possible to judge the current design
practice and level of regulatory compliance, a total of 100 buildings was proposed. The buildings
were selected for inclusion in the survey based on the following criteria:
• All building types contained in para 2.8 of Handbook on Energy Conservation (PWD).
• Buildings with good lighting design and installation.
H-1

11
• Energy-efficient buildings.
Assistance was sought from Subcommittee members from PWD and the Public UtilitiesBoard in identifying appropriate buildings. At this stage of the survey, of the building typesincluded in current regulations. primarily offices, shops and circulation spaces were chosen.
The data collection method and survey record was based on a previous survey carried outby the Department of Building Science, National University of Singapore (NUS), the record sheetbeing taken as the pro forma. and developed into the final survey form.
The survey was carried out between August 1984 and September 1985 by students of theSchool of Architecture, NUS, under the supervision of Mr. J.F. Pickup, Senior Lecturer in theDepartment of Building Science, NUS. Preliminary reporting of the results was made to the MainCommittee in 1986. The survey work was funded by the ongoing lighting research programme inthe Department of Building Science, NUS.
In 1986, it was agreed to extend the range of bUilding types to include schools. A survey of10 schools was carried out in June 1986 with the assistance of the Ministry of Education. In viewof the extensive availability of daylight in the school buildings, the survey form was modified toinclude measurements of daylight illuminance.
In 1987, the survey was further extended as part of the ASEAN US Cooperation ProgrammePhase 3, Research Activity S1.1. The criteria for the additional work was:
• Extension of existing data base.
• Verification of results from previous surveys.
• Inclusion of additional activity types (industrial).
This work was carried out by students of the School of Architecture, NUS, acting as parttime research assistants under the supervision of Mr. Peter Woods, Senior Lecturer in School ofArchitecture. The survey work was funded from the ASEAN US Cooperation Programme budgetfor Research Topic area S.1.
For this survey, additional data were collected with respect to daylight illuminance and distribution of interior surface luminances.
Summary of Field Survey Visits
Table H-1 gives details of numbers of buildings visited and spaces surveyed. broken downby activity type in each phase of the survey. Note that the total number of bUildings visited is notthe summation of each column because some buildings, spaces with more than one activity typewere surveyed.
Field Survey Results
For each location, the following has been calculated from the survey results:
• Lighting power density (including an allowance for lighting circuit).
• Illuminance levels on the working plane (average).
For offices and shopping centers, installed efficacy values have been calculated to allow acomparison with possible target values. Table H-2 summarizes the results for the major buildingactivities surveyed.
POWER DENSITY LIMITS
Criteria for Power Density Limit Revision
The Lighting Subcommittee took as its basis for evaluating the impact of existing regulationsand proposing future revisions the following criteria
(1) Existing regulatory standards.
H-2
(2) Performance of existing buildings.
(3) Proposed standards in other ASEAN countries
(4) Current technical performance of equipment
(5) SISIR code standards for illuminance.
(6) Assessment of availability of appropriate equipment.
(7) Implications for lighting quality.
Compliance with Power Density Standards
Surveyed values for power density have been compared with both current Singapore regulations as stated in the Handbook on Energy Conservation and standards proposed in comparativedocuments for Malaysia and Thailand. Both are draft proposals and possibly subject tomodification. They are, however, indicative of intentions. Table H-3 summarizes the comparison.
MEASURED ILLUMINANCE LEVELS
There is no published standard for illuminance design level pertinent to the buildings surveyed,except by implication that good design practice would comply with other suitable internationalstandards.
The Code of Practice for Artificial Lighting C.P. 38 1987 has now been published. Table H-4compares surveyed values with the levels recommended in the code.
DISCUSSION OF RESULTS
For each of the main activities, the implications of the survey results are listed below. A summaryof the discussion on the results by the Subcommittee follows with recommendations to the EnergyConservation Committee.
Offices
Summary of Results:
The existing regulatory limit of 20W/m2 has been achieved by 65% of the sample surveyed.For the 136 cases, the average value was 19 W/m 2. By comparison with the proposed standardsin other ASEAN countries, 30% of the sample surveyed:
49% would comply with draft Malaysian standard of 18 W/m 2.
40% would comply with draft Thai land standard of 16 W1m2
.
Current equipment available and in use in Singapore is demonstrably capable of meeting theSISIR code illuminance target within a power budget of 16 W/m 2 (efficacy> 33 Im/W, achieved by16% of sample). A disturbing trend illustrated by the survey is the number of cases where thetask illuminance was substantially lower than the SISIR code recommendations, 40% of samplebelow 300 lux (67% of the sample have an efficacy lower than 25 Im/W). This would seem toarise because of low design standards and poor maintenance
Subcommittee Discussion of Office Results:
Two issues were raised: the need for greater distinction between large and small offices,and the availability of suitable lamps, luminaires, and control gear to meet the recommendation.The argument for the former is that small offices do not utilize the lamp output as effectively aslarge offices. Hence, in any power density limit, this should be acknowledged with a slightly moregenerous budget. The arguments against such a distinction are:
• The difficulty in defining 'small office' for the purposes of a regulation and setting a limiting size.
• Typical planning of office floors tends to locate small offices at the perimeter, wherethey usually enjoy a significant amount of daylight. It is acknowledged that internaldecor, blinds, and external obstructions might mitigate against this advantage.
H-3
........ r-:Alr-::. I IrlI, .. .IIL ... ~-.IIL~~LI.....,.h.... ""_"~ ....... _ ............ _,...._••• _
n
• Where small offices occur remote from windows in deep plan locations, partitions normally have extensive glazing for visual relief. This means the lighting of a small officetends to perform in like that of a larger space.
These latter arguments were taken by the Subcommittee to be more persuasive than havingdistinctions in the Handbook for different office sizes.
With regard to the question of equipment availability, the Subcommittee is indebted to Mr.John F. Pickup, NUS, for a series of calculations of the performance of typically available lamps,luminaires, and control gear. His observations follow:
Example
An office 4m x 4m x 2.85m high using two modular recessed prismatic luminaires with three1200mm 40-watt standard fluorescent tubes in each. Reflectance of ceiling is 0.7 and of walls,0.5, with a utilization factor of 0.3.
The installed luminous efficacy, including average (locally made) (10 watts loss) ballasts and1200mm 40-watt standard fluorescent tubes, is 17 Im/W. Using 36-watt tri-phosphor fluorescenttubes with low-loss (6.5W) ballasts, the installed efficacy is 21.2 Im/W.
An area of 4m x 4m (room index = 1.0) and providing 300 lux would correspond to sixfluorescent tubes and two luminaires. Using average ballasts and lamps, the power density is18.75 W/m2
. Using tri-phosphor tubes and low-loss ballasts, the power density becomes 16W/m2
.
Polished aluminum reflectors with louvres, giving a better utilization factor of say 0.35, couldpermit two lamps only per luminaire and a resulting power density of 10.6 W/m2
.
On this basis, a regulatory limit of 16 W/m2 was thought reasonable.
Recommendations by Subcommittee for Offices:
• Lower power density limit to 16 W/m2.
• Promote SISIR code task illuminance requirements
• Promote target efficacy of 33 Im/w or greater.
• Education Programme: Design Methods (Task/Ambient), Programmed Maintenance,and Lighting Quality.
Shopping CentersSummary of Results:
The existing regulatory limit of 30 W/m2 has been achieved by 69% of the sample surveyed.For the 45 cases, the average value was 29 W/m2
. By comparison with the proposed standardsin other ASEAN countries, of the sample surveyed:
47% would comply with the lower draft Malaysian standard of 23 W/m2.
42% would comply with the lower draft Thailand standard of 22 W/m2.
There is a wide variation in illuminance levels, although 40% of the sample exceed theSISIR code value of 500 lux (sample average is 436 lux).
Subcommittee Discussion of Shopping Centers Results:
The question of the value of retaining any limit for shopping centers was raised in light of thewide divergence of lighting standards. The main argument for retention was that having no limitmight be interpreted as suggesting that energy conservation in shopping areas was consideredunimportant by the authorities. With regard to the revision of the limit, the increased acceptanceof new merchandising techniques based on display lighting and the availability of new lowpowered sources was put forward as being a trend which would automatically reduce power consumption.
H-4
Recommendations by Subcommittee for Shopping Centers:
• Retain a power density limit for shopping centers and reduce to 23 W/m2
.
• Promote SISIR code task illuminance requirements.
• Education Programme: Disseminate new lighting trends for merchandising (particu
larly low wattage lamps for accent and display lighting).
Circulation
Summary of Results:
The existing regulatory limit of 10 W/m2 has been achieved by 56% of sample surveyed. For
the 81 cases, the average value was 16 W/m2. By comparison with the proposed standards in
other ASEAN countries, of the sample surveyed:
77% would comply with the draft Malaysia standard of 17 W/m2.
75% would comply with the draft Thai standard of 15 W/m2.
The illuminance distribution centers on the lower SISIR code recommendation. The sample
average is 135 lux compared with the recommendation of 150 lux.
Subcommittee Discussions of Circulation Results:
The Subcommittee felt that the original regulation limit of 10 W/m2 was probably too severe,
given that in many buildings the distinction between the circulation spaces and other activities is
not always clear in the lighting design. Clearly there was no justification for lowering the limit and it
would not be wise to raise it. The Subcommittee also felt that "circulation areas" should be taken
to include lobbies, corridors, and stairs, without separate categorization.
Recommendations of Subcommittee for Circulation Areas:
• Retain power density limit at 10 W/m2
.
• Promote SISIR code illuminance requirements
Schools
Summary of Results:
The existing regulatory limit of 20 W/m2 has been achieved by 100% of sample surveyed.
For the 44 cases, the average value was 10 W/m2. By comparison with the proposed standards in
other ASEAN countries, of the sample surveyed:
100% would comply with the lower draft Malaysian standard of 17 W/m2.
100% would comply with the lower draft Thai standard of 16 W/m2.
The distribution of illuminance levels in the sample suggests a general design level of
around 400 lux. The SISIR code recommends 300 lux. The normalluminaire encountered in the
survey is a surface-mounted open trough fitting which, in combination with the efficient fluorescent
lamps used, accounts for the high efficacy performance. This standard design is of concern to the
Subcommittee as it may not meet an adequate standard for control of discomfort glare.
Subcommittee Discussion of Schools Results:
This concentrated mainly on lighting quality and the need for varying standards for different
age groups. This was also coupled with a discussion on lecture theatre design. The Subcommit
tee felt that it should express its concern over possible glare problems in current school lighting
schemes. With respect to different standards for each age group, the development of the use of
extensive audio-visual material, particularly in tertiary institutions, suggested no real reason for
having higher limits. Where high levels of task illuminance were necessary, as in laboratories or
machine rooms, the use of appropriate task lighting would be a preferred solution to excessive
ambient illuminance.
H-5
11
Recommendations by Subcommittee for Schools:
• Lower power density limit to 15 W/m2.
• Promote SISIR code task illuminance and limiting glare indices.
Production AreasSummary of Results:
There is no existing regulatory limit for production areas. Of the 17 cases surveyed, theaverage value was 24 W/m2
. By comparison with the proposed standards in other ASEAN countries, 30% of the sample surveyed, would comply with the draft Malaysian standard of 20 W/m2.
The sample, though small, demonstrates an extremely wide range of illuminance and power density levels. There would seem to be no reason why a power density limit for production areas cannot be specified given that the illuminance recommendations in the SISIR code are similar tothose for offices. Such a power density limit would have to recognize the particular space dimensions in production areas (ceiling heights) and obstructions to the task.
Subcommittee Discussions of Production Area Results'
It was raised very early in the project that industrial buildings should be included in theRegulations. The problem identified, even from the small sample surveyed, is the wide range ofcurrent conditions. Some installations are being specified at much higher standards than theSingapore Code, particularly for U.S. firms operating in Singapore. The Subcommittee felt that asingle but fairly liberal limit should be made for production areas.
Recommendations by Subcommittee for Production Areas:
• Institute a power density limit of 20 W/m2.
• Promote SISIR Code Task Illuminance requirements.
• Education Programme: Design Methods (Task/Ambient) and Programmed Maintenance.
SUMMARY OF RECOMMENDATIONS
The main findings and recommendations by the Lighting Subcommittee have been summarized inTable H-5.
H-6

illuminance
16
15
14
13
12
11II)
(Jl
c 10.-1)
.- 9:J
I mI
-....I '+- 80L 7IV.D
E 6:JZ
5
4
3
2
o //1 I 1/, I 1/1I 1/1
I 1/1I 1/1
I 1<':1 I 1/. I 1/1I 1/. " /. I I" I I" I I /. I 1/, I I" I I '" I I L, I 1/, I I L, I I L, I I L, I I L, I
< 100100125 150175200225250275300325350375400425450475500525 550 575 600>625
Illuminance (lux)
Figure H·1.
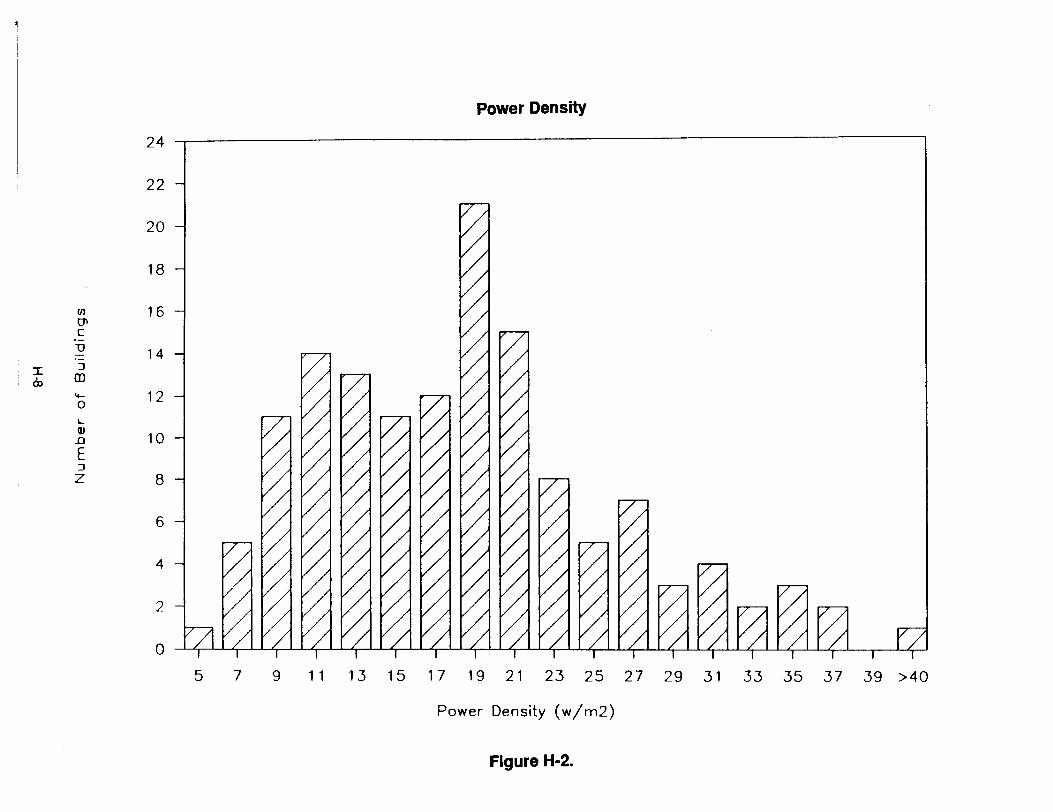
Ul(Jl
c:"U
:J: :J
Co m.....0L-V.D
E:JZ
Power Density
24
22
20
18
16
14
12
10
8
6
4
2
o I,") II) ") II) ") ") ") ") ") "4"4"4"4"4"{ II{ 1 I I{ I
5 7 9 11 13 15 17 19 21 23 25 27 29 31 33 35 37 39 >40
Power Density (w/m2)
Figure H·2.
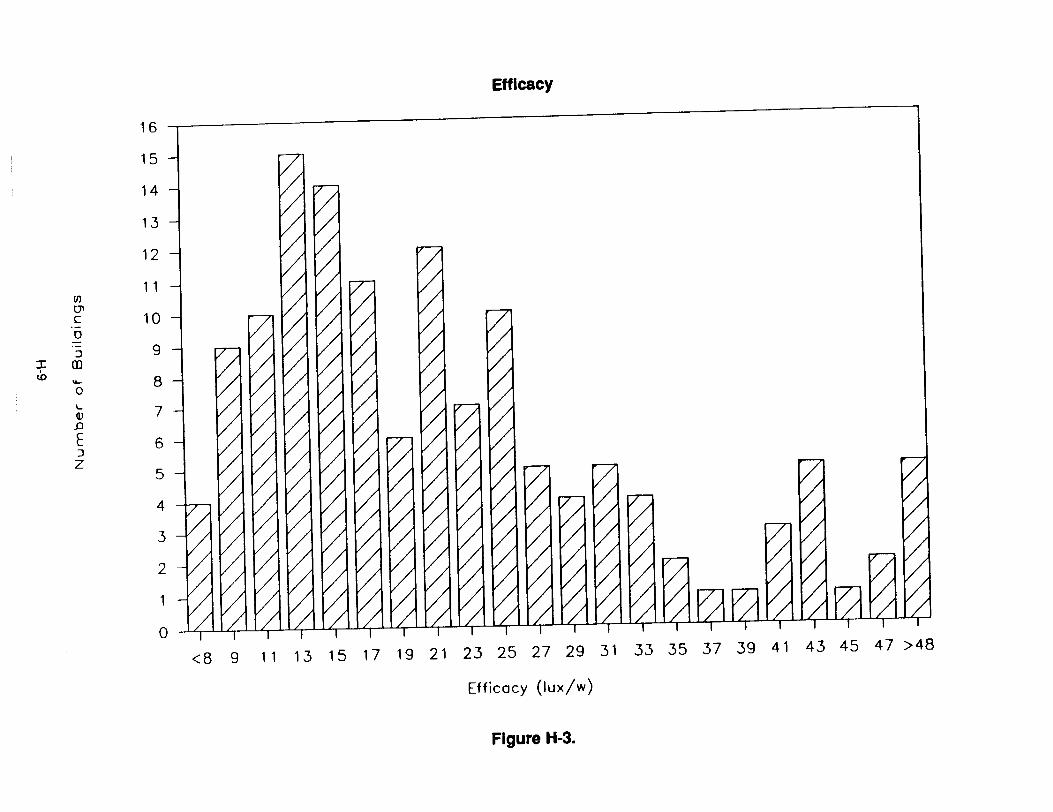
16
Efficacy
15
14
13
12
(/J11
(Jl
c 101)
'-
:I::J 9
t.bm~
08
L
V 7.D
E 6:JZ
5
4
3
2
o I /, I I /, I I /, I I /, I I.r, I I.r, I I.r, I I.r, I I '1 I I /, I I /, I I /, I I 4 ' I /, I I 4 I I /, I I;; I I;; I I 4 I I;; I I;; I I;; I
<8 9 11 13 15 17 19 21 23 25 27 29 31 33 35 37 39 41 43 45 47 >48
Efficacy (Iux/w)
Figure H-3.
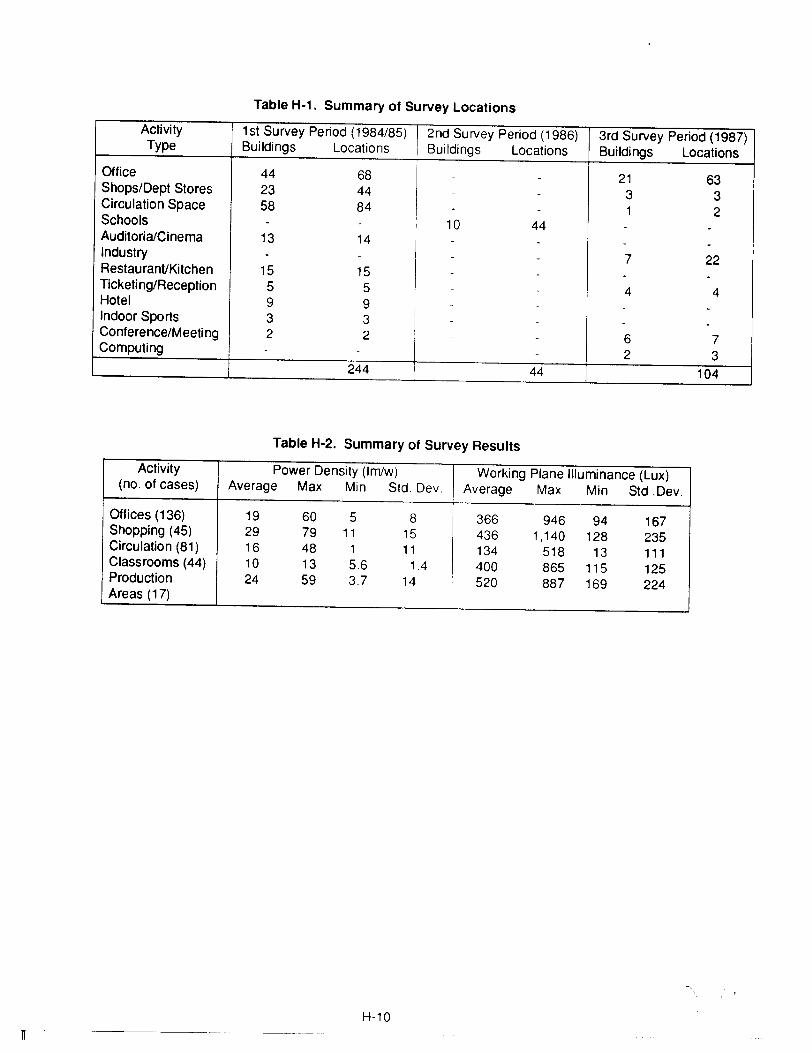
Table H·1. Summary of Survey Locations
Activity 1st Survey Period (1984/85) 2nd Survey Period (1986) 3rd Survey Period (1987)Type Buildings Locations Buildings Locations Buildings Locations
Office 44 68 - - 21 63Shops/Dept Stores 23 44 - - 3 3Circulation Space 58 84 - - 1 2Schools - - 10 44 - -AuditoriaiCinema 13 14 - - - -Industry - - - - 7 22RestauranVKitchen 15 15 - - - -TicketingiReception 5 5 - - 4 4Hotel 9 9 - - - -Indoor Sports 3 3 - - - -Conference/Meeti ng 2 2 - - 6 7Computing - - - - 2 3
244 44 104
Table H·2. Summary of Survey Results
Activity Power Density (Imlw) Working Plane Illuminance (Lux)(no. of cases) Average Max Min Std. Dev. Average Max Min Std .Dev.,
Offices (136) 19 60 5 8 366 946 94 167Shopping (45) 29 79 11 15 436 1,140 128 235Circulation (81) 16 48 1 11 134 518 13 111Classrooms (44) 10 13 5.6 1.4 400 865 115 125Production 24 59 3.7 14
I
520 887 169 224Areas (17)
H-10
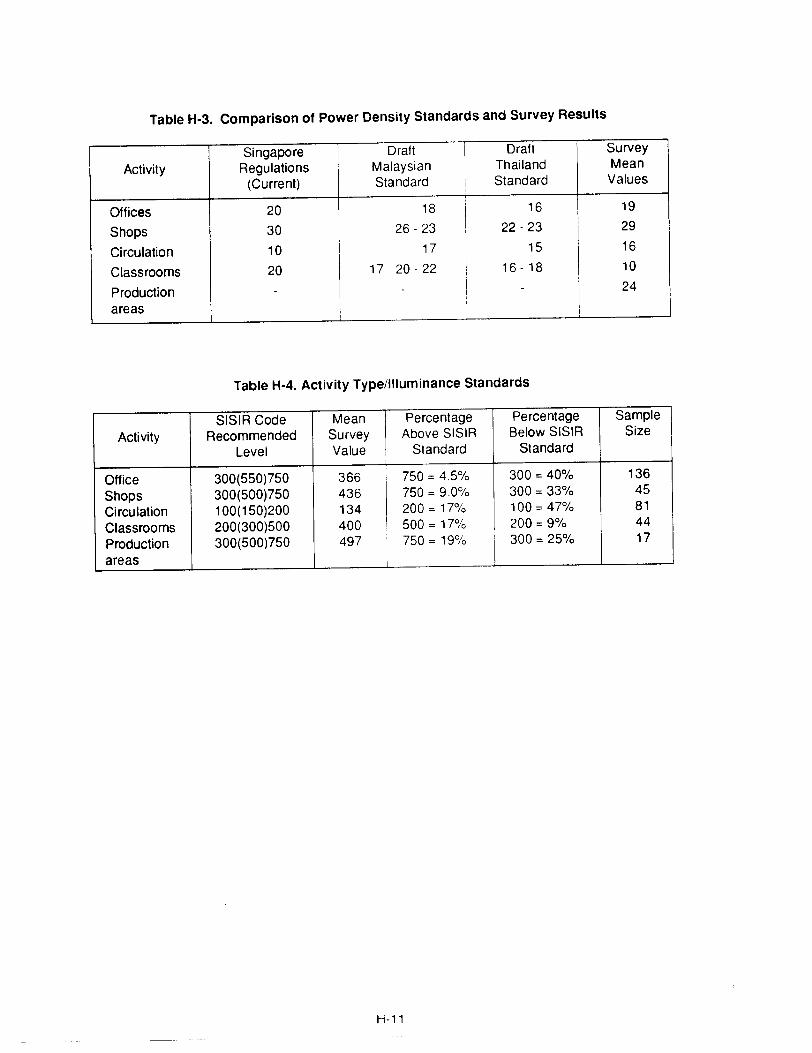
Table H·3. Comparison of Power Density Standards and Survey Results
Singapore Draft ! Draft SurveyActivity Regulations Malaysian
IThailand Mean
(Current) Standard Standard Values
Offices 20 18I
16 19
Shops 30 26 - 23 22 - 23 29I
Circulation 10 17 15 16
Classrooms 20 17-20-22 16 - 18 10
Production - - - 24areas
Table H·4. Activity Type/Illuminance Standards
SISIR Code Mean Percentage Percentage SampleActivity Recommended Survey Above SISIR Below SISIR Size
Level Value Standard Standard
Office 300(550)750 366 750 =4.5% 300 = 40% 136Shops 300(500)750 436 750 =9.0% 300 =33% 45Circulation 100(150)200 134 200 = 17% 100 = 47% 81Classrooms 200(300)500 400 500 = 17% 200 =9% 44Production 300(500)750 497 750 = 19%
I300 =25% 17
areas
H-11
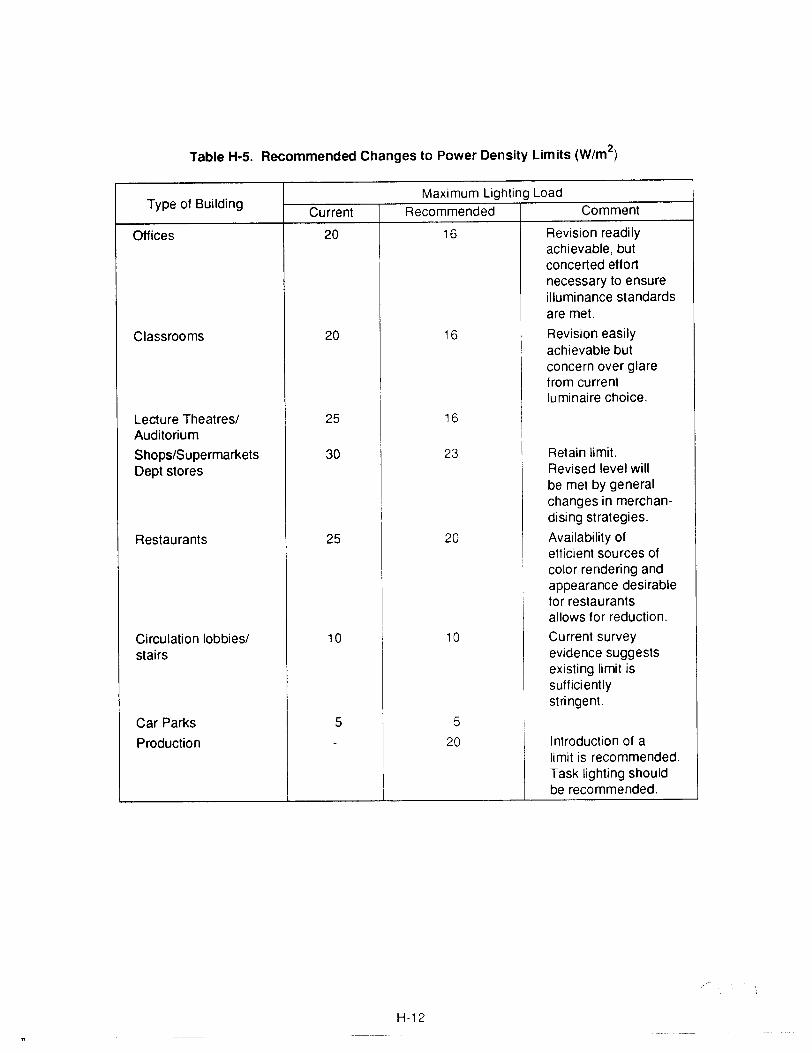
Table H·5. Recommended Changes to Power Density Limits (W/m 2)
Type of BuildingMaximum Lighting Load
Current Recommended Comment
Offices 20 16 Revision readilyachievable, butconcerted effortnecessary to ensureilluminance standardsare met.
Classrooms 20 16 Revision easilyachievable butconcern over glarefrom currentluminaire choice.
Lecture Theatres/ 25 16Auditorium
Shops/Supermarkets 30 23 Retain limit.Dept stores Revised level will
be met by generalchanges in merchan-dising strategies.
Restaurants 25 20 Availability ofefficient sources ofcolor rendering andappearance desirablefor restaurantsallows for reduction.
Circulation lobbies/ 10 10 Current surveystairs evidence suggests
existing limit issufficientlystringent.
Car Parks 5 5 I
Production - 20 Introduction of alimit is recommended.Task lighting shouldbe recommended.
H-12
APPENDIX I
ASEAN COMMERCIAL BUILDING ENERGY SURVEY FORM
ASEAN COMMERCIAL BUILDING ENERGY SURVEY FORM
Prepared by:
J.J. DeringerS. GreenbergH. Misuriello
Lawrence Berkeley LaboratoryUniversity of California
Berkeley, California, USA
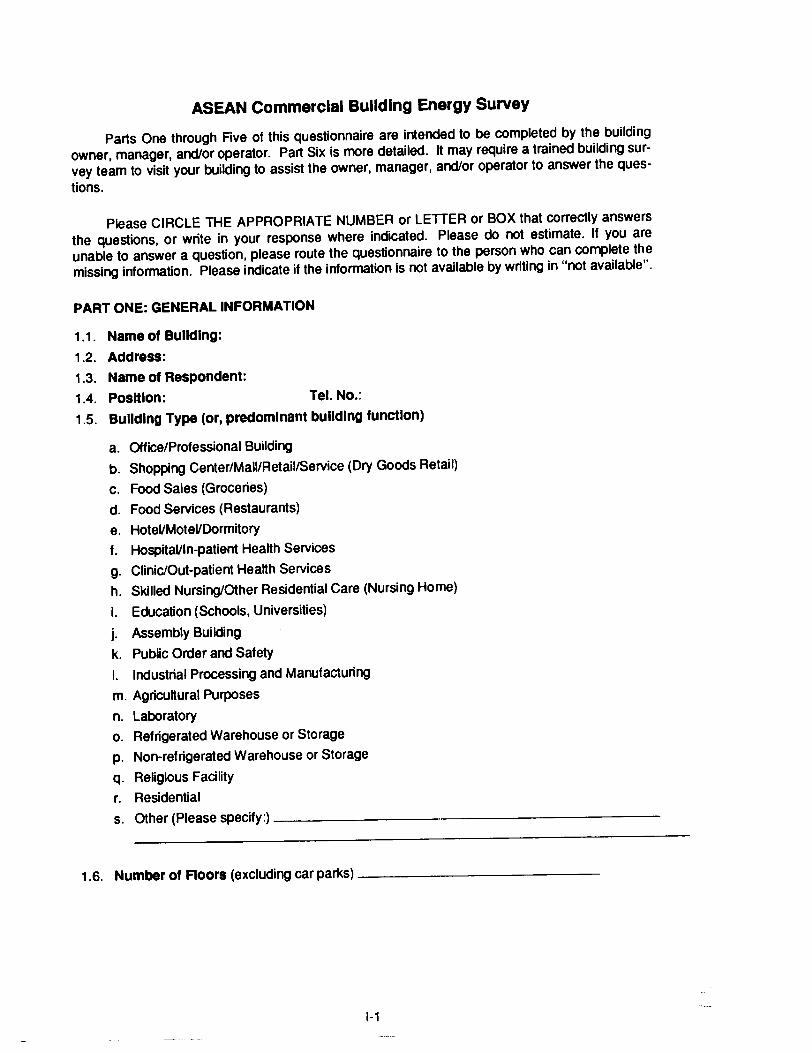
ASEAN Commercial Building Energy Survey
Parts One through Five of this questionnaire are intended to be completed by the buildingowner, manager, and/or operator. Part Six is more detailed. It may require a trained building survey team to visit your building to assist the owner, manager, and/or operator to answer the questions.
Please CIRCLE THE APPROPRIATE NUMBER or LEITER or BOX that correctly answersthe questions, or write in your response where indicated. Please do not estimate. If you areunable to answer a question, please route the questionnaire to the person who can complete themissing information. Please indicate if the information is not available by writing in "not available".
PART ONE: GENERAL INFORMATION
1.1. Name of BUilding:
1.2. Address:
1.3. Name of Respondent:
1.4. Position: Tel. No.:
1.5. Building Type (or, predominant building function)
a. Office/Professional Building
b. Shopping Center/Mall/Retail/Service (Dry Goods Retail)
c. Food Sales (Groceries)
d. Food Services (Restaurants)
e. HoteVMoteVDormitory
f. HospitaVln-patient Health Services
g. CliniC/Out-patient Health Services
h. Skilled Nursing/Other Residential Care (Nursing Home)
i. Education (Schools, Universities)
j. Assembly Building
k. Public Order and Safety
I. Industrial Processing and Manufacturing
m. Agricultural Purposes
n. Laboratory
o. Refrigerated Warehouse or Storage
p. Non-refrigerated Warehouse or Storage
q. Religious Facility
r. Residentials. Other (Please specify:) _
1.6. Number of Floors (excluding car parks) _
1-1
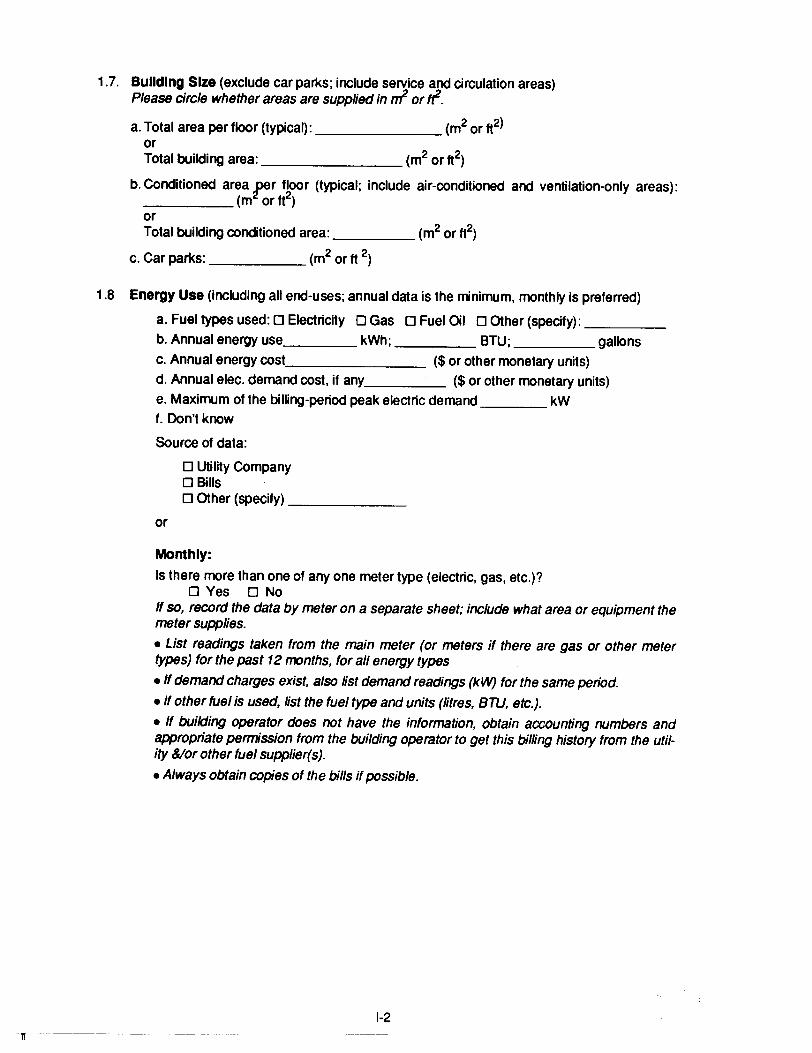
11
1.7. Building Size (exclude car parks; include service and circulation areas)Please circle whether areas are supplied in rr1 or if.a. Total area per floor (typical): (m2 or ft2)
orTotal building area: (m2 or ft2)
b. Conditioned area r:.r floor (typical; include air-conditioned and ventilation-only areas):_____ (m or ft2)
orTotal building conditioned area: (m2 or ft2)
c. Car parks: (m2 or ft 2)
1.8 Energy Use (including all end-uses; annual data is the minimum, monthly is preferred)
a. Fuel types used: 0 Electricity 0 Gas 0 Fuel Oil 0 Other (specify): _
b. Annual energy use kWh; BTU; gallons
c. Annual energy cost ($ or other monetary units)
d. Annual elec. demand cost, if any ($ or other monetary units)
e. Maximum of the billing-period peak electric demand kW
1. Don't know
Source of data:
o Utility Companyo Billso Other (specify) _
or
Monthly:
Is there more than one of anyone meter type (electric, gas, etc.)?DYes 0 No
If so, record the data by meter on a separate sheet; include what area or equipment themeter supplies.
• List readings taken from the main meter (or meters if there are gas or other metertypes) for the past 12 months, for all energy types
• If demand charges exist, also list demand readings (kW) for the same period.
• If other fuel is used, list the fuel type and units (Iitres, BTU, etc.).
• If building operator does not have the information, obtain accounting numbers andappropriate permission from the building operator to get this billing history from the utility &/or other fuel supplier(s).
• Always obtain copies of the bills if possible.
1-2
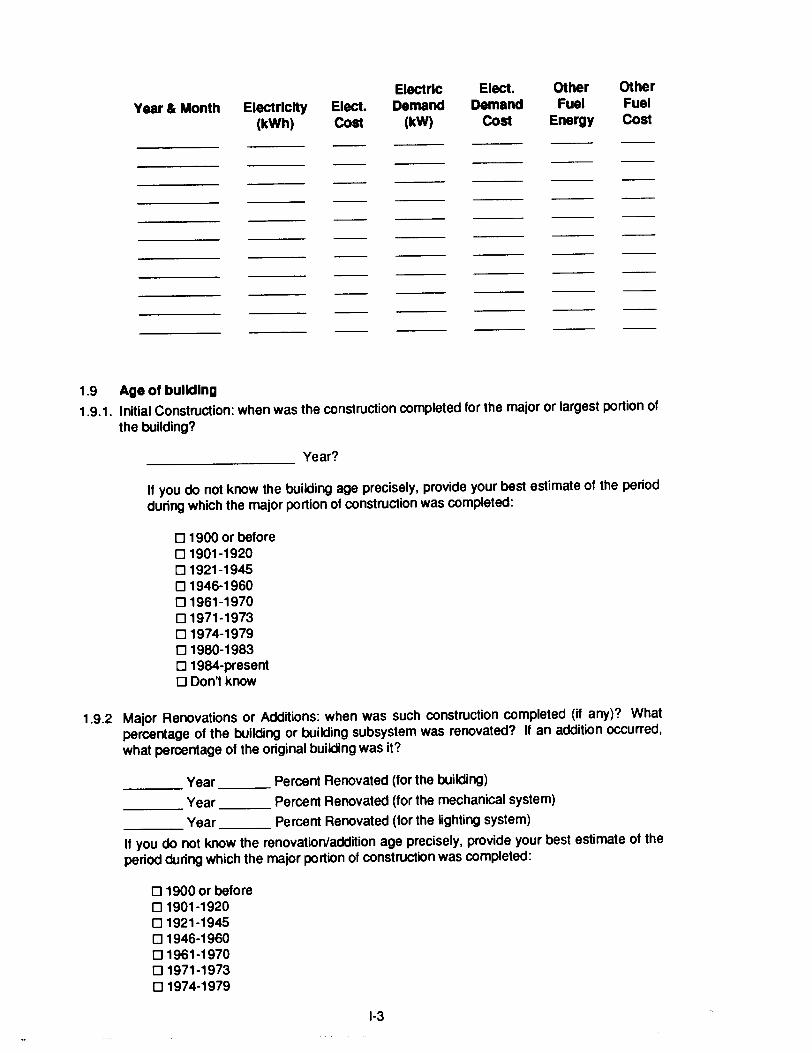
Year & Month Electricity Elect.(kWh) COst
ElectricDemand
(kW)
Elect.Demand
COst
OtherFuel
Energy
OtherFuelCost
1.9 Age of building
1.9.1. Initial Construction: when was the construction completed for the major or largest portion ofthe building?
________ Year?
If you do not know the building age precisely, provide your best estimate of the periodduring which the major portion of construction was completed:
o 1900 or before01901-192001921-194501946·196001961-197001971·197301974-197901980-1983o 1984-presento Don't know
1.9.2 Major Renovations or Additions: when was such construction completed (if any)? Whatpercentage of the building or building subsystem was renovated? If an addition occurred,what percentage of the original bUilding was it?
___ Year Percent Renovated (for the building)
___ Year Percent Renovated (for the mechanical system)
___ Year Percent Renovated (for the lighting system)
If you do not know the renovation/addition age precisely, provide your best estimate of theperiod during which the major portion of construction was completed:
o 1900 or before01901-192001921-194501946-196001961-197001971-197301974-1979
1-3
IT
01980-1983o 1984-presento Don't know
1.10 Building Architect and Engineers of Record
Please Ust the architects and engineers who designed the building. List the architects andarchitectural firm, and the mechanical and electrical engineers or engineering firms.
Architect: Name
Address
TelephoneDo not know 0
Mechanical Engineer: NameAddress
TelephoneDo not know 0
Electrical Engineer: NameAddressTelephone
Do not know 0
1-4
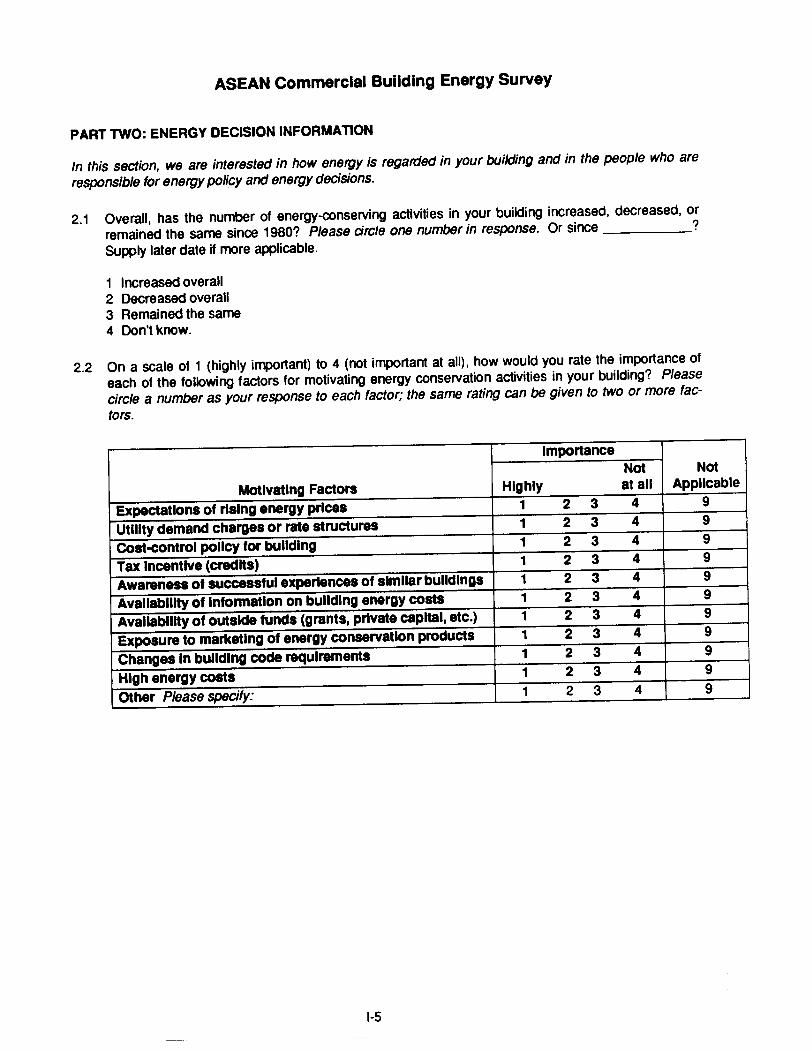
ASEAN Commercial Building Energy Survey
PART TWO: ENERGY DECISION INFORMATION
In this section, we are interested in how energy is regarded in your building and in the people who areresponsible for energy policy ancJ energy decisions.
2.1 Overall, has the number of energy-conserving activities in your building increased. decreased. orremained the same since 1980? Please circle one number in response. Or since ?Supply later date if more applicable.
1 Increased overall2 Decreased overall3 Remained the same4 Don't know.
2.2 On a scale of 1 (highly important) to 4 (not important at all). how would you rate the importance ofeach of the following factors for motivating energy conservation activities in your building? Pleasecircle a number as your response to each factor; the same rating can be given to two or more factors.
ImportanceNot Not
Motivating Factors Highly at all ApplicableExpectations of rising energy prices 1 2 3 4 9Utility demand charges or rate structures 1 2 3 4 9Cost-control policy for building 1 2 3 4 9Tax Incentive (credits) 1 2 3 4 9Awareness of succesSful experiences of similar buildings 1 2 3 4 9Availability of Information on building energy costs 1 2 3 4 9Availability of outside funds (grants, private capital, etc.) 1 2 3 4 9Exposure to marketing of energy conservation prodUcts 1 2 3 4 9Changes In building code requirements 1 2 3 4 9High energy costs 1 2 3 4 9Other Please specify: 1 2 3 4 9
1-5
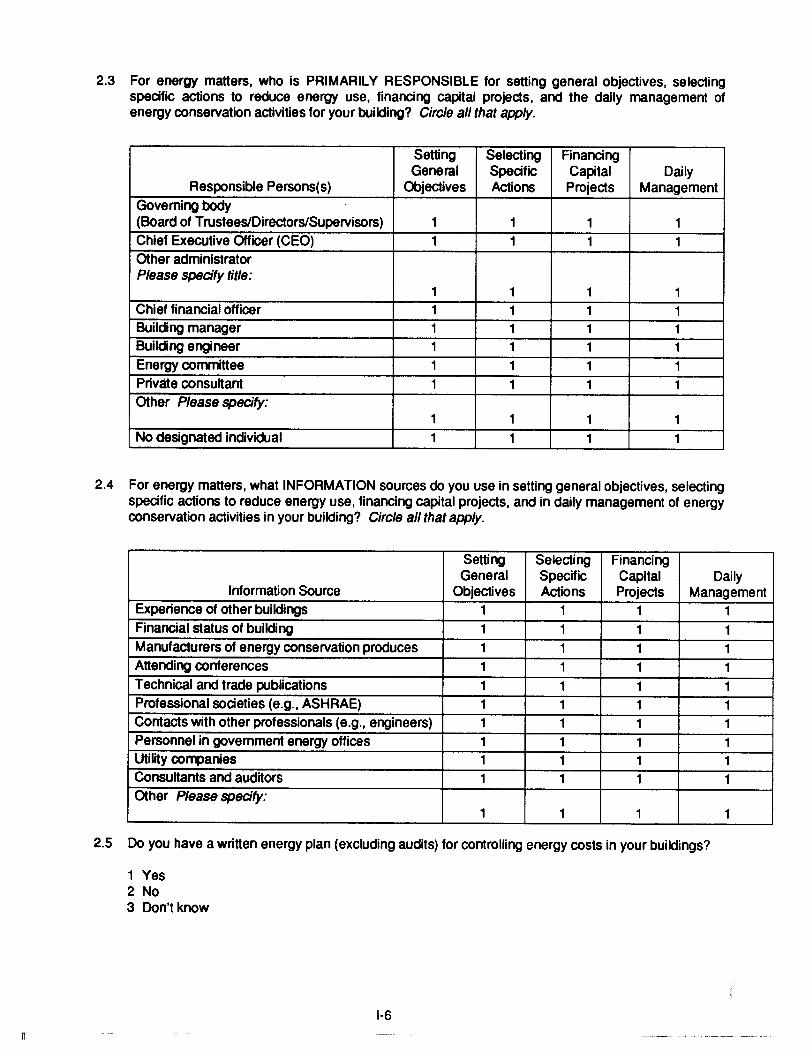
IT
2.3 For energy matters, who is PRIMARILV RESPONSIBLE for setting general objectives, selectingspecific actions to reduce energy use, financing capital projects, and the daily management ofenergy conservation activities for your building? Circle all that apply.
Setting Selecting FinancingGeneral Specific Capital Daily
Responsible Persons(s) Objectives Actions Projects ManagementGoverning body(Board of TrusteeS/Directors/Supervisors) 1 1 1 1
Chief Executive Officer (CEO) 1 1 1 1Other administratorPlease specify title:
1 1 1 1Chief financial officer 1 1 1 1Building manager 1 1 1 1Building engineer 1 1 1 1
Energy committee 1 1 1 1
Private consuhant 1 1 1 1
Other Please specify:1 1 1 1
No designated individual 1 1 1 1
2.4 For energy matters, what INFORMATION sources do you use in setting general objectives, selectingspecific actions to reduce energy use, financing capital projects, and in daily management of energyconservation activities in your building? Circle all that apply.
Setting Selecting FinancingGeneral Specific Capital Daily
Information Source Objectives Actions Projects ManagementExperience of other buildings 1 1 1 1Financial status of bUilding 1 1 1 1Manufacturers of energy conservation produces 1 1 1 1
Attending conferences 1 1 1 1
Technical and trade publications 1 1 1 1Professional societies (e.g., ASHRAE) 1 1 1 1Contacts with other professionals (e.g., engineers) 1 1 1 1
Personnel in government energy offices 1 1 1 1Utility companies 1 1 1 1Consuhants and auditors 1 1 1 1
Other Please specify:1 1 1 1
2.5 Do you have a written energy plan (excluding audits) for controlling energy costs in your buildings?
1 Ves2 No3 Don't know
1-6
ASEAN Commercial Building Energy Survey
PART THREE: ENERGY USE
In this section, we are interested in the energy consumption in your building, now, and in the past. We arealso interested in the actions you have taken, or plan to take, to improve the energy performance of yourbuilding.
3.1 What is your estimate of the energy performance of this building (compared with your estimate oftypical energy performance for other buildings of its type)? The building is:
1 Very energy efficient2 More efficient than average3 Average energy efficiency4 Less efficient than average5 Much less efficient than average6 Don'tknow
3.2 What features do you think make this building more (or less) energy efficient than others:
1 Design or structural features Please specify:
2 Building envelope features3 Air-conditioning features4 Lighting systems features5 Controls6 Operations and maintenance7 Operator training8 Others Please specify:
3.3 How important is the cost of energy (compared with other costs) in determining how the building isoperated?
1 Very important (a major factor)2 Important (a significant factor)3 Average factor4 Not important (a minor factor)5 Don'tknow
3.4 Overall, has total annual energy consumption (NOT COSTS) changed in your building since 1980?Or in a later year, if more appropriate.Please specify year if different from 1980: _
1 Increased overall2 Decreased overall3 About the same (GO TO QUESTION 4.6)4 Don't know (GO TO QUESTION 4.6)
3.5 If there has been a change in total energy consumption NOT DUE to energy conservation measures,why do you think it has occurred? Circle a response for each of the 4 items.
1-7
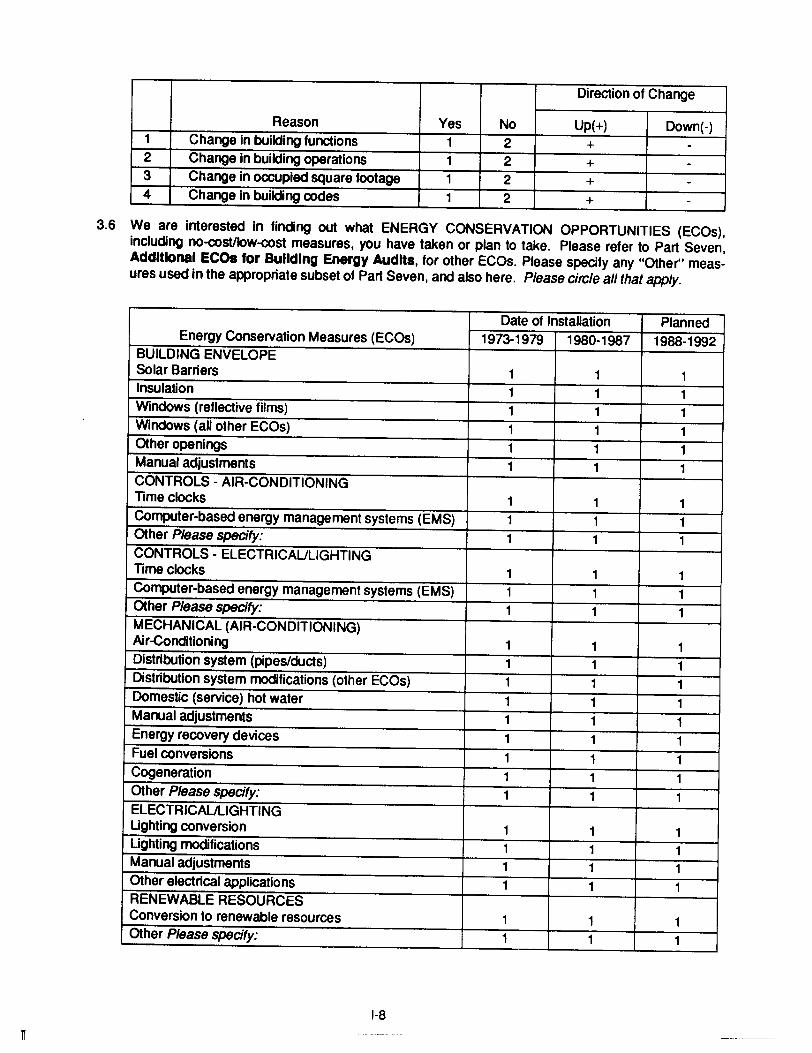
Direction of Change
Reason Yes No Up(+) Down(-)1 Change in bUilding functions 1 2 + -2 Change in building operations 1 2 + -3 Change in occupied square footage 1 2 + -4 Change in building codes 1 2 + -
3.6 We are interested in finding out what ENERGY CONSERVATION OPPORTUNITIES (ECOs),including no-cost/Iow-cost measures, you have taken or plan to take. Please refer to Part Seven,Additional ECOs for Building Energy Audits, for other ECOs. Please specify any "Other" measures used in the appropriate subset of Part Seven, and also here. Please circle all that apply.
Date of Installation PlannedEnergy Conservation Measures (ECOs) 1973-1979 1980-1987 1988-1992
BUILDING ENVELOPESolar Barriers 1 1 1Insulation 1 1 1Windows (reflective films) 1 1 1
Windows (all other ECOs) 1 1 1Other openings 1 1 1Manual adjustments 1 1 1
CONTROLS - AIR-CONDITIONINGTime clocks 1 1 1Computer-based energy management systems (EMS) 1 1 1Other Please specify: 1 1 1CONTROLS - ELECTRICAULIGHTINGTime clocks 1 1 1Computer-based energy management systems (EMS) 1 1 1Other Please specify: 1 1 1MECHANICAL (AIR-CONDITIONING)Air-Conditioning 1 1 1Distribution system (pipes/ducts) 1 1 1Distribution system modifications (other ECOs) 1 1 1
Domestic (service) hot water 1 1 1Manual adjustments 1 1 1Energy recovery devices 1 1 1
Fuel conversions 1 1 1Cogeneration 1 1 1Other Please specify: 1 1 1ELECTRICAULIGHTINGLighting conversion 1 1 1Lighting modifications 1 1 1Manual adjustments 1 1 1Other electrical applications 1 1 1RENEWABLE RESOURCESConversion to renewable resources 1 1 1Other Please specify: 1 1 1
1-8
3.7 If you have used any of the ECOs listed above in Question 3.6, which TWO ECOs have saved themost energy for your building?
1
2
3.8 If you have had problems in implementing energy conservation measures, please describe the kindsof problems you have had:
Technical (e.g., maintenance staff cannot handle added duties. equipment, operations and maintenance, installation):
Financial (e.g., Umited capital to invest, not considered cost-effective, waiting for existing equipmentto complete its useful Ufe, budget):
Managerial (e.g., building owner will not agree, staffing approvals):
Information (e.g., about products, benefits, etc.):
Building occupants (e.g., interfere with building operations, or tenant perceptions of comfort):
Other Please specify:
1-9
IT
3.9 Have you identified possible actions for improving the energy performance of your building that youdo not plan to take? If so, please list them:
1
2
3
4
3.10 What prevents you from taking these actions?
Technical
Financial
Managerial
Information
Building occupants
Other Please specify:
1-10
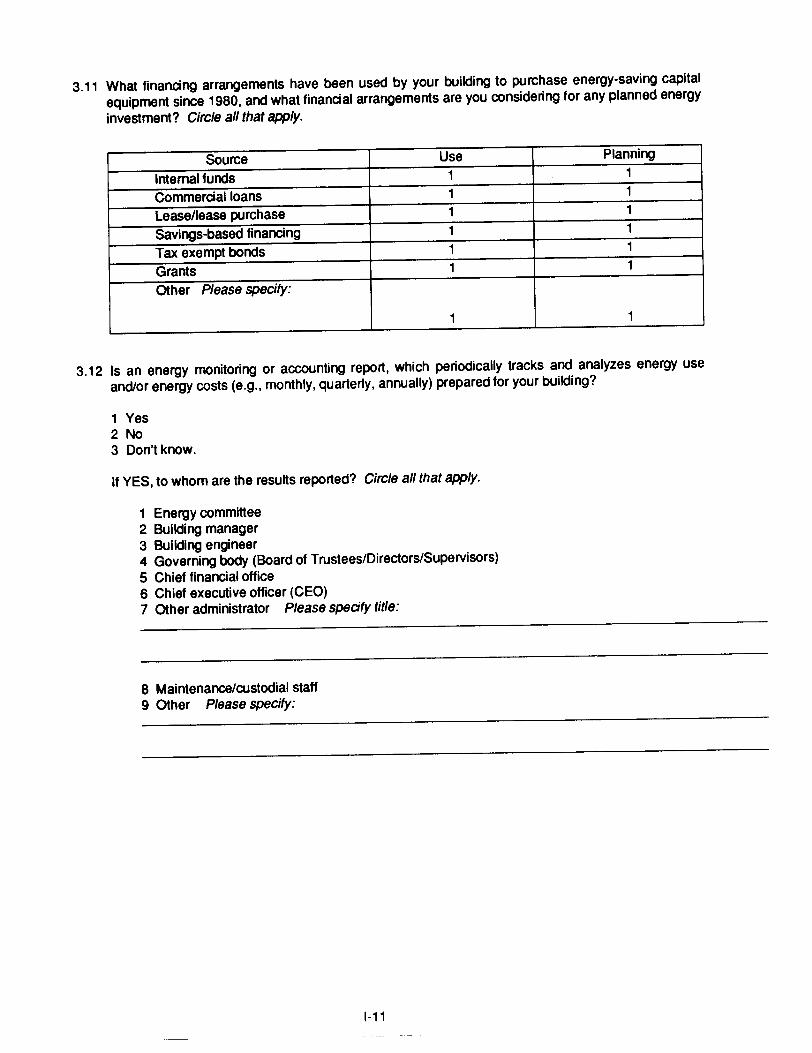
3.11 What financing arrangements have been used by your building to purchase energy-saving capitalequipment since 1980, and what financial arrangements are you considering for any planned energyinvestment? Circle all that apply.
Source Use Planning
Internal funds 1 1Commercial loans 1 1Lease/lease purchase 1 1
saVings-based financing 1 1
Tax exempt bonds 1 1
Grants 1 1
Other Please specify:
1 1
3.12 Is an energy monitoring or accounting report, which periodically tracks and analyzes energy useand/or energy costs (e.g., monthly, quarterly, annually) prepared for your bUilding?
1 Yes2 No3 Don't know.
If YES, to whom are the results reported? Circle all that apply.
1 Energy committee2 Building manager3 Building engineer4 Governing body (Board of Trustees/Directors/Supervisors)5 Chief financial office6 Chief executive officer (CEO)7 Other administrator Please specify title:
8 Maintenance/custodial staff9 Other Please specify:
1-11
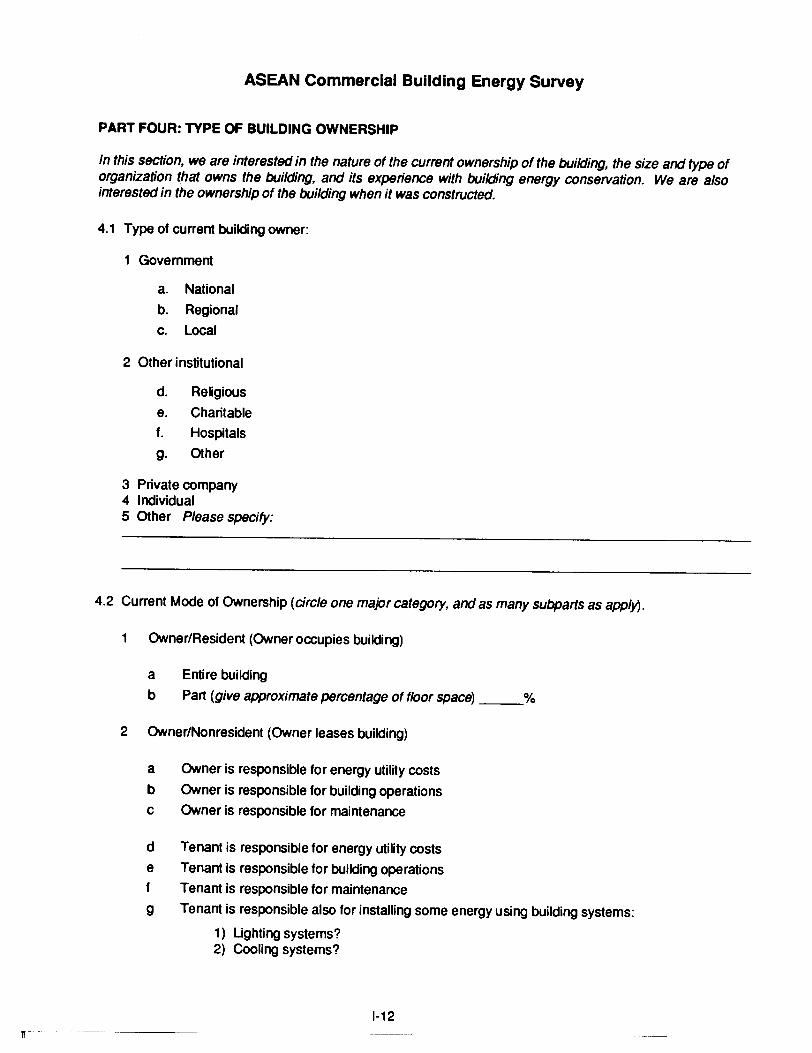
ASEAN Commercial Building Energy Survey
PART FOUR: TYPE OF BUILDING OWNERSHIP
In this section, we are interested in the nature of the current ownership of the building, the size and type oforganization that owns the building, and its experience with building energy conservation. We are alsointerested in the ownership of the building when it was constructed.
4.1 Type of current building owner:
1 Government
a. National
b. Regional
c. Local
2 Other institutional
d. Religious
e. Charitable
f. Hospitals
g. Other
3 Private company4 Individual5 Other Please specify:
4.2 Current Mode of Ownership (circle one major category, and as many subparts as apply).
1 Owner/Resident (Owner occupies building)
ab
Entire building
Part (give approximate percentage of floor space) %
2 Owner/Nonresident (Owner leases building)
a Owner is responsible for energy utility costs
b Owner is responsible for building operations
c Owner is responsible for maintenance
d Tenant is responsible for energy utility costs
e Tenant is responsible for building operations
f Tenant is responsible for maintenance
g Tenant is responsible also for installing some energy using building systems:
1) Lighting systems?2) Cooling systems?
1-12
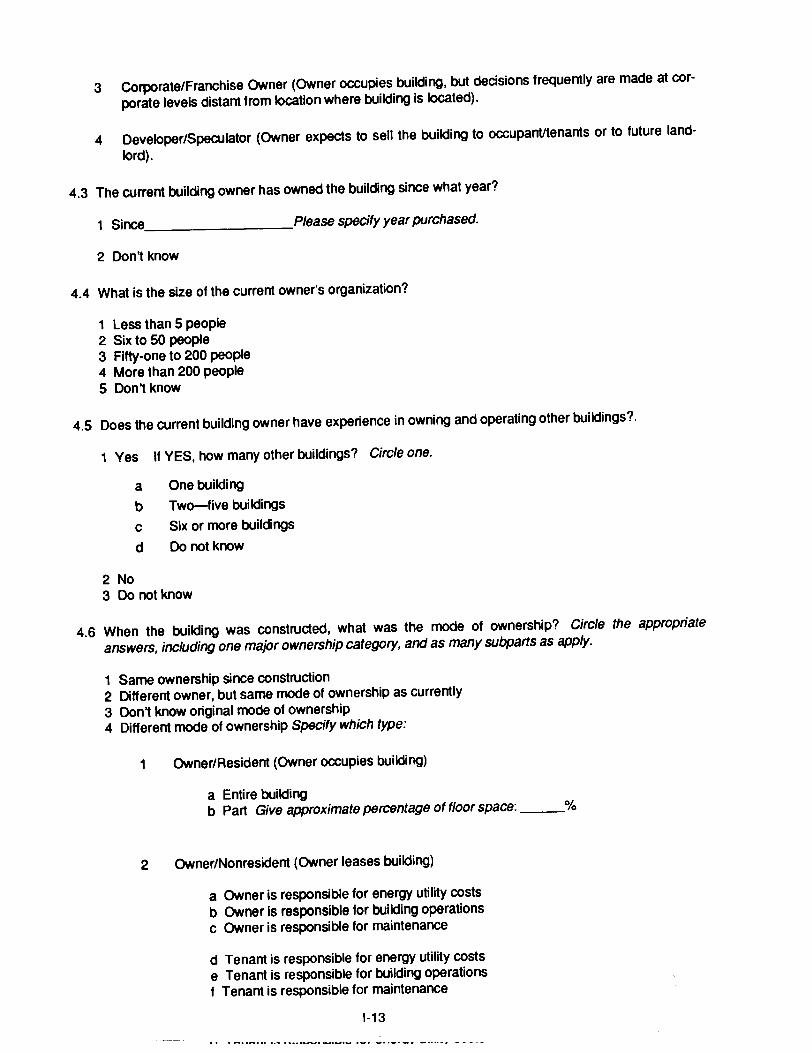
3 Corporate/Franchise Owner (Owner occupies building, but decisions frequently are made at cor
porate levels distant from location where building is located).
4 Developer/Speculator (Owner expects to sell the building to occupant/tenants or to future land
lord).
4.3 The current building owner has owned the building since what year?
1 Since Please specify year purchased.
2 Don't know
4.4 What is the size of the current owner's organization?
1 Less than 5 people2 Six to 50 people3 Fifty-one to 200 people4 More than 200 people5 Don't know
4.5 Does the current building owner have experience in owning and operating other buildings?
1 Yes If YES, how many other buildings? Circle one.
a One building
b Two-five buildings
c Six or more buildings
d Do not know
2 No3 Do not know
4.6 When the building was constructed, what was the mode of ownership? Circle the appropriate
answers, including one major ownership category, and as many subparts as apply.
1 Same ownership since construction
2 Different owner, but same mode of ownership as currently
3 Don't know original mode of ownership
4 Different mode of ownership SpeCify which type:
1 Owner/Resident (Owner occupies building)
a Entire buildingb Part Give approximate percentage of floor space: %
2 Owner/Nonresident (Owner leases building)
a Owner is responsible for energy utility costs
b Owner Is responsible for building operations
c Owner is responsible for maintenance
d Tenant is responsible for energy utility costs
e Tenant is responsible for building operations
f Tenant is responsible for maintenance
1-13
.. ._. --.....~ ... ~.",.....-... ------ --. _. -_. _.. --- --. - - - -
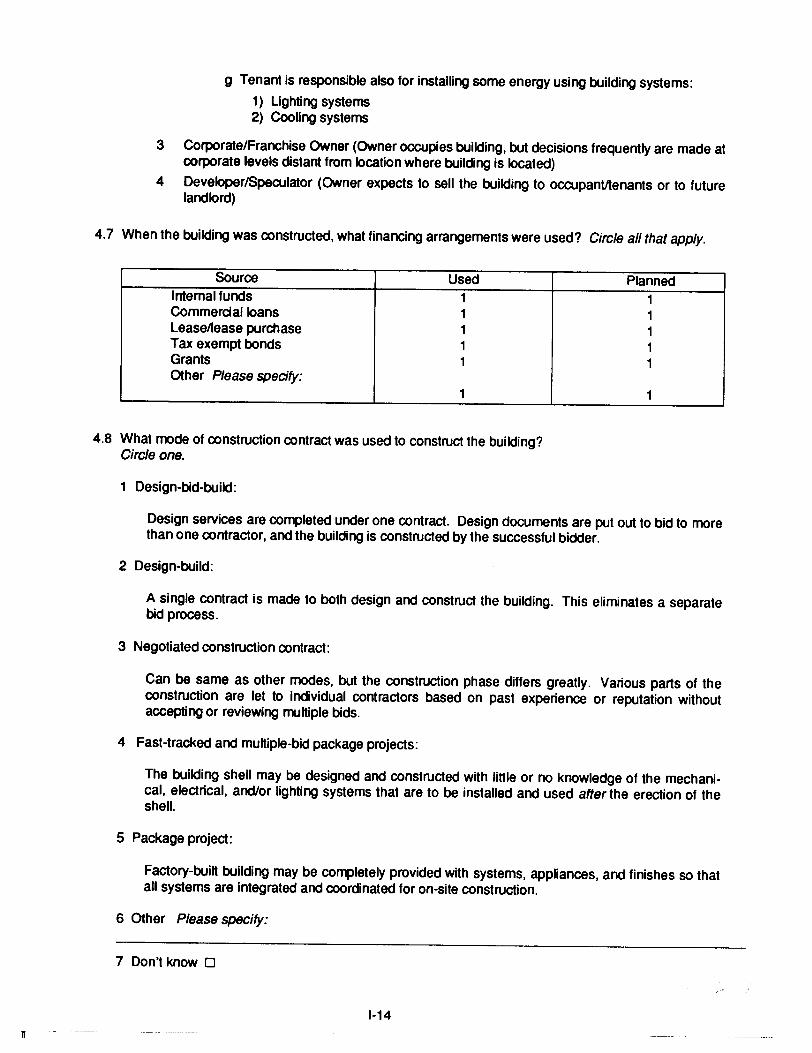
g Tenant is responsible also for installing some energy using bUilding systems:
1) Lighting systems2) Cooling systems
3 Corporate/Franchise Owner (Owner occupies building, but decisions frequently are made atcorporate levels distant from location where building is located)
4 Developer/Speculator (Owner expects to sell the building to occupantltenants or to futurelandlord)
4.7 When the building was constructed, what financing arrangements were used? Circle all that apply.
Source Used PlannedInternal funds 1 1Commercial loans 1 1Lease/lease purchase 1 1Tax exempt bonds 1 1Grants 1 1Other Please specify:
1 1
4.8 What mode of construction contract was used to construct the building?Circle one.
1 Design-bid-build:
Design services are completed under one contract. Design documents are put out to bid to morethan one contractor, and the building is constructed by the successful bidder.
2 Design-build:
A single contract is made to both design and construct the building. This eliminates a separatebid process.
3 Negotiated construction contract:
Can be same as other modes, but the construction phase differs greatly. Various parts of theconstruction are let to individual contractors based on past experience or reputation withoutaccepting or reviewing multiple bids.
4 Fast-tracked and multiple-bid package projects:
The building shell may be designed and constructed with little or no knowledge of the mechanical, electrical, and/or lighting systems that are to be installed and used after the erection of theshell.
5 Package project:
Factory-built building may be completely provided with systems, appliances, and finishes so thatall systems are integrated and coordinated for on-site construction.
6 Other Please specify:
7 Don't know 0
1-14
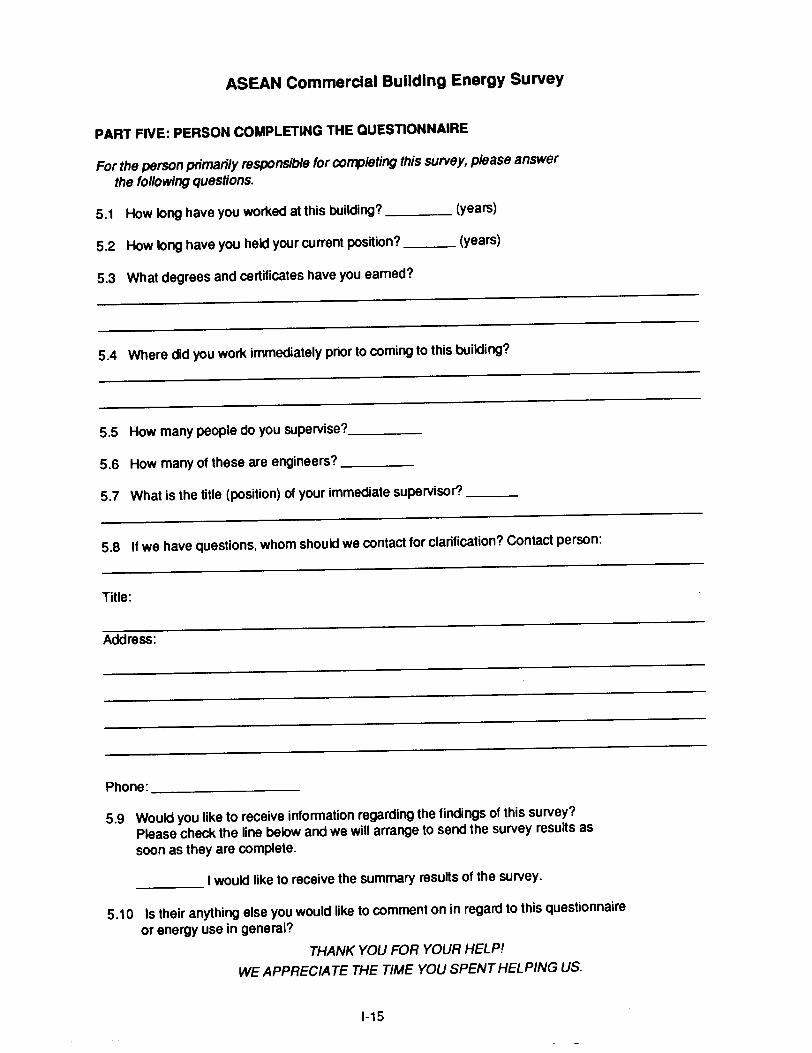
ASEAN Commercial Building Energy Survey
PART FIVE: PERSON COMPLETING THE QUESTIONNAIRE
For the person primarily responsible for cofTJJleting this survey, please answer
the following questions.
5.1 How long have you worked at this building? (years)
5.2 How long have you held your current position? (years)
5.3 What degrees and certificates have you earned?
5.4 Where did you work immediately prior to coming to this building?
5.5 How many people do you supervise? _
5.6 How many of these are engineers? _
5.7 What is the title (position) of your immediate supervisor? _
5.8 If we have questions, whom should we contact for clarification? Contact person:
Title:
Address:
Phone: _
5.9 Would you like to receive information regarding the findings of this survey?
Please check the line below and we will arrange to send the survey results as
soon as they are complete.
____ I would like to receive the summary results of the survey.
5.10 Is their anything else you would like to comment on in regard to this questionnaire
or energy use in general?
THANK YOU FOR YOUR HELP!
WE APPRECIATE THE TIME YOU SPENT HELPING US.
1-15
u
ASEAN Commercial Building Energy Survey
PART SIX: BUILDING CHARACTERISTICS
NOTE: Parts One through Five must also be completed. If you have completed Parts One throughFive already, please make a copy for your records and return Parts One through Five usingthe pre-addressed envelope enclosed.
6.1 PhotographS: Attach photos of building exterior here. If possible, include (and label) at least twoelevations: one North or South, one East or West.
1-16
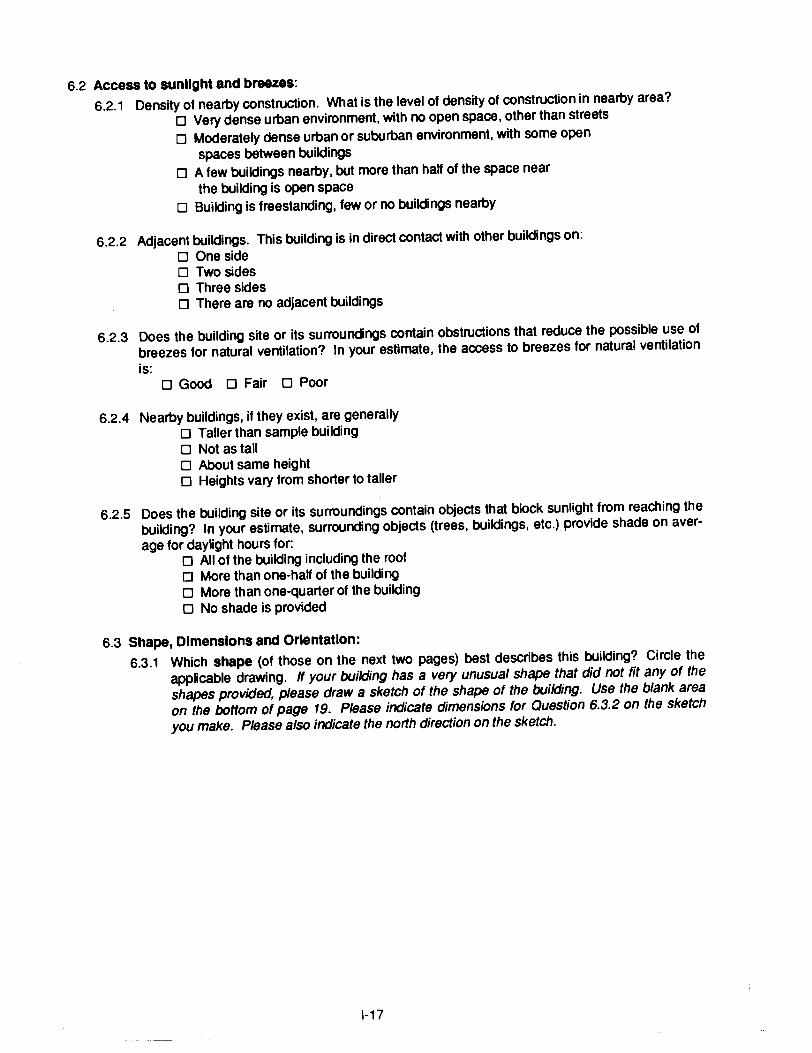
6.2 Access to sunlight and breezes:
6.2.1 Density of nearby construction. What is the level of density of construction in nearby area?o Very dense urban environment, with no open space, other than streetso Moderately dense urban or suburban environment, with some open
spaces between buildingso A few buildings nearby, but more than ha" of the space near
the building is open spaceo Building is freestanding, few or no buildings nearby
6.2.2 Adjacent buildings. This building is in direct contact with other buildings on:o One sideo Two sideso Three sideso There are no adjacent buildings
6.2.3 Does the building site or its surroundings contain obstructions that reduce the possible use ofbreezes for natural ventilation? In your estimate. the access to breezes for natural ventilationis:
o Good 0 Fair 0 Poor
6.2.4 Nearby buildings, if they exist. are generallyo Taller than sample buildingo Not as tallo About same heighto Heights vary from shorter to taller
6.2.5 Does the building site or its surroundings contain objects that block sunlight from reaching thebUilding? In your estimate. surrounding objects (trees. buildings, etc.) provide shade on average for daylight hours for:
o All of the building including the roofo More than one-ha" of the buildingo More than one-quarter of the buildingo No shade is provided
6.3 Shape, Dimensions and Orientation:
6.3.1 Which shape (of those on the next two pages) best describes this building? Circle theapplicable drawing. If your building has a very unusual shape that did not fit any of theshapes provided, please draw a sketch of the shape of the building. Use the blank areaon the bottom of page 19. Please indicate dimensions for Question 6.3.2 on the sketchyou make. Please also indicate the north direction on the sketch.
1-17
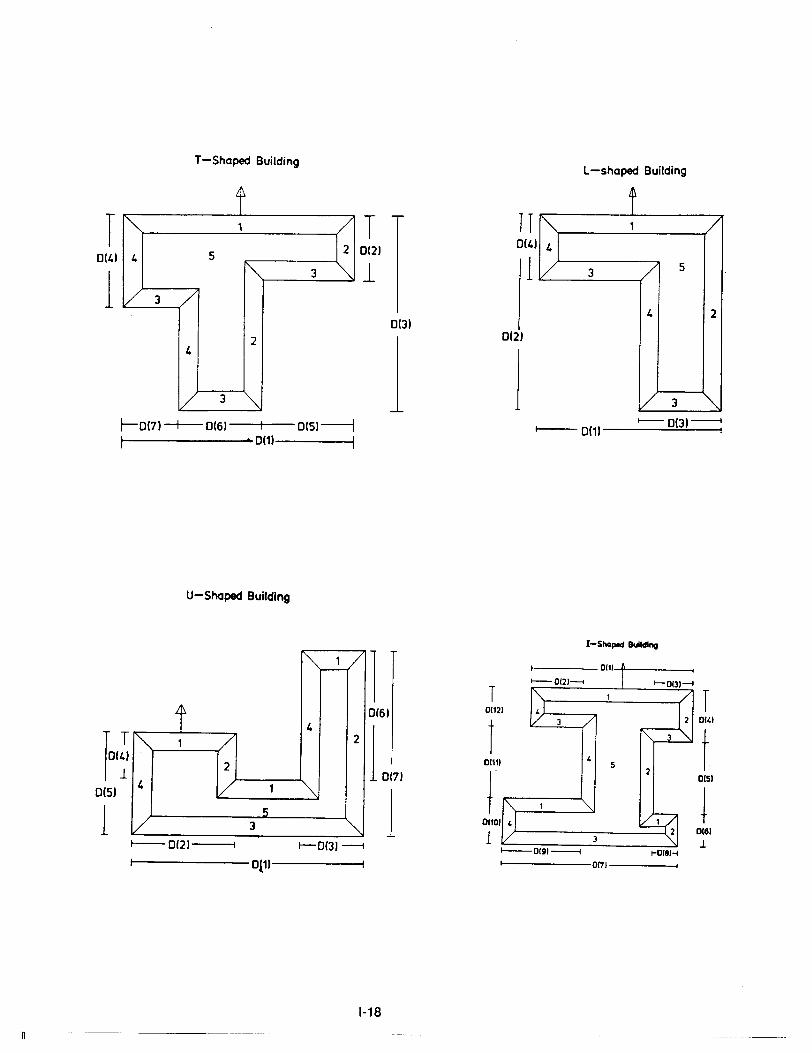
T-Shaped BuildingL-shaped Building
T0(4)
1
~0(31~~- 0(11-----=;.;.;;.:..--."
t"" 1 /
1 41V 3 / 5
4 2
V3 '"
1
rr0(4
j
0(2)0131
1
T0121
1
t'" , /
4 5 12
I"" 3 '"1/ 3 /
24
V 3 '"rOl7l-+-- 0161---t-1-- 0(5)--jI . 0(11 I
U-Shaped Building
1--------011)-------1
H0(5)
I-Shaped Building
1I 011)
>--Of21--<
T T0161 01121
r2 0141
1017J t01111 4
t2
0(51
1 +01101 40161
1 3 .!~Of9)---l t-018H
0171
0121
~ 1/-
t 4
1""- 1 / 2-
2
4 L( 1 '"5
V 3 ""-t--- I I--0(31 ---l
1
1-18
n -------- ---._-----
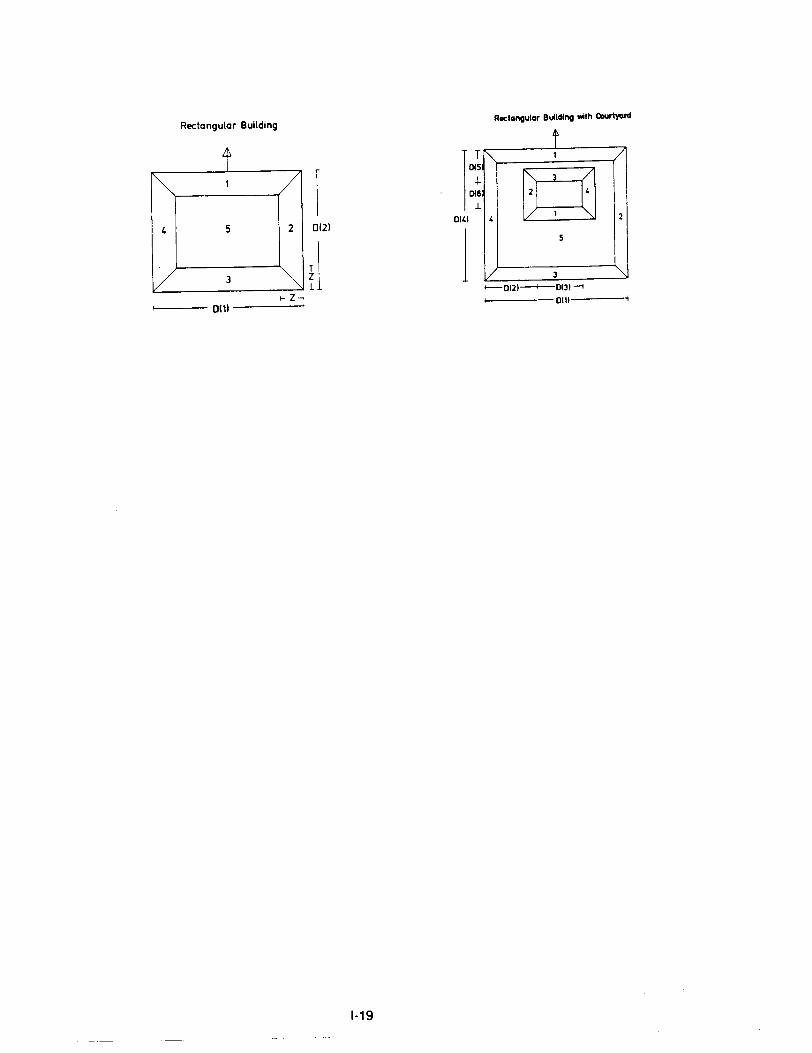
Rectangular Building
I4 5 2 0121
fl3
,..Z...,0111 I
1-19
) O~016.L
OW
j
Rectangular Building with 00urtycmI
t:\ 1 /
4 M 2
5
1/ J '...---OI21-+--0lJl-l
I 0111-----1
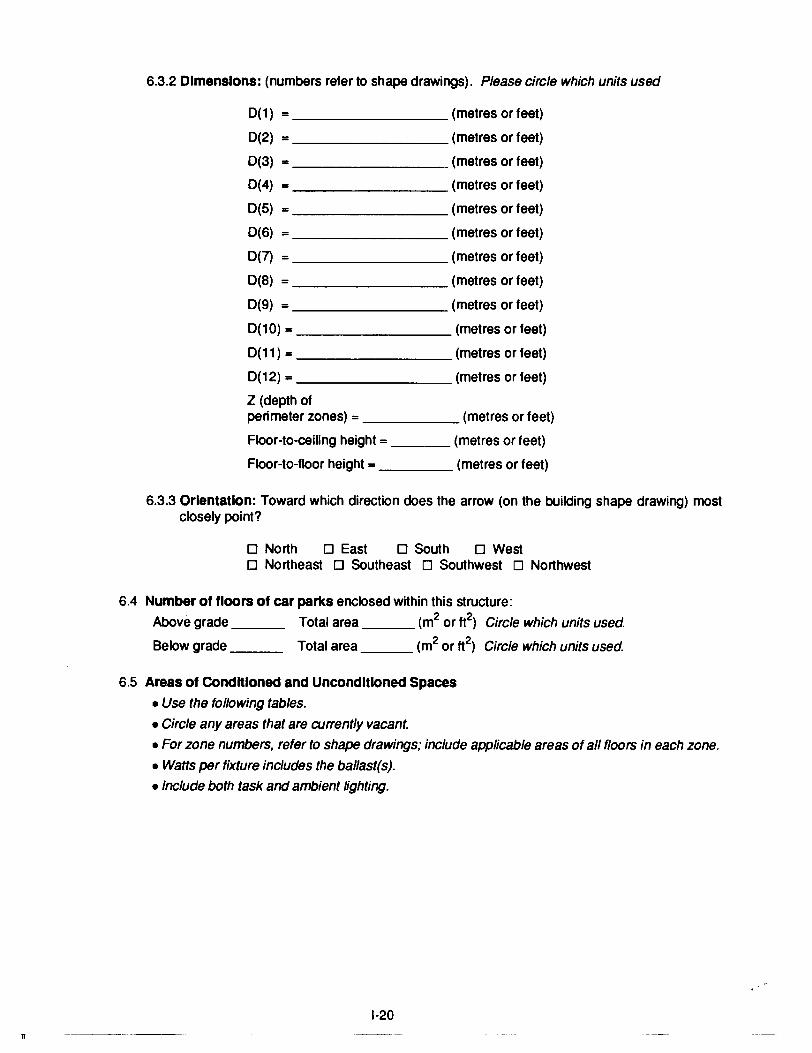
n
6.3.2 Dimensions: (numbers refer to shape drawings). Please circle which units used
0(1) = (metres or feet)
0(2) = (metres or feet)
0(3) = (metres or feet)
0(4) = (metres or feet)
0(5) "" (metres or feet)
0(6) = (metres or feet)
0(7) = (metres or feet)
0(8) = (metres or feet)
0(9) = (metres or feet)
0(10) = (metres or feet)
0(11) = (metres or feet)
0(12) = (metres or feet)
Z (depth ofperimeter zones) = (metres or feet)
Floor-to-ceiling height = (metres or feet)
Floor-to-fioor height = (metres or feet)
6.3.3 Orientation: Toward which direction does the arrow (on the building shape drawing) mostclosely point?
o North 0 East 0 South 0 Westo Northeast 0 Southeast 0 Southwest 0 Northwest
6.4 Number of floors of car parks enclosed within this structure:
Above grade Total area (m2 or ft2) Circle which units used.
Below grade Total area (m2 or ft2) Circle which units used.
6.5 Areas of Condhloned and Unconditioned Spaces
• Use the following tables.
• Circle any areas that are currently vacant.
• For zone numbers. refer to shape drawings; include applicable areas of all floors in each zone.
• Watts per fixture includes the ballast(s).
• Include both task and ambient lighting.
1-20---~~_ .._--
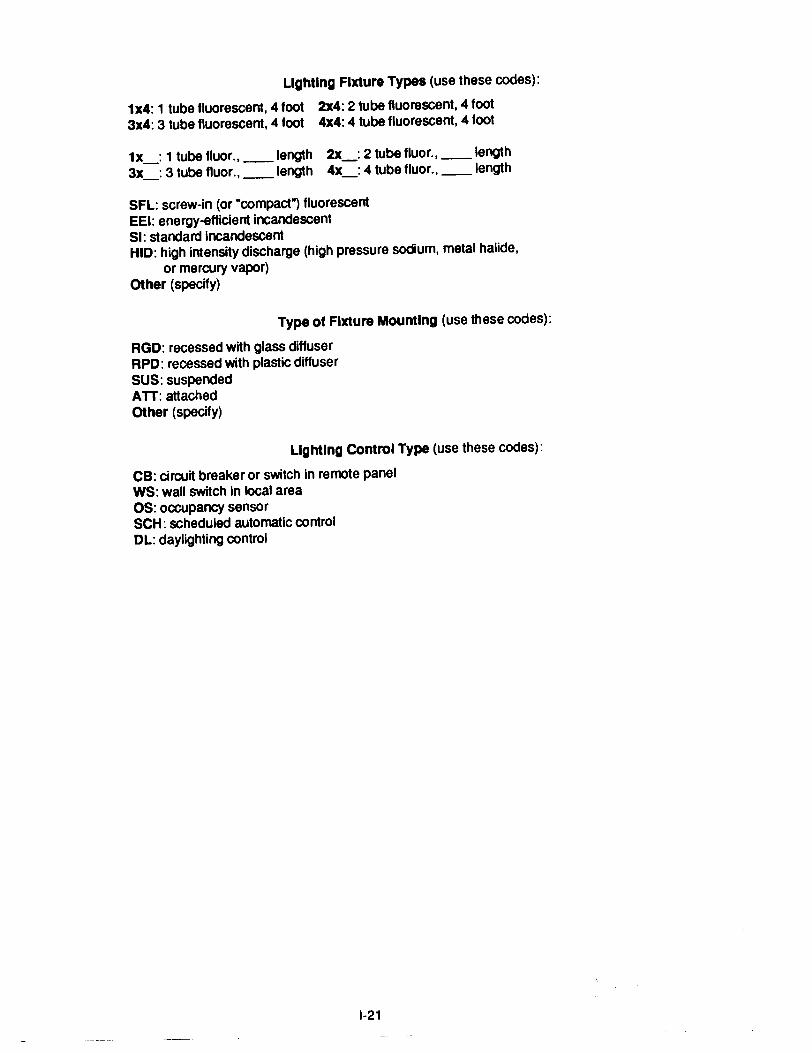
Ughtlng Fixture Types (use these codes):
1x4: 1 tube fluorescent, 4 foot 2X4: 2 tube fluorescent, 4 foot3x4: 3 tube fluorescent, 4 foot 4x4: 4 tube fluorescent, 4 foot
1x_: 1 tube fluor., __ length 2X_: 2 tube fluor., __ length3x_: 3 tube fluor., __ length 4x_: 4 tube fluor., __ length
SFL: screw-in (or "compactj fluorescentEEl: energy-efficient incandescentSl: standard incandescentHID: high intensity discharge (high pressure sodium, metal halide,
or mercury vapor)Other (specify)
Type of Fixture Mounting (use these codes):
RGD: recessed with glass diffuserRPD: recessed with plastic diffuserSUS: suspendedATT: attachedOther (specify)
lighting Control Type (use these codes):
CB: circuit breaker or switch in remote panelWS: wall switch in local areaOS: occupancy sensorSCH: scheduled automatic controlDL: daylighting control
1-21
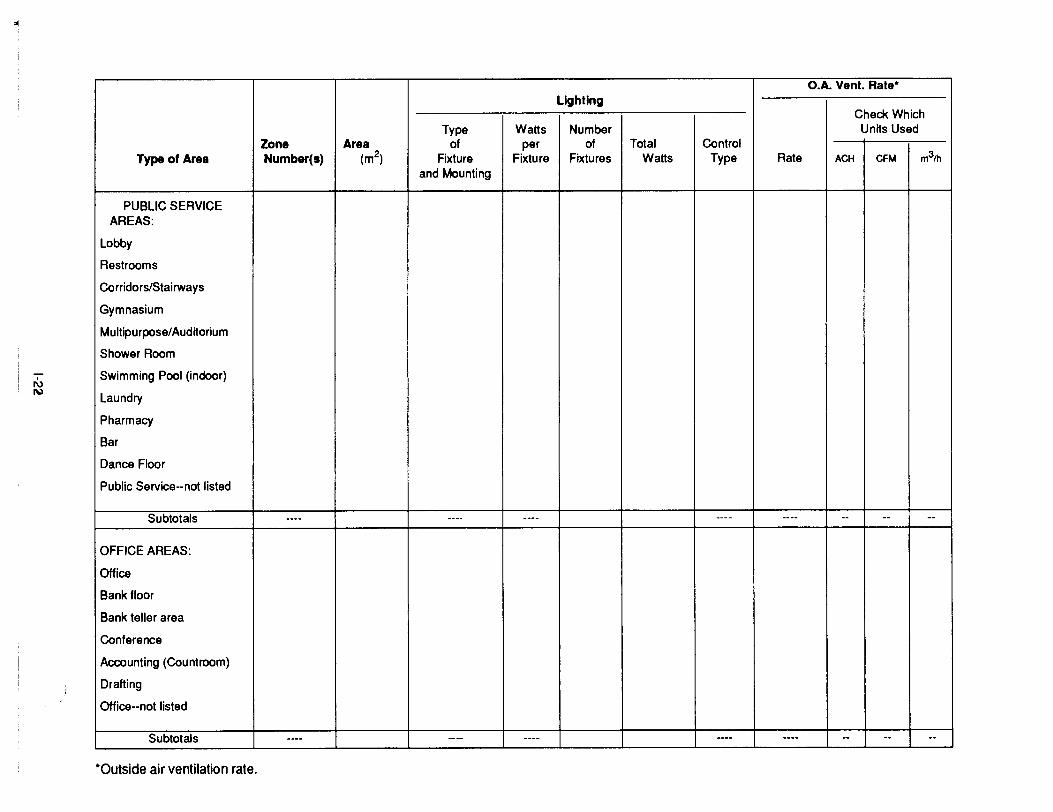
..
,NI\o'l
O.A. Vent. Rate*Lighting
Check WhichType Watts Number Units Used
Zone Area of per of Total ControlType of Area Number(s) (m2
) Fixture Fixture Fixtures Watts Type Rate ACH CFM m3Jh
and Mounting
PUBLIC SERVICEAREAS:
Lobby
Restrooms
Corridors/Stairways
Gymnasium
Multipurpose/Auditorium
Shower Room
Swimming Pool (indoor)
Laundry
Pharmacy
Bar
Dance Floor
Public Service--nol listed
Subtotals ---- .._..- .. _.. - ---- ---- -- -- .-
OFFICE AREAS:
Office
Bank floor
Bank teller area
Conference
Accounting (Countroom)
Drafting
Office--not listed
Subtotals ---- ---- ---- ---- ---- -- -- 0-
*Outside air ventilation rate.
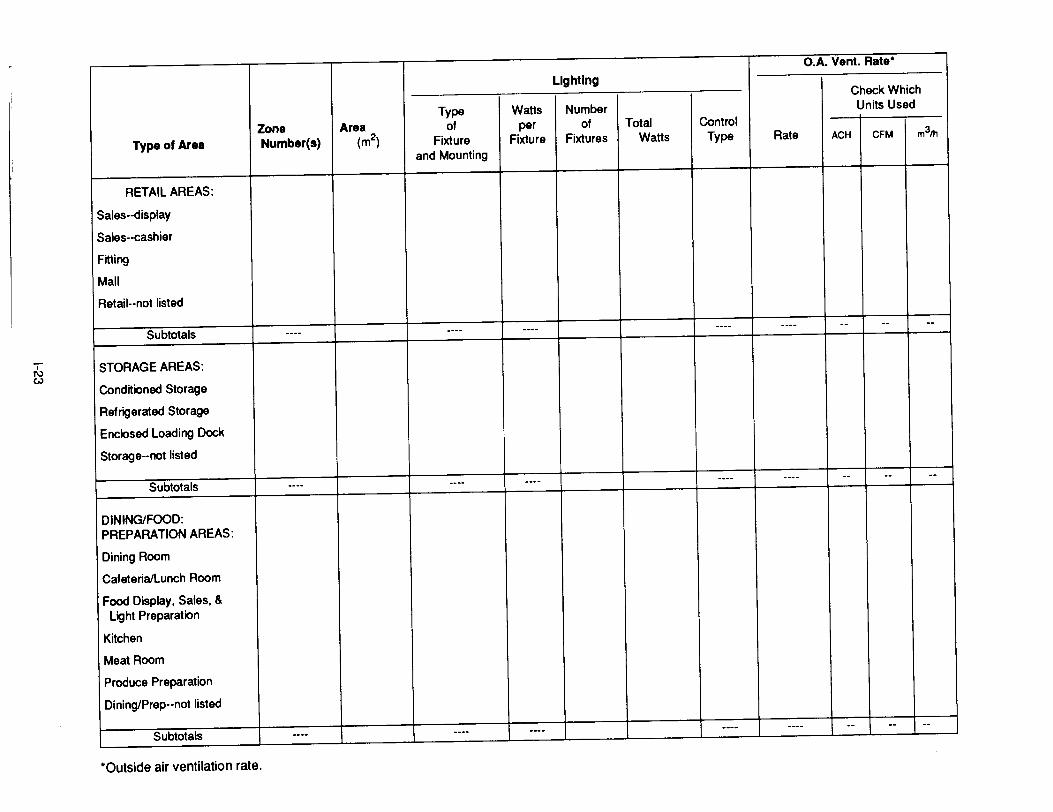
.,f\)w
O.A. Vent. Rate·Lighting
Check WhichType Watts Number Units Used
Zone Area of per of Total ControlType of Are. Number(s) (m2
) Fixture Fixture Fixtures Watts Type Rate ACH CFM m3/h
and Mounting
RETAIL AREAS:
Sales--display
Sales--cashier
Fitting
Mall
Retail--not listed
Subtotals -_..... .... -- .......- ---- ---- -- -- --STORAGE AREAS:
Conditioned Storage
Refrigerated Storage
Enclosed Loading Dock
Storage--not listed
Subtotals ...--- ---- ......- ---- ---- -- -- --
DINING/FOOD:PREPARATION AREAS:
Dining Room
Cafeteria/Lunch Room
Food Display, Sales, &Light Preparation
Kitchen
Meat Room
Produce Preparation
Dining/Prep--not listed
Subtotals -.._- ---- ...--- ... _- ... ---- -- -- --
·Outside air ventilation rate.
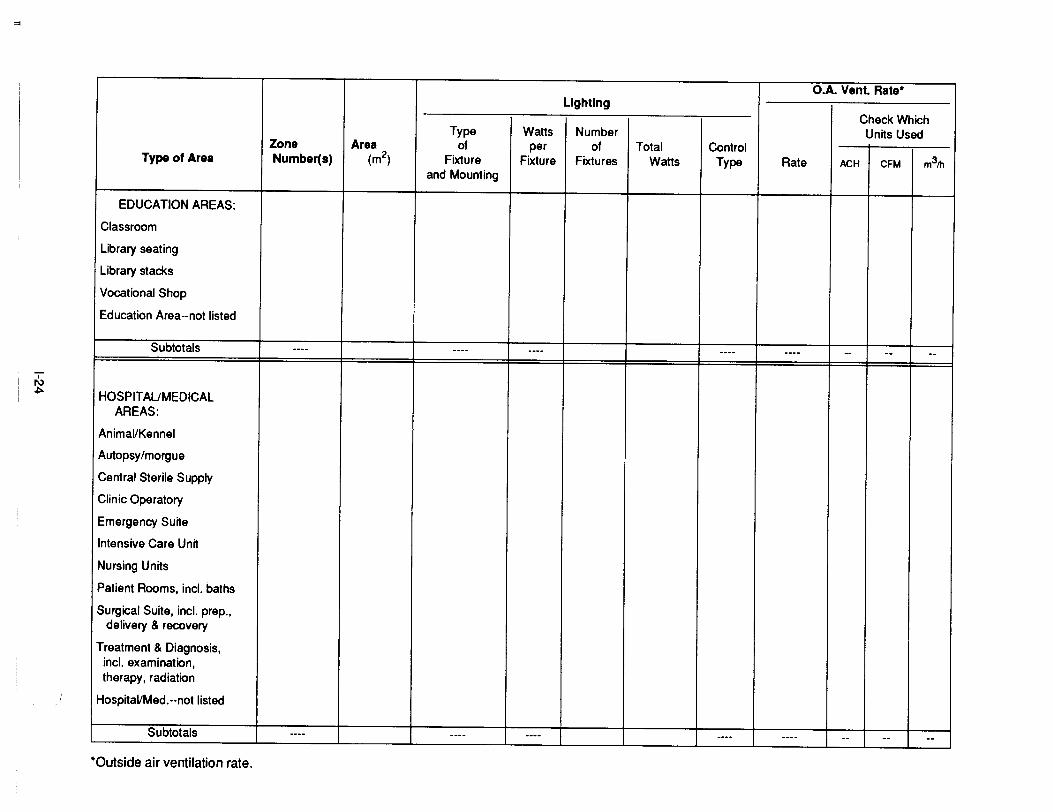
""
II\)~
O.A. Vent. Rate·Lighting
Check WhichType Watts Number Units Used
Zone Area of per of Total ControlType of Area Number(s) (m2) Fixture Fixture Fixtures Watts Type Rate ACH CFM m3/h
and Mounting
EDUCATION AREAS:
Classroom
Library seating
Library stacks
Vocational Shop
Education Area--not listed
Subtotals ---- ---- ---- .....-- ---- -- -- --
HOSPITAUMEDICALAREAS:
Animal/Kennel
Autopsy/morgue
Central Sterile Supply
Clinic Operatory
Emergency Suite
Intensive Care Unit
Nursing Units
Patient Rooms, inc!. baths
Surgical Suite, inc!. prep.,delivery & recovery
Treatment &Diagnosis,inc!. examination,therapy, radiation
Hospital/Med.--not listed
Subtotals ---- ---- ---- ---- ---- -- -- --
·Outside air ventilation rate.
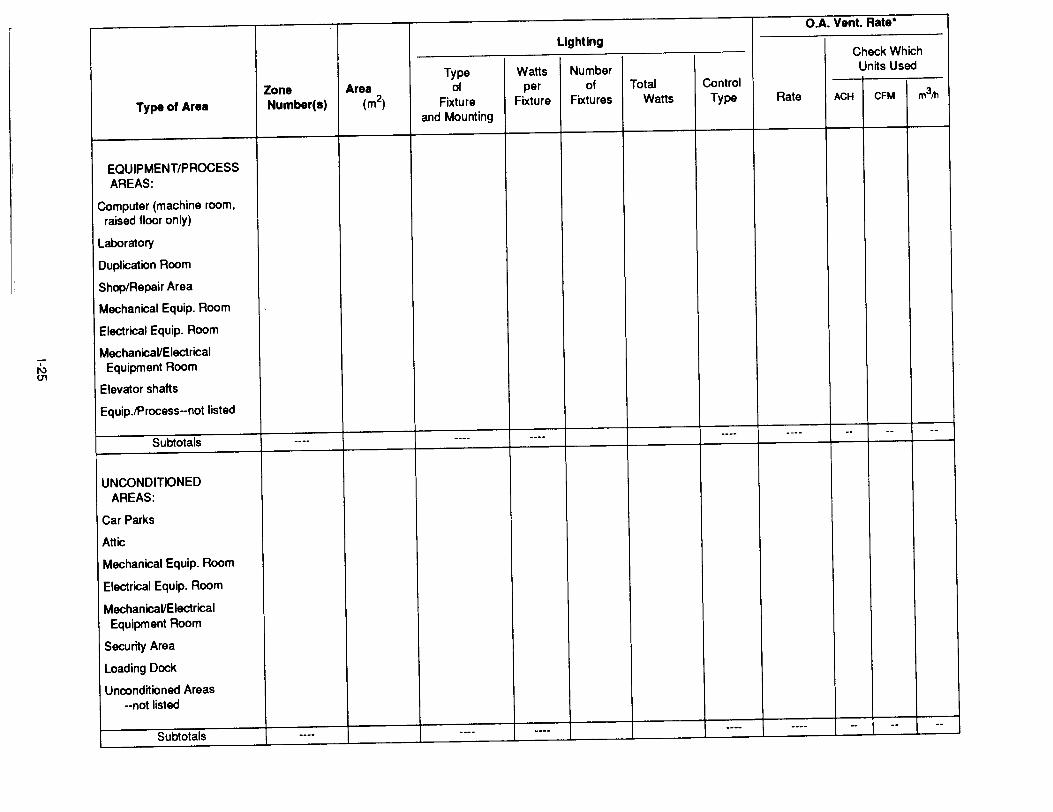
r\>(]'I
O.A. Vent. Rate·Lighting
Check WhichType Watts Number Units Used
Zone Area of per of Total ControlType of Area Number(s) (m2
) Fixture Fixture Fixtures Watts Type Rate ACH CFM m3fh
and Mounting
EQUIPMENT/PROCESSAREAS:
Computer (machine room.raised floor only)
Laboratory
Duplication Room
Shop/Repair Area
Mechanical Equip. Room
Electrical Equip. Room
Mechanical/ElectricalEquipment Room
Elevator shafts
Equip./Process--not listed
Subtotals ---- ---- ---- ---- ---- -- -- --
UNCONDITIONEDAREAS:
Car Parks
Attic
Mechanical Equip. Room
Electrical Equip. Room
Mechanical/ElectricalEquipment Room
Security Area
Loading Dock
Unconditioned Areas--not listed
Subtotals ---- ---- ---- ---- ---- -- -- --
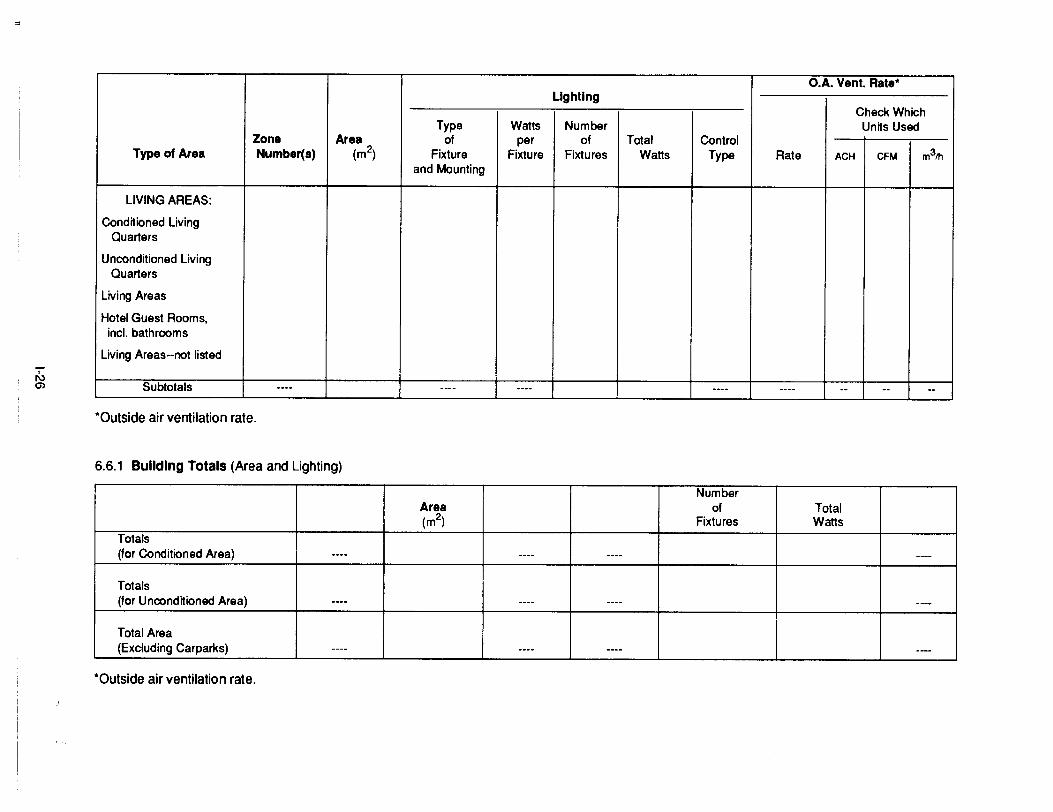
..
N0>
O.A. Vent. Rate*Lighting
Check WhichType Watts Number Units Used
Zone Area of per of Total ControlType of Area Number(s) (m2) Fixture Fixture Fixtures Watts Type Rate ACH CFM m3/h
and Mounting
LIVING AREAS:
Conditioned LivingQuarters
Unconditioned LivingQuarters
Living Areas
Hotel Guest Rooms,inc!. bathrooms
Living Areas--net listed
Subtotals ...... ---- ---- ........ ---- -- -- --
*Outside air ventilation rate.
6.6.1 Building Totals (Area and Lighting)
NumberArea of Total(m2) Fixtures Watts
Totals(for Conditioned Area) ........... ---- ... ........ ._--
Totals(for Unconditioned Area) ---- ---- ..._-- ---...
Total Area(Excluding Carparks) ---- _.._- ---- ----
*Outside air ventilation rate.
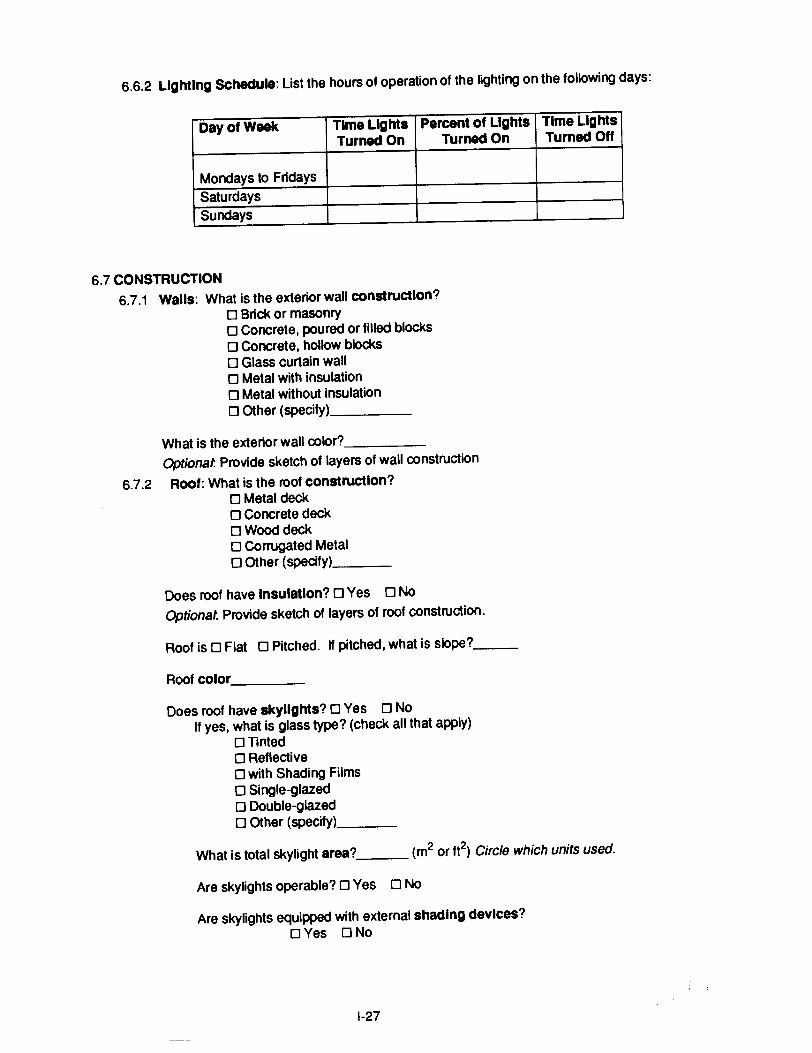
6.6.2 lighting SChedule: List the hours of operation of the lighting on the following days:
Day of Week Time Lights Percent of LIghts Time lights
Turned On Turned On Turned Off
Mondays to Fridays
Saturdays
SUndays
6.7 CONSTRUCTION
6.7.1 Walls: What is the exterior wall construction?
o Brick or masonryo Concrete, poured or filled blocks
o Concrete, hollow blockso Glass curtain wallo Metal with insulationo Metal without insulationo Other (specify) _
What is the exterior wall color? _
Optional. Provide sketch of layers of wall construction
6.7.2 Roof: What is the roof construction?o Metal deckD Concrete decko Wood deckD Corrugated MetalD Other (specify), _
Does roof have Insulation? DYes D No
Optional. Provide sketch of layers of roof construction.
Roof is D Flat D Pitched. If pitched, what is slope? _
Roof color _
Does roof have skylights? DYes D No
If yes, what is glass type? (check all that apply)
D TintedD ReflectiveD with Shading FilmsD Single-glazedo Double-glazedD Other (specify), _
What is total skylight area? (m2 or ft2) Circle which units used.
Are skylights operable? DYes D No
Are skylights equipped with external shading devices?
DYes DNo
1-27
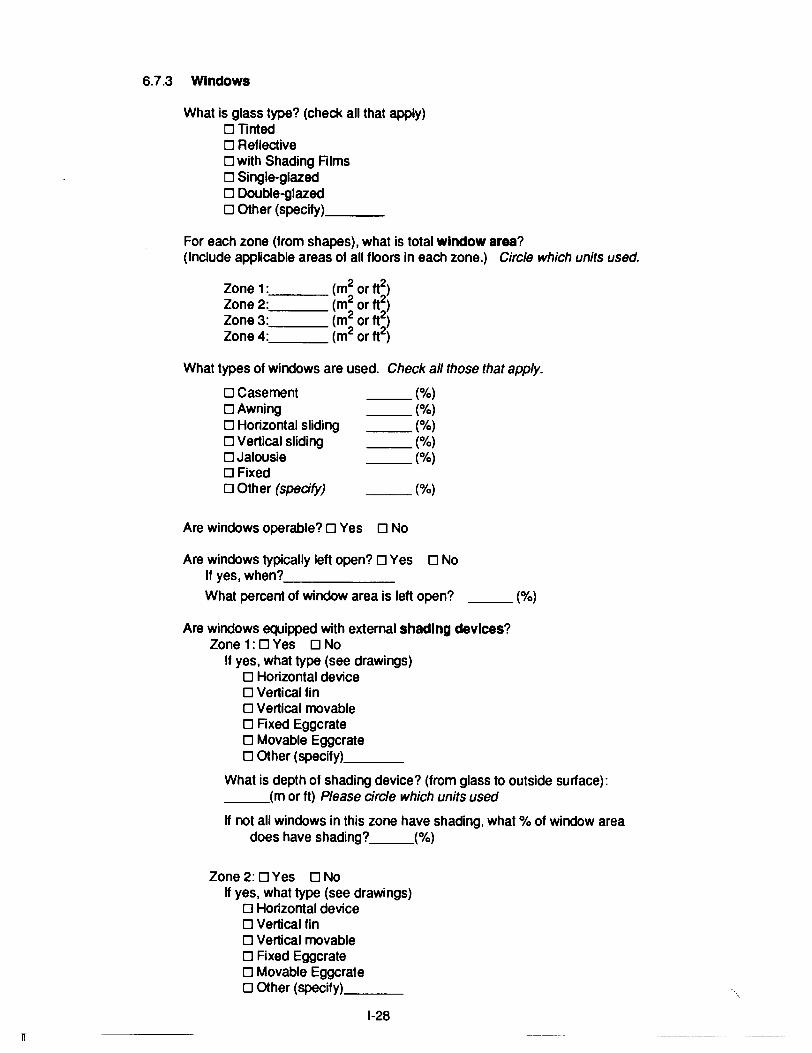
6.7.3 Windows
What is glass type? (check all that apply)DTintedD ReflectiveD with Shading FilmsD Single-glazedD Double-glazedD Other (specify) _
For each zone (from shapes), what is total window area?(Include applicable areas of all floors in each zone.) Circle which units used.
---(%)
Check all those that apply.
---(%)---(%)---(%)---(%)---(%)
What types of windows are used.
DCasernentDAwningD Horizontal slidingD Vertical slidingDJalousieo Fixedo Other (spedfy)
Are windows operable? 0 Yes 0 No
Are windows typically left open? DYes 0 NoIf yes, when? _
What percent of window area is left open? (%)
Are windows equipped with external shading devices?Zone 1: DYes D No
If yes, what type (see drawings)D Horizontal deviceD Vertical finD Vertical movableD Fixed EggcrateD Movable EggcrateD Other (specify) _
What is depth of shading device? (from glass to outside surface):___,(m or ft) Please circle which units used
If not all windows in this zone have shading, what % of window areadoes have shading? (%)
Zone 2: 0 Yes D NoIf yes, what type (see drawings)
D Horizontal deviceD Vertical finD Vertical movableD Fixed EggcrateD Movable EggcrateD Other (specify) _
1-28
11
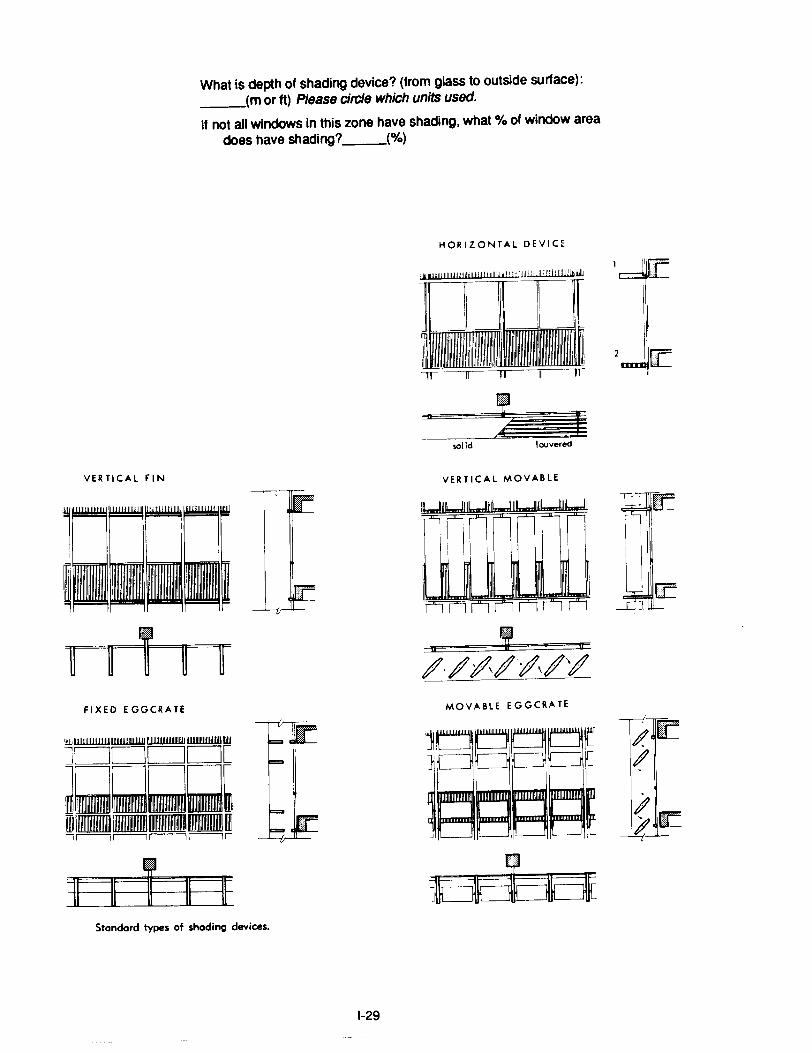
What is depth of shading device? (from glass to outside surface):
__.....;(m or ft) Please circle which units used.
If not all windows in this zone have shading, what % of window area
does have shading? (%)
HORIZONTAL DEVICE
'=f2J~
::u=;~:~~sol id louvered
VERTICAL FIN VERTICAL MOVABLE
UliIWliIWliILJIIIL..JIIIILJJIILJII I
~r
1r"'- ...... ,...... -
I
III
,......
D ,Ii
FIXED EGGCRATE MOVABLE EGGCRATE
,
I
I
Standard types af shading devices.
1-29
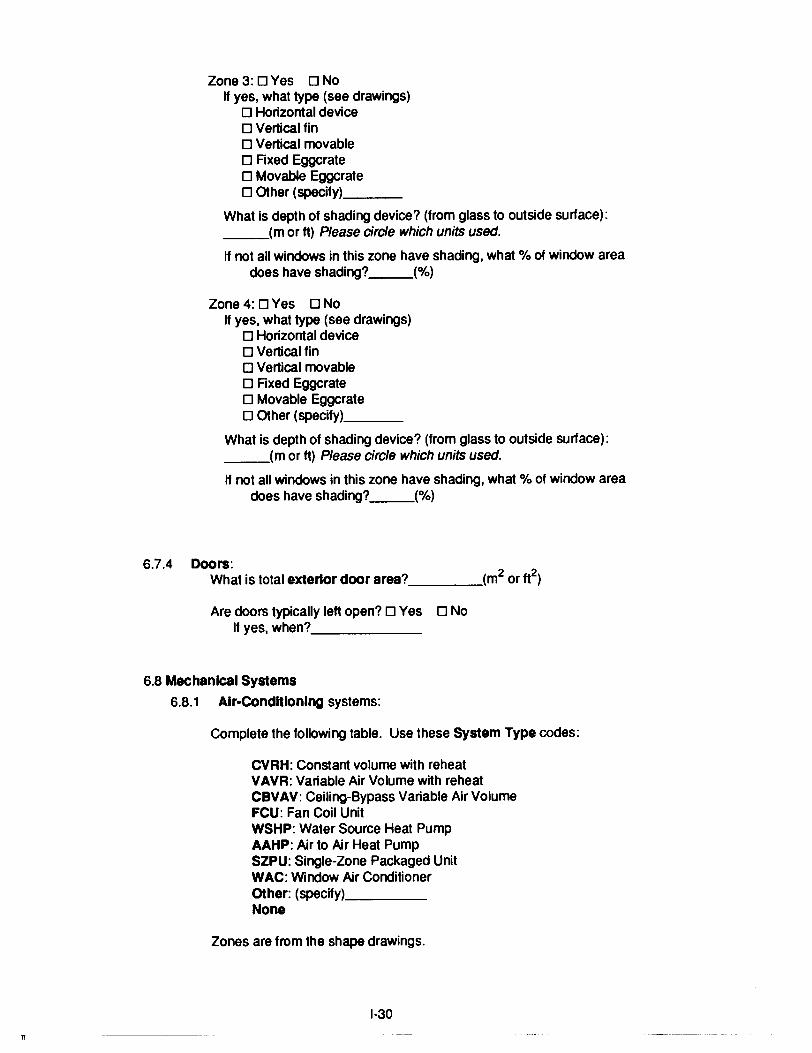
11
Zone 3: 0 Yes 0 NoIf yes, what type (see drawings)
o Horizontal deviceo Vertical fino Vertical movableo Fixed Eggerateo Movable Eggerateo Other (specify) _
What is depth of shading device? (from glass to outside sUrface):___,(m or ft) Please circle which units used.
If not all windows in this zone have shading, what % of window areadoes have shading? (%)
Zone 4: 0 Yes 0 NoIf yes, what type (see drawings)
o Horizontal deviceo Vertical fino Vertical movableo Fixed Eggerateo Movable Eggerateo Other (specny) ___
What is depth of shading device? (from glass to outside sUrface):___,(m or ft) Please circle which units used.
If not all windows in this zone have shading, what % of window areadoes have shading? (%)
6.7.4 Doors:What is total exterior door area? (m2 or ft2)
Are doors typically left open? 0 Yes 0 NoIf yes, when? _
6.8 Mechanical Systems
6.8.1 Air-Conditioning systems:
Complete the following table. Use these System Type codes:
CVRH: Constant volume with reheatVAVR: Variable Air Volume with reheatCBVAV: Ceiling-Bypass Variable Air VolumeFCU: Fan Coil UnitWSHP: Water Source Heat PumpAAHP: Air to Air Heat PumpSZPU: Single-Zone Packaged UnitWAC: Window Air ConditionerOther: (specify) _None
Zones are from the shape drawings.
1-30
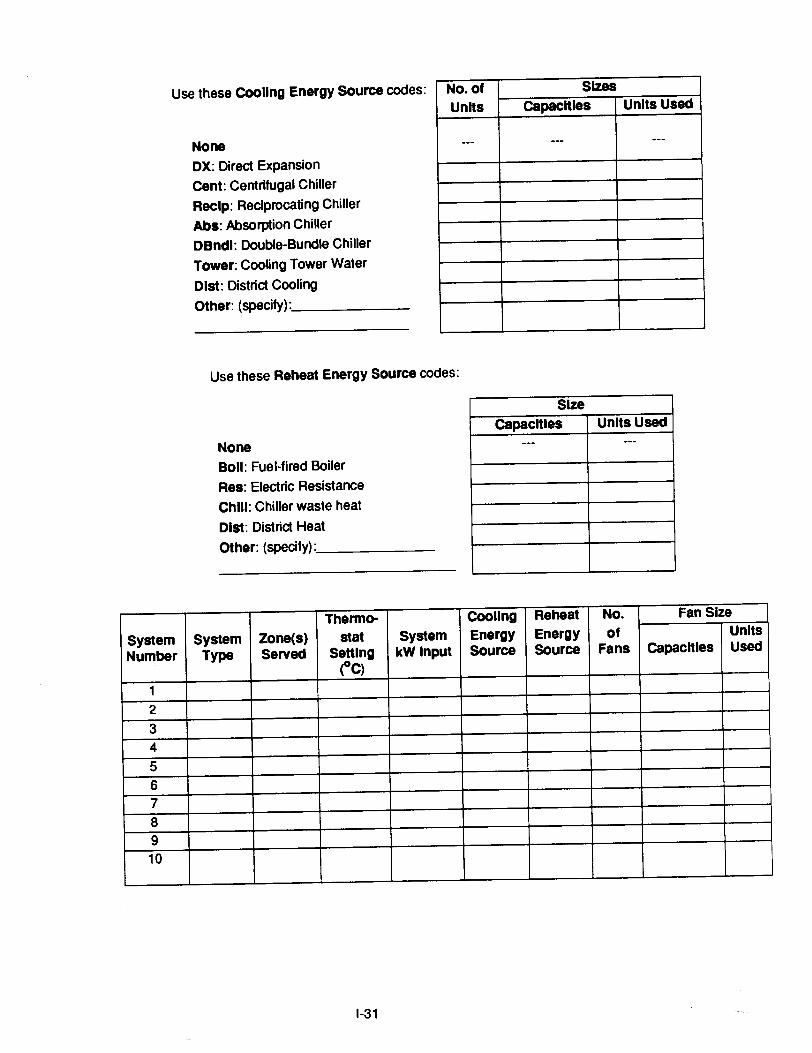
Use these Cooling Energy Source codes:
None
OX: Direct Expansion
cent: Centrifugal Chiller
Reclp: Reciprocating Chiller
Abs: Absorption Chiller
OBndl: Double-Bundle Chiller
Tower: CooUng Tower Water
Olst: District CoolingOther: (specify):~ _
No. of SizesUnits capacities Units Used
--- --- ---
Use these Reheat Energy Source codes:
None
Boll: Fuel-fired Boiler
Res: Electric Resistance
Chili: Chiller waste heat
Olst: District HeatOther: (specify) :. _
Sizecapacities Units Used
--- ---
Thermo- Cooling Reheat No. Fan SizeSystem System Zone(s) stat System Energy Energy of UnitsNumber Type Served setting kW Input Source Source Fans Capacities Used
(oC)
1234
5678910
1-31
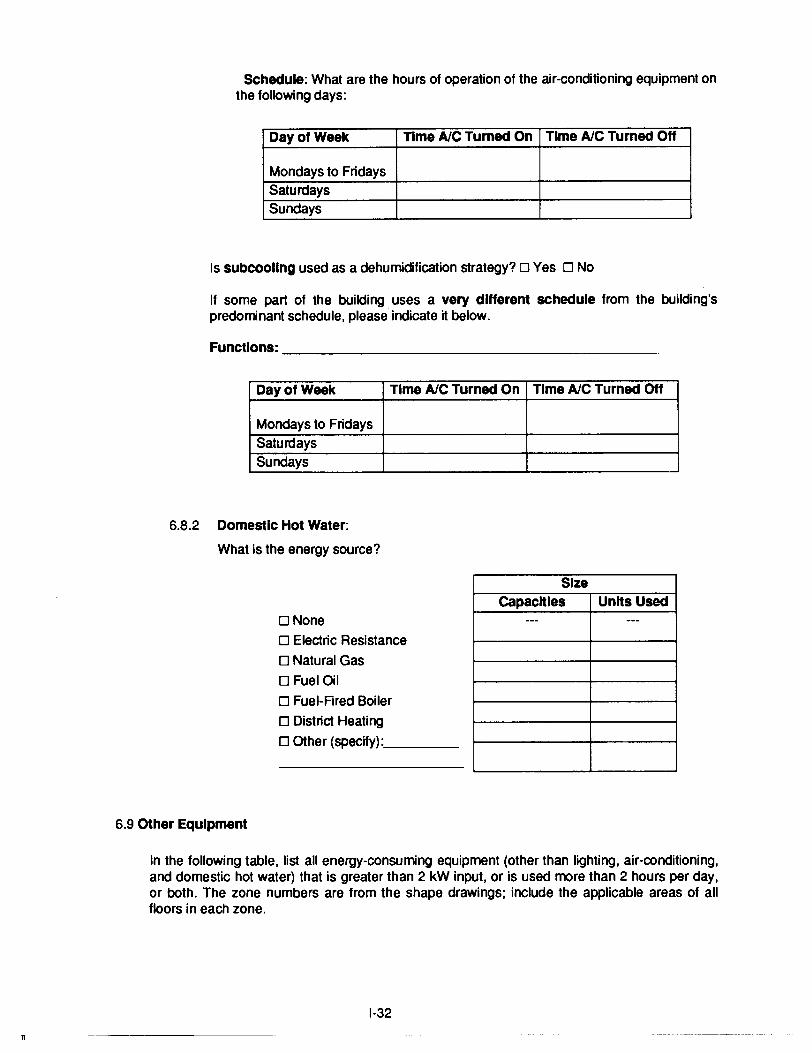
Schedule: What are the hours of operation of the air-conditioning equipment onthe following days:
Day of Week Time AlC Turned On Time AlC Turned Off
Mondays to FridaysSaturdaysSundays
Is subcoollng used as a dehumidification strategy? 0 Yes 0 No
If some part of the building uses a very different schedule from the building'spredominant schedule, please indicate it below.
Functions: _
Day of Week Time AlC Turned On Time AlC Turned Off
Mondays to FridaysSaturdaysSundays
6.8.2 Domestic Hot Water:
What is the energy source?
o None
o Electric Resistance
o Natural Gas
o Fuel Oil
o Fuel-Fired Boiler
o District Heating
o Other (specify):. _
6.9 Other Equipment
Sizecapacities Units Used
--- ---
11
In the following table, list all energy-consuming equipment (other than lighting, air-conditioning,and domestic hot water) that is greater than 2 kW input, or is used more than 2 hours per day,or both. The zone numbers are from the shape drawings; include the applicable areas of allfloors in each zone.
1-32
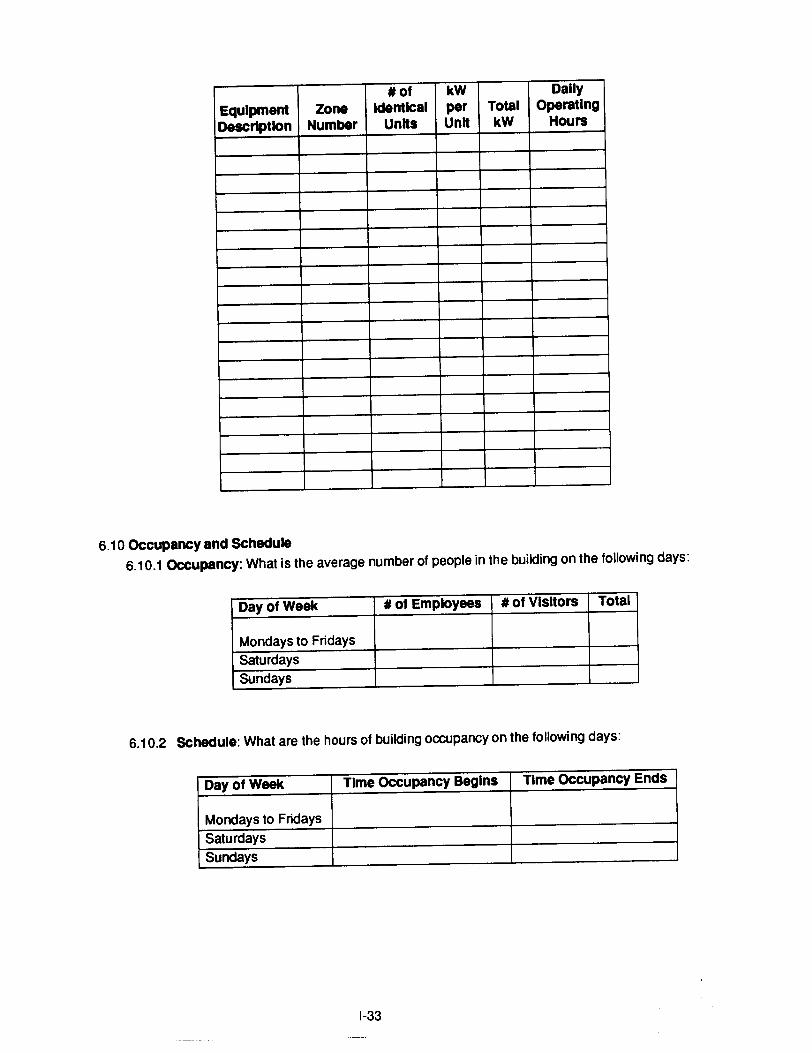
'of kW DallyEquipment Zone Identical per Total OperatingDescription Number Units Unit kW Hours
6.10 OCcupancy and SChedule
6.10.1 OCCupancy: What is the average number of people in the bUilding on the following days:
Day of Week • of Employees • of Visitors Total
Mondays to FridaysSaturdaysSundays
6.10.2 SChedule: What are the hours of building occupancy on the following days:
Day of Week Time OCcupancy Begins Time OCcupancy Ends
Mondays to FridaysSaturdaysSundays
1-33
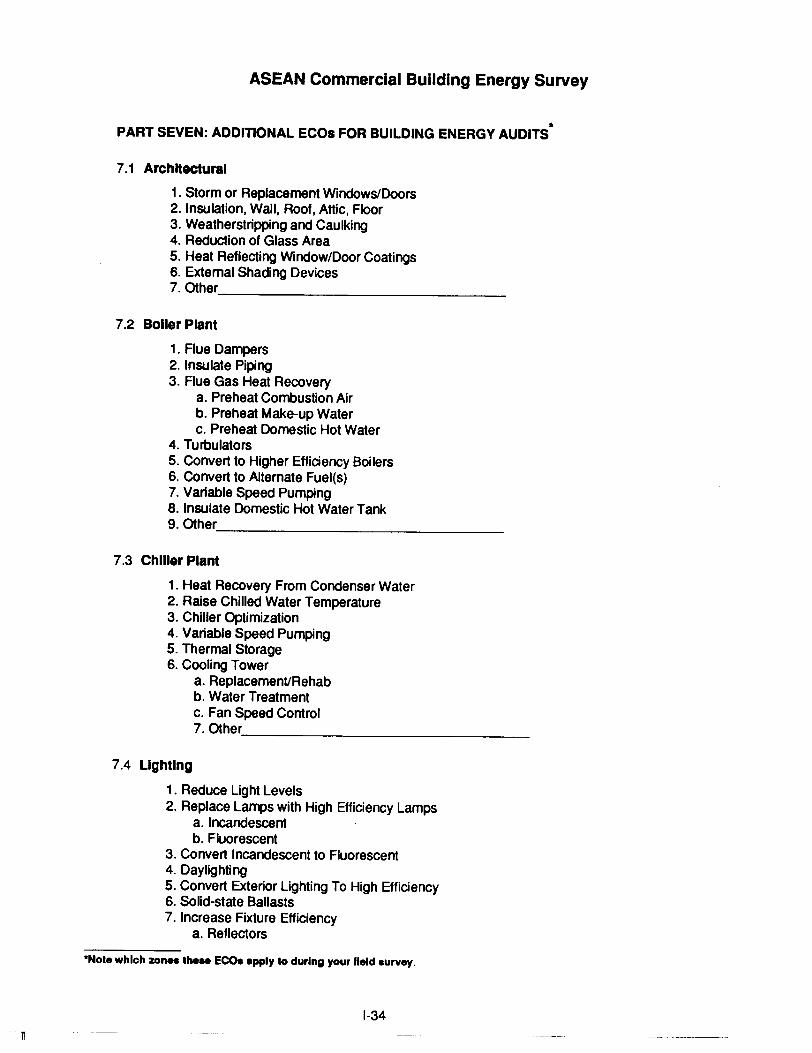
If
ASEAN Commercial BUilding Energy Survey
*PART SEVEN: ADDITIONAL ECOs FOR BUILDING ENERGY AUDITS
7.1 Archh8Ctural
1. Storm or Replacement Windows/Doors2. Insulation, Wall, Roof, Attic, Floor3. Weatherstripping and Caulking4. Reduction of Glass Area5. Heat Reflecting Window/Door Coatings6. External Shading Devices7. Other _
7.2 Boller Plant
1. Flue Dampers2. Insulate Piping3. Flue Gas Heat Recovery
a. Preheat Combustion Airb. Preheat Make-up Waterc. Preheat Domestic Hot Water
4. Turbulators5. Convert to Higher Efficiency Boilers6. Convert to Alternate Fuel(s)7. Variable Speed Pumping8. Insulate Domestic Hot Water Tank9. Other _
7.3 Chiller Plant
1. Heat Recovery From Condenser Water2. Raise Chilled Water Temperature3. Chiller Optimization4. Variable Speed Pumping5. Thermal Storage6. Cooling Tower
a. ReplacemenVRehabb. Water Treatmentc. Fan Speed Control7. Other _
7.4 Lighting
1. Reduce Light Levels2. Replace La/1l>s with High Efficiency Lamps
a. Incandescentb. Fluorescent
3. Convert Incandescent to Fluorescent4. Daylighting5. Convert Exterior Lighting To High Efficiency6. Solid-state Ballasts7. Increase Fixture Efficiency
a. Reflectors
·Notewhlch zones the.. ECOa apply to during your field survey.
1-34
b. Lenses/Louvers8. Controls
a. Local Switchingb. OCcupancy Sensorsc. Automated SChedule
9. Other _
7.5 Air Handling Unit Systems
1. Convert Constant Volume To Variable Volume2. Insulate Ductwork3. Reduce System CFM4. Heat WheelS/Pipes or Run Around Loops for Cool Recovery5. Return Air Recirculation6. Reduce Make-up and/or Exhaust CFM7. Supply/Exhaust Fan Timers8. Isolate 24 Hours Areas
a. Package Systemsb. System Revisions
9. Other _
7.6 HVAC Controls
1. Schedule Start/Stop Times2. Optimized Start/Stop Times3. Economizer Cycle4. Mixed Air Control5. NighVWeekend Set Up6. Discharge Temperature7. Central Energy Management Control System8. Cycle Fan System From Space Temperature9. Other _
7.7 Electrical
1. Replace Low Efficiency Motors with High Efficiency Motors2. Interlock Exhaust Fans with Lighting3. Other _
7.8 Laundry
1. Dedicated System(s) for Laundry2. Waste Water Heat Recovery3. Alternate Fuels4. Other _
7.9 Kitchen
1. Exhaust Fan Interlock with Operation2. "Make-up" Air3. Other _
7.10 SOlar
1. Photovoltaic2. Domestic Hot Water Systems3. Space Cooling4. Other, _
1-35
---.
7.11 Staffing
1. Integrate Housekeeping Functions with Operational Functions2. Revise Building Usage During Periods of Partial OCCUpancy3. Other _
7.12 Other
Please indicate any other significant ECOs you may recommend that are not listed above.
1-36
Related Documents