EY Global Financial Services Institute July 2015 | Volume 3 – Issue 2 The Journal of Financial Perspectives Article: Analyzing bank performance – linking RoE, RoA and RAROC: U.S. commercial banks 1992–2014

Welcome message from author
This document is posted to help you gain knowledge. Please leave a comment to let me know what you think about it! Share it to your friends and learn new things together.
Transcript

EY Global Financial Services Institute July 2015 | Volume 3 – Issue 2
The Journal of Financial Perspectives
Article:Analyzing bank performance – linking RoE, RoA and RAROC: U.S. commercial banks 1992–2014

Analyzing bank performance – linking RoE, RoA and RAROC: U.S. commercial banks 1992–20141
Pieter KlaassenGroup Risk Control, UBS
Idzard van EeghenChief Risk Officer, Royal Bank of Scotland N.V.
AbstractWe introduce a new performance scheme for banks, inspired by the Du Pont scheme for corporates, which clarifies the relationship between return on equity (RoE), risk-adjusted return on capital (RAROC) and return on assets (RoA). The scheme highlights how common financial ratios risk factors influence the development of RoA, RAROC and RoE. The scheme can be applied by managers, analysts and regulators to analyze the performance of an individual bank, as well as the performance of the banking sector as a whole. In addition, it can be used by bank managers to set coherent targets for various key financial ratios that tend to be managed separately within a bank, to achieve a target RoE, RAROC and RoA. We illustrate our performance scheme by applying it to analyze the main drivers behind the development of the performance of the U.S. commercial banking sector during the past 23 years.
1
1 The views expressed in this article are those of the authors and not necessarily of their employers.

Analyzing bank performance – linking RoE, RoA and RAROC: U.S. commercial banks 1992–2014
1. IntroductionHow can banks generate healthy returns? This question occupies the minds of many bank managers, regulators and analysts, as banks have to increase their capital at the same time as they aim to improve their returns on capital. The commonly used performance metric to measure bank performance is return on equity (RoE). However, this metric completely ignores risk. Since returns can be boosted by taking more risk, at least in the short run, this is a serious limitation. A performance measure that takes risk into account is the risk-adjusted return on capital (RAROC), but this performance metric has not captured the imagination of many bank managers and analysts yet. This is probably due to the lack of availability and comparability of this metric across the industry, and the lack of clarity on how such a metric relates to returns for shareholders.
More generally, a problem with bank performance metrics is the missing link with traditional financial variables and ratios that drive performance. For industrial firms, the Du Pont scheme establishes this link by decomposing RoE into business factors that drive performance, including operating margin, capital velocity and leverage. Analyzing these factors helps us understand the difference between a firm’s RoE and that of its peers, and how performance could potentially be improved. Similar schemes to analyze bank performance [Grier (2007), European Central Bank (ECB) (2010), McGowan and Stambach (2012)] typically disregard important factors that reflect risk-taking, regulatory capital requirements and the cyclical nature of bank performance.
In this article, we introduce a new performance scheme for banks, inspired by the Du Pont scheme for industrial firms, which clarifies the relationship between return on assets (RoA), RoE and RAROC. In contrast to existing performance schemes, our performance scheme clarifies how relevant risk factors influence RoE. The scheme can be used by analysts and regulators to analyze the performance of an individual bank, as well as the performance of the industry. It can also be used by bank management to set consistent targets for various key financial ratios that tend to be managed by different managers within a bank to achieve a target RoE, RAROC and RoA.
2

Analyzing bank performance – linking RoE, RoA and RAROC: U.S. commercial banks 1992–2014
In the next section, we introduce the relevant performance metrics and our performance scheme for banks, and use them to analyze bank performance in the U.S. between 1992 and 2014. For the application of our performance scheme to the U.S. banking sector, we take the viewpoint of a commercial bank. We will subsequently comment on how the scheme could be modified to reflect other bank activities, such as investment banking or asset management.
2. RoE, RAROC and risk-based required capitalThe key performance metric that most analysts use is RoE. This is defined as profit after tax (PAT) divided by equity. Since equity analysts are interested in shareholder returns, equity is typically taken to be the average common shareholder equity over the reporting period. We use the book value of equity in our performance scheme as this is generally available, although the market value of equity is preferable from a theoretical point of view.
RAROC is defined as:
RAROC adjusts a bank’s return for risks in two ways. First, the numerator incorporates the expected loss associated with lending, rather than the actual loan impairments that are included in the income statement of the bank. Expected losses are calculated on the basis of long-term average default rates and recovery rates associated with the bank’s actual loan portfolio. It thus represents a long-term view on loan losses. RAROC thus represents a view on profitability that is cycle neutral by considering long-term average credit losses instead of actual loan impairments that are influenced by the phase of the economy.
Second, it relates the adjusted income as measured in the numerator to risk-based required capital (RRC). RRC is a measure of how much capital a bank needs as a consequence of the risks it is exposed to, as opposed to the amount of available capital.
3

Analyzing bank performance – linking RoE, RoA and RAROC: U.S. commercial banks 1992–2014
Risk is high when the potential for large unexpected losses is high, and the bank then needs more capital to safeguard itself against the risk of insolvency. Regulators require that banks hold more capital when their risks increase. With Basel 2, 2.5 and 3, these regulations have become increasingly more detailed and risk sensitive. However, the Basel regulations do not capture all risks, and some calculated risks are simplifications of the real risks. Hence, a number of banks have developed internal models to measure their risks more accurately and comprehensively [Klaassen and Van Eeghen (2009)]. These internal capital measures are referred to as “economic capital.” Ideally, these internal capital measures should be used in RAROC calculations. However, they are not always disclosed; and when disclosed, a comparison between banks is not always possible. Analysts, therefore, often have to work with required or available regulatory capital as (proxy) measures for RRC.
RAROC is used to assess whether a bank’s returns provide sufficient compensation for the risks that it is exposed to. RAROC is also used to assess and compare the performance of different business units within a bank that allocates RRC to business units on the basis of their contribution to the bank’s overall RRC.
3. A performance scheme for banksAn important feature of a good performance scheme is that the performance can be imputed to underlying factors that can be managed by the institution, and that are coherently related to each other (i.e., no double counts or gaps).
We distinguish three stages in our performance scheme:
1. Calculation of RoA2. Derivation of RAROC from RoA3. Derivation of RoE from RAROC
The graphical form of the scheme is presented in Figure 1.
4

Analyzing bank performance – linking RoE, RoA and RAROC: U.S. commercial banks 1992–2014
5
Asset productivity
R/EA
Asset efficiency
EA/TA
TaxefficiencyPAT/PBT
ROAPBTI/EA
(PBTI-EL)/EA
RAROC(PBTI-EL)
/RRCPBT/RRC RoE
(1 – C/R)Cost-
efficiency
EL/EAAssetquality
TA/RRCRisk-normed
leverage
(Imp – EL)/RRC
Unexpected loss
RRC/EquityCapital buffer
X
X
X
X
X– –
Figure 1: The performance scheme
Note: abbreviations used in the performance scheme: R (revenues), C (costs), EA (earning assets), PBTI (profit before taxes and interest (= R — C)), RoA (return on assets), EL (expected loss), TA (total assets), RRC (risk-required capital), RAROC (risk-adjusted return on capital), Imp (impairment), UL (unexpected loss (= Imp — EL)), PBT (profit before tax), PAT (profit after tax), Equity (shareholder equity) and RoE (return on equity).

Analyzing bank performance – linking RoE, RoA and RAROC: U.S. commercial banks 1992–2014
The three key performance metrics are in formula form:
RoA is primarily determined by the bank’s choice of business activities and cost-efficiency, since the factors that determine the RoA are:
• Gross return on assets (R/EA): earning assets are the assets that contribute directly to revenues. Non-earning assets include intangible assets, goodwill, tax claims and other non-interest bearing claims. The ratio reflects the bank’s asset productivity and is higher for activities with little price competition, or that are more risky (high revenues being compensation for the risk). The ratio will also be higher if the bank generates significant revenues from activities that do not contribute (materially) to earning assets, such as transaction services and asset management.
• Cost/income (C/R): a lower ratio implies that fewer costs need to be made to generate a dollar of revenues. The ratio reflects the bank’s cost-efficiency.
RAROC represents the return on risk-based required capital, with the return based on expected credit losses, i.e., ignoring unexpected credit losses that are of a cyclical nature. The RoA is an important driver of the RAROC. Other factors are:
• Expected loss as a percentage of earning assets (EL/EA): reflects the asset quality of the bank. A high ratio indicates that the bank is active in lending to debtors that have a high risk of default (e.g., credit cards and subprime lending). However, we note that this ratio only provides an indication of the credit quality of assets that are accounted for as held-to-maturity. For assets that are accounted for at fair value, such as assets in the trading book, the expected loss is reflected in the fair value already. Hence, an increase of assets that are accounted for at fair value may lead to a decrease in the EL/EA ratio without a change in asset quality.
6

Analyzing bank performance – linking RoE, RoA and RAROC: U.S. commercial banks 1992–2014
7
• Earning assets as a percentage of total assets (EA/TA): is an indicator of a bank’s efficient use of assets. If a bank has many non-earning assets the ratio would fall and form a drag on its RAROC.
• Risk-normed leverage (TA/RRC): indicates to what extent the assets of a firm should be funded with capital, given the risk profile of the assets. In other words, how much leverage a firm can use. This ratio is lower the more risky the assets are, since risky loans require more capital. This leverage ratio is a normative ratio, because it is calculated on the basis of how much capital is required, not how much capital a bank actually has.
RAROC increases when (ceteris paribus) RoA increases, when asset quality improves or when risk-normed leverage increases. Optimizing RAROC may give rise to some complex trade-offs. For example, if a bank wants to increase its RAROC by expanding its high-risk loan portfolio and thereby its RoA, then such an expansion will increase its EL and decrease its risk-normed leverage, because required capital will increase. The key question will be whether the increase in RoA sufficiently compensates for the higher EL and lower acceptable leverage. A number of sophisticated banks have provided their business and risk management units with RAROC-tools to aid them in finding the right balance between risk and return.
The final step is to derive RoE from RAROC. This is accomplished by adding three more factors to the equation:
Unexpected losses (UL) as a percentage of RRC (impairments — EL)/RRC: if impairments are higher than expected losses, this constitutes an unexpected loss, which reduces RoE. Impairments are typically higher than EL in an economic downturn, and lower than EL in good times. As such, this ratio provides an indication of how economic circumstances have affected the bank’s results and RoE.

Analyzing bank performance – linking RoE, RoA and RAROC: U.S. commercial banks 1992–2014
8
• The inverse capital buffer ratio (RRC/equity): holding equity in excess of RRC may reflect the desire of the bank’s management to have a capital buffer on top of RRC. A high capital buffer will decrease leverage and reduce RoE.
• The impact of taxes (PAT/PBT): higher taxes result in a lower ratio and a lower RoE.
It follows that RoE and RAROC are directly and positively related to each other. RoE increases when RAROC increases, but also when the capital buffer decreases and when there are favorable economic circumstances (i.e., when actual impairments are lower than expected losses).
When we consider the entire performance scheme, we can directly see the chain of cause and effect. For example, a lower cost/income ratio will improve RoA and, as a result, improve RAROC and RoE. The risk-normed leverage ratio has an impact on RAROC and, via RAROC, on RoE. The inverse capital buffer ratio only has an impact on RoE.
The performance scheme comprises ratios that are commonly tracked within a bank and relate to specific management actions or choices. In that respect, it is very similar to the Du Pont scheme for industrial firms.
4. Application of the performance scheme: analyzing performance of the U.S. commercial banking sectorAggregated financial data for all commercial banks in the U.S. can be obtained from the website of the Federal Deposit Insurance Company (FDIC; www.fdic.gov). The number of commercial banks included in the FDIC database has decreased gradually between 1992 and 2014, from 11,463 to 5,642, while total assets have more than quadrupled from U.S.$3.5t to U.S.$14.5t. This consolidation trend had started much earlier [see Berger et al. (1995) for a study of the period 1979–94 and Jones and Critchfield (2005) for the period 1984–03].

Analyzing bank performance – linking RoE, RoA and RAROC: U.S. commercial banks 1992–2014
9
Based on the available data, we have made the following assumptions in our analysis:
• Profit after tax is measured as “income before extraordinary items,” thereby excluding “extraordinary gains.”
• Equity equals “total equity capital” and includes (a small amount of) perpetual preferred stock. • RRC is not available in the data, and, therefore, we need to approximate it. We have
set RRC equal to intangible assets plus 8% of risk-weighted assets. Between 1992 and 2014, U.S. banks calculated risk-weighted assets based on Basel I, which has limited risk sensitivity as it only includes credit and market risk and, within credit risk only distinguishes between broad lending categories (sovereigns, corporate, retail mortgages, etc). Hence, the proxy we use for RRC may differ materially from the risk-based capital requirement that banks calculate internally.
• EL to EA in each year equal to the average ratio of impairments to risk-weighted assets over the period 1992–2014 times the ratio of risk-weighted assets to earning assets at the beginning of the year. The ratio thus reflects the long-term average of actual impairments, but varies with the risk weight (and thus riskiness) of assets.

Analyzing bank performance – linking RoE, RoA and RAROC: U.S. commercial banks 1992–2014
10
Figure 2 shows that the expected loss ratio, and thus the risk profile of the credit portfolio, increased between 1994 and 2000, notwithstanding that realized impairments were below their long-term average. After a peak in impairments in 2001–02, associated with the dotcom crisis, the expected loss ratio slightly decreased before increasing again in 2005–06. After the very significant impairments as a result of the financial crisis, the expected loss ratio declined notably as banks took firm action to clean up their balance sheets.
0
0.5%
1.0%
1.5%
2.0%
2.5%
EL/EA
1992
1993
1994
1995
1996
1997
1998
1999
2000
2001
2002
2003
2004
2005
2006
2007
2008
2009
2010
2011
2012
2013
2014
Imp/EA
Figure 2: Expected loss and realized impairments as a percentage of earning assets over the period 1992–2014

Analyzing bank performance – linking RoE, RoA and RAROC: U.S. commercial banks 1992–2014
11
Figure 3: U.S. Treasury yields (10 year constant maturity) and RoE for aggregated U.S. commercial banks over the period 1992–2014
–2%
0
2%
4%
8%
12%
16%
6%
10%
14%
18% RoE
1992
1993
1994
1995
1996
1997
1998
1999
2000
2001
2002
2003
2004
2005
2006
2007
2008
2009
2010
2011
2012
2013
2014
U.S. Treasury yields (10 year)
As Figure 3 shows, RoE for the U.S. banks in aggregate has decreased from about 15% between 1993 and 2006 to below 10% since the financial crisis. In the same period, the yield on 10-year U.S. Treasury securities decreased by approximately 4%, and while the RoE of banks bounced back after the financial crisis, the excess return over U.S. treasuries has not returned fully to pre-crisis levels.
To analyze the causes for the decrease of RoE, we first compare the development of RoE with the development of RAROC during the same period (in Figure 4).
Source: www.federalreserve.gov

Analyzing bank performance – linking RoE, RoA and RAROC: U.S. commercial banks 1992–2014
12
We observe that, up to 2002, RAROC and RoE display a similar pattern, but in the years thereafter, RAROC decreases whereas RoE remains flat. The main reason for this is that the capital buffer decreased, and hence the ratio RRC/equity increased, between 2002 and 2008, which benefited RoE. We observe in the run-up to both the dotcom crisis in 2001–02 and the financial crisis in 2008, that capital buffers are decreasing; after the dotcom crisis, the capital buffer was only partially restored, but after the financial crisis, the capital buffers increased significantly.
–20%
–15%
–10%
–5%
5%
15%
25%
0%
10%
20%
30% 1.4
1.2
1.0
0.8
0.6
0.2
0.0
1992
1993
1994
1995
1996
1997
1998
1999
2000
2001
2002
2003
2004
2005
2006
2007
2008
2009
2010
2011
2012
2013
2014
0.4RoE
RAROC (=(PBTI–EL)/RRC)
–(IMP–EL)/RCC
RRC/Equity (RHS)
Figure 4: RoE and RAROC for aggregated U.S. commercial banks over the period 1992–2014

Analyzing bank performance – linking RoE, RoA and RAROC: U.S. commercial banks 1992–2014
13
While lower capital buffers helped to support RoE, the re-establishment of a capital buffer had the opposite effect.
An additional contributor to the difference between RAROC and RoE is the unexpected loss, which impacts RoE but not RAROC. This is most clearly seen in the large unexpected losses in 2008 to 2010, as a result of which, RoE recovered more slowly than RAROC. We have depicted the impact of the unexpected loss (IMP-EL)/RRC with a negative sign in Figure 4 to clearly show the positive correlation with RoE.
0% 0
2
4
6
8
10
12
14
16
18
5%
15%
25%
10%
20%
30%
1992
1993
1994
1995
1996
1997
1998
1999
2000
2001
2002
2003
2004
2005
2006
2007
2008
2009
2010
2011
2012
2013
2014
RAROC (= (PBTI – EL)/RRC)
RoA (= PBTI/EA)
TA/RRC (RHS)
Figure 5: RAROC and RoA for aggregated U.S. commercial banks over the period 1992–2014

Analyzing bank performance – linking RoE, RoA and RAROC: U.S. commercial banks 1992–2014
14
To obtain additional insight into the drivers of the changes in RAROC over time (and implicitly also RoE), Figure 5 depicts the development of the main individual components influencing RAROC — RoA and the risk-normed leverage ratio TA/RRC.
Figure 5 shows that the risk-normed leverage gradually decreased until 2007, implying that banks were taking more risks. Until 2002, the RoA increased, suggesting that the higher risks were also reflected in higher returns. However, between 2002 and 2007, RoA and risk-normed leverage both decreased, resulting in a significant drop of the RAROC. It was only by reducing their capital buffer that banks could maintain their RoE, as was shown in Figure 4.
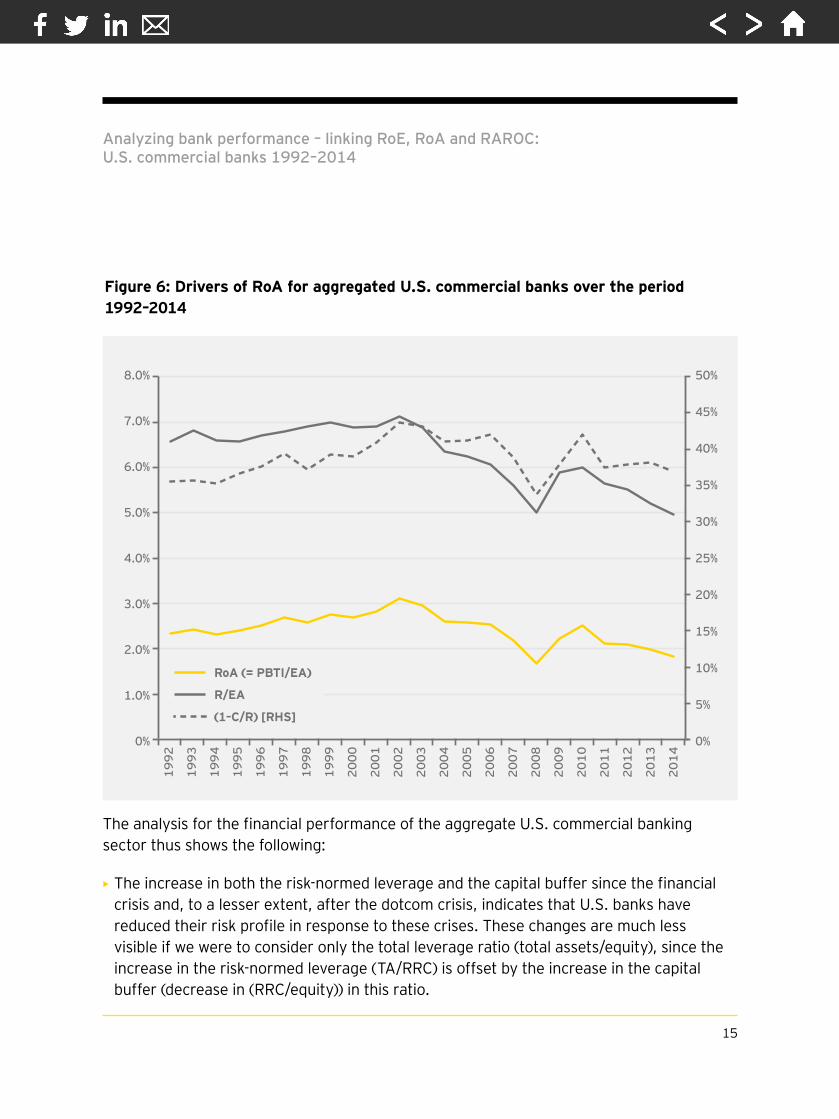
Finally, we analyze, in Figure 6, the drivers of the changes in RoA.
As Figure 6 shows, the RoA increased until 2002, mainly due to higher cost-efficiency (1 – C/R). In the period thereafter, lower revenues (R/EA) started to reduce RoA, but RoA really fell sharply during the financial crisis, as a result of large trading losses that have been accounted for in revenues, and thus depressed both the R/EA and (1 – C/R) ratios. After the financial crisis, when trading losses had ceased, RoA bounced back but, from 2010 onward, RoA fell again as the pressure on revenues caused a continuation of its downward trend. Moreover, the cost-efficiency did not return to pre-crisis levels, notwithstanding various cost reductions by banks; litigation costs related to the financial crisis proved to be very significant [Chauduri (2013), Lloyd (2013)]. These litigation costs materialize with a considerable time lag and it may, therefore, take some time before the cost-efficiency improves again.
Analyzing bank performance – linking RoE, RoA and RAROC: U.S. commercial banks 1992–2014
15
The analysis for the financial performance of the aggregate U.S. commercial banking sector thus shows the following:
• The increase in both the risk-normed leverage and the capital buffer since the financial crisis and, to a lesser extent, after the dotcom crisis, indicates that U.S. banks have reduced their risk profile in response to these crises. These changes are much less visible if we were to consider only the total leverage ratio (total assets/equity), since the increase in the risk-normed leverage (TA/RRC) is offset by the increase in the capital buffer (decrease in (RRC/equity)) in this ratio.
0% 0%
5%
10%
15%
20%
25%
30%
35%
40%
50%
2.0%
5.0%
7.0%
4.0%
6.0%
8.0%
1992
1993
1994
1995
1996
1997
1998
1999
2000
2001
2002
2003
2004
2005
2006
2007
2008
2009
2010
2011
2012
2013
2014
1.0%
3.0%
45%
RoA (= PBTI/EA)
R/EA
(1–C/R) [RHS]
Figure 6: Drivers of RoA for aggregated U.S. commercial banks over the period 1992–2014

Analyzing bank performance – linking RoE, RoA and RAROC: U.S. commercial banks 1992–2014
16
• RoA has been under pressure since the financial crisis due to lower returns on earning assets, thereby negatively impacting RAROC and RoE. The lower return on earning assets appears to be a global phenomenon, and is also observed in various European banking markets where the decrease, in fact, started earlier and is much more pronounced [see for example Lusignani and Onado (2014), Van Eeghen and Klaassen (2013)].
• The increase in RoE since the financial crisis is mainly caused by the fact that credit losses have been below long-term average losses, but the underlying trend, as reflected in a lower RAROC, signals fundamental performance challenges.
EA/TA91.48%
PAT/PBT69.71%
PBTI/EA1.83%
(PBTI–EL)/EA
1.23%
R/EA4.95%
(PBTI–EL)/RRC
13.82%
RAROCRoA
PBTI/RRC18.16%
RoE9.20%
(1 – C/R)36.98%
EL/EA0.60%
TA/RRC12.30
(IMP-EL)/RRC
–4.33%
RRC/Equity0.73
X
X
X
X
X– –
Figure 7: Performance scheme for the aggregate U.S. commercial banks for 2014
Analyzing bank performance – linking RoE, RoA and RAROC: U.S. commercial banks 1992–2014
17
The conclusion is, therefore, sobering: if the decreasing trend of R/EA cannot be stopped, and increasing leverage is ruled out by regulators, then improving cost-efficiency is the only route open to banks to improve returns. Nevertheless, the challenges for U.S. banks pale in comparison with those of European banks, whose profitability has suffered by a much greater degree after the financial crisis [Deutsche Bank Research (2013)].
5. Using the performance scheme for scenario analysis and target settingThe presented performance scheme enables a structured analysis of the main drivers behind the RoE, RAROC and RoA performance metrics and their interrelationships. In addition, it allows for a direct evaluation of the impact of a change in a financial ratio in one of the branches in the performance scheme on RoA, RAROC and/or RoE. With a target RoE in mind, it can, therefore, be used to determine target levels for the individual financial ratios that contribute to the RoE.
Figure 7 provides the performance scheme for the aggregate U.S. commercial banks for 2014. For banks RAROC and RoE in 2014 were, respectively, 13.82% and 9.20%. On the one hand, RoE had the benefit of a tail wind in 2014, as loan impairments were significantly below their estimated long-term expected value ((Imp – EL)/RRC = – 4.33%). On the other hand, the relatively large capital buffer (represented by the ratio RRC/equity being significantly below 1) depressed the RoE.

Analyzing bank performance – linking RoE, RoA and RAROC: U.S. commercial banks 1992–2014
18
We will now analyze various scenarios. As a first illustration, we evaluate the impact of higher RRC (triggered, for example, by new insights and refinement of internal risk models or, if based on RWA, an increase in RWA), while taking a long-term view on credit losses. In this scenario, we make the following adjustments to the scheme: unexpected credit losses are set to zero and we increase the percentage with which we multiply RWA from 8% to 10% to obtain a higher risk-based required capital. The resulting performance scheme is presented in Figure 8 (changes from the actual situation are highlighted in red).
Figure 8: Resulting performance scheme – zero unexpected credit losses and increased RRC
EA/TA91.48%
PAT/PBT69.71%
PBTI/EA1.83%
(PBTI–EL)/EA
1.23%
R/EA4.95%
(PBTI–EL)/RRC
11.77%
RAROCRoA
PBT/RRC11.77%
RoE5.97%
(1 – C/R)36.98%
EL/EA0.60%
TA/RRC10.48
(IMP–EL)/RRC0.00%
RRC/Equity0.73
X
X
X
X
X– –
Analyzing bank performance – linking RoE, RoA and RAROC: U.S. commercial banks 1992–2014
19
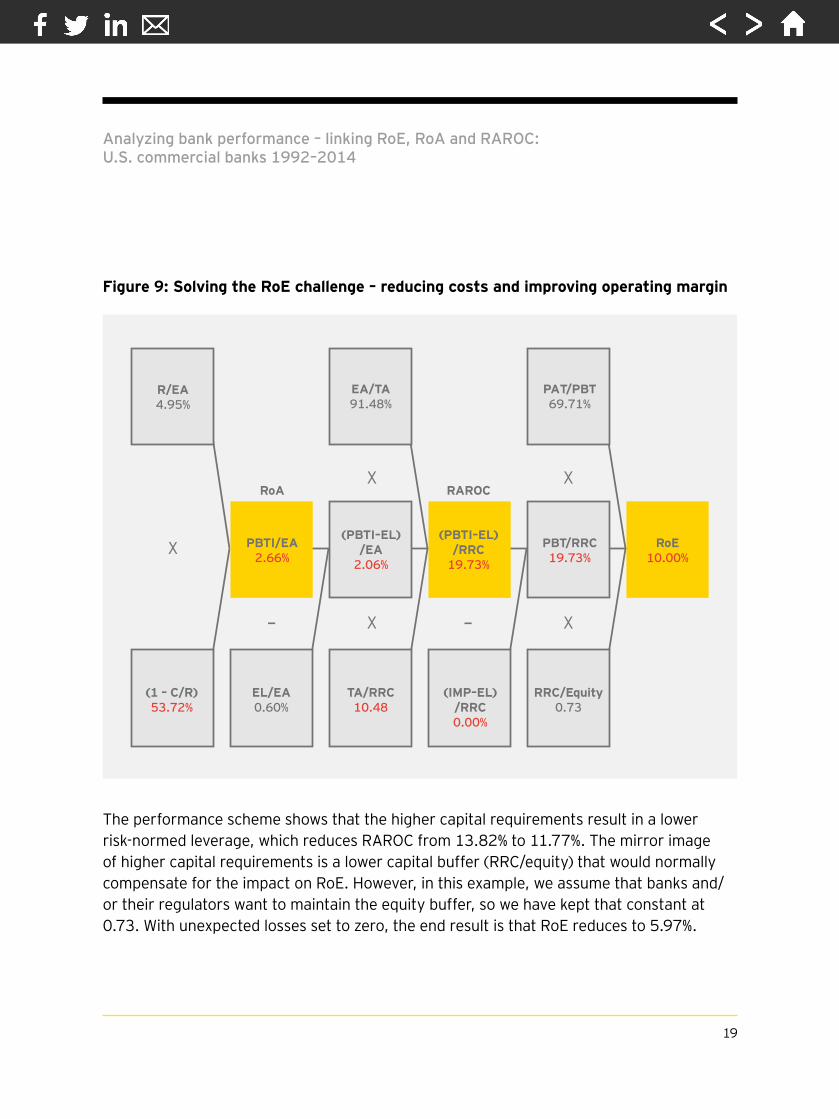
The performance scheme shows that the higher capital requirements result in a lower risk-normed leverage, which reduces RAROC from 13.82% to 11.77%. The mirror image of higher capital requirements is a lower capital buffer (RRC/equity) that would normally compensate for the impact on RoE. However, in this example, we assume that banks and/or their regulators want to maintain the equity buffer, so we have kept that constant at 0.73. With unexpected losses set to zero, the end result is that RoE reduces to 5.97%.
Figure 9: Solving the RoE challenge – reducing costs and improving operating margin
EA/TA91.48%
PAT/PBT69.71%
PBTI/EA2.66%
(PBTI–EL)/EA
2.06%
R/EA4.95%
(PBTI–EL)/RRC
19.73%
RAROCRoA
PBT/RRC19.73%
RoE10.00%
(1 – C/R)53.72%
EL/EA0.60%
TA/RRC10.48
(IMP–EL)/RRC0.00%
RRC/Equity0.73
X
X
X
X
X– –
Analyzing bank performance – linking RoE, RoA and RAROC: U.S. commercial banks 1992–2014
20
In case management aspires to achieve a RoE of, say, 10%, what action can be taken to achieve this? Various options exist, ranging from seeking assets with higher returns, reducing costs, decreasing non-earning assets and lowering taxes. In Figure 9, we “solve” the problem by reducing costs and improving the operating margin from 38.18% to 53.72%. This margin is approximately 10% higher than the best margin achieved by U.S. commercial banks since 1992, a veritable challenge.
In reality, individual banks may need to critically evaluate their chosen markets, business activities and operating model to be able to achieve a significant improvement of RoE. This will likely affect most, if not all, ratios in our scheme, instead of just the cost-efficiency that we have used in the illustration. The necessary changes in ratios that are found as a result of such an evaluation can subsequently be used to set performance targets for separate areas in the bank.
6. General use of the performance schemeThe above analysis can be performed at an industry level and at the level of an individual organization, or even business unit. For a bank performance scheme to be of practical value, its key driving factors must be intuitive, actionable and risk sensitive. In the presented scheme, the factors are well known within the industry and responsibilities can be assigned fairly easily. For example, managing the capital buffer is typically the responsibility of the treasury, whereas management of expected (and unexpected) credit losses is the responsibility of portfolio management and/or credit risk management. In many cases, an optimal balance between two or more factors needs to be found; for example, between revenues (R/EA) and risk-normed leverage (TA/RRC), since changing one is likely to lead to an offsetting change in the other(s). Pricing and other tools may be provided to the commercial units to aid them find the optimal balance.
Some factors may be branched out further to deepen the analysis. For example, the ratio R/EA may be split to distinguish between interest and non-interest income. Moreover, for a bank with multiple activities, a separate branch can be introduced in the performance scheme for each activity at the RAROC node. The RoE will then become a weighted average of the RAROC of the various activities, multiplied by the group-wide tax efficiency and capital buffer ratios.

Analyzing bank performance – linking RoE, RoA and RAROC: U.S. commercial banks 1992–2014
21
In our presentation, we have taken the viewpoint of commercial banks. However, the performance scheme can easily be generalized to other types of banks and activities. For example, for asset management, earning assets could be replaced by assets under management. For trading activities, they could be replaced by a measure such as VaR. As such, we believe the performance scheme to be quite versatile to accommodate various situations and organizations.
ConclusionThe presented performance scheme allows bank analysts to analyze the driving factors of a bank’s performance and the relation with (changes in) the risk profile of the bank. The scheme can be applied to individual banks, as well as at the industry level, as we have done in this paper.
The scheme is also relevant for regulators to obtain better insight of the drivers of change in the financial health of the banking industry. Furthermore, new regulations may negatively affect various performance drivers, of which the impact may be better understood by use of the scheme.
Finally, and perhaps most importantly, the presented performance scheme may help a bank’s leadership to formulate a coherent internal risk appetite and set explicit targets for key performance drivers that directly link to the desired shareholder returns. The clarity of the link between performance targets and RoE will help staff to have a clear understanding of what is being expected from them and why. Such clarity will also contribute to a convincing story for investors. The fact that risk appetite, in the form of asset quality and risk-normed leverage, is an explicit driver of RoE, should furthermore give comfort to bank regulators and depositors. The performance scheme thus provides clear cues to all stakeholders on how banks can generate healthy returns again.

Analyzing bank performance – linking RoE, RoA and RAROC: U.S. commercial banks 1992–2014
ReferencesBerger, A. N., A. K. Kashyap and J. M. Scalise, 1995, “The transformation of the U.S. banking industry: what a long, strange trip it’s been,” Brookings Papers on Economic Activity 2, 54–219Chauduri, S., 2013, “U.S. banks’ legal tabs is poised to rise, new estimates for crisis-era settlements total $107 billion or more,” Wall Street Journal, 28 OctoberDeutsche Bank Research, 2013, “Bank performance in the US and Europe — an ocean apart,” Current issues in global financial markets, September 26European Central Bank, 2010, “Beyond ROE — how to measure bank performance,” SeptemberGrier, W. A., 2007, “Credit analysis of financial institutions,” 2nd edition, Euromoney Institutional Investor Plc.Jones, K. D., and T. Critchfield, 2005, “Consolidation in the U.S. banking industry: is the ‘long, strange trip’ about to end?”, FDIC Banking Review 17:4Klaassen, P., and I. L. van Eeghen, 2009, “Economic capital: how it works and what every manager needs to know,” ElsevierLim, A., 2010, “The Basel III game changer,” Matrix Corporate Capital LLP, 19 January, www.scribd.comLloyd, R., 2013, “Hunting titans, an insight special on banking litigation,” Legal Business, December 2013/January 2014Lusignani G., and M. Onado, 2014, “A long-term approach to Italian banks’ profitability: paradise lost?,” The Journal of Financial Perspectives 2:1, 129–154McGowan, C. B., and A. R. Stambach, 2012, “Using disaggregated return on assets to conduct a financial analysis of a commercial bank using an extension of the Du Pont system of financial analysis,” Accounting and Finance Research 1:1, 152Van Eeghen, I. L., and P. Klaassen, 2013, “De solvabiliteit en rentabiliteit van Nederlandse Banken,” Economisch Statistische Berichten, May
22

Editorial
Special Advisory EditorsBen GolubBlackRockAnthony NeohBank of ChinaSteve PerryVisa Europe
Antony M. SantomeroThe Wharton SchoolNick SilitchPrudential Financial
Editorial BoardViral V. Acharya New York UniversityJohn Armour University of OxfordPhilip Booth Cass Business School and IEAJosé Manuel CampaIESE Business SchoolKalok Chan Hong Kong University of Science and TechnologyJ. David Cummins Temple UniversityAllen Ferrell Harvard Law SchoolThierry Foucault HEC ParisRoland Füss University of St. GallenGiampaolo Gabbi SDA BocconiBoris Groysberg Harvard Business SchoolScott E. Harrington The Wharton SchoolJun-Koo Kang Nanyang Business School
Takao Kobayashi Aoyama Gakuin UniversityDeborah J. Lucas Massachusetts Institute of TechnologyMassimo Massa INSEADTim Morris University of OxfordPatrice Poncet ESSEC Business SchoolMichael R. Powers Tsinghua UniversityPhilip Rawlings Queen Mary, University of LondonRoberta Romano Yale Law SchoolHato Schmeiser University of St. GallenPeter SwanUniversity of New South WalesMarno Verbeek Erasmus UniversityBernard Yeung National University of Singapore
EditorShahin Shojai EY UAE
Advisory EditorsDai Bedford EY U.K.Shaun Crawford EY U.K.David Gittleson EY U.K.
Michael Inserra EY U.S. Michael Lee EY U.S.Bill Schlich EY U.S.

The EY Global Financial Services Institute brings together world-renowned thought leaders and practitioners from top-tier academic institutions, global financial services firms, public policy organizations and regulators to develop solutions to the most pertinent issues facing the financial services industry.
The Journal of Financial Perspectives aims to become the medium of choice for senior financial services executives from banking and capital markets, wealth and asset management and insurance, as well as academics and policymakers who wish to keep abreast of the latest ideas from some of the world’s foremost thought leaders in financial services. To achieve this objective, a board comprising leading academic scholars and respected financial executives has been established to solicit articles that not only make genuine contributions to the most important topics, but are also practical in their focus. The Journal will be published three times a year.
gfsi.ey.com

About EYEY is a global leader in assurance, tax, transaction and advisory services. The insights and quality services we deliver help build trust and confidence in the capital markets and in economies the world over. We develop outstanding leaders who team to deliver on our promises to all of our stakeholders. In so doing, we play a critical role in building a better working world for our people, for our clients and for our communities.
EY refers to the global organization, and may refer to one or more, of the member firms of Ernst & Young Global Limited, each of which is a separate legal entity. Ernst & Young Global Limited, a UK company limited by guarantee, does not provide services to clients. For more information about our organization, please visit ey.com.
© 2015 EYGM Limited. All Rights Reserved.EYG No. CQ0244
ey.com
The articles, information and reports (the articles) contained within The Journal are generic and represent the views and opinions of their authors. The articles produced by authors external to EY do not necessarily represent the views or opinions of EYGM Limited nor any other member of the global EY organization. The articles produced by EY contain general commentary and do not contain tailored specific advice and should not be regarded as comprehensive or sufficient for making decisions, nor should be used in place of professional advice. Accordingly, neither EYGM Limited nor any other member of the global EY organization accepts responsibility for loss arising from any action taken or not taken by those receiving The Journal.The views of third parties set out in this publication are not necessarily the views of the global EY organization or its member firms. Moreover, they should be seen in the context of the time they were made.
Accredited by the American Economic AssociationISSN 2049-8640
Related Documents