Are There Consistent Grazing Indicators in Drylands? Testing Plant Functional Types of Various Complexity in South Africa’s Grassland and Savanna Biomes Anja Linsta ¨ dter 1,2 *, Ju ¨ rgen Schellberg 2 , Katharina Bru ¨ ser 2 , Cristian A. Moreno Garcı´a 2 , Roelof J. Oomen 2 , Chris C. du Preez 3 , Jan C. Ruppert 1,2 , Frank Ewert 2 1 Range Ecology and Range Management Group, Botanical Institute, University of Cologne, Cologne, Germany, 2 Institute of Crop Science and Resource Conservation, University of Bonn, Bonn, Germany, 3 Department of Soil, Crop and Climate Sciences, University of the Free State, Bloemfontein, Republic of South Africa Abstract Despite our growing knowledge on plants’ functional responses to grazing, there is no consensus if an optimum level of functional aggregation exists for detecting grazing effects in drylands. With a comparative approach we searched for plant functional types (PFTs) with a consistent response to grazing across two areas differing in climatic aridity, situated in South Africa’s grassland and savanna biomes. We aggregated herbaceous species into PFTs, using hierarchical combinations of traits (from single- to three-trait PFTs). Traits relate to life history, growth form and leaf width. We first confirmed that soil and grazing gradients were largely independent from each other, and then searched in each biome for PFTs with a sensitive response to grazing, avoiding confounding with soil conditions. We found no response consistency, but biome-specific optimum aggregation levels. Three-trait PFTs (e.g. broad-leaved perennial grasses) and two-trait PFTs (e.g. perennial grasses) performed best as indicators of grazing effects in the semi-arid grassland and in the arid savanna biome, respectively. Some PFTs increased with grazing pressure in the grassland, but decreased in the savanna. We applied biome- specific grazing indicators to evaluate if differences in grazing management related to land tenure (communal versus freehold) had effects on vegetation. Tenure effects were small, which we mainly attributed to large variability in grazing pressure across farms. We conclude that the striking lack of generalizable PFT responses to grazing is due to a convergence of aridity and grazing effects, and unlikely to be overcome by more refined classification approaches. Hence, PFTs with an opposite response to grazing in the two biomes rather have a unimodal response along a gradient of additive forces of aridity and grazing. The study advocates for hierarchical trait combinations to identify localized indicator sets for grazing effects. Its methodological approach may also be useful for identifying ecological indicators in other ecosystems. Citation: Linsta ¨dter A, Schellberg J, Bru ¨ ser K, Moreno Garcı ´a CA, Oomen RJ, et al. (2014) Are There Consistent Grazing Indicators in Drylands? Testing Plant Functional Types of Various Complexity in South Africa’s Grassland and Savanna Biomes. PLoS ONE 9(8): e104672. doi:10.1371/journal.pone.0104672 Editor: John F. Valentine, Dauphin Island Sea Lab, United States of America Received November 18, 2013; Accepted July 16, 2014; Published August 11, 2014 Copyright: ß 2014 Linsta ¨ dter et al. This is an open-access article distributed under the terms of the Creative Commons Attribution License, which permits unrestricted use, distribution, and reproduction in any medium, provided the original author and source are credited. Funding: This study was funded through the research project FOR 1501 by the German Science Foundation (http://www.dfg.de/en/). AL, JR and JS also acknowledge support by the German Federal Ministry of Education and Research (http://www.bmbf.de/en/) via the ‘Limpopo Living Landscapes’ project within the SPACES programme (grant numbers 01LL1304-C and -D). The funders had no role in study design, data collection and analysis, decision to publish, or preparation of the manuscript. Competing Interests: The authors have declared that no competing interests exist. * Email: [email protected] Introduction Resource availability and disturbances are widely recognized as key drivers of plant community structure and composition [1]. Rangeland vegetation is shaped by recent grazing pressure, together with multiple combinations of land use history and available resources [2,3]. In the case of dryland rangelands, management effects are particularly difficult to detect against the background of a high environmental variability [4,5]. There is a growing need for ecological indicators that provide aggregated information for assessing states and trends of vegeta- tion dynamics [6]. For this purpose, it is crucial to decide on an optimum type and level of aggregation of vegetation characteristics [7]. Plant functional types (PFTs) are a typical example for an aggregation of plant species, and PFTs are frequently applied as indicators for the state of dryland rangelands [8]. PFT classifica- tion is a widely supported method in data analysis to aggregate species and to reveal a consistent response of ecosystems, irrespective of species identities [9]. The underlying rationale is that different species within a PFT share traits that show a similar response to grazing disturbance [10]. Hence, PFTs can be powerful indicators for rangeland condition due to their functional relation to ecosystem processes [11]. A-priori classifications of PFTs have been criticised for neglecting the specific environmental settings and the evolutionary history of the study area [12]. However, individual plant traits are typically highly interrelated, and thus pairs or groups of traits usually co-vary [13]. This complexity of relations among traits can usually and effectively be summarized by aggregating individual traits to one or few key traits that capture a large proportion of variation in vegetation responses to grazing [14]. Life forms [15] and growth forms are early and well-known expression of such correlation among traits [13,16]. They are extensively used to describe functional plant responses to grazing [17,18]. However, despite the vast literature on plant trait and PFT responses to grazing in drylands, there is still no consensus if an PLOS ONE | www.plosone.org 1 August 2014 | Volume 9 | Issue 8 | e104672

Welcome message from author
This document is posted to help you gain knowledge. Please leave a comment to let me know what you think about it! Share it to your friends and learn new things together.
Transcript
Are There Consistent Grazing Indicators in Drylands?Testing Plant Functional Types of Various Complexity inSouth Africa’s Grassland and Savanna BiomesAnja Linstadter1,2*, Jurgen Schellberg2, Katharina Bruser2, Cristian A. Moreno Garcıa2, Roelof J. Oomen2,
Chris C. du Preez3, Jan C. Ruppert1,2, Frank Ewert2
1 Range Ecology and Range Management Group, Botanical Institute, University of Cologne, Cologne, Germany, 2 Institute of Crop Science and Resource Conservation,
University of Bonn, Bonn, Germany, 3 Department of Soil, Crop and Climate Sciences, University of the Free State, Bloemfontein, Republic of South Africa
Abstract
Despite our growing knowledge on plants’ functional responses to grazing, there is no consensus if an optimum level offunctional aggregation exists for detecting grazing effects in drylands. With a comparative approach we searched for plantfunctional types (PFTs) with a consistent response to grazing across two areas differing in climatic aridity, situated in SouthAfrica’s grassland and savanna biomes. We aggregated herbaceous species into PFTs, using hierarchical combinations oftraits (from single- to three-trait PFTs). Traits relate to life history, growth form and leaf width. We first confirmed that soiland grazing gradients were largely independent from each other, and then searched in each biome for PFTs with a sensitiveresponse to grazing, avoiding confounding with soil conditions. We found no response consistency, but biome-specificoptimum aggregation levels. Three-trait PFTs (e.g. broad-leaved perennial grasses) and two-trait PFTs (e.g. perennialgrasses) performed best as indicators of grazing effects in the semi-arid grassland and in the arid savanna biome,respectively. Some PFTs increased with grazing pressure in the grassland, but decreased in the savanna. We applied biome-specific grazing indicators to evaluate if differences in grazing management related to land tenure (communal versusfreehold) had effects on vegetation. Tenure effects were small, which we mainly attributed to large variability in grazingpressure across farms. We conclude that the striking lack of generalizable PFT responses to grazing is due to a convergenceof aridity and grazing effects, and unlikely to be overcome by more refined classification approaches. Hence, PFTs with anopposite response to grazing in the two biomes rather have a unimodal response along a gradient of additive forces ofaridity and grazing. The study advocates for hierarchical trait combinations to identify localized indicator sets for grazingeffects. Its methodological approach may also be useful for identifying ecological indicators in other ecosystems.
Citation: Linstadter A, Schellberg J, Bruser K, Moreno Garcıa CA, Oomen RJ, et al. (2014) Are There Consistent Grazing Indicators in Drylands? Testing PlantFunctional Types of Various Complexity in South Africa’s Grassland and Savanna Biomes. PLoS ONE 9(8): e104672. doi:10.1371/journal.pone.0104672
Editor: John F. Valentine, Dauphin Island Sea Lab, United States of America
Received November 18, 2013; Accepted July 16, 2014; Published August 11, 2014
Copyright: � 2014 Linstadter et al. This is an open-access article distributed under the terms of the Creative Commons Attribution License, which permitsunrestricted use, distribution, and reproduction in any medium, provided the original author and source are credited.
Funding: This study was funded through the research project FOR 1501 by the German Science Foundation (http://www.dfg.de/en/). AL, JR and JS alsoacknowledge support by the German Federal Ministry of Education and Research (http://www.bmbf.de/en/) via the ‘Limpopo Living Landscapes’ project withinthe SPACES programme (grant numbers 01LL1304-C and -D). The funders had no role in study design, data collection and analysis, decision to publish, orpreparation of the manuscript.
Competing Interests: The authors have declared that no competing interests exist.
* Email: [email protected]
Introduction
Resource availability and disturbances are widely recognized as
key drivers of plant community structure and composition [1].
Rangeland vegetation is shaped by recent grazing pressure,
together with multiple combinations of land use history and
available resources [2,3]. In the case of dryland rangelands,
management effects are particularly difficult to detect against the
background of a high environmental variability [4,5].
There is a growing need for ecological indicators that provide
aggregated information for assessing states and trends of vegeta-
tion dynamics [6]. For this purpose, it is crucial to decide on an
optimum type and level of aggregation of vegetation characteristics
[7]. Plant functional types (PFTs) are a typical example for an
aggregation of plant species, and PFTs are frequently applied as
indicators for the state of dryland rangelands [8]. PFT classifica-
tion is a widely supported method in data analysis to aggregate
species and to reveal a consistent response of ecosystems,
irrespective of species identities [9]. The underlying rationale is
that different species within a PFT share traits that show a similar
response to grazing disturbance [10]. Hence, PFTs can be
powerful indicators for rangeland condition due to their functional
relation to ecosystem processes [11].
A-priori classifications of PFTs have been criticised for
neglecting the specific environmental settings and the evolutionary
history of the study area [12]. However, individual plant traits are
typically highly interrelated, and thus pairs or groups of traits
usually co-vary [13]. This complexity of relations among traits can
usually and effectively be summarized by aggregating individual
traits to one or few key traits that capture a large proportion of
variation in vegetation responses to grazing [14]. Life forms [15]
and growth forms are early and well-known expression of such
correlation among traits [13,16]. They are extensively used to
describe functional plant responses to grazing [17,18].
However, despite the vast literature on plant trait and PFT
responses to grazing in drylands, there is still no consensus if an
PLOS ONE | www.plosone.org 1 August 2014 | Volume 9 | Issue 8 | e104672

optimum level of trait aggregation exists for detecting grazing
effects in these ecosystems [14,19]. This is particularly true for
transferring grazing responses to sites with different climatic and/
or edaphic aridity, and for upscaling from the plant community to
the biome level and beyond. To address plant responses to
grazing, Dıaz et al. [20] propose life form, life history (annual
versus perennial), plant height and architecture as a good trait set
to define PFTs. As a minimum set for herbaceous plants they
suggest life history and height or habit. For the more elaborated
climate-grazing category of ‘dryland environments with a long
evolutionary history of grazing’ (such as Africa’s drylands), they
recommend for herbaceous plants to distinguish between short
and tall graminoid growth forms of C3 or C4 metabolism, and
between forbs of prostrate, erect or tall architecture. However,
these recommendations of Dıaz et al. [20] are sometimes
contradictive as, for example, life history is included in the
minimum trait set, but not in some of the more elaborated climate-
grazing categories. Hence, even these general recommendations
are not consistent with respect to which level of trait aggregation
(or trait sets) should be used in drylands.
In the past decades, dryland rangelands in the Republic of
South Africa (RSA) have undergone profound changes in grazing
management, which in turn triggered changes in plant community
composition [21]. Grazing management itself is substantially
influenced by the form of land ownership (further referred to as
tenure system). Most rangelands are either free-hold, or communal
rangelands [21]. Free-hold, commercial farms (about 70% of all
land used in the RSA) are generally considered to be in good
condition, and, are typically managed using a rotational grazing
system at moderate stocking densities [22]. In contrast, communal
rangeland (about 14% of South Africa’s used land) holds about
half of all livestock in RSA and is often associated with land
degradation as a result of continuous grazing at high stocking
densities. However, the relative extent of rangeland degradation
under freehold compared to communal tenure has been increas-
ingly debated in the past years [23].
In this context, surprisingly little is known about differential
tenure effects along climatic aridity gradients, or across different
biomes. Two of the major rangeland biomes in southern Africa are
grasslands and savannas [24,25]. The vast majority of rangeland
studies has focused on single biomes, most often on the grassland
biome [26–28] followed by the savanna biome [29–31]. A recent
study analysed impacts of heavy grazing on plant species richness
across six South African rangeland biomes [21], but did not
differentiate between land tenure systems. Literature on global,
cross-biome comparisons of vegetation responses to grazing and
variable climate is also increasingly available [4], whereas
investigations on tenure-related management effects across biomes
are still scarce. In particular, cross-biome comparisons have rarely
been done with respect to the functional response of plant
aggregations to grazing at local and tenure system level, and with
respect to possible confounding effects of abiotic site conditions.
Accordingly, the objectives of this study were two-fold. First, we
aimed to identify functional plant aggregations which were good
and consistent grazing indicators across South Africa’s grassland
and savanna biomes. For this purpose, we developed a novel,
standardized approach to quantify how trait-based plant aggrega-
tions of various complexity responded to grazing and to other
environmental conditions. Second, we aimed to assess tenure-
related effects of grazing management on rangeland vegetation
with the aid of these indicators. Even though controlled
experiments usually render the most definitive results as variables
except the treatment are held constant, they are not feasible for
addressing ecological questions at the scale of ecosystems and
landscapes [32]. Hence, we used a comparative field study, which
made use of the prevailing (semi-) natural conditions and their
management-induced variation.
In detail, we addressed the following research questions:
(1) Are soil and grazing gradients independent from each other,
making an identification of grazing indicators principally
possible?
(2) Is there an optimum hierarchical level of functional
aggregation for assessing grazing effects on rangeland
vegetation, shown by a consistent response of PFTs to grazing
across biomes?
(3) Can we detect differences in vegetation state between tenure
systems in the two biomes, and can these differences be clearly
related to grazing effects?
We hypothesized that (1) soil and grazing gradients are largely
independent from each other, that (2) an optimum level of trait
aggregation exists, and that (3) communal farms display stronger
grazing-induced vegetation changes.
Materials and Methods
Study AreasStudy sites were located in South Africa’s Free State province
(grassland biome), and in the Northern Cape (savanna biome;
Figure 1). The two areas greatly differ with respect to climatic
aridity, soil conditions and species pools (for details see Table 1).
Most importantly, the savanna site has an arid climate (mean
annual precipitation 417 mm), while the climate of the grassland
site is semi-arid (mean annual precipitation 572 mm). However,
the grass layer is in both cases dominated by perennial C4 tuft
grasses [33,34]. The land use history of both study areas is
representative for South Africa’s grassland [35] and savanna
biome [36]. In the savanna biome, bush encroachment was
already observed in the study region in the 1870s and is ongoing
until today.
Study Set-Up and Sampling DesignTo address our research questions, we used a cross-biome
comparison with a unified sampling design. Specifically, we
sampled livestock grazing gradients in two major South African
biomes (mainly characterized by different climatic aridity), and
further stratified for grazing management. For this purpose, two
tenure systems were selected in both biomes, farms with
commercial production under freehold tenure (commercial farms,
CF), and farms under communal tenure (CU). Tenure systems
differ with respect to land use history, ownership, access regime,
and herd management such as the timing and frequency of herd
movements (Table 1; for details on land use history see Text S1).
With our sampling design we aimed to maximize detectable effects
of grazing, and to minimize potentially confounding effects of
other environmental conditions. As in other comparative studies of
real-world ecosystems (e.g., [18,21]), we were not able to
completely control for the high environmental variability typical
for drylands. By sampling unburnt sites with similar topography,
lithology and soil type, we made an effort to control for as many
environmental factors as possible (see Text S1 for details).
Ethics StatementNo specific permissions were required for research locations and
activities, as no endangered or protected species were involved,
and as field work was carried out on unprotected private or
communal land. The research area in the grassland biome
Searching for Grazing Indicators in Drylands
PLOS ONE | www.plosone.org 2 August 2014 | Volume 9 | Issue 8 | e104672
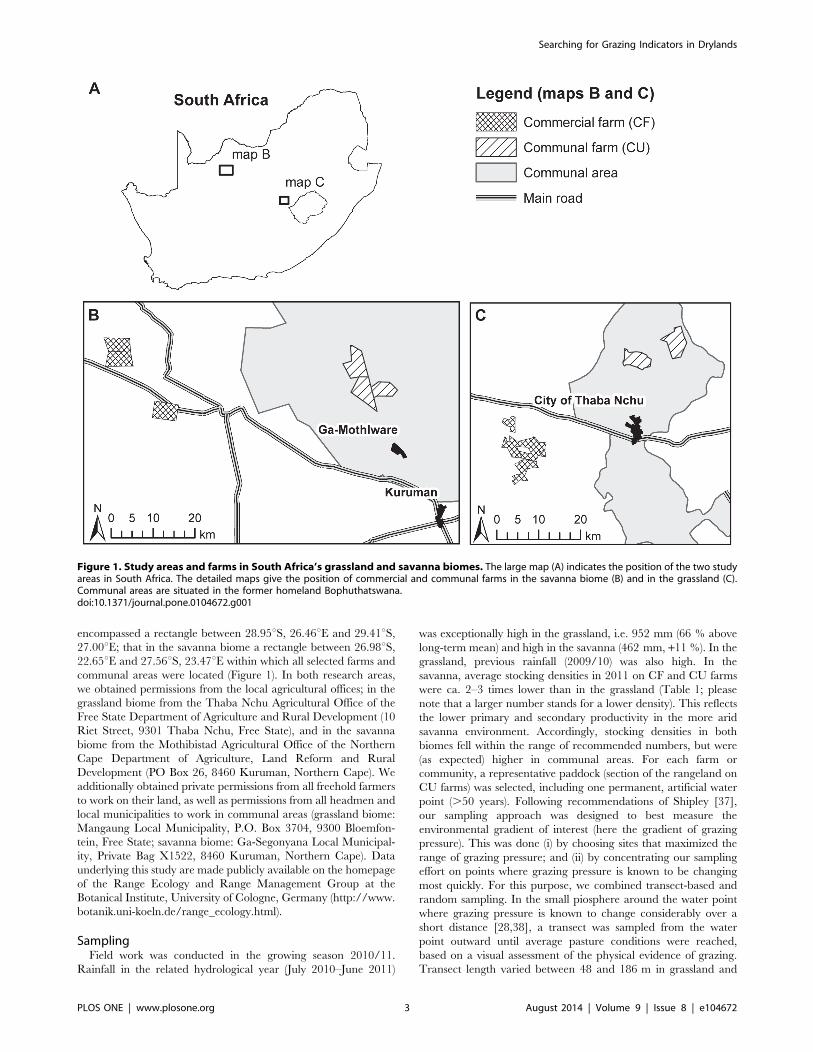
encompassed a rectangle between 28.95uS, 26.46uE and 29.41uS,27.00uE; that in the savanna biome a rectangle between 26.98uS,22.65uE and 27.56uS, 23.47uE within which all selected farms and
communal areas were located (Figure 1). In both research areas,
we obtained permissions from the local agricultural offices; in the
grassland biome from the Thaba Nchu Agricultural Office of the
Free State Department of Agriculture and Rural Development (10
Riet Street, 9301 Thaba Nchu, Free State), and in the savanna
biome from the Mothibistad Agricultural Office of the Northern
Cape Department of Agriculture, Land Reform and Rural
Development (PO Box 26, 8460 Kuruman, Northern Cape). We
additionally obtained private permissions from all freehold farmers
to work on their land, as well as permissions from all headmen and
local municipalities to work in communal areas (grassland biome:
Mangaung Local Municipality, P.O. Box 3704, 9300 Bloemfon-
tein, Free State; savanna biome: Ga-Segonyana Local Municipal-
ity, Private Bag X1522, 8460 Kuruman, Northern Cape). Data
underlying this study are made publicly available on the homepage
of the Range Ecology and Range Management Group at the
Botanical Institute, University of Cologne, Germany (http://www.
botanik.uni-koeln.de/range_ecology.html).
SamplingField work was conducted in the growing season 2010/11.
Rainfall in the related hydrological year (July 2010–June 2011)
was exceptionally high in the grassland, i.e. 952 mm (66 % above
long-term mean) and high in the savanna (462 mm, +11 %). In the
grassland, previous rainfall (2009/10) was also high. In the
savanna, average stocking densities in 2011 on CF and CU farms
were ca. 2–3 times lower than in the grassland (Table 1; please
note that a larger number stands for a lower density). This reflects
the lower primary and secondary productivity in the more arid
savanna environment. Accordingly, stocking densities in both
biomes fell within the range of recommended numbers, but were
(as expected) higher in communal areas. For each farm or
community, a representative paddock (section of the rangeland on
CU farms) was selected, including one permanent, artificial water
point (.50 years). Following recommendations of Shipley [37],
our sampling approach was designed to best measure the
environmental gradient of interest (here the gradient of grazing
pressure). This was done (i) by choosing sites that maximized the
range of grazing pressure; and (ii) by concentrating our sampling
effort on points where grazing pressure is known to be changing
most quickly. For this purpose, we combined transect-based and
random sampling. In the small piosphere around the water point
where grazing pressure is known to change considerably over a
short distance [28,38], a transect was sampled from the water
point outward until average pasture conditions were reached,
based on a visual assessment of the physical evidence of grazing.
Transect length varied between 48 and 186 m in grassland and
Figure 1. Study areas and farms in South Africa’s grassland and savanna biomes. The large map (A) indicates the position of the two studyareas in South Africa. The detailed maps give the position of commercial and communal farms in the savanna biome (B) and in the grassland (C).Communal areas are situated in the former homeland Bophuthatswana.doi:10.1371/journal.pone.0104672.g001
Searching for Grazing Indicators in Drylands
PLOS ONE | www.plosone.org 3 August 2014 | Volume 9 | Issue 8 | e104672

Ta
ble
1.
Bio
me
and
ten
ure
syst
em
char
acte
rist
ics,
and
soil
dif
fere
nce
sb
etw
ee
np
iosp
he
rean
dp
astu
rep
lots
of
the
ten
ure
syst
em
sin
the
two
bio
me
s.
Bio
me
Gra
ssla
nd
Sa
va
nn
a
Te
mp
era
ture
[uC
]
Max
&m
in(J
anu
ary/
July
)3
1/1
5(m
axim
al),
16
/22
(min
imal
)3
2/1
7(m
axim
al),
18
/1(m
inim
al)
An
nu
alp
reci
pit
atio
n
MA
P[m
m]/
CV
[%]
57
2/3
04
17
/42
Rai
ny
seas
on
Sum
me
r(O
cto
be
rto
Ap
ril)
Sum
me
r(S
ep
tem
be
rto
Ap
ril)
Do
min
ant
soil
typ
eLi
xiso
ls(d
ee
pso
ilsw
ith
clay
-en
rich
ed
sub
soil;
on
sed
ime
nts
or
shal
e)
Are
no
sols
(de
ep
aeo
lian
san
ds,
un
de
rlai
nb
yca
lcre
te)
Ve
ge
tati
on
typ
eM
ois
tC
oo
lH
igh
veld
Gra
ssla
nd
(eu
tro
ph
icg
rass
lan
d)
Kal
ahar
iP
lain
sT
ho
rnB
ush
veld
Do
min
ant
pla
nt
spe
cie
sP
ere
nn
ial
C4
tuft
gra
sse
s(Them
edatriandra
do
min
ant
inn
atu
ral
veg
eta
tio
n;Triraphis
andropogonoides,Eragrostissuperba
)G
rass
laye
r:P
ere
nn
ial
C4
tuft
gra
sse
s(e
.g.Stipagrostisuniplumis
),tr
ee
laye
r:Acaciaerioloba,
Boscia
albitrunca
Ran
ge
lan
dm
anag
em
en
t
Re
com
me
nd
ed
sto
ckin
gd
en
sity
[ha
LSU2
1]
5–
10
9–
16
Te
nu
resy
ste
mC
om
me
rcia
l(C
F)C
om
mu
nal
(CU
)C
om
me
rcia
l(C
F)C
om
mu
nal
(CU
)
He
rdco
mp
osi
tio
nC
attl
e,
few
she
ep
Cat
tle
,sh
ee
pC
attl
eC
attl
e,
go
ats,
do
nke
ys
He
rdm
ob
ility
Ro
tati
on
be
twe
en
cam
ps,
wit
hlo
ng
rest
of
win
ter
cam
ps
Co
nti
nu
ou
s,w
ith
dai
lym
ove
me
nts
fro
mse
ttle
me
nt
Pe
rman
en
tro
tati
on
be
twe
en
cam
ps
Co
nti
nu
ou
s,w
ith
dai
lym
ove
me
nts
fro
mse
ttle
me
nt
Sto
ckin
gd
en
sity
[ha
LSU2
1]
5.56
2.4
5.26
1.2
14
.26
7.1
10
.96
3.7
Edap
hic
con
dit
ion
sP
iosp
he
res
Pas
ture
sP
iosp
he
res
Pas
ture
sP
iosp
he
res
Pas
ture
sP
iosp
he
res
Pas
ture
s
San
dco
nte
nt
[%]
43
.36
9.6
ab4
7.86
10
.3a
38
.26
7.9
b4
5.26
12
.2ab
94
.16
1.3
ab9
4.96
2.7
a9
4.06
1.9
ab9
2.96
2.1
b
Silt
con
ten
t[%
]2
8.26
5.7
25
.46
6.9
26
.16
2.2
25
.16
7.7
2.66
1.6
2.06
1.4
2.66
0.8
3.06
1.6
Cla
yco
nte
nt
[%]
27
.76
8.2
ab2
5.76
7.7
a3
4.46
7.9
b2
9.26
14
.2ab
3.16
1.6
a3
.56
1.9
a4
.16
1.1
ac4
.56
0.8
bc
To
tal
nit
rog
en
[gkg
21]
1.2
36
0.3
4a
1.1
06
0.2
3a
1.1
06
0.2
2a
1.0
16
0.2
0b
0.1
66
0.0
7ab
0.1
26
0.0
4a
0.1
96
0.0
7b
0.1
86
0.0
5b
Ava
ilab
lep
ho
sph
oru
s[m
gkg
21]
7.16
6.8
5.36
4.4
4.16
2.1
5.26
3.5
4.76
5.1
a1
.96
0.9
b2
.96
2.1
b2
.56
1.4
b
Clim
ate
dat
a:B
loe
mfo
nte
in(2
9.1
0uS
,2
6.3
0uE
),ca
.3
0–
70
kmd
ista
nce
tog
rass
lan
dsi
tes;
Ku
rum
an(2
7.4
3uS
,2
3.4
5uE
),ca
.3
5–
75
kmd
ista
nce
tosa
van
na
site
s.M
AP
:m
ean
ann
ual
pre
cip
itat
ion
of
hyd
rolo
gic
alye
ars
(Ju
ly–
Jun
e);
CV
:co
eff
icie
nt
of
vari
atio
nfo
rM
AP
.Fo
rb
oth
me
teo
rolo
gic
alst
atio
ns,
on
lyye
ars
wit
ho
ut
dat
ag
aps
we
reu
sed
for
calc
ula
tio
ns;
dat
aso
urc
e:
htt
p:/
/clim
exp
.kn
mi.n
l.B
loe
mfo
nte
ind
ata
19
04
–2
01
1(n
=1
00
),K
uru
man
dat
a1
90
5–
19
97
(n=
62
).So
ilty
pe
sar
eg
ive
nas
WR
Bty
pe
[74
];g
rass
lan
dso
ilsaf
ter
[50
];sa
van
na
soils
afte
r[2
4].
Ve
ge
tati
on
char
acte
rist
ics
of
the
gra
ssla
nd
afte
r[2
5];
sava
nn
a:af
ter
[24
].H
erd
com
po
siti
on
,m
ob
ility
and
farm
-sp
eci
fic
sto
ckin
gd
en
siti
es
for
20
11
we
red
eri
ved
fro
mp
ers
.co
mm
.wit
hfa
rme
rsan
dp
rovi
de
db
yC
.Nau
man
n.P
leas
en
ote
for
sto
ckin
gd
en
sity
that
ala
rge
rn
um
be
rre
fle
cts
alo
we
rd
en
sity
.Ed
aph
icco
nd
itio
ns
are
giv
en
for
the
top
soil
(0–
20
cm)
of
veg
eta
tio
np
lots
;le
tte
rsin
dic
ate
sig
nif
ican
td
iffe
ren
ces
wit
hin
ab
iom
e(T
uke
y’s
HSD
,p,
0.0
5;
stan
dar
diz
ed
dat
a).
do
i:10
.13
71
/jo
urn
al.p
on
e.0
10
46
72
.t0
01
Searching for Grazing Indicators in Drylands
PLOS ONE | www.plosone.org 4 August 2014 | Volume 9 | Issue 8 | e104672
between 180 and 738 m in the savanna. Evenly spaced along each
transect, six vegetation plots of 565 m in the grassland, and
10610 m in the savanna were laid out, with the first five plots
(‘piosphere plots’) in the piosphere, and the sixth plot outside
(‘pasture plot’). We randomly established 9–13 additional pasture
plots on each pasture, limiting sampling to the habitat type of
plains. Minimum distance between plots exceeded twice their side
length. Plant species abundance was assessed on plots by visual
estimates of percentage ground cover. Estimates were done
independently by two to three experienced observers. In total,
213 plots were sampled, 35 and 30 in the piosphere and 86 and 62
pasture plots on grassland and in the savanna, respectively. These
plots were distributed across 5 CF versus 2 CU on grassland and 3
CF versus 3 CU in the savanna.
Soil variables. The proportion of the soil surface covered
with coarse material, i.e. particles .2 mm (Skeleton), was visually
estimated. We collected five topsoil samples per plot (0–20 cm),
and mixed them for a bulk sample. Soil analyses were carried out
on soil fractions,2 mm using standard methods [39]. Particle size
was determined by sieve-pipette method. Soil pH was determined
in a 1:2.5 water suspension. Plant-available phosphorus (Pav) was
measured as extractable (Olsen) P (1 mol dm23 NaHCO3 at pH
8.5) and determined colorimetrically [40]. Exchangeable Ca2+,
K+, Mg+ and Na+, as well as Cation Exchange Capacity (CEC)
were determined by atomic absorption (1 mol dm23 NH4OAc at
pH 7). Extractable micronutrients (Fe2+, Mn2+, Cu2+ and Zn2+)
were determined with the DTPA method [41]. Total carbon (Ctot)
and total nitrogen (Ntot) were analysed by dry combustion with a
CN analyser (NA 1500). As no inorganic C was detectable, total C
was regarded as organic C.
Variables reflecting grazing pressure. Grazing impact on
plots through defoliation and trampling was assessed (i) via a plot’s
distance [m] from the water point, which was expressed as raw
(untransformed) distance. Furthermore, we visually estimated the
ground cover of (ii) moribund biomass (previous year’s standing
dead), (iii) plant litter) and (iv) bare soil, which is the area of soil not
covered by vegetation, litter or skeleton [42]. The increasing
distance from water points is frequently used as a proxy for
decreasing grazing pressure [12,28]. A high proportion of bare soil
and a low cover of litter and moribund biomass indicate high
grazing pressure [42,43]. Further (v), we combined physical
evidence of grazing (trampling, dung, and the removal of standing
biomass) in an expert assessment of recent grazing pressure. Plots
scored from 1 (none) to 9 (extreme grazing pressure). Little (3),
moderate (5) and heavy (7) grazing pressure corresponded to an
estimated removal of standing biomass of 20, 40 and 60%,
respectively [see 44]. Finally (vi), the ground cover of woody plants
was estimated in the savanna to capture the extent of bush
encroachment. Bush encroachment was on several farms clearly
discernable in the field, particularly from the age structure and
density of Acacia mellifera populations, and was included in our
study because it is often the consequence of grazing mismanage-
ment [45].
Data AnalysisWe developed a novel approach to quantify PFTs’ responses to
grazing pressure, which combines a hierarchical definition of trait-
based PFTs with multivariate statistics and model selection
procedures. In the first step (related to question 1), we tested if
local soil and grazing gradients were largely independent from
each other, using data from all plots. In the second step (addressing
question 2), we aggregated the community composition into
relative abundances of plant functional types (PFTs) per plot. PFTs
were defined via three hierarchical levels of trait combinations,
from single- to three-trait PFTs. To evaluate species turnover
within plant communities and to compare PFT responses to
species responses, we also aggregated local community composi-
tion into ordination scores. We then applied two criteria to identify
the indicative potential of PFTs in a certain biome; i.e. if they
exhibited a strong response to grazing pressure (sensitivity), and if
they were little confounded by other ecosystem properties
(specificity). We used data from all plots to capture the full range
of grazing pressure. In a third step (related to question 3), we used
PFTs that were identified in the previous step as good grazing
indicators to assess tenure effects on rangeland vegetation,
comparing effects on piosphere and pasture plots.
Aggregation of Environmental VariablesTo aggregate environmental parameters into composite vari-
ables and to evaluate correlation between grazing and soil
gradients, we performed PCA with varimax rotation. As precision
and units of data varied, we used the correlation matrix of the raw
data [46]. We combined the six parameters reflecting grazing
pressure with 17 soil variables (Table S1) and performed PCA
separately for each biome. Scree-plots were used to assess the
appropriate number of principal components (PC) with eigenval-
ues .1. In each biome, we used a PC with high factor loadings of
parameters reflecting grazing pressure (‘grazing-related PC’) as a
predictor of grazing pressure in subsequent analyses.
Aggregation ProceduresCommunity composition. We aggregated plant community
composition via two alternative ordination procedures: DCA
(CANOCO version 4.5 [47]) and NMDS (PC-ORD version 5
[48]). Analyses were performed with log-transformed species’
cover values. In the savanna, we lumped unidentified taxonomic
groups as ‘annual forbs’ and ‘perennial forbs’. Relative cover of
those groups was always ,5 % (median values 0.1 % and 2.0 %).
For DCA, we used the default settings of CANOCO, but a down-
weighting of rare species was performed. Despite some criticism
with respect to the underlying distance model and for the
approach of detrending, DCA is a standard method for
unconstrained ordination which provides a meaningful scaling of
the ordination space [49]. Note that we refrained from interpret-
ing the second DCA axis due to concerns about interpretability
[49]. For NMDS, we chose Bray–Curtis dissimilarity as a distance
measure [50]; see Text S1 for details.
Plant functional types. We used a hierarchical, trait-based
approach to aggregate species into PFTs. It roughly followed the
methodology proposed by McIntyre et al. [16] for defining PFTs
which are responsive to disturbance. McIntyre et al. [16] identified
different sets of traits as being relevant for each ‘major life-form
group’, and proposed to apply a higher grain of classification for
life-form groups which are ‘locally relevant’ (i.e. occurring).
Following these recommendations, hierarchical levels in our study
were based on the following traits (see Table 2): (i) For single-trait
PFTs, we only considered dormant bud position (life form; [15]);
(ii) for two-trait PFTs, we additionally considered graminoid or
non-graminoid growth form; (iii) for three-trait PFTs, we
additionally considered leaf width, distinguishing narrow-leaved
(,5 mm), broad-leaved (5–10 mm) and very broad-leaved (.
10 mm). This final classification was only performed for annual
and perennial graminoids (hereafter grasses). The main reason for
this was that species from these life-form groups were in both study
areas dominant, and thus ‘locally relevant’ [16]. Functional
relevance of leaf width was another reason: First, leaf width of
grasses (but not of forbs or shrubs) could be used as a proxy for
specific leaf area, which has a high functional relevance for plants’
Searching for Grazing Indicators in Drylands
PLOS ONE | www.plosone.org 5 August 2014 | Volume 9 | Issue 8 | e104672

Ta
ble
2.
Hie
rarc
hic
al,
thre
e-l
eve
lap
pro
ach
for
the
de
fin
itio
no
fp
lan
tfu
nct
ion
alty
pe
s(P
FTs)
bas
ed
on
cate
go
rica
lfu
nct
ion
altr
aits
.
Ag
gre
ga
tio
nle
ve
la
nd
con
sid
ere
dtr
ait
sT
rait
cate
go
rie
sa
nd
resu
ltin
gp
lan
tfu
nct
ion
al
typ
es
Sin
gle
-tra
itP
FTs
(tra
it:
do
rman
tb
ud
po
siti
on
=R
aun
kiæ
r’s
life
form
)
Cat
eg
ori
es
Bu
ds
be
low
gro
un
dB
ud
so
np
ers
iste
nt
sho
ots
,,
50
cmto
gro
un
d
Bu
ds
ato
rn
ear
gro
un
dB
ud
sw
ith
inse
ed
s
%o
fta
xaa
8/2
11
/10
55
/.4
62
6/.
42
PFT
acro
nym
b(G
e)
Ch
HT
PFT
nam
ec
Ge
op
hyt
es
Ch
amae
ph
yte
s(=
shru
bs)
He
mic
ryp
top
hyt
es
(=p
ere
nn
ial
forb
s&
gra
sse
s)T
he
rop
hyt
es
(=an
nu
alp
lan
ts)
Tw
o-t
rait
PFT
s(a
dd
ed
trai
t:g
row
thfo
rm;
for
he
rbac
eo
us
PFT
so
nly
)
Cat
eg
ori
es
Forb
sG
rass
es
Forb
sG
rass
es
Forb
sG
rass
es
%o
fta
xa6
/22
/02
9/.
30
26
/29
20
/.3
25
/9
PFT
acro
nym
(Ge
F)(G
eG
)H
FH
GT
FT
G
PFT
nam
eP
ere
nn
ial
forb
sP
ere
nn
ial
gra
sse
sA
nn
ual
forb
sA
nn
ual
gra
sse
s
Th
ree
-tra
itP
FTs
(ad
de
dtr
ait:
leaf
wid
th;
for
gra
ssP
FTs
on
ly)
Cat
eg
ori
es
Lin
ear
Lan
ceo
late
Ova
teLi
ne
arLa
nce
ola
teO
vate
%o
fta
xa1
1/1
41
3/1
52
/01
/24
/70
/0
PFT
acro
nym
HG
linH
Gla
nH
Go
v(T
Glin
)(T
Gla
n)
(TG
ov)
PFT
nam
eN
arro
w-l
eav
ed
pe
ren
nia
lg
rass
es
Bro
ad-l
eav
ed
pe
ren
nia
lg
rass
es
Ve
ryb
road
-le
ave
dp
ere
nn
ial
gra
sse
s
aT
he
pe
rce
nta
ge
of
pla
nt
spe
cie
sb
elo
ng
ing
toa
cert
ain
PFT
isg
ive
nse
par
ate
lyfo
rth
eg
rass
lan
d/f
or
the
sava
nn
ab
iom
e.
bP
FTac
ron
yms
de
scri
be
the
hie
rarc
hic
alco
mb
inat
ion
of
trai
ts.
For
sin
gle
-tra
itP
FTs,
acro
nym
sar
eb
ase
do
nth
efi
rst
1–
2le
tte
rso
fR
aun
kiæ
r’s
life
form
clas
sifi
cati
on
[15
];fo
rtw
o-t
rait
PFT
s,ac
ron
yms
for
gro
wth
form
are
add
ed
(G=
gra
sse
s,F
=fo
rbs)
;fo
rth
ree
-tra
itP
FTs,
acro
nym
sfo
rle
afw
idth
are
add
ed
(lin
=lin
ear
(nar
row
-le
ave
d),,
5m
m;l
an=
lan
ceo
late
(bro
ad-l
eav
ed
),5
–1
0m
m,o
v=
ova
te(v
ery
bro
ad-l
eav
ed
),.
10
mm
).P
FTs
wh
ich
acro
nym
sar
ein
bra
cke
tsw
ere
no
tin
clu
de
din
furt
he
ran
alys
es
du
eto
the
irlo
wfr
eq
ue
ncy
and
low
rela
tive
abu
nd
ance
on
plo
ts.
cFo
rtw
o-
and
thre
e-t
rait
PFT
s,n
ame
sar
eo
nly
giv
en
ifP
FTs
we
rere
tain
ed
insu
bse
qu
en
tan
alys
es,
atle
ast
ino
ne
bio
me
.d
oi:1
0.1
37
1/j
ou
rnal
.po
ne
.01
04
67
2.t
00
2
Searching for Grazing Indicators in Drylands
PLOS ONE | www.plosone.org 6 August 2014 | Volume 9 | Issue 8 | e104672

resource acquisition and conservation strategies [38,51]. Second –
in contrast to grasses – forb leaf width is not reported to have
functional relevance for disturbance response [16]. To obtain
required trait data, we checked taxonomic and ecological
literature (e.g., [52–54]); see Table S4 for species’ trait values.
In contrast to the original hierarchical approach by McIntyre et
al. [16], we considered trait combinations from all three
hierarchical levels. This rendered 16 potential PFTs (Table 2).
Six PFTs were not used in further analyses due to their low
frequencies and relative abundances (Table 2, PFT acronyms in
brackets). Another two PFTs (Ch: chamaephytes (shrubs) and HG
ov: very broad-leaved perennial grasses) were for the same reason
excluded from the savanna dataset. This left eight PFTs for the
savanna and ten (i.e. two additional ones) for the grassland.
Among the eight PFTs which were shared between biomes, two
were single-trait PFTs (H: hemicryptophytes (perennial grasses and
forbs), and T: therophytes (annuals)); four were two-trait PFTs
corresponding to ‘major life-form groups’ defined by McIntyre et
al. ([16]; see above), and two were three-trait PFTs (HG lin:
narrow-leaved perennial grasses, HG lan: broad-leaved perennial
grasses).
Testing the Response of PFTs to Grazing and SoilConditionsTo identify plant aggregations which were good ecological
indicators for grazing pressure in the two biomes, we used linear
models (LM) with land tenure as categorical and PCA-derived
variables (reflecting grazing pressure and abiotic site conditions) as
linear predictors. Response variables were the relative abundances
of PFTs. For comparison reasons, we also constructed linear
models for the scores of the two NMDS axes, and of the first DCA
axis (reflecting species turnover within plant communities). To
achieve homoscedasticity and normality, PFT data were arcsine-
transformed. Separate models were calculated for each response
variable in each biome. Model simplification was done via a
likelihood ratio test (Type 1 test) of all possible subsets of effects.
We only retained variables that significantly contributed to model
performance at p,0.05.
We cross-checked the results by performing an alternative best-
subset selection based on the Akaike Information Criterion (AIC).
We calculated Delta AIC (DAIC) values for the two alternative
final models, which measures the performance of the best model
(based on the likelihood ratio test) relative to the best AIC-based
final model [55]. We quantified the strength of response to grazing
and to abiotic site conditions via effect sizes (classical Eta-squared,
g2). In each biome, we identified good grazing indicators via two
criteria, (i) a sensitive response to grazing, shown by a significant
contribution of the grazing-related PC to the final LM, and (ii) a
specific response (little confounded by variation in other ecosystem
properties), shown by the largest effects size of the grazing-related
PC in the final LM. Indicators’ response consistency across biomes
was evaluated by comparing their sensitivity, specificity, and
direction of response.
Assessing Land Tenure Effects using PFTs responsive toGrazingIn a final step, we evaluated tenure-related management effects
on rangeland vegetation with the aid of PFTs identified as good
grazing indicators. We used a partially nested, mixed-model
ANOVA design, and included ‘farm’ (nested in tenure and biome)
as a random factor, and the fixed factors ‘tenure’ (CF versus CU),
‘biome’ (grassland versus savanna) and ‘plot type’ (piosphere versus
pasture plots). Response variables were arcsine-transformed
relative abundances of PFTs with a specific response to grazing
at least in one biome. Homogeneous groups of factor combina-
tions were identified by post-hoc comparisons (Tukey’s HSD; p,0.05).
Results
Testing Independence of Soil Gradients and GrazingGradients (Question 1)PCA revealed five main environmental gradients in both biomes
(Table S1). Subsequent axes explained ,36% of total variation in
the grassland dataset and ,35% in the savanna, and were not
considered further. In the grassland, grazing was reflected by PC
3, which explained only 10% of total variation within the data set.
The grazing gradient reached from plots with little grazing impact
at greater distances to water points, and with high cover values for
litter and moribund material, to plots at close distances to water
points with a high proportion of bare soil and visible signs of severe
grazing. PC 1, 2 and 4 reflected gradients in edaphic conditions,
with PC 1 describing a gradient between plots with high clay
content and high CEC, and those with high sand content. PC 2
described a gradient in mineral nutrients.
In the savanna, grazing was reflected by PC 2 which explained
18% of variation among plots, i.e. considerably more than in the
grassland. PC 1 was mainly associated with changes in bush cover,
soil organic matter and nitrogen. Gradients in edaphic conditions
(particularly soil texture) were bundled by PC 3–5. While we found
a weak correlation between management and soil parameters in
the grassland, grazing and three mineral nutrients (P, K and Zn)
were correlated in the savanna (factor loadings .4 on same PC;
Table S1).
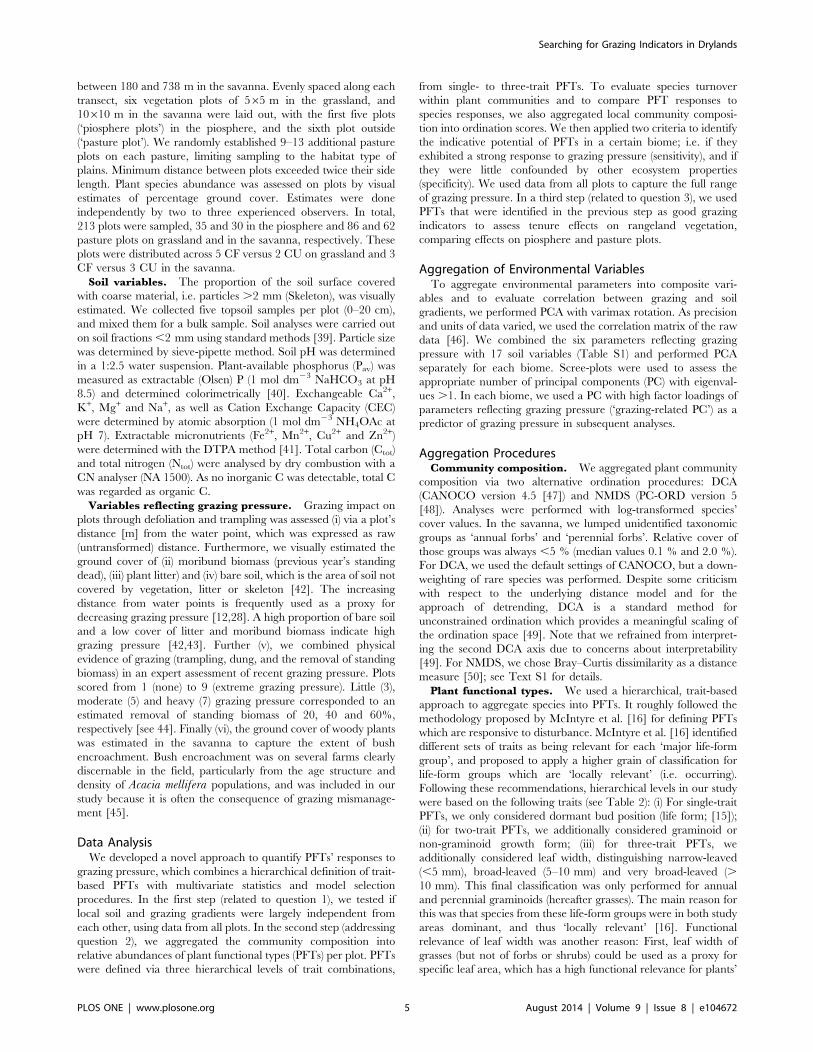
Response Consistency across Biomes (Question 2)Response of community composition. In both biomes,
piosphere and pasture plots from the two tenure systems were not
clearly separated in the ordination spaces (Figure 2). Both
ordination methods rendered essentially similar results. They
agreed for the savanna that, along the main ordination axes (DCA
1 and NMDS 1), variation among piosphere plots was higher than
that among pasture plots (Figure 2B and 2D). In congruence to
our expectations, this reflected steeper environmental gradients
close to water points. However, our expectations were not met for
the grassland, where variation among pasture plots was also high
(Figure 2A and 2C).
In the grassland biome, the grazing-related PC explained the
highest proportion of species turnover along the first axis of the
two ordination procedures (DCA 1: 43%, NMDS 1: 29%; see
Figure 3), followed by a variable group reflecting mineral nutrients
(PC 2) and a PC reflecting changes in silt and P content of the
topsoil (PC 5; see Tables S2 and S3 for details of final linear
models). Unexpectedly, the most important predictor for species
turnover in the savanna was not grazing pressure (PC 2; explained
variance only 6%) but a gradient in mineral nutrients (PC 3;
explained variance 25%). Other soil parameters (PC 5 related to
topsoil clay, and PC 4 to silt and Fe content) were of minor
importance. In both biomes, community composition in the
savanna (DCA 1) was not explained by differences in land tenure.
To substantiate our claim that certain ordination axes reflected a
grazing gradient, we performed correlations between these axes
and reciprocal distances to the water point, as this estimate reflects
grazing intensity better than distance [56]. In the grassland, both
DCA 1 and NMDS 1 showed a strong positive correlation to
reciprocal distance (p,0.001). Coefficients of determination (r2)indicated that reciprocal distance explained 23.4 % of variation in
Searching for Grazing Indicators in Drylands
PLOS ONE | www.plosone.org 7 August 2014 | Volume 9 | Issue 8 | e104672
DCA 1 and 21.9 % of variation in NMDS 1. In the savanna, a
strong negative correlation was found between NMDS 2 and
reciprocal distance (explained variance 53.6 %; p,0.001).
In the grassland biome, the response of narrow-leaved and
broad-leaved perennial grasses (HG lin and HG lan) to grazing
and soil conditions resembled the main changes in community
composition (DCA 1 and NMDS 1; see Figure 3). In the savanna,
perennial grasses’ responses resembled the NMDS 1 responses to
environmental conditions, but none of the tested PFTs resembled
DCA 1 responses.
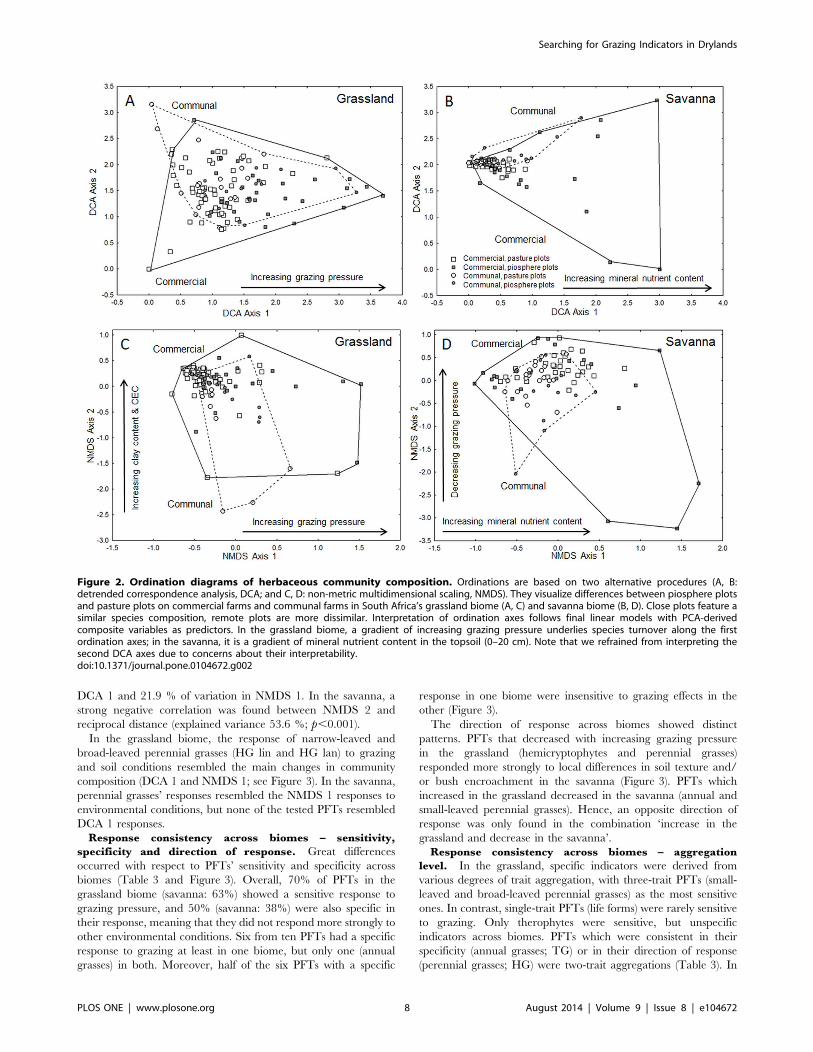
Response consistency across biomes – sensitivity,
specificity and direction of response. Great differences
occurred with respect to PFTs’ sensitivity and specificity across
biomes (Table 3 and Figure 3). Overall, 70% of PFTs in the
grassland biome (savanna: 63%) showed a sensitive response to
grazing pressure, and 50% (savanna: 38%) were also specific in
their response, meaning that they did not respond more strongly to
other environmental conditions. Six from ten PFTs had a specific
response to grazing at least in one biome, but only one (annual
grasses) in both. Moreover, half of the six PFTs with a specific
response in one biome were insensitive to grazing effects in the
other (Figure 3).
The direction of response across biomes showed distinct
patterns. PFTs that decreased with increasing grazing pressure
in the grassland (hemicryptophytes and perennial grasses)
responded more strongly to local differences in soil texture and/
or bush encroachment in the savanna (Figure 3). PFTs which
increased in the grassland decreased in the savanna (annual and
small-leaved perennial grasses). Hence, an opposite direction of
response was only found in the combination ‘increase in the
grassland and decrease in the savanna’.
Response consistency across biomes – aggregation
level. In the grassland, specific indicators were derived from
various degrees of trait aggregation, with three-trait PFTs (small-
leaved and broad-leaved perennial grasses) as the most sensitive
ones. In contrast, single-trait PFTs (life forms) were rarely sensitive
to grazing. Only therophytes were sensitive, but unspecific
indicators across biomes. PFTs which were consistent in their
specificity (annual grasses; TG) or in their direction of response
(perennial grasses; HG) were two-trait aggregations (Table 3). In
Figure 2. Ordination diagrams of herbaceous community composition. Ordinations are based on two alternative procedures (A, B:detrended correspondence analysis, DCA; and C, D: non-metric multidimensional scaling, NMDS). They visualize differences between piosphere plotsand pasture plots on commercial farms and communal farms in South Africa’s grassland biome (A, C) and savanna biome (B, D). Close plots feature asimilar species composition, remote plots are more dissimilar. Interpretation of ordination axes follows final linear models with PCA-derivedcomposite variables as predictors. In the grassland biome, a gradient of increasing grazing pressure underlies species turnover along the firstordination axes; in the savanna, it is a gradient of mineral nutrient content in the topsoil (0–20 cm). Note that we refrained from interpreting thesecond DCA axes due to concerns about their interpretability.doi:10.1371/journal.pone.0104672.g002
Searching for Grazing Indicators in Drylands
PLOS ONE | www.plosone.org 8 August 2014 | Volume 9 | Issue 8 | e104672

the savanna, grazing explained the highest proportion of variance
for three two-trait PFTs (HG, TG and HF).
Assessing Land Tenure Effects (Question 3)We used the six PFTs identified as good grazing indicators
(Table 3) to evaluate differences in vegetation condition between
pasture and piosphere plots in the two tenure systems. We found
that tenure-related differences among piosphere and pasture plots
were small in both biomes (Figure 4).
Significant effects of tenure system were only detected in the
savanna, where mean relative abundances of perennial forbs (HF)
on pasture plots indicated a higher grazing pressure on communal
farms. However, the response of HF to grazing was rather weak
compared to that of the two other specific indicators in this biome
(annual and perennial grasses; see Figure 3). One PFT with a
sensitive but unspecific response to grazing (HG lin) also indicated
tenure-related differences in the savanna.
Significant second- and third-order interactions among biome,
tenure system and plot type (Table 4) showed that all plant
aggregations responded in an idiosyncratic way to the climatic
conditions and to rangeland management. The inclusion of ‘farm’
as a random factor in our analyses revealed that grazing pressure
greatly differed between those farms which were nested within a
certain tenure system. All indicators agreed with respect to this
finding. In both biomes, within-tenure variability tended to be
higher on commercial farms than on communal land (higher
variability in stocking densities; Table 1). This phenomenon was
also visible in the response of specific grazing indicators (see
Figure 4).
Discussion
Independence of Soil Gradients and Grazing Gradients(Question 1)In the first step of our three-step approach, we evaluated if
gradients of edaphic site conditions and grazing pressure were
independent. We found independent variation in the semi-arid
grassland, while in the arid savanna grazing pressure and three
Figure 3. Response of plant aggregations to management and soil conditions in the grassland (A) and in the savanna biome (B). Foreach plant aggregation, bars denote the proportion of explained variance (given as effect sizes, g2) in best-fitting linear models, associated withbiome-specific principal components and land tenure. Parameters are ordered by their effect sizes, starting with the grazing-related principalcomponent. Arrows facing upwards indicate a positive response to increased grazing, and arrows facing downwards indicate a negative response.Note that negative or positive responses to grazing cannot be assigned to ordination axes. DCA 1 = plot scores on first DCA axis. For abbreviations ofPFTs, refer to Table 2.doi:10.1371/journal.pone.0104672.g003
Table 3. Response consistency of six PFTs which are good (specific) indicators for grazing pressure at least in one biome.
PFT Response to grazinga Response consistency
Description Acronym Grassland Savanna Sensitivity Specificity Direction
Annual grasses TG specific q specific Q yes yes -
Perennial grasses HG sensitive Q specific Q yes - yes
Small-leaved perennial grasses HG lin specific q sensitive Q yes - -
Broad-leaved perennial grasses HG lan specific Q insensitive - - -
Hemicryptophytes H specific Q insensitive - - -
Perennial forbs HF insensitive specific q - - -
aPFTs with a sensitive response to grazing had a significant contribution of the grazing-related PC to their final linear models, but other predictor variables had largereffect sizes. PFTs with a specific response to grazing also had a sensitive response, but responded stronger to grazing than to other predictor variables (largest effectsize for the grazing-related PC). Insensitive PFTs had a non-significant contribution of grazing-related PC to their final linear models. Arrows indicate the direction ofresponse (q positive response to increased grazing pressure, Qnegative response). For details of final linear models refer to Tables S2 and S3.doi:10.1371/journal.pone.0104672.t003
Searching for Grazing Indicators in Drylands
PLOS ONE | www.plosone.org 9 August 2014 | Volume 9 | Issue 8 | e104672

Searching for Grazing Indicators in Drylands
PLOS ONE | www.plosone.org 10 August 2014 | Volume 9 | Issue 8 | e104672

mineral nutrients (P, K and Zn) tended to co-vary. Our results are
contradictory to many studies reporting strong correlation
between soil and grazing gradients due to livestock-mediated
changes in soil properties (e.g., [18,31]). A recent study from the
grassland biome also found that mineral nutrients were enriched in
zones of highest animal activities [57]. However, changes in these
studies were most apparent in the topsoil (0–4 to 0–10 cm). In
contrast, we analyzed 0–20 cm samples to capture conditions in
the main rooting zone of the grass layer [58]. Here, changes are
still detectable but less pronounced, because they are initiated
from the soil surface. Our results also confirmed that it is
principally possible to identify PFTs which primarily respond to
first-order effects of grazing (such as tissue removal) and not to
second-order effects such as changes in soil nutrients.
Poor Response Consistency of PFTs across Biomes(Question 2)
Response of community composition. With our study
design we sought to maximize detectable effects of grazing by
concentrating a large proportion of our sampling effort on the
small piosphere zones around water points. At the same time, we
aimed to minimize the influence of other environmental conditions
in each biome by sampling unburnt sites with similar topography,
lithology and soil type.
Our approach was successful in the grassland where grazing
pressure (grazing-related PC) was the most important source of
variation for community composition. The two ordination
methods (DCA and NMDS) agreed with respect to this finding.
Ordination results were also strikingly similar with respect to the
identity and relative importance of the second and third predictors
(mineral nutrients followed by silt and P content in the topsoil; see
Fig. 3). In the savanna, though, the first ordination axes were not
primarily related to changes in grazing pressure (which only came
second or third) but mainly to changes in mineral nutrients,
followed by changes in soil texture. This implies a high importance
of abiotic site conditions. Our results are not unexpected, as
edaphic conditions have often been described to overrule grazing
effects, particularly in arid environments. This was found in similar
studies from arid southern Kalahari [29,59], and from arid
savannas elsewhere [60,61]. Soil texture and nutrients played –
next to grazing pressure – also an important role for species
turnover in the grassland, which is supported by earlier studies
[62,63]. In both biomes, local differences in abiotic site conditions
may thus confound grazing-related changes in community
composition. The categorical predictor of land tenure explained
only a relatively small proportion of species turnover (see
Figure 3). We can deduce that the grazing-related PCs successfully
captured grazing effects on vegetation, which implies that
unaccounted factors were of minor importance for recent
community composition.
Note that we were not interested in the ecological relevance of
ordination axes per se. Instead, we aimed to quantify the
importance of environmental variables in predicting changes in
community composition, and to compare these results to changes
in PFTs’ relative abundances. For this purpose we used the same
statistical procedure (LMs with model selection, and a subsequent
calculation of effect sizes) and the same predictor variables (PCA-
derived composite variables) for ordination-based and trait-based
plant aggregations. It is thus for reasons of comparability that our
interpretation of DCA and NMDS axes relied on this standardized
approach. Our cross-validation with two indirect ordination
methods confirmed that derived results on the relative importance
of predictors are sound. The desired quantitative comparison
could not have been achieved with often applied direct ordination
techniques like CCA.
Similarity of PFT and community composition
response. In the grassland, the response of broad-leaved and
small-leaved perennial grasses to environmental conditions was
strikingly similar to the main response of community composition
(NMDS 1 and DCA 1). Our observation is supported by a study
from a mesic South African grassland which indicated that, along
the primary axis of trait variation, broad-leaved grasses occupied
one extreme, and narrow-leaved the other [64]. In the savanna,
though, the results of the two ordination procedures already
disagreed with respect to the relative importance of environmental
predictor variables. While none of the PFTs resembled DCA 1
response to environmental conditions, NMDS 1 response was
roughly similar to that of perennial grasses (HG), but the relative
importance of predictor variables differed. Moreover, the PFT
with the highest cumulative effect size (HG lin) responded to four
out of five PCs. Thus, species responses to plant-available
resources and grazing were apparently too complex as to be
reflected by single- to three-trait PFTs.
Response consistency across biomes – sensitivity,
specificity and direction of response. As grazing-related
PCs represent a complex vector combining various processes
associated with livestock activities, they should characterize the
relevant environmental factors that filter grazing-related plant
traits in the studied systems [12]. A specific (negative) response to
increasing grazing pressure was found for some dominant PFTs,
i.e. small-leaved and broad-leaved perennial grasses in the
grassland, and perennial grasses in the savanna. We can thus
deduce that these trait combinations were strongly filtered by
grazing-related disturbances. The increased relative abundance of
annual grasses with higher grazing intensity in the grassland
underlines that this PFT has profited from the grazing-induced
suppression of the two dominant PFTs (broad-leaved and small-
leaved perennial grasses). This is consistent with other observations
in semi-arid grasslands [65,66]. Our results are in broad
agreement with the findings of a global analysis of responses to
grazing [20]. Considering the same climate-grazing category
(drylands with a long evolutionary history of grazing), we also
found an inconsistent direction of response for annual plants, a
neutral (insensitive) or negative response for graminoid growth
forms, and a mostly insensitive response for (both annual and
perennial) forbs, except for some perennial forbs which responded
positively in the savanna.
The small set of PFTs that had a sensitive response to grazing in
both biomes (three out of eight PFTs shared among biomes;
Table 3) underlines the difficulty to transfer trait responses to
other biomes even within the same climate-grazing category as
defined by Dıaz et al. [20]. In this context, several patterns of
response consistency are of interest. First, some trait combinations
Figure 4. Differences in grazing pressure according to good trait-based indicators (PFTs). Panels A–F compare piosphere and pastureplots across tenure systems (commercial and communal) and biomes (savanna and grassland). All PFTs had a specific response to grazing at least inone biome (see Figure 3 and Table 3). Broken lines connect piosphere and pasture plots of a tenure system within a biome, and different lettersindicate significant differences (Tukey’s HSD; p,0.05). Boxes show medians and 25th to 75th percentiles, whiskers stand for the non-outlier ranges ofthe data. Note the different scaling of the y-axis for panels E and F. HG lin = narrow-leaved perennial grasses, HG lan = broad-leaved perennial grasses,HG = perennial grasses, H = hemicryptophytes, TG = annual grasses, HF = perennial forbs.doi:10.1371/journal.pone.0104672.g004
Searching for Grazing Indicators in Drylands
PLOS ONE | www.plosone.org 11 August 2014 | Volume 9 | Issue 8 | e104672

only occurred in the semi-arid grassland biome. Second, the
direction of response across biomes was not arbitrary; PFTs which
decreased in the grassland always responded more strongly to local
differences in soil texture and/or bush encroachment in the
savanna. These patterns might be explained by the convergence
model of drought (aridity) and grazing resistance, stating that
aridity and grazing are convergent selective forces [67]. The
validity of this model for South Africa’s grasslands has been
recently confirmed [68]. Our results suggest that the more arid
climate in the savanna has acted as the primary filter [69], and
filtered out drought-prone trait combinations (broad-leaved and
very broad-leaved perennial grasses) in most habitat types. The
occurrence of these PFTs is restricted to habitats with a lower
aridity such as sites with favourable edaphic conditions.
The convergence model of aridity and grazing [67] could also
explain why an opposite response to grazing always implied an
increase of relative abundances in the semi-arid grassland and a
decrease in the arid savanna. Along a gradient of additive forces of
aridity and grazing (i.e. of environmental harshness), grassland
plots under low grazing pressure will occupy the side of most
favourable environmental conditions captured in this study, and
savanna plots under high grazing pressure the most unfavourable
ones. PFTs which appear to have an opposite response to grazing
in the two biomes thus rather display an unimodal response along
this gradient of environmental harshness captured in this study.
For example, the comparatively grazing-tolerant PFT of small-
leaved perennial grasses replaced the less tolerant broad-leaved
perennial grasses in the grassland when grazing pressure increased.
In the more arid savanna, though, small-leaved perennial grasses
dominated under conditions of little grazing but were replaced
themselves by other PFTs such as annual grasses when grazing
pressure increased. This response pattern has also been reported
from other arid savannas [30,70].
Response consistency across biomes – aggregation
level. We expected that an iterative aggregation of traits into
PFTs would allow us to identify good indicators with an optimum
level of aggregation. These indicators should capture species’
adaptive response to grazing and ideally be consistent across
biomes [16]. We found that one-trait PFTs did either not respond
at all, or responded weakly and inconsistently across biomes. This
confirms that single traits are insufficient for capturing grazing
response [19], which seems particularly true for dryland environ-
ments, even on high spatial or organizational scales [20].
Adding traits did not consistently increase the indicative value of
PFTs for grazing. In the grassland, three-trait PFTs were the best
grazing indicators, but in the savanna, an intermediate (two-trait)
level characterized specific grazing indicators. An intermediate
level of aggregation also characterized the two indicators which
either had a consistent direction (HG) or specificity of response
(TG) across biomes. If the inconsistency in response to grazing is
inevitable due to the above discussed convergence of aridity and
grazing effects, the striking lack of generality is unlikely to be
overcome by more refined classification approaches.
Coarse aggregations are obviously more viable for up-scaling
across biomes. For example, we found that a dichotomy of
perennial versus annual grasses was feasible. Perennial grasses are
also a good indicator of ecological services [6] because they are
closely linked to a reliable provision of forage biomass [71,72].
However, the aggregation of ‘Graminoid tall C4’ proposed by Dıaz
et al. [20] for ‘drylands with a long evolutionary history of grazing’
might be inefficient if life history is not included: As tropical and
subtropical grasslands and savannas are dominated by C4 grasses
[73], the proposed aggregation level provides no means of further
differentiation.
Ta
ble
4.
Re
sult
so
fp
arti
ally
ne
ste
dA
NO
VA
wit
hth
efi
xed
fact
ors
‘bio
me
’(g
rass
lan
do
rsa
van
na)
,‘t
en
ure
’(co
mm
erc
ial
or
com
mu
nal
),‘t
ype
’(p
iosp
he
reo
rp
astu
rep
lots
),an
dth
era
nd
om
fact
or
‘far
m’
ne
ste
dw
ith
in‘t
en
ure
’an
d‘b
iom
e’.
PF
TB
iom
eT
en
ure
Ty
pe
Fa
rmB
iom
e6te
nu
reB
iom
e6ty
pe
Te
nu
re6
typ
eB
iom
e6te
nu
re6
typ
e
Fp
Fp
Fp
Fp
Fp
Fp
Fp
Fp
HG
lin4
6.3
0.0
00
10
.80
.00
91
7.5
0.0
00
2.1
0.0
35
0.3
40
.57
54
.41
0.0
37
1.5
10
.22
11
.95
0.1
64
HG
lan
29
.50
.00
00
.00
.85
22
3.2
0.0
00
3.7
0.0
00
0.4
90
.50
21
5.9
0.0
00
0.5
10
.47
55
.22
0.0
24
HG
12
.10
.00
71
0.7
0.0
10
15
.00
.00
02
.50
.01
18
.07
0.0
20
2.2
60
.13
51
.33
0.2
50
4.7
30
.03
1
HF
6.8
0.0
26
2.4
0.1
52
1.1
0.2
96
5.6
0.0
00
6.3
70
.03
00
.01
0.9
07
3.9
80
.04
74
.39
0.0
38
TG
6.6
0.0
30
0.0
0.9
38
26
.40
.00
04
.30
.00
00
.17
0.7
11
27
.60
.00
01
.40
0.2
38
4.7
10
.03
2
H3
.21
0.0
75
1.6
00
.20
81
5.3
0.0
00
3.5
0.0
00
1.2
80
.25
96
.04
0.0
15
4.6
90
.03
26
.33
0.0
13
On
lyP
FTs
wit
ha
spe
cifi
cre
spo
nse
tog
razi
ng
atle
ast
ino
ne
bio
me
(sig
nif
ican
tco
ntr
ibu
tio
no
fg
razi
ng
-re
late
dp
rin
cip
alco
mp
on
en
tto
fin
alm
od
els
,an
dla
rge
ste
ffe
ctsi
ze)
we
rete
ste
d.H
Glin
=n
arro
w-l
eav
ed
pe
ren
nia
lgra
sse
s,H
Gla
n=
bro
ad-l
eav
ed
pe
ren
nia
lg
rass
es,
HG
=p
ere
nn
ial
gra
sse
s,H
F=
pe
ren
nia
lfo
rbs,
TG
=an
nu
alg
rass
es,
H=
he
mic
ryp
top
hyt
es.
Sig
nif
ican
tp
-val
ue
s(,
0.0
5)
are
sho
wn
inb
old
.d
oi:1
0.1
37
1/j
ou
rnal
.po
ne
.01
04
67
2.t
00
4
Searching for Grazing Indicators in Drylands
PLOS ONE | www.plosone.org 12 August 2014 | Volume 9 | Issue 8 | e104672

Few Tenure-Related Differences in Vegetation State(Question 3)
Grazing differences between tenure systems. We as-
sumed that, like in other South African regions [52,63], communal
farms would display stronger grazing-related changes in commu-
nity composition than commercial farms due to usually higher
stocking densities and due to detrimental effects of continuous
grazing management on rangeland condition [63]. However, trait-
based indicators showed that, in both biomes, tenure-related
management effects on vegetation were small, if piospheres were
compared to piospheres and pastures to pastures. For farms in the
grassland biome, these results are in general agreement with two
accompanying studies from the same growing season, focusing on
vegetation responses in piospheres based on a taxon-free sampling
of vegetative traits [38], and on a time series analysis based on
high-resolution spectral imagery of pastures [74].
These results could be explained by large differences in grazing
pressure across farms: Within-tenure variability in stocking
densities could have masked any between-tenure differences in
stocking rates and grazing management (continuous versus
rotational). Within each biome, differences in stocking densities
(and, similarly, in vegetation state) were larger on commercial
farms as compared to communal farms. The grazing management
of single owners was thus more variable than on communal farms,
where land tenure was shared among a group of users. The greater
variability among commercial farms might be associated with
recent land reform activities in South Africa [75].
We have used biome-specific indicators for grazing pressure that
were relatively insensitive for abiotic site conditions. Differences in
abiotic site conditions between commercial and communal
rangelands should thus have little confounded our results. For
the savanna, we have evidence that such differences occurred: Soil
texture parameters (sand and clay content) differed significantly
between pasture plots across tenure systems (Table 1). Hence
tenure-related differences in the relative abundance of fine-leaved
perennial grasses (a PFT which responded in this biome more
strongly to soil conditions than to grazing; Table 3) could also be
explained by differences in abiotic site conditions. More generally,
our results support critical voices stating that changes in vegetation
characteristics on rangelands under communal land tenure do not
necessarily have to be stronger than those on commercial farms
[23].
An alternative, but not mutually exclusive explanation for our
observation that tenure-related differences were small relates to the
fact that rangeland vegetation outside piospheres generally
appeared to be in a good state. In the grassland, this was apparent
by the dominance of palatable and preferred species like Themedatriandra [28]. Likewise, the dominance of palatable perennial
grasses such as Schmidtia pappophoroides and Eragrostis leh-manniana implied a comparatively good state of savanna pastures
[29]. We speculate that the 1–2 years with good rainfall prior to
our field study might have created a window of opportunity for
regeneration, as postulated [76] and reported [77] for arid and
semi-arid rangelands. However we could not differentiate if the
recovery of perennial grass cover was due to a recruitment wave
(as found in a Namibian savanna when soil moisture was
experimentally increased; [78]), or merely due to changes in
individual fitness and size. Long-term observations of plant
populations, combined with manipulative experiments and vege-
tation models should allow to track the complex responses of
vegetation to grazing and variable climate conditions, and to
better understand ecosystem dynamics [79].
Conclusions
The main aim of this study was to identify functional plant
aggregations with a consistent response to grazing across two
South African biomes, mainly differing in climatic aridity. The
systematic evaluation of hierarchical levels of aggregation was
unsuccessful, although we were able to detect a biome-specific
optimum level: Three-trait PFTs were the best grazing indicators
in the semi-arid grassland, while in the arid savanna two-trait
PFTs were better. The striking lack of generalizable PFT responses
to grazing might be due to a convergence of aridity and grazing
effects, which is unlikely to be overcome by more refined
classification approaches. Our study thus presents and advocates
for localized indicator sets, as recommended by Dıaz et al. [20].
While such sets are useful for applied studies, they do not offer a
generic understanding of the combined effects of plant-available
resources and grazing on community performance, which would
be a prerequisite for an up-scaling of plant responses [80]. For this
purpose, a promising approach is to use traits that capture the
trade-off between resource acquisition and conservation [2,51].
Our study also confirms the principal importance of life history
(annual versus perennial), growth form, and leaf size in explaining
species’ responses to grazing, and advocates for hierarchical
combinations of these traits (see [20,81]). Another important
outcome of our research was that certain combinations of traits
could successfully detect management effects against the back-
ground of a high environmental variability typical for drylands.
We think that our novel methodological approach to quantify
PFTs’ specificity and sensitivity to grazing pressure, which
combines a hierarchical definition of trait-based PFTs with
multivariate statistics and model selection procedures, will also
be successful for identifying and applying ecological indicators in
other ecosystems, and for other environmental drivers.
Supporting Information
Table S1 PCA of environmental variables for thegrassland and savanna biome.
(DOC)
Table S2 Final linear models for the grassland biome,fitted to plant aggregations.
(DOC)
Table S3 Final linear models for the savanna biome,fitted to plant aggregations.
(DOC)
Table S4 Species list with trait data for the grasslandand savanna biome.
(DOC)
Text S1 Details on land use history, sampling designand ordinations.
(DOCX)
Acknowledgments
Our gratitude goes to all headmen and farmers for allowing us to carry out
field research on their land, and for a pleasant cooperation. The assistance
of the Departments of Agriculture and Rural Development of the Free
State (Thaba Nchu) and the Northern Cape (Mothibistad) is gratefully
acknowledged. We thank Hermanus J. Fouche and Hermias C. van der
Westhuizen for their support during study setup, as well as Johannes
Schmidt, Hannah Steinschulte and Petra Weber for their field assistance.
Christiane Naumann kindly provided data for the calculation of stocking
densities. We also thank two anonymous referees for their valuable
comments.
Searching for Grazing Indicators in Drylands
PLOS ONE | www.plosone.org 13 August 2014 | Volume 9 | Issue 8 | e104672

Author Contributions
Conceived and designed the experiments: AL FE JS. Performed the
experiments: AL JS KB CAG RJO JCR. Analyzed the data: AL.
Contributed reagents/materials/analysis tools: CCP. Wrote the paper:
AL. Interpretation of results: AL JS.
References
1. Laliberte E, Shipley B, Norton DA, Scott D (2012) Which plant traits determine
abundance under long-term shifts in soil resource availability and grazing
intensity? Journal of Ecology 100: 662–677.
2. Lienin P, Kleyer M (2011) Plant leaf economics and reproductive investment are
responsive to gradients of land use intensity. Agriculture, Ecosystems &
Environment 145: 67–76.
3. Frank ASK, Dickman CR, Wardle GM, Greenville AC (2013) Interactions of
grazing history, cattle removal and time since rain drive divergent short-term
responses by desert biota. PLOS ONE 8: e68466.
4. Ruppert JC, Holm AM, Miehe S, Muldavin E, Snyman HA, et al. (2012) Meta-
analysis of rain-use efficiency confirms indicative value for degradation and
supports non-linear response along precipitation gradients in drylands. Journal
of Vegetation Science 23: 1035–1050.
5. Martin R, Muller B, Linstadter A, Frank K (2014) How much climate change
can pastoral livelihoods tolerate? Modelling rangeland use and evaluating risk.
Global Environmental Change 24: 183–192.
6. Muller F, Burkhard B (2012) The indicator side of ecosystem services. Ecosystem
Services 1: 26–30.
7. Meyer KM, Schiffers K, Munkemuller T, Schadler M, Calabrese JM, et al.
(2010) Predicting population and community dynamics: The type of aggregation
matters. Basic and Applied Ecology 11: 563–571.
8. Lavorel SMS, Grigulis K (2007) Plant responses to disturbance in a
Mediterranean grassland: How many functional groups? Journal of Vegetation
Science 10: 661–672.
9. Dıaz S, Noy-Meir I, Cabido M (2001) Can grazing response of herbaceous
plants be predicted from simple vegetative traits? Journal of Applied Ecology 38:
497–508.
10. Jauffret S, Lavorel S (2003) Are plant functional types relevant to describe
degradation in arid, southern Tunisian steppes? Journal of Vegetation Science
14: 399–408.
11. Schellberg J, Pontes L da S (2012) Plant functional traits and nutrient gradients
on grassland. Grass and Forage Science 67: 305–319.
12. Wesuls D, Oldeland J, Dray S (2012) Disentangling plant trait responses to
livestock grazing from spatio-temporal variation: the partial RLQ approach.
Journal of Vegetation Science 23: 98–113.
13. Garnier E, Navas M-L (2012) A trait-based approach to comparative functional
plant ecology: concepts, methods and applications for agroecology. A review.
Agronomy for Sustainable Development 32: 365–399.
14. Webb CT, Hoeting JA, Ames GM, Pyne MI, LeRoy Poff N (2010) A structured
and dynamic framework to advance traits-based theory and prediction in
ecology. Ecology Letters 13: 267–283.
15. Raunkiær C (1934) The life forms of plants and statistical plant geography.
Oxford, UK: Oxford University Press.
16. McIntyre S, Lavorel S, Landsberg J, Forbes TDA (1999) Disturbance response
in vegetation: Towards a global perspective on functional traits. Journal of
Vegetation Science 10: 621–630.
17. Saiz H, Alados CL (2012) Changes in semi-arid plant species associations along a
livestock grazing gradient. PLOS ONE 7: e40551.
18. Linstadter A, Baumann G (2013) Abiotic and biotic recovery pathways of arid
rangelands: lessons from the High Atlas Mountains, Morocco. CATENA 103:
3–15.
19. Koyanagi T, Kusumoto Y, Hiradate S, Morita S, Yokogawa M, et al. (2013)
New method for extracting plant indicators based on their adaptive responses to
management practices: application to semi-natural and artificial grassland data.
Applied Vegetation Science 16: 95–105.
20. Dıaz S, Lavorel S, McIntyre S, Falczuk V, Casanoves F, et al. (2007) Plant trait
responses to grazing - a global synthesis. Global Change Biology 13: 313–341.
21. Rutherford MC, Powrie LW (2013) Impacts of heavy grazing on plant species
richness: A comparison across rangeland biomes of South Africa. South African
Journal of Botany 87: 146–156.
22. Palmer T, Ainslie A (2006) Country pasture/forage resource profiles: South
Africa. Rome, Italy: FAO.
23. Palmer AR, Bennett JE (2013) Degradation of communal rangelands in South
Africa: towards an improved understanding to inform policy. African Journal of
Range & Forage Science: 1–7.
24. Cowling RM, Richardson DM, Pierce SM, editors (1997) Vegetation of
Southern Africa. Cambridge, UK: Cambridge University Press.
25. Mucina L, Rutherford MC (2006) The vegetation of South Africa, Lesotho and
Swaziland. Pretoria, South Africa: South African National Biodiversity Institute.
26. Harrison YA, Shackleton C (1999) Resilience of South African communal
grazing lands after the removal of high grazing pressure. Land Degradation &
Development 10: 225–239.
27. O’Connor TG, Morris CD, Marriott DJ (2003) Change in land use and
botanical composition of KwaZulu-Natal’s grasslands over the past fifty years:
Acocks’ sites revisited. South African Journal of Botany 69: 105–115.
28. van der Westhuizen HC, Snyman HA, Fouche HJ (2005) A degradation
gradient for the assessment of rangeland condition of a semi-arid sourveld in
southern Africa. African Journal of Range & Forage Science 22: 47–58.
29. Smet M, Ward D (2005) A comparison of the effects of different rangeland
management systems on plant species composition, diversity and vegetation
structure in a semi-arid savanna. African Journal of Range & Forage Science 22:
59–71.
30. Linstadter A (2008) Landscape ecology of savannas – from disturbance regime to
management strategies. In: Bollig M, Bubenzer O, editors. African landscapes:
interdisciplinary approaches. New York, USA: Springer. 79–103.
31. Smet M, Ward D (2006) Soil quality gradients around water-points under
different management systems in a semi-arid savanna, South Africa. Journal of
Arid Environments 64: 251–269.
32. Hargrove WW, Pickering J (1992) Pseudoreplication: a sine qua non for regional
ecology. Landscape Ecology 6: 251–258.
33. van Rooyen N, Bredenkamp GJ (1996) Kalahari Plains Thorn Bushveld. In:
Low AB, Rebelo AG, editors. Vegetation of South Africa, Lesotho and
Swaziland. A companion to the Vegetation Map of South Africa, Lesotho and
Swaziland. Pretoria, South Africa: Department of Environmental Affairs and
Tourism. p. 35.
34. Bredenkamp GJ, van Rooyen N (1996) Moist Cool Highveld Grassland. In: Low
AB, Robelo AG, editors. Vegetation of South Africa, Lesotho and Swaziland. A
companion to the vegetation map of South Africa, Lesotho and Swaziland.
Pretoria, South Africa: Department of Environmental Affairs and Tourism. p.
43.
35. Murray C (1997) South African land reform: case studies in demand and
participation in the Free State. African Affairs 96: 187–214.
36. Jacobs NC (2003) Environment, power, and injustice: a South African history.
Cambridge, UK: Cambridge University Press.
37. Shipley B (2010) From plant traits to vegetation structure. Chance and selection
in the assembly of ecological communities. Cambridge, UK: Cambridge
University Press.
38. Moreno Garcıa CA, Schellberg J, Ewert F, Bruser K, Canales-Prati P, et al.
(2014) Response of community-aggregated plant functional traits along grazing
gradients: insights from African semi-arid grasslands. Applied Vegetation
Science 17: 470–481.
39. Committee TN-ASAW (1990) Handbook of standard soil testing methods for
advisory purposes. Pretoria, South Africa: Soil Science Society of South Africa.
40. Murphy J, Riley JP (1962) A modified single solution method for the
determination of phosphate in natural waters. Analytica Chimica Acta 27:
31–36.
41. Lindsay, W L, Norvell WA (1978) Development of a DTPA test for zinc, iron,
manganese and copper. Soil Science Society of America Journal 42: 421–428.
42. Pyke DA, Herrick JE, Shaver P, Pellant M (2002) Rangeland health attributes
and indicators for qualitative assessment. Journal of Range Management 55:
584–597.
43. Zimmermann J, Higgins SI, Grimm V, Hoffmann J, Linstadter A (2010) Grass
mortality in semi-arid savanna: the role of fire, competition and self-shading.
Perspectives in Plant Ecology, Evolution and Systematics 12: 1–8.
44. Milchunas DG, Lauenroth WK, Burke IC (1998) Livestock grazing: animal and
plant biodiversity of shortgrass steppe and the relationship to ecosystem function.
Oikos 83: 65–74.
45. Eldridge DJ, Maestre FT, Maltez-Mouro S, Bowker MA (2012) A global
database of shrub encroachment effects on ecosystem structure and functioning.
Ecology 93: 2499–2499.
46. Jackson JE (2003) A user’s guide to Principal Components. New York: John
Wiley & Sons.
47. ter Braak, CJF, Smilauer P (2002) CANOCO reference manual and users guide
to Canoco for windows: software for canonical community ordination (version
4.5). Ithaca, USA: Microcomputer Power.
48. McCune B, Mefford MJ (2006) PC-ORD. Multivariate analysis of ecological
data. Version 5. Gleneden Beach, Oregon, USA: MjM Software.
49. von Wehrden H, Hanspach J, Bruelheide H, Wesche K (2009) Pluralism and
diversity: trends in the use and application of ordination methods 1990–2007.
Journal of Vegetation Science 20: 695–705.
50. Austin MP (2013) Inconsistencies between theory and methodology: a recurrent
problem in ordination studies. Journal of Vegetation Science 24: 251–268.
51. Wright IJ, Reich PB, Westoby M, Ackerly DD, Baruch Z, et al. (2004) The
worldwide leaf economics spectrum. Nature 428: 821–827.
52. Rutherford MC, Powrie LW (2011) Can heavy grazing on communal land
elevate plant species richness levels in the Grassland Biome of South Africa?
Plant Ecology 212: 1407–1418.
53. van Rooyen N, Bezuidenhout H, de Kock E (2001) Flowering plants of the
Kalahari dunes; van Rooyen N, van Rooyen G, editors. Lynnwood, South
Africa: Ekotrust. 1–216.
Searching for Grazing Indicators in Drylands
PLOS ONE | www.plosone.org 14 August 2014 | Volume 9 | Issue 8 | e104672

54. van Oudtshoorn F (1999) Guide to grasses of southern Africa. Pretoria, South
Africa: Briza.55. Burnham KP, Anderson DR (1998) Model selection and multimodel inference: a
practical information-theoretic approach. New York, USA: Springer.
56. Manthey M, Peper J (2010) Estimation of grazing intensity along grazinggradients – the bias of nonlinearity. Journal of Arid Environments 74: 1351–
1354.57. Kotze E, Sandhage-Hofmann A, Meinel JA, du Preez CC, Amelung W (2013)
Rangeland management impacts on the properties of clayey soils along grazing
gradients in the semi-arid grassland biome of South Africa. Journal of AridEnvironments 97: 220–229.
58. Snyman HA (2009) Root studies on grass species in a semi-arid South Africaalong a degradation gradient. Agriculture, Ecosystems & Environment 130:
100–108.59. van Rooyen N, Bredenkamp GJ, Theron GK (1991) Kalahari vegetation: veld
condition trends and ecological status of species. Koedoe 34: 61–72.
60. Angassa A, Sheleme B, Oba G, Treydte A, Linstadter A, et al. (2012) Savannaland use and its effect on soil characteristics in southern Ethiopia. Journal of Arid
Environments 81: 67–76.61. Schulte A (2002) Stabilitat oder Zerstorung? Veranderungen der Vegetation des
Kaokolandes unter pastoralnomadischer Nutzung. Kolner Geographische
Arbeiten 77: 101–118.62. O’Connor TG, Bredenkamp GJ (1997) Grassland. In: Cowling RM, Richardson
DM, Pierce SM, editors. Vegetation of Southern Africa. Cambridge, UK:Cambridge University Press. 215–257.
63. Vetter S, Goqwana WM, Bond WJ, Trollope WW (2006) Effects of land tenure,geology and topography on vegetation and soils of two grassland types in South
Africa. African Journal of Range & Forage Science 23: 13–27.
64. Fynn R, Morris C, Ward D, Kirkman K (2011) Trait–environment relations fordominant grasses in South African mesic grassland support a general leaf
economic model. Journal of Vegetation Science 22: 528–540.65. van der Westhuizen HC, van Rensburg WLJ, Snyman HA (1999) The
quantification of rangeland condition in a semi-arid grassland of southern Africa.
African Journal of Range and Forage Science 16: 49–61.66. Wiegand T, Snyman HA, Kellner K, Paruelo JM (2004) Do grasslands have a
memory: Modeling phytomass production of a semiarid South Africangrassland. Ecosystems 7: 243–258.
67. Quiroga RE, Golluscio RA, Blanco LJ, Fernandez RJ (2010) Aridity and grazingas convergent selective forces: an experiment with an Arid Chaco bunchgrass.
Ecological Applications 20: 1876–1889.
68. Rutherford MC, Powrie LW, Husted LB (2012) Plant diversity consequences ofa herbivore-driven biome switch from Grassland to Nama-Karoo shrub steppe
in South Africa. Applied Vegetation Science 15: 14–25.
69. Luzuriaga AL, Sanchez AM, Maestre FT, Escudero A (2012) Assemblage of a
semi-arid annual plant community: abiotic and biotic filters act hierarchically.
PLOS ONE 7: e41270.
70. Sander H, Bollig M, Schulte A (1998) Himba Paradise lost. Stability,
degradation, and pastoralist management of the Omuhonga Basin (Namibia).
Die Erde 129: 301–315.
71. Linstadter A, Kemmerling B, Baumann G, Kirscht H (2013) The importance of
being reliable – local ecological knowledge and management of forage plants in a
dryland pastoral system (Morocco). Journal of Arid Environments 95: 30–40.
72. Kuhn A, Heidecke C, Roth A, Goldbach H, Burkhardt J, et al. (2010)
Importance of resource management for livelihood security under climate
change in southern Morocco. In: Speth P, Christoph M, Diekkruger B, editors.
Impacts of global change on the hydrological cycle in West and Northwest
Africa. Berlin, Germany: Springer. 566–591.
73. Edwards EJ, Still CJ (2008) Climate, phylogeny and the ecological distribution of
C4 grasses. Ecology Letters 11: 266–276.
74. Bruser K, Feilhauer H, Linstadter A, Schellberg J, Oomen RJ, et al. (2014)
Discrimination and characterization of management systems in semi-arid
rangelands of South Africa using RapidEye time series. International Journal
of Remote Sensing 35: 1653–1673.
75. O’Laughlin B, Bernstein H, Cousins B, Peters PE (2013) Introduction: Agrarian
change, rural poverty and land reform in South Africa since 1994. Journal of
Agrarian Change 13: 1–15.
76. Holmgren M, Stapp P, Dickman CR, Gracia C, Graham S, et al. (2006)
Extreme climatic events shape arid and semiarid ecosystems. Frontiers in
Ecology and the Environment 4: 87–95.
77. Peters DPC, Yao J, Sala OE, Anderson JP (2012) Directional climate change
and potential reversal of desertification in arid and semiarid ecosystems. Global
Change Biology 18: 151–163.
78. Zimmermann J, Higgins SI, Grimm V, Hoffmann J, Munkemuller T, et al.
(2008) Recruitment filters in a perennial grassland: the interactive roles of fire,
competitors, moisture and seed availability. Journal of Ecology 96: 1033–1044.
79. Fraser LH, Henry HAL, Carlyle CN, White SR, Beierkuhnlein C, et al. (2012)
Coordinated distributed experiments: an emerging tool for testing global
hypotheses in ecology and environmental science. Frontiers in Ecology and the
Environment 11: 147–155.
80. Jeltsch F, Moloney K, Schurr F, Kochy M, Schwager M (2008) The state of
plant population modelling in light of environmental change. Perspectives in
Plant Ecology, Evolution and Systematics 9: 171–189.
81. Sasaki T, Okubo S, Okayasu T, Jamsran U, Ohkuro T, et al. (2011) Indicator
species and functional groups as predictors of proximity to ecological thresholds
in Mongolian rangelands. Plant Ecology 212: 327–342.
Searching for Grazing Indicators in Drylands
PLOS ONE | www.plosone.org 15 August 2014 | Volume 9 | Issue 8 | e104672
Related Documents