European SCGIS Conference “Best practices: Application of GIS technologies for conservation of natural and cultural heritage sites” 2012 Page 53 ARCHAEOLOGICAL GIS: KAZANLAK SURFACE SURVEY IN 2009-2011 Assoc. Prof. Dr. Georgi Nekhrizov 1 Assist. Prof. Dr. Julia Tzvetkova 2 Nadezhda Kecheva, PhD Student 1 1 National Institute of Archaeology and Museum, Bulgarian Academy of Sciences, Bulgaria 2 Sofia University “St. Kliment Ohridski”, Bulgaria ABSTRACT In the spring of 2009 an archaeological, multidisciplinary, and international research project led by Assoc. Prof. Dr. Georgi Nekhrizov from National Institute of Archaeology and Museum of the Bulgarian Academy of Sciences (NIAM-BAS) began to explore palaeoenvironments, settlement patterns, and productive strategies in the watershed of the upper Tundzha River. The project included palaeoecology, satellite remote sensing, mobile GIS survey, geophysics, and trial excavations, and systematic archaeological surface survey constituted the principal approach utilized. Initial research in 2009 focused on the hinterland of the Thracian city of Seuthopolis (now submerged under the Koprinka Reservoir). The follow-up campaigns in 2010 and 2011 extended the study area towards the Stara Planina Range, exploring rural landscapes across a variety of environmental and topographic zones. In total, the project surveyed 80.8 sq km and registered 343 archaeological sites. Keywords: Kazanlak Valley, Archaeological Survey, Satellite remote sensing, GIS, Archaeological Map of Bulgaria INTRODUCTION 1 The research project in Kazanlak Valley is a collaborative, multidisciplinary project involving researchers from Bulgaria, Australia, the United States, and the Czech Republic 2 . Its main approach is based on systematic surface survey for registering archaeological sites conducted in 2009-2011. Although this project deploys a variety of archaeological and palaeoecological approaches, the present article will be based mainly on survey methodology, satellite remote sensing and the corresponding results 3 . This project, together with one in Yambol region, are pilot in application of GIS technologies during field and post-processing work in archaeological surface surveys for Bulgaria 4 . The Kazanlak Study Area Geography The Kazanlak Valley is the largest Balkan valley, encompassing 780 sq km between the forested Sredna Gora hills to the south and the higher Stara Planina Range to the north (Fig. 1). The relatively young peaks of the Stara Planina Range rise over 2000 m above the valley; the Sredna Gora hills are older, lower, and more weathered. The valley is shaped like a narrow lozenge, with the Tundzha River following its southern edge 1 Although the three authors all have worked together on the paper, more or less the single contributions in the different parts of the text are as follows: G. Nekhrizov and J. Tzvetkova for the survey methodology and interpreting the results, N. Kecheva for the satellite remote sensing research. 2 In these surface surveys participated Dr. Adela Sobotkova and Dr. Shawn Ross from the University of New South Wales, Sydney, Australia, as well as other researchers from Bulgaria, Australia, the United States and the Czech Republic. 3 Preliminary reports on the same topic [1,2,3,4,5]. 4 Later GIS-aided surveys [6,7,8,9,10,11,12]. Fig. 1

Welcome message from author
This document is posted to help you gain knowledge. Please leave a comment to let me know what you think about it! Share it to your friends and learn new things together.
Transcript

European SCGIS Conference “Best practices: Application of GIS technologies for conservation of natural and cultural heritage sites” 2012
Page 53
ARCHAEOLOGICAL GIS: KAZANLAK SURFACE SURVEY IN 2009-2011
Assoc. Prof. Dr. Georgi Nekhrizov1 Assist. Prof. Dr. Julia Tzvetkova2 Nadezhda Kecheva, PhD Student1
1 National Institute of Archaeology and Museum, Bulgarian Academy of Sciences, Bulgaria 2 Sofia University “St. Kliment Ohridski”, Bulgaria
ABSTRACT
In the spring of 2009 an archaeological, multidisciplinary, and international research project led by Assoc. Prof. Dr. Georgi Nekhrizov from National Institute of Archaeology and Museum of the Bulgarian Academy of Sciences (NIAM-BAS) began to explore palaeoenvironments, settlement patterns, and productive strategies in the watershed of the upper Tundzha River. The project included palaeoecology, satellite remote sensing, mobile GIS survey, geophysics, and trial excavations, and systematic archaeological surface survey constituted the principal approach utilized. Initial research in 2009 focused on the hinterland of the Thracian city of Seuthopolis (now submerged under the Koprinka Reservoir). The follow-up campaigns in 2010 and 2011 extended the study area towards the Stara Planina Range, exploring rural landscapes across a variety of environmental and topographic zones. In total, the project surveyed 80.8 sq km and registered 343 archaeological sites.
Keywords: Kazanlak Valley, Archaeological Survey, Satellite remote sensing, GIS, Archaeological Map of Bulgaria INTRODUCTION1 The research project in Kazanlak Valley is a collaborative, multidisciplinary project involving researchers from Bulgaria, Australia, the United States, and the Czech Republic2. Its main approach is based on systematic surface survey for registering archaeological sites conducted in 2009-2011. Although this project deploys a variety of archaeological and palaeoecological approaches, the present article will be based mainly on survey methodology, satellite remote sensing and the corresponding results3. This project, together with one in Yambol region, are pilot in application of GIS technologies during field and post-processing work in archaeological surface surveys for Bulgaria4.
The Kazanlak Study Area Geography
The Kazanlak Valley is the largest Balkan valley, encompassing 780 sq km between the forested Sredna Gora hills to the south and the higher Stara Planina Range to the north (Fig. 1). The relatively young peaks of the Stara Planina Range rise over 2000 m above the valley; the Sredna Gora hills are older, lower, and more weathered. The valley is shaped like a narrow lozenge, with the Tundzha River following its southern edge
1 Although the three authors all have worked together on the paper, more or less the single contributions in the different parts of the text are as follows: G. Nekhrizov and J. Tzvetkova for the survey methodology and interpreting the results, N. Kecheva for the satellite remote sensing research. 2 In these surface surveys participated Dr. Adela Sobotkova and Dr. Shawn Ross from the University of New South Wales, Sydney, Australia, as well as other researchers from Bulgaria, Australia, the United States and the Czech Republic. 3 Preliminary reports on the same topic [1,2,3,4,5]. 4 Later GIS-aided surveys [6,7,8,9,10,11,12].
Fig. 1

European SCGIS Conference “Best practices: Application of GIS technologies for conservation of natural and cultural heritage sites” 2012
Page 54
and the Koprinka Reservoir sprawling at the foot of Sredna Gora. The landscape of the valley consists of rolling alluvial terraces north of the river that transform into stony colluvial fields with deluvial fans below the Stara Planina Range. The transition between plain and mountains is abrupt. Soils beneath the mountains are thin and stony; better soils including humic smolnitsas can only be found on the river terraces. In its wider context, the study area consists of a partially isolated valley in the interior of Thrace. Mountain passes guard access from the North, West and South. The valley is more open to the east, with a rolling, narrow corridor following the Tundzha River between the Sredna Gora and Stara Planina Range. The Black Sea lies about 190 km to the east through relatively easy terrain; the Aegean Sea lies about 300 km away, and can be reached by travelling east and then south along the Tundzha and Maritsa Rivers [2].
Archaeological Surveys in Kazanlak Study Area: A Short Historiography The systematization of all archaeological surveys from Prehistoric Times to the Medieval Ages in Kazanlak Study Area is difficult to achieve in a short retrospect. The famous archaeological discoveries from the 1940s and 1950s years, such as the Kazanlak tomb, Thracian city of Seuthopolis and its necropoleis, arise the interest of many researchers who contribute in different degree to the expansion of the investigations for the historical development of the region. Archaeological surface surveys conducted in the Kazanlak Study Area are connected with the names of G. Tabakova-Tzanova and, mostly, M. Domaradzki who has a special contribution to the creation and filling out registration paper forms being part of the national site registry Automated Information System “Archaeological Map of Bulgaria”5 for the region [13,14]. As a result of the periodically conducted surface surveys in 1970s a lot of data is gathered for archaeological sites in the western part of the Kazanlak Valley. A new stage in the filling out of the archaeological map of the region begins in 1996 when an expedition led by M. Domaradzki is organized. Intensive coverage of the territory was conducted according to the methodology for site registering in AKB. The results of these surface surveys were controlled with trial excavations for precision in the chronology and stratification of the sites. In 1998 these investigations were interrupted by the decease of Prof. M. Domaradzki. After a period of discontinuing of archaeological surface surveys, the fieldwork in Kazanlak Valley based on systematic work according to the methodology for site registering in AKB and satellite remote sensing continues. The choice of this particular region is based on the richness of archaeological potential and the limited number of the necessary archaeological investigations needed for studying the dynamic historical development.
Research Goals The archaeological surface surveys in 2009-2011 had some main methodological and scientific goals: [1]
1. The first application of systematic archaeological surface surveys in Bulgaria based on full coverage of the researched area, unit-based.
2. Filling out AKB registration paper forms for the region using also contemporary methods for satellite remote sensing and interdisciplinary palaeoecological investigations.
3. The dynamic of settlement development system in Kazanlak Valley from Prehistoric times to the Medieval Ages.
4. Characterization of regional differences in all aspects of settlement life in the hinterland of the Thracian city of Seuthopolis.
5 In Bulgarian language it is “Arheologicheska karta na Bulgaria” and it is abbreviated respectively AKB, which will be used from now on in the article.

European SCGIS Conference “Best practices: Application of GIS technologies for conservation of natural and cultural heritage sites” 2012
Page 55
5. Training of archaeological students and young scientists for conducting archaeological surface surveys using contemporary GIS-based methods.
6. Precise localization of the borders of all registered archaeological sites helping in their effective preservation.
7. A strategy for systematic archaeological surface surveys in Kazanlak Valley.
Preliminary Preparation The archaeological surface surveys were conducted according the requirements of the special normative documents in Republic of Bulgaria and the methodology used in creation of AKB [1]. Fieldwork was preceded by a thorough preliminary preparation such as: acquaintance with the results from earlier archaeological investigations based on special publications for the region; gathering information about geological characteristics of the region such as types of soils, waters, ores and minerals, vegetation; research based on georeferenced topographic maps in a different scale: 1:50000, 1:25000 and 1:5000; satellite remote sensing analysis of the area [1].
Satellite Image Data and Analysis A major part of the preliminary preparation took the analysis of the satellite imagery of the Kazanlak region6. The usage of low-, medium-, high- and very high-resolution multispectral and panchromatic satellite imagery is widely applied in archaeology [15,16] based on different satellites – LANDSAT Thematic Mapper, SPOT, KVR-1000 [17], CORONA [18], QuickBird [19,20] and IKONOS [21]. Lower-resolution imagery is useful for producing base-maps and digital elevation models and studying large-scale environmental and geological phenomena [22,23], while higher-resolution panchromatic imagery can detect prominent archaeological sites. Only high-resolution multispectral imagery reveals the relatively small soil marks, crop marks, and shadow marks often associated with subsurface archaeological remains. Use of high-resolution multispectral imagery allows for the detection of smaller sites, and for the efficient investigation and management of large, archaeologically rich landscapes [24].
Satellite image analysis was conducted during the first two project campaigns, both in 2009 and 2010. High-resolution multispectral and panchromatic imagery, IKONOS-2 provided by GeoEye Foundation, have been used to analyze the area. IKONOS-2’s multispectral information includes separate red, green, blue, and near-infrared (NIR) bands with 4 m spatial resolution and panchromatic imagery with 1 m spatial resolution. The
6 Special gratitude to Dr. Adela Sobotkova for sharing additional information.
Fig. 2
Fig. 3

European SCGIS Conference “Best practices: Application of GIS technologies for conservation of natural and cultural heritage sites” 2012
Page 56
capture date for the satellite imagery was April 14, 2001. It was all provided in the local coordinate system (WGS84 UTM 35N) and ready for use. From the provided 600 sq km 85 sq km underwent GIS analysis. Different spectral band combination of multispectral imagery detects in a different degree prominent and subsurface archaeological remains. In this project a band fusion between the represented four spectral bands was analyzed for presence of soil marks, crop marks, and shadow marks – 1-2-3, 4-2-1 and 4-1-4. In other projects QuickBird normalized difference vegetation index (NDVI) data is used in to enhance the typical surface anomalies linked to the presence of archaeological buried remains in a place with dense vegetation [25]. In the Kazanlak study area the NDVI data was also calculated and analyzed together with the panchromatic imagery (Fig. 2). The high-resolution, multispectral imagery was visually enhanced and manually analyzed for the presence of mounds, earthworks, and crop, weed, and soil marks that did not align with modern field divisions or natural features. In areas of overlap, the results of satellite remote sensing were compared with surface survey. Elsewhere, separate ground control was conducted to determine the nature and origin of image features, which were ultimately classified as "successes" (Fig. 3), "false positives", or "ambiguous". "False negatives" were also recorded when remote sensing failed to locate features discovered through surface survey (Fig. 4). During ground control, a small team would walk the perimeter of the remote sensing feature and several transects across it, using the same recordkeeping categories as extensive survey. The results of ground control informed ongoing mage analysis in an iterative process, improving the accuracy of feature identification as remote sensing proceeded. Objects located during remote sensing were recorded the same manner as those discovered through surface survey. This approach has proven valuable for detecting surface and subsurface archaeological features, as well as for evaluating their state of preservation [2]. It is interesting to notice that some of the detected burial mounds had been destroyed but still their traces were seen on the satellite images and thus they were registered as archaeological sites (Fig. 3).
Fieldwork In an attempt to make the surface survey as systematic as possible, survey strategies varied only according to environmental conditions, not the investigators' assumptions about where sites might be found. Such environmental conditions were recognized as the most significant criteria affecting artifact detection [26]. The strategies employed during fieldwork in the Kazanlak region included: 1. intensive survey in areas of high surface visibility and easy to moderate passability, 2. extensive survey in areas of low surface visibility and easy to moderate
passability, and 3. adverse terrain survey in areas of low surface visibility and difficult accessibility [2]. High-resolution satellite imagery together with topographic maps in different scales were used as a base map, and units were drawn directly into a GPS-equipped PDA and Trimble Juno SB handheld devices running ESRI ArcPAD v. 7.0 and v. 10.0. All other information was recorded on paper forms. A sophisticated geodatabase was created in ArcGIS for collecting all the results.
Fig. 4
European SCGIS Conference “Best practices: Application of GIS technologies for conservation of natural and cultural heritage sites” 2012
Page 57
Fieldwork methodology was dictated according to the characteristics of the land cover and, mostly, to the visibility status. The already established AKB surveying methods were adapted for the needs of the mobile GIS and the present project. According to the accepted field methodology the covered area builds a survey unit, named “polygon” in the survey terminology. The last is marked in the handheld device. The unit dimensions are defined according to the landscape characteristics, the observations possibilities and the number of participants (e.g. 5). In areas with good surface visibility (higher than 50 %) intensive surveys are performed: the participants are walking in a row at a distance of 10 to 15 m, counting the surface
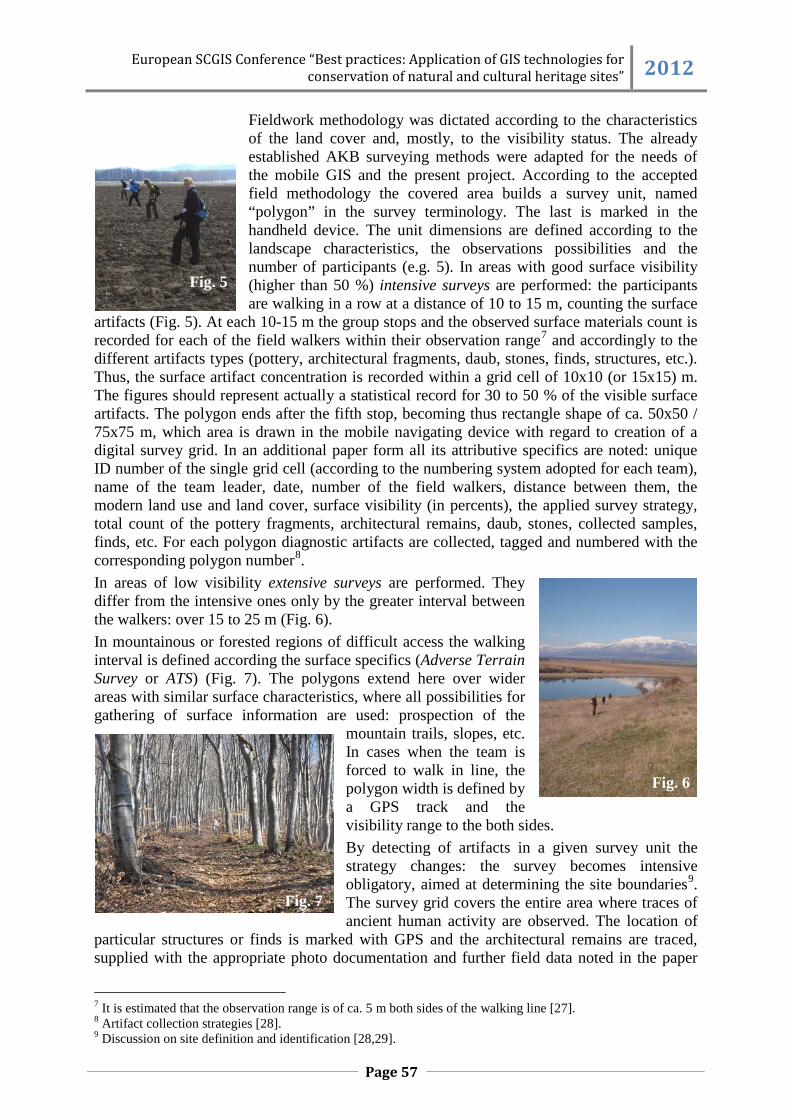
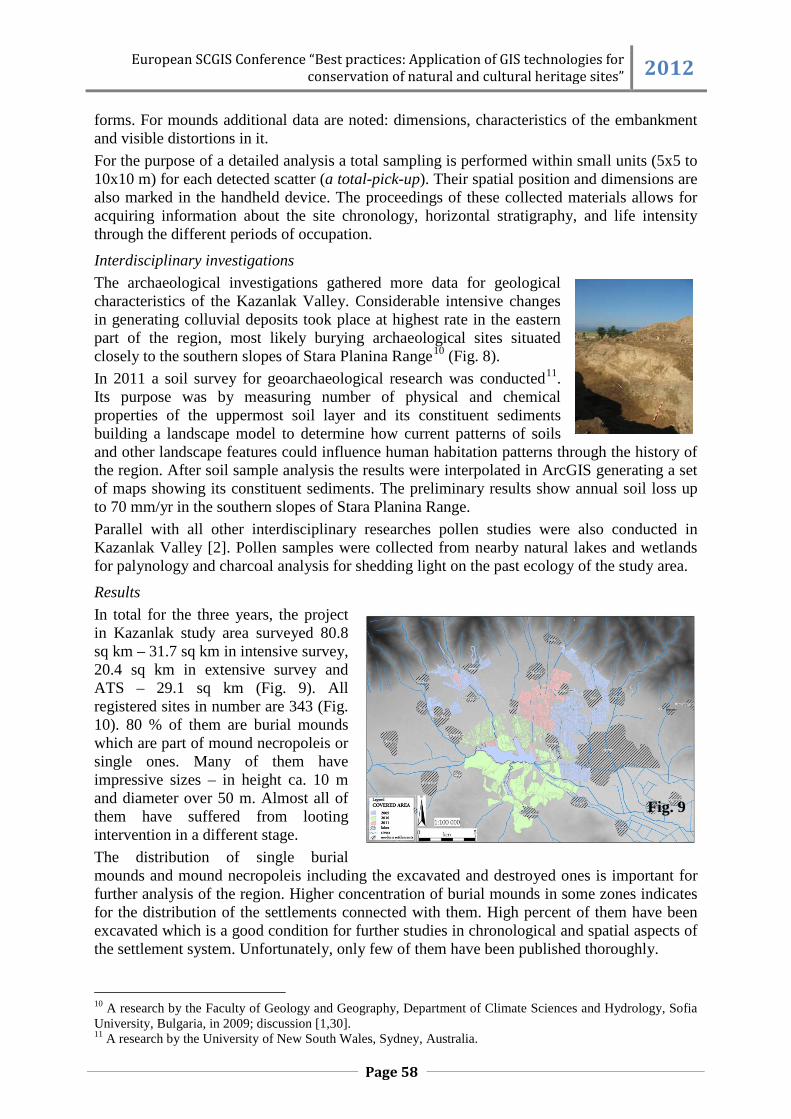
artifacts (Fig. 5). At each 10-15 m the group stops and the observed surface materials count is recorded for each of the field walkers within their observation range7 and accordingly to the different artifacts types (pottery, architectural fragments, daub, stones, finds, structures, etc.). Thus, the surface artifact concentration is recorded within a grid cell of 10x10 (or 15x15) m. The figures should represent actually a statistical record for 30 to 50 % of the visible surface artifacts. The polygon ends after the fifth stop, becoming thus rectangle shape of ca. 50x50 / 75x75 m, which area is drawn in the mobile navigating device with regard to creation of a digital survey grid. In an additional paper form all its attributive specifics are noted: unique ID number of the single grid cell (according to the numbering system adopted for each team), name of the team leader, date, number of the field walkers, distance between them, the modern land use and land cover, surface visibility (in percents), the applied survey strategy, total count of the pottery fragments, architectural remains, daub, stones, collected samples, finds, etc. For each polygon diagnostic artifacts are collected, tagged and numbered with the corresponding polygon number8. In areas of low visibility extensive surveys are performed. They differ from the intensive ones only by the greater interval between the walkers: over 15 to 25 m (Fig. 6). In mountainous or forested regions of difficult access the walking interval is defined according the surface specifics (Adverse Terrain Survey or ATS) (Fig. 7). The polygons extend here over wider areas with similar surface characteristics, where all possibilities for gathering of surface information are used: prospection of the
mountain trails, slopes, etc. In cases when the team is forced to walk in line, the polygon width is defined by a GPS track and the visibility range to the both sides. By detecting of artifacts in a given survey unit the strategy changes: the survey becomes intensive obligatory, aimed at determining the site boundaries9. The survey grid covers the entire area where traces of ancient human activity are observed. The location of
particular structures or finds is marked with GPS and the architectural remains are traced, supplied with the appropriate photo documentation and further field data noted in the paper
7 It is estimated that the observation range is of ca. 5 m both sides of the walking line [27]. 8 Artifact collection strategies [28]. 9 Discussion on site definition and identification [28,29].
Fig. 5
Fig. 6
Fig. 7
European SCGIS Conference “Best practices: Application of GIS technologies for conservation of natural and cultural heritage sites” 2012
Page 58
forms. For mounds additional data are noted: dimensions, characteristics of the embankment and visible distortions in it. For the purpose of a detailed analysis a total sampling is performed within small units (5x5 to 10x10 m) for each detected scatter (a total-pick-up). Their spatial position and dimensions are also marked in the handheld device. The proceedings of these collected materials allows for acquiring information about the site chronology, horizontal stratigraphy, and life intensity through the different periods of occupation.
Interdisciplinary investigations The archaeological investigations gathered more data for geological characteristics of the Kazanlak Valley. Considerable intensive changes in generating colluvial deposits took place at highest rate in the eastern part of the region, most likely burying archaeological sites situated closely to the southern slopes of Stara Planina Range10 (Fig. 8). In 2011 a soil survey for geoarchaeological research was conducted11. Its purpose was by measuring number of physical and chemical properties of the uppermost soil layer and its constituent sediments building a landscape model to determine how current patterns of soils and other landscape features could influence human habitation patterns through the history of the region. After soil sample analysis the results were interpolated in ArcGIS generating a set of maps showing its constituent sediments. The preliminary results show annual soil loss up to 70 mm/yr in the southern slopes of Stara Planina Range. Parallel with all other interdisciplinary researches pollen studies were also conducted in Kazanlak Valley [2]. Pollen samples were collected from nearby natural lakes and wetlands for palynology and charcoal analysis for shedding light on the past ecology of the study area.
Results In total for the three years, the project in Kazanlak study area surveyed 80.8 sq km – 31.7 sq km in intensive survey, 20.4 sq km in extensive survey and ATS – 29.1 sq km (Fig. 9). All registered sites in number are 343 (Fig. 10). 80 % of them are burial mounds which are part of mound necropoleis or single ones. Many of them have impressive sizes – in height ca. 10 m and diameter over 50 m. Almost all of them have suffered from looting intervention in a different stage. The distribution of single burial mounds and mound necropoleis including the excavated and destroyed ones is important for further analysis of the region. Higher concentration of burial mounds in some zones indicates for the distribution of the settlements connected with them. High percent of them have been excavated which is a good condition for further studies in chronological and spatial aspects of the settlement system. Unfortunately, only few of them have been published thoroughly.
10 A research by the Faculty of Geology and Geography, Department of Climate Sciences and Hydrology, Sofia University, Bulgaria, in 2009; discussion [1,30]. 11 A research by the University of New South Wales, Sydney, Australia.
Fig. 8
Fig. 9

European SCGIS Conference “Best practices: Application of GIS technologies for conservation of natural and cultural heritage sites” 2012
Page 59
Small number of the settlement sites present full data for their chronology. Thus, it is possible to draw some general conclusions. With the exception of settlement mounds there are no other multilayer settlements with vertical stratigraphy. There exist few examples for archaeological sites with horizontal stratigraphy. Most of them have been functioning within the framework of one or two archaeological periods. Topographical continuity is observed in some cases only between Early and Late Iron Age as well as Antiquity and Medieval Ages12. Settlement patterns in the covered area are presented by all types of settlements from the Neolithic to the Late Medieval Age (Fig. 11). In the Late Iron Age settlement development shows gradient progress which shows the importance of this region in the period. Another characteristic of settlement patterns involves settlements on the spurs of the Stara Planina Range. Easily defensible and with excellent views over Tundzha Valley, the sites on these spurs may represent guard towers or fortresses controlling the access to the valley and monitoring the traffic into and out of mountain passes. Overall the number of settlements and mound necropoleis demonstrate that the Thracian city of Seuthopolis was situated within a well inhabited landscape [1,2].
Fig. 11
Based on the results of the surface survey of the first campaign, in 2009 three most perspective sites were selected for magnetometry, which in turn informed limited trial excavations. The results from the magnetometrical investigations showed burnt features in the same places where the highest concentrations of archaeological materials were located (Fig. 12). Excavation results are published elsewhere [31,32,33]. Preliminary results demonstrate that this type of surface
survey is an efficient method of archaeological fieldwork in Bulgaria. The application of GIS technologies during the fieldwork (mobile GIS and GPS devices) followed by entering the gathered field information in the ArcGIS geodatabase for further interpolation and analysis was vital part of the project (Fig. 13). In particular, survey has shed light on the origins and context of the Thracian city of Seuthopolis, yielding both permanent and temporary settlements in it vicinity. Full coverage of certain areas is going to give a better idea for a
12 Further discussion [1,2,3,4,5].
Archaeological Sites
8 10 1220
15 13
0
5
10
15
20
25
Neolithic/EneolithicAge
Bronze Age Early Iron Age Late Iron Age Antiquity Medieval Age
Fig. 10
Fig. 12

European SCGIS Conference “Best practices: Application of GIS technologies for conservation of natural and cultural heritage sites” 2012
Page 60
more complete picture of the development of the settlement patterns in different ages. The crescent number of applications of these techniques in Bulgarian archaeological surface surveys will be very helpful in improving the digital database of AKB.
REFERENCES [1] Нехризов, Г.; Ю. Цветкова; А. Соботкова & Ш. Рос. Теренни обхождания за издирване на археологически обекти в Казанлъшката котловина през 2009-2010 г. (предварителни резултати). Казанлък в миналото и днес, VІІІ, Казанлък, 2011, стр. 114-124.
[2] Sobotkova, A.; S. Ross; G. Nehrizov & B. Weissova. Tundzha Regional Archaeological Project Kazanluk Survey: Preliminary Report. Spring 2009 and 2010. Studia Hercynia XIV, Pragae, 2010, pp 56-66 with Pls. 24-27.
[3] Нехризов, Г. Теренни обхождания в Казанлъшката котловина. Археологически открития и разкопки през 2009 г., София, 2010, стр. 649-651.
[4] Нехризов, Г.; Ю. Цветкова; А. Соботкова & Е. Божинова. Издирване на археологически обекти в Казанлъшката котловина. Археологически открития и разкопки през 2010 г., София, 2011, стр. 571-574.
[5] Нехризов, Г. & Ю. Цветкова. Издирвания на археологически обекти в Казанлъшката котловина. Археологически открития и разкопки през 2011 г., София, 2012, стр. 550-552.
[6] Илиев, И. & С. Бакърджиев. Теренни обхождания в Ямболска област. Археологически открития и разкопки през 2009 г., София, 2010, стр. 651-652.
[7] Aтанасов, Б.; В. Петков; И. Кулов; М. Гребска-Кулова; Б. Думанов; Ж. Узунов; Д. Гърбов; К. Чукалев & В. Герчева. Експедиция Струма 2009 г., Археологически открития и разкопки през 2009 г., София, 2010, стp. 676-678.
[8] Prahov, N.; H. Angelova; A. Kotsev; A. Popov & S. Dimitrov. Predictive modeling in archaeology: World practice and Bulgarian perspectives (Bulgarian, English Summary), Bulgarian e-Journal of Archaeology 1, 2011, pp 71-121, http://be-ja.org/wp-content/uploads/2011/11/Be-JA_1_2011_71-121.pdf
[9] Nekhrizov, G.; L. E. Roller; M. Vassileva; J. Tzvetkova & N. Kecheva. Gluhite Kamani: Old Questions and New Approaches, Thracia 20, Sofia 2012, pp 215-233.
[10] Нехризов, Г.; Ю. Цветкова & Н. Кечева. Издирвания на археологически обекти в района на скалния комплекс Глухите камъни. Археологически открития и разкопки през 2011 г., София, 2012, стр. 561-563.
[11] Лещаков, П.; Г. Самичкова; Н. Христов; С. Трифонов & Ц. Арнаудов. Издирвания на археологически обекти в околностите на праисторически солодобивен център
Fig. 13

European SCGIS Conference “Best practices: Application of GIS technologies for conservation of natural and cultural heritage sites” 2012
Page 61
Провадия-Солницата. Археологически открития и разкопки през 2011 г., София, 2012, стр. 535-537.
[12] Nekhrizov, G.; J. Tzvetkova & N. Kecheva. Mobile GIS and the Perspectives for Archaeological Surface Surveys in Bulgaria. Survey in Archaeology: Often a Neglected Science. Survey Method – Study Cases. (in print)
[13] Табакова-Цанова, Г. Принос към Археологическата карта на Казанлъшкия район. Сборник „Тракийската култура през елинистическата епоха в Казанлъшкия край,” Казанлък, 1991, стр. 104-124.
[14] Домарадски, М. Културата на траките през късножелязната епоха в Казанлъшкия край, Сборник „Тракийската култура през елинистическата епоха в Казанлъшкия край,” Казанлък, 1991, стр. 126-141.
[15] Lasapona, R. & N. Masini. Satellite Remote Sensing in Archaeology: Past, Present and Future Perspectives. Journal of Archaeological Science, 38, 2011, pp 1995-2002.
[16] Satellite Remote Sensing. A New Tool for Archaeology. Remote Sensing and Digital Image Processing. Eds. R. Lasaponara & N. Masini. Volume 16, Springer Science+Business Media B.V., 2012.
[17] Fowler, M. J. Satellite Remote Sensing and Archaeology: a Comparative Study of Satellite Imagery of the Environs of Figsbury Ring, Wiltshire. Archaeological Prospection, 9, 2002. pp 55-69.
[18] Ur, J. A. CORONA satellite photography and ancient road networks: A Northern Mesopotamian case study. Antiquity, 77 (295), 2003, pp 102-115.
[19] Lasapona, R. & N. Masini. On the Potential of Quickbird Data for Archaeological Prospection. International Journal of Remote Sensing, 27, 2006, pp 3607-3614.
[20] Lasapona, R. & N. Masini. Detection of Archaeological Crop Marks by Using Satellite QuickBird Multispectral Imagery. Journal of Archaeological Science, 34, 2007, pp 214-221.
[21] Garrison, T. G.; S. D. Houston; C. Golden; T. Inomata; Z. Nelson & J. Munson. Evaluating the use of IKONOS satellite imagery in lowland Maya settlement archaeology. Journal of Archaeological Science, 35, 2008, pp 2770-2777.
[22] Casana, J. & J. Cothren. Stereo analysis, DEM extraction and orthorectification of CORONA satellite imagery: archaeological applications from the Near East. Antiquity, 82 (317), 2008, pp 732-749.
[23] Galiatsatos, N.; D. N. M. Donoghue & G. Philip. High Resolution Elevation Data Derived from Stereoscopic CORONA Imagery with Minimal Ground Control: An Approach Using Ikonos and SRTM Data. Photogrammetric engineering and remote sensing, 74 (9), 2008, pp 1093-1106.
[24] Ross, S.; A. Sobotkova & G. Burgers. Remote Sensing and Archaeological Prospection in Apulia, Italy. Journal of Field Archaeology, 34, 4, 2009, pp 423-437.
[25] Lasapona, R. & N. Masini. Identification of Archaeological Buried Remains Based on the Normalized Difference Vegetation Index (NDVI) from QuickBird Satellite Data. Institute of Electrical and Electronics Engineers Transactions on Geoscienceand Remote Sensing Letters 3, 2006, pp 325-328.
[26] Terrenato, N. & A. Ammerman. Visibility and site recoveiy in the Cecina Valley survey, Italy. Journal of Field Archaeology, 23, 1996, pp 91-110

European SCGIS Conference “Best practices: Application of GIS technologies for conservation of natural and cultural heritage sites” 2012
Page 62
[27] Bintliff, J. & A. Snodgrass, Off-Site Pottery Distributions: A Regional and Interregional Perspective. Current Anthropology, 29, 3, 1988, pp 506-513.
[28] Bintliff, J.; M. Kuna & N. Venclová (eds.), The Future of Surface Artefact Survey in Europe (Sheffield Archaeological Monographs, 13). Sheffield Academic Press, 2000.
[29] Gallant, T. W. “Background Noise” and Site Definition: A Contribution to Survey Methodology, Journal of Field Archaeology, 13, 4, 1986, pp 403-418.
[30] Нехризов, Г. & М. Първин. Надгробна могила със зидана гробница при с. Долно Изворово, община Казанлък. Археологически открития и разкопки през 2009 г., София, 2010, стр. 232-234.
[31] Божинова, Е. Сондажно проучване на селищен обект от ранножелязната епоха и късния халколит в м. Карабеглик, с. Горно Черковище, Казанлъшко. Археологически открития и разкопки през 2009 г., София, 2010, стр. 141-144.
[32] Божинова, Е. Археологическо проучване на селище от ранната желязна епоха и късния халколит в м. Карабеглик, с. Горно Черковище, Казанлъшко. Казанлък в миналото и днес, VІІІ, Казанлък, 2011, стр. 43-69.
[33] Нехризов, Г. & Ю. Цветкова. Сондажни проучвания на обект при гр. Казанлък. Археологически открития и разкопки през 2009 г., София, 2010, стр. 144-146.
Related Documents
![,l];O - Kazanlak](https://static.cupdf.com/doc/110x72/621d9b624cb470683427db37/lo-kazanlak.jpg)