Welcome message from author
This document is posted to help you gain knowledge. Please leave a comment to let me know what you think about it! Share it to your friends and learn new things together.
Transcript


Hyderabad adds zing to the opening edition of Propindex Volume III
Telangana may be debated in political and social circles and opinions may bedivided over whether it was a politically correct move. But Hyderabad’sproperty market has clearly shown that these issues need not determine thecourse of the city’s business or property markets. A whopping 11 per cent riseas compared to the national average of 2 per cent. The Price Monitor’s 10 percent rise shows the city’s growth has been across the board and fairly even.
Hyderabad was no aberration. At a time of rising inflation, slowing economyand a country headed towards general elections, the country’s real estatemarkets have shown that residential markets are dictated by soundfundamentals and realistic price. Chennai’s growth was on the back of apotisive business environment and steadily increasing stock along growthcorridors. Bangalore’s falling index value was largely because of thecorrection in values in the North zone which has pushed the city index up inan earlier quarter. Delayed infrastructure projects also got a clear thumbsdown from consumers. Positive growth stories from Ahmedabad is mirroredin its rising index values.
Does this indicate that the Indian property buyer has matured? Trends showthat with the exit of the investor and speculator, end users are driving trendsbased on sound economic growth and structured planned infrastructure.India may well be moving towards a planned growth story, at least in theproperty markets with values as the monitor of city governance.
City zones have a distinct role to play. So also do transport links. As theadvance of the metro as well as flyovers and expressways expose the lesserknown areas to access and therefore structured development, developers aremoving in with projects that attract all ends of the spectrum.
This is the 9th issue of PropIndex and 9 straight quarters of reporting marketperformance has led to Magicbricks.com building a large repository ofdata/values about property markets across cities. It shows that demandremains robust across the spectrum. The requirement at the base of thepyramid remains strong and select cities have seen the private sector cateringto these. But surprisingly for a weak economic scenario, the demand at the topof the pyramid showed robust growth in demand, fuelled by end users. High-end consumers have seen this as an opportunity to upgrade lifestyle and seekbetter, newer units with amenities to match their growing expectations. Butthe winners have been those who have managed to strike a balance betweenprice, amenities and luxury. So go ahead and invest intelligently and let ourvalues be your guide
FOREWORD
Sudhir PaiBusiness Head, [email protected]

MagicBricksPropIndexMagicBricks.comPropIndex is a tool whichempowers propertyseekers and investors withdetailed information onthe movement ofresidential apartmentprices and supply ofproperties in India. Nocredible property indexcan be a function of directvalues as the changes aregoverned by multiplefactors.
MagicBricks.comPropIndex has taken thisreality into account andproduced an index basedon listing of apartmentsand their capital andrental values on thewebsite.
MagicBricks.com has over 500,000 active propertiesposted by more than1,50,000 active users in 300cities and 10,000 localities.Our users include owners,agents and developers.
MethodologyApartment values arebased on listings onMagicBricks.com. Theseinclude multistoreyapartments and singleunits on plotteddevelopments, referred toas builder floors onMagicBricks.com.
The Index is structured in
such a way that individualproperties are aggregatedinto their respective citiesand then to the NationalIndex. Weightages forPropIndex are based on thesupply of propertieswithin the locality/city.Based on this structure,PropIndex gives a realisticpicture of trends inprice/supply acrossdifferent property marketsin each city. We have useddifferent weightages forListed Price Monitor/RentMonitor. Therefore, read asa whole, PropIndex alongwith tables provided forListed Price Monitor, RentMonitor, Yield Monitor andCapital Values, gives anexcellent perspective ofthe property marketperformance in thequarter.
While listing and itsvalues/supply provide alevel of understandinginto the market, there aremeticulous data checks toprevent aberrationscreeping into the Index.These are based onstatistical calculations,industry inputs and logicalinterpretations.
The National PropertyIndex (NPI) is indicative ofthe extent of activity aswell as price movementsacross cities and localitiesin the major cities activeon MagicBricks.com. Theindex includes the top 11
cities (these have beenchosen based on theiractivity levels) and has anindividual city report foreach of these cities. Whilethe NPI and its movementsare of interest to theexpert community ofbankers, builders andinvestors, the PropIndexhas also taken care toexplain the nuances ofindex movements at thelocality level that wouldhelp the huge base ofMagicBricks.comconsumers.
Insights into consumerdemand have beengathered through analysisof search information onthe site. This helpsunderstand the bestlocalities by demand, thetype and configuration ofunits as well as the budget-wise preferences.
The PropIndex is the resultof meticulous research atthe locality level andthrough detaileddiscussions with experts atMagicBricks.com’s offlineand online initiatives.
The Indian real estatemarket is dynamic and thePropIndex reflects thosechanges. Since it is derivedfrom a dynamic database,additions and deletions oflocalities happen as afunction of marketdynamics.
METHODOLOGY
There is a wealth of information within these pages. For better readability, we have presented some data as tablesand others as graphs. Between them, you will find how property markets have performed in the Apr-Jun 2013quarter from different perspectives – from that of capital appreciation, from a rental/yield realisationperspective and from a supply standpoint. Also in Demand Analysis section, understand what consumers look for.
We recommend that you evaluate the city report in its entirety and that will provide a rounded perspective of theperformance of the property market within each city. Here are the details of what you will find in each of the cityreports enclosed within -
1. City Property Index – This is a composite index which is a function of supply of properties as well as theaverage capital appreciation/drop in various localities of the city in the quarter. The city index is theweighted average of the average rate per square foot in that locality and the supply of properties from thatlocality. Premium localities (with higher average rate per square foot) as well as localities with higher supplyof properties will have a bigger impact on the Index. For example, if the supply of properties from apremium locality drops, that locality will end up having a lower weightage in the index which in turn willpush the Index downwards (and vice-versa). On the other hand, supply of properties remaining unchanged,the Index will be influenced by capital appreciation within the locality.
2. Listed Price Monitor – This metric shows the capital appreciation/drop within a locality and is calculatedon the basis of movement in the “average rate per square foot” within that locality. By and large, themovement in the “average rate per square foot” reflects capital appreciation/ drops. However, in a few selectcases, we have observed that the average rate per square foot moves due to a change in the mix of apartmentswithin that locality (e.g. if the ratio of premium apartments, which command a higher per square foot rate,changes over the quarter). In these few circumstances, the Listed Price Monitor will, in turn, reflect thisinput. Such changes have been explained in the text of the City Reports.
3. Rent Monitor – This reflects the rental appreciation/drop within a locality. It is calculated on the basis ofmovement in the “average rent per square foot” within that locality. By and large, the movement in the“average rent per square foot” reflects rental appreciation/drops. However, in a few selected cases, we haveobserved that the average rent per square foot moves due to a change in the mix of apartments within thatlocality (e.g. if the ratio of premium apartments, which command a higher per square foot rent, changes overthe quarter). In these few circumstances, the Rent Monitor will, in turn, reflect this input. Such changes havebeen explained in the text of the City Reports.
4. Yield Meter – Yield is the annual rate of return earned on property. The Yield Meter depicts the gross yieldpercentages across various localities. Gross yield is a ratio of average annual rental value to the averagecapital value of the property.
5. Capital Value Tables (given in Annexures) – This shows the actual range of prices within which propertieswere available in each locality in the quarter. Prices are shown in Rupees per square foot basis; these are theprevailing rates for properties in each locality.
6. Demand Analysis –This analysis of consumer demand is based on searches and requirements that usershave performed on MagicBricks.com. The top localities by demand gives an insight into consumerpeferences. The demand data has been used to arrive at various aspects of consumer requirements includingBudget-wise analysis, Property type analysis and BHK configuration analysis. This section also provides acomparison between demand and supply in the Jan-Mar, 2013 and Apr-Jun, 2013 quarters.
7. Realty News – Property market performance is also dependent on drivers outside the purview of buyingand selling. There are broadly four key drivers that determine the prospects of real estate – infrastructuresuch as water and power, transport links creating new growth corridors, policy such as rental laws, propertytax, etc and return on investment. PropIndex also focuses on news bytes that impact future prospects of realestate in the city.
GLOSSARY & DEFINITIONS
APR-JUN 2013
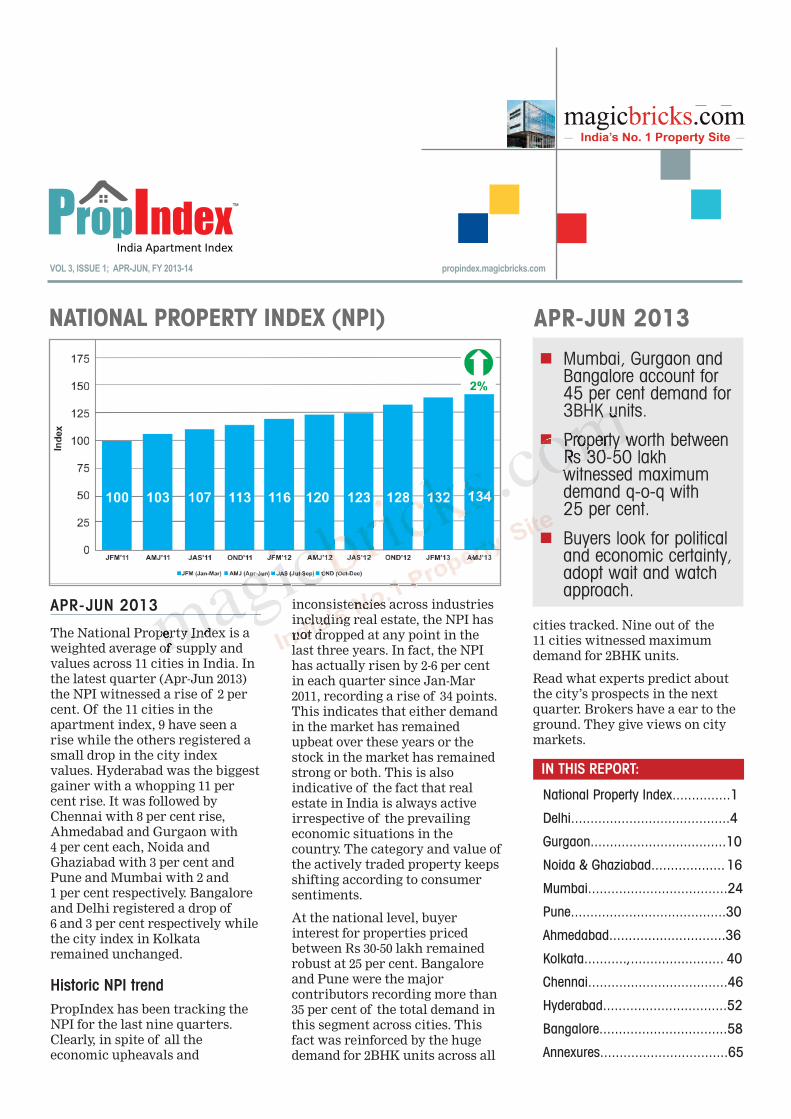
The National Property Index is aweighted average of supply andvalues across 11 cities in India. Inthe latest quarter (Apr-Jun 2013)the NPI witnessed a rise of 2 percent. Of the 11 cities in theapartment index, 9 have seen arise while the others registered asmall drop in the city indexvalues. Hyderabad was the biggestgainer with a whopping 11 percent rise. It was followed byChennai with 8 per cent rise,Ahmedabad and Gurgaon with 4 per cent each, Noida andGhaziabad with 3 per cent andPune and Mumbai with 2 and 1 per cent respectively. Bangaloreand Delhi registered a drop of 6 and 3 per cent respectively whilethe city index in Kolkataremained unchanged.
Historic NPI trend PropIndex has been tracking theNPI for the last nine quarters.Clearly, in spite of all theeconomic upheavals and
inconsistencies across industriesincluding real estate, the NPI hasnot dropped at any point in thelast three years. In fact, the NPIhas actually risen by 2-6 per centin each quarter since Jan-Mar2011, recording a rise of 34 points.This indicates that either demandin the market has remainedupbeat over these years or thestock in the market has remainedstrong or both. This is alsoindicative of the fact that realestate in India is always activeirrespective of the prevailingeconomic situations in thecountry. The category and value ofthe actively traded property keepsshifting according to consumersentiments.
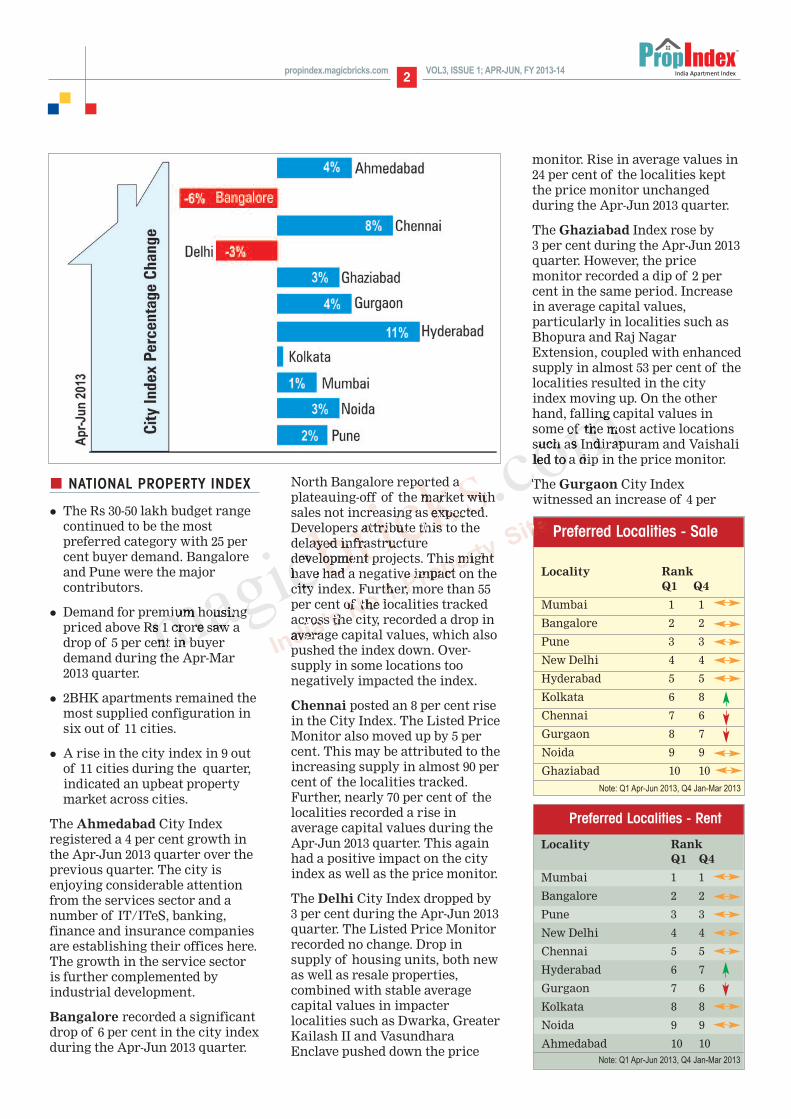
At the national level, buyerinterest for properties pricedbetween Rs 30-50 lakh remainedrobust at 25 per cent. Bangaloreand Pune were the majorcontributors recording more than35 per cent of the total demand inthis segment across cities. Thisfact was reinforced by the hugedemand for 2BHK units across all
cities tracked. Nine out of the 11 cities witnessed maximumdemand for 2BHK units.
Read what experts predict aboutthe city’s prospects in the nextquarter. Brokers have a ear to theground. They give views on citymarkets.
n Mumbai, Gurgaon andBangalore account for45 per cent demand for3BHK units.
n Property worth betweenRs 30-50 lakhwitnessed maximumdemand q-o-q with 25 per cent.
n Buyers look for politicaland economic certainty,adopt wait and watchapproach.
IN THIS REPORT:
National Property Index...............1
Delhi.........................................4
Gurgaon...................................10
Noida & Ghaziabad................... 16
Mumbai....................................24
Pune........................................30
Ahmedabad..............................36
Kolkata...........,........................ 40
Chennai....................................46
Hyderabad................................52
Bangalore.................................58
Annexures.................................65
NATIONAL PROPERTY INDEX (NPI)
VOL 3, ISSUE 1; APR-JUN, FY 2013-14
APR-JUN 2013
propindex.magicbricks.com
2VOL3, ISSUE 1; APR-JUN, FY 2013-14propindex.magicbricks.com
NATIONAL PROPERTY INDEX
l The Rs 30-50 lakh budget rangecontinued to be the mostpreferred category with 25 percent buyer demand. Bangaloreand Pune were the majorcontributors.
l Demand for premium housingpriced above Rs 1 crore saw adrop of 5 per cent in buyerdemand during the Apr-Mar2013 quarter.
l 2BHK apartments remained themost supplied configuration insix out of 11 cities.
l A rise in the city index in 9 outof 11 cities during the quarter,indicated an upbeat propertymarket across cities.
The Ahmedabad City Indexregistered a 4 per cent growth inthe Apr-Jun 2013 quarter over theprevious quarter. The city isenjoying considerable attentionfrom the services sector and anumber of IT/ITeS, banking,finance and insurance companiesare establishing their offices here.The growth in the service sectoris further complemented byindustrial development.
Bangalore recorded a significantdrop of 6 per cent in the city indexduring the Apr-Jun 2013 quarter.
North Bangalore reported aplateauing-off of the market withsales not increasing as expected.Developers attribute this to thedelayed infrastructuredevelopment projects. This mighthave had a negative impact on thecity index. Further, more than 55per cent of the localities trackedacross the city, recorded a drop inaverage capital values, which alsopushed the index down. Over-supply in some locations toonegatively impacted the index.
Chennai posted an 8 per cent risein the City Index. The Listed PriceMonitor also moved up by 5 percent. This may be attributed to theincreasing supply in almost 90 percent of the localities tracked.Further, nearly 70 per cent of thelocalities recorded a rise inaverage capital values during theApr-Jun 2013 quarter. This againhad a positive impact on the cityindex as well as the price monitor.
The Delhi City Index dropped by 3 per cent during the Apr-Jun 2013quarter. The Listed Price Monitorrecorded no change. Drop insupply of housing units, both newas well as resale properties,combined with stable averagecapital values in impacterlocalities such as Dwarka, GreaterKailash II and VasundharaEnclave pushed down the price
monitor. Rise in average values in24 per cent of the localities keptthe price monitor unchangedduring the Apr-Jun 2013 quarter.
The Ghaziabad Index rose by 3 per cent during the Apr-Jun 2013quarter. However, the pricemonitor recorded a dip of 2 percent in the same period. Increasein average capital values,particularly in localities such asBhopura and Raj NagarExtension, coupled with enhancedsupply in almost 53 per cent of thelocalities resulted in the cityindex moving up. On the otherhand, falling capital values insome of the most active locationssuch as Indirapuram and Vaishaliled to a dip in the price monitor.
The Gurgaon City Indexwitnessed an increase of 4 per
Locality RankQ1 Q4
Mumbai 1 1
Bangalore 2 2
Pune 3 3
New Delhi 4 4
Hyderabad 5 5
Kolkata 6 8
Chennai 7 6
Gurgaon 8 7
Noida 9 9
Ghaziabad 10 10
Preferred Localities - Sale
Note: Q1 Apr-Jun 2013, Q4 Jan-Mar 2013
Preferred Localities - Rent
Locality RankQ1 Q4
Mumbai 1 1
Bangalore 2 2
Pune 3 3
New Delhi 4 4
Chennai 5 5
Hyderabad 6 7
Gurgaon 7 6
Kolkata 8 8
Noida 9 9
Ahmedabad 10 10Note: Q1 Apr-Jun 2013, Q4 Jan-Mar 2013
3VOL3, ISSUE 1; APR-JUN, FY 2013-14 propindex.magicbricks.com
cent in the Apr-Jun 2013 quarter.The Listed Price Monitor alsorecorded an increase, reflectingan improved market. This wasprimarily due to increasing buyerinterest mainly from the MNCsand other offices located in thecity. An upward trend was notedin the supply as well as in theaverage listed price for more than70 per cent of the localitiestracked. This is the prime reasonfor the increased city index andthe price monitor.
After recording a 3 per cent dropin the City Index in Jan-Mar 2013,Hyderabad’s residential markethas picked up pace in the Apr-Jun2013 quarter and has gone up by 11 per cent. The Listed PriceMonitor also went up by 10 percent in the same period, clearlyindicating a healthy rise in capitalvalues across various localities.Industry experts believe that a lotof improvement in the otherwisestable market has happened due tohigh activity in the IT/ITeSindustry. This has boded well forthe real estate market as demandfor housing has received animpetus.
The Kolkata City Index did notwitness any rise during the Apr-Jun 2013 quarter. However, theListed Price Monitor rose by 3 percent. While the increasing capitalvalues in more than 60 per cent ofthe localities accounted for thepositive price monitor, a drop in
capital values of actively listedlocalities such as EM Bypass andBehala restricted the upwardmovement of the city index. Thismay be attributed to the launch ofnew projects at comparativelylower rates and a situation ofover-supply in these locations.
The City Index for Noidaregistered an increase of 3 percent in Apr-Jun 2013. IT/ITeS andother industries have led to hugeemployment generation in Noidawhich augurs well for housing.Increase in availability of units innew developing sectors coupledwith small rise in average capitalvalues across the city kept the cityindex and price monitor up.
The Pune City Index rose by 2 percent during the Apr-Jun 2013quarter on the back ofconsistently rising average capitalvalues across the city. Further, anincrease in supply also led to thepositive movement of the pricemonitor and the city index.Capital values in the city rose by1-8 per cent across differentlocalities.
The Mumbai City Index rose by 1 per cent during the Apr-Jun 2013quarter while the price monitorrose by 5 per cent. Increasedsupply in the market coupled witha rise in the average listed pricespushed up the city index and theprice monitor. Several localitiesposted higher capital values.
Upto Rs 20 Lakh Rs 20-30 Lakh Rs 30-50 Lakh Rs 50-70 Lakh Rs 70-100 Lakh Rs 1-2 Crore Rs 2 Crore & Above
National - Consumer Budget Preference
30%
25%
20%
15%
10%
5%
0%
16% 15%
25%
14%12% 11%
7%
TOP Y IELD GROSSERS
Gross yield is a ratio of average annualrental value to the average capital valueof the property. Given below are the topyield-grossing localities in each city.
Locality Gross yield
Bangalore, Electronic City 5.40%
Kolkata, EM Bypass 5.03%
Hyderabad, Kondapur 4.24%
Ahmedabad, Vejalpur 3.72%
Mumbai, Parel 3.52%
Noida, Sector-92 3.44%
Ghaziabad, Indirapuram 3.09%
Pune, Viman Nagar 3.06%
Gurgaon, MG Road 2.66%
Chennai, Anna Nagar 2.63%
Delhi, Vasundhara Enclave 2.33%
CAPITAL GAINS
The table given below indicatesmaximum increase in capital values ineach city.
Locality % Change
Noida, Sector-150 15.23%
Hyderabad, Gachibowli 14.50%
Bangalore, Koramangala 9.79%
Chennai, Saligramam 9.73%
Ghaziabad, Govindpuram 8.85%
Kolkata, Jodhpur Park 8.47%
Pune, Bavdhan 8.41%
Mumbai, Colaba 8.05%
Ahmedabad, Gurukul 6.51%
Gurgaon, Sector-86 5.63%
Delhi, Malviya Nagar 3.70%
MUMBAI 24VOL3, ISSUE 1; APR-JUN, FY 2013-14propindex.magicbricks.com
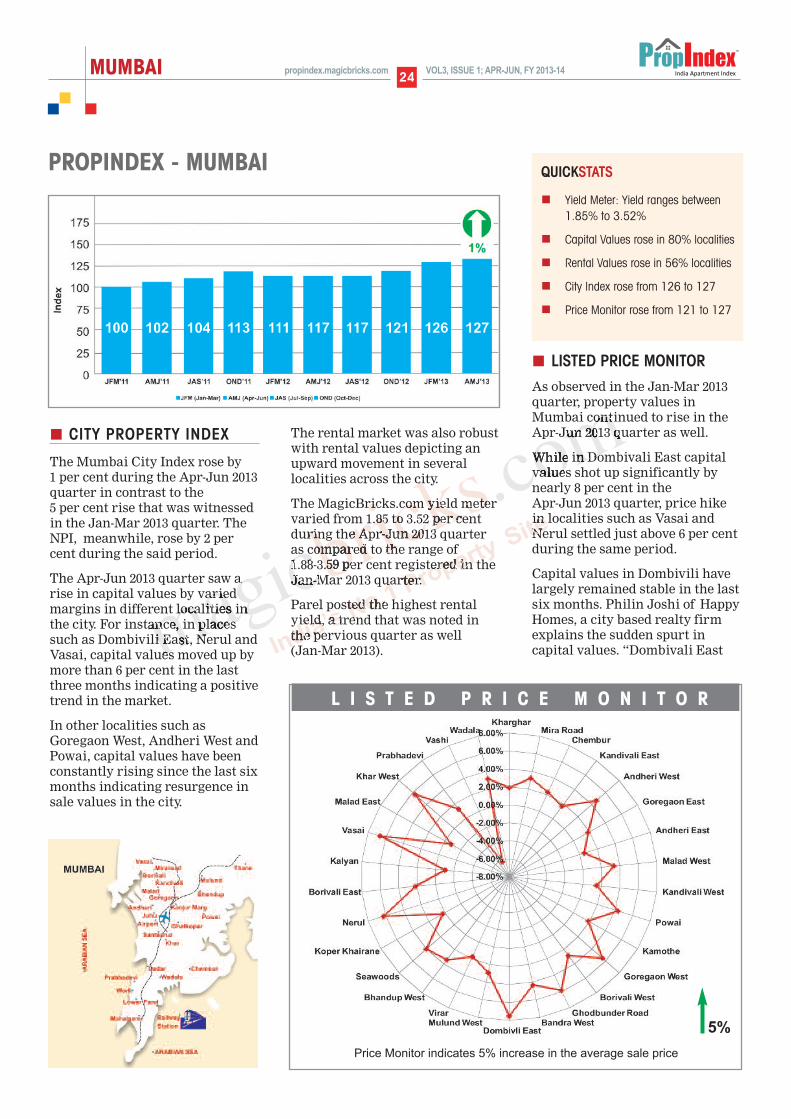
CITY PROPERTY INDEX
The Mumbai City Index rose by 1 per cent during the Apr-Jun 2013quarter in contrast to the 5 per cent rise that was witnessedin the Jan-Mar 2013 quarter. TheNPI, meanwhile, rose by 2 percent during the said period.
The Apr-Jun 2013 quarter saw arise in capital values by variedmargins in different localities inthe city. For instance, in placessuch as Dombivili East, Nerul andVasai, capital values moved up bymore than 6 per cent in the lastthree months indicating a positivetrend in the market.
In other localities such asGoregaon West, Andheri West andPowai, capital values have beenconstantly rising since the last sixmonths indicating resurgence insale values in the city.
The rental market was also robustwith rental values depicting anupward movement in severallocalities across the city.
The MagicBricks.com yield metervaried from 1.85 to 3.52 per centduring the Apr-Jun 2013 quarteras compared to the range of 1.88-3.59 per cent registered in theJan-Mar 2013 quarter.
Parel posted the highest rentalyield, a trend that was noted inthe pervious quarter as well (Jan-Mar 2013).
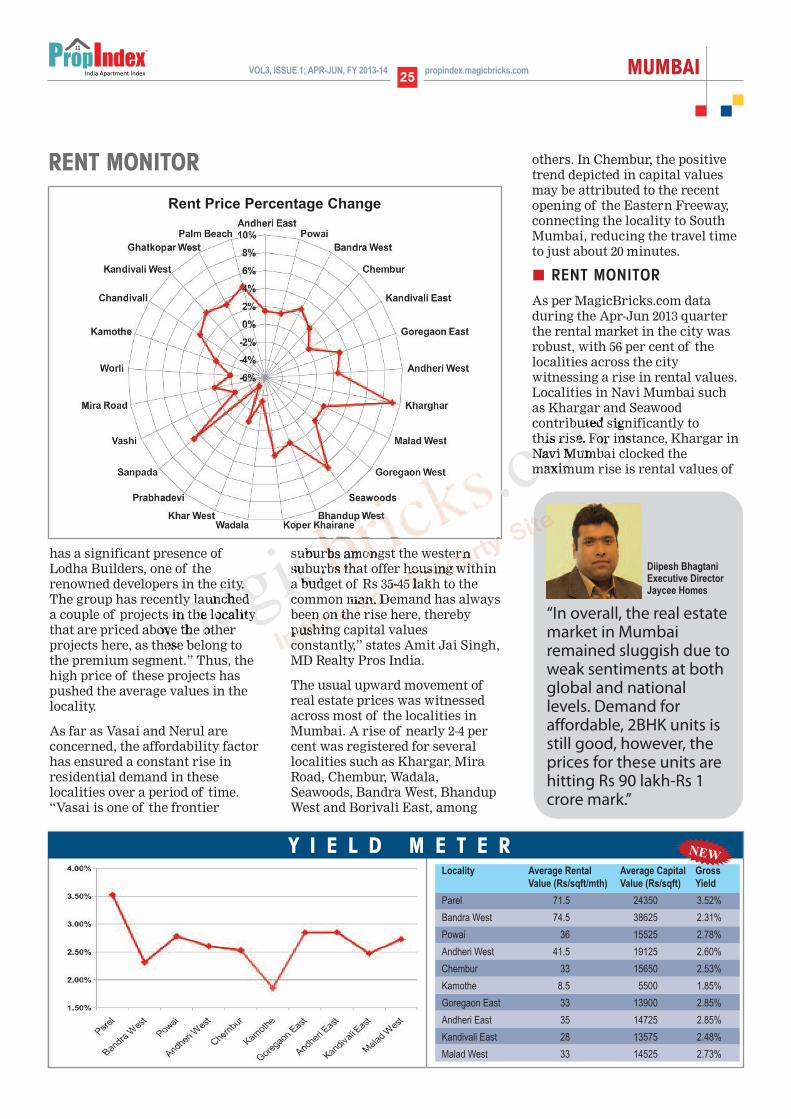
LISTED PRICE MONITOR
As observed in the Jan-Mar 2013quarter, property values inMumbai continued to rise in theApr-Jun 2013 quarter as well.
While in Dombivali East capitalvalues shot up significantly bynearly 8 per cent in the Apr-Jun 2013 quarter, price hikein localities such as Vasai andNerul settled just above 6 per centduring the same period.
Capital values in Dombivili havelargely remained stable in the lastsix months. Philin Joshi of HappyHomes, a city based realty firmexplains the sudden spurt incapital values. “Dombivali East
Price Monitor indicates 5% increase in the average sale price
L I S T E D P R I C E M O N I T O R
PROPINDEX - MUMBAI QUICKSTATS
n Yield Meter: Yield ranges between1.85% to 3.52%
n Capital Values rose in 80% localities
n Rental Values rose in 56% localities
n City Index rose from 126 to 127
n Price Monitor rose from 121 to 127
5%
MUMBAI25VOL3, ISSUE 1; APR-JUN, FY 2013-14 propindex.magicbricks.com
has a significant presence ofLodha Builders, one of therenowned developers in the city.The group has recently launcheda couple of projects in the localitythat are priced above the otherprojects here, as these belong tothe premium segment.” Thus, thehigh price of these projects haspushed the average values in thelocality.
As far as Vasai and Nerul areconcerned, the affordability factorhas ensured a constant rise inresidential demand in theselocalities over a period of time.“Vasai is one of the frontier
suburbs amongst the westernsuburbs that offer housing withina budget of Rs 35-45 lakh to thecommon man. Demand has alwaysbeen on the rise here, therebypushing capital valuesconstantly,” states Amit Jai Singh,MD Realty Pros India.
The usual upward movement ofreal estate prices was witnessedacross most of the localities inMumbai. A rise of nearly 2-4 percent was registered for severallocalities such as Khargar, MiraRoad, Chembur, Wadala,Seawoods, Bandra West, BhandupWest and Borivali East, among
others. In Chembur, the positivetrend depicted in capital valuesmay be attributed to the recentopening of the Eastern Freeway,connecting the locality to SouthMumbai, reducing the travel timeto just about 20 minutes.
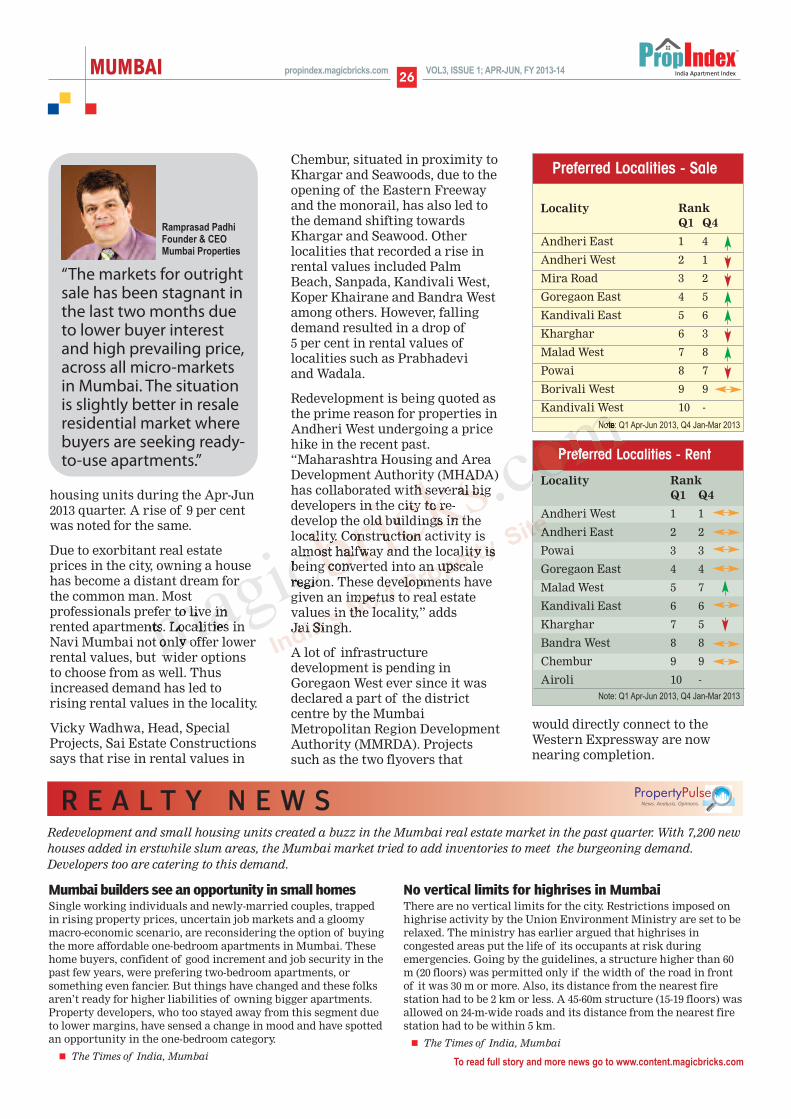
RENT MONITOR
As per MagicBricks.com dataduring the Apr-Jun 2013 quarterthe rental market in the city wasrobust, with 56 per cent of thelocalities across the citywitnessing a rise in rental values.Localities in Navi Mumbai suchas Khargar and Seawoodcontributed significantly to this rise. For instance, Khargar inNavi Mumbai clocked themaximum rise is rental values of
RENT MONITOR
Rent Price Percentage Change
“In overall, the real estatemarket in Mumbairemained sluggish due toweak sentiments at bothglobal and nationallevels. Demand foraffordable, 2BHK units isstill good, however, theprices for these units arehitting Rs 90 lakh-Rs 1crore mark.”
Diipesh BhagtaniExecutive DirectorJaycee Homes
Locality Average Rental Average Capital Gross
Value (Rs/sqft/mth) Value (Rs/sqft) Yield
Parel 71.5 24350 3.52%
Bandra West 74.5 38625 2.31%
Powai 36 15525 2.78%
Andheri West 41.5 19125 2.60%
Chembur 33 15650 2.53%
Kamothe 8.5 5500 1.85%
Goregaon East 33 13900 2.85%
Andheri East 35 14725 2.85%
Kandivali East 28 13575 2.48%
Malad West 33 14525 2.73%
Y I E L D M E T E R NEW
MUMBAI 26VOL3, ISSUE 1; APR-JUN, FY 2013-14propindex.magicbricks.com
housing units during the Apr-Jun2013 quarter. A rise of 9 per centwas noted for the same.
Due to exorbitant real estateprices in the city, owning a househas become a distant dream forthe common man. Mostprofessionals prefer to live inrented apartments. Localities inNavi Mumbai not only offer lowerrental values, but wider optionsto choose from as well. Thusincreased demand has led torising rental values in the locality.
Vicky Wadhwa, Head, SpecialProjects, Sai Estate Constructionssays that rise in rental values in
Chembur, situated in proximity toKhargar and Seawoods, due to theopening of the Eastern Freewayand the monorail, has also led tothe demand shifting towardsKhargar and Seawood. Otherlocalities that recorded a rise inrental values included PalmBeach, Sanpada, Kandivali West,Koper Khairane and Bandra Westamong others. However, fallingdemand resulted in a drop of 5 per cent in rental values oflocalities such as Prabhadevi and Wadala.
Redevelopment is being quoted asthe prime reason for properties inAndheri West undergoing a pricehike in the recent past.“Maharashtra Housing and AreaDevelopment Authority (MHADA)has collaborated with several bigdevelopers in the city to re-develop the old buildings in thelocality. Construction activity isalmost halfway and the locality isbeing converted into an upscaleregion. These developments havegiven an impetus to real estatevalues in the locality,” adds Jai Singh.
A lot of infrastructuredevelopment is pending inGoregaon West ever since it wasdeclared a part of the districtcentre by the MumbaiMetropolitan Region DevelopmentAuthority (MMRDA). Projectssuch as the two flyovers that
would directly connect to theWestern Expressway are nownearing completion.
Mumbai builders see an opportunity in small homes Single working individuals and newly-married couples, trappedin rising property prices, uncertain job markets and a gloomymacro-economic scenario, are reconsidering the option of buyingthe more affordable one-bedroom apartments in Mumbai. Thesehome buyers, confident of good increment and job security in thepast few years, were prefering two-bedroom apartments, orsomething even fancier. But things have changed and these folksaren’t ready for higher liabilities of owning bigger apartments.Property developers, who too stayed away from this segment dueto lower margins, have sensed a change in mood and have spottedan opportunity in the one-bedroom category.
n The Times of India, Mumbai
No vertical limits for highrises in Mumbai There are no vertical limits for the city. Restrictions imposed onhighrise activity by the Union Environment Ministry are set to berelaxed. The ministry has earlier argued that highrises incongested areas put the life of its occupants at risk duringemergencies. Going by the guidelines, a structure higher than 60m (20 floors) was permitted only if the width of the road in frontof it was 30 m or more. Also, its distance from the nearest firestation had to be 2 km or less. A 45-60m structure (15-19 floors) wasallowed on 24-m-wide roads and its distance from the nearest firestation had to be within 5 km.
n The Times of India, Mumbai
Redevelopment and small housing units created a buzz in the Mumbai real estate market in the past quarter. With 7,200 newhouses added in erstwhile slum areas, the Mumbai market tried to add inventories to meet the burgeoning demand.Developers too are catering to this demand.
To read full story and more news go to www.content.magicbricks.com
“The markets for outrightsale has been stagnant inthe last two months dueto lower buyer interestand high prevailing price,across all micro-marketsin Mumbai. The situationis slightly better in resaleresidential market wherebuyers are seeking ready-to-use apartments.”
Ramprasad Padhi Founder & CEOMumbai Properties
R E A L T Y N E W S
Preferred Localities - Rent
Locality RankQ1 Q4
Andheri West 1 1
Andheri East 2 2
Powai 3 3
Goregaon East 4 4
Malad West 5 7
Kandivali East 6 6
Kharghar 7 5
Bandra West 8 8
Chembur 9 9
Airoli 10 -Note: Q1 Apr-Jun 2013, Q4 Jan-Mar 2013
Locality RankQ1 Q4
Andheri East 1 4
Andheri West 2 1
Mira Road 3 2
Goregaon East 4 5
Kandivali East 5 6
Kharghar 6 3
Malad West 7 8
Powai 8 7
Borivali West 9 9
Kandivali West 10 -
Preferred Localities - Sale
Note: Q1 Apr-Jun 2013, Q4 Jan-Mar 2013
MUMBAI27VOL3, ISSUE 1; APR-JUN, FY 2013-14 propindex.magicbricks.com
Budget wise Analysis - DEMAND
120
100
80
60
40
20
0
Q4 (Jan-Mar 2013)
Q1 (Apr-Jun 2013)
Fig
ures
in p
erce
ntag
e(%
)
South Mumbai Central Line Central Western Navi Mumbai ThaneMumbai Suburbs
Q4 Q1
6059
Q4 Q1 Q4 Q1 Q4 Q1 Q4 Q1 Q4 Q1
13
12
12 11
12
14
Rs <20 lakh Rs 20-50 lakh Rs 50-100 lakh Rs 1-2 crore Rs 2 crore and above
1612
28
30
21
9
14
32
34
3736
21
23
15 17
20
23
1915
23
32
23
7
15
33
29
10
34
44
10 9
46
34
9 22
50
22 20
51
23
Budget wise Analysis - SUPPLY
120
100
80
60
40
20
0
Q4 (Jan-Mar 2013)
Q1 (Apr-Jun 2013)
Fig
ures
in p
erce
ntag
e(%
)
South Mumbai Central Line Central Western Navi Mumbai ThaneMumbai Suburbs
Q4 Q1
9093
Q4 Q1 Q4 Q1 Q4 Q1 Q4 Q1 Q4 Q1
2520
43
21
11
21
49
7879
15 13
3427
31
25
13
24
36
13
43
36 35
42
14
33
42
6
44
36
1112
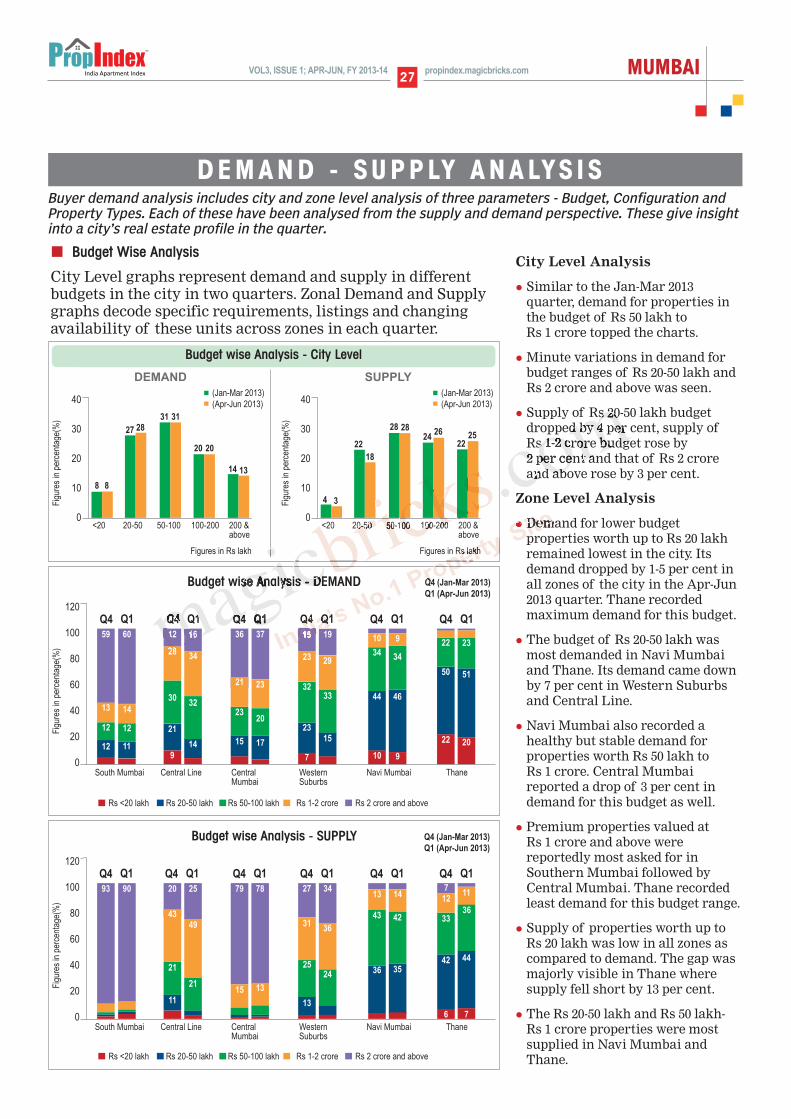
City Level Analysis
l Similar to the Jan-Mar 2013quarter, demand for properties inthe budget of Rs 50 lakh to Rs 1 crore topped the charts.
l Minute variations in demand forbudget ranges of Rs 20-50 lakh andRs 2 crore and above was seen.
l Supply of Rs 20-50 lakh budgetdropped by 4 per cent, supply of Rs 1-2 crore budget rose by 2 per cent and that of Rs 2 croreand above rose by 3 per cent.
Zone Level Analysis
l Demand for lower budgetproperties worth up to Rs 20 lakhremained lowest in the city. Itsdemand dropped by 1-5 per cent inall zones of the city in the Apr-Jun2013 quarter. Thane recordedmaximum demand for this budget.
l The budget of Rs 20-50 lakh wasmost demanded in Navi Mumbaiand Thane. Its demand came downby 7 per cent in Western Suburbsand Central Line.
l Navi Mumbai also recorded ahealthy but stable demand forproperties worth Rs 50 lakh to Rs 1 crore. Central Mumbaireported a drop of 3 per cent indemand for this budget as well.
l Premium properties valued at Rs 1 crore and above werereportedly most asked for inSouthern Mumbai followed byCentral Mumbai. Thane recordedleast demand for this budget range.
l Supply of properties worth up toRs 20 lakh was low in all zones ascompared to demand. The gap wasmajorly visible in Thane wheresupply fell short by 13 per cent.
l The Rs 20-50 lakh and Rs 50 lakh-Rs 1 crore properties were mostsupplied in Navi Mumbai andThane.
40
30
20
10
0<20 20-50 50-100 100-200 200 &
above
8
Fig
ures
in p
erce
ntag
e(%
)
Figures in Rs lakh
8
27 2831 31
20 20
14 13
(Jan-Mar 2013)
(Apr-Jun 2013)
Budget wise Analysis - City Level
DEMAND
40
30
20
10
0<20 20-50 50-100 100-200 200 &
above
4Fig
ures
in p
erce
ntag
e(%
)
Figures in Rs lakh
3
22
18
28 2824
26
2225
(Jan-Mar 2013)
(Apr-Jun 2013)
SUPPLY
7
DEMAND - S UPP LY ANALYS I S
Budget Wise Analysis
City Level graphs represent demand and supply in differentbudgets in the city in two quarters. Zonal Demand and Supplygraphs decode specific requirements, listings and changingavailability of these units across zones in each quarter.
Buyer demand analysis includes city and zone level analysis of three parameters - Budget, Configuration andProperty Types. Each of these have been analysed from the supply and demand perspective. These give insightinto a city’s real estate profile in the quarter.
7
Rs <20 lakh Rs 20-50 lakh Rs 50-100 lakh Rs 1-2 crore Rs 2 crore and above
MUMBAI 28VOL3, ISSUE 1; APR-JUN, FY 2013-14propindex.magicbricks.com
Property wise Analysis - City Level
100
80
60
40
20
0
8791
11 82 1
(Jan-Mar 2013)
(Apr-Jun 2013)
Fig
ures
in p
erce
ntag
e(%
)
Multistorey Residential Residentialapartment house plot
DEMAND SUPPLY
100
80
60
40
20
0
8893
116
1 1
(Jan-Mar 2013)
(Apr-Jun 2013)
Fig
ures
in p
erce
ntag
e(%
)
Multistorey Residential Residentialapartment house plot
Property wise Analysis - DEMAND
120
100
80
60
40
20
0
Q4 (Jan-Mar 2013)
Q1 (Apr-Jun 2013)
Fig
ures
in p
erce
ntag
e(%
)
South Mumbai Central Line Central Western Navi Mumbai ThaneMumbai Suburbs
Multistorey apartment Residential house Residential plot
Q4 Q1 Q4 Q1
8190 92
Q4 Q1
86 91
Q4 Q1
88 92
Q4 Q1
88 91
Q4 Q1
848887
17 12 9 7 13 8 11 7 9 7 14 10
Property wise Analysis - SUPPLY
120
100
80
60
40
20
0
Q4 (Jan-Mar 2013)
Q1 (Apr-Jun 2013)
Fig
ures
in p
erce
ntag
e(%
)
South Mumbai Central Line Central Western Navi Mumbai ThaneMumbai Suburbs
Multistorey apartment Residential house Residential plot
Q4 Q1 Q4 Q1
88 9195
Q4 Q1
88 93
Q4 Q1
88 94
Q4 Q1
88 92
Q4 Q1
8592
91
11 8 8 4 11 6 11 5 10 7 13 6
City Level Analysis
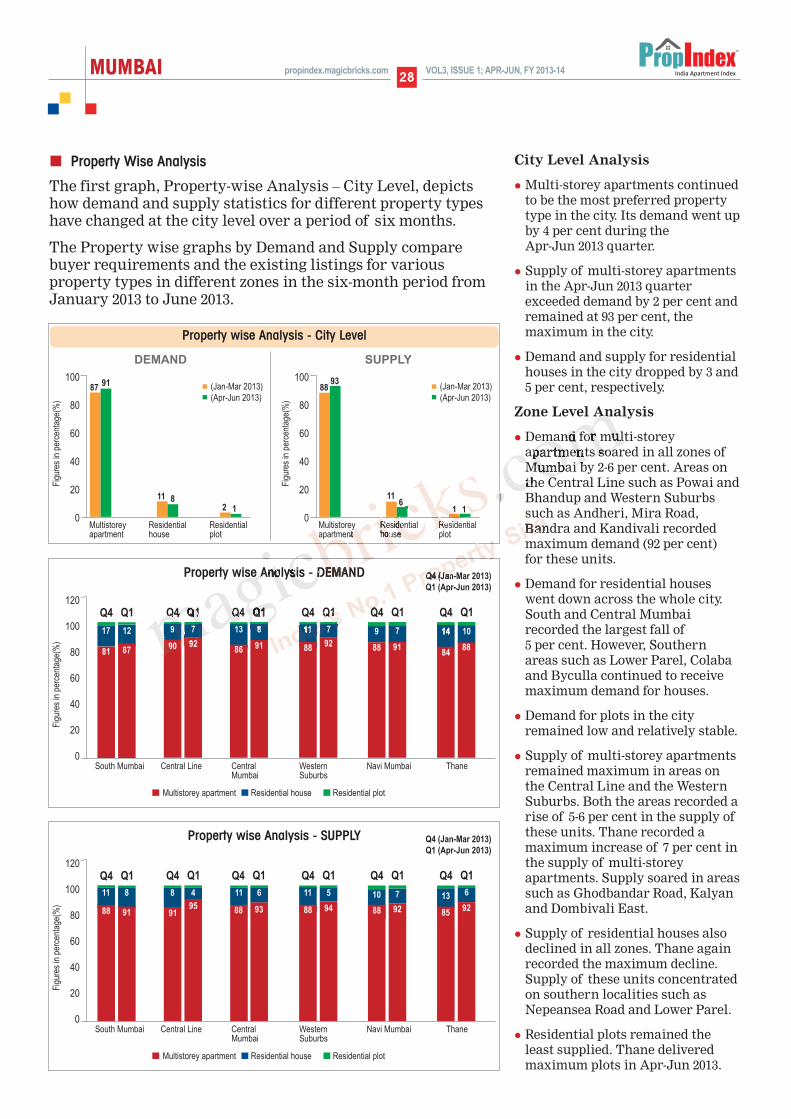
l Multi-storey apartments continuedto be the most preferred propertytype in the city. Its demand went upby 4 per cent during the Apr-Jun 2013 quarter.
l Supply of multi-storey apartmentsin the Apr-Jun 2013 quarterexceeded demand by 2 per cent andremained at 93 per cent, themaximum in the city.
l Demand and supply for residentialhouses in the city dropped by 3 and5 per cent, respectively.
Zone Level Analysis
l Demand for multi-storeyapartments soared in all zones ofMumbai by 2-6 per cent. Areas onthe Central Line such as Powai andBhandup and Western Suburbssuch as Andheri, Mira Road,Bandra and Kandivali recordedmaximum demand (92 per cent) for these units.
l Demand for residential houseswent down across the whole city.South and Central Mumbairecorded the largest fall of 5 per cent. However, Southernareas such as Lower Parel, Colabaand Byculla continued to receivemaximum demand for houses.
l Demand for plots in the cityremained low and relatively stable.
l Supply of multi-storey apartmentsremained maximum in areas onthe Central Line and the WesternSuburbs. Both the areas recorded arise of 5-6 per cent in the supply ofthese units. Thane recorded amaximum increase of 7 per cent inthe supply of multi-storeyapartments. Supply soared in areassuch as Ghodbandar Road, Kalyanand Dombivali East.
l Supply of residential houses alsodeclined in all zones. Thane againrecorded the maximum decline.Supply of these units concentratedon southern localities such asNepeansea Road and Lower Parel.
l Residential plots remained theleast supplied. Thane deliveredmaximum plots in Apr-Jun 2013.
14
Property Wise Analysis
The first graph, Property-wise Analysis – City Level, depictshow demand and supply statistics for different property typeshave changed at the city level over a period of six months.
The Property wise graphs by Demand and Supply comparebuyer requirements and the existing listings for variousproperty types in different zones in the six-month period fromJanuary 2013 to June 2013.
MUMBAI29VOL3, ISSUE 1; APR-JUN, FY 2013-14 propindex.magicbricks.com
BHK Configuration - DEMAND
120
100
80
60
40
20
0
Q4 (Jan-Mar 2013)
Q1 (Apr-Jun 2013)
Fig
ures
in p
erce
ntag
e(%
)
South Mumbai Central Line Central Western Navi Mumbai ThaneMumbai Suburbs
1 BHK 2 BHK 3 BHK 4 BHK & above
Q4 Q1 Q4 Q1 Q4 Q1 Q4 Q1 Q4 Q1 Q4 Q1
2832
37
24 28
37
3638
43
1715
46
3634
40
21 20
39
4445
38
14 15
38
4443
43
13 11
44
5556
36
7 7
37
7 7
BHK Configuration - SUPPLY
120
100
80
60
40
20
0
Q4 (Jan-Mar 2013)
Q1 (Apr-Jun 2013)
Fig
ures
in p
erce
ntag
e(%
)
South Mumbai Central Line Central Western Navi Mumbai ThaneMumbai Suburbs
1 BHK 2 BHK 3 BHK 4 BHK & above
Q4 Q1 Q4 Q1 Q4 Q1 Q4 Q1 Q4 Q1 Q4 Q1
1414
31
34 34
32
2725
42
27 28
40
1615
35
36
33
3130
40
24 23
41
33 34
49
1414
50
42 42
44
1213
43
21 20 156 16 6
34
BHK Configuration - City Level
50
40
30
20
10
0
44 44
3940
15 14
2 2
(Jan-Mar 2013)
(Apr-Jun 2013)
Fig
ures
in p
erce
ntag
e(%
)
1 BHK 2 BHK 3 BHK 4 BHK &above
DEMAND SUPPLY
50
40
30
20
10
0
31 31
42 42
21 21
6 6
(Jan-Mar 2013)
(Apr-Jun 2013)
Fig
ures
in p
erce
ntag
e(%
)
1 BHK 2 BHK 3 BHK 4 BHK &above
City Level Analysis
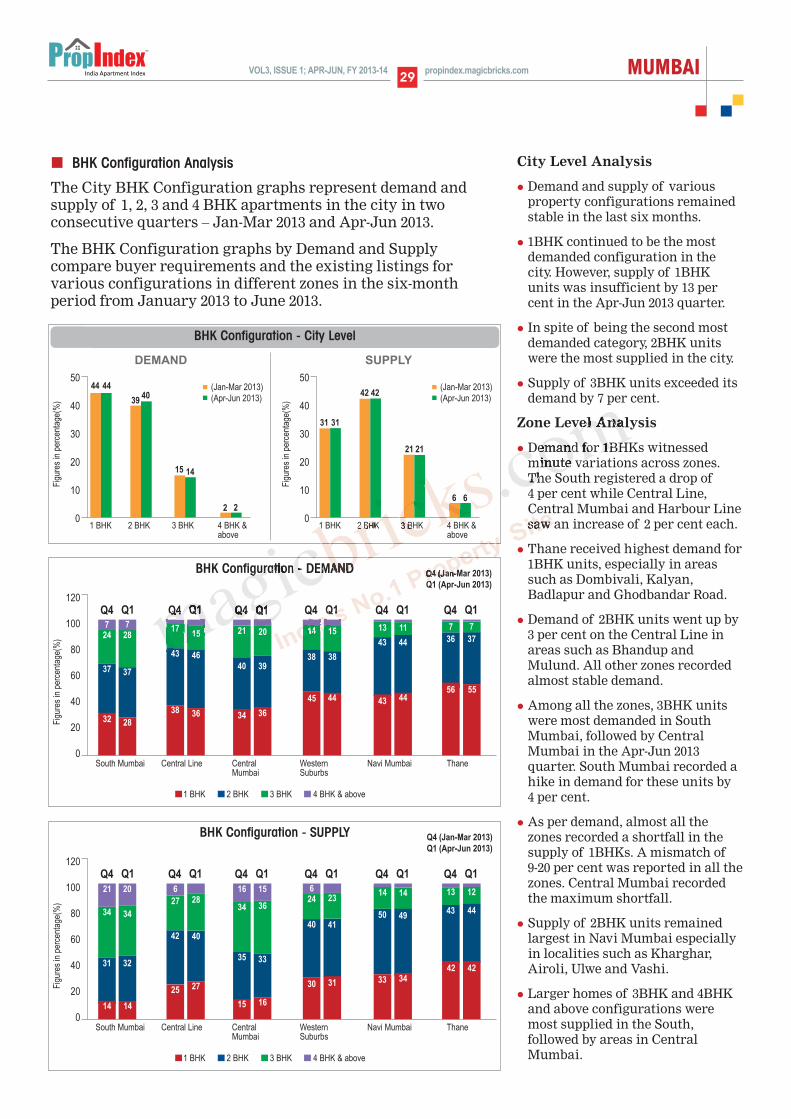
l Demand and supply of variousproperty configurations remainedstable in the last six months.
l 1BHK continued to be the mostdemanded configuration in thecity. However, supply of 1BHKunits was insufficient by 13 percent in the Apr-Jun 2013 quarter.
l In spite of being the second mostdemanded category, 2BHK unitswere the most supplied in the city.
l Supply of 3BHK units exceeded itsdemand by 7 per cent.
Zone Level Analysis
l Demand for 1BHKs witnessedminute variations across zones.The South registered a drop of 4 per cent while Central Line,Central Mumbai and Harbour Linesaw an increase of 2 per cent each.
l Thane received highest demand for1BHK units, especially in areassuch as Dombivali, Kalyan,Badlapur and Ghodbandar Road.
l Demand of 2BHK units went up by3 per cent on the Central Line inareas such as Bhandup andMulund. All other zones recordedalmost stable demand.
l Among all the zones, 3BHK unitswere most demanded in SouthMumbai, followed by CentralMumbai in the Apr-Jun 2013quarter. South Mumbai recorded ahike in demand for these units by 4 per cent.
l As per demand, almost all thezones recorded a shortfall in thesupply of 1BHKs. A mismatch of 9-20 per cent was reported in all thezones. Central Mumbai recordedthe maximum shortfall.
l Supply of 2BHK units remainedlargest in Navi Mumbai especiallyin localities such as Kharghar,Airoli, Ulwe and Vashi.
l Larger homes of 3BHK and 4BHKand above configurations weremost supplied in the South,followed by areas in CentralMumbai.
BHK Configuration Analysis
The City BHK Configuration graphs represent demand andsupply of 1, 2, 3 and 4 BHK apartments in the city in twoconsecutive quarters – Jan-Mar 2013 and Apr-Jun 2013.
The BHK Configuration graphs by Demand and Supplycompare buyer requirements and the existing listings forvarious configurations in different zones in the six-monthperiod from January 2013 to June 2013.

ANNExURES
Airoli 7550 to 8900
Ambernath 3200 to 3650
Andheri East 13500 to 16950
Andheri West 17350 to 22300
Badlapur 3000 to 3500
Bandra West 34850 to 45400
Bhakti Park 19150 to 21750
Bhandup West 11900 to 14350
Bhayandar East 5900 to 6950
Borivali East 10750 to 13600
Borivali West 11700 to 14300
Chandivali 14200 to 17050
Chembur 14450 to 17800
Dadar West 27150 to 32750
Dahisar East 8800 to 11050
Dahisar West 10250 to 12750
Dombivli East 5300 to 6500
Ghansoli 6650 to 8350
Ghatkopar West 13650 to 16450
Ghodbunder Road 7550 to 9250
Goregaon East 12700 to 16050
Goregaon West 13050 to 16550
Hiranandani Estate 10000 to 13350
Juhu 28150 to 36550
Kalyan 4350 to 5450
Kalyan West 4700 to 5750
Kamothe 5250 to 6000
Kandivali East 12550 to 15400
Kandivali West 11000 to 13650
Kanjur Marg East 11400 to 13450
Karanjade Village 4050 to 4650
Kasarvadavali 7250 to 8450
Khar West 32750 to 42050
Kharghar 6200 to 7650
Koper Khairane 7900 to 9800
Lower Parel 31200 to 41900
Mahalakshmi 32500 to 41050
Majiwada 10200 to 12200
Malad East 12000 to 14950
Malad West 13300 to 16750
Manpada 9400 to 10950
Mira Bhaiyandar Road 6050 to 7150
Mira Road 6000 to 7300
Mulund East 12700 to 15500
Mulund West 12000 to 15400
Nallasopara 3750 to 4600
Nepeansea Road 52650 to 67200
Nerul 8850 to 11300
New Panvel 3300 to 4350
Palm Beach 13550 to 17300
Panvel 3900 to 5150
Parel 22000 to 28550
Pokharan Road No. 2 10200 to 12150
Pokhran Road 10050 to 11850
Powai 14200 to 17900
Prabhadevi 33900 to 42650
Road Pali 4850 to 5650
Sanpada 10050 to 12550
Santacruz East 16200 to 20350
Santacruz West 29900 to 38500
Seawoods 8250 to 10400
Sion 13950 to 17800
Taloja 4000 to 4950
Thane West 8950 to 11750
Ulwe 4600 to 5500
Vasai 4400 to 5500
Vasant Vihar 10050 to 12300
Vashi 8850 to 11650
Vile Parle East 21700 to 26450
Virar 4050 to 5000
Wadala 18400 to 22000
Waghbil 7650 to 9000
Worli 32500 to 41250
MUMBAI69VOL3, ISSUE 1; APR-JUN, FY 2013-14 propindex.magicbricks.com
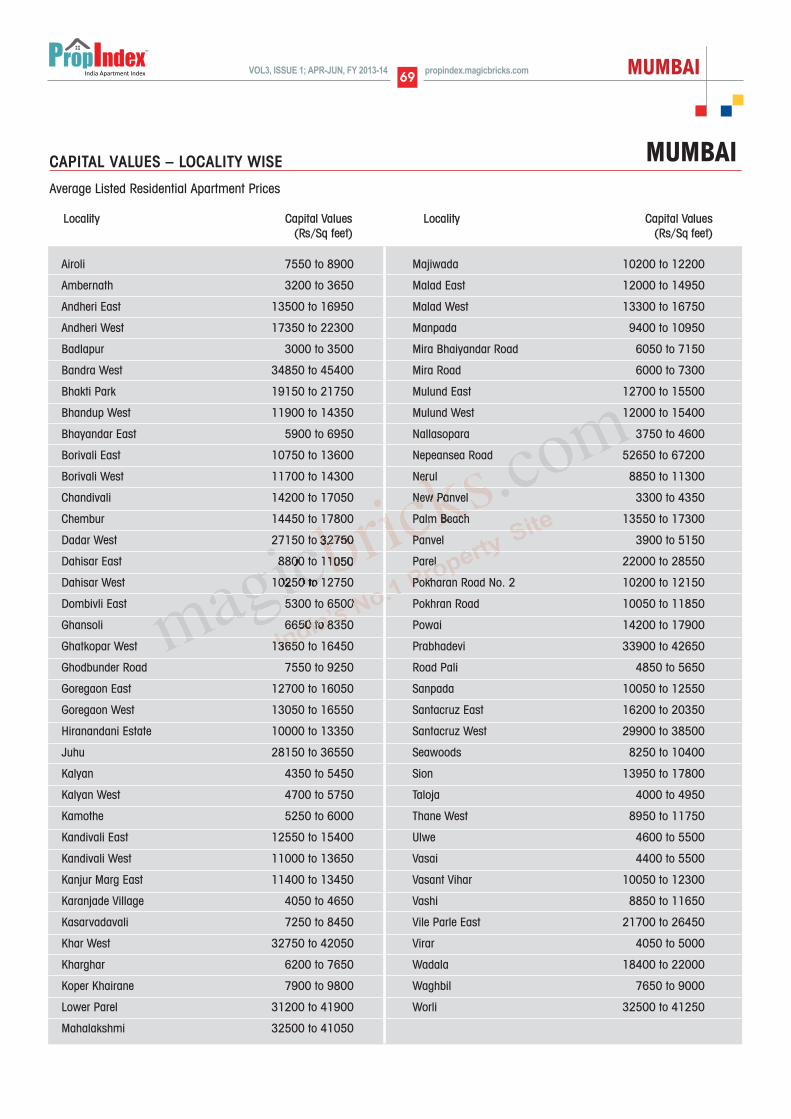
CAPITAL VALUES – LOCALITY WISE
Average Listed Residential Apartment Prices
Locality Capital Values (Rs/Sq feet)
Locality Capital Values (Rs/Sq feet)
MUMBAI


VOL3, ISSUE 1; APR-JUN, FY 2013-14propindex.magicbricks.com
D I S C L A I M E REvery effort has been made to make this Index as complete and as accurate as possible. MagicBricksaccepts no responsibility for inaccuracies in the information/data contained in this book. It shall haveneither liability nor responsibility to any person or entity with respect to any loss or damage caused, oralleged to have been caused, directly or indirectly, by the information contained in this book. Theinformation/data in this book is subject to change from time to time due to market condition.
CONTACT US
l Post your feedback to -
propindex @timesgroup.com
l Join our discussion forum at -
openhouse.magicbricks.com
l For business enquiries -
PROPINDEX TEAM
l Content & Research: E Jayashree Kurup,
Dipti Tandon, Vikram Jethwani, Rishab Jain,
Indrani Rajkhowa Banerjee, Sruthi Kailas,
Neha Nagpal, Shradha Goyal, Bhawna Mongia,
Renu Arya, Aradhana Mazumdar, Girish Bindal,
Puneet Kukreja & Bikash Kumar
l Layout Design: Harsha Khattar
l Cover Page Design: Raghav Krishnan &
Rahul Nair

Related Documents