
Welcome message from author
This document is posted to help you gain knowledge. Please leave a comment to let me know what you think about it! Share it to your friends and learn new things together.
Transcript

We are delighted to share that PropIndex has completed a year!
It has been an eventful year for us, in our quest to support a data-driven decisionmaking approach while investing in the real-estate sector. This anniversary issue isspecial and has lots extra -
l CREDAI has joined hands to make this issue special. Find commentaries fromvarious city units of CREDAI on their interpretation of market performance.
l “User Demand Analytics” has been expanded - find analysis of User Demand atSuburb level; plus we initiate “Top 10 Localities” in each city; and much more.
l We’ve expanded the coverage of localities for Capital Values to 620+.
Despite tight monetary conditions and slow offtake, values of residential propertymaintained a growth of 8-10% across cities. As a result, 9 of the 11 indexed citiesshowed a rise in the property index values. However, the cash-squeezed consumer madeshifts towards the suburbs in search of lifestyle and better deals. While broad priceranges were present at the macro level, only properties that were being actively soughtby buyers were being listed for sale. Rental markets swung to infrastructure beats androse on better transport connectivity.
We’re also happy to let you know that Magicbricks.com continues to consolidate itsmarket leadership position – we continue to gain market share every quarter. Activeclients now number 7000+; the site gets 40 lakh visits per month; and now throws up onaverage 80,000 enquiries per day! As you read this issue, we would have launched a newsection on our site to focus on “New Projects” (www.newprojects.magicbricks.com). Wecontinue to look forward to your support to make these new launches successful!
On our first anniversary, we wish to thank our readers, the developer and agentcommunity; many of whom shared feedback and pushed us to improve ouranalytics/content – and thereby helped to shape PropIndex into what it is today. We’vereceived heart-warming testimonials from Industry Stalwarts, and this continues toencourage us to work harder to make PropIndex even better. We solicit your feedbackfor the current issue - please do write in!
FOREWORD
Sudhir PaiBusiness Head, [email protected]

“The progress of sectors have been aiding the phenomenalgrowth of the Indian economy and are one of the majorcontributors to the emergence of the GDP initiation of thecountry. Now we need benchmark value indicator in thereal estate industry across the country which can guideconsumer and assist developers in analysing city rates andtrends. A shining case study in this parlance is the RealEstate sector of Hyderabad wherein revolutionary reformsin realty bye-laws along with proactive measures like theconcept of FSI, prescription of uniform setbacks for alltypes of use of buildings, density and ground coverage ofplot, permission on height of the building with reference to
plot size and the abutting road width and allowance of liberal multi-level parking havehelped the Hyderabad real estate sector to reach the zenith of the Indian realty boom.Magicbricks PropIndex provides structured and transparent matrix and I am lookingforward to consider these case studies as Benchmark in such reports. We congratulateMagicbricks.com for completing one year for this report and look forward for moreknowledge initiatives and reports from the Group.”
INDUSTRY VIEWPOINT
Lalit Kumar JainPresident, CREDAI National &Chairman, Kumar Urban Development Ltd. (KUL)
The market is mature and there is no speculation at thispoint of time. We expect that in the coming times, this willcontinue as the demand and supply ratio will remainbalanced. The investors are aware that the appreciation isa gradual process and properties will appreciate at a goodrate provided one can hold the investment for 2 to 3 years.Your magazine is a well produced, interesting andinformative package that makes it a delightful read. Thepresentation of the magazine is very attractive andcolourful, making it easy to go through. The articles aremostly supported by researched facts and figures, with thedifferent sections well thought-out and these should prove tobe popular among professionals from all walks of business and marketing.
Navin RahejaPresident, NAREDCO &
CMD, Raheja Developers
CREDAI NATIONAL PRESIDENT
NAREDCO PRESIDENT
MagicBricksPropIndexMagicBricks.comPropIndex is a tool whichempowers propertyseekers and investors withdetailed information onthe movement ofresidential apartmentprices and supply ofproperties in India. Nocredible property indexcan be a function of directvalues as the changes aregoverned by multiplefactors.
MagicBricks.comPropIndex has taken thisreality into account andproduced an index basedon listing of apartmentsand their capital andrental values on thewebsite.
MagicBricks.com has over 4 lakh active propertiesposted by more than1,00,000 active users in 300cities and 3,500 localities.Our users include owners,agents and developers.
MethodologyApartment values andlistings on the basis of theMagicBricks.comPropIndex. These includemultistorey apartmentsand single units on plotteddevelopments, referred toas builder floors onMagicBricks.com.
The Index is structured in
such a way that individualproperties are aggregatedinto respective cities andthen to the National Index.Weightages for PropIndexare based on the supply ofproperties within thelocality/city. Based on thisstructure, PropIndex givesa realistic picture oftrends in price/supplyacross different propertymarkets in each city. Wehave used differentweightages for PriceMonitor/Rent Monitor.Therefore, read as a whole,PropIndex along withtables provided for PriceMonitor, Rent Monitor,Yield Monitor and CapitalValues. PropIndex gives anexcellent perspective ofthe property marketperformance in thequarter.
While listing and itsvalues/supply provide alevel of understandinginto the market, there aremeticulous data checks toprevent aberrationscreeping into the Index.These are based onstatistical calculations andlogical interpretations.
The National PropertyIndex (NPI) is indicative ofthe extent of activity aswell as price movementsacross cities and localitiesin the major cities activeon MagicBricks.com. Theindex includes the top 11cities (these have been
chosen based on theiractivity levels) and has anindividual city report foreach of these cities. Whilethe NPI and its movementsare of interest to theexpert community ofbankers, builders andinvestors, the PropIndexhas also taken care toexplain the nuances ofindex movements at thelocality level that wouldhelp the huge base ofMagicBricks.comconsumers.
Insights into consumerdemand have beengathered through analysisof search information onthe site. This helpsunderstand the bestlocalities by demand, thetype and configuration ofunits as well as the budget-wise preferences.
The PropIndex is the resultof meticulous research atthe locality level andthrough detaileddiscussions with experts atMagicBricks.com’s offlineand online initiatives.
The Indian real estatemarket is dynamic and thePropIndex reflects thosechanges. Since it is derivedfrom a dynamic database,additions and deletions oflocalities happen as afunction of marketdynamics.
METHODOLOGY
There is a wealth of information within these pages. For better readability, we have presented somedata as tables and others as graphs. Between them, you will find how property markets haveperformed in the Jan-Mar 2012 quarter from many different perspectives – from that of capitalappreciation, from a rental/yield realization perspective and from the stand of supply of properties.Also understand what consumers want in the Demand Analysis section.
We recommend that you evaluate the city report in its entirety and that will provide a roundedperspective of the performance of the property market within each city. Here are details of whatyou will find in each of the city reports enclosed within -
1. City Property Index - This is a composite index which is a function of supply of properties aswell as the average capital appreciation/drop in various localities of the city in the quarter. Thecity index is the weighted average of the average rate per square foot in that locality and thesupply of properties from that locality. Premium localities (with higher average rate per squarefoot) as well as localities with higher supply of properties will have a bigger impact on theIndex. For example, if the supply of properties from a premium locality drops, that locality willend up having a lower weightage in the index which in turn will push the Index downwards(and vice-versa). On the other hand, supply of properties remaining unchanged, the index willbe influenced by capital appreciation within the locality.
2. Price Monitor - This reflects the capital appreciation/drop within a locality. It is calculated onthe basis of movement in the “average rate per square foot” within that locality. By and large, the movement in the “average rate per square foot” reflects capital appreciation/drops. However, in a few select cases, we have observed that the average rate per square footmoves due to a change in the mix of apartments within that locality (e.g. if the ratio ofpremium apartments, which command a higher per square foot rate, changes over the quarter).In these few circumstances, the Price Monitor will, in turn, reflect this input. Such changeshave been explained in the text of the City Reports.
3. Rent Monitor - This reflects the rental appreciation/drop within a locality. It is calculated onthe basis of movement in the “average rent per square foot” within that locality. By and large, the movement in the “average rent per square foot” reflects rentalappreciation/drops. However, in a few selected cases, we have observed that the average rentper square foot moves due to a change in the mix of apartments within that locality (e.g. if theratio of premium apartments, which command a higher per square foot rent, changes over thequarter). In these few circumstances, the Rent Monitor will, in turn, reflect this input. Suchchanges have been explained in the text of the City Reports.
4. Yield Meter - Yield is the annual rate of return earned on property. The Yield Meter depictsthe gross yield percentages across various localities. Gross yield is a ratio of average annualrental value to the average capital value of the property.
5. Capital Value Tables (given in Annexures) - This shows the actual range of prices withinwhich properties were available in each locality in the quarter. Prices are shown in rupees persquare foot basis; these are the prevailing rates for properties in each locality.
6. Demand Analysis - This analysis of consumer demand is based on searches and requirementsthat users have performed on MagicBricks.com. The top localities by demand gives an insightinto consumer peferences. The demand data has been used to arrive at various aspects ofconsumer requirements including Budget-wise analysis, Property type analysis and BHKconfiguration analysis.
GLOSSARY & DEFINITIONS
JAN-MAR 2012
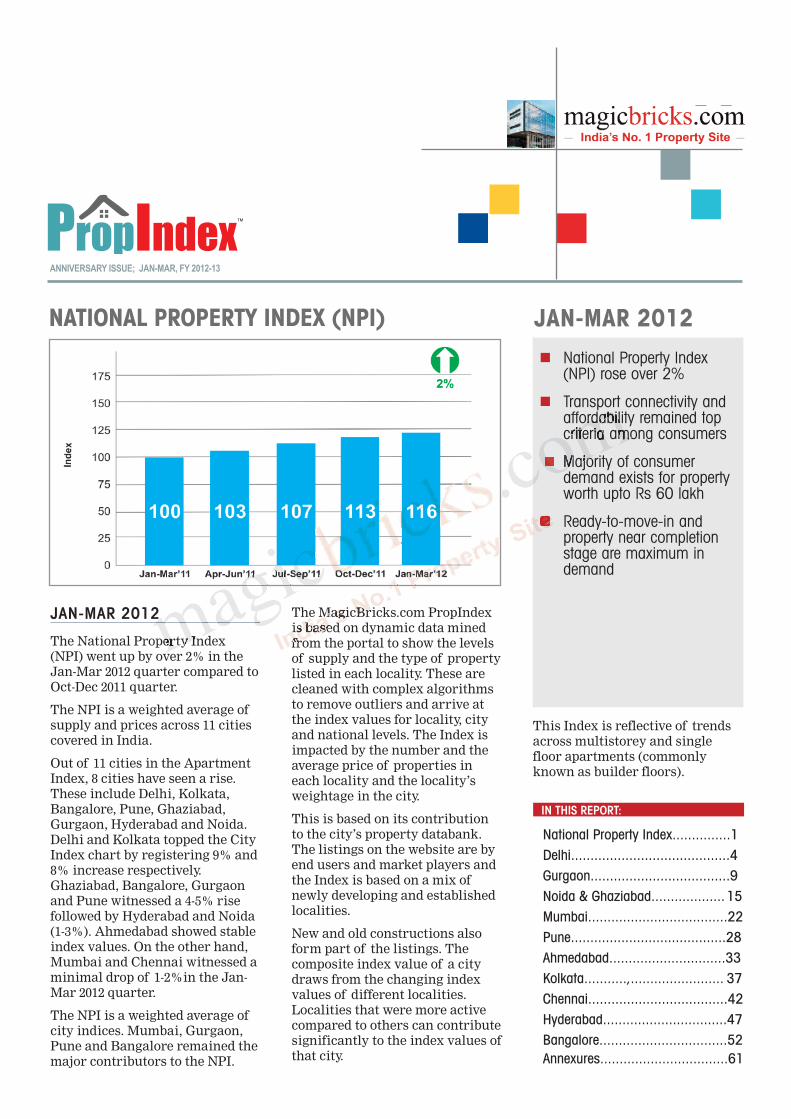
The National Property Index(NPI) went up by over 2% in theJan-Mar 2012 quarter compared toOct-Dec 2011 quarter.
The NPI is a weighted average ofsupply and prices across 11 citiescovered in India.
Out of 11 cities in the ApartmentIndex, 8 cities have seen a rise.These include Delhi, Kolkata,Bangalore, Pune, Ghaziabad,Gurgaon, Hyderabad and Noida.Delhi and Kolkata topped the CityIndex chart by registering 9% and8% increase respectively.Ghaziabad, Bangalore, Gurgaonand Pune witnessed a 4-5% risefollowed by Hyderabad and Noida(1-3%). Ahmedabad showed stableindex values. On the other hand,Mumbai and Chennai witnessed aminimal drop of 1-2%in the Jan-Mar 2012 quarter.
The NPI is a weighted average ofcity indices. Mumbai, Gurgaon,Pune and Bangalore remained themajor contributors to the NPI.
The MagicBricks.com PropIndexis based on dynamic data minedfrom the portal to show the levelsof supply and the type of propertylisted in each locality. These arecleaned with complex algorithmsto remove outliers and arrive atthe index values for locality, cityand national levels. The Index isimpacted by the number and theaverage price of properties ineach locality and the locality’sweightage in the city.
This is based on its contributionto the city’s property databank.The listings on the website are byend users and market players andthe Index is based on a mix ofnewly developing and establishedlocalities.
New and old constructions alsoform part of the listings. Thecomposite index value of a citydraws from the changing indexvalues of different localities.Localities that were more activecompared to others can contributesignificantly to the index values ofthat city.
This Index is reflective of trendsacross multistorey and singlefloor apartments (commonlyknown as builder floors).
n National Property Index(NPI) rose over 2%
n Transport connectivity andaffordability remained topcriteria among consumers
n Majority of consumerdemand exists for propertyworth upto Rs 60 lakh
n Ready-to-move-in andproperty near completionstage are maximum indemand
IN THIS REPORT:
National Property Index...............1Delhi.........................................4Gurgaon....................................9Noida & Ghaziabad................... 15Mumbai....................................22Pune........................................28Ahmedabad..............................33Kolkata...........,........................ 37Chennai....................................42Hyderabad................................47Bangalore.................................52Annexures.................................61
NATIONAL PROPERTY INDEX (NPI)
ANNIVERSARY ISSUE; JAN-MAR, FY 2012-13
JAN-MAR 2012
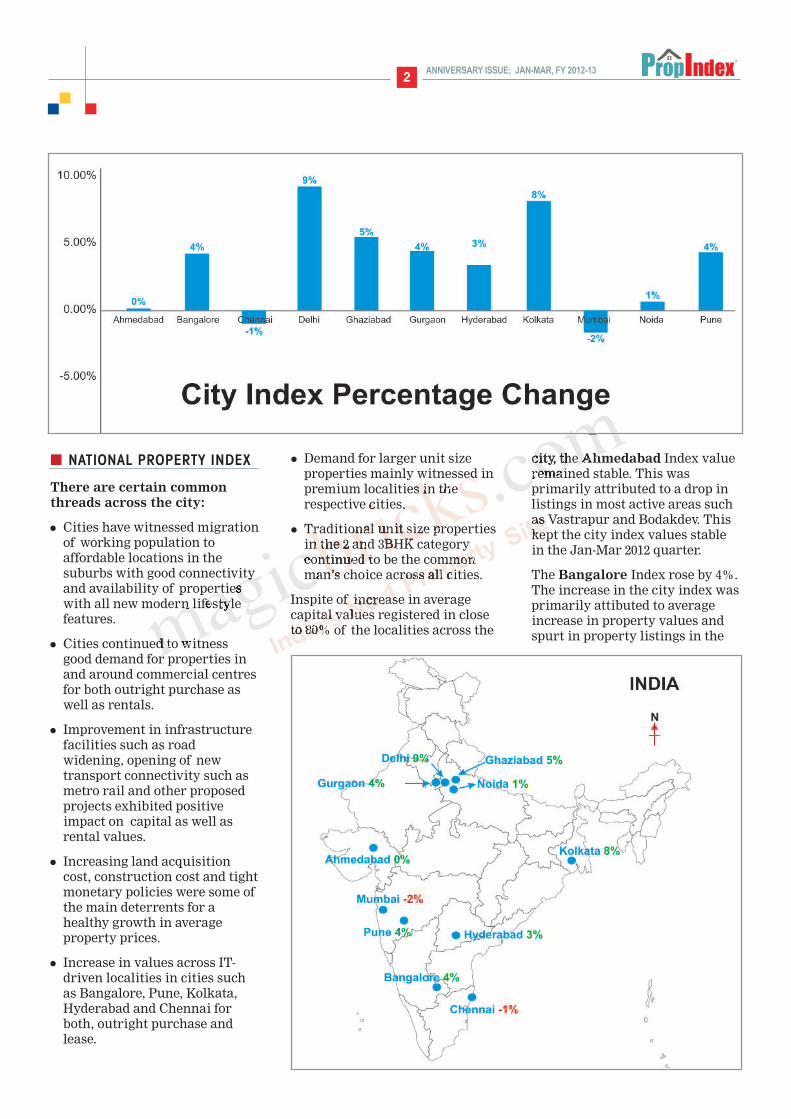
NATIONAL PROPERTY INDEX
There are certain commonthreads across the city:
l Cities have witnessed migrationof working population toaffordable locations in thesuburbs with good connectivityand availability of propertieswith all new modern lifestylefeatures.
l Cities continued to witnessgood demand for properties inand around commercial centresfor both outright purchase aswell as rentals.
l Improvement in infrastructurefacilities such as roadwidening, opening of newtransport connectivity such asmetro rail and other proposedprojects exhibited positiveimpact on capital as well asrental values.
l Increasing land acquisitioncost, construction cost and tightmonetary policies were some ofthe main deterrents for ahealthy growth in averageproperty prices.
l Increase in values across IT-driven localities in cities suchas Bangalore, Pune, Kolkata,Hyderabad and Chennai forboth, outright purchase andlease.
l Demand for larger unit sizeproperties mainly witnessed inpremium localities in therespective cities.
l Traditional unit size propertiesin the 2 and 3BHK categorycontinued to be the commonman’s choice across all cities.
Inspite of increase in averagecapital values registered in closeto 80% of the localities across the
city, the Ahmedabad Index valueremained stable. This wasprimarily attributed to a drop inlistings in most active areas suchas Vastrapur and Bodakdev. Thiskept the city index values stablein the Jan-Mar 2012 quarter.
The Bangalore Index rose by 4%.The increase in the city index wasprimarily attibuted to averageincrease in property values andspurt in property listings in the
ANNIVERSARY ISSUE; JAN-MAR, FY 2012-132
ANNIVERSARY ISSUE; JAN-MAR, FY 2012-13
localites in East, North and Southzones. Due to ongoing andproposed real estate developments,there was a shift witnessed in theinvestor interest towards thenorthern part of the city. However,active IT-driven localities in theother part of the city continued towitness end-user interest.
The Chennai Index dropped by1%. Small decline in averagecapital values as well as listingspushed the city index downwards.The localities in South zonecontinued to witness maximumactivity, primarily on account ofpresence of IT companies,connectivity and availability oflarge number of options across allprice ranges.
The Delhi Index rose by 9%. Anupward trend in average capitalvalues in close to 90% localities ofthe city pushed the index valuesup. The localities such as Dwarka,Safdarjung Enclave, GreaterKailash I & II, IndraprasthaExtension and Mayur Vihar Phase1 were the major contributors.Asking values remained high inthe anticipation of a reduction inhome loan interest rates.
The Ghaziabad Index rose by 5%.The localities with good metroconnectivity continued to witnesshealthy demand from bothinvestors as well as end-users,resulting in an increase inaverage capital values. Theincrease in weightage of localiteswith affordable options tooimpacted the index positively. Thiscollectively pushed the Indexupwards.
The Gurgaon Index rose by 4%.Over 80% localities showedincrease in average capital valuesacross the city. Sectors along theDwarka Expressway, Golf CourseRoad and availability of propertiesat relatively affordable prices inSectors 80, 81, 83, 84 and 92 werethe major contributors. This tiltedthe Index upwards. Currently, theGurgaon-Dwarka Expressway isunder-construction and thecompletion is expected to further
boost property values along thisstretch.
The Hyderabad Index value roseby 3%. Irrespective of theunsettled Telangana issue andslow growth rate, localities inproximity to IT hubs continued towitness rise in capital values. Theaverage property values remainedup across the city, except in Uppaland Begumpet. The increase inprices was primarily due to highconstruction and raw materialcost, in addition to healthydemand from end-users.
The Kolkata Index value rose by8%. Close to 70% of the localitiesimpacted the city index positively.This led to significant rise in cityindex. Stable demand forproperties in premium localitiesin southern region and localitiesaround Rajarhat and Newtownarea were the major drivers.
The Noida Index value was up by1% in the Jan-Mar 2012 quarter.Residential demand remained upacross the city as emerging areassuch as Sectors 74, 75, 76, 78 andNoida Expressway sectors saw ahealthy rise in values.UnsettledNoida Extension litigation andslow growth rate in new launcheskept the asking values high.
The Pune Index value rose by 4%.There was consistent growth inthe average capital values acrossthe city. Areas such as Hadapsar,Magarpatta, Viman Nagar andBibwewadi were the major thecontributors that pushed the Indexvalue up.
The Mumbai Index witnessed adrop of 2% in values. Factors suchas weak consumer sentiments anddrop in rate of new launches inthe city dragged the Indexdownwards. Across Mumbai,market preference veered towardsaffordable locations, in bothcapital and rental values. Areasthat outpriced itself saw an exit ofconsumers, whether in city centreor suburbs.
TOP YIELD GROSSERS
Rental yield is a factor of the changes inrental values locality-wise vis-a-vis thechanges in capital values. Given beloware the top yield-grossing localities ineach city
Locality Gross yield
Kolkata, EM Bypass 6.14%
Bangalore, Electronic City 5.87%
Hyderabad, Kondapur 4.68%
Chennai, OMR 4.65%
Mumbai, Bandra East 4.27%
Ahmedabad, Vejalpur 3.60%
Ghaziabad, Indirapuram 3.33%
Pune, Viman Nagar 3.32%
Gurgaon, Sushant Lok-I 3.18%
Noida, Sector-50 2.70%
Delhi, Vasundhara Enclave 2.59%
CAPITAL GAINS
The table given below indicates maximum increase in capital values ineach city
Locality % Change
Chennai,Nungambakkam 16%
Gurgaon, Dwarka Expressway 16%
Bangalore, Koramangala 14%
Delhi, Panchsheel Enclave 14%
Noida, Sector-75 13%
Hyderabad, Bowanpalli 13%
Ghaziabad, Indirapuram 12%
Pune, Hadapsar 11%
Mumbai, Virar 11%
Ahmedabad, Gandhinagar 10%
Kolkata, Jadavpur 10%
3
CHENNAI 42ANNIVERSARY ISSUE; JAN-MAR, FY 2012-13
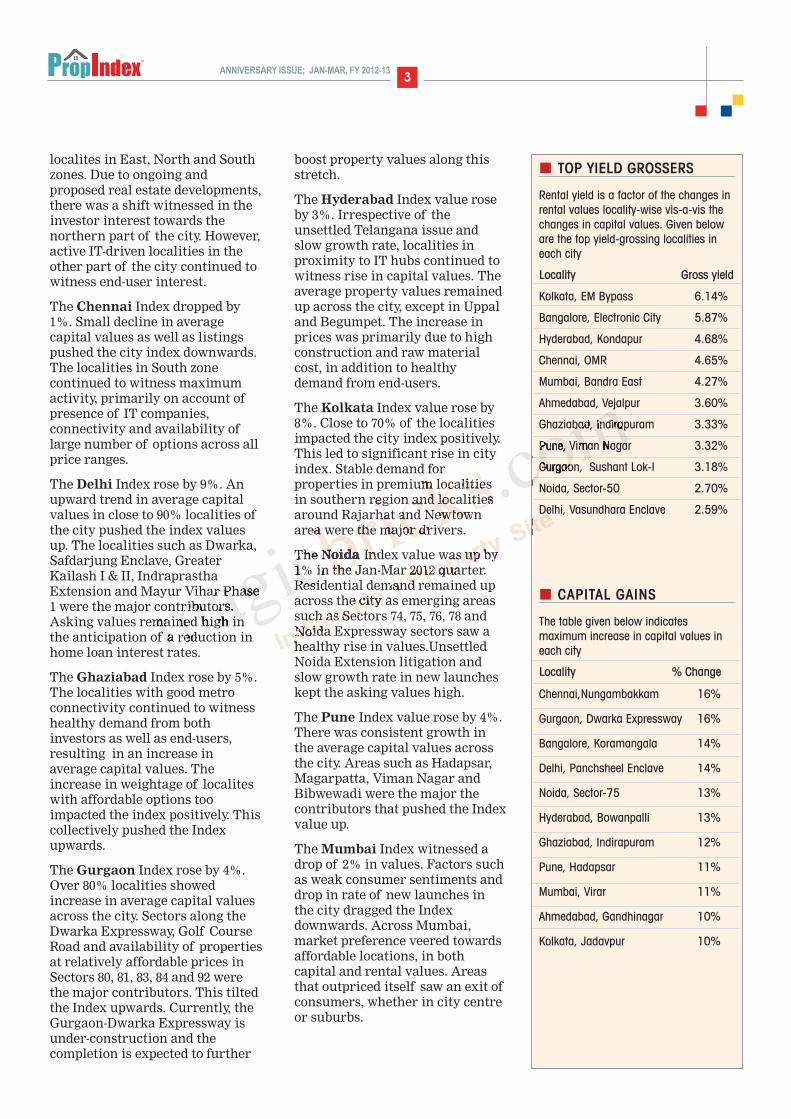
CITY PROPERTY INDEX
The Chennai Property Indexdropped by 1%, unlike the NPIthat rose by 2% during the Jan-Mar 2012 quarter.
The Chennai Price Monitorshowed an increase of 4% in thequarter compared to the Oct-Dec2011 quarter that witnessed a dropof 1%. An upward trend inaverage capital values in majorityof the localities and supply inpremium areas resulted in a hikein the Price Monitor.
The MagicBricks.com Yield Meterincreased marginally to 2.61-4.65%in this quarter from 2.55-4.58%.Properties along the OldMahabalipuram Road (OMR)continued to fetch highest rentalreturn. This is primarily onaccount of availability of lowerrange of properties with goodrental return in the quarter.
Thiruvanmiyur continued toregister the lowest rental returnquarter-over-quarter. But in thisquarter, the average capital valueexhibited a marginal fall,however, rental values remainedstable. This led to marginallyhigher gross yield compared tothe previous quarter.
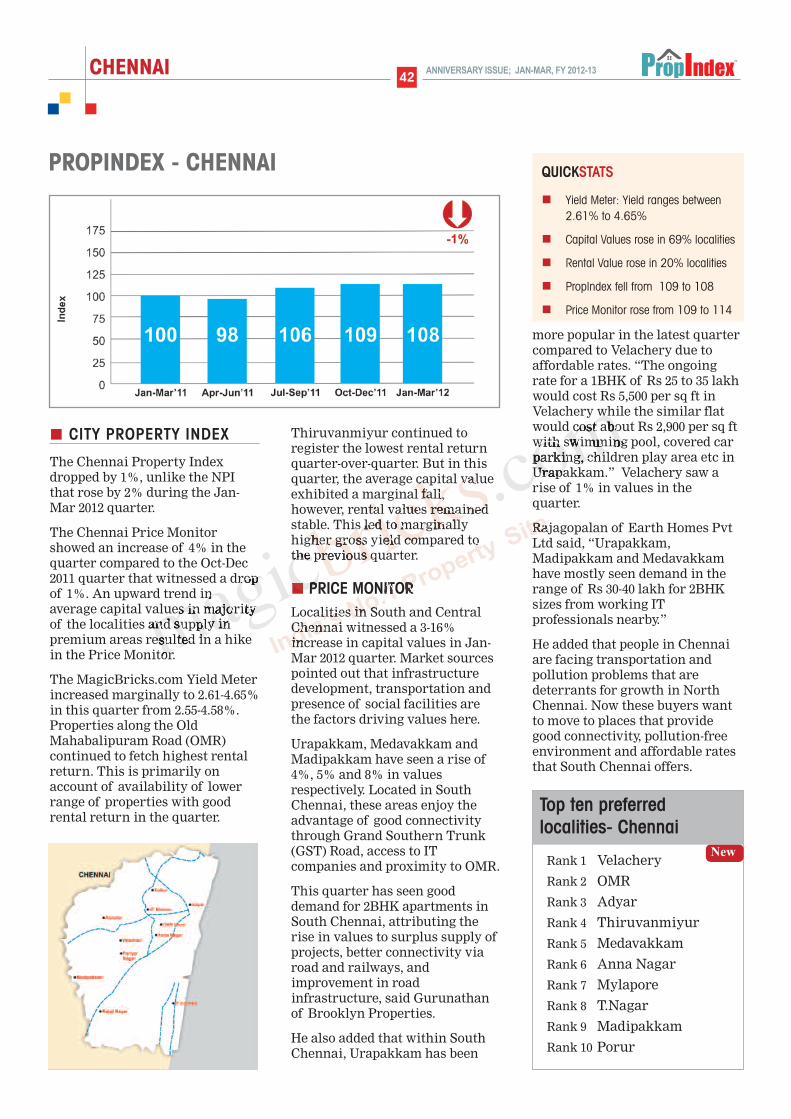
PRICE MONITORLocalities in South and CentralChennai witnessed a 3-16%increase in capital values in Jan-Mar 2012 quarter. Market sourcespointed out that infrastructuredevelopment, transportation andpresence of social facilities arethe factors driving values here.
Urapakkam, Medavakkam andMadipakkam have seen a rise of4%, 5% and 8% in valuesrespectively. Located in SouthChennai, these areas enjoy theadvantage of good connectivitythrough Grand Southern Trunk(GST) Road, access to ITcompanies and proximity to OMR.
This quarter has seen gooddemand for 2BHK apartments inSouth Chennai, attributing therise in values to surplus supply ofprojects, better connectivity viaroad and railways, andimprovement in roadinfrastructure, said Gurunathanof Brooklyn Properties.
He also added that within SouthChennai, Urapakkam has been
more popular in the latest quartercompared to Velachery due toaffordable rates. “The ongoingrate for a 1BHK of Rs 25 to 35 lakhwould cost Rs 5,500 per sq ft inVelachery while the similar flatwould cost about Rs 2,900 per sq ftwith swimming pool, covered carparking, children play area etc inUrapakkam.” Velachery saw arise of 1% in values in thequarter.
Rajagopalan of Earth Homes PvtLtd said, “Urapakkam,Madipakkam and Medavakkamhave mostly seen demand in therange of Rs 30-40 lakh for 2BHKsizes from working ITprofessionals nearby.”
He added that people in Chennaiare facing transportation andpollution problems that aredeterrants for growth in NorthChennai. Now these buyers wantto move to places that providegood connectivity, pollution-freeenvironment and affordable ratesthat South Chennai offers.
PROPINDEX - CHENNAI QUICKSTATS
n Yield Meter: Yield ranges between2.61% to 4.65%
n Capital Values rose in 69% localities
n Rental Value rose in 20% localities
n PropIndex fell from 109 to 108
n Price Monitor rose from 109 to 114
Rank 1 Velachery
Rank 2 OMR
Rank 3 Adyar
Rank 4 Thiruvanmiyur
Rank 5 Medavakkam
Rank 6 Anna Nagar
Rank 7 Mylapore
Rank 8 T.Nagar
Rank 9 Madipakkam
Rank 10 Porur
New
Top ten preferredlocalities- Chennai
CHENNAI43ANNIVERSARY ISSUE; JAN-MAR, FY 2012-13
The trend in Central Chennai hasbeen similar to that of South,with Nungambakkam and Porurseeing a rise of 16% and 6%respectively. Gurunathan saidfactors like presence of ITcompanies, availability of goodground water for residents,schools and colleges in theneighbourhood are propellingvalues and demand here.
Secondly, proximity toSriperumbudur is another reasonwhy people are looking to move toCentral localities like Porur andNungambakkam.
Rajagopalan added that peoplewho work in industries inSriperumbudur prefer to stay inPorur as its closeby, pollution-freeand is comparatively morepopulated than Sriperumbudur.
In addition, Porur andNungambakkam are located closeto 2-3 IT parks, attractingprofessionals who work nearby.
According to S. Ramakrishnan,CEO, MARG ProperTies, “Growthcorridors like OMR, East CoastRoad (ECR) and Sriperumbuduroffer good potential.” He added
that areas near Sriperumbudurare one of the best bets asmultinationals are expandingtheir foot print there. “With theairport planned there, it will be agood bet in the future. Thoughsocial infrastructure still needs tobe improved a lot in the next 3-4years,” Ramakrishnan added.
Localities in Northern Chennaisuch as Ambattur and AnnaNagar witnessed a marginal risepf 1-3%. Rajagopalan pointed outthat the migration ofmanufacturing belt fromAmbattur to Sriperumbudur inphases is impacting values inNorthern Chennai.
Secondly, pollution andconnectivity to the rest of the cityhas been a major concern forbuyers in this part of the city.That is also a reason why buyersare consistently relocating toSouth and Central Chennai.
“The major source of income inNorth Chennai is railways ashardly any IT companies arelocated here. Demand is shiftingto Central and South Chennaifrom here,” Gurunathan said. Headded that IT and manufacturing
4%Price Monitor indicates 4% increase in the average sale price
P R I C E M O N I T O R
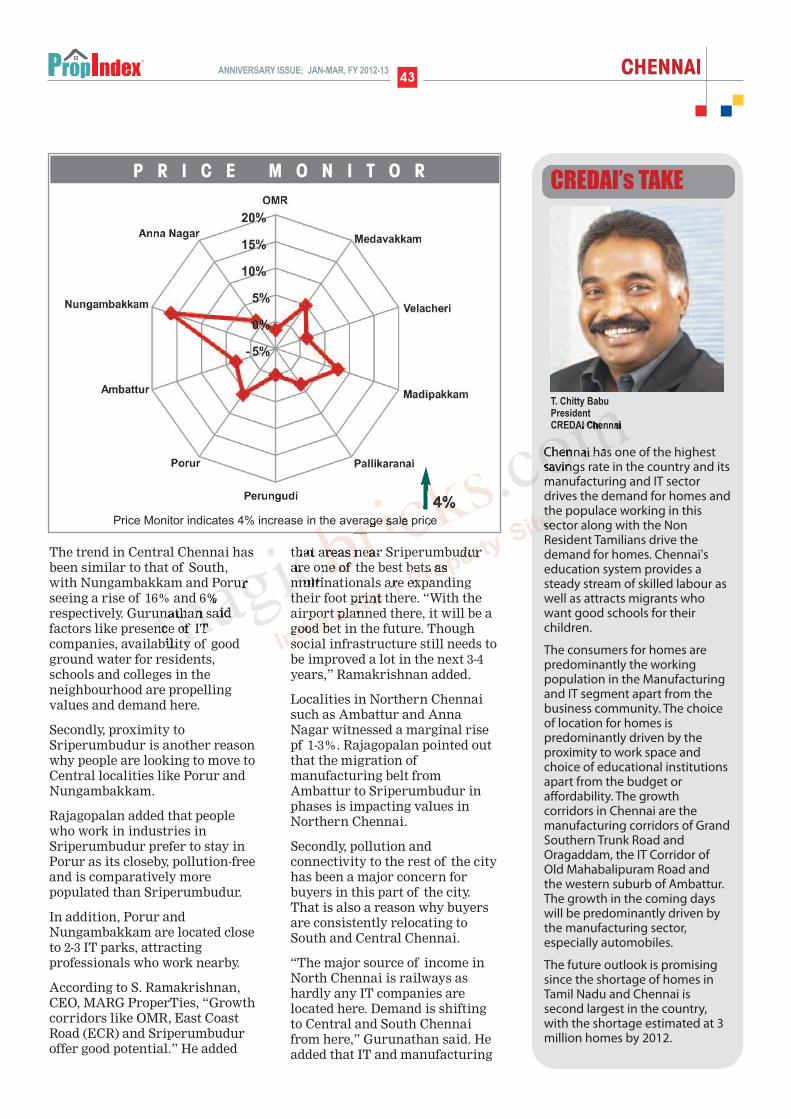
Chennai has one of the highestsavings rate in the country and itsmanufacturing and IT sectordrives the demand for homes andthe populace working in thissector along with the NonResident Tamilians drive thedemand for homes. Chennai'seducation system provides asteady stream of skilled labour aswell as attracts migrants whowant good schools for theirchildren.
The consumers for homes arepredominantly the workingpopulation in the Manufacturingand IT segment apart from thebusiness community. The choiceof location for homes ispredominantly driven by theproximity to work space andchoice of educational institutionsapart from the budget oraffordability. The growthcorridors in Chennai are themanufacturing corridors of GrandSouthern Trunk Road andOragaddam, the IT Corridor ofOld Mahabalipuram Road andthe western suburb of Ambattur.The growth in the coming dayswill be predominantly driven bythe manufacturing sector,especially automobiles.
The future outlook is promisingsince the shortage of homes inTamil Nadu and Chennai issecond largest in the country,with the shortage estimated at 3million homes by 2012.
CREDAI’s TAKE
T. Chitty BabuPresidentCREDAI Chennai
CHENNAI 44ANNIVERSARY ISSUE; JAN-MAR, FY 2012-13
the are two main growth driversin Chennai. “Areas that willpropel demand in future are thesetwo sectors going forward,” hesaid.
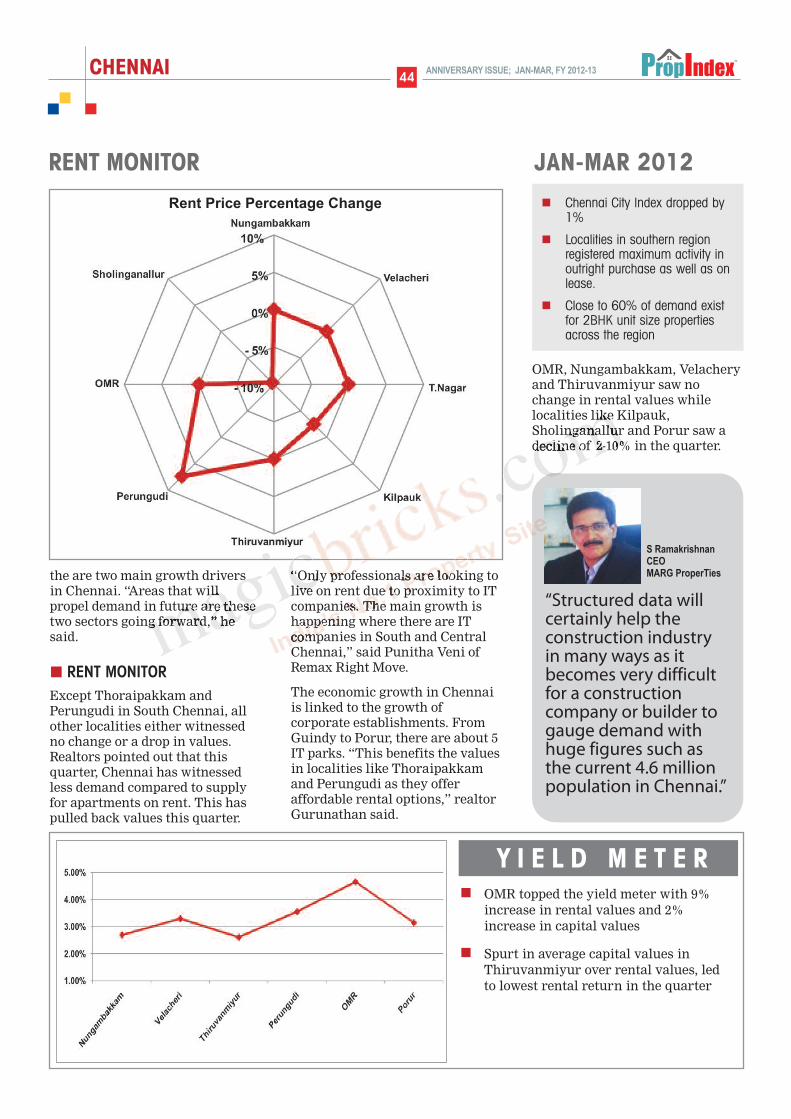
RENT MONITORExcept Thoraipakkam andPerungudi in South Chennai, allother localities either witnessedno change or a drop in values.Realtors pointed out that thisquarter, Chennai has witnessedless demand compared to supplyfor apartments on rent. This haspulled back values this quarter.
“Only professionals are looking tolive on rent due to proximity to ITcompanies. The main growth ishappening where there are ITcompanies in South and CentralChennai,” said Punitha Veni ofRemax Right Move.
The economic growth in Chennaiis linked to the growth ofcorporate establishments. FromGuindy to Porur, there are about 5IT parks. “This benefits the valuesin localities like Thoraipakkamand Perungudi as they offeraffordable rental options,” realtorGurunathan said.
OMR, Nungambakkam, Velacheryand Thiruvanmiyur saw nochange in rental values whilelocalities like Kilpauk,Sholinganallur and Porur saw adecline of 2-10% in the quarter.
RENT MONITOR
Rent Price Percentage Change
Y I E L D M E T E Rn OMR topped the yield meter with 9%increase in rental values and 2%increase in capital values
n Spurt in average capital values inThiruvanmiyur over rental values, ledto lowest rental return in the quarter
JAN-MAR 2012
n Chennai City Index dropped by1%
n Localities in southern regionregistered maximum activity inoutright purchase as well as onlease.
n Close to 60% of demand existfor 2BHK unit size propertiesacross the region
“Structured data willcertainly help theconstruction industryin many ways as itbecomes very difficultfor a constructioncompany or builder togauge demand withhuge figures such asthe current 4.6 millionpopulation in Chennai.”
S Ramakrishnan CEOMARG ProperTies
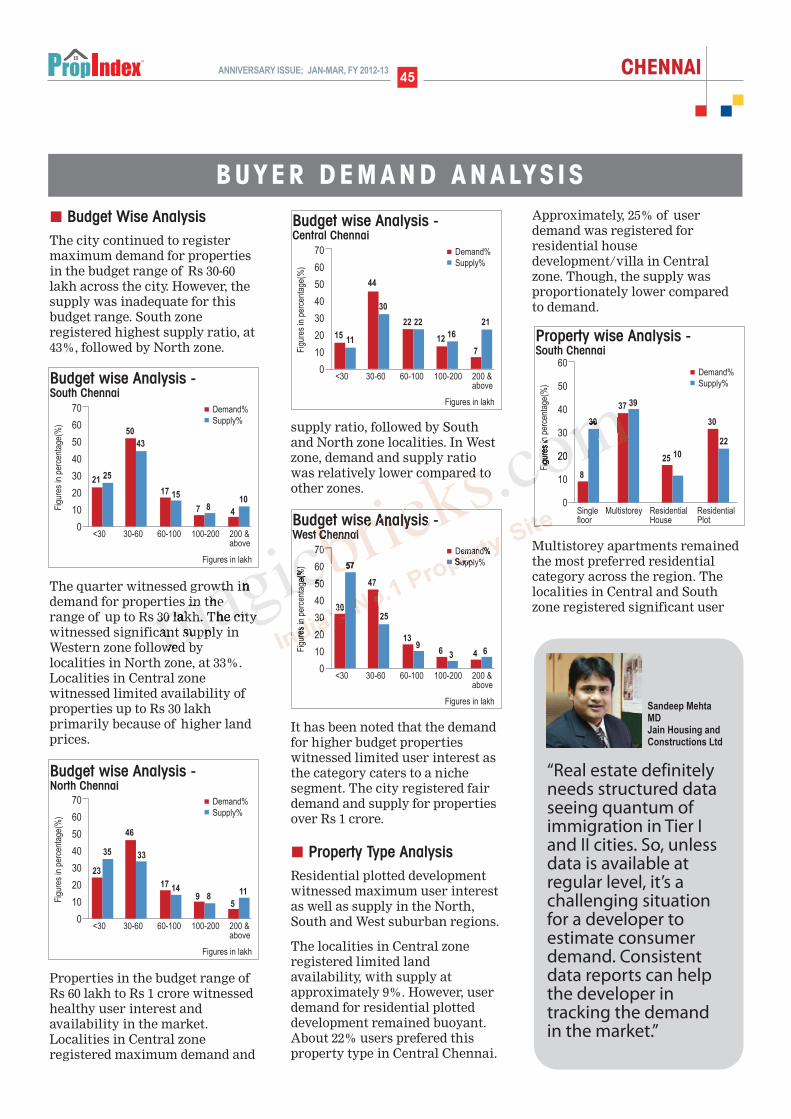
Budget Wise AnalysisThe city continued to registermaximum demand for propertiesin the budget range of Rs 30-60lakh across the city. However, thesupply was inadequate for thisbudget range. South zoneregistered highest supply ratio, at43%, followed by North zone.
The quarter witnessed growth indemand for properties in therange of up to Rs 30 lakh. The citywitnessed significant supply inWestern zone followed bylocalities in North zone, at 33%.Localities in Central zonewitnessed limited availability ofproperties up to Rs 30 lakhprimarily because of higher landprices.
Properties in the budget range ofRs 60 lakh to Rs 1 crore witnessedhealthy user interest andavailability in the market.Localities in Central zoneregistered maximum demand and
supply ratio, followed by Southand North zone localities. In Westzone, demand and supply ratiowas relatively lower compared toother zones.
It has been noted that the demandfor higher budget propertieswitnessed limited user interest asthe category caters to a nichesegment. The city registered fairdemand and supply for propertiesover Rs 1 crore.
Property Type AnalysisResidential plotted developmentwitnessed maximum user interestas well as supply in the North,South and West suburban regions.
The localities in Central zoneregistered limited landavailability, with supply atapproximately 9%. However, userdemand for residential plotteddevelopment remained buoyant.About 22% users prefered thisproperty type in Central Chennai.
Approximately, 25% of userdemand was registered forresidential housedevelopment/villa in Centralzone. Though, the supply wasproportionately lower comparedto demand.
Multistorey apartments remainedthe most preferred residentialcategory across the region. Thelocalities in Central and Southzone registered significant user
CHENNAI45ANNIVERSARY ISSUE; JAN-MAR, FY 2012-13
Property wise Analysis - South Chennai
60
50
40
30
20
10
0
8
30
37 39
25 10
30
22
Demand%
Supply%
Fig
ures
in p
erce
ntag
e(%
)
Single Multistorey Residential Residentialfloor House Plot
Budget wise Analysis - Central Chennai
70
60
50
40
30
20
10
0<30 30-60 60-100 100-200 200 &
above
15
Figures in lakh
11
44
30
22 22
1216
7
21
Demand%
Supply%
Fig
ures
in p
erce
ntag
e(%
)
Budget wise Analysis - South Chennai
70
60
50
40
30
20
10
0<30 30-60 60-100 100-200 200 &
above
21
Figures in lakh
25
50
43
17 15
7 84
10
Demand%
Supply%
Fig
ures
in p
erce
ntag
e(%
)
Budget wise Analysis - West Chennai
70
60
50
40
30
20
10
0<30 30-60 60-100 100-200 200 &
above
30
Figures in lakh
57
47
25
139
6 3 4 6
Demand%
Supply%
Fig
ures
in p
erce
ntag
e(%
)
B U Y E R D E M A N D A N A LY S I S
“Real estate definitelyneeds structured dataseeing quantum ofimmigration in Tier Iand II cities. So, unlessdata is available atregular level, it’s achallenging situationfor a developer toestimate consumerdemand. Consistentdata reports can helpthe developer intracking the demandin the market.”
Sandeep MehtaMDJain Housing andConstructions Ltd
Budget wise Analysis - North Chennai
70
60
50
40
30
20
10
0<30 30-60 60-100 100-200 200 &
above
23
Figures in lakh
35
46
33
17 149 8
5
11
Demand%
Supply%
Fig
ures
in p
erce
ntag
e(%
)
demand as well supply. In Northand West zones, the localitieswitnessed higher demandcompared to supply.
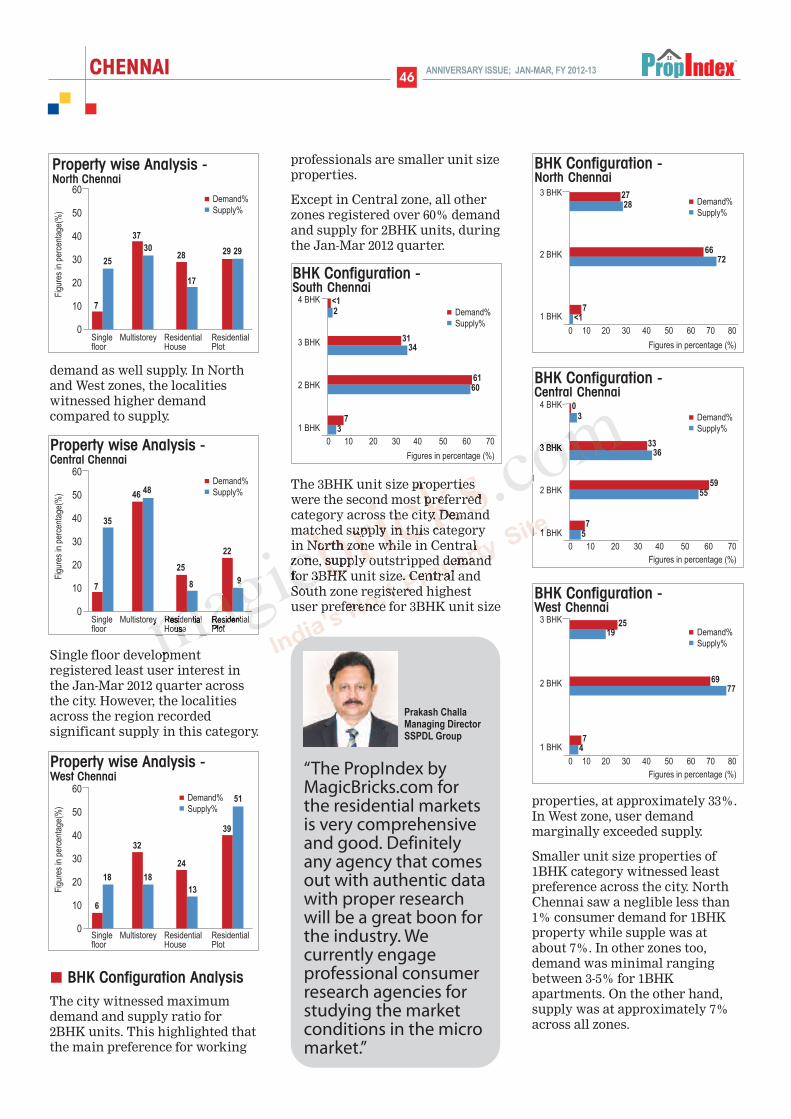
Single floor developmentregistered least user interest inthe Jan-Mar 2012 quarter acrossthe city. However, the localitiesacross the region recordedsignificant supply in this category.
BHK Configuration AnalysisThe city witnessed maximumdemand and supply ratio for2BHK units. This highlighted thatthe main preference for working
professionals are smaller unit sizeproperties.
Except in Central zone, all otherzones registered over 60% demandand supply for 2BHK units, duringthe Jan-Mar 2012 quarter.
The 3BHK unit size propertieswere the second most preferredcategory across the city. Demandmatched supply in this categoryin North zone while in Centralzone, supply outstripped demandfor 3BHK unit size. Central andSouth zone registered highestuser preference for 3BHK unit size
properties, at approximately 33%.In West zone, user demandmarginally exceeded supply.
Smaller unit size properties of1BHK category witnessed leastpreference across the city. NorthChennai saw a neglible less than1% consumer demand for 1BHKproperty while supple was atabout 7%. In other zones too,demand was minimal rangingbetween 3-5% for 1BHKapartments. On the other hand,supply was at approximately 7%across all zones.
CHENNAI 46ANNIVERSARY ISSUE; JAN-MAR, FY 2012-13
BHK Configuration - Central Chennai
Figures in percentage (%)
Demand%
Supply%
4 BHK
3 BHK
2 BHK
1 BHK
0 10 20 30 40 50 60 70
03
3336
5955
75
BHK Configuration - North Chennai
Figures in percentage (%)
Demand%
Supply%
3 BHK
2 BHK
1 BHK
0 10 20 30 40 50 60 70 80
2728
6672
7<1
BHK Configuration - South Chennai
Figures in percentage (%)
Demand%
Supply%
4 BHK
3 BHK
2 BHK
1 BHK
0 10 20 30 40 50 60 70
<12
3134
6160
73
BHK Configuration - West Chennai
Figures in percentage (%)
Demand%
Supply%
3 BHK
2 BHK
1 BHK
0 10 20 30 40 50 60 70 80
2519
6977
74
Property wise Analysis - Central Chennai
60
50
40
30
20
10
0
7
35
4648
25
8
22
9
Demand%
Supply%
Fig
ures
in p
erce
ntag
e(%
)
Single Multistorey Residential Residentialfloor House Plot
Property wise Analysis - West Chennai
60
50
40
30
20
10
0
6
18
32
18
24
13
39
51Demand%
Supply%
Fig
ures
in p
erce
ntag
e(%
)
Single Multistorey Residential Residentialfloor House Plot
“The PropIndex byMagicBricks.com forthe residential marketsis very comprehensiveand good. Definitelyany agency that comesout with authentic datawith proper researchwill be a great boon forthe industry. Wecurrently engageprofessional consumerresearch agencies forstudying the marketconditions in the micromarket.”
Prakash ChallaManaging DirectorSSPDL Group
60
50
40
30
20
10
0
7
25
37
3028
17
29 29
Demand%
Supply%
Fig
ures
in p
erce
ntag
e(%
)
Single Multistorey Residential Residentialfloor House Plot
Property wise Analysis - North Chennai


annexuRes
Adambakkam 5350 to 6150
Adyar 8550 to 11450
Alwarpet 13100 to 16000
Ambattur 3350 to 4050
Anna Nagar 8100 to 10700
Anna Nagar West 6300 to 7800
Ashok Nagar 6500 to 8300
Ayanavaram 5650 to 6950
Besant Nagar 9450 to 12950
Chromepet 3800 to 4600
Chromepet West 3800 to 4450
E.C.R Road 3750 to 4300
Egmore 6100 to 7700
GST Road 3050 to 3700
Guduvancheri 2600 to 2950
Hasthinapuram 3500 to 3750
Iyyappanthangal 3350 to 3950
Kattupakkam 3500 to 3750
Kelambakkam 2900 to 3550
Kilkattalai 3600 to 4200
Kilpauk 8400 to 11250
KK Nagar 5950 to 7350
Kolapakkam 3950 to 4350
Kolathur 3800 to 4300
Kovilambakkam 3400 to 3700
Koyambedu 6200 to 7150
Madambakkam 3350 to 3700
Madipakkam 3650 to 4200
Maduravoyal 4400 to 4550
Mahendra City 2950 to 3200
Medavakkam 3650 to 3950
Mogappair 3950 to 4900
Mogappair West 3550 to 4250
Mylapore 7400 to 9700
Nanganalluir 4600 to 5250
Nanmangalam 3350 to 4150
Navalur 3900 to 3950
Nelson Manikam Road 9650 to 10300
Nungambakkam 10000 to 12550
OMR 3000 to 3650
Oragadam 2850 to 4150
Padur 3600 to 4050
Pallavaram 3250 to 4050
Pallikaranai 3650 to 4250
Perambur 4850 to 5650
Perumbakkam 3300 to 3950
Perungalathur 3300 to 3450
Perungudi 4700 to 5250
Porur 4050 to 4500
Red Hills 2250 to 2250
Saidapet 6350 to 7500
Saligramam 5150 to 6350
Sholinganallur 4350 to 5250
Sithalapakkam 3100 to 3400
Sriperumbudur 2000 to 2650
T.Nagar 8600 to 11400
Tambaram East 3700 to 4650
Tambaram West 2700 to 3450
Thirumangalam 4900 to 5450
Thoraipakkam 4150 to 4850
Tiruverkadu 3600 to 3850
Urappakkam 3100 to 3600
Vadapalani 5600 to 6550
Valasaravakkam 4450 to 5400
Vandalur 2950 to 3000
Velacheri 5300 to 6250
Villivakkam 4400 to 5600
Virugambakkam 5500 to 6600
CHENNAI69ANNIVERSARY ISSUE; JAN-MAR, FY 2012-13
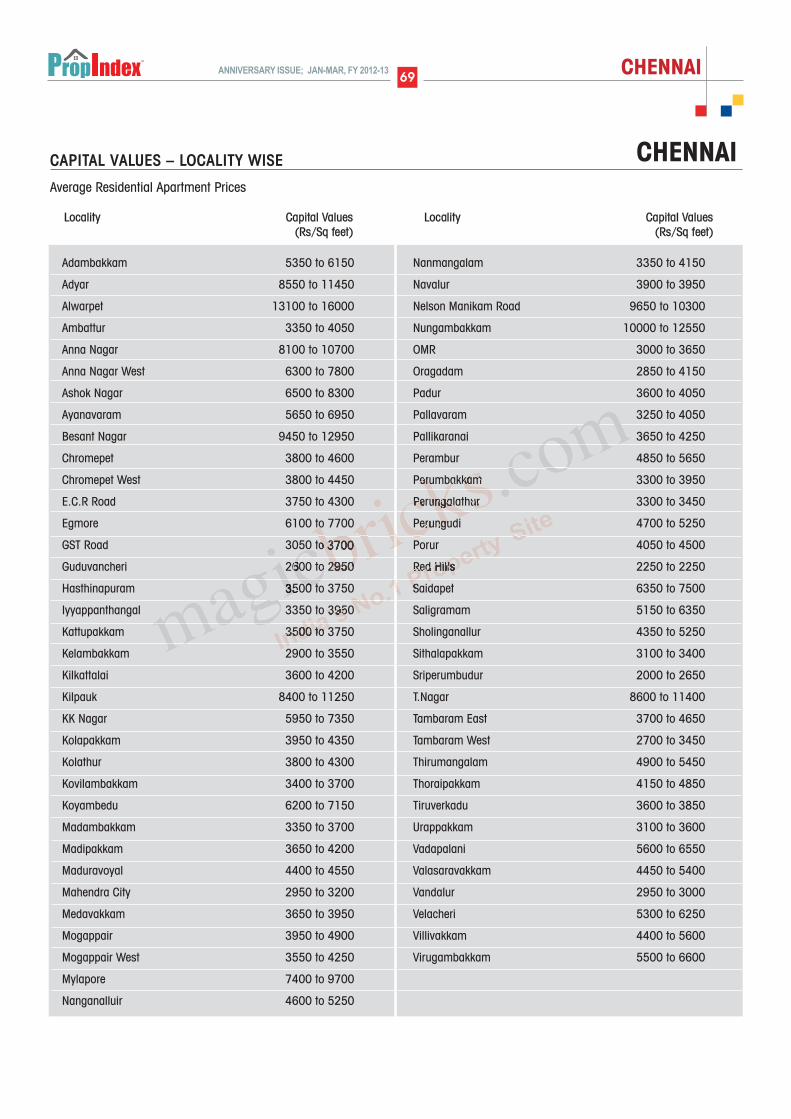
CAPITAL VALUES – LOCALITY WISE
Average Residential Apartment Prices
Locality Capital Values (Rs/Sq feet)
Locality Capital Values (Rs/Sq feet)
CHENNAI


D I S C L A I M E REvery effort has been made to make this Index as complete and as accurate as possible. MagicBricksaccepts no responsibility for inaccuracies in the information/data contained in this book. It shall haveneither liability nor responsibility to any person or entity with respect to any loss or damage caused, oralleged to have been caused, directly or indirectly, by the information contained in this book. Theinformation/data in this book is subject to change from time to time due to market condition.
CONTACT US
l Post your feedback to -
propindex @timesgroup.com
l Join our discussion forum at -
openhouse.magicbricks.com
l For business enquiries -
PROPINDEX TEAM
l Content & Research: e Jayashree Kurup,
Dipti Tandon, Rishab Jain, neha nagpal,
neha Pathania Kashyap, neha Gupta, Puneet
Kukreja & atul Gupta
l Layout Design: Harsha Khattar
l Cover Page Design: Raghav Krishnan &
Rahul nair
l Marketing: Gayatri Prasad & Bhawna Mongia
l Operations Management: Imran sharief

Related Documents

![Untitled-1 [] · Title: Untitled-1 Created Date: 20110827203248Z](https://static.cupdf.com/doc/110x72/5e5c37ba4f4d7a6137230a3c/untitled-1-title-untitled-1-created-date-20110827203248z.jpg)


![Untitled document [] · 2017. 6. 11. · Untitled document](https://static.cupdf.com/doc/110x72/60b5fa1afeb575185d5dfee6/untitled-document-2017-6-11-untitled-document.jpg)
![Untitled-1 [] · Untitled-1 Subject: Untitled-1 Keywords: Untitled-1 Created Date: 20110513150011 ...](https://static.cupdf.com/doc/110x72/60436b02647e0d00c02c5ab3/untitled-1-untitled-1-subject-untitled-1-keywords-untitled-1-created-date.jpg)
![Untitled-2 [] · Title: Untitled-2 Created Date: 20100707113029Z](https://static.cupdf.com/doc/110x72/5f8bab75572d02710a49e309/untitled-2-title-untitled-2-created-date-20100707113029z.jpg)
![(UNTITLED) []...Title (UNTITLED) Subject (UNTITLED) Keywords](https://static.cupdf.com/doc/110x72/5e9b61cb57896228d3155fa7/-untitled-title-untitled-subject-untitled-keywords.jpg)

![Untitled-1 []€¦ · Title: Untitled-1 Created Date: 20140217113650Z](https://static.cupdf.com/doc/110x72/60d0fe286b308346f174d731/untitled-1-title-untitled-1-created-date-20140217113650z.jpg)

![(UNTITLED) [] file(UNTITLED)](https://static.cupdf.com/doc/110x72/5af0b7bc7f8b9a8b4c8dcf22/untitled-untitled.jpg)