Appraisal of the Sri Lanka Dairy Sector Volume 2: Main Report Dept. of Animal Science, University of Peradeniya International Livestock Research Institute Ministry of Livestock Development and Estate Infrastructure Colombo, Sri Lanka October, 1999 Dr. M.N.M. Ibrahim, Dr. S.J. Staal, Dr. S.L.A. Daniel and Dr. W. Thorpe

Welcome message from author
This document is posted to help you gain knowledge. Please leave a comment to let me know what you think about it! Share it to your friends and learn new things together.
Transcript

Appraisal of the Sri Lanka Dairy Sector Volume 2: Main Report
Dept. of Animal Science, University of Peradeniya
International Livestock Research Institute
Ministry of Livestock Development and Estate Infrastructure
Colombo, Sri Lanka October, 1999 Dr. M.N.M. Ibrahim, Dr. S.J. Staal, Dr. S.L.A. Daniel and Dr. W. Thorpe

Table of Contents
Appraisal of the Sri Lanka Dairy Sector:Main Report i
Study Participants Primary research team: Dr. M.N.M. Ibrahim (Department of Animal Science, University of Peradeniya), Dr. S.J. Staal (International Livestock Research Institute, Kenya), Dr. S.L.A. Daniel Ministry of Livestock Production and Estate Infrastructure), Dr. W. Thorpe (International Livestock Research Institute, Kenya). Resource persons: Production Systems: Dr. M.C.L. de Alwis (Animal Health Consultant, Kandy, Sri Lanka), Dr. (Ms) S. Premaratne (Department of Animal Science, University of Peradeniya), Dr. J. Tanner (International Livestock Research Institute, Kenya), Dr. T. Wickramaratne (Veterinary Research Institute, DAPH). Economics and Marketing: Prof C. Bogahawatte (Department of Agricultural Economics, University of Peradeniya), Mr. B.K. Ganguly (National Dairy Development Board, India), Prof. T. Jogaratnam (Department of Agricultural Economics, University of Peradeniya) Policy and Institutional: Dr. A.O. Kodithuwakku, (Department of Animal Production and Health), Dr. K. Pillai, (Ministry of Livestock Development and Estate Infrastructure)
Acknowledgements The authors are grateful for the support and encouragement extended by Dr. P. Ramanujam, Secretary, and the staff of the Livestock Division of the Ministry of Livestock Development and Estate Infrastructure. The support extended by Dr. S.S.E. Ranawana, Director General, Department of Animal Production and Health, and his staff, is also appreciated. The assistance of Mr. B. K. Ganguly of the National Dairy Development Board (India) in data analysis and interpretation, and that of Mr. Kapila Ranaraja and Mr. I. Yapa for assisting with the execution of household survey and data entry is gratefully acknowledged. Ms. E. Ouma and Mr. D. Njubi, ILRI, also contributed to data handling, analysis and interpretation. Mr. Khanna and Mr. H.V.G.R. Navaratne of Kiriya, Provincial Directors of the Department of Animal Production and Health, Managers of Anuradhapura district co-operative, Nawalapitiya Milk co-operative, Yatinuwara Milk co-operative and Coconut Triangle Milk Union were very helpful during the RRA survey. The GIS work was handled by Dr. R. Premalal (Department of Agricultural Engineering, University of Peradeniya) and Mr. K. Munasinghe (Land use Division, Department of Agriculture). Dept of Animal Science Faculty of Agriculture University of Peradeniya Peradeniya, Sri Lanka International Livestock Research Institute PO Box 30709 Nairobi, Kenya Ministry of Livestock Development and Estate Infrastructure 45, St. Michael’s Road, Colombo 3, Sri Lanka

Table of contents
Appraisal of the Sri Lanka Dairy Sector:Main Report ii
Table of Contents Structure of the Report The complete report, Appraisal of the Sri Lanka Dairy Sector, consists of 2 volumes as follows:
Volume 1: Synthesis Report Presents an Executive Summary, and synthesis of the study findings and recommendations, organised in three main sections: 1) Dairy Production Systems, 2) Economics and Markets, and 3) Policy and Institutions.
Volume 2: Main Report (this volume) Presents more detailed findings, as well as supplementary appendices, organised in the same manner as Volume 1.
Volume 2: Main Report
Study Participants __________________________________________________________ i Acknowledgements______________________________________________________________ i
Table of Contents__________________________________________________________ ii
List of Figures______________________________________________________________v
List of Tables ______________________________________________________________v
List of Abbreviations______________________________________________________ vii
Background to the study ___________________________________________________viii Objectives of the appraisal ______________________________________________________ viii Methodology_________________________________________________________________ viii Summary of the structured survey__________________________________________________ ix
Dairy Production Systems____________________________________________________1 Introduction ___________________________________________________________________ 1
The Island’s Geography _________________________________________________________ 1 The Island’s Dairy Livestock and Milk Sheds _________________________________________ 3 Cattle and buffalo production systems in the major agro-climatic and land-use zones ___________ 5 Milk production and marketing: the current situation ___________________________________ 6 Feed Resources________________________________________________________________ 9 Health status of cattle and buffaloes _______________________________________________ 10
Livestock Services ______________________________________________________________11 Breeding and Insemination Services _______________________________________________ 11 Veterinary services ____________________________________________________________ 12 Extension and training services ___________________________________________________ 12 The Mahaweli authority_________________________________________________________ 13
Progress in dairy production and marketing _________________________________________14 Dairy production _____________________________________________________________ 14
Results of the Survey of Cattle and Buffalo Producer Households _______________________16 Regional variation in cattle and buffalo keeping_______________________________________ 16 Regional variation in cattle and buffalo breeds _______________________________________ 16 Size and structure of cattle herds__________________________________________________ 17 Cattle performance by breed type and zone__________________________________________ 21 Buffalo performance by breed type and zone ________________________________________ 22 Main feeding practices by zone ___________________________________________________ 23 Concentrated feed use__________________________________________________________ 23 Diseases reported in cattle herds __________________________________________________ 27

Table of contents
Appraisal of the Sri Lanka Dairy Sector:Main Report iii
Land holdings and land use______________________________________________________ 30 Dairy Farm Labour ____________________________________________________________ 31 Constraints to dairy production reported by farmers ___________________________________ 31 Constraints to, and opportunities for, improving production aspects of the dairy sector ________ 34
Dairy Economics and Markets _______________________________________________35 Overview of Trends in the Dairy Sector ____________________________________________ 35
Supply and demand prospects____________________________________________________ 36
Economics of Dairy Production ___________________________________________________41 Farm-level budgets ____________________________________________________________ 41 Opportunity costs of labour _____________________________________________________ 42
Milk Collection and Marketing___________________________________________________ 44 Producer Price of Milk _________________________________________________________ 44 Producer household milk disposal_________________________________________________ 45 Milk Collection _______________________________________________________________ 47 Other services from co-operatives and collection centres _______________________________ 52 Milk Processing_______________________________________________________________ 53 Market channels in the Sri Lankan market for dairy products ____________________________ 54
Milk and dairy product consumption______________________________________________ 56 Dairy expenditure patterns ______________________________________________________ 56 Liquid milk market and consumer behaviour_________________________________________ 57 Milk powder market and consumer behaviour________________________________________ 58 Other milk product consumption _________________________________________________ 58
Main Issues Emerging from the Market and Economic Analysis _______________________ 60
Policies and Institutions in the Dairy Sector ____________________________________61 Government institutions supporting the dairy sector __________________________________61
Ministry of Livestock Development and Estate Infrastructure____________________________ 61 Department of Animal Production And Health (DAPH) _______________________________ 62 Provincial Departments of Animal Production and Health ______________________________ 63 National Livestock Development Board (NLDB) _____________________________________ 63 Kiriya Milk Industries of Lanka Company Limited ____________________________________ 63 Livestock Development Division of Mahaweli Authority of Sri Lanka _____________________ 64
Private sector institutions for dairy development. ____________________________________ 65 Nestles Lanka Limited (NLL) ____________________________________________________ 65 International Dairy Products Limited (IDPL) ________________________________________ 66 Swiss Cheese Company Limited __________________________________________________ 66 Coconut Triangle Milk Union (CTMU)_____________________________________________ 66
Policies and strategies for dairy development ____________________________________ 68 Animal feed _________________________________________________________________ 69 GST on Animal Feeds__________________________________________________________ 69 Pasture and fodder for dairying ___________________________________________________ 70 Trade Policies ________________________________________________________________ 71 Promotion of private sector activities ______________________________________________ 71
Recommendations _________________________________________________________72 Recommendations for production systems _________________________________________ 72
Recommendations for economics and markets______________________________________ 72
Recommendations for policies and institutions _____________________________________ 72
References________________________________________________________________74

Table of contents
Appraisal of the Sri Lanka Dairy Sector:Main Report iv
Appendices_______________________________________________________________77 Appendix 1: Terms of Reference__________________________________________________ 77
Appendix 2: Stakeholder Meeting Participants ______________________________________ 80 First stakeholder meeting – Peradeniya, Dec. 17, 1997 _________________________________ 80 Final stakeholder meeting - Peradeniya, Oct. 5, 1998 __________________________________ 81
Appendix 3: Production Systems _________________________________________________ 82 The health status of cattle and buffalo______________________________________________ 82 District milk production ________________________________________________________ 90
Appendix 4: Economics and Markets ______________________________________________91 Sample design for the Household Survey ___________________________________________ 91 Producer and consumer milk prices in the formal dairy industry in Sri Lanka ________________ 92 Total Imports and Exports of Milk and Milk Products (‘000 US$) ________________________ 93 Trends in milk collection and producer prices of milk__________________________________ 93 Consumer market for Milk & Milk Products: 1992-94__________________________________ 94 Imports of Milk and Milk Products (LME), Sri Lanka: 1981–94 __________________________ 95 Annual Milk Collection by Major Processors (‘000 litres), 1980-94 ________________________ 95 Milk Collection at Chilling Centres: MILCO and Nestles (1994) ________________________ 96

Table of contents
Appraisal of the Sri Lanka Dairy Sector:Main Report v
List of Figures Figure 1: Conceptual framework for the Rapid Appraisal of dairy systems...................................................... ix Figure 2: Agroclimatic Zones and Milksheds in Sri Lanka.................................................................................... 2 Figure 3: District Distribution of Cattle and Buffalo Populations in Sri Lanka, 1997. ................................... 4 Figure 4: Milk density and Average Milk Production of Cattle and Buffaloes of selected Districts. ............. 8 Figure 5: Monthly variation in Milk Collection, 1994 – 1997. .............................................................................. 9 Figure 6: Estimated lactation curves for Sri Lankan cattle. Source: Survey .................................................... 22 Figure 7: Changes in milk supply and collection................................................................................................... 35 Figure 8: Domestic Sri Lanka milk production and dairy imports (LME’s), 1987 to 1997. .......................... 36 Figure 9: Real producer and consumer milk prices and milk powder imports from 1990 to 1997............. 45 Figure 10: Dairy channel flow diagram for Sri Lankan dairy sector, expressed in terms of % of milk
production (LME’s). ............................................................................................................................. 54
List of Tables Table 1: Contributions of the agro-climatic/land-use zones to milk production and collection (some: X;
major XX) in, and flows (+) to, the five milk sheds of Sri Lanka................................................ 3 Table 2: Cattle and buffalo systems: topography, climate and animal husbandry. ........................................... 5 Table 3: Approximate numbers of cattle and buffaloes in each agro-climatic/land-use zone * ..................... 5 Table 4: Location and areas of natural grazing in Sri Lanka ................................................................................ 9 Table 5: Number of artificial inseminations (AI), pregnancy diagnoses (PD) and AI calves reported born
from 1986 to 1996................................................................................................................................. 11 Table 6. Estimates of Milk Production (‘000 Litres) of Cattle and Buffaloes, 1987 to 1996........................ 14 Table 7. Estimates of Number of Milch cows and percentage in milking, 1987 to 1996 ............................. 14 Table 8: Percentage of sampled households (HH) with bovines in each zone keeping cattle and or
buffaloes.................................................................................................................................................. 16 Table 9: Percentage of indigenous, dairy crossbred and dairy purebred types in zonal cattle populations. 17 Table 10: Percentage of indigenous, dairy crossbred and dairy purebred types in zonal buffalo populations
.................................................................................................................................................................. 17 Table 11: Mean herd size and structure of the cattle keeping households ...................................................... 18 Table 12: Mean herd size and structure of households keeping buffaloes..................................................... 18 Table 13: Mean age at first calving and daily milk yield reported for indigenous, dairy crossbred and dairy
purebred cattle ....................................................................................................................................... 21 Table 14: Mean age at first calving and daily milk yield reported for indigenous, dairy crossbred and dairy
purebred buffalo.................................................................................................................................... 23 Table 15: Percentage of households (HH) by zone grazing or stall feeding their bovines ............................ 23 Table 16: Percentage of households (HH) by zone using concentrate feeds for their bovines .................... 23 Table 17: Percentage of households (HH) feeding concentrates and the mean concentrate feed offer rate
(kg/day)* by species and lactation status ........................................................................................... 24 Table 18: Number of households (HH) reporting feeding concentrate types and their quantities (kg/d) to
milking and dry cows ............................................................................................................................ 24 Table 19: Number of households purchasing feeds from specific sources..................................................... 25 Table 20: Concentrate prices (Rs per Kg) by zone ............................................................................................... 25 Table 21: Percentage of producer households employing different feeding practices.................................... 25 Table 22: Zonal variation in feeding methods of producer households who practice grazing ..................... 26 Table 23: Percentage of producer households accessing various cut-and-carry fodder sources................... 26 Table 24: Percentage of producer households (HH) reporting transactions for purchased dairy inputs
from various sources............................................................................................................................. 29 Table 25: Number of cattle reported as diagnosed with conditions/diseases last year ................................. 29 Table 26: Number of cases and reasons for bovine mortality in the past year reported by the producer
households in the survey...................................................................................................................... 29 Table 27: Land holdings and land use pattern across all surveyed households ............................................... 30 Table 28: Households’ use of own land (acres) by zone...................................................................................... 30

Table of contents
Appraisal of the Sri Lanka Dairy Sector:Main Report vi
Table 29: Household members involvement (mean no. of hrs per day) in dairy activities ............................ 31 Table 30: Number of farmers reporting constraints (primary and secondary) to dairy production ............. 32 Table 31: Human population growth: past trends in Sri Lanka ........................................................................ 37 Table 32: Estimated expenditure elasticity of demand (double-log) for milk and milk products............... 37 Table 33: Underlying parameters used for dairy demand projections.............................................................. 37 Table 34: Estimated sensitivity of domestic milk power prices to changes in whole milk powder (WMP)
world prices and exchange rates.......................................................................................................... 38 Table 35: Estimated average annual budgets for typical smallholder cattle-keeping households in Sri
Lanka, by zone and overall. ................................................................................................................. 41 Table 36: Milk disposal from milk producing households, mean litres per day and percent of production
.................................................................................................................................................................. 46 Table 37: Milk Disposal Outlets Reported, Amount Disposed per day and Milk Prices (Rs/L). ............... 46 Table 38: Milk Disposal Outlets, quantity disposed (Litres/day) and No of households, by AEZ. ............ 46 Table 39: Relative role of milk collection centre (MCC) types, and sales loyalty by dairy farmers............... 46 Table 40 : Formal milk collection by agro-climatic zones, Lt. and % shares, 1996. ...................................... 48 Table 41: Number of dairy co-operatives by Province: 1997. ........................................................................... 49 Table 42: Indicative costs at different stages of milk collection. ........................................................................ 52 Table 43: No of farmers receiving other services from collection centres ....................................................... 52 Table 44: Estimated shares in the dairy market of Sri Lanka............................................................................. 55 Table 45: Expenditure patterns for milk & milk products, as Rs/month and as percentage of monthly
household income. ................................................................................................................................ 57 Table 46: Milk Collection, Average Price Paid for the Farmers and Average Price Sold to the Processors
by CTMU During 1990 - 1996............................................................................................................ 68

List of abbreviations
Appraisal of the Sri Lanka Dairy Sector:Main Report vii
List of Abbreviations AEZ agro-ecological zone AGA Assistant Government Agent APH Animal production and health AI Artificial insemination a.m.s.l. above mean sea level BOI Board of Investment BSE Bovine spongiform encephalopathy CIF Cost of insurance and freight CTMU Coconut Triangle Milk Union DAPH Department of Animal Production and Health DCCs Dairy collection centres DDF Dairy Development Foundation DS Divisional secretariat FMD Foot and mouth disease GDP Gross domestic product GIS Geographical Information Systems GN Grama Niladari GST Good and Services Tax HH Household HS Haemoragic septicaemia IDPL International Dairy Products Limited ILRI International Livestock Research Institute (Kenya) L or l litres LDI Livestock development instructor LME Liquid milk equivalents M Million MCCs Milk chilling centres MIDCOMUL Mid Country Milk Union Limited MILCO Milk Industries of Lanka Co. Ltd (Kiriya) MLD&EI Ministry of Livestock Development and Estate Infrastructure MTs Metric tonnes NLDB National Livestock Development Board NLL Nestle Lanka Limited NMB National Milk Board NDDB National Dairy Development Board (India) Rs Sri Lankan rupees RRA Rural Rapid Appraisal survey SD standard deviation SMP Skim milk powder SNF Solids non-fat UHT Ultra-high temperature VRI Veterinary Research Institute VS Veterinary surgeon WMP Whole milk powder WTO World Trade Organisation

Background to the study
Appraisal of the Sri Lanka Dairy Sector:Main Report viii
Background to the Study The initiative for this Dairy Sector Appraisal arose from a shared interest by the Ministry of Livestock Development and Estate Infrastructure and the National Dairy Development Board of India, to review progress in the Sri Lanka dairy sector with a view to identifying strategies for continued development. Due to its experience in this type of research, the International Livestock Research Institute (ILRI) was asked to assist in facilitating this review. A stakeholder’ meeting was held in Peradeniya on December 17, 1997 to further the implementation of this idea. At that meeting, which was attended by a wide variety of participants from the public sector, research and development agencies and the private sector, a number of priority issues to be addressed through the Sector Appraisal were identified. The general objective of the Appraisal would be to review dairy development in Sri Lanka, and identify priority development and research interventions. The approach agreed upon generally followed the ILRI Conceptual Framework for Dairy Research (Rey et al., 1993), which addresses the entire consumption-to-production spectrum within dairy systems. It was decided to assign researchers to examine each of the primary set of issues: a) production systems, b) economic and structural issues, and c) policy and institutional issues. The Terms of Reference (TOR) for each topic are presented in Appendix 1. The team leader chosen to co-ordinate the Appraisal was Dr MNM Ibrahim, from the Department of Animal Science of the University of Peradeniya.
Objectives of the appraisal As agreed at the initial stakeholder meeting, the overall objective was to bridge information gaps to assist and accelerate dairy development in Sri Lanka. The specific objectives were to: 1. Highlight the nature and distribution of dairy production, processing, marketing and consumption; 2. Identify the potential for further development of the dairy sector and the primary constraints which
impede the potential; and 3. Suggest areas that should be targeted for investment, policy and technological interventions and research
in support of the development of the dairy sector. The main areas targeted for the study were the zones typically used in differentiating agricultural systems in Sri Lanka: Up-country, Mid-country, Coconut Triangle, Northern Dry Zone and Southern Dry Zone.
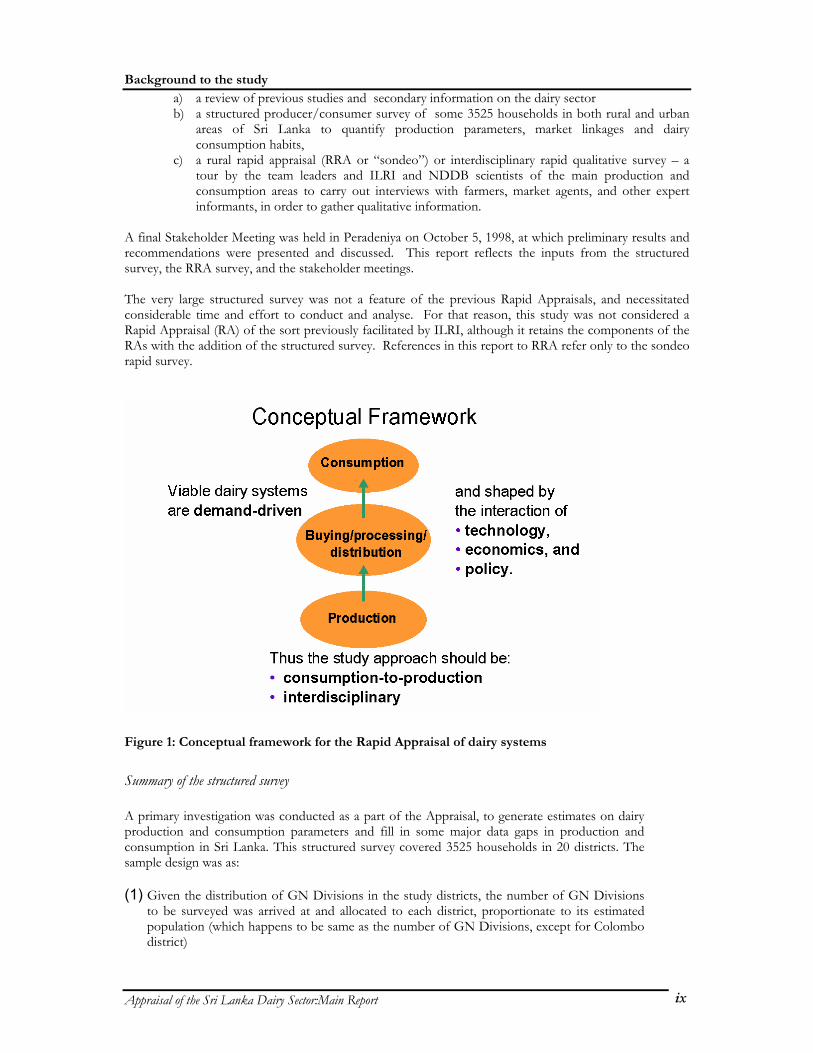
Methodology The methodology used in this study was based on ILRI’s Conceptual Framework for Dairy Research (Rey et al., 1993), further refined through Dairy Rapid Appraisals carried out by ILRI with its collaborators in Uganda and Tanzania. The approach centres on the principle that viable dairy systems are necessarily demand-driven (Figure 1). Thus the focus is on market-orientation, and the analysis begins by considering current and potential market demand, as any significant expansion or development of the dairy sector will depend on effective demand. Further, given that dairy systems are shaped by the interaction of technology, economics, and policy, an interdisciplinary approach is needed, so that is reflected in the make-up of the research teams. Critical to generating new insights and information that are not simply a repetition of previous assessments, is a willingness to challenge prevailing notions among the development and research stakeholders in the dairy sector. This approach was taken in the Appraisal, with a view towards testing current presumptions against the available facts, as their validity may be undermined by contrary evidence, or because the dynamics of the sector have rendered them outdated. The Appraisal was subsequently carried out during April to July 1998. It was composed of the following parts:
Background to the study
Appraisal of the Sri Lanka Dairy Sector:Main Report ix
a) a review of previous studies and secondary information on the dairy sector b) a structured producer/consumer survey of some 3525 households in both rural and urban
areas of Sri Lanka to quantify production parameters, market linkages and dairy consumption habits,
c) a rural rapid appraisal (RRA or “sondeo”) or interdisciplinary rapid qualitative survey – a tour by the team leaders and ILRI and NDDB scientists of the main production and consumption areas to carry out interviews with farmers, market agents, and other expert informants, in order to gather qualitative information.
A final Stakeholder Meeting was held in Peradeniya on October 5, 1998, at which preliminary results and recommendations were presented and discussed. This report reflects the inputs from the structured survey, the RRA survey, and the stakeholder meetings. The very large structured survey was not a feature of the previous Rapid Appraisals, and necessitated considerable time and effort to conduct and analyse. For that reason, this study was not considered a Rapid Appraisal (RA) of the sort previously facilitated by ILRI, although it retains the components of the RAs with the addition of the structured survey. References in this report to RRA refer only to the sondeo rapid survey.
Figure 1: Conceptual framework for the Rapid Appraisal of dairy systems
Summary of the structured survey A primary investigation was conducted as a part of the Appraisal, to generate estimates on dairy production and consumption parameters and fill in some major data gaps in production and consumption in Sri Lanka. This structured survey covered 3525 households in 20 districts. The sample design was as: (1) Given the distribution of GN Divisions in the study districts, the number of GN Divisions
to be surveyed was arrived at and allocated to each district, proportionate to its estimated population (which happens to be same as the number of GN Divisions, except for Colombo district)

Background to the study
Appraisal of the Sri Lanka Dairy Sector:Main Report x
(2) Sampling of GN Divisions in a given district was based on a random selection (3) Given a sample GN Division, the households (one in every ten) were randomly selected
from the GN household list, thus both household with and without livestock were interviewed. Those with livestock were interviewed for both dairy production and consumption information, and those without were interviewed for consumption information only. The interviews were carried out by students from Peradeniya University.

Dairy production systems
Appraisal of the Sri Lanka Dairy Sector:Main Report 1
Dairy Production Systems
Introduction Sri Lanka’s dairy production systems and their market linkages have developed in response to domestic demand for milk and dairy products, particularly the demand from Colombo’s large relatively rich, urban population. The systems found in specific areas strongly reflect the variation in climate and agro-ecology and the resultant land-use patterns, with adaptations according to the level of participation in the dairy market, both local and distant. The national population, which has an annual rate of growth of approximately 1%, is almost 18 million. Urban growth is faster, and currently about 25% of the population lives in urban centres. Colombo, with some 750,000 inhabitants, and Dehiwala-Mt. Lavinia, Jaffna, Moratuwa, Kottee, Kandy and Galle, with 100,000 to 225,000, are the principal concentrations of consumers of marketed milk and dairy products.
The Island’s Geography For administration purposes, Sri Lanka has ten provinces and 25 administrative districts. Population densities range from over 1,300 people per sq. km in Western Province to 115 in North-Central Province (Central Bank Annual Report, 1996), reflecting variation in urbanisation, agricultural potential and land-use systems. Aside from the densely populated periurban Colombo region and the adjacent coconut triangle, the rural population is concentrated in the mid- and up-country regions in the south central mountainous zone. This zone, which rises to a height of 7,000 – 8,000 feet a.m.s.l., is surrounded on all sides by flat lowland (Figure 2). The lowlands, between the highlands and the coast, occupy a relatively narrow strip in the south-east, south and west, but to the north they spread out into a large plain. Since the country is located on the border of the equatorial belt, it’s climate is characterised by low variations in temperature and rainfall. Rainfall is concentrated in two monsoons: the north-east monsoon in November – January, locally referred to as the maha season, and the south-west monsoon during May – August, locally known as yala season. These are supplemented during the inter-monsoonal period by convectional storms, and in October by cyclonic depressions coming from the east. The south-west monsoons are mostly confined to the south-central mountainous region and to the lowland between it and the coast to the west and south. The north east monsoon rains are island-wide. These rainfall distributions result in three distinct zones: the Dry (which receives only from one monsoon and an annual rainfall of 875-1875 mm); the Wet, which receives both monsoons and an annual rainfall of about 2500 to 5000 mm; and, the Intermediate zone, the narrow strip of land which lies between them, which has an annual rainfall of 1875 to 2500 mm. The Dry, Intermediate and Wet zones cover approximately 4.1, 0.9 and 1.5 million ha, respectively. Within these zones, agricultural (cultivated) land is estimated at approximately 2 million ha (about 30% of the total) of which 75% are smallholdings, and of these 90% are less than 2 ha. The MLD&EI (1995) estimated that 33% of these smallholdings have livestock. The total agricultural population is estimated at around 10 – 11 million, with an estimated 3.5 million involved with livestock of whom 70% are rural farmers. Consequently smallholders dominate agricultural production, including dairy.

Dairy production systems
Appraisal of the Sri Lanka Dairy Sector:Main Report 2
Figure 2: Agroclimatic Zones and Milksheds in Sri Lanka
Source: DDF Desk Study, 1986.

Dairy production systems
Appraisal of the Sri Lanka Dairy Sector:Main Report 3
The Island’s Dairy Livestock and Milk Sheds The national livestock population contributing to, or with potential to contribute to, dairy production, includes 1.64 m. cattle, 0.76 m. buffaloes and 0.54 m. goats, with an estimated 697,300 milch cows and 234,800 milch buffaloes in 1996 (Dept. Census and Statistics, 1997). Because large ruminant production is largely based on natural grazing, approximately 70% of cattle and 75% of buffalo are found in the Dry and Intermediate zones. Goats do not currently, nor are expected to, contribute significantly to dairy production. Figure 3 shows the distribution of the cattle and buffalo by district in 1997, based on official statistics. It should be borne in mind that the quality of the statistical data on the livestock sector is relatively poor, hence the efforts of the current study to gather reliable estimates to serve as a sounder basis for the planning of Sri Lanka’s dairy development. The cattle and buffalo populations are managed in production systems that are characteristic of the five major agro-climatic/land-use zones: Up-country; Mid-country; the Coconut triangle; the Wet low country (the south-west lowlands); and, the Dry (lowland) zone. The latter has both rainfed and irrigated (Mahaweli) farming systems, and, in addition, the rainfed systems of the southern, eastern and northern regions of the Dry lowlands have some distinguishing characteristics.
Table 1: Contributions of the agro-climatic/land-use zones to milk production and collection (some: X; major XX) in, and flows (+) to, the five milk sheds of Sri Lanka
Dry zone Milk Shedsa North East South
Wet Low Country
Coconut Triangle
Up- Country
Mid- Country
Colombo + + X X XX + + Kandy X XX XX Moneragala
XX XX X X
Polonnaruwa
XX X
Jaffna XX a Based on DDF Desk Study Report (1986). As is shown in Table 1, these seven agro-climatic/land-use zones contribute to milk production and collection in, and milk flows to, the five milk sheds identified in the DDF Desk Study Report (1986). The vast majority of the milk comes from smallholder herds.

Dairy production systems
Appraisal of the Sri Lanka Dairy Sector:Main Report 4
Figure 3: District Distribution of Cattle and Buffalo Populations in Sri Lanka, 1997.
Distribution of CattlePopulationas % of total
Insufficient data< 3 %3 - 5 %6 - 9%>10%
Distribution of BuffaloPopulationas % of total
Insufficient data< 3 %3 - 5 %6 - 9%>10%

Results of the household survey
Appraisal of the Sri Lanka Dairy Sector:Main Report 5
Table 2: Cattle and buffalo systems: topography, climate and animal husbandry.
Zone Elevation m
Rainfall mm/yr
Temp. Range oC
Type of Animal Husbandry Practices
Up-& Mid- country
>450 >2000 10-32 Pure exotic and crosses; some zebu crosses
Zero grazing small herds; some tethering
Coconut triangle
<450 1500-2500
21-38 Crosses of exotic breeds. Zebu types. Indigenous animals and crosses. Buffaloes
Limited grazing. Tethered under coconut palms. Medium sized herds
Wet lowlands
<450 1875-2500
24-35 As above Limited grazing. Medium sizes herds
Dry lowlands
<450 1000-1750
21-38 Indigenous cattle. Zebu cattle and their crosses. Buffaloes
Free grazing large, nomadic herds. Sedentary small herds in irrigated schemes
Cattle and buffalo production systems in the major agro-climatic and land-use zones The cattle and buffalo production systems can be classified by the breeds utilised and the husbandry practised, which in turn are closely related to the agro-ecology and climate. These can be summarised for four major agro-climatic/land-use zones: up- and mid-country; the coconut triangle; the wet lowland; and, the dry lowland. The common topographic and climatic features, types of animals and husbandry practices in the major systems are given in Table 2. The classification does not include the intensive dairying system in Jaffna, to which access is limited currently because of the military conflict. The approximate numbers of cattle and buffaloes in each zone are shown in Table 3. Amongst the up- and mid-country cattle, it is estimated that nearly 50% are dairy cows. In the coconut triangle and the wet lowlands, the proportion of dairy cows is around 40%, whereas in the dry lowlands it is around 30%. In general the percentage of buffaloes used for milk production is lower than for cattle. In the rice production areas of the dry and wet lowland zones and the coconut triangle, a considerable proportion of buffaloes and cattle are used for draught power.
Table 3: Approximate numbers of cattle and buffaloes in each agro-climatic/land-use zone *
Zone Cattle Buffalo Up- & Mid -country 121,000 21,700Coconut triangle 177,000 73,000Wet lowlands 142,000 137,300Dry lowlands 1,104,000 518,900
*Estimated from Livestock Data, DAPH June 1997 The Up-country or hill country zone lies above 1200 meters a.m.s.l. and is characterised by tea plantations and dairy production from cattle kept in two systems, the estate- and village-based systems. In the estate-based system many of the employees in the tea estates rear dairy cattle, generally the European breeds, Ayrshire, Friesian and Jersey, and their crosses, although the popularity of the Friesian is said to be increasing at the expense of the Ayrshire. Average milk yields are reported as up to 8 litres/cow/day or about 2,500 litres/cow/lactation. In this estate-based system, the dairy farmers own no land and are dependent upon weeds from the estate land and fodder gathered from near waterways and other communal and public areas. Manure is often sold. In the village-based system, the majority of smallholders

Results of the household survey
Appraisal of the Sri Lanka Dairy Sector:Main Report 6
are crop-livestock farmers, growing vegetables and paddy. Manure is a major product from their cattle, with milk often a secondary source of income. In the Mid-country, the European dairy breed crosses, are an increasing proportion of the smallholder cattle herd, but there are many crosses with Indian breeds and milk yields are correspondingly lower. They are reported to be about 6 litres/cow/day or around 1,500 litres/cow/lactation. Farms combine a homestead tree garden system (McConnel, 1992) with rice production in the low lying land, generally cultivated by buffalo. Land sizes are small (Westernbrink, 1986), encouraging the adoption of zero-grazing, with generally two cows and their progeny. There is an increasing dependence on fodder from off-farm and on concentrate purchases, which are influenced by the level of household income (EEC Project Report, 1996). In the Coconut triangle and the Wet lowlands cattle and buffalo form an integral part of the farming systems, helping in weed control and providing manure in the coconut lands. Buffaloes are used principally for draft purposes in paddy cultivation and are kept in almost all the rice growing areas. Some farmers rear dairy buffaloes, pure Indian breeds or their crosses managed under a intensive or semi-intensive system. The buffalo milk is generally converted to curd for which there is high demand locally. In both zones cattle and buffalo graze on the fallow paddy fields, as well as on the natural pastures under the coconut plantations and in non-cultivated areas, including common properties. In the Dry lowland zone cattle are predominantly indigenous Zebu, although Sahiwal crossbred cattle, and improved buffalo in the eastern dry zone, are becoming more common, especially in the Mahaweli irrigated areas. These cattle and buffalo form an important capital asset (an inflation-proof insurance fund) for the peasant farmers, and where there is the possibility to sell milk, it is becoming an important source of income. Many herds are grazed on common lands and in the farmer’s or neighbours’ fallow paddy fields, and brought to the homestead at night to avoid theft and damage to crops. The feeding of rice straw is common; generally concentrates are not fed. Herd sizes average 10 - 25 with some of more than 100 animals. The average production of milk extracted for human consumption from the indigenous breeds is about 1 litre per cow per day, with 2-3 times more from Sahiwal. Labour and Gender Livestock and particularly dairying, are traditional economic activities for which women commonly provide a major part of the labour input. According to de Moor (1989), in most households in the coconut triangle and mid country areas where dairy cattle were kept, more than one person was involved in dairy, with the work load divided among family members. On the average, respondents spent three hours per day on dairy related activities. According to Mendis, (1989), the main responsibility in attending to the dairy enterprise fell on the women, with other members helping wherever possible. The women were involved in almost all dairy activities, including feeding.
Milk production and marketing: the current situation The government has been active in its support for domestic dairy production and marketing through, for example, it’s policies to promote the breeding and distribution of dairy stock. Yet it is said that the anticipated growth in the dairy sector, principally through development of smallholder dairy in the production systems (see previous section), has been hindered by inadequate extension and veterinary services (including AI) to increase milk production, and by insufficient cooling and marketing facilities to capture the milk produced in the 25 districts. Government estimates indicate that Nuwara Eliya district has the highest milk production, with Batticaloa, Hambanthota, Anuradhapura, Amparai, Badulla, Kandy, Kurunegala and Polonnaruwa districts being significant producers, many of them serving the Colombo market (Figure 4). On the other hand, the civil conflict in the north and east, which began in the early 1980's, has adversely affected milk production and collection in the Jaffna milk shed (Table 1). In the remaining districts, milk collection in 1996 by the processing companies was around 100 million litres, which was an increase of about 13
Results of the household survey
Appraisal of the Sri Lanka Dairy Sector:Main Report 7
percent over 1995 (Milk Industries of Lanka Company Limited), and is said to represent around 30 percent of the estimated annual production. The government’s aim is to substantially increase this level of milk production and collection in the medium and long term. One initiative has been to encourage the upgrading of the indigenous herds by matings with temperate and Indian dairy breeds through an artificial insemination programme, which was projected to serve 90,000 cows in 1994 increasing to 580,000 by the year 2000 (MLD&EI, 1995). Through this and other initiatives, it is considered that in the long term the country has the potential to be self sufficient in milk. This move to self sufficiency will provide additional nutrition to the population, and generate important income and employment, while saving the foreign exchange currently spent on the dairy imports required to fill the gap between domestic production and consumption. In 1996 the amount of milk collection all island was 100 million litres, 13% more than in 1995. The total estimated milk production for 1996 was 331,306,000 litres, indicating that only about 30% of the total milk production is handled by the formal milk sector. Of the formal collection of 100 million litres of milk in 1996, 54 million litres of milk (or 54%) is collected by the Milco and the Nestles Lanka Limited (NLL) accounted for 36 million litres (or 36%), with the balance being shared by Nestles group (IDPL) and a number of small processors. Until the current study there have been no estimates of the informally (directly ) marketed milk production. High human and bovine densities in the areas of intensive agriculture and those close to major urban markets, result in high milk production and collection per sq. km, varying in 1996 between Nuwara Eliya with 66 l/day/sq km, and, for example, Colombo 36, Gampaha 24 and Jaffna 20 (Figure 4). Conversely the large bovine herds in the dry lowland districts have relatively low stocking rates and therefore milk production densities are low. Despite this, the dry and intermediate zones, with 70 - 75% of the national cattle and buffalo population, provides about 60% of the national milk collection.

Results of the household survey
Appraisal of the Sri Lanka Dairy Sector:Main Report 8
a) Milk density (Lt/day/sq. Km
KilinochchiMannar
KegallePuttalam Galle
TrincomaleeKalutara
KandyColombo
Nuwara Eliya
10
20
30
40
50
60
70
Districts
Milk density (Lt/day/sq. Km)
b) Milk Production of Cattle
Kilin
ochc
hi
Man
nar
Keg
alle
Putta
lam
Gal
le
Trin
com
alee
Kalu
tara
Kand
y
Col
ombo
Nuw
ara
Eliy
a
0
1
2
3
4
5
6
7
Districts
Milk prod(lt/Animal/Day)
c) Milk Production of Buffaloes
Kilin
ochc
hi
Man
nar
Kega
lle
Putta
lam
Gal
le
Trin
com
alee
Kalu
tara
Kand
y
Col
ombo
Nuw
ara
Eliy
a
0
1
2
3
4
5
6
7
Districts
Milk prod(lt/Animal/Day)
Figure 4: Milk density and Average Milk Production of Cattle and Buffaloes of selected Districts.

Results of the household survey
Appraisal of the Sri Lanka Dairy Sector:Main Report 9
Jan Feb March April May June July Aug Sept Oct Nov Dec100,000
150,000
200,000
250,000
300,000
MONTHS
Average Milk Collection (LPD)
Average 'all island' Average 'MILCH' Figure 5: Monthly variation in Milk Collection, 1994 – 1997.
Another important influence on milk production and the surpluses potentially available for collection and marketing is the seasonality of milk supply. Some of this variation is captured by the monthly variation in milk procurement averaged over the last four years (1994 - 1997; Figure 5). The seasonal pattern is similar for both all island and MILCO collection, with more milk supplied to the processing market in May, June and July, implying that production of milk is higher during this period.
Feed Resources Major influences on the quantities of milk produced and available for supplying the domestic market, are the feed resource base and how the feeds are utilised. This feed supply and its interaction with the genetic composition of the cattle and buffalo populations, are the primary determinants of dairy productivity in Sri Lanka where, compared to many tropical production environments, disease challenge is relatively low (Appendix: Health). Therefore if Sri Lankan farmers are to exploit the improved genetic potential of the national bovine population resulting from the upgrading programme, particular attention must be given to improving the feeding systems for smallholder dairy production. As indicated in Table 2, the predominant feed resources from which the domestic milk supply is produced, are natural pasture and browse. This natural vegetation, especially the grasses, are low in digestibility and crude protein, and dry matter production is low in the dry months. While the areas of natural pasture available nationally are large and their sources varied (Table 3), the low nutritive value of the grasses, compensated somewhat by the availability of browses of higher protein content, limits daily intake of digestible OM. Consequently the resultant productivity of cattle and buffalo is low, especially amongst the improved (crosses and purebred) dairy cattle. Similar limitations of poor quality (low nutrient density) reduce the utility, especially for lactating cows, of the large quantities of crop residues available for feeding of cattle and buffalo. Rice straw (1.82 million tons), maize stover (0.09 million tons), and other straws such as cowpea, millet, black gram and soy bean are the principal crop residues available to smallholder dairy farmers as substitutes for the natural pasture and browse or to complement their seasonality (Ranawana 1994). In addition there are an estimated 0.24 million tons of sugar cane tops and the same quantity of Banana pseudo-stems.
Table 4: Location and areas of natural grazing in Sri Lanka
Location Hectares Dry Zone (non irrigated) 400,000 Coconut Plantations 140,000 Hill Country patna lands 55,000 Fallow paddy fields 30,000

Results of the household survey
Appraisal of the Sri Lanka Dairy Sector:Main Report 10
Homestead gardens 20,000 Road sides/ Railway Embankments etc. 5,500 Others 5,000 Total Area 655,500
These crop residues and natural pastures, fed alone or with minimal concentrate feeds (e.g. coconut poonac and rice bran), can only sustain low daily milk yields (4-6 litres) from crossbred dairy cows, and less in the dry months. Yet in combination with good quality fodder and higher levels of concentrates, natural pasture and crop residues can be efficiently utilised as the basal feeds for sustaining and increasing Sri Lanka’s smallholder dairy production (Ranawana 1994). Rice bran, coconut poonac and molasses are the main sources of concentrates used in dairy production to supplement the generally poor quality (low nutrient density) fodder basal diets. It has been estimated that there are 70-90,000 tone of rice bran produced annually. However much of this is wasted mainly due to inefficient methods of milling, that do not separate the rice hulls, which have virtually no nutritional value (digestibility of 12%), from the valuable bran. As a result, only 25,000 tons of rice bran are suitable for dairy feed. Coconut poonac is the only medium protein source; on average some 40,000 tons are available annually. The price varies regionally, ranging from Rs. 7.00 to 16.50/kg. Imported oil seed meals such as cotton seed meal, spent liquor from alcohol distillers, soya bean hulls from soya bean industry are also available as concentrate feeds. A neglected concentrate source is poultry manure, although its usefulness to smallholders will depend on the cost of transport from the large-scale intensive poultry units, generally located in periurban areas, which are its principal sources. The expansion of the sugar industry has resulted in relatively inexpensive molasses, but the establishment of distilling industries and the opening up of potential markets in Europe has diverted the molasses from animal feeding. Because of this, it is unlikely that molasses will be available in Sri Lanka for cattle feed or for molasses urea block manufacture in the foreseeable future. A number of improved grasses have been studied as forages for ruminants. If managed well and cut at the right stage of maturation, they produce good forage for dairy cows and buffaloes. It has been reported that some 50,000 ha of improved pasture are in production and there is considerable scope for farmers to increase this area, particularly in the coconut triangle, if market incentives stimulate this investment. Research by the Coconut Research Institute shows clearly that grazing livestock under pasture does not compromise coconut yields.
Health status of cattle and buffaloes The health status of cattle and buffaloes in Sri Lanka is largely dependent on the breeds and husbandry practices, which in turn are closely related to the different climatic and topographical features, and agricultural practices. From the standpoint of the prevalence and distribution of animal diseases, four agro-climatic zones can be recognised. As described in the Introduction, these are: the hill and mid country; coconut triangle; low country wet zone; and, the lowland dry zone. Their topographic and climatic features, types of animals and husbandry practices were given in Table 2, and their approximate populations of cattle and buffalo in Table 3. The diseases of economic importance in these zones are discussed in detail in the Appendix (Health). In summary, while many bovine diseases are prevalent, and some endemic, in the areas of current and potential dairy production, there are well-documented health management practises, both curative and prophylactic, for minimising the risk of infection from these diseases and the productivity losses associated with infection. Disease constraints to dairy productivity are therefore associated with the need to improve the delivery of veterinary services to dairy farmers and to improve the quality of those services, especially for preventive medicine. Clearly these are policy and institutional rather than technical issues. A recommended approach to the strengthening of veterinary services is to associate their delivery more directly with organisations (farmers’ groups; co-operatives; private milk processors; etc) collecting and marketing milk as a transitional stage to private sector delivery.

Results of the household survey
Appraisal of the Sri Lanka Dairy Sector:Main Report 11
Livestock Services
Breeding and Insemination Services The Department of Animal Production and Health is responsible for breeding policy nationally and manages three artificial insemination centres. National breeding policy guidelines for cattle, buffaloes, and goats, sheep and pigs have been formulated to contribute to uniformity of livestock breeding in the various agro-climatic zones in Sri Lanka. Two Semen Production Units (SPU) at Kundasale in Central and Polonnaruwa in North Central provinces produce most of the semen for Sri Lanka. Both are equipped to produce deep frozen semen (DFS) and chilling semen (CS). Semen output from Polonnaruwa is limited to small amounts of fresh semen. With the exception of imported semen used in government breeding farms, all DFS in the national artificial insemination programme is produced at Kundasale.
Table 5: Number of artificial inseminations (AI), pregnancy diagnoses (PD) and AI calves reported born from 1986 to 1996
Year AI PD AI calves 1986 50,677 5,243 3,535 1987 46,321 3,742 1,164 1988 28,131 5,318 2,457 1989 36,182 2,742 2,918 1990 46,697 6,529 5,297 1991 51,219 5,348 6,262 1992 66,901 9,441 7,684 1993 73,516 8,109 8,186 1994 81,482 11,256 9,881 1995 96,138 14,242 14,519 1996 108,338 18,737 16,173
Source : Department of Animal Production & Health Artificial insemination in Sri Lanka is provided by Livestock Development Instructors from the veterinary ranges using either DFS or CS of buffalo and various breeds of cattle. DAPH trains most of the LDI in artificial insemination, with the objective of expanding insemination services mainly into the dry zone provinces of Northern, Central, Uva, and Sabaragamuwa. Inseminators have been mostly state employees since 1981, although under a privatisation initiative introduced by government in 1990, government technicians can work as private inseminators upon retirement. The number of Artificial Inseminations, Pregnancy Diagnoses and the AI calves reported born from 1986 to 1996 are shown in Table 5. Over 108,000 inseminations were carried out in 1996, twice as many as in 1986, although the increases were not uniform and were somewhat concentrated in the mid and up-country zones. As will be shown later, the AI programme has partially contributed to a major change to the genetic composition of the national cattle and buffalo populations, resulting in a large increase in the proportion of these populations having improved dairy production potential. Some of this can be seen as an achievement of the Government’s breeding policy, the objective of which for cattle is to produce a dairy type or a dairy dominated dual purpose (dairy/draft) type, depending on the agro-climatic zone. The temperate breeds recommended for cross breeding are Holstein Friesian and Jersey for the higher potential zones, and the zebu breeds Sahiwal and Khillari are recommended for the lower potential zones. It should be recognised, nevertheless, that much of the observed upgrading is likely to be a result of farmers’ own practices, including use of cross-bred bulls, and marketing of surplus replacement animals to deficit areas, often from mid or up-country to other zones. For buffalo, the Government’s breeding objective is to produce a dual (dairy/draft) type for the mid-country, the lowlands (wet and dry) and the coconut triangle. The exotic breeds recommended for cross breeding are Murrah and Nili Ravi. The breeding strategy is to up grade the indigenous buffalo to 87%

Results of the household survey
Appraisal of the Sri Lanka Dairy Sector:Main Report 12
exotic level to rear under intensive management and to 50% exotic level to rear under extensive management. If draft power is required, the Government’s policy is to maintain the indigenous buffalo or to up grade to a maximum of 50% exotic. Given the difficulty of using AI in herds of buffaloes, due to heat detection and control of mating, emphasis may need to be given instead to producing high-quality buffalo studs. An adjucant to these Government policies are the government-owned NLDB farms, the major objectives of which are to provide good quality bulls and surplus females to farmers throughout the country and to provide replacement bulls to the three artificial insemination centres. The NLDB semen station at Polunaruwa has not operated since January, 1997. The RRA suggested quite clearly that supply of NLDB animals is uncertain. While the NLDB farms are meant to be an important source of the four most important breeds, Friesian, Jersey, Sahiwal cattle and Nili-Ravi buffalo and their crosses, it is apparent that the level of output is low due to poor management and animal pricing policies, and some animals go to butchers rather than to livestock producers. It may be that that the NLDB has overly-diversified from its central objectives, and NLDB objectives and functions should be reviewed Besides an emphasis on buffalo studs, upgrading of the herd could be further promoted by trained persons working at milk collection centres and co-operatives. Additional training in veterinary first-aid would increase their value to producers and raise the likelihood of their economic viability.
Veterinary services The Veterinary Research Institute of the Department of Animal Production and Health is responsible for research in animal production, animal and poultry disease and the production and quality control of some animal and poultry vaccines against diseases of economic importance. These functions are carried out at the central veterinary investigation centre (CVIC), the poultry services unit at Gannoruwa, the veterinary vaccine production laboratory, the animal virus laboratory at Polgolla and a poultry breeding unit at Kundasala. Research, vaccine production and animal disease diagnostic service laboratories are operated from the Veterinary Institute of Agriculture compound at Gannoruwa. Diagnosis animal health support is conducted from the VIC and coupled with vaccination program which plans and supports the provincial vaccination campaigns and determines the serological responses to vaccination in the national herd. Vaccinations are a provincial responsibility. Animal Health Division determines the vaccine requirements of the provinces, based on the disease incidence and livestock numbers in each locality, vaccination performance during the previous year, and the vaccination target proposed by each Veterinary Surgeon. Given the important role of women in livestock production, women veterinarians may be one key to improved services. Data show that the proportion of women graduates in Veterinary Science increased from 1.7% to 53% over past four decades, and that recently, 43% of the veterinarians in the field services were women (HSMP Herath, 1998). It should be noted that many veterinarians rely on small animal practices to maintain economic viability, as these services tend to be more remunerative. The impact that this has on provision of clinical services to livestock is unclear, but it may be critical in allowing private veterinarians to survive, and so offer services to all types of animals.
Extension and training services The Department of Animal Production and Health (DAPH) has a strong provincial representation and is organised through Provincial Departments. Currently the DAPH's veterinary surgeons (VS), Livestock Officers and the Livestock Development Instructors are the main public-funded livestock extension service.

Results of the household survey
Appraisal of the Sri Lanka Dairy Sector:Main Report 13
Prior to 1988, the former Department of Agriculture (DOA) had a cadre of about 4,000 Village Extension Workers (VEW). Livestock extension services were organised through Assistant Directors at provincial level and provided by VS assisted by Livestock Development Instructors (LDI) and Livestock Development Technicians (LDT) from the veterinary ranges. Extension services were rationalised with devolution in 1988 and LDI and LDT were combined as LDI, many VEW were reassigned to other duties and the extension system for Sri Lanka largely broke down. In addition to publicly funded extension services, some extension is provided by private sector companies. Large corporate processors and producers in the livestock sector disseminate their own information to their staff, outgrowers and suppliers. The private sector provides most of the new information to livestock raisers in the pig and poultry sectors and this also occurs to some extent in the dairy industry. At present some private sector companies and producer organisations such as Nestles, MILCO, MIDCOMUL, individual co-operatives, etc., are involved in extension. In addition, institutions such as the Department of Animal Science, Faculty of Veterinary Medicine, are also engaged in providing extension services, yet there appear to be weak linkages amongst the various research and extension institutions and organisations. As a result, much valuable information does not reach the intended clients, the smallholder farmers and their market agents. Therefore, an essential step required in support of increasing dairy production and improving its productivity, particularly amongst smallholders, is to encourage a more effective extension service (supported by strong and interactive research institutions), one that links producers, processors and market agents with information relevant to the needs of these clients. Emphasis should be given to developing these research-extension-client linkages through targeted projects, which should involve all stakeholders and key players through participatory approaches. Increased participation by producer organisations, linking milk collection and service provision, may be key to providing adequate extension services in the future. As with disease control, these are primarily policy and institutional issues, yet they are constraints with a profound and widespread impact on dairy productivity.
The Mahaweli authority The Mahaweli (irrigation) Authority of Sri Lanka, under the Ministry of Mahaweli Development, undertakes activities to promote livestock amongst settlers in project areas within the dry lowlands. The Mahaweli Development Program was started in 1970. A livestock development programme was first started with draft animals (particularly in system H), aimed primarily at salvaging male cattle and buffalo with draft potential, but also for breeding draft cattle and buffaloes suitable for use by the settlers. In the mid-1980's, it was realised that the incomes of the settler farmers could be increased through diversification into dairying. Therefore the scope of the program was widened to the draft animal and dairy development program. The objectives related to dairy are: - Maintaining livestock farms to breed and multiply a milch animal suitable for the Mahaweli areas. - Issuing upgraded animals for farmers in the Mahaweli areas - Providing extension, veterinary health care, immunisation against endemic diseases, distribution
of pasture and fodder cuttings for developing the feed resources in the area - Organising farmers for collective milk marketing and in producing simple dairy products Mahaweli plays a major role in dairy production and marketing. According to the Mahaweli Authority it’s settler schemes increased milk collection from 700,000 litres in 1989 to over 1,200,000 in 1994. In the schemes the farmers own buffaloes and/or neat cattle, although 70 - 80 percent use them for cultivation. The basic livestock unit being promoted by the draft animal and dairy development programme was two cows and followers, and the philosophy was to develop a dual purpose draft and milk animal, "the Mahaweli cow", based on Sahiwal X Jersey. These irrigated smallholder schemes therefore have considerable potential for further expansion of the dairy herd, both buffalo and cattle, and to increase its marketed surplus of milk and dairy products. They represent an important client group for research and

Results of the household survey
Appraisal of the Sri Lanka Dairy Sector:Main Report 14
extension support, particularly because of the scope for intensive integrated crop-dairy systems and the experiences in the Indian sub-continent with these systems.
Progress in dairy production and marketing
Dairy production Between 1987 and 1996 (the latest year with complete statistics), there is some evidence that Sri Lanka experienced a considerable expansion of domestically produced milk, due to changes in the number, breed and herd composition of cows and buffaloes and their productivity. Attempts to estimate these measures, however, are hampered by lack of reliable data, mainly due to civil strife in parts of the country since the early 1980s. Based on official data, cattle and buffalo numbers (estimated at 249 MM and 82 MM, respectively, in 1996) have been generally declining, but overall milk production figures show an increase, from some 250 M Ls (1987) to 331 M Ls (1996). These are shown in Table 6. The figures show an estimated annual milk production increased by a total of 50%; there was a rapid increase, 27%, from 1987 to 1991, followed by an increase of 18% to 1996. The increase was greater for cattle (58%), than for buffalo (30%). While the herds of both species markedly increased production from 1987 to 1992, Table 6 shows that milk production from the buffalo herd, unlike that from cattle, did not grow between 1993 and 1996.
Table 6. Estimates of Milk Production (‘000 Litres) of Cattle and Buffaloes, 1987 to 1996
Year Cattle Buffalo Total 1987 157,969 62,920 220,889 1988 162,155 63,497 225,652 1989 172,859 65,344 238,202 1990 215,792 75,961 291,753 1991 208,822 70,889 279,711 Increase 32% 13% 27% 1992 232,666 82,294 314,960 1993 244,567 81,119 325,686 1994 250,449 81,800 332,299 1995 253,447 79,859 333,306 1996 249,459 81,936 331,395 Increase 7% - 0.4% 5% Total increase 58% 30% 50%
Table 7. Estimates of Number of Milch cows and percentage in milking, 1987 to 1996
Population of Milch Cows Year Cattle Buffalo No of milch cows % in Milk No of milch cows % in Milk 1987 641,400 43.51 278,700 40.261988 655,900 43.79 266,900 43.141989 669,100 39.70 269,000 41.671990 677,400 39.90 283,400 40.33Change - 8% -11% 1992 636,700 52.08 276,700 50.491993 686,900 50.12 240,200 47.841994 685,200 51.46 238,900 50.861995 694,800 51.05 231,700 49.721996 697,300 49.09 234,800 48.44Change 10% -32% Total change 9% -16%

Results of the household survey
Appraisal of the Sri Lanka Dairy Sector:Main Report 15
This 50% rise in milk production over 10 years has been achieved despite an apparent significant decrease in the milch buffalo cow herd (16%) and a small increase (9%) in the dairy cattle herd (Table 7). These trends suggest an annual decrease in cattle and buffalo number of 1% and 2.7% respectively over the period and annual milk productivity increases per herd-animal1 of 4.5% and 4.1% respectively. These figures, however, include data which includes estimates of livestock numbers and production in Northern and Eastern districts which may not be accurate. Estimates were thus also made based on the 18 districts for which apparently more reliable data are available for 1982, and 1992 through 1996.2 These suggest that, in those districts, there may have been herd growth rather than decline, and decreases in productivity per animal, although the period 1992-1996 indicates growth in cattle milk productivity of 2.5% annually. There are thus conflicting trends observed depending on which period is covered and which data are used (the entire country or just the more reliable districts). Due to uncertainty as to which of these figures may be reliable, no firm projections on change in domestic production can reliably be made. It may be considered likely, nevertheless, that if current trends were extrapolated, domestic production would grow either slowly or not at all by 2010. Based on the 1992-96 trends in the 18 districts with apparently reliable data, production might grow by 18% over that period.
1 Herd-animal refers to all animals in the herd, not differentiated into cows, bulls, etc. 2 The 18 districts are Colombo,Gampaha, Kalutara, Kandy, Matale, N'Eliya, Galle, Matara, Hambantota, Amparai, Kurunegala, Puttalam, Anuradhapura, Polonnaruwa, Badulla, Monaragala, Ratnapura, and Kegalle.

Results of the household survey
Appraisal of the Sri Lanka Dairy Sector:Main Report 16
Results of the Survey of Cattle and Buffalo Producer Households
In order to verify the results of the review of secondary information presented in the previous sections, and to gather reliable estimates of the current status of dairy production from cattle and buffalo, a survey was carried out in 20 districts spanning the dry lowlands, wet lowlands, the coconut triangle, and the mid- and up-country zones. The survey approach and methodology was described in the Background to the Study. Results from the survey are summarised here by the agro-climatic/land-use zones. Detailed tabular results are presented in the Appendices.
Regional variation in cattle and buffalo keeping As shown in Table 8, whereas over 90% of households keeping bovines in all zones had cattle, only 18% kept buffalo, and only 10% kept both cattle and buffalo. The north and east dry lowlands had the highest proportion of buffalo owning producer households. In the 1982 Census the proportion of farms keeping cattle only, buffalo only and cattle and buffalo was 70, 15 and 15%, respectively. The underlying difference between 1982 and the present survey appears to be the decline in the buffalo population. One of the factors contributing to this may be farmers switching to tractor powered cultivation of paddy instead of the traditional use of buffalo.
Table 8: Percentage of sampled households (HH) with bovines in each zone keeping cattle and or buffaloes
Zone Number of HH Cattle Cattle and Buffalo Buffalo Coconut triangle 566 81 12 7 Dry zone - East 103 70 2 28 Dry zone - North 128 68 26 6 Dry zone - South 85 79 14 7 Low country - wet 414 84 6 10 Mid country 178 89 7 4 Upcountry 196 96 3 2 Total 1703 82 10 8
Regional variation in cattle and buffalo breeds As was expected from Govt. statistics and field observations, the survey confirmed the major shift from indigenous cattle breeds to dairy types, such that in the sampled households with cattle, 39% had crossbred or pure dairy types (Table 9). The proportion of dairy cattle was lowest in the dry lowland zones (26-30%), where there were few purebreds, and highest in mid-country (73%), which also had the highest proportion of purebreds (25%). Indigenous breeds such as Lanka predominated particularly in the drier zones. As aridity decreased, so the importance of crossbreds rose. All crosses of local breeds with Jersey, Friesian, Sahiwal, Gir, Sindhi and Tharpakar were observed, as well as some taurine/Indian zebu crosses. Purebred dairy cattle, particularly Friesian and Jersey breeds, were concentrated in the wetter zones, particularly in the up-country areas. The distribution of cattle breeds largely matches the recommendations given in the Department of Animal Production and Health National breeding policy for cattle (DAPH National Breeding Policy for Cattle, Departmental Circular No. 93, May 1983). Just as for cattle, the buffalo population has been undergoing extensive replacement of the indigenous breed type, such that 30% of the sampled buffalo population were dairy types (Table 10). In the World Bank Dairy Sector Review for Sri Lanka (1983) it was recommended that all of Sri Lanka’s indigenous buffalo be upgraded using Murrah or Surthi buffalo breeds from India. As Table 10 shows, this process has been most extensive in the eastern dry lowlands, where more than 50% of herds are improved types, and in the coconut triangle with nearly 40% of herds. Upgrading has occurred with the Surthi being preferred, presumably because it is a dual purpose animal (dairy and draft). Murrah purebreds appear to

Results of the household survey
Appraisal of the Sri Lanka Dairy Sector:Main Report 17
be concentrated in the coconut triangle.
Table 9: Percentage of indigenous, dairy crossbred and dairy purebred types in zonal cattle populations
Total Dairy Dairy Zone Cattle Indigenous Crossbred Purebred Coconut triangle 2699 56 25 19 Dry zone - East 731 70 29 1 Dry zone - North 1637 74 21 5 Dry zone - South 1504 70 30 <1 Low country - wet 2038 61 30 9 Mid country 551 28 48 25 Upcountry 673 42 42 16 Total 9843 61 29 10
Table 10: Percentage of indigenous, dairy crossbred and dairy purebred types in zonal buffalo populations
Zone
Total Buffalo
Indigenous
Dairy Crossbred
Dairy Purebred
Coconut triangle 729 63 23 15 Dry zone - East 1109 49 49 2 Dry zone - North 6 17 17 67 Dry zone - South 511 86 13 1 Low country - wet 982 74 18 8 Mid country 524 98 1 1 Upcountry 42 90 7 2 Total 3903 70 25 6
Size and structure of cattle herds As expected, the survey confirmed that cattle herds were largest and most variable in the dry lowlands (mean sizes 7.2-12.8), and smallest and least variable in mid- and up-country (3.1 & 3.4) (Table 11). This variation in size was consistent with the shifting balance of indigenous and dairy breed types and the relative emphases on grazing, tethering and stall-feeding systems. It should be noted that relatively high variation simply means that herd sizes are heterogeneous, and is not reflective of the quality of the data, given the large sample size. Cows (both lactating and dry) were the most important category of cattle in all zones, comprising at least 40% of the total herd. In the wetter zones, where improved cattle occur in larger numbers, lactating cows outnumbered dry cows by between 2 or 3 to 1.

Results of the household survey
Appraisal of the Sri Lanka Dairy Sector:Main Report 18
Table 11: Mean herd size and structure of the cattle keeping households
Milking cows Dry cows Pregnant
heifers Heifers Calves Bulls Total cattle
Mean SD Mean SD Mean SD Mean SD Mean SD Mean SD Mean SD Coconut triangle 1.2 1.4 0.7 1.7 0.3 0.8 0.7 1.2 1.5 1.8 0.4 0.9 4.8 5.3 Dry zone - East 2.7 4.7 0.9 2.4 0.5 1.0 1.1 2.3 1.7 3.3 0.3 0.8 7.2 11.3 Dry zone - North 2.3 2.8 2.9 4.6 1.6 3.6 2.0 5.0 3.0 5.0 1.0 1.5 12.8 19.2 Dry zone - South 3.7 9.0 3.3 9.6 1.7 6.1 4.2 17.1 3.9 8.4 0.8 1.7 11.7 48.3 Low country - wet 1.4 2.3 0.5 1.1 0.4 1.1 0.7 1.5 1.5 2.3 0.5 1.4 4.9 8.2 Mid country 0.9 1.0 0.5 1.0 0.2 0.5 0.3 0.6 0.9 1.0 0.3 0.6 3.1 3.0 Upcountry 1.0 0.9 0.4 0.7 0.4 0.7 0.4 0.8 0.8 0.9 0.5 1.1 3.4 2.7
Table 12: Mean herd size and structure of households keeping buffaloes
Milking cows Dry cows Pregnant
heifers Heifers Calves Bulls Total buffaloes
Mean SD Mean SD Mean SD Mean SD Mean SD Mean SD Mean SD Coconut triangle 0.2 1.1 0.3 1.7 0.1 0.4 0.2 1.5 0.4 1.4 0.2 0.9 1.4 5.5 Dry zone - East 3.0 8.2 0.7 1.5 0.6 1.3 0.5 1.1 0.5 1.0 0.2 0.5 5.5 10.9 Dry zone - North 0.7 2.9 1.0 2.8 0.2 1.0 0.3 1.4 0.6 1.9 0.6 1.3 3.5 8.9 Dry zone - South 3.3 9.9 1.6 4.8 0.6 3.5 1.3 4.1 2.4 7.5 0.2 0.8 9.4 27.3 Low country - wet 0.5 2.2 0.2 0.9 0.1 0.7 0.2 1.3 0.5 1.5 0.3 1.6 1.9 6.6 Mid country 0.1 0.3 0.1 0.3 0.0 0.1 0.0 0.1 0.0 0.2 0.1 0.4 0.3 0.9 Upcountry 0.0 0.1 0.1 0.5 0.0 0.0 0.0 0.1 0.0 0.1 0.1 0.5 0.2 1.1


Results of the household survey
Appraisal of the Sri Lanka Dairy Sector:Main Report 20

Results of the household survey
Appraisal of the Sri Lanka Dairy Sector:Main Report 21
Farms appeared to be raising their own replacement stock with heifers forming approximately 25% of the herds in all zones apart from the dry zone where the proportion rose to 30%. On the other hand, many herds had no bull, as would be expected with small herds in the higher potential areas, and because of the communal grazing practised in the dry lowlands.
Size and structure of buffalo herds Buffalo herds are largest (mean 3.5 to 9.4) in the dry zone, where paddy is the principal crop and buffalo are used for work purposes (Table 12). Cows form the largest component of the herd with lactating animals dominating in the dry zone. In other zones the cows are equally divided between lactating and dry animals. Replacement stock are present in herds in all zones. Calf numbers reflect those of cows in all zones except in the Dry Zone where lactating cows exceed the number of calves by more than 2 to 1.
Cattle performance by breed type and zone As would be expected, indigenous breed cattle had later ages at first calving and lower mean daily milk yields than dairy crosses, which in turn calved later and gave less milk than dairy purebreds (Table 13). The better performance of the purebred dairy cattle reflected in part the better management afforded to these breeds in cut-and-carry feeding systems. These performances compare favourably with those reported for cattle on government livestock farms where age at first calving for pure-bred temperate cattle was 3 years and for crossbreds 3.2 - 3.5 years (Dairy Development Foundation, 1986).
Table 13: Mean age at first calving and daily milk yield reported for indigenous, dairy crossbred and dairy purebred cattle
Dairy purebred Dairy crossbred Indigenous n Mean S.D n Mean S.D n Mean S.D
Age at first calving, yrs. 248 3.3 078 521 3.5 0.7 965 3.7 0.7 Daily milk yield, l. 309 5.4 3.5 504 4.8 3.2 668 2.3 1.3
The results in Table 13 suggest that on smallholdings dairy cross-breeding (and any associated management changes) has resulted in a doubling of daily milk off-take over local breeds in, for example, the wet lowlands and the coconut triangle. Where management conditions permit, upgrading to purebred dairy leads to a three-fold increase in daily milk off-take.

Results of the household survey
Appraisal of the Sri Lanka Dairy Sector:Main Report 22
Figure 6: Estimated lactation curves for Sri Lankan cattle. Source: Survey
Figure 6 shows estimated lactation curves for the 3 main types of cattle found in the survey, showing only the first 10 months of lactation. These estimates were made from the data using a semi log-linear lactation curve3. This was calculated using a combination of reported yields for individual animals, including milk at calving, and milk at day of survey. The data, amounting to 619 observations, were pooled for each breed and the specified functional form was estimated. The parameter estimates for β1 were in each case significant at the 5% level. The absence of a lactation peak and the rapid decline in daily milk yield over the early months of lactation strongly suggest that feeding levels to lactating cows, particularly during the first months of lactation, are low.
Cattle performances differed within zones for the three breed types. The mean age at first calving of indigenous cattle varied little amongst zones, but mean daily milk yield was lower (2.1 litres) in the south dry zone than in the other zones where it ranged between 2.6 and 3.2 litres. For dairy crossbreds, performance was particularly good in the upcountry zone, where daily milk yield was twice (8.4 litres) that reported for crosses in the coconut triangle (4.0 litres), presumably reflecting variation in feeding practises. These crossbred performances were equal to those of the dairy purebreds in those zones, whereas purebreds were reported to have higher yields than crosses in the mid-country and in the wet low country, differences reflected in the lactation curves .
Buffalo performance by breed type and zone Buffalo performance reported by the survey respondents show the expected advantage in milk production from upgrading with Murrah stock (Table 14). Dairy cross- and pure-bred buffaloes had shorter age at first calving and higher milk off-take (pure-breds only). These improved performance indices may be the expression of inherent production potential or the result of better nutrition or both. Research station reared native buffaloes first calved at 3.7 years, whereas purebreds calved at between 3.7 and 4.1 years (Dairy Development Foundation, 1986). Milk yields for dairy buffalo from the coconut triangle were well above average for purebreds (5.6 litres) and for crosses (4.8), but not for indigenous types, suggesting that in that zone dairy types were given some preferential feeding.
3 The functional form estimated was y = α + β1 ln (x1), where y is milk yield per day, and x1 is months of lactation.
0
2
4
6
8
10
0 2 4 6 8 10Months of lactation
Litr
es m
ilk/d
ay
Purebred cattle Crossbred cattleIndigenous cattle

Results of the household survey
Appraisal of the Sri Lanka Dairy Sector:Main Report 23
Table 14: Mean age at first calving and daily milk yield reported for indigenous, dairy crossbred and dairy purebred buffalo
Dairy purebred Dairy crossbred Indigenous n Mean S.D n Mean S.D n Mean S.D
Age at first calving, yrs. 32 3.5 0.8 80 3.7 0.8 240 4.0 1.0 Daily milk yield, l. 32 3.7 2.0 180 2.1 1.5 163 2.3 1.3
Main feeding practices by zone The majority of producer households depended upon grazing as their main source of animal feed. Grazing occurs mainly on paddy land (bunds and harvest aftermath), public spaces and under coconuts. Animals are usually tethered during grazing, except in the dry zones. In the higher production potential zones, stall feeding, often combined with some grazing, was common.
Table 15: Percentage of households (HH) by zone grazing or stall feeding their bovines
Zone Total HHs
Grazing Grazing and Stall feeding
Stall feeding
Coconut triangle 566 94 0 7 Dry zone – East 102 97 0 3 Dry zone – North 128 95 0 5 Dry zone – South 85 98 0 2 Low country - wet 161 32 61 7 Mid country 178 55 23 16 Upcountry 196 58 24 19
Concentrated feed use Whereas in the north and south dry zones, less than 1 in 10 households used concentrate feeds (coconut poonac, rice bran or compounded concentrate), between a third to over a half of households in the other zones fed concentrates (Table 15). The zones with most households using concentrates correlate approximately with those with dairy herds. It should be noted that the wet zone includes the periurban dairy system of Colombo where concentrated feed use may be higher per head of lactating animal than elsewhere in the wet zone.
Table 16: Percentage of households (HH) by zone using concentrate feeds for their bovines
Zone Total HHs Feeding concentrates
Coconut triangle 566 42 Dry zone - East 102 31 Dry zone - North 128 8 Dry zone - South 85 9 Low country - wet 161 32 Mid country 178 55 Upcountry 196 59
Households owning cattle are more likely to use concentrated feeds than those solely keeping buffaloes. This reflects the fact that buffalo are more often kept for draught purposes than cattle which primarily supply milk. The survey did not ascertain whether the cattle and/or the buffalo are fed concentrated feeds in the mixed herds.

Results of the household survey
Appraisal of the Sri Lanka Dairy Sector:Main Report 24
Table 17: Percentage of households (HH) feeding concentrates and the mean concentrate feed offer rate (kg/day)* by species and lactation status
% HHs feeding concentrate, of those with
indicated animal type
Average total concentrate offer rate (kg/day)
Only those offering Concentrates*
Both those HH’s offering/not offering concentrates
Milking cows 45% 2.26 1.16 Dry cows 14% 1.68 0.23 Milking buffaloes 10% 2.92 0.20
* Concentrates include poonac, rice bran, and dairy meal Table 17 shows the mean concentrate offer rates to cattle and buffaloes. For those households who report offering concentrates to milking cows (45%), over 2 kgs per day is reported. Overall, for those households who have milking cows, however, the mean falls to just over 1 kg/day. A small proportion of those households with dry cows reported offering concentrates (14%), at a rate of 1.68 kg/day. A small proportion of households with buffaloes reported concentrate use, and those who did offered nearly 3 kg/day. Type, source and price of concentrate feeds Coconut poonac and rice bran were the most popular forms of concentrated feeds amongst cattle keepers, whereas compounded feeds such as dairy mix were rarely purchased (Table 18). Few households reported feeding concentrates to their buffalo, but amongst those that did, poonac and bran were the most frequently used. Rice bran is used in slightly larger quantities that poonac. The data did not show whether poonac and bran were fed in combination. In the drier zones, where padi is the major crop grown, larger quantities of rice bran were fed to both dry and lactating cattle. In the wetter zones, such as the Coconut Triangle, the quantities of poonac and bran were approximately equal. The data did not reveal whether poonac and bran were being offered in combination. In the few households where dairy mix was being offered it was fed in lower quantities. Data collected for buffalo, when dis-aggregated by zone, gave too few data points to draw reliable conclusions on feed use.
Table 18: Number of households (HH) reporting feeding concentrate types and their quantities (kg/d) to milking and dry cows
Cattle Buffalo Milking Dry Milking Dry
Kg hh Kg Hh kg hh Kg hh Coconut Poonac 1.8 400 1.2 68 2.3 18 2.0 5 Rice Bran 2.1 343 1.5 70 2.0 16 1.3 4 Dairy Mix 0.7 29 0.3 4 0.8 3 0.5 2
The survey confirmed that coconut poonac and rice bran were the most frequently purchased concentrated feeds for dairy in Sri Lanka (Table 19). Poonac was purchased mainly from private retailers whereas rice bran was bought directly from the rice mill. It has to be ascertained whether farmers had access to the rice bran produced after the milling of their own paddy, or whether they bought back the bran in addition to paying for milling. Very few households purchased compounded feeds or minerals. The survey showed that the milk co-operatives supplied very few households with dairy feed inputs.
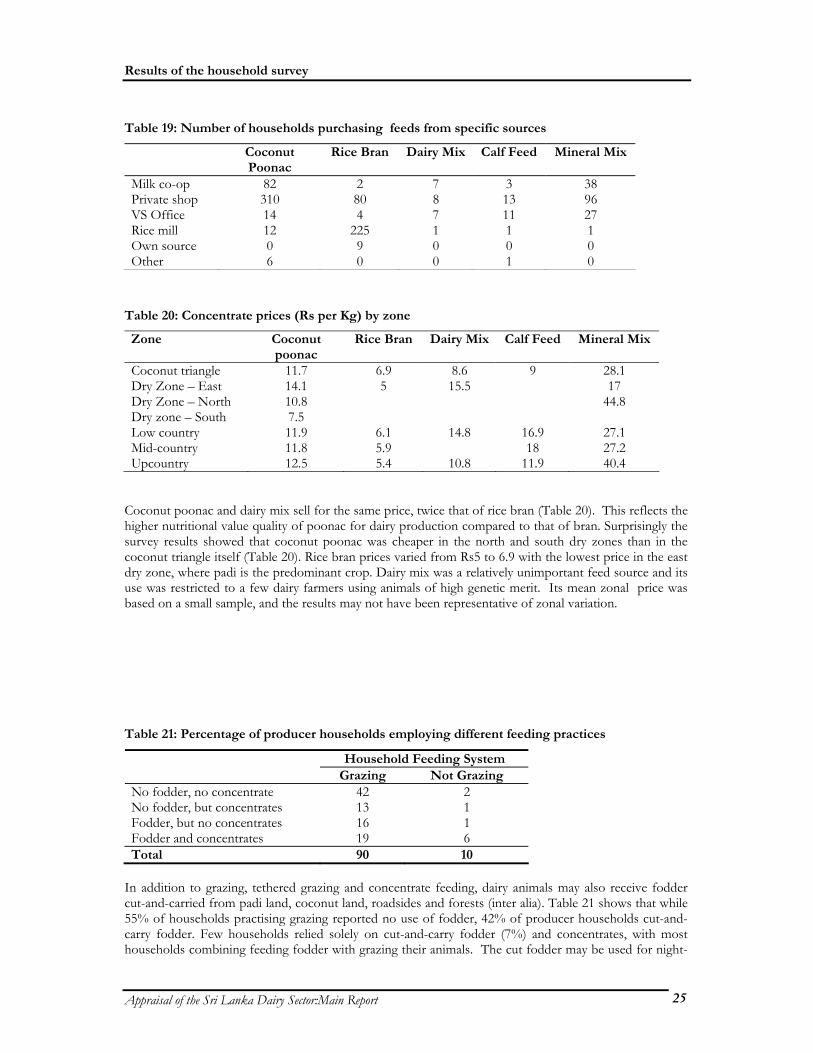
Results of the household survey
Appraisal of the Sri Lanka Dairy Sector:Main Report 25
Table 19: Number of households purchasing feeds from specific sources
Coconut Poonac
Rice Bran Dairy Mix Calf Feed Mineral Mix
Milk co-op 82 2 7 3 38 Private shop 310 80 8 13 96 VS Office 14 4 7 11 27 Rice mill 12 225 1 1 1 Own source 0 9 0 0 0 Other 6 0 0 1 0
Table 20: Concentrate prices (Rs per Kg) by zone
Zone Coconut poonac
Rice Bran Dairy Mix Calf Feed Mineral Mix
Coconut triangle 11.7 6.9 8.6 9 28.1 Dry Zone – East 14.1 5 15.5 17 Dry Zone – North 10.8 44.8 Dry zone – South 7.5 Low country 11.9 6.1 14.8 16.9 27.1 Mid-country 11.8 5.9 18 27.2 Upcountry 12.5 5.4 10.8 11.9 40.4
Coconut poonac and dairy mix sell for the same price, twice that of rice bran (Table 20). This reflects the higher nutritional value quality of poonac for dairy production compared to that of bran. Surprisingly the survey results showed that coconut poonac was cheaper in the north and south dry zones than in the coconut triangle itself (Table 20). Rice bran prices varied from Rs5 to 6.9 with the lowest price in the east dry zone, where padi is the predominant crop. Dairy mix was a relatively unimportant feed source and its use was restricted to a few dairy farmers using animals of high genetic merit. Its mean zonal price was based on a small sample, and the results may not have been representative of zonal variation.
Table 21: Percentage of producer households employing different feeding practices
Household Feeding System Grazing Not Grazing
No fodder, no concentrate 42 2 No fodder, but concentrates 13 1 Fodder, but no concentrates 16 1 Fodder and concentrates 19 6 Total 90 10
In addition to grazing, tethered grazing and concentrate feeding, dairy animals may also receive fodder cut-and-carried from padi land, coconut land, roadsides and forests (inter alia). Table 21 shows that while 55% of households practising grazing reported no use of fodder, 42% of producer households cut-and-carry fodder. Few households relied solely on cut-and-carry fodder (7%) and concentrates, with most households combining feeding fodder with grazing their animals. The cut fodder may be used for night-

Results of the household survey
Appraisal of the Sri Lanka Dairy Sector:Main Report 26
time feeding or may be used seasonally when grazing is restricted because of cropping. The households apparently relying solely upon stall feeding may be periurban producers or those rearing cattle in confinement in the uplands where manure is a major product of the system. The 3% of households reporting not feeding or only feeding concentrates may be a recording error.
Table 22: Zonal variation in feeding methods of producer households who practice grazing
No fodder, no concentrates
No fodder but concentrates
Fodder but no concentrates
Fodder and concentrates
G=grazing NG= not grazing
G NG G NG G NG G NG
Coconut triangle 189 17 82 2 117 5 141 13 Dry zone – East 60 1 18 2 9 0 12 0 Dry zone – North 87 5 0 0 24 2 10 0 Dry zone – South 75 1 7 1 1 0 0 0 Low country – wet 222 20 79 6 37 0 48 1 Mid country 36 0 10 0 43 2 48 39 Upcountry 42 5 16 1 31 2 59 40
Table 21 showed that 90% of producer households used grazing to a greater or lesser extent. Table 22 shows that there was a greater dependency on grazing as the only source of feed in the dry zones, with dependency decreasing with increasing rainfall. Conversely the use of concentrates increased as rainfall increased. Presumably this occurs with the increasing incidence of improved dairy genotypes in the zones with higher production potential. In each of the zones, the majority of the respondents were not using cut fodder although the proportion not cut-and-carrying fodder decreases with increasing rainfall. Indigenous grasses are by far the largest cut-and-carry fodder input into dairy production in Sri Lanka (Zemmelink et al, 1998). Table 23 shows that most of this type of fodder was cut from the bovine keeper’s own farm, along roadsides and on others’ farms. These areas were also important sources for the supply of improved grasses, e.g., Panicum sp., legume forages, e.g., Centrosema sp., and tree leaves, e.g, Gliricidia sepium, which grows wild in Sri Lanka. The source (own land; others’ land; purchased) of padi straw was not identified in the survey. That most fodder was cut-and-carried by household labour was indicated by the few reports of fodder purchases.
Table 23: Percentage of producer households accessing various cut-and-carry fodder sources
Cut-and-carry fodder type Sources: Indigenous
grasses Improved
grasses Legumes Padi
straw Tree
leaves Own farm 36 52 41 40 42 Roadsides 37 12 39 1 30 Purchased 2 4 0 3 0 Other farms 25 28 19 57 28 Rented land 0 4 1 0 0
Suppliers of purchased dairy inputs The greatest number of transactions for dairy inputs occurred at private retailers and at the VS Office (

Results of the household survey
Appraisal of the Sri Lanka Dairy Sector:Main Report 27
Table 24). Private retailers were the most important suppliers of concentrates (notably coconut poonac cake), while the VS office supplied most of the vaccines but was on a par with private retailers for the supply of anthelmintics. AI was provided by the VS Office both officially and on a private basis. By comparison the dairy co-operatives were relatively infrequent sources of dairy inputs, with feed inputs and anthelmintics being the most common inputs supplied. A significant proportion (26%) of transactions with private retailers were for “other” goods and services, the nature of which was not specified in the replies to the survey.
Diseases reported in cattle herds It is striking to note that from the sample population of around 10,000 cattle, only 4% were reported to be affected by the conditions listed in Table 25. Of the diseases or ill-health conditions reported by the respondent producer households as having occurred during the year preceding the survey, locomotory (foot and leg) problems formed the largest category, followed by gastrointestinal (helminth) infestations and diarrhoea. This may explain the high frequency of anthelmintic purchases reported in

Results of the household survey
Appraisal of the Sri Lanka Dairy Sector:Main Report 28
Table 24, and is consistent with grazing of animals in moist areas such as padis, likely to be infected with gastrointestinal helminths. Clinical cases of diseases such as mastitis, FMD and tick fever were less prevalent. There was no marked zonal variation in the occurrence of the diseases or ill-health conditions. These producer reports indicating low incidences of disease in cattle are consistent with the conclusions of the extensive review of literature reported in Appendix: Health. The results confirm the relatively healthy environment for cattle in Sri Lanka (compared to many other tropical countries), and its advantage in terms of the lower disease risks faced by exotic dairy breeds, whether cattle or buffalo. This may result in lower veterinary costs for Sri Lankan dairy producers compared to many of their overseas competitors.

Results of the household survey
Appraisal of the Sri Lanka Dairy Sector:Main Report 29
Table 24: Percentage of producer households (HH) reporting transactions for purchased dairy inputs from various sources
Milk co-op
Private shop
VS office
Rice mill
Rented land
Other farmers
Milk coll. Centre
Concentrates 44 31 3 89 0 0 30 Salt/Minerals 23 12 4 4 0 0 20 Forages 3 0 0 1 83 17 20 Acaricide/spray 10 6 4 1 0 0 Vaccines 0 2 22 1 0 0 Deworming drugs 14 20 20 0 0 2 20 Vet. Treat. - Govt. 0 1 11 0 17 0 - Private 0 0 1 0 0 0 10 Breeding - Private 3 2 15 0 0 68 - Govt. 3 0 29 0 0 0 Hired Labour 0 0 0 0 0 13 Others 0 26 0 4 0 0 No. HHs 175 920 669 98 6 46 10
Table 25: Number of cattle reported as diagnosed with conditions/diseases last year
Treatment source Animals affected
Veterinary Office
Private
Disease Type
No. No. Treat. Costs (Rs) No. Treat. costs (Rs)
Tick fever 24 9 158 7 260 Mastitis 32 21 385 6 178 Foot problems 107 34 472 14 321 Leg weakness 65 26 603 17 385 Dystocia 9 2 190 2 125 Retained placenta 14 6 408 0 0 Wounds 38 22 217 6 108 Navel ill 8 7 385 1 100 Worm infestation 51 34 196 11 80 Pneumonia 19 10 235 8 281 Diarrhoea 40 21 468 9 120 FMD 25 4 1625 1 1000
Bovine mortality rates Consistent with the low incidence of disease reported in the survey, was the extremely low rate of bovine mortality (only 265; < 2%) reported for the year preceding the survey in a sample bovine population of around 14,000 animals ( Table 26). Mortalities of cattle cows were the most frequently reported, but generally with no specific cause of death. Calf mortality was lower than might be expected in a population dominated by the smallholder sector (compared with similar situations elsewhere in the tropics), and perhaps again because of lower disease challenge, but also possibly resulting from under-reporting, and merits further investigation.
Table 26: Number of cases and reasons for bovine mortality in the past year reported by the producer households in the survey
Animal Type Number of cases
Dystocia Still birth Wounds Diarrhoea
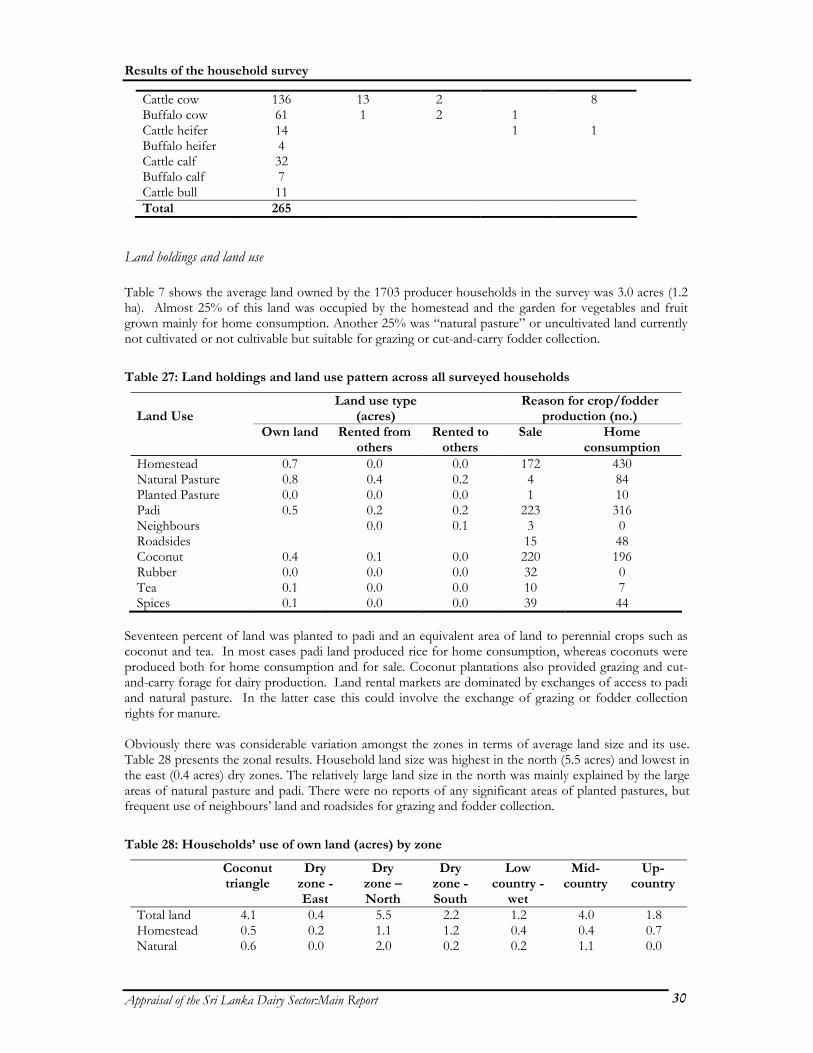
Results of the household survey
Appraisal of the Sri Lanka Dairy Sector:Main Report 30
Cattle cow 136 13 2 8 Buffalo cow 61 1 2 1 Cattle heifer 14 1 1 Buffalo heifer 4 Cattle calf 32 Buffalo calf 7 Cattle bull 11 Total 265
Land holdings and land use Table 7 shows the average land owned by the 1703 producer households in the survey was 3.0 acres (1.2 ha). Almost 25% of this land was occupied by the homestead and the garden for vegetables and fruit grown mainly for home consumption. Another 25% was “natural pasture” or uncultivated land currently not cultivated or not cultivable but suitable for grazing or cut-and-carry fodder collection.
Table 27: Land holdings and land use pattern across all surveyed households
Land use type (acres)
Reason for crop/fodder production (no.)
Land Use
Own land Rented from others
Rented to others
Sale Home consumption
Homestead 0.7 0.0 0.0 172 430 Natural Pasture 0.8 0.4 0.2 4 84 Planted Pasture 0.0 0.0 0.0 1 10 Padi 0.5 0.2 0.2 223 316 Neighbours 0.0 0.1 3 0 Roadsides 15 48 Coconut 0.4 0.1 0.0 220 196 Rubber 0.0 0.0 0.0 32 0 Tea 0.1 0.0 0.0 10 7 Spices 0.1 0.0 0.0 39 44
Seventeen percent of land was planted to padi and an equivalent area of land to perennial crops such as coconut and tea. In most cases padi land produced rice for home consumption, whereas coconuts were produced both for home consumption and for sale. Coconut plantations also provided grazing and cut-and-carry forage for dairy production. Land rental markets are dominated by exchanges of access to padi and natural pasture. In the latter case this could involve the exchange of grazing or fodder collection rights for manure. Obviously there was considerable variation amongst the zones in terms of average land size and its use. Table 28 presents the zonal results. Household land size was highest in the north (5.5 acres) and lowest in the east (0.4 acres) dry zones. The relatively large land size in the north was mainly explained by the large areas of natural pasture and padi. There were no reports of any significant areas of planted pastures, but frequent use of neighbours’ land and roadsides for grazing and fodder collection.
Table 28: Households’ use of own land (acres) by zone
Coconut triangle
Dry zone - East
Dry zone – North
Dry zone - South
Low country -
wet
Mid-country
Up-country
Total land 4.1 0.4 5.5 2.2 1.2 4.0 1.8 Homestead 0.5 0.2 1.1 1.2 0.4 0.4 0.7 Natural 0.6 0.0 2.0 0.2 0.2 1.1 0.0

Results of the household survey
Appraisal of the Sri Lanka Dairy Sector:Main Report 31
pasture Paddy 0.6 0.2 1.6 0.3 0.2 0.3 0.5 Neighbours 0.3 0.0 0.0 0.1 0.0 0.4 0.4 Roadsides 0.0 0.0 0.1 0.0 0.0 0.3 0.1 Coconut 0.6 0.0 0.3 0.1 0.1 0.0 0.0 Rubber 0.0 0.0 0.0 0.0 0.1 0.0 0.0 Tea 0.0 0.0 0.0 0.0 0.0 0.6 0.0
Dairy Farm Labour The average total time spent on dairy activities is 5.3 hours daily, of which a significant proportion is taken up with feeding the animals; either collecting fodder or taking animals to and from tethered grazing Table 29). The household head (generally the husband) is the major actor in dairy activities spending up to 4.4 hours on average daily in the east dry zone. By contrast the household heads in the south dry zone reported spending only 2.1 hours on those activities. Generally household heads contributed an equal or greater amount of time to dairy activities than the total time contributed by all other family members and hired labour. In none of the zones except the east dry zone, did hired labour play a prominent role in the dairy enterprise.
Table 29: Household members involvement (mean no. of hrs per day) in dairy activities
Zone Head
Wife
Sons
Daughters
Other relatives
Hired Labour
Overall mean 2.8 1.1 0.8 0.2 0.2 0.2 Coconut triangle 3.3 1.5 0.9 0.3 0.3 0.2 Dry zone – East 4.4 0.6 1.4 0.0 0.0 0.7 Dry zone – North 2.9 1.5 1.2 0.1 0.3 0.3 Dry zone – South 2.1 0.5 1.4 0.1 0.4 0.4 Low country - wet 2.2 0.7 0.5 0.2 0.1 0.2 Mid country 2.7 1.4 0.9 0.1 0.1 0.1 Upcountry 2.3 0.8 0.5 0.0 0.0 0.3
Constraints to dairy production reported by farmers Overall the two major constraints to dairying reported by farmers were lack of fodder (Table30: “fodder unavailability”; “land shortage for fodder cultivation”) and low milk prices. Related issues were “High feed cost” and “Insufficient labour”. Perhaps surprisingly, reports of fodder shortages occurred more frequently in the moister zones where biomass production is high. The underlying cause for the perceived constraint may lie in lack of labour for fodder collection (although not specifically highlighted as a major problem) and the lack, due to intense cropping, of available grazing land. The “Low milk price” was of particular concern in the wet lowland zone (including Colombo) and the coconut triangle, perhaps reflecting higher costs of production and more profitable, lower risk or less demanding opportunities for household labour and land.

Results of the household survey
Appraisal of the Sri Lanka Dairy Sector:Main Report 32
Table 30: Number of farmers reporting constraints (primary and secondary) to dairy production
Overall Coconut triangle
Dry zone East
Dry zone North
Dry zone South
Low country - wet
Mid - country
Up - Country
Constraints
1st 2nd 1st 2nd 1st 2nd 1st 2nd 1st 2nd 1st 2nd 1st 2nd 1st 2nd Low milk price 385 146 135 33 8 35 25 13 12 0 101 18 34 17 65 27 High feed cost 165 284 70 84 11 12 4 10 1 1 40 86 10 26 25 61 Fodder unavailability 493 243 110 95 24 12 37 16 53 15 161 41 62 42 38 14 Land shortage for fodder cultivation
203 327 84 81 38 5 9 8 5 36 18 140 34 36 14 16
Insufficient labour 40 46 13 19 0 0 4 6 0 0 7 9 13 8 3 3 Poor fertility of animals 38 51 12 16 5 4 1 2 0 0 12 18 4 7 2 4 Poor livestock services 58 72 26 29 6 7 9 10 0 0 11 13 4 6 2 7 Lack of high producing animals
95 78 49 23 4 11 11 12 2 5 11 11 3 6 13 10
Expensive animals 37 61 10 20 1 3 3 11 0 0 4 10 6 2 12 15 Low priority on dairy development
18 43 3 16 0 1 3 6 3 5 4 3 0 2 4 10

Economics and markets
Appraisal of the Sri Lanka Dairy Sector:Main Report 33
Blank page

Economics and markets
Appraisal of the Sri Lanka Dairy Sector:Main Report 34
Constraints to, and opportunities for, improving production aspects of the dairy sector Several important issues emerge from the review of dairy production and the results of the country-wide survey, each with the potential to make a major contribution to the continued development of Sri Lanka’s dairy sector, and to support the role played by smallholder producers in supplying milk and dairy products to rural and urban consumers. • Breed improvement: Clearly the up-grading of the indigenous cattle and buffalo populations to
dairy breed types has been a major success, contributing substantially to increased milk production and marketing over the last decade. To sustain this impetus, support is required to meet the demand for dairy breeding stock. Particular attention is needed to improve the supply of dairy buffalo, for which use AI is often problematic. Buffalo stud schemes in priority areas should be developed and private/co-operative cattle AI schemes should be encouraged.
• Feed resources: Lack of good quality feed year round is a major constraint to profitable smallholder
dairy production. This is primarily a result of pressure on land and competing opportunities for labour, which restrict the supply of fodder to many dairy herds. In turn, limited access to good quality fodder reduces the cost-effectiveness of feeding concentrates. Potentially beneficial feed technologies have been researched by Sri Lankan institutions and others in the region. Emphasis must now be given to developing targeted projects in regions where fodder shortages are well documented, to test these promising feed technologies. Participatory approaches, thereby strengthening research-extension-farmer linkages, are required to ensure that the testing and validation of the technologies is demand/farmer driven.
• Management of common properties: A related issue is the management of communal grazing
areas and public land, including roadsides. Community-based schemes need to be developed to improve the management of these resources, which frequently are key to efficient dairy production by smallholders, particularly during the cropping seasons.
• Dry and Intermediate zones: These account for some 70% of the cattle and 75% of the buffalo
population of the country and, with considerable land resource, may offer greatest scope for milk production increases. Greater intervention in these areas however, have to cope with seasonality of production and feed resources, low milk density, and the difficulty of upgrading the buffalo herd under extensive herding practices.
• Improving the nutritional value of milling by-products: Milling residues are a vital resource for
increased dairy production, yet current milling practises reduce the value of, e.g., rice bran. A targeted project should be implemented to demonstrate the benefits to grain producers, millers and dairy producers of milling methods that improve the availability of good quality milling by-products.
• Technical information – public/private goods: These initiatives emphasise the urgent need to
improve the provision of technical information to current and potential dairy producers, particularly to the vast majority who are smallholders. This can be best achieved in a sustainable way through linking these research and extension services to the providers of dairy input and output markets, e.g., dairy co-operatives, farmers’ groups, private dairy processors, etc. Targeting the provision of technical information as a private, rather than as a public, good has the potential to overcome the current poor delivery of improved production technologies, especially to resource-poor farmers.

Economics and markets
Appraisal of the Sri Lanka Dairy Sector:Main Report 35
Dairy Economics and Markets
Overview of Trends in the Dairy Sector The dairy sector plays a relatively minor role in the Sri Lanka economy. Subject to well-known data limitations, it is estimated that the livestock sector contributes about 5.5% of the agricultural GDP and to about 1.2% of the national GDP. However, as income increases and urbanisation expands, demand for milk and milk products is likely to rise, leading to increased modernisation of the dairy production and marketing systems and proliferation of dairy activities. The per capita consumption of milk and milk products in Sri Lanka (about 36 kg) is quite low, as compared to some other countries in South Asia like Pakistan (122.8 kg) and India (69.2 kg). Nevertheless, the level is marginally higher than the average for developing countries (32.9 kg) and close to the Medical Research Institute recommended level of 41.6 Kg. The average monthly expenditure on milk and milk products is relatively low and is lower in rural household as compared to the urban and estate sectors though the rural population’s demand for milk is more sensitive to income than in other sectors.
Increases in milk supply and collection ('000s MT)
0
100
200
300
400
500
600
700
1981 1997
ImportsDomestic productionDomestic collection13 kgs/capita/year
36 kgs/capita/year
Figure 7: Changes in milk supply and collection
Figure 7 above shows changes in milk supply and collection, based on official figures from the Dept of Census and Statistics. They indicate that since 1981, per capita milk consumption has grown by nearly 200% percent, from 13 kgs/year to about 36 kgs/year currently. Milk production has apparently grown significantly since then (although the accuracy of some of that reporting is in doubt –see below). Milk collection, however, has not grown as quickly, and so is now a smaller proportion of production – according to these figures, it has fallen from 54% to 32% of production. This implies that most of the growth in dairy production has gone to supply the informal or unregulated market. This may reflect inadequacies in the formal milk marketing system, including price policies, as well as limited marketing of fluid milk.

Economics and markets
Appraisal of the Sri Lanka Dairy Sector:Main Report 36
Domestic milk production and dairy imports
0
100
200
300
400
1987 1988 1989 1990 1991 1992 1993 1994 1995 1996 1997
Domestic production (000 MT's) Imports (000 MT's)
Figure 8: Domestic Sri Lanka milk production and dairy imports (LME’s), 1987 to 1997.4
As a result of these trends, imports of mainly milk powder continue to be a significant feature of the Sri Lanka formal dairy industry. Figure 8 shows recent trends in milk production and dairy imports. Although production has trended up, it is not clear during this period that there is any trend towards increasing imports. In terms of LME’s, imports in 1997 were estimated to represent 43% of all milk available (including home consumption by milk producers), and an addition to the milk available of 83% of domestic milk production. Imports represent 68% of the formal, processed milk market. Although there is much concern about increased imports, it should be noted that in 1981 imports formed a similar proportion of total dairy product availability at 45% (although in 1995 imports rose to some 58% of availability). Thus although imports have risen in absolute terms (from an estimated 88,000 MTs in 1981 to 290,000 MTs in 1997), as a proportion of dairy product availability, they have remained generally stable.
Supply and demand prospects Changes in human population and income are the major determinants of demand. Although urbanisation (about 20% of the population in Sri Lanka) plays an important role, there is little apparent change in the proportion of the urban population over last several decades. As seen in Table31, overall population growth has slowed from an annual rate of 2.8% in the early 1950’s to around 1.2% recently.
4 LME conversion figures for 1995 to 1997 are based on estimates.

Economics and markets
Appraisal of the Sri Lanka Dairy Sector:Main Report 37
Table31: Human population growth: past trends in Sri Lanka
Year Population (‘000s) % growth/year 1946 6,657 1.4 1953 8,098 2.8 1963 10,582 2.7 1971 12,690 2.2 1981 14,846 1.7 1991 17,247 1.4 1996 18,315 1.2
Source: Central Bank of Ceylon, Annual Report Population growth in itself, as it is currently quite low, will not likely provide a major impetus for growth in dairy demand. Strong per capita income growth can, however, provide that increase in demand. In the past, income growth per capita was relatively low, averaging 2% per annum or less. However, economic growth has risen in recent years, averaging 4-5% annually since 1990. Further, Household Expenditure data suggests a positive expenditure elasticity (1.17) of demand for Milk and Milk Products. Based on the data available from the Household Income & Expenditure Survey (1990-91) conducted by the Dept of Census & Statistics, following expenditure elasticities for milk and dairy products were derived.
Table 32: Estimated expenditure elasticity of demand (double-log) for milk and milk products
Milk Milk Products Milk+Milk Products Overall Elasticity 1.19 1.18 1.17 R2 0.76 0.94 0.95 Urban Elasticity 1.33 0.79 0.83 R2 0.73 0.93 0.95 Rural Elasticity 1.09 1.33 1.31 R2 0.69 0.91 0.91
Source: Estimated from the Household Income and Expenditure Survey (1990-1991), Dept. of Census and Statistics.
The overall expenditure elasticity for dairy products (Milk and Milk Products) is 1.17, which is relatively elastic since it is greater than 1. This suggests that a 1% increase in household income would lead to a greater than 1% increase in expenditure on dairy products, which simply indicates that relatively more is spent on dairy products as household income goes up. Comparing rural and urban areas, rural expenditure elasticities are seen to be higher for dairy products in general (1.31 compared to 0.83). This may be a result of lower income levels in rural areas, and thus more dairy expenditure response to increases in income, or due to overall lower rural dairy consumption. These rural/urban differences are consistent with those found in studies in India (Abdulai et al., 1998). Thus given reasonably high rates of economic growth on the order of 4% per year or more, demand can be expected to grow substantially. During the period 1990-95, real GDP was reported to have grown by 5.4% annually. Based on the above demand parameters and others related to population growth, projections were made for the period 1998-2010. Table 33 shows the underlying parameters used for the projections. At a 4% rate of real GDP growth, the elasticities suggest that income and population growth alone will generate an increase in aggregate demand for milk and dairy products of slightly over 100% by 2010, from about 698,000 MT in 1997 to over 1,400,000 MT in 2010. This represents important opportunities for domestic producers to increase production.
Table 33: Underlying parameters used for dairy demand projections
1996 national population 18,315,000

Economics and markets
Appraisal of the Sri Lanka Dairy Sector:Main Report 38
Urban/rural dairy product consumption ratio 2.05 Urban population growth rate 1.2% Rural population growth rate 1.2% Annual decrease in pop growth rate (assumed) 0.02% Rural population percentage 80% Urban elasticity of demand for dairy products 0.8 Rural elasticity of demand for dairy products 1.3
On the supply side, the future determinants of milk production are the number and composition of cows and buffaloes and their average productivity. Attempts to estimate these measures, however, are hampered by lack of reliable data, mainly due to civil strife in parts of the country since the early 1980s. Based on official data, cattle and buffalo numbers (estimated at 249 MM and 82 MM, respectively, in 1996) have been generally declining, but overall milk production figures show an increase, from some 250 mill litres (1987) to 331 mill litres (1996). These trends suggest an annual decrease in cattle and buffalo number of 1% and 2.7% respectively over the period and annual milk productivity increases per herd-animal5 of 4.5% and 4.1% respectively. These figures, however, include estimates of livestock numbers and production in Northern and Eastern districts that may not be accurate. The figures for 1990-92, in fact exclude some of those districts. Estimates were thus also made based on the 18 districts for which apparently more reliable data are available for 1982, and 1992 through 1996.6 These suggest that, in those districts, there may have been herd growth rather than decline, and decreases in productivity per animal, although the period 1992-1996 indicates growth in cattle milk productivity of 2.5% annually. Due to uncertainty as to which of these figures may be reliable, no projections on change in domestic production are presented. It may be considered likely, nevertheless, that if current trends were extrapolated, domestic production would grow either slowly or not at all by 2010. Based on the 1992-96 trends in the 18 districts with apparently reliable data, production might grow by 18% over that period. Such supply projections, however, do not take into account price changes that may be driven by the large expected increases in domestic demand, by policy changes, or by changes in world dairy product prices. Some of these will be discussed under the assessment of consumption patterns. Regardless of factors affecting the supply side, the projecting large increases in demand will present new opportunities for domestic dairy production, particularly to meet liquid milk demand, as liquid milk is essentially a non-traded commodity globally.7 The household dairy consumption trends, presented in a later section, show a potential shift towards liquid milk and away from milk powder as household incomes rise. This trend, combined with strong projected increases in demand, will create good opportunities for smallholder Sri Lanka dairy producers to market their production. Although imports form an important share of the dairy market, they remain susceptible to macroeconomic factors. Based on estimates of the cost of importing, repackaging and distributing milk powder, changes in world powder prices and local exchange rates can significantly alter import competitiveness.
Table 34: Estimated sensitivity of domestic milk power prices to changes in whole milk powder (WMP) world prices and exchange rates
Cost category Share of wholesale price World Whole Milk Powder FOB 75% Freight, clearance 1% 2.5% stamp,10% duty, 4.5% defense levy 12% Repackaging and distribution cost margin 13%
5 Herd-animal refers to all animals in the herd, not differentiated into cows, bulls, etc. 6 The 18 districts are Colombo,Gampaha, Kalutara, Kandy, Matale, N'Eliya, Galle, Matara, Hambantota, Amparai, Kurunegala, Puttalam, Anuradhapura, Polonnaruwa, Badulla, Monaragala, Ratnapura, and Kegalle. 7 FAO trade figures show that, in 1996, only about 1% of world dairy trade was in the form of liquid milk.

Economics and markets
Appraisal of the Sri Lanka Dairy Sector:Main Report 39
RS/400 gram package wholesale price 100% Sensitivity to 10% exchange rate change 8.0% Sensitivity to 10% WMP price change 7.8%
Source : Dairy industry As shown in Table 34, a 10% rise in world WMP prices is estimated to raise the cost of packaged powder at the wholesale level by 8.9 %. Similarly, a 10% devaluation in the Rupee/$ exchange rate, which has indeed approximately occurred between January and Sept of 1998, would raise wholesale costs by 9.1%. As shown previously, the projected increases in domestic demand will require higher levels of per capita dairy product availability, which must come through either domestic production or through imports. The most important factor determining the competitiveness of domestic dairy production over time will be the opportunity cost of labour. This is determined by alternative employment opportunities, by the prices of farm outputs and inputs, and by the farm technologies available. With the current trend in strong GDP growth, it is possible that incomes will rise to the point where, under current labour-intensive technologies, domestic production may become un-competitive.

Economics and markets
Appraisal of the Sri Lanka Dairy Sector:Main Report 40

Economics of dairy production
Appraisal of the Sri Lanka Dairy Sector:Main Report 41
Economics of Dairy Production
Farm-level budgets The revenues and costs of cattle keeping and production, including dairy production, were estimated from the results of the household survey. Farmers were asked to recall costs and revenues per item. These estimates are shown in Table 35. Revenues include sales of milk and culled animals, mainly male calves and bulls, and the value of milk consumed by the household, which is considered to be part of the household income. Costs include fixed equipment (straight line depreciated) and variables costs such as feed and input services. The costs of family labour and land were not available from the survey and so are not included. This should be kept in mind when evaluating returns, which are thus considered returns to land and labour. Not all zones are shown, as the results were not judged to be reliable in some areas due to lack of producer response to questions.
Table 35: Estimated average annual budgets for typical smallholder cattle-keeping households in Sri Lanka, by zone and overall.
Coconut Triangle
Dry East
Low Country
Mid Country
Up Country
Overall
Herd size 5.1 9.5 7.3 3.1 3.2 5.3 MT's milk/year 2.1 3.2 3.8 1.9 3.1 2.6 Annual Revenues Milk home consumed 4,435 4,090 8,752 4,677 4,392 5,643 Milk sale –collect centres 3,888 26,050 25,439 9,059 7,298 10,620 Milk sale- other 25,427 13,147 29,894 7,508 20,534 21,433 Sale of cattle 3,980 7,590 4,520 2,170 2,440 4,070 Total Annual Revenues 37,730 50,876 68,605 23,414 34,664 41,766 Annual Costs Fixed equipment and livestock
4,631 10,401 5,810 4,215 4,040 5,165
Feed/minerals 12,090 2,855 3,254 6,264 2,885 7,562 Vet drugs/ vaccines 175 1,310 390 100 - 282 Breeding services 408 171 5 30 539 278 Veterinary services 82 14 67 - - 48 Hired Labour 569 - - 1 55 254 Other 456 14 144 40 - 228 Total Annual Costs 18,410 14,766 9,671 10,650 7,520 13,818 Annual returns to family labour and land per HH
19,320 36,111 58,934 12,764 27,144 27,948
Annual returns to family labour and land per MT of milk
9,286 11,217 15,510 6,777 8,853 10,892
Annual returns to family labour and land per cow
8,782 7,081 21,048 9,819 16,965 12,151
Source: Household survey The results show that overall, cattle-keeping households earn returns to land and labour per household of nearly SR 28,000 per year, or more than SR 2,000 per month. Per metric ton of milk overall returns to land and labour are over SR 10,000, or over SR 10 per litre of milk (a litre of milk is approximately 1 kg). Comparing zones, the highest returns were reported in the Low (Wet) Country, which includes Colombo. The high returns there were due to high prices of milk available through local sales to individuals and institutions, underlining the importance of informal dairy markets in

Economics of dairy production
Appraisal of the Sri Lanka Dairy Sector:Main Report 42
maintaining producer profitability. The lowest returns per household were reported in the mid-country and coconut triangle, where feed costs were reportedly high and revenues relatively low. The largest cost components are for cattle, fixed equipment, and feeds. Reported expenditures on veterinary drugs and services are generally quite low. The region of highest apparent cost is the coconut triangle, which may be associated with proximity to Colombo and consequent high labour and feed costs. In general, the reported returns may not be viewed as very high when considered per household. It should be kept in mind, however, that in the large majority of household cases, dairy and cattle production are only one component of the household farm and employment strategy. This is made clearer when returns to land and labour are viewed from the point of view of returns per litre of milk. At over SR 10 per litre of milk, the returns can be considered as relatively good, considering that milk prices in most collection centres are in the range of SR 11-12. The reason that returns are nearly as high as those prices is the much higher value of the milk sold to local/informal markets, and the value of sale of animals. Again, it should be kept in mind that these returns must also cover the cost of land and family labour. Nevertheless, these results suggest that in most cases dairying is an economically viable enterprise, and that the informal market is critical to profitability. The role of the informal market will be discussed further in the next section. These results also point to the strong comparative advantage of domestic producers for the liquid milk market (the target of most of the informal milk market).
Opportunity costs of labour Relatively high opportunity costs of labour relative to milk prices hinder more the intensive use of planted and cut and carry fodder. They also greatly restrict incentives for fodder markets, which are limited to larger urban areas. This constraint is apparent across regions by virtue of farmers reporting of low milk prices as a primary constraint. A rough estimate of milk price/wage ratios in Sri Lanka, where rural manual unskilled labour earns some 150 Rs/day and milk prices in the formal market average some 11.5 Rs/litre, is thus approximate 1 to 13 (about 0.08). Thus the value of one litre of milk sold at farm gate is only one thirteenth of a days wage. In India, on the other hand, where farm-gate (co-operative) milk prices are higher at about 9 rupees (equivalent to about 14 Sri Lankan Rs at current rates), a rural manual wage rate, in Gujarat for example, is approximately 35 Rs/day (some 54 SL Rs)8. In that case, the ratio is about 1 to 4. The relative value of milk is thus much higher, as a litre of milk pays for nearly a quarter of a day’s wage.9 Similar results are found when Sri Lankan wage/milk prices ratios are compared to other developing countries, which is linked to the relatively high per capita GDP in Sri Lanka. Sri Lanka is categorised by the World Bank as a Lower Middle-Income nation, with per capita GNP of some $800, more than double that of India with $370 (World Development Indicators 1999, World Bank). These realities are reflected clearly in rural casual wage rates in Sri Lanka, which are much higher than in lower income countries. The result of this on farmer behaviour are significant differences in willingness to spend time gathering crop residues such as rice straw, cutting rice straw, and engaging in the marketing of fodder. These structural differences in opportunity costs of labour lead to the observed low use of rice straw, the low level of adoption of planted fodder, and the very small role of fodder markets. It is mainly in situations where practical opportunities for alternative employment are low (e.g. up-country tea estate workers) or where local, informal milk prices are high (urban and periurban areas), that significant intensification of fodder use and marketing can be found. Everywhere else, farmers choose to optimise returns to labour by operating at relatively low levels of both fodder use and milk output, but which require low labour input. In contrast, in India where opportunity costs are low, there is in many areas intensive use of crop residues and fodder market or exchange, particularly among landless dairy producers. The effect of labour values on dairy cattle feeding has been recently confirmed in another more detailed study in Sri Lanka led by Wageningen University that shows clearly that poorer households employ more labour-intensive 8 B.K. Ganguly, personal communication. 9 Although these are rough estimates and vary widely by location, they give an indication of structural differences in relative opportunity costs of labour.

Economics of dairy production
Appraisal of the Sri Lanka Dairy Sector:Main Report 43
feeding practices. Further, they show that a significant number of households engage in off-farm casual employment, and that off-farm employment contributes to 47% of all household income on average, which confirms the validity of using rural casual wage rates as indicators of labour opportunity costs (Leegwater et al., 1999) Altering this structural reality is unlikely to be possible through milk price policies or subsidies on pasture, fodder seeds, etc. Opportunities may exist, however, through raising the productivity of labour in dairy production, either though a) focusing on fodder technologies that are not labour-demanding or b) continued upgrading of the national herd to raise the productivity of dairy animals.

Milk collection and marketing
Appraisal of the Sri Lanka Dairy Sector:Main Report 44
Milk Collection and Marketing The formal milk collection system in Sri Lanka revolves around collecting small quantities of milk from large number of small holdings scattered over relatively long distances. The formal milk sector consists of public or private enterprises such as MILCO (now Kiriya), Nestles group (IDPL), Nestles Lanka and small processors. The “informal” or raw milk market consists of sales directly to individual consumers and private milk collectors who then sell milk either to collection centre or to customers and institutions.10
Producer Price of Milk The present practice observed in most of the formal dairy industry is that the producer price of milk is set based on the fat and SNF content of milk. Procurement of small quantities of milk from large number of small farmers may be a constraint in adoption of quality standards, although in most parts of the industry the testing of milk for fat and SNF is widespread. The average nominal price for farm milk (4.3% fat, 8.4% SNF) was set at Rs 10.54/litre in 1994, but now appears to vary by milk collector and is instead set by the market. The RRA survey results indicate that the average producer price varies from Rs 10.9 to Rs 15.2, depending on the agency to which it is sold. The best price is received from “other households” (Rs 15.2) and “hotels” (Rs 14.7), with substantially lower prices from “collection centres” (Rs 11.6-12.7), “private traders” (Rs 10.8) and “others” (Rs 10.9) (Table 6). Those parts of the informal market where the producer can sell directly to consumers or institutions offer the highest prices, and contribute importantly to farmer profitability. These market outlets are discussed in more detail below. One also observes high inter-district variation in the prices offered by the informal market, with a coefficient of variation of up to 33%. These differences are generally explained by distance and nearness of the market and production density, and suggest that the informal market more efficiently incorporates transport costs than the formal collection centres, which tend to subsidise producers further removed from processing plants. Consumer and producer milk prices were obtained from various secondary sources, and adjusted for inflation to yield real prices (base=1990). In real terms, while the producer price has moved in a narrow band in recent years, the real consumer price has in fact declined during 1994-97, a period which saw continued increases in powder imports as demand rises with income growth (Figure 8, with details in Appendix 2). This suggests that producer prices are less affected than consumer prices by levels of powder imports. One reason for this might be that domestic milk production goes partially into the liquid milk market, for which reconstituted powder is not a good substitute. Regardless, the results suggest that even under increasing powder imports, producer prices are robust.
10 The term “informal market” is used here to describe raw milk or indigenous process dairy product markets, which may or may not be officially sanctioned at some level. For example, although raw milk traders may pay license fees to local authorities, they are considered here outside of the “formal market” which refers to Western-style milk processing.

Milk collection and marketing
Appraisal of the Sri Lanka Dairy Sector:Main Report 45
Real Milk Prices (1990 base) and Powder Imports (MT)
0.0
2.0
4.0
6.0
8.0
10.0
12.0
14.0
1970
1973
1976
1979
1982
1985
1988
1991
1994
1997
Pric
e (R
s/L)
0
5
10
15
20
25
30
35
40
45
50
Impo
rts
Real PP Real CP Import
Figure 9: Real producer and consumer milk prices and milk powder imports from 1990 to 1997.
Producer household milk disposal The household survey asked each producing household to report the amount of milk sold to each market outlet, and the price received. Of an average of 7.2 litres of milk produced per day by each cattle- and or buffalo-keeping household, only about 15% (about 1 litre per day), was reported consumed by the producing household (Table 36). Most of the rest (78% of that produced) is sold in liquid form, with 6% being produced into curd. A small amount, less than 1%, is reported made into yoghurt by the producing household. Some 85% of the household production is thus apparently sold, mostly in liquid form, reflecting a high degree of commercialisation of dairying and its role in offering regular income to the producing household.

Milk collection and marketing
Appraisal of the Sri Lanka Dairy Sector:Main Report 46
Table 36: Milk disposal from milk producing households, mean litres per day and percent of production
Litres/day % Estimated production/hh/day 7.20 100% Family consumption 1.08 15% Liquid milk sales 5.64 78% Curd making 0.43 6% Yoghurt making 0.05 <1% Source: Household survey
As shown in Table 37, most cattle milk is sold to collection centres (46%) with most of the rest split between other households (20%) and private collectors (22%).
Table 37: Milk Disposal Outlets Reported, Amount Disposed per day and Milk Prices (Rs/L).
Milk disposal outlets Other
households Hotels Private collector Milk collection
centre Others
Description n Lt. Rs/L N Lt. Rs/L N Lt. Rs/L n Lt. Rs/L n Lt. Rs/LMorning 388 3.6 15.2 65 5.9 14.7 158 7.5 10.8 336 8.5 11.6 41 7.02 10.9Evening 16 9.5 14.7 59 6.2 10.8 53 7.5 12.7 17 5.06 10.9Sales, % 20% 8% 22% 46% 5% Source: Household survey n=number of households reporting specified type of sale Figures reported are for cattle-keeping household only, as differentiation of milk into cattle and buffalo is unknown.
Table 38: Milk Disposal Outlets, quantity disposed (Litres/day) and No of households, by AEZ.
Milk disposal outlets Other
households Hotels Private
Collector Milk collecting
centre Others
Zone Litres No Litres No Litres No Litres No Litres No Dry intermediate 3.8 37 23.0 7 8.36 22 6.38 65 10.0 1 Dry Zone 4.5 57 5.5 8 17.3 9 9.70 86 14.3 8 Wet intermediate 4.0 81 10.7 14 5.9 43 9.44 88 8.37 8 Wet Zone 3.2 209 16.3 35 7.0 80 7.6 90 14.5 23
Table 38 shows the relative importance of the competing milk outlets by agro-ecological zone. Hotels are an important outlet in the wet zone, likely a reflection of higher human population densities and thus closer proximity to urban area. In the dry zone, private collectors are important, reflecting the longer distances to collection centres and the role that private collectors play in transporting milk to the centres. Details on prices received by AEZ and outlet are shown in Appendix 2.
Table 39: Relative role of milk collection centre (MCC) types, and sales loyalty by dairy farmers
Collection Centre Type No of Households Quantity (L’s) to MCCs % of milk quantityMilco 197 1539 66 Nestle 91 324 14 Co-operative 114 427 18

Milk collection and marketing
Appraisal of the Sri Lanka Dairy Sector:Main Report 47
Milco + Nestle 5 6 0.3 Milco + Co-operative 5 7 0.3 Nestle + Co-operative 13 13 0.6 Milco + Nestle + Co-operative
1 0 0
None 1275 530 Source: Household survey Table 39 shows the relative importance of the different collection centre types and the loyalty of farmer to MCC’s. The majority of the households reported selling of milk through the collection centres use Milco, comprising some 66% of the total milk volume reported by the surveyed farmers to be sold to MCC’s. Second in importance were co-operative collection centres, which in turn sell to either Milco, Nestle or some other outlet, including direct marketing of raw milk informally. There are few households using more than one collection centre: only 24 reported doing so, less than 2% of the sample. Households were asked how frequently their milk was tested. Of those households who responded to this question (over 400), 59% said they were tested regularly, 24% said periodically, and 17% said their milk was never tested. It is not clear, however, whether those who didn’t respond experienced testing. Overall, 23% of farmers reported being members of milk co-operatives (co-operative membership by zone is shown in Appendix 3) Testing of milk for fat and SNF at some market level was observed to be occurring in nearly all market systems. The four most common testing systems observed during the RRA were: 1) daily testing of individual farmer milk, 2) 15 day average testing of individual farmer milk, 3) daily bulk testing of a group of farmer’s milk (through collection centre or private collector) and 4) 7 or 15 day average bulk testing of a group of farmer’s milk. Individual daily testing was most commonly seen in the new Kiriya primary societies. Even where daily or individual testing is not practised, however, farm-gate prices clearly reflect general fat and SNF levels in all systems visited, so that prices in the dry zones were significantly higher than those in the other areas, in spite of the higher transportation costs. These provide excellent incentive to increase offtake particularly in extensive production areas where high-fat genotype animals predominate.
Milk Collection The milk collection system substantially revolves round collecting small quantities of milk from large number of smallholder farmers scattered over long distances. Because of this, collection costs are relatively high. Producers who are not able to sell directly to consumers or retail outlets must rely on either private (informal) milk collectors, co-operative milk collection, or formal milk collection centres linked to processors such as Milco and Nestle. Distance from major urban markets may or may not affect market access. While distance reduces the opportunity to sell directly and informally to consumers, in some areas, such as the mid-country and highlands, where milk production density is high, numerous collection agencies and milk drying plants create easy access for producers to milk markets. In other areas, such as in some of the dry zones where production densities are low, distance to markets can adversely affect market access. This can be exacerbated by inefficient functioning of some dairy co-operative societies or other collection agencies. Private (small-scale) Milk Collectors: They are an important group of private sector entrepreneurs (also called middlemen) who collect milk from small producers and deliver it to milk markets (boutiques, hotels, home delivery to consumers, major processors, chilling centres or milk collecting centres). They range in size from 7-8 litres/day (bicycle operators) to 2000 litres/day (vehicle operators). They operate on a margin between the price they pay the farmer and the price they obtain from their market outlet. They often provide other services to farmers besides milk collection, including small loans, transport of feeds, etc, the costs of which are presumed to be reflected in the milk price offered. In spite of that, the prices they offer are often competitive. RRA investigation indicated that these private collectors can

Milk collection and marketing
Appraisal of the Sri Lanka Dairy Sector:Main Report 48
operate with limited capital. A case study (see box) indicated an estimated 13% gross return to labour per litre of milk in this type of small-scale milk collection.
Market margins: Private collector near Kandy, selling to Milco chilling centre
This trader collects 140 litres morning + 20 litres afternoon milk = 160 Litres daily collection. He pays Rs 5000 monthly salary for 1 helper. He provides credit occasionally to his farmers, in the form of a Rs 2000 per farmer festival advance. Farmers are paid a flat rate of Rs 10 buying price while he is paid approximately Rs 11.5 morning price and Rs 13.5 afternoon price (due to higher milk fat) by the collection centre. It is assumed he capture some 10% of the “excess milk” value. Capital costs are only the 10 milk cans he bought (23 Litre), @ Rs 2800 per can price, and 2 bicycles for delivering the milk @ 4000/bicycle. The margins that can be calculated from these figures show that the trader earns a reasonable monthly return to labour of about Rs 8,000 per month, at the same time providing employment to one worker and providing milk collection service to farmers. That service includes collecting milk from farmer’s doorstep, which the RRA found was often a valued service. Some farmer who produced milk did not sell any due to the opportunity costs of time spent delivering milk to collection centres and sometimes waiting for the collection vehicle. The service provided by the trader also includes occasional loans to farmers, the costs of which amounts to about 1% of the sale price. Margins Rs/Litre % of sale price Farm-gate price 10.00 77% Wages 1.04 8% Equipment 0.13 1% Loan costs 0.10 1% Sale price 12.93 100% Gross return to labour 1.65 13% Rs/month returns 7,940
Formal milk collection The organisation of milk procurement routes usually follows the milk production density, and this is apparent in Sri Lanka as well. Nuwara-Eliya has the highest production per sq. km (66 litres), followed by Colombo (36 litres) and Batticaloa (34 litres). North Western province (Coconut triangle) has the highest reported share of milk collection as well as highest share cattle and buffalo population (Appendix 4). Though the share in number of cattle and buffalo is comparatively low in Central province, it contributes significantly to the total milk collection, due to higher density as well as higher yields as a result of more favourable climatic conditions and higher grades of dairy animals.
Table 40 : Formal milk collection by agro-climatic zones, Lt. and % shares, 1996.
Zone
Collection (Litres )
%
Wet 25,790,941 26 Wet Intermediate 11,985,096 12 Dry Intermediate 46,108,171 46 Dry 16,210,385 16 Total 100,094,593 100

Milk collection and marketing
Appraisal of the Sri Lanka Dairy Sector:Main Report 49
Source : Department of Census and Statistics In 1996, the Dry-intermediate zone (Hambanthota, Moneragala, Puttalam, Kurunegala and Anuradhapura) has the highest share of the milk collection (46%), while the Wet zone (Colombo, Gampaha, Kalutara, Kandy, Nuwara Eliya, Galle and Kegalle), with low cattle and buffalo population (around 17% and 16%, respectively), accounted for some 25% of the total collection (Table 40). Thus, though Dry and Dry-intermediate zones consist of 70-75% of the national cattle and buffalo population, only about 60% of the total milk collection comes from these two zones. Wet- intermediate zone (Matara, Matale, Badulla and Ratnapura) has the lowest share of milk collection (11.97%) but cattle and buffalo population is also low in this zone (12% and 9%, respectively). A considerable amount of seasonality is observed in milk collection, due to seasonality in rainfall and temperature. Over the year, the collection index varies from 86 (Nov) to 118 (July) – an increase of about 37%. October-March are the lean months while the flush occurs in May-August. Thus, to maintain a steady level of liquid milk supply, certain amount of re-constitution seems to be unavoidable.
Index of Seasonal Variation in Milk Collection (1994-97)
80
85
90
95
100
105
110
115
120
Jan
Mar
May Ju
l
Sep Nov
Month
Inde
x
Nestle/IDPLMilcoTotal
Dairy Collection Centres (DCCs): These are the primary formal collection points, often established with a collection radius of 3-5 Km with a sufficient number of milk producers to ensure a minimum milk collection of about 100 litres/day. These are operated by farmers themselves, directly by processors or by larger dairy co-operatives. Currently there are 265 registered dairy co-operatives, as shown in Table 4141. The main function of a DCC is receiving milk from producers/collectors and forwarding the milk to the chilling centre or processor. Farmers deliver milk at collecting centre in aluminium cans of 5-10 litres or in plastic cans. Most DCCs test for fat and SNF in milk, as reported above. Some adulteration occurs at some DCCs due to poor implementation of quality testing of milk from the collectors (see box below). Milk is then taken from the DCC by truck, pickup, tractor or motorcycle to the nearest chilling or processing centre.
Table 41: Number of dairy co-operatives by Province: 1997.
Province Number of co-operatives Central 41 Uva 35 Sabaragamuwa 06 North Central 19 North Western 76 Northern Nil Western 15

Milk collection and marketing
Appraisal of the Sri Lanka Dairy Sector:Main Report 50
Province Number of co-operatives Southern 03 Eastern 70 Total 265
Source : Department of Co-operatives Most milk is usually collected on “morning only” basis, although in areas where the production density levels are higher, milk is collected in the evening as well. Otherwise, evening milk is often sold by farmers to the informal markets or simply consumed. In some areas, hydrogen peroxide is added to evening milk to preserve it for morning collection. This practice has led to some controversy, and the additive is not generally considered as acceptable in milk, unlike the lacto-peroxidase system of milk preservation. Although all formal processors insist that they now discourage the practice, hydrogen peroxide was observed in use on occasion during the RRA. The practice is likely to continue unless replaced with lacto-peroxidase or until milk collection systems are able to better meet the needs of the farms.
Potential Abuses and Solutions in DCC-level Milk Testing Some collectors, either private informal traders or agents of the formal dairy industry, use several methods to try to capture a larger margin from the milk price. During the RRA investigation, while the incidence of soured milk was reported to be within reasonable limits at the level of the chilling centre, some producers supplying milk to contractors complained that, once in about a fortnight, the collector paid them less price because “milk got soured”. As milk is usually measured by collectors in litre and half litre measures, the “extra” milk above these measures is not paid for but goes to the collector. Rough estimates suggest that in many systems such “extra” milk, for which the farmer is not paid but the collector is, may amount to 5 to 10% of the total. In systems where individual farmer milk is not tested but instead testing is done of bulked milk at the chilling centre, there may also be some avenue for abuse by collectors. These systems, however, exist mainly because the additional costs of testing for fat and SNF at the collection point may outweigh the benefits. Regardless, the farmer has less ability in these cases to monitor whether s/he is being paid fairly. The benefits of quality-based pricing (mainly based on fat content) on the quality of milk supplied is best illustrated by an analysis of average Fat/SNF data obtained from 12 Farmer Managed Societies (FMS) organised by Kiriya in the milk collection areas of the chilling centres at Ampitiya, Pundalu, Kaotagala and Norwood. It was observed that over a period of some months, average fat increased from 3.8% to 4.4%, SNF from 8.1% to 8.5% and Total Solids from 11.88% to 12.90, which resulted in an improvement in the average price paid to farmers from Rs 9.60 to Rs 12.02. These changes occur because the fat-based price creates an incentive for farmers to not adulterate milk with water before delivery. Kiriya officials reported privately that since these observations, fat and SNF levels have again declined in these co-operatives, suggesting that farmers may have judged their returns to be higher with some level of adulteration. Regardless, such a system provides a good opportunity to raise the quality of milk delivered, and presumably the value consumers are willing to pay for the final products. Unless this system raises the retail value of products sold, then it is not clear that farmers overall benefit, since price increases to farmers whose milk is tested may simply be countered by price decreases to those farmers whose milk is not individually tested. Farmers who are able to market their milk in this way, however, clearly benefit. During the RRA investigation, some estimates were made of margins available to dairy co-operative. Two case examples are shown below. In one case, an important component of economic viability was direct local raw milk sales that obtained considerably higher prices.

Milk collection and marketing
Appraisal of the Sri Lanka Dairy Sector:Main Report 51
Market Margins: Small co-operative near Kandy This independent co-operative conducts about 1400 lt./day of milk collection, about half of which is sold locally through private vendor and the other half sold to Milco. They pay approximately Rs 10.25 morning price, Rs 10.75 afternoon price to farmers who deliver the milk. Costs include Rs 0.25/Litre that is taken for overhead, including salaries, depreciation, and variable collection costs, as well as fuel and a commission for the private vendor. The local sale price is Rs 14, while the Milco price received by the co-operative is about Rs 11.25 morning, and Rs 11.75 afternoon. The estimates indicate that the co-operative can generate a much higher margin on local sales, some 15% of sale price, than is available on sales to Milco (2%). When the total volume of milk is incorporated, these result in about 83% of the returns to the co-operative activity coming from local sales. As in the case of smallholder farmers, local market allow dairy activity to be viable Milco sale margins Rs/L. % of sale price Local sale
margins Rs/L. % of sale price
Farm-gate price 10.46 91% Farm-gate price 10.25 73%Transport and overhead
0.80 7% Transport, overhead
and commission
1.65 12%
Sale price 11.46 100% Sale price 14.00 100%Gross margin 0.20 2% Gross margin 2.10 15%
Market Margin: Dairy Co-operative Society in Central Province A relatively large dairy co-operative society in Central Province collects on average some 6,500 litres/day. It has it’s own Nestle-supplied coolers. Most of the milk is sold to Nestle, although some 1,000 litres/day are sold locally. It pays Rs 10.75 to its farmers, and obtains a price of Rs 12.5 from Nestle, and Rs 14 from local sales. Unlike most milk collection agents, it provides extension to its farmers through the employment of 3 field officers (@ 3200/month). They provide training in animal husbandry, feeding, etc, in order to help raise farmer milk production. The estimates below show that the co-operative is able to generate a margin of about 2% from its activities and pay a dividend to farmers of Rs.05/lt, even bearing the costs of extension agents. Again, local sales help economic viability by raising the average sale price to 12.73 from the price of 12.5 available from Nestle. Average margins Rs/Lt. % of sale price Farm-gate price 10.75 84% Transport 0.95 7% Chilling 0.37 3% Wages & overhead 0.34 3% Sale price (average) 12.73 100% Dividend 0.05 0.4% Gross return 0.27 2% Of the registered 265 dairy collection co-operatives, 4 are large district-level primary co-operatives, 30 are at levels of AGA divisions or electorates, 231 are smaller primary dairy collection co-operatives at the village level. Some of these primary dairy collection co-operatives have formed secondary milk producer co-operatives societies/unions, presently 5 in number, together collecting about 38.1 mill litres annually or about 30-35% of total milk collection. These unions currently include: Coconut Triangle Milk Union (CTMU), Mid Country Milk Union Limited (MIDCOMUL), Moneragala Milk Union, Binthenna Milk Union, and the Badulla Milk Union. Some of these do not operate in reality, since most co-operatives sell directly to processors, and co-operatives report their unwillingness to pay union fees.
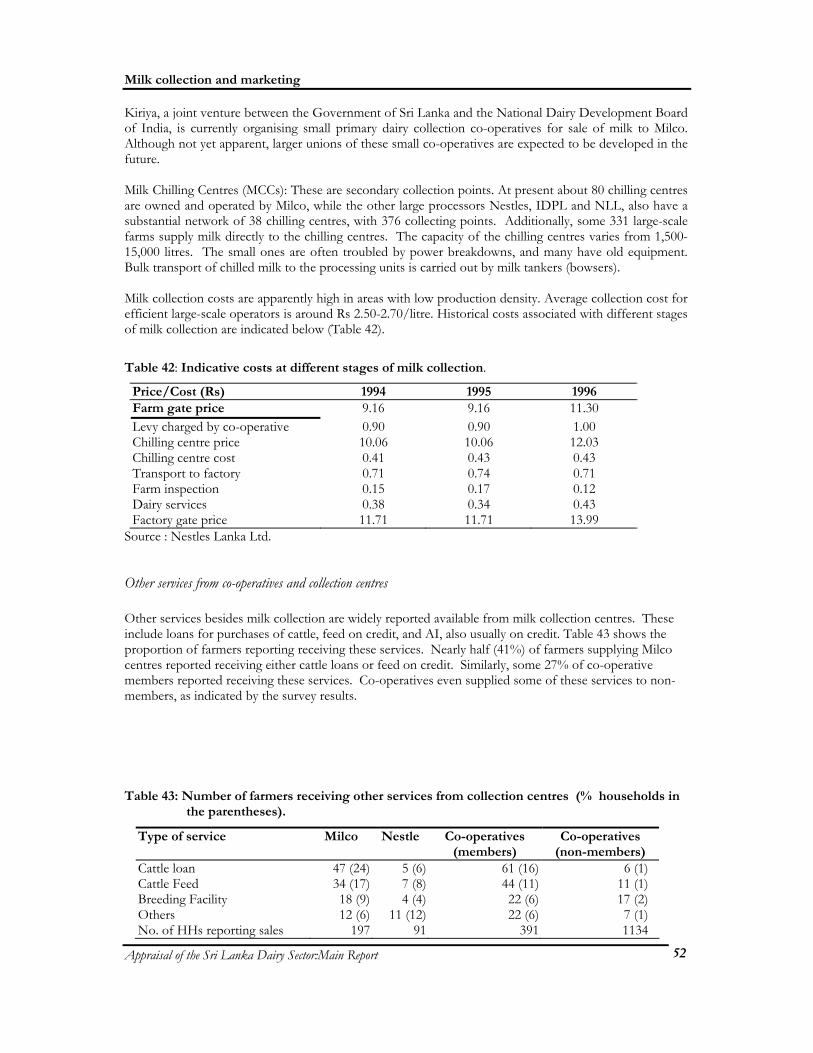
Milk collection and marketing
Appraisal of the Sri Lanka Dairy Sector:Main Report 52
Kiriya, a joint venture between the Government of Sri Lanka and the National Dairy Development Board of India, is currently organising small primary dairy collection co-operatives for sale of milk to Milco. Although not yet apparent, larger unions of these small co-operatives are expected to be developed in the future. Milk Chilling Centres (MCCs): These are secondary collection points. At present about 80 chilling centres are owned and operated by Milco, while the other large processors Nestles, IDPL and NLL, also have a substantial network of 38 chilling centres, with 376 collecting points. Additionally, some 331 large-scale farms supply milk directly to the chilling centres. The capacity of the chilling centres varies from 1,500-15,000 litres. The small ones are often troubled by power breakdowns, and many have old equipment. Bulk transport of chilled milk to the processing units is carried out by milk tankers (bowsers). Milk collection costs are apparently high in areas with low production density. Average collection cost for efficient large-scale operators is around Rs 2.50-2.70/litre. Historical costs associated with different stages of milk collection are indicated below (Table 42).
Table 42: Indicative costs at different stages of milk collection.
Price/Cost (Rs) 1994 1995 1996 Farm gate price 9.16 9.16 11.30 Levy charged by co-operative 0.90 0.90 1.00 Chilling centre price 10.06 10.06 12.03 Chilling centre cost 0.41 0.43 0.43 Transport to factory 0.71 0.74 0.71 Farm inspection 0.15 0.17 0.12 Dairy services 0.38 0.34 0.43 Factory gate price 11.71 11.71 13.99
Source : Nestles Lanka Ltd.
Other services from co-operatives and collection centres Other services besides milk collection are widely reported available from milk collection centres. These include loans for purchases of cattle, feed on credit, and AI, also usually on credit. Table 43 shows the proportion of farmers reporting receiving these services. Nearly half (41%) of farmers supplying Milco centres reported receiving either cattle loans or feed on credit. Similarly, some 27% of co-operative members reported receiving these services. Co-operatives even supplied some of these services to non-members, as indicated by the survey results.
Table 43: Number of farmers receiving other services from collection centres (% households in the parentheses).
Type of service Milco Nestle Co-operatives (members)
Co-operatives (non-members)
Cattle loan 47 (24) 5 (6) 61 (16) 6 (1) Cattle Feed 34 (17) 7 (8) 44 (11) 11 (1) Breeding Facility 18 (9) 4 (4) 22 (6) 17 (2) Others 12 (6) 11 (12) 22 (6) 7 (1) No. of HHs reporting sales 197 91 391 1134

Milk collection and marketing
Appraisal of the Sri Lanka Dairy Sector:Main Report 53
through the collection centre Source: Household survey Further, as indicated above, informal market agents such as private milk collectors also often offer cash loans and feed on credit. During the RRA, these services were reported by farmers as important components of the services they expected to receive along with milk collection. This combination of services is typical of dairy co-operatives in other countries as well, although not among Anand-model co-operatives in India, and is generally considered one of the bases of the comparative advantage that co-operatives hold over some other market agents. The newly developed Kiriya co-operatives currently do not offer credit, and some farmers indicated that this made them less attractive.
Milk Processing In Sri Lanka, the milk processing industry is comprised of (a) liquid milk processing of locally produced milk and (b) repackaging plants using imported milk powder while some processors use a combination of local milk and imported milk powder to produce yoghurt and ice-cream. Milco (prior to 1986 the National Milk Board and presently being amalgamated into Kiriya) has 3 milk processing plants (Colombo, Digana and Ambewela) and 85 chilling centres (69 currently in use), with a throughput of some 160,000 litres/day in 1995. Nestle Lanka, commissioned in 1983, produces annually 5000-6000 MT WMP with local milk and recombines imported SMP and butter oil. The Ceylon Cold Stores produces and sells pasteurised milk and ice cream with a collection of milk around 5000 litres/day. Swiss Cheese Company produces a wide range of milk and milk products and currently handles 10,000 litres/day. The other notable milk processing plants include those run by Nel Farms, Mini Dairies, the Coconut Triangle Milk Union, Mahaweli, and the National Livestock Development Board. In addition to milk powder production, many are also import bulk WMP and repackage it in retail packs. Lanka Milk Foods handles around 35% of the WMP market. Currently it is also involved in the liquid milk market (UHT milk in tetra packs) with an initial capacity of 10,000 litres/day. New Zealand Milk Products handles around 40% of WMP market. Dairy Lanka is also entering the liquid milk market (UHT milk) with a capacity of 20,000 litres/day. Most of these firms include ice cream manufacture in their operations. Further there are several small to medium scale ice cream producers such as Alerics Dairies, Bonns Frozen Foods, Woodlands Ice Cream and Carnival Ice-cream. Because of relatively low tariff on imported dairy products (10-15%), and low packaging/distribution costs and retail margins, consumers enjoy relatively low cost milk. The cost of locally produced WMP (like Highland, and Nespray) in 1995 was equivalent to US$ 35-41 cents/litre. In spite of apparently low retail prices, local entrepreneurs can engage in small-scale dairy processing successfully. One case study made during the RRA permits some examination of the margins available to a small-scale processor of simple dairy products such as yoghurt.
Market Margins: Small dairy processor near Kandy This entrepreneur makes yoghurt, curd and popsicle tubes, which he distributes locally by motorcycle to retail outlets. Some of the product is retailed directly from his premises. The milk used, some 260 L/week, is bought from the local dairy co-operative at a price of Rs 14/L. About 150 litres are used for yoghurt, the rest split about evenly between the two other products. The materials used for packaging, such as curd pots and yoghurt packages, are bought locally. The simple processing equipment cost an estimated Rs 25,000. The main other capital cost is the motorcycle used to transport the product. The costs reported below do not include own wages or cost of house he rents (in which he and his family also reside), so that returns are viewed as returns to labour and that portion of the premises used for the enterprise. Average margins Rs/Litre % of sale price Milk cost 14.00 30%Supplies 10.35 22%Equipment 0.23 0%
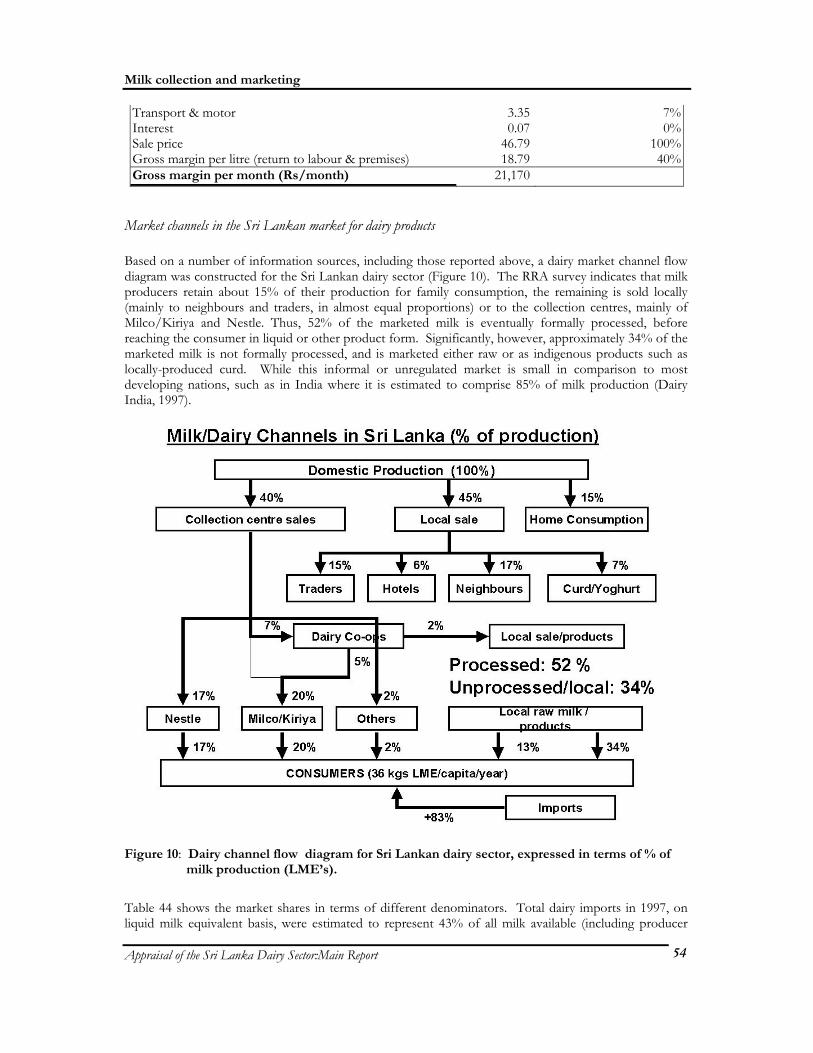
Milk collection and marketing
Appraisal of the Sri Lanka Dairy Sector:Main Report 54
Transport & motor 3.35 7%Interest 0.07 0%Sale price 46.79 100%Gross margin per litre (return to labour & premises) 18.79 40%Gross margin per month (Rs/month) 21,170
Market channels in the Sri Lankan market for dairy products Based on a number of information sources, including those reported above, a dairy market channel flow diagram was constructed for the Sri Lankan dairy sector (Figure 10). The RRA survey indicates that milk producers retain about 15% of their production for family consumption, the remaining is sold locally (mainly to neighbours and traders, in almost equal proportions) or to the collection centres, mainly of Milco/Kiriya and Nestle. Thus, 52% of the marketed milk is eventually formally processed, before reaching the consumer in liquid or other product form. Significantly, however, approximately 34% of the marketed milk is not formally processed, and is marketed either raw or as indigenous products such as locally-produced curd. While this informal or unregulated market is small in comparison to most developing nations, such as in India where it is estimated to comprise 85% of milk production (Dairy India, 1997).
Figure 10: Dairy channel flow diagram for Sri Lankan dairy sector, expressed in terms of % of milk production (LME’s).
Table 44 shows the market shares in terms of different denominators. Total dairy imports in 1997, on liquid milk equivalent basis, were estimated to represent 43% of all milk available (including producer

Milk collection and marketing
Appraisal of the Sri Lanka Dairy Sector:Main Report 55
home consumption), and were an addition to the milk available of 85% of domestic milk production. Imports represent 69% of the formal, processed milk market.
Table 44: Estimated shares in the dairy market of Sri Lanka
Description
Nestle
Milco
Others
Local processed
Local Unprocessed
Imports
a) % of domestic production 16% 19% 2% 13% 34.3% 85%b) % of formal processed market ( including imports)
13% 16% 2% 69%
c) % of domestic market (excluding imports)
19% 23% 2% 15% 40%
d) % of overall market, domestic and imported
10% 12% 1% 8% 21% 49%

Milk collection and marketing
Appraisal of the Sri Lanka Dairy Sector:Main Report 56
Milk and dairy product consumption During the household survey, questions were also asked of each respondent about milk and dairy product consumption in the household, sources of these, etc. Household incomes were also reported. Since the survey covered both dairy producing and non-producing households, these responses are available for a wide range of household type, and can be used to accurately gauge consumption patterns. The sample households had an average family size of 4.54 persons and an average income of Rs 6,047 per month (Rs 1,332 per capita) which is comparable to the official estimate of Rs 5019 (1993), when compounded to 1998 at a 5% annual growth rate. Some 53% of the households in the sample were milk producers, which is considerably higher than the generally accepted proportion of cattle-keeping households in the country, which is some 15-20%. The sample must thus be considered biased towards milk producers, which may be attributable to a tendency by enumerators to select dairy producers. Overall, 58% of the households in the sample districts buy some liquid milk and/or milk products, 48% and 70% in case of producers and non-producers, respectively.
Dairy expenditure patterns Income quartiles were used to classify the households. To do this the households were separated into the bottom 25% (of number of households) by income, which formed the 1 quartile (Q1), the next 25% formed the second quartile (Q2) and so on. Table 45 shows some of the expenditure pattern results. The fourth quartile, with the highest income, can be seen to represent 48% of all household income (Table 45) • An average household spends about Rs 262 (4.3% of the household income) on liquid milk and milk
products, about 20% on liquid milk, another 62% on milk powder and the remainder on other milk products.
• As one moves from lower to higher income quartiles (Q1 to Q4), expenditure on liquid milk and
milk products rises sharply (from 140 to 494 Rs/month), but not as a percentage of household income, which instead falls from 5.6 to 4.2%. Q4 households account for nearly half the market for dairy products.
• A very limited market exists for specialised dairy products like condensed milk and cheese.

Milk collection and marketing
Appraisal of the Sri Lanka Dairy Sector:Main Report 57
Table 45: Expenditure patterns for milk & milk products, as Rs/month and as percentage of monthly household income.
Description Unit Q1 Q2 Q3 Q4 Total Households % 25 25 25 25 100 Total income % 10 17 24 48 100 Expenditure: Milk & Products % 13 17 22 47 100 Income/Household Rs/M 2,498 4,188 5,809 11,674 6047 Expenditure: Milk & Products Rs/M 140 179 233 494 262 - % of Income % 5.6 4.3 4.0 4.2 4.3 Liquid Milk Rs/M 13 23 21 130 47 - % of Income % 0.5 0.5 0.3 1.1 0.8 Milk Powder Rs/M 109 130 171 246 164 - % of Income % 4.4 3.1 2.9 2.1 2.7 Infant Milk Foods Rs/M 2 4 3 7 4 - % of Income % 0.1 0.1 < 0.1 < 0.1 < 0.1 Condensed Milk Rs/M 1 Negl - % of Income % .01 Negl Milk Products Rs/M 15 23 39 111 47 - % of Income % 0.6 0.5 0.7 1.0 0.8 Source: Household survey. One notable result is that, while, expenditure on milk powder as a percentage of income declines at higher quartiles, expenditure on liquid milk more than doubles, from 0.5% to 1.1% of income. In economic terms, this suggests that consumers perceive milk powder as an inferior good, in that it’s consumption declines with income. On the other hand, liquid milk is shown to be a superior good. This result indicates that as per capita income rise in Sri Lanka, demand is likely to shift increasingly to liquid milk (assuming preferences remain the same).
Liquid milk market and consumer behaviour Across the districts, some 12% of the households buy liquid milk (in Hambantota, none of the sample households bought any liquid milk, although many produced milk) though the frequency is much higher in districts like Colombo (52%) and Badulla (41%). An average buyer household buys some 0.5 litres of milk a day at an average price of Rs 29.3 a litre (all types of milk and all forms of packaging included). • Given an estimated number of 3.8 million households (172 million persons) and the consumption
parameters obtained through the present survey, the total quantity of liquid milk marketed (both formally and informally) in these 20 sample districts is estimated at 209,410 litres a day, valued at Rs 6.1 million.
• In absolute terms, Colombo market ranks first with a market size of nearly 140,000 litres a day,
followed by Badulla (22,000 litres) and Puttalam (14,300 litres). Over 50% of the purchased liquid milk is used for making tea/coffee, 43% is converted into milk products or used as cooking ingredient11, 5% is directly consumed by adults, leaving some 2% for the children below 7 years of age. Only 4% of the sample households reported buying liquid milk daily, another 7% bought occasionally. As for the reasons of never buying liquid milk, 41% stated that they were milk producer themselves, 35% preferred milk powders while 15% stated non-availability as a major reason (more so in districts like Batticaloa, Hambantota, Kandy, Gampaha, Kurunegala and Puttalam).
11 The relatively frequent reported use of milk as a cooking ingredient is thought to indicate some misunderstanding by respondants, since milk in cooking is not considered widespread. Respondants may have meant by this that they use milk in tea/coffee.

Milk collection and marketing
Appraisal of the Sri Lanka Dairy Sector:Main Report 58
As for other reasons, over 15% of the respondents in Kandy and Polonnaruwa rated the presently available quality of liquid milk as “poor”, while over 15% in Colombo, Kandy and Hambantota stated that they could not afford to buy liquid milk for considerations of income. The relatively high ranking of non-availability of liquid milk and reported poor quality may be indicators that markets for liquid milk are not currently meeting demand, and could be significantly expanded. For the buying households, the per capita consumption of liquid milk works out to be 106 gms/day or 39 kgs/year (0.5 litre/day/household). An analysis of the primary data in terms of income quartiles reveal that households in the 4th Quartile presently form the bulk of the consumer market. One-third of the households in this category buy liquid milk and they account for 69% of the market in quantity and 70% in value. As noted, with increases in income, the frequency of households buying liquid milk increases, as does quantity bought and expenditure. Thus, a potential target group for liquid milk marketers is the 4th Quartile households though a proper price-product mix (whereby high-margin milk products subsidises liquid milk processing). Along with such marketing strategies such as smaller retail units (e.g. 250 ml's), marketing may induce more lower quartile households to the liquid milk market.
Milk powder market and consumer behaviour An estimated 69% of the households in the sample districts reported buying milk powders, with the highest percentage levels in Colombo (95%), Puttalam, Gampaha, Kaluthara, Matara and Polonnaruwa (over 70% of households). An average buyer family buys about 1.12 kg of milk powder a month (a high 30% variation is observed in the average quantity bought) at an average price of Rs 211/kg. In terms of milk powder brands, Anchor accounts for 48% of the market volume (44% of buyers), followed by Lakspray’s 14% (14% of the buyers) and Highland’s 9% (11% of the buyers). Unlike liquid milk, little inter-district variations are observed in the milk powder price. This observation is consistent with price data published in official reports and reflects greater price uniformity in the formal market. • The milk powder market is estimated at 2.9 million kg a month, valued at Rs 611 million. • Colombo (694,000 kg), Kaluthara (285,000 kg), Kandy (220,000 kg), Galle (173,000 kg), Gampaha
(189,000 kg), Kurunegale (198,000 kg), Matara (188,000 kg) and Ratnapura (161,000 kg) are major consumption centres, accounting for over 72% of the total quantity bought a month.
Respondents did not report significant complaints about the quality of milk powders they buy – 90% rated the available products as either “very good” or “good” (rather exceptionally, in Puttalam, 12% of the buyers regarded the quality as “poor”). However, 22% of the respondents were willing to shift to other brands (probably on grounds such as availability and price). In terms of income quartiles, frequency of households buying milk powders increases as one moves from the 1st to the 4th Quartile and so does the average quantity bought and amount spent. Unlike liquid milk, the proportion of income spent declines, however, as incomes increase.
Other milk product consumption Only 2% of the sample households reported buying infant milk foods (IMF) (30% of who were in Colombo alone), an average of .75 kg a month at an average price of Rs 242/kg. The households in the 4th Quartile accounts for 43% of the total buyers and 45% of the quantity bought. Similarly, there is a very limited market for condensed milk, which only 0.2% of the households reported purchasing, mainly in Colombo and Galle. An average CM buyer, who is solely among the 4th quartile households, buys some 1.1 kg a month (Rs 115/kg).

Milk collection and marketing
Appraisal of the Sri Lanka Dairy Sector:Main Report 59
Every third sample household reported buying some other milk product. Curd, yoghurt and flavoured milk powders were most common products, followed by butter and, to lesser extent, cheese. However, districts like Moneragala, Mathale, Ratnapura and Ampara presently offer very little market opportunity for most of these products. Flavoured milk powder (FMP) was purchased by 9% of the households, the average quantity bought being a little over 0.5 kg a month at an average price of 242/kg. Some 12% of the sample families were buying Curd (usually in earthen pots), reporting an average quantity of 1.7 kg a month at an average price of Rs 82/kg. The frequency of buyers is much higher in Matara, Hambantota, Trincomalee and Polonnaruwa (30-40%). The total market for curd is estimated at 728,000 kg a month. Hambantota (127,000 kg), Matara (125,000 kg) and Kaluthara (119,000 kg) are the major consumption centres (Hambantota is also a major production centre). Similarly, 12% of the households reported buying yoghurt, an average quantity of 1 kg per month at an average price of Rs 88/kg. Frequency of buyers is much higher in Colombo (59%), Puttalam (22%), Gampaha and Polonnaruwa (17-18%). Only 3% of the sample households reported buying cheese.
Milk collection and marketing
Appraisal of the Sri Lanka Dairy Sector:Main Report 60
Main Issues Emerging from the Market and Economic Analysis • Due to data unreliability, the trends in milk production and numbers of cattle and buffalo in Sri
Lanka are unclear. There is some indication, however, that per animal productivity has recently been growing significantly.
• A large role for imports in the dairy sector which, although they have grown in volume, have maintained approximately same the market share since early 1980’s (about 45% of available dairy products).
• Smaller proportion of milk production is now collected (32% compared to 54% in 1981), suggesting growth in informal sector.
• Increased availability of dairy products, from 13 kgs/capita/yr in 1981 to about 36 kgs/capita/yr now, due to proportional growth in both domestic production and imports.
• Projections of strong increases in demand due to continued GDP growth. Under assumption of 4% GDP growth (compared to 5.4% 1990-1996), demand could grow by over 100% by 2010. This will present good opportunities for smallholder domestic dairy producers, especially if demand for liquid milk grows particularly fast, as consumption data suggests could happen.
• Lack of reliable data limits projections in domestic production, but apparent current trends suggest that by 2010 it may only rise only slowly if at all.
• Relatively little milk is retained by producers for home consumption (15%) – most is sold (78%) or made into curd/yoghurt (7%), indicating a high degree of market orientation.
• The informal or local market supplies some 28% of the total market, and provides many viable income-generating opportunities for small entrepreneurs. Public health risks in some of these market channels, however, are uncertain.
• Low farm-gate milk prices relative to other countries, which is cited as major constraint by producers. Formal collection centre price averages 11.6 Rs/l, while the informal market price average is 15.2 Rs/l.
• Varying approaches to dairy co-operative development co-exist, as well as different scales of co-operative operation. Over time, as government withdraws from provision of livestock services such as AI and livestock extension, the ability of co-operatives to offer such services may be critical for continued development. Provision of limited short-term credit by co-operatives may also be a needed service, expressed by a large majority of small producers.
• In areas where milk collection occurs only once a day, use of hydrogen peroxide by farmers was observed. The appropriate use of the more acceptable alternative, lacto-peroxidase, may need to be investigated.
• Only approximately 30% of households report consumption of liquid milk, and most of those are dairy producers. Most households report preference for powdered milk. However, 15% of household says liquid milk is not available.
• Consumption of liquid milk appears to increase with income (unlike that of milk powder), suggesting that over time, as incomes grow, demand could shift towards liquid milk, which would benefit domestic producers.

Policies and institutions
Appraisal of the Sri Lanka Dairy Sector:Main Report 61
Policies and Institutions in the Dairy Sector The institutional support for the dairy industry is provided both by state institutions as well as by the private sector. The state sector is mainly engaged in providing the public goods, and the private sector institutions provide the input supplies, and marketing facilities.
Government institutions supporting the dairy sector
Ministry of Livestock Development and Estate Infrastructure The government support to the dairy sector is primarily under the Ministry of Livestock Development and Estate Infrastructure. In addition, this Ministry is also responsible for the development of socio-economic welfare of the workers in the plantation sector. The subject of Livestock Development was made a separate portfolio in 1978, and since then the function of livestock development including that of dairy development has remained a separate portfolio. In 1978 the Ministry responsible for livestock development had the added responsibility of rural development also, and in June 1997 when the present Ministry was established the livestock development responsibilities and that of estate infrastructure development were combined together and named as the Ministry of Livestock Development & Estate Infrastructure. The Mission Statement of the Ministry is stated as ‘Initiate appropriate measures to ensure sustainable growth in the livestock sector’, and the development goals of the livestock sector are spelt out by the Ministry as; - Promotion of dairying and other livestock species and livestock sector activities for additional
employment and incomes, and as instruments for rural development. - Increase the self reliance on domestic milk production. The objectives of the Ministry towards these goals are stated as; i. Provide funds for the livestock development (approximately Rs.200 Mn. Per annum and with an
annual increase of around 10 %). ii. Review and revise policies and programmes in respect of the livestock sector annually. iii. Ensure the programmes and projects implemented by the agencies concerned as planned. iv. Management of manpower, material and finances for the successful implementation of the
programme. v. Ensure the policies related to the livestock sector are adhered by all concerned. vi. Promote a satisfactory annual growth in the ventures related to the livestock sector. vii. Ensure animal health status in the country in line with the international standards. viii. Facilitate the adherence of all concerned with the country obligations towards international
agreements. The key concepts of the livestock development are to promote the private sector play a greater role in the activities of livestock production, processing, marketing and supply of inputs including veterinary services and extension advice to the farmers, and, for the state to engage in activities of livestock and dairy development which are at present not attractive for the involvement of the private sector. In pursuing it's development goals in the livestock sector, MLD&EI has following medium term objectives to improve the dairy sector.

Policies and institutions
Appraisal of the Sri Lanka Dairy Sector:Main Report 62
- Increase the number of breedable cows in the country through new approaches to breeding and providing appropriate delivery systems for artificial inseminations and natural service, and through a calf salvage programme.
- Spearhead a programme for small farmer group formation for collective milk marketing, for
obtaining inputs for dairying, and to use these entities as media for public sector extension deliveries and technology transfer.
- To increase the role of domestic buffalo in the milk production To implement the Ministry policies and programmes there are two state agencies under the Ministry of Livestock Development and Estate Infrastructure at the central government level. In addition there are eight provincial agencies to support the public sector development programmes in relation to the livestock sector in the country. The two institutions at the centre are the Department of Animal Production and Health (DAPH) and the National Livestock Development Board (NLDB). The agencies under the provincial administration are the eight Provincial Departments of Animal Production and Health in the eight provincial councils of the country. In addition to the MLD&EI, Ministries of Agricultural and Lands, Mahaweli Development, and Internal and International Trade, Commerce and Food are also engaged in some activities which has a role in the development of the dairy sector in Sri Lanka.
Department of Animal Production And Health (DAPH) The department of Animal Production And Health was established in 1978 as a separate organisation with the establishment of a separate portfolio for livestock development . Prior to this change the DAPH was functioning under the Department of Agriculture (DOA) as a Division of Animal Production and Health. The mission statement of the DAPH is ‘to provide leadership on technical aspect of development to the livestock sector from a national prospective’. The objectives of the department are stated as: - Monitor the status of the livestock sector monthly in order to identify emerging issues. - Plan and execute research programmes according to the needs of the livestock industry. - Provide technical products and specialised services according to the needs of the livestock
sector. - Implement the provisions of the statutes pertaining to livestock sector. - Promote the buildup of technical capacity of sectoral staff. - Disseminate technical information concerned agencies, provincial DAPH and individuals. - Develop the genetic resources of livestock. - Monitor and control animal disease of economic and zoonotic importance. - Provide professional expertise on issues related to the livestock sector. To carry out the above functions the department is organised into 6 divisions, namely the Human Resources Development Division, Animal Health Division, Veterinary Research Division, Livestock Resource Development Division, Livestock Planning and Economics Division, General Administration Division. The department is headed by a Director, and each of the above mentioned 6 divisions are headed by a Deputy Director. In addition to these 6 divisions, there are special entities for the following functions directly under the Director APH. They are the Implementation of Laws and Regulations Unit, which deals with registration of drugs and pharmaceuticals, registration of animal feeds, control of import of live animals and livestock products, and the unit for animal quarantine functions.

Policies and institutions
Appraisal of the Sri Lanka Dairy Sector:Main Report 63
The Human Resource Development division is responsible for manpower development, including training of trainees, conducting of departmental examinations for DAPH staff, extension co-ordination and mass media activities related to livestock production. It also conducts diploma level education for advance level qualified youth at two of its training schools at Welisara and at Anuradhapura. The Animal Health Division is responsible disease surveillance and control of animal diseases in the country. The Veterinary Research Division is engaged in carrying out animal health and production research to meet the needs of the livestock sector. It is also engaged in the production of certain vaccines for animal diseases. The Livestock Resources Development division is responsible for animal breeding and semen production in the country, while the Economics and Planning Division of the department is responsible for planning and monitoring of DAPH development activities. The General Administration Division of the DAPH looks after the financial and administration functions of the department and that of the Sri Lanka Animal Production and Health Service which includes even the veterinary surgeons and agriculture graduates serving under the provincial DAPH.
Provincial Departments of Animal Production and Health The provincial departments of APH comes under the administration of the different provincial councils of the country, and are directly under the Provincial Ministries of Agriculture. They are headed by a provincial director, who is a Class I officer of the Sri Lanka Animal Production &Health Service. The provincial DAPHs are responsible for carrying out the devolved functions of livestock development in the country, and these include animal breeding, animal health control, animal husbandry extension, pasture and fodder production, and farmer training. The provincial DAPH have a net work of veterinary ranges in their provinces to carry out the above functions. And the veterinary ranges are headed by a veterinary graduate and 3 or 4 diploma trained livestock development instructors. The technical back-stopping for the provincial DAPH is provided by the Central DAPH at Peradeniya, including the supply of semen for animal breeding, and vaccines and other biologicals for animal disease control.
National Livestock Development Board (NLDB) The National Livestock Development Board was established as a state agricultural corporation on 4th May 1973 with original purpose of promoting and improving the efficiency of the meat trade through animal purchase, slaughtering of animals, processing of slaughtered animals, transportation of meat to retail outlets and utilisation of by-products of slaughter for animal feeds. However, the NLDB could not venture into any of these functions, and in 1975 a different set of functions were assigned to NLDB. Since then the NLDB has been focusing on the maintenance of livestock farms as nucleus farms for the production and multiplication of livestock and poultry to be issued to the farmers, and to carryout them as commercial operations. At the time the NLDB was established, several coconut estates which were acquired by the government under the land reform law of 1972 were handed over to NLDB for purposes of holding animals it procures for meat. When the functions of the NLDB were changed in 1975 these coconut estates were converted as dairy cattle farms. In 1991 the government took a decision to hand over the livestock farms belonging to the DAPH to NLDB, and as a result of these changes the number of farms of the NLDB increased and it now maintains a total to 30 livestock farms incorporating nearly 17,000 hectares of land, thus making the agency with the largest land resource for livestock farming.
Kiriya Milk Industries of Lanka Company Limited Kiriya Milk Industries of Lanka Ltd. is a joint venture between the National Dairy Development Board (NDDB) of India, which promotes dairy co-operative development, and the government of Sri Lanka on

Policies and institutions
Appraisal of the Sri Lanka Dairy Sector:Main Report 64
a 51% to 49% share basis, for the purpose of milk processing and marketing in Sri Lanka. It is the successor to the formerly state owned milk factory the Milk Industries of Lanka Ltd.. (MILCO). In keeping with the government policy of divesting state owned commercial entities to the private sector, the MILCO was made into a joint company in September 1997 in partnership with the National Dairy Development Board of India. A factor that influenced the government of Sri Lanka to enter into a joint venture project with NDDB is the latter’s perceived contribution to helping make India the largest milk producer in the world, also based on smallholder production. In spite of this perception, the co-operative share of the Indian dairy market is less than 10% (Dairy India, 1997). The main function of Kiriya is to provide a market for the liquid milk produced by the dairy farmers of Sri Lanka. Kiriya at present manages 3 milk plants and some 90 milk chilling centres spread throughout the country. The 3 plants are the Colombo liquid milk plant, the Digana dairy and Ambewela spray drying milk plant. Kiriya at present processes fresh milk into products such as pasteurised milk, sterilised milk, full cream milk powder which are the major products and to other products such as yoghurt, ice cream, cheese etc. which are minor products comparing the volume but are important contributors to the MILCO revenues. Kiriya has plans to set up a 300,000 a litres a day new milk factory, and also a 30 ton a day capacity cattle feed plant. At present the total milk handling capacity of Kiriya is 220,000 l/day, of which some 50% is used, and the present cattle feed plant of Kiriya makes around 5 tons of cattle feed a day. The key concept of the Kiriya operation is to mobilise farmers into small groups as dairy co-operatives at village level, and to collect the milk from these farmer managed dairy co-operatives with testing of milk of every farmer member every time he supplies and pay for the milk according to it’s quality. Few other services are provided.
Livestock Development Division of Mahaweli Authority of Sri Lanka The Mahaweli Development Program which was an agricultural development programme was started in 1970 with the diversion of waters of the Mahaweli river to the dry zone parts of the country. The project was mainly an irrigation and a farmer settlement project. The project is handled by the Mahaweli Authority of Sri Lanka, under the Ministry of Mahaweli development. In order to provide the draught cattle requirements of the Mahaweli settlers another development component was added to the original project and was given the responsibility of maintaining large farms for cattle breeding. This activity is handled by the livestock development division of the Mahaweli Authority. At the beginning when it was first started in the late 1970s its activities were restricted to the production of draught cattle and buffaloes. However in the mid 1980s it expanded its livestock programme to cover dairy cattle breeding, as well as milk collection and processing. As a result of these changes the livestock programme was renamed as the draught animal and dairy development programme. The basic livestock unit being promoted by draft animal and dairy development program was two cows and followers, and the philosophy was to develop a dual purpose draft and milk animal, "the Mahaweli cow", based on crossing Sahiwal and Jersey. In Mahaweli areas farmers own buffaloes and/or neat cattle, although about 70 - 80 percent would use cattle/buffalo for cultivation. Mahaweli owns some 10 farms, 2 of which each being in the system H, system C and Uda Walawe. 3 farms are in system A and 1 farm is located in system B. At present livestock in Mahaweli plays a major role in the dairy industry. It involves in production of milk as well as milk products. According to the Mahaweli Authority it’s collection of milk from Mahaweli area is around 1.2 million litres of milk annually. The main functions of the livestock development division of Mahaweli Authority of Sri Lanka can be summarised as follows: - Maintaining livestock farms to breed and multiply a milch animal suitable for the Mahaweli areas.

Policies and institutions
Appraisal of the Sri Lanka Dairy Sector:Main Report 65
- Issuing upgraded animals for farmers in the Mahaweli areas - Providing extension, veterinary health care, immunisation against endemic diseases, distribution
of pasture and fodder cuttings for developing the feed resources in the area - Organising farmers for collective milk marketing and in producing simple dairy products - Managing a joint venture company called the Mahaweli Livestock Enterprises Limited
for the production of Pigs, Poultry and Poultry meat.
Private sector institutions for dairy development. Among the private sector agencies supporting the dairy development in Sri Lanka, the milk processors are an important group. There are two multinationals in the milk processing industry in Sri Lanka and a few local companies also engaged in milk procurement and processing. The two multinational companies are the Nestle Lanka Limited and the New Dale Dairies which is a subsidiary company of the New Zealand Dairy Board.
Nestles Lanka Limited (NLL) Nestle’ is one of the oldest companies in Sri Lanka engaged in food processing and marketing of food products. It ventured into the manufacture of dairy products in 1980 when it first joined with the then National Milk Board to produce condensed milk at Polonnaruwa. Later in 1982 the Company decided to go into full cream powder manufacture also and set up a factory at Kurunegala, which is the most modern powdered milk processing plant in Sri Lanka. The plant which was commissioned in 1983 is producing some 5,000 - 6,000 MTs of whole milk powder annually, about 50% of it's total capacity. In addition to this Nestles produces and markets a wide range of other food products too. In 1983 with government agreement with Nestle’ was to give 3 districts, viz. Anuradhapura, Kurunegala and Puttalam for the collection of milk. Milk was collected through chilling centres of Milk Industries of Lanka Company Limited. A huge development program was carried out by the Nestles spending over 30 million rupees to increase milk production in these 3 districts. Some of the work undertaken by the Nestles included, pasture establishment, issuing of stud bulls, bull calves, supplying interest free loans for the farmers for various development work etc. Collecting points were established on village basis, and the collected milk were transported to the chilling centres by trucks. Payments were given directly to the farmers through a tally sheet system and the payments were done once in 2 weeks. In 1989 Nestle’ entered into another agreement, with the Ministry of Livestock, for the collection of milk in the Kandy district also. As a result of this by the year 1992, the formal segregation of areas for milk collection by MILCO and Nestle’ was deregulated and the Nestles and MILCO were allowed to collect milk in all districts in Sri Lanka. The Ministry has viewed this as a good policy to increase the competition of milk procurement in the country and thereby to guarantee a good farm-gate price for milk. Nestle’ started farmers associations in many parts of the country for milk collection, and some of these were breakaway groups of the former dairy co-operatives organised by the DAPH and the NLDB. Nestle’ was the first company to start computerisation of milk procurement system at village level, and farmer associations were given computer printout of individual farmer details of milk receipts, quality, value, deductions etc. on a fortnightly basis. The Kurunegal milk plant produces a wide range of dairy products such as Nespray, Nestomalt, Milo etc. and according to Company sources, the full cream milk powder production is not a very attractive activity because of the imported milk powders in the local market.

Policies and institutions
Appraisal of the Sri Lanka Dairy Sector:Main Report 66
International Dairy Products Limited (IDPL) This is a joint venture company between the then National Milk Board and Nestle’ Ltd. with management control by Nestle’ Ltd. with Nestle’ owning (60%) and NMB holding (40%) shares. The joint venture took over the condensed milk plant at Polonnaruwa in 1980 from NMB, under a 30 year agreement. Districts in the Easter Province are the major milk shed for the IDPL plant, and it has organised several farmer associations in these areas for milk collection. The plants in the beginning was producing condensed milk under the Milk Board brand of Perakum and the Nestle’ brand. Currently it produces only the Nestle’ brand of condensed milk and since recently the plant is modified to produce ready to drink dairy products under the Milo brand name. The IDPL also adopts a milk payment system similar to Nestle’ Lanka Ltd. Ceylon Cold Stores Limited This old established company used to operate a large dairy farm near Kandy producing nearly 10,000 litres/day, and to market dairy products under the name of Elephant House. This farm was taken over by government under the Land Reform Act of 1972. The company was in financial difficulty in 1992 and was taken over by John Keells Holdings Limited, but continues to produce products under the earlier brand name of Elephant House. The company produces several types of milk products, and has a home delivery system of milk within the Colombo municipal limits. The main products are the pasteurised milk and ice cream. At present the company does not collect milk from the farmers but buys it’s milk requirements from third party sources.
Swiss Cheese Company Limited This company was established in 1979 to produce Kotmale cheese. Soon it made good progress of cheese and by mid 1980s it ventured into other dairy such as pasteurised milk, fresh cream, etc. It is the first company to export dairy products from Sri Lanka, and the cheese it produced was having a good market in the Maldives. The company collects about 20,000 litres a day in the hill country regions of Sri Lanka but uses only around one third of it’s collection for their products and the rest is sold to either Nestle’ or Kiriya Milk Company. The company produces cheese, ice cream, pasteurised flavoured milk, cream and ghee.
Coconut Triangle Milk Union (CTMU) This Union was established in 1986 with 20 provincial milk co-operatives, under a world bank project. At present the CTMU is consisted with 94 registered co-operatives and 30 unregistered co-operatives, with altogether 9750 farmer members. The major objectives of the CTMU are - to give a better price for milk for the milk producers - to provide sales facilities for the milk producers through a better collecting system - to increase the price per one litre of milk through value added products (processing) Therefore this union is common with other co-operative unions, expects net returns from milk processing and involves in strengthening the milk collection net work and improving the social life of dairy farmers. The main services that the union is providing for the farmers include, - supplying free transport for the farmers in transporting of their milk - Provide free extension services. The field staff is actively engaged in this - Linking of farmers with banks to obtain bank loans - provide free artificial insemination services

Policies and institutions
Appraisal of the Sri Lanka Dairy Sector:Main Report 67
- holding training programs for the farmers. In this context CTMU is organising at least one training program per month
- Supply cattle feed, mineral mixtures, wormicide like medicine at a lower costs and also on loan schemes.
- CTMU is also engaged in providing bonus for the farmers at the end of each year as a secondary payment for their milk
Milk collection, the average price paid for the farmers per litre of milk and the average price obtained per litre of milk by selling it to the larger processors is given in the Table 46.
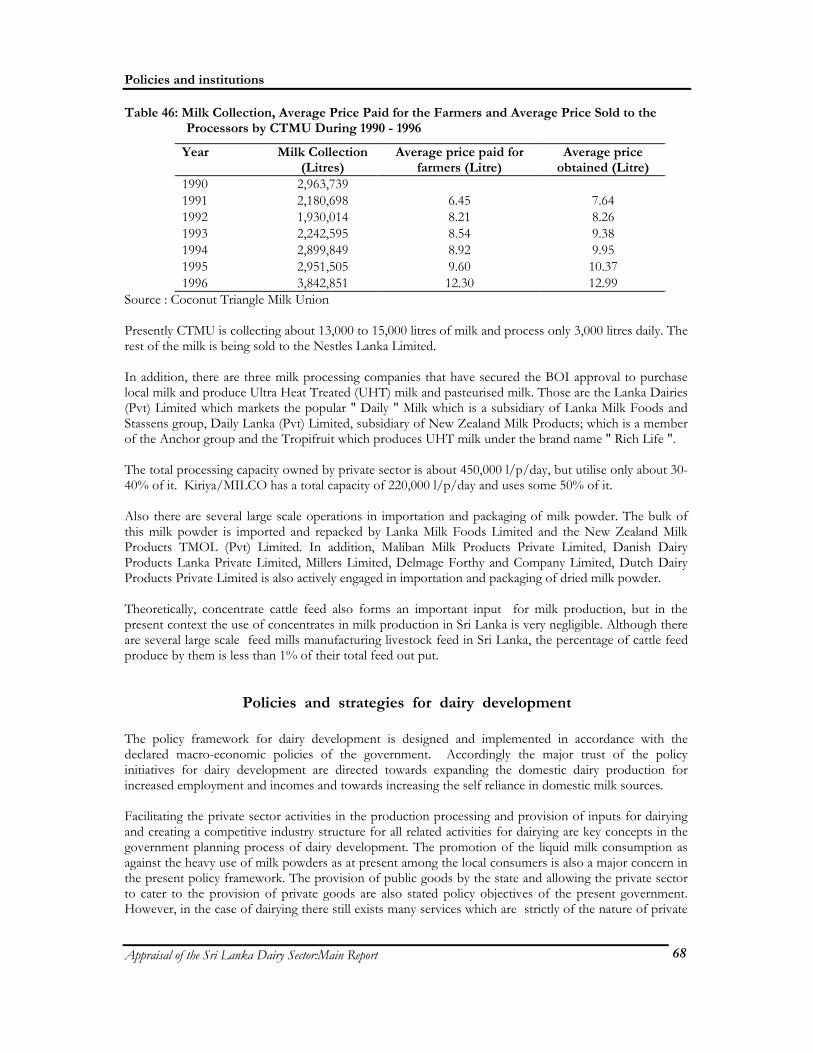
Policies and institutions
Appraisal of the Sri Lanka Dairy Sector:Main Report 68
Table 46: Milk Collection, Average Price Paid for the Farmers and Average Price Sold to the Processors by CTMU During 1990 - 1996
Year Milk Collection (Litres)
Average price paid for farmers (Litre)
Average price obtained (Litre)
1990 2,963,739 1991 2,180,698 6.45 7.64 1992 1,930,014 8.21 8.26 1993 2,242,595 8.54 9.38 1994 2,899,849 8.92 9.95 1995 2,951,505 9.60 10.37 1996 3,842,851 12.30 12.99
Source : Coconut Triangle Milk Union Presently CTMU is collecting about 13,000 to 15,000 litres of milk and process only 3,000 litres daily. The rest of the milk is being sold to the Nestles Lanka Limited. In addition, there are three milk processing companies that have secured the BOI approval to purchase local milk and produce Ultra Heat Treated (UHT) milk and pasteurised milk. Those are the Lanka Dairies (Pvt) Limited which markets the popular " Daily " Milk which is a subsidiary of Lanka Milk Foods and Stassens group, Daily Lanka (Pvt) Limited, subsidiary of New Zealand Milk Products; which is a member of the Anchor group and the Tropifruit which produces UHT milk under the brand name " Rich Life ". The total processing capacity owned by private sector is about 450,000 l/p/day, but utilise only about 30-40% of it. Kiriya/MILCO has a total capacity of 220,000 l/p/day and uses some 50% of it. Also there are several large scale operations in importation and packaging of milk powder. The bulk of this milk powder is imported and repacked by Lanka Milk Foods Limited and the New Zealand Milk Products TMOL (Pvt) Limited. In addition, Maliban Milk Products Private Limited, Danish Dairy Products Lanka Private Limited, Millers Limited, Delmage Forthy and Company Limited, Dutch Dairy Products Private Limited is also actively engaged in importation and packaging of dried milk powder. Theoretically, concentrate cattle feed also forms an important input for milk production, but in the present context the use of concentrates in milk production in Sri Lanka is very negligible. Although there are several large scale feed mills manufacturing livestock feed in Sri Lanka, the percentage of cattle feed produce by them is less than 1% of their total feed out put.
Policies and strategies for dairy development The policy framework for dairy development is designed and implemented in accordance with the declared macro-economic policies of the government. Accordingly the major trust of the policy initiatives for dairy development are directed towards expanding the domestic dairy production for increased employment and incomes and towards increasing the self reliance in domestic milk sources. Facilitating the private sector activities in the production processing and provision of inputs for dairying and creating a competitive industry structure for all related activities for dairying are key concepts in the government planning process of dairy development. The promotion of the liquid milk consumption as against the heavy use of milk powders as at present among the local consumers is also a major concern in the present policy framework. The provision of public goods by the state and allowing the private sector to cater to the provision of private goods are also stated policy objectives of the present government. However, in the case of dairying there still exists many services which are strictly of the nature of private

Policies and institutions
Appraisal of the Sri Lanka Dairy Sector:Main Report 69
goods, but because of the current economics of dairying in Sri Lanka, the state is obliged to continue to provide such services to the dairy farmers. Encouraging farmer participation in the milk assembly and marketing; provision of inputs for dairying; providing effective extension delivery; educating the farmers on methods of reducing the cost of production of milk; reducing the age at calving and calving intervals; are regarded some of the important strategies among the many different development strategies adopted for dairy improvement in Sri Lanka. The present policies of the government on the various components of the dairy industry and suggestions for improvement of same based on the findings of the Rapid Appraisal of the Dairy Sector are produced below:
Animal feed The government policy on animal feed is to promote a competitive animal feed industry in the country. Towards this end the government has allowed free trading of animal feed ingredients except maize and by-products of animal origin for the manufacturer of livestock feed. Both the latter ingredients require an import permit from the Controller of Imports and Exports before any one places an order for such imports into the country. Imported feed ingredients comprise nearly 70 % of the raw materials for feed manufacture, since only a very few raw materials are available locally. Before 1991 only foreign investors registered with the Foreign Investment Advisory Committee of the Ministry of Finance were permitted to import their feed ingredients free of custom duties for the manufacture of livestock feed. However since October 1991 this anomaly in the feed industry structure is rectified, and all feed ingredients are exempted from custom duties. This action by the government therefore has brought a uniformity in taxation of the feed industry, and has made the policy on the importation of feed ingredients transparent to every importer. This latter move by the government has encouraged the competitiveness of the animal feed industry, and since then many new firms have started to manufacturer animal feed in the country. However in spite of the expansion of the animal feed milling industry in Sri Lanka, the use of concentrate feeds for dairy cattle production in the country has remained at a very negligible level. The principal reason attributed for this by the farmers in the study is the low profitability of dairying when concentrates are fed to their cattle. Although there is no duty on the import of animal feed ingredients to the country, there exists a 10% duty on the import of finished animal feeds. The intention of this policy is to develop a local feed industry with the possible advantage of providing a market for local feed ingredients such as coconut poonac, rice polish, shell powder etc. Furthermore, the manufacturer also will have to get a certificate to confirm that the finished feed has not used any animal sources from areas where BSE disease is reported.
GST on Animal Feeds The government in April 1998 introduced a new taxation called the Goods and Services Tax (GST) which is charged at 12.5% on the value addition on a manufacturing process or in providing some kind of a service. This new taxation appears to have serious implications on the use of concentrate feeds for dairying, because the cattle feed prices are now effectively increased by 12.5% . Before the GST was introduced the tax on cattle feed was only the business turn over tax (BTT) which was charged at 1% of the feed cost. The GST has now replaced the BTT, and although in many cases it has resulted in a reduction in sale prices of commodities, as the average rate of BTT for many consumer items was 18 or 20 %, the situation is different in the case of animal feeds. The new GST therefore is an added cost on the milk production amounting to nearly 12.5% of the feed costs.

Policies and institutions
Appraisal of the Sri Lanka Dairy Sector:Main Report 70
Normally in the value added taxation regimes, there is the possibility of obtaining a credit on the GST payable on the finished product, equivalent to the amount of GST paid on the inputs used by the manufacturing process. But unfortunately in the case of dairy farming the final product of the production process, that is milk is GST exempted and therefore the farmers do not have a mechanism to get relief of the GST they have already paid on the concentrates and other inputs used for milk production. One may argue that the small dairy farmers operate at very low production levels and hence their total turnover do not qualify them to register for GST calculations, and any benefit of input credit on final GST is only a theoretical concept. But the reality of the present policy of GST on feeds however is that it has resulted in raising the animal feed prices, and therefore the cost of production of domestic milk. The higher cost of production of milk also has another implication. The liquid milk and milk powder being both GST exempted, is applicable both for domestic milk as well as for imports. It is not difficult therefore to understand that the present cost advantage of imported milk and milk powders to local milk or milk powders have been increased as a result of the policy of GST on animal feed. Furthermore it should be noted that coconut poonac is GST exempted where as many other feed ingredients and cattle feed are subjected to GST. Poonac is only one of the many feed ingredients, and not a balanced cattle feed. The GST exemption on poonac therefore is not an incentive for promoting dairy development. However if the intention of the government in exempting poonac from GST is promotion of dairy development in the country, then the most desirable action would be to remove GST from animal feed. The governments concern to expand the tax base through the introduction of GST is understandable. However by the present policy of adding GST to cattle feed and exempting the final product milk from GST to benefit the consumer only shows the insensitivity of government policy on dairy production. It is therefore suggested that the government reviews its policy on GST on animal feeds so that the dairy farmers are given the advantage of such a policy, while at the same time without burdening the consumers of dairy products. Rectifying the GST on feed is likely to increase the use of concentrate feed for dairying, and hence will have a positive effect on the local milk production. This would also mean that there will be a surplus of milk which can be converted to products such as curd, yoghurt, ice cream, fresh cream etc. which are GST chargeable.
Pasture and fodder for dairying At present dairying in Sri Lanka is primarily dependent on pasture and fodder found on road sides tank bunds, ravines, and other common areas. Hardly any farmer practices the cultivation of pastures and fodder for purposes of dairying. There are many reasons for this farmer behaviour, and the lack of knowledge and skills about the possibilities of growing and using pastures and fodder is a major factor to reckon. The pasture development and extension is a function of the provincial DAPHs. However there is no strong institutional arrangement either at the provincial level or at the national level to spearhead a useful programme for promotion of pasture and fodder for dairy production. It is however interesting to note that the recently started livestock breeding project by the Ministry of Livestock Development and Estate Infrastructure with technical assistance from the National Dairy Development Board of India, has a major component of the project on the promotion of pasture and pasture utilisation. The present weakness of the institutional arrangement for pasture development may become a hindrance for the above project objectives, and it is therefore recommended that the necessary institutional changes at the central DAPH, and the provincial DAPH and the Livestock Breeding Project are put in place early, so that a meaningful remedy can be made to the present problems on the expansion of the pasture base for dairy production.

Policies and institutions
Appraisal of the Sri Lanka Dairy Sector:Main Report 71
Trade Policies The government of Sri Lanka has adopted the open market policy on the trading of dairy products. As such all dairy products are under open general license system, and the only requirement the importers of dairy products have to comply with are the standards set by the Sri Lanka Standards Institution. Full cream milk powder and the skim milk powder are the 2 important dairy products imported from out side sources, and which have an implication on the domestic dairy industry. Full cream milk powder is the main dairy product in the formal milk market of Sri Lanka, and skim milk powder is an important raw material for the production of items such as ice cream, yoghurt, reconstituted milk etc. Both these commodities therefore have a direct bearing on the market prices of domestic fresh milk which is a substitute for milk powder or as a raw material for the production of above mentioned other dairy products. Milk powder has a 10% duty rate, and a 4.5% national security levy. In addition the importers also incur a cost when opening letters of credit for such imports. This is the stamp duty on the letters of credit, and at present it is equivalent to 2.5% of the CIF value of the consignment for import. Although there some pressure to raise the custom duty on full cream milk powder and skim milk powder, the findings of the study do not tend to support a change of the present duty structure for these two commodities. Also the deteriorating rupee-dollar parity rates also has forced the milk powder packers to raise their prices accordingly. After the implementation of WTO agreements by the milk powder exporting countries on reduction commitments on dairy production, it is likely that the international prices of dairy commodities will increase in the international markets. The present effective rate of taxation of nearly 19% may therefore be sufficient to give the required protection level for the domestic dairy industry. It is understood that the government is planning to make it compulsory for the sellers of milk powders to print on the packaging of such products the date of manufacture of the powder, so that the import of very old stocks of milk powder at give- away prices from international markets are discouraged from entering the domestic market and influencing the domestic milk prices .
Promotion of private sector activities In line with the government policy of promoting free market for dairy processing and marketing, the government in the past has offered several concessions and fiscal incentives to the private sector to enter into dairy processing.

Policies and institutions
Appraisal of the Sri Lanka Dairy Sector:Main Report 72
Recommendations
Recommendations for production systems 1. Further research into and the promotion of improved fodder and feed technologies, given the
observed low utilisation of fodder resources and low demand for compound feed. Similarly, research should address the role of common property feed resources, including those in the estate sector, and identify ways of better management of those resources.
2. More focus of government breeding farm efforts should be on providing improved buffalo studs,
and not solely or even primarily on semen for buffalo AI. 3. Farmer-participatory research and extension for validation and promotion of appropriate
technologies should be expanded. This would identify means of raising productivity that are suitable for existing production systems and traditional practices.
4. Investigate quality of rice bran, and find ways of improving the availability and quality of
compounded feeds, which are currently little used in the dairy sector.
Recommendations for economics and markets 5. Promote liquid milk consumption through generic campaign aimed at consumers, but also by
encouraging market agents to better exploit currently un-tapped demand for liquid milk, as revealed in the consumer survey. Increased liquid milk consumption will have strong positive effects on opportunities for domestic milk production, given the clear comparative advantage domestic producers hold for supplying fresh milk demand.
6. Research is needed into informal and traditional milk and dairy markets to identify effective and
appropriate market mechanisms, technologies, avenues for formalisation and quality control, and to identify public health risks.
7. Because some areas are characterised by low milk production densities and long distance from
milk processing facilities, research is needed into alternative strategies for milk preservation, and to identify the target areas for their appropriate use
Recommendations for policies and institutions 8. Explore alternative systems for monitoring and updating national and regional livestock statistics. 9. Promote the alternative provision of livestock services, including through private and co-
operative institutions. Dairy co-operative development efforts should carefully consider all dairy farmer service needs, including animal health, AI, extension, credit, and inputs. Currently, not all services and inputs are adequately provided in all areas, and private dairy institutions and co-operatives could play an important role, as they do in other countries.
10. Rectify the issue of GST tax on compounded feeds, which currently imposes discriminatory
taxation on dairy producers.

Policies and institutions
Appraisal of the Sri Lanka Dairy Sector:Main Report 73
11. Maintain the status quo on tax and trade policies for imported dairy products. This position should be reviewed regularly, and revised if considered necessary to support domestic production under changing market conditions. Trade policies should be complemented by efforts to promote demand for fresh milk, which will favour domestic producers.
12. Strengthen institutional support for developing feed and fodder resources. With the continued
upgrading of the national herd, the constraint posed by feed and fodder resources will grow more severe. Co-ordinating central and provincial animal production and health departments to give priority attention to feeding and fodder extension may be one option.
13. Consider measures for those dairy processors using equipment obtained with Board of
Investment concessions, to compel them to collect more fresh milk and reduce dependence on imported dairy products.
14. DAPH should promote closer linkages between researchers, including VRI and universities, with
VS staff, farmer organisations and NGO’s to improve participatory research and extension efforts in support of dairy development. Such participatory activities will better provide appropriate technologies and strategies, and their dissemination for dairy producers.

References
Appraisal of the Sri Lanka Dairy Sector:Main Report 74
References Abeygunawardena, H., Rathnayake, D., Jayathilake, W. MA.P. 1997. Characteristics of Cattle Farming Systems in Sri Lanka. J. of Nat. Sci. Coun. of Sri Lanka 25(1): 25 – 38. Abdulai, A., D. K. Jain, and A.K. Sharma. 1996. Household Food Demand Analysis in India. Forthcoming, Journal of Agricultural Economics.
Agricultural Statistics of Sri Lanka. 1995.Department of Census and Statistics, Ministry of Finance and Planning, Sri Lanka. Anon 1997. Cow Boys in Milk Mess, Sunday Times, 2nd November. Asian Development Bank, Ministry of Livestock Development and Rural Industries. 1996. Sri Lanka Second Livestock Development Project, Final Report, Sri Lanka. Birner, R. 1995. Cattle and Buffalo Farming Systems in the Dry Zone of Hambantota District. Grass Roots 4:2- 8.
Bogahawatte C. 1991. Changes in farm gate price of milk on production and consumption of milk in Sri Lanka. Sri Lankan J. of Agricultural Sci., 28 : 34 - 42 Bogahawatte, C. 1994. Cost of Dairy Production of Agroecological Zones in Sri Lanka: Implications for Milk Pricing Policy, Consultancy Report, Ministry of Livestock Production and Rural Industries, November, Sri Lanka. Central Bank of Sri Lanka. 1986-1987. Consumer Finance and Socio Economic Survey, Sri Lanka. Central Bank of Sri Lanka. 1996. Annual Report. Coconut Development Authority. 1990-92. Annual Report, Sri Lanka. Dairy Development II Project.. 1986. Revised Briefing Paper, Farming Sys., Dairy Development Foundation, Sri Lanka: pp. 1 – 15. Dairy Industry in Sri Lanka. 1997. Status, Limitations and Suggestions for Revival. Reported by Presidential Sub Committee on Animal Production and Health Sector, University of Peradeniya: pp 1 – 32. Dept of Animal Production and Health. 1990-93. Annual Reports, Sri Lanka. Dept of Census and Statistics Census. 1982. General Report, Sri Lanka. Dept of Census and Statistics Census. 1975-1994. Annual Reports, Sri Lanka. Dept Import and Export Control. 1980-92. Annual Reports, Sri Lanka. de Jong, R. 1996. Dairy Stock Development and Milk Production with Small Holders. Doctoral Thesis, Wageningen Agricultural University, The Netherlands, pp : 111 - 190. de Moor. 1989. The Role of Women in Dairy Husbandry in the Project area of NLDB/SHDDP, SHDDP, Kandy. In Livestock Sector Policy Review, Draft Final Report, Asian Development Bank and the Ministry of Livestock Development and Rural Industries.

References
Appraisal of the Sri Lanka Dairy Sector:Main Report 75
Economic and Social Statistics of Sri Lanka. 1996. Central Bank of Sri Lanka. Economic Review. 1996. Peoples Bank of Sri Lanka: 22(6 & 7), 2 – 24. FAO. 1995. Short Term Trade Outlook of Milk and Milk Products. FAO. 1990-95. Commodity Trade Bulletins. Food Balance Sheet. 1991 – 1995. Dept. Census and Statistics, Ministry of Finance and Planning: p - 11. Herath, HMSP. 1998. "Women In Extension and Development In Livestock Farming And Veterinary Services in Sri Lanka", (pp 18-21), Scientific Proceedings, Volume-I (Invited and Short Papers), Second Pan Commonwealth Veterinary Conference on Animal Health and Production In Rural Areas: The Essential Role of Women At All Levels, 22-27th February, 1998, Bangalore, India. Leegwater, P.H., G Zemmelink, S. E Ranawana, and M.N.M. Ibrahim. 1999. Socio-economic aspects of smallholder dairy farming in the mid-country forest garden areas of Sri Lanka, IAC, Wageningen. Livestock Sector Policy Review. 1992. Draft Final Report, Asian Development Bank and Ministry of Livestock Development and Rural Industries. Mahaweli Authority of Sri Lanka. 1995. Annual Report Mendis, S.K. Women in the Dairy Industry in Sri Lanka. Center for Women's Research, Colombo. In Livestock Sector Policy Review, Draft Final Report, Asian Development Bank and the Ministry of Livestock Development and Rural Industries. Milk Industries of Lanka Co Ltd. 1984-94. Annual Reports, Sri Lanka. Ministry of Livestock Development & Milk Development. 1975-1992. Annual Report, Sri Lanka. National Livestock Development Board. 1985-92. Annual Reports, Sri Lanka. Progress of Activities and Future Development Plans. 1997. Ministry of Livestock Development and Estate Infra Structure: 1 - 14. Rajaguru, A.S.B. 1986. Livestock Development Policy Plan for Sri Lanka. Report of the Society for Researchers on Native Livestock 11: 37 - 64. Sri Lanka Customs. 1980-92. Annual Reports, Sri Lanka. Sri Lanka Livestock Statistics. 1986/87. Ministry of Rural Industries Development, Colombo. Sri Lanka Livestock Statistics. 1991/92 Department of Census and Statistics, Colombo Sri Lanka Second Livestock Development Project. 1995. Asian Development Bank and Ministry of Livestock Development and Rural Industries, Colombo. Sri Lanka Socio Economic Data. 1998. Statistics Department, Central Bank of Sri Lanka, Colombo.
Sri Lanka Veterinary Association. 1995. Strategies for Revitalizing the Dairy Industry in Sri Lanka,: pp 1 - 48. Wimalasuriya, R.K. 1992. A Baseline Survey of the Rainfed Farming Systems in the Dry Zone of Sri Lanka with Special Emphasis on Ruminant Livestock and Chena Cultivation. Final Report of a

References
Appraisal of the Sri Lanka Dairy Sector:Main Report 76
Collaborative Research Project Between the VRI and Agriculture Research Station, Maha Illuppallama Undertaken in 1991. World Bank. Sri Lanka Poverty Assessment, South Asia Region, World Bank.

Appendices
Appraisal of the Sri Lanka Dairy Sector:Main Report 77
Appendices
Appendix 1: Terms of Reference The terms of reference (TOR) for each research team are as follows: TOR for Production Systems Analysis Team
1) Identify the current principal milk sheds and their major consumption centres, and the areas with potential as milk sheds to serve milk deficit areas now and in the next 20 years.
2) For each milk shed, document in as quantitative terms as possible, the current production systems (livestock species and breeds; herd/flock sizes and structures; milking and calf management; breeding practises; feeding resources and systems; disease risks and health management practises); and, their output and input market linkages (including quantities of milk consumed by progeny and by the producer household, and how much is marketed in what form), and cultural/historical determinants of dairy practices, including past development projects. Put these descriptions into the context of the farm and land use systems of the milk shed.
3) For each major production system in each milk shed, identify the current major constraints and opportunities, and those expected in short, mid and long term, with focus on market-oriented production.
4) Recommend specific actions/interventions to address the identified constraints, recognising existing resources, and aimed at meeting the shortfall in domestic dairy production.
TOR for Economic and Market Analysis Team
1. Identify the physical and geographical distribution of dairy production, processing, markets and consumption. This includes quantification of flows through alternative market channels and illustrated by diagrams of quantities and percentages for the national market and major milk shed areas.
2. Assess the historical trends in output supply and demand, and project the changes in demand over short, mid, and long term.
3. Assess issues related to input supply and demand patterns, including for heifers and feeds.
4. Measure the economic viability of all output market components of the sector, and quantify market margins at all levels. Estimate costs of production in the main production systems.
5. Quantify the effects of macro-economic and regional/world market factors on competitiveness of domestic dairy production and processing.
6. Identify the major economic and market constraints to substituting domestic dairy products for imports.
7. Recommend specific actions/interventions to address the identified constraints in the short, mid, and long term, with focus on improving the competitiveness of domestic production.
TOR for Policy and Institutional Analysis Team
1. Describe the socio-economic and cultural significance of livestock, with particular reference to cattle, buffalo and any other milk-producing species.
2. Describe the evolution of dairy development nationally, including: changes in stated and effective public policy towards dairy production and marketing, and consumption, central and local government, donor and NGO activities in the dairy sector, and the evolution of institutions in the dairy sector dealing with policy-making and investment, extension, training/education, disease

Appendices
Appraisal of the Sri Lanka Dairy Sector:Main Report 78
control and animal health, reproductive services, input supply and feed, processing and marketing, safety and quality control legislation, and credit.
3. Describe the current and planned policy interventions, institutional re-organisation and donor activities.
4. Assess the impact that dairy policies at the central and provincial levels have had on smallholder dairy development, especially on greater involvement by poorer households.
5. Evaluate and review the effectiveness of dairy policy implementation. Identify constraints to implementation, with attention to inter-ministerial and inter-institutional co-ordination of responsibilities.
6. Recommend specific actions/interventions to address the identified constraints in the short, mid, and long term, with a focus on improving implementation of policies to meet recognised goals.

Appendices
Appraisal of the Sri Lanka Dairy Sector:Main Report 79

Appendices
Appraisal of the Sri Lanka Dairy Sector:Main Report 80
Appendix 2: Stakeholder Meeting Participants
First stakeholder meeting – Peradeniya, Dec. 17, 1997 Name Designation/Organisation P. Ramanujam Secretary, MLD&EI N.A. Abekoon Provincial Director-Livestock, North Central Province S. Abeyratne Advisor, MLD&EI M.C.L. de Alwis Former head, VRI S.K.R. Amarasekara Director/ Development, LD&EI P. M. Amarasoma General Manager (Milk Procurement) –KIRIYA R.M. Ariyadasa Vet. Surgeon / Badulla S.L.A. Daniel Director (Planning) MLD&EI A.M.U. Disanayake Deputy Director, Dept. of Census & Statistic J. Dodangoda Statistician, Dept. of Census & Statistic B.K. Ganguly NDDB I. Gunawardana Vet. Surgeon/ Welisara, Ragama H.M.P. Herath Milk Procurement Manager/ Dairy Lanka M.N.M. Ibrahim Dept. of Animal Science, University of Peradeniya T. Jogarathnam Dept of Agric. Economics, University of Peradeniya F. Kahrs Team Leader, GTZ-SILEP B.S. Khanna KIRIYA A. O. Kodituwakku DD (Resource Management), DAPH D.P.Z. Liyanage Manager, Agriculture Services, Nestle Lanka E. Madhaven Advisor, National Dairy Development Board, India W. Melchisedech AGM, NLDB H.V.R.G. Navaratne Manager (Development), KIRIYA K. Pillai DD(Animal Husbandry), MLD&EI I.W. Premarathna AD(Animal Health), MLD&EI S. Premaratne Dept. of Animal Science, University of Peradeniya A.S.B. Rajaguru Dept. of Animal Science, University of Peradeniya S.S.E. Ranawana Director, DAPH J.A.De S. Siriwardana Project Coordinator, SAREC Buffalo Project P. Sritharan Provincial Director-Livestock, Central Province S.J. Staal Dairy Research Team, ILRI M. Thangaraja Provincial Director-Livestock, North Eastern Province W. Thorpe Dairy Research Team Leader, ILRI P.D. Wanasundara Provincial Director–Livestock, Sabaragamuwa S.H.G. Wickramaratne Research Officer, VRI

Appendices
Appraisal of the Sri Lanka Dairy Sector:Main Report 81
Final stakeholder meeting - Peradeniya, Oct. 5, 1998 Name Designation/Organisation P. Ramanujam Secretary. MLD&EI H. Abegunawardana Dept of Clinical Vet. Studies, University of Peradeniya M. Amarasoma General Manager (Milk Procurement) –KIRIYA S. Balachandran Addl. Dir, DAPH, C. Bogahawatte Dept of Agric Economic, Univ. of Peradeniya S.L.A. Daniel Director (Planning) MLD&EI L.C.A. Dias Nestle Lanka Ltd. B.K. Ganguly NDDB B. Gunawardene Lanka Daries (PVT) Ltd M.P. Herath Newdale Dairies (PVT) Ltd. T. Jayatilaka Livestock Advisor, Ag-Ent J. Joseph Kothmale Dairies, Kothmale F.Kahrs GTZ-SILEP, Badulla B.S. Khanna KIRIYA A.O. Kodituwakku DD (Resource Management), DAPH N. Kodituwakku DD (Animal Health), DAPH E. Madhavan Breeding project, Polonnaruwa Farm N. Melchisedech NLDB H.V.R.G. Navaratne Manager (Development), KIRIYA W. Perera CTMU, Kuliyapitiya K. Pillai Director, Breeding Project, Polonnaruwa Farm I.W. Premarathne AD(Animal Health), MLD&EI S. Premaratne Dept. of Animal Science, Univ. Of Peradeniya J. Punjrath MD, KIRIYA S.S.E. Ranawana Director, DAPH A. Shakthivale Addl. Sec., MLD&EI L. Somapala DD (Animal Breeding), DAPH P. Sritharan Provincial Director-Livestock, Central Province S.J. Staal Dairy Research Team, ILRI S. Subasinghe D.D.M.P.P.A M. Thangaraja Provincial Director-Livestock, North Eastern Province R. Wickramasinghe DD, VRI

Appendices
Appraisal of the Sri Lanka Dairy Sector:Main Report 82
Appendix 3: Production Systems
The health status of cattle and buffalo General The health status of cattle and buffaloes in Sri Lanka is largely dependent on the breeds and husbandry practices which in turn are closely related to the different climatic and topographical features, and agricultural practices. From the standpoint of the prevalence and distribution of animal diseases, four agroclimatic zones can be recognised. These are: the hill and mid country; coconut triangle; low country wet zone; and, the lowland dry zone. Their topographical and climatical features, types of animals and husbandry practices were given in the Introduction, Table 2, and their approximate populations of cattle and buffalo in Table 3. Animal Diseases Status Some important diseases of economic importance are discussed on a zonal basis. The Hill and Mid Country: In this region, the cattle are mainly of exotic breeds and their crosses. The buffalo population in this region is negligible and the few numbers will be confined to the border areas of the mid country. This zone is composed of the Nuwera Eliya and Kandy districts and parts of Baddulla and Matala districts. The main diseases that occur in this region causing economic looses are Gastro-intestinal parasitism, Tick borue, Blood parasites, Mastitis and Metabolic diseases. These diseases are actually related to features characteristic of the region. These are
1. Type of breed 2. Intensive management practices 3. High milk yield
Gastro-intestinal parasitism The high rainfall in this region and the wet conditions prevailing during most of the year provides ideal conditions for intestinal helminth parasites. A perusal of the records maintained in the veterinary dispensaries in this region will show that gastro-intestinal parasitism is the condition for which the largest number of animals are presented for treatment. The worms that have been identified are the stomach worms Necistocirrus digitatus, Haemonchus contortus and H.similis and the intestinal worms Toxocara vitulorum, Trichostrougylus axei, Cooperia pectinata, Bunostomum phlebotomum, Oesaphagustomum radiatum and Trichuris spp. Gastro intestinal parasitism leads to poor growth in calves, delayed maturity and in general leads to the production of a low-productive animal. No surveys have been carried out to quantify the economic losses, and indeed it is a difficult task. Tick-borne Blood Parasitic Diseases Two important blood parasitic diseases are present in this region. These are Babesiosis and Anaplasmosis. Babesiosis is caused by Babesia argentius or B.bigemina and is a more acute disease than anaplasmosis, which takes a more chronic form. Only the Bos taurus type of cattle in the hill and mid country is susceptible to these diseases. Generally around 2% to 10% of all reports of diseases reaching veterinary dispensaries in the regional cases of blood parasitism. If untreated, Babesiosis is fatal. Mastitis Mastitis is common among the high yielding temperate animals and their crosses in the hill and mid country. Its incidence was particularly high in the large, intensively managed farms. One of the earliest surveys carried out in 1971 indicated that an average of two quarters was affected in 60% of the dairy cows examined. Except in herds where strict control measures have been adopted, the situation has not improved to a significant degree. Studies have also shown that the bacteria involved are much the same as in other countries, streptococci being the dominant pathogen, with staphylococci ranking record. Escherichis coli and Corynebacterium pyogenus also accounted for a small percentage of cases. A survey carried

Appendices
Appraisal of the Sri Lanka Dairy Sector:Main Report 83
out in the late 1980’s covering six mid and hill country veterinary ranges indicated that mastitis ranked second only to gastrointestinal parasitism in the number of cases reported to veterinary dispensaries and it accounted for 11-20% of all bovine cases presented. Metabolic Disorders The common metabolic disorders presented in the region are milk fever and ketosis. They occur more commonly in high yielding animals. It is reported that the number of reports of metabolic disorders is in the range of 5% of all bovine cases. Occasionally reports of conditions such as hypomagnesaemic tetany have also been made. Other Diseases These are other diseases, which are presented in the country but their occurrence in this region is exceptional. Contagious diseases such as foot and mouth disease and haemorrhagic septicaemia may break out occasionally. This may occur mainly in the bordering areas, and is usually associated with movements of animals from endemic areas into the region, particularly draught animals during the cultivation season, or to abattoirs for slaughter. Sporadic outbreaks of blackquarter may also occur in the border areas of Uva and central provinces. Brucellosis occurs only in a very small percentage of cattle in this region, and in a few infected pockets only. By and large this zone may be considered free of brucellosis. A disease to be considered in future animal health programs is leptospirosis, which has been found to occur in this region, but for which no systematic survey has been done in cattle. A study that serves as a significant indicator of the magnitude of the problem, is an islandwide survey of buffaloes. Nearly 60% of buffaloes in the Kandy district and over 70% in the Baddula district were serologically positive for leptospirosis on a random sampling and testing program. Nuwara Eliya was not covered in this survey. Disease of young calves In the hill and mid country where cattle farming is intensive, mortality in young calves is high. A number of studies have been made from time to time and depending on the particular situation mortality rates from 5% to 20% in the first year of life has been recorded. Some conditions that have been recognised as causes of mortality are navel ill and joint ill in very young calves, parasitic gastro-enteritis (caused by helminthes as well as coccidia), bacterial (and probably viral) diarrhoea and respiratory infections. The most vulnerable age appears to be the post-weaning period, i.e. around 3-6 months of age. The Coconut Triangle and the Low Country Wet zone From a disease point of view, the status of these two regions is similar. Some important diseases that merit the attention of the animal health authorities are discussed below 1. The Contagious Diseases Haemorrhagic septicaemia (HS) In most parts of these two regions sporadic outbreaks of HS have to be expected particularly in the areas with a high buffalo population and bordering the dry zone where the disease is endemic. Losses in these outbreaks can be high, particularly in herds which are not vaccinated on a routine prophylactic basis. The outbreaks are only sporadic, but a recent study in the Western province indicated the mortality may go up to even 50% in affected herds. Only the Asian stereotype B:2 is present in Sri Lanka. Foot and mouth disease As in the case of HS, sporadic outbreaks may occur, which are usually associated with the movement of animals into the region from endemic areas. Most outbreaks appear to originate from the Eastern province and spread to this region through the North Central province. In an early study it was revealed that during the period of 10 years ending 1972, its incidence was 199 cases per 1000 head for the Eastern province with Sabaragamuwa ranking second with a low figure of 14, but this above information reveals the focus of infection in the island. Sri Lanka is fortunate to have only one serotype of FMD virus, type 0. Although type C was introduced in 1969 through cattle imported from India, it was last isolated in 1975, and has disappeared thereafter. Losses due to FMD are not obvious as with HS, since case fatality is low in FMD. Losses are lowly in young animals and improved crossbred animals where a more severe syndrome is observed. Indigenous and zebu types only develop a mild syndrome. Loses are of an insidious nature and will be in the form of

Appendices
Appraisal of the Sri Lanka Dairy Sector:Main Report 84
reduction in milk production and loss of draught power. With the development of the superior crossbreeds into these two regions, looses due to FMD will be expected. Black Quarter Black quarter is an infectious disease caused by a bacterium Clostridium chauveoi. It occurs sporadically in certain pockets of infection particularly in the North Western Province. In terms of losses per 1000 head, its incidence is very low but when it does occur, case fatality is nearly 100%. In a recent study carried out in the early 1990’s, in affected herds, mortality of 13.7% has been recorded for cattle and 13.3% for buffaloes. Thus no species susceptibility is evident. Significant breed differences, however, do occur, the mortality in temperate breeds being 19% as against 10.5% and 8.2% for indigenous and zebu animals, i.e. nearly double in temperate breeds. On an age basis, among local and zebu types the most vulnerable age group are the 6-month to 2 years older with a mortality of 29% among temperate breeds whilst 36% mortality has been recorded in this age group, it is highest (48%), in the 2-4 year group. Gastrointestinal Parasites The same intestinal nematode parasites that are present in the hill and mid country are present in this region too. The magnitude of the worm burden, and the losses therefrom depend on a variety of factors. In the drier areas of the coconut triangle – intermediate zone, the worm burdens will be less severe than in the wetter parts of this region. Secondly the stocking rate/ intensity of management will also influence the level of infection. In highly intensive management systems, the burden is more severe compared with the open free-range system of management. Among buffaloes, of which around 30% of the total population are scattered in this region, special mention must be made of Toxocara vitulorum infestation, which is one of the main causes of death among very young calves. With this parasite encysted larve are mobilized during the latter part of pregnancy, and prenatal infection occurs in calves. The infection becomes patent when the calves are 3-6 weeks of age, and worm egg counts reach a peak at 4-6 weeks, and high mortality results. Intestinal Coccidiosis is also not uncommon in intensively managed buffalo farms. Nine species of Eimeria has been identified in Sri Lanka. It is another cause of mortality in young calves. Other Helminth Parasites The liver fluke Explanatum (Gigantocotyle) explanatum is also more common in buffaloes than in cattle. An islandwide survey covering over 8000 animals, 34.2% buffaloes and 0.21% cattle were found to be affected. The infection rate use slightly higher in the drier areas. The degree of improvement of liver functions and other pathophysiological affects and the economic losses resulting therefore has not been estimated. Schistosoma nasale that causes nasal schistosomicasis is also a parasite which deserves mention. Abattoir studies have shown that on an average around 6% of cattle and 24% of buffaloes are infected. In certain location, the infection rate may be as high as 90%. The intermediate host has been identified as Indoplaanobis exutus, a snail commonly found in paddy fields. No estimates of economic losses are available. Two important blood parasites prevalent among cattle and buffaloes in this region, is theileria and trypanosoma. They are transmitted by ticks and biting flies, respectively, belonging to species which are widely present. Except in special circumstances, in indigenous and zebu animals they do not cause clinical disease. Related growth leading to delayed maturity, lowered milk production etc, will result in economic losses, which have not been quantitatively estimated. Losses could be heavier in improved breeds introduced into this region. Mastitis In intensive dairy farming system in this region too, mastitis is a problem to be taken notice of. The pathogens present are the same as mentioned under hill and mid country, and indicate island wide has been observed that the infection rate is lower among buffaloes than cattle, indicating the relative resistance of buffaloes to udder infection. Buffaloes are particularly resistant to staphylococcal mastitis. With the development of the dairy industry and the introduction of improved, high yielding animals much as the temperate crosses, the problem of mastitis is expected to be aggravated. Calf Mortality The causes are the same as in the hill and mid country. The magnitude of the problem will be greater in more intensive rearing and in the wetter regions as compared with the drier parts of this region and a more extension systems of calf rearing.

Appendices
Appraisal of the Sri Lanka Dairy Sector:Main Report 85
Brucellosis Surveys carried out from time to time in this region has shown that 1% to 4% of herds are infected with Brucellosis. The prevalence appears to be somewhat higher in parts of the North Western and Southern provinces, and lower in the Western and Sabaragamuwa provinces. On an individual animal basis, the reactor rate is less than 1% of the animals. Higher infection rates have been found in state sector farms, where management practices are highly intensive. Two biotypes of Brucella abortus, biotypes 1 and 3 have been identified. Leptospirosis has been reported in both cattle and buffalo have been reported in the country. A zero epidemiological buffaloes carried out in the early 1990’s have indicated that in this region, the number of seropositive ranged from approx. 12% in Kegalle, 25% in Kaluthara, 26% in Galle, 37% in Kurunegala, 45% in Rathnapura and 59% in Colombo. The disease, therefore, appears to be widespread. The actual losses caused by this disease and its economic losses have not been estimated. The Dry Zone The special features of the dry zone are its relatively low (yet significant) rainfall of 1000-1750 mm/year, which is concentrated during a few months of the year, with relatively long day periods. It has around 65% of the island cattle population and 70% of buffalo population. All animals are of indigenous types and pure Indian breeds or their crosses. Most animals graze freely in grassland, fallow paddy fields and scrub jungle. Some are paddocked at night, other large numbers are herded together for the night. A few dairy farmers maintain temperate breeds or crosses, under intensive, stall-fed conditions, but this is exceptional. The disease patterns are related to the above conditions. Contagious Diseases Haemorrhagic septicaemia, foot and mouth disease and black quarter are endemic diseases. Rinderpest, which was re-introduced into the island in 1987 through goats imported from India, spread to the dry zone, mainly the North Central province, from the Northern and Eastern provinces where it lingered for a while for the rest few years, no outbreaks have been reported. Haemorrhagic Septicaemia This is a disease for which prevalence is highest in the dry zone. It occurs during most of the year, but outbreaks tend to spread more during the wet season thereby resulting in an apparent seasonal incidence. Morbidity is variable depending on a variety of factors. Case fatality is 100%, unless treatment is carried out in the very early stages. The most susceptible age group is the 6m to 2 yr range. Buffaloes are more susceptible than cattle. In the late 1970’s a survey in six locations in the dry zone indicated that around 48% buffalo herds and 38% cattle herds experience outbreaks of the diseases. It was also shown that the average mortality in buffalo herds where outbreak occurred was 24.2%, whenever for cattle herds it was 17.8%. During the 1980’s a strategically formulated vaccination program was carried out using an improved vaccine. A similar survey in the early 1990’s indicated that the herd infection rate has dropped to 48% to 14.7% for buffaloes and from 38% to 17.5% for cattle. Similarly the mean mortality in outbreaks had dropped from 24.2% to 3.4% in buffaloes and from 17.8% to 4.0% in cattle. Black Quarter This disease occurs only in certain pockets of infection. Sites of outbreaks have been identified in the Anuradhapura and Moneragala and in the dry zone areas of the Puttlam and Matala districts. The total losses in terms of death per 1000 head may appear insignificant, but the mean mortality is around 13-14% in affected herds. Mortality however may be higher and reach even 50% in vulnerable age groups in herds of temperate breeds. Vulnerable, high producing animals introduced to this region are exposed to a potential risk. Gastro-intestinal Parasitism The gastrointestinal parasites in this region are very much the same as in the coconut triangle. The more extensive systems of management presently practised reduce the magnitude of the problem. If intensification of management results from the development of the dairy industry in this region in the background of diminishing land resources, and if improved breeds are introduced, the problem will escalate.
Appendices
Appraisal of the Sri Lanka Dairy Sector:Main Report 86
Other helminth parasites much as the liver fluke Explcuatum (Gigantocotyle) explauatum and Schistosoma nasale, which are more common in buffaloes than cattle, enjoy a higher prevalence in the dry zone. The blood parasite theileria sp. and trypanosoma sp. are also more common in the dry zone. High incidence may be observed in specific foci. The economic losses due to any of these parasites diseases have not been estimated, but losses may be significant and will undoubtedly increase with increasing numbers of superior quality animals being introduced into the region. Mastitis In indigenous and zebu animals that dominate this region presently, mastitis is not a major problem, although if yet causes losses and therefore cannot be overlooked. Improved breeds and intensification of management will no doubt increase its economic losses. Brucellosis The highest prevalence of Brucellosis is in the dry zone. In the intensively managed state farms, as high as 25-30% seropositive has been recovered. Surveys carried out at abattoirs receiving animals mainly from the dry zone and random resting of private owned animals have shown an overall reactor rate of around 6%. These surveys were carried out in the 1970’s. If more sensitive testes, presently available, are applied the rate of detection may be higher. Brucellosis causes economic losses through loss of milk, loss of calves and infertility. From available information, it has been estimated recently that the islandwide loss due to brucellosis is Rs 141 million, which is equivalent to 2.4% of the contribution of the livestock sector to the GDP in 1994. Leptospirosis This disease too occurs in this region also. The sero-epidemiological survey in buffalo indicated 59% positive at Pollonnaruwa and 41% at Anuradhapura. In this seroepidemilogical survey carried out in buffaloes using a panel of 10 contiguous against serovars commonly present in humans in Sri Lanka, the Serovars detected in order user serovar weerasingha (Serogroup Autmnalis) 30.2%, serovar pomona (Serogroup Pomona) 26.5%, serovar harjo (serogroup Sejroe) 24% and serovar ceylonica (serogroup Javanica) 0.79%. It must be noted that both brucellosis and leptospirosis are transmissible to humans. The transmission of brucellosis, however, is rear since few persons in Sri Lanka consume unboiled/unprocessed milk and the risk group is mainly the abattoir workers and veterinarians. On account of its high prevalence in buffaloes and presumably to the same degree in cattle, from animals used for draught purposes, transmissibility to paddy field workers is a risk of much greater potential. Calf Mortality Under extensive systems of management, presently seen in the dry zone, diseases much as navel ill and joint ill that result from poor hygiene in calving pens, diarrhea and respiratory infections are of lesser significance. Any changes to the present management system should be done with a full knowledge of the consequences of increasing the risk of deaths from these conditions. The same is true of parasitic gastroenteritis in calves, including the specific cases of T. vitulorum in buffalo calves. The Jaffna Peninsula The special case of Jaffna is worthy of mention on account of its peculiar features. Jaffna has a typical dry zone climate. Yet, it harbours a sizeable proportion of temperate animals and their crosses under intensive management conditions. Thus, the incidence of diseases such as the tick-borne haemoparasites, metabolic disorders, mastitis etc., which are of significance in the hill and mid-country, should also be given consideration in addition to the diseases characteristic of the dry zone. Prevention and Control of Bovine Diseases Management and Nutrition A good management and nutrition regime is an absolute pre-requisite to any animal health program. Its cannot be compensated by any other means. Proper hygiene at calving, adequate colostrum feeding, appropriate suckling management including weaning, the use of good quality calf starter, suitable housing etc. are all practices of utmost importance, that give a good start to an animal for a healthy, productive life

Appendices
Appraisal of the Sri Lanka Dairy Sector:Main Report 87
span. There are many lessons to be learnt from the Heifer Calf Rearing Scheme implemented by the Department of Animal Production and Health, when a subsidized heifer calf management and feeding program has been introduced. Routine Deworming Programs Anthelmintic drugs (deworming drugs) are some of the most widely abused or overused phamacentical preparations. The extent of worm burden depends on the region – its climate, intensity of stocking and management practices. A blanket recommendation is to worm all calves at 1 month, 3 months, 9 months and 18 months. This may be modified to meet specific situations. Rotational use of anthelmintic drugs is recommended and frequent monitoring of worm burden patterns and anthelmintic resistance, which can be undertaken by the Veterinary Research Institute in collaboration with the VRI is recommended. In the case of buffalo calves, in order to prevent patent T. Vitulorum infection from developing a single treatment at 14-16 days is recommended. Routine Vaccinations Against Contagious Diseases Haemorrhagic Septicaemia Routine prophylactic vaccination using the oil adjuvant vaccine (OAV) is recommended in the dry zone and the low country wet zone and coconut triangle. In animals kept under confident for whole or past of the day, primary vaccination at4-6 months, booster vaccination 6 months later, and annual revaccination thereafter is recommended. In free range animals, one mass vaccination of all animals over 4 months of age preferably during the months of May – August followed by vaccination of all calves over 4 months and up to one year, in January – February should be practised. In any region, including the hill and mid country where routine vaccination is not done, if an outbreak occurs immediate re-vaccination with OAV is recommended among the infected zone. If the outbreak is in a hitherto unvaccinated herd or villages, simultaneous vaccination with the alum-precipitated vaccine at a different site is recommended. Vaccination coverage of 70% or more should be attained. As a further control measures, immediate in-control should be checked daily for temperature, elevation, and treated with antibiotics. The vaccine is relatively cheap, the cost of production locally being around Rs 2/= (current price) and it has been estimated that the cost of delivering per dose of vaccine to an animal ranges between Rs 5/= to Rs 7/=. Foot and Mouth Disease Presently, the FMD vaccine is imported and may cost between Rs 20/= to Rs 30/= per dose. The vaccination schedule is to vaccinate at 4-6 months booster to be given 4-6 weeks later, and thereafter 6 monthly vaccination should be practised. One 6 monthly dose can be given simultaneously with the HS vaccine, in order to cut down the cost of delivery. It would suffice if the FMD vaccination is done only in the ranges boarding the foci of origin of outbreaks, located in the eastern province. This has to be coupled with strict control and / or monitoring of movement of animals. A vaccine strch should always be available for in-contact and ring vaccination in the event of an outbreak. Black Quarter Black Quarter vaccination need be done only in the identified infective pockets. The recommended schedule is to vaccinate every animal at 6 months, 1 year, 1.5 years and 2 years. Temperate breeds in endemic pockets may be vaccinated 6 monthly up to 4 years of age. The estimated requirement of vaccine is around 100,000 to 120,000 doses. The vaccine is locally produced and will cost around Rs 5/= to Rs 7/= per dose. Tick Fever Immunisation The Veterinary Research Institute organizes an immunisation program. The vaccine material is stored at the VRI. Only young animals of temperate breeds need to be immunized. Once the ‘ready to use’ vaccine is prepared, it has to be used within 3 days. The parasitology division of the VRI needs 3-4 weeks to prepare a batch of vaccine for use. Only calves of the Bos taurus type 4-5 months of age, and adults introduced from non-endemic areas need to be immunized once. Veterinarians should arrange a program of vaccination for a given area, and obtain stocks of vaccine accordingly. Control of Brucellosis

Appendices
Appraisal of the Sri Lanka Dairy Sector:Main Report 88
If the dairy industry is to be developed it is of utmost importance to control brucellosis with the ultimate objective of eradication. The strategies to be adopted are given below. 1. To classify regions into low and high incidence zones/herds. This has to be based on available
information and random sample testing where necessary. 2. In low incidence areas, adopt the ‘test and disposal’ policy
(i) In these areas 6 monthly testing should be done, and all positives slaughtered. Positives to be retained in holding points and slaughtered under veterinary supervision. Compression should be paid to owners. Carcass value can be recovered.
(ii) Brucellosis free herds should be established and certified. Criteria for ‘ Brucellosis Free Status’ should be laid down. Milk from such herds should be paid a higher price, as an incentive
1. ‘Test and Disposal’ should be adopted in all breeding status too. 2. The ‘test and disposal’ program should be operated on a provincial basis, starting with the province
with lowest incidence i.e. Central Province. The program should then radiate from their district by district.
3. In high incidence zone/herd, whole herd vaccination with SS19 vaccine should be practised. The status should be monitored closely. At a later stage, when the occurrence of new cases is prevented for a number of years, introduction of the test and disposal system may be considered.
Wide ranges of tests are now available. Facilities for the Milk Ring Test, Rose Bengal Plate Test and the Complement Fixation Test are available at the VRI. At the Faculty of Veterinary Medicine and Animal Science an ELISA test has been established recently. A systematic program, which will use all these resources, must be planned and executed by a central authority. Control of Mastitis In any dairy herd, control of mastitis is of utmost importance. A well-formulated program would consist of the following components: • Proper milking shed hygiene • Proper milking hygiene. This would include using of udders prior to milking with fresh, clean
preferably running water. • Periodical testing of milking herd by the California Mastitis Test or any other convenient test • Regular teat dipping. An economical teat dip has been developed at the VRI. • The prompt treatment of clinical mastitis and regular dry cow therapy in cows showing sub-clinical
mastitis. For this purpose a considerably cheap method of treatment has been developed at the VRI which involve use of parenteral antibiotic preparations mixed into an emulsion with a locally produced oil base for infusion though a syringe and test siphon.
The assistance of the VRI and the VIC network could be obtained in formulating an executing such a program. Disease Surveillance A proper animal disease surveillance program should be established. This would consist of the following components: 1. Setting up a computer network between the Regional VIC’s and other provincial units and a Central
Surveillance Unit, in order to strengthen and make more effective the animal disease reporting system.
2. Continuous monitoring (including periodical sero-monitoring) of sentinel herds identified in strategic locations.
3. Minimizing the risk of entry of exotic disease by minimizing the import of live animals exercising grater control over choice of country of origin, health standards etc., when importing, and strengthening quarantine facilities

Appendices
Appraisal of the Sri Lanka Dairy Sector:Main Report 89
Conclusions In summary therefore, while many bovine diseases are prevalent, and some endemic, in the areas of current and potential dairy production, there are well-documented health management practises, both curative and prophylatic, for minimising the risk of infection from these diseases and the productivity losses associated with infection. Disease constraints to dairy productivity are therefore associated with the need to improve the delivery of veterinary services to dairy farmers and to improve the quality of those services, especially for preventive medicine. Clearly these are policy and institutional rather than technical issues. A recommended approach to the strengthening of veterinary services is to associate their delivery more directly with organisations (farmers’ groups; co-operatives; private milk processors; etc) collecting and marketing milk as a transitional stage to private sector delivery.

Appendices
Appraisal of the Sri Lanka Dairy Sector:Main Report 90
District milk production
Milk Density and Average Milk Production of Cattle and Buffaloes in Different Districts
Milk Density (Production/l/d/Km)
Milk Production (Animal/Day)
District
Cattle Buffalo Colombo 36.46 2.64 2.67 Gampaha 24.33 2.61 2.41 Kalutara 19.22 1.85 2.01 Galle 14.24 2.03 2.37 Matara 15.18 1.55 2.15 Hambantota 17.46 1.07 1.44 Moneragala 4.14 1.21 1.75 Badulla 18.10 3.07 2.48 Kandy 24.44 2.8 1.57 Mathale 13.83 3.79 1.58 Nuwara Eliya 65.86 6.68 1.82 Kegalle 8.98 2.52 2.33 Rathnapura 6.76 2.02 2.56 Kurunegala 14.99 2.05 2.09 Puttalam 12.58 1.60 .77 Trincomalee 17.38 1.39 2.11 Batticaloa 34.05 1.49 2.98 Ampara 13.15 1.47 1.98 Anuradhapura 9.46 1.28 1.47 Polonnaruwa 10.63 2.50 2.13 Jaffna 20.09 1.37 - Kilinochchi 2.45 0.95 1.92 Mulaithivu 2.98 0.99 1.41 Mannar 4.69 0.91 1.16 Vavuniya 8.53 1.28 2.00
Adopted from Department of Census and Statistics

Appendices
Appraisal of the Sri Lanka Dairy Sector:Main Report 91
Appendix 4: Economics and Markets
Sample design for the Household Survey
Population (‘000) District 1995 %
GNDiv %
Sample GND
% of estimated Households
Ampara 522 3 511 4 3 2 Anuradhapuram 763 5 694 5 4 4 Badulla 748 4 532 4 3 5 Batticola 452 3 334 3 2 2 Colombo 2095 13 558 4 3 11 Galle 996 6 896 7 5 6 Gampaha 1582 9 1177 9 7 11 Hambantota 544 3 576 4 3 3 Kandy 1306 8 1188 9 7 7 Kegalle 770 5 573 4 3 5 Kaluthura 979 6 762 6 4 6 Kurunegela 1499 9 1610 12 9 10 Matara 822 5 650 5 4 7 M'nrgl 374 2 319 2 2 1 Mathale 440 3 45 4 3 3 Nuwara Eliya 550 3 427 3 2 4 Polonnoruwa 340 2 290 2 2 2 Puttalam 636 4 548 4 3 4 Ratnapura 948 6 575 4 3 6 Trincomalee 331 2 230 2 1 2 Total 16697 100 12995 100 74 100

Appendices
Appraisal of the Sri Lanka Dairy Sector:Main Report 92
Producer and consumer milk prices in the formal dairy industry in Sri Lanka
Year
Producer Price (PP)
Consumer Price (CP)
Colombo CPI
1952=100
Real P (1990)
Real C (1990)
Powder Imports
(MT)('000 kg) 1970 0.6 1.0 138.2 4.7 7.1 1971 0.6 1.0 141.9 4.5 6.9 1972 0.6 1.0 150.9 4.3 6.5 9.83 1973 1.0 1.6 165.4 5.8 9.6 10.89 1974 1.2 1.8 185.8 6.4 9.6 9.80 1975 1.2 1.8 198.3 6.0 9.0 7.77 1976 1.2 1.8 200.7 5.9 8.8 9.51 1977 1.5 1.8 203.2 7.4 8.7 14.67 1978 1.6 2.5 227.8 7.2 10.9 24.75 1979 1.6 2.5 252.3 6.5 9.8 23.43 1980 1.8 3.5 318.2 5.7 11.2 20.83 1981 2.7 4.2 375.4 7.3 11.3 10.87 1982 2.7 4.2 416.1 6.6 10.2 10.94 1983 3.7 5.8 474.2 8.0 12.3 24.91 1984 4.0 7.5 553.1 7.3 13.7 16.98 1985 4.0 7.5 561.2 7.2 13.5 20.60 1986 4.0 7.5 606.0 6.6 12.5 25.63 1987 4.0 8.3 652.8 6.1 12.9 35.78 1988 4.8 9.2 744.1 6.5 12.5 40.13 1989 5.2 11.0 830.2 6.3 13.4 34.59 1990 6.0 12.5 1008.6 6.0 12.5 29.11 1991 6.5 12.7 1131.5 5.8 11.3 39.34 1992 6.5 14.6 1260.4 5.2 11.7 29.25 1993 8.9 15.1 1408.4 6.4 10.8 35.85 1994 10.4 18.5 1527.4 6.9 12.2 44.91 1995 10.4 18.5 1644.6 6.4 11.3 47.12 1996 12.6 18.5 1906.1 6.7 9.8 42.76 1997 12.6 20.1 2106.4 6.0 9.6 Sources: a) Sri Lanka Livestock Statistics: 1991/92, Ministry of Agri Dev & Research, Sri Lanka, Dec '92. b) MB/Milco Purchase Price (Rs/Lt.), calculated for 4.3% fat & 8.4% SNF, monthly data
weighted to obtain annual data c) Milco Retail Price for Pasteurised Milk (Rs/Lt.), monthly data weighted to obtain annual data d) Statistical Abstract, Sri Lanka, 1996: Dept of Census & Statistics, Ministry of Finance &
Planning e) Annual average Colombo Consumers' Price Index:1952=100, (1997 data is for July'97) f) Import figures are from Agricultural Statistics, 1995 (and MOLD&EI updates).

Appendices
Appraisal of the Sri Lanka Dairy Sector:Main Report 93
Total Imports and Exports of Milk and Milk Products (‘000 US$)
Country Imports 1983 1993
Exports 1983 1993
Difference 1983 1993
Bangladesh India Nepal Pakistan Sri Lanka
37664 8825 13790 31150 3500 5125 44579 31481 37513 48524
- - 620 110 2100 312 - 149 46 540
37664 8825 13170 30050 1400 4813 44579 31332 37467 47984
Trends in milk collection and producer prices of milk
Milk collection Producer price Fresh milk (Rs/Lt.)
Consumer price Pasteurised milk (Rs/Lt.)
Year
(mill ltr) Nominal Real Nominal Real 1986 1987 1988 1989 1990 1991 1992 1993 1994 1995
67 68 65 60 64 73 81 82 86 94
4.30 4.30 4.30 5.80 6.80 8.50 8.50 9.2510.5410.54
4.003.693.213.923.734.173.723.924.103.83
7.50 8.34 9.2011.0012.5014.5015.8012.9017.0022.50
6.99 7.15 6.86 7.44 6.85 7.10 6.90 5.48 6.62 8.18
Source: Ministry of Finance & Planning, 1996. Public Investment Program 1996- 2000 Colombo
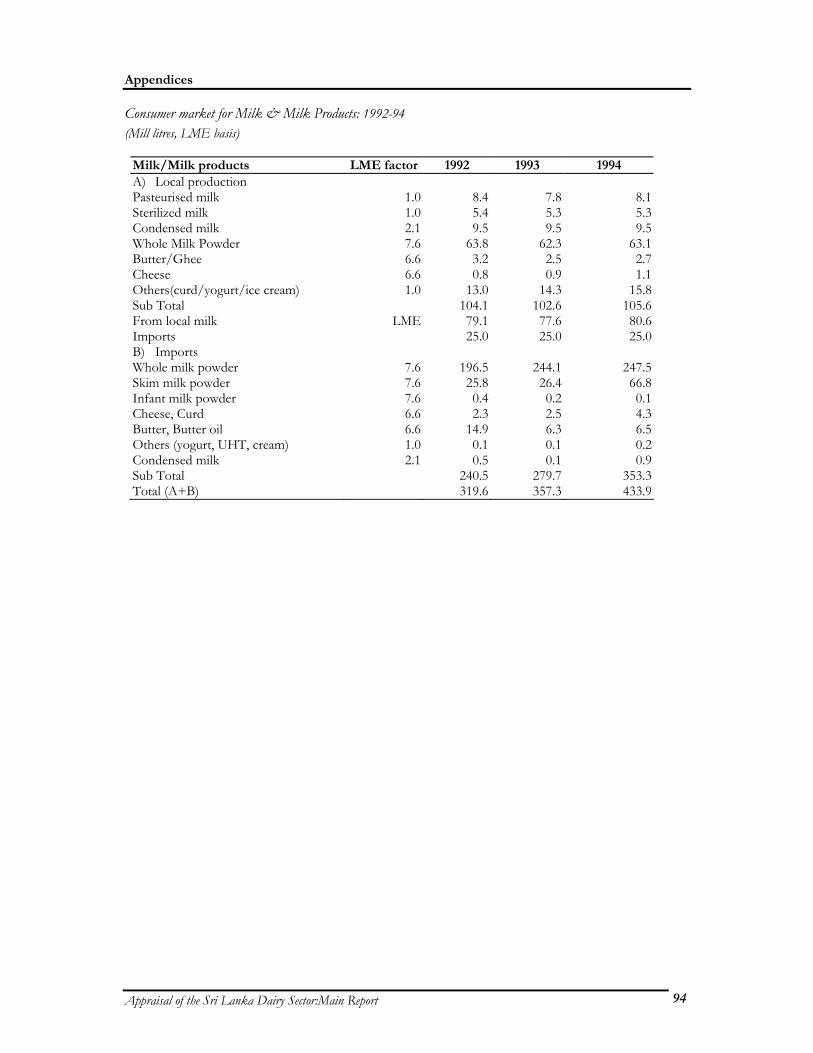
Appendices
Appraisal of the Sri Lanka Dairy Sector:Main Report 94
Consumer market for Milk & Milk Products: 1992-94 (Mill litres, LME basis)
Milk/Milk products LME factor 1992 1993 1994 A) Local production Pasteurised milk Sterilized milk Condensed milk Whole Milk Powder Butter/Ghee Cheese Others(curd/yogurt/ice cream) Sub Total From local milk Imports
1.01.02.17.66.66.61.0
LME
8.4 5.4 9.5 63.8 3.2 0.8 13.0104.1 79.1 25.0
7.8 5.3 9.5 62.3 2.5 0.9 14.3102.6
77.6 25.0
8.1 5.3 9.5 63.1 2.7 1.1 15.8 105.6 80.6 25.0
B) Imports Whole milk powder Skim milk powder Infant milk powder Cheese, Curd Butter, Butter oil Others (yogurt, UHT, cream) Condensed milk Sub Total Total (A+B)
7.67.67.66.66.61.02.1
196.5 25.8 0.4 2.3 14.9 0.1 0.5240.5319.6
244.1 26.4 0.2 2.5 6.3 0.1 0.1279.7357.3
247.5 66.8 0.1 4.3 6.5 0.2 0.9 353.3 433.9

Appendices
Appraisal of the Sri Lanka Dairy Sector:Main Report 95
Imports of Milk and Milk Products (LME), Sri Lanka: 1981–94
Year Local milk1 Imported milk Total milk Imports/Total, % 1981 1982 1983 1984 1985 1986 1987 1988 1989 1990 1991 1992 1993 1994
59.3 56.1 54.8 60.3 70.9 70.8 69.0 64.2 62.8 63.4 74.7 79.1 80.5 80.9
88.2 94.8205.8155.2202.0258.2330.7271.0295.9259.1335.3240.5279.7352.3
147.5150.9260.6215.5272.9329.0399.7335.2358.7322.5410.0319.6360.2433.2
59.8 62.8 79.0 72.0 74.0 78.5 82.7 80.8 82.5 80.3 81.8 75.2 77.7 81.3
Source: Local milk here refers only to that from formal collection centres. Thus a substantial amount of informal local milk sales are not included.
Annual Milk Collection by Major Processors (‘000 litres), 1980-94
Year
NMB/ MILCO
Polonnaruwa/NMB/IDPL
Pollnnaruwa/Pannala
Pannala
Others
Total
1980 1981 1982 1983 1984 1985 1986 1987 1988 1989 1990 1991 1992 1993 1994
52665 51121 47850 46650 40648 42707 43242 43540 41093 35740 44661 46582 47211 45370 44167
919771567236734576099876860371895856732651414000
34681 37349 34928
11300 17500 18200 17500 16800 19100 19400 25800
1012 993 1001 780 778 784 769 787 452 594 813 4000 4700 6500 6200
62874 59270 56087 54775 60335 70867 70814 69016 64201 62760 63394 74714 86592 89219 85295

Appendices
Appraisal of the Sri Lanka Dairy Sector:Main Report 96
Milk Collection at Chilling Centres: MILCO and Nestles (1994)
District MILCO NESTLE Milk collection (litres)
Colombo Gampaha Kaluthara Kegalle Galle Rathnapura Hambantota Matara Puttalam Kurunegala Matale Kandy Badulla N’eliya Ampara Moneragala Polonnaruwa Batticloa Trincomalee
334123224338684425-
-12213-132--812-1
827,000 2,500,000 2,357,170 1,246,110 1,210,340 1,683,015 663,435 416,830 3,154,695 3,589,935 1,567,320 9,011,850 9,818,13612,408,639 3,441,220 865,780 1,610,930 4,781,500 93,690
Related Documents