ASSESSING CITIES: APPLYING GIS-BASED METHODS FOR MAPPING CROSS-SCALE SPATIAL INDICATORS LILLIAN SVE ROKSETH, NTNU BENDIK MANUM, NTNU TOBIAS NORDSTROM, NTNU/SPACESCAPE Nordic ZEB – Trondheim – November 7 th 2019

Welcome message from author
This document is posted to help you gain knowledge. Please leave a comment to let me know what you think about it! Share it to your friends and learn new things together.
Transcript
ASSESSING CITIES: APPLYING GIS-BASED METHODS FOR MAPPING CROSS-SCALE SPATIAL INDICATORS
LILLIAN SVE ROKSETH, NTNUBENDIK MANUM, NTNUTOBIAS NORDSTROM, NTNU/SPACESCAPE
Nordic ZEB – Trondheim – November 7th 2019
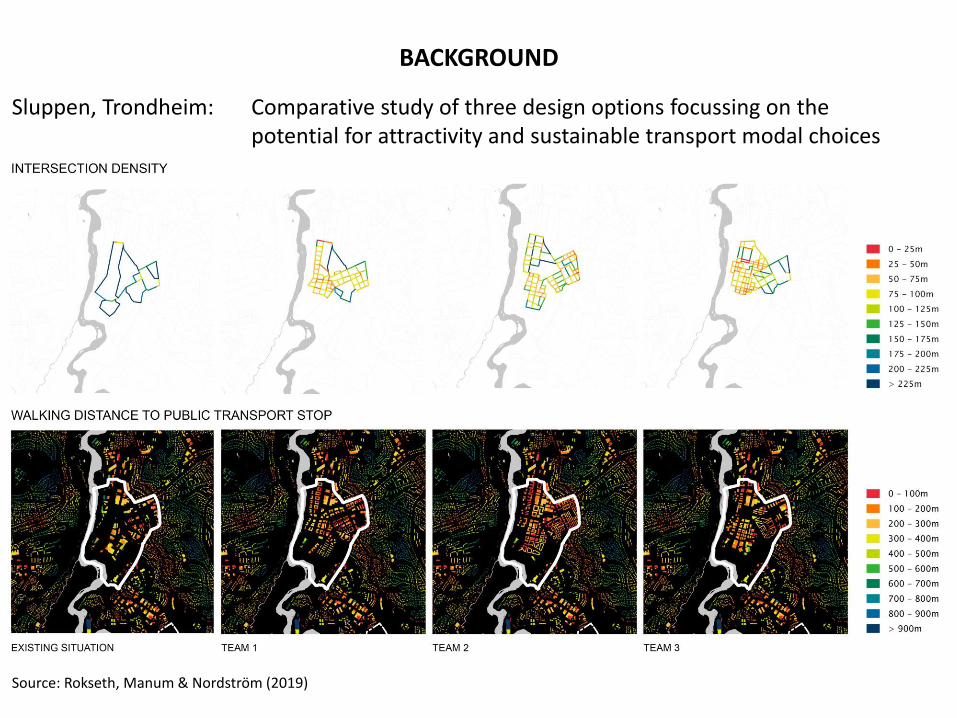
BACKGROUND
Source: Rokseth, Manum & Nordström (2019)
Sluppen, Trondheim: Comparative study of three design options focussing on thepotential for attractivity and sustainable transport modal choices
NORMALIZED VALUES WITHIN THE PLANAREA
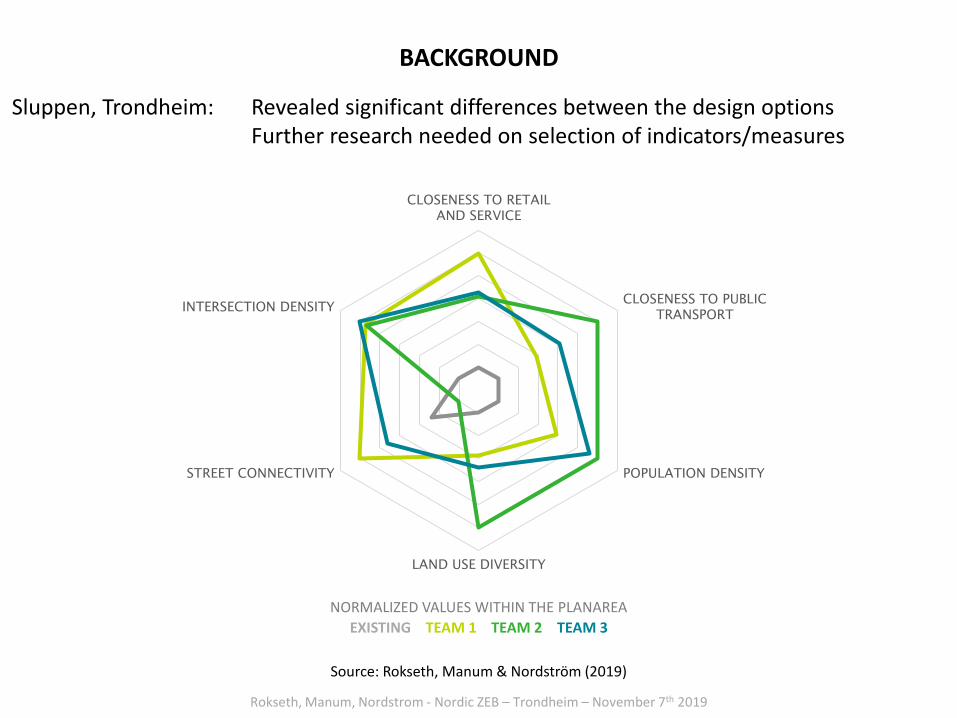
BACKGROUND
Rokseth, Manum, Nordstrom - Nordic ZEB – Trondheim – November 7th 2019
EXISTING TEAM 1 TEAM 2 TEAM 3
CLOSENESS TO RETAIL
AND SERVICE
CLOSENESS TO PUBLIC
TRANSPORT
POPULATION DENSITY
LAND USE DIVERSITY
STREET CONNECTIVITY
INTERSECTION DENSITY
Source: Rokseth, Manum & Nordström (2019)
Sluppen, Trondheim: Revealed significant differences between the design options Further research needed on selection of indicators/measures
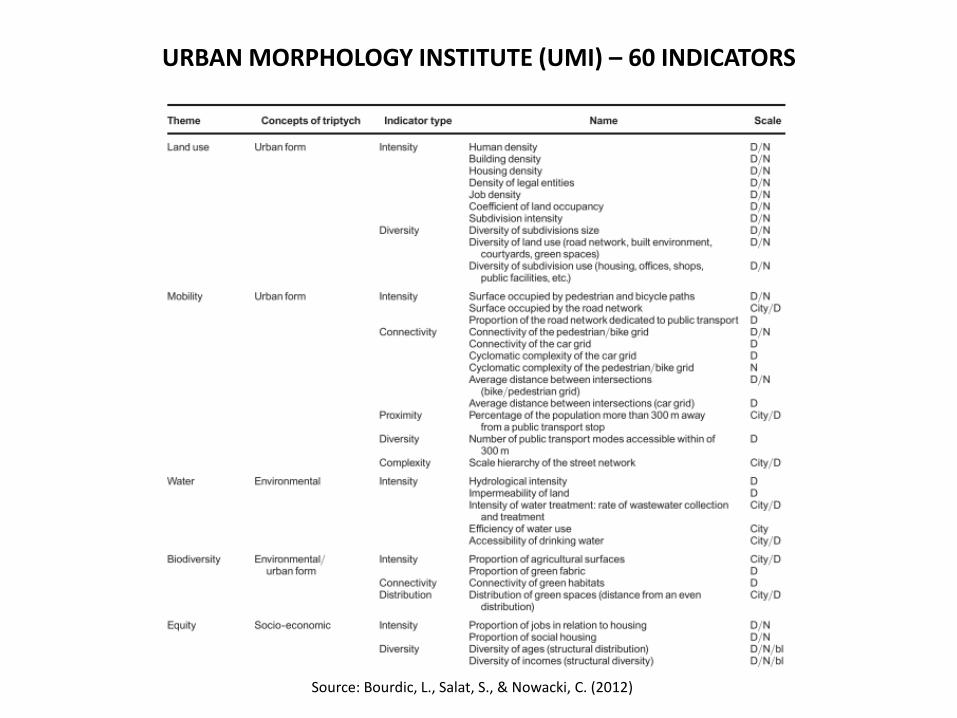
Source: Bourdic, L., Salat, S., & Nowacki, C. (2012)
URBAN MORPHOLOGY INSTITUTE (UMI) – 60 INDICATORS
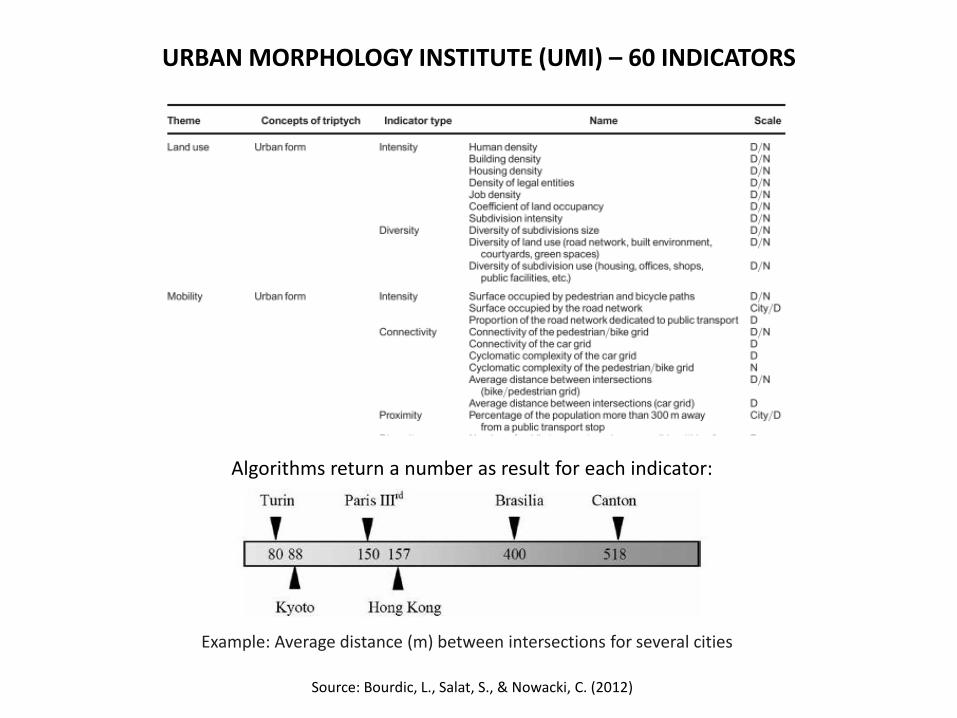
Example: Average distance (m) between intersections for several cities
Source: Bourdic, L., Salat, S., & Nowacki, C. (2012)
URBAN MORPHOLOGY INSTITUTE (UMI) – 60 INDICATORS
Algorithms return a number as result for each indicator:
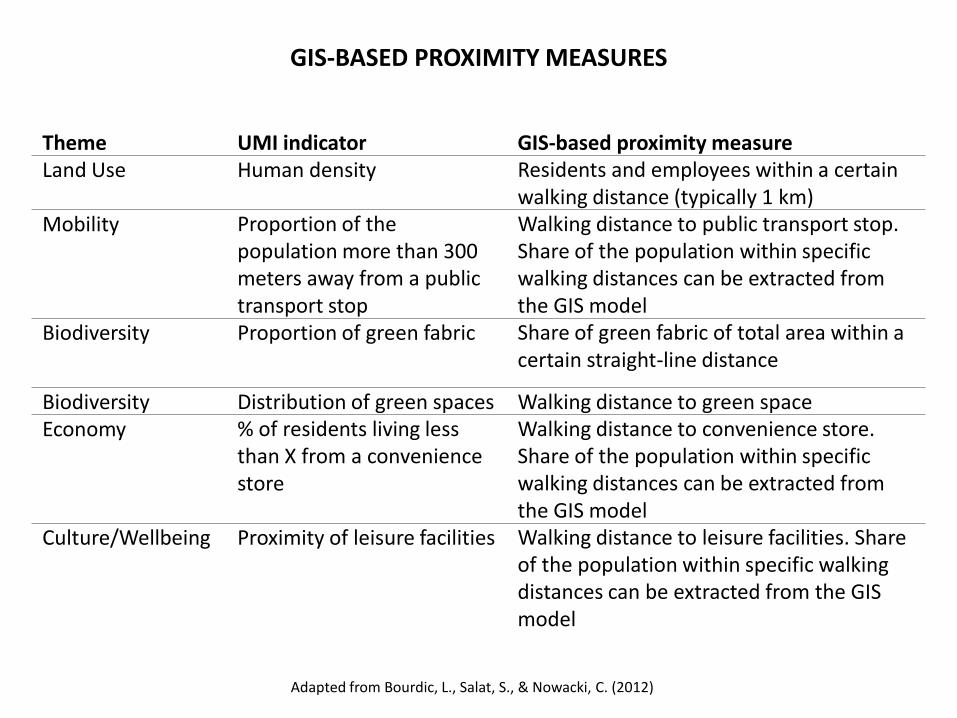
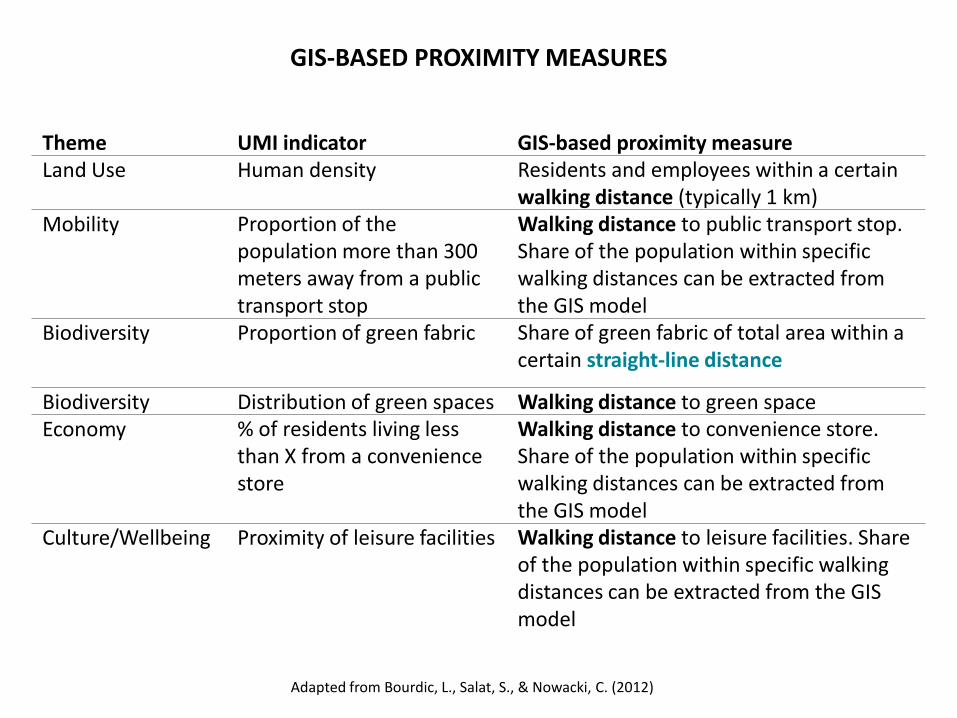
Theme UMI indicator GIS-based proximity measureLand Use Human density Residents and employees within a certain
walking distance (typically 1 km)Mobility Proportion of the
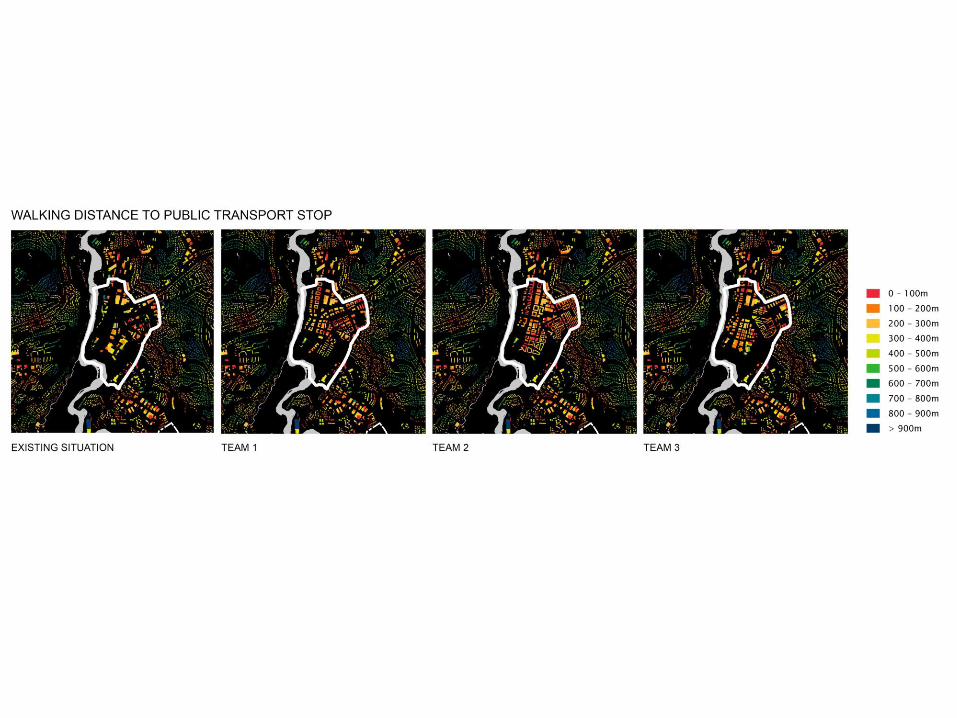
population more than 300 meters away from a public transport stop
Walking distance to public transport stop. Share of the population within specific walking distances can be extracted from the GIS model
Biodiversity Proportion of green fabric Share of green fabric of total area within a certain straight-line distance
Biodiversity Distribution of green spaces Walking distance to green spaceEconomy % of residents living less
than X from a convenience store
Walking distance to convenience store. Share of the population within specific walking distances can be extracted from the GIS model
Culture/Wellbeing Proximity of leisure facilities Walking distance to leisure facilities. Share of the population within specific walking distances can be extracted from the GIS model
GIS-BASED PROXIMITY MEASURES
Adapted from Bourdic, L., Salat, S., & Nowacki, C. (2012)
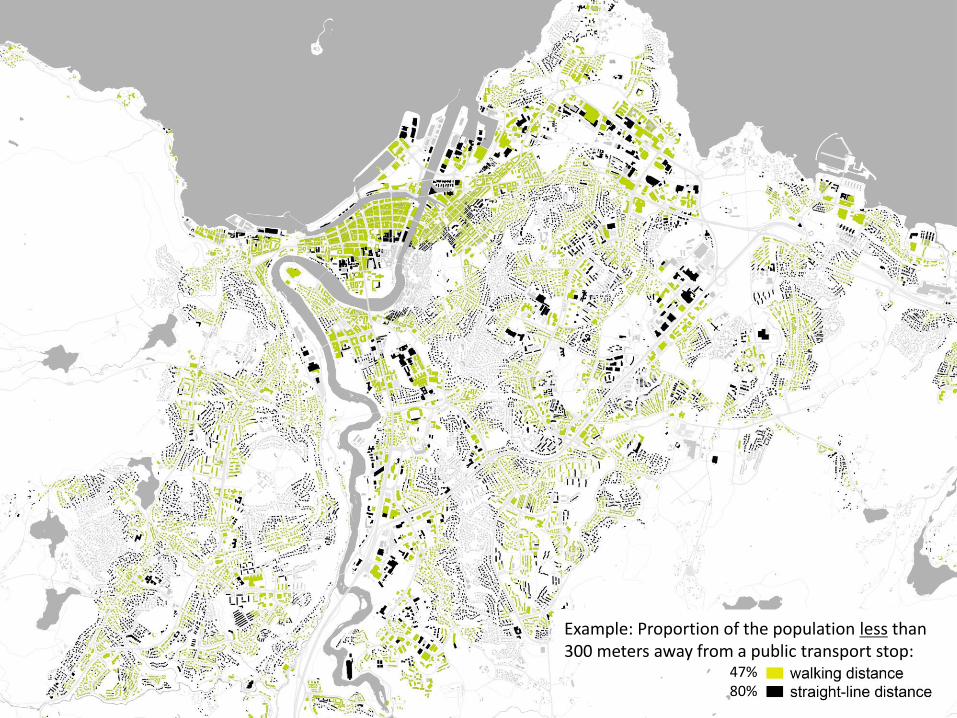
Example: Proportion of the population less than 300 meters away from a public transport stop:
47%80%
Theme UMI indicator GIS-based proximity measureLand Use Human density Residents and employees within a certain
walking distance (typically 1 km)Mobility Proportion of the
population more than 300 meters away from a public transport stop
Walking distance to public transport stop. Share of the population within specific walking distances can be extracted from the GIS model
Biodiversity Proportion of green fabric Share of green fabric of total area within a certain straight-line distance
Biodiversity Distribution of green spaces Walking distance to green spaceEconomy % of residents living less
than X from a convenience store
Walking distance to convenience store. Share of the population within specific walking distances can be extracted from the GIS model
Culture/Wellbeing Proximity of leisure facilities Walking distance to leisure facilities. Share of the population within specific walking distances can be extracted from the GIS model
GIS-BASED PROXIMITY MEASURES
Adapted from Bourdic, L., Salat, S., & Nowacki, C. (2012)
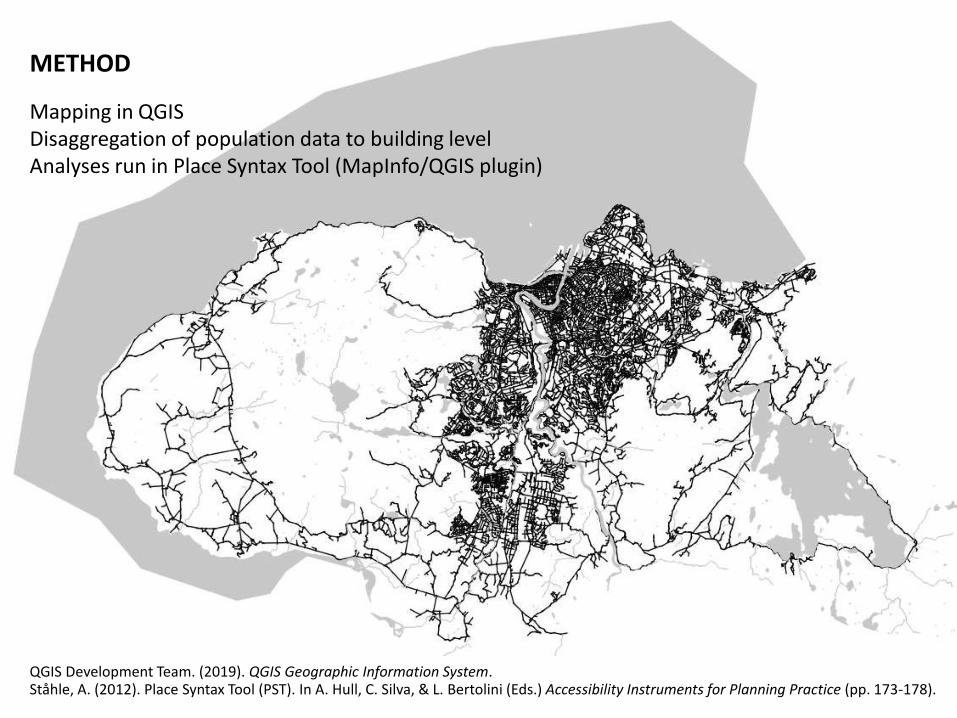
METHOD
Ståhle, A. (2012). Place Syntax Tool (PST). In A. Hull, C. Silva, & L. Bertolini (Eds.) Accessibility Instruments for Planning Practice (pp. 173-178). QGIS Development Team. (2019). QGIS Geographic Information System.
Mapping in QGISDisaggregation of population data to building levelAnalyses run in Place Syntax Tool (MapInfo/QGIS plugin)
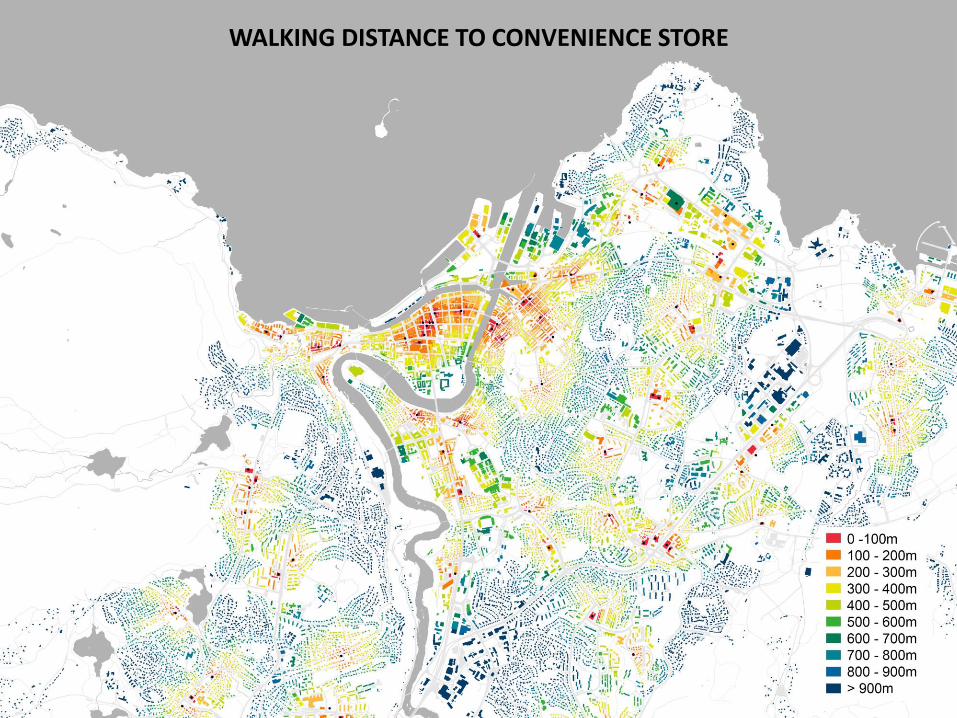
WALKING DISTANCE TO CONVENIENCE STORE
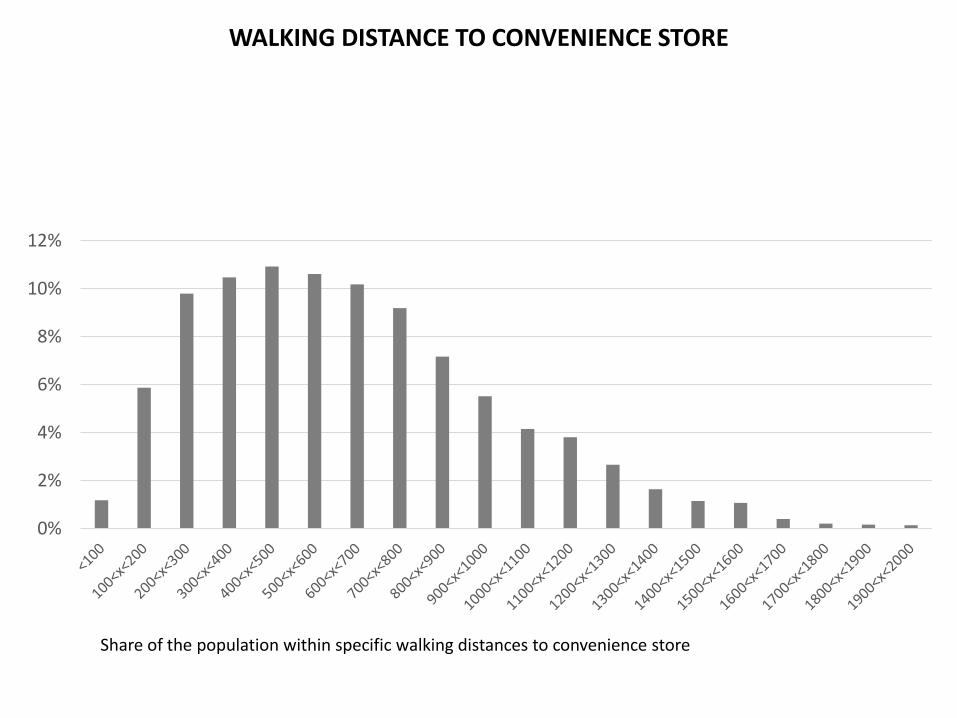
Share of the population within specific walking distances to convenience store
0%
2%
4%
6%
8%
10%
12%
WALKING DISTANCE TO CONVENIENCE STORE
0%
10%
20%
30%
40%
50%
60%
70%
80%
90%
100%
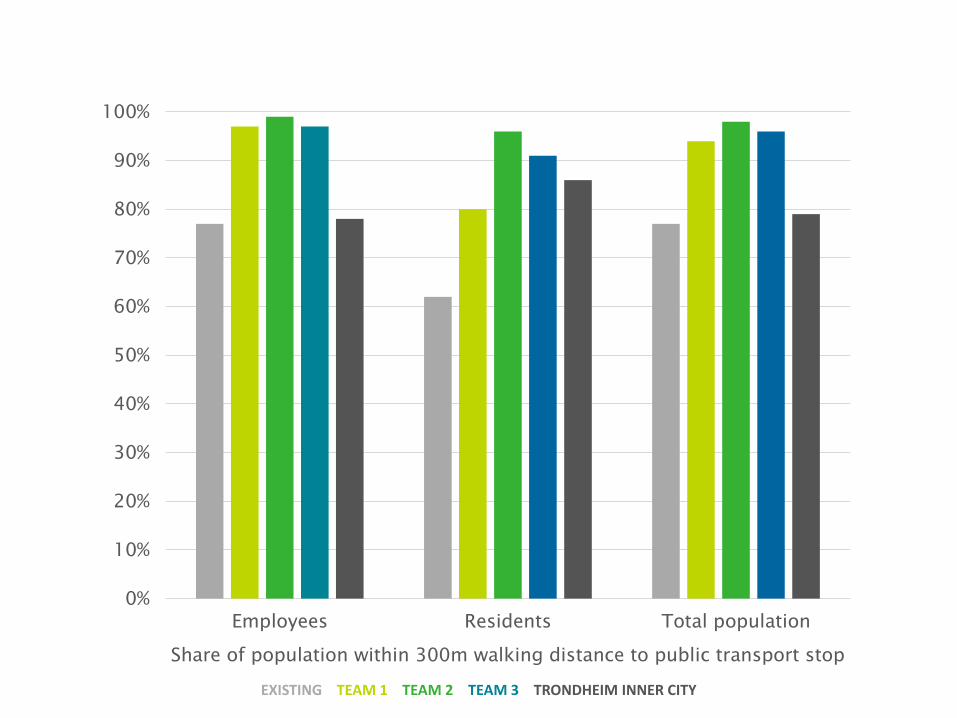
Employees Residents Total population
Share of population within 300m walking distance to public transport stop
EXISTING TEAM 1 TEAM 2 TEAM 3 TRONDHEIM INNER CITY
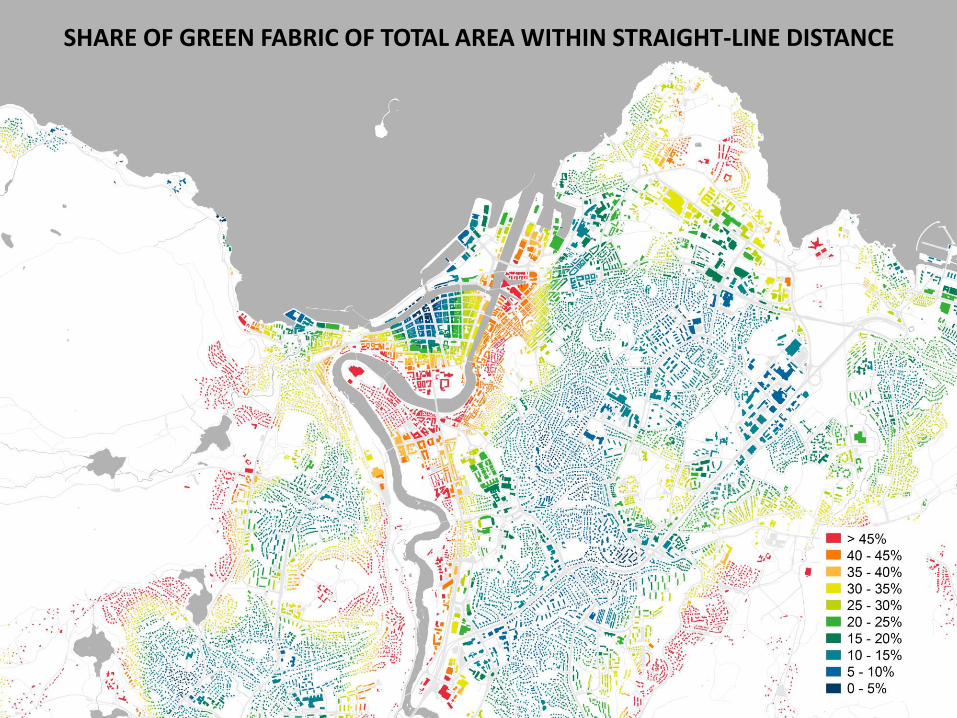
SHARE OF GREEN FABRIC OF TOTAL AREA WITHIN STRAIGHT-LINE DISTANCE
• GISs methods currently being developed holds a potential to support assessment systems for urban sustainability in terms of providing informative thematic maps for visualizations in different scales.
CONCLUSIONS
• GISs methods currently being developed holds a potential to support assessment systems for urban sustainability in terms of providing informative thematic maps for visualizations in different scales.
• In addition, GIS-based methods can be implemented to further specify which measures to apply.
• The GIS model will also provide data in various scales and units, allowing for several alternatives of comparing data between cities or between planning options and for a richer ground for discussions about the meaning and importance of examined topics and indicators.
• The potential of applicability of urban assessment system in planning as well as design processes will increase when linked to tools that to some extent are already implemented.
CONCLUSIONS
Related Documents