1 Application of Structural Equation Modeling on the Linkage of Risk Management, Capital Management, and Financial Management for Insurance Industry Min-Ming Wen, Hong-Jen Lin and Patricia Born Abstract This study uses property/liability insurance industry as research sample to examine how risk management, financial management, and capital management are related to each another, thereby reflecting such interactions in the managerial decisions in the choice of derivative and reinsurance use, in the allocation of asset risks, in the determination of underwriting activities as well as liability risks, and in the adequacy of capital levels. This study contributes to the literature by adopting structural equation modeling (SEM) to examine the direct effects from regulations on capital management, financial management, and risk management as well as the interacted effects of the three managerial decisions. As a result, the net effects of risk management, capital management, and financial management are reflected in the observable managerial decisions on the implementation of derivatives in managing risks, the allocation in bond and stock investment, and the adoption of debt and equity.

Welcome message from author
This document is posted to help you gain knowledge. Please leave a comment to let me know what you think about it! Share it to your friends and learn new things together.
Transcript
1
Application of Structural Equation Modeling on the Linkage of Risk Management,
Capital Management, and Financial Management for Insurance Industry
Min-Ming Wen,
Hong-Jen Lin
and Patricia Born
Abstract
This study uses property/liability insurance industry as research sample to examine how risk
management, financial management, and capital management are related to each another, thereby
reflecting such interactions in the managerial decisions in the choice of derivative and
reinsurance use, in the allocation of asset risks, in the determination of underwriting activities as
well as liability risks, and in the adequacy of capital levels. This study contributes to the
literature by adopting structural equation modeling (SEM) to examine the direct effects from
regulations on capital management, financial management, and risk management as well as the
interacted effects of the three managerial decisions. As a result, the net effects of risk
management, capital management, and financial management are reflected in the observable
managerial decisions on the implementation of derivatives in managing risks, the allocation in
bond and stock investment, and the adoption of debt and equity.
2
I. Introduction
To achieve the goal of firm-value maximization, managers have to optimize the corporate
decisions on financial management, capital management and risk management. However,
optimal investment and financing decisions cannot be reached without the support of an effective
risk management approach. On the other hand, managers will employ an optimal risk
management approach given the existence of adequate capital levels and investment
opportunities (Froot, Scharfstein, and Stein, 1993). As a result, firm-value maximization is
accomplished through the interactions and linkage of a firm’s risk management, capital
management, and financial management. This study uses the property/liability insurance industry
as a research sample to examine how risk management, financial management, and capital
management are related to each another, thereby reflecting such interactions in the managerial
decisions on the choice of derivative and reinsurance use, on the allocation of asset risks, on the
determination of underwriting activities as well as liability risks, and on the adequacy of capital
levels.
Studies by Cebenoyan and Strahan (2004), Shimpi (2002), Froot, and Stein (1998), and
Leland (1998) have rigorously developed models illustrating the linkage between a company’s
decisions in risk, capital, and financial management. For example, Shimpi (2002) develops an
Insurative Model to simultaneously consider the roles of capital management and risk
management in maximizing the firm value. Froot, Scharfstein, and Stein (1993) have developed
a model illustrating that the determination of risk management depends on the interaction of
capital and financial management, namely, investment and financing considerations. Earlier
research by Froot and Stein (1998) develops a framework incorporating risk management to
analyze the capital allocation and capital structure facing financial institutions. Their model
considers how a bank changes its capital structure when hedging decisions and investment
choices are taken into account. In addition, the model highlights a trade-off between risk
management via capital structure policy versus managing risk via capital budgeting and hedging
policies. Correspondingly, a joint decision is made by the bank about its risk management,
capital budgeting and capital structure policy. The model attributes the jointly and endogenously
determined managerial decisions on managing risk, capital and investment to the existence of
illiquid assets and non-tradable risks. Similarly, the insurance industry is an industry with a
major business sector in underwriting insurance policies under which a significant amount of
3
non-tradable (underwriting) risks are embedded. We conjecture that the conclusions in Froot and
Stein (1998) on the endogeneity of the three managerial decisions can be applied in the insurance
industry. In addition, with the dynamic features embedded in both asset and liability sides of an
insurance company, the decision of its capital structure should be a dynamic process, and so is
the linkage in the risk management, capital management, and financial management. In this
study, we utilize structural equation modeling (SEM) methodology on a time-varying basis to
examine the dynamics. Different from the extant literature, we also consider the influence of
insurance regulations on the interrelationship and joint determination of the three managerial
decisions. The incorporation of regulatory effects requires the SEM to be set up on a three-level
framework. The first level of a three-level SEM is to indicate the direct effects of regulations on
each of the managerial decisions, and the translation of such direct effects to the
interrelationships between the three managerial decisions is presented in the second level of
SEM, and lastly the net effects from the regulations and managerial decisions are reflected in the
corporate strategies of determining the risks of asset, liability, and underwriting activities. Under
this SEM framework, risk management, capital management, and financial management are
defined as latent variables and are not directly observed, whereas the explicitly observable
corporate strategies driven by the above managerial decisions are defined as manifest variables.
As a result, the choice of those manifest variables has to be as accurate as possible so that they
can reflect the concepts embedded in the latent variables.
Through the choice of an investment opportunity, a financial managerial decision is to
increase cash flows given a certain level of risk. In addition, efficient capital management
preserves capital so that the firm can be more effectively in engaging in risk-taking activities.
One can define risk management by its goal of managing risk at a reasonable and acceptable
level. The above simplified definitions for risk management, capital management, and financial
management provide the rationale to establish relationships between the implicit risk
management and explicit decisions on the use of financial derivatives and reinsurance; between
implicit capital management and explicit decisions on the choice of invested assets, adequacy of
capital level, and liability risks determined by the underwriting activities; and between implicit
financial management and explicit decisions on the use of financing instruments.
In other words, the explicitly observable risk-taking strategies can be the central focus
underlying the three implicit managerial decisions, and thereby contribute to the determination of

4
a joint optimal combination of the three decisions. For example, when a firm engages in a risk
management approach to transfer or diversify risk, the extent of risk management, on one hand,
enables the firm to manage risks more effectively, and on the other hand, enables the firms to
enhance their risk-taking at a more aggressive level. Thereby the risks induced by altering
investment strategies and capital structure can become significant. Cebenoyan and Strahan
(2004) provide evidence for such possibility for commercial banks by showing that through the
engagement in simultaneous loan sales and loan purchases, the banks will engage in active credit
risk management that can increase the banks’ risk-taking level, thereby affecting their capital
structure as well as investment strategies represented by their asset allocation. Moreover, Leland
(1998) shows that an optimal capital management can be distorted due to the risks embedded in
the choice of capital structure. Nevertheless, the implementation of risk management can
possibly bring the capital decision back to optimal level via a more aggressive investment
strategy presented in the form of financial management. The extant literature discussed above, to
some extent, provides us with arguments suggesting that risk-taking behaviors can be the central
focus of the three corporate decisions. For insurance companies, the risk-taking behaviors
present not only in the form of asset risks, but also in the form of liability risks. The time
difference between premium receipts and claim payments, on the one hand, enables insurers to
engage in a different level of asset risks corresponding to the investment strategies, and on the
other hand require insurers to recognize the liability risks to fulfill their payment commitments to
policyholders. It is of interest to understand the level of the net risk that an insurer will expose
when it considers its risk management, capital management, and financial management
simultaneously.
The presence of a possibly aggressive risk-taking strategy further motivates the regulators
to control insurer’s risk-taking to protect the integrity of the financial system. Hence, when
insurers intend to develop optimal strategies to link their risk management, financial
management, and capital management by possibly pursuing a more aggressive risk-taking
strategy, they will spontaneously consider the impact from regulatory requirements that are
imposed not only on the levels of asset risks, but also on the levels of liability risks. A study by
Daníelsson, Jorgensen, and Vries (2002) demonstrates that under the new Basel II Capital
Accord, previously unregulated institutions that chose optimal and best risk management can be
expected to switch to a lower quality risk management approach subsequent to becoming
5
regulated. As a result, whether the presence of regulation promotes a more aggressive or a more
conservative risk-taking strategy is an interesting issue for further investigation, especially for
the insurance industry that operates business under a highly regulated environment. For the
insurance industry, regulations are imposed on ratemaking, asset allocation, and capital
requirement. Insurance companies must operate within the constraints imposed by regulators
who have discretion in making decisions that can have significant impacts on the risk of an
institution. Correspondingly, regulatory impact can be a common factor underlying the decisions
on risk management, capital management, and financial management. It is our intent to examine
the impact of regulations on the determination of the joint degree of risk management, capital
management, and financial management.
This study contributes to the literature by adopting structural equation modeling (SEM) to
examine the direct effects from regulations on capital management, financial management, and
risk management as well as the interacted effects of the three managerial decisions. The three
latent managerial decisions are the factors that drive the determination in observable corporate
strategies in the implementation of derivatives in managing risks, the allocation in bond and
stock investments, and the adoption of debt or equity in capital structure. In other words, literal
so-called risk management, capital management, and financial management are not directly
observed and thus are defined as latent variables under the SEM framework and they are the
essential factors determining the observable managerial decisions in hedging degree, capital level
and asset allocations, which are defined as manifest variables under SEM.
The following sections elaborate on the use of SEM methodology for examining the
effects of regulations on the three managerial decisions and their interactions, present the
empirical results from the application of SEM, and discuss the implications of the results to the
insurance industry and regulators.
II. Methodology
Structural Equation Modeling:
Structural equation modeling has its roots in path analysis invented by the geneticist
Sewall Wright (Wright 1921) and was introduced in sociology by Duncan (1966). Since then,
Mueller (1996) documents the literature in which many applications have appeared. It can be
6
viewed as a combination of factor analysis and regression or path analysis. Path analysis
provides the researcher with a multivariate (more than one dependent variable) method to
estimate structurally interpretable terms including the direct, indirect, and total effects among a
set of variables, thereby providing an a priori path model. The theoretical constructs represented
by the latent factors are of interest in SEM analysis. The purpose of SEM is twofold. First, it
aims to obtain estimates of the parameters of the model, i.e. the factor loadings, the variance and
covariance of the factor, and the residual error variances of the observed variables. The second
purpose is to assess the fit of the model. The relationship among the theoretical constructs is
represented by regression or path coefficients between factors. The structural equation model
implies a structure for the covariance between the observed variables, and as a result, such
covariance structure conveys information about the dynamically interactive relationships among
the variables. As a statistical tool, SEM goes beyond conventional multiple regression, factor
analysis and analysis of variance. Structural equations are more appropriate than regression
parameters when important observed variables have not been directly measured or the observed
variables contain measurement errors in both the dependent and independent variables.
Traditional regression analysis neglects potential measurement error in the explanatory variables,
which can possibly generate misleading empirical results. In addition to handling measurement
error, SEM can measure the direct effects that go directly from one variable to another variable
and the indirect effects between two variables that are mediated by one or more intervening
variables. Correspondingly, the combination of direct and indirect effects makes up the total
effect of an explanatory variable on a dependent variable. In summary, the employment of SEM
can identify the interdependence and causality relationship between the unobserved variables and
the observed variables. SEM defines such observed variables as manifest variables, and the
unobserved variables as latent variables.1
Path diagrams are used to graphically display a prior hypothesized structure among the
variables in the model. For any two variables, say X and Y, their relationships can be represented
1 We use an example to elaborate the conceptual definitions of latent and manifest variables under SEM. For example (Rakov and Marcoulides 2006), it is of interest to examine the relationships among Parental dominance, Child intelligence and Achievement Motivation, which are not directly observed variables. Nonetheless, one can use the observed variables on the parents’ professions and education, and the children’s observed grade point average as indicators. Under SEM, Parental dominance, Child intelligence and Achievement Motivation are defined as latent variables and they are the independent variables that determine the values in the manifest variables—parents’ professions, education, and grade average points.
7
as X→ Y: X might structurally influence Y; X←Y: Y might structurally influence X; YX→
←: X
might structurally influence Y, and Y might structurally influence X; and X <------> Y: No
structural relation is hypothesized between X and Y, but the variables might co-vary. In Wright’s
(1921) notation, observed (or measured) variables are represented by a rectangle or square box,
and latent (or unmeasured) factors by a circle or ellipse.
The application of SEM analyses to this study is to identify the observed factors that can
independently or interdependently influence a firm’s risk management, capital management and
financial management when the interdependence of the three managerial decisions is taken into
account. We view the three managerial decisions as latent variables since any of them cannot be
“directly” or “explicitly” observed. Nevertheless, one is able to recognize the managerial
decisions through the respective underlying observed factors. For example, when “risk
management” is mentioned, it “implies” that both the instruments employed for management
purpose and the corresponding costs are observed. That is to say, by recognizing the instruments
and the costs of hedging, one can understand the explicit risk management strategy. Following
this logic, we are motivated to investigate those specific factors that can be used to represent the
managerial decisions. The dynamic features of assets and liabilities have been rigorously
modeled in finance and insurance literature (Merton 1976, Fischer 1978, and Cummins and
Lamm-Tennant 1994). In this study, we intend to examine how the effects of the dynamics
embedded in insurance liabilities and assets work on the joint determination of financial
management, risk management and capital management. Different from the traditional
multivariate regression model, SEM enables us to consider the relationship between latent
factors and the observed variables simultaneously; in other words, the application of SEM is
under a dynamic framework, which is consistent with our purpose incorporating the dynamics of
insurance asset and liability risk-taking strategies into the joint determinant of the three
managerial decisions.
Among a variety of SEM models, we adopt the general maximum likelihood (ML)
estimate from the LISREL 8.8 software package (see Jöreskog and Sörbom, 2001), which is the
default estimate in the LISREL. Since this is one of the initial attempts of SEM analysis applied
to the insurance industry, we start with a simple original estimation of ML and leave other more

8
complicated variations of SEM for future explorations.2
Here we discuss the respective observable factors underlying each of the latent variables
and that can better represent them. With regard to risk management, an insurer can apply
reinsurance, securitization, and financial derivatives, such as options, forwards, futures, and
insurance derivatives as the management instruments, and thus the corresponding transactions
can be employed to measure risk management implemented by insurers. A capital management
strategy can be represented by management in operational capital, risk capital and signaling risk
(Shimpi 2002). They can be identified through management in insurance liabilities, investment
strategies and asset allocations, among which asset and liability risks and asset allocation also
result from the decision of financial management. For an insurer, asset risks can be defined as the
asset investment in bonds, stocks and mortgage real estate, whereas liability risk is defined as the
ratio of loss reserves to total liabilities. Moreover, an insurer’s capital level relative to its asset,
and its policyholders’ surplus relative to the level of capital can be used to observe the insurer’s
capital managerial decision. In addition as the insurance industry is highly regulated, regulations
play an important role in insurance companies’ managerial decisions. As a result, we argue that
regulation is the essential determinant for indicating its direct effects on the three managerial
decisions and the underlying dynamic and interacted relationships between financial
management, risk management and capital management. Taken together, we use path diagrams to
illustrate the applications of confirmatory factor analysis, and a structural equation model that
describes the correlations between latent variables and manifest variables as well as the
interrelationship between latent variables and the casualty relationship between latent and
manifest variables.
A confirmatory factor analysis (CFA) is used to specify/confirm the correlation between
the three latent variables as shown in Figure 1. Let x1, x2, …, x12 denote the observed indicator
variables for the risk management, capital management and financial management that are
viewed as construct latent variables and are represented by ξ1, ξ2, and ξ3, respectively. The
pairwise correlations between latent variables are denoted by ρ12, ρ23, and ρ13. Measurement errors
δs (s = 1, 2,..,12) for each observed variable are incorporated in the graph representation. The
CFA model can be written in a matrix form in Equation (1).
δΛξX += (1) 2 The advance SEM methods include Bayesian Estimation, nonlinear structure, heterogeneity, and multilevel data.

9
where
X is the vector of observable variables (x1,x2,..x12),
Λ is a 12×3 matrix of the λ coefficients that depict the relations between variables X and ξ ,
ξ is the vector of latent variables (ξ1, ξ2, ξ3), and
δ is the vector of residuals (δ1, δ2, δ3, … δ12).
In practice, it is natural to run CFA to test the goodness of model fit of the prior
hypothesized structure before the estimation of SEM. However, under the confirmatory factor
analysis, only the correlation/interrelationships among latent constructs are presented, no specific
directional relationships are assumed among the constructs. Structural equation modeling (SEM)
resembles confirmatory factor analysis models in the way indicating the correlations among
latent variables is indicated; additionally, SEM possesses the noteworthy characteristic that latent
variables are regressed on other latent variables to capture the numerical correlation between
latent variables and describe both the statistical relationship and the causality relationship.
.

10
Risk Mgt ξ 1
Capital
Mgt ξ 2
Financial
Mgt ξ 3
x2
x1
x3
x5
x4
x6
x7
x8
x10
x9
x11
x12
δ1 Λ
ρ12
δ2
δ4
δ3
δ5
δ6
δ7
δ8
δ9
δ10
δ11
δ12
ρ23
ρ13
Figure1 A Confirmatory Factor Analysis model of risk management, capital management, and financial management
11
The correlation under confirmatory factor analysis suggests the frequency or opportunity
of simultaneous occurrence of multiple events or decisions, but no causal relationship from one
latent variable to the others is specified. Under this high correlation between any two latent
variables may be caused by other non-observable variables that are likely to have their affects on
the latent variables, namely spurious correlation. Consequently, this study employs confirmatory
factor analysis to confirm the statistical correlation between latent variables and then utilize a
structural equations model to further investigate the causality relationship between latent
variables as well as between latent and manifest variables. In addition, regulations play an
essential role in influencing the three managerial decisions through which the direct and indirect
relationships between these three managerial decisions between them and the observed variables
are presented. We utilize SEM to construct such hierarchically pairwise relationships.
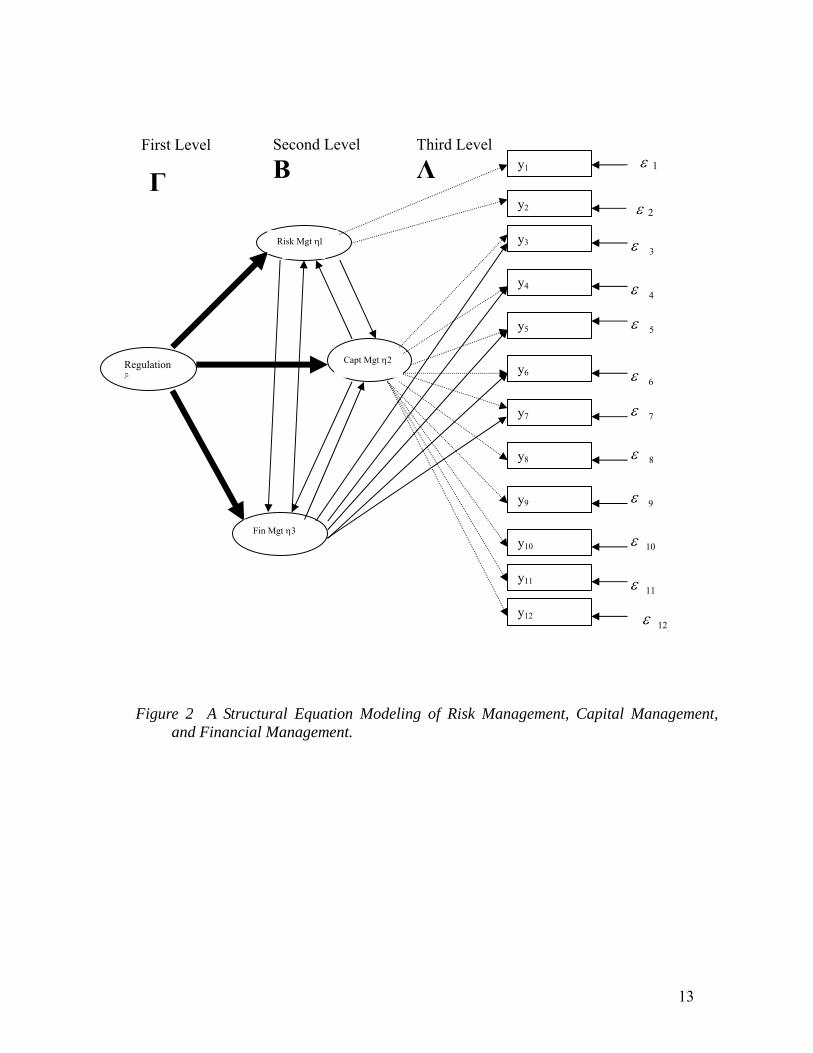
In the path diagram of structuring equation modeling as shown in Figure 2, the causality
between the three latent variables—risk management (η1), capital management (η2), and
financial management (η3) are represented by the parameters β12, β21, β23, β32, β13, and β31.3 Let
y1, y2, …, y12 denote the observed manifest variables for the risk management, capital
management, and financial management and εs (s = 1, 2,…,12) denote the measurement errors
associated with the endogenous variables that indicate the unexplained portion embedded in the
relationship.
A prior hypothesized structure assumes that the asset risk and liability risk levels and the
regulatory requirement are the central focus and common factors underlying the three managerial
decisions. Along with this prior hypothesized structure, the interrelationship between latent
variables and the relationship between latent and manifest variables define the model as a three-
level structural model specified in Figure 2.
The first-level structural equations are to indicate the essential regulation factor that
fundamentally drives the managerial decisions, and the second-level structural equations are to
illustrate the interactions between the latent variables. Here, we can observe that the SEM helps
construct the regulatory latent variable under which the managerial decision effects are reflected
in the observed manifest variables. Correspondingly, through the interactions between latent 3 Under SEM, one can assume symmetric effects between any of two latent variables by imposing the constraints of β12 = β21, β23 = β32, and β13 = β31 to reduce the parameters to be estimated and satisfy the identification criterion. However, we recognize that the effects between two latent variables can be different, and therefore with sufficient information, in this study we set up the SEM in a more general framework by allowing the existence of asymmetric effects between any two latent variables.

12
variables in the first- and the second-level regression, the net effects are presented in the
measurement equations, which are defined as the third-level in the structural model. We
formulate the three-level structural equations model as expressed in Equations (2), and (3),
which are structural regressions, and measurement regressions, respectively.
The structural equation model is
ζΓξΒηη ++= (2);
and the measurement model for y is
εΛηY += (3);
where
Y is a vector of the observable variables (y1,y2,…y12),
η is a vector of the three latent variables,
Λ is a 12×3 matrix of λ coefficients that depict the relations between observable variables Y and
latent variables η,
ε is a vector of the measurement errors (ε1, ε 2, ε 3, … ε12),
Β is a 3×3 matrix of coefficients of η variables,
Γ is a 3×1 vector that describes the relationship between the regulation latent variable ξ, and
ζ is a 3×1 vector of equation errors.
13
Figure 2 A Structural Equation Modeling of Risk Management, Capital Management, and Financial Management.
Regulation ξ
Risk Mgt 1
Capital Mgt η2
Financial Mgt η3
y2
y1
y3
y5
y4
y6
y7
y8
y10
y9
y11
y12
2ε
3ε
4ε
5ε
6ε
7ε
8ε
9ε
10ε
11ε
12ε
Third Level
Λ First Level Second Level
Β Γ ε 1
η1Risk Mgt η1
ε 2
Capt Mgt η2
Fin Mgt η3
14
After specifying the prior hypothesized structures among variables, we are able to estimate
the parameters under the SEM set up in this study. The empirical analysis is detailed in the
following sections.
III. Empirical Study and Results
Based on structural equation modeling, this study proposes a prior hypothesized structure
among regulations, risk management, capital management and financial management that can be
confirmed by the application of confirmatory factor analysis (CFA). In addition, to explicitly
examine the hypothesized relations among the variables, we conduct an empirical study by
employing insurance data reported on the regulatory annual statement filed by insurers with the
National Association of Insurance Commissioners (NAIC). To measure the financial
management and capital management latent variables, we extract from the NAIC regulatory
statements data on assets, liabilities and exhibits of investment for the measurement variables.
From the statements, we also obtain reinsurance premium to measure the risk management latent
variable. The transactions of financial derivatives are also used to measure the insurers’ risk
management and the data are gathered from Schedule DB of the statement. Parts A through D of
Schedule DB list individual transactions across four categories of derivatives: (A) options, caps
and floors owned; (B) options, caps and floors written; (C) collars, swaps and forwards; and (D)
futures. In Part E of Schedule DB, insurers report their year-end counter-party exposure for all
the contracts contained in Parts A through D. Total notional amount transacted during the year is
used to measure the volume of hedging transactions undertaken by insurers. Using the within-
year transactions enables us to analyze all insurers that are active in derivatives markets rather
than only those that report year-end positions (Cummins, Phillips, and Smith 2001). The sample
period expands from year 2000 to year 2002. The inclusion of multi-year data enables us to
analyze whether a time-varying trend exists in the relationships indicated in the structural
equations model, and to examine the dynamics interactions interpreted by the different effects
over years between the three managerial activities. Moreover, through a model-fit technique the
hypothesized structure can reflect the most appropriate structural relationships between the latent
and observed variables.
III.1 Summary of Statistics
15
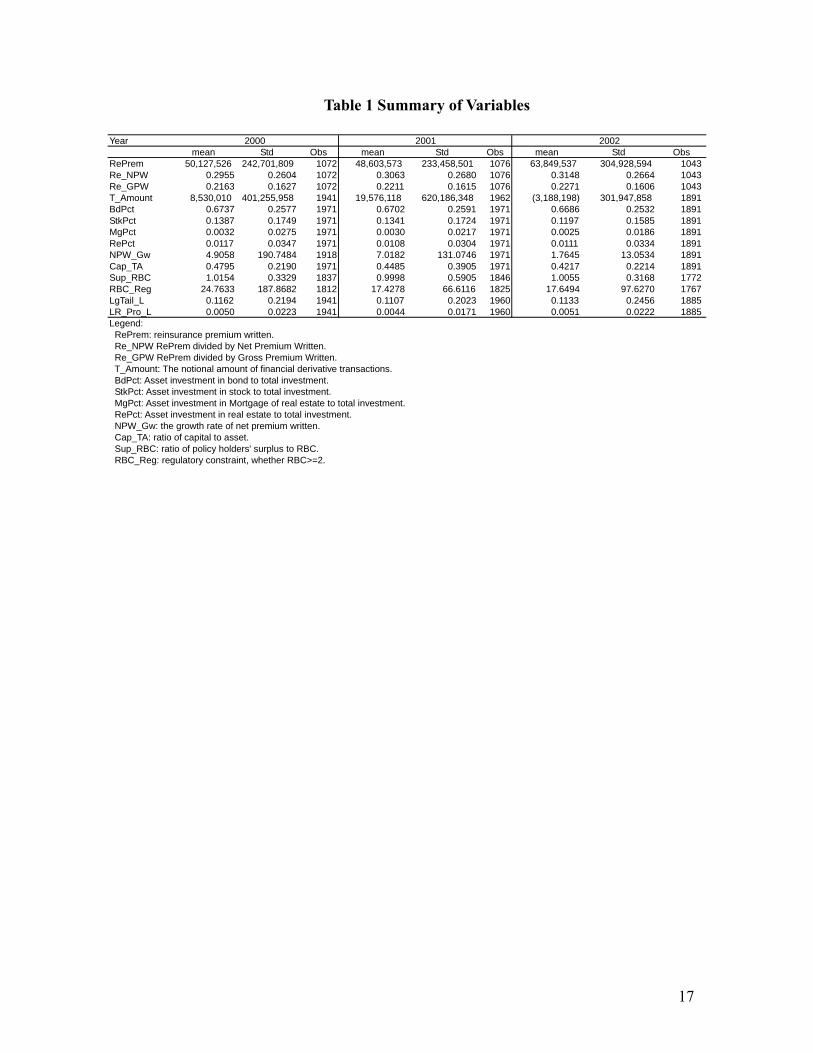
Table 1 summarizes the descriptive statistics of manifest variables used in this study for
years from 2000 to 2002. The insurance companies with data available for these three years are
selected. The inclusion of yearly data enables us to compare the statistics over time and to
observe their time-varying pattern.
For example, reinsurance premium (RePrem) decreases from $50,127,526 in year 2000 to
$48,603,573 in year 2001 and then increases to $63,849,537 in year 2002. The increase of
reinsurance premium is likely to be attributed to the increases in underwriting policies. To
control for this factor, we normalize the reinsurance premium by net premium written to be the
ratio of reinsurance premium payment to the insurers’ net premium written or gross premium
written. The ratio of reinsurance premium to net premium written (Re_NPW) grows from
29.56% in year 2000, to 30.63% in year 2001, and then to 31.48% in year 2002. Similarly, the
ratio of reinsurance premium to gross premium written (Re_GPW) rises from 21.63% to 22.11%,
and then to 22.71% from year 2000 to 2002. Despite the decrease in reinsurance premium
(measured by absolute amount) from year 2000 to 2001, the relative reinsurance premium
payment to underwriting premium income steadily increases over the sample period from 2000
to 2002.
T_Amount denotes the notional amount of financial derivative transactions. It increases
rapidly from $8,530,010 in 2000 to $19,576,118 in 2001 and becomes a negative number
($3,188,198) in 2002.4 A negative amount in derivative transactions suggests that, on average,
the property/liability insurers took a counter-party position in year 2002. Observing the changes
in the amount of reinsurance premium and transactions in financial derivatives in the years 2001
and 2002, we conjecture that the events of September 11m 2001 might have driven the changes
in insurers’ risk management decisions, thereby causing the changes in the use of reinsurance and
financial derivatives.
Capital management under SEM is also defined as a latent variable, whereas it drives the
observed decisions on the asset allocations in bonds (BdPct), stocks (StkPct), mortgage (MgPct),
and real estate (RePct). They present a declining pattern in the period from 2000 to 2002
suggesting more conservative asset risk-taking behavior. For instance, Table 1 shows that BdPct
gently declines from 67.37% to 67.02% and then to 66.8%; StkPct decreases from 13.87% in
4 Due to a small ratio of the notional amount of financial derivatives transactions to total assets, which is likely to distort the analysis, we incorporate the amount of derivative costs as the variables.

16
2000 to 13.41% in 2001 and then drops drastically to 11.97% in 2002. The changes in asset
allocations are categorized as a result from the insurers’ capital management as well as financial
management. In addition, we use the growth in premium written (NPW_GW) as one of the
manifest variables for the latent capital management. Table 1 shows that NPW_GW grows from
4.91% in 2000 to 7.02% in 2001 and drops to 1.76% in 2002. Capacity constraint suggests that
an insurer tends to limit the supply of insurance once a major event that can possibly cause
insurers to suffer underwriting losses. Within the sample period, the events of September 11 can
be one of the major factors causing capacity constraint at that time.
In addition, the manifest variables for capital management are the ratios of capital relative
to assets (Cap_TA), the ratios of policyholders’ surplus to risk-based capital (Sup_RBC), ratios
of risk-based capital to regulatory required capital (RBC_Reg), and the liability risks. Liability
risks are measured by the ratios of long-tail reserves to total liabilities (LgTail_L). Results show
that Cap_TA decreases from 2000 to 2002, however the values of risk-based capital relative to
the regulatory requirement presents an increasing trend from 2001 to 2002. On the other hand,
the ratio of long-tail reserves to total liabilities goes downward from 2000 to 2001, but upward
from 2001 to 2002 suggesting that liability risks have changed over time with dynamic character
as asset risks do. The above observations show that policy holders’ surplus (Sup_RBC) is
increasing and regulatory constraints (RBC_Reg) are becoming tighter after 2001 and the events
of September 11. Also, this downward-upward pattern of LgTail_L and LR_Pro_L indicates that
the ratios of loss reserves are increasing after 2001, which is likely to come from the significant
loss incurred due to the events of September 11, 2001.
17
Table 1 Summary of Variables
Year mean Std Obs mean Std Obs mean Std Obs
RePrem 50,127,526 242,701,809 1072 48,603,573 233,458,501 1076 63,849,537 304,928,594 1043Re_NPW 0.2955 0.2604 1072 0.3063 0.2680 1076 0.3148 0.2664 1043Re_GPW 0.2163 0.1627 1072 0.2211 0.1615 1076 0.2271 0.1606 1043T_Amount 8,530,010 401,255,958 1941 19,576,118 620,186,348 1962 (3,188,198) 301,947,858 1891BdPct 0.6737 0.2577 1971 0.6702 0.2591 1971 0.6686 0.2532 1891StkPct 0.1387 0.1749 1971 0.1341 0.1724 1971 0.1197 0.1585 1891MgPct 0.0032 0.0275 1971 0.0030 0.0217 1971 0.0025 0.0186 1891RePct 0.0117 0.0347 1971 0.0108 0.0304 1971 0.0111 0.0334 1891NPW_Gw 4.9058 190.7484 1918 7.0182 131.0746 1971 1.7645 13.0534 1891Cap_TA 0.4795 0.2190 1971 0.4485 0.3905 1971 0.4217 0.2214 1891Sup_RBC 1.0154 0.3329 1837 0.9998 0.5905 1846 1.0055 0.3168 1772RBC_Reg 24.7633 187.8682 1812 17.4278 66.6116 1825 17.6494 97.6270 1767LgTail_L 0.1162 0.2194 1941 0.1107 0.2023 1960 0.1133 0.2456 1885LR_Pro_L 0.0050 0.0223 1941 0.0044 0.0171 1960 0.0051 0.0222 1885Legend: RePrem: reinsurance premium written. Re_NPW RePrem divided by Net Premium Written. Re_GPW RePrem divided by Gross Premium Written. T_Amount: The notional amount of financial derivative transactions. BdPct: Asset investment in bond to total investment. StkPct: Asset investment in stock to total investment. MgPct: Asset investment in Mortgage of real estate to total investment. RePct: Asset investment in real estate to total investment. NPW_Gw: the growth rate of net premium written. Cap_TA: ratio of capital to asset. Sup_RBC: ratio of policy holders' surplus to RBC. RBC_Reg: regulatory constraint, whether RBC>=2.
2000 2001 2002
18
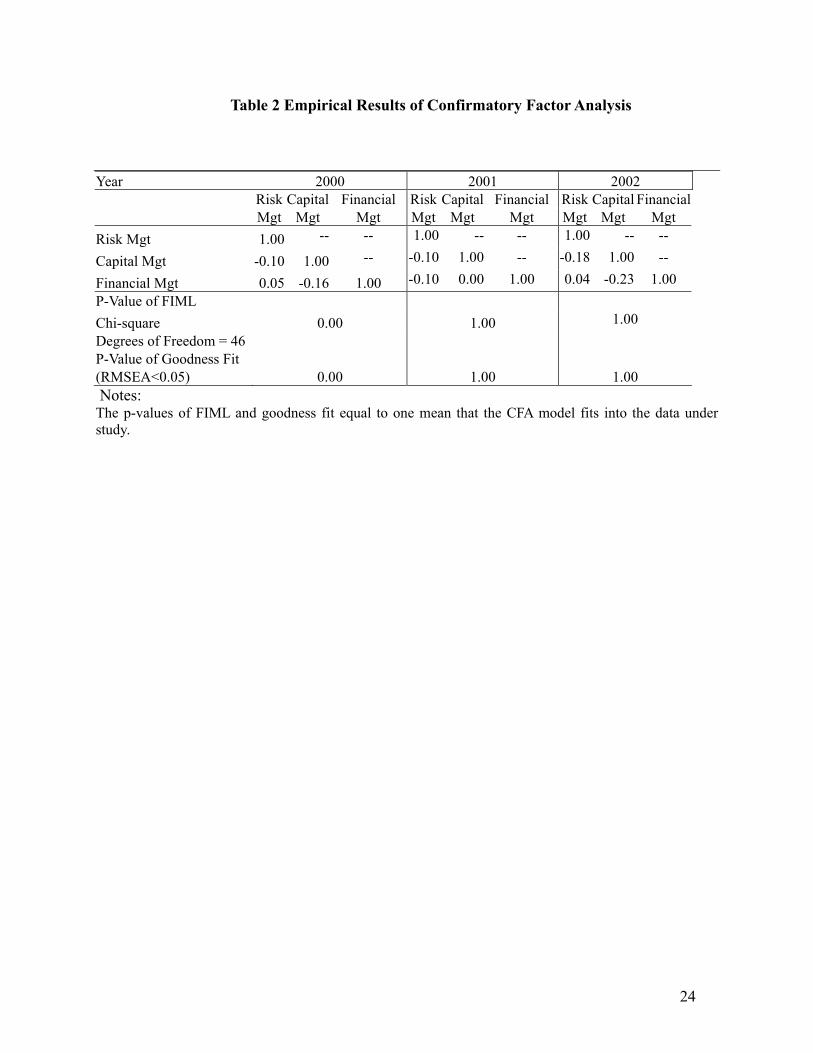
III.2 Empirical Results of the Confirmatory Factor Analysis
After creating the manifest variables that are possibly related to the three latent
managerial decisions and before utilizing SEM, we first employ confirmatory factor analysis to
examine the pre-hypothesized correlations between the latent variables and manifest variables as
illustrated in Figure 1 with the results presented in Table 2.
In Table 2, we observe that the hypothesized structure of the CFA model fits into the data
analyzed in this study. The full information ML Chi-square provides evidence supporting the
goodness of model fit for the hypothesized factor structure between the latent variables as well as
between the latent and manifest variables for 2001 and 2002.5 Even though the full information
ML Chi-square shows that the CFA model does not fit in 2000, the results from the SEM shown
in the next section supports that the SEM model fits into the data in the entire sample period
from 2000 to 2002. Hence, we can conclude that the use of our prior hypothesized structure is
valid.
Results shown in Panel I of Table 3 depict a consistently negative correlation between
risk management and capital management over the sample period, a negative relationship
between capital management and financial management, and a positive relationship between risk
management and financial management, except in 2001.
Taken together, results suggest that as the insurers behave actively in risk management
and actively in financial management (correlations are 0.05 and 0.04 in years 2000 and 2002,
respectively, which indicate positive correlation between risk and financial managements), the
insurers are likely to engage in higher risk-taking behaviors in terms of a looser capital
management (correlations between capital and financial managements in years 2000 and 2002
are -0.16 and -0.23, respectively; correlations between capital and risk management in years
2000 and 2002 are -0.01 and -0.18, respectively). This result is consistent with the conclusions in
Froot and Stein (1998) and the empirical evidence in Cebenoyan and Strahan (2004) in which the
banking industry is used as the research sample. Our results augment these previous results by
using the insurance industry as the research subject and conclude that the phenomenon of active
risk management strategy leading to more aggressively risk-taking capital management prevails
in financial institutions, including commercial banks and property insurance companies.
5 The goodness of model fit cannot reject the null hypothesis that the RMSEA=0 for years 2001 and 2002.
19
In 2001, the correlation between risk management and capital management is negative and
so is the correlation between risk management and financial management, while capital
management is positively correlated (not significantly) with financial management. The
correlations suggest that when a company actively implements capital management and/or
financial management in terms of conservative asset allocations and liability risks, the insurers’
risk management is likely to be less active. Correspondingly, a spontaneous dynamic balancing
relationship between capital, financial and risk management exists such that an insurer will not
be over-hedging or over-managing its risk, while asset and liability risks are controlled at
conservative levels through active capital and financial management.
In summary, the existence of at least a negative correlation between two of the three
managerial decisions provides evidence showing that while one of the three managerial decisions
is actively implemented and negatively correlated with one of the other two decisions, a balanced
overall risk-taking level can be presented. In addition, we conjecture that such spontaneous
balancing strategies among the three managerial decisions can be attributed to regulatory
scrutiny under which risks should be taken and maintained at a reasonable level to meet the
regulatory requirement and the goal of value maximization. Results from confirmatory factor
analysis confirm the existence of the correlations among the three managerial variables as well as
the correlations between the latent variables and the manifest variables. In order to further
examine the causality relationship, we construct a three-level structural equations model.6
III.3 The Empirical Results of the Structural Equation Modeling
In this section we utilize a three-level structural equations model to investigate not only the
relationships and interrelationships between regulations and the three managerial decisions, but
also their net impact on the observed corporate strategies—the decisions on the use of financial
derivatives and reinsurance, on the underwriting sector, on the choice of stocks and bond
investments, and on the use of equity or debt. Causal relationships are established through the
applications of SEM.7
6 The statistical relationships (e.g. correlation) indicated in the confirmatory factor analysis is on a symmetric basis. However the causality relationships depicted under SEM allow the effects between two latent variables to be asymmetric suggesting that the effects from the first latent variable on the second one can be different from the effects from the second latent variable on the first one in terms of the mathematical signs and magnitudes. 7 Under SEM framework, the causal relationship between two latent variables can be assumed to be symmetric by imposing a constraint, for example, β12 =β21 in Figure 2, suggesting that the effects between the two latent variables

20
Figure 2 illustrates the structure that indicates the relationships between the latent variables
and between the latent and manifest variables. The manifest variables for measuring the direct
influences from risk management are the reinsurance premium payments and the transactions in
financial derivatives; the manifest variables for measuring the direct effects from capital
management are underwriting risks (growth in premium written), asset risks (investments in
stocks, bonds, mortgage real estate, and real estate), liability risks (the ratios of long-tail loss
reserves to total liabilities), the ratio of policyholders’ surplus to risk-based capital and the ratio
of risk-based capital to regulatory capital level; and among the same set of variables, premium
growth and asset allocations are specified as the manifest variables for measuring the effects of
financial management. The interpretation of the structure is, for example, the direct effects from
risk management on the degree of use of reinsurance and financial derivatives takes into
account the effects of regulations on risk management and its interrelationships with capital and
financial management.
The empirical results of the three-level SEM are summarized in Panels I, II and III of
Table 3. The parameters to be estimated in SEM indicate the causality relationship among the
variables. This study employs the LISREL 8.8 (Linear Structural Relationships) statistical
package for estimation purposes and parameter estimates are based on ML estimation.
In order to identify the net effects on the observed corporate strategies, the interpretation of
the results shown in Table 3 should start from the first-level of SEM that indicates the regulation
effects on the three managerial decisions (Panel I), then after the regulation effects are taken into
account, the second-level of SEM considers the inter-effects between the three latent variables
(Panel II), and finally the third-level of SEM is for aggregated net effects (Panel III) from the
effects of regulations and interacted effects of the managerial decisions. However, the first- and
second-level of SEM are viewed under an intertemporal status before the structure achieves its
equilibrium status. Correspondingly, results of the net effects shown in the third-level are the
main focus of the utilization of SEM.
Moreover, the net effects from financial management on risk management and capital
management have changed over time. Such time-varying interacted effects indicate the
are the same. However, with sufficient information for estimation, this study utilizes the SEM on a more general framework by allowing the asymmetric effects between two latent variables, i.e. β12≠β21. Correspondingly, the results can show different coefficient estimates for capital management from the coefficient estimate for risk management when their interrelationship is discussed.
21
rebalancing relationship between them and suggest that the discussions on the inter-relationships
should not be on a static basis.
Results shown in Panel III suggest that risk management has positive influence on the use
of reinsurance and financial derivatives over the sample period from 2000 to 2002. Such positive
net effects are attributed to the consistently positive intertemporal effects from regulations (first-
level of SEM), and from the interacted effects of capital and financial management (second-level
of SEM). Capital management consistently has negative effects on risk management, whereas
financial management negatively affects risk management in 2000, positively affects risk
management in 2002, and has no effects in 2001. The intertemporally negative effects from
capital management on risk management are consistent with Stein and Froot (1998) and
Cebenoyan and Strahan (2004) concluding that more emphasis on managing capital leads to less
effort in managing risk level. Furthermore, the dominating direct intertemporal effects from
regulations motivate insurers to use more reinsurance as well as financial derivatives. It is
noteworthy that after incorporating the effect from regulations and from financial and capital
management, the net effect of risk management on the magnitude of reinsurance use stays at a
stable level over years 2000, 2001, and 2002 with coefficient estimates 0.24, 0.48, and 0.50,
respectively. Whereas, risk management triggered the largest magnitude of using financial
derivatives in year 2001 with the coefficient estimate 1.26 compared to 0.40 and 0.50 in years
2000 and 2002, respectively.
While capital management imposes positive net effects on insurers’ underwriting risks
and capital adequacy relative to assets, along with negative effects on investment risks in stocks
and bonds and on liability risks in terms of the ratio of long-tail reserves to total liabilities, it
suggests aggressive underwriting activity is implemented with conservative investment strategies
in allocating assets in bonds and stocks along with a higher level of capital. Thus, a balancing
strategy between underwriting and investment risks is observed. In addition, along with the
consideration of regulations, the balancing strategy is a reasonable result under a regulatory
mechanism so that the underwriting and investment risks can meet regulatory requirements.
For example, results in 2001 presented such a balancing strategy mentioned above. A
significant positive effect from capital management is observed on premium growth (i.e.
aggressive underwriting activities; NPW_GW) with the magnitude of 7.41, and negative effects
(conservative investment strategy) are presented in the investment portfolio of stocks (Stk_Pct)

22
and bonds (Bd_Pct) with the magnitude -0.13, and -0.01, respectively. In addition, such
rebalancing strategies are in synch with the adequacy of capital levels required by regulations
(RBC_Reg) with the coefficients 1.49, 0.08, and 18.9 in years 2000, 2001, and 2002,
respectively. As mentioned above, the net effects from capital management are attributed to the
consistently positive direct effects of regulations shown in the first-level and to the intertemporal
interacted effects of risk management and financial management that are positive in years 2000
and 2002 suggesting that more active risk management and financial mismanagement will result
in more active capital management.8
The net effects of financial management are presented in the coefficients of premium
growth (NPW_GW), and investment allocation (Stk_Pct and Bd_Pct), which represent the
changes in the liabilities and asset allocations, respectively. Over the sample period, the net
effects are positive on the growth of premium (coefficients are 1.00, 0.34, and 0.51 for years
2000, 2001, and 2002, respectively) and on the investment allocations in stocks with coefficients
0.05, 0.12, and 0.18 for years 2000, 2001, and 2002, respectively, whereas the effects are 0.21, -
0.02, and 0.37 on bond investments. Reviewing the first-level of structure, one can find that
compared to the effects of regulations on risk and capital management, the regulation effect on
financial management is the least and present a decreasing trend with the values 0.59, then 0.55,
and then to 0.34 in years 2000, 2001, and 2002, respectively. In addition, the intertemporal
interacted effects from risk and capital management on financial management are negative,
which suggests that as insurers actively manage risk and capital, financial management can
become less emphasized. Thus an aggressive increase in the liability level by underwriting
insurance policies can be observed.
8 In year 2002 the effect from capital management on risk management is negative with magnitude -0.07, whereas the effect of risk management on capital management is positive with magnitude 0.08. The existence of such asymmetric effects between risk and capital management results from the general estimation of SEM.
23
Conclusions
This study utilizes a three-level structural equations model (SEM) to empirically show the
direct effects of regulations and interacted effects of risk management, capital management and
financial management that are reflected as the net effects on the observed corporate strategies in
the use of financial derivatives and reinsurance, asset allocations in invested asset risks in bonds
and stocks, underwriting activities, and capital adequacy. In addition, the analysis over the
sample period from year 2000 to year 2002 provides evidence supporting that the
interrelationships of the three latent managerial decisions along with their relationships with the
observed manifest variables are not static and with time-varying characteristics.
Empirical results are consistent with the conclusions drawn in Stein and Froot (1998) and
Cebenoyan and Strahan (2004) that more active capital and financial management can be
associated with less risk management. Such interrelationships are presented as the net effects
with more reinsurance written, more financial derivative use, more conservative bond and stock
investment choices, and a higher level of capital relative to both asset and regulatory
requirements. In terms of methodologies, advanced techniques in the estimation of SEM will be
applicable for future research.
While the linkage of risk management, capital management and financial management
should be under an integrated framework as emphasized by principals of enterprise risk
management, the regulatory characteristics embedded in the insurance industry should play an
essential role in the integration of managerial decisions. Results from this study can provide an
avenue for future study in examining the integrated effects of regulations and managerial
decisions for other highly regulated industries; for example the banking industry. This is
especially relevant as the New Basel Accord (Basel II) requires three-pillar regulation that is
analogous to the framework of those latent variables specified in this study for the insurance
industry. Moreover, the boundary between banking and insurance has become blurred recently
with and more and more ‘banksurance’ companies surfacing such that the consideration of
integrated corporate strategies is even more important on an integrated industry basis.
24
Table 2 Empirical Results of Confirmatory Factor Analysis
Year 2000 2001 2002 Risk Capital Financial Risk Capital Financial Risk Capital Financial Mgt Mgt Mgt Mgt Mgt Mgt Mgt Mgt Mgt Risk Mgt 1.00 -- -- 1.00 -- -- 1.00 -- --
Capital Mgt -0.10 1.00 -- -0.10 1.00 -- -0.18 1.00 --
Financial Mgt 0.05 -0.16 1.00 -0.10 0.00 1.00 0.04 -0.23 1.00 P-Value of FIML Chi-square 0.00 1.00 1.00 Degrees of Freedom = 46 P-Value of Goodness Fit (RMSEA<0.05) 0.00 1.00 1.00 Notes: The p-values of FIML and goodness fit equal to one mean that the CFA model fits into the data under study.

25
Table 3 Empirical Results of the Structural Equation Modeling
Panel I Parameter Estimates of First-level Structural Regression Year 2000 2001 2002 Risk Capital Financial Risk Capital Financial Risk Capital Financial Mgt Mgt Mgt Mgt Mgt Mgt Mgt Mgt Mgt Regulation 1.21 1.34 0.59 0.98 1.02 0.55 0.38 0.82 0.34 Panel II Parameter Estimates of Second-level Structural Regression Year 2000 2001 2002 Risk Capital Financial Risk Capital Financial Risk Capital Financial Mgt Mgt Mgt Mgt Mgt Mgt Mgt Mgt Mgt Risk Mgt - - -0.11 -0.17 - - -0.01 0.00 - - -0.07 0.11 Capital Mgt 0.01 - - 0.05 -0.01 - - -0.03 0.08 - - 0.26
Financial Mgt -0.03 -0.17 - - -0.22 -0.29 - - -
0.30 0.17 - - Panel III Parameter Estimates of Measurement Equations Regression Year 2000 2001 2002 Risk Capital Financial Risk Capital Financial Risk Capital Financial Mgt Mgt Mgt Mgt Mgt Mgt Mgt Mgt Mgt RePrem 0.24 - - - - 0.48 - - - - 0.50 - - - - T_Amount 0.40 - - - - 1.26 - - - - 0.50 - - - - NPW_Gw - - 7.41 1.00 - - -0.02 0.34 - - -0.18 0.51 BdPct - - -0.13 0.21 - - -0.16 -0.02 - - -0.45 0.37 StkPct - - -0.01 0.05 - - 0.12 0.12 - - -0.12 0.18 MgPct - - 0.00 0.00 - - 0.00 0.00 - - 0.00 0.01 RePct - - 0.00 0.00 - - 0.01 -0.01 - - 0.00 0.00 Cap_TA - - 0.45 - - - - 0.47 - - - - 0.49 - - Sup_RBC - - -0.01 - - - - 0.02 - - - - -0.01 - - RBC_Reg - - 1.49 - - - - 0.08 - - - - 18.10 - - LgTail_L - - -0.01 - - - - -0.02 - - - - -0.08 - - LR_Pro_L - - 0.00 - - - - 0.00 - - - - 0.00 - - P-Value of FIML Chi-square 1.00 1.00 1.00 Degrees of Freedom = 40 P-Value of Goodness Fit (RMSEA<0.05) 1.00 1.00 1.00 Notes: RePrem: reinsurance premium written. Re_NPW RePrem divided by Net Premium Written. Re_GPW RePrem divided by Gross Premium Written. T_Amount: The notional amount of financial derivative transactions. BdPct: Asset investment in bond to total investment. StkPct: Asset investment in stock to total investment. MgPct: Asset investment in Mortgage of real estate to total investment. RePct: Asset investment in real estate to total investment. NPW_Gw: the growth rate of net premium written.

26
Cap_TA: ratio of capital to asset. Sup_RBC: ratio of policy holders' surplus to RBC. RBC_Reg: regulatory constraint, whether RBC>=2. The p-values of FIML and goodness fit equal to one mean that the SEM model fits into the data under study.

27
References
Cebenoyan, Sinan, and Philip E. Strahan, 2004, “Risk Management, Capital Structure and
Lending at Banks.” Journal of Banking and Finance 28, 19–43.
Chen, Xuanjuan, Helen Doerpinghaus, Bingxuan Lin, and Tong Yu, 2006, “Catastrophic Losses
and Insurer Profitability: Evidence from 9/11.” Journal of Risk and Insurance,
Forthcoming.
Culp, Christopher, 2002, “Contingent Capital: Integrating Corporate Financing and Risk
Management Decisions.” Journal of Applied Corporate Finance 15, 46-56.
Cummins, David and Joan Lamm-Tennant, 1994, “Capital Structure and the Cost of Equity
Capital in the Property-Liability Insurance Industry.” Insurance: Mathematics and
Economics 15, 187–201.
Daníelsson, Jon, Bjorn Jorgensen, and Casper G. de Vries, 2002, “Incentives for Effective Risk
Management.” Journal of Banking and Finance 26, 1407–1425.
Fischer, Stanley, 1978, “Call Option Pricing When the Exercise Price is Uncertain, and the
Valuation of Index Bonds.” Journal of Finance 33, 169–176.
Froot, Kenneth A., David Scharfstein, and Jeremy Stein, 1993, “Risk Management: Coordinating
Corporate Investment and Financing Policies.” Journal of Finance 48, 1629–1658.
Froot, Kenneth A., and Jeremy Stein, 1998, “Risk Management, Capital Budgeting and Capital
Structure Policy for Financial Institutions: An Integrated Approach.” Journal of Financial
Economics 47, 55–82.
Leland, Hayne, 1998, “Agency Costs, Risk Management and Capital Structure.” Journal of
Finance 53, 1213–1243.
Jöreskog, Karl and Dag Sörbom, 2001, LISREL®8: User’s Reference Guide, Science Software
International Inc.
Merton, Robert, 1976, “Option Prices When Underlying Stock Returns are Discontinuous.”
Journal of Financial Economics 3, 125–144.
Mueller, Ralph, 1996, Basic Principles of Structural Equation Modeling. New York: Springer-
Verlag.
Shimpi, Prakash, 2002, “Integrating Risk Management and Capital Management.” Journal of
Applied Corporate Finance 14, 27–40.
Related Documents


![Estimating and interpreting structural equation models … · Estimating and interpreting structural equation models in Stata 12 ... and Var [ǫ] = Σ sem (y1 ... Structural equation](https://static.cupdf.com/doc/110x72/5b286e167f8b9ae8108b4592/estimating-and-interpreting-structural-equation-models-estimating-and-interpreting.jpg)