GE-INTERNATIONAL JOURNAL OF ENGINEERING RESEARCH VOLUME -2, ISSUE -5 (JULY 2014) IF-3.022 ISSN: (2321-1717) A Monthly Double-Blind Peer Reviewed Refereed Open Access International e-Journal - Included in the International Serial Directories. GE- International Journal of Engineering Research (GE-IJER) Website: www.aarf.asia . Email: [email protected] , [email protected] Page 66 APPLICATION OF SERVQUAL IN CAMPUS SHUTTLE SERVICE OJO Thomas Kolawole, Department of Geography and Regional Planning University of Cape Coast, Cape coast, Ghana. AMOAKO-SAKYI Regina, Department of Geography and Regional Planning University of Cape Coast, Cape coast, Ghana. AGYEMANG William, Building and Road Research Institute Kumasi. ABSTRACT The study is to apply SERVQUAL scale in assessing campus shuttle bus service. The methodology was opinion survey of simple randomly selected 300 respondents at the two designated stations for the shuttle service. The cronbach’salpha of the attributes ranges from 0.903-0.907. Frequencies, percentage, mean andpaired sample t-testwas used for the data analysis. The results of the study indicates that 55% of the respondents are male; 70.2% are aged between 20-24years; 67.3% use the shuttle every other day; 50.5% use the campus shuttle because of the lower transport fares; 83.7% use the campus shuttle for educational reasons; all the five dimensions have negative gap scores and 17 attributes are statistically significant with p-value<0.005. The study makes recommendations for better service delivery. Keywords: Campus shuttle, service quality, SERVQUAL Introduction Public transport as a means of transport enables people to move from one location to the other. In developing countries, public transport is either funded by the government, operated by the private sector or the synergy between the two. But the private sector plays a dominant role in providing public transport services. This is because some of the state funded public transport

Welcome message from author
This document is posted to help you gain knowledge. Please leave a comment to let me know what you think about it! Share it to your friends and learn new things together.
Transcript
GE-INTERNATIONAL JOURNAL OF ENGINEERING RESEARCH
VOLUME -2, ISSUE -5 (JULY 2014) IF-3.022 ISSN: (2321-1717)
A Monthly Double-Blind Peer Reviewed Refereed Open Access International e-Journal - Included in the International Serial Directories. GE- International Journal of Engineering Research (GE-IJER)
Website: www.aarf.asia. Email: [email protected] , [email protected] Page 66
APPLICATION OF SERVQUAL IN CAMPUS SHUTTLE SERVICE
OJO Thomas Kolawole,
Department of Geography and Regional Planning
University of Cape Coast, Cape coast, Ghana.
AMOAKO-SAKYI Regina,
Department of Geography and Regional Planning
University of Cape Coast, Cape coast, Ghana.
AGYEMANG William,
Building and Road Research Institute
Kumasi.
ABSTRACT
The study is to apply SERVQUAL scale in assessing campus shuttle bus service. The
methodology was opinion survey of simple randomly selected 300 respondents at the two
designated stations for the shuttle service. The cronbach’salpha of the attributes ranges from
0.903-0.907. Frequencies, percentage, mean andpaired sample t-testwas used for the data
analysis. The results of the study indicates that 55% of the respondents are male; 70.2% are
aged between 20-24years; 67.3% use the shuttle every other day; 50.5% use the campus shuttle
because of the lower transport fares; 83.7% use the campus shuttle for educational reasons; all
the five dimensions have negative gap scores and 17 attributes are statistically significant with
p-value<0.005. The study makes recommendations for better service delivery.
Keywords: Campus shuttle, service quality, SERVQUAL
Introduction
Public transport as a means of transport enables people to move from one location to the
other. In developing countries, public transport is either funded by the government, operated by
the private sector or the synergy between the two. But the private sector plays a dominant role in
providing public transport services. This is because some of the state funded public transport

GE-INTERNATIONAL JOURNAL OF ENGINEERING RESEARCH
VOLUME -2, ISSUE -5 (JULY 2014) IF-3.022 ISSN: (2321-1717)
A Monthly Double-Blind Peer Reviewed Refereed Open Access International e-Journal - Included in the International Serial Directories. GE- International Journal of Engineering Research (GE-IJER)
Website: www.aarf.asia. Email: [email protected] , [email protected] Page 67
service providers have folded up while others have been established to replace the old ones. A
couple of researches have been conducted to look at issues concerning these government funded
agencies (Abane, 2009; Ojo et al., forthcoming). One enviable phenomenon about these
government funded agencies is the economic nature of their fares. The faresare comparatively
cheaper.
Amongst all the forms of public transport, bus is noted to carry a large number of
passengers at a go. Passengers rely on it for social or entertainment, education, religious, official
and business purposes. Bus transports is not just about moving passengers or goods from one
place to another, but a service business and are provided by different bus agencies with their own
specific aims. In University of Cape Coast, bus service is provided by both the school
management and the private sector. The private operators are located at the old site and new sites
car parks in the school. The operators queue to pick passengers at these stations with no
schedules. The bus leaves whenever all the seats are occupied. But the Campus shuttle operates
from the shuttle bus park provided by the management at both old and new sites. The campus
shuttle fare is comparatively cheaper than that of the private operators. This makes students
commuting within the school patronize the campus shuttle more. As a result of this patronage,
palpable queues are observed in the morning from 8-9am on weekdays at Old site and 4-5pm at
new site. There are also no shelters and seats provided for the passengers at the stations. This
invariably affects perception of service quality. More so, Ojo et al (forthcoming) assessed
students’ satisfaction of campus bus service using the QUALBUS scale. The study focused on
the perception of service quality neglecting the expectation of the students.It is in this vein that
this study seeks to adopt the SERVQUAL scale by comparing the passengers’ expectations and
perceptions of campus shuttle bus service.
The main objective of the study is to apply SERVQUAL developed by (Parasuramum, et
al) in assessing campus bus service in the University of Cape Coast. The specific objectives are
toassess the expectation and perception mean scores for the SERVQUAL scale; compute the gap
scores of the five SERVQUAL dimensions and to ascertain the attributes of service quality. The
research questions are:
GE-INTERNATIONAL JOURNAL OF ENGINEERING RESEARCH
VOLUME -2, ISSUE -5 (JULY 2014) IF-3.022 ISSN: (2321-1717)
A Monthly Double-Blind Peer Reviewed Refereed Open Access International e-Journal - Included in the International Serial Directories. GE- International Journal of Engineering Research (GE-IJER)
Website: www.aarf.asia. Email: [email protected] , [email protected] Page 68
1. What are the differences in mean scores for expectations and perceptions of service
quality?
2. Which of the attributes of SERVQUAL influences perception of service quality?
3. How do the gap scores of SERVQUAL dimensions differ from one another?
Literature review
Campus shuttle service as a program is necessitated by a couple of important factors. One
of such is off-campus housing based on student density (Juarez, 2011). The University of Cape
Coast accommodates 37.8% of its students’ population in halls of residence (SRMIS, 2011). The
remaining students live in private hostels dotted round the campus. The campus shuttle bus
conveys both residential and non-residential students to/from the old site and the new site.
Krizek, et al (2012) observes that this service should become a solution to sustainable transport
in future for university campuses because students heavily depend on this service. Hashim et al
(2013 a) posit that poor quality of service campus shuttle service will cause students to miss
classes, waste precious time and discourage them from riding the shuttle buses. Hashim, et al
(2013 b) in a different study note that other discomforts such as tardiness of bus services,
unpleasant rides, as well as issues on safety, unsupportive personnel fuel the users’ negative
perception on campus transport services. Juarez (2011) identifies four practical ideal models in
assessing universities’ transit services- (1) operations model, (2) funding model, (3) scope of
service model, and (4) environmental responsiveness model. Hashim et al (2013 b) in a study on
twelve universities (8000 respondents) in Malaysia provided empirical evidence for campus
shuttle service efficiency leading to a greener and conducive environment on the university
ground.
This study adopts the scope of service model to assess UCC campus shuttle bus service.
This is accomplished by using the SERVQUAL scale which has been universally applied in
public transport studies (Ojo et al., forthcoming; Mercangöz et al., 2012). The universality of
SERVQUAL scale has come under a couple of criticisms. Notably is the number of dimensions
and attributes constituting the SERVQUAL scale. For instance Ojo et al (forthcoming)
maintained the five dimensions but used 26 attributes on intercity bus passengers in Ghana,
Miguel et al., (2010) administered a ten-item SERVQUAL questionnaires on 105 customers and
GE-INTERNATIONAL JOURNAL OF ENGINEERING RESEARCH
VOLUME -2, ISSUE -5 (JULY 2014) IF-3.022 ISSN: (2321-1717)
A Monthly Double-Blind Peer Reviewed Refereed Open Access International e-Journal - Included in the International Serial Directories. GE- International Journal of Engineering Research (GE-IJER)
Website: www.aarf.asia. Email: [email protected] , [email protected] Page 69
21 managers of a vehicle repair service chain in Brazil and Mercangöz et al (2012) used a 28-
item SERVQUAL questionnaire administered on passengers to analyze service quality of a fast
ferry company in Turkey.
SERVQUAL is based on the “GAP model” of service quality which facilitates
quantification of the gap between customers’ expectations of a service and their perceptions of
the actual service delivered. These three or five numbered attributes (21 attributes) on the
modified SERVQUAL scale (see table 1) are used to measure each dimension based on
expectations and perceptions of services rendered. To achieve these measurements the
respondents are asked to indicate their degree of agreement with certain statements bordering on
each of the 21 items on a 5-point Likert-type scale (1 = strongly disagree and 5= strongly agree.
There are three ways to arrive at the gap score- viv-a-vis the averages of either for each of the
attribute(Perception(P)- Expectation(E) divided by one), dimension by dimension analysis(
(P1+P2+P3+P4)-(E1+E2+E3+E4)/4), where P1 to P4, and E1 to E4, represent the four
perception and expectation statements relating to a single dimension and all the 22-item
attributes((P1+P2+P3+P4…+P22)-(E1+E2+E3+E….+E22))/22, the so-called SERQUAL gap..
The greater the “gap score” (calculated as G =P-E) the higher the score for perceived service
quality.
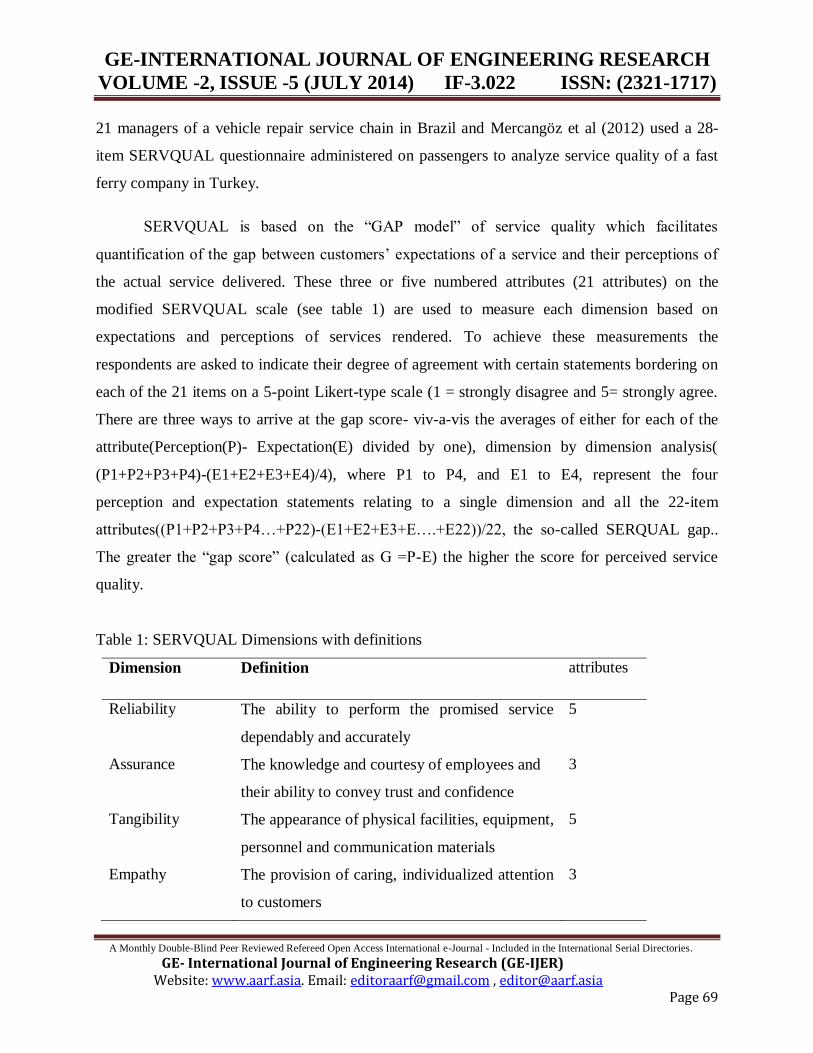
Table 1: SERVQUAL Dimensions with definitions
Dimension Definition attributes
Reliability The ability to perform the promised service
dependably and accurately
5
Assurance The knowledge and courtesy of employees and
their ability to convey trust and confidence
3
Tangibility The appearance of physical facilities, equipment,
personnel and communication materials
5
Empathy The provision of caring, individualized attention
to customers
3
GE-INTERNATIONAL JOURNAL OF ENGINEERING RESEARCH
VOLUME -2, ISSUE -5 (JULY 2014) IF-3.022 ISSN: (2321-1717)
A Monthly Double-Blind Peer Reviewed Refereed Open Access International e-Journal - Included in the International Serial Directories. GE- International Journal of Engineering Research (GE-IJER)
Website: www.aarf.asia. Email: [email protected] , [email protected] Page 70
Responsiveness The willingness to help customers and to
provideprompt service
5
Source: Parasuraman et al., 1988; Ojo et al., (forthcoming)
The following are the noteworthy purposes for measuring service quality with
SERVQUAL (Zeithamlet al.,2006):
For the assessment of quality performance on each SERVQUAL dimensions;
For the assessment of service performance contrast to direct competitors;
For the categorization of different customer segments; and
For the records of changes in service quality perception among customers over a
specified time period.
Research methodology
Three hundred copies of pre-tested questionnaires were administered through a face to
face method. The questionnaire was divided into two parts with the first part containing the basic
characteristics of the students and the second part addressing the 21 attributes SERVQUAL scale
divided into five dimensions. The measurement and analysis method that is used consist of
reliability test, descriptive analysis and paired sample t-test. Finally a five-point likert scale has
been applied in the questionnaire. The 300 students were randomly selected at the two stations
where students board the campus shuttle bus. The students were accosted while waiting for the
bus early November, 2013 from 8am-6pm.
Results and analysis
Majority of the respondents are males representing 55% and 45% are females. The
highest percentage of the respondents representing 70.2% is aged between 20-24 years, 21.1%
are aged between 15-19 years, 6.2% are between 24-29years and the rest are above 30 years. The
highest percentage of respondents representing 67.3% use the campus shuttle every other day,
21.6% use it about twice a week, 16.7% are occasional users and 5.6% use it once a day or more
than once a day. The highest percentage of respondents representing 50.5% use the campus
GE-INTERNATIONAL JOURNAL OF ENGINEERING RESEARCH
VOLUME -2, ISSUE -5 (JULY 2014) IF-3.022 ISSN: (2321-1717)
A Monthly Double-Blind Peer Reviewed Refereed Open Access International e-Journal - Included in the International Serial Directories. GE- International Journal of Engineering Research (GE-IJER)
Website: www.aarf.asia. Email: [email protected] , [email protected] Page 71
shuttle because of the lower transport fares, 15.3% use it because of safety/security, 11% use it
because of the location of stations/locations, 8.1% use it for scheduling, 7.9% because of
comfortability of the seat and the ample legroom of the buses, 5.7% use it because of speed and
1.4% use it because of disability friendliness. The highest percentage of respondents representing
83.7% use the campus shuttle for educational reasons, 7.9% use it for recreational, 6.4% for
religious activities and 2.4% use it for reasons apart from these three.
Table 2 indicates that the cronbach’s alpha of the perception and expectation attributes range
from 0.903 -0.907. For expectation, the lowest cronbach’salpha’s of 0.905) was recorded by
“drivers are willing to help passengers” and the highest cronbach’salpha of 0.907 was recorded
by the attribute “Transport section always look after the best interest of their customers”. For
perception, the lowest cronbach’salpha 0.903 was recorded by attributes “the shuttle buses have
regular schedules and “drivers are always willing to help passengers” and the highest cronbach’s
alpha of 0.906 was recorded by attribute “transport section always look after the best interest of
their customers”. These cronbach’salpha are high scores and are reliable indicated 0.7 to be an
acceptable reliability coefficient.
The perceived service quality, or gap, score (denoted as Q) is calculated for each attributes by
subtracting the E score from the P score, implying a gap score for each attribute ranging between
-5 and +5. A negative gap score indicates a level of service quality which is below that which is
expected by the customer. Conversely, a zero to positive gap score indicates a level of service
which is equal to or exceeds customer expectations.

GE-INTERNATIONAL JOURNAL OF ENGINEERING RESEARCH
VOLUME -2, ISSUE -5 (JULY 2014) IF-3.022 ISSN: (2321-1717)
A Monthly Double-Blind Peer Reviewed Refereed Open Access International e-Journal - Included in the International Serial Directories. GE- International Journal of Engineering Research (GE-IJER)
Website: www.aarf.asia. Email: [email protected] , [email protected] Page 72
Table 2: Reliability of 21 SERVQUAL attributes
Cronbach’s Alpha
SERVQUAL Dimensions expectation Perception
Reliability
1. The shuttle bus always arrives on time
2. Bus never breaks down on the road
3. Customers don’t queue
4. The shuttle buses have regular schedules .906 .903
5. Drivers are always polite
Assurance
6. customers feel safe in their transactions with staff
7. drivers have in-depth occupational knowledge of their
jobs
8. Behaviour of staff instills confidence in the passengers .905
Tangibles
9. Drivers are neatly dressed and smart
10. Shuttle Bus companies have adequate shed for
passengers obtaining tickets
11. Bus companies have spacious seats for passengers on
board
.906 .904
12. Shuttle buses are well maintained and neat
13. Shuttle buses have ample legroom and foot space
Empathy
14. Transport section always look after the best interest of
their customers
.907 .906
15. Transport section have operating hours convenient to all
their customers
16. It is easy to find and access the bus
station/terminals/waiting points

GE-INTERNATIONAL JOURNAL OF ENGINEERING RESEARCH
VOLUME -2, ISSUE -5 (JULY 2014) IF-3.022 ISSN: (2321-1717)
A Monthly Double-Blind Peer Reviewed Refereed Open Access International e-Journal - Included in the International Serial Directories. GE- International Journal of Engineering Research (GE-IJER)
Website: www.aarf.asia. Email: [email protected] , [email protected] Page 73
Responsiveness
17. Drivers provide individualized attention to help
customers
18. Transport section always inform people of availability
of services and changes in prices in advance
19. Transport section can provide timely and efficient
services
20. Communication with customers is clear and helpful
21. drivers are always willing to help passengers .905 .903
Source: fieldwork, 2013
According to Table 3, the least gap score (-0.41) was recorded by tangibility dimension,
followed by reliability and assurance dimensions with gap score -0.33 each. Empathy dimension
has a gap score of -0.30 and the highest mean was recorded by responsiveness dimension. This
analysis indicates that mean difference between expectations for all the five dimensions are
higher than the mean perceptions. It implies that the mean score for expectations of passengers
are more than that of perceptions.
Table 3: Mean ofSERVQUAL dimensions
Dimensions Perception Expectation
Mean Mean Gapscore
Reliability 2.95 3.28 -0.33
Assurance 3.30 3.63 -0.33
Tangibility 3.14 3.55 -0.41
Empathy 3.22 3.52 -0.30
Responsiveness 3.06 3.34 -0.28
Source: fieldwork, 2013.
GE-INTERNATIONAL JOURNAL OF ENGINEERING RESEARCH
VOLUME -2, ISSUE -5 (JULY 2014) IF-3.022 ISSN: (2321-1717)
A Monthly Double-Blind Peer Reviewed Refereed Open Access International e-Journal - Included in the International Serial Directories. GE- International Journal of Engineering Research (GE-IJER)
Website: www.aarf.asia. Email: [email protected] , [email protected] Page 74
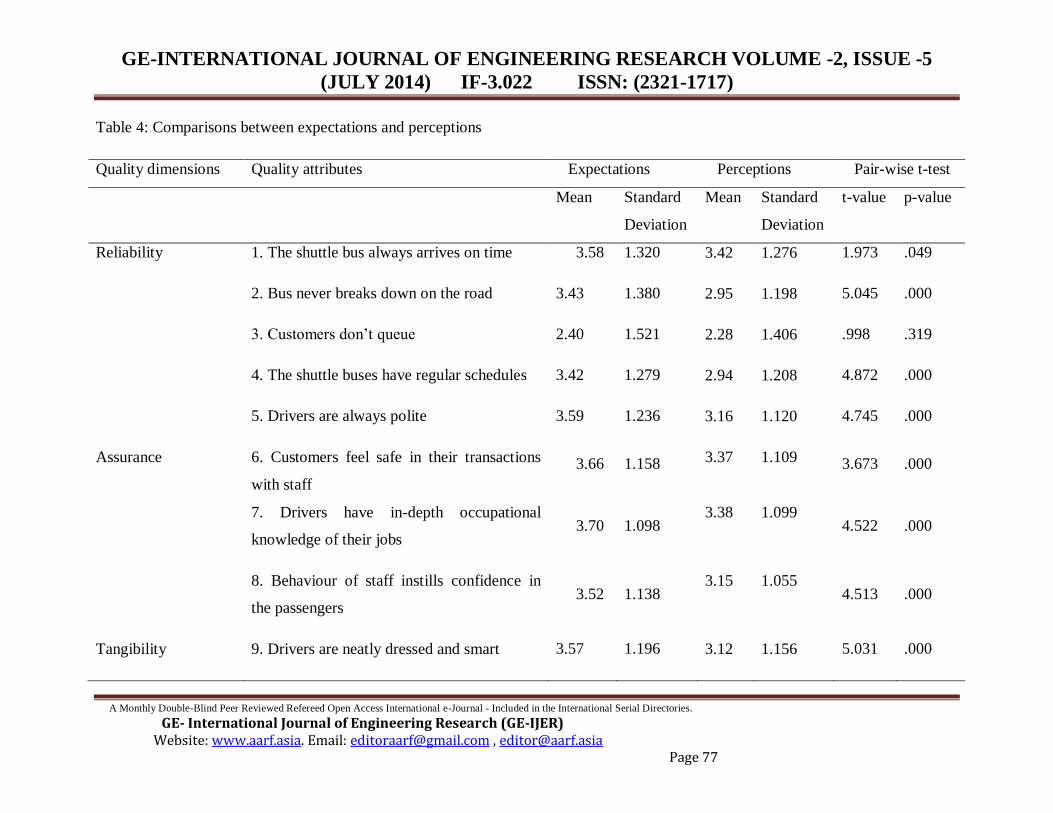
Table 4 shows that seventeen attributes are significant with the p-value less than 0.005.
Three reliability attributes comprising the bus never breaks down, the schedule buses have
regular schedules and drivers are always polite have p-value 0.000 each. All the three assurance
attributes comprising customers feel safe in their transaction with staff, drivers have in-depth
occupational knowledge of their jobs and behavior of staff instills confidence in the passengers
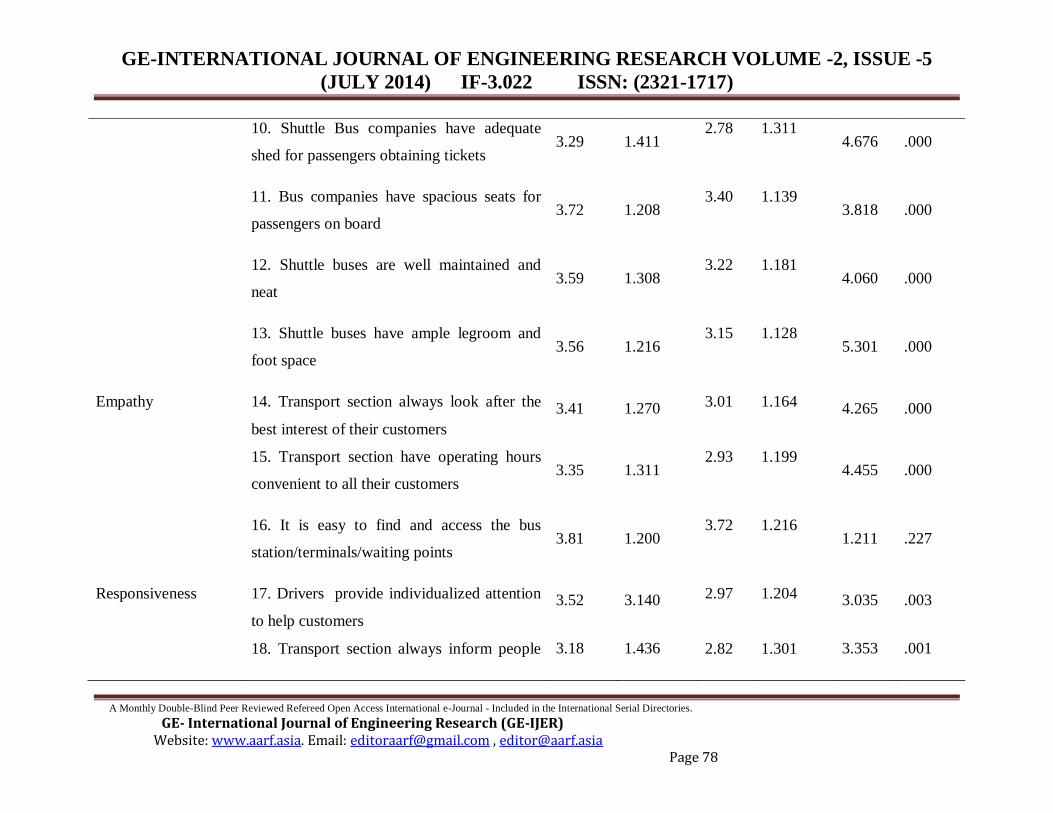
have p-value 0.000. More so, all five tangibility attributes comprising drivers are neatly dressed
and smart, shuttle bus companies have adequate shed for passengers obtaining tickets, bus
companies have spacious seats for passengers on board, shuttle buses are well maintained and
neat and shuttle buses have ample legroom and foot space have p-value 0.000. Two empathy
attributes of transport section always look after the best interest of their customers and transport
section have operating hours convenient to all their staff are significant . All the five
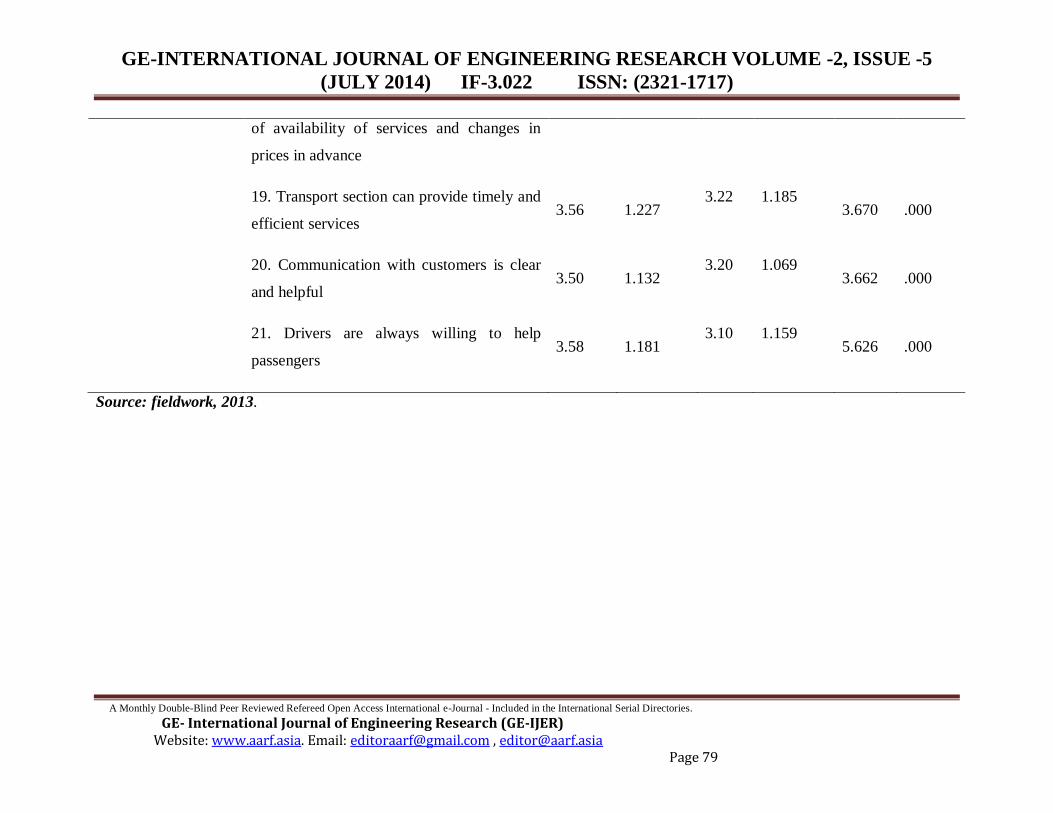
responsiveness attributes are significant.
Discussion and implications
The impetus for this research came from the observations of queues in the sun by
students of the University of Cape Coast from 8-9am and 3-5pm at the two stations provided for
the campus shuttle service. The approach was from student’s perspective and sought for
intervention to improve service delivery from the transport management. Nevertheless, the
results revealed significant implications such that:
1. 67.3% use the campus shuttle every other day, 21.6% use it about twice a week, 16.7%
are occasional users and 5.6% use it once a day or more than once a day. This analysis is
supported by Hassim et al’s (2013) study which posited that students who leave on
campus are highly dependent on public transport specifically bus services (such as shuttle
service). This shows that 50.5% use the campus shuttle because of the lower transport
fares, 15.3% use it because of safety/security, 11% use it because of the location of
stations/locations, 8.1% use it for scheduling, 7.9% because of comfortability of the seat
and the ample legroom of the buses, 5.7% use it because of speed and 1.4% use it
because of disability friendliness. The highest percentage of respondents representing
GE-INTERNATIONAL JOURNAL OF ENGINEERING RESEARCH
VOLUME -2, ISSUE -5 (JULY 2014) IF-3.022 ISSN: (2321-1717)
A Monthly Double-Blind Peer Reviewed Refereed Open Access International e-Journal - Included in the International Serial Directories. GE- International Journal of Engineering Research (GE-IJER)
Website: www.aarf.asia. Email: [email protected] , [email protected] Page 75
83.7% use the campus shuttle for educational reasons, 7.9% use it for recreational, 6.4%
for religious activities and 2.4% use it for reasons apart from these three.
2. The gap scores for all the five dimensions indicate that mean difference between
expectations are higher than the mean perceptions. It implies that the expectations of
passengers are more than the perceptions. The mean scores further show that perceptions
and expectations are above average (2.5-3.5). This expectation may have been formed by
previous experience, word of mouth or any other reason. Efforts should be directed at
working on these dimensions to improve service quality.
3. Seventeen attributes are significant with the p-value less than 0.005. These attributes are
bus never breaks down, the schedule buses have regular schedules and drivers are always
polite customers feel safe in their transaction with staff, drivers have in-depth
occupational knowledge of their jobs and behavior of staff instills confidence in the
passengers, drivers are neatly dressed and smart, shuttle bus companies have adequate
shed for passengers obtaining tickets, bus companies have spacious seats for passengers
on board, shuttle buses are well maintained and neat and shuttle buses have ample
legroom and foot space, transport section always look after the best interest of their
customers and transport section have operating hours convenient to all their staff, drivers
provide individualized attention to help customers, transport section always informs
people of availability of services and changes in prices in advance, transport section can
provide timely and efficient service, communication with customers is clear and helpful,
drivers are always willing to help customers. All attempts to improve service delivery
should be directed at these attributes. Muthuoandian&Vijayakumar (2012) similarly used
pair sampled t-test to ascertain if there is a significant difference in passenger’s
expectation and perception of State Road Transport Understakings (SRTUs) in Tamil
Nadu. The results demonstrate that insignificant differences in passengers perceived
service quality with p>0.005.
4. All the twenty one attributes have expectation mean scores higher than the perception
mean score. The mean scores of perceptions and expectations are merely above average
for almost all the attributes ranging from 2.78-3.82.this indicates low perceived quality.
GE-INTERNATIONAL JOURNAL OF ENGINEERING RESEARCH
VOLUME -2, ISSUE -5 (JULY 2014) IF-3.022 ISSN: (2321-1717)
A Monthly Double-Blind Peer Reviewed Refereed Open Access International e-Journal - Included in the International Serial Directories. GE- International Journal of Engineering Research (GE-IJER)
Website: www.aarf.asia. Email: [email protected] , [email protected] Page 76
Muthuoandian & Vijayakumar (2012) study of State Road Transport Understakings
(SRTUs) in Tamil Nadu found no gap between expectations and perceptions of all the 25
service quality attributes of SRTUs. Hence perceived quality is neutral. Only one
attribute in the current study has greater mean score of 2.40 for expectation and 2.28 for
perception. This attribute is on whether students queue or not at the point of boarding the
campus shuttle. More attention should be directed at providing more buses at these
observed peak period to curtail the formation of queues.
GE-INTERNATIONAL JOURNAL OF ENGINEERING RESEARCH VOLUME -2, ISSUE -5
(JULY 2014) IF-3.022 ISSN: (2321-1717)
A Monthly Double-Blind Peer Reviewed Refereed Open Access International e-Journal - Included in the International Serial Directories. GE- International Journal of Engineering Research (GE-IJER)
Website: www.aarf.asia. Email: [email protected] , [email protected] Page 77
Table 4: Comparisons between expectations and perceptions
Quality dimensions Quality attributes Expectations Perceptions Pair-wise t-test
Mean Standard
Deviation
Mean Standard
Deviation
t-value p-value
Reliability 1. The shuttle bus always arrives on time 3.58 1.320 3.42 1.276 1.973 .049
2. Bus never breaks down on the road 3.43 1.380 2.95 1.198 5.045 .000
3. Customers don’t queue 2.40 1.521 2.28 1.406 .998 .319
4. The shuttle buses have regular schedules 3.42 1.279 2.94 1.208 4.872 .000
5. Drivers are always polite 3.59 1.236 3.16 1.120 4.745 .000
Assurance 6. Customers feel safe in their transactions
with staff
3.66 1.158 3.37 1.109 3.673 .000
7. Drivers have in-depth occupational
knowledge of their jobs 3.70 1.098
3.38 1.099 4.522 .000
8. Behaviour of staff instills confidence in
the passengers 3.52 1.138
3.15 1.055 4.513 .000
Tangibility 9. Drivers are neatly dressed and smart 3.57 1.196 3.12 1.156 5.031 .000
GE-INTERNATIONAL JOURNAL OF ENGINEERING RESEARCH VOLUME -2, ISSUE -5
(JULY 2014) IF-3.022 ISSN: (2321-1717)
A Monthly Double-Blind Peer Reviewed Refereed Open Access International e-Journal - Included in the International Serial Directories. GE- International Journal of Engineering Research (GE-IJER)
Website: www.aarf.asia. Email: [email protected] , [email protected] Page 78
10. Shuttle Bus companies have adequate
shed for passengers obtaining tickets 3.29 1.411
2.78 1.311 4.676 .000
11. Bus companies have spacious seats for
passengers on board 3.72 1.208
3.40 1.139 3.818 .000
12. Shuttle buses are well maintained and
neat 3.59 1.308
3.22 1.181 4.060 .000
13. Shuttle buses have ample legroom and
foot space 3.56 1.216
3.15 1.128 5.301 .000
Empathy 14. Transport section always look after the
best interest of their customers
3.41 1.270 3.01 1.164 4.265 .000
15. Transport section have operating hours
convenient to all their customers 3.35 1.311
2.93 1.199 4.455 .000
16. It is easy to find and access the bus
station/terminals/waiting points 3.81 1.200
3.72 1.216 1.211 .227
Responsiveness 17. Drivers provide individualized attention
to help customers
3.52 3.140 2.97 1.204 3.035 .003
18. Transport section always inform people 3.18 1.436 2.82 1.301 3.353 .001
GE-INTERNATIONAL JOURNAL OF ENGINEERING RESEARCH VOLUME -2, ISSUE -5
(JULY 2014) IF-3.022 ISSN: (2321-1717)
A Monthly Double-Blind Peer Reviewed Refereed Open Access International e-Journal - Included in the International Serial Directories. GE- International Journal of Engineering Research (GE-IJER)
Website: www.aarf.asia. Email: [email protected] , [email protected] Page 79
of availability of services and changes in
prices in advance
19. Transport section can provide timely and
efficient services 3.56 1.227
3.22 1.185 3.670 .000
20. Communication with customers is clear
and helpful 3.50 1.132
3.20 1.069 3.662 .000
21. Drivers are always willing to help
passengers 3.58 1.181
3.10 1.159 5.626 .000
Source: fieldwork, 2013.
GE-INTERNATIONAL JOURNAL OF ENGINEERING RESEARCH
VOLUME -2, ISSUE -5 (JULY 2014) IF-3.022 ISSN: (2321-1717)
A Monthly Double-Blind Peer Reviewed Refereed Open Access International e-Journal - Included in the International Serial Directories. GE- International Journal of Engineering Research (GE-IJER)
Website: www.aarf.asia. Email: [email protected] , [email protected] Page 80
Conclusions
The study provides the empirical evidence on the application of SERVQUAL scale in
assessing campus shuttle bus in a Ghanaian university. Results from the analysis provided the
empirical evidence for campus shuttle bus service quality. Concerted efforts should be made to
work on all the dimensions of service quality. But more attention should be accorded the
seventeen attributes highlighted in the analysis.
References :
1. Abane, A. M. (2009). The metro mass transportation scheme in Ghana: Issues, challenges
and the way forward. Oguaa Journal of Social Sciences,4(4), 35-58.
2. Abane, A. M. (2011). Travel behaviour in Ghana: Empirical observations from four
metropolitan areas. Journal of Transport Geography, 19 (1), 313-322.
3. Aidoo E. N., Agyemang W., Monkah J. E. &Afukaar F. K. (2013). Passenger’s
satisfaction with public bus transport services in Ghana: A case study of Kumasi–Accra
route. Theoretical and Empirical Researches in Urban Management, 8(2), 33-44.
4. Hashim, R., Haron, S., Mohamad, S. & Hassan, F. (2013). Assessment of campus bus
service efficacy: An application towards green environment. Procedia-Social and
Behavioral Sciences, 105, 294-303.
5. Hashim, R., Haron, S., Hassan, F. Hassan, N. A. &Kasa, A (2013).students satisfaction
with the campus bus service at UiTM Shah Alam, Malaysia. Proceedings of the
2013IEEE business Engineering and Industrial Application Colloquium, 7-9 April
2013, Langkawi, Malaysia: 695-698.
6. Ibrahim-Adedeji, K. (2011). Determining the socio economic characteristics and user’s
perception of intra-urban transport system inAyangbajupark, Ikorodu, Lagos State.
International Journal ofEconomic Development Research and Investment, 2(2), 38-48.
7. Juarez, B. (2011). Best Practices for University Bus Transit Programs: Identifying
Strategies for Success. Applied Research Projects, Texas State University-San
Marcos.Paper 352.
GE-INTERNATIONAL JOURNAL OF ENGINEERING RESEARCH
VOLUME -2, ISSUE -5 (JULY 2014) IF-3.022 ISSN: (2321-1717)
A Monthly Double-Blind Peer Reviewed Refereed Open Access International e-Journal - Included in the International Serial Directories. GE- International Journal of Engineering Research (GE-IJER)
Website: www.aarf.asia. Email: [email protected] , [email protected] Page 81
8. Krizek, K.J, Newport, D., White, J., Townsend, A.R. (2012). Higher education’s
sustainability imperative how to practically respond?. International Journal of
Sustainability in higher education, 13(1), 19-33.
9. Limtanakool, N., Dijst, M., &Schwanen, T. (2006). The influence of socio economic
characteristics, land use, travel time considerations on mode choice for medium
and long distance trips. Journal of Transport Geography, 14, 327- 341.
10. Mercangöz, B. A., Paksoy, M. &Karagülle, A. Ö. (2012).Analyzing the service quality of
a fast ferry company by using SERVQUAL Scores: A case study in Turkey. International
Journal of Business and Social Science 3(24).
11. Norzalwi, N & Ismail, A.(2011).Public approach towards sustainable transportation in
UKM’s campus.Australia. Journal of Basic & Applied Sciences, 5(5), 1332-1337.
12. Ojo, T.K Nutsugbodo, R. Y., Abane, A. M. &Amenumey, E. K. (forthcoming).
Passenger’s perspective of quality of intercity bus transport service on Cape Coast-
Accra Route, Ghana: A SERVQUAL Approach.
13. Students Records Management and Information Service (2011).University of Cape Coast.
14. Pallant, J. (2005). SPSS survival manual (2nd ed.). Berkshire: Open University Press.
15. Ojo, T.K Nutsugbodo, R. Y., Abane, A. M. &Amenumey, E. K. (forthcoming).
Passenger’s perspective of quality of intercity bus transport service on Cape Coast-
Accra Route, Ghana: A SERVQUAL Approach.
16. University of Cape Coast (2011).Students Records Management and Information Service
(SRMIS)
17. Zeithaml, V. A., Bitner, M.J. &Gremler (2006).Services Marketing-integrating customer
focus across the firm. New York.
Related Documents