This article appeared in a journal published by Elsevier. The attached copy is furnished to the author for internal non-commercial research and education use, including for instruction at the authors institution and sharing with colleagues. Other uses, including reproduction and distribution, or selling or licensing copies, or posting to personal, institutional or third party websites are prohibited. In most cases authors are permitted to post their version of the article (e.g. in Word or Tex form) to their personal website or institutional repository. Authors requiring further information regarding Elsevier’s archiving and manuscript policies are encouraged to visit: http://www.elsevier.com/copyright

Welcome message from author
This document is posted to help you gain knowledge. Please leave a comment to let me know what you think about it! Share it to your friends and learn new things together.
Transcript

This article appeared in a journal published by Elsevier. The attachedcopy is furnished to the author for internal non-commercial researchand education use, including for instruction at the authors institution
and sharing with colleagues.
Other uses, including reproduction and distribution, or selling orlicensing copies, or posting to personal, institutional or third party
websites are prohibited.
In most cases authors are permitted to post their version of thearticle (e.g. in Word or Tex form) to their personal website orinstitutional repository. Authors requiring further information
regarding Elsevier’s archiving and manuscript policies areencouraged to visit:
http://www.elsevier.com/copyright
Author's personal copy
Research paper
Application of modified nonlinear storage function on runoff estimation
Shiang-Jen Wu a,*, Lin-Fang Ho b, Jinn-Chuang Yang b
aNational center for High-Performance Computing, Hsinchu, TaiwanbDepartment of civil engineering, Chiao-Tung University, Taiwan
Received 9 May 2009; revised 19 September 2010; accepted 22 September 2010
Abstract
This study proposed a modified nonlinear storage function runoff model to take into account the storage hysteresis effect, in which thereexists difference of the storageedischarge relationship between the rising and recession limb. Since the modified storage function runoff hasseven parameter, a parameter-calibration method, which combines the genetic algorithm with the least square criterion. For model calibrationand validation, twenty rainfallerunoff events (1968e2005) recorded at Wudu gage in Keelung River in northern Taiwan were used in the study.The results of model validation reveal that the modified storage function runoff model not only produces the realistic storageedischargerelationship, but also provides a good estimation of the runoff.� 2011 International Association of Hydro-environment Engineering and Research, Asia Pacific Division. Published by Elsevier B.V. All rightsreserved.
Keywords: Storage function runoff model; Storage hysteresis effect; Genetic algorithm
1. Introduction
The runoff estimation and prediction play an important rolein the design and performance evaluation of hydraulic struc-tures and water resource management. According to thetransformation relationship between rainfall and runoff, therainfall-runoff models commonly used are classified into threetypes: (1) the linear model, (2) the semi-linear model, and (3)the nonlinear model. For example, the unit hydrograph isa typical linear model, and the tank model is a semi-linearmodel. Of the above three types of models, the storage func-tion model (SFRM) not only describes more realistic rainfalland runoff relationships, but also embeds a simple underlyingequation s¼ kqp for storage (s) and runoff (q) (e.g., Kimura,1961; Aoki et al., 1976; Zbigniew and Jaroskaw, 1986;Sugiyama et al., 1997, 1999; Sujono et al., 2003). In addi-tion to parameters k and p, the SFRM has two other parame-ters, namely, the lag time Tl and runoff coefficient fr. Park et al.(1999) analyzed runoff characteristics of three small water-sheds in the Su-Young River Basin in Korea using three
rainfall-runoff models, i.e. the storage function method, linerreservoir cascade model, and the discrete linear inputeoutputmodel. Their study concluded that the storage function modelis the most accurate among the three models. In literature,a number of forms of storage functions can be found (e.g.Prasad, 1967; Kimura, 1975).
In the SFRM, the storageedischarge relationship for theSFRM is a single-valued monotonic function. Thus, of fiveparameters of the SFRM, the parameters k and p arecommonly calibrated using the regression analysis (e.g.Prasad, 1967; Kimura, 1975; Sugiyama et al., 1997). Therunoff coefficient fr is equal to a ratio of runoff volume to thatof rainfall. For the lag time Tl and cumulative saturated rainfallRsa, a trial-and-error procedure is applied with an objectivefunction for minimizing the mean absolute error of estimatedrunoff. Note that the parameters k, p, and fr should be cali-brated under the specific Tl and Rsa. Hence, the process ofcalibrating SFRM parameters is complicated and inflexible. Inaddition, due to storage hysteresis effect which means that thestorageedischarge relation is a loop-shaped function, differentstorages exist on the rising and recession limbs of a hydro-graph with the same discharge (Kimura, 1975). Therefore, theobjectives of this study are to modify the nonlinear storage
* Corresponding author.
E-mail address: [email protected] (S.-J. Wu).
Available online at www.sciencedirect.com
Journal of Hydro-environment Research 5 (2011) 37e47www.elsevier.com/locate/jher
1570-6443/$ - see front matter � 2011 International Association of Hydro-environment Engineering and Research, Asia Pacific Division. Published by Elsevier B.V. All rights reserved.
doi:10.1016/j.jher.2010.09.003
Author's personal copy
function by considering the storage hysteresis effect, and todevelop a corresponding parameter-calibration method. Todemonstrate the proposed model, twenty-four rainfall-runoffevents recorded at the Wudu station in the Keelung River ofnorthern Taiwan are used for the parameter calibration andmodel validation.
2. Storage function runoff model
2.1. Brief concept
The storage function runoff model (SFRM) with a lossmechanism was developed by Kimura (1961). In the SFRM,relationship between the storage (s) and runoff (q) is definedas:
s¼ kqp ð1Þwhere k and p are coefficients representing watershed char-acteristics. As p¼ 1, Eq. (1) reduces to the linear reservoircascade model. In the runoff estimation, the SFRM incorpo-rates the modified Plus method, which is derived from thecontinuity equation, as (Kimura, 1961):
reðt� TlÞ � qðtÞ ¼ ds
dt
reðt� TlÞ ¼�fr � rðt� TlÞ; if
Prðt� TlÞ � Rsa
rðt� TlÞ; ifP
rðt� TlÞ> Rsa
ð2Þ
where r(t) and q(t), respectively, denote the inflow and outflowat time t; fr is the runoff ratio; Tl is the lag time; and Rsa standsfor the cumulative saturated rainfall. Note that the outflow rateq(t) (mm/h) in Eq. (2) is calculated by:
qðtÞ ¼ QðtÞA
� 3:6 ð3Þ
where A is the catchment area (km2); and Q(t) is the discharge(m3/s).
2.2. Traditional storageedischarge relationship
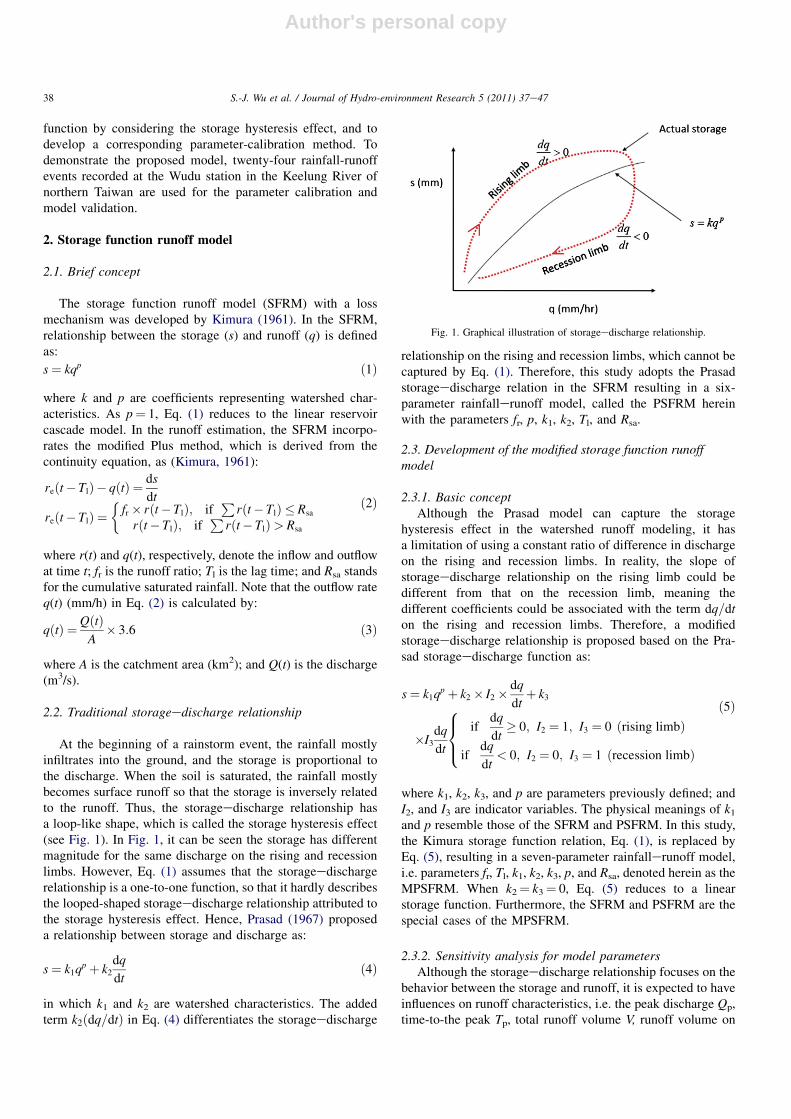
At the beginning of a rainstorm event, the rainfall mostlyinfiltrates into the ground, and the storage is proportional tothe discharge. When the soil is saturated, the rainfall mostlybecomes surface runoff so that the storage is inversely relatedto the runoff. Thus, the storageedischarge relationship hasa loop-like shape, which is called the storage hysteresis effect(see Fig. 1). In Fig. 1, it can be seen the storage has differentmagnitude for the same discharge on the rising and recessionlimbs. However, Eq. (1) assumes that the storageedischargerelationship is a one-to-one function, so that it hardly describesthe looped-shaped storageedischarge relationship attributed tothe storage hysteresis effect. Hence, Prasad (1967) proposeda relationship between storage and discharge as:
s¼ k1qp þ k2
dq
dtð4Þ
in which k1 and k2 are watershed characteristics. The addedterm k2ðdq=dtÞ in Eq. (4) differentiates the storageedischarge
relationship on the rising and recession limbs, which cannot becaptured by Eq. (1). Therefore, this study adopts the Prasadstorageedischarge relation in the SFRM resulting in a six-parameter rainfallerunoff model, called the PSFRM hereinwith the parameters fr, p, k1, k2, Tl, and Rsa.
2.3. Development of the modified storage function runoffmodel
2.3.1. Basic conceptAlthough the Prasad model can capture the storage
hysteresis effect in the watershed runoff modeling, it hasa limitation of using a constant ratio of difference in dischargeon the rising and recession limbs. In reality, the slope ofstorageedischarge relationship on the rising limb could bedifferent from that on the recession limb, meaning thedifferent coefficients could be associated with the term dq=dton the rising and recession limbs. Therefore, a modifiedstorageedischarge relationship is proposed based on the Pra-sad storageedischarge function as:
s¼ k1qp þ k2 � I2 � dq
dtþ k3
�I3dq
dt
ifdq
dt� 0; I2 ¼ 1; I3 ¼ 0 ðrising limbÞ
ifdq
dt< 0; I2 ¼ 0; I3 ¼ 1 ðrecession limbÞ
8><>:
ð5Þ
where k1, k2, k3, and p are parameters previously defined; andI2, and I3 are indicator variables. The physical meanings of k1and p resemble those of the SFRM and PSFRM. In this study,the Kimura storage function relation, Eq. (1), is replaced byEq. (5), resulting in a seven-parameter rainfallerunoff model,i.e. parameters fr, Tl, k1, k2, k3, p, and Rsa, denoted herein as theMPSFRM. When k2¼ k3¼ 0, Eq. (5) reduces to a linearstorage function. Furthermore, the SFRM and PSFRM are thespecial cases of the MPSFRM.
2.3.2. Sensitivity analysis for model parametersAlthough the storageedischarge relationship focuses on the
behavior between the storage and runoff, it is expected to haveinfluences on runoff characteristics, i.e. the peak discharge Qp,time-to-the peak Tp, total runoff volume V, runoff volume on
Fig. 1. Graphical illustration of storageedischarge relationship.
38 S.-J. Wu et al. / Journal of Hydro-environment Research 5 (2011) 37e47
Author's personal copy
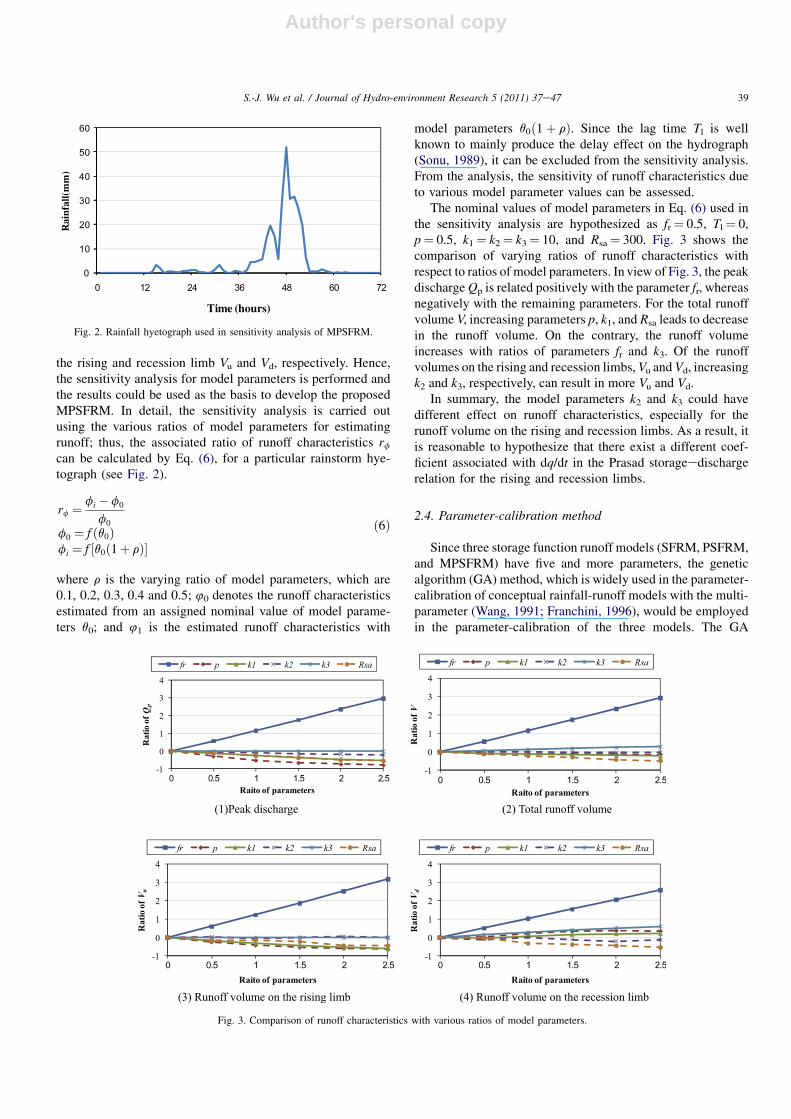
the rising and recession limb Vu and Vd, respectively. Hence,the sensitivity analysis for model parameters is performed andthe results could be used as the basis to develop the proposedMPSFRM. In detail, the sensitivity analysis is carried outusing the various ratios of model parameters for estimatingrunoff; thus, the associated ratio of runoff characteristics rfcan be calculated by Eq. (6), for a particular rainstorm hye-tograph (see Fig. 2).
rf ¼ fi �f0
f0
f0 ¼ f ðq0Þfi ¼ f ½q0ð1þ rÞ�
ð6Þ
where r is the varying ratio of model parameters, which are0.1, 0.2, 0.3, 0.4 and 0.5; 40 denotes the runoff characteristicsestimated from an assigned nominal value of model parame-ters q0; and 41 is the estimated runoff characteristics with
model parameters q0ð1þ rÞ. Since the lag time Tl is wellknown to mainly produce the delay effect on the hydrograph(Sonu, 1989), it can be excluded from the sensitivity analysis.From the analysis, the sensitivity of runoff characteristics dueto various model parameter values can be assessed.
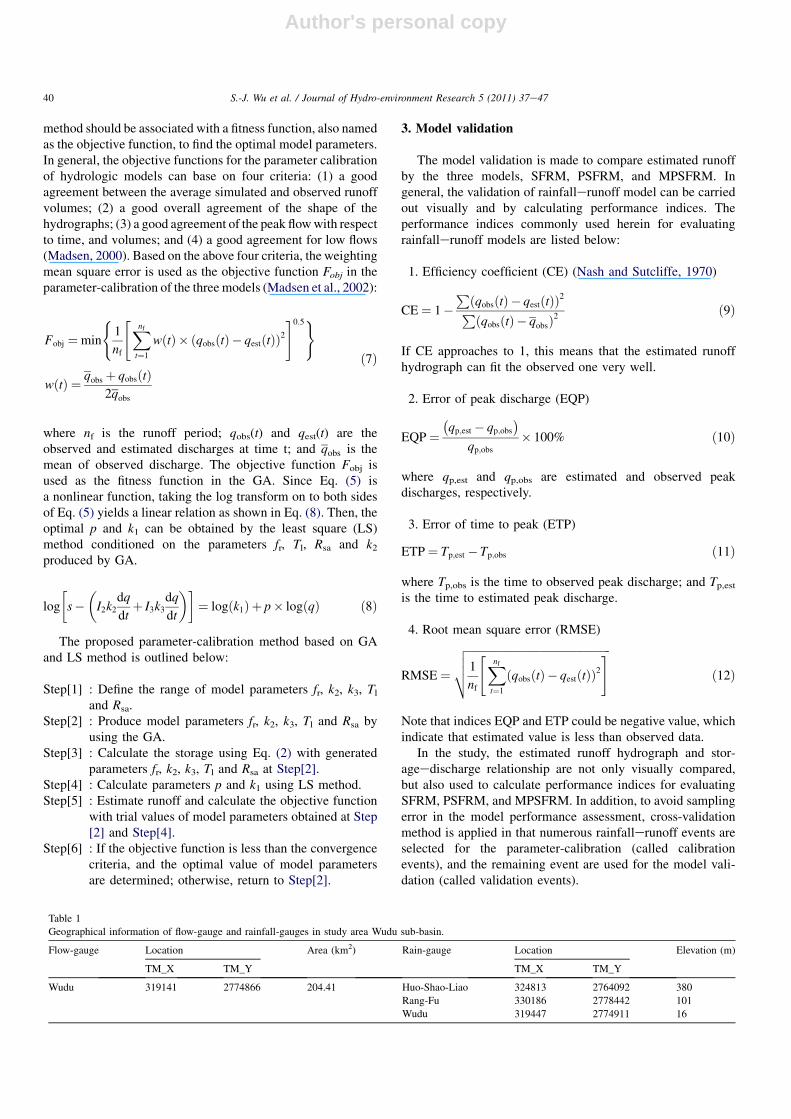
The nominal values of model parameters in Eq. (6) used inthe sensitivity analysis are hypothesized as fr¼ 0.5, Tl¼ 0,p¼ 0.5, k1¼ k2¼ k3¼ 10, and Rsa¼ 300. Fig. 3 shows thecomparison of varying ratios of runoff characteristics withrespect to ratios of model parameters. In view of Fig. 3, the peakdischargeQp is related positively with the parameter fr, whereasnegatively with the remaining parameters. For the total runoffvolume V, increasing parameters p, k1, and Rsa leads to decreasein the runoff volume. On the contrary, the runoff volumeincreases with ratios of parameters fr and k3. Of the runoffvolumes on the rising and recession limbs,Vu and Vd, increasingk2 and k3, respectively, can result in more Vu and Vd.
In summary, the model parameters k2 and k3 could havedifferent effect on runoff characteristics, especially for therunoff volume on the rising and recession limbs. As a result, itis reasonable to hypothesize that there exist a different coef-ficient associated with dq/dt in the Prasad storageedischargerelation for the rising and recession limbs.
2.4. Parameter-calibration method
Since three storage function runoff models (SFRM, PSFRM,and MPSFRM) have five and more parameters, the geneticalgorithm (GA) method, which is widely used in the parameter-calibration of conceptual rainfall-runoff models with the multi-parameter (Wang, 1991; Franchini, 1996), would be employedin the parameter-calibration of the three models. The GA
0
10
20
30
40
50
60
0 12 24 36 48 60 72
Rai
nfal
l(m
m)
Time (hours)
Fig. 2. Rainfall hyetograph used in sensitivity analysis of MPSFRM.
Fig. 3. Comparison of runoff characteristics with various ratios of model parameters.
39S.-J. Wu et al. / Journal of Hydro-environment Research 5 (2011) 37e47
Author's personal copy
method should be associated with a fitness function, also namedas the objective function, to find the optimal model parameters.In general, the objective functions for the parameter calibrationof hydrologic models can base on four criteria: (1) a goodagreement between the average simulated and observed runoffvolumes; (2) a good overall agreement of the shape of thehydrographs; (3) a good agreement of the peak flowwith respectto time, and volumes; and (4) a good agreement for low flows(Madsen, 2000). Based on the above four criteria, the weightingmean square error is used as the objective function Fobj in theparameter-calibration of the three models (Madsen et al., 2002):
Fobj ¼min
(1
nf
"Xnft¼1
wðtÞ � ðqobsðtÞ � qestðtÞÞ2#0:5)
wðtÞ ¼ qobs þ qobsðtÞ2qobs
ð7Þ
where nf is the runoff period; qobs(t) and qest(t) are theobserved and estimated discharges at time t; and qobs is themean of observed discharge. The objective function Fobj isused as the fitness function in the GA. Since Eq. (5) isa nonlinear function, taking the log transform on to both sidesof Eq. (5) yields a linear relation as shown in Eq. (8). Then, theoptimal p and k1 can be obtained by the least square (LS)method conditioned on the parameters fr, Tl, Rsa and k2produced by GA.
log
�s�
�I2k2
dq
dtþ I3k3
dq
dt
��¼ logðk1Þ þ p� logðqÞ ð8Þ
The proposed parameter-calibration method based on GAand LS method is outlined below:
Step[1] : Define the range of model parameters fr, k2, k3, Tland Rsa.
Step[2] : Produce model parameters fr, k2, k3, Tl and Rsa byusing the GA.
Step[3] : Calculate the storage using Eq. (2) with generatedparameters fr, k2, k3, Tl and Rsa at Step[2].
Step[4] : Calculate parameters p and k1 using LS method.Step[5] : Estimate runoff and calculate the objective function
with trial values of model parameters obtained at Step[2] and Step[4].
Step[6] : If the objective function is less than the convergencecriteria, and the optimal value of model parametersare determined; otherwise, return to Step[2].
3. Model validation
The model validation is made to compare estimated runoffby the three models, SFRM, PSFRM, and MPSFRM. Ingeneral, the validation of rainfallerunoff model can be carriedout visually and by calculating performance indices. Theperformance indices commonly used herein for evaluatingrainfallerunoff models are listed below:
1. Efficiency coefficient (CE) (Nash and Sutcliffe, 1970)
CE¼ 1�PðqobsðtÞ � qestðtÞÞ2PðqobsðtÞ � qobsÞ2
ð9Þ
If CE approaches to 1, this means that the estimated runoffhydrograph can fit the observed one very well.
2. Error of peak discharge (EQP)
EQP¼�qp;est � qp;obs
�qp;obs
� 100% ð10Þ
where qp,est and qp,obs are estimated and observed peakdischarges, respectively.
3. Error of time to peak (ETP)
ETP¼ Tp;est � Tp;obs ð11Þ
where Tp,obs is the time to observed peak discharge; and Tp,estis the time to estimated peak discharge.
4. Root mean square error (RMSE)
RMSE¼ffiffiffiffiffiffiffiffiffiffiffiffiffiffiffiffiffiffiffiffiffiffiffiffiffiffiffiffiffiffiffiffiffiffiffiffiffiffiffiffiffiffiffiffiffiffiffiffiffiffiffiffi1
nf
"Xnft¼1
ðqobsðtÞ � qestðtÞÞ2#vuut ð12Þ
Note that indices EQP and ETP could be negative value, whichindicate that estimated value is less than observed data.
In the study, the estimated runoff hydrograph and stor-ageedischarge relationship are not only visually compared,but also used to calculate performance indices for evaluatingSFRM, PSFRM, and MPSFRM. In addition, to avoid samplingerror in the model performance assessment, cross-validationmethod is applied in that numerous rainfallerunoff events areselected for the parameter-calibration (called calibrationevents), and the remaining event are used for the model vali-dation (called validation events).
Table 1
Geographical information of flow-gauge and rainfall-gauges in study area Wudu sub-basin.
Flow-gauge Location Area (km2) Rain-gauge Location Elevation (m)
TM_X TM_Y TM_X TM_Y
Wudu 319141 2774866 204.41 Huo-Shao-Liao 324813 2764092 380
Rang-Fu 330186 2778442 101
Wudu 319447 2774911 16
40 S.-J. Wu et al. / Journal of Hydro-environment Research 5 (2011) 37e47
Author's personal copy
4. Results and discussion
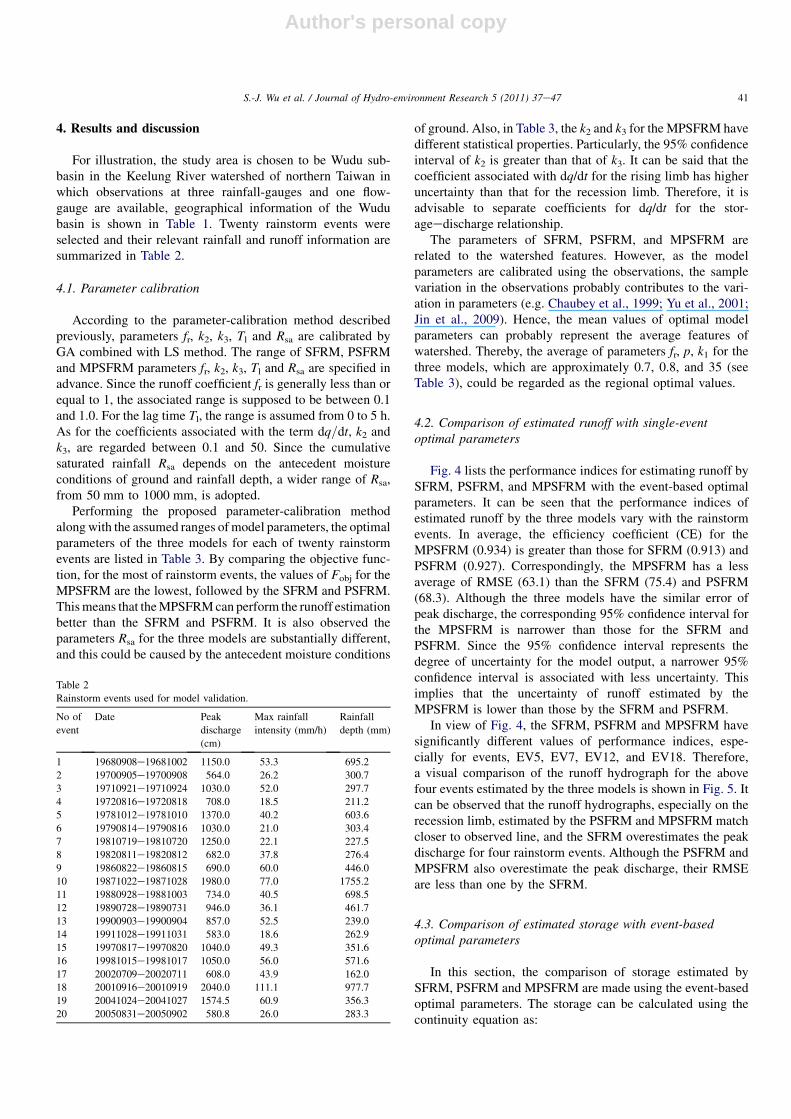
For illustration, the study area is chosen to be Wudu sub-basin in the Keelung River watershed of northern Taiwan inwhich observations at three rainfall-gauges and one flow-gauge are available, geographical information of the Wudubasin is shown in Table 1. Twenty rainstorm events wereselected and their relevant rainfall and runoff information aresummarized in Table 2.
4.1. Parameter calibration
According to the parameter-calibration method describedpreviously, parameters fr, k2, k3, Tl and Rsa are calibrated byGA combined with LS method. The range of SFRM, PSFRMand MPSFRM parameters fr, k2, k3, Tl and Rsa are specified inadvance. Since the runoff coefficient fr is generally less than orequal to 1, the associated range is supposed to be between 0.1and 1.0. For the lag time Tl, the range is assumed from 0 to 5 h.As for the coefficients associated with the term dq=dt, k2 andk3, are regarded between 0.1 and 50. Since the cumulativesaturated rainfall Rsa depends on the antecedent moistureconditions of ground and rainfall depth, a wider range of Rsa,from 50 mm to 1000 mm, is adopted.
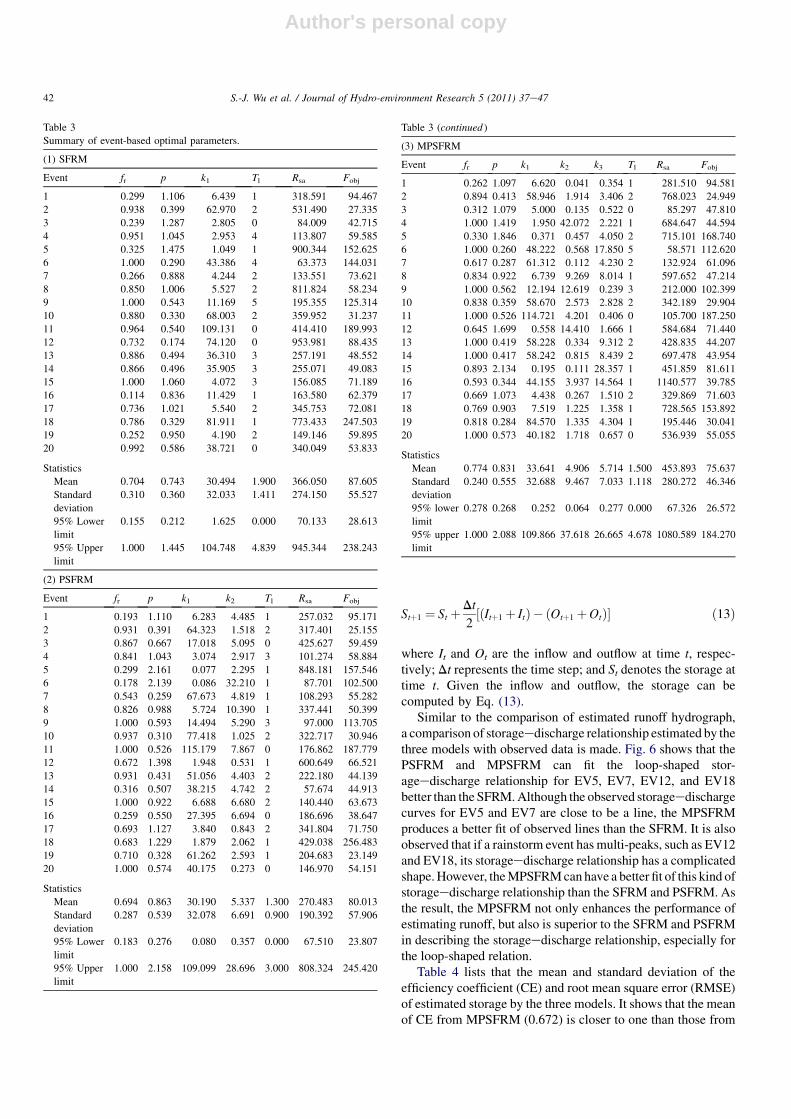
Performing the proposed parameter-calibration methodalongwith the assumed ranges ofmodel parameters, the optimalparameters of the three models for each of twenty rainstormevents are listed in Table 3. By comparing the objective func-tion, for the most of rainstorm events, the values of Fobj for theMPSFRM are the lowest, followed by the SFRM and PSFRM.Thismeans that theMPSFRMcan perform the runoff estimationbetter than the SFRM and PSFRM. It is also observed theparameters Rsa for the three models are substantially different,and this could be caused by the antecedent moisture conditions
of ground. Also, in Table 3, the k2 and k3 for the MPSFRM havedifferent statistical properties. Particularly, the 95% confidenceinterval of k2 is greater than that of k3. It can be said that thecoefficient associated with dq/dt for the rising limb has higheruncertainty than that for the recession limb. Therefore, it isadvisable to separate coefficients for dq/dt for the stor-ageedischarge relationship.
The parameters of SFRM, PSFRM, and MPSFRM arerelated to the watershed features. However, as the modelparameters are calibrated using the observations, the samplevariation in the observations probably contributes to the vari-ation in parameters (e.g. Chaubey et al., 1999; Yu et al., 2001;Jin et al., 2009). Hence, the mean values of optimal modelparameters can probably represent the average features ofwatershed. Thereby, the average of parameters fr, p, k1 for thethree models, which are approximately 0.7, 0.8, and 35 (seeTable 3), could be regarded as the regional optimal values.
4.2. Comparison of estimated runoff with single-eventoptimal parameters
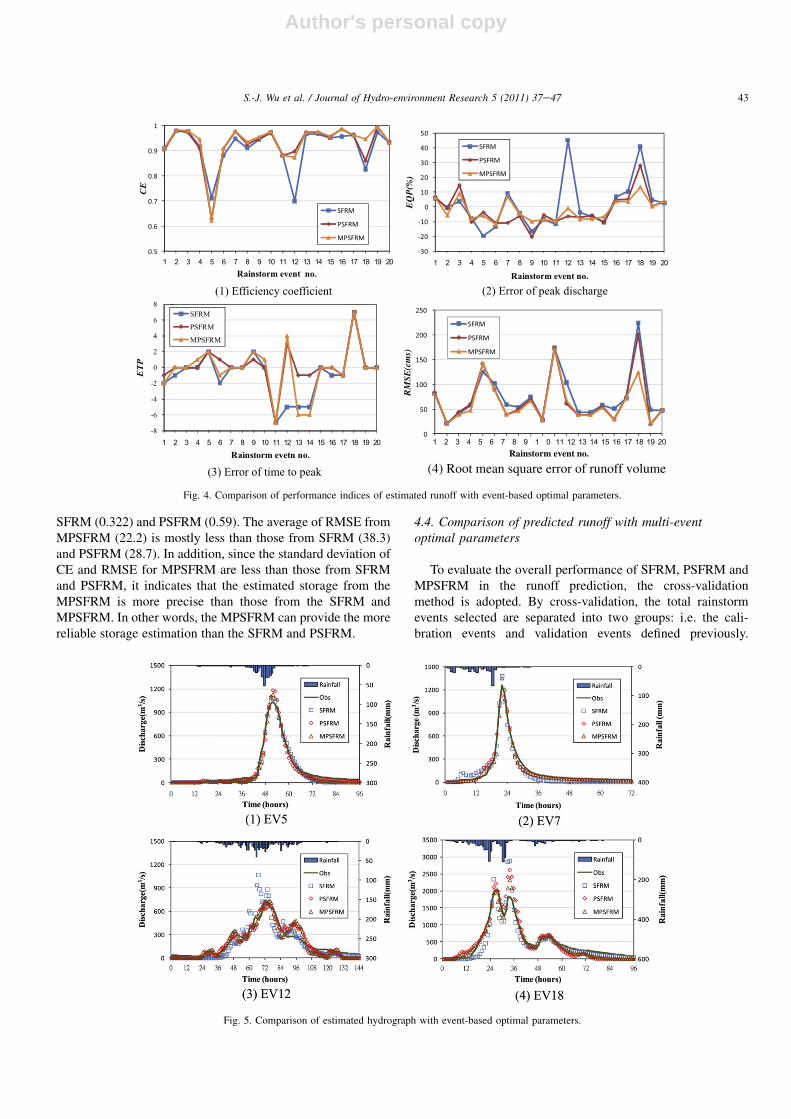
Fig. 4 lists the performance indices for estimating runoff bySFRM, PSFRM, and MPSFRM with the event-based optimalparameters. It can be seen that the performance indices ofestimated runoff by the three models vary with the rainstormevents. In average, the efficiency coefficient (CE) for theMPSFRM (0.934) is greater than those for SFRM (0.913) andPSFRM (0.927). Correspondingly, the MPSFRM has a lessaverage of RMSE (63.1) than the SFRM (75.4) and PSFRM(68.3). Although the three models have the similar error ofpeak discharge, the corresponding 95% confidence interval forthe MPSFRM is narrower than those for the SFRM andPSFRM. Since the 95% confidence interval represents thedegree of uncertainty for the model output, a narrower 95%confidence interval is associated with less uncertainty. Thisimplies that the uncertainty of runoff estimated by theMPSFRM is lower than those by the SFRM and PSFRM.
In view of Fig. 4, the SFRM, PSFRM and MPSFRM havesignificantly different values of performance indices, espe-cially for events, EV5, EV7, EV12, and EV18. Therefore,a visual comparison of the runoff hydrograph for the abovefour events estimated by the three models is shown in Fig. 5. Itcan be observed that the runoff hydrographs, especially on therecession limb, estimated by the PSFRM and MPSFRM matchcloser to observed line, and the SFRM overestimates the peakdischarge for four rainstorm events. Although the PSFRM andMPSFRM also overestimate the peak discharge, their RMSEare less than one by the SFRM.
4.3. Comparison of estimated storage with event-basedoptimal parameters
In this section, the comparison of storage estimated bySFRM, PSFRM and MPSFRM are made using the event-basedoptimal parameters. The storage can be calculated using thecontinuity equation as:
Table 2
Rainstorm events used for model validation.
No of
event
Date Peak
discharge
(cm)
Max rainfall
intensity (mm/h)
Rainfall
depth (mm)
1 19680908e19681002 1150.0 53.3 695.2
2 19700905e19700908 564.0 26.2 300.7
3 19710921e19710924 1030.0 52.0 297.7
4 19720816e19720818 708.0 18.5 211.2
5 19781012e19781010 1370.0 40.2 603.6
6 19790814e19790816 1030.0 21.0 303.4
7 19810719e19810720 1250.0 22.1 227.5
8 19820811e19820812 682.0 37.8 276.4
9 19860822e19860815 690.0 60.0 446.0
10 19871022e19871028 1980.0 77.0 1755.2
11 19880928e19881003 734.0 40.5 698.5
12 19890728e19890731 946.0 36.1 461.7
13 19900903e19900904 857.0 52.5 239.0
14 19911028e19911031 583.0 18.6 262.9
15 19970817e19970820 1040.0 49.3 351.6
16 19981015e19981017 1050.0 56.0 571.6
17 20020709e20020711 608.0 43.9 162.0
18 20010916e20010919 2040.0 111.1 977.7
19 20041024e20041027 1574.5 60.9 356.3
20 20050831e20050902 580.8 26.0 283.3
41S.-J. Wu et al. / Journal of Hydro-environment Research 5 (2011) 37e47
Author's personal copy
Stþ1 ¼ St þDt
2½ðItþ1 þ ItÞ � ðOtþ1 þOtÞ� ð13Þ
where It and Ot are the inflow and outflow at time t, respec-tively; Dt represents the time step; and St denotes the storage attime t. Given the inflow and outflow, the storage can becomputed by Eq. (13).
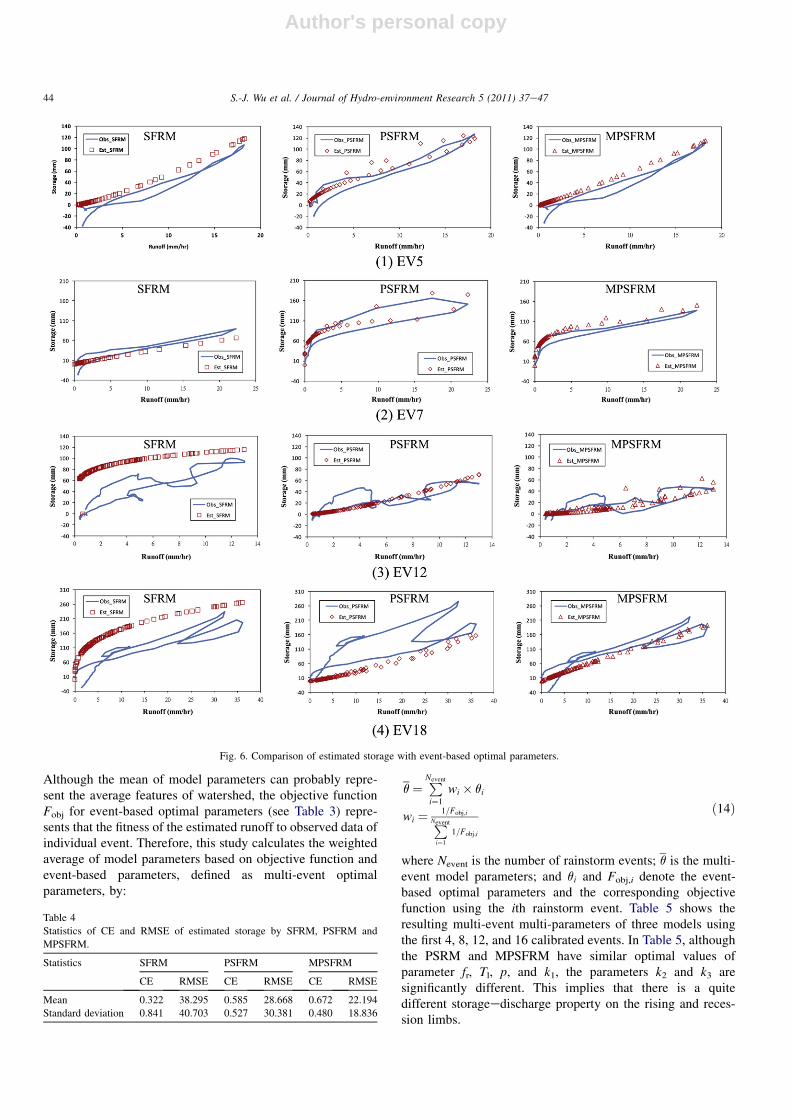
Similar to the comparison of estimated runoff hydrograph,a comparison of storageedischarge relationship estimated by thethree models with observed data is made. Fig. 6 shows that thePSFRM and MPSFRM can fit the loop-shaped stor-ageedischarge relationship for EV5, EV7, EV12, and EV18better than the SFRM.Although the observed storageedischargecurves for EV5 and EV7 are close to be a line, the MPSFRMproduces a better fit of observed lines than the SFRM. It is alsoobserved that if a rainstorm event has multi-peaks, such as EV12and EV18, its storageedischarge relationship has a complicatedshape.However, theMPSFRMcan have a better fit of this kind ofstorageedischarge relationship than the SFRM and PSFRM. Asthe result, the MPSFRM not only enhances the performance ofestimating runoff, but also is superior to the SFRM and PSFRMin describing the storageedischarge relationship, especially forthe loop-shaped relation.
Table 4 lists that the mean and standard deviation of theefficiency coefficient (CE) and root mean square error (RMSE)of estimated storage by the three models. It shows that the meanof CE from MPSFRM (0.672) is closer to one than those from
Table 3
Summary of event-based optimal parameters.
(1) SFRM
Event fr p k1 Tl Rsa Fobj
1 0.299 1.106 6.439 1 318.591 94.467
2 0.938 0.399 62.970 2 531.490 27.335
3 0.239 1.287 2.805 0 84.009 42.715
4 0.951 1.045 2.953 4 113.807 59.585
5 0.325 1.475 1.049 1 900.344 152.625
6 1.000 0.290 43.386 4 63.373 144.031
7 0.266 0.888 4.244 2 133.551 73.621
8 0.850 1.006 5.527 2 811.824 58.234
9 1.000 0.543 11.169 5 195.355 125.314
10 0.880 0.330 68.003 2 359.952 31.237
11 0.964 0.540 109.131 0 414.410 189.993
12 0.732 0.174 74.120 0 953.981 88.435
13 0.886 0.494 36.310 3 257.191 48.552
14 0.866 0.496 35.905 3 255.071 49.083
15 1.000 1.060 4.072 3 156.085 71.189
16 0.114 0.836 11.429 1 163.580 62.379
17 0.736 1.021 5.540 2 345.753 72.081
18 0.786 0.329 81.911 1 773.433 247.503
19 0.252 0.950 4.190 2 149.146 59.895
20 0.992 0.586 38.721 0 340.049 53.833
Statistics
Mean 0.704 0.743 30.494 1.900 366.050 87.605
Standard
deviation
0.310 0.360 32.033 1.411 274.150 55.527
95% Lower
limit
0.155 0.212 1.625 0.000 70.133 28.613
95% Upper
limit
1.000 1.445 104.748 4.839 945.344 238.243
(2) PSFRM
Event fr p k1 k2 Tl Rsa Fobj
1 0.193 1.110 6.283 4.485 1 257.032 95.171
2 0.931 0.391 64.323 1.518 2 317.401 25.155
3 0.867 0.667 17.018 5.095 0 425.627 59.459
4 0.841 1.043 3.074 2.917 3 101.274 58.884
5 0.299 2.161 0.077 2.295 1 848.181 157.546
6 0.178 2.139 0.086 32.210 1 87.701 102.500
7 0.543 0.259 67.673 4.819 1 108.293 55.282
8 0.826 0.988 5.724 10.390 1 337.441 50.399
9 1.000 0.593 14.494 5.290 3 97.000 113.705
10 0.937 0.310 77.418 1.025 2 322.717 30.946
11 1.000 0.526 115.179 7.867 0 176.862 187.779
12 0.672 1.398 1.948 0.531 1 600.649 66.521
13 0.931 0.431 51.056 4.403 2 222.180 44.139
14 0.316 0.507 38.215 4.742 2 57.674 44.913
15 1.000 0.922 6.688 6.680 2 140.440 63.673
16 0.259 0.550 27.395 6.694 0 186.696 38.647
17 0.693 1.127 3.840 0.843 2 341.804 71.750
18 0.683 1.229 1.879 2.062 1 429.038 256.483
19 0.710 0.328 61.262 2.593 1 204.683 23.149
20 1.000 0.574 40.175 0.273 0 146.970 54.151
Statistics
Mean 0.694 0.863 30.190 5.337 1.300 270.483 80.013
Standard
deviation
0.287 0.539 32.078 6.691 0.900 190.392 57.906
95% Lower
limit
0.183 0.276 0.080 0.357 0.000 67.510 23.807
95% Upper
limit
1.000 2.158 109.099 28.696 3.000 808.324 245.420
Table 3 (continued )
(3) MPSFRM
Event fr p k1 k2 k3 Tl Rsa Fobj
1 0.262 1.097 6.620 0.041 0.354 1 281.510 94.581
2 0.894 0.413 58.946 1.914 3.406 2 768.023 24.949
3 0.312 1.079 5.000 0.135 0.522 0 85.297 47.810
4 1.000 1.419 1.950 42.072 2.221 1 684.647 44.594
5 0.330 1.846 0.371 0.457 4.050 2 715.101 168.740
6 1.000 0.260 48.222 0.568 17.850 5 58.571 112.620
7 0.617 0.287 61.312 0.112 4.230 2 132.924 61.096
8 0.834 0.922 6.739 9.269 8.014 1 597.652 47.214
9 1.000 0.562 12.194 12.619 0.239 3 212.000 102.399
10 0.838 0.359 58.670 2.573 2.828 2 342.189 29.904
11 1.000 0.526 114.721 4.201 0.406 0 105.700 187.250
12 0.645 1.699 0.558 14.410 1.666 1 584.684 71.440
13 1.000 0.419 58.228 0.334 9.312 2 428.835 44.207
14 1.000 0.417 58.242 0.815 8.439 2 697.478 43.954
15 0.893 2.134 0.195 0.111 28.357 1 451.859 81.611
16 0.593 0.344 44.155 3.937 14.564 1 1140.577 39.785
17 0.669 1.073 4.438 0.267 1.510 2 329.869 71.603
18 0.769 0.903 7.519 1.225 1.358 1 728.565 153.892
19 0.818 0.284 84.570 1.335 4.304 1 195.446 30.041
20 1.000 0.573 40.182 1.718 0.657 0 536.939 55.055
Statistics
Mean 0.774 0.831 33.641 4.906 5.714 1.500 453.893 75.637
Standard
deviation
0.240 0.555 32.688 9.467 7.033 1.118 280.272 46.346
95% lower
limit
0.278 0.268 0.252 0.064 0.277 0.000 67.326 26.572
95% upper
limit
1.000 2.088 109.866 37.618 26.665 4.678 1080.589 184.270
42 S.-J. Wu et al. / Journal of Hydro-environment Research 5 (2011) 37e47
Author's personal copy
SFRM (0.322) and PSFRM (0.59). The average of RMSE fromMPSFRM (22.2) is mostly less than those from SFRM (38.3)and PSFRM (28.7). In addition, since the standard deviation ofCE and RMSE for MPSFRM are less than those from SFRMand PSFRM, it indicates that the estimated storage from theMPSFRM is more precise than those from the SFRM andMPSFRM. In other words, the MPSFRM can provide the morereliable storage estimation than the SFRM and PSFRM.
4.4. Comparison of predicted runoff with multi-eventoptimal parameters
To evaluate the overall performance of SFRM, PSFRM andMPSFRM in the runoff prediction, the cross-validationmethod is adopted. By cross-validation, the total rainstormevents selected are separated into two groups: i.e. the cali-bration events and validation events defined previously.
Fig. 5. Comparison of estimated hydrograph with event-based optimal parameters.
Fig. 4. Comparison of performance indices of estimated runoff with event-based optimal parameters.
43S.-J. Wu et al. / Journal of Hydro-environment Research 5 (2011) 37e47
Author's personal copy
Although the mean of model parameters can probably repre-sent the average features of watershed, the objective functionFobj for event-based optimal parameters (see Table 3) repre-sents that the fitness of the estimated runoff to observed data ofindividual event. Therefore, this study calculates the weightedaverage of model parameters based on objective function andevent-based parameters, defined as multi-event optimalparameters, by:
q¼ PNevent
i¼1
wi � qi
wi ¼ 1=Fobj;iPNeventi¼1
1=Fobj;i
ð14Þ
where Nevent is the number of rainstorm events; q is the multi-event model parameters; and qi and Fobj,i denote the event-based optimal parameters and the corresponding objectivefunction using the ith rainstorm event. Table 5 shows theresulting multi-event multi-parameters of three models usingthe first 4, 8, 12, and 16 calibrated events. In Table 5, althoughthe PSRM and MPSFRM have similar optimal values ofparameter fr, Tl, p, and k1, the parameters k2 and k3 aresignificantly different. This implies that there is a quitedifferent storageedischarge property on the rising and reces-sion limbs.
Fig. 6. Comparison of estimated storage with event-based optimal parameters.
Table 4
Statistics of CE and RMSE of estimated storage by SFRM, PSFRM and
MPSFRM.
Statistics SFRM PSFRM MPSFRM
CE RMSE CE RMSE CE RMSE
Mean 0.322 38.295 0.585 28.668 0.672 22.194
Standard deviation 0.841 40.703 0.527 30.381 0.480 18.836
44 S.-J. Wu et al. / Journal of Hydro-environment Research 5 (2011) 37e47
Author's personal copy
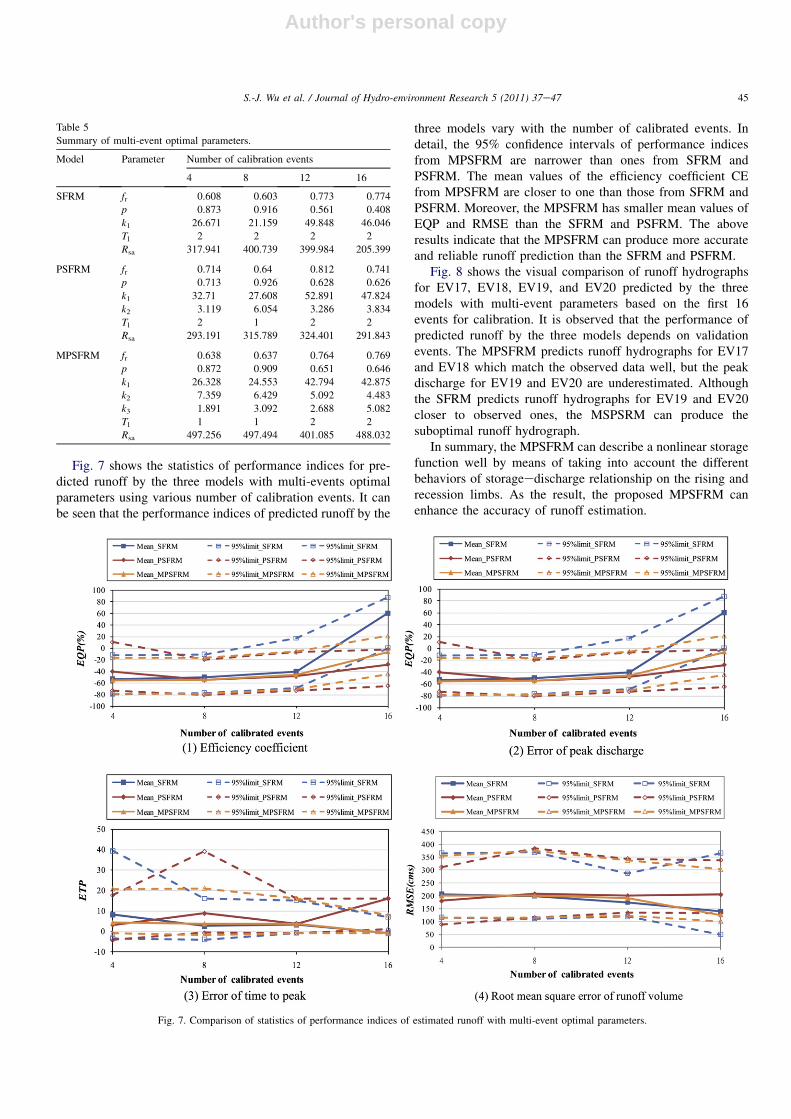
Fig. 7 shows the statistics of performance indices for pre-dicted runoff by the three models with multi-events optimalparameters using various number of calibration events. It canbe seen that the performance indices of predicted runoff by the
three models vary with the number of calibrated events. Indetail, the 95% confidence intervals of performance indicesfrom MPSFRM are narrower than ones from SFRM andPSFRM. The mean values of the efficiency coefficient CEfrom MPSFRM are closer to one than those from SFRM andPSFRM. Moreover, the MPSFRM has smaller mean values ofEQP and RMSE than the SFRM and PSFRM. The aboveresults indicate that the MPSFRM can produce more accurateand reliable runoff prediction than the SFRM and PSFRM.
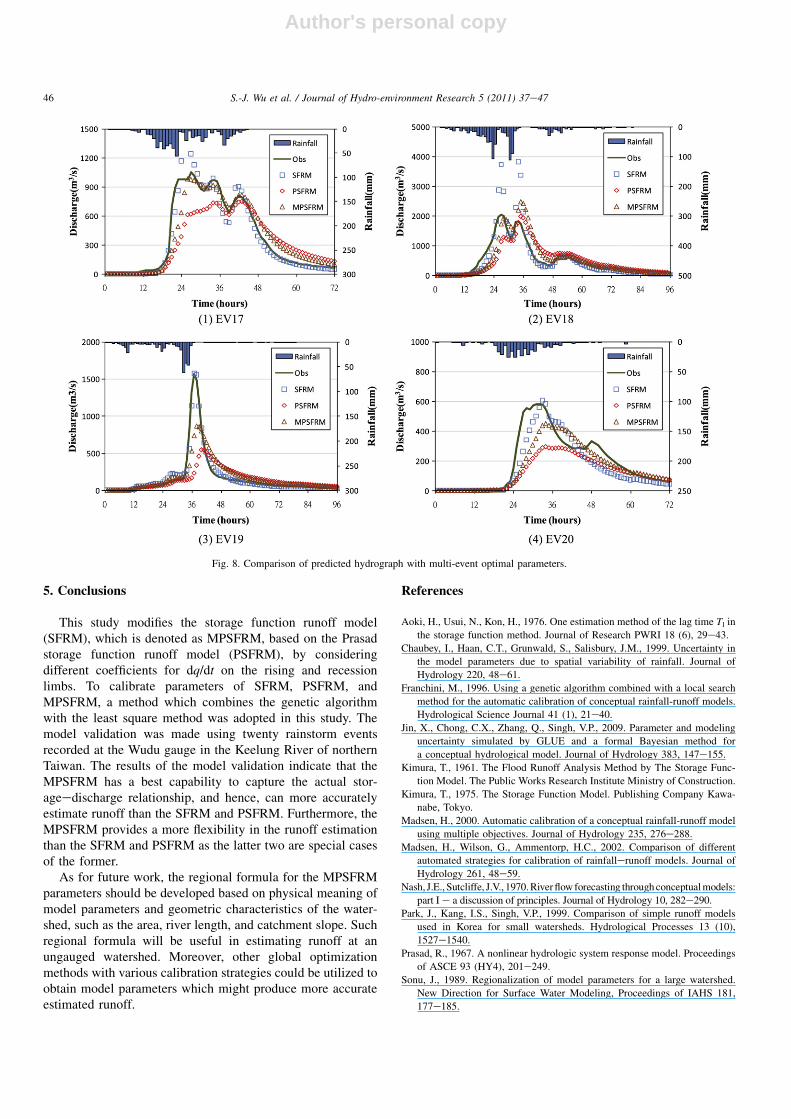
Fig. 8 shows the visual comparison of runoff hydrographsfor EV17, EV18, EV19, and EV20 predicted by the threemodels with multi-event parameters based on the first 16events for calibration. It is observed that the performance ofpredicted runoff by the three models depends on validationevents. The MPSFRM predicts runoff hydrographs for EV17and EV18 which match the observed data well, but the peakdischarge for EV19 and EV20 are underestimated. Althoughthe SFRM predicts runoff hydrographs for EV19 and EV20closer to observed ones, the MSPSRM can produce thesuboptimal runoff hydrograph.
In summary, the MPSFRM can describe a nonlinear storagefunction well by means of taking into account the differentbehaviors of storageedischarge relationship on the rising andrecession limbs. As the result, the proposed MPSFRM canenhance the accuracy of runoff estimation.
Fig. 7. Comparison of statistics of performance indices of estimated runoff with multi-event optimal parameters.
Table 5
Summary of multi-event optimal parameters.
Model Parameter Number of calibration events
4 8 12 16
SFRM fr 0.608 0.603 0.773 0.774
p 0.873 0.916 0.561 0.408
k1 26.671 21.159 49.848 46.046
Tl 2 2 2 2
Rsa 317.941 400.739 399.984 205.399
PSFRM fr 0.714 0.64 0.812 0.741
p 0.713 0.926 0.628 0.626
k1 32.71 27.608 52.891 47.824
k2 3.119 6.054 3.286 3.834
Tl 2 1 2 2
Rsa 293.191 315.789 324.401 291.843
MPSFRM fr 0.638 0.637 0.764 0.769
p 0.872 0.909 0.651 0.646
k1 26.328 24.553 42.794 42.875
k2 7.359 6.429 5.092 4.483
k3 1.891 3.092 2.688 5.082
Tl 1 1 2 2
Rsa 497.256 497.494 401.085 488.032
45S.-J. Wu et al. / Journal of Hydro-environment Research 5 (2011) 37e47
Author's personal copy
5. Conclusions
This study modifies the storage function runoff model(SFRM), which is denoted as MPSFRM, based on the Prasadstorage function runoff model (PSFRM), by consideringdifferent coefficients for dq/dt on the rising and recessionlimbs. To calibrate parameters of SFRM, PSFRM, andMPSFRM, a method which combines the genetic algorithmwith the least square method was adopted in this study. Themodel validation was made using twenty rainstorm eventsrecorded at the Wudu gauge in the Keelung River of northernTaiwan. The results of the model validation indicate that theMPSFRM has a best capability to capture the actual stor-ageedischarge relationship, and hence, can more accuratelyestimate runoff than the SFRM and PSFRM. Furthermore, theMPSFRM provides a more flexibility in the runoff estimationthan the SFRM and PSFRM as the latter two are special casesof the former.
As for future work, the regional formula for the MPSFRMparameters should be developed based on physical meaning ofmodel parameters and geometric characteristics of the water-shed, such as the area, river length, and catchment slope. Suchregional formula will be useful in estimating runoff at anungauged watershed. Moreover, other global optimizationmethods with various calibration strategies could be utilized toobtain model parameters which might produce more accurateestimated runoff.
References
Aoki, H., Usui, N., Kon, H., 1976. One estimation method of the lag time Tl in
the storage function method. Journal of Research PWRI 18 (6), 29e43.
Chaubey, I., Haan, C.T., Grunwald, S., Salisbury, J.M., 1999. Uncertainty in
the model parameters due to spatial variability of rainfall. Journal of
Hydrology 220, 48e61.
Franchini, M., 1996. Using a genetic algorithm combined with a local search
method for the automatic calibration of conceptual rainfall-runoff models.
Hydrological Science Journal 41 (1), 21e40.
Jin, X., Chong, C.X., Zhang, Q., Singh, V.P., 2009. Parameter and modeling
uncertainty simulated by GLUE and a formal Bayesian method for
a conceptual hydrological model. Journal of Hydrology 383, 147e155.Kimura, T., 1961. The Flood Runoff Analysis Method by The Storage Func-
tion Model. The Public Works Research Institute Ministry of Construction.
Kimura, T., 1975. The Storage Function Model. Publishing Company Kawa-
nabe, Tokyo.
Madsen, H., 2000. Automatic calibration of a conceptual rainfall-runoff model
using multiple objectives. Journal of Hydrology 235, 276e288.
Madsen, H., Wilson, G., Ammentorp, H.C., 2002. Comparison of different
automated strategies for calibration of rainfallerunoff models. Journal of
Hydrology 261, 48e59.
Nash, J.E., Sutcliffe, J.V., 1970.Riverflow forecasting throughconceptualmodels:
part I e a discussion of principles. Journal of Hydrology 10, 282e290.Park, J., Kang, I.S., Singh, V.P., 1999. Comparison of simple runoff models
used in Korea for small watersheds. Hydrological Processes 13 (10),
1527e1540.
Prasad, R., 1967. A nonlinear hydrologic system response model. Proceedings
of ASCE 93 (HY4), 201e249.
Sonu, J., 1989. Regionalization of model parameters for a large watershed.
New Direction for Surface Water Modeling, Proceedings of IAHS 181,
177e185.
Fig. 8. Comparison of predicted hydrograph with multi-event optimal parameters.
46 S.-J. Wu et al. / Journal of Hydro-environment Research 5 (2011) 37e47

Author's personal copy
Sugiyama, H., Kadoya, M., Nagai, A., Lansey, K., 1997. Evaluation of the storage
functionmodelparameter characteristics. Journal ofHydrology191, 332e348.
Sugiyama, H., Kadoya, M., Nagai, A., Lansey, K., 1999. Verification and
application of regional equations for the storage function runoff model.
Journal of the American Water Resource Association 15 (5), 1147e1157.Sujono, J., Shikasho, S., Hiramatsu, K., 2003. Vagueness ratio of storage
function model parameters and its relation to the accuracy of hydrograph
prediction. Paddy Water Environment 1, 201e206.
Wang, Q.J., 1991. The genetic algorithm and its application to calibrating
conceptual rainfall-runoff models. Water Resources Research 27 (9),
2467e2471.
Yu, P.S., Yang, T.C., Chen, S.J., 2001. Comparison of uncertainty analysis
methods for a distributed rainfallerunoff model. Journal of Hydrology
224, 43e59.
Zbigniew, W.K., Jaroskaw, J.N., 1986. Nonlinear models of dynamic
hydrology. Hydrological Sciences Journal 31 (2), 163e185.
47S.-J. Wu et al. / Journal of Hydro-environment Research 5 (2011) 37e47
Related Documents