Runoff Calculations Predicting Runoff Depth, Volume and Peak Flow Environmental Hydrology Lecture 11

Runoff Calculations Predicting Runoff Depth, Volume and Peak Flow
Jan 01, 2016
Runoff Calculations Predicting Runoff Depth, Volume and Peak Flow. Environmental Hydrology Lecture 11. Precipitation rate, p (mm/hr). Runoff Production A Refresher. Horton overland flow. Robert E. Horton Image source: American Geophysical Union. p > i overland flow. - PowerPoint PPT Presentation
Welcome message from author
This document is posted to help you gain knowledge. Please leave a comment to let me know what you think about it! Share it to your friends and learn new things together.
Transcript

Runoff CalculationsPredicting Runoff Depth, Volume and Peak Flow
Environmental Hydrology
Lecture 11
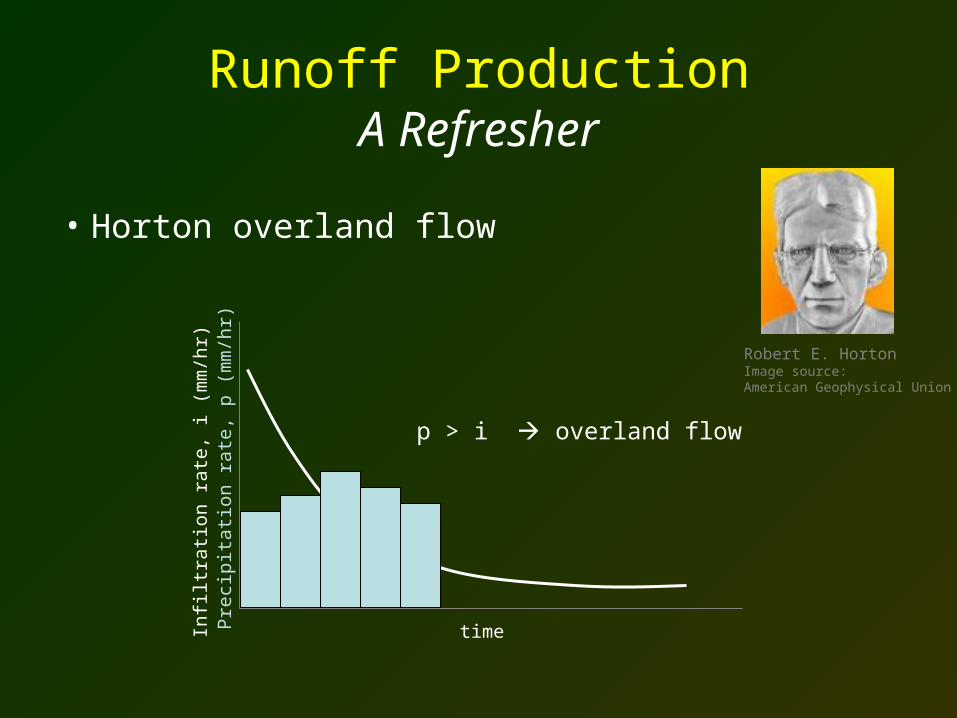
Runoff ProductionA Refresher
• Horton overland flow
time
Infil
trat
ion
rate
, i (
mm
/hr)
Pre
cipi
tatio
n r
ate,
p (
mm
/hr)
p > i overland flow
Robert E. HortonImage source:American Geophysical Union
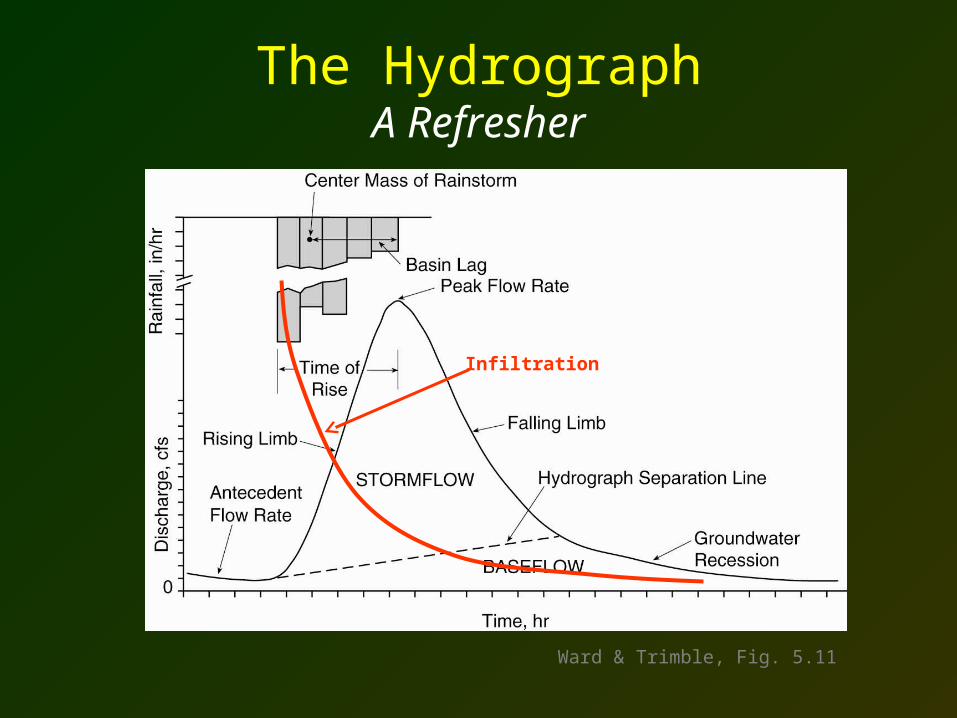
The HydrographA Refresher
Ward & Trimble, Fig. 5.11
Infiltration

Predicting Runoff and Storm Flow
• The Rational Equation (the SIMPLE model)
– Peak runoff discharge
• The Curve Number concept
– Storm runoff depth runoff volume
• The Graphical Peak Discharge method
– Peak runoff discharge
• Empirical Regression models
– e.g. USGS National Flood Frequency model

The Rational Method
AiCq ***008.1
Where…• q is peak flow in ft3/sec• C in an empirical coefficient• I is the rainfall intensity (in/h)• A is the catchment area (acres)
• The 1.008 factor is… 1 in/h * 1ft/12in *1h/3600sec * 43,560ft2/acre

Rational Coefficients

Concept: Soil Hydrogroups
• Group A: high infiltration (>0.3 in/h), low runoff
• Group B: moderate infiltration when wet (0.15 to 0.30 in/h), moderate runoff
• Group C: slow infiltration when wet (0.05 to 0.15 in/h), high runoff
• Group D: very low infiltration when wet (<0.05 in/h), very high runoff

Rational Method Assumptions and Limitations
• Rainfall is uniform
• Time of concentration (tc) is the time required for water to get from the most distant point in the watershed to the point of observation
• Peak runoff ≈ Peak rainfall intensity lagged by tc
• Frequency of runoff ≈ frequency of rainfall
• Best for small watersheds (<1 mile2)

Derivation of the CN equation
QFIP a
S
F
IP
Q
a
)(
SIa
Where…
P = precipitation (in)
Ia = initial abstraction (in)
F = cumulative infiltration (in)
Q = direct runoff (in)S = max. potential retention (in)
λ = coefficient, usually 0.2
)(
)( 2
SIP
IPQ
a
a
)8.0(
)2.0( 2
SP
SPQ
Mass Balance
Proportionality
SubstitutionS=f(P-Ia, Q)
Proportionality
Substitution
CN = curve number
inchesfor 101000
CN
S
mmfor 25425400
CN
STR-55 Manual, see also Mishra et al. 2006


Curve Numbers for Cover Types
Ward and Trimble, after NRCS

Concept: Antecedent Moisture Content(based on previous 5-day P)
• AMC-1 (Dry)– Dormant season P <0.5 in– Growing Season P <1.4 in
• AMC-2 (Average)– Dormant season 0.5<P <1.1 in– Growing Season 1.4<P <2.1 in
• AMC-3 (Wet)– Dormant season P >1.1 in– Growing Season P >2.1 in

Curve Number Adjustments for AMC
Ward and Trimble, after NRCS
0.0
0.5
1.0
1.5
2.0
2.5
0 20 40 60 80 100
CN forAMC-II
Adj
ustm
ent F
act
or
AMC-III
AMC-II
AMC-I

Curve Number (TR-55)Assumptions and Limitations
• Describes average and not extreme events
• Does not explicitly account for storm duration or intensity
• The term Ia is ill-defined and has important influences on the derivation of CN’s
• Does not deal with snow or rain on frozen ground
• Should not be used for storms <0.5 in
• Does not explicitly deal with groundwater effects
• Don’t use if the weighted CN is <40, inaccurate

The Graphical Peak Discharge Method
Where…• q is the peak runoff (ft3/sec)
• qu is the unit peak discharge (ft3/sec per square mile per inch of rain or csm/in)
• A is area (square miles)• Q is the total runoff depth (from CN, in inches)• F is a ponding adjustment factor
FQAqq u ***
Can be used to relate Q from CN approach to q.Essentially relates storm volume to storm peak q.

The “graphs” of the Graphical Method

The Graphical MethodAssumptions and Limitations
• Homogenous land cover/use in catchment
• Only one main stream, or an balance network
• “ponding” is off-stream, not in-stream
• Need some idea of Ia
• Need tc = f(hydraulic length, maximum retention [S], land slope, return interval)

Empirical Regression Models
• Where• DA = drainage area• S = channel bed slope• P = reference precipitation (e.g. 2y/24h)• BDF = an index of development• IC = percent impervious cover• U = indices of other land uses• STR = percent lakes, ponds, wetlands• E = elevation effect• Qft = the reference discharge event (e.g. 2y/24h)• X, a, b, c,… are fitted coefficients
ift
ihgf
edcbRI
QESTRUIC
BDFXPSDAaq
)()()1()()(
)13()()()(
This equation is used by FEMA for national flood forecasting (See NFF model)

Later in Lab:Reconstructing Whole Hydrographs
• Unit Hydrographs
• Time-area method
Related Documents


![Extraction Drainage Network for Lesser Zab River Basin ...€¦ · of the main inputs for estimating rainfall runoff, predicting flood levels and managing water resources [3]. Automation](https://static.cupdf.com/doc/110x72/5ecbb59aeaf25c38390e4892/extraction-drainage-network-for-lesser-zab-river-basin-of-the-main-inputs-for.jpg)