ELSEVIER Journal of Chromatography A, 755 (1996) 189-204 JOURNAL OF CHROMATOGRAPHY A Application of liquid chromatography-atmospheric pressure ionization mass spectrometry in natural product analysis Evaluation and optimization of electrospray and heated nebulizer interfaces Shaolian Zhou*, Matthias Hamburger Centre .for Natural Product Research, h2stitute ~f Molecular and Cell Biology, National University c~( Singapore, I0 Kent Ridge, Singapore 119260, Singapore Received 15 March 1996; revised 2 July 1996; accepted 3 July 1996 Abstract A representative set of 46 secondary metabolites of plant and microbial origin was examined with electrospray and atmospheric pressure chemical ionization MS in both positive and negative ion mode, in order to evaluate the applicability of atmospheric pressure ionization LC-MS as a tool for rapid identification and dereplication of bioactive compounds in the drug screening process. MS characteristics of different compound classes were determined on the basis of quasi-molecular ion and other adduct ion responses observed with the two LC-MS interfaces. Interface parameters and LC mobile phase composition were optimized and an analytical protocol applicable to a wide range of secondary metabolites is proposed. Keywords: Interfaces; Electrospray ionization; Nebulizing interface; Atmosphere pressure chemical ionization; Detection, LC 1. Introduction In new drug lead discovery programmes, bio- logical samples still play an important role as source for structurally diverse and unique molecules ]1]. However, the success of a high-throughput screening operation critically depends on the implementation of procedures for efficient dereplication of known and/ or otherwise uninteresting molecules and the early identification of potentially new leads. Mass spec- trometry (MS), with its high sensitivity and capa- bility of providing M r and additional structural *Corresponding author. Present address: Department of Chemis- try, University of Tennessee, Knoxville, TN 37919, USA. information, fulfills many of the requirements of an ideal dereplication technique. With the recent de- velopments in MS interface technology, the pros- pects for characterization of unknown compounds in complex matrices by means of LC-MS have sig- nificantly improved [2,3]. A number of interfaces are of potential interest for dereplication purposes. Among the most commonly used LC-MS interfaces, the particle beam (PB) interface [4] can be operated in both chemical ionization (CI) and electron impact (El) mode. EI spectra produced by the PB interface are comparable to conventional El spectra and are therefore search- able thanks to commercially available MS libraries. The major drawback of PB is the lack of sensitivity 0021-9673/96/$15.00 © 1996 Elsevier Science B.V. All rights reserved Pll S0021-9673(96)00617-6

Welcome message from author
This document is posted to help you gain knowledge. Please leave a comment to let me know what you think about it! Share it to your friends and learn new things together.
Transcript
E L S E V I E R Journal of Chromatography A, 755 (1996) 189-204
JOURNAL OF CHROMATOGRAPHY A
Application of liquid chromatography-atmospheric pressure ionization mass spectrometry in natural product analysis
Evaluation and optimization of electrospray and heated nebulizer interfaces
S h a o l i a n Z h o u * , M a t t h i a s H a m b u r g e r Centre .for Natural Product Research, h2stitute ~f Molecular and Cell Biology, National University c~( Singapore, I0 Kent Ridge,
Singapore 119260, Singapore
Received 15 March 1996; revised 2 July 1996; accepted 3 July 1996
Abstract
A representative set of 46 secondary metabolites of plant and microbial origin was examined with electrospray and atmospheric pressure chemical ionization MS in both positive and negative ion mode, in order to evaluate the applicability of atmospheric pressure ionization LC-MS as a tool for rapid identification and dereplication of bioactive compounds in the drug screening process. MS characteristics of different compound classes were determined on the basis of quasi-molecular ion and other adduct ion responses observed with the two LC-MS interfaces. Interface parameters and LC mobile phase composition were optimized and an analytical protocol applicable to a wide range of secondary metabolites is proposed.
Keywords: Interfaces; Electrospray ionization; Nebulizing interface; Atmosphere pressure chemical ionization; Detection, LC
1. Introduction
In new drug lead discovery programmes, bio- logical samples still play an important role as source for structurally diverse and unique molecules ]1]. However, the success of a high-throughput screening operation critically depends on the implementation of procedures for efficient dereplication of known and/ or otherwise uninteresting molecules and the early identification of potentially new leads. Mass spec- trometry (MS), with its high sensitivity and capa- bility of providing M r and additional structural
*Corresponding author. Present address: Department of Chemis- try, University of Tennessee, Knoxville, TN 37919, USA.
information, fulfills many of the requirements of an ideal dereplication technique. With the recent de- velopments in MS interface technology, the pros- pects for characterization of unknown compounds in complex matrices by means of L C - M S have sig- nificantly improved [2,3].
A number of interfaces are of potential interest for dereplication purposes. Among the most commonly used L C - M S interfaces, the particle beam (PB) interface [4] can be operated in both chemical ionization (CI) and electron impact (El) mode. EI spectra produced by the PB interface are comparable to conventional El spectra and are therefore search- able thanks to commercially available MS libraries. The major drawback of PB is the lack of sensitivity
0021-9673/96/$15.00 © 1996 Elsevier Science B.V. All rights reserved Pl l S 0 0 2 1 - 9 6 7 3 ( 9 6 ) 0 0 6 1 7 - 6
190 S. Zhou. M. Hamburger / J. Chromatogr. A 755 (1996) 189-204
for non-volatile compounds. It is thus not suitable for the analysis of polar molecules as encountered in most natural product extracts [2,5]. The thermospray (TSP) interface has been successfully used for the analysis of a wide range of natural products, includ- ing polar and non-volatile compounds [2,5-16]. However, good TSP performance critically depends on the operating conditions (vaporizer and source temperature, repeller voltage) which need to be optimized for the analyte of interest [2,5,17]. Thus, the TSP interface is not very suitable in the context of a high-throughput screening programme, where the analytes are typically unknown and of high structural diversity [17]. Also, the high temperature applied during vaporization may lead to decomposi- tion of thermolabile samples [2,5]. The continuous- flow fast atom bombardment (CF-FAB) interface [18] has also found some application in natural product chemistry [19]. Although CF-FAB over- comes some limitations of TSP, its use appears limited due to the difficulties of practical im- plementation. In the recently introduced electrospray interface (ES|) [20,21], the ions are taken straight from the liquid phase at room temperature and atmospheric pressure. ESI is ideally suited for the analysis of large biomoleculessuch as proteins, but is also increasingly used for non-volatile molecules in the lower to mid-mass range [22-29]. The heated nebulizer (atmospheric pressure chemical ionization, APCI) is another type of interface operating at atmospheric pressure, where analyte ions are gener- ated via chemical ionization in the gas phase [30]. The temperature control of the APCI desolvation process appears far less critical than in TSP-MS, and a wide range of compounds may possibly be analyzed under the same vaporizer conditions [2,3]. The main application of LC-APCI-MS analysis has been for analysis of drug metabolites in biological samples [31-34]. Despite its inherent advantages over TSP, APCI has not been applied to natural products.
Considering our goal, namely the development of a general LC-MS tool for the analysis of a wide range of natural products in unknown samples, a combination of the ESI and APCI interfaces ap- peared to hold the best promise. The ionization mechanisms of ESI and APCI differ [35], hence the ionization characteristics for various analytes also
differ. The ESI process is strongly dependent on the solution chemistry, electrophoretic migration and surface behavior of analyte ions [35-39]. The pres- ence of preformed ion species in solution is essential for the formation of gas phase ions. In contrast to ESI, APCI relies more on the gas phase chemistry, e.g., the gas phase acidity or basicity [40]. The analyte is vaporized into the gas stream prior to chemical ionization through the charge transfer or proton transfer from the reagent ions. In LC-MS applications with both atmospheric pressure ioniza- tion interfaces, change of LC mobile phase com- position may influence the ion formation and re- sponse [35,38,41]. We report here on the first sys- tematic optimization of API-MS for natural product analysis and the development of a generally applic- able LC-API-MS dereplication protocol. A set of 46 diverse natural products of plant and microbial origin were analyzed under ESI- and APCI-MS condition, both in positive and negative ionization mode (Table 1). MS ionization characteristics and ion response under different instrument conditions and with vari- ous mobile phase compositions were examined.
2. Experimental
2.1. API-MS
All experiments were performed with a Sciex API III p~u~ triple quadrupole mass spectrometer coupled with articulated ionspray interface for pneumatically assisted electrospray ionization (ESI) and a heated nebulizer interface for APCI-MS (Sciex, Thornhill, Canada). Major parameters of two interfaces used in this study are listed in Table 2, with exception of those specifically stated in the Section 3 (Results and discussion). The mass ions were recorded in the full scan mode by quadrupole 1. The MS data were averaged from three replicate injections (10/zl each).
2.2. Liquid chromatography
The HPLC system consisted of a Perkin-Elmer 200 series pump, ISS 200 autosampler and LC-95 UV detector (Perkin-Elmer, Norwalk, CT, USA). Direct flow injection analysis was performed without HPLC columns. The eluent was transferred at the
S. Zhou, M. Hamburger / J. Chromatogr. A 755 (1996) 189-204
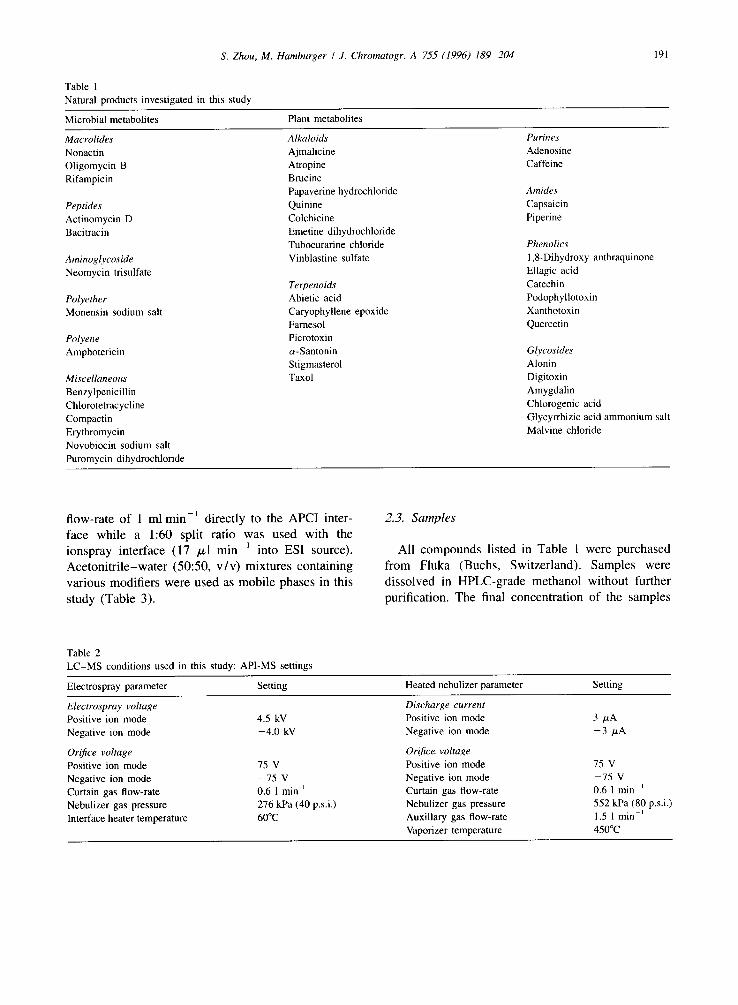
Table 1 Natural products investigated in this study
191
Microbial metabolites Plant metabolites
Macrolides Alkaloids Nonactin Ajmalicine Oligomycin B Atropine Rifampicin Brucine
Papaverine hydrochloride Peptides Quinine Actinomycin D Colchicine Bacitracin Emetine dihydrochloride
Tubocurarine chloride Aminoglycoside Vinblastine sulfate Neomycin trisulfate
Polyether Monensin sodium salt
Polyene Amphotericin
Miscellaneous Benzylpenicillin Chlorotetracycline Compactin Erythromycin Novobiocin sodium salt Puromycin dihydrochloride
Terpenoids Abietic acid Caryophyllene epoxide Farnesol Picrotoxin o~-Santonin Stigmasterol Taxol
Purines Adenosine Caffeine
Amides Capsaicin Piperine
Phenolics 1,8-Dihydroxy anthraquinone Ellagic acid Catechin Podophyllotoxin Xanthotoxin Quercetin
Glycosides Alonin Digitoxin Amygdalin Chlorogenic acid Glycyrrhizic acid ammonium salt Malvine chloride
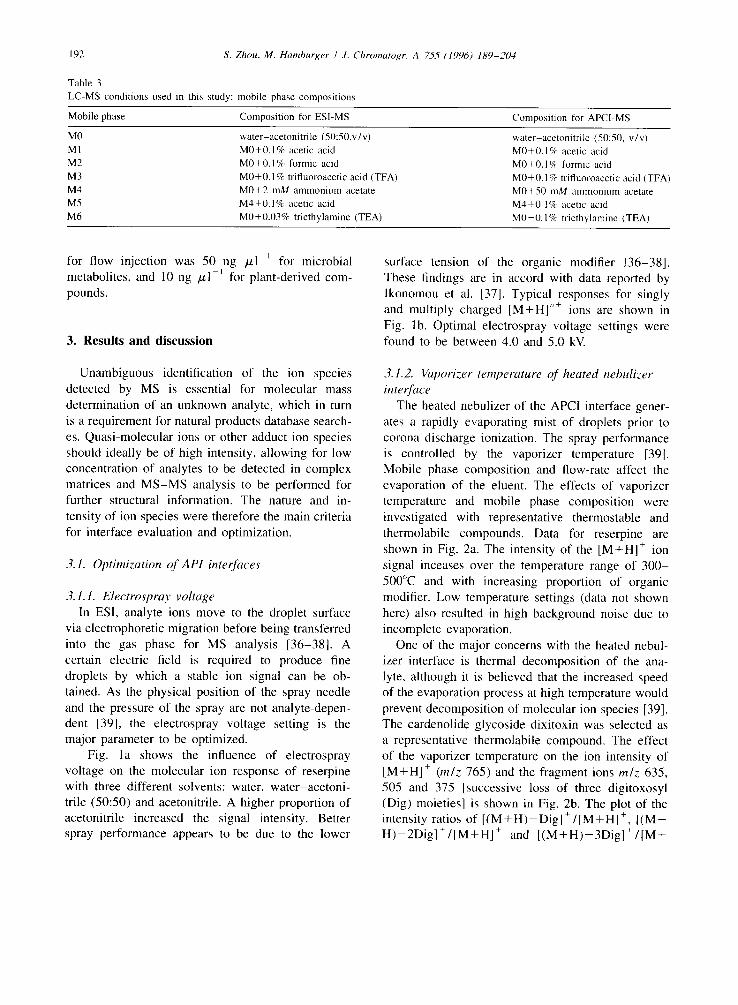
flow-rate of 1 ml min-1 directly to the APCI inter- face while a 1:60 split ratio was used with the ionspray interface (17 /zl min l into ESI source). Acetonitrile-water (50:50, v /v) mixtures containing various modifiers were used as mobile phases in this study (Table 3).
2.3. Samples
All compounds listed in Table 1 were purchased from Fluka (Buchs, Switzerland). Samples were dissolved in HPLC-grade methanol without further purification. The final concentration of the samples
Table 2 LC-MS conditions used in this study: API-MS settings
Electrospray parameter Setting Heated nebulizer parameter Setting
Electrospray voltage Positive ion mode 4.5 kV Negative ion mode -4 .0 kV
Orifice voltage Positive ion mode 75 V Negative ion mode -75 V Curtain gas flow-rate 0.6 1 min Nebulizer gas pressure 276 kPa (40 p.s.i.) Interface heater temperature 60°C
Discharge current Positive ion mode Negative ion mode
Orifice voltage Positive ion mode Negative ion mode Curtain gas flow-rate Nebulizer gas pressure Auxiliary gas flow-rate Vaporizer temperature
3 /zA - 3 #A
75 V - 7 5 V 0.6 1 m i n t 552 kPa (80 p.s.i.) 1.5 1 min- 450°C
192 S. Zhou, M. Hamburger J. Chromatogr. A 75.5 (1996) 189-204
Table 3 LC-MS conditions used in this study: mobile phase composmons
Mobile phase Composition for ESI-MS Composition for APCI-MS
M0 M1 M2 M3 M4 M5 M6
water-acetonitrile (50:50,v/v) M0+0.1% acetic acid M0+0.1% formic acid M0+0.1% trifluoroacetic acid (TFA) M0+2 mM ammonium acetate M4+0.1% acetic acid M0+0.03% triethylamine (TEA)
water acetonitrile (50:50, v/v) M0+0.1% acetic acid M0+0.1% formic acid M0+0.1% trifluoroacetic acid (TFA) M0+50 mM ammonium acetate M4+0.1% acetic acid M0+0.1% triethylamine (TEA)
for flow injection was 50 ng # l ~ for microbial metabolites, and 10 ng # l ~ for plant-derived com- pounds.
3. Results and discussion
Unambiguous identification of the ion species detected by MS is essential for molecular mass determination of an unknown analyte, which in turn is a requirement for natural products database search- es. Quasi-molecular ions or other adduct ion species should ideally be of high intensity, allowing for low concentration of analytes to be detected in complex matrices and M S - M S analysis to be performed for further structural information. The nature and in- tensity of ion species were therefore the main criteria for interface evaluation and optimization.
3.1. Optimization of AP1 interfaces
3.1.1. Electrospray voltage In ESI, analyte ions move to the droplet surface
via electrophoretic migration before being transferred into the gas phase for MS analysis [36-38]. A certain electric field is required to produce fine droplets by which a stable ion signal can be ob- tained. As the physical position of the spray needle and the pressure of the spray are not analyte-depen- dent [39], the electrospray voltage setting is the major parameter to be optimized.
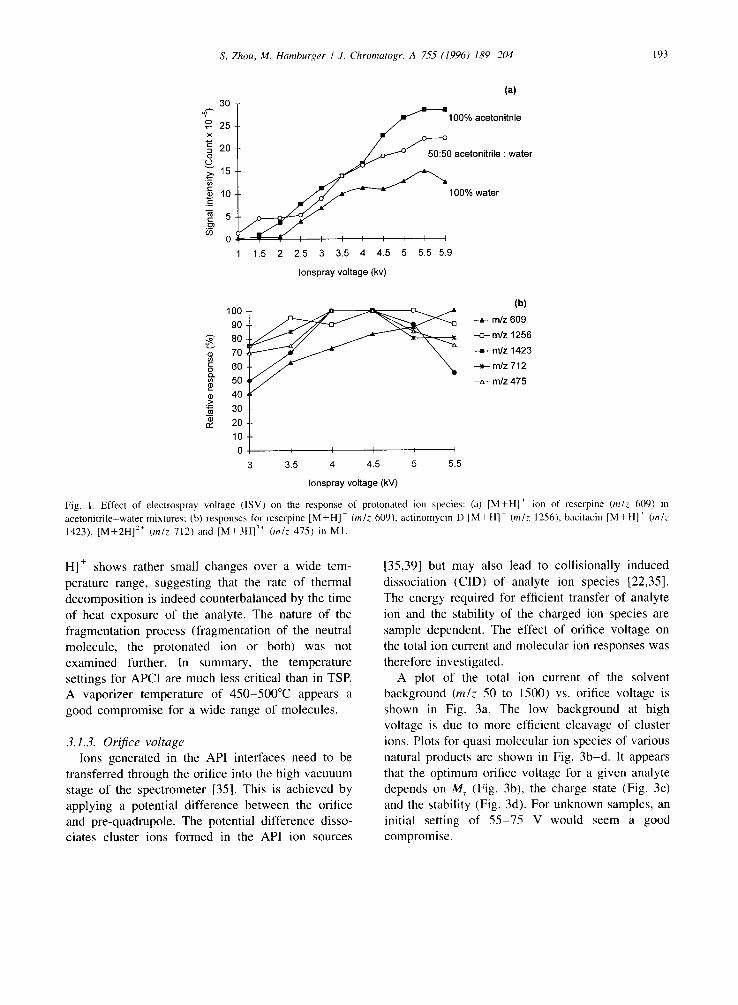
Fig. la shows the influence of electrospray voltage on the molecular ion response of reserpine with three different solvents: water, water-acetoni- trile (50:50) and acetonitrile. A higher proportion of acetonitrile increased the signal intensity. Better spray performance appears to be due to the lower
surface tension of the organic modifier [36-38]. These findings are in accord with data reported by Ikonomou et al. [37]. Typical responses for singly and multiply charged [M+H] ''+ ions are shown in Fig. lb. Optimal electrospray voltage settings were found to be between 4.0 and 5.0 kV.
3.1.2. Vaporizer temperature of heated nebulizer interface
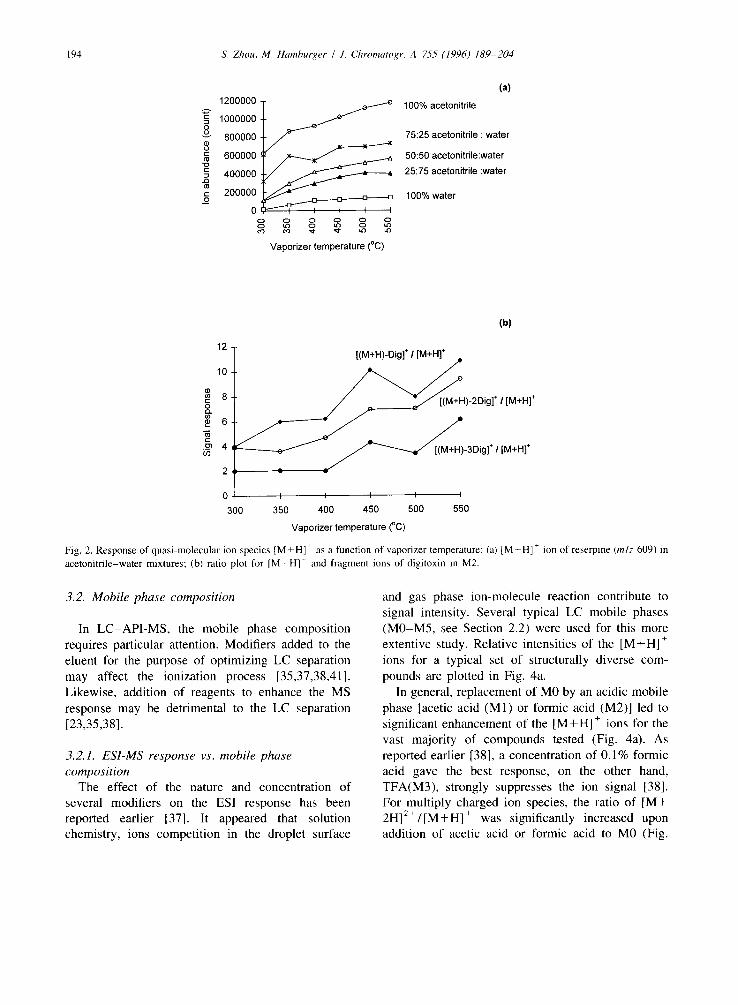
The heated nebulizer of the APCI interface gener- ates a rapidly evaporating mist of droplets prior to corona discharge ionization. The spray performance is controlled by the vaporizer temperature [39]. Mobile phase composition and flow-rate affect the evaporation of the eluent. The effects of vaporizer temperature and mobile phase composition were investigated with representative thermostable and thermolabile compounds. Data for reserpine are shown in Fig. 2a. The intensity of the [M+H] + ion signal inceases over the temperature range of 300- 500°C and with increasing proportion of organic modifier. Low temperature settings (data not shown here) also resulted in high background noise due to incomplete evaporation.
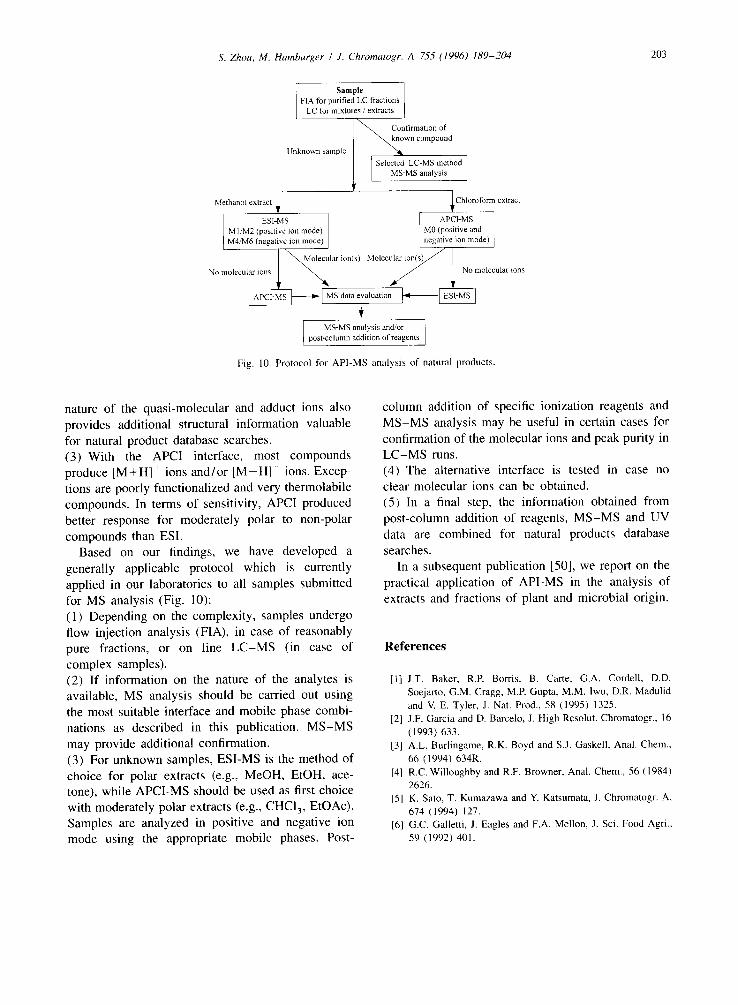
One of the major concerns with the heated nebul- izer interface is thermal decomposition of the ana- lyte, although it is believed that the increased speed of the evaporation process at high temperature would prevent decomposition of molecular ion species [39]. The cardenolide glycoside dixitoxin was selected as a representative thermolabile compound. The effect of the vaporizer temperature on the ion intensity of [M+H] + (m/z 765) and the fragment ions m/z 635, 505 and 375 [successive loss of three digitoxosyl (Dig) moieties] is shown in Fig. 2b. The plot of the intensity ratios of [ ( M + H ) - D i g ] + / [ M + H ] +, [ (M+ H ) - 2 D i g ] t / [ M + H ] + and [ ( M + H ) - 3 D i g ] + / [ M +
S. Zhou, M. Hamburger / J. Chromatogr. A 755 (1996) 189-204 193
o
x
o 0
(D
30
25
20
15
10
5
0
(a)
-100% acetonitrile
0 acetonitrile : water
~ ~ 100°/° water
1.5 2 2.5 3 3.5 4 4.5 5 5.5 5.9
Ionspray voltage (kv)
100 90
X 6o ~ 5 0
~ 4o N 3o rr 20
10 0
(b) m/z 609
-c:- m/z 1256 --e-- m/z 1423 -~- m/z 712
m l z 475
I I I I I
3.5 4 4.5 5 5.5
Ionspray voltage (kV)
Fig. 1. Effect of electrospray voltage (ISV) on the response of protonated ion species: (a) [M+HI + ion of reserpine (m/z 609) in acetonitrile-water mixtures; (b) responses for reserpine [M +H]- (m/z 609), actinomycin D [M +H]- (m/z 1256), bacitacin [M +HI + (m/z 1423), [M+2H] 2+ (m/z 712) and [M+3H] ~ (m/z 475) in MI.
HI + shows rather small changes over a wide tem- perature range, suggesting that the rate of thermal decomposition is indeed counterbalanced by the time of heat exposure of the analyte. The nature of the fragmentation process (fragmentation of the neutral molecule, the protonated ion or both) was not examined further. In summary, the temperature settings for APCI are much less critical than in TSE A vaporizer temperature of 450-500°C appears a good compromise for a wide range of molecules.
3.1.3. Orifice voltage Ions generated in the API interfaces need to be
transferred through the orifice into the high vacuuum stage of the spectrometer [35]. This is achieved by applying a potential difference between the orifice and pre-quadrupole. The potential difference disso- ciates cluster ions formed in the API ion sources
[35,39] but may also lead to collisionally induced dissociation (CID) of analyte ion species [22,35]. The energy required for efficient transfer of analyte ion and the stability of the charged ion species are sample dependent. The effect of orifice voltage on the total ion current and molecular ion responses was therefore investigated.
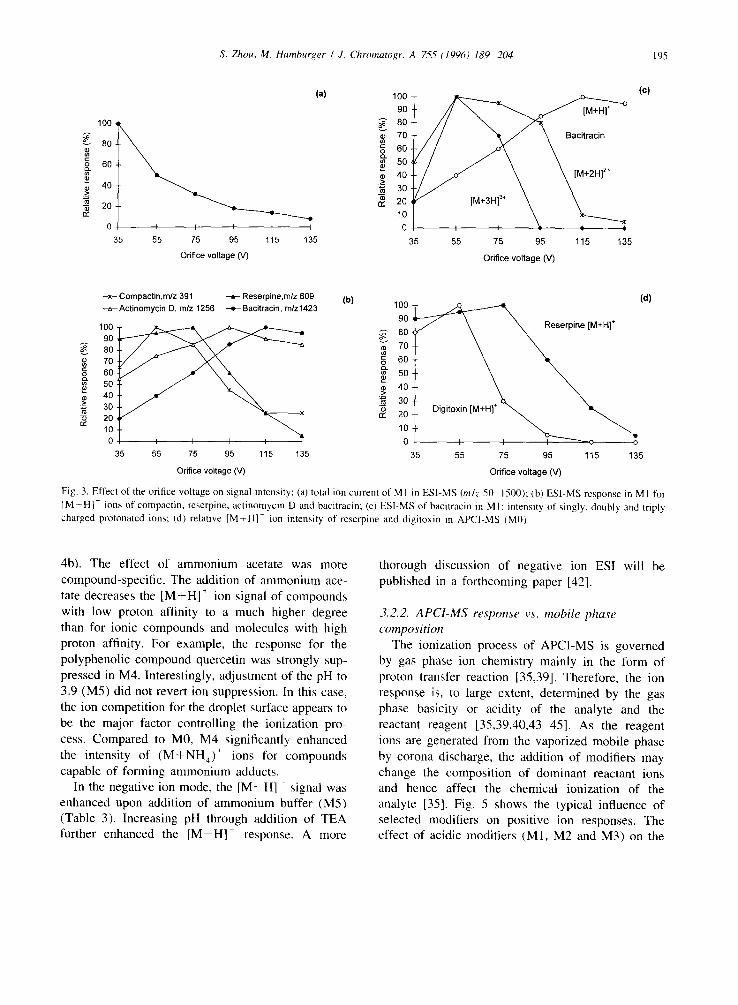
A plot of the total ion current of the solvent background (m/z 50 to 1500) vs. orifice voltage is shown in Fig. 3a. The low background at high voltage is due to more efficient cleavage of cluster ions. Plots for quasi-molecular ion species of various natural products are shown in Fig. 3b-d. It appears that the optimum orifice voltage for a given analyte depends on M r (Fig. 3b), the charge state (Fig. 3c) and the stability (Fig. 3d). For unknown samples, an initial setting of 55-75 V would seem a good compromise.
194 S. Zhou, M. Hamburger / J. Chromatogr. A 755 (1996) 189-204
1200000
= 1000000
o~ 800000 8 = 600000
400000
200000
0
(a)
100% acetonitrile
75:25 acetonitrile : water
~ 50:50 acetonitrile:water
25:75 acetonitrile :water
100% water I I I I I
Vaporizer temperature (°C)
(b)
12 [(M+H)-DIg] + I [M+H] ÷
.-~ 4
2
0 I I I I I 300 350 400 450 500 550
Vaporizer temperature (°C)
Fig. 2. Response of quasi-molecular ion species [M + H] + as a function of vaporizer temperature: (a) {M +H] + ion of reserpine (m/z 609) in acetonitrile-water mixtures; (b) ratio plot for [M+H]- and fragment ions of digitoxin in M2.
3.2. Mobile phase composition
In LC-AP1-MS, the mobile phase composition requires particular attention. Modifiers added to the eluent for the purpose of optimizing LC separation may affect the ionization process [35,37,38,41]. Likewise, addition of reagents to enhance the MS response may be detrimental to the LC separation [23,35,381.
3.2.1. ESI-MS response vs. mobile phase composition
The effect of the nature and concentration of several modifiers on the ESI response has been reported earlier [37]. It appeared that solution chemistry, ions competition in the droplet surface
and gas phase ion-molecule reaction contribute to signal intensity. Several typical LC mobile phases (M0-M5, see Section 2.2) were used for this more extentive study. Relative intensities of the [M+H] + ions for a typical set of structurally diverse com- pounds are plotted in Fig. 4a.
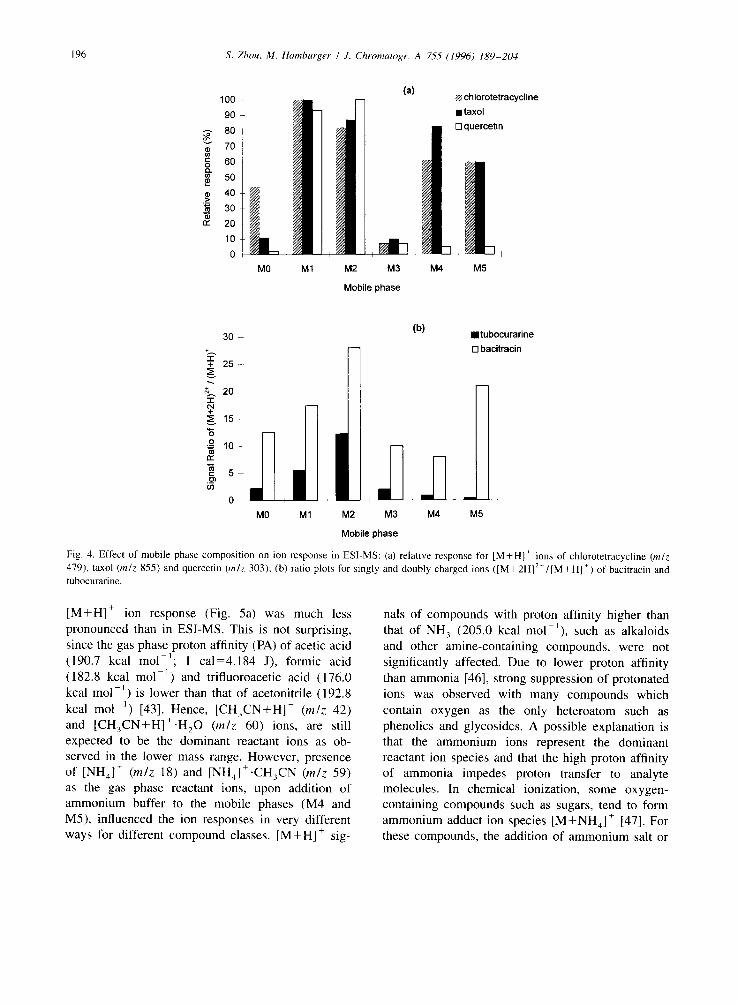
In general, replacement of M0 by an acidic mobile phase [acetic acid (M1) or formic acid (M2)] led to significant enhancement of the [M+H] + ions for the vast majority of compounds tested (Fig. 4a). As reported earlier [38], a concentration of 0.1% formic acid gave the best response, on the other hand, TFA(M3), strongly suppresses the ion signal [38]. For multiply charged ion species, the ratio of [M+ 2H]2+/[M+H] + was significantly increased upon addition of acetic acid or formic acid to M0 (Fig.
S. Zhou, M. Hamburger / J. Chromatogr. A 755 (1996) 189-204 195
rv"
100
80
60
(a)
40
20
0 35
I I I I I
55 75 95 115 135 Orifice voltage (V)
80 ~ 7o ~ 6 0 ~ / ~ , ~ ~ 50. >e 40 [M+2H] 2~
\ 2O 1
35 55 75 95 115 135 Orifice voltage (V)
(c)
-x- Compactin,m/z 391 ~ Reserpine,m/z 609 --~-Actinomycin D, m/z 1256 -e-Bacitracin, m/z1423
100 , ~ 90 80 70 60 50. 40 30. 20, 10 0 I I I I I
35 55 75 95 115 135
( b ) 100
go
o~ 80 70
60
50 m 40 30 20 10 0
35
( d )
[M+H] +
Digitoxin [M+H]* I I I ~ o ~ o ~ ' ~ ~
55 75 95 115 135 Orifice voltage (V) Orifice voltage (V)
Fig. 3. Effect of the orifice voltage on signal intensity: (a) total ion current of MI in ESI-MS (m/z 50-1500); (b) ES1-MS response in M1 for [M +H] + ions of compactin, reserpine, actinomycin D and bacitracin; (c) ESI-MS of bacitracin in M l: intensity of singly, doubly and triply charged protonated ions; (d) relative [M+H]- ion intensity of reserpine and digitoxin in APCI-MS (M0).
4b). The effect of ammonium acetate was more compound-specific. The addition of ammonium ace- tate decreases the [M+H] + ion signal of compounds with low proton affinity to a much higher degree than for ionic compounds and molecules with high proton affinity. For example, the response for the polyphenolic compound quercetin was strongly sup- pressed in M4. Interestingly, adjustment of the pH to 3.9 (M5) did not revert ion suppression. In this case, the ion competition for the droplet surface appears to be the major factor controlling the ionization pro- cess. Compared to M0, M4 significantly enhanced the intensity of (M+NH4) + ions for compounds capable of forming ammonium adducts.
In the negative ion mode, the [ M - H ] - signal was enhanced upon addition of ammonium buffer (M5) (Table 3). Increasing pH through addition of TEA further enhanced the [ M - H ] - response. A more
thorough discussion of negative ion ESI will be published in a forthcoming paper [42].
3.2.2. APCI-MS response vs. mobile phase composition
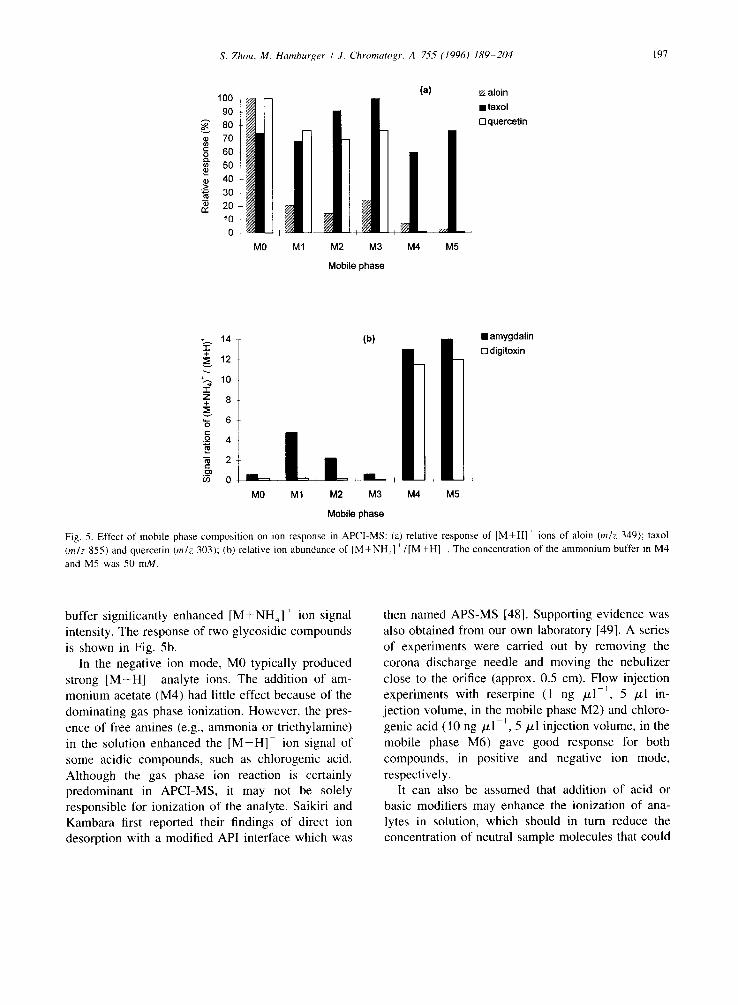
The ionization process of APCI-MS is governed by gas phase ion chemistry mainly in the form of proton transfer reaction [35,39]. Therefore, the ion response is, to large extent, determined by the gas phase basicity or acidity of the analyte and the reactant reagent [35,39,40,43-45]. As the reagent ions are generated from the vaporized mobile phase by corona discharge, the addition of modifiers may change the composition of dominant reactant ions and hence affect the chemical ionization of the analyte [35]. Fig. 5 shows the typical influence of selected modifiers on positive ion responses. The effect of acidic modifiers (M1, M2 and M3) on the
196 S. Zhou. M. Hamburger / J. Chromatogr. A 755 (1996) 189-204
v
0
100
90
80
70
60
50
40
30
20
10
0
(a) [ ] chlorotetracycline
_ • taxol
[ ] quercetin
®
MO M1 M2 M 4 M3
t
M5
Mobile phase
(b) 3O I tubocurarine
0 bacitracin
V -*._. 2 0 ~ '1"
b5
MO M1 M2 M3 M4 M5
Mobile phase
Fig. 4. Effect of mobile phase composition on ion response in ESI-MS: (a) relative response for [M+H] + ions of chlorotetracycline (m/z 479), taxol (m/z 855) and quercetin (m/z 303); (b) ratio plots for singly and doubly charged ions ([M + 2H] 2+/[M + H] +) of bacitracin and tubocurarine.
[M+H] + ion response (Fig. 5a) was much less pronounced than in ESI-MS. This is not surprising, since the gas phase proton affinity (PA) of acetic acid (190.7 kcal mol ]; 1 ca1=4.184 J), formic acid (182.8 kcal mol 1) and trifluoroacetic acid (176.0 kcal mol - j ) is lower than that of acetonitrile (192.8 kcal tool ~) [43]. Hence, [CH3CN+H] + (m/z 42) and [CH3CN+H]+-H20 (m/z 60) ions, are still expected to be the dominant reactant ions as ob- served in the lower mass range. However, presence of [NH4] + (m/z 18) and [NH4]+.CH3CN (m/z 59) as the gas phase reactant ions, upon addition of ammonium buffer to the mobile phases (M4 and M5), influenced the ion responses in very different ways for different compound classes. [M+H] + sig-
nals of compounds with proton affinity higher than that of NH 3 (205.0 kcal mol l), such as alkaloids and other amine-containing compounds, were not significantly affected. Due to lower proton affinity than ammonia [46], strong suppression of protonated ions was observed with many compounds which contain oxygen as the only heteroatom such as phenolics and glycosides. A possible explanation is that the ammonium ions represent the dominant reactant ion species and that the high proton affinity of ammonia impedes proton transfer to analyte molecules. In chemical ionization, some oxygen- containing compounds such as sugars, tend to form ammonium adduct ion species [M+NH4] + [47]. For these compounds, the addition of ammonium salt or
S. Zhou, M. Hamburger / J. Chromatogr. A 755 (1996) 189-204 197
o
G}
100 90 80 70 60 50 40 30 20 10 0
MO
(a)
j J M1 M2 M3 M4 M5
aloin • taxol D quercetin
Mobile phase
*~ 14 -i- + 12
*.-. 10 :ff z 8 +
-6 6
co 0
(b) ml • amygdalin • D digitoxin
M0 M1 M2 M3 M4 M5
Mobile phase
Fig. 5. Effect of mobile phase composition on ion response in APCI-MS: (a) relative response of [M+H] ÷ ions of aloin (m/z 349); taxol (m/z 855) and quercetin (mlz 303); (b) relative ion abundance of [M+NH4] +/[M+H] +. The concentration of the ammonium buffer in M4
and M5 was 50 mM.
buffer significantly enhanced [M+NH 4] + ion signal intensity. The response of two glycosidic compounds is shown in Fig. 5b.
In the negative ion mode, M0 typically produced strong [ M - H ] analyte ions. The addition of am- monium acetate (M4) had little effect because of the dominating gas phase ionization. However, the pres- ence of free amines (e.g., ammonia or triethylamine) in the solution enhanced the [ M - H ] ion signal of some acidic compounds, such as chlorogenic acid. Although the gas phase ion reaction is certainly predominant in APCI-MS, it may not be solely responsible for ionization of the analyte. Saikiri and Kambara first reported their findings of direct ion desorption with a modified API interface which was
then named APS-MS [48]. Supporting evidence was also obtained from our own laboratory [49]. A series of experiments were carried out by removing the corona discharge needle and moving the nebulizer close to the orifice (approx. 0.5 cm). Flow injection experiments with reserpine (1 ng /,zl - l , 5 /zl in- jection volume, in the mobile phase M2) and chloro- genic acid (10 ng #1 -], 5/21 injection volume, in the mobile phase M6) gave good response for both compounds, in positive and negative ion mode, respectively.
It can also be assumed that addition of acid or basic modifiers may enhance the ionization of ana- lytes in solution, which should in turn reduce the concentration of neutral sample molecules that could
198 S. Zhou, M. H a m b u r g e r / J. Chromatogr . A 755 (1996) 1 8 9 - 2 0 4
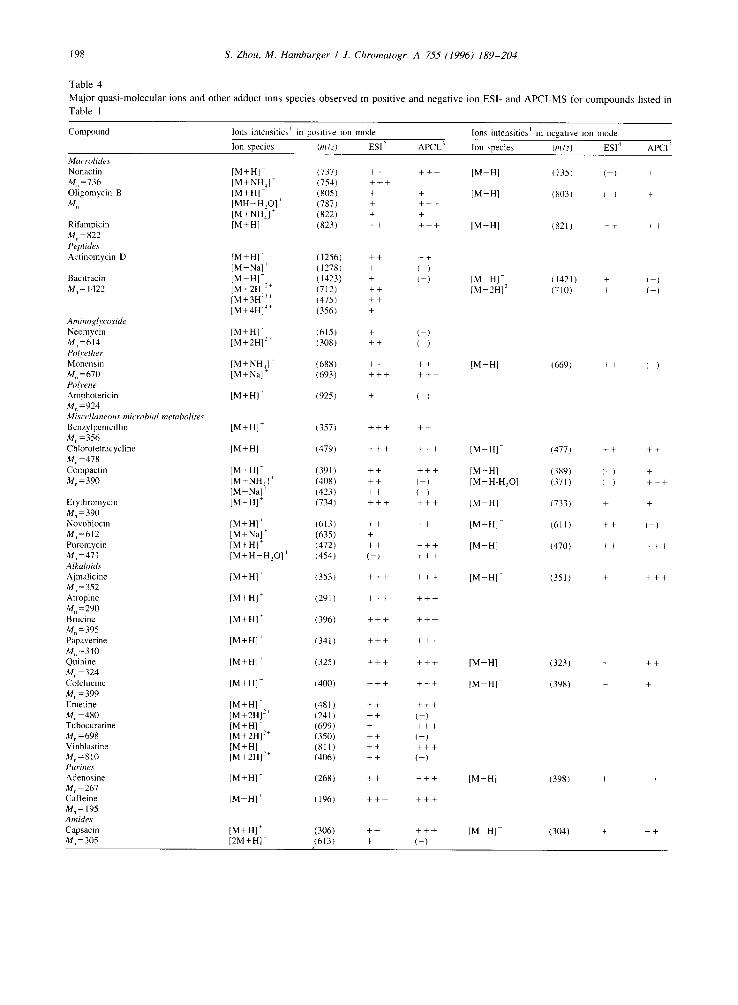
Table 4
Ma jo r quas i -molecu la r ions and other adduct ions species obse rved in pos i t ive and nega twe ion ESI- and A P C I - M S for compounds l isted in
Table 1
Compound Ions intensities I in positive ion mode • . . i
Ions intensities in negative ion mode
Ion species (re~z) ESI z APCL 3 Ion species (m/z) ESI 4 APCI ~
Macrolides Nonactin [M+H]* (737) + + + + + IM HI (735) Mn =736 [M+NH4] - (754) + + + Oligomycin B [M+H] + (805) + + [M-H] (803) M,, [MH-H~O] + (787) + + + +
[M+NH4] + (822) + + Rifampicin [M+H] ~ (823) + + + + + [M-H] (821) Mn - 822 Peptides Actinomycin D [M+H] ~ (1256) + + + +
[M+Na] + (1278) + ( ) Bacitracin [M+H]" (1423) + ( - ) [M HI (1421) M~, 1422 [M+2H] 2+ (712) + + [M-2H] 2 (710)
[M+3H] 3+ (475) + + [M+4HI 4+ (356) +
( - ) +
( ) +
++ ++
+ ( ) + ( - )
++
+ + +
+ + +
Aminoglycoside Neomycin [M+H]- (615) + ( - ) M. =614 [M +2H] -~÷ (308) + + ( - ) Polyether Monensin [M + NH4] ~ (688) + + + + [ M - H I (669) + + ( - ) M.=670 [M+Na] + (693) + + + + + + Pol3ene Amphotericin [M+H} ~ (925) + ( - ) M,, = 924 Miscellaneous microbial metabolites Benzylpenicillin [M + H] + (357) + + + + + M. - 356 Chlorotetracycline IM +HI + (479) + + + + + + [ M - H ] - (477) + + M° -478 Compactin [M+H] * (391) + + + + + [M-HI (389) ( - ) + M,,=390 [M+NH4] + (408) + + ( ) [M-H-H20 ]- (371) ( )
[M+Na] + (423) + + ( - ) Erythromycin [M +H] + (734) + + + + + + [M-H] (733) + + M n - 390 Novobiocin [M+H] + (613) + + + + [M-H] (61 I ) + + ( - ) Mn=612 [M+Na] + (635) + Puromycin [M+H] + (472) + + + + + [M HI (470) + + M° 471 [ M + H - H , O ] + (454) ( - ) + + + Alkaloids Ajmalicine [M+H]* (353) + + + + + + [ M - H I - (351) + M. =352 Atropine [M+HI + (291) + + + + + + M . - 2 9 0 Bmcine [M+H] + (396) + + + + + + M . - 3 9 5 Papaverine [M + H] + (341 ) + + + + + + M~ =340 Quinine [M+H] + (325) + + + + + + [M-H] (323) + + + M. - 324 Colchicine {M+H] + (400) + + + + + + [M-H] (398) + + M. - 399 Emetine [M + H] ÷ (481 ) + + + + + M. =480 [M +2H] 2+ (241) + + ( - ) Tubocurarine [M + H] * (699) + + + + M,,=698 [M+2H] 2+ (350) + + ( - ) Vinblastine [M + H] + (811 ) + + + + + M. = 810 [M + 2H] 2 ÷ (406) + + ( - ) Purines Adenosine [M +HI ~ (268) + + + + + [M-HI (398) + + + M, = 267 Caffeine [M+H] + (196) + + + + + + M. - 195 Amides Capsacin [M+H] + (306) + + + + + [M H] (304) + + + Mo 305 [2M+H] + (613) + ( - )
r
+ + +
S, Zhou, M. Hamburger / J. Chromatogr. A 755 (1996) 189-204 199
be desolved into the gas phase. On the other hand, vaporized acidic (e.g., formic acid) or basicity (e.g., ammonia or TEA) reagents in the stream may assist the gas phase ionization. These assumptions, how- ever, have not yet been further investigated.
3.3. API-MS characteristics of natural products
The detection and characteriation of selected natural products by API-MS has been reported [24- 30,32,33]. In this study, a systematic investigation
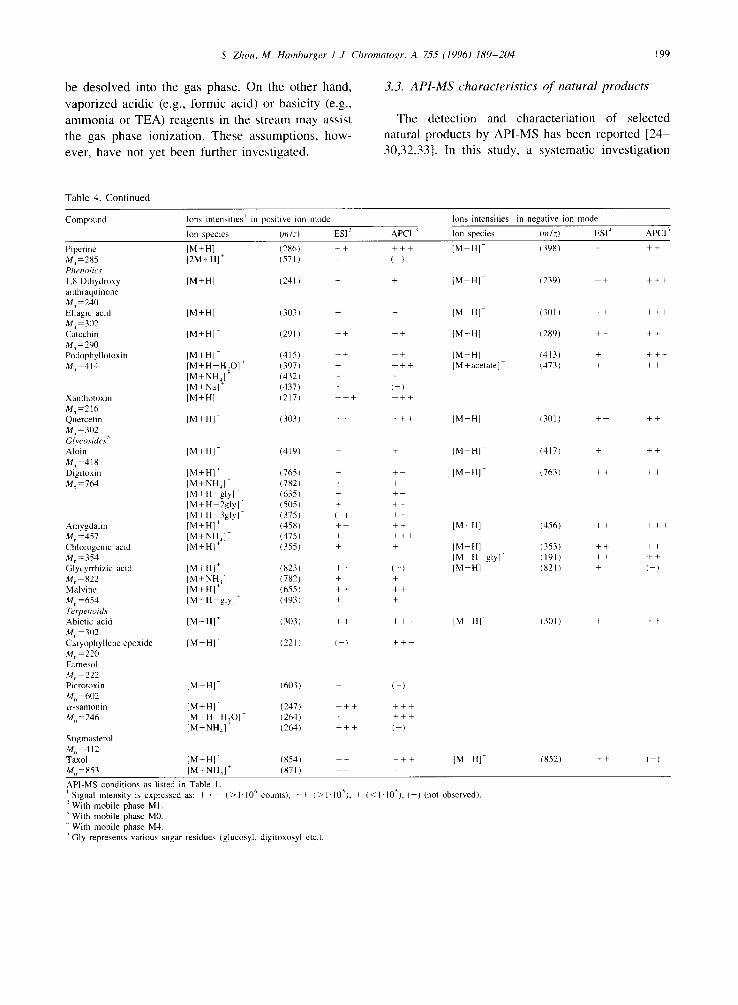
Table 4. Con t inued
Compound Ions intensities ~ in positive ion mode
Ion species (m/z) ESI 3
Ions intensities ~ in negative ion mode
APCL ~ Ion species On~z) ESI z APCI ~
Piperine [M +HI ~ (286) + + M, =285 [2M + H] + (571 ) + Phenolics 1.8-Dihydroxy [M + HI - (241 ) + anthraquinone M. =240 Ellagic acid [M+H] + (303) + M. 302 Catechin [M+H] + (291) + + M. =290 Podophyllotoxin [M + H ] + (415 ) + + M =414 [M+H-H~O] + (397) +
[M+NH4] "~ (432) + [M+Nal + (437) +
Xanthotoxin [M+H] + (217) + + + M.=216 Quercetin M. =302 Glycosides ~ Aloin M~,-418 Digitoxin M,,-764
Amygdalin M , - 4 5 7 Chlorogenic acid M.=354 Glycyrrhizic acid M, 822 Malvine M,=654 J~rpenoids Abietic acid M,~ 302 Caryophyllene epoxide M,~-220 Farnesnl M n 222 Pic~)toxin M. 602 ~-santonin M.=246
[M+H] + (303) + +
+ + + [ M - H I 1398) + + + ( )
+ [M HI (239) + + + + +
+ [M HI (301) + + + + +
+ + [M-H] (289) + + + +
+ + [M HI (413) + + + + + + + [M +acetate] (473) + + + + ( - ) + + +
+ + +
IM+H] + (419) + +
IM+H] + (765) + + + IM+NH41 ~ (782) + + IM+H g ly l ' (635) + + + IM+H 2glyl- (505) + + + [ M + H - 3 g l y ] - (375) ( ) + + [M+H]~ (458) + + + + [M+NH4] + (475) + + + + [M+HI + (355) + +
[M+HI + (823) + + ( - ) [M+NH4]- (782) + + [M+HI ~ (655) + + + + [ M + H - g l y ] + (493) + +
[M+H]* (303) + + + + +
[M+H]- (221) ( ) + + +
[M+H] + (603) + ( - )
[M+H] + (247) + + + + + + [M+H H20] + (264) + + + + [M+NH4]- (264) + + + ( )
Stigmasterol M. 412 Taxol {M+H] ' (854) + + + + + M° -853 [M +NH4] + (871 ) + + +
[M-H] (301) + + + +
I M HI (417) + + +
[M-HI (763) + + + +
[M-H] (456) + + + + +
I M - H I (353) + + + + [M H glyl (191) + + + + [M-H] (821) + ( )
[M-HI (301) + + +
IM H] (852) + + ( - )
API-MS conditions as listed in Table 1. Signal intensity is expressed as: + + + (> 1-l0 n counts), + + (> 1" 10~), + (< I- 10s), ( - ) (not observed).
2 With mobile phase M1. With mobile phase M0. With mobile phase M4. Gly represents various sugar residues (glucosyl, digitoxosyl etc.).
200 S. Zhou, M. Hamburger / J. Chromatogr. A 755 (1996) 189-204
was carried out to compare the mass spectrum of the tested compounds and the results are summarized in Table 4.
due to the lability and poor volatility of these compounds and demonstrates the limitations of the heated nebulizer interface.
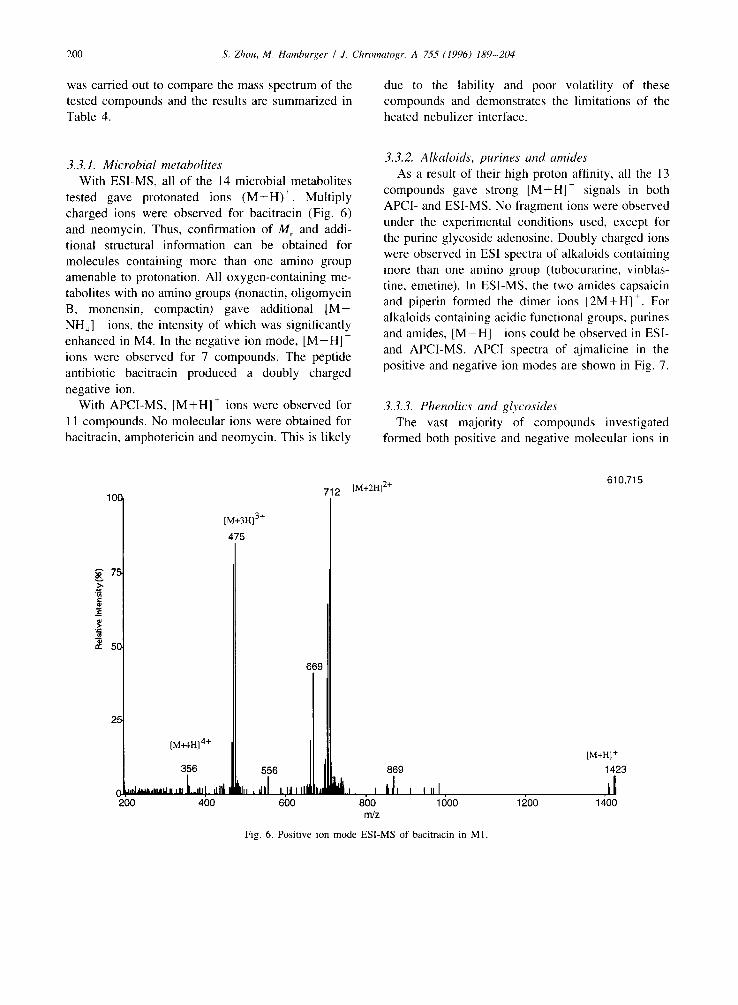
3.3.1. Microbial metabolites With ESI-MS, all of the 14 microbial metabolites
tested gave protonated ions (M+H) +. Multiply charged ions were observed for bacitracin (Fig. 6) and neomycin. Thus, confirmation of M r and addi- tional structural information can be obtained for molecules containing more than one amino group amenable to protonation. All oxygen-containing me- tabolites with no amino groups (nonactin, oligomycin B, monensin, compactin) gave additional [M+ NH4] + ions, the intensity of which was significantly enhanced in M4. In the negative ion mode, [M-H] ions were observed for 7 compounds. The peptide antibiotic bacitracin produced a doubly charged negative ion.
With APCI-MS, [M+H] + ions were observed for 11 compounds. No molecular ions were obtained for bacitracin, amphotericin and neomycin. This is likely
3.3.2. Alkaloids, purines and amides As a result of their high proton affinity, all the 13
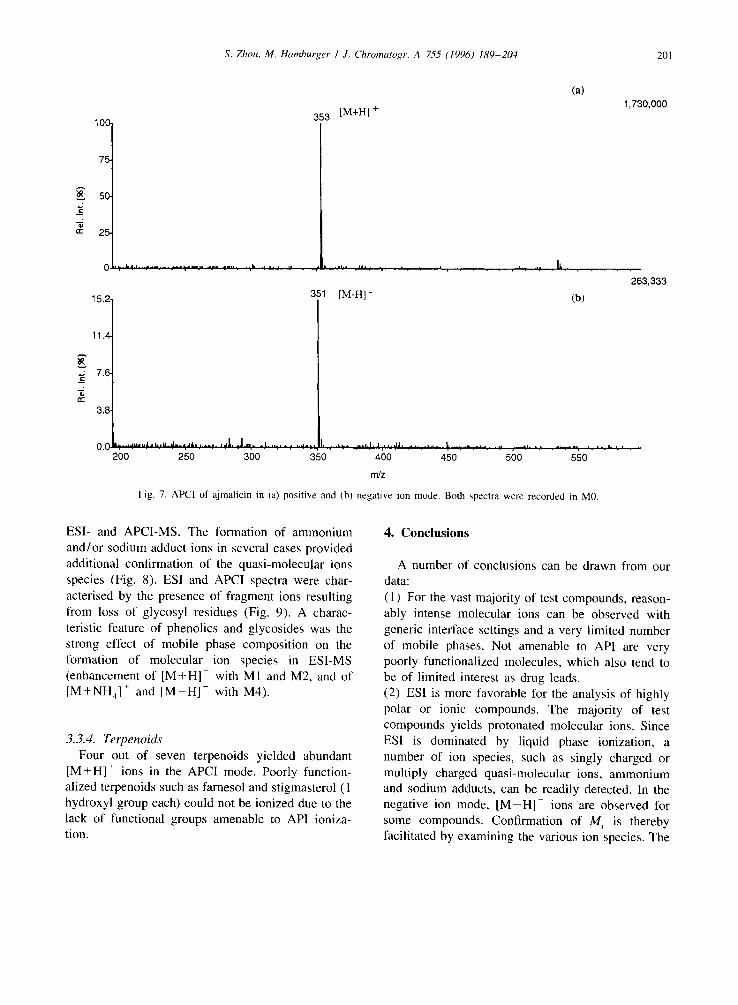
compounds gave strong [M+H] + signals in both APCI- and ESI-MS. No fragment ions were observed under the experimental conditions used, except for the purine glycoside adenosine. Doubly charged ions were observed in ESI spectra of alkaloids containing more than one amino group (tubocurarine, vinblas- tine, emetine). In ESI-MS, the two amides capsaicin and piperin formed the dimer ions [2M+HI +. For alkaloids containing acidic functional groups, purines and amides, [M-H] ions could be observed in ESI- and APCI-MS. APCI spectra of ajmalicine in the positive and negative ion modes are shown in Fig. 7.
3.3.3. Phenolics and glycosides The vast majority of compounds investigated
formed both positive and negative molecular ions in
100
E 75. >. .r,_ ~J I :
" 50.
25.
[M+4H] 4+
356 /
C~,.J ....... , , , . ,,, ~[. dlll l 200 400
712 [M+2H]2+ 610,715
[M+3H] 3+
475
669
556
Jil ,.. , , , i a,d, 6bo
869 i
.,. I i J , , 1,1 8bo 16oo
rn/z 1200
[M+H] +
1423
hi 1400
Fig. 6. Positive ion mode ESI-MS of bacitracin in MI.
S. Zhou, M. Hamburger / J. Chromatogr. A 755 (1996) 189-204 201
100 353 [M+H] +
(a) 1,730,000
t , t -
75
50
25
15.2
, - . . . ,
351 [ M - H ] - 263,333
11.4
• -: 7.6 f:
3.8
0.0 "7""ff"'~L'b?u'd-'-~.J'l'% ''~'~'' ,~l, ~.J.,,,= %t.,.z,.y ..,~..,, : "L'7" .='".1" J, '" '~J' . ' " . ' " ' . " ' ! "". "=.-'~." "t' , "'." ".' 200 250 300 350 400 450 500
. . . . L . = . ' . ' . ' - L f . ,,
550
rrdz
Fig. 7. A P C I of a jma l i c in in (a) pos i t ive and (b) nega t ive ion mode, Both spect ra were recorded in M0.
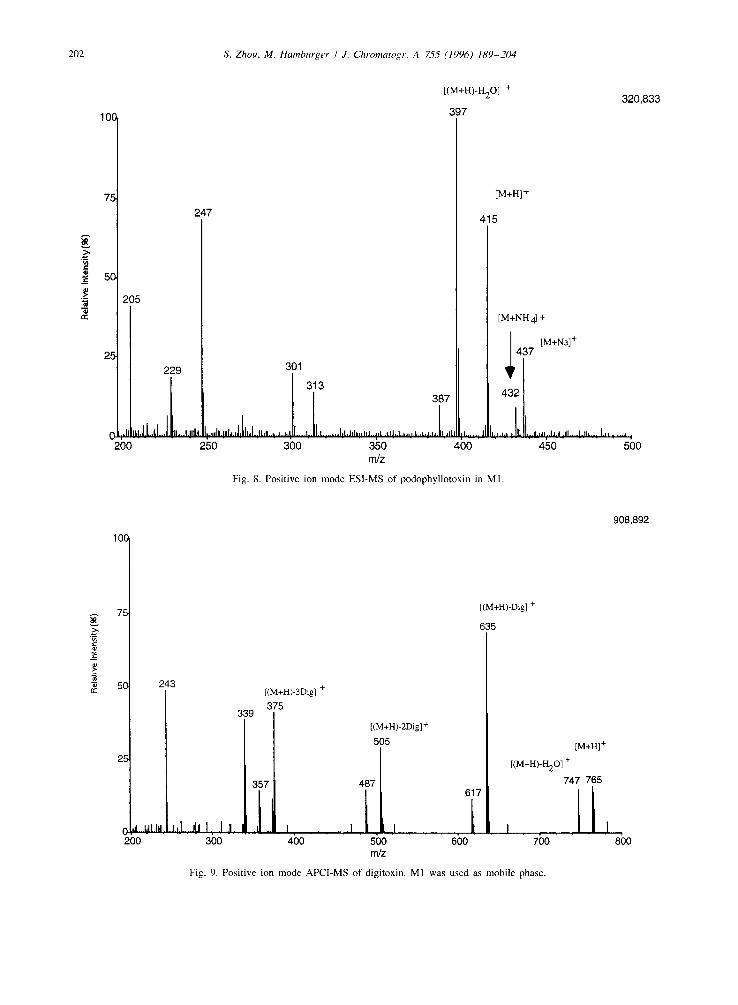
ESI- and APCI-MS. The formation of ammonium and/or sodium adduct ions in several cases provided additional confirmation of the quasi-molecular ions species (Fig. 8). ESI and APCI spectra were char- acterised by the presence of fragment ions resulting from loss of glycosyl residues (Fig. 9). A charac- teristic feature of phenolics and glycosides was the strong effect of mobile phase composition on the formation of molecular ion species in ESI-MS (enhancement of [M+H] + with M1 and M2, and of [M+NH4] + and [ M - H ] - with M4).
3.3.4. Terpenoids Four out of seven terpenoids yielded abundant
[M+H] ÷ ions in the APCI mode. Poorly function- alized terpenoids such as farnesol and stigmasterol (1 hydroxyl group each) could not be ionized due to the lack of functional groups amenable to API ioniza- tion.
4. Conclusions
A number of conclusions can be drawn from our data: ( l ) For the vast majority of test compounds, reason- ably intense molecular ions can be observed with generic interface settings and a very limited number of mobile phases. Not amenable to API are very poorly functionalized molecules, which also tend to be of limited interest as drug leads. (2) ESI is more favorable for the analysis of highly polar or ionic compounds. The majority of test compounds yields protonated molecular ions. Since ESI is dominated by liquid phase ionization, a number of ion species, such as singly charged or multiply charged quasi-molecular ions, ammonium and sodium adducts, can be readily detected. In the negative ion mode, [ M - H ] - ions are observed for some compounds. Confirmation of M r is thereby facilitated by examining the various ion species. The
202
I0C
S. Zhou, M. Hamburger / J. Chromatogr. A 755(1996)189-204
[(M+H)_H20] +
3 9 7 320,833
..',r
75
50
25
0 ;LI 200
247
205
229 301
L 313 387
,L, JL.!' J,LI,IL, ;,,I,,,I,,J,Ll:lL,,~,,.t.ll.,:l',..l,t,,I,,,,,, ;,L .LI],.L ,,,, L,L,~.n..LALI ,I.....: J] 11~,. 250 300 350 400
m/z
Fig. 8. Positive ion mode ESI-MS of podophyllotoxin in M1.
[M+H] +
415
[M+NH 4] +
[M+Na] + 437
-)l I _, ,,n,..ij., .~1 .._1_,, . . . .
450 [.ll .: ..., ;
500
g >. 9
10C
75
50
25
243
.,J Ullti 2OO
[(M+H)-Dig] +
635
339
357
300
[(M+H)-3Dig] +
375
[(M+H)-2Dig] +
505
[(M+H)_N20] +
487 617
/
t , - , I , t . . . . I I , 400 500 600 700
m/z
Fig. 9. Positive ion mode APCI-MS of digitoxin. MI was used as mobile phase.
[M+H] +
747 765
L,
908,892
8O0
S. Zhou, M. Hamburger / J. Chromatogr. A 755 (1996) 189 204 203
Sample FIA for purified LC fractions
LC for mixtures / extracts
~ Confirmation of
Unknown sample \ k n o . wn compound
l Selected LC-MS method ] MS-MS analysis
Methanol extract ~ iChlorofo tract . . . .
[ ESI-MS APCI-MS M1/M2 (positive ion mode) M0 (positive and M4/M6 (negative ion mode) negative ion mode) ]
~Uolecular ion(s) Molecular i o n ( s ) ~ ~ No m o l e c u l ~ ~ ~ No molecular ions
Apci-Ms
M~MS analysis and/or post-column addition of reagents
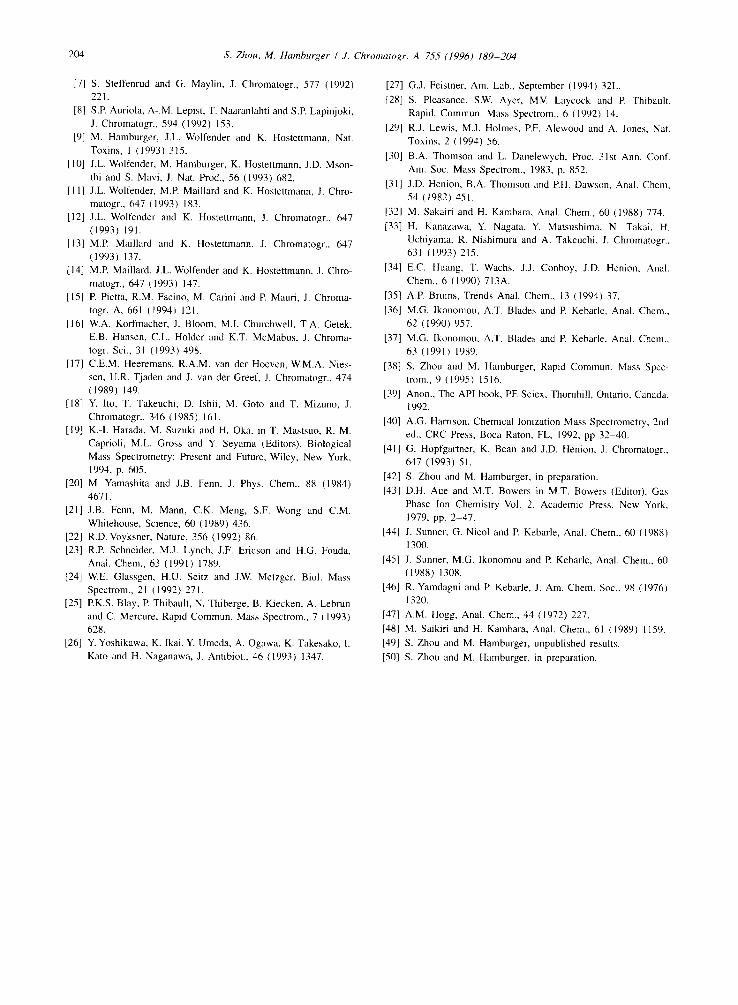
Fig. 10. Protocol for API-MS analysis of natural products.
nature of the quasi-molecular and adduct ions also provides additional structural information valuable for natural product database searches. (3) With the APCI interface, most compounds produce [M+H] + ions and /o r [ M - H I - ions. Excep- tions are poorly functionalized and very thermolabile compounds. In terms of sensitivity, APCI produced better response for moderately polar to non-polar
compounds than ESI. Based on our findings, we have developed a
generally applicable protocol which is currently applied in our laboratories to all samples submitted
for MS analysis (Fig. 10): (1) Depending on the complexity, samples undergo flow injection analysis (FIA), in case of reasonably pure fractions, or on line L C - M S (in case of
complex samples). (2) If information on the nature of the analytes is available, MS analysis should be carried out using the most suitable interface and mobile phase combi- nations as described in this publication. M S - M S may provide additional confirmation. (3) For unknown samples, ESI-MS is the method of choice for polar extracts (e.g., MeOH, EtOH, ace- tone), while APCI-MS should be used as first choice with moderately polar extracts (e.g., CHCI 3, EtOAc). Samples are analyzed in positive and negative ion mode using the appropriate mobile phases. Post-
column addition of specific ionization reagents and M S - M S analysis may be useful in certain cases for confirmation of the molecular ions and peak purity in L C - M S runs. (4) The alternative interface is tested in case no clear molecular ions can be obtained. (5) In a final step, the information obtained from post-column addition of reagents, M S - M S and UV data are combined for natural products database
searches. In a subsequent publication [50], we report on the
practical application of API-MS in the analysis of extracts and fractions of plant and microbial origin.
References
[1] J.T. Baker, R.E Borris, B. Carte, G.A. Cordell, D.D. Soejarto, G.M. Cragg, M.P. Gupta, M.M. lwu, D.R. Madulid and V. E. Tyler, J. Nat. Prod., 58 (1995) 1325.
[2] J.F. Garcia and D. Barcelo, J. High Resolut. Chromatogr., 16 (1993) 633.
[3] A.L. Burlingame, R.K. Boyd and S.J. Gaskell, Anal. Chem., 66 (1994) 634R.
[4] R.C. Willoughby and R.F. Browner, Anal. Chem., 56 (1984) 2626.
[5] K. Sato, T. Kumazawa and Y. Katsumata, J. Chromatogr. A, 674 (1994) 127.
[6] G.C. Galletti, J. Eagles and F.A. Mellon, J. Sci. Food Agri., 59 (1992) 401.
204 S. Zhou, M. Hamburger / J. Chromatogr. A 755 (1996) 189-204
[7] S. Steffenrud and G. Maylin, J. Chromatogr., 577 (1992) 221.
[8] S.R Auriola, A-.M. Lepist, T. Naaranlahti and S.E Lapinjoki, J. Chromatogr., 594 (1992) 153.
[9] M. Hamburger, J.L. Wolfender and K. Hostettmann, Nat. Toxins, 1 (1993) 315.
[10] J.L. Wolfender, M. Hamburger, K. Hostettmann, J.D. Mson- thi and S. Mavi, J. Nat. Prod., 56 (1993) 682.
[11] J.L. Wolfender, M.E Maillard and K. Hostettmann, J. Chro- matogn, 647 (1993) 183.
[12] J.L. Wolfender and K. Hostettmann, J. Chromatogr., 647 (1993) 191.
[13] M.E Maillard and K. Hostettmann, J. Chromatogr., 647 (1993) 137.
[14] M.E Maillard, J.L. Wolfender and K. Hostettmann, J. Chro- matogr., 647 (1993) 147.
[15] R Pietta, R.M. Facino, M. Carini and R Mauri, J. Chroma- togr. A, 661 (1994) 121.
[16] W.A. Korfmacher, J. Bloom, M.I. Churchwell, T.A. Getek, E.B. Hansen, C.L. Holder and K.T. McMabus, J. Chroma- togr. Sci., 31 (1993) 498.
[17] C.E.M. Heeremans, R.A.M. van der Hoeven, W.M.A. Nies- sen, U.R. Tjaden and J. van der Greef, J. Chromatogr., 474 (1989) 149.
[18] Y. lto, T. Takeuchi, D. Ishii, M. Goto and T. Mizuno, J. Chromatogr., 346 (1985) 161.
[19] K.-I. Harada, M. Suzuki and H. Oka, in T. Mastsuo, R. M. Caprioli, M.L. Gross and Y. Seyama (Editors), Biological Mass Spectrometry: Present and Future, Wiley, New York, 1994, p. 605.
[20] M. Yamashita and J.B. Fenn, J. Phys. Chem., 88 (1984) 467 I.
[21] J.B. Fenn, M. Mann, C.K. Meng, S.F. Wong and C.M. Whitehouse, Science, 60 (1989) 436.
[22] R.D. Voyksner, Nature, 356 (1992) 86. [23] R.E Schneider, M.J. Lynch, J.F. Ericson and H.G. Fouda,
Anal. Chem., 63 (1991) 1789. [24] W.E. Glassgen, H.U. Seitz and J.W. Metzger, Biol. Mass
Spectrom., 21 (1992) 271. [25] RK.S. Blay, 13. Thibault, N. Thiberge, B. Kiecken, A. Lebrun
and C. Mercure, Rapid Commun. Mass Spectrom., 7 (1993) 628.
[26] Y. Yoshikawa, K. Ikai, Y. Umeda, A. Ogawa, K. Takesako, 1. Kato and H. Naganawa, J. Antibiot., 46 (1993) 1347.
[27] G.J. Feistner, Am. Lab., September (1994) 32L.
[28] S. Pleasance, S.W. Ayer, M.V. Laycock and E Thibault, Rapid. Commun. Mass Spectrom., 6 (1992) 14.
[29] R.J. Lewis, M.J. Holmes, EF. Alewood and A. Jones, Nat. Toxins, 2 (1994) 56.
[30] B.A. Thomson and L. Danelewych, Proc. 31st Ann. Conf. Am. Soc. Mass Spectrom., 1983, p. 852.
[31] J.D. Henion, B.A. Thomson and EH. Dawson, Anal. Chem, 54 (1982) 451.
[32] M. Sakairi and H. Kambara, Anal. Chem., 60 (1988) 774.
[33] H. Kanazawa, Y. Nagata, Y. Matsushima, N. Takai, H. Uchiyama, R. Nishimura and A. Takeuchi, J. Chromatogr., 631 (1993) 215.
[34] E.C. Huang, T. Wachs, J.J. Conboy, J.D. Henion, Anal. Chem., 6 (1990) 713A.
[35] A.R Bruins, Trends Anal. Chem., 13 (1994) 37.
[36] M.G. Ikonomou, A.T. Blades and R Kebarle, Anal. Chem., 62 (1990) 957.
[37] M.G. Ikonomou, A.T. Blades and R Kebarle. Anal. Chem., 63 (1991) 1989.
[38] S. Zhou and M. Hamburger, Rapid Commun. Mass Spec- trom., 9 (1995) 1516.
[39] Anon., The API book, PE Sciex, Thornhill, Ontario, Canada, 1992.
[40] A.G. Harrison, Chemical Ionization Mass Spectrometry, 2nd ed., CRC Press, Boca Raton, FL, 1992, pp 32-40.
[41] G. Hopfgartner, K. Bean and LD. Henion, J. Chromatogr., 647 (1993) 51.
[42] S. Zhou and M. Hamburger, in preparation.
[43] D.H. Aue and M.T. Bowers in M.T. Bowers (Editor), Gas Phase Ion Chemistry Vol. 2, Academic Press, New York, 1979, pp. 2 47.
[44] J. Sunner, G. Nicol and R Kebarle, Anal. Chem., 60 (1988) 1300.
[45] J. Sunner, M.G. Ikonomou and E Kebarle, Anal. Chem.. 60 (1988) 1308.
[46] R. Yamdagni and R Kebarle, J. Am. Chem. Soc.. 98 (1976) 1320.
[47] A.M. Hogg, Anal. Chem., 44 (1972) 227.
[48] M. Saikiri and H. Kambara, Anal. Chem., 61 (1989) 1159. [49] S. Zhou and M. Hamburger, unpublished results.
[50] S. Zhou and M. Hamburger, in preparation.
Related Documents