Ecole Polytechnique Promotion 2010 Raimbault Juste ? ? ? RAPPORT DE STAGE DE RECHERCHE Application of evidence-based methods to the test of a multi-value evaluation framework for sustainable renovation ? ? ? NON CONFIDENTIEL Département Humanités et Sciences Sociales HSS 593A Urbanisme, Architecture, Art de Bâtir under the supervision of Dr Karim Basbous, Ecole Polytechnique, Département HSS Dr Paula Femenias, Chalmers Tekniska Högskola, Department of Architecture 01 avril - 30 juin 2013 Department of Architecture Chalmers University of Technology Göteborg, Sweden

Welcome message from author
This document is posted to help you gain knowledge. Please leave a comment to let me know what you think about it! Share it to your friends and learn new things together.
Transcript

Ecole Polytechnique
Promotion 2010Raimbault Juste
? ??
RAPPORT DE STAGE DE RECHERCHE
Application of evidence-based methods to the test of a multi-value
evaluation framework for sustainable renovation
? ??
NON CONFIDENTIEL
Département Humanités et Sciences SocialesHSS 593A Urbanisme, Architecture, Art de Bâtir
under the supervision of
Dr Karim Basbous, Ecole Polytechnique, Département HSSDr Paula Femenias, Chalmers Tekniska Högskola, Department of Architecture
01 avril - 30 juin 2013
Department of ArchitectureChalmers University of TechnologyGöteborg, Sweden
1

2

Abstract
The integration of sustainability in architectural projects is a key issue for current research. Thatimplies a robust definition of the notion of sustainibility which can not simply be reduced to singleaspects in relation with it such as environmental performances or social impact. From a systemicpoint of view, sustainibility is the ability of emerging properties of the system to satisfy on long timescales certain requirements. In that frame, the research project ReBo presented in Thuvander
& al., 2011, aims to understand necessary variables to obtain sustainable refurbishment processes,with a focus on Swedish housing stocks.
We propose to apply evidence-based methods to strengthen the methodology and philosophyproposed by the framework of ReBo, especially for the need of horizontal and vertical integration.We first proceed to a short architectural and sociological review of concerned urban areas, whatis essential as preliminary work for model construction. We then propose a quantitative top-downanalysis with aim to understand deeper the planning of the districts and to propose indicators ofurban quality. That allows us to build an integrated agent-based model at the scale of a district.On a double-scale economic basis, further aspects linked to social questions or quality of life aretaken into account. After calibration on real data and partial validation through the reproductionof economical stylised facts, we are able to launch simulations on possible refurbishment scenarii.Finally, we propose an original evolutionnary algorithm for planning and design of a new district,in the spirit of a possible application on real case through the coupling with the agent-based modelto analyse the influence of the construction of a new district near the old one.
Résumé
L’intégration du développement durable dans les projects architecturaux est une question clépour la recherche actuelle. Cela implique une robuste définition de la notion de développementdurable, qui ne peut pas être réduit à des simples problèmes le concernant, comme les performancesenvironnementales ou l’impact social du projet. D’un point de vue systémique, le développementdurable est la capacité des propriétés émergentes du système à satisfaire certains pré-requis sur delongues échelles temporelles. Dans ce cadre, le projet de recherche ReBo, présenté dans Thuvander
& al., 2011, a pour but de comprendre les variables essentielles pour des projets de rénovationdurables, en se concentrant sur le cas de la Suède.
Nous proposons d’appliquer des méthodes evidence-based pour renforcer la méthodologie et laphilosophie proposées au sein du projet ReBo, particulièrement en ce qui concerne la nécessitéd’une intégration horizontale et verticale. Nous procédons d’abord à une étude architecturale etsociologique des zones urbaines concernées, travail préliminaire à l’élaboration de modèles. Nousproposons ensuite une analyse quantitative top-down afin de mieux comprendre la conception deces quartiers et de proposer des indicateurs de qualité urbaine. Cela nous permet de construireun modèle agent-based à l’échelle d’un quartier. A partir d’une base économique à deux échelles,d’autres aspects liés aux questions sociales ou à la qualité de vie sont pris en compte. Aprèscalibrage et validation partielle par la reproduction de faits stylisés économiques, nous sommes enmesure de lancer des simulations sur différents scénarii de rénovation. Enfin, nous proposons unalgorithme évolutionnaire original pour la planification d’un nouveau quartier, dans l’esprit d’unepossible application à un cas réel par le couplage avec le précédent modèle, afin d’analyser l’influencede la construction du nouveau quartier sur l’ancien.
3

4

Foreword
This research work is the produce of a research internship conducted at Chalmers University ofTechnology, department of Architecture, in spring 2013.
The spirit behind the construction of the project is the establishment of a PhD subject in the fieldof urban system modeling, with aim to touch architecture, urbanism and complex system theorythrough a multi-scale approach. That’s why that internship at the department of Architecture wasa real chance. The elaboration of the project in link with a current research project allowed to workon actual research subject with a lot of available data, and also many people able to give advices.
The meeting between my formation in Complex Systems and the sociological approach of Ar-chitectural problems typical of the Swedish school led to a synergy in the definition of a various butglobally coherent project. We managed to find four complementary fields of research, which gather-ing aims to bring an answer to our research question. That explains the structure of this documents: after the subject has been introduced, four independant thematic paper develop each theme. Theorder follows a global logic and the whole should be read in order for an exact apprehension of theissues, but each part was written to be read much independantly as possible. Appendices are morefor technical purposes and are not essential at the first reading.
Acknowledgments
I would like to thank first of all Paula and Liane who welcomed me at the department of Architectureand found time to help me positionning my project in relation with the project ReBo. I also thanka lot Pål for giving me a place to work in his room and for his precious advices (unfortunately notso frequent because of the lack of time) regarding social aspects of urban problems.
I also thank people from School of Architecture at KTH that invited us to the research workshop,and all the participants of the workshop that was a great experience.
I thank my supervisor and teacher Karim Basbous for his amazing classes on Architecture andUrbanism and his advices before the internship, Kashayar Pakdaman and Arnaud Banos for havingteached me the basis of research in complex systems during this year of master.
More undirectly but still essential, I thank organiser of the Complex Systems Summer School2013 - all the lecturers brought me precious knowledge used here, and also participants, especiallyClaire and Chris for teaching me the reality of GIS, and Nico for his approbation on networkalgorithms.
I thank Raphaëlle for the correction of english mistakes, which unfortunately surely remain ingreat number because time for correction really lacked.
Finally, I thank Emily for having supported and endured me during the long redaction of thiswork.
5

6

Contents
Introduction 11
1 Setting the scene . . . . . . . . . . . . . . . . . . . . . . . . . . . . . 11
2 Integrating sustainable processes : the project ReBo . . . . . . 12
3 The question of modeling . . . . . . . . . . . . . . . . . . . . . . . . 15
4 Description of the project . . . . . . . . . . . . . . . . . . . . . . . 16
Paper A - Architectural and sociological analysis of theSwedish peri-urban areas : past, present and perspec-tives 19
1 Architectural history . . . . . . . . . . . . . . . . . . . . . . . . . . . 201.1 People’s Home : Modern architecture for social housing . . . . . . 201.2 Million Homes Program : the Welfare State at a greater scale . . . 22
2 “The myth of the Swedish suburb” . . . . . . . . . . . . . . . . . . 252.1 The suburb as rental housing area . . . . . . . . . . . . . . . . . . 252.2 Current representation against reality of the Swedish suburb . . . 26
3 Perspectives . . . . . . . . . . . . . . . . . . . . . . . . . . . . . . . . 283.1 Future of social housing . . . . . . . . . . . . . . . . . . . . . . . . 283.2 Evolution of segregation . . . . . . . . . . . . . . . . . . . . . . . . 293.3 Possible actions . . . . . . . . . . . . . . . . . . . . . . . . . . . . . 29
Paper B - Architectural urbanity : between art andscience, how Swedish urban planning can be consideredas particularly performant and valuable 33
1 Swedish Urban planning : subjective qualitative analysis . . . . 351.1 Architectural urbanity . . . . . . . . . . . . . . . . . . . . . . . . . 35
1.1.1 Presentation . . . . . . . . . . . . . . . . . . . . . . . . . . 351.1.2 Example . . . . . . . . . . . . . . . . . . . . . . . . . . . . . 36
1.2 An implicit culture of performance? . . . . . . . . . . . . . . . . . 39
2 Case study : quantitative comparison . . . . . . . . . . . . . . . . 392.1 Choice of the subjects . . . . . . . . . . . . . . . . . . . . . . . . . 392.2 Selected analysis criteria . . . . . . . . . . . . . . . . . . . . . . . . 40
2.2.1 Spatial configuration . . . . . . . . . . . . . . . . . . . . . . 412.2.2 Land use diversity . . . . . . . . . . . . . . . . . . . . . . . 42
7
2.2.3 Daylight performances . . . . . . . . . . . . . . . . . . . . . 442.2.4 Public transportation performances . . . . . . . . . . . . . . 45
2.3 Quantitative comparison . . . . . . . . . . . . . . . . . . . . . . . . 472.3.1 Extraction of data . . . . . . . . . . . . . . . . . . . . . . . 472.3.2 Results . . . . . . . . . . . . . . . . . . . . . . . . . . . . . 47
Paper C - Application of agent-based modeling to theconsolidation of a multi-criteria evaluation frameworkfor building refurbishment 55
1 Background economic model . . . . . . . . . . . . . . . . . . . . . . 571.1 Scales and data . . . . . . . . . . . . . . . . . . . . . . . . . . . . . 571.2 Agents . . . . . . . . . . . . . . . . . . . . . . . . . . . . . . . . . . 571.3 Evolution and interactions . . . . . . . . . . . . . . . . . . . . . . . 58
1.3.1 Initialisation . . . . . . . . . . . . . . . . . . . . . . . . . . 581.3.2 Update work situations . . . . . . . . . . . . . . . . . . . . 581.3.3 Economic balances . . . . . . . . . . . . . . . . . . . . . . . 591.3.4 Population movements . . . . . . . . . . . . . . . . . . . . . 601.3.5 Update rents values . . . . . . . . . . . . . . . . . . . . . . 60
1.4 List of parameters . . . . . . . . . . . . . . . . . . . . . . . . . . . 60
2 Integration of multiple aspects . . . . . . . . . . . . . . . . . . . . 612.1 Choice of extending aspects . . . . . . . . . . . . . . . . . . . . . . 612.2 Description of the integration . . . . . . . . . . . . . . . . . . . . . 62
3 Concrete results : refurbishment simulation . . . . . . . . . . . . 643.1 Implementation and calibration . . . . . . . . . . . . . . . . . . . . 64
3.1.1 Implementation issues . . . . . . . . . . . . . . . . . . . . . 643.1.2 Calibration process . . . . . . . . . . . . . . . . . . . . . . . 65
3.2 Case study : district Långängen . . . . . . . . . . . . . . . . . . . 683.2.1 Data collection and integration . . . . . . . . . . . . . . . . 683.2.2 Running the basic model . . . . . . . . . . . . . . . . . . . 70
3.3 Simulating possible refurbishment scenarii . . . . . . . . . . . . . . 71
4 Discussion and perspectives . . . . . . . . . . . . . . . . . . . . . . 724.1 Obtained results . . . . . . . . . . . . . . . . . . . . . . . . . . . . 724.2 Limitations of agent-based modeling . . . . . . . . . . . . . . . . . 724.3 Perspectives of developments . . . . . . . . . . . . . . . . . . . . . 74
Paper D - Local and global design of a new districtthrough evolutionary algorithm 77
1 Overall approach of the problem . . . . . . . . . . . . . . . . . . . 781.1 From Artificial Art to Computational Design, applications in Ar-
chitecture . . . . . . . . . . . . . . . . . . . . . . . . . . . . . . . 78
8
1.2 Evolutionary Algorithms for multi-objective Optimisation . . . . . 811.3 Mixing the two approaches : heterogeneous modeling and design
through scale integration . . . . . . . . . . . . . . . . . . . . . . . 82
2 Evolutionary algorithm for automatic design and planning . . 822.1 Formal description of the algorithm . . . . . . . . . . . . . . . . . 82
2.1.1 Configurations . . . . . . . . . . . . . . . . . . . . . . . . . 822.1.2 Optimisation objectives . . . . . . . . . . . . . . . . . . . . 832.1.3 Producing new configurations . . . . . . . . . . . . . . . . . 83
2.3 Exploration . . . . . . . . . . . . . . . . . . . . . . . . . . . . . . . 842.3.1 Patterns for landuse . . . . . . . . . . . . . . . . . . . . . . 842.3.2 Patterns for network . . . . . . . . . . . . . . . . . . . . . . 84
3 Further developments . . . . . . . . . . . . . . . . . . . . . . . . . . 85
Conclusion 89
References 91
Appendices 97
9

10
Introduction
1 Setting the scene
This project can be situated at the intersection of multiples perspectives andapproaches on architecture and urban design and follows therefore the actualtrend of a more integrated and transversal way to practice architectural science.Indeed, the bottom-up systemic approach is quite recent in urban design (intro-duced for example by the architect Batty in the end of the 90s, recently sumedup in [1]), and more recent for architecture in itself (for exemple first papers onthe use of computational design, as the work of Knight on shape grammarsin [6], are not older than ten years), although earlier work already proposedimplicitly top-down systemic for urban systems, for which the best example isthe theory of Space Syntax introduced by Hillier in 1976 in [5]. More thanthe theorical already present, it is really the technical aspect of complex sys-tems that is breaking nowadays into design and planning, as a consequence ofthe recent development of complexity analysis in link with new accessible andalways more powerful computer simulation tools (see [3] to have an idea of thedevelopment of that disciplin).
The way to practice and to think architecture really depends of the culturalcontext. As an example, a friend studying nowadays in a school of architecturein France explained his vision of the disciplin : “there are three ways to doArchitecture, the technical one [he meant construction technique], the artisticone and the social science one”. Let take this as an unformal description, since weweren’t able to find a similar description in the litterature, but that should reflecta “field” reality. Compared to that, the practice of research in Architecture inSweden seems to be more oriented towards social science, and the systemicvision has its place as a branch of research in Architecture and Urban Planning; in France, the field is not so developped and is studied by geographers. Ourpurpose is to claim that our study may be at the border of several disciplinesand at the cross of points of views that may appear as opposed, but we bet onthe fact that this originality could bring interessant ideas.
The implicit personal opinion behind the philosophy of this work is thatthe gap that could exist between the artistic aspect and the scientific aspect
11
(that can be social science, technical aspect or complex systems science) hasno strong justification and that it could be breached through epistemological,philosophical and technical work - a concrete example of such a try will bepresented in the last paper composing this project, when we will propose anhybrid model based on scale integration. Therefore we will always try to keepa multidisciplinary point of view when posing the problematics and proposingsolutions.
The general purpose of this work, as presented in the initial proposal (see[7], in appendice D), is to propose extensions of technical order to an existingresearch project lead at the departement of Architecture at Chalmers Universityof Technology, Göteborg, by applying in priority agent-based modeling, andmore generally evidence-based methods. We use the theorical framework of theproject (that we present in more details in the following) to build models whichapplication is supposed to strengthen the ideas proposed by it.
2 Integrating sustainable processes : the project
ReBo
General presentation The need of integrated processes has appeared as cru-cial for the sustainibility of the projects, and in that frame the considerationof refurbishment or requalification of buildings has totally its place. First therefurbishment in itself becomes sometimes necessary to fill ecological and soci-etal constraints of sustainibility, but reciproquely a refurbishment can not besustainable if its approach is not integrated. For example, strong cultural andarchitectural (in the sense of the subjective quality) components can become anissue, then an asset for sustainibility in a refurbishment process. These ideashave been first formulated by Stenberg & al. in [8], where they insist on theimportance of taking into account societal aspects (will the refurbished districtbe “socially sustainable”?) and many other fields within the design of a refur-bishment process. They point the fact that “Actually, it is not unusual thatenvironmental projects in [...] areas are put forward as examples of holisticand good practice in urban development in general, without considering funda-mental and negative social impacts”, and therefore conclude to a huge need oftransversal integration in the processes. The general transversal integration isshown on figure 1.
This has lead to the development of a research project called ReBo con-ducted since 2010 by Chalmers University of Technology in Göteborg, in whichmany other institutionnals stakeholders (komun, firms) are sometimes involved.
12
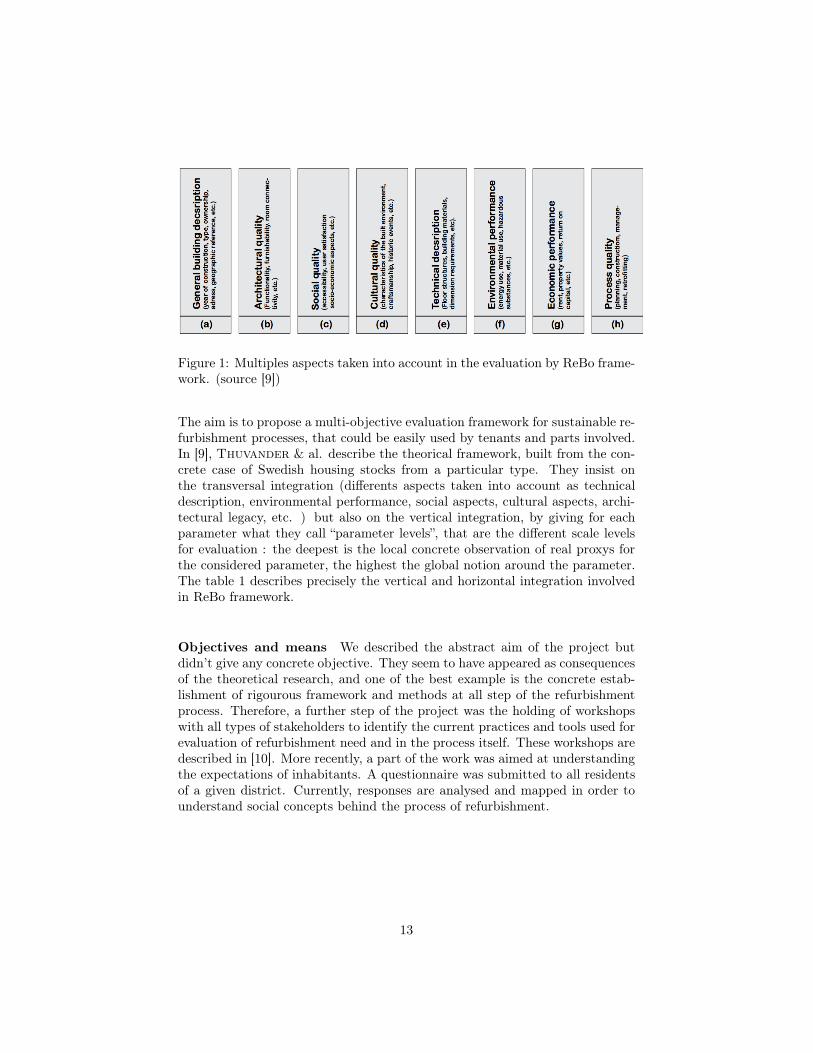
Figure 1: Multiples aspects taken into account in the evaluation by ReBo frame-work. (source [9])
The aim is to propose a multi-objective evaluation framework for sustainable re-furbishment processes, that could be easily used by tenants and parts involved.In [9], Thuvander & al. describe the theorical framework, built from the con-crete case of Swedish housing stocks from a particular type. They insist onthe transversal integration (differents aspects taken into account as technicaldescription, environmental performance, social aspects, cultural aspects, archi-tectural legacy, etc. ) but also on the vertical integration, by giving for eachparameter what they call “parameter levels”, that are the different scale levelsfor evaluation : the deepest is the local concrete observation of real proxys forthe considered parameter, the highest the global notion around the parameter.The table 1 describes precisely the vertical and horizontal integration involvedin ReBo framework.
Objectives and means We described the abstract aim of the project butdidn’t give any concrete objective. They seem to have appeared as consequencesof the theoretical research, and one of the best example is the concrete estab-lishment of rigourous framework and methods at all step of the refurbishmentprocess. Therefore, a further step of the project was the holding of workshopswith all types of stakeholders to identify the current practices and tools used forevaluation of refurbishment need and in the process itself. These workshops aredescribed in [10]. More recently, a part of the work was aimed at understandingthe expectations of inhabitants. A questionnaire was submitted to all residentsof a given district. Currently, responses are analysed and mapped in order tounderstand social concepts behind the process of refurbishment.
13
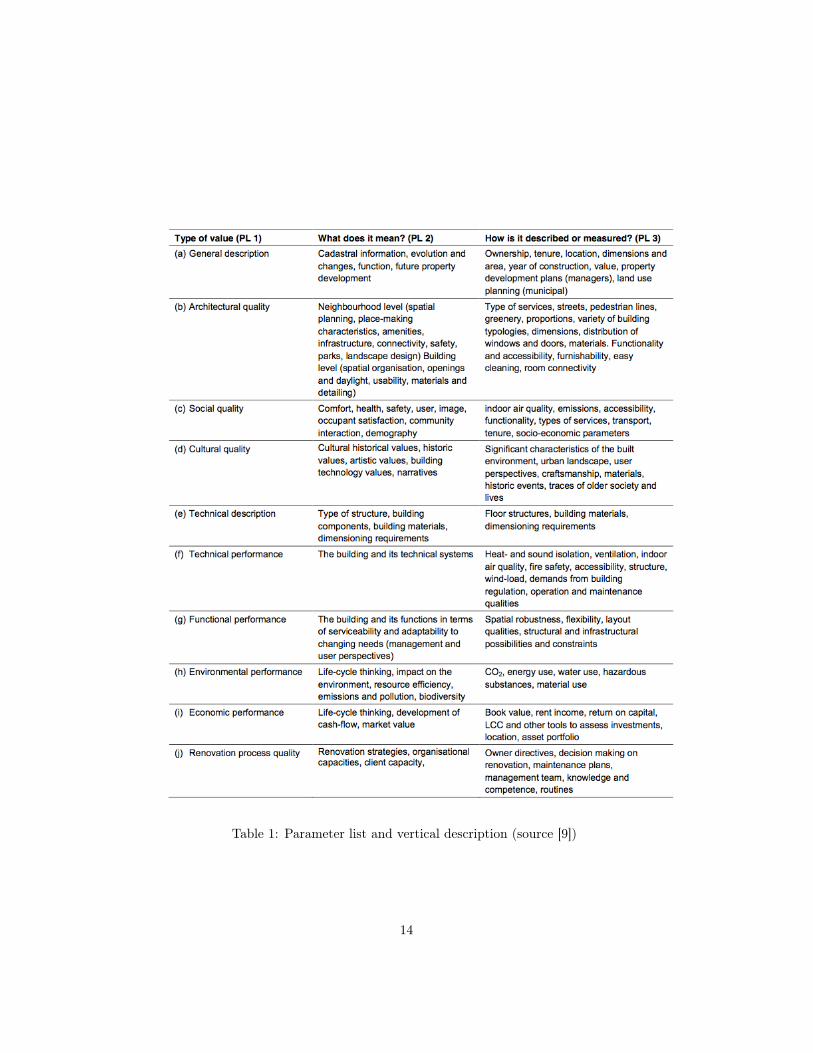
Table 1: Parameter list and vertical description (source [9])
14

3 The question of modeling
Since we want to propose formal models on which simulations can be launchedand that could lead to evidence-based solutions to the problematics we face,and since a purely technical approach is not the purpose of our work, we werestrongly confronted to the epistemological issue of the sense and the role ofmodeling.
Models in science The way of thinking science evolve with it and modelshave not always been seen as we do today. First the concept of level of complex-ity of models is quite recent. In [12], Varenne sets the concept of complexityvector. Three values are needed to represent the complexity of a modeling pro-cess: complexity of the system, complexity of the model and complexity of theimplementation. The implementation is what “we can touch”, in the sense thatthe model is an abstract object which is different from the mathematical objectsrepresenting it (for example). Before Poincarré and the formulation of thedynamical system of three corpses, science thought simple models were alwaysassociated with simple system, what is not the case at all, since that problemis the simpler example of chaotic dynamical system. The implicit definition ofmodels by Varenne is in resonance with the notion of perspectivism recentlyproposed by Giere (see [4]), and it is in fact the most and most acceptedvision of modeling as Brown confirms in [2]. Simply, a model is an abstractobject that “someone uses to represent something”. The fact of taking into ac-count the object of modeling and the object that proceeds to modeling (thescientist in general) is the key of that perspectivist approach. That brings thenotion of projection that we met during meta-modeling attempts. As Varenneassumes, meta-modeling is in itself not possible. Let take the example of a meta-formulation of agent-based modeling. At the highest level, we can propose thatthe meta-model is composed of the abstract set of agents A and of an family offunction (fa,t)a2A,t2R 2
�AA�R⇥A describing evolutions. But still, that vision
can not be formalised in the same way as a differential representation for ex-ample. And the vision of time is far from actual physics models, what reinforcethe idea that a general meta-modeling process can’t exist. Furthermore, tryingto extend the modeling horizontally (i. e. in the number of objects “taken intoaccount by the model”), we always reach a limit when we tend to real object.This limity is in fact the essence of modeling, it is the “projection” we sawbefore. That limitation in possible meta-modeling is in fact intrinsic to the con-cept of modeling. It is quite the same idea with informatic theory of languages,models and calculus: when formalising the formalisations themselves, a limit isalso reached, first in the need of strong axioms and secondly in the fact that itproves that theories are not self-consistent (see Gödel theorem). That showshow modeling is in essence delicate, because it is in fact not really possible toproceed to modeling without thinking on what we are doing.
15

Modeling in our context In our context, the clear aim of modeling is toproceed to simulations. On that point, Varenne explains in [11] that the dif-ference can be done between simulation of models and models of simulations. Ifone creates a model and then uses it for simulations, without having conceivedthe model in that particular aim, then the informatic code he writes for thatwill be in itself a model of the model, since translation and interpretation areneeded. That leads to intrinsic complications and unwanted side effects. Thatis the simulation of model. On the contrary, if the model is directly created as asimulation, then the problem won’t exist. We do in that case a model of simu-lation. Concretely, that means for us that the formalisation has to be rigourousand closest as possible to the implementation (what can be quite difficult insome cases). In our project, we will then use models as simulations, but alsoabstract models in themselves, as in the reflexion on the relation between artand science in the frame of evolutionnary design.
4 Description of the project
Research question The research question leading the project is: “How canwe build models of complex systems to test different perspectives on refurbish-ment evaluation, especially to test the method of horizontal and vertical inte-gration proposed by the project ReBo in the case of Swedish housing stocks?”.
Overview The research project will by nature be composed of heterogeneousaspects. The question directly implies the understanding of the sociologicalcontext of the particular case, what brings a first decomposition between thetechnical part and a social science analysis. After that it appears quickly thatthe technical understanding of housing projects is also a prerequisite for theelaboration of any model concerning these districts. That work is still prelimi-nary to model construction. Then the core part is the modeling in itself, thatcombines two approaches: agent-based modeling and evolutionnary design.
Plan of work In Paper A, we will proceed to architectural and sociologicalreview of the urban areas that are the object of study in the next papers. Wewill focus on the understanding of the notion of “suburb”, which has a particularmeaning in the Swedish context.
In Paper B, we propose a technical understanding of Swedish urban planning.That brings to the construction of objective indicators of urban quality at thescale of a district. This is a top-down approach of the urban question. Weare then able to apply these indicators to a comparison case study between a
16

Swedish and a French district, to test if some planning have globally betterobjective qualities than other.
In Paper C, we build an agent-based model to represent life in a districtof Göteborg, Långängen. This is the core part of the project. The model isbuild to be applicable on real data and data collection and processing is part ofthe work. The aim is to have multiples aspects, beyond the economical one, tojustify the multi-criteria approach done in ReBo. The question of calibration ofthe model is also well considered. One key result is the possibility of simulationson different refurbishment scenarii.
Finally, we propose in Paper D a reflexion on automatic design and planningthrough evolutionnary algorithms. A generative model for planning of a newdistrict is described and implemented. The initial aim was to couple the modelwith the agent-based model built in Paper C, representing that way a newdistrict that have just been built besides Långängen.
? ??
17

References
[1] Michael Batty. Cities and Complexity: Understanding Cities with CellularAutomata, Agent-based Models, and Fractals. MIT Press, 2007.
[2] Matthew J Brown. Models and perspectives on stage: remarks on giere’sScientific perspectivism. Studies In History and Philosophy of Science PartA, 40(2):213–220, 2009.
[3] David Chavalarias, Paul Bourgine, Edith Perrier, Fréderic Amblard,François Arlabosse, Pierre Auger, Jean-Bernard Baillon, Olivier Barreteau,Pierre Baudot, Elisabeth Bouchaud, et al. French roadmap for complexsystems 2008-2009. 2009.
[4] Ronald N Giere. How models are used to represent reality. Philosophy ofscience, 71(5):742–752, 2004.
[5] Bill Hillier, Adrian Leaman, Paul Stansall, and Michael Bedford. Spacesyntax. Environment and Planning B: Planning and Design, 3(2):147–185,1976.
[6] Terry Knight. Computing with emergence. Environment and Planning B,30(1):125–156, 2003.
[7] J. Raimbault. Application of evidence-based methods to the test of a multi-value evaluation framework for sustainable renovation. Research internshipproject description, April 2013.
[8] Jenny Stenberg, Liane Thuvander, and Paula Femenias. Linking socialand environmental aspects: a multidimensional evaluation of refurbishmentprojects. Local Environment, 14(6):541–556, 2009.
[9] Liane Thuvander, Paula Femenias, and Pär Meiling. Strategies for anintegrated sustainable renovation process: Focus on the swedish housingstock ‘people’s home’. In Proceedings from the International SustainableBuilding Conference SB11 in Helsinki 18-21October 2011, 2011.
[10] Liane Thuvander, Paula Femenías, Kristina Mjörnell, and Pär Meiling.Unveiling the process of sustainable renovation. Sustainability, 4(6):1188–1213, 2012.
[11] Franck Varenne. Les simulations computationnelles dans les sciences so-ciales. Nouvelles Perspectives en Sciences Sociales, 5(2):17–49, 2010.
[12] Franck Varenne, Marc Silberstein, et al. Modéliser & simuler. Epistémolo-gies et pratiques de la modélisation et de la simulation, tome 1. 2013.
18
Paper A
Architectural and sociological analysis of the
Swedish peri-urban areas : past, present and
perspectives
Abstract
We proceed to a description of the Swedish peri-urban areas, first from
the historical point of view of their development and of their architectural
description. Then we propose a sociological diagnosis around the existence
of the Swedish “suburb”, and finally we review some perspectives on the
future of these areas.
19
Introduction
Understanding the nature of the area concerned by our research project appearsas a necessity. In the first place the context is really particular, because historyof Sweden led to unique urban configurations that can not directly be comparedwith analog configurations in other countries. Secondly, our object of studyis inside Sweden of a particular type, on which prejudices are quite current.Therefore we need to sum up history of these peri-urban areas, and try todefine what they are today.
1 Architectural history
1.1 People’s Home : Modern architecture for social hous-ing
Historical context
The People’s Home (Folkhemmet) projects (or more the “notion” of People’sHome, because it can be presented as a political ideal, a realization of theWelfare State) are well reviewed in [10]. A case study on a particular districtmade in [11] was also a keypoint to understand the ideas behind this description.Around 1930, Swedish state proceeded to an investigation on the qualities ofhousing all over the country, which conclusion was that there was a need to giveto each citizen a decent home for a decent price. Concretly, advantageous loanswere done for constructions of new buildings. Public housing companies formeda important part of the owners. This politic led to the apparition of areas ofnew type, mostly in peri-urban fields (in free spaces, since “housing politics werefocused on the construction of new housing on virgin land”).
Architecture of buildings
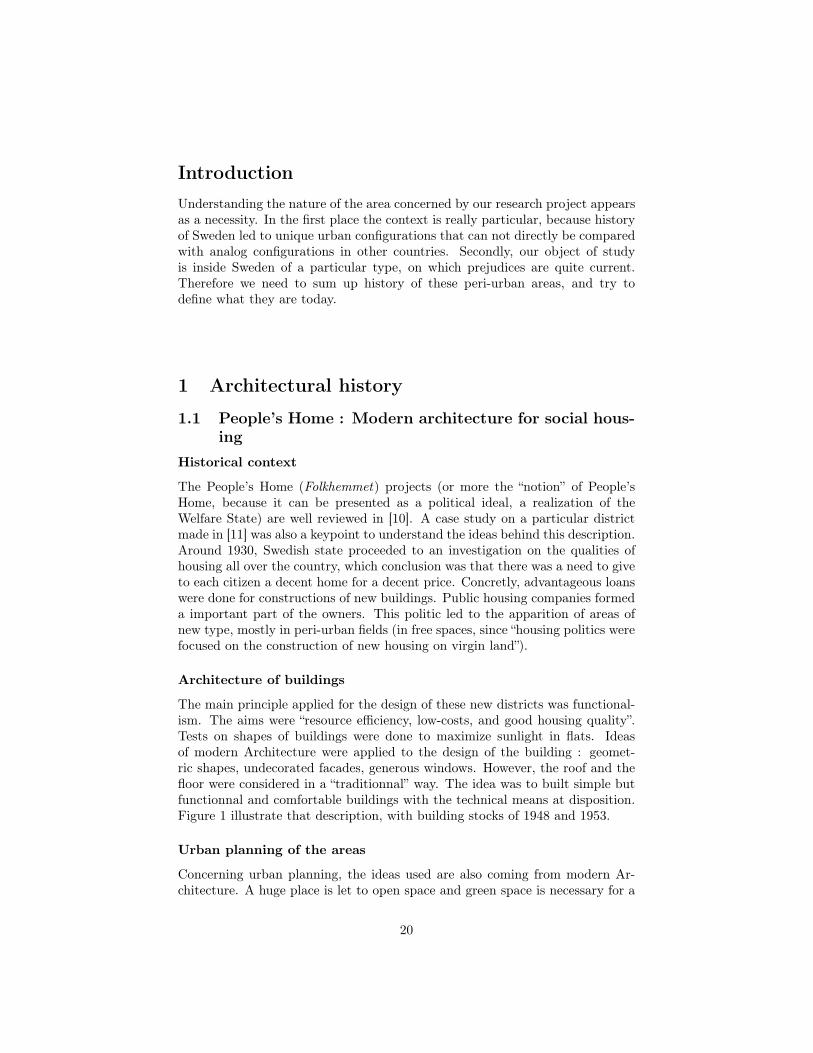
The main principle applied for the design of these new districts was functional-ism. The aims were “resource efficiency, low-costs, and good housing quality”.Tests on shapes of buildings were done to maximize sunlight in flats. Ideasof modern Architecture were applied to the design of the building : geomet-ric shapes, undecorated facades, generous windows. However, the roof and thefloor were considered in a “traditionnal” way. The idea was to built simple butfunctionnal and comfortable buildings with the technical means at disposition.Figure 1 illustrate that description, with building stocks of 1948 and 1953.
Urban planning of the areas
Concerning urban planning, the ideas used are also coming from modern Ar-chitecture. A huge place is let to open space and green space is necessary for a
20
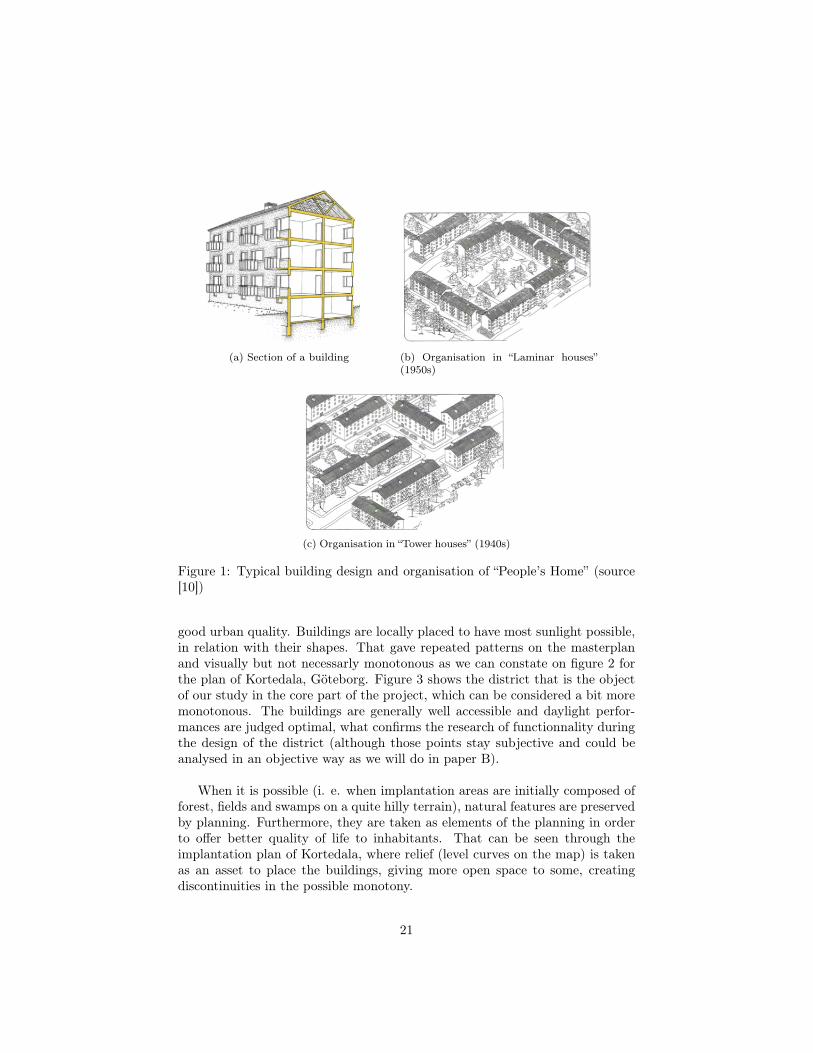
(a) Section of a building (b) Organisation in “Laminar houses”(1950s)
(c) Organisation in “Tower houses” (1940s)
Figure 1: Typical building design and organisation of “People’s Home” (source[10])
good urban quality. Buildings are locally placed to have most sunlight possible,in relation with their shapes. That gave repeated patterns on the masterplanand visually but not necessarly monotonous as we can constate on figure 2 forthe plan of Kortedala, Göteborg. Figure 3 shows the district that is the objectof our study in the core part of the project, which can be considered a bit moremonotonous. The buildings are generally well accessible and daylight perfor-mances are judged optimal, what confirms the research of functionnality duringthe design of the district (although those points stay subjective and could beanalysed in an objective way as we will do in paper B).
When it is possible (i. e. when implantation areas are initially composed offorest, fields and swamps on a quite hilly terrain), natural features are preservedby planning. Furthermore, they are taken as elements of the planning in orderto offer better quality of life to inhabitants. That can be seen through theimplantation plan of Kortedala, where relief (level curves on the map) is takenas an asset to place the buildings, giving more open space to some, creatingdiscontinuities in the possible monotony.
21
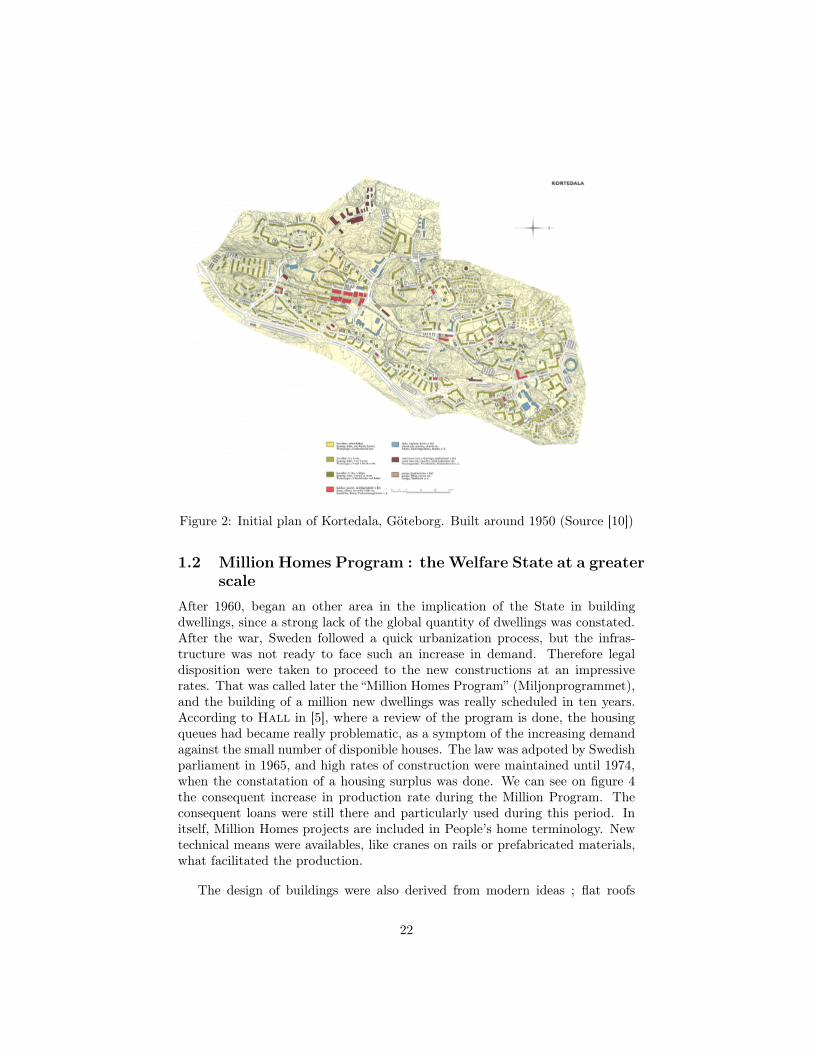
Figure 2: Initial plan of Kortedala, Göteborg. Built around 1950 (Source [10])
1.2 Million Homes Program : the Welfare State at a greaterscale
After 1960, began an other area in the implication of the State in buildingdwellings, since a strong lack of the global quantity of dwellings was constated.After the war, Sweden followed a quick urbanization process, but the infras-tructure was not ready to face such an increase in demand. Therefore legaldisposition were taken to proceed to the new constructions at an impressiverates. That was called later the “Million Homes Program” (Miljonprogrammet),and the building of a million new dwellings was really scheduled in ten years.According to Hall in [5], where a review of the program is done, the housingqueues had became really problematic, as a symptom of the increasing demandagainst the small number of disponible houses. The law was adpoted by Swedishparliament in 1965, and high rates of construction were maintained until 1974,when the constatation of a housing surplus was done. We can see on figure 4the consequent increase in production rate during the Million Program. Theconsequent loans were still there and particularly used during this period. Initself, Million Homes projects are included in People’s home terminology. Newtechnical means were availables, like cranes on rails or prefabricated materials,what facilitated the production.
The design of buildings were also derived from modern ideas ; flat roofs
22
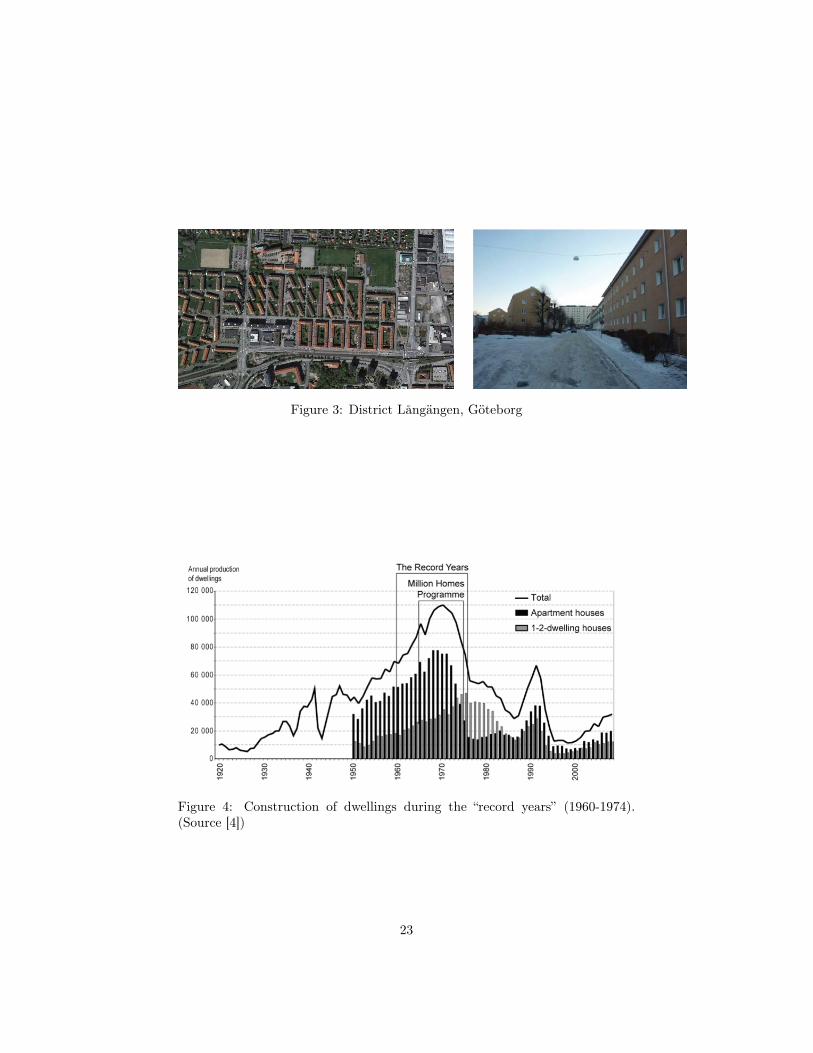
Figure 3: District Långängen, Göteborg
Figure 4: Construction of dwellings during the “record years” (1960-1974).(Source [4])
23
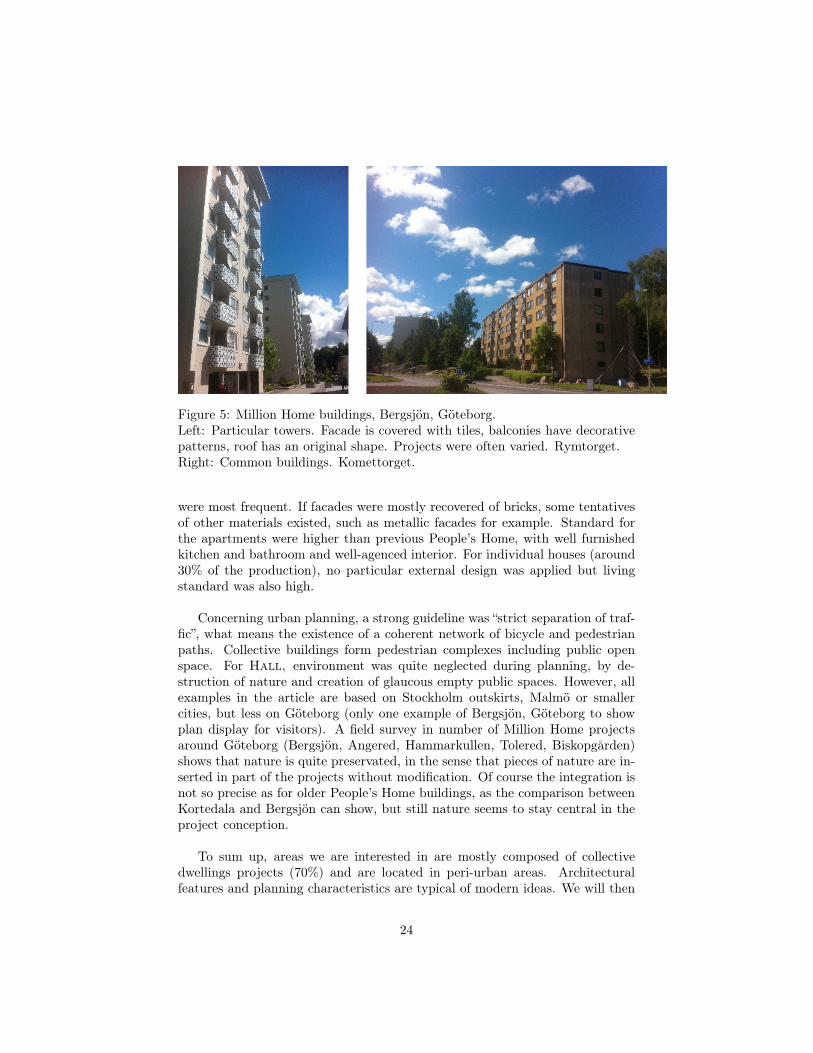
Figure 5: Million Home buildings, Bergsjön, Göteborg.Left: Particular towers. Facade is covered with tiles, balconies have decorativepatterns, roof has an original shape. Projects were often varied. Rymtorget.Right: Common buildings. Komettorget.
were most frequent. If facades were mostly recovered of bricks, some tentativesof other materials existed, such as metallic facades for example. Standard forthe apartments were higher than previous People’s Home, with well furnishedkitchen and bathroom and well-agenced interior. For individual houses (around30% of the production), no particular external design was applied but livingstandard was also high.
Concerning urban planning, a strong guideline was “strict separation of traf-fic”, what means the existence of a coherent network of bicycle and pedestrianpaths. Collective buildings form pedestrian complexes including public openspace. For Hall, environment was quite neglected during planning, by de-struction of nature and creation of glaucous empty public spaces. However, allexamples in the article are based on Stockholm outskirts, Malmö or smallercities, but less on Göteborg (only one example of Bergsjön, Göteborg to showplan display for visitors). A field survey in number of Million Home projectsaround Göteborg (Bergsjön, Angered, Hammarkullen, Tolered, Biskopgården)shows that nature is quite preservated, in the sense that pieces of nature are in-serted in part of the projects without modification. Of course the integration isnot so precise as for older People’s Home buildings, as the comparison betweenKortedala and Bergsjön can show, but still nature seems to stay central in theproject conception.
To sum up, areas we are interested in are mostly composed of collectivedwellings projects (70%) and are located in peri-urban areas. Architecturalfeatures and planning characteristics are typical of modern ideas. We will then
24

Figure 6: Proportions of types of tenure
study the sociological aspect of these areas that we then call call “suburbs”.
2 “The myth of the Swedish suburb”
The consequences of the development of peri-urban areas during the 20th cen-tury include the birth of a particular type of “suburb” (notion that we haveto redefine in that particular case). Castell proposes to explore that “myth” ofthe Swedish suburb in [4], trying to set the definition for the particular case ofSweden.
2.1 The suburb as rental housing areaCastell presents first the context of rental housing and the importance ofmunucipal housing companies. On figure 1 we can see the repartition betweendifferent types of tenure. It appears that almost a half of people rent theirdwelling. That set the role of housing companies. The municipal companies(allmännyttan) had in the past privileges over private ones, such as loans withvery low interest rate. That was part of the Swedish Welfare State, because thesecompanies were considered as instruments to allow access to decent dwellingfor everyone. Rents were strongly regulated, fixed according to standard formunicipal companies and regulated to a close value for private companies. Al-though economic privilege for public housing companies disappeared 20 yearsago, these companies have still an important place on the market, and the sys-tems of regulation for rents has not changed. An important point is also thatpublic companies are still the mean for local authorities to develop policies ortry to implement solutions to social problems.
The name allmännyttan can also be translated as “social housing”, but thenotion has not the pejorative sense it can have in countries such as France :
25
social housing is conceived for everyone, not only for economically disadvantagedcategories.
Taking into account the fact that most of peri-urban areas that we wouldlike to define as suburbs are totally composed of rental housing, especially forcollective housing areas, we can propose the approach that Castell gives im-plicitely in his work : the Swedish suburbs are peri-urban areas with a majorityof rental housing. Included sub-areas of owned individual homes are consideredas so, but some area with only individual houses are not (as the exemple ofSouth-West of Göteborg).
2.2 Current representation against reality of the Swedishsuburb
Environmental qualities In common representation, suburbs are associ-ated with “large-scale housing areas” and therefore with high buildings creatingmonotonous landscape. That is not mostly not the case in Sweden : if that“environmental stigma” is justified in a few places, a major part of projectsis composed of short-storey buildings, giving a more human scale to the area.Open space are appreciated by inhabitants. In fact, the physical layout of sub-urbs gives more positive considerations than negative ones.
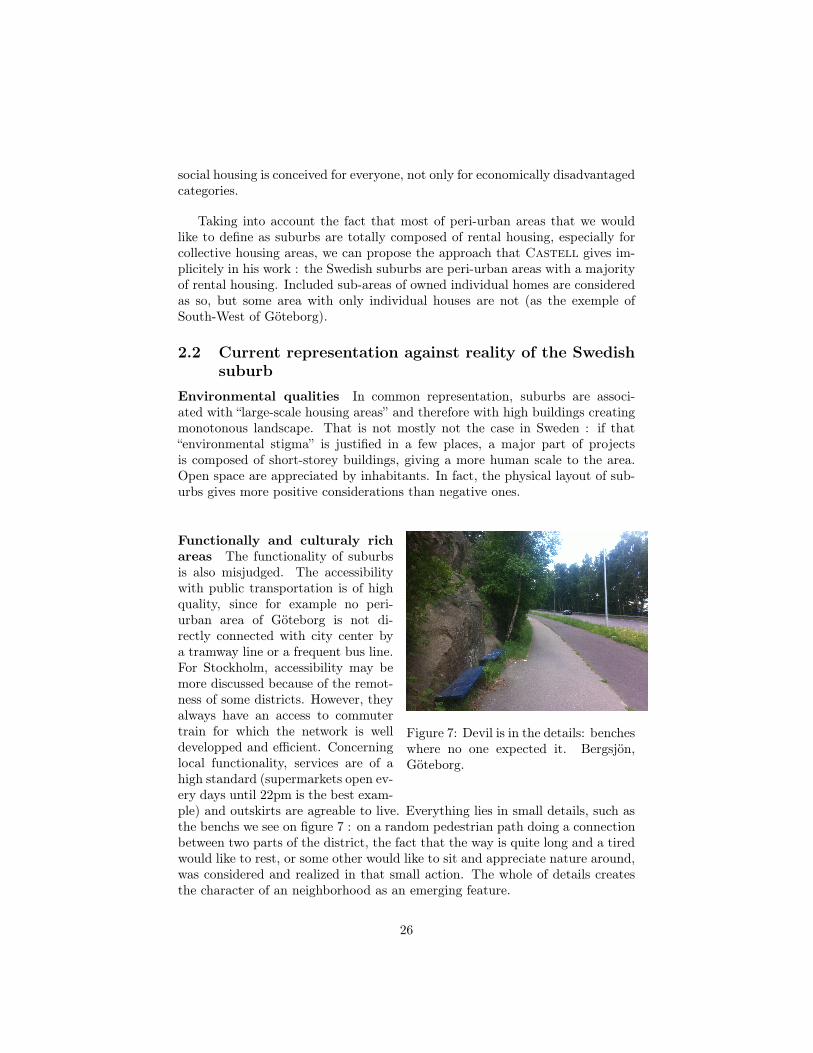
Figure 7: Devil is in the details: bencheswhere no one expected it. Bergsjön,Göteborg.
Functionally and culturaly richareas The functionality of suburbsis also misjudged. The accessibilitywith public transportation is of highquality, since for example no peri-urban area of Göteborg is not di-rectly connected with city center bya tramway line or a frequent bus line.For Stockholm, accessibility may bemore discussed because of the remot-ness of some districts. However, theyalways have an access to commutertrain for which the network is welldevelopped and efficient. Concerninglocal functionality, services are of ahigh standard (supermarkets open ev-ery days until 22pm is the best exam-ple) and outskirts are agreable to live. Everything lies in small details, such asthe benchs we see on figure 7 : on a random pedestrian path doing a connectionbetween two parts of the district, the fact that the way is quite long and a tiredwould like to rest, or some other would like to sit and appreciate nature around,was considered and realized in that small action. The whole of details createsthe character of an neighborhood as an emerging feature.
26

Figure 8: 37°/Suburbia, cultural performance at Rymdtorget, Bergsjön, Mai2013. Inhabitants where involved voluntary in performances, attesting of thedynamic of local cultural life. (source website)
An other prejudice on suburbs is that they are unactive areas, with no cul-tural life for example. That is also not true, since most of projects include com-munity centers, local libraries, etc. Suburbs have sometimes build their owncultural identity (see the musician Timbuktu for example). Recently, dansecompany of the Göteborgs Operan created a set of artistic performances to-gether with residents of Rymdtorget, Bergsjön. People where able to sharetheir culture by being part of the artistic performance. Religion was also wellconsidered during planning, since places of worship for most present religionswhere built.
The question of segregation However, the negative aspect of segregationin different ways stays a reality associated to suburbs. Segregation can be de-fined as residential grouping of people sharing appartenance to the same “socialstatus” (socio-economic segregation) or sharing the same culture (ethnic segre-gation). In mai 2013, riots broke in Husby in the outskirts of Stockholm. Thetrigger was an incident during a police intervention, but the real causes seemto be the bad economic situation of the neighborhood combined with ethnicsegregation (see Newspaper articles about it1).
The measure of segregation can be subject to debate since many indicatorscan be defined. As an example, the dramatic situation of English suburban areasdescribed by Simpson in [8] was nuanced by a response in [7]. Other statistical
1For example, The Local (http://www.thelocal.se/48006/20130520) or dn.se(http://www.dn.se/sthlm/upplopp-och-brander-i-husby/).
27
measures led to different results. There is also the question of the proxy variableused for measure ; socio-economic segregation is not always directly linked withethnic segregation, although a complex relation between the two seems to exists.
However, as Castell points out, segregation has more and more becamea reality in Swedish suburbs. In his essay “See you in the suburbs - if youdare!” in [6], Hammaren describes the common vision of north-east suburbs ofGöteborg, that are seen as extremly segregated and dangerous to live. Altoughthe description appears as exagerated, it proves the increasing importance ofthat problem. Segregation seems to be the main future problematic for theseneighborhoods.
3 Perspectives
We can now interrogate the possible perspectives for Swedish suburbs regardingsome aspects we described.
3.1 Future of social housingAround 1990, housing system was strongly reformed. Municipal companies losttheir privileges and all kind of subsidies linked to the old housing system werestopped, all that in a context of merket opening. In [12], Turner and Whiteheadtake stock 10 years after these structurals reforms. Through a macro-economicanalysis, they conclude that “significant modifications of the housing system”had emerged. Main features were augmentation of risk in the rental domain, anincrease of inequalities and a reduction of demand in the construction of newbuildings. That implies that poorer were disadvantaged by the reform. Socialhousing in Sweden may for this reasons be in strong crisis today.
In 2012, Göteborg Stad led a study ([9]) to find out the best alternativesto keep an efficient social housing in this context of market opening. Indeed,the mix of people with different incomes in a district (“mix of social classes”)appears as a way to encourage social housing and to break segregation, but themarket-ruled prices produce too high rents for low-income people. Thereforethey analyse all social housing systems in Europe and come to the conclusionthat the state should help local organisations to manage social housing, throughconstruction of new buildings by non-lucrative organisms, in which municipalityshould have a strong role - in a way a compromise between old swedish systemand french one for example. In all cases, future of social housing in Swedenstays totally unclear today.
28
3.2 Evolution of segregationAndersson studies in [1] the consequence of policies taken to counter segregation(called “Metropolitan Development Initiative” and launched by the state in 1999)and concludes that the expected effects didn’t appear. The reason for thatseems to be that governement measures more amount to assist people thanto structurally change the neighborhood. He argues that deep transformationof the concerned districts, with new constructions in order to obtain “sociallymixed neighborhood”. The results do not help to be optimistic regarding theevolution of segragation.
Concerning ethnic segregation, it seems harder to understand the phenomenon.Indeed, the authors of [3] argue that this segregation is reinforced by an ethnichousing segmentation, i. e. that immigrants are significantly “underrepresentedin home ownership”. They try to explain that fact by looking at people leavingrental housings for home ownership. By means of statistical regressions on datafor the city of Uppsala, they express the relations between the two variables.The results are that the correlations are not enough so ethnic discrimination isnot the explanation for the housing segmentation, what implies that discrimi-nation has few chances to be at the origin of ethnic segregation. In the sameway the work by Simpson didn’t give clear answer on ethnic segregation, thisone shows how that fact is complex to understand. Therefore we are not ableto give precise answer about the evolution of ethnic segregation.
3.3 Possible actionsMany policies are proposed to counter problems suburbs are facing today. ForSweden, recent state initiatives appears as having failed as we saw before. How-ever, local actors are involved in finding policies as the work of Göteborg Stad.Castell points the fact that environmental actions were totally ignored bythe government recently and that maybe a requalification following a “resident-based” approach for neighborhood requalifications could be a great asset againtsuburb deprivation. This is in fact the spirit of the project ReBo presented inintroduction.
The bottom-up “resident-based” approach should be one of the great assetsfor the requalification of our cities. In France, that fact is confirmed by Badar-iotti in [2]. He analyses how we recently switch from the only morphologicalappraoch to a mixed point of view including local functional questions, takinginto account especially the “interest of residents of the city”.
Combined with the argument of Andersson on measures against segregation,that brings us to think that the most promising scenarii for urban renewalare bottom-up approaches with strong structural impact, such as integratedrefurbishment or/and construction of new infrastructures.
29

Conclusion
We have seen that Swedish peri-urban areas have a strong historical and ar-chitectural identity, since they are mainly results of People’s Home and MillionHomes projects. This identity is associated to urban features that have led toa particular notion of suburb. Behind that the context of social housing andhousing policies adds ambiguity in that. Even if these areas are now facingsegregation problems, one must not forget the intrinsic quality of these placesand consider perspectives for their preservation and requalification.
? ??
30

References
[1] Roger Andersson. ’breaking segregation’—rhetorical construct or effectivepolicy? the case of the metropolitan development initiative in sweden.Urban Studies, 43(4):787–799, 2006.
[2] Dominique Badariotti. Le renouvellement urbain en france: du traitementmorphologique à l’intervention sociale. 2006.
[3] Åsa Bråmå and Roger Andersson. Who leaves rental housing? examiningpossible explanations for ethnic housing segmentation in uppsala, sweden.Journal of Housing and the Built Environment, 25(3):331–352, 2010.
[4] Pål Castell. The swedish suburb as myth and reality. Pål Castell (2010),Managing yard and togetherness: living conditions and social robustnessthrough tenant involvement in open space management, Chalmers Univer-sity of Technology, Göteborg., (Part 2, Thematic Paper E), 2010.
[5] Thomas Hall and Sonja Vidén. The million homes programme: a review ofthe great swedish planning project. Planning Perspectives, 20(3):301–328,2005.
[6] Helena Holgersson and Brett J. Epstein. (Re)searching Gothenburg: essayson a changing city. Glänta produktion, Göteborg, 2010.
[7] Ron Johnston, Michael Poulsen, and James Forrest. On the measurementand meaning of residential segregation: a response to simpson. Urbanstudies, 42(7):1221–1227, 2005.
[8] Ludi Simpson. Statistics of racial segregation: measures, evidence andpolicy. Urban studies, 41(3):661–681, 2004.
[9] Göteborgs Stad. Ett socialt blandat boende i göteborg : En kunskap-söversikt om bostäder för låginkomsttagare och socialt blandade boendeni europa och möjligheterna att finna nya verktyg i göteborg. Technicalreport, Göteborgs Stad Fastighetskontoret, Göteborgs Stad Socialresurs-förvaltning, Centrala Älvstaden, 2012.
[10] Liane Thuvander, Paula Femenias, and Pär Meiling. Description of the peo-ple’s home building stock in sweden. Technical report, Chalmers TekniskaHögskola, Departement of Architecture, Göteborg, 2012.
[11] Liane Thuvander, Paula Femenias, and Pär Meiling. En rebo-rapport : caselångängen. Technical report, Chalmers Tekniska Högskola, Departement ofArchitecture, Göteborg, 2012.
[12] Bengt Turner and Christine ME Whitehead. Reducing housing sub-sidy: Swedish housing policy in an international context. Urban Studies,39(2):201–217, 2002.
31

32

Paper B
Architectural urbanity : between art and
science, how Swedish urban planning can be
considered as particularly performant and
valuable
Abstract
We propose to study caracteristics of Swedish urban planning, espe-cially for the districts built during the Million Homes program. First aqualitative analysis in general and case studies inform on the nature ofthese district and allow us to evoke the notion of “architectural urbanity”.Then we consolidate the proposed ideas through objective quantitativecase study by the construction of diverse indicators at the scale of a dis-trict and by applying them to the comparison between two suburbiandistricts.
33

Introduction
The city cannot be only composed of architectural exceptions, first of all for tech-nical and pragmatic evident reasons, then maybe for more complicated internalstructure effects. As Lynch has shown in [13], the distinction of landmarks anddistinctive edges is essential in the personnal creation of the image of the city,so in its perception and appreciation, what can be considered as influencing thequality of urban life. The apparition of the suburbs in the second middle of the20th century has directly followed that logic, taking it more dramatically as ageneral rule, which led to “aggregation of unperceptible and disagreable pieces,that we can difficultly consider as buildings” (subjective comment on suburbsheard from an urbanist). It would mean that some parts of urban areas, espe-cially the suburbs, lack of architectural quality and therefore of life quality fortheir inhabitants.
However, such a vision stays at a small level of integration and forgets totake into account more global descriptors of the urban environment, since thelocal architectural or urban qualities of the built environment can be stronglydifferent of more global properties evaluated at the scale of the district, theentire city or even within system of cities. Pumain ([19]) argued that this moreglobal vision is necessary to understand, analyse, predict the performance ofurban systems and therefore necessary for an optimal planning. That argumentis also presented from an other point of view when Hillier propose ([9]) spatialand topological analysis of static urban systems in order to enlight some of theirqualities or defaults.
Those arguments are to be developed in the following section, particularlythe ideas developped by Lars Marcus in his thesis ([14]), when he focuses onthe existence of these integrated qualities (what he calls the “functional perfor-mance”) in a majority of districts.
34

1 Swedish Urban planning : subjective qualita-
tive analysis
1.1 Architectural urbanity
1.1.1 Presentation
In his thesis, Marcus’ aim is to show evidences of the existence of real perfor-mances for district planned during the 20th century. The background is a crisisof functionalism, since the expected emerging social aspects for district plannedin a functionalist way do not appear today in an obvious way. Such criticismhas raised particularly in Sweden, where the context for projects planned dur-ing the Million Homes program was this one. Looking at reviews on history ofurban planning during the 20th century, a skepticism on possible accumulatedknowledge in that field is quite present in mentalities today, and that is whatMarcus wants to contest.
The first point of his response is the existence of “architectural urbanity”,highlighted as a distinct part of urbanity : “within urban planning and design inthe 20th century, one can distinguish a distinct category termed architecturalurbanity”. It is not really clear if that supposes a success of the top-downplanning process behind most of urbanistic projects, or if this category is aconsequence of commons local aspects, through the emergence of similar effects.Anyway, the purpose of this first part is not to explain the origin but to showthe reality of this concept. Without going into details, the methods used toprove it are the application of spatial analysis methods (see [11] for furtherdetails on this theory and associated methods ; a written report of the workshopis in Appendice A). By extracting features of spatial configurations, we areable to classify the configurations according to quantifications of parameters ofsome features. The analogy between the organisation of a building through itsarchitecture and the noticeable organisation in these patterns of features is themain argument for calling that class within planning “architectural urbanity”.An example of the output of a spatial analysis calculation is shown in figure 1.
Going further in the second point, he brings proofs that architectural urban-ity implies a minimal level of urban quality. Indeed “there are spatial preferenceswithin [architectural urbanity] which is possible to link to certain functional per-formances”. The built form has both consequences on its meaning and on itsfunction. Therefore social aspects should be strongly influenced by urban form.The methods used are the same as for the first point, but only brought one stepforward, since he sees these “quantitative methods as a scientific approach tothe relationship between form and function”.
Following this path, we will first try to get a rough feeling what this no-tion can mean. This theory will be applied in the second part with technicalmeans, not exactly as Marcus does, because we will be more looking for adiversification in the approaches of the evaluation of performances.
35

Figure 1: Spatial configuration analysis of different district of Stockholm (source[24]).
1.1.2 Example
We can touch the notion of architectural urbanity by looking at a brief casestudy. The concrete example of the district Angered in Göteborg, which hasbeen built during the Million Program and is typical of the criticals presentedin Paper A, fits well for that study.
To set the global situation of that district, it is the most distant district fromcenter. It is not accessible by walking (10km from center) and is isolated bynatural and artificial obstacles such as hills, forest and industrial areas. Still, adirect tramway line links Angered to the center of Göteborg in approximatively15 minutes. The part of occupied surface for collective buildings and individualhouses is around 50% each, what means that a majority of the inhabitants livein the buildings.
Concerning the configuration and the local characteristics, we can analysethe detailed map shown on figure 2.
First of all, we note that the district is divided into four main parts (Centrum,Rannebergen, Lövgärdet, Gårdsten) wich are composed of cores of complexes ofbuildings, with satellites of individual houses systems. Each part is at the samedistance of the Centrum, were the tramway line ended, so the transportationtimes are quite the same for all inhabitants and they are simply minimised. Lo-cal service is assured by bus but in worst case, the greatest walking distance tothe station is 1,5 km. We can see that walking and bicycle paths (intermittent
36
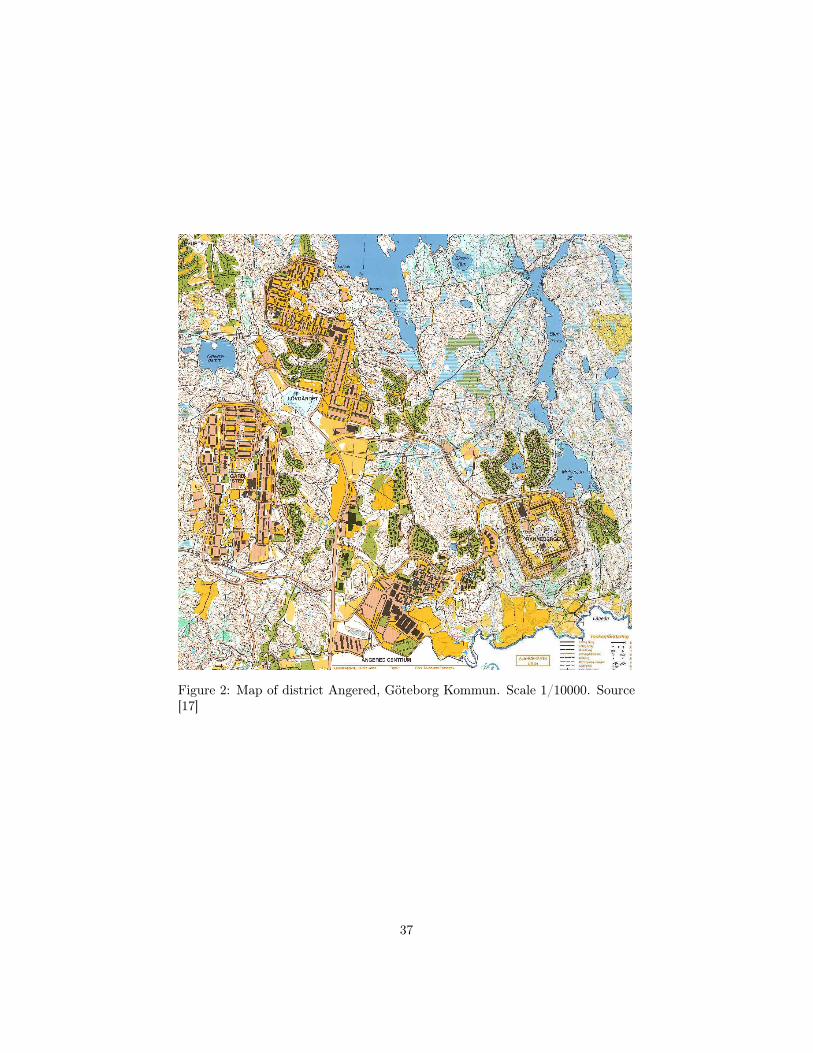
Figure 2: Map of district Angered, Göteborg Kommun. Scale 1/10000. Source[17]
37

Figure 3: View of Gårdstensvägen, Angered. (street west of Gårdsten, viewtowards North).
black lines) are strictly separated from car traffic, for safety reasons (bridgesand tunnels). All these simple points suggest a good performance regardingmovements of individuals in the district and to the center of Göteborg. Fur-thermore, the tree structure of most satellites of individual houses is an otherproof of optimisation of traffic distribution.
The well being of inhabitants is not forgotten in the planning : forest isalways accessible and has been preserved all around the cores, to give a betterliving environment than only buildings everywhere around. An other interestingpoint is the accessibility of bathing places in the natural lakes. Swedish culturegive a great place to the relation with nature and people know how to honorit, by appreciating and respecting it. When summer comes, bathing in naturallakes and going in the forest is a main activity. The planner have functionnalyoptimised this access to nature, particularly to bathing places, since each partof the district has its own lake (in blue on the map) and the associated places,wich are very close by walking distance.
Last but not least, the core part of the district are each well self-organised.The building generally form a thin enveloppe surrounding public green spaces asparks and parts of forest, that are inside the core for the two convex parts, andpartially inside for the third that is opened. The Centrum is different becausecompact, but its relative size allows easy access to surroundings green spaceseven for buildings in the middle of it. If building shapes are globally the sameand the architecture is also the same inside a part of the district, the monotonythat could result and that is one of the main criticals evoked (see Paper A) ishere broken through the non-monotonous aspect of the global masterplan ; forexample just the small curvature of west front of Gårdsten is enough to entertainthe walker by suggesting next buildings just showing a part behind (figure 3).
38

All these point are showing that district planning has intrinsic qualities, sug-gesting a certain level of “functionnal performance”. They are not consequenceof hazard but of small details in planning, in local and global organisation. Thatshould be one proof of the reality of the “architectural urbanity”. Of course theapproach here was quite suggestive and not necessary justified, that’s why wewill apply to build in the second section a more objective analysis.
1.2 An implicit culture of performance ?
It is not clear wether all these aspects of planning were core elements of theplanning directives at this time or they were implicit features that are part ofSwedish culture in architecture and urban planning. Concerning traffic separa-tion for example, it was clearly one of constraints in Million Program projectsas it is explained in [8]. But other “softer” aspects are not generally mentionnedin this review.
We explored briefly historical litterature to understand that point : in [16],that is a book published in the middle of the “record years” of Million program,the authors want to set standards for planning. It is interesting to note thatsome points may appear as contradictory : concerning the choice of buildingterrain, they recommand flat regions with less geographic constraints, as southof Sweden around Malmö. However, most of district built in that time (quasitotality for Göteborg, the same for Stockholm for South and North suburbanareas, and these two cities gather majority of Million Program projects), werebuilt on complicated hilly terrain, in contradiction with the directives for lowercosts. The reason of these locations appears as an open question, in fact theremay be no simple reason, the choice resulting of complex interactions of elementsinvolved in the decision process.
But as we saw in the case of Angered, the disadvantaging geographic locationbecomes strong assets for performance of the project : the 4-core structure issuggested by topology, the natural lakes offer opportunities, etc. Therefore wecan ask ourselves if the planners (consciously or inconsciously) did contradictthe recommended rules in order to get more functionnal performance. Thatwould suggest the presence of a culture of performance among planners, thatexpress itself in an artistic way through the architectural urbanity of the district,confirming in an other way the importance of this notion.
2 Case study : quantitative comparison
2.1 Choice of the subjects
Proceeding to an evaluation of some evaluation criteria to a single district wouldhave no sense at all, because if they are not normalised, reference values arenecessarly needed. We propose in the following to built normalised criteria,but since it would be the purpose of an entiere study for each to determine
39

the domain of validity and to assess of their pertinence, we will apply them to“reasonable cases”, in the sense that cases must not be extreme cases for anyaspect taken into account in the criteria. We also won’t have clear ideas onthe range of values taken by the indicators, so comparison will be binary andnot quantitative. To proceed to quantitative comparison, a deeper study ofindicators on a large range of cases would also be needed.
Concerning the scale of the subjects, it is not possible to find two districtsexactly at the same size, especially in demographic and geographic size. Sinceour indicators are normalised, that point shouldn’t matter. Still, following thehypothesis that scaling laws generally apply to urban systems as Pumain arguesin [20], we are encouraged to think that the scale ratio between the studiedelement and its neighbors in the system of systems will have more influence onthe properties of the subject than the absolute scale in itself. That allows todetermine the set of comparable cases to a fixed subject.
Since we were interested in Swedish urban planning, and especially in MillionProgram projects, one of the subjects will be of that type. For practical reasons(thorough field surveys have been done), we will take the district of Bergsjön,in the East of Göteborg Kommun, Sweden (+57° 45’ 21", +12° 4’ 12"). Forthe second one, we will choose a french district also for practical reasons. Theconstraint of scale ratio in the system of systems of cities in the country imposesa district of the suburbs of Lyon, since Göteborg is the second city of Sweden.According to the choice of criteria, we need a district linked with town centerwith fast and frequent public transportation (if not, comparing the networkswould have no sense). It is also coherent to choose a district built approxima-tively at the same period. Therefore the comparison case will be the district ofMinguettes, Venissieux, France (+45° 41’ 47", +4° 52’ 16"), that fits perfectlyall these needs.
2.2 Selected analysis criteria
On the variety and the arbitrary in the choice of evaluation criteriaOne could always argue, especially in social complex systems study, that thechosen evaluation criteria are the reason of the obtained results and that othercriteria, even very close, would have led to totally opposed conclusions. It isobvious that we can build example where e. g. an arbitrary small change in thedegree of an evaluation norm can lead to arbitrary big changes in the comparisonresults, however, we can suppose that there exists a sort of continuity in humansystems and that the sensitivity of real systems stays small, in other terms thatsome near criteria are continuously linked.
The choice of evaluation criteria is at the heart of the multi-criteria decisionanalysis. An example can be seen in [30], where the authors try to propose anheuristic for systematic multi-criteria decision-making, and where the choice of
40
indicators appears crucial but still arbitrary, show how ambiguous that prob-lem can be. Although the construction of meta-methods for evaluation can beformally justified, as the use of aggregation functions proposed in that case, theinitial problem of the human choice of evaluation space remains particular toeach case. In that case, there are no strong geographic constraints, so criteriaare mainly ecologic and economic ones. That is far from the choice of corridorfor Highway A75 in France around the town of Millau, where lies nowadays thefamous Viaduc de Millau : geotechnical constraints and direct impact on urban-ization led to the choice of the “high solution” against the “low” - the choice ofwest against other option was made for ecological reasons and also consequenceson urbanization. (source [6]).
Therefore we need to stay aware that our choice of indicators can arbitraryinfluence the results. We try to make it reasonnably regarding our problem,taking four aspects that appear important for the life quality in a district andfor which the comparison across different countries will still have a sense. Theseare the spatial configuration, the repartition of landuse, the daylight qualities ofbuildings and the qualities of the transportation network. This diversificationof aspects is suggested by the work of Ceccato in her thesis ([2]), notably whenshe insists on the fact that urban facts are understandable only through theconjunction of multiple characteristics and she proposes a simplified typologyof possible fields of evaluation (what meets in background the ideas behind theReBo project).
2.2.1 Spatial configuration
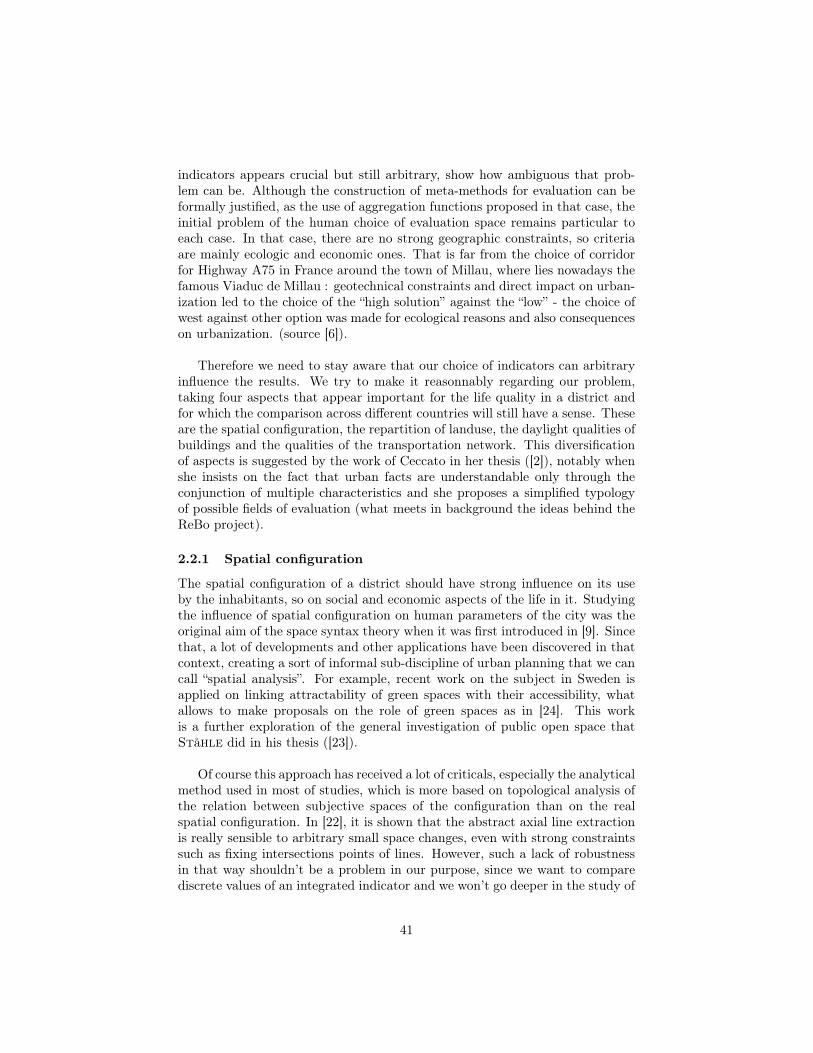
The spatial configuration of a district should have strong influence on its useby the inhabitants, so on social and economic aspects of the life in it. Studyingthe influence of spatial configuration on human parameters of the city was theoriginal aim of the space syntax theory when it was first introduced in [9]. Sincethat, a lot of developments and other applications have been discovered in thatcontext, creating a sort of informal sub-discipline of urban planning that we cancall “spatial analysis”. For example, recent work on the subject in Sweden isapplied on linking attractability of green spaces with their accessibility, whatallows to make proposals on the role of green spaces as in [24]. This workis a further exploration of the general investigation of public open space thatStåhle did in his thesis ([23]).
Of course this approach has received a lot of criticals, especially the analyticalmethod used in most of studies, which is more based on topological analysis ofthe relation between subjective spaces of the configuration than on the realspatial configuration. In [22], it is shown that the abstract axial line extractionis really sensible to arbitrary small space changes, even with strong constraintssuch as fixing intersections points of lines. However, such a lack of robustnessin that way shouldn’t be a problem in our purpose, since we want to comparediscrete values of an integrated indicator and we won’t go deeper in the study of
41
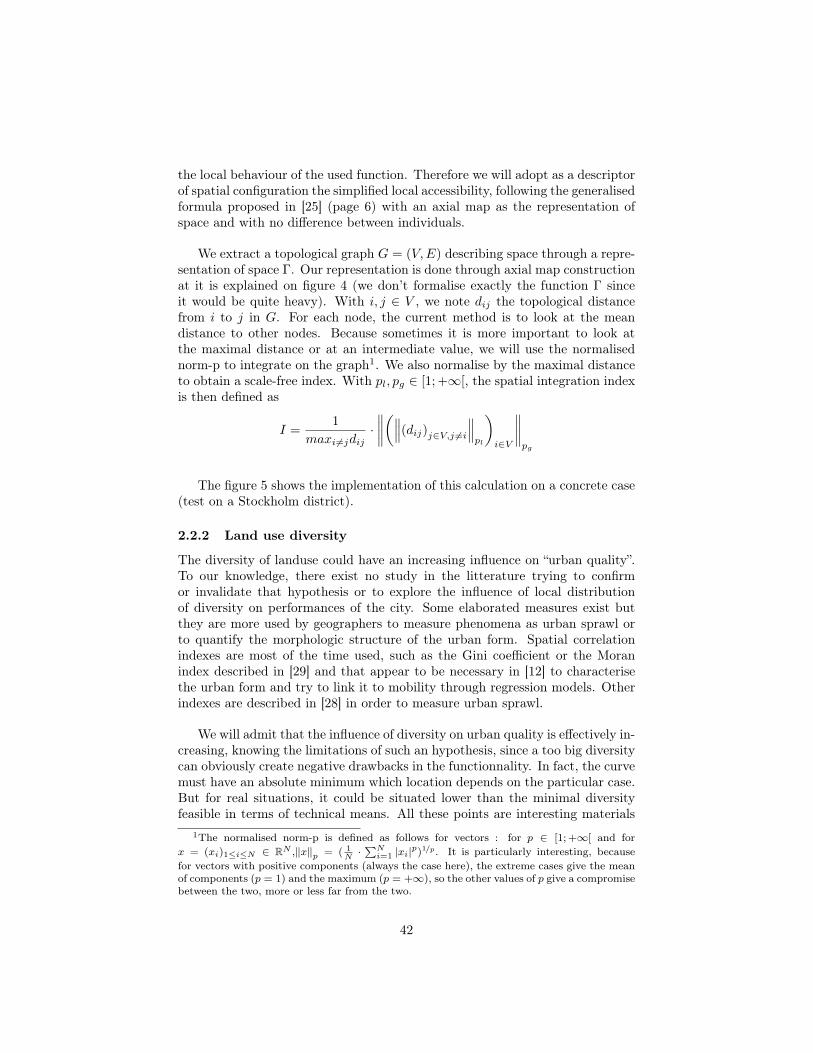
the local behaviour of the used function. Therefore we will adopt as a descriptorof spatial configuration the simplified local accessibility, following the generalisedformula proposed in [25] (page 6) with an axial map as the representation ofspace and with no difference between individuals.
We extract a topological graph G = (V,E) describing space through a repre-sentation of space �. Our representation is done through axial map constructionat it is explained on figure 4 (we don’t formalise exactly the function � sinceit would be quite heavy). With i, j 2 V , we note dij the topological distancefrom i to j in G. For each node, the current method is to look at the meandistance to other nodes. Because sometimes it is more important to look atthe maximal distance or at an intermediate value, we will use the normalisednorm-p to integrate on the graph1. We also normalise by the maximal distanceto obtain a scale-free index. With pl, pg 2 [1; +1[, the spatial integration indexis then defined as
I =1
maxi 6=jdij·����
✓���(dij)j2V,j 6=i
���pl
◆
i2V
����pg
The figure 5 shows the implementation of this calculation on a concrete case(test on a Stockholm district).
2.2.2 Land use diversity
The diversity of landuse could have an increasing influence on “urban quality”.To our knowledge, there exist no study in the litterature trying to confirmor invalidate that hypothesis or to explore the influence of local distributionof diversity on performances of the city. Some elaborated measures exist butthey are more used by geographers to measure phenomena as urban sprawl orto quantify the morphologic structure of the urban form. Spatial correlationindexes are most of the time used, such as the Gini coefficient or the Moranindex described in [29] and that appear to be necessary in [12] to characterisethe urban form and try to link it to mobility through regression models. Otherindexes are described in [28] in order to measure urban sprawl.
We will admit that the influence of diversity on urban quality is effectively in-creasing, knowing the limitations of such an hypothesis, since a too big diversitycan obviously create negative drawbacks in the functionnality. In fact, the curvemust have an absolute minimum which location depends on the particular case.But for real situations, it could be situated lower than the minimal diversityfeasible in terms of technical means. All these points are interesting materials
1The normalised norm-p is defined as follows for vectors : for p 2 [1; +1[ and for
x = (xi)1iN 2 RN,kxkp = ( 1
N ·PN
i=1 |xi|p)1/p. It is particularly interesting, because
for vectors with positive components (always the case here), the extreme cases give the mean
of components (p = 1) and the maximum (p = +1), so the other values of p give a compromise
between the two, more or less far from the two.
42
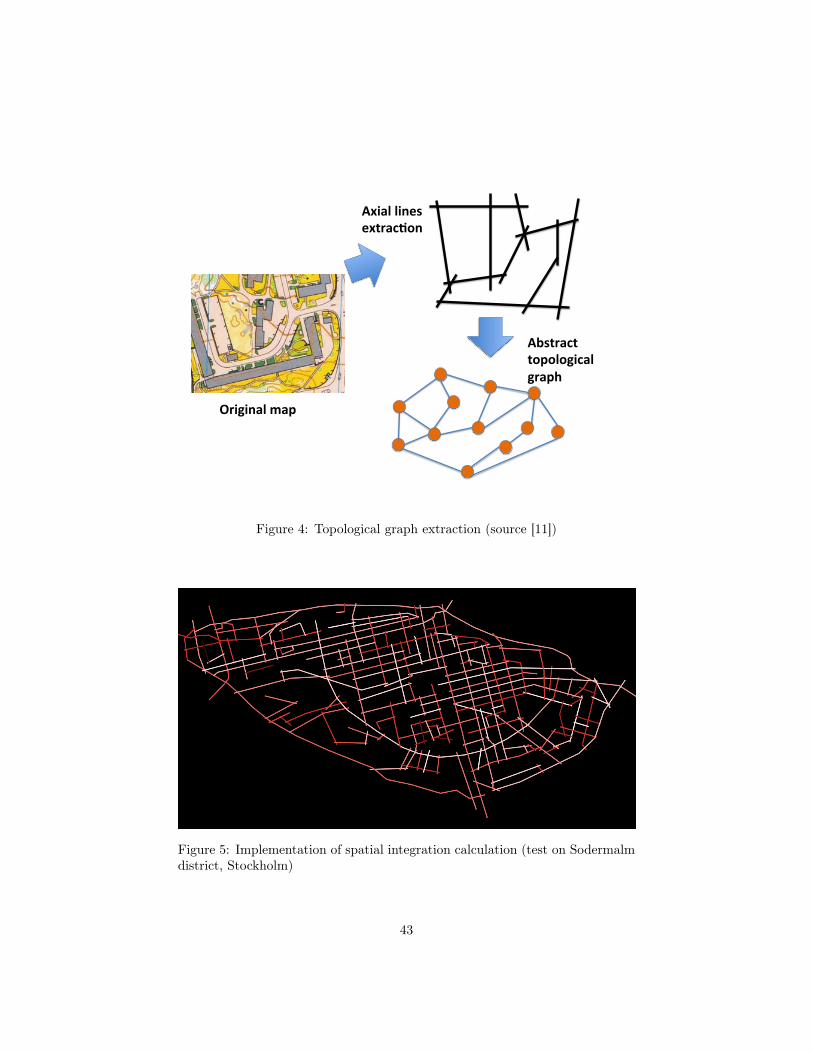
Original(map(
Axial(lines(extrac1on(
Abstract(topological(graph(
Figure 4: Topological graph extraction (source [11])
Figure 5: Implementation of spatial integration calculation (test on Sodermalmdistrict, Stockholm)
43
for further studies. In most of recent planning projects, diversity of landuse isencouraged, what support us in our first hypothesis (see for example the newdistrict Paris Rive Gauche conducted by Portzamparc and administrated bythe SEMAPA, or the new district Massy Atlantis, France, etc. ).
If the world is composed of a set of patches P and that we can associate atype of landuse to each patch by the function t : p 2 P 7! t(p) 2 [|1;N |], thenour index is calculated as
d =N
Card(P )·P
p2P
Pp0 6=p
t(p) 6=t(p0)d(p,p0)P
p2P
Pp0 6=p
1d(p,p0)
The weighting by the inverse of the distance allows to translate diversityfrom a fixed patch : in a way, the “changes” of type of landuses are countedwhile going away from the patch. Then the integration on all patches gives theglobal diversity. The normalisation by N
Card(P ) puts the index between 0 and 1,because it is possible to show that the ratio of sum is lower than Card(P )
N .
2.2.3 Daylight performances
The role of light is essential in architecture, as Le Corbusier said in [4] in thisfamous quote : “Our eyes are made to see forms in light; light and shade reveal[...] forms”, or as the work of Tadao Ando devotes to it in the Church of theLight (Ibaraki Kasugaoka Church in Japan). Daylight has therefore also a mainplace in the appreciation of the quality of a dwelling. In [18], Philips confirmsthat “changing is the heart of daylighting, perception reacts to change”.
It is possible to quantify the performance of a room towards daylighting byconsiderations on surface of windows, depth of the room, etc. Here, we don’tconsider the small scale of the flat or the building, but a more global level. Wepropose in appendice B a simplified model to calculate performance index ofa hole district towards daylight. Such indicator doesn’t exist in the litteratureand seems to have never been used systematically during the conception oflarge scale urban projects. Of course the question has since long time beensolved locally, e. g. the total renewal of Paris in the 19th century by BaronHaussmann included in its guidelines the need of larger streets, with calculatedratio between height of buildings and recommended street width (as he describesin its memories, well summed up by Choay in her anthology [3]). But a globalindicator depending on geographical position of the district (sun position in thesky depends strongly on it), topology (hills, differences of floor heights), naturalobstacles (trees) and expriming a normalised value on a year can go further thansimple height regulation rules.
The construction of the index was based on adaptation at a greater scale ofof the basic layer of a daylight calculation model at the scale of the building pro-posed in [15]. In the following, since we take non necessarly linear aggregation
44

functions (in fact the norms used are linear only in the case of the mean andfor positive reals), the order of integration has a meaning, and it appeared moresignificant to first integrate on a day for each spatial point (daily performanceof the point), then aggregate it on space (daily performance of district), andfinally to evaluate it through a year.
Formal description Given a latitude L and a time in the year T , we sup-pose knowing the positions of the sun during a day by its spherical coordinates: (SL,T )L,T = (t 2 [0; 24] 7! (✓L,T (t),'L,T (t)))L,T , the height function of thedistrict h(x, y) on a subset of R2 (we assume the projection has already beendone), and the positions of all windows ((x0
i , y0i , z
0i ))1iN . We can calculate
for each window with these data the binaries enlightning functions (not detailedhere) si(L, T ) : [0; 24] ! {0; 1}. Finally, the successives aggregations as ex-plained before give our index S(L), with ps, pY 2 [1; +1] parameters for thenorms :
S(L) =
�������
0
@
������
R 24t=0 si(L, d)[t]dtR 24t=0 ✓L,T (t)<⇡
2dt
!
1iN
������ps
1
A
1d365
�������pY
The point particularly interesting in this indicator is that it exprimes the ca-pacity of district to use the given daylight, thanks to the normalization by thelighting time in a day ; in winter in Sweden, enlighting times are short, but thatdoes not mean that the district is not designed in an efficient way. This pointraises the question of the validity field of the indicator : on latitudes close tohuge North or South (just Kiruna in north Sweden could already pose a prob-lem), it will become very sensitive to configuration because of the small valuesof enlightning time and won’t have really a sense (it should be possible to buildmasterplans leading to strong bifurcation phenomena) - exploration of valid-ity domain through linking to felt impressions and cultural expectations, andmaybe diversification of its expression depending on human parameters, couldbe the object of further study. Still, we will use that here as an approximativeindicator.
The figure 6 shows the implementation through sunbeams trajectory calcu-lation.
2.2.4 Public transportation performances
The last criteria we chose was the performances of the public transportationnetwork ; it is in an other field that the three we already have and appearsalso as crucial in the life of the city. Without getting into the debate of thestructuring aspect of the transportation network or of its interactions with theother aspects of urban systems, we will admit the reasonable hypothesis thatthe relation between the quality of the transportation network (according to
45

Figure 6: Implementation of daylight indicator
various criteria as robustness, connectivity, speed, etc) and the “quality” of thedistrict (which is of course not really defined) is an increasing function.
The intermediate scale for which we give indicators is not appropriated forcomplex network analysis as centrality measures (see [5] on physical street net-work), clustering analysis (see [10] on named street network), or real robustnessevaluation (see [26] on large scale road network weighted by real traffic), butthe promising recent developments in complex networks theory (in particularby application of results on complex networks in physics to the study socialnetworks) should invite us to find a way to consider networks at this smallerscale and try to apply these methods ; that could be the object of future work.
For our district evaluation, we will stay to very simple but essential indexes: transportation time and network relative speed. Formally, we suppose hav-ing the abstract representation of pedestrian network as an euclidian graph(Vp, Ep) with V finite part of the euclidian plane, and the same for the publictransportation network (Vt, Et). Each building will correspond to a node in Vp,so the buildings can be seen as B ⇢ Vp. Transportation network is accessibleby foot, i. e. for all v 2 Vp, there exists at least a path to a vertex v
0 2 Vp \ Vt.Then we are able to define the shortest path to transportation for all b 2 B, andthe nearest station s(b). To simplify, there exists a “target station” T in trans-portation network which is concretly the town center. We note dv,v0 the lengthin networks between vertices v and v
0. With mean speeds pedestrian speeds vp
and transportation speed vt (we neglige waiting time, which can be integratedin speed if needed), we define our first indicator for the network (homogeneousto a time), with pt 2 [1; +1[ :
⌧ =����db,s(b) · vp + ds(b),T · vt
�b2B
���pt
46

The other network performance we propose is the relative “speed”, i.e. thequantification of how the network is able to go directly to destination. It appearsas an essential metric in real network studies as it is explained in [1]. With thesame notations as previously, we will calculate it only on the pedestrian network,since at our scale the transportation network adapts itself to local constraints,quantifying its performance that way would have no sense. The undimensioned“relative speed” integrated on all travels is defined as follows, with ps 2 [1; +1[,
� =
�����
db,s(b)p
(xb � xs(b))2 + (yb � ys(b))2
!
b2B
�����ps
2.3 Quantitative comparison
2.3.1 Extraction of data
The GIS data for building shapes of the Bergsjön district in Göteborg were avail-able from internal database, but we didn’t have adapted shapefiles for paths androads (spatial analysis) or for the transportation network. Also for the frenchdistrict it was totally impossible to get data simply (French geographic nationalinstitute, IGN, makes pay for it). That’s why we proceeded to the data extrac-tion by hand in a Desktop GIS Software ([21]), for all different layers : one layerfor buildings used for landuse diversity, daylight performances calculation andpublic transportation performances (generation of origin/destination matrix),one for pedestrian paths for spatial configuration analysis and a third layer forpublic transportation (simplified to the tram lines, since the bus lines appearednot significant in both districts). Technically, an export to ESRI shapefile for-mat made the analysis by the Netlogo handmade code possible. We can see infigure 7 the image of the used layers for both districts.
2.3.2 Results
For both districts we have calculated the indicators presented above for differentvalues of the parameters for the p-norms. All results are summed up in table1 for norms as means. The curves in figure 8 show comparison of results withdifferent values for the parameters.
Interpretation and discussion First of all, we can say that we weren’t ex-pecting such results with quite balanced scores. The subjective impression afterhaving lived a few time in one of the district (Bergsjön) and done consequentfield survey in the other was that the Swedish district should be better on allpoints, what is not the case at all. That difference between subjective and ob-jective analysis proves on the one hand that we must always be careful withsubjective judgements, and on the other hand that it is not possible to trans-late in a few objective indicators the global feeling that one can have whenappreciating an area.
47
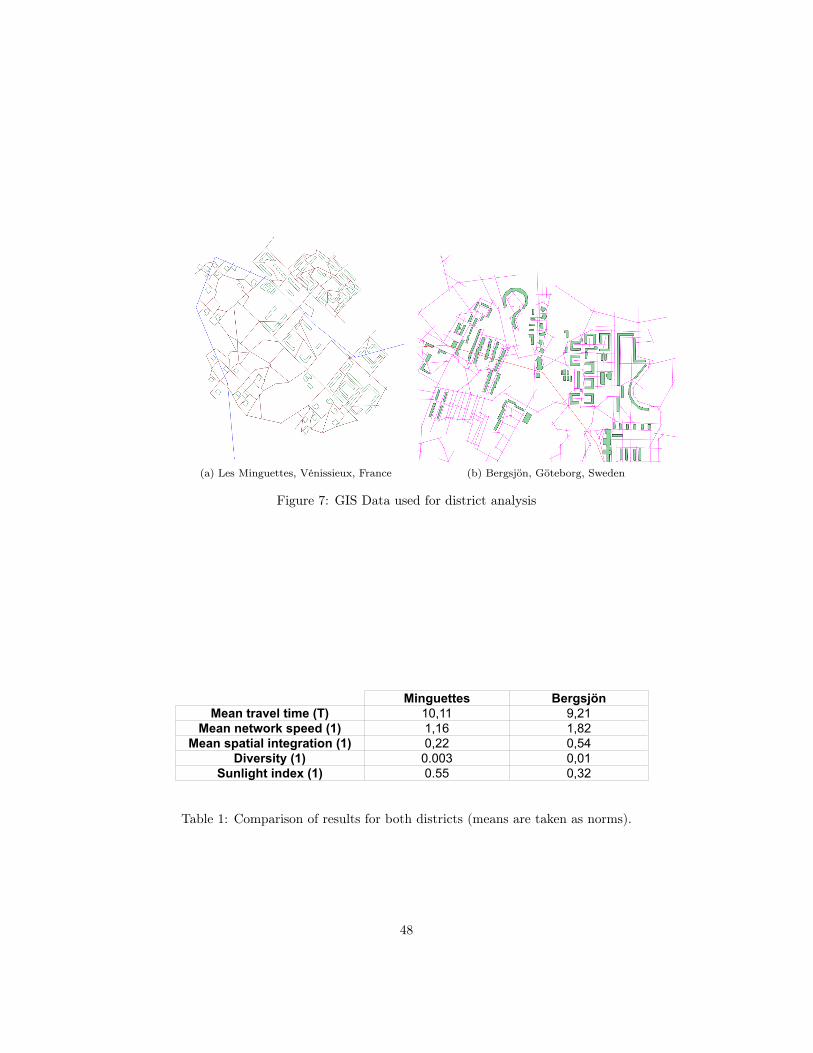
(a) Les Minguettes, Vénissieux, France (b) Bergsjön, Göteborg, Sweden
Figure 7: GIS Data used for district analysis
Minguettes Bergsjön
Mean travel time (T) 10,11 9,21
Mean network speed (1) 1,16 1,82
Mean spatial integration (1) 0,22 0,54
Diversity (1) 0.003 0,01
Sunlight index (1) 0.55 0,32
Table 1: Comparison of results for both districts (means are taken as norms).
48
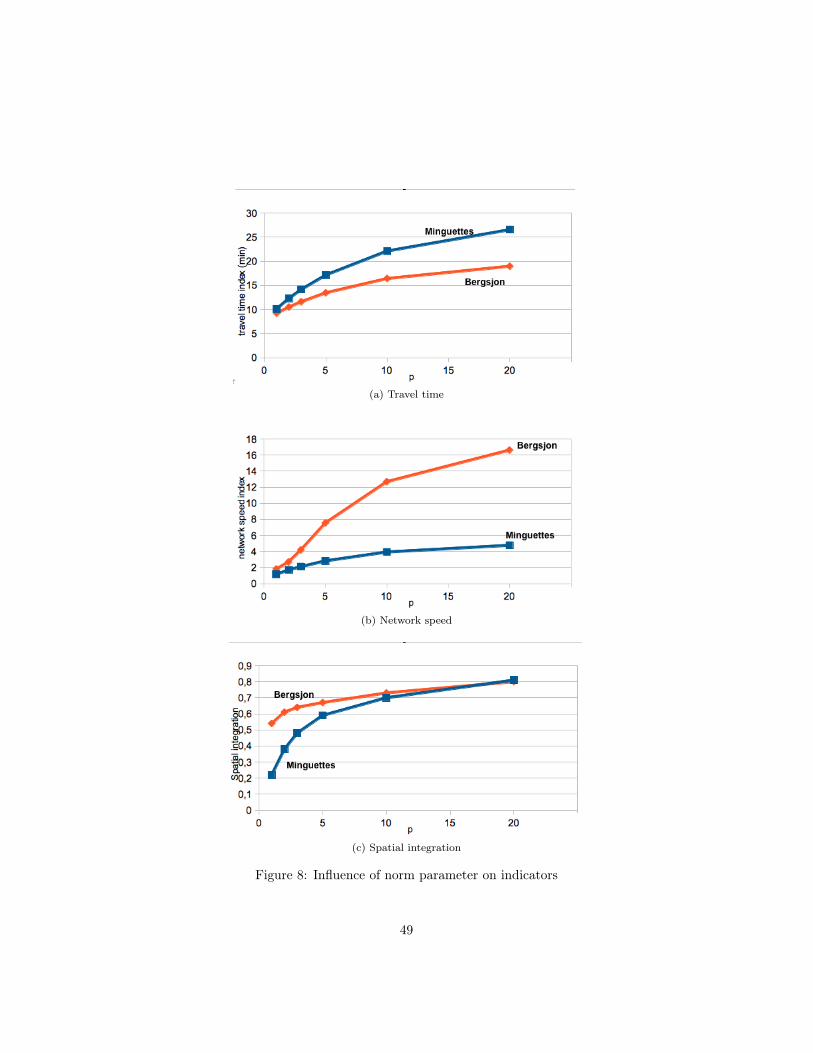
(a) Travel time
(b) Network speed
(c) Spatial integration
Figure 8: Influence of norm parameter on indicators
49

Bergsjön is doing better on travel time, but not so much for the mean value,for which the time is almost the same (less than one minute). Looking at thecurves, it is interesting that Bergsjon is more equalitarian, in the sense thatduration of travel increases less quickly according to the rank among all travels.
Concerning network speed, Minguettes is better around the mean, but againwith very small difference. The shape of the curves tell a lot about the structureof the network : because the curve for Minguettes is flat, the network shouldbe regular all around the space, i. e. that we observe topological similaritiesbut also that different parts of the network are used in the same way. In thecontrary, the quickly increasing curve for Bergsjön shows strong irregularitiesin the network. That can be explained that there exists a lot of geographicalobstacles that need to be avoided (cliffs), so on some parts of the networks hugedetours were needed.
For spatial integration, the result is also quite logical when we know thedistricts, since Bergsjön is really fragmented by the pieces of forest whereas theMinguettes has a kind of spatial unity through a space really more open. Thatbrings us to question the legitimity of the spatial integration index, because thefragmentation is not a problem for inhabitants, on the contrary it defines clearspaces that can be easier to appreciate. For the local travels, the tramway lineis used, what breaks the fragmentation. In that case, our index has no strongsense.
The diversity index translates directly the more compact character of thefrench district. It joins the remark just before on the good influence of thefragmentation of space : more diversity between buildings, public open spaces,lakes and forest should be a good point.
Finally, the sunlight performance is better for the Minguettes, what is alsoa surprise because Swedish architecture is in general particularly demanding fordaylight performance, because daylight is there in winter quite rare so it is betternot to miss a single sunbeam. That could be a vice of implementation, becauseas a simplification the set of objective points was determined by discretisation ofthe union of the discontinuity curves of the height function, what is of course nottrue because there are walls without windows. In the french district, buildingsof square shape with windows on every wall, are more frequent, so the errormade during the calculation should be smaller.
More generally, going back to the question of the functional performance, thevalues taken stay abstract because we didn’t do the tests on a greater numberof district. But that suggest a method to give an evidence-based response tothe thesis of architectural urbanity ; even in his applied work, Marcus doesn’tgeneralise his methods to a representative set of districts, and some points stayat the state of assumption, since maybe no clear pattern of classification betweendistricts would appear from a generalised analysis. That point also need to be
50

explored in future work. An automation of the data collection is for that acrucial point, that can be solved through exploration of geographic database.Still, the problem of the difference between administrative definition of districtand the boundaries of the concerned planning project remains, and the collectionof the set of these boundaries would be important. After that, a projection of allprojects in the criteria space should allow to proceed to clustering methods inorder to search for possible patterns, and definitively confirm or invalidate theexistence of the class called architectural urbanity. What could happen is thatthe projects form a continuum in the space, and that the clustering patternsbring out more cultural difference, or even nothing particular.
Conclusion
We were able to quantify by comparable indexes some aspects of what can becalled the functionnal performances of parts of a city. The title of this paper,insisting on the quality of Swedish urban planning, is in fact just justified bythe subjective analysis of the first part, since the objective analysis led to theconclusion that the Swedish district was not particularly better regarding thecriteria we chose.
The question would need further development in both subjective and objec-tive directions. We also touched a possible method for systematic classificationof functional urban patterns. Linking it with recent classification methods of theurban shape (as mathematical morphology based methods developed in [7, 27])would be a step further in the comprehension of the relation between form andfunction in urban systems.
That top-down approach for understanding characters of Swedish urbanplanning was in any cases a milestone of the global research project, especially aspreliminary work for the third part, since the construction of agent-based mod-els subtly depends on the overall context, and that a small misunderstanding orapproximation can drastically change the internal mechanisms of the model.
? ?
?
51

References
[1] Arnaud Banos and Cyrille Genre-Grandpierre. Towards new metrics forurban road networks: Some preliminary evidence from agent-based sim-ulations. In Agent-based models of geographical systems, pages 627–641.Springer, 2012.
[2] Vânia Aparecida Ceccato. Understanding Urban Patterns : Qualitativeand Quantitative Approaches. PhD thesis, Kungliga Tekniska högskolan,Stockholm, 2001.
[3] Françoise Choay. L’urbanisme, utopies et réalités : une Anthologie. éditionsdu Seuil, Paris, 1965.
[4] Le Corbusier. Vers une Architecture. Paris, 1924.
[5] Paolo Crucitti, Vito Latora, and Sergio Porta. Centrality measures inspatial networks of urban streets. Physical Review E, 73(3):036125, 2006.
[6] OMEGA Team Ecole Nationales Ponts et Chaussees Paris France. Viaducde millau. In Project Profile. UCL, Bartlett School of Planning, 2010.
[7] Pierre Frankhauser and Cécile Tannier. A multi-scale morphological ap-proach for delimiting urban areas. In 9th Computers in Urban Planningand Urban Management conference (CUPUM’05), University College Lon-don, 2005.
[8] Thomas Hall and Sonja Vidén. The million homes programme: a review ofthe great swedish planning project. Planning Perspectives, 20(3):301–328,2005.
[9] Bill Hillier, Adrian Leaman, Paul Stansall, and Michael Bedford. Spacesyntax. Environment and Planning B: Planning and Design, 3(2):147–185,1976.
[10] Bin Jiang and Christophe Claramunt. Topological analysis of urban streetnetworks. Environment and Planning B, 31(1):151–162, 2004.
[11] KTH. Architectural morphology : Investigative modeling and spatial anal-ysis. In Public Research Workshop, KTH School of Architecture, Stockholm,Mai 2013.
[12] Florent Le Néchet and Anne Aguilera. Déterminants spatiaux et sociaux dela mobilité domicile-travail dans 13 aires urbains françaises : une approchepar la forme urbaine, à deux échelles géographiques. In ASRDLF 2011,SCHOELCHER, Martinique, July 2011. http://asrdlf2011.com/.
[13] Kevin Lynch. The Image of the City. MIT Press, 1960.
52

[14] Lars Marcus. Architectural Knowledge and Urban Form: The functionalperformance of architectural urbanity. PhD thesis, Arkitekturskolan, Kung-liga Tekniska högskolan, Stockholm, 2000.
[15] Francis Miguet and Dominique Groleau. A daylight simulation tool for ur-ban and architectural spaces—application to transmitted direct and diffuselight through glazing. Building and environment, 37(8):833–843, 2002.
[16] Ella Ödmann and Gun-Britt Dahlberg. Urbanization in Sweden: Meansand methods for the planning. Allmänna förlaget Uddevalla, 1970.
[17] Svenska Orienteringsförbundet. Kartbanken. available onhttp://www.obasen.nu/kartbanken/, 2013.
[18] D Phillips. Daylighting: Natural light in architecture. Amsterdam, 2004.
[19] Denise Pumain. Pour une théorie évolutive des villes. Espace géographique,26(2):119–134, 1997.
[20] Denise Pumain. Scaling laws and urban systems. Santa Fe Institute, Work-ing Paper n 04-02, 2:26, 2004.
[21] QGIS Development Team. QGIS Geographic Information System. OpenSource Geospatial Foundation, 2009.
[22] Carlo Ratti. Urban texture and space syntax: some inconsistencies. Envi-ronment and Planning B: Planning and Design, 31(4):487–499, 2004.
[23] Alexander Ståhle. Compact sprawl: Exploring public open space and con-tradictions in urban density. PhD thesis, School of Architecture, KTH,2008.
[24] Alexander Ståhle. More green space in a denser city: Critical relationsbetween user experience and urban form. Urban Design International,15(1):47–67, 2010.
[25] Alexander Ståhle, Lars Marcus, and Anders Karlström. Place syntax: Ge-ographic accessibility with axial lines in gis. In Proceedings, Fifth interna-tional space syntax symposium, pages 131–144, 2005.
[26] J.L. Sullivan, D.C. Novak, L. Aultman-Hall, and D.M. Scott. Identify-ing critical road segments and measuring system-wide robustness in trans-portation networks with isolating links: A link-based capacity-reductionapproach. Transportation Research Part A: Policy and Practice, 44(5):323–336, June 2010.
[27] Cécile Tannier, Gilles Vuidel, and Pierre Frankhauser. Délimitationd’ensembles morphologiques par une approche multi-échelle. In J.-C.Foltête, editor, Actes des huitièmes Rencontres de Théo Quant, page 14,Besançon, France, 2008. http://thema.univ-fcomte.fr/theoq/.
53

[28] Paul M Torrens and Marina Alberti. Measuring sprawl. 2000.
[29] Yu-Hsin Tsai. Quantifying urban form: compactness versus’ sprawl’. UrbanStudies, 42(1):141–161, 2005.
[30] Josias Zietsman, Laurence R Rilett, and Seung-Jun Kim. Transportationcorridor decision-making with multi-attribute utility theory. InternationalJournal of Management and decision making, 7(2):254–266, 2006.
54

Paper C
Application of agent-based modeling to the
consolidation of a multi-criteria evaluation
framework for building refurbishment
Abstract
With aim to integrate sustainability in the more and more currentrefurbishment processes - especially in Swedish building stocks typicals ofPeople’s Home and Million Program projects, which are today beginningto decay, Thuvander & al. describe in [15] the ReBo model, a conceptualframework for a multi-criteria evaluation of the need of refurbishment andof the possible ways to proceed to it. We propose here to consolidate thismulti-criteria approach through agent-based modeling of the evolution ofa district. We describe a formal economic model that we then extendto an heterogeneous model with aspects suggested by ReBo. Thanksto dedicated calibration process, we are able to launch simulations onreal data and to explore possible refurbishment scenarii, what in a wayreinforce the proposal by ReBo of a multi-criteria approach.
55
Introduction
As we explained in [12] (in Appendice D), the main part of our project onReBo and Långängen case is the conception and implementation of an agent-based model at the scale of the district, which will take into account severalaspects, from economic field to socio-cultural issues. That requires a hetero-geneous model, which also need to be multi-scaled, since the concrete data wewill use are themselves on different scales (macro scale for economic data suchas unemployment, micro scale for the sociological data coming from individualquestionnaires submitted recently to households of the district in the frame ofan other part of the project). It is well known that, beyond epistemologicalissues that are also a great part of the problem according to [11], the technicalaspect of building such models is a huge obstacle, so an appropriate method-ology, proposed in [3], is to construct the model step by step, beginning withthe essential in a simple way. Even following this, it appears that the first stepis a great challenge in itself. We applied this methodology in consequence ; itappeared that the first aspect that was necessary to have a credible and workingmodel was the economic one, what brought us to build a simple economic modelto which we could add the other aspects later.
After a review of existing applications of Agent-based Modeling to urbanquestions, synthetized in [10, 1] , we saw that economic models of urban systemsnever were the purpose of pure economic research, since the economic field seemsto have difficulties to accept the synergetics approach to their problems as itis argued in [4], but that there already exists promising economic agent-basedmodels applied to geography. The SimPop model, developped for ten years bySanders & al. , presented in [14], seemed to be the nearest of what we wantedto do, but at a greater scale, staying however adaptable at our smaller scale.
56

1 Background economic model
1.1 Scales and dataThe real data we dispose of are of two types : macro yearly data such as unem-ployment rates at the scale of Gothenburg city or its part containing Långängen(Kvillbäcken), obtained from local statistic office, and micro data at the scaleof the building or the household, for example the rent values obtained fromthe companies renting the buildings (annual reports), or incomes of householdsand subjective considerations about the quality of life from the questionnairesrecently submitted.
That implies a double-scaled model : the evolution of agents and interactionsbetween them will take place at the smallest level, which will be the flat and thehousehold, with a small temporal scale as two weeks for example, whereas thedistrict will also be considered from a global point of view to integrate the macrodata, which will then be seen as exogeneous fixed time-series, on which the localbehaviours will have no influence, but which the integration of local values willtend to reproduce in the better way. This hypothesis seems to be reasonableif the people work mainly outside the district, so a local perturbation of theeconomic configuration will have few impact on the unemployment (for example,if everybody works at the local supermarket and it burns, this hypothesis won’tbe true, whereas if the main part works outside, the fire won’t have direct impacton unemployment - it will have of course on other aspect such as life quality).
1.2 AgentsFor the basic model, the agents are households and flats. A household h 2 H(t),with H(t) set of households at time t, is described by the number of people in it,the incomes status (with the convention that non-actives can’t have income andunemployed have null income), the level of competence (approximately level ofstudies) of each active in it, the years of experience in the current job for eachactive, a consumption rate c
h
which describes approximately the propensity toconsume and the occupied flat f 2 F(t) (F(t) set of flats), so he have for allt � 0,
H(t) ⇢ [|1; pmax
|]⇥[
kp
max
([0; Imax
]⇥ [0; smax
]⇥ [0; emax
])k⇥ [0; 1]⇥pF!N(F(t))
where pmax
is the maximal number of people in a household, Imax
(resp.smax
, emax
) the maximal income in SEK (resp. level of studies in years, resp.experience in current work) for actives, and pF!N a projection of F on N givenby an arbitrary numerotation.
For the set of flats, we considere more simply the number of rooms andthe rent, since the location is not of interest yet (the building fixes the rentper square meter, but it doesn’t matter if we take the rent as given), and also
57

the surface is in first approximation directly linearly linked with the number ofrooms. That means that for all t � 0, F(t) ⇢ [|1;R
max
|]⇥]0; rmax
], with Rmax
maximal number of rooms, rmax
maximal rent.
1.3 Evolution and interactionsThe economic situation of households evolves according to the global economicdata and the evolution of flat rents, whereas the evolution of flat rents is functionof themselves and the mean economic value of the district.
An iteration step of the model, corresponding to the small time step, isglobally the following :
• Update work situation ; some people loose their jobs, other find one, inorder to fit the current unemployment macro-value. Social help attributionand work experiences are also updated.
• Calculate economic balances for each houshold, taking into account allexpenditures (rent, taxes, consumption).
• Households in great difficulty leave the district (seen as too expensive forthem), whereas new inhabitants can come.
• Update rents for each building.
We describe the rules in details in the following.
1.3.1 Initialisation
The initialisation is done both at random and following external data. For ex-ample, the buildings follow their real GIS shapes. The exact way to initializewill not be described in detail here and can be seen in source code if needed.More explanations are given in the section concerning the integration of realdata. The important point is the one of the internal coherence of the implemen-tation, so the variables of households are initialized following the update rulesexplained in the following, in order to have no transitionnary state before the“real behaviour” of the model (that means that the model does directly what itshould do and that there is no bord-effects due to wrong initialisation, it is aswe followed a situation that already evolved before).
1.3.2 Update work situations
Employment For a household h, we can define by projection and countingthe number u
h
of people unemployed and the number ah
of actives in it, so thetotal number of unemployed is U(t) =
Ph2H(t) uh
and the unemployment rate
is u(t) =P
h2H(t) uhPh2H(t) ah
.
58
The global tendance of u should verify < u(tn
) >= un
, where un
is thefixed external time-serie. If N
u
(tn+1) is the number of people loosing their
jobs and Ne
(tn+1) the number of people finding a job, we have approxima-
tively Nu
(tn+1) � N
e
(tn+1) = A(t
n
) · (u(tn+1) � u(t
n
)) (taking the number ofactive A(t) as constant at this time scale, that suppose that emigration andimmigration rates are relatively small). New employed are directly linked toa global economic tendancy, that can be also represented by a time serie J
n
(which represents the quantity of job opportunities), so it’s possible to writeN
e
(tn+1) ⇠ N (J
n+1,�J
) (the variance is a fixed parameter), so we can thencalculate the number of people loosing their jobs also as a random function (�
u
parameter) :
Nu
(tn+1) ⇠ N (N (J
n+1,�J
) +A(tn
) · (un+1 � u(t
n
)),�u
)
That satisfies our constraint on the mean, we can see it by taking the meanon the above formula.1
A new employed person fixes his income such that Ii
(tn+1) = max(I
min
,N (mI
��I
+kI
·si
·�I
,�I
)) where Imin
is a minimal income, mI
a mean value, �I
a stan-dard deviation, k
I
a parameter representing the importance of studies in incomeattribution (if k
I
= 1, mean income will correspond to 1 year of studies. Sucha relation is of course reducing but we will take that in first approximation).
Experience After that, for each household h, if (ei
(t)) are the experiences and(I
i
(t)) the incomes, ⌧ the value of the time step, we set ei
(tn+1) =
I
i
(tn+1)=0 ·
ei
(tn
) + ⌧ and if the income has not already be defined through a new employ-ment, I
i
(tn+1) =
e
i
(tn+1) mod ⌧
prom
=0 ·(I(tn)+Istep
) where ⌧prom
is the durationto be promoted (necessary multiple of ⌧) and I
step
the corresponding incomevariation.
Social Help At each step, a given subset S(t) of H can benefit of social help.We define the primary reduced balance by b
r
(h) = (P
Ii
� r(f(h)))/p(h), withf the occupied flat, r its rent function and p the people number. Following asimple treshold criterium, the households in S are the S
max
elements in {h 2H|b
r
(h) < tS
} with the lowest br
.
1.3.3 Economic balances
Then the global economic balance is calculated for each household. It is defined,taking b
p
(h) = (1 � t � ch
· ph
)P
Ii
� r(f(h)), by b(h) = max(bp
(h),h2S ·
min(Imax
S
, bp
(h) + IS
)), with t global taxe rate (we take the taxe linear in afirst approximation ; a tresholded function could be more appropriate), c
h
the1
Note that to be correct, we should note Ne(tn+1) ⇠law N (Jn+1,�J ) and
Nu(tn+1) ⇠cond. to N
e
=ne
N (ne +A(tn) · (un+1 �u(tn)),�u), and the calculation of mean is
done conditionally : E(Nu(tn+1)) = E(E(Nu(tn+1)|Ne)) = E(Ne +A(tn) · (un+1 � u(tn))) =Jn+1 +A(tn) · (un+1 � u(tn)), what gives well < u(tn+1) >= un+1.
59

propension to consume (per person) of the household, ph
the number of people,IS
the max amount of social help and Imax
S
the maximal value of balance aftergetting social help
1.3.4 Population movements
According to the value of their economic balance, people can then leave thedistrict if it has become too expensive for them. That is modeled simply by atreshold rule again, households with b(h) < t
d
are deleted from H at this step.
Then can immigrate new inhabitants, of mean income the current meanincome, and with other parameters chosen following the current initialisationrule (can be at random or depending of u
n
for unemployment for example).Their number is limited by the number of free flats Card({f 2 F|8h 2 H, f(h) 6=f}) and a maximal number N
n
.
1.3.5 Update rents values
It seems logical to propose that rents are updated according to the previousvalues and mean of rents (to have an auto-regulation) and to the global “eco-nomic value” of the district, which we can see as a direct function of incomes.Furthermore, a strong legal disposition particular to Sweden fixes a tresholdthat rents can not exceed to regulate the rents (recently set more flexible as wesaw in Paper A). To follow these constraints, we propose a rent update for flati of the form
ri
(tn+1) ⇠law
N (min(rmax
· nr
(i) · s0, (1 + <b(h)>H(t)�b
ref
b
norm
) · ri
(tn
)+K
r
· (< ri
>F (t)� ri
(tn
))),�r
)
where �r
is the variance parameter, rmax
the maximal rent per square meterfixed by the law, n
r
(i) the bumber of rooms in flat, s0 the mean surface of aroom (the random fluctuations are translated through the randomness of rent),bref
and bnorm
two parameters quantifying the influence of economic status onrents, K
r
the auto-regulation coefficient.
The term of auto-regulation tends to create a uniform distribution of rentson long times, because it brings all rents to the mean value, so we will for longtime executions set the parameter K
r
to zero.
1.4 List of parametersThe right boundaries of descriptive variables for households and flats are pa-rameters in themselves, but since we need to take them arbitrary big to alwaysstay in the definition domain because they don’t appear in formula, they haveno influence on the model behaviour, so we don’t consider them.
Follows the list of essential parameters.
• ⌧ the time step corresponding to the real value of one iteration
60
• Jn
, un
the fixed time-series corresponding more to data than to parame-ters, and their corresponding sample time step ⌧
ext
• Imin
the minimal income, mI
the mean income (that we could also takeas a time serie later, to represent for example the external consequence ofinflation on incomes), �
I
the corresponding deviation, kI
the coefficientdetermining the importance of competence level
• ⌧prom
the experience time to get promoted, Istep
the corresponding incomeincreasing
• Smax
the maximal number of households that can get simulteanously so-cial help, t
S
the social help attribution treshold, IS
the maximal amountof money a household can get from social help, Imax
S
the maximal finalbalance for people getting social help
• rmax
, s0, bref , bnorm
, Kr
the rent parameters
• td
die treshold and Nn
maximal number of immigrants per step
2 Integration of multiple aspects
The next step of the model construction process was to consider the first layeras validated, and to add new layers of agents and variables in order to create aheterogeneous integrated model. The validation step was made through modelexploration and sensitivity analysis, that we describe further in the results sec-tion.
2.1 Choice of extending aspectsThe main objective was to diversify the model in the direction of socio-culturalaspect, since the purpose of ReBo is to highlight the importance of these mul-tiple aspects in the refurbishment process. The consideration of such problemsis quite poor in the history of agent-based modeling of urban systems. In [2],Benenson explores the residential dynamics following first only economic rules,then “sociological” rules, using a cultural code for agents and the cultural disso-nance, what is the distance between two codes, to define preferences of agents.It is like an evolved Schelling’s segregation model, and the model was able toreproduce segregation patterns. Unfortunately, coupling between economic andsociological aspects is not explored in his work. The concept of sociodynamicsintroduced by Weidlich in [17] would be a sort of meta-method for model-ing sociological dynamical phenomena. That way of modeling, deducing macroequations from local dynamics, was not really followed in the study of urban sys-tems. More recently, the use of agent-based modeling appeared as a good toolfor sociological studies, following other approaches of urbanism. For example,a operationnal framework based on multi-agent modeling with aim to explorepolicies against segregation was proposed by Feitosa & al. in [5] and explored
61

in [6]. The core of the agent-based model is economic, but socio-demographicaspects are integrated through a feedback of experimental measures in the evo-lution of the model. We would like to add in our model more concrete influenceof elements that could be considered as part of sociological aspects of the life ofthe district.
Within the ReBo project, recent work (forthcoming publications) was con-centrated on the inhabitants of the district. As we described briefly in introduc-tion, a questionnaire was submitted to all inhabitants of the district for whichour model was designed (Lågängen), with a quite good rate of answer (around75%). The questionnaire grid is available in appendice H. The purpose was toask about all aspects of daily life, in the district (for example satisfaction withneighbourhood, dangerous places, accessibility, etc.), in the flats (satisfactionwith rooms, storages, heating, bathroom, kitchen, etc.) and in buildings (com-mon parts, stairs). The satisfaction about these points was asked, and then thepoint of view on the need of the renewal of each point during a refurbishment.Currently, data are processed, by mappings, statistical analysis, etc. A file withall answers was created, what is particularly practical for us for teh integra-tion of questionnaire data in the model. For the choice of the aspects, fieldsconcerned by the questionnaire were especially looked at.
We also chose the aspects that would allow to make simulations on differentpossible refurbishment scenarii and therefore the new aspects are at the intersec-tion of these two characterictics. We used the preliminary work done in PaperB in order to understand what was really important. Finally, a discussion wasled with main researcher involved in ReBo to extract from the shortlist a smallnumber of aspects, which they judged as the closest to the spirit of the model.
The extending aspects are finally the following, they will be detailed in nextsubsection.
• Green space
• Public transportation
• Local services
• Energetic performances of buildings
• Living standard of flats
2.2 Description of the integrationGreen spaces These new agents don’t have direct influence on economic situ-ation but there exists a feedback in the other sense: people will use green spaceaccording to their available time, what is a consequence of job situation. Tosimplify, green space are ponctuals, so it is more the symbolic action of going toa given green space than doing some things in it that will be taken into account.
62
The set of green spaces at a time is a subset G ⇢ R2 ⇥ R ⇥ RH(t), we notefor g 2 G, g = ((x, y), q, IgH(t)). That set can discontinuously evolve in time,especially in the case of a refurbishment: quality of existing green spaces canbe improved or new one can be created. The first vectorial component is theposition in the district, known from the geographical position in the GIS data.The second is a real parameter describing a “quality” of the green space. It isquite abstract and is supposed to aggregate diverse characteristics as surface,subjective quality (is it amazing to be in ?), capacity in number of people,opportunities of activities offered by it, opportunities of social contacts. Thevalues are determined subjectively during the field survey we did on the area,and according to the mean results of the questionnaire concerning the feelingof people with the different spaces (section E.5 and E.6 of the questionnaire,see Appendice I). They are stored as attributes associated to the elements ofthe GIS file. The last component is a function associating to each householda coefficient of preference to this green space. In other word, for h 2 H(t),we can describe the preference of individuals by sorting the set of coefficients{IgH(t)(h)|g 2 G}. Concerning the time available for leisure, we will follow a sim-plification : at experience and level of studies both fixed, time is decreasing withincome ; at same level of studies, available time is decreasing with experience(more responsabilities) ; at same experience, time is decreasing with level ofstudies (idem) ; so we propose the function, with I (resp. S, E) incomes (resp.studies, experiences) T
h
(I, S,E) = 18·Card(I) ·
Pi2I
max(0, 8�KT
· i · s(i) · e(i)),where K
T
is a constant allowing the second member to be a time of the goodmagnitude (fixed by experience). The normalisation is done in order to obtaina coefficient between 0 and 1. The value of the constant in the affine functioncorrespond to reasonable remaining time in a day without incompressible tasks.We can also consider the distances from flats to green space in order to weigth byaccessibility : for f 2 F(t) and g 2 G(t), d(f, g) is the walking distance from f tog (calculated through shortest path routing in the pedestrian network, which isan euclidian network imported from GIS data), and by that defining an adimen-sioned coefficient of geographic accessibility d̃(f, g) = d(f,g)/max
f
02F,g
02Gd(f 0,g
0).With that, we can set the role of green spaces in the model by adding the outputrepresenting “satisfaction of people with green spaces”, with p
gs
2 [1; +1[,
Sgs
(t) =
�������
0
@Th
· 1
Card(G) ·X
g2Gd̃(f(h), g) · q(g) · IgH(t)(h)
1
A
h2H(t)
�������p
gs
Public transportation The public transportation network (tramway andbus lines) is modeled as an euclidian graph, which vertices (stations) are nec-essarly nodes of the pedestrian network. We can then define the satisfactionof people with public transportation by looking at the accessibility of stationsthrough the pedestrian network, and then through mean time to get to city cen-ter. However, this point stays as a theoical one and is not implemented because
63
the question of transportation infrastructure and gestion (change of bus lines,of timetables) is more the responsability of a company at the scale of the city(Västtraffik for Göteborg) and a local refurbishment of the district, led by localstakholders as the tenants of buildings, shouldn’t influence these.
Local services The services are local shops, community centers, culturalspaces, etc. We won’t distinguish the different types and consider that peo-ple always go to a certain number of services. The modeling is done exactly thesame way as for green spaces, with the difference that available time is not takeninto account as weight in the output function. So the set of services is S
e
⇢ R2⇥R⇥RH(t) , and we evaluate the global perceived quality of services the same way,
with ps
2 [1; +1[, Ss
(t) =
����⇣
1Card(S
e
) ·P
s2Se
d̃(f(h), s) · q(s) · IsH(t)(h)⌘
h2H(t)
����p
s
.
As for green spaces, that point is essential for the refurbishment simulations.
Energetic performances Each building has its own energetic performances,depending on isolation, heating materials, etc. Increasing in insulation capacityis for example one of targeted point during refurbishment processes (as it is ex-plained in [16], “environmental goals” are systematically purchased in “decision-making process during preliminary investigation phase”). Therefore we extendthe description of flats by setting a function "(t) : F(t) ! R, and we change theeconomic balance by adding the price of energy consumption : the new balanceis b̃(h) = b(h) � "(t)[f(h)] · ⇡
e
where ⇡e
is a constant representing the price ofenergy per time unit.
Living standard Living standard will also be added as a characteristic offlats, and will influence the initial rent (and not directly the evolution of rents ;this effect is indirectly expressed through the feedback of the incomes on rent).We will represent it as a function �(t) : F(t) ! R+ and the new initialisa-tion function for rents is, following notation of previous section, with r̄ initialmean rent parameter, �
ref
such that maximal variations of the mean are of thesame magnitude as the expected standard deviation and �0
r
a negligible valueregarding �
r
, ri
(t0) ⇠law
N (min(rmax
·nr
(i) · s0, r̄ ·nr
(i) · s0 · (1+ �(0)[fi
]�
ref
),�0r
) .
3 Concrete results : refurbishment simulation
3.1 Implementation and calibration3.1.1 Implementation issues
The model was implemented with the NetLogo software ([18]), which is designedfor agent-based modeling. Source code is available in appendice F. Automatic
64

calibration process, setup procedures and different ways to run simulations (withor without refurbishment e. g., on different periods of time, etc... ), as we can seeon the interface of the model shown on figure 1. The visual representation is initself not necessary for the model to run but help understanding the mechanisms.Graph are keypoints because they show some of the outputs. Other outputsare written in file, such as mean-square errors on time-series, for treatment incalculation softwares such as Scilab.
The formal description we did of agents and evolution equations was donewith aim to limit all possible edge effect of the implementation. However, smallpoints can become problematic if the user is not aware of them. To give anexample, the handle of pedestrian network is not so simple. The shapefile ofpaths is imported through the GIS-extension of NetLogo, but the network com-posed of agents (nodes and links) has to be created in order to manage shortestpath calculations. A quick but not deterministic clustering algorithm is used forthat. The algorithm finishes with a connex network not far from the original ifinitial agents are ditributed under certain conditions, i. e. extremities of GISpaths that are supposed to be linked are close in space (distance under a certainthreshold passed as parameter for the algorithm).
3.1.2 Calibration process
The aim of the model was to make predictions based on real data, so after havingreduced the number of unknown (mostly because abstracts) parameters in themodel, we designed a particular calibration process, in order to automaticallyfind one of the best set of values for the parameters that makes the model“fit the reality” (according to some objective functions). The technical detailsof the elaboration process (which includes exploration and experiments) aredevelopped in Appendice C, and we will just sum up here globally the methodused.
The calibration has to be done on a small number of parameters. Indeed,with K parameters (p1, ... , p
K
) 2 [pmin
1 , pmax
1 ]⇥...⇥[pmin
K
, pmax
K
] with precisionsteps (pstep1 , ... , pstep
K
), it is obvious that with M = max1iK
(pmax
i
�p
min
i
p
step
i
), cal-ibration time is a O(MK) (we have supposed number of replications as constantand maximal replication time fixed). That exponential becomes quickly impos-sible to manage with all possible needs. Therefore we follow the prerogativeexplained in [9] of finding as much proxies as possible for the parameters inorder to decrease signifanctly the number of abstract parameters. Concretely,we will do that on not more than three parameters.
The method is single-objective based because the use of the gradient methodthrough the simplex algorithm is efficient to minimize the objective function.
65
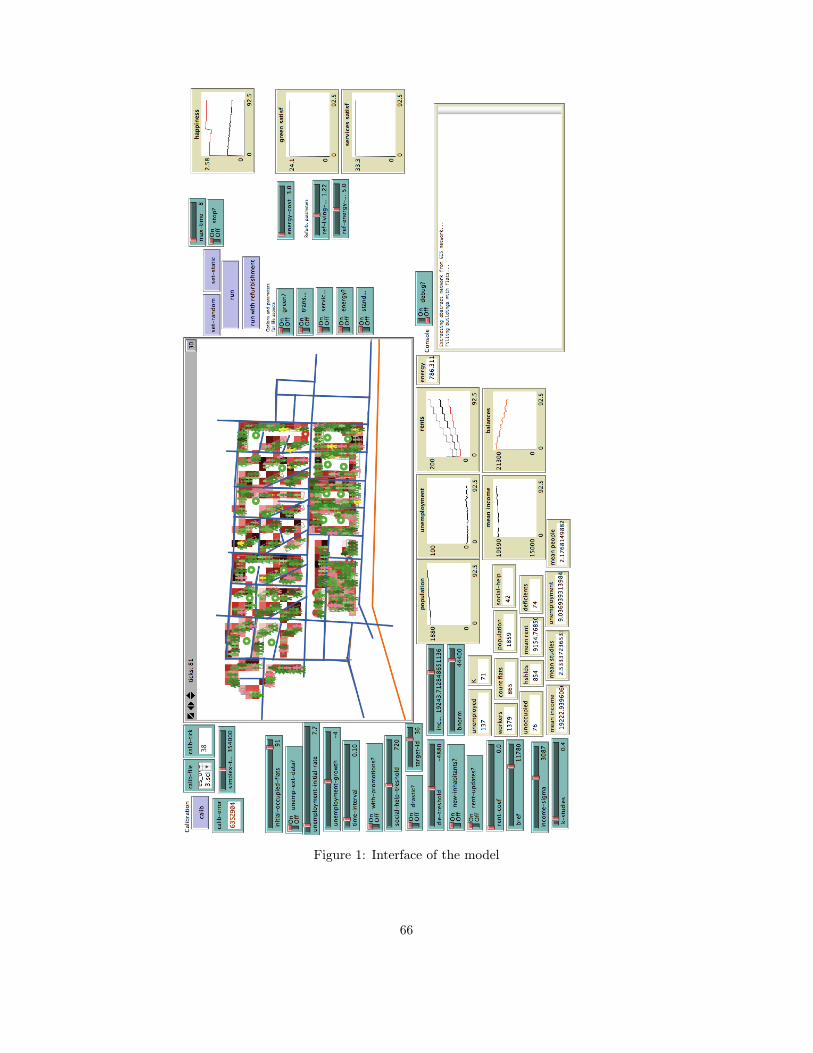
Figure 1: Interface of the model
66
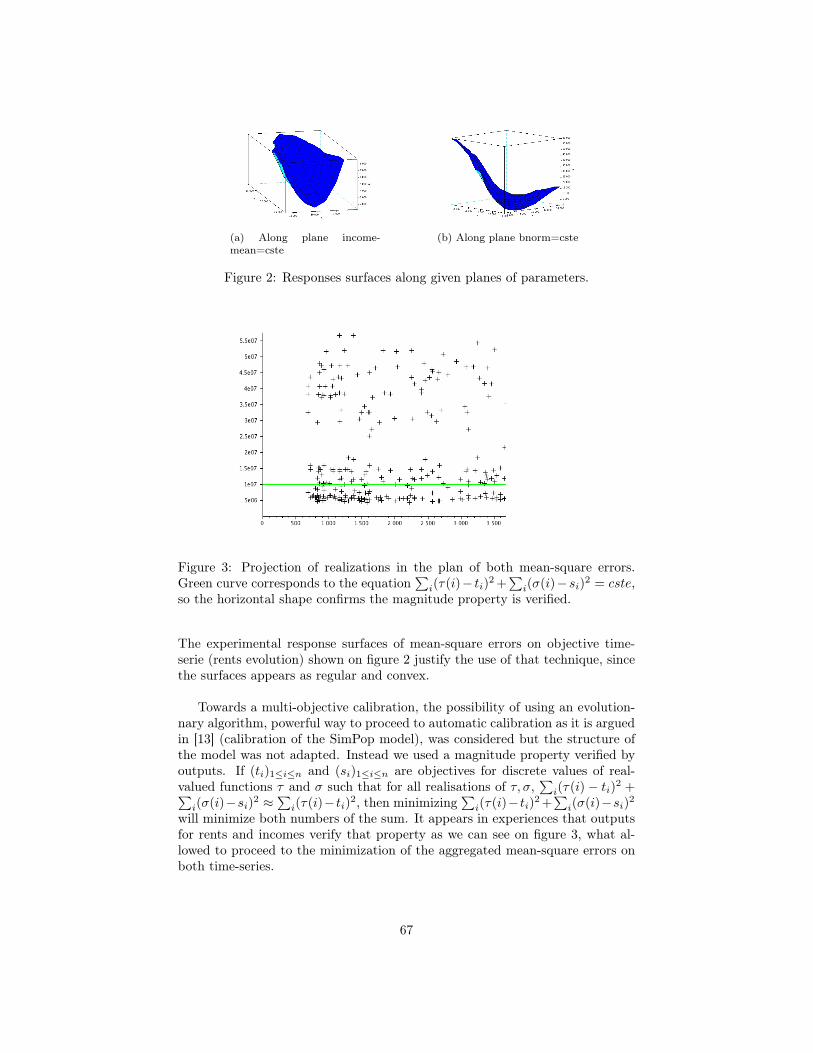
(a) Along plane income-
mean=cste
(b) Along plane bnorm=cste
Figure 2: Responses surfaces along given planes of parameters.
Figure 3: Projection of realizations in the plan of both mean-square errors.Green curve corresponds to the equation
Pi
(⌧(i)� ti
)2+P
i
(�(i)�si
)2 = cste,so the horizontal shape confirms the magnitude property is verified.
The experimental response surfaces of mean-square errors on objective time-serie (rents evolution) shown on figure 2 justify the use of that technique, sincethe surfaces appears as regular and convex.
Towards a multi-objective calibration, the possibility of using an evolution-nary algorithm, powerful way to proceed to automatic calibration as it is arguedin [13] (calibration of the SimPop model), was considered but the structure ofthe model was not adapted. Instead we used a magnitude property verified byoutputs. If (t
i
)1in
and (si
)1in
are objectives for discrete values of real-valued functions ⌧ and � such that for all realisations of ⌧,�,
Pi
(⌧(i)� ti
)2 +Pi
(�(i)�si
)2 ⇡ Pi
(⌧(i)� ti
)2, then minimizingP
i
(⌧(i)� ti
)2+P
i
(�(i)�si
)2
will minimize both numbers of the sum. It appears in experiences that outputsfor rents and incomes verify that property as we can see on figure 3, what al-lowed to proceed to the minimization of the aggregated mean-square errors onboth time-series.
67

3.2 Case study : district Långängen3.2.1 Data collection and integration
A consequent part of the parameters are representing reals variables, so theircorrect value has to be extracted from real data. Some are calculated once andfor all and fixed in the code setup procedure, but other are loaded from externalfiles during the setup, in order to bring more flexibility to the use of the model.All real data are sumed up in table 1.
Type of data The data are of four types :
• “Calibration” : these are the two time-series on which the mean-squareerror with the output of the model are used as aggregated objective forthe calibration process.
• “Parameter” : can be a time-serie or constant parameter, these are param-eter representing real variables.
• “Objective” : these data are not used yet in the current version of themodel. They are supposed to be objective values for output correspondingto additional aspects, in order to proceed to additional calibration.
• “Structural data” : these are GIS data, allowing spatial dimension of themodel. For the basic model they are not essential, since locations of flatdon’t have influence on evolutions and abstract buildings could be enoughin the implementation. However, they are key features in the extendedmodel because outputs are calculated taking into account walking distancefrom flats to services, green space and transportation stations.
Origin of data and specificities in processing The data have multipleorigin. The Statistic service of Göteborg city publishes every year reports withdetailed values of economic, demographic, sociological, etc. variables ([8]). Weuse here the values of unemployment rate, taken as macro variable as explainedin the formal description before. We also use the mean income and the variancein incomes (approximated through the given distributions of population) to cre-ate a virtual gaussian distribution of incomes and then attribute initial incomesto workers : response on economic status in the questionnaire are scaled on theleft part of the distribution (hypothesis of a “modest” district), what allows togive an income randomly around the expected one.
Concerning the rents of flats, a data collection work had to be done be-cause there exists no compiled database including these values. Therefore, westarted with the assumption to take values for buildings owned by the municipalcompany Familje Bostader as proxy for all rents in the district, since they ownapproximatively 50% of the district and their data is easely available (using [7]).
68

Ori
gin
of
inp
ut
da
ta f
or
Ag
en
t-b
as
ed
mo
de
l fo
r L
an
gä
ng
en
Da
taTy
pe
Un
itO
rig
inIn
pu
t p
roc
ed
ure
Me
an
re
nt
Ca
libra
tio
nK
r/m
^2
/mo
nth
Fa
milj
e B
osta
de
r a
nn
ua
l re
po
rts
Me
an
in
co
me
Ca
libra
tio
nK
r/m
on
thS
tatistiks G
öte
bo
rg/Q
ue
stio
nn
air
e
Un
em
plo
ym
en
t ra
teP
ara
me
ter
%S
tatistiks G
öte
bo
rg
Pro
xy o
f liv
ing
-sta
nd
ard
Pa
ram
ete
r-
Qu
estio
nn
air
eV
ar
sa
tisfa
ctio
n w
ith
sta
nd
ard
GIS
Bu
ildin
g L
aye
rS
tru
ctu
ral d
ata
-D
raw
n G
IS d
ata
Str
uctu
ral d
ata
-D
raw
n G
IS d
ata
/fie
ld s
urv
ey
GIS
se
rvic
es la
ye
rS
tru
ctu
ral d
ata
-D
raw
n G
IS d
ata
/fie
ld s
urv
ey
GIS
pu
blic
tra
nsp
ort
atio
n la
ye
rS
tru
ctu
ral d
ata
-D
raw
n G
IS d
ata
Ind
ivid
ua
l sa
tisfa
ctio
n w
ith
gre
en
sp
ace
sO
bje
ctive
-Q
ue
stio
nn
air
e
Ind
ivid
ua
l sa
tisfa
ctio
n w
ith
se
rvic
es
Ob
jective
-Q
ue
stio
nn
air
eid
em
Ind
ivid
ua
l sa
tisfa
ctio
n w
ith
liv
ing
-sta
nd
ard
in
fla
tsO
bje
ctive
-Q
ue
stio
nn
air
eid
em
En
erg
y p
erf
orm
an
ce
s o
f b
uild
ing
sP
ara
me
ter
kW
h/m
^2
/ye
ar
En
erg
y d
ekla
ratio
nn
er
Ann
ual m
ea
n f
or
Fa
milj
eb
osta
de
r b
uild
ing
s t
ake
n a
s p
roxy f
or
all
bu
ildin
gs
Sta
tistical d
istr
ibu
tio
n e
va
lua
ted f
rom
m
ea
n/v
arian
ce f
rom
Sta
tistik G
öte
bo
rgs,
ind
ivid
ual lo
ca
liza
tion
in d
istr
ib e
va
lua
ted
fr
om
eco
no
mic
va
rs in
Qu
estio
nn
air
e
Glo
bal u
ne
mplo
ym
ent,
no
lo
cal d
ata
fo
un
d
GIS
« g
ree
n s
pa
ce
s »
la
ye
r
Co
mb
inatio
n o
f varia
ble
s f
rom
Q
ue
stio
nn
air
e (
acce
ssib
ility
, sa
tisfa
ctio
n)
Fo
r b
uild
ing
s w
ith
ou
t da
ta,
extr
apo
lation
fr
om
sta
tistica
l d
istr
ibu
tio
n
Table 1: Origin and processing methods of the real data.
69
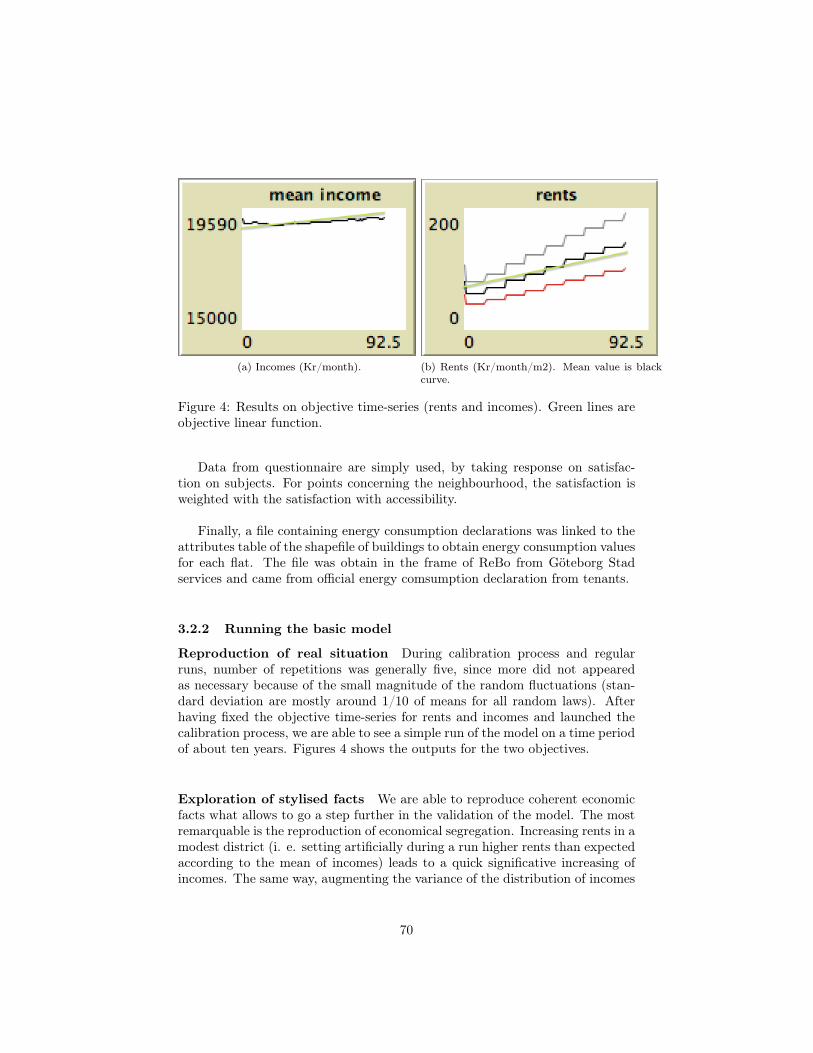
(a) Incomes (Kr/month). (b) Rents (Kr/month/m2). Mean value is black
curve.
Figure 4: Results on objective time-series (rents and incomes). Green lines areobjective linear function.
Data from questionnaire are simply used, by taking response on satisfac-tion on subjects. For points concerning the neighbourhood, the satisfaction isweighted with the satisfaction with accessibility.
Finally, a file containing energy consumption declarations was linked to theattributes table of the shapefile of buildings to obtain energy consumption valuesfor each flat. The file was obtain in the frame of ReBo from Göteborg Stadservices and came from official energy comsumption declaration from tenants.
3.2.2 Running the basic model
Reproduction of real situation During calibration process and regularruns, number of repetitions was generally five, since more did not appearedas necessary because of the small magnitude of the random fluctuations (stan-dard deviation are mostly around 1/10 of means for all random laws). Afterhaving fixed the objective time-series for rents and incomes and launched thecalibration process, we are able to see a simple run of the model on a time periodof about ten years. Figures 4 shows the outputs for the two objectives.
Exploration of stylised facts We are able to reproduce coherent economicfacts what allows to go a step further in the validation of the model. The mostremarquable is the reproduction of economical segregation. Increasing rents in amodest district (i. e. setting artificially during a run higher rents than expectedaccording to the mean of incomes) leads to a quick significative increasing ofincomes. The same way, augmenting the variance of the distribution of incomes
70
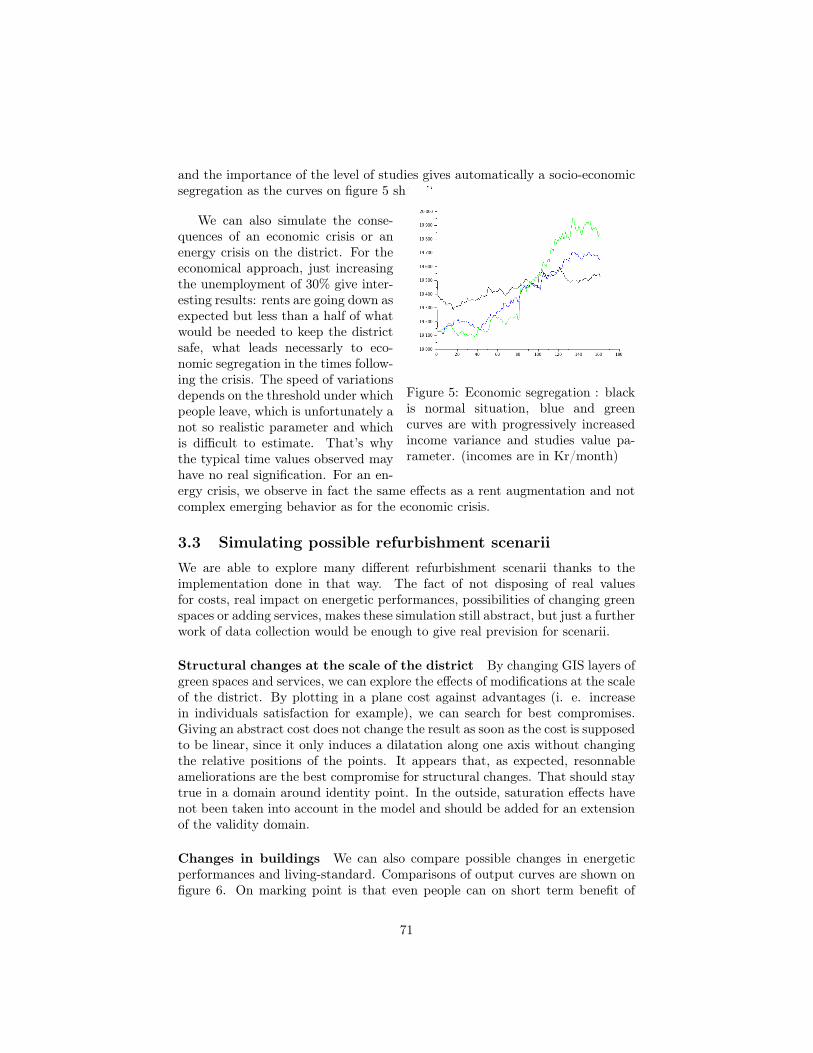
and the importance of the level of studies gives automatically a socio-economicsegregation as the curves on figure 5 show it.
Figure 5: Economic segregation : blackis normal situation, blue and greencurves are with progressively increasedincome variance and studies value pa-rameter. (incomes are in Kr/month)
We can also simulate the conse-quences of an economic crisis or anenergy crisis on the district. For theeconomical approach, just increasingthe unemployment of 30% give inter-esting results: rents are going down asexpected but less than a half of whatwould be needed to keep the districtsafe, what leads necessarly to eco-nomic segregation in the times follow-ing the crisis. The speed of variationsdepends on the threshold under whichpeople leave, which is unfortunately anot so realistic parameter and whichis difficult to estimate. That’s whythe typical time values observed mayhave no real signification. For an en-ergy crisis, we observe in fact the same effects as a rent augmentation and notcomplex emerging behavior as for the economic crisis.
3.3 Simulating possible refurbishment scenariiWe are able to explore many different refurbishment scenarii thanks to theimplementation done in that way. The fact of not disposing of real valuesfor costs, real impact on energetic performances, possibilities of changing greenspaces or adding services, makes these simulation still abstract, but just a furtherwork of data collection would be enough to give real prevision for scenarii.
Structural changes at the scale of the district By changing GIS layers ofgreen spaces and services, we can explore the effects of modifications at the scaleof the district. By plotting in a plane cost against advantages (i. e. increasein individuals satisfaction for example), we can search for best compromises.Giving an abstract cost does not change the result as soon as the cost is supposedto be linear, since it only induces a dilatation along one axis without changingthe relative positions of the points. It appears that, as expected, resonnableameliorations are the best compromise for structural changes. That should staytrue in a domain around identity point. In the outside, saturation effects havenot been taken into account in the model and should be added for an extensionof the validity domain.
Changes in buildings We can also compare possible changes in energeticperformances and living-standard. Comparisons of output curves are shown onfigure 6. On marking point is that even people can on short term benefit of
71

a better insulation thanks to less energy consumption, on the long term thefinal economic balances are quite close, supposing an augmentation of rents.This emerging effect of rent augmentation can be understandable, since housingcompanies will consider dwelling as of better quality and therefore (inconsciouslymaybe) impact it on rent.
Problem of outputs Our definition of individual satisfaction may not bescalable for direct comparison with real values and representation of the proxyof satisfactions by the output of the model. Further exploration would be neededto confirm and strengthen the sense of these outputs.
4 Discussion and perspectives
4.1 Obtained resultsConcrete results Although the robustness of the model has not been provedand that sensitivity tests and explorations are still needed for the validation of anarbitral framework, we managed to obtain an self-consistent model. The precisecalibration process gives accurate results on concerned outputs. Furthermore,the integration of heterogeneous aspects led to the possibility of testing scenariifor refurbishment. A lack of reference values let this point still abstract but itshows that evidence-based descision making thanks to simulations is possible.
Consolidation of the original framework ? The way our work consolidatethe original philosophy of ReBo is not really of pragmatic nature but more anepistemological question. Of course the possibilities offered by simulations canreinforce the project but that does not justify the global approach. What does isthe fact of considering that our way of modeling was an analogy of the way ReBoframework was constructed. Through that idea, we can argue that the extensionof the basic economic model brings more robustness, and therefore comes theneed of horizontal integration. For the vertical integration, the structure of ourmodel justifies it, since it was necessary to build a double-scale integration ofdata. For these reasons, we can argue that this work is equivalent to testingand approving the approach of the ReBo framework.
4.2 Limitations of agent-based modelingWe are not sure that horizontal integration of the model could go further. Firstfor technical reasons because quantity of implementation is directly linked withquantity of side effect and it is possible sometimes that over a certain level ofcomplexity, side effects becomes of greater magnitude that white noise of randomfunctions, what gives an unvalidated model. The difficulty of formalizing somesocial aspects of urban life can also remind there are still limitations in socialscience simulations by agent-based modeling.
72
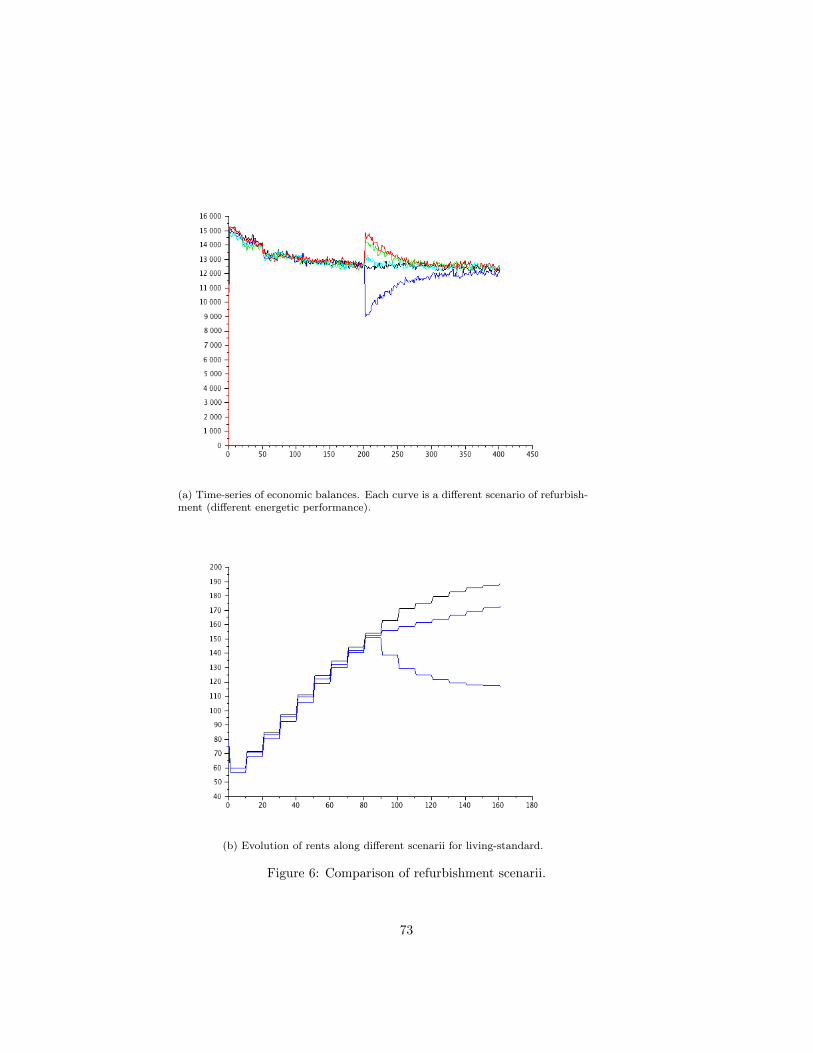
(a) Time-series of economic balances. Each curve is a different scenario of refurbish-
ment (different energetic performance).
(b) Evolution of rents along different scenarii for living-standard.
Figure 6: Comparison of refurbishment scenarii.
73

Concerning the robustness of the model, as we already noted, further studiesof sensibility are needed because that is a weakness of agent-based modeling. Itis possible that an arbitrary small change in a parameter that is not consideredin the calibration process because it is suppose to have a real proxy changes allbehaviour and outputs of the model. Because of the high number of parameters,study of the response surfaces were done only for ones judged as most influent,but it there is still the possibility that chaotic behavior exists in some place ofthe space that has not been explored yet.
4.3 Perspectives of developmentsNext steps in the project can be directed towards the application to other con-crete case. The study of the generalisation to all People’s Home, and thenMillion Homes projects should be the first step. The final point would to geta generic framework working on all possibles cases, with an easy integration ofdata. We also need to deeper validate and explore the model, as we alreadyclaim.
Conclusion
From the theorical point of view, we managed to propose a self-consistent agent-based model for the simulation of the life of a district. The integration ofheterogeneous aspects and the construction of output functions was possiblethanks to the work done in Paper B, whereas the understanding of how torepresent refurbishment process in that particular case and the fact that themodel is well adapted to the real context were made possible through the reviewof Paper A. We must insist that we managed to design a special calibrationprocess which could be the object of further work, especially in a more accurateformalisation of the magnitude properties for a greater number of objectives.Finally, we can point out that we partially answered to the research question,since the process of agent-based modeling and the obtain results can be seen asa justification of ReBo proposals.
? ??
74

References
[1] Michael Batty, Andrew T. Crooks, Linda M. See, and Alison J. Heppenstall.Perspectives on agent-based models and geographical systems. In Alison J.Heppenstall, Andrew T. Crooks, Linda M. See, and Michael Batty, edi-tors, Agent-Based Models of Geographical Systems, pages 1–15. SpringerNetherlands, 2012.
[2] Itzhak Benenson. Multi-agent simulations of residential dynamics in thecity. Computers, Environment and Urban Systems, 22(1):25–42, 1998.
[3] R. Duboz. Intégration de modèles hétérogènes pour la modélisation et lasimulation de systèmes complexes. PhD thesis, Laboratoire d’Informatiquedu Littoral — UPRES JE-2335, 2004.
[4] J Doyne Farmer and Duncan Foley. The economy needs agent-based mod-elling. Nature, 460(7256):685–686, 2009.
[5] Flávia F Feitosa, Quang Bao Le, and Paul LG Vlek. Multi-agent simulatorfor urban segregation (masus): A tool to explore alternatives for promotinginclusive cities. Computers, Environment and Urban Systems, 35(2):104–115, 2011.
[6] Flávia F Feitosa, Quang Bao Le, Paul LG Vlek, Antônio Miguel V Mon-teiro, Roberta Rosemback, et al. Countering urban segregation in braziliancities: policy-oriented explorations using agent-based simulation. Environ-ment and Planning-Part B, 39(6):1131, 2012.
[7] Familje Bostader Göteborg. Annual reports. available onhttp://www.familjebostader.se/en/Om-foretaget/Arsredovisning/, 1999- 2012.
[8] Statistics Göteborg. Statistisk årsbok göteborg. Stadskansliet, Göteborg,2005 - 2012.
[9] Yaron Hollander and Ronghui Liu. The principles of calibrating trafficmicrosimulation models. Transportation, 35(3):347–362, 2008.
[10] RobinB. Matthews, NigelG. Gilbert, Alan Roach, J.Gary Polhill, andNickM. Gotts. Agent-based land-use models: a review of applications.Landscape Ecology, 22(10):1447–1459, 2007.
[11] Fabien Michel. Formalisme, outils et éléments méthodologiques pour la mod-élisation et la simulation multi-agents. PhD thesis, Université des scienceset techniques du Languedoc, Montpellier, 2004.
[12] J. Raimbault. Application of evidence-based methods to the test of a multi-value evaluation framework for sustainable renovation. Research internshipproject description, April 2013.
75

[13] Romain Reuillon, Sebastien Rey, Clara Schmitt, Mathieu Leclaire, DemisePumain, et al. Algorithmes évolutionnaires sur grille de calcul pour lecalibrage de modéles géographiques. In journées scientifiques mésocentreset France Grilles 2012, 2012.
[14] Lena Sanders, Denise Pumain, Hélene Mathian, France Guérin-Pace, andStephane Bura. Simpop: a multiagent system for the study of urbanism.Environment and Planning B, 24:287–306, 1997.
[15] Liane Thuvander, Paula Femenias, and Pär Meiling. Strategies for anintegrated sustainable renovation process: Focus on the swedish housingstock ‘people’s home’. In Proceedings from the International SustainableBuilding Conference SB11 in Helsinki 18-21October 2011, 2011.
[16] Liane Thuvander, Paula Femenías, Kristina Mjörnell, and Pär Meiling.Unveiling the process of sustainable renovation. Sustainability, 4(6):1188–1213, 2012.
[17] Wolfgang Weidlich. Sociodynamics applied to the evolution of urban andregional structures. Discrete Dynamics in Nature and Society, 1(2):85–98,1997.
[18] U. Wilensky. Netlogo. Center for Connected Learning and Computer-BasedModeling, Northwestern University, Evanston, IL., 1999.
76

Paper D
Local and global design of a new district
through evolutionary algorithm
Abstract
The study of refurbishment of old building stocks through Agent-basedModeling in Paper C had voluntary occulted the background problem ofa parallel building of a totally new district (Project Homes for Tomorrow,reviewed in [15]) which would have strong influence on the existing one.Although the design has already been done and the construction processis well advanced, we propose here to follow the thought experience ofproposing a possible design from scratch through computational methodsfor this new district. We explore first the question of the role of computa-tional design in architecture and the one of multi-objective optimisationin urban planning, and how it could be interesting to link them in order toconstruct an hybrid approach. We finally describe a simplified algorithmthat we apply to our concrete problem to propose automatic design.
77

IntroductionIn the case of a global project, the process of urban planning consists in ex-ploring the space of possibilities under certain constraints and finding the bestcompromise in all evaluated solutions. It is the analog for the artistic creationduring architectural design as we will see further. Going back to the problemof modeling the district, we can suppose that the new project has not beenplanned yet and propose an algorithm for optimal planning. The idea is to offerthe possibility of a coupling with the agent-based model of Paper C. It couldeven be then possible to calibrate the algorithm to fit the real planning of thenew district. We will in the following consider the question of computationnalmethods and propose a formal evolutionnary algorithm for automatic planningand design.
1 Overall approach of the problem
1.1 From Artificial Art to Computational Design, appli-cations in Architecture
The use of softwares and computers to produce Art, what we can call artificialart, has recently developped as a branch of practical applications of computa-tional algorithms.
The designer Casey Reas is one of the pioneers in that field, and is stillvery active today. He formulates his vision on the use of software in design in[13], that can be considered as his manifest. As an interpretation of his ideas,we propose that imagination can be seen as a powerful method of exploration ofthe space of possibilities (which we paradoxaly present as the search space of themind, but which is not rigourously defined in that case), so it appeared quicklyas an application of artificial intelligence to simulate artifacts of the imagination,with its own advantages and issues. Typically, by using algorithms to createpieces of art or to design shapes, we just suggest new ideas to help the mind tocreate, but the process is still totally guided by the artist. The software is thenonly a new medium of expression and exploration of artistic possibilities.
Reas has explored figurative and abstract software painting, but also appli-cations in design and architecture. One example of such work in architecturaldesign can be seen in figure 1 .
The most recent researches in artificial art go towards use of artificial ants. In[12], the authors, that are specialists of solving complex optimisation problemsusing systems of artificial ants, present how these “ants” can be used to producepaintings or music. In a forthcoming work (presented at [11]), Monmarché
proposes some applications to the design of real forms in three dimensions, firstfor everyday objects, but also for sculptures. Following local rules (as for the 2Dsystems) and global constraints (it is one of the limitations of the method that
78

Figure 1: Software for architectural design. Project Tour Signal, La Defense,France. (source [13])
79
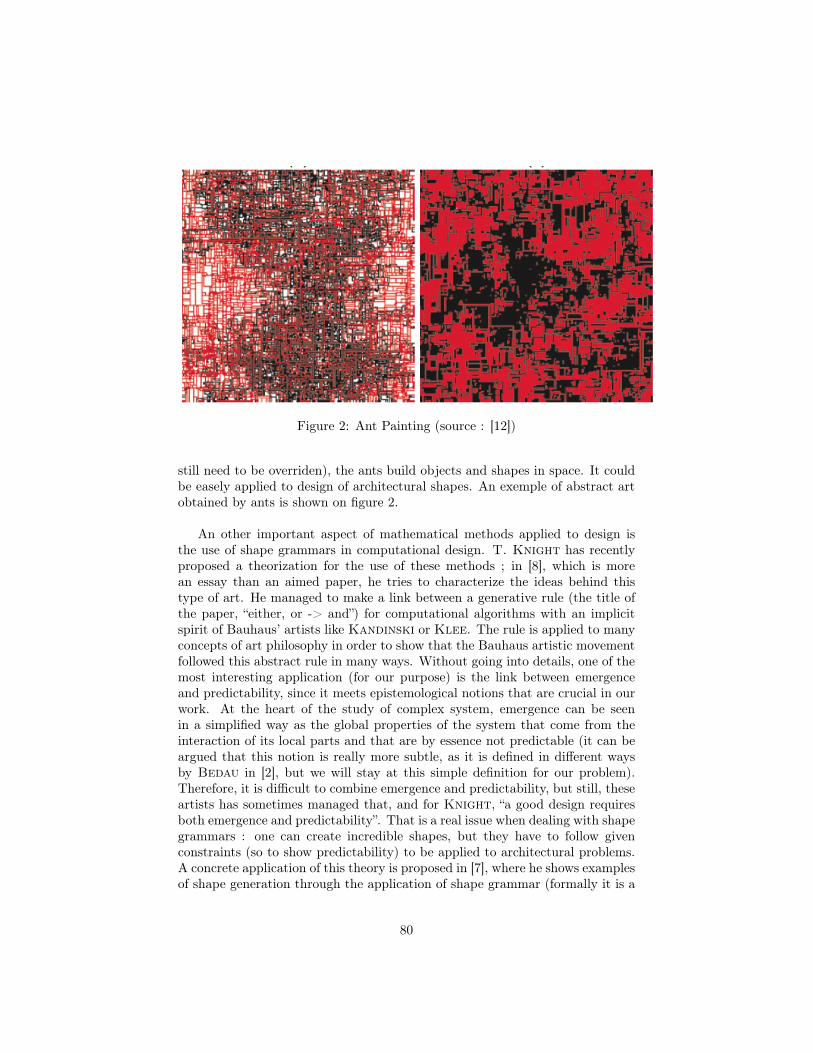
Figure 2: Ant Painting (source : [12])
still need to be overriden), the ants build objects and shapes in space. It couldbe easely applied to design of architectural shapes. An exemple of abstract artobtained by ants is shown on figure 2.
An other important aspect of mathematical methods applied to design isthe use of shape grammars in computational design. T. Knight has recentlyproposed a theorization for the use of these methods ; in [8], which is morean essay than an aimed paper, he tries to characterize the ideas behind thistype of art. He managed to make a link between a generative rule (the title ofthe paper, “either, or -> and”) for computational algorithms with an implicitspirit of Bauhaus’ artists like Kandinski or Klee. The rule is applied to manyconcepts of art philosophy in order to show that the Bauhaus artistic movementfollowed this abstract rule in many ways. Without going into details, one of themost interesting application (for our purpose) is the link between emergenceand predictability, since it meets epistemological notions that are crucial in ourwork. At the heart of the study of complex system, emergence can be seenin a simplified way as the global properties of the system that come from theinteraction of its local parts and that are by essence not predictable (it can beargued that this notion is really more subtle, as it is defined in different waysby Bedau in [2], but we will stay at this simple definition for our problem).Therefore, it is difficult to combine emergence and predictability, but still, theseartists has sometimes managed that, and for Knight, “a good design requiresboth emergence and predictability”. That is a real issue when dealing with shapegrammars : one can create incredible shapes, but they have to follow givenconstraints (so to show predictability) to be applied to architectural problems.A concrete application of this theory is proposed in [7], where he shows examplesof shape generation through the application of shape grammar (formally it is a
80
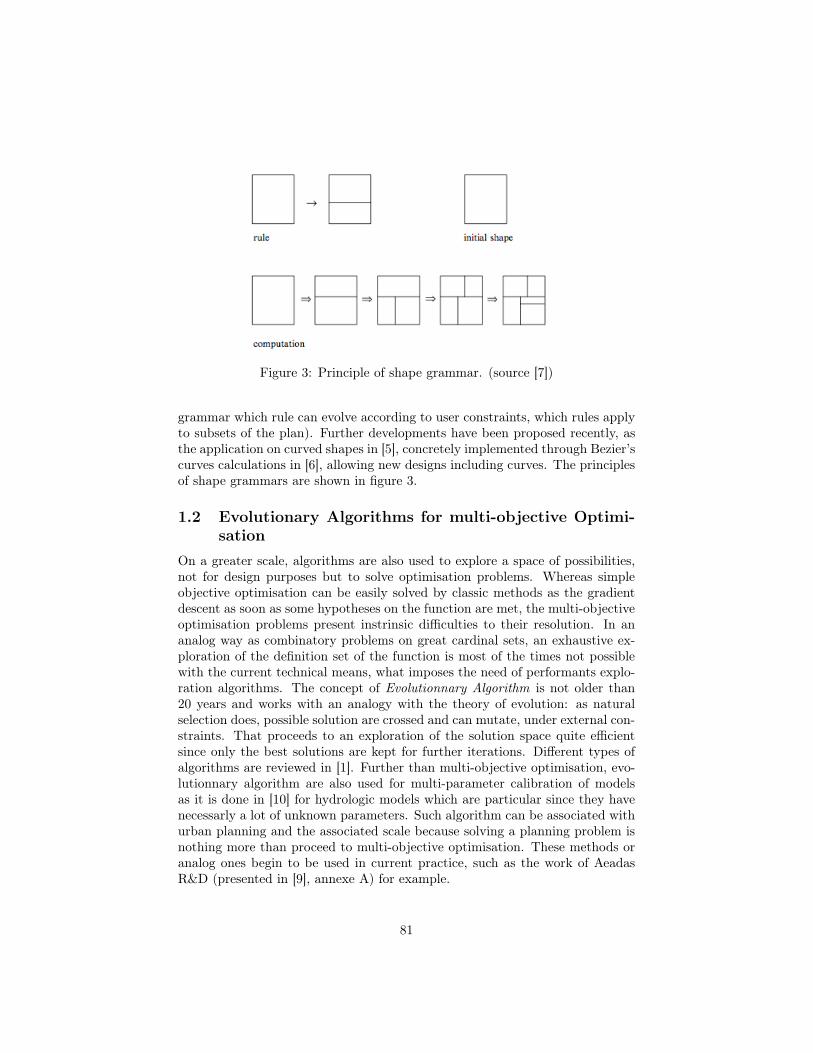
Figure 3: Principle of shape grammar. (source [7])
grammar which rule can evolve according to user constraints, which rules applyto subsets of the plan). Further developments have been proposed recently, asthe application on curved shapes in [5], concretely implemented through Bezier’scurves calculations in [6], allowing new designs including curves. The principlesof shape grammars are shown in figure 3.
1.2 Evolutionary Algorithms for multi-objective Optimi-sation
On a greater scale, algorithms are also used to explore a space of possibilities,not for design purposes but to solve optimisation problems. Whereas simpleobjective optimisation can be easily solved by classic methods as the gradientdescent as soon as some hypotheses on the function are met, the multi-objectiveoptimisation problems present instrinsic difficulties to their resolution. In ananalog way as combinatory problems on great cardinal sets, an exhaustive ex-ploration of the definition set of the function is most of the times not possiblewith the current technical means, what imposes the need of performants explo-ration algorithms. The concept of Evolutionnary Algorithm is not older than20 years and works with an analogy with the theory of evolution: as naturalselection does, possible solution are crossed and can mutate, under external con-straints. That proceeds to an exploration of the solution space quite efficientsince only the best solutions are kept for further iterations. Different types ofalgorithms are reviewed in [1]. Further than multi-objective optimisation, evo-lutionnary algorithm are also used for multi-parameter calibration of modelsas it is done in [10] for hydrologic models which are particular since they havenecessarly a lot of unknown parameters. Such algorithm can be associated withurban planning and the associated scale because solving a planning problem isnothing more than proceed to multi-objective optimisation. These methods oranalog ones begin to be used in current practice, such as the work of AeadasR&D (presented in [9], annexe A) for example.
81
1.3 Mixing the two approaches : heterogeneous modelingand design through scale integration
We propose here an approach to the problem of multi-scale urban planning anddesign that could be considered as a mix of the two techniques described in thepreceding sections. Indeed, it appears that they may be not so far, and that thegap would just be a question of scale. To go further, we can try to make somehypotheses that of course would need deeper exploration and that offer strongpotential for future works : maybe is the edge between architecture and urbandesign not so well defined, and just a change of point of view or scale can breakthis edge. Some evidences, as the existence of an “architectural urbanity” thatwe have presented in Paper B, or the parallel that we have just done betweencomputational methods at different scales, can reinforce that vision.
Therefore we will try here to explore the possibilities offered by that pointof view by building a scale-integrated model for automatic design : in a reallysimple way (we don’t try to elaborate complicated model, the aim is more abeginning of exploration of the fundamental ideas), we will couple a macro-scaleevolutionnary algorithm for the design of landuses and transportation networkwith a local shape-generation algorithm for the buildings. The main idea thatwe use for scale coupling will be more indirect feedback through sub-systemsinteractions inside the global system, as it was proposed for multi-scale cellularautomata coupling in [4], than direct feedback on the variable and parametersat both scale as it is done between macro differential equation and micro agent-based model for evolution of individuals in the work of Duboz on marine ecologyin his thesis ([3]).
2 Evolutionary algorithm for automatic designand planning
2.1 Formal description of the algorithmThe algorithm considers configurations and produce new ones from already ex-plored configuration by crossing configurations and doing mutations. Followingthe idea of [14] in which the population is constinuously updated, we keep in ahashtable the description of the known configurations and their correspondingevaluation values.
2.1.1 Configurations
The space is discretised in a set of patches P = {p0, ..., pn}. We will distinguishthe description of landuses at the macro level, that, given a number of distinctslanduses N , can be translated through a function L : P ! [|1;N |]n, and themicro description of the shapes of the buildings, that would be for a configurationa family of continuous parts of surfaces in space (Si)1iK . We also suppose
82
the existence of a transportation network, formalised as an euclidian graphG = (V,E) with V finite subset of R2.
2.1.2 Optimisation objectives
The objective will be some of urban qualities used in Paper B for objectivedistrict comparison. We adapt each as follows:
• Landuse diversity: calculation done through the function L
• Sunlight index: formally calculable thanks distribution of buildings. How-ever, the performances of the calculation make us not implement this ob-jective
• Spatial configuration: not implemented since axial map extraction wouldhave a huge algorithmic complexity in that case (would require calculationof Radon transform of height function)
• Network performances: with the positions of buildings (barycentres of Si
for example) and the network G we can calculate the network densityand speed. The transportation time is not implemented because there isno destination for individuals. For that, we should set destination pointsoutside the world.
2.1.3 Producing new configurations
We produce new configurations, evaluate them for the selected optimisationobjectives and keep in memory their associated values after having projectedobjective point in objctive space (Pareto optimisation).
The heuristic to produce new configurations is the following:
Crossing Given two configurations (L1, G1, S1) and (L2, G2, S2), we crossthem to obtain a new one. Let P a random subset of P such that P andcP form a coherent partition of space, in the sense that one of the two is com-posed of a reasonnable number of connex components and that the shape arequite regular (squares and ellipses). We define the new landuses L by settingL = L1 · P +L2 · cP (the property of partition allows L to be a function of thegood form). For the network, we take as vertices the vertices of first networkon P and of the other on the complementary. The edges with both ends in thesame part are kept. Fot the others, the closest vertex to one end on the otherside of the border is chosen to create a new edge. Finally, the remaining connexcomponents are connected in order to keep a connex network. The new shapesof buildings are the same by keeping the shapes corresponding to the selectedset of the partition. They can only change by mutations.
83
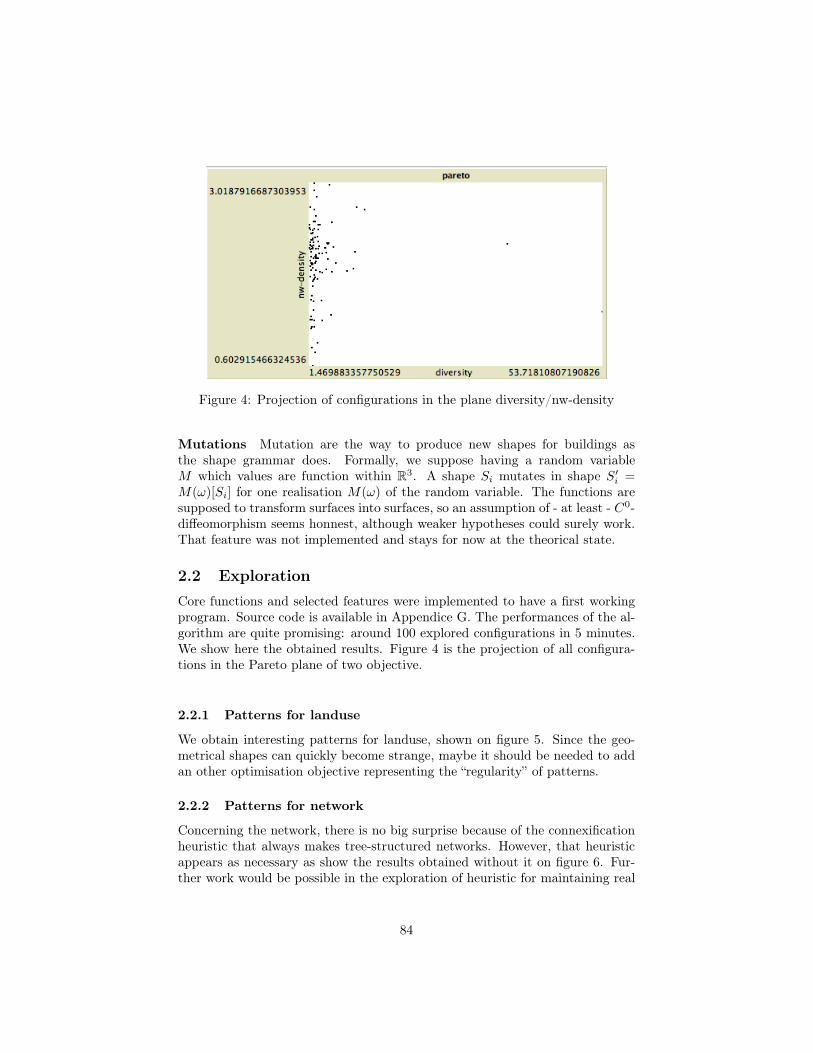
Figure 4: Projection of configurations in the plane diversity/nw-density
Mutations Mutation are the way to produce new shapes for buildings asthe shape grammar does. Formally, we suppose having a random variableM which values are function within R3. A shape Si mutates in shape S0
i =M(!)[Si] for one realisation M(!) of the random variable. The functions aresupposed to transform surfaces into surfaces, so an assumption of - at least - C0-diffeomorphism seems honnest, although weaker hypotheses could surely work.That feature was not implemented and stays for now at the theorical state.
2.2 ExplorationCore functions and selected features were implemented to have a first workingprogram. Source code is available in Appendice G. The performances of the al-gorithm are quite promising: around 100 explored configurations in 5 minutes.We show here the obtained results. Figure 4 is the projection of all configura-tions in the Pareto plane of two objective.
2.2.1 Patterns for landuse
We obtain interesting patterns for landuse, shown on figure 5. Since the geo-metrical shapes can quickly become strange, maybe it should be needed to addan other optimisation objective representing the “regularity” of patterns.
2.2.2 Patterns for network
Concerning the network, there is no big surprise because of the connexificationheuristic that always makes tree-structured networks. However, that heuristicappears as necessary as show the results obtained without it on figure 6. Fur-ther work would be possible in the exploration of heuristic for maintaining real
84
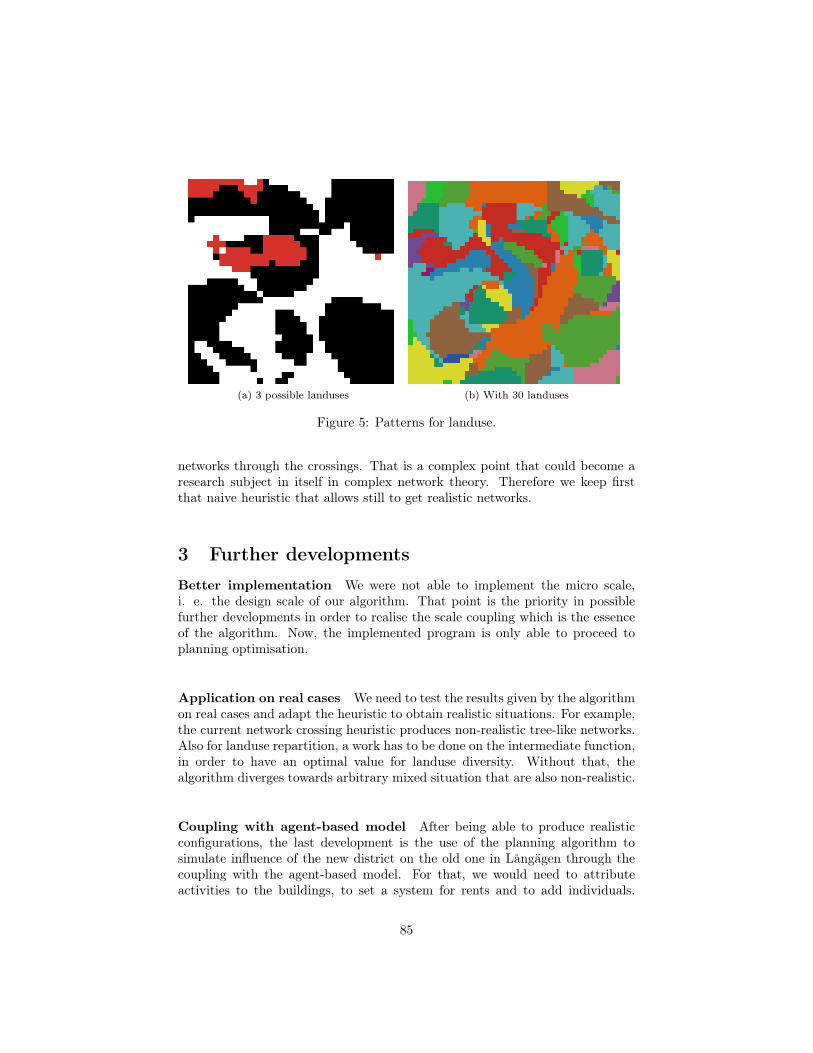
(a) 3 possible landuses (b) With 30 landuses
Figure 5: Patterns for landuse.
networks through the crossings. That is a complex point that could become aresearch subject in itself in complex network theory. Therefore we keep firstthat naive heuristic that allows still to get realistic networks.
3 Further developmentsBetter implementation We were not able to implement the micro scale,i. e. the design scale of our algorithm. That point is the priority in possiblefurther developments in order to realise the scale coupling which is the essenceof the algorithm. Now, the implemented program is only able to proceed toplanning optimisation.
Application on real cases We need to test the results given by the algorithmon real cases and adapt the heuristic to obtain realistic situations. For example,the current network crossing heuristic produces non-realistic tree-like networks.Also for landuse repartition, a work has to be done on the intermediate function,in order to have an optimal value for landuse diversity. Without that, thealgorithm diverges towards arbitrary mixed situation that are also non-realistic.
Coupling with agent-based model After being able to produce realisticconfigurations, the last development is the use of the planning algorithm tosimulate influence of the new district on the old one in Långägen through thecoupling with the agent-based model. For that, we would need to attributeactivities to the buildings, to set a system for rents and to add individuals.
85

(a) Failure, without connexification procedure. (b) Tree-structured network
Figure 6: Networks obtained
Since the district is supposed to be new, the rents may be stable during thelength of the simulation, but the question of their determination remains. Infact, doing the coupling would imply creating an agent-based model for the newplanned district and finding consistent outputs that can be taken as influencingparameters in the old model.
ConclusionAfter having reviewed the existing techniques in automatic design at the smallscale and planning optimisation (multi-objective optimisation) at the macroscale, we have proposed a simple evolutionary algorithm with aim both to pro-pose optimal planning solution and original design patterns. We began to ex-plore the solutions given by the algorithm. Finally, we reviewed the work stillleft, remembering especially the initial motive that was the design of the newdistrict and coupling with agent-based model.
? ??
86
References[1] Enrique Alba and José M Troya. A survey of parallel distributed genetic
algorithms. Complexity, 4(4):31–52, 1999.
[2] Mark Bedau. Downward causation and the autonomy of weak emergence.Principia: an international journal of epistemology, 6(1):5–50, 2002.
[3] R. Duboz. Intégration de modèles hétérogènes pour la modélisation et lasimulation de systèmes complexes. PhD thesis, Laboratoire d’Informatiquedu Littoral — UPRES JE-2335, 2004.
[4] AlfonsG. Hoekstra, Alfonso Caiazzo, Eric Lorenz, Jean-Luc Falcone, andBastien Chopard. Complex automata: Multi-scale modeling with coupledcellular automata. In Jiri Kroc, Peter M.A. Sloot, and Alfons G. Hoekstra,editors, Simulating Complex Systems by Cellular Automata, volume 0 ofUnderstanding Complex Systems, pages 29–57. Springer Berlin Heidelberg,2010.
[5] Iestyn Jowers and Christopher Earl. The construction of curved shapes.Environment and planning. B, Planning & design, 37(1):42, 2010.
[6] Iestyn Jowers and Christopher Earl. The implementation of curved shapegrammars. Environment and Planning B: Planning and Design, 38(4):616–635, 2011.
[7] Terry Knight. Computing with emergence. Environment and Planning B,30(1):125–156, 2003.
[8] Terry W Knight. either/or -> and. Environment and Planning B: Planningand Design, 30:327–338, 2003.
[9] KTH. Architectural morphology : Investigative modeling and spatial anal-ysis. In Public Research Workshop, KTH School of Architecture, Stockholm,Mai 2013.
[10] Henrik Madsen. Automatic calibration of a conceptual rainfall–runoffmodel using multiple objectives. Journal of hydrology, 235(3):276–288,2000.
[11] Nicolas Monmarché. Lecture on artificials ants. In 13th French ComplexSystems Summer School, July 2013.
[12] Nicolas Monmarché, Isabelle Mahnich, and Mohamed Slimane. Artificialart made by artificial ants. In The Art of Artificial Evolution, pages 227–247. Springer, 2008.
[13] Casey Reas. Form+ code in design, art, and architecture. Princeton Ar-chitectural Press, 2010.
87

[14] Eckart Zitzler and Lothar Thiele. Multiobjective evolutionary algorithms:A comparative case study and the strength pareto approach. EvolutionaryComputation, IEEE Transactions on, 3(4):257–271, 1999.
[15] Guillemette Zuber. Evolution et futur du design de l’habitat suèdois. Rap-port de stage de recherche, Ecole Polytechnique, 2012.
88

Conclusion
Taking a step back on the global project, we can better understand how the different parts arecomplementary to answer our research question. The top-down analysis approach was the key forthe construction of indicators we used for some as outputs of the heterogeneous agent-based modeland for others as objectives for the multi-objective optimisation in the evolutionary algorithm. Thearchitectural and sociological review was required for a contextual construction of a local agent-based model, but was also necessary for the understanding of the concept of suburbs specific toSweden and knowing which type of area on which we could build the indicators of second part. Thefailure on meta-modeling attempt was essential to go further in the understanding of the conceptof modeling. Although some points were not developped so much as expected and although thepreliminary results for simulations obtained through the model of simulation for Långägen werenot strongly validated, we produced through the synthesis of the whole new theorical and practicalknowledge and answered partly our research question with the proposed methods.
We must insist on the importance of the cultural context of Sweden on the quality of thatwork. The way to practice architecture and urban planning there is really specific and researchexchanges are all the richer. Generally, urban questions cannot be solved from an unique perspectivedespite the fact that they are strongly linked with the local cultural context, what strengthen thedelicate character of this type of complex systems modeling. Nevertheless we showed here thatheterogeneous approaches mixing top-down and bottom-up modeling, architectural and urbanisticconsiderations, sociological and technical analysis were possible and promising.
We also opened in that work a lot of research questions some of which can lead to interesting de-velopments. As an example, the problem of trying to find patterns of classification of the projectionof urban parts in the indicator space may be a path toward a new approach of the relation betweenmorphology and functionality in urban systems. The issue of the choice of surfaces of integrationsuggest of trying on a subset of convex subparts of the plane, what would imply the knowledgeof function on this set and what makes think of a mathematical transformation. The integrationof complicated submodels in complex models of complex systems is often unpopular since it goesagainst the popular methodology “Keep It Simple”. However, it seems possible to use some wisely,as brownian motion can find its place in traffic simulation models or pedestrian flows prediction.The diversity of questions opened encourages to go further on some points which will surely beprosperous research subjects.
? ??
89

90
References[1] Enrique Alba and José M Troya. A survey of parallel distributed genetic
algorithms. Complexity, 4(4):31–52, 1999.
[2] Roger Andersson. ’breaking segregation’—rhetorical construct or effectivepolicy? the case of the metropolitan development initiative in sweden.Urban Studies, 43(4):787–799, 2006.
[3] Dominique Badariotti. Le renouvellement urbain en france: du traitementmorphologique à l’intervention sociale. 2006.
[4] Arnaud Banos and Cyrille Genre-Grandpierre. Towards new metrics forurban road networks: Some preliminary evidence from agent-based sim-ulations. In Agent-based models of geographical systems, pages 627–641.Springer, 2012.
[5] Michael Batty. Cities and Complexity: Understanding Cities with CellularAutomata, Agent-based Models, and Fractals. MIT Press, 2007.
[6] Michael Batty, Andrew T. Crooks, Linda M. See, and Alison J. Heppenstall.Perspectives on agent-based models and geographical systems. In Alison J.Heppenstall, Andrew T. Crooks, Linda M. See, and Michael Batty, edi-tors, Agent-Based Models of Geographical Systems, pages 1–15. SpringerNetherlands, 2012.
[7] Mark Bedau. Downward causation and the autonomy of weak emergence.Principia: an international journal of epistemology, 6(1):5–50, 2002.
[8] Itzhak Benenson. Multi-agent simulations of residential dynamics in thecity. Computers, Environment and Urban Systems, 22(1):25–42, 1998.
[9] Åsa Bråmå and Roger Andersson. Who leaves rental housing? examiningpossible explanations for ethnic housing segmentation in uppsala, sweden.Journal of Housing and the Built Environment, 25(3):331–352, 2010.
[10] Matthew J Brown. Models and perspectives on stage: remarks on giere’sScientific perspectivism. Studies In History and Philosophy of Science PartA, 40(2):213–220, 2009.
[11] Pål Castell. The swedish suburb as myth and reality. Pål Castell (2010),Managing yard and togetherness: living conditions and social robustnessthrough tenant involvement in open space management, Chalmers Univer-sity of Technology, Göteborg., (Part 2, Thematic Paper E), 2010.
[12] Vânia Aparecida Ceccato. Understanding Urban Patterns : Qualitativeand Quantitative Approaches. PhD thesis, Kungliga Tekniska högskolan,Stockholm, 2001.
91

[13] David Chavalarias, Paul Bourgine, Edith Perrier, Fréderic Amblard,François Arlabosse, Pierre Auger, Jean-Bernard Baillon, Olivier Barreteau,Pierre Baudot, Elisabeth Bouchaud, et al. French roadmap for complexsystems 2008-2009. 2009.
[14] Françoise Choay. L’urbanisme, utopies et réalités : une Anthologie. éditionsdu Seuil, Paris, 1965.
[15] Le Corbusier. Vers une Architecture. Paris, 1924.
[16] Paolo Crucitti, Vito Latora, and Sergio Porta. Centrality measures inspatial networks of urban streets. Physical Review E, 73(3):036125, 2006.
[17] R. Duboz. Intégration de modèles hétérogènes pour la modélisation et lasimulation de systèmes complexes. PhD thesis, Laboratoire d’Informatiquedu Littoral — UPRES JE-2335, 2004.
[18] OMEGA Team Ecole Nationales Ponts et Chaussees Paris France. Viaducde millau. In Project Profile. UCL, Bartlett School of Planning, 2010.
[19] J Doyne Farmer and Duncan Foley. The economy needs agent-based mod-elling. Nature, 460(7256):685–686, 2009.
[20] Flávia F Feitosa, Quang Bao Le, and Paul LG Vlek. Multi-agent simulatorfor urban segregation (masus): A tool to explore alternatives for promotinginclusive cities. Computers, Environment and Urban Systems, 35(2):104–115, 2011.
[21] Flávia F Feitosa, Quang Bao Le, Paul LG Vlek, Antônio Miguel V Mon-teiro, Roberta Rosemback, et al. Countering urban segregation in braziliancities: policy-oriented explorations using agent-based simulation. Environ-ment and Planning-Part B, 39(6):1131, 2012.
[22] Pierre Frankhauser and Cécile Tannier. A multi-scale morphological ap-proach for delimiting urban areas. In 9th Computers in Urban Planningand Urban Management conference (CUPUM’05), University College Lon-don, 2005.
[23] Ronald N Giere. How models are used to represent reality. Philosophy ofscience, 71(5):742–752, 2004.
[24] Familje Bostader Göteborg. Annual reports. available onhttp://www.familjebostader.se/en/Om-foretaget/Arsredovisning/, 1999- 2012.
[25] Statistics Göteborg. Statistisk årsbok göteborg. Stadskansliet, Göteborg,2005 - 2012.
[26] Thomas Hall and Sonja Vidén. The million homes programme: a review ofthe great swedish planning project. Planning Perspectives, 20(3):301–328,2005.
92

[27] Bill Hillier, Adrian Leaman, Paul Stansall, and Michael Bedford. Spacesyntax. Environment and Planning B: Planning and Design, 3(2):147–185,1976.
[28] AlfonsG. Hoekstra, Alfonso Caiazzo, Eric Lorenz, Jean-Luc Falcone, andBastien Chopard. Complex automata: Multi-scale modeling with coupledcellular automata. In Jiri Kroc, Peter M.A. Sloot, and Alfons G. Hoekstra,editors, Simulating Complex Systems by Cellular Automata, volume 0 ofUnderstanding Complex Systems, pages 29–57. Springer Berlin Heidelberg,2010.
[29] Helena Holgersson and Brett J. Epstein. (Re)searching Gothenburg: essayson a changing city. Glänta produktion, Göteborg, 2010.
[30] Yaron Hollander and Ronghui Liu. The principles of calibrating trafficmicrosimulation models. Transportation, 35(3):347–362, 2008.
[31] Bin Jiang and Christophe Claramunt. Topological analysis of urban streetnetworks. Environment and Planning B, 31(1):151–162, 2004.
[32] Ron Johnston, Michael Poulsen, and James Forrest. On the measurementand meaning of residential segregation: a response to simpson. Urbanstudies, 42(7):1221–1227, 2005.
[33] Iestyn Jowers and Christopher Earl. The construction of curved shapes.Environment and planning. B, Planning & design, 37(1):42, 2010.
[34] Iestyn Jowers and Christopher Earl. The implementation of curved shapegrammars. Environment and Planning B: Planning and Design, 38(4):616–635, 2011.
[35] Terry Knight. Computing with emergence. Environment and Planning B,30(1):125–156, 2003.
[36] Terry W Knight. either/or -> and. Environment and Planning B: Planningand Design, 30:327–338, 2003.
[37] KTH. Architectural morphology : Investigative modeling and spatial anal-ysis. In Public Research Workshop, KTH School of Architecture, Stockholm,Mai 2013.
[38] Florent Le Néchet and Anne Aguilera. Déterminants spatiaux et sociaux dela mobilité domicile-travail dans 13 aires urbains françaises : une approchepar la forme urbaine, à deux échelles géographiques. In ASRDLF 2011,SCHOELCHER, Martinique, July 2011. http://asrdlf2011.com/.
[39] Kevin Lynch. The Image of the City. MIT Press, 1960.
[40] Henrik Madsen. Automatic calibration of a conceptual rainfall–runoffmodel using multiple objectives. Journal of hydrology, 235(3):276–288,2000.
93

[41] RobinB. Matthews, NigelG. Gilbert, Alan Roach, J.Gary Polhill, andNickM. Gotts. Agent-based land-use models: a review of applications.Landscape Ecology, 22(10):1447–1459, 2007.
[42] Fabien Michel. Formalisme, outils et éléments méthodologiques pour la mod-élisation et la simulation multi-agents. PhD thesis, Université des scienceset techniques du Languedoc, Montpellier, 2004.
[43] Francis Miguet and Dominique Groleau. A daylight simulation tool for ur-ban and architectural spaces—application to transmitted direct and diffuselight through glazing. Building and environment, 37(8):833–843, 2002.
[44] Nicolas Monmarché. Lecture on artificials ants. In 13th French ComplexSystems Summer School, July 2013.
[45] Nicolas Monmarché, Isabelle Mahnich, and Mohamed Slimane. Artificialart made by artificial ants. In The Art of Artificial Evolution, pages 227–247. Springer, 2008.
[46] Ella Ödmann and Gun-Britt Dahlberg. Urbanization in Sweden: Meansand methods for the planning. Allmänna förlaget Uddevalla, 1970.
[47] Svenska Orienteringsförbundet. Kartbanken. available onhttp://www.obasen.nu/kartbanken/, 2013.
[48] D Phillips. Daylighting: Natural light in architecture. Amsterdam, 2004.
[49] Denise Pumain. Pour une théorie évolutive des villes. Espace géographique,26(2):119–134, 1997.
[50] Denise Pumain. Scaling laws and urban systems. Santa Fe Institute, Work-ing Paper n 04-02, 2:26, 2004.
[51] QGIS Development Team. QGIS Geographic Information System. OpenSource Geospatial Foundation, 2009.
[52] J. Raimbault. Application of evidence-based methods to the test of a multi-value evaluation framework for sustainable renovation. Research internshipproject description, April 2013.
[53] Carlo Ratti. Urban texture and space syntax: some inconsistencies. Envi-ronment and Planning B: Planning and Design, 31(4):487–499, 2004.
[54] Casey Reas. Form+ code in design, art, and architecture. Princeton Ar-chitectural Press, 2010.
[55] Romain Reuillon, Sebastien Rey, Clara Schmitt, Mathieu Leclaire, DemisePumain, et al. Algorithmes évolutionnaires sur grille de calcul pour lecalibrage de modéles géographiques. In journées scientifiques mésocentreset France Grilles 2012, 2012.
94
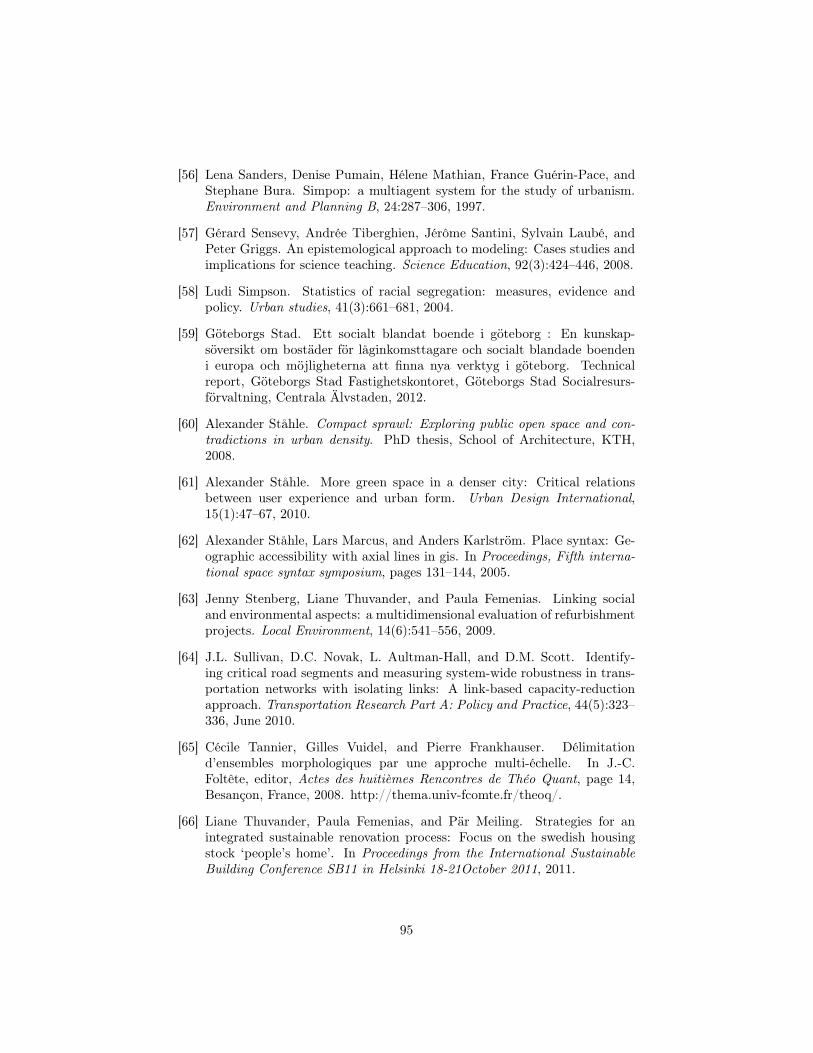
[56] Lena Sanders, Denise Pumain, Hélene Mathian, France Guérin-Pace, andStephane Bura. Simpop: a multiagent system for the study of urbanism.Environment and Planning B, 24:287–306, 1997.
[57] Gérard Sensevy, Andrée Tiberghien, Jérôme Santini, Sylvain Laubé, andPeter Griggs. An epistemological approach to modeling: Cases studies andimplications for science teaching. Science Education, 92(3):424–446, 2008.
[58] Ludi Simpson. Statistics of racial segregation: measures, evidence andpolicy. Urban studies, 41(3):661–681, 2004.
[59] Göteborgs Stad. Ett socialt blandat boende i göteborg : En kunskap-söversikt om bostäder för låginkomsttagare och socialt blandade boendeni europa och möjligheterna att finna nya verktyg i göteborg. Technicalreport, Göteborgs Stad Fastighetskontoret, Göteborgs Stad Socialresurs-förvaltning, Centrala Älvstaden, 2012.
[60] Alexander Ståhle. Compact sprawl: Exploring public open space and con-tradictions in urban density. PhD thesis, School of Architecture, KTH,2008.
[61] Alexander Ståhle. More green space in a denser city: Critical relationsbetween user experience and urban form. Urban Design International,15(1):47–67, 2010.
[62] Alexander Ståhle, Lars Marcus, and Anders Karlström. Place syntax: Ge-ographic accessibility with axial lines in gis. In Proceedings, Fifth interna-tional space syntax symposium, pages 131–144, 2005.
[63] Jenny Stenberg, Liane Thuvander, and Paula Femenias. Linking socialand environmental aspects: a multidimensional evaluation of refurbishmentprojects. Local Environment, 14(6):541–556, 2009.
[64] J.L. Sullivan, D.C. Novak, L. Aultman-Hall, and D.M. Scott. Identify-ing critical road segments and measuring system-wide robustness in trans-portation networks with isolating links: A link-based capacity-reductionapproach. Transportation Research Part A: Policy and Practice, 44(5):323–336, June 2010.
[65] Cécile Tannier, Gilles Vuidel, and Pierre Frankhauser. Délimitationd’ensembles morphologiques par une approche multi-échelle. In J.-C.Foltête, editor, Actes des huitièmes Rencontres de Théo Quant, page 14,Besançon, France, 2008. http://thema.univ-fcomte.fr/theoq/.
[66] Liane Thuvander, Paula Femenias, and Pär Meiling. Strategies for anintegrated sustainable renovation process: Focus on the swedish housingstock ‘people’s home’. In Proceedings from the International SustainableBuilding Conference SB11 in Helsinki 18-21October 2011, 2011.
95

[67] Liane Thuvander, Paula Femenias, and Pär Meiling. Description of the peo-ple’s home building stock in sweden. Technical report, Chalmers TekniskaHögskola, Departement of Architecture, Göteborg, 2012.
[68] Liane Thuvander, Paula Femenias, and Pär Meiling. En rebo-rapport : caselångängen. Technical report, Chalmers Tekniska Högskola, Departement ofArchitecture, Göteborg, 2012.
[69] Liane Thuvander, Paula Femenías, Kristina Mjörnell, and Pär Meiling.Unveiling the process of sustainable renovation. Sustainability, 4(6):1188–1213, 2012.
[70] Paul M Torrens and Marina Alberti. Measuring sprawl. 2000.
[71] Yu-Hsin Tsai. Quantifying urban form: compactness versus’ sprawl’. UrbanStudies, 42(1):141–161, 2005.
[72] Bengt Turner and Christine ME Whitehead. Reducing housing sub-sidy: Swedish housing policy in an international context. Urban Studies,39(2):201–217, 2002.
[73] Franck Varenne. Les simulations computationnelles dans les sciences so-ciales. Nouvelles Perspectives en Sciences Sociales, 5(2):17–49, 2010.
[74] Franck Varenne, Marc Silberstein, et al. Modéliser & simuler. Epistémolo-gies et pratiques de la modélisation et de la simulation, tome 1. 2013.
[75] Wolfgang Weidlich. Sociodynamics applied to the evolution of urban andregional structures. Discrete Dynamics in Nature and Society, 1(2):85–98,1997.
[76] U. Wilensky. Netlogo. Center for Connected Learning and Computer-BasedModeling, Northwestern University, Evanston, IL., 1999.
[77] Josias Zietsman, Laurence R Rilett, and Seung-Jun Kim. Transportationcorridor decision-making with multi-attribute utility theory. InternationalJournal of Management and decision making, 7(2):254–266, 2006.
[78] Eckart Zitzler and Lothar Thiele. Multiobjective evolutionary algorithms:A comparative case study and the strength pareto approach. EvolutionaryComputation, IEEE Transactions on, 3(4):257–271, 1999.
[79] Guillemette Zuber. Evolution et futur du design de l’habitat suèdois. Rap-port de stage de recherche, Ecole Polytechnique, 2012.
96

Appendice AWritten report of the research Workshop
“Architectural MorphologyInvestigative modeling and spatial analysis”
KTH, May 14th 2013
97

98
Architectural MorphologyInvestigative modeling and spatial analysis
Public Research WorkshopStockholm, KTH School of Architecture
May 14th, 2013
Abstract
The development of new theorical and technical means, particularly in
the field of computer science and its direct applications, leads more and more
to a renewal of the approach on design and architecture. The increasing
place of modeling and calculations in the architectural process confirms
that Architecture lays on the interface, in this case ambiguous, between art
and science. This workshop aims to be a presentation of the state of the art
of actual research in the field of spatial analysis applied to urban design,
urban planning and architecture.
99

Speakers
John PeponisProfessor, Associate Chair Advanced Studies and Research
GeorgiaTech School of Architecture
Sophia PsarraReader of Architecture and Spatial Design
The Bartlett School of Graduate Studies, Editor, Journal of Space Syntax
Ermal ShpuzaAssociate Professor
Department of Architecture, Southern Polytechnic State University
Meta Berghauser PontChair Urban Design – Theory and Methods
TU Delft Faculty of Architecture
Ulrika KarlssonVisiting Professor School of Architecture, KTH; servo stockholm
Christian DeriHead of AEDAS Architects R&D
Visiting Professor, Technical University of Munich
Åsmund IzakiAEDAS Architects R&D
Daniel KochResearcher, Director of Research Studies
KTH School of Architecture
Pablo Miranda CarranzaResearcher
KTH School of Architecture
100

Introduction
This workshop was presented as follows :
The Research Workshop Architectural Morphology: Investigative modelingand spatial analysis is meant as a beginning or a point of departure, in researchand for coming events revolving around modeling and spatial analysis in architec-ture. With speakers of considerable repute within the field commonly referred toas Space Syntax, as well as in other Architectural fields, it is meant to communi-cate cutting edge analytical, configurative modeling as well as explore relations toother modeling and analytical traditions in architectural research. Furthermore,through the participation of AEDAS R&D and the experience of many of thespeakers, the relation between modeling and analysis in research and practice willbe highlighted and discussed.
101

John Peponis, GeorgiaTech School of ArchitectureConcrete applications of Space SyntaxWe unfortunately missed the begining of this first presentation.
That presented direct application of spatial integration calculations on Atlantadistricts.
The theory of space syntax was introduced by Hillier in 1976 in [4]. Its aimis to study the influence of spatial configuration on human aspects of urban life.One current implementation is the axial map extraction : we extract the axialmap of a place by considering linear spaces, in the sense of one feels belongingto that space when evolving in it (it’s globally what one can see, that’s why thatleads to an axial map in the context of street network analysis). Then we can builtthe topological graph corresponding to the axial maps, and can calculate whatwe call “spatial integration” on it : with N places and dij the topological distancefrom place i to j, the mean accessibility to other places : IS = 2
N ·(N�1) ·P
i<j dij, and the integration is the mean of all accessibilities on the graph.
The figure 1 shows that process of topological graph extraction.
Concerning the concrete applications, it is possible for example, by distinguish-ing pedestrian and car axial maps, to show evidences of “bad” designed districtin the sense that they are not liveable for a pedestrian, what is no more possiblenowadays. Such designs present a strong lack of flexibility.
Such errors could have been avoided by the use of analytic methods like spatialanalysis, and we need today to switch from an exclusive descriptive approach ofarchitecture to a normative point of view ; we need more normative, evidence-based practice. For example, back to the Atlanta districts, it can be showedthrough investigative modeling that a greater building flexibility could have beenpermitted thanks to a non equivalent distribution of block size ; that can be putin parallel with the need for local activity diversification.
Of course spatial analysis will never be the direct answer to the difficult ques-tion of what is an ideal city, but the motivation of space syntax has always beena normative aim through a better understanding of urban systems.
Question Should not the designer adapt the used methods to the real situation,in the sense that the normative means won’t be the same depending on the neigh-borhood?
Yes of course. Here it is the ideas behind the methods that are important,not the concrete implementation themselves. The “normative” is more a system-atic application of calculation and modeling in general than a specific method offurmula.
102
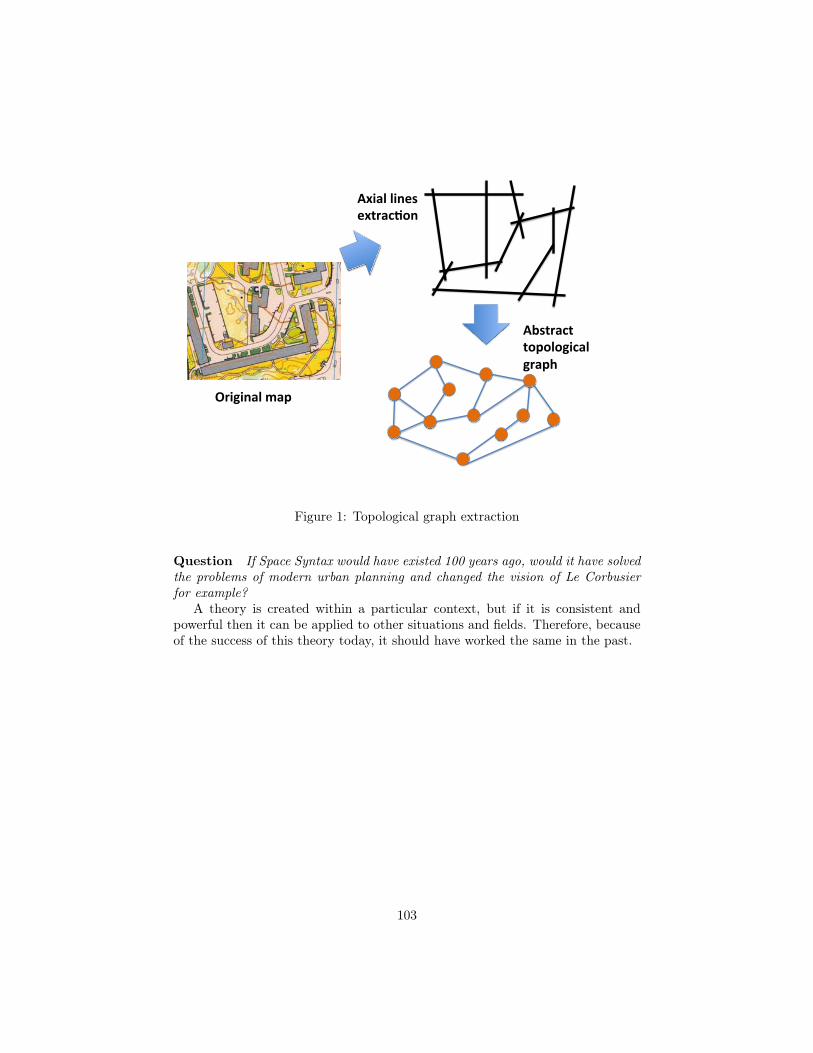
Original(map(
Axial(lines(extrac1on(
Abstract(topological(graph(
Figure 1: Topological graph extraction
Question If Space Syntax would have existed 100 years ago, would it have solvedthe problems of modern urban planning and changed the vision of Le Corbusierfor example?
A theory is created within a particular context, but if it is consistent andpowerful then it can be applied to other situations and fields. Therefore, becauseof the success of this theory today, it should have worked the same in the past.
103
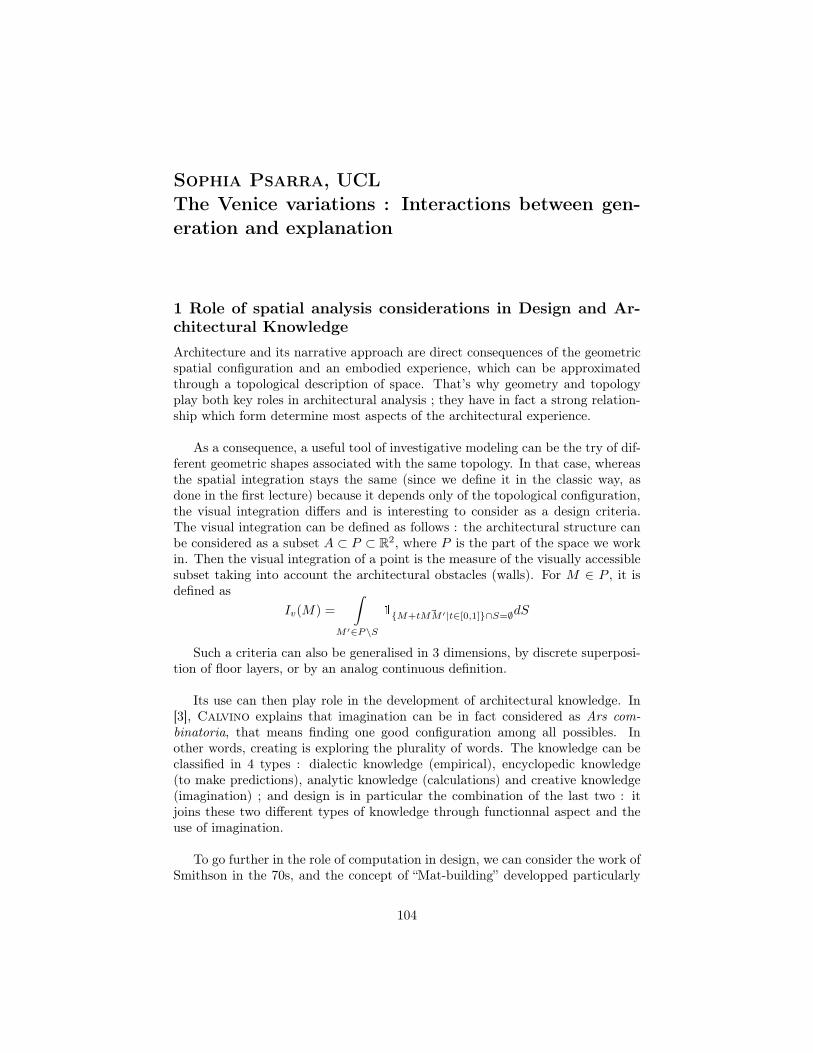
Sophia Psarra, UCLThe Venice variations : Interactions between gen-eration and explanation
1 Role of spatial analysis considerations in Design and Ar-
chitectural Knowledge
Architecture and its narrative approach are direct consequences of the geometricspatial configuration and an embodied experience, which can be approximatedthrough a topological description of space. That’s why geometry and topologyplay both key roles in architectural analysis ; they have in fact a strong relation-ship which form determine most aspects of the architectural experience.
As a consequence, a useful tool of investigative modeling can be the try of dif-ferent geometric shapes associated with the same topology. In that case, whereasthe spatial integration stays the same (since we define it in the classic way, asdone in the first lecture) because it depends only of the topological configuration,the visual integration differs and is interesting to consider as a design criteria.The visual integration can be defined as follows : the architectural structure canbe considered as a subset A ⇢ P ⇢ R2, where P is the part of the space we workin. Then the visual integration of a point is the measure of the visually accessiblesubset taking into account the architectural obstacles (walls). For M 2 P , it isdefined as
Iv(M) =
Z
M 02P\S
{M+t ~MM 0|t2[0,1]}\S=;dS
Such a criteria can also be generalised in 3 dimensions, by discrete superposi-tion of floor layers, or by an analog continuous definition.
Its use can then play role in the development of architectural knowledge. In[3], Calvino explains that imagination can be in fact considered as Ars com-binatoria, that means finding one good configuration among all possibles. Inother words, creating is exploring the plurality of words. The knowledge can beclassified in 4 types : dialectic knowledge (empirical), encyclopedic knowledge(to make predictions), analytic knowledge (calculations) and creative knowledge(imagination) ; and design is in particular the combination of the last two : itjoins these two different types of knowledge through functionnal aspect and theuse of imagination.
To go further in the role of computation in design, we can consider the work ofSmithson in the 70s, and the concept of “Mat-building” developped particularly
104

in [7]. The important ideas are that architecture and urbanism are closely linkedto the notion of emergence, and that an only top-down approach is not sufficient,a bottom-up approach is also needed, by considerations of evolutionnary fieldsand local relations.
That importance of computers in design was later in the 90s confirmed by theapparition of evolutionnal design, e. g. design through genetic algorithm thatuse given rules of the genetic languages to compute new designs. That is again abottom-up approach for which the unpredictability of the emerging properties isinherent to the system and its self-organisation.
2 Evolution and Urban form : case Venice
Venice can be seen as an archipel lago of monuments and open spaces. It is inter-esting to study relations between spatial and visual integration in it. The singleconsideration of pedestrian network is not enough to understand the patterns inurban form.
That lead to the idea of proceeding to a network coupling between pedestriannetwork and water network, since the canals are in Venice as important as thestreets, and they can be considered as streets themselves. The coupling is donethroug the locations of step access, that allow to bank with boats.
The important results of that study is that the urban form were stronglyinfluenced by both networks, and that modelings taking into account only one leadto weak correlations. To sum up, the evolution of Venice was strongly determinedby the coupling of its two networks.
3 Comparison to the project of hospital by Le Corbusier
One major project by Le Corbusier at the end of his life was a porject of hugemodern hospital for Venice, that we can see on figure 2.
For Sarkis in [6], the spirit of the project is closely linked to the Mat-building.The hospital is like a city in itself, and without going too far, we can makea parallel between the coupling of the visibility network and the accessibilitynetwork in the hospital and the street/water networks in the city of Venice. LeCorbusier would have unconsciously understood the essence of the city and builta project corresponding exactly to it, reproducing the structure of Venice ?
The building follows scaling laws and the flexibility of the design suggests a sortof functionnal optimisation. It has also both good spatial and visual integrations.
105

Figure 2: Project for Venice hospital by le Corbusier
The analysis of the project by analytical methods shows us hidden aspects andleads to a better understanding of its internal mechanisms.
Conclusion
After having presented new applications and implementations of space syntaxtheory, and having linked them to architectural history and the sense of architec-tural knowledge, we have seen the rich opportunites these methods offered bothin urban planning analyis and architectural project understanding.
106

Daniel Koch, KTHArchitectural Interfaces & Resilience
Introduction
Architecture can be seen as the interface between the one and other : it has astrong impact on the social relations. Whereas socio-cultural identification canexplain differences in housings, on the opposite how is architecture communicatingwith these socio-cultural considerations?
Characterization of interfaces
We first need to characterize the interface we are responding to. Without goinginto details, a study of the influence of typical architectural objects on our presenceand our movement, by a projection in a evaluation plane for these two functions,emphasises the importance of open space. People are connected through space,and maybe that’s why we are studying these connections. As a consequence theresilience would be the way social statuts are defined regarding our vision of space.
The question is therefore to study how architecture relates to exterior, but alsohow it interfaces with people inside. Architecture is in itself in a way teh interfacebetween arrangment of objects and movement of people. The link between visualinterface and physical accessibility is in that frame interesting to look at ; theprojection of configurations in the plane visibility/accessibility gives a measureof assymetry. These concrete calculations on existing buildings strengthen ourknowledge of this internal interface.
The role of the relation between interior and exterior has to be consideredsince it has consequences on the calculation of the measures. A concrete exampleis the existence of an external path that changes the accessibility measures insidethe building. Without the exterior, we are able to explain better the relations andinterfaces inside the building. In that way, visibility measures explain better howthe building is internally built. An interesting result of investigative modelingthrough visibility measures is the fact that fusion of spaces (“open space”) in abuilding of offices strongly increases the social segregation (whereas the commonidea is that it would help proximity and decrease it).
107

Consequences for the resilience of the built environment
Taking for definition of resilience the relations through space of social agents inthe built environment has strong consequences on the results obtained throughinvestigative modeling. Indeed, we need to explore the sensitivity of interfacesregarding system parameters, and to make tests of continuity of the responseproxys before validating these output functions. We need to compare the differentmeasures and look for the existence of strong discontinuities at given points, sincethese discontinuities can bring conclusions to non-sense.
We might change the classification of configuration by defining the continu-ity not on a measure of “similarity” [that appears to be classic distance betweengeometric patterns through sums of distances along local homeomorphisms anddiscrete adding/deletion of shape parts] but more a measure of “seamness”, thatwould be defined the reciprocal way, by declare as close in seamness configurationclose in resilience. Then the continuity will not be a problem anymore. A pathto explore in future work is the question of the existence of an algorithm usingdiscretization and reduction of configurations, that could lead from geometricalsimilarity to this “seamness”, i. e. a class reduction algorithm that would not cal-culate explicitly the quotienting function but find directly the class only throughspatial discretisation and simple geometrical reductions, since the calculation ofthe function can in some cases be arbitrary sensitive and lead to wrong resultsbecause of bord-effects of the implementation. The existence of such an algo-rithm has no direct reason to be true, and it is still an intuition now. But itsproof would deeply change calculation heuristics and results on the resilience ofthe built environment.
108
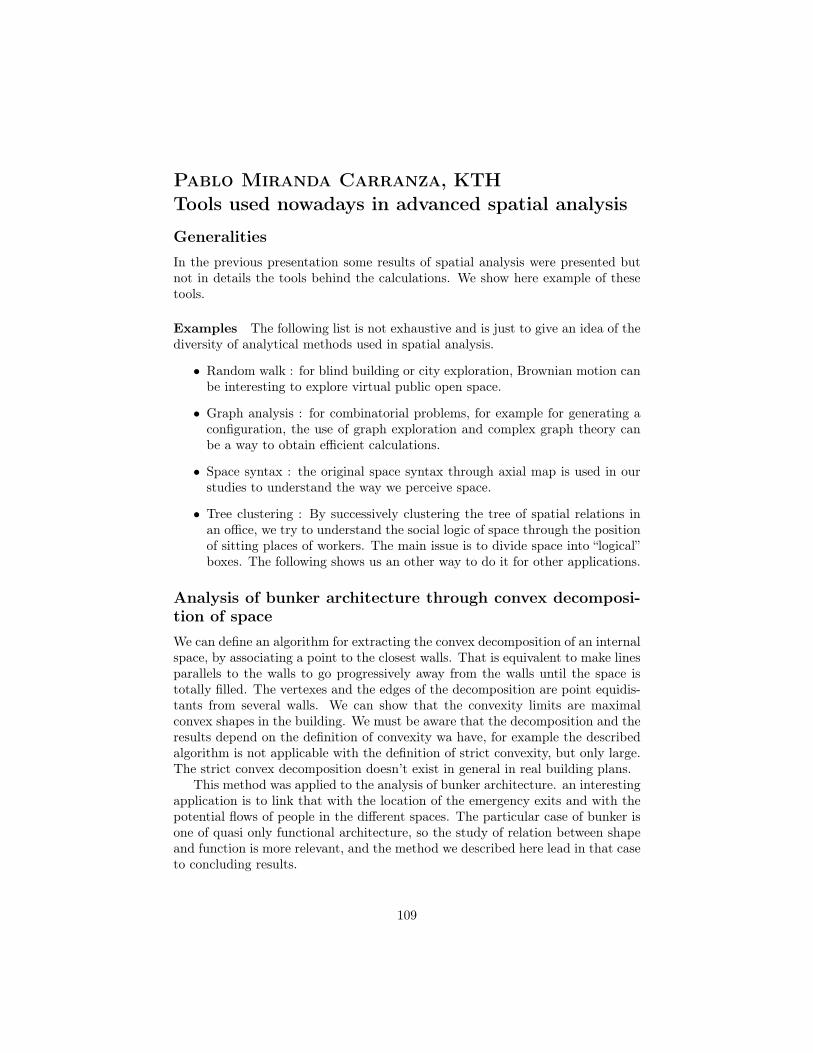
Pablo Miranda Carranza, KTHTools used nowadays in advanced spatial analysis
Generalities
In the previous presentation some results of spatial analysis were presented butnot in details the tools behind the calculations. We show here example of thesetools.
Examples The following list is not exhaustive and is just to give an idea of thediversity of analytical methods used in spatial analysis.
• Random walk : for blind building or city exploration, Brownian motion canbe interesting to explore virtual public open space.
• Graph analysis : for combinatorial problems, for example for generating aconfiguration, the use of graph exploration and complex graph theory canbe a way to obtain efficient calculations.
• Space syntax : the original space syntax through axial map is used in ourstudies to understand the way we perceive space.
• Tree clustering : By successively clustering the tree of spatial relations inan office, we try to understand the social logic of space through the positionof sitting places of workers. The main issue is to divide space into “logical”boxes. The following shows us an other way to do it for other applications.
Analysis of bunker architecture through convex decomposi-
tion of space
We can define an algorithm for extracting the convex decomposition of an internalspace, by associating a point to the closest walls. That is equivalent to make linesparallels to the walls to go progressively away from the walls until the space istotally filled. The vertexes and the edges of the decomposition are point equidis-tants from several walls. We can show that the convexity limits are maximalconvex shapes in the building. We must be aware that the decomposition and theresults depend on the definition of convexity wa have, for example the describedalgorithm is not applicable with the definition of strict convexity, but only large.The strict convex decomposition doesn’t exist in general in real building plans.
This method was applied to the analysis of bunker architecture. an interestingapplication is to link that with the location of the emergency exits and with thepotential flows of people in the different spaces. The particular case of bunker isone of quasi only functional architecture, so the study of relation between shapeand function is more relevant, and the method we described here lead in that caseto concluding results.
109

Meta Berghauser Pont, TU DelftDensity, Architecture and the City
Why study density?
Through history, density of cities has always have a great importance. As a con-crete example, there is evidence of the link between a high density of populationand health problems in Ansterdam, Jordean at the end of the 19th century. Atthe same time, regulations to constraint the height of buildings according to thestreet width were taken all over the world (see Paris of Haussman for example).The promoters of the Garden City took the aspect of a healthier city as a mainargument. In the late 50s, Jacobs proposed ([5]) in opposition to these idealismsa return to a more natural and by consequence a more dense city.
Today, density can still be an issue. Back to the example of Amsterdam, theglobal density is too low, as a consequence of an explosion of the urban footprint,and of different relative growths of land uses (the proportion of dwellings wentbigger).
We could try to give an answer to the question of arguments for or againstdensification, but there are very much pertinent arguments on both side, so thereally important aspect that appears is the study of density in itself, the fact thatit has good or bad consequences on some aspects of the urban system is in fact another problem, depending most of the time on the particular concrete situationwe are in.
Measuring density
There exists in the litterature several way of measuring density, and each is par-ticular to the specific defintion given to density and the field of application of theresults. For example, the physical density is different from the perceived density,or the demographic density.
One important issue of the classic measure is that they don’t manage to cap-ture in a single way the urban from and other aspects of urban life. For example,the floor space index, the ground space index or the open space ratio are currentlyused measures with their advantages as qualifying in a way the perceived space.But still, the urban form is not captured, and the size of the elements is notincluded, as we can see on concrete example (same density for radically differentforms).
By considering the network density, in a way the streets per area, we believebeing able to define density in a new way that would capture urban form. Thishypothesis of coupling network analysis with spatial considerations is our currentresearch work which will lead we hope to a new way of considering density
110

Performance of density
An other important aspect in the study of density is the measure of the perfor-mance of density ; it is also the object of furhter development in our research totry to express simplified relations between density function and several qualitiesof the urban life, for example the parking performance of a street (available placesto park the car) or the daylight performances of the buildings.
We need to mix several aspects in the expression of the performance of den-sity. One issue would be to understand the relation between physical density andperceived density in another way space syntax does it. Indeed, the determina-tion of perception of different performances should be quite simple in relation tocultural aspects, so if our quantification of performance of density is sufficientlyconsistent, we would undirectly make that link through that quantification.
Note : Implicitly this presentation gives the impression that a strong link existsbetween space syntax theory and that vision of density, the top-down approachproposed here seems to exploit the same internal mechanisms that the bottom-upcalculation of spatial analysis to reveal relations between shape and function incities. Need to explore that.
111

Ermal Shpuza, Southern Polytechnic State Uni-versityInteraction between boundary shape and circula-tion structure in the built environmentRecent research work has been oriented towards the study of the mutual effectof rules and constraints, in the sense of the relations between the building shapeand the social organization occupying it. These two elements have totally differ-ent time longevity, so we can ask if it could lead to contradictions between thefunctionnal aim of an architecture and its effective use.
That lead to the study of two aspects and the links they have : the boudaryshape of the building and the contained circulation. Circulation system is directlylinked to a level of movement, and can be taken as a local description of floorplates,whereas the boundaries are more a global description. Such a study can also bedone at the urban scale, by searching the impacts of an imposed shape on internalcirculations.
We will see here first the pure shape aspect, then the influence of circulationon shape, and finally the inverse relation.
1 Unique shape approach
It can be useful to first describe the boundary shape in itself, since we will interestus later on clustering of shapes.
Given a boundary shape, it is possible to extract a polygonal approximation(which can be exact in the case of a polygonal shape, what is the most usedcase for the following studies), and then classify it through the classification ofthe polygon. It has been shown ([Missing reference]) that a polygonal shape canbe quite uniquely put in correspondance with 6 sets of reals numbers, that are,if we note, with S summits of the polygons, Ai(s) the set of depth i adjacentsummits to summit s, Sj
i = {d(k, a)j |k 2 S, a 2 Ai(k)}, the particular setsS11 , S1
2 , S13 , S2
1 , S22 and S2
3 . Such a classification of polygonal shapes is thestarting point of the following work, since we will work on unscaled polygonalshapes, i.e. with P set of polygonal shape and the equivalence relation on it :R : P1RP2 () (9↵ 2 R⇤, Sj
i (P1) = ↵Sji (P2), i = 1, 2, 3, j = 1, 2) , on the
quotient set P/R. On the following, when we consider polygonal shapes, it willalways be on that set.
2 From circulation to shape : the inside-out approach
This approach is a modular approach, in the sense that it goes from inside tooutside. The internal space influences the boundary shape. A shape can be
112

seen as the result of an equilibrium of constraints, external and internal forces.That approach is the consideration of the internal forces only, to understand theinfluence of internal constraints (for us the internal circulation) on the boundaryshapes. To do that, we concretely consider measures for these two parametersof the built environment and we plot different classes of polygonal shapes in theplan among these two measures, in order to try to bring out clustering patternsbetween the shapes. The measures are metric inertia, i. e. compactness andkinetic inertia, i. e. fragmentation coefficient of the space. [Note : measures notclearly defined ]
Plotting simple polygonal shapes shows some strong clustering in the plane,and some shapes appears to be optimal towards both measures. Adding con-straints on the shapes, as holes in polygonal shapes, shows also strongly localisedclustering, what suggest the relevance of the measures.
We can also study the correlation between the two measures by plotting mazesgenerated by precise rules on the internal circulation. Seeing the consequence ofthese rules on the relation compactness/circulation gives an idea of the correlation.
Finally, one application is plotting on the same graph real configurations atdifferent scales : building shapes, cities plans, etc. , to classify the real shapesregarding the clustering already done. No concluding result have been found yetbut this concrete application is our next goal in the research process.
3 Influence of shape on circulation
This process is quite the same as the previous one but the measure are different,we plot here the real shapes according to the real connectivity and the perceivedconnectivity (calculated through visual integration). At a greater scale, this isquite equivalent as studying the relation between urban shape and street networks.This work is also still in process, and should lead to a reciprocal confirmation ofthe results obtained with the previous approach.
113

Ulrika Karlsson, KTHBiotic interferencesThis presentation is more on research in pure design than in spatial analysis, butis closely linked to it because of the underlying systemic approach in the designprocess. It presents a work of integrated design lead by a multi-disciplinary teamat servo Stockholm and KTH, including researchers from several disciplines suchas Design, Architecture, Ecology of biodiversity, Composition of built materials.The project was called hydrophile, in relation to its particular aspects that wewill see in the following.
Presentation
To define the project in itself, which name is “biotic interference”, we need to comeback to the initial definition of these words : biotic means related with livingorganism, and interference should be taken here as the emergence from sharingby agents of a system. Here the abstract aim of the project is to create suchpositives interferences within a biotic system. It lays on the line of relationshipbetween technical design (mathematical aspects) and architecture.
An ubiquitous idea is the overreaching presence of nature, almost a symbiosisbetween all the dirts of nature and human being, as it can be feeled in the in-troduction sequence of the swedish film Melancholia, or in the artwork PartiallyBuried Woodshed by Robert Smithson.
In the 70s, Banham built in Los Angeles the first green roof building, in aexceptionaly innovative way, through the elegant combination of glass walls withthe turf roof. He was one of the first to propose ecology-oriented analysis of urbansystems and environmental designed architectural projects. He wrote theoricalexplanations in [2]. One ambitious aim of the project is to reinvent, to rethinkthat concept of green roof, in a innovative approach called the hydrodynamicgreen roof.
An overview of the project can be seen on figure 3.
Particular aspects
Biotope A focus was done on the place of biological species in the design ofthe project. A biotope map was created (figure 4), including all animal andvegetal species (as frogs, hooks, conifers, etc) and simulations on the influence ofthe project on these species was conducted. The main goal was to preserve andfurther encourage biodiversity.
114

Figure 3: Global view of the hydrophile
Technical aspects for the roof Since vegetals are implanted on the roof, thethickness of the substrate, its nature, and the material of the hard roof shouldhave influence on their development. Several tests around these parameters weredone. One important is the shape of the ground on which the substrate lies, andtherefore real tests were done on miniature versions of the roof.
Rainfall Hydrodynamic studies were needed to predict from the map of rainfallthe move of water on the roof. Hydrophobic and hydrophile surface are used toredirect places to wanted places. The protuberances are used for irrigation andnatural light inside the building.
Conclusion
The spirit of the project is to integrate biotic processes in archtitecture, and tohave a system globally adaptative to local disturbances, so it should be integratedvertically and horizontally.
115
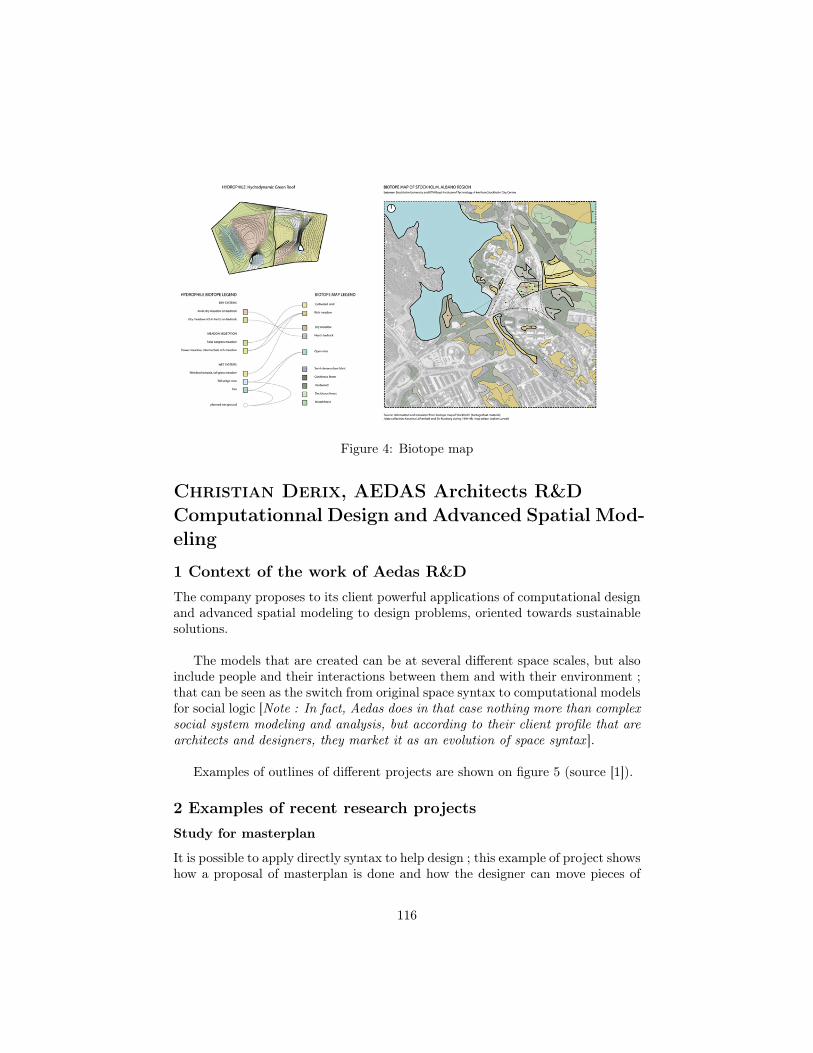
Figure 4: Biotope map
Christian Derix, AEDAS Architects R&DComputationnal Design and Advanced Spatial Mod-eling
1 Context of the work of Aedas R&D
The company proposes to its client powerful applications of computational designand advanced spatial modeling to design problems, oriented towards sustainablesolutions.
The models that are created can be at several different space scales, but alsoinclude people and their interactions between them and with their environment ;that can be seen as the switch from original space syntax to computational modelsfor social logic [Note : In fact, Aedas does in that case nothing more than complexsocial system modeling and analysis, but according to their client profile that arearchitects and designers, they market it as an evolution of space syntax ].
Examples of outlines of different projects are shown on figure 5 (source [1]).
2 Examples of recent research projects
Study for masterplan
It is possible to apply directly syntax to help design ; this example of project showshow a proposal of masterplan is done and how the designer can move pieces of
116
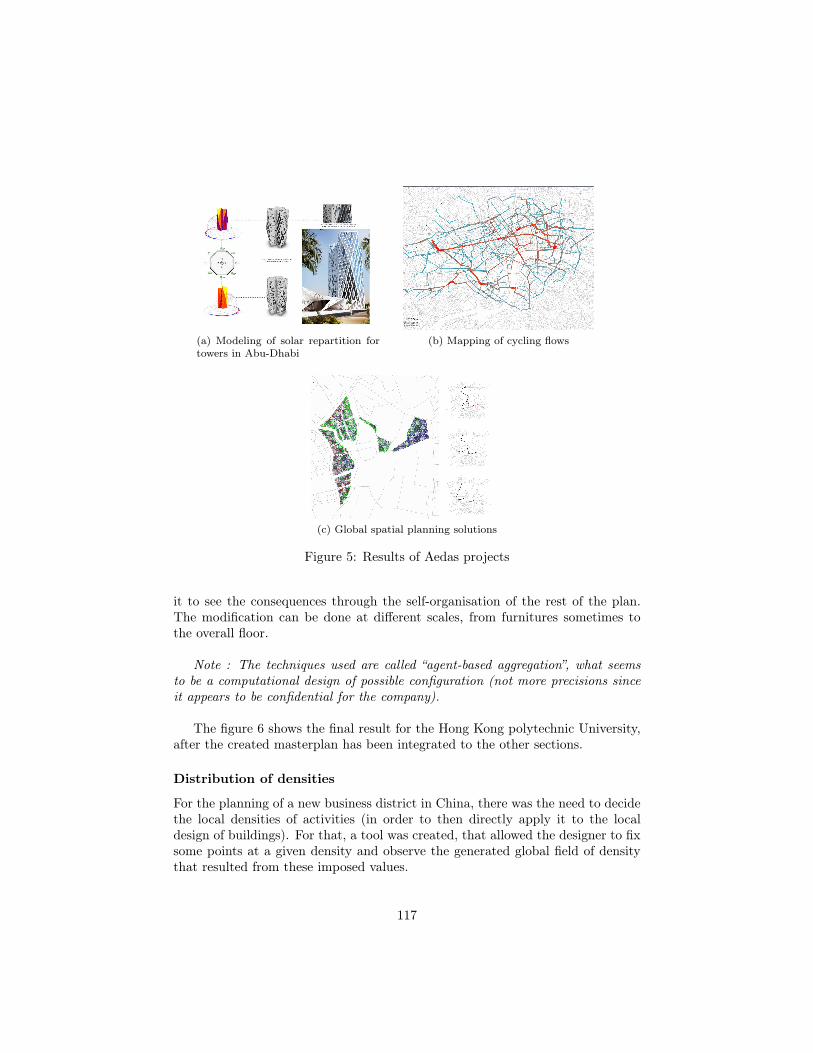
(a) Modeling of solar repartition for
towers in Abu-Dhabi
(b) Mapping of cycling flows
(c) Global spatial planning solutions
Figure 5: Results of Aedas projects
it to see the consequences through the self-organisation of the rest of the plan.The modification can be done at different scales, from furnitures sometimes tothe overall floor.
Note : The techniques used are called “agent-based aggregation”, what seemsto be a computational design of possible configuration (not more precisions sinceit appears to be confidential for the company).
The figure 6 shows the final result for the Hong Kong polytechnic University,after the created masterplan has been integrated to the other sections.
Distribution of densities
For the planning of a new business district in China, there was the need to decidethe local densities of activities (in order to then directly apply it to the localdesign of buildings). For that, a tool was created, that allowed the designer to fixsome points at a given density and observe the generated global field of densitythat resulted from these imposed values.
117
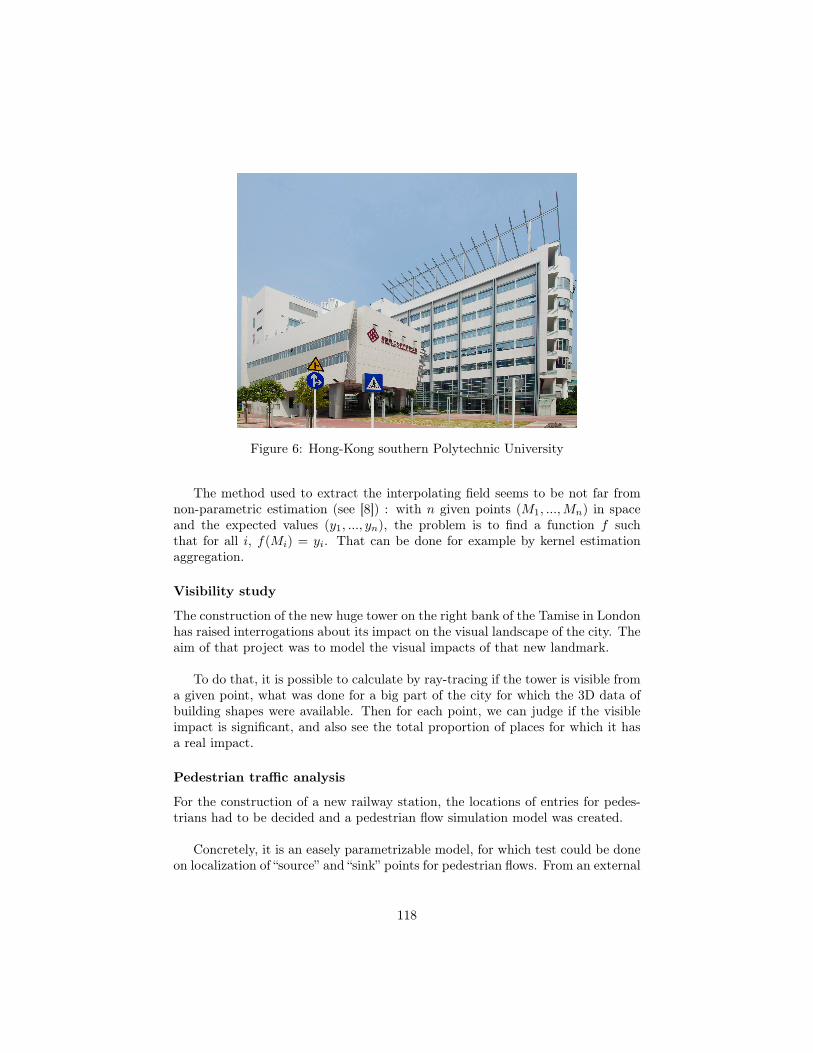
Figure 6: Hong-Kong southern Polytechnic University
The method used to extract the interpolating field seems to be not far fromnon-parametric estimation (see [8]) : with n given points (M1, ...,Mn) in spaceand the expected values (y1, ..., yn), the problem is to find a function f suchthat for all i, f(Mi) = yi. That can be done for example by kernel estimationaggregation.
Visibility study
The construction of the new huge tower on the right bank of the Tamise in Londonhas raised interrogations about its impact on the visual landscape of the city. Theaim of that project was to model the visual impacts of that new landmark.
To do that, it is possible to calculate by ray-tracing if the tower is visible froma given point, what was done for a big part of the city for which the 3D data ofbuilding shapes were available. Then for each point, we can judge if the visibleimpact is significant, and also see the total proportion of places for which it hasa real impact.
Pedestrian traffic analysis
For the construction of a new railway station, the locations of entries for pedes-trians had to be decided and a pedestrian flow simulation model was created.
Concretely, it is an easely parametrizable model, for which test could be doneon localization of “source” and “sink” points for pedestrian flows. From an external
118

points of view, it is quite similar to the problem of distribution of densities,although here the interest is more on the flow quantities resulting from fixedpotential points. But the method to solve the problem is exactly at the opposite,since for densities it was solved by a top-down calculation, by global mathematicalcalculations, and here the model used is a bottom-up approach, since it simulatesthe flows through individuals agents that are the pedestrian themselves.
Mapping architectural controversies
Urban studies are also sociological studies, as this project testify. Through news-paper articles analysis, it was possible to proceed to “social mapping”, and identifytrending subjects and social clustering around these key subjects.
What is really interesting is to make the parallel between the social systemand the architectural system analysis.
Questions
Question Do a global comparative knowledge emerge from all these researchprojects?
Yes but not formally, in the sense that no exhaustive list of knowledge wascreated in the company. But still, it contributes to the spread of such knowledgeand methods.
Question Was network self-generation already considered in one of the projects?Not at all ; but that seems interesting to consider. Self-generation following
local rules can be a way to proceed to global optimisation on some propoerties ofthe network, as nature does in some cases.
119
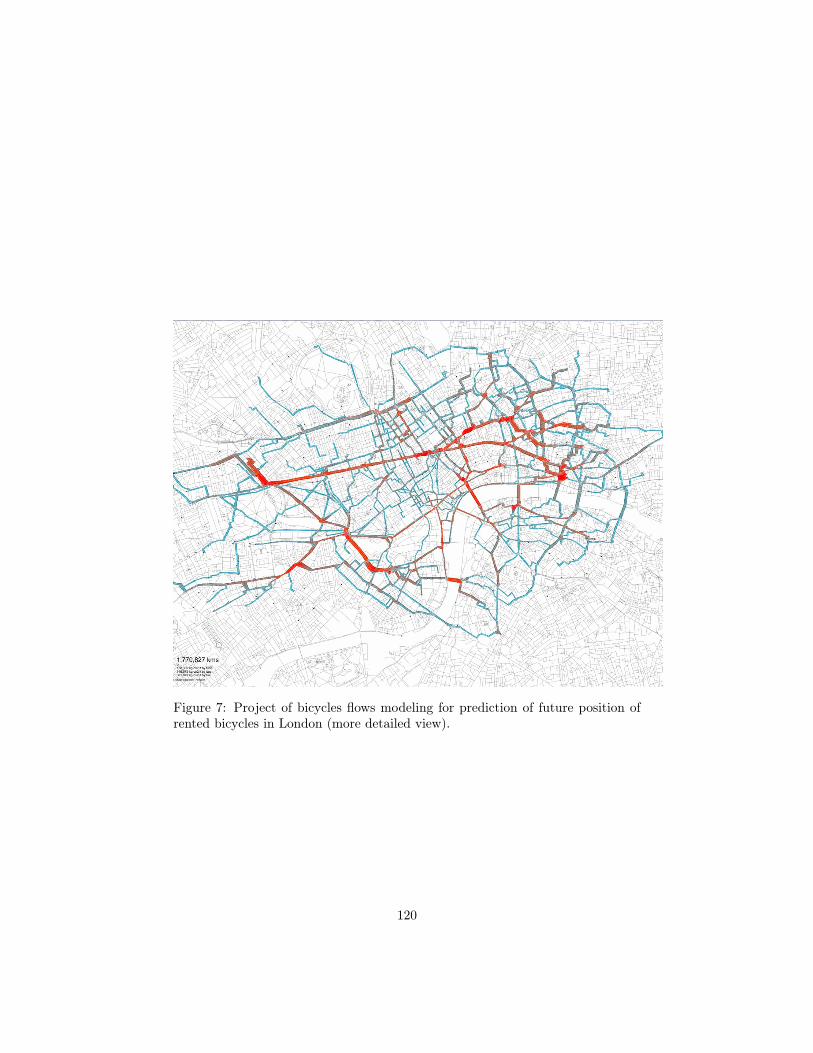
Figure 7: Project of bicycles flows modeling for prediction of future position ofrented bicycles in London (more detailed view).
120
åsmund Izaki, AEDAS Architects R&DAlgorithmic aspects of spatial analysisThat last presentation is a short overview of computer science issues that occurwhen doing spatial analysis and investigative modeling.
Complexity of algorithms
When doing computations, the speed depends on the machine on which theyare done, but what is really important is the intrinsic complexity of the usedalgorithm. For example, there exists many ways to sort a set of number, and thebest ones (quick sort or fusion) will have a mean complexity in O(n · ln(n)), whatcan be assimilated to a linear time as a function of the size of the set, whereas badones will execute in O(n2), what is quadratic and can quickly lead to impossiblecalculation times on big data.
This aspect is particularly important in spatial analysis because of the size ofthe data and the natural complexity of graph exploration problems, that’s whyfinding “good” algorithms for spatial analysis is necessary.
Difficulty of problems
When dealing with spatial generation algorithm, some technical problems appear,as the question of the calculation of visibilities, to obtain the integration of spatialvisibility. It is usually done through ray-tracing, but that suppose to test for smallspatial discretization if there are edges and if they are open, what can becomeslow if it is not done the good way (dynamic programming can help to make theprocess quickier).
Examples of applications
We propose concrete applications that are tools for the architect or the designer.For example, you have an interactive model calculating spatial and visual integra-tion, in which you can open/close doors, add new ones or deleting others. It is asort of “design in direct”, you directly see the consequence of your choices on theproperties of the building. An other example is a 3 dimensionnal configurationfor a building (a school), where you can also modify pieces and see consequenceson internal flows.
Note : main part of the presentation was after that the demonstration of thesesoftwares.
121

Conclusion
The architectural solution for a project is a particular response to the context ofthe project, a local proposal in space and time, but it is also a proposition forarchitecture in general. Architectural theory builds itself from concrete responsesto concrete cases.
What is important to understand is that we need to learn from all theseapplications, and from itself the theory should become more robust. Investigativemodeling is still at the beginning but should become more and more present inarchitectural projects and in urban planning tomorrow.
122
References[1] Aedas architectes webpage, 2013.
[2] Reyner Banham. Architecture of the Well-tempered Environment. Universityof Chicago Press, 1984.
[3] Italo Calvino. Invisible cities. Mariner Books, 1978.
[4] Bill Hillier, Adrian Leaman, Paul Stansall, and Michael Bedford. Space syntax.Environment and Planning B: Planning and Design, 3(2):147–185, 1976.
[5] Jane Jacobs. The Death and Life of Great American Cities. Vintage, 1956.
[6] Hashim Sarkis. Le Corbusier’s Venice Hospital and the mat building revival.Prestel Pub, 2001.
[7] Alison Smithson. How to recognize and read mat-building: Mainstream ar-chitecture as it has developed towards the mat building. Architectural Design,44(9):573, 1974.
[8] Alexandre B Tsybakov. Introduction to nonparametric estimation. (introduc-tion à l’estimation non-paramétrique.). 2004.
123

124

Appendice B
Description of model for daylight calculation
125

126

Basic model for daylight exposition calculation with
objective of urban contexts comparison
Juste RaimbaultChalmers Tekniska HögskolaDepartment of Architecture
AbstractIn the frame of a research of objective indicators of different types in
order to compare qualities of given urban contexts, it appeared that the
direct exposition of building windows to daylight (sunbeams) was quite
important for the life quality, since we wanted to apply our model to districts
without particular architectural programs, current residentials districts. We
propose therefore here a simplified but directly and quickly implementable
model for such comparisons, the aim being more to have an approximate
idea if great differences exists than very precise calculations, because it will
be used in a more general context.
Introduction
The importance of daylight on the perception of architectural objects, so thereforeof their quality, but also on direct life quality (health issues, natural need ofdaylight) are described in [4], and that’s why we would like to consider it as anevaluation criteria for urban districts. We place ourselves in the framework ofinvestigative modeling that is today strongly developing in architecture (see [3]): we want to use objective calculations and investigations on the studied objects.
If we consider buildings in themselves, it is possible to estimate subjectivelyand objectively the performance of the architecture regarding daylight treatment,but it is an evaluation of the individual architecture. More globally, we wouldlike to evaluate the performance of an urban configuration in that context, thatmeans not if the buildings see daylight (they always see it of course), but how thesunbeams come on building facades and the effect of shadows consequences of thedistrict configuration. A simplified example is if the designer creates line buildingsoriented North-South, it will be significantly more efficient to get sunbeams onfacades than if it was oriented East-West. Further, there are also the shadowseffects between buildings and natural elements of the site.
In [2], the authors study an elaborated model of daylight calculations, and wehave based ourselves on the same ideas for sunbeam calculations. In the following,we describe the theorical framework of the model and briefly give clues for quickconcrete implementation.
127

Model Description
Input Data
Sun course
We want to apply our model to districts located in different places, but alsointegrate on short and long time periods, so the input description of the suncourse will depend of the location L (location on earth, for which only latitudewill be influent) and of the time in the year T (in days).
The space is parametrized in spherical coordinates (adapted to the calcula-tions), a point in the sky is defined by (r, ✓,'). It is natural to make the assump-tion that the sun is located at r = +1 and that its relative position to every pointin the district is the same, given by the angles (✓,'). (it stays true as long as thestudied zone remains “small”, although we didn’t quantify this size, it appears asnormal that it is the case for a city district).
The course of the sun will by consequent be represented by a family of functions
(SL,T
)L,T
= (t 7! (✓L,T
(t),'L,T
(t)))L,T
that we will in input roughly approximate by regulars samplings (like everyhour for example) S(d)
L,T
= ((✓i,L,T
,'
i,L,T
))1iK
(K = 12 for 2 hour sampling forexample).
District configuration
We need to know the configuration of the buildings, but also their elevation(shadow effects). A simple way to represent it is just to give the height func-tion of the position in the district h(x, y), with (x, y) 2 P ⇢ R2 coordinate withindistrict bounds relative to an arbitrary origin. We can even by that mean rep-resent hills or trees (roughly simplified of course). Concretely, the input data isspatially discretised, and can be for example a GIS raster data.
Set of objective points (windows)
An other part of the architecture that is needed is the positions of windows inbuildings, that we will consider as a set of N “objective points” : ((x0
i
, y
0i
, z
0i
))1iN
,supposed to be compatible with the descriptive function h (the windows need tobe on the wall, so on vertical discontinuities of h). Of course the real windowsare more than points but we will assume the simplification that the windows isenlightened if its center is (which is the objective point), what shouldn’t be aproblem because of the small size of a window compared to a all building.
Calculation of indicators
Given this simple description of the district configuration, we are able to calculateindicators of the quantity of direct daylight exposition.
128
With ~u
r
(✓,') the radial unit vector corresponding to angles (✓,'), the ap-proximation that sunbeams come parallel on all points of our study zone givesdirectly the equivalence that M(x, y, z) is enlightened at time t of day T in L ()✓
L,T
(t) > 0 and M+R+·~ur
(✓L,T
(t),'L,T
(t))\S
(x,y)2P
[(x, y, 0)(x, y, h(x, y))] = ;.Concretely, the test shouldn’t be done on all P but on the projection of the
line for better performance, and the intersection tests can be done by discretisingthe segments. It is in fact necessary, since in 3 dimensions it will be easy tohave very close but not intersecting lines, which intersects in reality, that’s whythe discretisation is necessary (if we test among the projection, it will be on itsdiscretisation, and the given vertical segments will never exactly intersect the linesince we have float values).
Then it is possible to compute the “enlightening” functions for each point :
s
i
(L, T ) : t 7!(
1 if (x0i
, y
0i
, z
0i
) is enlightened at time t
0 otherwise
so their integration on the day gives the enlightening time ⌧i
(L, T ) =´ 24t=0 si(L, T )[t]dt,
measure that we need to normalise if we want to be coherent (compare absoluteenlightening times would have no sense because it depends directly of T and L).In that way we define the normalized enlightening time ⌧̃
i
(L, T ) by
⌧̃
i
(L, T ) =⌧
i
(L, T )´ 24t=0 ✓L,T (t)<⇡
2dt
Then we integrate on the all district by taking the normalized p-norm of thevector of these values : with p
d
2 [1; +1[, we define ⌧̃(L, T ) =���( ˜⌧
i
(L, T ))1iN
���pd
(with p
d
= 1 it gives the mean and p
d
= +1 the max).To conclude, we just need to consider it on a hole year. With p
Y
2 [1; +1[,the indicator that we will use to approximate and compare the global daylightexpositions is
S(L) = k(⌧̃(L, d))1d365kpY
Since that indicator is normalized by the relative day lengths and integratedon all district and all year, it should be a good candidate to represent the “per-formance” of the urban district regarding the daylight exposition, independentlyof its location : that tells if the buildings are agenced to profit at maximum ofthe light that is given.
Note that we normalized by an approximation of the length of the day andnot by the global enlightening time, because first it would be quite complicatedto have it as a data, and then it would make not real sense because the buildercan not change anything to that through design, the geometric configuration ofthe district has only interaction with the geometry of the sun course, not withthe fact that it is hidden or not.
129

Implementation
We are currently doing test to implement that model quickly and integrate it ina more global project. Follows important aspects related to the implementation.
Software Because we place ourselves in a project which main part consists ofAgent-Based Modeling, we choose the plateform NetLogo ([5]) for compatibilityreasons. In fact it appears to be particularly ergonomic for that case, because ofthe efficient GIS extension, and the system of the world divised in patches thatare already the spatial discretisation we wanted.
Input data Concerning the sun course, as explained before we can take samplesof the position each hour, and the same on the year (each two weeks for example),so the input can be a simple list of couples.
For the height configuration, we can use GIS raster data as input. Data canbe available from precise Lidar data, a mean to get precise mappings that havebecome more popular and efficient quite recently (see [1] for example), and insome countries extended coverage has been proceded, at least in great cities (forSweden we have available data). These height data are very precise (50cm) andare particularly adapted to our problem.
Finally, for the windows position, we could input the exact configuration, butthat would require field survey. Instead, we can simplify by approximating a givennumber of windows per square meter on facades (will depend on architecture ofcourse, but we can consider a mean on the district), then extract hypotheticposition from facades shapes (what are themselves calculated by searching thevertical discontinuities of the height function), so we don’t need more input bydoing that way.
Conclusion
Although a lot of approximations are done in the model, the approximated outputvalues can be used for comparison purposes, and that gives us an objective criteriato evaluate performance of a district regarding enlightening, that we can integratein a global comparison of different districts among criteria of various types.
130

References
[1] Y. Hu. Automated extraction of digital terrain models, roads and buildings
using airborne lidar data. PhD thesis, University of Calgary (Canada, 2004.
[2] Francis Miguet and Dominique Groleau. A daylight simulation tool for urbanand architectural spaces—application to transmitted direct and diffuse lightthrough glazing. Building and environment, 37(8):833–843, 2002.
[3] KTH School of Architecture Stockholm. Architectural morphology : Inves-tigative modeling and spatial analysis, public research workshop, 14th may2013.
[4] D Phillips. Daylighting: Natural light in architecture. Amsterdam, 2004.
[5] U. Wilensky. Netlogo. Center for Connected Learning and Computer-BasedModeling, Northwestern University, Evanston, IL., 1999.
131

132

Appendice C
Elaboration of the calibration process
133

134

Basic model calibration
Experience plan
The experience plan for model calibration will be a regular grid within an hy-percube in the parameter space. Since we proceed first to a single objectivecalibration, for which the objective function is the mean square error betweenthe simulated values of a given time-serie and their real values according to thedata we dispose, and since the theorical description of the model is not easily pro-jectable in a space on which cross-mutations dicted by evolutionnary algorithmsare possible, we choose to proceed to a brutal calibration through an explorationof the hypercube.
Exploration domain If we need to calibrate the model on K parameters(p1, ... , p
K
) 2 [pmin
1 , pmax
1 ]⇥ ...⇥ [pmin
K
, pmax
K
] with corresponding precision steps(pstep1 , ... , pstep
K
), a minimal replication number ⌧K
for which the output valueare considered as acceptable, that depends on parameters and on given trust in-tervals on the output values (empirically we will fix that number according tofirst experienced outputs, since the sensitivity of output variances regarding tothe parameters seems to be relatively small), and a maximal execution time forone replication T
max
(also empirically fixed by experiences), then the necessarycalculation time will be bounded by
jp
max
1 �p
min
1
p
step
1
k⇥ ...⇥
jp
max
K
�p
min
K
p
step
K
k· ⌧
K
· Tmax
which is, with M = max1iK
(pmax
i
�p
min
i
p
step
i
), unfortunately a O(MK) : the bru-tal exploration time increase exponentially on the number of parameters, whichleads us to try to fix the most possible number of parameters value by evaluatinga real world approximation, what is possible only for parameters that are preciseproxies.
Gradient descent optimisation After having minimized the size of the ex-ploration domain, we will proceed to the optimization of the mean-square erroron that remaining domain. If the function is quite regular, a direct application ofa gradient-descent method on the multi-variable function should be a huge gainof time and lead to a quick model calibration. However, if there exists chaoticbehaviours and a lot of local minima, the optimization can in worst case be ascostly as the hole exploration of the grid within the hypercube. In that case,we will not be able to calibrate on more than 3 or 4 parameters on reasonablecalculation times (let say one day). Furthermore, it is not yet possible to say if
135
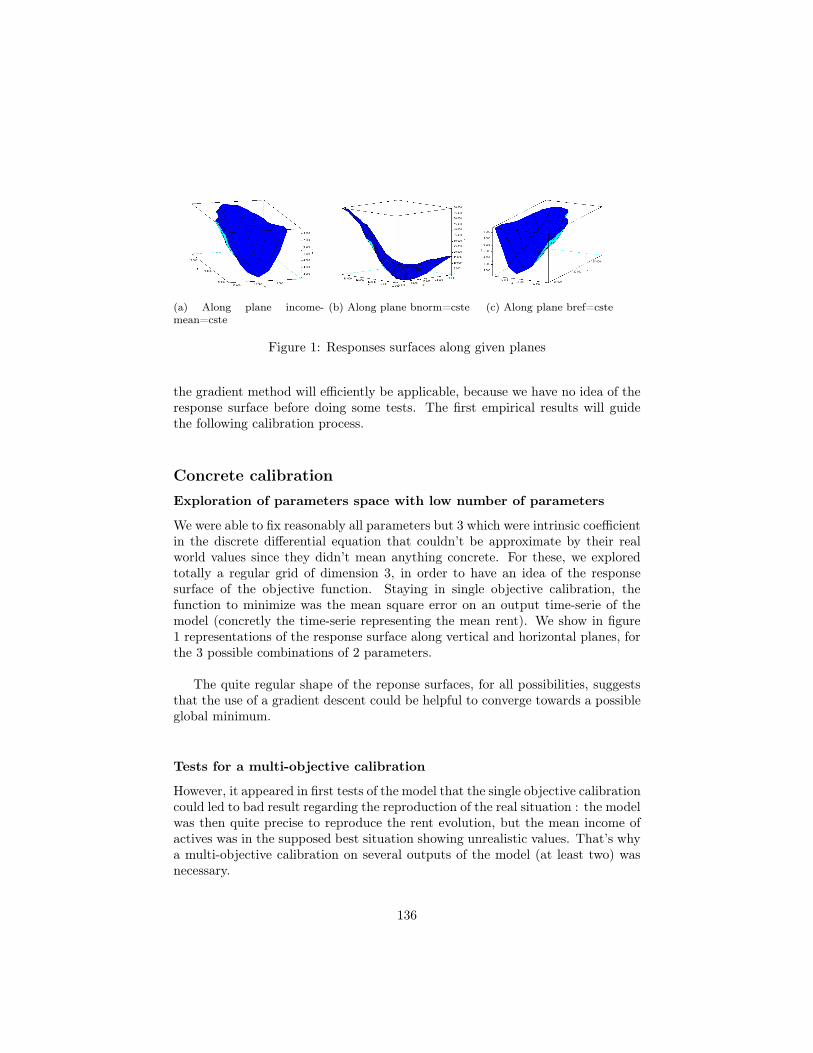
(a) Along plane income-
mean=cste
(b) Along plane bnorm=cste (c) Along plane bref=cste
Figure 1: Responses surfaces along given planes
the gradient method will efficiently be applicable, because we have no idea of theresponse surface before doing some tests. The first empirical results will guidethe following calibration process.
Concrete calibration
Exploration of parameters space with low number of parameters
We were able to fix reasonably all parameters but 3 which were intrinsic coefficientin the discrete differential equation that couldn’t be approximate by their realworld values since they didn’t mean anything concrete. For these, we exploredtotally a regular grid of dimension 3, in order to have an idea of the responsesurface of the objective function. Staying in single objective calibration, thefunction to minimize was the mean square error on an output time-serie of themodel (concretly the time-serie representing the mean rent). We show in figure1 representations of the response surface along vertical and horizontal planes, forthe 3 possible combinations of 2 parameters.
The quite regular shape of the reponse surfaces, for all possibilities, suggeststhat the use of a gradient descent could be helpful to converge towards a possibleglobal minimum.
Tests for a multi-objective calibration
However, it appeared in first tests of the model that the single objective calibrationcould led to bad result regarding the reproduction of the real situation : the modelwas then quite precise to reproduce the rent evolution, but the mean income ofactives was in the supposed best situation showing unrealistic values. That’s whya multi-objective calibration on several outputs of the model (at least two) wasnecessary.
136

Figure 2: Projection of realizations in the plan of both mean-square errors. Greencurve corresponds to the equation MSE1+MSE2 = cste, so the horizontal shapeconfirms the magnitude property is verified.
In that case, the simple but expensive method is the total exploration of thegrid as we did for the initial tests. The calculation time (1 day) makes it notpossible to use in a simple run of the model, what we would like to have (severalcases of real values for the other parameters may be tested, so we want to havea immediate calibration before running the model, according to the values of thepther parameters). Furthermore, the use of evolutionnary algorithm is also notpossible as we explained in introduction.
The only solution left is the use of an aggregated error function and a gradientdescent on that function. Fortunately, the magnitude of the two main errorsfunctions were quite different, as the tests have shown it. We can verify on figure2 that property on experimentals outputs of the model.
To conclude, the method finally used is a gradient descent on the aggregatedmean-square errors on the two objective time-series.
137

138

Appendice D
Description of research project
139

140

Application of evidence-based methods to the test of a
multi-value evaluation framework
for sustainable renovation
Juste Raimbault
Chalmers Tekniska HögskolaDepartment of Architecture
April 14th, 2013
Presentation of research project under the direction of
Karim Basbous
Ecole Polytechnique, Département HSS
Paula Femenias
Chalmers Tekniska Högskola, Department of Architecture
Liane Thuvander
Chalmers Tekniska Högskola, Department of Architecture
Abstract
We present here in details the planned project for our research intern-
ship, that will be based on the same theorical basis that we presented in the
first draft of the project ([20]), but will take place in a particular context re-
garding the objective and concrete applications : indeed, we will work in the
frame of a recent research project called ReBo conducted by Chalmers’ De-
partment of Architecture, which aim is to show the necessity of considering
several fields in the process of sustainable refurbishment of housing stocks
and to propose a framework usable by the different involved stakholders to
take all these aspects into account.
141
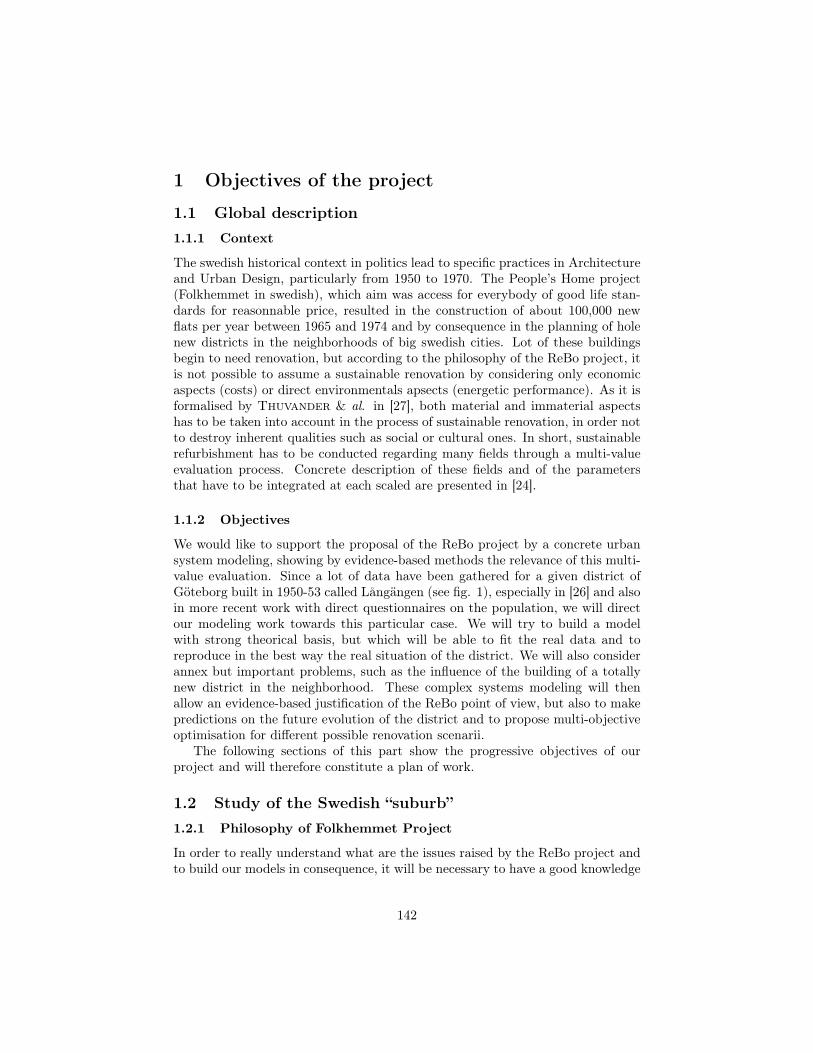
1 Objectives of the project
1.1 Global description
1.1.1 Context
The swedish historical context in politics lead to specific practices in Architectureand Urban Design, particularly from 1950 to 1970. The People’s Home project(Folkhemmet in swedish), which aim was access for everybody of good life stan-dards for reasonnable price, resulted in the construction of about 100,000 newflats per year between 1965 and 1974 and by consequence in the planning of holenew districts in the neighborhoods of big swedish cities. Lot of these buildingsbegin to need renovation, but according to the philosophy of the ReBo project, itis not possible to assume a sustainable renovation by considering only economicaspects (costs) or direct environmentals apsects (energetic performance). As it isformalised by Thuvander & al. in [27], both material and immaterial aspectshas to be taken into account in the process of sustainable renovation, in order notto destroy inherent qualities such as social or cultural ones. In short, sustainablerefurbishment has to be conducted regarding many fields through a multi-valueevaluation process. Concrete description of these fields and of the parametersthat have to be integrated at each scaled are presented in [24].
1.1.2 Objectives
We would like to support the proposal of the ReBo project by a concrete urbansystem modeling, showing by evidence-based methods the relevance of this multi-value evaluation. Since a lot of data have been gathered for a given district ofGöteborg built in 1950-53 called Långängen (see fig. 1), especially in [26] and alsoin more recent work with direct questionnaires on the population, we will directour modeling work towards this particular case. We will try to build a modelwith strong theorical basis, but which will be able to fit the real data and toreproduce in the best way the real situation of the district. We will also considerannex but important problems, such as the influence of the building of a totallynew district in the neighborhood. These complex systems modeling will thenallow an evidence-based justification of the ReBo point of view, but also to makepredictions on the future evolution of the district and to propose multi-objectiveoptimisation for different possible renovation scenarii.
The following sections of this part show the progressive objectives of ourproject and will therefore constitute a plan of work.
1.2 Study of the Swedish “suburb”
1.2.1 Philosophy of Folkhemmet Project
In order to really understand what are the issues raised by the ReBo project andto build our models in consequence, it will be necessary to have a good knowledge
142
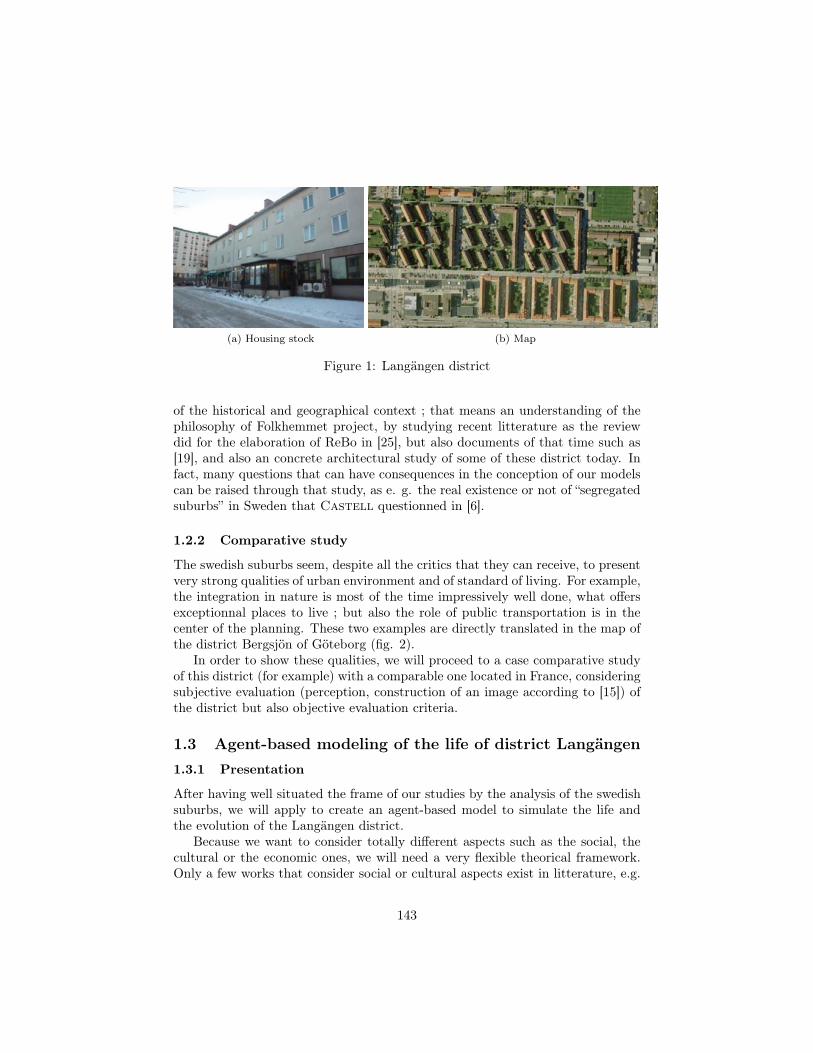
(a) Housing stock (b) Map
Figure 1: Langängen district
of the historical and geographical context ; that means an understanding of thephilosophy of Folkhemmet project, by studying recent litterature as the reviewdid for the elaboration of ReBo in [25], but also documents of that time such as[19], and also an concrete architectural study of some of these district today. Infact, many questions that can have consequences in the conception of our modelscan be raised through that study, as e. g. the real existence or not of “segregatedsuburbs” in Sweden that Castell questionned in [6].
1.2.2 Comparative study
The swedish suburbs seem, despite all the critics that they can receive, to presentvery strong qualities of urban environment and of standard of living. For example,the integration in nature is most of the time impressively well done, what offersexceptionnal places to live ; but also the role of public transportation is in thecenter of the planning. These two examples are directly translated in the map ofthe district Bergsjön of Göteborg (fig. 2).
In order to show these qualities, we will proceed to a case comparative studyof this district (for example) with a comparable one located in France, consideringsubjective evaluation (perception, construction of an image according to [15]) ofthe district but also objective evaluation criteria.
1.3 Agent-based modeling of the life of district Langängen
1.3.1 Presentation
After having well situated the frame of our studies by the analysis of the swedishsuburbs, we will apply to create an agent-based model to simulate the life andthe evolution of the Langängen district.
Because we want to consider totally different aspects such as the social, thecultural or the economic ones, we will need a very flexible theorical framework.Only a few works that consider social or cultural aspects exist in litterature, e.g.
143
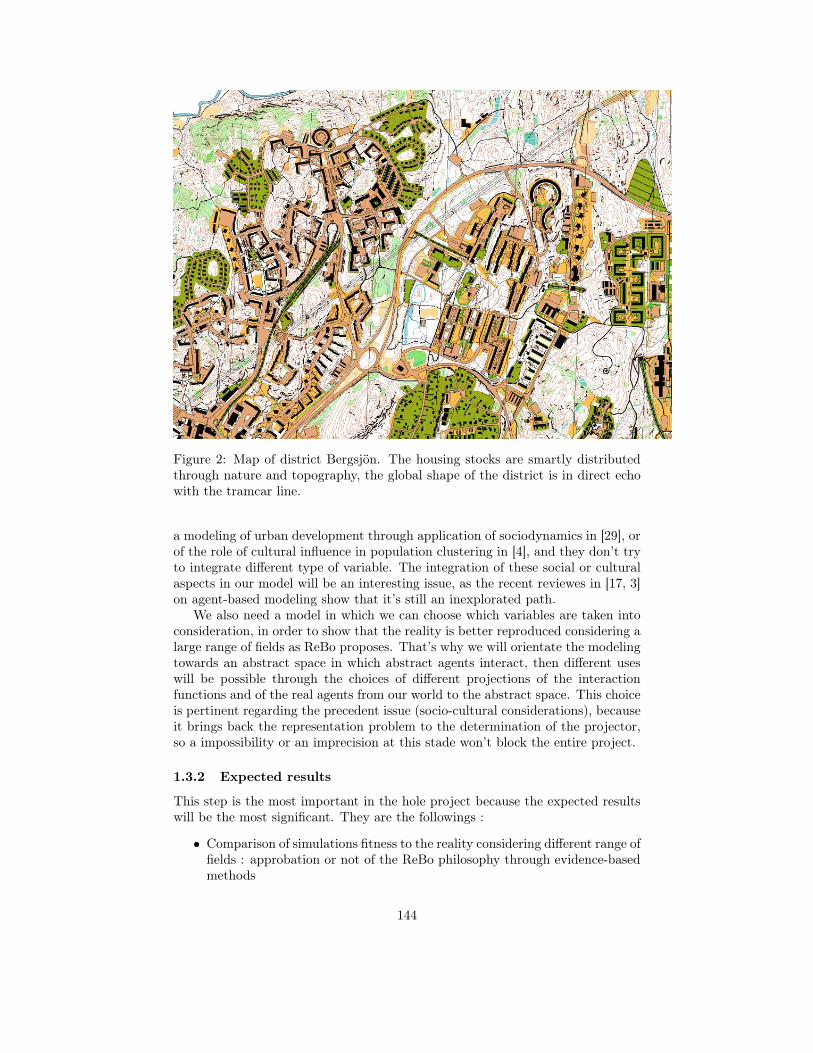
Figure 2: Map of district Bergsjön. The housing stocks are smartly distributedthrough nature and topography, the global shape of the district is in direct echowith the tramcar line.
a modeling of urban development through application of sociodynamics in [29], orof the role of cultural influence in population clustering in [4], and they don’t tryto integrate different type of variable. The integration of these social or culturalaspects in our model will be an interesting issue, as the recent reviewes in [17, 3]on agent-based modeling show that it’s still an inexplorated path.
We also need a model in which we can choose which variables are taken intoconsideration, in order to show that the reality is better reproduced considering alarge range of fields as ReBo proposes. That’s why we will orientate the modelingtowards an abstract space in which abstract agents interact, then different useswill be possible through the choices of different projections of the interactionfunctions and of the real agents from our world to the abstract space. This choiceis pertinent regarding the precedent issue (socio-cultural considerations), becauseit brings back the representation problem to the determination of the projector,so a impossibility or an imprecision at this stade won’t block the entire project.
1.3.2 Expected results
This step is the most important in the hole project because the expected resultswill be the most significant. They are the followings :
• Comparison of simulations fitness to the reality considering different range offields : approbation or not of the ReBo philosophy through evidence-basedmethods
144

• Prediction of future evolution of the district thanks to the calibration onpast and present data
• Multi-objective optimisation on different possible renovation scenarii
1.4 Coupling with an evolutive model for the new district
We also keep in mind our initial proposal of project which was the design of atool to propose automatic shape design through multi-criteria optimisation forthe building of a new district from scratch. Depending on the time we have leftand on the qualities of the results of the precedent parts, we will try to constructthis tool and adapt it to the new district that will be soon built beside Langängen.It will be more probably an evolutive Cellular Automaton model, as we used in[21] on the basis of classical works such as [2, 5, 18].
After that, we will try to operate a heterogeneous model coupling with the firstmodel, in order to represent the influence of the construction of that new districtaside Langängen. It may have huge consequences, as we can imagine that forexample, a rich population linked to a high rent standard in the new district willcertainly mutate the neighborhood and lead to a rent increase in Langängen, whatcould be not desirable for the stability of the district considering the actual socialprofile of its inhabitants. That justifies the interest of modeling the interactionsbetween the two districts.
The expected results of this last part of the project are also quite important :
• Multi-objective optimisation on possible building configurations for the newdistrict alone
• Multi-objective optimisation of the consequences on Lagängen on possibleconfigurations for the new district
• Shape designing framework interesting in itself (initial project)
2 Main issues and points of particular interestWe present here quickly the main issues that could appear during the developmentof the project. The approaches and answers that we will give to them will bealmost as important as the results. The list is of course not exhaustive, since thereal ones appear all along the development work and can only be seen through astepping back on the project after it is finished.
2.1 Philosophical issues
2.1.1 For a better understanding of “sustainable”
In the common sense, there is a misunderstanding of the notion of “sustainable”,since it is mostly directly associated with “good environmental performances”.
145

That is surely part of it but it must not hide the other aspects such as socialsustainibility, cultural conservation, economic sustainibility. The sustainibility ofa complex system is closely linked to his resilience and is therefore an emergingproperty that cannot be deduced from a single variable of the system. The philos-ophy of the ReBo project follows exactly this idea, and one of its aim is to awareof that fact all the common stakeholders involved in the renovation processes, ormore generally in all the planning or building processes.
2.1.2 On the notion of “suburb”
The perception of the “suburbs” and of the segregation of ethnic groups thatcould be associated can be strongly controversial. In [6], the swedish suburbsare questioned, and policies are proposed to counter the increasing segregation.But this notion of segregation can in itself be discussed, as e. g. the authors of[13] contradict the results on segregation in London’s suburbs proposed in [22].The signification of the notion of “suburb” and the associated problems is aninteresting issue that we will touch.
2.1.3 Objective modeling of subjective aspects?
The precedent problem raises the question of definition and measures of subjectivephenomena, which is globally recurrent in social sciences.
It is the same for the evaluation of the quality of life which will be central inour modeling. As the question of the definition of utility in economy, we need tofind objective criteria which the aggregation (in the better case) or the commonconsideration will represent a proxy of the quality of life of an individual. Aquite exhaustive review of such techniques is done in [7], and we can begin byoverlapping them with the concrete needs of our modeling.
We may also try to integrate the architecture as an agent, so the subjectiverelations of other agents to it could be complicated to model.
2.2 Issues for Urban systems modeling
2.2.1 Choice of indicators and measures
A current issue in Urban design is the “good” choice of measures and indicatorsfor an urban configuration, and that’s not always the most elaborated that arethe most appropriate.
For example, the Moran indice, proposed in [14] to measure the regularity ofthe spatial distribution of the city, is not adapted to the spatial intercorrelationof more than one field, so it is in that case needed to simplify it for a workinggeneralisation.
Also concerning the morphological properties of an urban shape, we needmost of the time to extract the real enveloppe of the city to calculate pertinent
146

measures, and that is a complicated problem that has just recently have hadsolutions, through distorsions techniques proposed in [10, 23].
Plenty of indicators are proposed in [28] to measure urban sprawl, and it isnot evident which one are pertinent. That shows that the choice of indicators isalso a real issue here.
2.2.2 On the need of diversification
The preliminary researches for the comparative study of swedish suburb districtagainst a french one lead to the question of local diversification of activities.
The spatial diversification of the urban space and the local diversification ofactivities seems to be positive according to most of actual architectes and planners.But in a logical way there exists an inferior limit to this diversification since thesize of the urban components decrease as a function of the diversification level,and there is a limit size for the functionnality of this components. We can thenmake the conjuncture that an urban system would have an “optimal” level ofdiversification (for each fixed set of other parameters of the urban system). Thesearch in litterature about that problem gave no results although that appears tobe an important issue, so we may give us time to search around this question byqualitative analysis and simple model building.
2.2.3 Level of complexity of the models
Most of existing complex models of urban systems concern each time particularaspects and not so much take into account a diversity in type of parameters andvariables. One issue will be to test the coherence of putting together multipletype of variables, and to which level we can increase the complexity of the modelwithout making it disconnected from the reality. We hope that the abstractionexplained precendently will help to consider the largest number of variables andparameters.
2.3 Technical issues
2.3.1 Scale and heterogeneous model coupling
Integrated multi-scale model The ABM for Langangen district will needto consider at least two scales, because of the type of the data that have beencollected, which are sometimes at the scale of all the district himself, sometimes ata more local scale (building or people themselves for the questionnaires). The idealsituation for the model we want to create would to obtain an integrated multi-scale model, containing at least these two distincts scales in order to have thebest inclusion for all available data. However, multi-scale models are often hardto construct, so that should be an interesting issue. A proposition of integrationis described in [12], where the scale coupling is realised through a system couplingof all subsystems that can then be seen as agents for the global system.
147

Heterogeneous model coupling An other technical problem that can occurin the last part of the project is the coupling between the two models. In fact,the differente nature of the two models will raise difficulties in finding the way toconnect the outputs with the inputs, and at which level the connections are done.We could need to proceed to an abstract formulation of the coupling process, sincea lot of litterature have been developped on the subject, as the DEV formalismpresented in [9].
2.3.2 Model calibration
Once the model is constructed and implemented, a huge problem is its calibration,that means finding the values of parameters that lead to the best fitting of theresults obtained to reality. This process has no simple solution in general andoften takes a lot of time because of the large calculation it needs. We will have tofind the more efficient approximate solution for our problem and proceed it in areasonnable time. This problem occurs in quite different fields such as hydrologicmodels ([11, 16]) or applied economics ([30]), but is in fact always the same andworking solutions are proposed in this specialized litterature, our problem will beto adapt them to our field.
2.3.3 Multi-objective optimisation through Evolutionnary Algorithms
The Pareto-front approach for multi-criteria optimisation works well when theset of configurations stays discrete and of small cardinal, since the complexityof a brutal domination-test algorithm is in O(d · n2) where n is the number ofpoints and d the dimension of the criteria space. But as we tend to continuousdistribution of configuration, that can’t work anymore and specific multi-objectiveoptimisation algorithms are needed. The most common family of such algorithmstoday is the Evolutionnary Algorithms, also known as genetic algorithms. Theyallow the determination of a continous Pareto-front, which can be interesting forthe decision-maker if the optimised function is a homeomorphism (otherwise thesolutions could have no sense), because he can then choose along a continuous setof propositions. Such algorithms are described and compared in [31, 1, 8], and itappears that the choice of the exact method will depend on the situation we aredealing with.
Depending on the size of the set of configurations we will work and on severaltests we will proceed around these techniques, we may use a non-parametric esti-mation of the functions representing the criteria and then extract the continuousPareto-front instead of a discrete one which may not be sufficient.
148
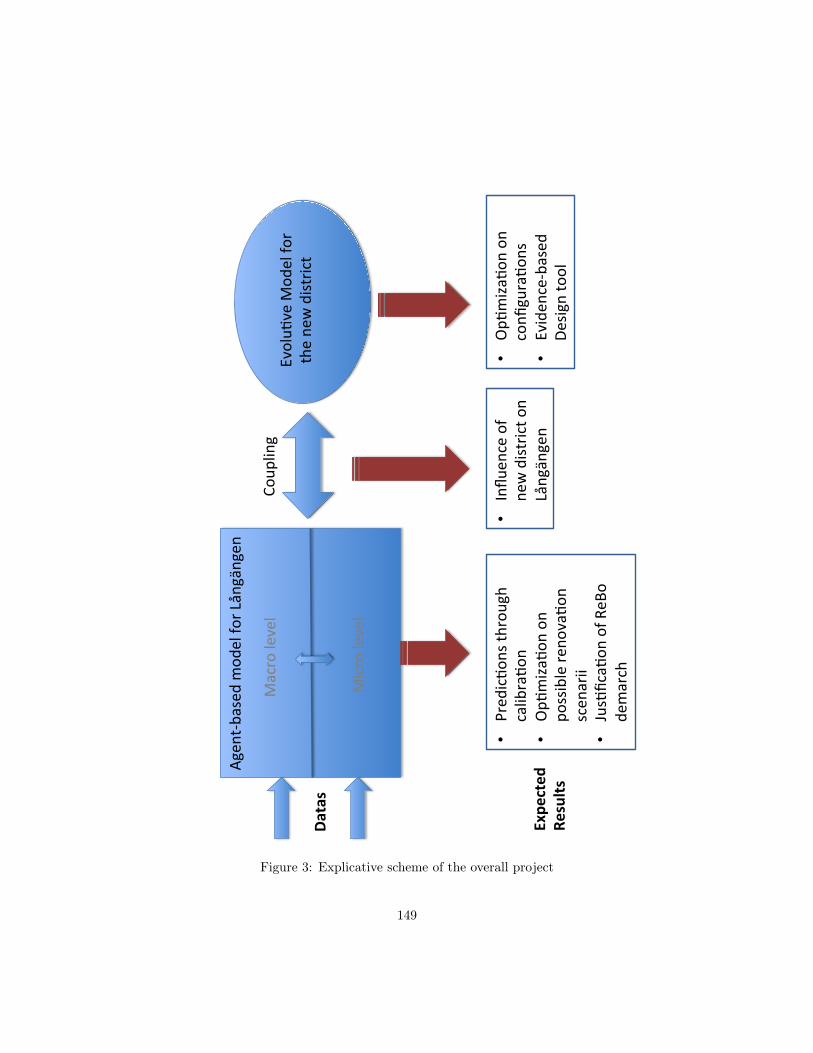
Agen
t&based+mod
el+fo
r+Långängen
++
Macro+level+
Micro+level+
Datas%
Coup
ling+
Evolu<
ve+M
odel+fo
r++th
e+ne
w+district+
Expe
cted
%Re
sults%
• Pred
ic<o
ns+th
rough+
calibra<o
n+•
Op<
miza
<on+on
+po
ssible+re
nova<o
n+scen
arii+
• Jus<fica<
on+of+R
eBo+
demarch+
• Op<
miza
<on+on
+confi
gura<o
ns+
• Eviden
ce&based
+De
sign+tool+
• Influ
ence+of+
new+district+o
n+Långängen+
Figure 3: Explicative scheme of the overall project
149

ConclusionWe have presented the global framework for our project and its objectives, themost important is the translation of the philosophy of the ReBo project in UrbanModels in order to show its relevance and efficiency. The other objectives are alsoimportant since they can lead to real proposition of architectural and planningchoices for the decision makers. We can see on Fig. 3 a recapitulative scheme ofthe overall project, that shows the working plan and the expected results. We willalways work carefully keeping in mind the global context of the Swedish suburb,and the preliminary historical and architectural study will help us for that. Somechallenges may not be solved and we may adapt our working plan in consequence; that is not a problem but more an advantage, because it is the nature of researchin itself.
150

References[1] Hussein A Abbass, Ruhul Sarker, and Charles Newton. Pde: A pareto-
frontier differential evolution approach for multi-objective optimization prob-lems. In Evolutionary Computation, 2001. Proceedings of the 2001 Congresson, volume 2, pages 971–978. IEEE, 2001.
[2] Michael Batty. Cities and Complexity: Understanding Cities with CellularAutomata, Agent-based Models, and Fractals. MIT Press, 2007.
[3] Michael Batty, Andrew T. Crooks, Linda M. See, and Alison J. Heppenstall.Perspectives on agent-based models and geographical systems. In Alison J.Heppenstall, Andrew T. Crooks, Linda M. See, and Michael Batty, editors,Agent-Based Models of Geographical Systems, pages 1–15. Springer Nether-lands, 2012.
[4] Itzhak Benenson. Multi-agent simulations of residential dynamics in the city.Computers, Environment and Urban Systems, 22(1):25–42, 1998.
[5] Geoffrey Caruso, Gilles Vuidel, Jean Cavailhes, Pierre Frankhauser, Do-minique Peeters, and Isabelle Thomas. Morphological similarities betweendbm and a microeconomic model of sprawl. Journal of Geographical Systems,13:31–48, 2011.
[6] Pål Castell. The swedish suburb as myth and reality. Pål Castell (2010),Managing yard and togetherness: living conditions and social robustnessthrough tenant involvement in open space management, Chalmers Univer-sity of Technology, Göteborg., (Part 2, Thematic Paper E), 2010.
[7] Vânia Aparecida Ceccato. Understanding Urban Patterns : Qualitative andQuantitative Approaches. PhD thesis, Kungliga Tekniska högskolan, Stock-holm, 2001.
[8] David W Corne, Joshua D Knowles, and Martin J Oates. The paretoenvelope-based selection algorithm for multiobjective optimization. In Par-allel Problem Solving from Nature PPSN VI, pages 839–848. Springer, 2000.
[9] R. Duboz. Intégration de modèles hétérogènes pour la modélisation et lasimulation de systèmes complexes. PhD thesis, Laboratoire d’Informatiquedu Littoral — UPRES JE-2335, 2004.
[10] Pierre Frankhauser and Cécile Tannier. A multi-scale morphological ap-proach for delimiting urban areas. In 9th Computers in Urban Planningand Urban Management conference (CUPUM’05), University College Lon-don, 2005.
[11] Hoshin Vijai Gupta, Soroosh Sorooshian, and Patrice Ogou Yapo. Towardimproved calibration of hydrologic models: Multiple and noncommensurablemeasures of information. Water Resources Research, 34(4):751–763, 1998.
151

[12] AlfonsG. Hoekstra, Alfonso Caiazzo, Eric Lorenz, Jean-Luc Falcone, andBastien Chopard. Complex automata: Multi-scale modeling with coupledcellular automata. In Jiri Kroc, Peter M.A. Sloot, and Alfons G. Hoek-stra, editors, Simulating Complex Systems by Cellular Automata, volume 0of Understanding Complex Systems, pages 29–57. Springer Berlin Heidelberg,2010.
[13] Ron Johnston, Michael Poulsen, and James Forrest. On the measurementand meaning of residential segregation: a response to simpson. Urban studies,42(7):1221–1227, 2005.
[14] Florent Le Néchet and Anne Aguilera. Déterminants spatiaux et sociaux dela mobilité domicile-travail dans 13 aires urbains françaises : une approchepar la forme urbaine, à deux échelles géographiques. In ASRDLF 2011,SCHOELCHER, Martinique, July 2011. http://asrdlf2011.com/.
[15] Kevin Lynch. The Image of the City. MIT Press, 1960.
[16] Henrik Madsen. Automatic calibration of a conceptual rainfall–runoff modelusing multiple objectives. Journal of hydrology, 235(3):276–288, 2000.
[17] RobinB. Matthews, NigelG. Gilbert, Alan Roach, J.Gary Polhill, and NickM.Gotts. Agent-based land-use models: a review of applications. LandscapeEcology, 22(10):1447–1459, 2007.
[18] Diego Moreno, Dominique Badariotti, and Arnaud Banos. Un automatecellulaire pour expérimenter les effets de la proximité dans le processusd’étalement urbain : le modèle raumulus. Cybergeo : European Journalof Geography, 2009.
[19] Ella Ödmann and Gun-Britt Dahlberg. Urbanization in Sweden: Means andmethods for the planning. Allmänna förlaget Uddevalla, 1970.
[20] J. Raimbault. Application of evidence-based methods to the design of a newsustainable district. Research internship project proposition, 2012.
[21] J. Raimbault. Evidence-based choices in urban planning, application of urbanframework evolution models. Rapport de Projet de Sciences des SystèmesComplexes, M1 Complex Systems Ecole Polytechnique, 2012.
[22] Ludi Simpson. Statistics of racial segregation: measures, evidence and policy.Urban studies, 41(3):661–681, 2004.
[23] Cécile Tannier, Gilles Vuidel, and Pierre Frankhauser. Délimitationd’ensembles morphologiques par une approche multi-échelle. In J.-C. Foltête,editor, Actes des huitièmes Rencontres de Théo Quant, page 14, Besançon,France, 2008. http://thema.univ-fcomte.fr/theoq/.
152

[24] Liane Thuvander, Paula Femenias, and Pär Meiling. Strategies for an inte-grated sustainable renovation process: Focus on the swedish housing stock‘people’s home’. In Proceedings from the International Sustainable BuildingConference SB11 in Helsinki 18-21October 2011, 2011.
[25] Liane Thuvander, Paula Femenias, and Pär Meiling. Description of the peo-ple’s home building stock in sweden. Technical report, Chalmers TekniskaHögskola, Departement of Architecture, Göteborg, 2012.
[26] Liane Thuvander, Paula Femenias, and Pär Meiling. En rebo-rapport : caselångängen. Technical report, Chalmers Tekniska Högskola, Departement ofArchitecture, Göteborg, 2012.
[27] Liane Thuvander, Paula Femenías, Kristina Mjörnell, and Pär Meiling. Un-veiling the process of sustainable renovation. Sustainability, 4(6):1188–1213,2012.
[28] Paul M Torrens and Marina Alberti. Measuring sprawl. 2000.
[29] Wolfgang Weidlich. Sociodynamics applied to the evolution of urban andregional structures. Discrete Dynamics in Nature and Society, 1(2):85–98,1997.
[30] Milton C Weinstein. Recent developments in decision-analytic modelling foreconomic evaluation. Pharmacoeconomics, 24(11):1043–1053, 2006.
[31] Eckart Zitzler and Lothar Thiele. Multiobjective evolutionary algorithms:A comparative case study and the strength pareto approach. EvolutionaryComputation, IEEE Transactions on, 3(4):257–271, 1999.
153

154

Appendice E
Source code for static district analysis model
155

156

Main file
1 ex t en s i on s [ g i s nw ]
__includes [" [ . . . ] / L i n kU t i l i t i e s . n l s "" [ . . . ] / L i s t U t i l i t i e s . n l s "
6 " [ . . . ] / Ne two rkUt i l i t i e s . n l s "" [ . . . ] / Eu c l i d i a nD i s t a n c e sU t i l i t i e s . n l s "" [ . . . ] / F i l e U t i l i t i e s . n l s "" day l i gh t . n l s "" ind i ca to r sVar s . n l s "
11 ]
g l oba l s [; ; s c a l e f a c t o r; ; va lue in meters o f 1 s tep in NL world
16 sca l e�f a c t o r
; ; networkpaths�l ayer�databu i ld ings�l ayer�data
21 tram�l ayer�data
remaining�l i n k sremaining�v e r t i c e s
26 ; ; speedtarget�s t a t i o n
; ; landuselanduse�d i v e r s i t y
31 patches�count
; ; day l i gh t; ; l i s t o f s u c c e s s i v e s theta ang l e stheta
36 ; ; l i s t o f s u c c e s s i v e s phi ang l e sphi; ; time i n t e r v a l to change ang le ( f i r s t l i n e o f txt f i l e )angle�time�i n t e r v a lsun l i ght�index
41 ]
breed [ v e r t i c e s ver tex ]
46 breed [ abst ract�g i s�paths abst ract�g i s�path ]
abst ract�g i s�paths�own [g i s�f e a tu r ev e r t i c e s � l i s t
51 ]
breed [ s t a t i o n s s t a t i o n ]
breed [ bu i l d i ng s bu i l d ing ]56
undirected�l ink�breed [ paths path ]undirected�l ink�breed [ r a i l s r a i l ]
paths�own [ path�l ength ]61 r a i l s �own [ r a i l �l ength ]
v e r t i c e s �own [
157

d; ; s imp l i f i e d as mean d i s t ance to other v e r t i c e s
66 spa t i a l �i n t e g r a t i o n]
bu i ld ings�own [g i s�shape
71 d i s tance�to�nearest�s t a t i o nnearest�s t a t i o nt ranspor ta t i on�timet ranspor ta t i on�speed
]76
patches�own [; ; day l i gh the ightneighb
81; ; d i v e r s i t yuse
]
86 to load�and�draw�datacar e s i z e �world 0 400 0 300set�patch�s i z e 2s e t s ca l e�f a c t o r r ea l�world�width / world�width
91 ask patches [ s e t he ight 0 ]s e t paths�l ayer�data g i s : load�datase t path�datas e t bu i ld ings�l ayer�data g i s : load�datase t bu i ld ing�datas e t tram�l ayer�data g i s : load�datase t tram�datag i s : set�world�enve lope g i s : envelope�union�o f
96 g i s : envelope�union�o f ( g i s : envelope�o f paths�l ayer�data )( g i s : envelope�o f bu i ld ings�l ayer�data ) ( g i s : envelope�o f tram�l ayer�data )
g i s : set�drawing�c o l o r browng i s : draw paths�l ayer�data 2
101 ; ; c r e a t e ab s t r a c t bu i l d i n g sf o r each g i s : f ea ture�l i s t �o f bu i ld ings�l ayer�data [
c reate�bu i l d i ng s 1 [l e t pos g i s : l o ca t i on�o f g i s : centro id�o f ?
s e t g i s�shape ?106 s e t d i s tance�to�nearest�s t a t i o n 0 s e t hidden ? true
setxy f i r s t pos f i r s t but� f i r s t pos]
]end
111to import�tramask s t a t i o n s [ d i e ] ask r a i l s [ d i e ]
l e t current�s t a t i o n nobodyfo r each g i s : f ea ture�l i s t �o f tram�l ayer�data [
116 fo r each g i s : vertex� l i s t s �o f ? [f o r each ? [l e t l o c g i s : l o ca t i on�o f ?create�s t a t i o n s 1 [
setxy f i r s t l o c f i r s t but� f i r s t l o c121 s e t shape " c i r c l e "
s e t c o l o r red s e t s i z e 1i f e l s e current�s t a t i o n != nobody [
create�r a i l �with current�s t a t i o n [s e t th i ckne s s 0 .4 s e t c o l o r red ]
126 ] [ s e t target�s t a t i o n s e l f ]s e t current�s t a t i o n s e l f
]]
158
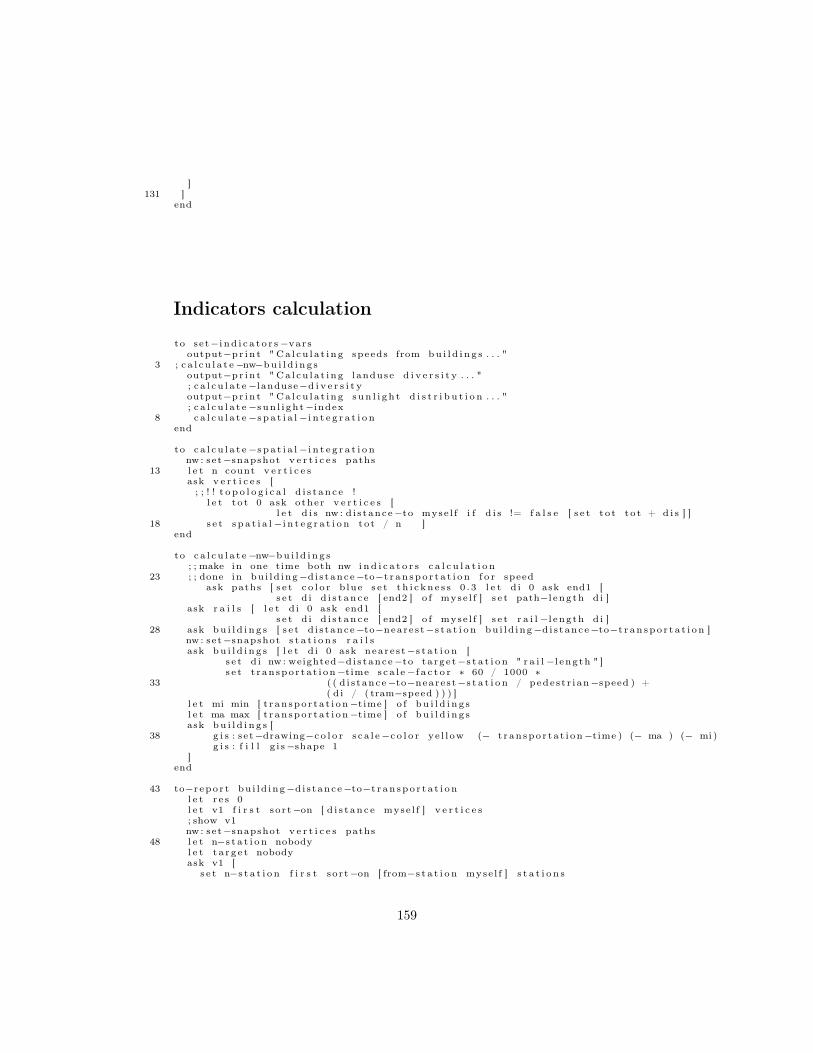
]131 ]
end
Indicators calculation
to set�i nd i c a t o r s�varsoutput�pr in t " Ca l cu la t ing speeds from bu i l d i ng s . . . "
3 ; c a l cu l a t e�nw�bu i l d i ng soutput�pr in t " Ca l cu la t ing landuse d i v e r s i t y . . . "; c a l cu l a t e�landuse�d i v e r s i t youtput�pr in t " Ca l cu la t ing sun l i gh t d i s t r i b u t i o n . . . "; c a l cu l a t e�sun l i ght�index
8 ca l cu l a t e�s pa t i a l �i n t e g r a t i o nend
to ca l cu l a t e�s pa t i a l �i n t e g r a t i o nnw : set�snapshot v e r t i c e s paths
13 l e t n count v e r t i c e sask v e r t i c e s [
; ; ! ! t o p o l o g i c a l d i s t ance !l e t to t 0 ask other v e r t i c e s [
l e t d i s nw : d i s tance�to myse l f i f d i s != f a l s e [ s e t to t to t + d i s ] ]18 s e t spa t i a l�i n t e g r a t i o n to t / n ]
end
to ca l cu l a t e�nw�bu i l d i ng s; ; make in one time both nw i nd i c a t o r s c a l c u l a t i o n
23 ; ; done in bu i ld ing�dis tance�to�t r an spo r t a t i on f o r speedask paths [ s e t c o l o r blue s e t th i ckne s s 0 .3 l e t d i 0 ask end1 [
s e t d i d i s t ance [ end2 ] o f myse l f ] s e t path�l ength di ]ask r a i l s [ l e t d i 0 ask end1 [
s e t d i d i s t ance [ end2 ] o f myse l f ] s e t r a i l �l ength di ]28 ask bu i l d i n g s [ s e t d i s tance�to�nearest�s t a t i o n bui ld ing�dis tance�to�t r an spo r t a t i on ]
nw : set�snapshot s t a t i o n s r a i l sask bu i l d i ng s [ l e t d i 0 ask nearest�s t a t i o n [
s e t d i nw : weighted�dis tance�to target�s t a t i o n " r a i l �l ength " ]s e t t ranspor ta t i on�time sca l e�f a c t o r ⇤ 60 / 1000 ⇤
33 ( ( d i s tance�to�nearest�s t a t i o n / pedest r ian�speed ) +( di / ( tram�speed ) ) ) ]
l e t mi min [ t ranspor ta t i on�time ] o f bu i l d i n g sl e t ma max [ t ranspor ta t i on�time ] o f bu i l d i n g sask bu i l d i ng s [
38 g i s : set�drawing�c o l o r s ca l e�c o l o r ye l low (� t ranspor ta t i on�time ) (� ma ) (� mi)g i s : f i l l g i s�shape 1
]end
43 to�r epor t bu i ld ing�dis tance�to�t r an spo r t a t i onl e t r e s 0l e t v1 f i r s t sort�on [ d i s t ance myse l f ] v e r t i c e s; show v1nw: set�snapshot v e r t i c e s paths
48 l e t n�s t a t i o n nobodyl e t t a r g e t nobodyask v1 [
s e t n�s t a t i o n f i r s t sort�on [ from�s t a t i o n myse l f ] s t a t i o n s
159

s e t t a r g e t f i r s t sort�on [ d i s t ance n�s t a t i o n ] v e r t i c e s53 s e t r e s nw : weighted�dis tance�to t a r g e t "path�l ength "
l e t l nw : weighted�path�to t a r g e t "path�l ength "l e t t nw : t u r t l e s �on�weighted�path�to t a r g e t "path�l ength "
fo r each l [ ask ? [ s e t c o l o r green s e t hidden ? f a l s e ] ]f o r each t [ ask ? [ s e t c o l o r green s e t hidden ? f a l s e ] ]
58 ]; ; s e t the " speed" to that s t a t i o n
i f r e s = f a l s e [ s e t r e s 0 ] ; ; ok , j u s t not counted !s e t t ranspor ta t i on�speed r e s / ( d i s t ance t a r g e t )
s e t nearest�s t a t i o n n�s t a t i o n63 ; show re s
r epor t r e send
to�r epor t from�s t a t i o n [ target�ver tex ]68 l e t r e s 0
l e t s f i r s t sort�on [ d i s t ance myse l f ] v e r t i c e sask target�ver tex [ s e t r e s nw : weighted�dis tance�to s "path�l ength " ]i f e l s e r e s != f a l s e [ r epo r t r e s ] [
r epor t sq r t ( world�width ^ 2 + world�he ight ^ 2 ) ]73 end
to ca l cu l a t e�landuse�d i v e r s i t yask patches [ s e t use landuse ]s e t landuse�d i v e r s i t y d i v e r s i t y
78 end
to�r epor t d i v e r s i t yl e t W 0l e t r 0
83 l e t e c h an t i l l o n n�o f round ( 0 . 3 ⇤ count patches ) patchesask e chan t i l l o n [ l e t x pxcor l e t y pycor l e t t use
ask other e c h an t i l l o n [i f use != t [ s e t r r + (1 / d i s tancexy x y ) ] s e t W W + (1 / d i s tancexy x y ) ]
s e t patches�count patches�count + 1 ]88 r epor t 3 / 2 ⇤ r / W ; ; norma l i sa t i on s i n c e we have 3 landuse here
end
; ; patch procedure r epo r t i ng landuse in that p a r t i c u l a r caseto�r epor t landuse
93 i f count bu i ld ings�here > 0 [ r epor t 0 ]i f count s t a t i on s�here > 0 [ r epor t 1 ]r epor t 2
end
Sunlight index calculation
; ; patches need owned�va r i ab l e he ight; ; import from r a s t e r data ? f i r s t d i r e c t l y from lay e r; ; patches are s p a t i a l d i s c r e t i s a t i o n ( not more , so need to be p r e c i s e )
4to ca l cu l a t e�sun l i ght�index
; ; s e t he i gh t s o f bu i l d i ng s; ; s imp l i f i e d : a l l same height , would need a t t r i bu t e f i l eset�he i ght s
9
160
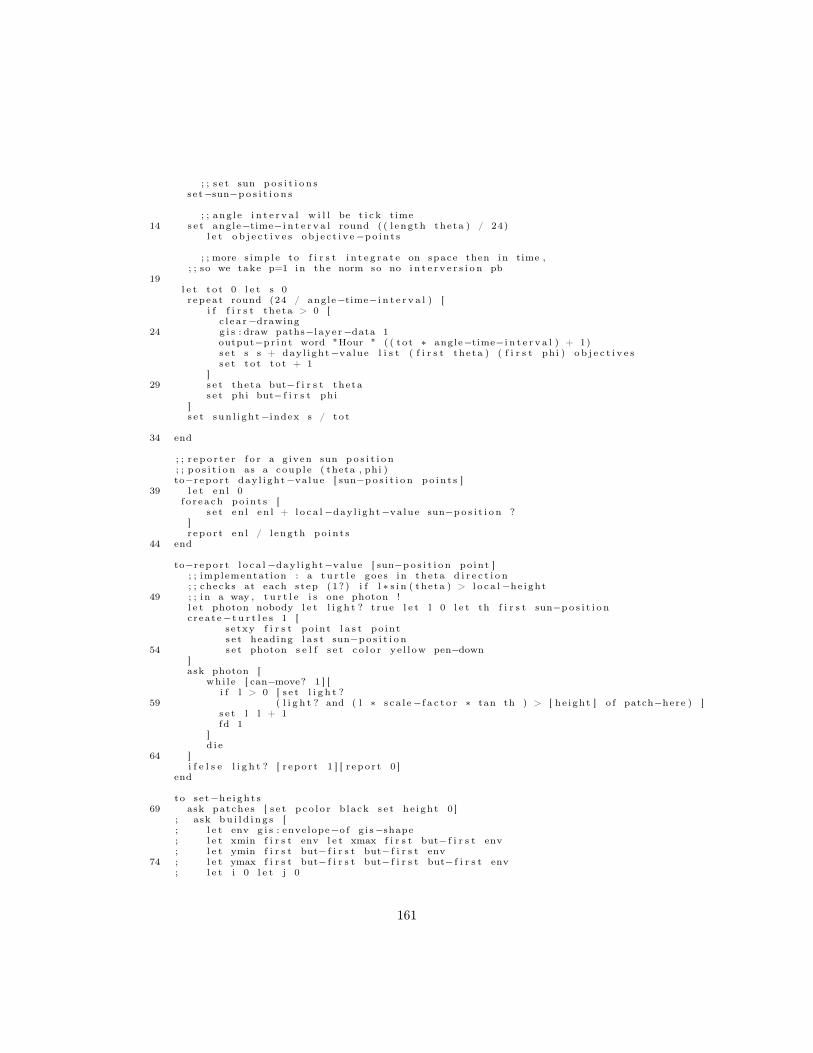
; ; s e t sun po s i t i o n sset�sun�po s i t i o n s
; ; ang le i n t e r v a l w i l l be t i c k time14 s e t angle�time�i n t e r v a l round ( ( l ength theta ) / 24)
l e t o b j e c t i v e s ob j e c t i v e�po in t s
; ; more s imple to f i r s t i n t e g r a t e on space then in time ,; ; so we take p=1 in the norm so no i n t e r v e r s i o n pb
19l e t to t 0 l e t s 0repeat round (24 / angle�time�i n t e r v a l ) [
i f f i r s t theta > 0 [c l ea r�drawing
24 g i s : draw paths�l ayer�data 1output�pr in t word "Hour " ( ( to t ⇤ angle�time�i n t e r v a l ) + 1)s e t s s + dayl ight�value l i s t ( f i r s t theta ) ( f i r s t phi ) o b j e c t i v e ss e t to t to t + 1
]29 s e t theta but� f i r s t theta
s e t phi but� f i r s t phi]s e t sun l i ght�index s / to t
34 end
; ; r epo r t e r f o r a g iven sun po s i t i o n; ; p o s i t i o n as a couple ( theta , phi )to�r epor t day l ight�value [ sun�po s i t i o n po in t s ]
39 l e t en l 0f o r each po in t s [
s e t en l en l + l o ca l�dayl ight�value sun�po s i t i o n ?]r epor t en l / l ength po in t s
44 end
to�r epor t l o c a l�dayl ight�value [ sun�po s i t i o n po int ]; ; implementation : a t u r t l e goes in theta d i r e c t i o n; ; checks at each step (1?) i f l ⇤ s i n ( theta ) > l o ca l�he ight
49 ; ; in a way , t u r t l e i s one photon !l e t photon nobody l e t l i g h t ? t rue l e t l 0 l e t th f i r s t sun�po s i t i o ncreate�t u r t l e s 1 [
setxy f i r s t po int l a s t po ints e t heading l a s t sun�po s i t i o n
54 s e t photon s e l f s e t c o l o r ye l low pen�down]ask photon [
whi l e [ can�move? 1 ] [i f l > 0 [ s e t l i g h t ?
59 ( l i g h t ? and ( l ⇤ s ca l e�f a c t o r ⇤ tan th ) > [ he ight ] o f patch�here ) ]s e t l l + 1fd 1
]d i e
64 ]i f e l s e l i g h t ? [ r epo r t 1 ] [ r epo r t 0 ]
end
to set�he i ght s69 ask patches [ s e t pco lo r black s e t he ight 0 ]
; ask bu i l d i ng s [; l e t env g i s : envelope�o f g i s�shape; l e t xmin f i r s t env l e t xmax f i r s t but� f i r s t env; l e t ymin f i r s t but� f i r s t but� f i r s t env
74 ; l e t ymax f i r s t but� f i r s t but� f i r s t but� f i r s t env; l e t i 0 l e t j 0
161

; r epeat (xmax � xmin ) [ repeat (ymax � ymin ) [; l e t p patch ( xmin + i ) ( ymin + j ) i f p != nobody [; i f g i s : conta ins ? g i s�shape p or g i s : i n t e r s e c t s ?
79 ; g i s�shape p [ ask p [ s e t he ight 3 0 ] ] ] s e t j j + 1 ] s e t i i + 1 s e t j 0 ]; ]; show "ok"
ask bu i l d i ng s [ ask patches with [g i s : i n t e r s e c t s ? [ g i s�shape ] o f myse l f s e l f
84 or g i s : conta in s ? [ g i s�shape ] o f myse l f s e l f ][ s e t he ight 30 s e t pco l o r white ] ]
end
to set�sun�po s i t i o n s89 ; ; read from f i l e
; ; va lues o f ang l e s every hours e t theta map read�from�s t r i n g read� f i l e "thetaSW . txt "s e t phi map read�from�s t r i n g read� f i l e "phiSW . txt "
end94
to�r epor t ob j e c t i v e�po in t sl e t r e s [ ]
ask patches [ask ne ighbors4 [
99 i f he ight � [ he ight ] o f myse l f != 0 [s e t r e s lput l i s t ( ( [ pxcor ] o f myse l f + pxcor ) / 2)
( ( [ pycor ] o f myse l f + pycor ) / 2) r e s ]]
]104 r epor t r e s
end
162
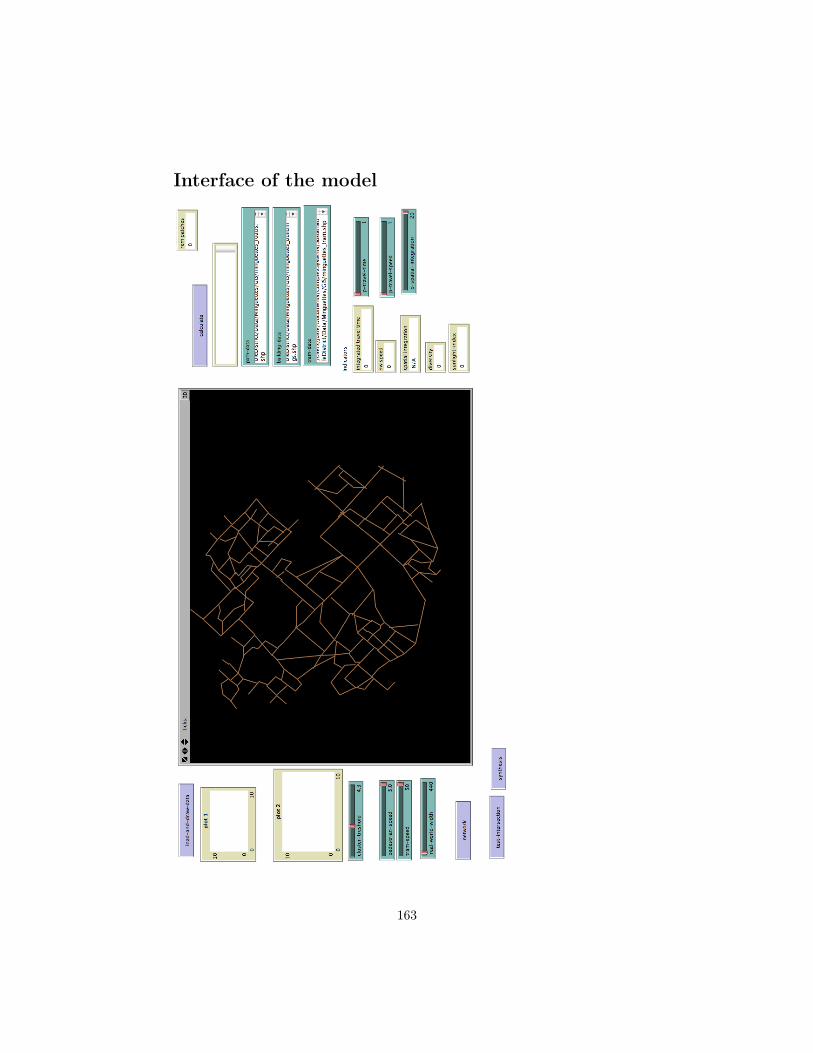
Interface of the model
163

164

Appendice E
Source code for Agent-based model
165

166

Main code
1 ex t en s i on s [ g i s t e s t p r o f i l e r nw numanal ]
__includes [" [ . . . ] / Eu c l i d i a nD i s t a n c e sU t i l i t i e s . n l s "" [ . . . ] / S t r i n g U t i l i t i e s . n l s "
6 " [ . . . ] / S o r t i n g U t i l i t i e s . n l s "" [ . . . ] / L i s t U t i l i t i e s . n l s "" [ . . . ] / Typ e sU t i l i t i e s . n l s "" [ . . . ] / F i l e U t i l i t i e s . n l s "" [ . . . ] / L i n kU t i l i t i e s . n l s "
11 " [ . . . ] / Ne two rkUt i l i t i e s . n l s "" [ . . . ] / G ISU t i l i t i e s . n l s "
" setup . n l s "" c a l i b r a t i o n . n l s "" r e f s c e n a r i i . n l s "
16 ]
g l oba l s [; ; u t i l s v a r i a b l e sbu i ld ing�l ayer�data
21 transport�l ayer�datagreen�l ayer�datas e r v i c e s �l ayer�data
; ; network inc lude vars26 paths�l ayer�data
remaining�l i n k sremaining�ve r t exe sc l u s t e r�t r e sho l d
31 f l a t s �l i s t �by�rooms
; c o e f f i c i e n t be f o r e the d e r i v a t i v e in mean unemployment equa d i f funemployment�d i f f
36 ; stop ?t s t
; ; r e a l v a r i a b l e s; ; cons ide red as a macro var i ab l e ,
41 ; ; may evo lve in long time s e r i e s ,; ; accord ing to ex t e rna l data ?; unemployment�r a t e
; b a s i c a l l y cons ide red as l i n e a r func t i on46 ; o f income ; no taxes i f get s o c i a l he lp
taxes�proport ion
; very important : c l o s e l y l i nked to the time sca l e , i f smal l time step; as 2 weeks , must be smal l ! to reproduce r e a l s i t u a t i o n s with a l o t o f steps ,
51 ; such smal l s tep i s neededjob�oppor tun i t i e s�per�year
; time�s e r i e to matchunemployment�data
56 unemployment�data�time�s c a l e
;max proport ion o f populat ion that can get s o c i a l he lp; s o c i a l he lp i s a t t r i bu t ed to the people with negat ive balance; f i r s t approx br ing balance to zero
61 ; s o c i a l �help�r a t e
; approximate co s t o f a person per month ( food etc )
167

person�co s t
66 ; time f o r each t i ck , in years; time�i n t e r v a l
; t r e sho l d under which you can get s o c i a l he lp; expres sed in Kr/person ( i n c l ud ing ch i l d r en ) �> a l l o c s
71 ; s o c i a l he lp; s o c i a l �help�t r e sho l d
;max f r a c t i o n o f the populat ion which can get s o c i a l he lps o c i a l �help�max�r e c i p i e n t �proport ion
76 ; max amount perce ived from s o c i a l he lps o c i a l �help�max�amount
; ; r ent update; law r e gu l a t i on
81 max�rent�per�square�meter; no rma l i sa t i on co e f f o r the i n f l u e n c e o f ba lances on r en t s; bnorm; b r e f
86 ; params f o r immigrantsmax�immigrant�number�per�year
; ; g l o ba l s f o r random con f i gcouple�proba
91 ch i ld ren�mean; income�mean; income�sigmarent�meanrent�sigma
96; ; ; ; ; ; ; ; ; ; ; ; ;; ; g l o ba l s f o r extended aspec t s; ; ; ; ; ; ; ; ; ; ; ; ;
101 ; ; e x t e rna l agents s a t i s f a c t i o ngreen�space�s a t i s f a c t i o n �i nd iv idua l�norm�f a c t o rs e r v i c e s �s a t i s f a c t i o n �i nd iv idua l�norm�f a c t o r
; ; i n f l u e n c e parameters106 ; ; can move accord ing to g l oba l economic s i t u a t i o n
standard�i n f l u enc e�on�rent; energy�co s t; ; data from que s t i onna i r e : l i s t o f l i s t e sque s t i onna i r e�data
111; ; c a l i b r a t i o n v a r i a b l e s; ; o b l e c t i v e f o r c a l i b r a t i o nrents�objincomes�obj
116 ; ; output f i l e; ca l i b� f i l e; ca l i b�t i c k
; ; ; ; ; ; ;121 ; ; Globals f o r re furb i shment d e s c r i p t i o n : parameters , new l a y e r s
; ; ; ; ; ; ;; r e f�l i v i n g �standard�change�f a c t o r; r e f�energy�change�f a c t o radd i t i ona l�green�spaces�l a y e r
126 add i t i ona l�s e r v i c e s �l a y e r]
168

; ; Bas ic breeds131
breed [ f l a t s f l a t ]
breed [ bu i l d i ng s bu i l d ing ]
136 breed [ households household ]
; ; new breedsbreed [ s e r v i c e s s e r v i c e ]
141 breed [ t r an spo r t s t ranspor t ]
breed [ green�spaces green�space ]
; ; ; ; ; ; ; ; ; ; ; ; ; ; ; ; ; ; ; ; ; ; ;146 ; ; network inc lude breeds
; ; ; ; ; ; ; ; ; ; ; ; ; ; ; ; ; ; ; ; ; ; ;breed [ v e r t exe s ver tex ]
breed [ abst ract�g i s�paths abst ract�g i s�path ]151
abst ract�g i s�paths�own [g i s�f e a tu r ever texes� l i s t
]156
undirected�l ink�breed [ paths path ]
paths�own [ path�l ength ]
161 ; ; ; ; ; ; ; ; ; ; ; ; ; ; ; ; ; ; ; ; ; ; ; ; ; ; ;
; ; ; ; ; ; ; ; ; ; ; ; ; ; ; ; ; ; ; ; ; ;; ; Owned va r i a b l e s
166 ; ; ; ; ; ; ; ; ; ; ; ; ; ; ; ; ; ; ; ; ; ;
bu i ld ings�own [; cor responding g i s VectorFeatureg i s�shape
171; l i s t o f f l a t s conta ined in the bu i l d ingin� f l a t s
; numeric va lue o f r en t s in the bu i l d ing176 rent�per�square�meter
; ; energy pe r f; i n i t i a l value , a re furb i shment changes t h i s valuebu i ld ing�ene rge t i c�performance
181 ]
households�own [; l i s t o f incomesincomes
186 to ta l�income
; f o r each people , l e v e l o f s t ud i e s in years .; shows p o t e n t i a l i t y to f i nd a job ( ch i l d r en have 0 f o r example ); s t ud i e s
191; years o f expe r i ence in jobexpe r i enc e s
s o c i a l �help ?
169

196; economic b i l an o f the l a s t per iodg loba l�balance
; number o f people in the household201 people�number
; qu i t e constant , shows the tendancy to consumconsumption�r a t e
206 ; po in t e r to the occuped f l a toccupied�f l a t
; ; l i f e qua l i t y a spec t sgreen�space�s a t i s f a c t i o n
211 s e r v i c e s �s a t i s f a c t i o n]
f l a t s �own [; number o f rooms
216 rooms; sur face , d i r e c t l y l i nked to number o f rooms .s u r f a c e
rent221
; po in t e r to the occuping householdoccupant
; ; l i v i n g cond i t i on s v a r i a b l e s226 l i v i n g �standard
; ;% o f t o t a l rentene rge t i c�performance
231 ; ; caches l i s t s f o r d i s t an c e s; index corresponds to p lace in the so r t ed l i s t o f green by who ( avo ids a hashmap)d i s tance s�to�green�spacesd i s tance s�to�s e r v i c e s
]236
green�spaces�own [; what can evo lve through st rong mod i f i c a t i on o f d i s t r i c t s i t u a t i o n or re furb i shmentqua l i t y
]241
s e r v i c e s �own [ qua l i t y ; idem as f o r green�spaces ]
to new�household [ income ]; ; s e t people
246 l e t r random�f l o a t 1i f e l s e r >= couple�proba [ s e t people�number 1 ]
[ s e t people�number 2 + ( random 2 ⇤ ch i ld r en�mean ) ]; ; s e t s t ud i e s ! ! BEFORE incomes , to be coherent with the f o l l ow i ng; ; ( s e l f coherence o f the implementation )
251 l e t s1 f l o o r ( random�normal 3 2)l e t s2 f l o o r ( random�normal 3 2)
i f e l s e people�number = 1 [ s e t s t ud i e s ( l i s t s1 ) ][ s e t s t ud i e s l i s t s1 s2 ]; ; s e t incomes or unemployment
256 s e t incomes [ ]f o r each s t ud i e s [
l e t i 0 l e t u random�f l o a t 100i f u > unemployment� i n i t i a l �r a t e [
s e t i max l i s t 10000 ( random�normal ( ( income�mean � ( income�sigma ) )261 + (k�s t ud i e s ⇤ ? ⇤ income�sigma ) ) income�sigma ) ]
170

s e t incomes lput i incomes]; ; s e t expe r i enc e ss e t expe r i enc e s l i s t 0 0
266 fo r each incomes [s e t expe r i enc e s
rep lace�item po s i t i o n ? incomes expe r i enc e s ( 0 . 5 + ( random 20 / 2 ) ) ]; ; f i nd f l a tf ind�f l a t
271; ; s o c i a l he lps e t s o c i a l �help ? f a l s e
; ; d e f au l t s a t i s f a c t i o n s276 s e t green�space�s a t i s f a c t i o n 0
s e t s e r v i c e s �s a t i s f a c t i o n 0
end
281 ; household procedure to f i nd the best f l a tto f ind�f l a t
l e t i min l i s t max l i s t 0 ( people�number � 2) 2l e t f nobody l e t d item i f l a t s �l i s t �by�roomsi f e l s e d != [ ] [
286 s e t f f i r s t d s e t f l a t s �l i s t �by�roomsrep lace�item i f l a t s �l i s t �by�rooms but� f i r s t d ]
[ s e t f one�o f f l a t s with [ occupant = nobody ]f o r each f l a t s �l i s t �by�rooms [ s e t ? remove f ? ] ]s e t occupied�f l a t f ask f [ s e t occupant myse l f ]
291 end
to re furb i shment; ; setupset�random� i n i t i a l �c on f i gu r a t i on
296 ; ; go f o r f i r s t h a l fwhi l e [ not stop ? ] [ go ]; ; ; ; ;; ; proceed to re furb i shment; ; ; ; ;
301 log�out "Refurbishment . . . "ask f l a t s [
i f energy ? [s e t ene rge t i c�performance ene rge t i c�performance ⇤ r e f�energy�change�f a c t o r ]
i f standard ? [306 s e t l i v i n g �standard l i v i n g �standard ⇤ r e f�l i v i n g �standard�change�f a c t o r
; ; need to change rent accord ing to the change o f l i v i n g �standards e t rent rent ⇤ r e f�l i v i n g �standard�change�f a c t o r
]]
311; ; add new l a y e r s f o r green spaces and s e r v i c e s i f needed; ; d e l e t e old , because new l ay e r can be l e s s ?ask green�spaces [ d i e ]ask s e r v i c e s [ d i e ]
316 s e t add i t i ona l�green�spaces�l a y e rg i s : load�datase t " [ . . . ] / langangen_green_new . shp"
s e t add i t i ona l�s e r v i c e s �l a y e rg i s : load�datase t " [ . . . ] / langangen_serv ices . shp"
setup�act ion�g i s�l a y e r s add i t i ona l�green�spaces�l a y e r add i t i ona l�s e r v i c e s �l a y e r321 ; ; new c a l c u l a t i o n o f d i s t an c e s ask f l a t s [ set�cache�d i s t an c e s ]
; ; s imulate f o l l ow i ng yearss e t stop ? f a l s el e t m max�time
326 s e t max�time max�time ⇤ 2whi le [ not stop ? ] [ go ]
171

s e t max�time mend
331to go
log�out word "Going f o r t i c k " t i c k sset�datai f not stop ? [
336 update�work�s i t u a t i o n supdate�s o c i a l �he lpsupdate�r en t sc a l cu l a t e�ba lancesemigrate
341 immigrateupdate�drawing; ; add new e f f e c t s : i n t e g r a t i o n on time step o f " s a t i s f a c t i o n " regard ing to new aspec t s; ; a l s o i n f l u e n c e o f energy and l i v i n g standard on r en t supdate� l i f e �qua l i ty�r e p o r t e r s
346 t i c klog�out word "Total time : " ( t i c k s ⇤ time�i n t e r v a l ) ]
end
to te s t�run�durat ion351 p r o f i l e r : r e s e t
p r o f i l e r : s t a r tl e t time 0set�random� i n i t i a l �c on f i gu r a t i onwhi le [ not stop ? ] [
356 gos e t time time + p r o f i l e r : i n c l u s i v e �time "go"show p r o f i l e r : i n c l u s i v e �time "go"
]show p r o f i l e r : i n c l u s i v e �time "go"
361 end
to c a l i b r a t el e t f i l ename word word " c a l i b r a t i o n /cal_" timer " . s c i "pr int�in� f i l e f i l ename " b r e f = [ ] ; bnorm = [ ] ; income�mean = [ ] ; r en t s = [ ] ; "
366 s e t b r e f 5000s e t bnorm 10000s e t income�mean 10000l e t i 1
repeat 10 [371 repeat 10 [
repeat 10 [set�random� i n i t i a l �c on f i gu r a t i onl e t out ( l i s t mean [ rent / su r f a c e ] o f f l a t s )l e t j 1
376 whi le [ not stop ? ] [go i f ( t i c k s ⇤ time�i n t e r v a l ) mod 1 = 0 [s e t out lput mean [ rent / su r f a c e ] o f f l a t s out ] ]pr int�in� f i l e f i l ename word word word word " b r e f (" i ")=" br e f " ;"pr int�in� f i l e f i l ename word word word word "bnorm(" i ")=" bnorm " ;"
381 pr int�in� f i l e f i l ename word word word word "incomemean (" i ")=" income�mean " ;"fo r each out [ pr int�in� f i l e f i l ename word word word
word word word " r en t s (" i " ," j ")=" ? " ;" s e t j j + 1 ]s e t income�mean income�mean + 1000s e t i i + 1
386 ]s e t bnorm bnorm + 2000s e t income�mean 10000]
s e t b r e f b r e f + 1000391 s e t bnorm 10000
s e t income�mean 10000]
172

end
396 to update� l i f e �qua l i ty�r e p o r t e r slog�out " Ca l cu la t ing l i f e qua l i t y r e po r t e r s . . . "; snapshoti f green ? or s e r v i c e s ? or standard ? [
; ; ga in time i f nothing pb401 ask households [
i f green ? [s e t green�space�s a t i s f a c t i o n green�space�s a t i s f a c t i o n �r epo r t e r]
i f s e r v i c e s ? [ s e t s e r v i c e s �s a t i s f a c t i o n s e r v i c e s �s a t i s f a c t i o n �r epo r t e r ]406 ]
]end
to�r epor t green�space�s a t i s f a c t i o n �r epo r t e r411 repor t norm�p green�space�s a t i s f a c t i o n �i nd iv idua l�norm�f a c t o r
[ d i s tance s�to�green�spaces ] o f occupied�f l a tend
to�r epor t s e r v i c e s �s a t i s f a c t i o n �r epo r t e r416 repor t norm�p s e r v i c e s �s a t i s f a c t i o n �i nd iv idua l�norm�f a c t o r
[ d i s tance s�to�s e r v i c e s ] o f occupied�f l a tend
to set�data421 i f e l s e ( t i c k s ⇤ time�i n t e r v a l ) > max�time [ s e t stop ? true ] [
; ; unemploymenti f unemp�ext�data ? [
i f unemployment�data != [ ][ i f ( t i c k s ⇤ time�i n t e r v a l ) mod unemployment�data�time�s c a l e = 0 [
426 s e t unemployment� i n i t i a l �r a t e f i r s t unemployment�datas e t unemployment�data but� f i r s t unemployment�data ] ]
]]
end431
to update�work�s i t u a t i o n s; ; add time expe r i ence f o r workersask households [ f o r each incomes [
i f ? != 0 [ l e t i p o s i t i o n ? incomes436 s e t expe r i enc e s rep lace�item i expe r i en c e s
( item i expe r i enc e s + time�i n t e r v a l ) ] ] ]; ; some unemployed f i nd jobs and othe r s l o o s e t h e i r j obs .l e t u unemployed�numberl e t new�workers�number max l i s t 0
441 min l i s t u f l o o r (random�normal ( job�oppor tun i t i e s�per�year ⇤ time�i n t e r v a l ) (u / 10))
l e t unemployed to� l i s t households with [ member? 0 incomes ]r epeat new�workers�number [ ; people f i nd i ng a job
i f unemployed != [ ] [446 ask one�o f unemployed [
l e t w 1 � bool�to�i n t ( ( item 0 incomes ) = 0); index o f unemployed guy; ge t s job and new income !s e t incomes rep lace�item w incomes max l i s t 10000
451 ( random�normal ( ( income�mean � ( income�sigma ) ) +(k�s t ud i e s ⇤ ( item w s tud i e s ) ⇤ income�sigma ) ) income�sigma )
i f not member? 0 incomes [ s e t unemployed remove s e l f unemployed ]]
]456 ]
; ; l o o s e o f j obs � r a t i o has to match unemployment�growth va r i ab l el e t job�l o o s e r s�number max l i s t 0 min l i s t ( a c t i v e s�number � u)
f l o o r ( random�normal (new�workers�number +
173

( a c t i v e s�number ⇤ unemployment� i n i t i a l �r a t e / 100) � u) (u / 10))461 s e t unemployment�d i f f job�l o o s e r s�number � new�workers�number
l e t employed to� l i s t households with [ sum incomes > 0 ]repeat job�l o o s e r s�number [; people l o o s i n g t h e i r job
i f employed != [ ] [466 ask one�o f employed [
l e t w bool�to�i n t ( item 0 incomes = 0); ; l o o s e s income and exper i ences e t incomes rep lace�item w incomes 0s e t expe r i enc e s rep lace�item w expe r i en c e s 0
471 i f sum incomes = 0 [ s e t employed remove s e l f employed ]]]
]; ; promotion f o r exper i enced workers
476 i f with�promotions ? [ask households [
f o r each expe r i en c e s [l e t i p o s i t i o n ? expe r i enc e s i f ? > 0 and ? mod 5 = 0 [s e t incomes rep lace�item i incomes ( item i incomes + 5 0 0 ) ] ]
481 ]]
end
to update�s o c i a l �he lps486 ask households [ s e t s o c i a l �help ? f a l s e ]
; ; c a l c u l a t e prov i so ry balance to see i f could get the s o c i a l he lpl e t e l i g i b l e s households with [ prov�balance < so c i a l �help�t r e sho l d ]ask min�n�o f min l i s t count e l i g i b l e s f l o o r
( s o c i a l �help�max�r e c i p i e n t �proport ion ⇤ count households / 100 )491 e l i g i b l e s [ prov�balance ]
[ s e t s o c i a l �help ? t rue ]end
; aux func t i on496 to�r epor t prov�balance
r epor t (sum incomes � ( [ r ent ] o f occupied�f l a t ) ) / people�numberend
to update�r en t s501 ; ; r en t s adapt themsleves accord ing to neighborhood value and people wealth
; ; e x t e rna l c on t r o l ( law ) , a l s o e x t e r n a l i t i e s as unemployment?; ; one time per year only ? �> can change i ti f t i c k s ⇤ time�i n t e r v a l mod 1 = 0 and rent�updates ? [
; ; update r en t s506 l e t r mean [ rent ] o f f l a t s
l e t b mean [ g loba l�balance ] o f households
ask f l a t s [l e t max�rent su r f a c e ⇤ max�rent�per�square�meter
511 s e t rent min l i s t max�rent ( ( ( rent ⇤ ( (1 + (b � br e f )/ bnorm ) ) ) ) ) ] ⇤(1 + standard�i n f l u enc e�on�rent ⇤( l i v i n g �standard � 1) / 2)) ]+ ( rent�co e f ⇤ ( r � rent ) ) ) ] ]
end
516 to ca l cu l a t e�ba lancesask households [
s e t g loba l�balance balance i f s o c i a l �help ? [s e t g loba l�balance min l i s t
( g loba l�balance + so c i a l �help�max�amount ) 5 0 0 ] ]521 end
to�r epor t balance; ; ba s i c balance , l i n e a r taxes .; ; energy consumption : r epre s ented as a proport ion o f the rent
174

526 ; ; a l l in counted % one monthrepor t (sum incomes � ( [ r ent ] o f occupied�f l a t ) )� ( taxes�proport ion ⇤ sum incomes ) � ( person�co s t ⇤ people�number )� ( [ ene rg e t i c�performance ] o f occupied�f l a t ⇤ energy�co s t )
end531
to emigratei f d r a s t i c ? [
ask households with [ g loba l�balance < die�t r e sho l d ][ ask occupied�f l a t [ s e t occupant nobody ] d i e ] ]
536 end
to immigratei f new�i nhab i t an t s ? [
541 l e t i workers�mean�incomerepeat min l i s t
( count f l a t s with [ occupant = nobody ] )f l o o r (max�immigrant�number�per�year ⇤ time�i n t e r v a l ) [
c reate�households 1 [ new�household i ] ]546 ]
end
; ; U t i l i t i e s f unc t i on s551 to�r epor t unemployed�number
l e t r e s 0 ask households [f o r each incomes [ i f ? = 0 [ s e t r e s r e s + 1 ] ] ]
r epor t r e send
556to�r epor t ac t i v e s�number
r epor t sum [ l ength incomes ] o f householdsend
561 to�r epor t workers�mean�incomel e t r e s 0 l e t c 0ask households [
f o r each incomes [ i f ? != 0 [ s e t r e s r e s + ? s e t c c + 1 ] ]]
566 r epor t r e s / cend
to�r epor t unemployment�co e fr epor t unemployment�d i f f
571 end
to update�drawinglog�out "Drawing . . . "c l ea r�drawing
576 g i s : set�drawing�c o l o r browng i s : draw paths�l ayer�data 2g i s : set�drawing�c o l o r greyg i s : draw bui ld ing�l ayer�data 1i f green ? [ g i s : set�drawing�c o l o r green g i s : draw green�l ayer�data 5 ]
581 i f s e r v i c e s ? [ g i s : set�drawing�c o l o r red g i s : draw s e r v i c e s �l ayer�data 5 ]i f t r anspor t ? [ g i s : set�drawing�c o l o r orange g i s : draw transport�l ayer�data 3 ]ask t u r t l e s [ s e t hidden ? true ]l e t mir min [ rent ] o f f l a t sl e t mar max [ rent ] o f f l a t s
586 ask patches with [ count f l a t s �on s e l f > 0 ] [s e t pco lo r s ca l e�c o l o r red (mean ( [ rent ] o f f l a t s �on s e l f ) ) ( mir � 50) (mar + 50 ) ]
l e t mii min [ ( sum incomes ) / people�number ] o f householdsl e t mai max [ ( sum incomes ) / people�number ] o f householdsask households [
591 setxy [ xcor ] o f occupied�f l a t [ ycor ] o f occupied�f l a t
175

s e t shape " person " s e t s i z e people�number / 2s e t hidden ? f a l s es e t c o l o r s ca l e�c o l o r green ( ( sum incomes ) / people�number ) ( mii � 50) (mai + 50)i f member? 0 incomes [ s e t c o l o r pink ]
596 i f s o c i a l �help ? [ s e t c o l o r ye l low ]]
end
to log�out [ t ext ]601 i f debug? [ output�pr in t text ]
end
Local includes
File setup.nls
to draw�g i s�l a y e r sca
3 log�out "Loading and Drawing GIS data . . . "ask patches [ s e t pco l o r white ]; ; load g i s l a y e r ss e t bu i ld ing�l ayer�data g i s : load�datase t
" [ . . . ] / langangen_buildings_pol . shp " ; user�new� f i l e8 s e t paths�l ayer�data
g i s : load�datase t " [ . . . ] / langangen_roads . shp"s e t t ransport�l ayer�data
g i s : load�datase t " [ . . . ] / langangen_transport . shp"s e t green�l ayer�data
13 g i s : load�datase t " [ . . . ] / langangen_green . shp"s e t s e r v i c e s �l ayer�data
g i s : load�datase t " [ . . . ] / langangen_serv ices . shp"; ; s e t enve loppes � these two l a y e r s enough?
g i s : set�world�enve lope g i s : envelope�union�o f18 g i s : envelope�o f bu i ld ing�l ayer�data
g i s : envelope�o f paths�l ayer�data; ; draw bu i l d i ng sg i s : set�drawing�c o l o r blackfo r each g i s : f ea ture�l i s t �o f bu i ld ing�l ayer�data [
23 ; i f g i s : property�value ? "ID" = target�id [g i s : set�drawing�c o l o r red ]
; f o r each explode " ;" g i s : property�value ? "ADRESS" [i f member? ? ad r e s s e s [ g i s : set�drawing�c o l o r blue ] ]
g i s : f i l l ? 1 g i s : set�drawing�c o l o r black28 l e t c g i s : l o ca t i on�o f g i s : centro id�o f ?
; c reate�t u r t l e s 1 [ setxy item 0 c item 1 cs e t l abe l�c o l o r red s e t s i z e 0s e t l a b e l g i s : property�value ? "ADRESS" ] ]
g i s : set�drawing�c o l o r white33 fo r each g i s : f ea ture�l i s t �o f bu i ld ing�l ayer�data [
l e t v ?fo r each g i s : f ea ture�l i s t �o f bu i ld ing�l ayer�data [
i f v != ? and g i s : conta ins ? v ? [ g i s : f i l l ? 1 ] ] ]
38 ; ; draw roadsg i s : set�drawing�c o l o r browng i s : draw paths�l ayer�data 2; ; draw other l a y e r s
176

; ; i f green ? [ g i s : set�drawing�c o l o r green43 ; ; g i s : draw green�l ayer�data 5 ]
; ; i f s e r v i c e s ? [g i s : set�drawing�c o l o r red; ; g i s : draw s e r v i c e s �l ayer�data 5 ]i f t r anspor t ? [ g i s : set�drawing�c o l o r orange
48 g i s : draw transport�l ayer�data 3 ]end
to load�csv�p rope r i e s [ f i l ename property�name layer�data ]53 ; load from csv f i l e o f the form ADRESS;PROPERTY
l e t data but� f i r s t read� f i l e f i l enamefo r each data [
l e t va lue f i r s t but� f i r s t explode " ;" ?fo r each layer�data [
58 ; g i s : set�property�value]
]end
63; ; s e t the s t a t i c agent that are not supposed to change .to set�s t a t i c �agents
log�out " Se t t ing up s t a t i c agents . . . "; ; l oad ing some bu i l d ing data
68 l e t ad r e s s e s import�data "data/data . csv " 0l e t energy map read�from�s t r i n g import�data "data/data . csv " 1
; ; load que s t i onna i r e dataload�ques t i onna i r e�data " [ . . . ] / que s t i onna i r e . csv "
73 ; c r e a t i on o f bu i l d i n g sf o r each g i s : f ea ture�l i s t �o f bu i ld ing�l ayer�data [
c reate�bu i l d i ng s 1 [s e t g i s�shape ?s e t in� f l a t s [ ]
78 s e t hidden ? truel e t i 0 f o r each explode " ;"g i s : property�value ? "ADRESS" [i f member? ? ad r e s s e s [
s e t i p o s i t i o n ? ad r e s s e s83 s e t bu i ld ing�ene rge t i c�performance item i energy ] ]
i f bu i ld ing�ene rge t i c�performance = 0 [s e t bu i ld ing�ene rge t i c�performance mean energy ]
]]
88 ; ; c r e a t e ab s t r a c t network �> BEFORE SETTING FLATS ! ! !; ; ( need network to c a l c u l a t e caches d i s t an c e s ); ; c l u s t e r t r e sho l d i s f i x ed ? Y, very smal loutput�pr in t " Extract ing abs t ra c t network from GIS network . . . "s e t c l u s t e r �t r e sho l d 0 .5
93 create�network; ; setup s e r v i c e s and green spaces through t h e i r g i s�l a y e r passed as a va r i ab l e; ; [ the ex t e rna l func t i on i s c a l l e d a l s o during a re furb i shment with add i t i ona l l a y e r s ]setup�act ion�g i s�l a y e r s green�l ayer�data s e r v i c e s �l ayer�data; ; c r e a t i on o f f l a t s
98 set� f l a t send
to setup�act ion�g i s�l a y e r s [ green�l a y e r s e r v i c e s �l a y e r ]103 ; ; s e t green spaces � Idem network ( t a r g e t s need to e x i s t ! )
i f green ? [ f o r each g i s : f ea ture�l i s t �o f green�l a y e r [f o r each g i s : vertex� l i s t s �o f ? [f o r each ? [ l e t l o c g i s : l o ca t i on�o f ?create�green�spaces 1 [
177

108 setxy f i r s t l o c f i r s t but� f i r s t l o cs e t c o l o r green s e t shape " c i r c l e " ] ] ] ] ]
; ; s e t s e r v i c e si f s e r v i c e s ? [ f o r each g i s : f ea ture�l i s t �o f s e r v i c e s �l a y e r [
113 fo r each g i s : vertex� l i s t s �o f ? [f o r each ? [l e t l o c g i s : l o ca t i on�o f ?create�s e r v i c e s 1 [
setxy f i r s t l o c f i r s t but� f i r s t l o c118 s e t c o l o r red s e t shape " c i r c l e " ] ] ] ] ]
end
to set� f l a t soutput�pr in t " F i l l i n g bu i l d i ng s with f l a t s . . . "
123 create� f l a t s 1 [ setxy 0 0 s e t shape "house" s e t s i z e 0 .5s e t c o l o r ye l low s e t occupant nobody ]
l e t current�f l a t one�o f f l a t sl e t prev ious�f l a t nobodyl e t f i l l e d ? f a l s e
128 l e t previous�bu i l d ing nobodysnapshot; ; procedure to f i l l the bu i l d ing with f l a t s seems weird ,; ; but no d i r e c t method to get patches with in a g i s shape
133 whi le [ not f i l l e d ? ] [; ; f i x i f in a bu i l d ingl e t f i x ed ? f a l s eask bu i l d i ng s [
l e t b s e l f ask current�f l a t [138 i f e l s e not f i x ed ? [
i f g i s : conta in s ? [ g i s�shape ] o f myse l f s e l f [hatch� f l a t s 1 [
s e t prev ious�f l a t current�f l a ts e t current�f l a t s e l f
143 ask b [s e t in� f l a t s lput previous�f l a t
in� f l a t s s e t previous�bu i l d ing s e l f]
]148 s e t f i x ed ? true
; ; s i n c e cur rent f l a t has been f i x ed in prev ious f l a t ,; ; ab le to c a l c u l a t e cache d i s t anc e s to a c t i v i t i e s
; ; update these d i s t anc e s i f change in c on f i gu r a t i on; ; o f green�space / s e r v i c e s : case o f a re furb i shment e . g .
153 set�cache�d i s t an c e s]
][ i f g i s : conta in s ? [ g i s�shape ] o f myse l f s e l f [ask previous�bu i l d ing [ s e t in� f l a t s remove previous�f l a t in� f l a t s ]
158 ask previous�f l a t [ d i e ] ] ; ; two and only two max conta in ing shape ?]
]]; ; advance current�f l a t in space
163 ask current�f l a t [i f e l s e ycor = world�he ight � 1
and xcor = world�width � 1 [ s e t f i l l e d ? t rue ][ s e t ycor ( ycor + 0 .5 ) mod ( world�he ight � 0 . 5 )i f ycor = 0 [ s e t xcor ( xcor + 0 .5 ) mod ( world�width � 0 . 5 ) ] ] ]
168 i f f i l l e d ? [ ask current�f l a t [ d i e ] ]]
end
; ; f l a t procedure , s e t caches d i s t anc e s .173 ; ; c a l l e d when setup or s e r v i c e s update
178

; ; need snapshot be f o r eto set�cache�d i s t an c e s
s e t d i s tance s�to�green�spaces [ ]f o r each sort�on [who ] green�spaces [
178 s e t d i s tance s�to�green�spaceslput d i s tance�through�network ? d i s tance s�to�green�space ]
s e t d i s tance s�to�s e r v i c e s [ ]f o r each sort�on [who ] s e r v i c e s [s e t d i s tance s�to�s e r v i c e s
183 lput d i s tance�through�network ? d i s tance s�to�s e r v i c e s ]end
to set�s t a t i cdraw�g i s�l a y e r s
188 set�s t a t i c �agentsend
to set�random� i n i t i a l �c on f i gu r a t i on193 ; ; when mul t ip l e i t e r a t i o n s ( ex c a l i b r a t i o n ) ,
; ; don ’ t do i t each t i c k to gain timeset�s t a t i clog�out " Se t t ing up dynamic agents . . . "; ; s e t " f i x ed " g l oba l vars
198 s e t couple�proba 0 .8s e t ch i ld ren�mean 1; s e t income�mean 16000; s e t income�sigma 3000s e t rent�mean 72.45
203 s e t rent�sigma 6 .9; s e t time�i n t e r v a l 0 . 1 ; 6 months e t s o c i a l �help�max�r e c i p i e n t �proport ion 25s e t taxes�proport ion 0 .1s e t person�co s t 1500
208 s e t s o c i a l �help�max�amount 15000s e t job�oppor tun i t i e s�per�year 100s e t max�immigrant�number�per�year 10s e t max�rent�per�square�meter 200; s e t bnorm 30000
213 s e t stop ? f a l s el e t data read� f i l e "data/unemployment . csv "s e t unemployment�data�time�s c a l e read�from�s t r i n g f i r s t but� f i r s t datas e t unemployment�data map read�from�s t r i n g but� f i r s t but� f i r s t data
218 ; ; extended g l oba l ss e t green�space�s a t i s f a c t i o n �i nd iv idua l�norm�f a c t o r 0 .01s e t s e r v i c e s �s a t i s f a c t i o n �i nd iv idua l�norm�f a c t o r 20s e t standard�i n f l u enc e�on�rent 0 .2; s e t energy�co s t 10
223 log�out " Var iab l e s "
; ; f i x r en t sask bu i l d i ng s [
s e t rent�per�square�meter random�normal rent�mean rent�sigma228 l e t energy�per�month bui ld ing�ene rge t i c�performance / 12
; ; s e t f o r each f l a t rooms , s u r f a c e and rent; ; and standard and en e r g e t i c per formances
f o r each in� f l a t s [l e t r random�f l o a t 1
233 i f e l s e r > couple�proba [ ask ? [ s e t rooms 2 ] ][ i f e l s e r > couple�proba / 2 [ ask ? [ s e t rooms 3 ] ]
[ ask ? [ s e t rooms 4 ] ] ]ask ? [
; ; 3 l e v e l s o f standard238 ; impact on rent ? depends o f parameter
s e t l i v i n g �standard random 3 + 1
179

; ; s u r f a c e : s imp l i f i e d by l i n e a r to roomss e t su r f a c e rooms ⇤ 20; ; e n e r g e t i c p e r f : f i x ed f o r a l l ?
243 ; ; i n i t i a l va lue from gi s�data , r e f change t h i s va lue .s e t ene rge t i c�performance energy�per�month ⇤ s u r f a c e; ; r ent � i n i t i a l va lue so standard i s importants e t rent ( [ rent�per�square�meter ] o f myse l f )
⇤ s u r f a c e ⇤ (1 + ( standard�i n f l u enc e�on�rent ⇤ ( l i v i n g �standard � 1) / 2) )248 ]
]]log�out "Rents"
253 ; ; populate the d i s t r i c t; ; again qu i t e weird method? l e x i c a l l y s o r t by ( rent , rooms )s e t f l a t s �l i s t �by�rooms [ ]s e t f l a t s �l i s t �by�rooms lput sort�by [
lexcomp ?1 ?2 ( l i s t task [ rent ] ) ] f l a t s with [ rooms = 2 ] f l a t s �l i s t �by�rooms258 s e t f l a t s �l i s t �by�rooms lput sort�by [
lexcomp ?1 ?2 ( l i s t task [ rent ] ) ] f l a t s with [ rooms = 3 ] f l a t s �l i s t �by�roomss e t f l a t s �l i s t �by�rooms lput sort�by [
lexcomp ?1 ?2 ( l i s t task [ rent ] ) ] f l a t s with [ rooms = 4 ] f l a t s �l i s t �by�roomsrepeat f l o o r ( count f l a t s ) ⇤ i n i t i a l �occupied� f l a t s / 100 [
263 create�households 1 [new�household income�mean
]]log�out "Households "
268 re s e t�t i c k supdate�drawing
end
273 to load�ques t i onna i r e�data [ f i l e ]s e t ques t i onna i r e�data [ ]f i l e �open f i l eshow f i l e �read�l i n e
; ; sk ip va r i ab l e names l i n e278 whi le [ not f i l e �at�end ? ] [
s e t ques t i onna i r e�data lputf i r s t explode " ;" f i l e �read�l i n e ques t i onna i r e�data
]f i l e �c l o s e
283 end
to�r epor t import�data [ f i l e index ]l e t r e s [ ]f i l e �open f i l e
288 whi le [ not f i l e �at�end ? ] [s e t r e s lput item index explode " ;" f i l e �read�l i n e r e s
]f i l e �c l o s er epor t r e s
293 end
180

File calibration.nls
; ; s imple run on the s implex2 to c a l i b r a t e �with�s implex
s e t ca l i b� f i l e word word " c a l i b r a t i o n / calibSimplexMeanSquares_" date�and�time " . s c i "s e t ca l i b�t i c k 1pr int�in� f i l e ca l i b� f i l e "ms= [ ] ; incomemean = [ ] ; b r e f = [ ] ; bnorm =[ ] ; "; l e t guess [10000 34000 13000]
7 l e t guess [12000 30000 17000]; ; income guess has to be g r ea t e r than t re sho ld , i f not bad time
l e t t sk task [ runmodel ? ]l e t r e s u l t numanal : s implex guess t sk simplex�t o l e r an c e 1000
log�out r e s u l t end12
to�r epor t runmodel [ params ]s e t b r e f f i r s t paramss e t bnorm f i r s t but� f i r s t params
17 s e t income�mean f i r s t but� f i r s t but� f i r s t paramsset�random� i n i t i a l �c on f i gu r a t i on; ; data : beware o f f i l e l ength !s e t rents�obj map read�from�s t r i n g
but� f i r s t read� f i l e "data/rentsNLData . csv "22 s e t incomes�obj map read�from�s t r i n g
but� f i r s t read� f i l e "data/ incomesSimplexObj . csv "s e t max�time length rents�obj
log�out " In simplex , running model . . . "log�out word " b r e f : " b r e f
27 log�out word "bnorm :" bnormlog�out word "incomemean : " income�mean
l e t out 0l e t i 0whi le [ not stop ? ] [
32 goi f ( t i c k s ⇤ time�i n t e r v a l ) mod unemployment�data�time�s c a l e = 0
and t i c k s > 1 and not stop ? [log�out unemployment�datas e t out out +
37 ( ( ( ( mean [ rent / su r f a c e ] o f f l a t s ) � ( item i rents�obj ) ) ^ 2) )+ ( ( ( ( workers�mean�income ) � ( item i incomes�obj ⇤ 1000 / 12)) ^ 2) )s e t i i + 1
]]
42 log�out word "mean�square�e r r o r " outpr int�in� f i l e ca l i b� f i l e word word word word
"ms(" ca l i b�t i c k ")=" min l i s t out 1000000000 " ;"pr int�in� f i l e ca l i b� f i l e word word word word
"incomemean (" ca l ib�t i c k ")=" income�mean " ;"47 pr int�in� f i l e ca l i b� f i l e word word word word
" br e f (" ca l i b�t i c k ")=" br e f " ;"pr int�in� f i l e ca l i b� f i l e word word word word
"bnorm(" ca l ib�t i c k ")=" bnorm " ;"s e t ca l i b�t i c k ca l ib�t i c k + 1
52 s e t ca l i b�e r r o r round outr epor t out
end
181

Interface of the model
182

Appendice G
Source code for evolutionary algorithm design
183

184

Main file
1 ex t en s i on s [ t ab l e nw ]
__includes [
" [ . . . ] / u t i l s / L i s t U t i l i t i e s . n l s "
" [ . . . ] / u t i l s / F i l e U t i l i t i e s . n l s "
6 " [ . . . ] / u t i l s / S t r i n g U t i l i t i e s . n l s "
" eva l s . n l s "
"network . n l s "
]
11 breed [ numbers number ]
breed [ v e r t i c e s ver tex ]
undirected�l ink�breed [ paths path ]
16
g l oba l s [
; ; vars f o r p a r t i t i o n
; ; In % the minimal r a t i o between two volumes o f p a r t i t i o n s
min�pa r t i t i on�r a t e
21 ; ; Max number o f connex components ( ? )
max�pa r t i t i on�components
; ; max number o f i t e r a t i o n s
max�pa r t i t i on�i t e r a t i o n s
26 ; ; vars f o r evo lu t i ona ry a lgor i thm
; ; t ab l e o f l i s t s r ep r e s en t i ng c on f i g u r a t i o n s
; ; should be more e f f i c i e n t to check ex i s t e n c e ?
; ; PB : don ’ t r e a l l y know how hascode i s c a l cu l a t ed and used
; ; we map the conf o f landuses with network d e s c r i p t i o n
31 ; ; : [ [ node�x , node�y ] . . . ] , [ [ [ n1�x , n1�y ] [ n2�x , n2�y ] ] . . . ]
e x i s t i ng�c on f i g u r a t i o n s
; ; l i s t o f best va lues f o r ob j e c t i v e f unc t i on s
; ; should put i t in a tab l e a s s o c i a t ed with conf ?
36 ; ; Yes i f r e c a l c u l a t i o n i s needed ?
best�ob j e c t i v e�va lues
current�c on f i gu r a t i on
current�eva lua t i on
; ; va lues o f preced con f s
41 va lues
]
patches�own [
; ; u t i l i t y var f o r p a r t i t i o n p a r t i t i o n
46 ; ; landuse va r i ab l e
landuse
]
v e r t i c e s �own [ ]
51 paths�own [
path�l ength
]
to setup
56 ca
s e t min�pa r t i t i on�r a t e 5
s e t max�pa r t i t i on�components 5
s e t max�pa r t i t i on�i t e r a t i o n s 50
; ; s e t numbers
61 ask patches [ sprout�numbers 1 [ s e t hidden ? true ] ]
; ; s e t p l o t
set�current�p lo t " pareto "
185
set�current�plot�pen "pen�0"
set�plot�pen�mode 2
66 s e t va lues [ ]
end
to�r epor t eval�c on f i gu r a t i on [ ob j e c t i v e�names conf ]
; ; name o f the ob j e c t i v e f unc t i on s we want to cons ide r
71 s e t current�eva lua t i on [ ]
s e t current�c on f i gu r a t i on conf
f o r each ob j e c t i v e�names [
run word word " s e t current�eva lua t i on lput "
? " current�c on f i gu r a t i on current�eva lua t i on "
76 ]
r epor t current�eva lua t i on
end
to�r epor t cros s�c on f i g u r a t i o n s [ conf1 conf2 ]
81 ; ; con f s in arguments are coup le s
; ; ( conf , nw de s c r i p t i o n ) in the std format
; ; c on f i g u r a t i o n s are s to r ed in l i s t s ,
; ; s o r t ed by "patch number" ,
; ; which i s the number o f the t u r t l e on the patch
86 ; ; t h i s func t i on c r o s s e s the two and repor t the new one .
; ; new conf i s cached out s ide t h i s func t i on
; ; ( because w i l l at term depend o f comparisons )
; ; we repor t the couple ( conf , network d e s c r i p t i o n ) in the standard format
l e t part sort�on [ [ who ] o f one�o f numbers�here ] random�pa r t i t i o n
91 l e t patches� l i s t sort�on [ [ who ] o f one�o f numbers�here ] patches
l e t r e s [ ] l e t resnetwork�nodes [ ] l e t resnetwork�l i n k s [ ]
l e t c1 f i r s t conf1 l e t c2 f i r s t conf2
l e t n1 f i r s t but� f i r s t conf1 l e t n2 f i r s t but� f i r s t conf2
96 ; ; qu i t e hard to obta in l i n e a r complexity f o r networks ;
; ; l e t suppose the number o f nodes and l i n k s remains smal l
; ; get nodes
f o r each f i r s t n1 [
i f member? ( patch ( f i r s t ?) ( l a s t ? ) )
101 part [ s e t resnetwork�nodes lput ? resnetwork�nodes ]
]
; ; and l i n k s
f o r each f i r s t but� f i r s t n1 [
i f member? ( patch ( f i r s t f i r s t ?) ( l a s t f i r s t ? ) ) part
106 and member? ( patch ( f i r s t l a s t ?) ( l a s t l a s t ? ) ) part
[ s e t resnetwork�l i n k s lput ? resnetwork�l i n k s ]
]
; ; idem f o r second network
fo r each f i r s t n2 [
111 i f not member? ( patch ( f i r s t ?) ( l a s t ? ) ) part [
s e t resnetwork�nodes lput ? resnetwork�nodes ]
]
; ; and l i n k s
f o r each f i r s t but� f i r s t n2 [
116 i f not member? ( patch ( f i r s t f i r s t ?) ( l a s t f i r s t ? ) ) part
and not member? ( patch ( f i r s t l a s t ?) ( l a s t l a s t ? ) ) part
[ s e t resnetwork�l i n k s lput ? resnetwork�l i n k s ]
]
; ; most d i f f i c u l t : c r e a t e c r o s s i n g l i n k s .
121 ; ; what h e u r i s t i c ?
; ; f i nd l i n k s with s t a r t in part and other not and r ep l a c e them?
; ; not optimised , t e s t could be done in above loops ?
; ; does i t f o r only one network ? �> randomly chosen
; ; f o r now n1 , n2 . l i t t l e degueu
126 i f e l s e random 2 = 0 [ l e t n n1 s e t n1 n2 s e t n2 n ]
[ l e t n n2 s e t n2 n1 s e t n1 n ]
f o r each f i r s t but� f i r s t n1 [
i f member? ( patch ( f i r s t f i r s t ?) ( l a s t f i r s t ? ) ) part
186
and not member? ( patch ( f i r s t l a s t ?) ( l a s t l a s t ? ) ) part [
131 ; ; f i nd the c l o s e s t v e r t i c e in n2 which i s not in part and l i n k to i t
l e t p patch ( f i r s t f i r s t ?) ( l a s t f i r s t ?)
l e t c l o s e s t �v e r t i c e f i r s t sort�by [
[ d i s t ance p ] o f ( patch ( f i r s t ?1) ( l a s t ?1) ) <
[ d i s t ance p ] o f ( patch ( f i r s t ?2) ( l a s t ? 2 ) ) ] f i r s t n2
136 s e t resnetwork�l i n k s lput
l i s t ( f i r s t ?) ( c l o s e s t �v e r t i c e ) resnetwork�l i n k s
]
]
; ; f i n a l l y connex i fy the nw?
141 create�network l i s t resnetwork�nodes resnetwork�l i n k s
connect�components
s e t resnetwork�l i n k s [ ]
ask paths [ s e t resnetwork�l i n k s lput
l i s t ( l i s t [ xcor ] o f end1 [ ycor ] o f end1 )
146 ( l i s t [ xcor ] o f end2 [ ycor ] o f end2 ) resnetwork�l i n k s ]
ask v e r t i c e s [ d i e ] ask paths [ d i e ]
; ; f o r e f f i c i e n c e , advance in same time in two l i s t e s
; ; uses the p a r t i t i o n property
151 fo r each patches� l i s t [
i f e l s e part != [ ] [
i f e l s e ? = f i r s t part [
s e t r e s lput f i r s t c1 r e s s e t part but� f i r s t part ]
[ s e t r e s lput f i r s t c2 r e s ]
156 ] [
s e t r e s lput f i r s t c2 r e s
]
s e t conf1 but� f i r s t c1 s e t c2 but� f i r s t c2 ]
r epor t l i s t r e s l i s t resnetwork�nodes resnetwork�l i n k s
161 end
to te s t�c r o s s i n g
setup
l e t conf1 constant�conf 2
166 l e t conf2 constant�conf 1
l e t conf c ros s�c on f i g u r a t i o n s conf1 conf2
co lor�c on f i gu r a t i on conf
end
171 to te s t�cascaded�c r o s s i n g s
; ; need s p e c i a l setup f i r s t
l e t conf1 one�o f t ab l e : keys ex i s t i ng�c on f i g u r a t i o n s
l e t n1 tab l e : get ex i s t i ng�c on f i g u r a t i o n s conf1
l e t conf2 one�o f remove conf1 tab l e : keys ex i s t i ng�c on f i g u r a t i o n s
176 l e t n2 tab l e : get ex i s t i ng�c on f i g u r a t i o n s conf2
l e t conf c ros s�c on f i g u r a t i o n s l i s t conf1 n1 l i s t conf2 n2
co lor�c on f i gu r a t i on conf
; ; eva l and p lo t the conf
l e t va l eval�c on f i gu r a t i on ( l i s t " d i v e r s i t y " "nw�speed ") conf
181 update�p lo t va l
t ab l e : put ex i s t i ng�c on f i g u r a t i o n s f i r s t conf l a s t conf
end
to setup�c r o s s i n g s
186 ; ; we begin with a l l cons tants c on f i g u r a t i o n s
setup
s e t ex i s t i ng�c on f i g u r a t i o n s t ab l e : make
s e t best�ob j e c t i v e�va lues [ ]
l e t c o l 10
191 repeat landuses�number [
l e t conf constant�conf v i s i b l e �c o l o r c o l (130 / ( landuses�number � 1) )
; ; generate a random network ?
l e t network [ ]
i f e l s e random�network ? [
187

196 s e t network random�network
] [
; ; h e u r i s t i c f o r " r e a l network" �> jo i n ne ighbors and connected components .
s e t network rea l�network
]
201 tab l e : put ex i s t i ng�c on f i g u r a t i o n s conf network
s e t c o l c o l + (130 / ( landuses�number � 1) )
]
end
206 to�r epor t v i s i b l e �c o l o r [num step ]
; ; r epo r t s a c o l o r from a f l o a t which i s not black or white
; ; in order to d i f f e r e n t i a t e
l e t o r i g i n�c o l o r ( ( f l o o r (num / 10)) ⇤ 10) + 1
repor t o r i g in�c o l o r + ( step ⇤ 0 . 8 )
211 end
to�r epor t index
repor t [ who ] o f one�o f numbers�here
end
216
to�r epor t constant�conf [ n ]
l e t r e s [ ]
r epeat count patches [ s e t r e s lput n r e s ]
r epor t r e s
221 end
to update�p lo t [ va l ]
s e t va lues lput va l va lues
l e t minx 0 l e t maxx 0
226 l e t miny 0 l e t maxy 0
l e t xva l s map f i r s t va lues
i f e l s e l ength xva l s = 1 [ s e t maxx 1 ]
[ s e t minx min xva l s s e t maxx max xva l s ]
l e t yva l s map l a s t va lues
231 i f e l s e l ength yva l s = 1 [ s e t maxy 1 ]
[ s e t miny min yva l s s e t maxy max yva l s ]
set�plot�x�range minx maxx set�plot�y�range miny maxy
fo r each va lues [ p lotxy f i r s t ? l a s t ? ]
end
236
to co lo r�c on f i gu r a t i on [ conf ]
l e t c on f i gu r a t i on f i r s t conf
; ; landuse var w i l l be the c o l o r
f o r each sort�on [ [ who ] o f one�o f numbers�here ] patches [
241 ask ? [ s e t landuse f i r s t c on f i gu r a t i on
s e t c on f i gu r a t i on but� f i r s t c on f i gu r a t i on ] ]
ask patches [ s e t pco l o r landuse ]
; ; shows network
; ; opt ion l a t e r f o r e f f i c i e n c e purposes ?
246 create�network l a s t conf
end
to new�ver tex
s e t c o l o r black s e t shape " c i r c l e " s e t s i z e 0 .5
251 end
to new�path
s e t c o l o r black s e t th i ckne s s 0 .2
end
256
; ; c r e a t e s a random pa r t i t i o n o f the world .
; ; r epo r t s agenset o f one o f the e lements o f the p a r t i t i o n
; ; supposed to be reasonnable : l im i t ed number o f connex components ,
; ; qu i t e we l l balanced
261 to�r epor t random�pa r t i t i o n
188

; ; t ry o f h e u r i s t i c with va r i ab l e d i f f u s i o n
; ; l e t put i n i t i a l number at max�pa r t i t i on�components
ask patches [ s e t p a r t i t i o n 0 ]
ask n�o f max�pa r t i t i on�components patches [ s e t p a r t i t i o n 1 ]
266 repeat max�pa r t i t i on�i t e r a t i o n s [
; l e t put some randomness in d i f f u s i o n proce s s
i f e l s e random 2 = 0 [ d i f f u s e p a r t i t i o n 0 . 5 ]
[ d i f f u s e 4 p a r t i t i o n 0 . 5 ] ]
l e t patches�number round ( ( count patches ) ⇤ (min�pa r t i t i on�r a t e +
271 random (100 � (2 ⇤ min�pa r t i t i on�r a t e ) ) ) / 100)
r epor t max�n�o f patches�number patches [ p a r t i t i o n ]
end
to te s t�random�pa r t i t i o n
276 ask patches [ s e t pco l o r black ]
s e t min�pa r t i t i on�r a t e 5
s e t max�pa r t i t i on�components 5
s e t max�pa r t i t i on�i t e r a t i o n s 50
ask random�pa r t i t i o n [ s e t pco lo r white ]
281 end
to movie�random�pa r t i t i o n
l e t max�time 10
l e t frame�r a t e 4
286 movie�s t a r t word date�and�time " _par t i t i ons .mov"
movie�set�frame�r a t e frame�r a t e
r e s e t�t i c k s
l e t t t imer l e t tmax timer whi le [ t imer � tmax < max�time ]
[ i f ( t imer � t ) > 1 / frame�r a t e [
291 te s t�random�pa r t i t i o n
t i c k
s e t t t imer
movie�grab�view
]
296 ]
movie�c l o s e
end
File evals.nls
to�r epor t d i v e r s i t y [ conf ]
2 l e t W 0
ask patches [ l e t x pxcor l e t y pycor
ask other patches [ s e t W W + (1 / d i s tancexy x y ) ] ]
l e t r 0
ask patches [ l e t x pxcor l e t y pycor
7 l e t t pco lo r ask other patches [
i f pco l o r != t [ s e t r r + (1 / d i s tancexy x y ) ] ] ]
l e t d landuses�number / ( landuses�number � 1) ⇤ r / W
i f d = 0 [ r epor t plot�x�max ]
r epor t (1 / d)
12 end
to�r epor t nw�dens i ty [ conf ]
; ; need to be c a l l e d when network i s bu i l t
; c reate�network
17 l e t n count v e r t i c e s
189

l e t l count paths
r epor t 2 ⇤ l / (n ⇤ (n � 1) )
end
22 to�r epor t nw�speed [ conf ]
; c reate�network
l e t v e r t i c e s � l i s t to� l i s t v e r t i c e s
l e t remaining�v e r t i c e s v e r t i c e s � l i s t
l e t t o t a l 0
27 nw: set�snapshot v e r t i c e s paths
ask paths [ l e t dd 0 ask end1 [
s e t dd d i s t ance other�end ] s e t path�l ength dd ]
f o r each v e r t i c e s � l i s t [
; ; works that way because exact copy o f the l i s t ! Dangerous !
32 i f remaining�v e r t i c e s != [ ] [
s e t remaining�v e r t i c e s but� f i r s t remaining�v e r t i c e s ]
ask ? [
l e t s t a r t ?
f o r each remaining�v e r t i c e s [
37 ask ? [
l e t p nw: weighted�dis tance�to s t a r t "path�l ength "
i f p != f a l s e [ s e t t o t a l t o t a l + (p /( d i s t ance s t a r t ) ) ] ]
]
]
42 ]
l e t nn count v e r t i c e s
r epor t 2 ⇤ t o t a l /(nn ⇤ (nn � 1) )
end
File network.nls
; ; random network genera t i on
to�r epor t random�network
l e t network�nodes [ ]
l e t network�l i n k s [ ]
5 repeat i n i t i a l �nodes [
s e t network�nodes
lput l i s t random�xcor random�ycor network�nodes ]
l e t l i nk s�number round ( ( i n i t i a l �nodes ⇤( i n i t i a l �nodes � 1) / 2) ⇤ i n i t i a l �nw�dens i ty )
10 l e t l 0
whi le [ l < l i nk s�number ]
[ l e t n1 one�o f network�nodes
l e t n2 one�o f network�nodes
i f n1 != n2 and not member? l i s t n1 n2 network�l i n k s and
15 not member? l i s t n2 n1 network�l i n k s [
s e t network�l i n k s lput l i s t n1 n2 network�l i n k s
s e t l l + 1 ]
]
r epor t l i s t network�nodes network�l i n k s
20 end
; ; " more r e a l " nw genera t i on
to�r epor t r ea l�network
; ; c r e a t e the r e a l network
25 create�v e r t i c e s i n i t i a l �nodes [
new�ver tex setxy random�xcor random�ycor ]
190

ask v e r t i c e s [ c reate�paths�with ( ( other v e r t i c e s )
with�min [ d i s t ance myse l f ] ) with [ not l ink�neighbor ? myse l f ] [ new�path ] ]
connect�components
30 ; ; export i t i n to std format
l e t nw�nodes [ ]
l e t nw�paths [ ]
ask v e r t i c e s [ s e t nw�nodes lput l i s t xcor ycor nw�nodes ]
ask paths [ s e t nw�paths lput l i s t
35 ( l i s t [ xcor ] o f end1 [ ycor ] o f end1 )
( l i s t [ xcor ] o f end2 [ ycor ] o f end2 )nw�paths ]
ask v e r t i c e s [ d i e ] ask paths [ d i e ]
r epor t l i s t nw�nodes nw�paths
end
40
to connect�components
l e t dmax sq r t ( ( world�width ^ 2) + ( world�he ight ^ 2) )
l e t c l u s t e r s [ ]
whi l e [ l ength c l u s t e r s = 0 or l ength c l u s t e r s > 2 ]
45 [
nw : set�snapshot v e r t i c e s paths
s e t c l u s t e r s nw : weak�component�c l u s t e r s
l e t c1 f i r s t c l u s t e r s l e t dmin dmax
l e t tmin1 one�o f v e r t i c e s
50 l e t tmin2 one�o f v e r t i c e s
f o r each c l u s t e r s [
i f ? != c1 [
l e t d dmax l e t t1 one�o f v e r t i c e s
l e t t2 one�o f v e r t i c e s
55 fo r each ? [
l e t t ?
f o r each c1 [
ask ? [ i f d i s t ance t < d [
s e t d d i s t ance t s e t t1 s e l f s e t t2 t ] ]
60 ]
]
i f d < dmin [ s e t dmin d s e t tmin1 t1 s e t tmin2 t2 ]
]
]
65 i f tmin1 != tmin2 [ ask tmin1 [
c reate�path�with tmin2 [ new�path ] ] ]
]
end
70 to create�network [ network ]
ask v e r t i c e s [ d i e ] ask paths [ d i e ]
l e t nodes f i r s t network
l e t nw�paths l a s t network
fo r each nodes [ c reate�v e r t i c e s 1 [
75 setxy f i r s t ? l a s t ? new�ver tex ] ]
f o r each nw�paths [
l e t n1 one�o f v e r t i c e s �on patch f i r s t f i r s t ? l a s t f i r s t ?
l e t n2 one�o f v e r t i c e s �on patch f i r s t l a s t ? l a s t l a s t ?
i f n1 != nobody and n2 != nobody [
80 ask n1 [ i f not path�neighbor ? n2 and
n2 != s e l f [ c reate�path�with n2 [ new�path ] ] ] ]
]
end
191

192

Appendice HSource code for utility functions
193

194

File TypeUtilities
1 ; ; type conver s i on func t i on s
to�r epor t bool�to�i n t [ boolean ]i f e l s e boolean [ r epo r t 1 ] [ r epor t 0 ]
end6
to�r epor t int�to�bool [ i n t e g e r ]i f e l s e i n t e g e r != 0 [ r epor t t rue ] [ r epor t f a l s e ]
end
11 ; ; g l oba l v a r i a b l e s management from names as s t r i n gto set�g l oba l [ va r i ab l e�name var i ab l e�value ]
run word word word " s e t " var i ab l e�name " " var i ab l e�valueend
File StringUtilities
1 ; ; ba s i c f unc t i on s o f s t r i n g p ro c e s s i ng
; ; s p l i t the s t r i n g f o l l ow i ng the d e l im i t e rto�r epor t explode [ d e l im i t e r s t r i n g ]
l e t r e s [ ] l e t cur rent ""6 l e t n l ength s t r i n g l e t i 0
repeat n [i f e l s e item i s t r i n g = de l im i t e r [s e t r e s lput cur rent r e s s e t cur rent "" ]
[ s e t cur rent word cur rent item i s t r i n g ]11 s e t i i + 1
]r epor t lput cur rent r e s
end
16 ; ; concats a l l e lements o f the l i s t in one s t r i n gto�r epor t implode [ l ]
l e t r e s ""fo r each l [ s e t r e s word r e s ? ]r epor t r e s
21 end
to�r epor t r ep l a c e [ s t r i n g mot i f new ]l e t n l ength s t r i n g l e t i 0 l e t r e s ""repeat n [ i f e l s e item i s t r i n g = moti f [
26 s e t r e s word r e s new ][ s e t r e s word r e s item i s t r i n g ]
s e t i i + 1]r epor t r e s
31 end
195

File SortingUtilities
; ; s o r t i n g u t i l i t i e s
; ; l e x i c o g r aph i c comparison on a va r i ab l e number o f r epo r t e r ta sk s4 ; ; r epo r t e r l i s t i s so r t ed in dec r ea s ing importance order
; ; boolean r epo r t e rto�r epor t lexcomp [ var1 var2 r epo r t e rTask sL i s t ]
l e t r e s t rue l e t f i x ed ? f a l s ef o r each r epo r t e rTask sL i s t [
9 i f not f i x ed ? [i f e l s e [ r un r e su l t ? ] o f var1 < [ run r e su l t ? ] o f var2[ s e t r e s t rue s e t f i x ed ? true ][ i f e l s e [ r un r e su l t ? ] o f var1 = [ run r e su l t ? ] o f var2 [ s e t r e s t rue ][ s e t r e s f a l s e s e t f i x ed ? true ]
14 ]]
]r epo r t r e s
end19
to te s t�lexcompfo reach sort�by [ lexcomp ?1 ?2 ( l i s t task [ pxcor ] task [ pco l o r ] ) ] patches[ ask ? [ show word word pxcor " � " pco lo r ] ]
end
File NetworkUtilities
; ; f unc t i on s c a l l e d in a p a r t i c u l a r context2 ; ; Create an abs t ra c t network o f breeds ver texes , paths i f and only i f :
; ; � paths�l ayer�data i s a g i s p o l y l i n e l ay e r; ; � g l oba l var c l u s t e r�t r e sho ld ,; ; remaining�l i nk s , remaining�v e r t i c e s has been de f ined ( not i n i t i a l i s e d , no pb); ; � breed v e r t i c e s , undirected�l ink�breed paths
7 ; ; and breed abst ract�g i s�pathshas been def ined ,; ; with corresponding va r i ab l e s , that means in code :; ; breed [ v e r t i c e s ver tex ]; ; breed [ abst ract�g i s�paths abst ract�g i s�path ]; ; abst ract�g i s�paths�own [
12 ; ; g i s�f e a tu r e; ; ver texes� l i s t; ; ]; ; undirected�l ink�breed [ paths path ]; ; paths�own [ path�l ength ]
17 ; ; � L i n kU t i l i t i e s . n l s i s in the i n c l ude s; ; � L i s t U t i l i t i e s . n l s i s in the i n c l ude s
to create�network�v e r t i c e s �c l u s t e r i n gfo r each g i s : f ea ture�l i s t �o f paths�l ayer�data [
22 l e t ab s t r a c t nobodyl e t current�ver tex nobodycreate�abst ract�g i s�paths 1 [s e t g i s�f e a tu r e ? new�abst ract�g i s�paths e t ab s t r a c t s e l f ]
27 fo r each g i s : vertex� l i s t s �o f ? [f o r each l i s t f i r s t ? l a s t ? [
196

l e t l o c g i s : l o ca t i on�o f ? i f l o c != [ ] [c reate�v e r t i c e s 1 [
setxy min l i s t f i r s t l o c max�pxcor min l i s t f i r s t but� f i r s t l o c max�pycor32 new�ver tex
ask abs t r a c t [ s e t v e r t i c e s � l i s t lput myse l f v e r t i c e s � l i s t ]i f e l s e current�ver tex = nobody [ s e t current�ver tex s e l f ]
[ ask current�ver tex [ c reate�path�with myse l f [ new�path ] ] s e t current�ver tex s e l f ]]
37 ]]s e t current�ver tex nobody
]]
42 ; ; t ry a s imple l o c a l c l u s t e r i z es e t remaining�v e r t i c e s to� l i s t v e r t i c e sr e s e t�t i c k swhi le [ l ength remaining�v e r t i c e s > 0 ] [
l e t v f i r s t remaining�v e r t i c e s47 s e t remaining�v e r t i c e s remove v remaining�v e r t i c e s
ask v [ s e t c o l o r blue ]ask v [ fus ion�ne ighbors ]t i c k
]52 end
to fus ion�ne ighborsl e t neigh other v e r t i c e s in�rad ius c l u s t e r �t r e sho l di f count neigh > 0 [
57 l e t n nobodyl e t x mean [ xcor ] o f neighl e t y mean [ ycor ] o f neighhatch�v e r t i c e s 1 [
s e t n s e l f62 setxy x y
ask neigh [s e t remaining�v e r t i c e s remove s e l f remaining�v e r t i c e s
ask my�paths [i f not member? other�end neigh and other�end != n [
67 ask other�end [ c reate�path�with n ] ] d i e ]d i e
]]ask my�paths [ i f not member? other�end neigh and other�end != n [
72 ask other�end [ c reate�path�with n ] ] d i e ]d i e
]end
77 to create�networks e t remaining�l i n k s [ ]; ; paths l ay e r i s supposed to match the world enveloppefo r each g i s : f ea ture�l i s t �o f paths�l ayer�data [
l e t ab s t r a c t nobody82 l e t current�ver tex nobody
create�abst ract�g i s�paths 1 [s e t g i s�f e a tu r e ? new�abst ract�g i s�path s e t ab s t r a c t s e l f ]
f o r each f i r s t g i s : vertex� l i s t s �o f ? [l e t l o c g i s : l o ca t i on�o f ? i f l o c != [ ] [
87 create�v e r t i c e s 1 [setxy min l i s t f i r s t l o c max�pxcor min l i s t f i r s t but� f i r s t l o c max�pycor
new�ver texask abs t r a c t [ s e t v e r t i c e s � l i s t lput myse l f v e r t i c e s � l i s t ]i f e l s e current�ver tex = nobody [ s e t current�ver tex s e l f ]
92 [ ask current�ver tex [ c reate�path�with myse l f [ new�path ] ]s e t current�ver tex s e l f ]
]
197

]]
97 ]l o c a l�c l u s t e r i z es e t remaining�l i n k s to� l i s t pathswhi le [ l ength remaining�l i n k s > 0 ] [show length remaining�l i n k s
102 l e t l one�o f remaining�l i n k ss e t remaining�l i n k s remove l remaining�l i n k sask l [ s e t c o l o r blue s e t th i ckne s s 0 . 3 ]l e t i n t e r i n t e r s e c t i n g li f i n t e r != nobody [
107 l e t i i n t e r s e c t i o n l i n t e rl e t x f i r s t i l e t y f i r s t but� f i r s t ic reate�v e r t i c e s 1 [new�ver tex
setxy x y create�path�with [ end1 ] o f l [112 s e t remaining�l i n k s lput s e l f remaining�l i n k s ]
c reate�path�with [ end2 ] o f l [s e t remaining�l i n k s lput s e l f remaining�l i n k s ]
c reate�path�with [ end1 ] o f i n t e r [s e t remaining�l i n k s lput s e l f remaining�l i n k s ]
117 create�path�with [ end2 ] o f i n t e r [s e t remaining�l i n k s lput s e l f remaining�l i n k s ] ]ask l [ d i e ]
ask i n t e r [ d i e ]s e t remaining�l i n k s remove i n t e r remaining�l i n k s
122 ]]
l o c a l�c l u s t e r i z eask v e r t i c e s [ s e t c o l o r blue ]ask paths [ s e t c o l o r blue s e t th i ckne s s 0 . 3 ]
127 end
; ; p a r t i c u l a r r educt ion o f network by c l u s t e r i n g .; ; ( adapted to the network c r e a t i on procedure and; ; to the r e a l world g i s network we work with )
132 to l o ca l�c l u s t e r i z e; ; d e l e t i n g l o c a l c l u s t e r ss e t remaining�v e r t i c e s to� l i s t v e r t i c e swhi le [ l ength remaining�v e r t i c e s > 0 ] [
l e t v one�o f remaining�v e r t i c e s137 s e t remaining�v e r t i c e s remove v remaining�v e r t i c e s
ask v [ s e t c o l o r blue ]l e t neigh v e r t i c e s with [
member? s e l f remaining�v e r t i c e s and d i s t ance v < c lu s t e r�t r e sho l d and s e l f != v ]i f e l s e count neigh > 0 [ ask one�o f neigh [ f u s i on v ] ]
142 ; ; in the other case , i f e x i s t s one l i n k with d i s t ance < eps i l on ,; ; c r e a t e a ver tex at the p r o j e c t i o n l o c a t i o n; ; added t h i s requirement to have qu i t e in each case a connex network ,; ; because then two very c l o s e l i n k w i l l connect although they don ’ t i n t e r s e c t at the smal l s c a l e[ ask v [
147 l e t ml my�pathsl e t x xcor l e t y ycorl e t ps paths with [ not member? s e l f ml and di s tance�to�point x y < c lu s t e r�t r e sho l d ]i f count ps > 0 [ ask one�o f ps [
l e t p coord�of�pro j e c t i on�o f x y152 l e t xx f i r s t p l e t yy f i r s t but� f i r s t p
l e t e1 end1 l e t e2 end2ask e1 [ hatch�v e r t i c e s 1 [
setxy xx yycreate�path�with e1 [ s e t th i ckne s s 1 ]
157 ; th i ckne s s f o r debug purposes at the beg inningcreate�path�with e2 [ s e t th i ckne s s 1 ]f u s i on v
]
198

]162 d i e
; the o ld l i n k]
]]
167 ]]ask v e r t i c e s [ s e t c o l o r blue ]ask paths [ s e t c o l o r blue s e t th i ckne s s 0 . 3 ]
end172
to f u s i on [ v ]s e t remaining�v e r t i c e s remove s e l f remaining�v e r t i c e sl e t v1 s e l f l e t v2 v; show " fu s i on "
177 ; show v1; show v2l e t x ( [ xcor ] o f v1 + [ xcor ] o f v2 ) / 2l e t y ( [ ycor ] o f v1 + [ ycor ] o f v2 ) / 2hatch�v e r t i c e s 1 [ setxy x y
182 l e t n s e l f; show word "n : " nask ( [my�paths ] o f v1 ) with [ end1 != v2 and end2 != v2 ]
[ show s e l f i f e l s e end1 = v1 [ ask end2 [ c reate�path�with n ] ][ ask end1 [ create�path�with n ] ] d i e ]
187 ask ( [my�paths ] o f v2 ) with [ end1 != v1 and end2 != v1 ][ show s e l f i f e l s e end1 = v2 [ ask end2 [ c reate�path�with n ] ][ ask end1 [ create�path�with n ] ] d i e ]
ask ( [my�paths ] o f v1 ) [ i f end1 = v2 or end2 = v2 [ d i e ] ]ask v1 [ d i e ]
192 ask v2 [ d i e ]s e t remaining�v e r t i c e s lput s e l f remaining�v e r t i c e s
]end
197 to�r epor t i n t e r s e c t i n g [ l ]; ; hard complexity
l e t r e s nobodyl e t found? f a l s el e t r�l i n k s to� l i s t paths with [ s e l f != l ]
202 whi le [ not found? and length r�l i n k s > 0 ] [l e t l 1 one�o f r�l i n k s s e t r�l i n k s remove l 1 r�l i n k si f i n t e r s e c t i o n l l 1 != [ ] and not common�extremity ? l l 1 [ s e t r e s l 1 s e t found? true ]
]r epor t r e s
207 end
to�r epor t common�extremity ? [ l 1 l 2 ]r epor t [ end1 ] o f l 1 = [ end1 ] o f l 2 or
[ end1 ] o f l 1 = [ end2 ] o f l 2 or [ end2 ] o f l 1 = [ end2 ] o f l 2 or212 [ end1 ] o f l 2 = [ end2 ] o f l 1
end
to new�ver texs e t s i z e 0 .5 s e t shape " c i r c l e " s e t c o l o r grey
217 end
to new�abst ract�g i s�paths e t hidden ? true s e t v e r t i c e s � l i s t [ ]
end222
to new�paths e t th i ckne s s 0 .2 s e t c o l o r grey
end
199

227 ; ; ; ; ; ; ; ; ; ; ; ; ; Calcu l o f d i s t an c e s in the network ; ; ; ; ; ; ; ; ; ; ;; ; Requires : nw extens i on s e t; ; same breeds as be f o r e ( need path length f o r weighted d i s t ance ! ); ; t u r t l e procedure : d i s t ance to other t u r t l e through network; ; snapshot and l i n k d i s t ance done in other funct ion , so done j u s t 1 time ( e f f i c i e n c y ! )
232 to snapshotnw : set�snapshot v e r t i c e s pathsask paths [ l e t dd 0 l e t e2 end2
ask end1 [ s e t dd d i s t ance e2 ] s e t path�l ength dd ]end
237; ; beware , need snapshot be f o r e !to�r epor t d i s tance�through�network [ target�t u r t l e ]
l e t o r i g i n f i r s t sort�on [ d i s t ance myse l f ] v e r t i c e sl e t d e s t i n a t i on nobody
242 ask target�t u r t l e [ s e t d e s t i n a t i on f i r s t sort�on [ d i s t ance myse l f ] v e r t i c e s ]l e t r e s 0ask o r i g i n [ s e t r e s nw : weighted�dis tance�to d e s t i n a t i on "path�l ength " ]; i f r e s = f a l s e [ ask o r i g i n [ s e t s i z e 3 s e t hidden ? f a l s e ]; ask d e s t i n a t i on [ s e t s i z e 3 s e t hidden ? f a l s e ] ]
247 i f r e s = f a l s e [ s e t r e s 0 ]; ; Beware : in theory i n f i n i t y , but f o r norms ca l c u l a t i o n s , j u s t not taken in to account , so ok; f o r other use not coherent behavior; ; SO : network MUST be connex ! ! !; ; add t h i s f i x to avoid bugs but can produce i n s t a b l e r e s u l t s
252; ; should add both eu c l i d i a n d i s t an c e s ? Yes , more p r e c i s e in that case !; ; BUT could e x i s t some ca s e s where the f i n a l d i s t ance i s not the s ho r t e s t .; ; ( i f network can be reached through p r o j e c t i o n on l i n k s .; ; I f network can be entered only by ve r t exe s ?
257 ; ; a l s o counter�examples o f that f a c t ??? Yes . . .; ; but s t i l l , should be good approximation in r e a l i s t i c ca s e s .; ; ( on random networks ?) ( wr i t e something on that ?)
l e t dt 0 ask target�t u r t l e [ s e t dt d i s t ance d e s t i n a t i on ]262 repor t ( d i s t ance o r i g i n ) + r e s + dt
end
File ListUtilities
; ; agent s e t / l i s t f unc t i on s2
to�r epor t to� l i s t [ agent s e t ]l e t r e s [ ]ask agent se t [
s e t r e s lput s e l f r e s7 ]
r epor t r e send
; ; normal i sed norm�p o f a vec tor12 ; ; in t h i s f i l e because app l i e s on a l i s t
to�r epor t norm�p [ p l ]l e t r e s 0l e t n l ength lf o r each l [ s e t r e s r e s + (? ^ p ) ]
17 r epor t ( r e s / n) ^ (1 / p)
200
end
File LinkUtilities
2 to�r epor t i n t e r s e c t i o n [ t1 t2 ]i f [ xcor ] o f [ end1 ] o f t1 = [ xcor ] o f [ end2 ] o f t1 and[ ycor ] o f [ end1 ] o f t1 = [ ycor ] o f [ end2 ] o f t1 [ r epo r t [ ] ]
i f [ xcor ] o f [ end1 ] o f t2 = [ xcor ] o f [ end2 ] o f t2 and[ ycor ] o f [ end1 ] o f t2 = [ ycor ] o f [ end2 ] o f t2 [ r epo r t [ ] ]
7 l e t m1 [ tan (90 � l ink�heading ) ] o f t1l e t m2 [ tan (90 � l ink�heading ) ] o f t2
i f m1 = m2 [ r epor t [ ] ]
12 i f abs m1 = tan 90 [i f e l s e abs m2 = tan 90
[ r epo r t [ ] ][ r epo r t i n t e r s e c t i o n t2 t1 ]
]17
i f abs m2 = tan 90 [l e t c1 [ l ink�ycor � l ink�xcor ⇤ m1] o f t1l e t x [ l ink�xcor ] o f t2l e t y m1 ⇤ x + c1
22 i f not [ x�within ? x ] o f t1 [ r epor t [ ] ]i f not [ y�within ? y ] o f t2 [ r epor t [ ] ]r epo r t l i s t x y
]
27 l e t c1 [ l ink�ycor � l ink�xcor ⇤ m1] o f t1l e t c2 [ l ink�ycor � l ink�xcor ⇤ m2] o f t2l e t x ( c2 � c1 ) / (m1 � m2)i f not [ x�within ? x ] o f t1 [ r epor t [ ] ]i f not [ x�within ? x ] o f t2 [ r epor t [ ] ]
32 r epor t l i s t x (m1 ⇤ x + c1 )end
to�r epor t x�within ? [ x ]r epor t abs ( l ink�xcor � x ) <= abs ( l ink�l ength / 2 ⇤ s i n l ink�heading )
37 end
to�r epor t y�within ? [ y ]r epor t abs ( l ink�ycor � y ) <= abs ( l ink�l ength / 2 ⇤ cos l ink�heading )
end42
to�r epor t l ink�xcorr epor t ( [ xcor ] o f end1 + [ xcor ] o f end2 ) / 2
end
47 to�r epor t l ink�ycorr epor t ( [ ycor ] o f end1 + [ ycor ] o f end2 ) / 2
end
201

File GISUtilities
1 ; ; GIS s p e c i f i c g ene ra l f unc t i on s
to�r epor t patches�in [ g i s shape ]r epor t patches with [
g i s : conta ins ? g i s shape s e l f or g i s : i n t e r s e c t s ? g i s shape s e l f6 ]
end
File FileUtilities
; ; read and wr i t e f i l e u t i l i t i e s
3 to�r epor t read� f i l e [ f i l ename ]l e t r e s [ ]f i l e �open f i l enamewhi le [ not f i l e �at�end ? ] [
s e t r e s lput f i l e �read�l i n e r e s8 ]
f i l e �c l o s er epor t r e s
end
13 to pr int�in� f i l e [ f i l ename output ]f i l e �open f i l enamef i l e �pr in t outputf i l e �c l o s e
end18
; ; export p l o t as s c i l a b data; ; need s t r i n g u t i l i t i e s i n c lude; ; don ’ t work with mul t ip l e pens !; ; o v e r r i d e e x i s t i n g f i l e or wr i t e i t at the end?
23 to export�plot�as�s c i l a b [ plotname f i l ename var1name var2name ]i f f i l e �e x i s t s ? f i l ename [ f i l e �de l e t e f i l ename ]
l e t t emp f i l e word date�and�time " . temp"pr int�in� f i l e t emp f i l e ""pr int�in� f i l e f i l ename word "//Export p l o t as s c i l a b data : "
28 plotnamepr int�in� f i l e f i l ename word word word
var1name "=[ ] ; " var2name "=[ ] ; "export�p lo t plotname t emp f i l e; l e t data� l i s t read� f i l e t emp f i l e ;
33 ; show data� l i s t ;; l e t data ? f a l s e
; l e t i 1 ;; f o r each data� l i s t [; i f e l s e data ? [
38 ; l e t l explode " ," ?; pr int�in� f i l e f i l ename word word word word word; var1name "(" i ")=" r ep l a c e f i r s t l "\"" "" " ;"; pr int�in� f i l e f i l ename word word word word word; var2name "(" i ")=" r ep l a c e f i r s t but� f i r s t l "\"" "" " ;"
43 ; s e t i i + 1; ]
202

; [; s e t data ? ( f i r s t explode " ," ?) = "\"x\""; pr int�in� f i l e f i l ename word "//" ?
48 ; ]; ]; ; f i l e �de l e t e t emp f i l eend
File EuclidianDistancesUtilities
; ; Euc l id ian d i s t ance c a l c u l a t i o n u t i l i t i e s f unc t i on s
; t u r t l e or patch procedure r epo r t i ng the d i s t ance4 ; to a given l i n k
to�r epor t d i s tance�to�l i n k [ l ]l e t x1 0 l e t y1 0l e t x2 0 l e t y2 0l e t e1 0 l e t e2 0
9 l e t x 0 l e t y 0ask l [ s e t e1 end1 s e t e2 end2 ]i f e l s e i s�t u r t l e ? s e l f [
s e t x xcor s e t y ycor ] [ s e t x pxcor s e t y pycor ]ask e1 [ s e t x1 xcor s e t y1 ycor ]
14 ask e2 [ s e t x2 xcor s e t y2 ycor ]l e t m1m sq r t ( ( ( x1 � x ) ^ 2) + ( ( y1 � y ) ^ 2) )l e t m2m sq r t ( ( ( x2 � x ) ^ 2) + ( ( y2 � y ) ^ 2) )l e t m1m2 sq r t ( ( ( x1 � x2 ) ^ 2) + ( ( y1 � y2 ) ^ 2) )i f m1m = 0 or m2m = 0 [ r epor t 0 ]
19 i f m1m2 = 0 [ r epor t m1m]l e t cos t1 ( ( ( x � x1 )⇤ ( x2 � x1 ) ) +
( ( y � y1 )⇤ ( y2 � y1 ) ) ) / (m1m ⇤ m1m2)l e t cos t2 ( ( ( x � x2 )⇤ ( x1 � x2 ) ) +
( ( y � y2 )⇤ ( y1 � y2 ) ) ) / (m2m ⇤ m1m2)24 i f co s t1 < 0 [ r epor t m1m]
i f co s t2 < 0 [ r epor t m2m]repor t m1m ⇤ sq r t abs (1 � ( cos t1 ^ 2) )
end
29 ; l i n k procedure which c a l c u l a t e s the d i s t ance; to a given po intto�r epor t d i s tance�to�point [ x y ]
l e t x1 0 l e t y1 0 l e t x2 0 l e t y2 0ask end1 [ s e t x1 xcor s e t y1 ycor ]
34 ask end2 [ s e t x2 xcor s e t y2 ycor ]l e t m1m sq r t ( ( ( x1 � x ) ^ 2) + ( ( y1 � y ) ^ 2) )l e t m2m sq r t ( ( ( x2 � x ) ^ 2) + ( ( y2 � y ) ^ 2) )l e t m1m2 sq r t ( ( ( x1 � x2 ) ^ 2) + ( ( y1 � y2 ) ^ 2) )i f m1m = 0 or m2m = 0 [ r epor t 0 ]
39 i f m1m2 = 0 [ r epor t m1m]l e t cos t1 ( ( ( x � x1 )⇤ ( x2 � x1 ) )+ ( ( y � y1 )⇤ ( y2 � y1 ) ) ) / (m1m ⇤ m1m2)
l e t cos t2 ( ( ( x � x2 )⇤ ( x1 � x2 ) )+ ( ( y � y2 )⇤ ( y1 � y2 ) ) ) / (m2m ⇤ m1m2)
44 i f co s t1 < 0 [ r epor t m1m]i f co s t2 < 0 [ r epor t m2m]repor t m1m ⇤ sq r t abs (1 � ( cos t1 ^ 2) )
end
203

49 ; r epor t a t u r t l e on the p r o j e c t i o n o f po int x y; on the c a l l i n g l i n kto�r epor t p ro j e c t i on�o f [ x y ]
l e t x1 0 l e t y1 0 l e t x2 0 l e t y2 0ask end1 [ s e t x1 xcor s e t y1 ycor ]
54 ask end2 [ s e t x2 xcor s e t y2 ycor ]l e t m1m sq r t ( ( ( x1 � x ) ^ 2) + ( ( y1 � y ) ^ 2) )l e t m2m sq r t ( ( ( x2 � x ) ^ 2) + ( ( y2 � y ) ^ 2) )l e t m1m2 sq r t ( ( ( x1 � x2 ) ^ 2) + ( ( y1 � y2 ) ^ 2) )i f m1m = 0 or m1m2 = 0 [ r epor t end1 ]
59 i f m2m = 0 [ r epor t end2 ]l e t co s t1 ( ( ( x � x1 )⇤ ( x2 � x1 ) ) +
( ( y � y1 )⇤ ( y2 � y1 ) ) ) / (m1m ⇤ m1m2)l e t cos t2 ( ( ( x � x2 )⇤ ( x1 � x2 ) ) +
( ( y � y2 )⇤ ( y1 � y2 ) ) ) / (m2m ⇤ m1m2)64 l e t mq 0 l e t xx 0 l e t yy 0 l e t m1q 0
i f e l s e cos t1 < 0 [r epor t end1
] [i f e l s e cos t2 < 0 [
69 repor t end2] [
s e t mq m1m ⇤ sq r t abs (1 � ( cos t1 ^ 2) )s e t m1q sq r t ( (m1m ^ 2) � (mq ^ 2) )s e t xx x1 + m1q ⇤ ( x2 � x1 ) / m1m2
74 s e t yy y1 + m1q ⇤ ( y2 � y1 ) / m1m2i f count t u r t l e s �on patch xx yy = 0 [ask patch xx yy [ sprout 1 [
setxy xx yy]
79 ]]
r epor t one�o f t u r t l e s �on patch xx yy]
]84 end
; ; same as p r o j e c t i o n but doesn ’ t pose the problem of k i l l i n g; the t u r t l e or not ( which surv ived sometimes anyway ,;why? �> because i n t e r n a l l y c reated ? l o s t the po in t e r
89 to�r epor t coord�of�pro j e c t i on�o f [ x y ]l e t x1 0 l e t y1 0 l e t x2 0 l e t y2 0ask end1 [ s e t x1 xcor s e t y1 ycor ]ask end2 [ s e t x2 xcor s e t y2 ycor ]l e t m1m sq r t ( ( ( x1 � x ) ^ 2) + ( ( y1 � y ) ^ 2) )
94 l e t m2m sqr t ( ( ( x2 � x ) ^ 2) + ( ( y2 � y ) ^ 2) )l e t m1m2 sq r t ( ( ( x1 � x2 ) ^ 2) + ( ( y1 � y2 ) ^ 2) )i f m1m = 0 or m1m2 = 0 [ r epor t end1 ]i f m2m = 0 [ r epor t end2 ]l e t co s t1 ( ( ( x � x1 )⇤ ( x2 � x1 ) ) +
99 ( ( y � y1 )⇤ ( y2 � y1 ) ) ) / (m1m ⇤ m1m2)l e t cos t2 ( ( ( x � x2 )⇤ ( x1 � x2 ) ) +
( ( y � y2 )⇤ ( y1 � y2 ) ) ) / (m2m ⇤ m1m2)l e t mq 0 l e t xx 0 l e t yy 0 l e t m1q 0
i f e l s e cos t1 < 0 [104 repor t l i s t [ xcor ] o f end1 [ ycor ] o f end1
] [i f e l s e cos t2 < 0 [r epor t l i s t [ xcor ] o f end2 [ ycor ] o f end2
] [109 s e t mq m1m ⇤ sq r t abs (1 � ( cos t1 ^ 2) )
s e t m1q sq r t ( (m1m ^ 2) � (mq ^ 2) )s e t xx x1 + m1q ⇤ ( x2 � x1 ) / m1m2s e t yy y1 + m1q ⇤ ( y2 � y1 ) / m1m2
repor t l i s t xx yy
204

114 ]]
end
205

206

Appendice I
Questionnaire Grid used in the frame of ReBo project
207

208

A.Bakgrund
1. Hur gammal är du?
_____r.
2. Ar du .... Kvinna LI Man LI
3. Hur lange har du bott I0-Sar 5-lOar 10-2Oar 20-4Oar 40+ arLangangen?
LI LI LI
4. Vilken är din huvudsakligasysselsättning? ‘\nstä1ld LI Egen foretagare
LI Pensionär El Student
LI Foraldraledig LI ArbetssOkande
Annat, namligen
5. Vilken är din hogsta utbi1dningsniv? LI Folkskola/grundskola LI Realskola
LI Folkhogskola LI Laroverk/gymnasium
LI Yrkesutbildning/KY Hogskola/Universitet
Annat, närnligen
6. Vilket sprãk talar du/ni vanligtvis hem ma?
Svenska
LI Svenska och annat sprk
LI Annat sprâk, namligen
B. Hälsa och välmâende
1. Hur nöjd med din nuvarande situation? Vanhigen kryssa i det alternativet per kategori som du tyckeröverensstämmer bäst p dig.
MycketMycket nöjdmissnojd
1 2 3 4 5
Din fysiska hälsa LI LI LI LI
Ditt välmâende LI LI LI LI
Dittboende El LI - LI
Din utbildning LI LI LI LI
3

Fortsättning hälsa och välmâende. Mycket Mycket nojdHur nöjd är du medfoljande? missnojd
1 2 3 4 5
Dittarbete Li LI Li Li
Dinfritid LI Li LI Li
Din familjesituation Li Li Li Li
Din vänskapskrets Li Li Li Li
Din Iivssituation överlag Li 1)c Li Li
C. Livsforing. Vad gör du pa din fritid?
. VarjeVane dag Varje vecka Varje ar Aidrig
manad
1 2 3 4 5
Idrottar/motionerar Li Li Li Li
Besöker eller engagerar mig i konserter/Li Li Li Li
kulturevenemang
Ar ute i naturen. Ex. vandrar eller plockarLi b Li Li
bar.
Shoppar/tittar i butiker Li Li £14 Li Li
Tittar pa TV/film Li Li Li Li
Använder dator (ex. surfar, spelar spel) Li Li Li [1
Umgas med vänner och familj Li Li Li Li
Laser tidningar/bocker Li Li Li Li
Andligt utövande/mental träning Ex.Li Li Li Li
religion, meditation, yoga
Matlagning/bakning Li Li Li Li
Odling Li Li Li Li
Annat, namligen
4

D Ekonomi
Markera pa skalan fran “Inte ails” till “Mycket väi” For huryal dessa pastaenden stammer in pi dig.Stammer: Inte ails Mycket väl
1 2 3 4 5När jag jämför de manatliga intäkterna med
LI LI El LIutgifterna sâ gâr det ihop utan svarigheter.
Jag är fullkomligt nöjd med mm materiellastandard, dvs saker jag kan kopa for pengar sisom El LI LI “ LIboende, möbler, bil, resor, pryiar, etc.
Om jag far en oväntad räkning pa 20 000 kr sâ kan LI LI LI Eljag utan större problem betala den mom en vecka.
E. Bostadsomràdet
1. Hur nöjd är du med föijande aspekter? Vanligen fy11 i pa skalan fran “irite ails nöjd” till “mycket näjd”
MycketInte ails nojdno] d
1 2 3 4 5Hur husen ãr byggda/utformade LI El LI jI’ LISkötseln av fastigheterna i oni’rdet LI [1 LI ElTillgâng till torg och öppna platser LI LI LI LISkotsel/stadning av torg och oppna platser El El El ElTiligângen till park- och naturomrâden LI Li LI ElTiligâng till gang- och cykeibanor El Li LI LIMojlighet att ta sig fram till fots/med cykel LI LI LI !‘ LIKoliektivtrafiken till/fran Lãngangen LI LI LI LITillgâng till gator och vägar till/fran Lângängen LI LI !lZ, El LITillgang till kommunal service LI LI LI LITryggheten i Lngängen kvãilar och flatter LI LI LI LITryggheten i Lângängen dagtid LI LI LI LITillgáng till olika typer av mötesplatser LI LI LI LILângangen i dess heihet som plats att bo och leva
LI LI LI LIpa
5

2. Hur viktigt tycker du att det är med olika tänkbara satsningar i Lângängen? Vanhigen svara pa skalan
fran “inte ails viktigt” till “mycket viktigt”.
Inte ails Mycket
Satsningar pa.. viktigt viktigt
1 2 3 4 5
..att bygga fier bostäder LI LI [1 Li
..renovering av befintliga fastigheter LI LI LI LI
..fler gronomraden LI LI Li Li W
..bibliotek LI LI Li LI
..gâng- och cykelbanor Li LI LI Li
..vagarna Li Li LI Li
..koliektivtrafiken LI Li Li LI
..lekpiatser Li Li Li LI
..olika typer av motespiatser Li Li Li LI
..affärsutbudet LI LI Li Li
..motionsanlaggningar LI LI LI LI
..bättre stadning och underhall av gator ochLI Li LI Li
allmänna platser
..ökad trygghet och säkerhet LI Li LI LI
Li Li LI LI..mindre skadegorelse
Annan satsning som du tycker är viktig, namligen:
3. Hur är samhälisklimatet i Lngängen? Hur väi stammer pâstâendena nedan överens med hur det är i
Lângangen. Svara pa skalan fran “inte ails” till “mycket väi”
Stammer: Ente ails Mycket väl
1 2 3 4 5
I Lângangen ställer vi upp for varandra LI Li LI Li
I Lângängen finns mycket konflikter mellanLi Li Li Li
invãnare
Langangen är ett socialt segrege rat omrade LI Li Li Li
Langangen är en bra plats for barn att växaLI LI Li LI
upppâ
4. Funderar du pa att flytta Iran Langangen Li Ja nej
6
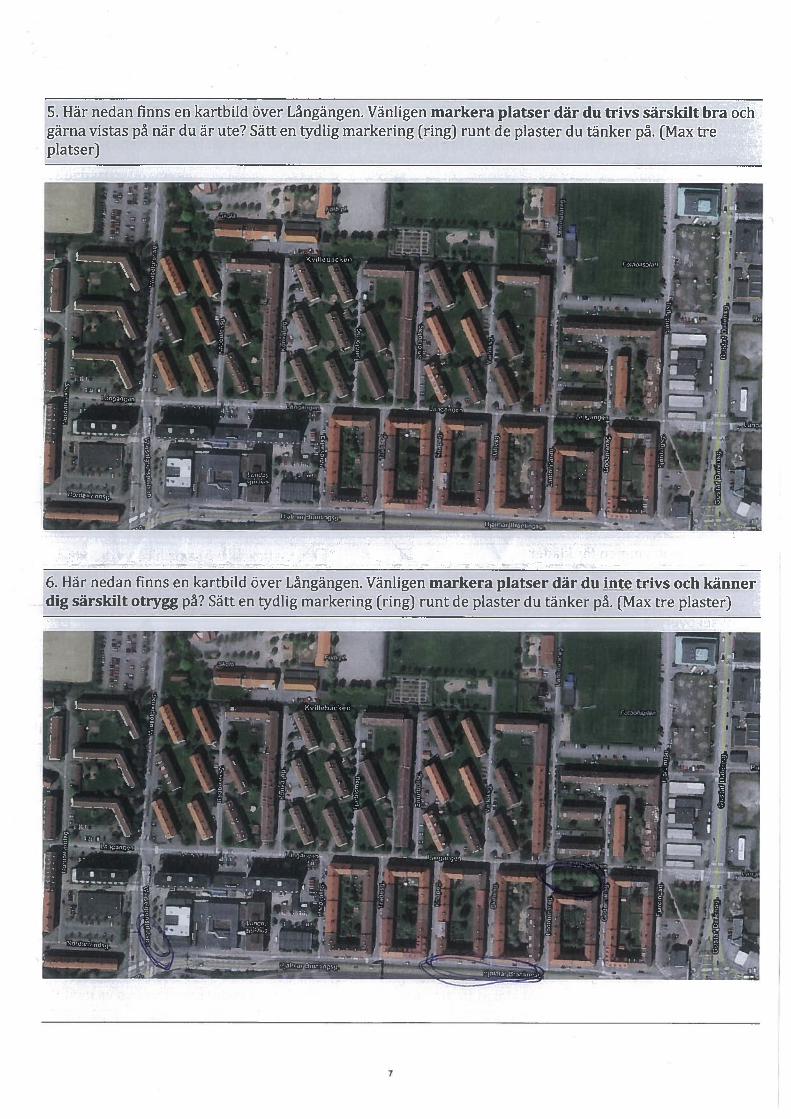
5. Här nedan finns en kartbild over Lngängen. Vänligen markera platser där du trivs särskilt bra ochgärna vistas pa när du är ute? Satt en tydlig markering (ring) runt de plaster du tanker pa. (Max treplatser)
6. Här nedan finns en kartbild Over Lângangen. Vanligen markera platser där du trivs och kännerdig särskilt otrygg pa? Satt en tydlig markering (ring) runt de plaster du tanker pa. (Max tre plaster)
7

F. Lagenheten I1. Hur nöjd är du med följande aspekter i din lagenhet. Vanligen p skalan fran “inte ails nöjd”
till “mycket nojd” 4f
Naturligtljusinsläpp LI LI LI LI
Ljudisolering i huset (ex. meilan dig ochLI LI LI LI
grannar)
Ljudisolering utifran (ex. fran gatan) LI LI LI LI
Temperatur sommartid LI LI LI X LI
Temperatur vintertid LI LI LI LI
Ventilation och iuftkvalitet i lagenheten LI LI LI LI
Koksinredning LI LI LI LI
Badrumsinredning LI LI LI LI
Förvaringsutrymmen for kläder LI LI LI LI
Forrãdsutrymmen som hör till lagenheten LI LI LI LI
Trivsei overlag LI LI LI LI
-_bfr2. Om digoch din lagenhet. Hur väl stammer följande pastaenden? Vanligen svara pa skalan fran “inte
ails” till “mycket väl”.
Stammer: Inte ails Mycket väi
1 2 3 4 5
Jag trivs bra i mm lagenhet LI LI LI LI
Lagenhetens standard är bra LI LI LI LI
Jag känner mig säker I mm Iagenhet LI LI LI LI
Jag känner mig stoit over mm lägenhet LI LI LI LI
Jag känner mig stoit over huset LI LI N. LI LI
-:J ‘i’ ‘‘f° Inte ailsnojd
Mycketnöjd
8

Iwr9tt L
3. Hur viktigt tycker du att det är med olika tãnkbara satsningar i din lagenhet? Vänligen svara p skalanfrn “inte ails viktigt” till “mycket viktigt” for de olika forbattrings- och fornyeIsetgarderna.
,<‘
Inte ails Mycket Gãller ejForbattra/Fornya.. viktigt viktigt mig
1 2 3 4 5..koksinredningen overlag (vitvaror,
. El El El El Eldiskbank, skafferi etc)
..koksinredningens användbarhet /... El El El El l El(arbetshojd pa diskbank/koksbank etc)
..badrumsinredningen overlag (WC,El Elhandfat, dusch/badkar etc) —‘--‘
El LI El
..badrummet Overlag (vaggar, golv etc) El LI El LI El
..ytskikt p väggar och golv I vardagsrum El El El LI El
..vardagsrummets fönster El El C] LI El
..ytskikt p vãggar och golv i sovrum LI LI LI El LI
..sovrummets fönster El El El El LI
..ytskikt pa vaggar och golv i hallen El El El LI El
..ventilation fran spis (dvs köksfläkt ellerEl LI El El Elmotsvarande) i
..ventilation i badrum’’’ El El El El El
..ventilation i lagenheten i övrigt. LI El LI El El
..ljudisolering inomhus LI Li LI LI El
..ljudisolering utifrãn El LI El LI El
..temperatur inomhus pa vâren’” El LI LI El El
..temperatur inomhus pa sommaren El LI LI El El
..temperatur inomhus pa hösten ‘ LI LI LI LI LI
..temperatur inomhus pa vintern LI El El El El
..forvaringsutrymmen for kläder El El El El El
..forradsutrymmeri (vind/kãllare) El LI LI LI El
Annat som du anser skulle vara viktig att forbattra/fornya, nämligen
Vilken av ovanstaende satsningar skulle det vara motiverat att betala for?_______________________
9

G. Inflytande och samverkan
1. När det galler bostadsomrâdet, vad tycker du är viktigt att du som boende har inflytande over?
2. Om du hade mojlighet, skulle du vilja vara mer engagerad an vad du är idag gallandebostadsomrâdet?
LlNej LIVetej
3. Känner du dig invoiverad i beslut som rör din lägenhet?
LIJa .Nej LlVetej
4 Hur viktigt skulle du yard era att foijande saker ar rorande inflytade ition Vanhigenmarkera pa skalan fran “inte’alls viktigt” till “mycket viktigt”
Inte ails Mycketviktigt viktigt
Boende ges inflytande i planeringsfasen videventuell renovering av lagenheterna i LI LI L] LI LILângangen
Boende ges mojlighet att pâverka forslagLI LI LI LI LI
om eventuell renovering
Information om eventuell renovering tillLI LI LI LI LI
boende i Langangen
5. Nar det galler din lãgenhet, vad tycker du är viktigt att ha inflytande over vid en eventuell renovering?
6. Känner du att du har fatt gehor for dma önskemâl och synpunkter du stahlt till Famihjebostader?
LI Ja 4iiej LI Har ej haft nâgra onskemâl/synpunkter
7. Ovriga synpunkter:
10
Related Documents


![[ Sustainable Renovation in the Upper City ] Bergamo 2.(035) Paolo Pesenti p.pesenti@studenti.unibg.](https://static.cupdf.com/doc/110x72/56649f425503460f94c61a50/-sustainable-renovation-in-the-upper-city-bergamo-2035-paolo-pesenti.jpg)

![[ Sustainable Renovation in the Upper City ]](https://static.cupdf.com/doc/110x72/568161dc550346895dd1e9b1/-sustainable-renovation-in-the-upper-city-.jpg)
