APPLICATION OF ELECTRIC WELL LOGGING AND OTHER WELL LOGGING METHODS IN HAWAII Chester Lao Frank L. Peterson Doak C. Cox Technical Report No. 21 November 1969 The programs and activities described herein were supported by funds provided by the Board of Water Supply, City and County of Honolulu; Department of Land and Natural Resources, Division of Water and Land Development of the State of Hawaii; and the University of Hawai i .

Welcome message from author
This document is posted to help you gain knowledge. Please leave a comment to let me know what you think about it! Share it to your friends and learn new things together.
Transcript

APPLICATION OF ELECTRIC WELL LOGGING
AND OTHER WELL LOGGING METHODS IN HAWAII
Chester Lao
Frank L. Peterson
Doak C. Cox
Technical Report No. 21
November 1969
The programs and activities described herein were supportedby funds provided by the Board of Water Supply, City andCounty of Honolulu; Department of Land and Natural Resources,Division of Water and Land Development of the State of Hawaii;and the University of Hawai i .


ABSTRACT
In 19663 t he Water Resources Research Center initiated a compre
hensive study of electric well logging and other geophysical well
logging techniques in Hawaii. The primary objectives of this study
were t o determine what results could be obtained by the use of conven
tional electric and geophysical well-logging methods under Hawaiian
conditions and t o collect as much basic geologic3 hydrologic3 and geo
metric information as possible from wells in Hawaiian aquifers. The
functions logged include spontaneous potential3 point resistivity3
short and normal resistivitY3 lateral resistivitY3 water tempera
ture3 water conductivitY3 and caliper.
Resistivity logging in Hawaii produced much important qualitative
information and some quantitative information. Resistivity logs from
we l Zs in basaltic aquifers indicate the location3 number3 thickness3and total t hi cknesses of permeable and less permeable formations and
are extremely useful as indicators of water-yieZding zones. High re
sistivities general l y are indicative of dense impermeable basalts and
low resistivities are indicative of porous permeable zones most likely
to contribute water to the borehole. The logs also provide a direct
measurement of depth to wat er 3 depth of casing3 and depth of hole.
Spontaneous potential logs sometimes are inconsistent and unre
liable and are used primarily f or correlation with other logs.
Conducti vi t y and t emperature logs provide a direct quantitative
measure of water conductivity and water temperature and provide con
siderable insight into the depth3 thickness3 qualitY3 and temperature
of water s contained i n the wells of Hawaii. Borehole conductivity and
temperature data al so ai d in the interpretation of the complex dynamic
Ghyben- Her zberg lens relat i onshi ps .
The ca l i per module3 which provides a measure of the well diameter3has been subject t o frequent mechanical breakdown3 however3 recent
alterations of t he caliper module's design should allow the device to
perform to its expected capability.
Borehole phot ography emp lo yed r ecently by the Board of Water Sup
ply provides pos i t ive ident i f i cation of most Hawaiian rock types. Cor
r elation between t he photologs and e lect r i c logs is very good .
iii

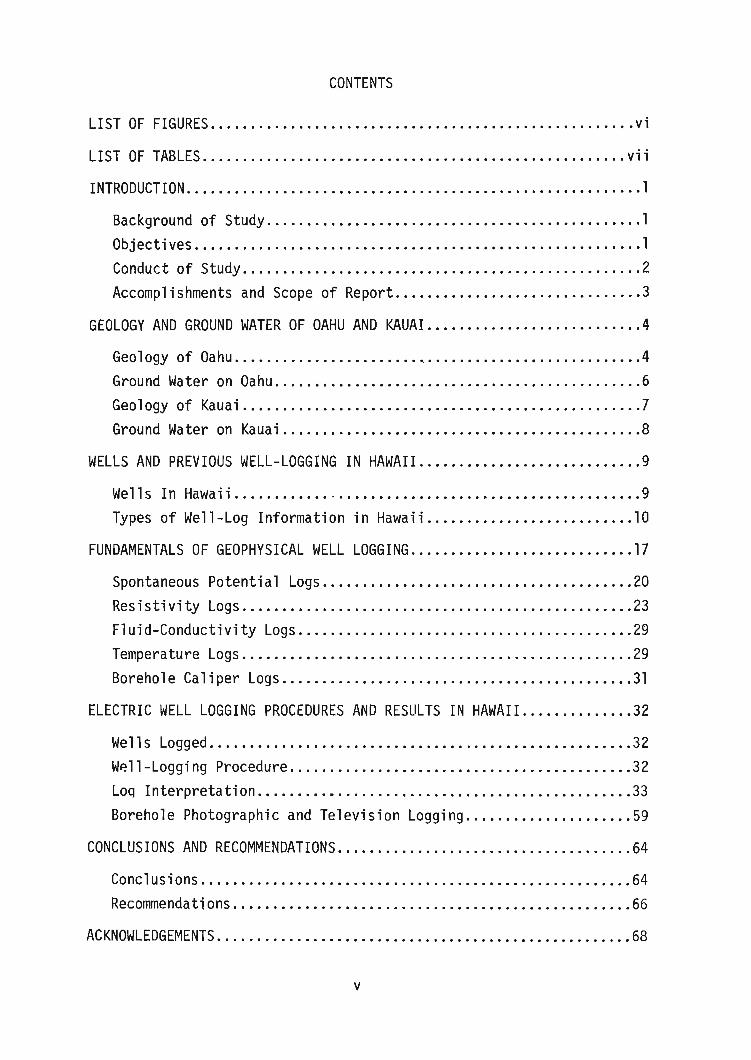
CONTENTS
LIST OF FIGURES ••••••••••••••••••••••••••••••••••••••••••••••••••••• vi
LIST OF TABLES • •••••••••••••••••••••••••••••••••••••••••••••••••••• vi i
INTRODUCTION •••••••••••••••••••••••••••••••••••••••••••••••••••• ••••• 1
Background of Study ••••••••••••••••••••••••••••••••••••••••••••••• 1
Object; ves 1
Conduct of Study ••••••••••••••••••••••••••••••••••.••••••••••••.•• 2
Accomplishments and Scope of Report •••••••••••••••••• •••••••••••• •3
GEOLOGY AND GROUND WATER OF OAHU AND KAUAI ••••••••••••••••••••••••••• 4
Geology of Oahu ••••••••••••••••••••••••.•••••••••••••••••••••••••••4
Ground Water on Oahu .••••••••••••••••••••••••••••••••••••••••••••• 6
Ge0 logy 0 f Kauai • • • • • • • • • • • • • • • • • • • • • • • • • • • • • • • • • • • • • • • • • • . • • • • • • •7
Ground Wa ter on Kaua i ••••••••••••••••••••••••••••••••••••••• •••••• 8
WELLS AND PREVIOUS WELL-LOGGING IN HAWAII. ••••••••••••••••••••••••••• 9
Wells In Hawaii 9
Types of Well-Log Information in Hawaii. .•••••••••••••••••••••••• 10
FUNDAMENTALS OF GEOPHYSICAL WELL LOGGING ••••••••••••••••• ••••••• •••• 17
Spontaneous Potential Logs ••••••••••••••••••••••••••••••••••••••• 20
Resistivity Logs ••••.•••• ••••••••••••••••••••••••••••••••• ••••••• 23
F1 ui d-Conducti vity Logs ••••••••••.•••••••••• •••••••••• ••••.•••••• 29
Temperature Logs •••••••.••••••••••••••••••••••••••••••••••••••••• 29
Borehole Caliper Logs •••••••••••••••••••••••••••••••••••••••••••• 31
ELECTRIC WELL LOGGING PROCEDURES AND RESULTS IN HAWAII •••••••••••••• 32
Well sLogged •••.••••••••••••••••••••••••••••.••• •••••••••••••. ••• 32
Wp.11-Loggi ng Procedure •••••••.•••• ••••••.• ••• ••••• ••••••••••••••• 32
Loq Interpretation ••••••••••••••••••••• ••••• ••••••••••••••••••••• 33
Borehole Photographic and Television Logging ••••••••••• •••••• •••• 59
CONCLUSIONS AND RECOMMENDATIONS ••••••• ••••••••••.••••••••••••••••••• 64
Conclusions •••••••••••••••• •••••••••••••••••• ••••••. •••.••••••••• 64
Recommendati ons••••••••••••••••••••••••.••••••••••••••••••••••••• 66
ACKNOWLEDGEMENTS •••• •••••••••••••••••••••••.••••••••••••••••••• ••••• 68
v

BIBLIOGRAPHY ... ..................•..........•......••...•........... 70
APPENDICES . ..... .. .. ......•......................... ..•............ •75
APPENDIX A. LOCATION MAPS OF WELLS LOGGED ON OAHU AND KAUAI . . . . .77APPENDIX B-1. SUMMARY OF FUNCTIONS LOGGED ...............•.. •.... 91APPENDIX B-2. SUMMARY OF SpIS, APPARENT RESISTIVITIES,
CONDUCTIVITIES, AND TEMPERATURES MEASURED .•...... .95APPENDIX C. LIST OF EQUIPMENT.•.......•.....•........... •. •..... 97APPENDIX D. OPERATIONAL PROCEDURES 99APPENDIX E. TROUBLE-SHOOTING PROCEDURES 103
LIST OF FIGURES
Figure1A1B2
3
4
5
6
7
8
9
10
11
12
131415
16
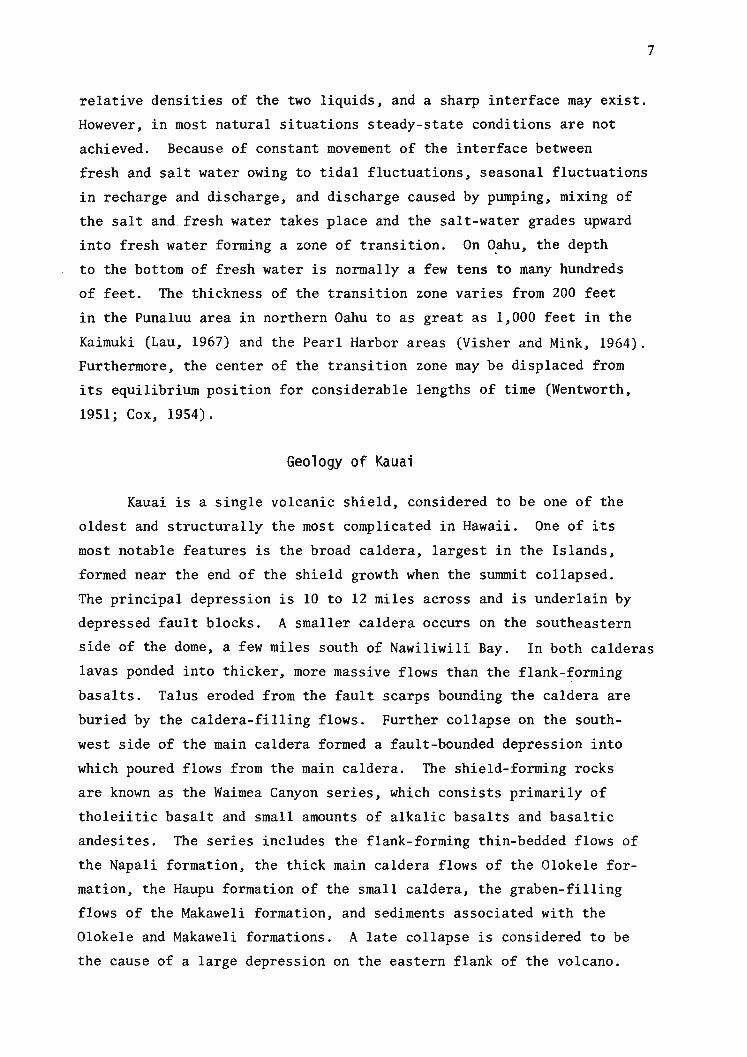
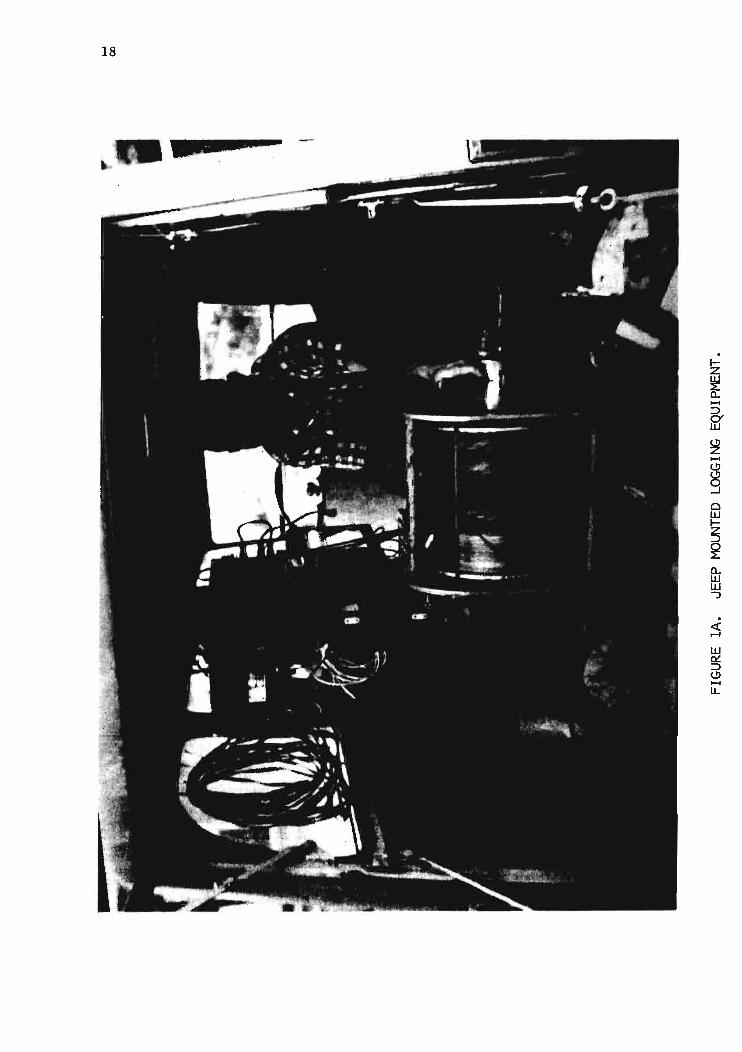
Jeep Mounted Logging Equipment .......................•...•.. 18Loggi ng Sondes 19
Circuit for Recording Spontaneous Potentia1 22Resistivity Sonde Logging Configurations 25Salinity, Temperature, and Chemical Effects on Conductivity.30Correction Curve for Caliper Reference Footage 36Examples of Caliper Logs 37Temperature Logs for Wells T-85 (Beretania), T-143(Puna1uu), and 196-2 (Punanani) ...............•......... •... 39Salinity Versus Conductivity 41Electric Well Logs for Well No. 202-C, Pearl City, Oahu 42Periodic Conductivity Profiles from Well No. T-85,Beretania, Oahu 45Electric Logs and Geologic Log from Well No. T-133-1,Ewa Beach, Oahu ' .' 47
Electric Logs and Geologic Log from Well No. 200-4,Pearl Ci ty, Oahu 48Curve for Adjusting Resistivity to 25°C ............ •........ 54Conversion of Conductivity to Resistivity 56Photographs of Television Images of Obstructions inWells on Mana Plain, Kauai. 61Correlation of Electric Logs, Driller's Logs and PhotoLog of Well 128E, Ka1ihi, Oahu 63
vi

LIST OF TABLES
Table1 Driller's Log Terms and Equivalent Geologic Terms ll2 Resistivities of Rock in Hawaii and Comparative
Resistivities Elsewhere (Values in Ohmmeters) 493 Sample Porosity Calculations 574 Total Porosity in Cores of Koolau Basalts from Oahu 59
vii

INTRODUCTION
Background of Study
In spite of their almost universal application to oil-well develop
ment and analysis and their extensive application elsewhere to water
development and analysis, the application in Hawaii of geophysical well
logging techniques, prior to 1966 has been limited to crude temperature,
water conductivity, and flow logging. Electric logging techniques had
not been tried at all because of the high costs of the equipment and
the uncertainty of the results that might be obtained. Owing to the
peculiarities of Hawaiian geology and hydrology, it was anticipated
that techniques found useful in Hawaii might differ materially from
those useful in continental areas. Although general expectations
could be stated as to parameters of interest from the known character
istics of Hawaiian aquifers, most of the techniques of geophysical well
logging are so highly empirical that only experience could indicate with
certainty which would be of use.
Objectives
The geophysical well logging study had the following basic ob
jectives:
1) Determine what results could be obtained by the use of conven
tional electric well-logging methods under Hawaiian conditions.
2) Determine which of the conventional methods have possible
practical utility in Hawaii.
3) Investigate, if time and funds permit, some of the well
logging methods that are less conventional, but for theo
retical reasons seem to have possible special applicability .
4) Provide resistivity data for correlation with the U. S.
Geological Survey's surface resistivity program at Moluleia,
Oahu.
5) Complete the conversion of the Ewa Beach Test Well for hydro
logic monitoring as well as for obtaining electric well logs
for correlation with its complete cores.
6) Train personnel from agencies concerned with ground-water
2
development and well problems in the field and in analytic
techniques of electric well logging.
Conduct of Study
The investigation, on which this report is based, was begun in
the fall of 1965 with a review of electric well-logging parameters and
equipment of probable utility in Hawaii (Cox, 1965). Plans for the
project itself were formulated in December 1965.
The Board of Water Supply of the City and County of Honolulu
provided a grant to begin work in April 1966, the basic logger,
which included spontaneous potential and resistivity probes, was
purchased.
Late in 1966, a conductivity-temperature probe was received. How
ever, owing to persistent circuit problems this instrument did not per
form satisfactorily until overhauled by the manufacturer a procedure
which took several months.
By the end of 1966, when a progress report was prepared (Lao,
1967), facility with logging techniques were developed, 34 wells and
test holes on Oahu were logged, and useful initial correlations were
established between electric logs and driller's and geologic logs.
In 1967-68, the Honolulu Board of Water Supply provided additional
support to continue the Oahu work and, in addition, purchased a caliper
tool. The support was supplemented by a smaller grant from the Divi
sion of Land and Natural Resources , by means of which some work was
done on Kauai.
In total, 65 wells were logged in the study, including 53 on Oahu
and 12 on Kauai, and since the project was formally ended in June 1968,
the Honolulu Board of Water Supply has logged approximately 25 more new
wells. Several wells were logged more than once to obtain all the log
ging data possible, and 4 deep monitor wells on Oahu have been logged
periodically for salinity and temperature.
When active work on the project was terminated in June 1968,
the logging equipment was transferred to the Honolulu Board of Water
Supply for operation and maintenance. It will remain available for
use by all interested parties, however, and the Water Resources Research

3
Center has retained title to the basic equipment so as to be free to
use it for future research.
Accomplishments and Scope of Report
The emphasis of this report is on methodology in geophysical well
logging and well-log interpretation developed by the project for use in
Hawaii . Illustrative logs are presented with interpretation but no
attempt is made to present interpretations of all of the logs obtained
during the course of the investigation. However, Appendix I shows the
location of all of the wells logged in this study, and Appendix II
includes a list of all the surveys conducted and comments on all the
wells for which there are electric logs. All of the master logs from
this study are on file at the Water Resources Research Center and copies
are on file at the Honolulu Board of Water Supply. Copies of logs of
wells not owned by the Board of Water Supply are being provided to the
owners . All of the logs are available to interested parties upon re
quest.
Several wells were logged in the vicinity of Mokuleia, Oahu to
provide correlation with the U. S. Geological Survey's surface resis
tivity program in this area. The results from these logs are included
in the summary of res istivities from well logging in Table 2 in the
section entitled, "Electric Well Logging Procedures and Results in
Hawaii." In general, good correlation was achieved.
Results of the conversion of the Ewa Beach Test Well to hydrologic
monitoring, including electric logs of that well, have been reported
elsewhere (Co~ and Lao, 1967). The electric logging results are,
however, discussed further in this report .
Training personnel of other governmental agencies to operate the
logger thus far has been limited to the Honolulu Board of Water Supply.
Because of project committments of the other agencies, neither time nor
personnel could be committed to the well logging project for the required
time. Nevertheless, other agencies concerned with the development of
ground water in Hawaii will, it is hoped, avail themselves of training
opportunities in the future.
4
GEOLOGY AND GROUND WATER OF OAHU AND KAUAI
Because the geophysical well-logging program has been restricted,
to date, to the islands of Oahu and Kauai, only the geology and ground
water or these islands will be discussed here. Hydrogeologic condi
tions on the other Hawaiian islands are similar. Furthermore, the
discussion of the geology and occurrence of ground water presented
here is quite brief, and is intended to provide only the general back
ground necessary for the interpretation of geophysical well logs.
If more detailed information on the subjects is desired, the follow
ing references should be consulted: Stearns and Vaksvik (1935, 1938),
Stearns (1939, 1940), Wentworth (1938, 1940, 1941, 1942, 1945, and
1951), Stearns and Macdonal d (1942, 1946, 1947), Macdonald, Davis and
Cox (1960), and Visher and Mink (1964).
Geology of Oahu
The island of Oahu, Hawaii consists essentially of two eroded
shield volcanoes, the Waianae volcano to the west and the Koolau vol
cano to the east. Each volcano is composed primarily of thin basaltic
lava flows, dipping away from axial rift zones. The Schofield
plateau, between the two volcanoes, was formed by the ponding of late
lavas from the Koolau volcano against the eroded lower slopes of the
Waianae volcano. The margins of the volcanic mountains are over
lapped by prisms of coastal plain composed of sediments of terrestrial
and marine origin which were deposited during the long period of
quiescence following the active Waianae and Koolau volcanic periods.
Sea-level changes caused by isostatic adjustment of the earth's
crust in response to the island mass during Pleistocene time greatly
influenced the construction of these coastal plain deposits. A
restricted renewal of volcanism resulted in small areas of the south
eastern portion of the Koolaus being covered by the Honolulu volcanic
series. These rocks, formed during the later period of shifting sea
levels and continued down to recent time, comprise Diamond Head,
Punchbol~l, Koko Head, Tantalus, Kaimuki, etc .
The principal water-bearing rocks of Oahu are the lava flows
of the Koolau and Waianae volanic series. Lavas and pyroclastics
5
of the Honolulu series are so limited in extent that they are rela
tively unimportant as aquifers. The Koolau and Waianae series include
both pahoehoe and aa flows, which are generally less than 20 feet
thick and normally have dips less than 10 degrees. These lavas are
remarkably uniform in composition and all, except the latest Waianae
flows and a 400-foot thick Waianae trachyte flow at intermediate
depth, are classified as tholeiitic basalts. The Honolulu series and
the youngest Waianae lavas are alkalic basalts which form relatively
thin caps over the tholeiitic basalt shields.
The permeability of unweathered Hawaiian lavas is generally
high, but it is also quite variable on a coarse scale owing to the
effects of major flow structures such as clinker zones in aa, lava
tubes and gas cavities in pahoehoe, vertical contraction joints
formed by cooling of the lavas, and irregular openings associated
with the surfaces between flows.
The rift zones of the Koolau and Waianae volcanoes contain
many vertical or steeply dipping dikes which cut through the lava flows.
In the central portions of the rifts, the dikes are closely spaced
and almost completely replace the lava flows. Toward the outer edges
of the rift zones the dikes are more widely spaced and form large
compartments which enclose permeable lavas. Because the dikes are
dense and have low permeabilities, ground water may be impounded
within these compartments.
The principle pyroclastic materials on Oahu consist of cinders,
ash, and tuff. These materials generally have little importance as
aquifers owing to their limited extent and volume although an area in
the Makiki district underlain by permeable cinders is an important
intake area for a small perched supply for Honolulu. However, weath
ered ash and tuff, because of their extremely low permeabilities, act
as perching members over small areas, especially in the Honolulu
volcanic series.
The wedges of coastal plain sediments are composed of both
terrestrial and marine sediments, including boulder conglomerate, mud,
reef rock, calcareous sands, beach rock, and eolianite. Overlying
or interbedded with the sediments in places are pyroclastic rocks and
flows of the Honolulu series. Alluvium and marine sediments comprise
the greatest volume of the wedges, which at the coastal margins of
6
southern Oahu have thicknesses of over 1,000 feet. Although the per
meability of the components of the coastal wedge varies widely, the
overall effect is one of low permeability compared to the basalt. The
coastal sediments contain large quantities of water, varying from
fresh to sea water. Compared to the basalt aquifers, however, the
capacity of the wedges to store and transmit water is small. Conse
quently, the wedges act as a caprock retarding the seaward movement
of fresh ground water from the more permeable underlying basaltic
aquifer.
Ground Water on Oahu
Replenishment of the Oahu aquifer system comes primarily from
precipitation incident on upland watersheds . The Koolau and Waianae
Ranges force the moisture-laden trade winds to rise, cool, and pre
cipitate . The windward flanks of the mountain are substantially
wetter than the leeward flanks and the higher elevations wetter than
low-lying areas. Infiltration capacities of the soils and rock are
very high.
Two modes of occurrence of ground water may be distinguished
on Oahu: high-level ground water and basal ground water. Dikes in
and near the rift zones of the Koolau and Waianae volcanoes impound
large volumes of fresh water. The compartments formed by the dikes
are commonly saturated to levels several hundred feet above sea
level and natural discharge often occurs in the form of high-level
springs . Other high-level water is perched on beds of weathered ash,
tuff, soil, and thick sills or flows. Perched water makes up only
a very small part of all high-level water.
The principal source of fresh ground water on Oahu is the lens
shaped basal water body, commonly called the Ghyben-Herzberg lens,
floating on denser salt water. The basal water body is largely
unconfined in the'interior portions of the island. Where the basa!tic
aquifer is directly overlai~by the sedimentary caprock along the
coastal margins, artesian heads of a few fe~t to over 20 feet above
sea level commonly occur.
When steady-state conditions exist, the location of the bottom
of the fresh-water lens floating on sea water is dependent on the
7
relative densities of the two liquids, and a sharp interface may exist.
However, in most natural situations steady-state conditions are not
achieved. Because of constant movement of the interface between
fresh and salt water owing to tidal fluctuations, seasonal fluctuations
in recharge and discharge, and discharge caused by pumping, mixing of
the salt and fresh water takes place and the salt-water grades upward
into fresh water forming a zone of transition. On ~ahu, the depth
to the bottom of fresh water is normally a few tens to many hundreds
of feet. The thickness of the transition zone varies from 200 feet
in the Punaluu area in northern Oahu to as great as 1,000 feet in the
Kaimuki (Lau, 1967) and the Pearl Harbor areas (Visher and Mink~ 1964).
Furthermore, the center of the transition zone may be displaced from
its equilibrium position for considerable lengths of time (Wentworth,
1951; Cox, 1954).
Geology of Kauai
Kauai is a single volcanic shield, considered to be one of the
oldest and structurally the most complicated in Hawaii. One of its
most notable features is the broad caldera, largest in the Islands,
formed near the end of the shield growth when the summit collapsed.
The principal depression is 10 to 12 miles across and is underlain by
depressed fault blocks. A smaller caldera occurs on the southeastern
side of the dome, a few miles south of Nawiliwili Bay. In both calderas
lavas ponded into thicker, more massive flows than the flank-~orming
basalts. Talus eroded from the fault scarps bounding the caldera are
buried by the caldera-filling flows. Further collapse on the south
west side of the main caldera formed a fault-bounded depression into
which poured flows from the main caldera. The shield-forming rocks
are known as the Waimea Canyon series, which consists primarily of
tholeiitic basalt and small amounts of alkalic basalts and basaltic
andesites. The series includes the flank-forming thin-bedded flows of
the Napali formation, the thick main caldera flows of the Olokele for
mation, the Haupu formation of the small caldera, the graben-filling
flows of the Makaweli formation, and sediments associated with the
Olokele and Makaweli formations. A late collapse is considered to be
the cause of a large depression on the eastern flank of the volcano.

8
Renewed volcanism following a long period of erosion resulted
in the eruption of lava, cinders, and ash over the eastern two-thirds
of Kauai. The resulting rocks are known as the Koloa volcanic series
and include cinder cones, one tuff cone, and lava cones. The lavas
are alkalic basalts contrasting with the predominantly tholeiitic
basalts of the Waimea Canyon zones. The period of volcanism was long
but not continuous over the entire area, allowing areas to become
eroded and re-covered again by new flows. The latest flow appears to
be very recent.
During the erosion period preceding, during, and following the
Koloa series eruptions, coastal plain sediments similar to those on
Oahu accumulated around the most of the margins of Kauai. Much of the
coastal plain has been deeply buried by the Koloa series volcanics.
Inland, the Koloa series flows and pyroclastics are interbedded with
extensive alluvial deposits.
Ground Water on Kaua;
The Napali formation is highly permeable and contains fresh
basal water almost everywhere toward the margins of the island and
dike-compartmented water inland in some areas. The basal water is
impounded in most areas, contained by coastal plain sediments or by
the less permeable rocks of the Makaweli formation and the Koloa
volcanic series. The caldera~filling lavas of the Olokele and Haupu
formations are generally poorly permeable and yield little water.
The Makaweli formation i s poorly to moderately permeable. Locally,
small bodies of fresh water are perched on interbedded conglomerates
and breccias and basal water may be recovered in some areas.
The Koloa lavas are poorly permeable. As on Oahu, some members
such as coral reefs are permeable, but most contain only brackish
water and are of only local importance.
9
WELLS AND PREVIOUS WELL-LOGGING IN HAWAII
Wells in Hawaii
Most wells in Hawaii fall into one of the following categories:
1) Tunnels developing water confined by dikes or perched
ash or soil beds.
2) Maui wells, consisting of shafts to the water table and
skimming tunnels, developing basal ground water especially
where the Herzberg lenses are thin.
3) Simple pits, mostly developing water in sediments.
4) Drilled wells mainly developing basal ground water,
especially artesian water, mostly in basalts (Stearns, 1939;
Cox, 1954).
The techniques of well logging discussed in this report pertain only
to the latter category.
There are about 750 drilled wells on the island of Oahu (Stearns
and Vaksvik, 1938) and about 150 on Kauai (Macdonald, Davis, and Cox,
1960). The number of drilled wells on Hawaii, Maui, Molokai, Lanai,
and Niihau is considerably smaller. Well depths range from a few tens
of feet to over 1,000 feet but most of the wells in use are less than
700 feet deep and were drilled in the period from 1880 to the 1930's.
All wells drilled prior to 1946 were drilled by the cable tool method.
Since then about half have been drilled by the rotary method. Drilling
mud has been used, in general, only in rotary drilling. Mud recovery
has frequently been a problem where it has been used. Artesian wells,
flowing and non-flowing, generally are cased through the sedimentary
caprock and the weathered top sections of the basalt aquifer, and the
fresh section of the basalt aquifer is left uncased. Non-artesian wells
generally are cased to a depth of 10 to 30 feet below the water table.
Drillers logs exist for only a few of the wells drilled prior to 1930
but they are fairly common for wells after that time and are required
for new wells.
In addition to the production wells there are many diamond drill
test holes ranging from a few tens to over 1,000 feet in depth. Most
of those drilled prior to 1950 were E or EX size. AX holes have pre
dominated since, but there are a few NX holes.
10
Many of the wells and test holes are lost, caved, sealed, or
cased in such a way that they cannot now be probed. On many more,
delivery pipes, valves, or pumps are installed in ways that make
probing infeasible except in combination with major overhauls.
New wells and large diameter test holes are being drilled at
a rate of 10 or 15 a year.
Types of Well-Log Information in Hawaii
Well logging, whether driller's logging, geologic logging,
electric logging, or other types of logging, may be considered as
having the objective of supplying the following types of information:
1) GEOLOGIC INFOR~TION3 useful in developing an understanding
of the performance of a well and in planning further well
development near the logged well or in other areas of
similar geology.
2) HYDROLOGIC INFOR~TION3 useful in the same ways as the
geologic information and in evaluating the probable per
formance of an incomplete or untested well.
3) GEO~TRIC INFOR~TION3 useful in designing casings, pumps,
and seals or other remedial treatments.
These types of information were more or less inadequately sup
plied by the earlier logging techniques used in Hawaii.
GEOLOGIC INFOR~TION. Geologic information desired from logging con
sists primarily of identifying rock characteristics which aid in the
construction of geologic well logs, which are intended to identify in
geologic terms the rocks penetrated by a well. Of greatest importance
under Hawaiian conditions is the distinction between sedimentary rocks
and impermeable lavas that most commonly act as aquicludes and the lava
flows that most commonly act as aquifers. For stratigraphic analysis
and for the identification of caprock aquifers, either as potential
sources of water supply or as potential zones to which leakage ' might
occur, identification of the sedimentary rocks as well as the imper
meable lavas is frequently desirable. Discrimination among gravel or
conglomerate, fine-grained alluvium, coral reef and rubble, calcareous
sands, beach rQck, aeolianite, lagoon marls and clays, and the pyro
clastics, cinders, ash, and tuff is particularly useful. For

11
distinguishing between shield-forming and post-erosional lava flows
and, less commonly, for distinguishing late, differentiated, shield
forming flows (usually less permeable) from the primitive tholeiitic
basaltic shield-forming lavas (usually more permeable), and for
determining the stratigraphy and structure of post-erosional flows,
petrographic logging of the lavas may be required. In addition, the
degree of weathering of the lavas is of considerable importance,
both geological and from the standpoint of interpreting the geo
physical well logs.
Generally, driller's logs of churn-drilled (cable-tool) wells
provide a good deal of geologic information, although some translation
of drilling terms is necessary (see Table 1).
TABLE 1. DRILLER'S LOG TERMS AND EQUIVALENT GEOLOGIC TERMS.
DRILLER'S LOG TERMS
MUD-ROCK
CINDERS
AA
PAHOEHOE
CORAL
SOFT ROCK
HARD ROCK
BLUE ROCK
GEOLOGIC TERMS
TUFF, WEATHERED LAVA, WELL CONSOLIDATED ARGILLACEOUS SEDIMENT
AA CLINKER
AA CLINKER OR SCORIACEOUS ORCAVERNOUS PAHOEHOE
DENSE PAHOEHOE OR DENSE AA
CORAL REEF, CORAL RUBBLE, BEACHROCK, OR AEOLIANITE
PARTLY WEATHERED LAVA, CLINKER,OR CAVERNOUS PAHOEHOE
DENSE AA OR PAHOEHOE
FRESHEST DENSEST LAVA
By megascopic and hand-lens study of cable-tool cuttings, in
addition to the driller's log, a geologist may generally prepare a
good log which may be further improved by selective petrographic
analysis.
Good geologic logs rarely can be prepared for rotary-drilled
wells because the origin of the cuttings cannot ordinarily be closely
determined.
Most of the well logs reproduced in the bulletins of the Hawaii
Division of Hydrography (e. g., Stearns and Vaksvik, 1938; Macdonald,
Davis, and Cox, 1960) are cable-tool driller's logs annotated by a
geologist. A ~ew were prepared on the basis of geologic examination

12
of cuttings. Examples of other published geologic logs may be found
in the reports on test wells drilled for the Hawaii Division of
Water and Land Development.
The best geologic logs are those based on core drilling where
direct examination of the cores or cuttings is possible. Core
drilling, mostly diamond drilling, has been used principally for small
diameter test holes. Good examples of diamond drill test hole logs
are those of the 100 holes drilled by East Maui Irrigation Co. in
exploration for perched water and perched artesian water (the complete
logs are available only in manuscript form but Macdonald (1942) shows
graphic logs based on them) and the 84 holes drilled by the Board of
Water Supply in the 1930's and 1940's (the logs appear in the detailed
Board of Water Supply manuscript reports by C. K. Wentworth on the
geology and ground-water resources in individual districts on Honolulu).
HYDROLOGIC INFORMWTION. Hydrologi~ information desired from logging con
sists of measurements or estimates of rock porosity and permeability, head,
flow velocity, water salinity or conductivity, and water temperature.
Rock Poposity. There are very few significant quantitative mea
sures of porosities of either aquifer or aquiclude material in Hawaii.
Undisturbed samples of the poorly consolidated or unconsolidated sedi
ments and of the clinkery or badly fractured lava flows are not
obtainable by any of the conventional methods used in the islands for
either well drilling or test-hole drilling.
Test-hole cores of the more massive parts of coral reefs, aeo
lianites, and beach rocks are available, but their porosities rarely
have been measured because, by themselves, the measurements would be
of little significance. Tens of thousands of feet of lavas have been
core-drilled, but the average core recovery is probably only on the
order of 30 percent. Although a few continuous cores have been limited
in length only by the 10-foot length of the core barrels conventionally
used, the cores recovered generally represent only the less porous and
less permeable parts of the lavas. It must be recognized that, over
lengths on the order of a few tens of feet, the porosity of eVen a single
lava flow may range from a small percentage in massive sections to perhaps
SO percent in clinker beds and to 100 percent in lava tubes. Useful
estimates of average permeability, therefore, are not available.
When diamond drill test hole cores are available from the well

13
site, with experience, a hydrogeologist may be able to estimate the
qualitative specific capacity of a well in lavas from the porosity of
the cores and the amount of core recovery. In general, however, owing
to difficulties similar to those encountered in determining porosity,
significant quantitative permeability measurements are unavailable
from Hawaiian wells and test-hole logs.
Bailing tests conducted during the course of drilling a cable
tool well may provide useful information on yield, but only on yields
inadequate for most practical purposes~ For a few wells, pump tests
repeated after well deepening provide a simple sort of specific capacity
log. It should be noted that the inapplicability of most well-yield
formulae to Hawaiian conditions limits the exactitude with which per
meabilities may be calculated from specific capacities.
Head. Driller's logs commonly provide a record of the depth to
water. However, in spite of the fact that occasional notices of water
level changes during drilling appear in the early well logs, drillers
have customarily overlooked the possibility that the head may vary with
depth and time even in what are still considered essentially isopiestic
areas. Hence, there is usually only a single head measurement given,
and not uncommonly based on some temporary point of reference, such
as the top of the drilling platform. In cable tool wells, a record of
the depth to water at the beginning of each day of drilling may be very
useful if it is based on a permanent datum and if there is a negligible
tidal effect or if the time is recorded so that tidal effects may be
computed. Stearns and Vaksvik (1935, p. 257) give one example of a
water-level log for a well at Moanalua, Oahu.
In rotary-drilled wells where mud is used, water levels are rarely
of any value. The mud is intended to seal the walls of the well. Even
if the seal is only partly effective, it is generally uncertain at what
depth the fluid level in the well is in balance with the head outside
the well, and the density of the mud results in an uncertainty in cal
culating the head from the fluid level. Water-level measurements inte
grate the effects of head throughout the depth of a well, and true head
measurements as a function of depth are possible in a large-diameter
well qnly by the use of packers, a technique that is quite uncommon in
Hawaii. In small-diameter test holes, however, approximations to head
measurements in the lower parts of the holes may be obtained by measuring

14
water levels in the drill rods with the core barrel at the bottom
acting as a packer.
Examples of thorough head logging of test holes may be found in
the East Maui Irrigation Co. logs of the 100 diamond-drill holes at
Nakiku previously referred to in the section entitled "Geologic Infor
mation," and especially for the last of the holes in which the compli
cations of perched artesian water were encountered.
Vertical Flow in Well. Because wells usually have been considered
isopiestic under static conditions, tests of flow in wells rarely are
made under natural conditions. An exception is vertical flow logging
in old artesian wells to detect and locate leakage out of the cased
portions of the wells into coral or other permeable aquifers in the
sedimentary caprocks with heads lower than those in the major bedrock
aquifers. The technique has been described by McCombs (1928) and by
Vaksvik (Stearns and Vaksvik, 1935). The Au propeller-type deep-well
current meter described by Fiedler (see McCombs, 1928) is used. The
4-inch meter is usually mounted in a closed section of a 6-inch pipe
which is run down the well on a cable to produce essentially a velocity
log. The meter in its housing may be calibrated by observations while
it is being raised and lowered at constant known rates . With additional
baffles essentially sealing the current-meter housing to the casing on
the sides of the well it may be used to approximate a flow log. Irreg
ularities in well diameter invalidate flow· measurements, however. Ex
amples of well sealing operations in which velocity logging was used
may be found in the biennial reports of the Honolulu Board of Water
Supply prior to about 1950.
In the Kuhiwa well, drilled by East Maui Irrigation Co. in 1948
to test the yield of a perched artesian ground-water body, thorough
use was made of the Au meter to measure both upward and downward flows.
In other East Maui Irrigation Co. diamond-drill holes in the Nakiku area
of East Maui, which were drilled to explore normal perched and perched
artesian ground-water bodies, many flow logs were made using improvised
propeller-type current meters built into core barrels. To distinguish
between upward and downward flows, ball-check valves were installed in
the current meters. Such valves were used in many of the East Maui
Irrigation Co. Nakiku test holes.
Similar flow logs were made in the drilling exploration program

15
for Lihue Plantation Co. on Kauai using an improvised propeller-type
current meter in a housing lowered by cable. In these holes, high
rates of revolution of the meter were measured by matching the tone
produced in earphones connected in series with a battery and a contact
closed by the propeller to a tone produced by rotating a many-toothed
pinion against a reed which measured the rate of rotation of the pinion.
The rate of rotation was then multiplied by the number of teeth. (Manu
script logs of these holes were prepared by the Experiment Station of
the Hawaiian Sugar Plantation Association).
The location of zones of inflow and outflow in wells and their
respective flow rates generally have been unattainable in Hawaiian wells
except for estimates based only on the divergence or convergences indi
cated by vertical flow measurements.
Water Salinity or Conduct i vi t y . In spite of the critical impor
tance of salinity, prior to 1950 there was only one salinity log run
under static conditions in a Hawaiian well or test hole. There have
been studies of salinity in relation to depth in groups of wells in
various areas, especially in Honolulu, and logs of the salinity of
water discharged from individual wells as they were deepened or plugged
back (Palmer, 1927), as well as extensive records of long-term salinity
monitoring on individual wells. The first log of salinity as a function
of depth in an already drilled test hole was made by R. E. Hughes in
a diamond-drill hole on the fair ground in Kahului, Maui (Stearns and
Macdonald, 1942). This log was made by pumping water at a low rate
from a small-diameter pipe as i t ran into the well.
In the 1950's a number of conductivity logs were run by the
Hawaiian Sugar Planters' Association in wells using a conventional
bridge and a weighted cell lowered on a long neoprene-jacketed cable.
The bridge used a balancing variable capacitance to balance the cable
capacitance. The impedence effects required that the cable and cell
be specially calibrated. The results were at least consistent, although
in an absolute sense the conductivities may not have been quite accurate.
Wa ter Temperature. The well-water temperature data available for
Hawaiian wells are similar to but much sparser than the well-water salin
ity and conductivity data. A few temperature logs were run by using
ordinary mercury thermometers, which were jacketed to slow their response,
and left at v&rious depths for extended lengths of time and raised

16
quickly to the surface for reading. The bulk of the temperature data
is for water discharging from wells .
GEOMETRIC INFOR~TION. Geometric information desired from logging
consists primarily of measurement of well diameter, and incidentally
of measurement of depth to the water, depth of the casing, and depth
of the hole.
Very little information is available on the dimensions of most
Hawaiian wells except nominal casing diameters, nominal well diameters
(diameter of bit), and corresponding depths. The depths reported in
driller's logs have sometimes referred to temporary datums such as drill
rig platforms whose elevation from the ground level were not recorded.
Well depths may easily be checked by sounding. Many wells have
been found to be materially shallower than recorded, presumably as a
result of backfill by cuttings and other material settling from the
walls of the wells.
Steel casing depths have been checked, especially in wells to
be sealed, by raising a heavy permanent magnet on a cable and noting
the depth at which drag against the casing begins (McCombs, 1928,
Stearns and Vaksvik, 1935).
Casing diameters have in a few cases been checked by running
templates or swages on drilling tools.

17
FUNDAMENTALS OF GEOPHYSICAL WELL LOGGING
Geophysical well logging is the recording of various geophysical
parameters associated with earth formations penetrated by a borehole.
These properties are measured in situ by means of appropriate down-hole
sondes or probes and are continuously recorded at the surface. Probably
the most widely used geophysical logging technique in water wells is
electric logging.
Electric resistivity well logging was first introduced by Conrad
and Marcel Schlumberger in the Pechelbronn oil field in France in 1927.
In 1928 the Schlumberger brothers discovered the existence of naturally
generated potentials in wells (Pirson, 1963). In the years immediately
following, the resistivity logging method was used in oil wells in
Venezeula, Russia, Romania, and Oklahoma. In 1932, it was introduced
in California and in 1933 in the Gulf Coast (Lynch, 1962). In the past
40 years, since the Schulumberger brothers first introduced the method,
electric well logging has been developed primarily to meet the needs
of the petroleum industry. It has been only in the past 20 years that
electric logging techniques have been used in water wells.
Some types of electric logs presently in use are: single point
resistivity, short and long normal resistivity, lateral resistivity,
lateralog, spontaneous potential, conductivity, micro-resistivity, and
induction logs .
Some other types of geophysical logs, which utilize much of the
same equipment, and are made in conjunction with electric well logs,
include temperature, fluid flow, magnetic, seismic, acoustic, gamma,
and neutron logs. Still other types of logs, using the same equipment,
are frequently included, although they are not really geophysical in
nature, for example, caliper logs.
The logging program conducted by the Water Resources Research
Center has included spontaneous potential, point resistivity, short
and long normal resistivity, lateral resistivity, fluid conductivity,
temperature, and caliper logging.
The logger used by WRRC and some of the auxiliary equipment are
shown in Figure lA and lB.
This report is not intended to be a comprehensive study of the
theoretical aspects of electrical well logging. However, short dis-
18
oUJ
~0UJUJJ
.«.-f
UJoc::::>t!>.....u,
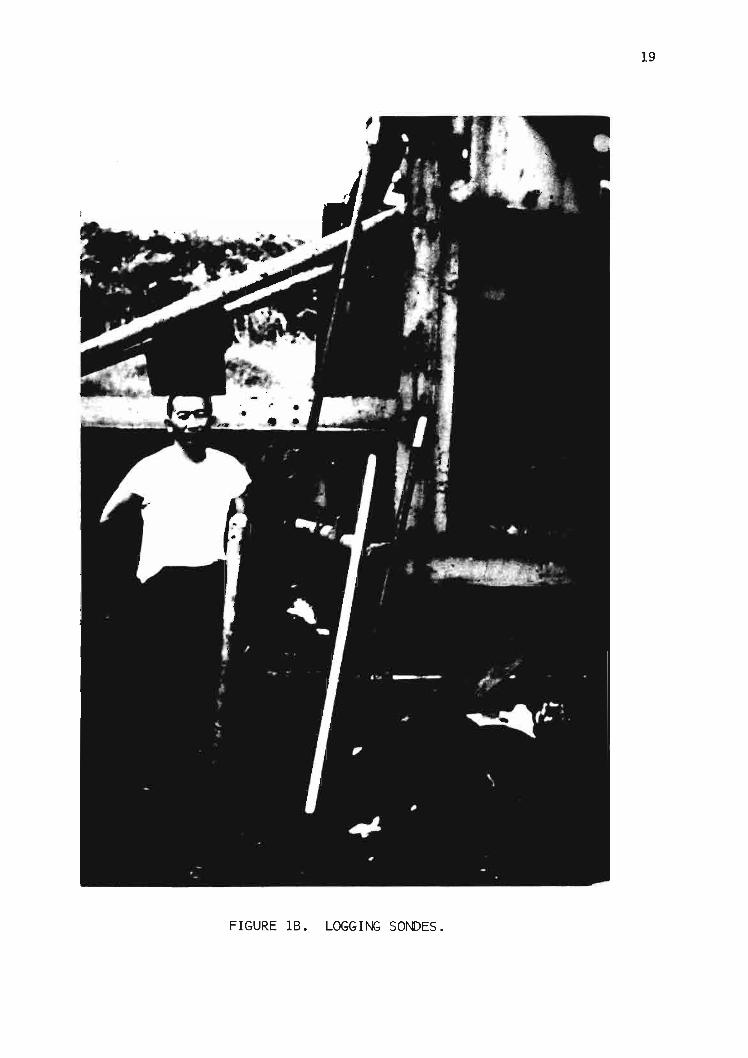
FIGURE lB. LOGGING SONDES.
19
20
cuss ions of the general theory of spontaneous potential logging and
resistivity logging are included in the following sections to facil
iate electric well-log interpretation. The theory presented in these
sections generally follows that given by Guyod (1952, 1954, 1957, and
1965), Lynch (1962), Pirson (1957, 1963), and Patten and Bennett (1963).
In addition, numerous charts and tables from publications of the
Schlumberger Corporation and Mandrel Industries (Anonymous,undated,
1958, 1961, 1962, 1963) have been consulted throughout this study.
Spontaneous Potential Logs
Spontaneous electrical potential logs, also known as self
potential, or simply SP logs, indicate natural electrical potentials
found within the earth. The potential can be caused by an electro
chemical behavior, similar to that in a battery, which results at
the junction between the fluid-filled borehole and the boundary be
tween formations of dissimilar composition, usually such as sand
stones and shales, or between permeable beds and impermeable beds,
or by the electrokinetic effect of fluids moving through permeable
formations.
An electrochemical potential is created ~hen solutions with
different concentrations of the same salts are placed in contact and
ions diffuse toward the solution of lower activity. In general,
positive and negative ions will not diffuse at the same rate across a
given boundary and a potential is established. If the circuit is com
pleted, a current will be produced.
In water wells, potentials are produced at contacts of chemically
different borehole and formation fluids across direct liquid junctions
opposite sandstones and other permeable zones and across charged mem
branes opposite shale. Usually several ionic species, which do not have
the same valence, are present.
Electrical potential also may be produced at the phase boundary
when a solid and a flowing liquid are in contact. Although little
quantitative information is available, on the basis of theory, flowing,
or so-called streaming potentials should be proportional to the pres
sure differential causing flow and the resistivity of the electrolyte
and inversely proportional to the viscosity of the electrolyte (Lynch,

21
1962).
The spontaneous potential in a well is determined by measuring
the potential difference between a single electrode lowered into the
uncased well and a reference electrode immersed in a small hole at the
surface, filled with drilling mud or water, to insure good electrical
contact. The potential at the reference electrode remains relatively
constant. The measured potential difference results from natural
spontaneous potentials produced in the earth, and are measured by the
electrode lowered into the well. Figure 2 shows a diagram of the
electrical circuit. Potential values generally range from zero to
several hundred millivolts.
By convention, electrical well-logging apparatus is constructed
so that deflections on logs to the left of zero represent negative
potentials and deflections to the right of zero represent positive
potentials. When spontaneous potentials result from electrochemical
effects, impermeable formations usually produce zero or very low SP's
and permeable formations produce high SP's which may be either posi
tive or negative in sign. Generally, if the formation water is more
saline than the borehole fluid, negative potentials are produced and
if the formation water is less saline than the borehole fluid, positive
potentials are produced. When spontaneous potentials result from
electrokinetic effects, usually pos itive SP's are produced in forma
tions where the direction of flow is from the formation into the bore
hole and negative SP's are produced in formations where the direction
of flow is from the borehole into the formation.
In sedimentary formations, where electrochemical effects pre
dominate, the spontaneous electrical potential is an extremely useful
tool to identify permeable beds, to locate the tops and bottoms of
beds, and to estimate water quality. Permeable beds usually are indi
cated by either positive or negative deflections and formation bound
aries are marked by points of inflection. Quality of water in the
formations can be estimated from the potential logs by means of various
approximate equations, departure curves or nomograms. In particular,
the equation,
SP = K log (1)

22
SLIP RING WINCHRECORDING POTENTIOMETER
SHEAVE IMMERSED GROUNELECTRODE
~l/
FLUID LEVEL 'V-
FIGURE 2. CIRCUIT FOR RECORDING SPONTANEOUS POTENTIAL.
23
which was developed for use in oil wells, where SP is the measured
spontaneous potential, K is a factor depending mainly on temperature
(at 25°C, K = 70.7), Rmf is the resistivity of the mud filtrate, and
~ is the resistivity of the formation water, often is used to estimate
quality of formation water.
The use of equation (1) for quantitative spontaneous potential
interpretation involves several assumptions which generally are not
applicable in water wells, especially in water wells that do not
contain drilling mud (Patten and Bennett, 1963). The equation is only
valid if there is an extremely large difference in salinity between
formation water and drilling mud. Consequently, water quality estimates
obtained with this equation are open to considerable doubt.
Because Hawaiian aquifers consist almost entirely of basalt lavas
of remarkably uniform composition, the spontaneous potential may be
produced primarily be electrokinetic rather than electrochemical ef
fects, per se. Consequently, in Hawaiian volcanic rocks spontaneous
potential logs probably indicate, for the most part, zones of flow in
a well and are used primarily as a supplement to resistivity logs.
Spontaneous potentials in sedimentary caprocks in Hawaii, which are
probably produced primarily by electrochemical effects, can be treated
much like SP logs from other sedimentary formations.
Resistivity Logs
Resistivity logs measure the effect of an applied electric cur
rent which is produced at the surface and transmitted to the formation
through electrodes lowered into an uncased well.
The basic law describing movement of electric current through
any conductor is Ohm's law, which states that the rate of flow of
electric current is proportional to the electrical potential difference
causing flow. The constant of proportionality is the resistance. Ex
pressed in equation form,
v = IR , (2)
where V is the electrical potential difference in volts, I is the elec
tic current in amperes, and R is the resistance in ohms.
The resistance depends not only on the material which is conducting

24
the current, but also on its physical dimensions. The resistance of a
conductor is doubled by doubling its length or by halving its cross
sectional area normal to the current flow. By incorporating the length
and area terms with the resistance, it is possible to obtain a parameter
which is a function only of the material of which the conductor is com
posed . This parameter, called the resistivity, e, is defined as
e = R(A/L) (3)
where A is the cross-sectional area of · the conductor and L is its length.
In electric logging practice, the units of ohm-meters 2/meter or simply
ohmmeters are most commonly used for resistivity. Resistivity in these
units, then, may be defined as the resistance between opposite faces
of a cubical element of material, the edges of which are 1 meter in
length. It is often convenient to refer to the reciprocal of the re
sistivity, which is the conductivity, or the reciprocal of the resist
ance which is the conductance.
Resistivities of natural earth formations vary widely, depending
upon the material, its density, porosity, pore size and shape, water
content and quality, and temperature . Dense crystalline rocks such as
granite or limestone may have resistivities of 105 to 101 2 ohmmeters,
whereas clays and shales may have resistivities as low as 1.0 ohmmeter.
In porous formations, the resistivity is controlled primarily by pore
geometry and content and quality of water in the rock formations, rather
than by the resistivity of the rock itself. Consequently, in saturated
formations, the resistivity becomes a function of water quality, poro
sity, and temperature. For example, saturated dense non-porous non
conductive rocks , such as limestone or dense lava flows, normally have
high resistivities, porous materials saturated with fresh water have
intermediate resistivities, and porous materials saturated with saline
water have low resistivities.
Resistivity logging in a well, like SP logging, involves lowering
resistivity sondes into the uncased well and immersing a reference
electrode into a wetted hole at the surface. A combination of several
electrode arrangements and current settings is used to achieve varying
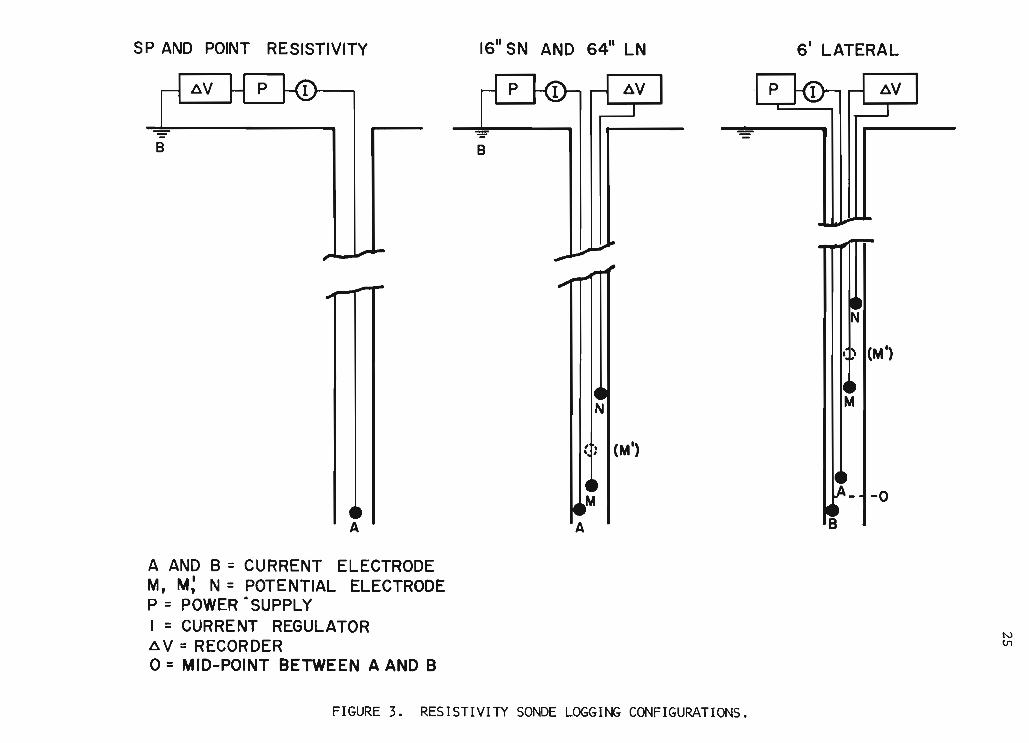
radii of effective formation penetration. Figure 3 shows the configu
rations used in Hawaii. A constant logging current is maintained between
SP AND POINT RESISTIVITY
-B
A
A AND B = CURRENT ELECTRODEM, M: N = POTENTIAL ELECTRODEP = POWER A SUPPLYI = CURRENT REGULATOR
t::.. V =RECOR DERo = MID-POINT BETWEEN A AND B
16" SN AND 64" LN
B
(MI)
A
61
LATERAL
N
II' I(M~
M
-"'-0
8
NtJ1
FIGURE 3. RESISTIVITY SONDE LOGGING CONFIGURATIONS.

26
electrodes A and B, and a recording galvanometer measures the potential
between N and A for single-point resistivity, Nand M for l6-inch short
normal resistivity, Nand M' for 64-inch long-normal resistivity, and
Nand Mfor 6-foot lateral resistivity. The radius of the A electrode,
r a, is considered to be a point, AM is 16 inches, AM' is 64 inches, and
MO is 6 feet. The distances between the pickup electrode, N, and A, M,
and M~ respectively, are large relative to the above-given distances,
and electrically they have the effect of being infinite. The utility
and capabilities of the different resistivity configurations used in
Hawaii are explained in the following sections.
The resistance, R, of a spherical shell in an infinite, homoge
neous, and isotropic electrical medium to a 3-dimensional radial current
is given by the expression,
(4)
where r 1 and r 2 are the radii of the inner and outer bounding surfaces
of the shell, ~r is the radial thickness of the shell, r is the mean
radius of the shell from the center of the current pattern, and e is
the previously defined resistivity of the medium. Equation (4) is a
special case of the more general formula for resistance given by equa
tion (3) . From Ohm's law, the potential difference developed between
the bounding surfaces of such spherical shells is given by
(5)
From equation (5), the potential difference between a point at a dis
tance, r, from the current source and a point an infinite distance
away is given by
(6)
If homogeneous and isotropic conditions are assumed, if the ef
fects of the borehole are ignored, and if the distances AN, MN, and
M'N are assumed to have the effect electrically of being infinite, the

27
following equation can be used to approximate resistivity measured by
the various configurations,
Ve =y 47fr (7)
When r = r a, e is the resistivity measured by the point resistivity
sonde, when r = AM, e is the resistivity measured by the l6-inch SN
sonde, when r = AM', e is the resistivity measured by the 64-inch LN
sonde, and when r = MO, e is the resistivity measured the 6-foot lateral
sonde.
As discussed earlier, as r increases and the cross-sectional
area perpendicular to flow expands rapidly, the resistance decreases
rapidly for a given logging current. Calculations using equation (5)
show that nine-tenths of the voltage drop recorded between r and infinity
occurs between r and lOr owing to the concentration of resistance pri
marily in a zone near the source of current (Patten and Bennett, 1963).
In practice, the zones of investigation probably are restricted even
further so that the point resistivity measures effectively the resis
tivity of a spherical zone of the borehole and earth material extending
to a radius of 2 r A, the short normal measures effectively the resisti
vity of a spherical shell with a radius extending from AM to 2AM, the
long normal measures effectively the resistivity between AM' and 2AM',
and the lateral between Mand o.All the concepts and equations developed in the previous sections
assume that the medium surrounding the sondes is perfectly homogeneous.
In practice, the resistivities measured by borehole devices are only
apparent resistivities and often are not true formation resistivities
owing to the heterogeneity within the earth formations investigated.
When electrical heterogeneity prevails, the resistivity measured is a
composite value of all the resistivities of the component parts. Heter
ogeneity created by the borehole especially affects the point resisti
vity and short normal devices. The resistivity readings of the point
resistivity, and the short normal device to a lesser extent, are great
ly affected by the borehole, while the resistivity readings of the long
normal and lateral devices are relatively unaffected by the borehole
and are closer ~o the true formation resistivity.

28
Resistivity logs are used primarily as aids in correlating the
lithology of the formations penetrated and in estimating the character
of the pore fluid. Detailed formation resistivity and formation bound
aries are located most readily with the point resistivity and short
normal devices, whereas true formation resistivities uninfluenced by
borehole fluids can be obtained best with the long"normal device. The
lateral device is also useful for measuring true resistivity.
Formation porosity sometimes is estimated by using the equation,
(8)
where ¢ is porosity, F is the formation factor, Rw is the resistivity
of the water in the formation, Ro is the bulk resistivity of the satu
rated formation, and M is an exponent which depends on the mineralogy
and pore characteristics of the rock. However, as discussed in a later
section on the interpretation of the resistivity logs, equation (8)
does not appear applicable to the determination of porosities in
Hawaiian basalts.
Equation (8) can be used in some regions such as Louisiana (Tur
can, 1966; Whitman, 1965) and Florida (Jones, 1951) to estimate water
quality if a reasonable value for porosity is assumed. True formation
resistivity can be determined from resistivity curves. Often a wide
electrode spacing combined with a thick homogeneous aquifer will give,
by direct inspection, resistivities which are close to the true resis
tivity. For most work, however, elaborate corrections must be made for
factors like borehole diameter, electrode spacing and arrangement,
aquifer thickness, temperature, and mud resistivity and depth of invasion
of mud filtrate if drilling mud is present when the hole is logged
(Guyod, 1954). The logging program in Hawaii makes use of a continuous
water-conductivity sonde which yields accurate detailed data so far as
the water in the well is concerned. Hence, water-quality estimates are
not attempted from resistivity logs.
By convention, the resistivity logs are recorded on the right side
of the chart and spontaneous potential on the left.
Fluid-Conductivity Logs
Conductivity logs of a water-filled borehole indicate the elec
trical conductive properties of the water, which, in turn, can be
used to estimate the chemical quality of the water.
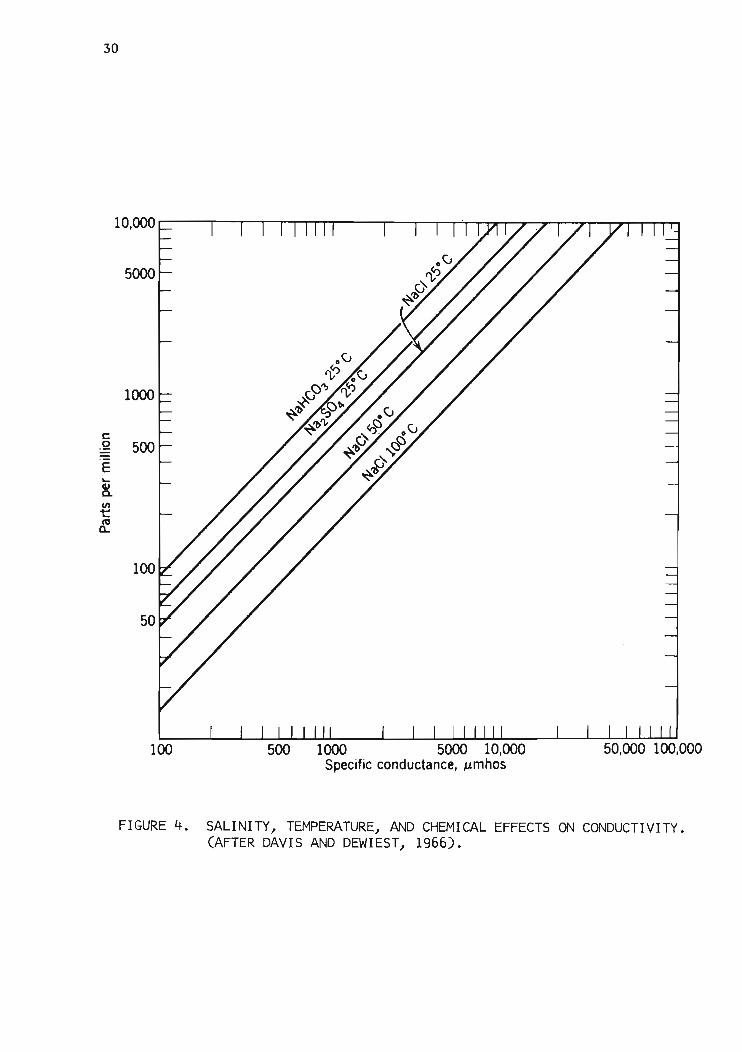
Specific electrical conductance or electrical conductivity is
the reciprocal of resistivity and is measured in mhos. When working
with fresh water, the mho usually is too large a unit to be convenient
so micromhos, or millionths of mhos, generally are used. The specific
conductance of water is directly dependent on the concentration and
the types of ions present and on the temperature (see Fig. 4). The
specific conductance readings made with the equipment used in Hawaii
are instrumentally adjusted to 25°C, so that variations in conductance
are a function only of the concentration and type of dissolved consti
tuents present.
Water conductivity is measured by lowering a conductivity sonde
into the well, which may be either cased or uncased, and the water may
be flowing or static. If the well is not flowing, and the water has
not been recently disturbed, the measured values may represent for
mation water changes with depth.
Temperature Logs
Temperature logs of a well directly measure the temperature of
the water in the borehole. In Hawaii borehole temperature is measured
with the same sonde used to measure fluid conductivity. The conduc
tivity log is prepared first as the sonde is inserted into the well,
and the temperature log is prepared as the sonde is being withdrawn
from the well. A thermal lag, which depends on the withdrawal rate
of the sonde, occurs owing to time required for the sonde to reach
equilibrium.
Temperature logs u ually are used to determine the water tem
perature variation with depth and to locate zones contributing water
of different temperatures, however, other uses sometimes are made of
temperature logs, such as locating freshly cemented zones.
29
30
5000
1000
c:.Q 500E...8.
100 500 1000 5000 10,000Specific conductance, J-Lmhos
FIGURE 4. SALINITY, TEMPERATURE, AND CHEMICAL EFFECTS ON CONDUCTIVITY .(AFTER DAVIS AND DEWIEST, 1966).

Borehole Caliper Logs
31
Caliper logs of a well measure directly the diameter of the
borehole and are used for determining borehole correction factors for
electric logging. The logs are also used for locating zones suitable
for packers. In Hawaii, the caliper device has been used for locating
casing breaks. Correlation has been made with the resistivity logs
where zones of caving are indicative of loose permeable clinker zones.
32
ELECTRIC WELL LOGGING PROCEDURES AND RESULTS IN HAWAII
Wells Logged
Most of the wells which were electric logged in the Hawaiian
project had been drilled many years or even decades prior to the
logging. Most were wells from which pumping equipment had been
removed temporarily or permanently. Some were flowing agricultural
artesian wells or wells in batteries connected to a common pump
suction header, which required only the removal of fittings for access.
A very few wells were logged immediately after drilling. Besides the
wells, a number of test holes and observation wells were logged.
These generally had been pump-tested and the drilling mud, if any
had been used, had been removed before the logging.
In all of the water wells logged, the productive aquifer was the
basalt lavas. Other than a few wells producing salt water for air
conditioning or industrial cooling there is, in fact, only one
drilled well at Punaluu, Oahu known to be producing brackish water
from sediments. Many of the producing wells were drilled through
sedimentary sections prior to entering the basalts, but in all of
these, the sedimentary sections were cased off.
Most of the wells logged on Oahu were basal water wells.
Dike-zone wells were logged at Makaha and at several places between
the Pali Highway and Waihee on Oahu. On Kauai, wells drilled in
dike zones included the well near Polihale and those on the north
side of the island.
Well-Logging Procedure
The procedures used in the geophysical well logging on Oahu
and Kauai were essentially standard procedures.
The well logger was mounted in a jeep which also carried a
generator or an alternator as a power source, the selsyn sheave that
measures and transmits to the logger the length of cable paid out,
down-hole logging tools, and other miscellaneous parts and tools.
Preparatory to logging a well the jeep was maneuvered conveniently
close to the well. The selsyn sheave was suspended centrally above
33
the well, ordinarily by mounting it on a light-weight aluminum
tripod. Where there was a well drilling rig over the well, the
sheave was suspended from the travelling block of the rig or from
a pipe lashed to the tower. On some wells the sheave was lashed
to standpipes and over one well the sheave was suspended from
a convenient tree limb.
A conductivity survey on non-flowing wells was always the
first to be logged and it was made with the sonde going down the
well to disturb the water standing in the well as little as pos
sible. The sequence of logging all the other functions is of no
importance, however, the temperature log was always run next after
the conductivity log as this function is also provided by the
conductivity sonde. On f lowing wells, the logging sequence, includ
ing conductivity logging, is of little importance, however, the
conductivity log as a matter of standard operating procedure was
always run first.
More detailed information on logging procedures is available
in the Operational Procedures and Trouble-Shooting Procedures sections
in the appendix of this report, and in the manufacturer's instruction
manual for the logger which was kept with the logging equipment
at all times (Appendices 0 and E) .
Log Interpretation
The interpretation of electric logs from the few wells in
Hawaiian sedimentary rocks is not substantially different from the
interpretation of logs from continental sedimentary aquifers.
However, the interpretation of certain of the electric logs from
wells in the volcanic rocks, which constitute by far the most important
aquifers in Hawaii, differs significantly from the interpretation of
such logs from sedimentary aquifers. In particular, the extremely
uniform chemical composition of Hawaiian basalts complicates the
interpretation of SP logs and the high resistivity and the extremely
heterogeneous nature of the basalts complicates interpretation of the
resistivity logs. The closest resemblance to the basaltic rock as
far as logging conditions are concerned would be stratified limestones

34
which have an entirely different physical structure but are fairly
similar in chemistry and mineralogy. Limestone formations are usually
logged with induction and neutron devices which were not available
for this study.
In general, the interpretation of the other geophysical parameters
logged in Hawaii', fluid conductivity, fluid temperature, and bore-
hole diameter, follow conventional water-well techniques.
In addition to the unique hydrogeologic conditions in Hawaii,
differences in the use of drilling mud in well construction in Hawaii
necessitate differences in well-log interpretation. Cable-tool
drilling, a method which uses little or no drilling mud, is still
actively used for well drilling in Hawaii, even to depths as great
as 1000 feet. Rotary drilling where air is used to lift cuttings
is also practiced in Hawaii where the artesian head is sufficient.
Furthermore, except for the few wells which were constructed during
the duration of this study and then logged immediately after construc
tion, the well logging in this study was done months or more commonly
years after the wells were drilled so that even if mud was used in
drilling most of it was pumped out of the borehole and formation
prior to logging. In contrast, many mainland wells are drilled
by rotary methods which require the use of drilling mud and are
logged soon after drilling is completed while the drilling mud is still
present in the borehole and the formation. Consequently, great
emphasis has been placed on mud cake, mud filtrate, the extent of the
mud-invaded zone, and other parameters usually not pertinent for logs
in Hawaii.
For the few mud-filled wells that have been logged, the depth
of mud invasion in basalts has not been studied. Penetration is likely
to be deep in zones where the flow channels are large and continuous,
shallow where the pore spaces are small, and nil in dense layers. The
extent of invasion also is dependent upon the degree of hydrodynamic
unbalance between the mud column and the formation water. High
specific-gravity muds and high mud-pump pressures used for bringing
up the cuttings will maximize penetration of mud into the formations.
The presence of mud affects the apparent resistivity to a degree,
d~pending on the contrast of the resistivity between the mud and the
35
formation.
CALIPER LOGS. Caliper log interpretation is straightforward in that
the log provides a direct measure of the variation of borehole diameter
with depth. Unfortunately, for the instrument used in Hawaii, diameter
readout is non-linear despite the circuit adjustments that supposedly
can be made to accomplish this result. An accuracy of approximately
an inch can be achieved with confidence. The greatest accuracy can be
achieved by calibrating the caliper logger in a casing of known dia
meter, such as is always available in new wells. Because the reference
length of the caliper sonde changes as the extension of sonde arms
changes in response to hole diameter variations, the reference lengths
of this sonde must be calibrated in relation to hole diameter (Fig.
5). For general work, 4.5 feet, 5.0 feet, and 5.5 feet may be used
as the reference lengths for the 12-inch, 24-inch, and 36-inch arms,
respectively. If accuracy of depth is required, a further correction
should be made (from Correction Chart Number 1, "Caliper Log Opera
tional Manual"). Typical caliper surveys of wells in Hawaii are shown
in Figures 6a to 6c .
In the Hawaiian project, caliper logs have been used effectively
to locate trouble spots in casings such as was done in well 88-B, to
guide in the select jon of suitable sections of the borehole with uniform
diameters for packer positions as proposed for the Punaluu and Puuanani(
Board of Water Supply research wells, to calculate the volume of mate-
rial needed to backfill a well as in 88-B, and to locate caved zones
which probably are permeable, high-water producing formations as in
7a. In addition, the logs can be used to provide corrections to cal
culate formation resistivity from apparent resistivity.
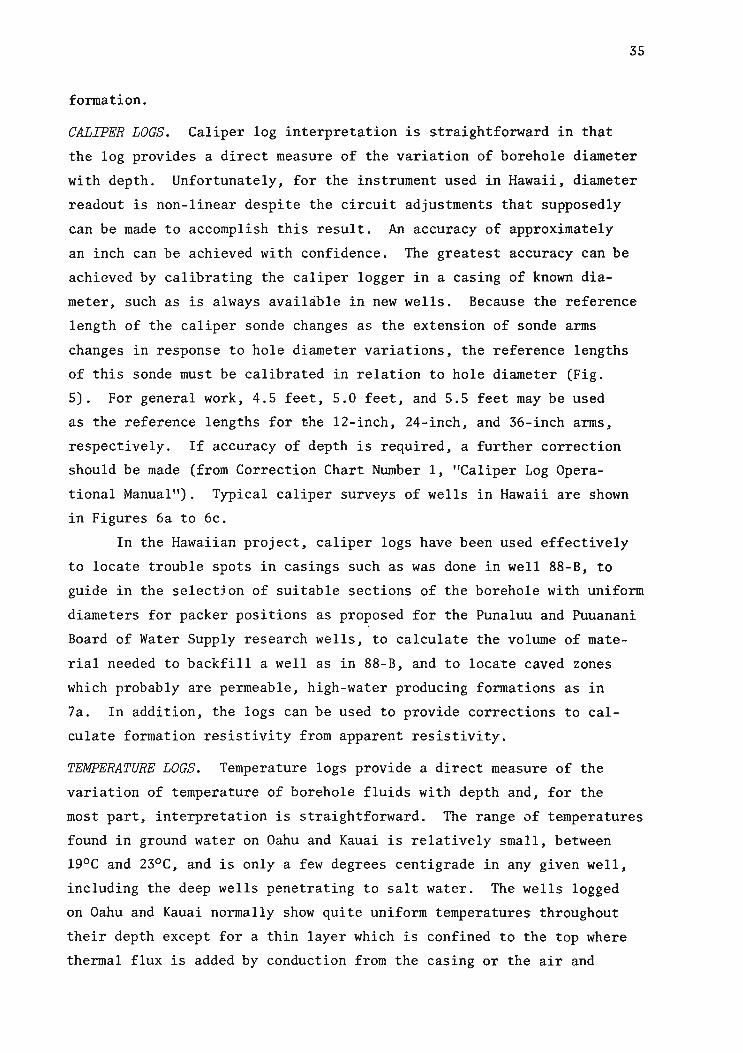
TEMPERATURE LOGS. Temperature logs provide a direct measure of the
variation of temperature of borehole fluids with depth and, for the
most part, interpretation is straightforward. The range of temperatures
found i n ground water on Oahu and Kauai is relatively small, between
19°C and 23°C, and is only a few degrees centigrade in any given well,
including the deep wells penetrating to salt water. The wells logged
on Oahu and Kauai normally show quite uniform temperatures throughout
their depth except for a thin layer which is confined to the top where
thermal flux is added by conduction from the casing or the air and

36
en 30"~a::<ta::w0-...J<tU
>-CD
24 11 ARMS 36" ARMS20"0w~<tU0Z
a::w~w~<t lO"0
oI' 21 4' 5' 6' 7 1
REFERENCE FOOTAGE FOR CALIPER SONDE
FIGURE 5. CORRECTION CURVE FOR CALIPER REFERENCE FOOTAGE.

180 I I 1« I I
o 4 8 12 ~
CALIPER READING (INCHES)
260
4-40' , =s I ,
o 4 8 12 16CALIPER READING (INCHES)
420
280
300
320
-f-WW 340IL-If-a 360, J I-PAcKERSW0
CAVITIES 380
400200
2400 6 12 18 24 30
CALIPER READING (INCHES)
60
120
180
80
100
220
fWW 140IL
If-a 160Wo
r - CASING BREAK
0
20
40
60
f-wW 80IL-If-a.. 100W0
120
140
160
A. CALIPER LOG SHOWING CASINGBREAK IN BERETANIA WELL88-B.
B. CALIPER LOG SHOWINGCAVITIES IN KAIMUKIWELL 7A.
C. CALI PER LOG SHOWINGPACKER LOCATION INPUNANANI WELL 196-2.
FIGURE 6. EXAMPLES OF CALIPER LOGS. VI-.J

38
where return irrigation water is warmer than basal water. The wells
of over 1000-foot depth on Oahu exhibit thermal characteristics
suggestive of geothermal heat.
A typical temperature log with calibration marks made during
logging is presented in Figure 7. Note that no attempt has been made
to provide a calibration such as one inch of chart equals one degree
centigrade. Calibration of this sort can be made, but it is almost
as convenient to read the numbers.
In addition to providing a direct measure of water temperature
for general water quality purposes, temperature logs from Hawaiian
wells have been used to determine thermal gradients and to help
locate, together with resistivity and conductivity logs, water
contributing zones. Borehole temperatures are normally used for
correction of apparent formation resistivity and formation conductivity
but the range is so slight in Hawaii that it can be neglected. In
addition, information from temperature logs has been used to aid in
thE interpretation of regional ground-water flow patterns and
velocities and to aid in the interpretation of the complex, dynamic,
Herzberg lens relationships.
FLUID CONDUCTIVITY LOGS. Fluid conductivity logs provided by the
logging module used in Hawaii, which has automatic temperature
compensation, indicate the conductivity of the fluid in the well
corrected to a standard reference temperature of 25°C. The range
of fluid conductivity logged in wells on Oahu and Kauai is very
wide. Values have varied from a few hundred micromhos near the
top of some wells to more than 40,000 micromhos at the bottom of
several deep test holes which cJmpletely pass through the fresh
water lens and into salt water.
In wells from which there has been no discharge during or for
some time prior to logging, it may be assumed that the conductivity
of the water in the well i s the same as the conductivity of the
water in the formation outside the well at the same depth. In
discharging wells, the conductivity of the water at any depth is a
composite dependent on the conductivities of water entering the
well and the relative rates of infl0w below that depth.
As indicated in a previous section, specific conductance is
a function of the type and concentration of ions in the watel and
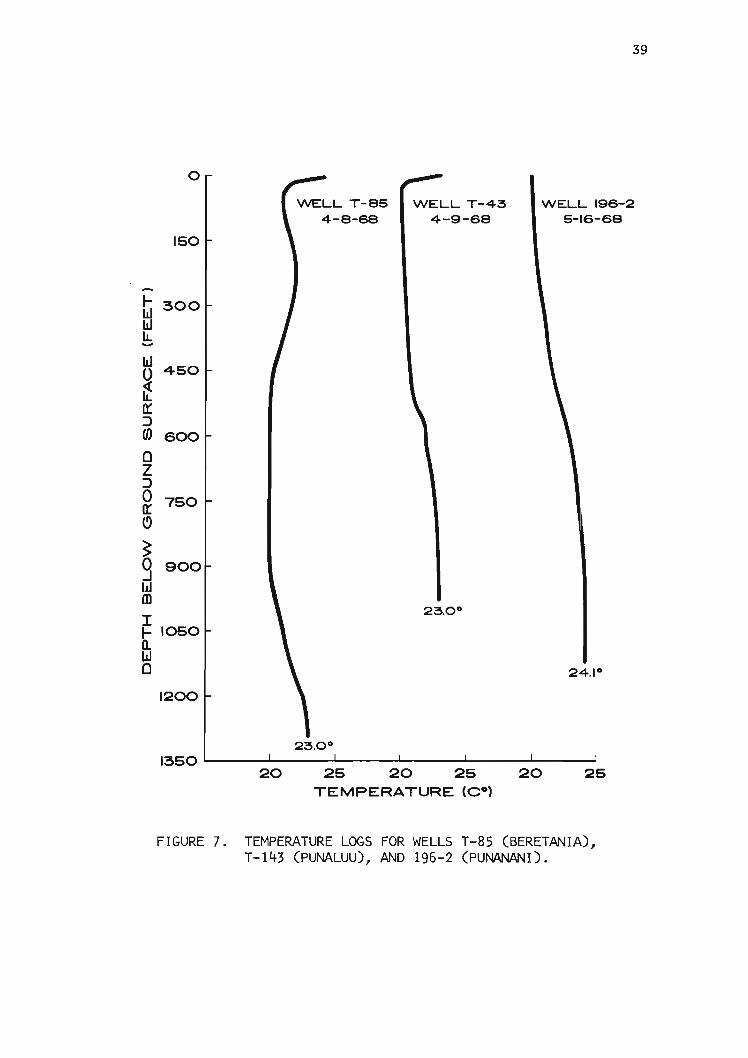
39
WELL 196-25-16-68
WELL T-454-9-68
o
150
I- 300WWLL....W 4500~0::::>en 600
0Z::>0 750lrC>
~
9 900Wm
25.0°II- 1050a.W0 24.1°
1200
25.0°1350
20 25 20 25 20 25TEMPERATURE <CO)
FIGURE 7. TEMPERATURE LOGS FOR WELLS T-85 (BERETANIA)~
T-143 (PUNALUU)~ AND 196-2 (PUNANANI).

40
and the water temperature. If the geochemical character of water
is relatively uniform over an area, detailed laboratory analyses
may show consistent relationships between conductivity and chemical
constituents. With the aid of these relationships, accurate esti
mates can be made from conductivity data for the various chemical
constituents, including total dissolved solids . Unfortunately,
there are not enough data on compositions of dissolved solids to
determine the relationships for waters in all areas of Hawaii.
However, because salinity in most wells in Hawaii results from
admixture of sea water with water of very low content of dissolved
solids, it may be assumed for most general purposes that there is
a unique relationship between conductivity and either total salinity
or the concentrations of any of the major ions. A useful approxi
mation which often is applied to relatively low conductivity water
in Hawaii is that the concentration of Cl in parts per million is
about 1/4 of the specific conductivity in micromhos. A more accurate
estimate of chlorinity as a function of conductivity can be obtained
by using the relation pertaining to diluted sea water graphed for
various temperatures in Figure 8.
Another important use of conductivity logs in Hawaii, in
conjunction with resistivity logs, is to help locate zones contribu
ting water of anomalous or objectionable quality. For example, the
conductivity log and the resistivity log for a well at Pearl City,
Oahu (see Fig. 9) indicate that if the casing of this well had
not been perforated and if it had been seated in the dense basalt
at 320 feet depth, then the poorer 4uality upper water probably
would have been shut off or at least reduced in quantity and an
overall improvement of the water quality would have resulted.
One of the most important uses of conductivity logs, together
with temperature logs, in Hawaii is to provide data for the inter
pretation of the complex Ghyben-Herzberg lens relationships . The
heads indicated in wells in Hawaii are the result of complex dynamic
relationships of time, tides, recharge, discharge, and the changes
of density with depth. The problem of imperfect balance of the
Ghyben-Herzberg ratio in Hawaii was recogni zed by Wentworth (1939).
Cox (1954) and Lau (1960, 1962 and 1967) have discussed the shape
of the salinity and temperature curves with depth. With the data

10-3CHLORINITY (0/00)
10-2 10-1 10°
~
~ 10-2CIlo~
~
LLIUZet~U;:)ozooU1L(310-3
LLIQ.CIl
~u"10 ~~
~
-I-I
~
LLIUZet~u;:)ozou
lOo~1L(3LLIQ.CIl
10 102 103
CHLORIDE ION CONCENTRATION (PPM)104
FIGURE 8. SALINITY VERSUS CONDUCTIVITY (AFTER COX, ET AL., 1969).~.....

42
280
290
SpontaneOU1 Poten tia l- - - - - +- --14--25mv---04
No pump
Perforoted cotinQ
Ohmm.' ....I I
490 500Honolulu Boord 01 WolI, SuPIIIy
Thiel Sompl.. 9123/66Somple Mlc,omhOI
1 513
2 5823 4534 393~ 3856 3687 3248 321
300 zoo 300
Mfcromhol
400 500
End 01 cOllnQ
310 SP 16"SN
LlIIIII mixing on l o' gll 110'" 01lIullnllolly unlfo,m quolily
Zonll /0EII."I/ally uniform qual,'y
)
(
/ ./ " ' . '" '' ''/ _ ~ ~ - / Zono 4
poor 1o mod.rD/~/y ",'""aN" 03/ Pr imorlly mli/u'" 01 £tNJil.~ and " .,i'" I,.",. wol.'r"", 1It16 porUon
"".ry ....ld.n•• ba,""_...... -
Zonll SLo19ft flow $uggtlsl.d by ,.sisllvil)'log tJnd slraighln.s. of conduclfl'ify
I"10' Indic a ling dominant '"lIu. nc•
. 04 "/" ",,,/ , , ,,, // / / / /""///
Zonll 6
of- Sfralg'" porlion 01 log og,lIuwilh ,ssMllally IfD flow from din"
bohl/l
good
//
(-----------/_/1 ~~~", ,, ,, " " """ " ' "' ' ' ' ' '' ' '' '' ' '
good
":r~fo~""tof,~'::tI:~~Rw=35
/
I\,\\\
'---'\
410
380
420
360
370
340
~-,\ f'lod"olilly plI,mllllblll\\J dtlcr'(1$.d p"mllobllfy
390 (~
( "",dll,ol"'y ptt,m.abl.(
Rw =29.~'--400
32 0
330
3~0
FIGURE 9. ELECTRIC WELL LOGS FOR WELL NO. 202-C, PEARL CITY, OAHU.

43
currently available on temperature and salinity profiles, corrections
of density with depth are possible. By study of head changes in the
well and monitoring of the salinity and temperature, more reliable
estimates can be made of ground-water storage. At present, the
Honolulu Board of Water Supply has a continuing program of logging
deep wells penetrating to salt water for borehole conductivity and
temperature at periodic intervals. Re-runs have revealed changes
in the depth and thickness of the fresh water and the transition
zones and show that the lens is dynamic (Fig. 10).
Finally, to avoid possible erroneous interpretation of re
sistivity logs, conductivity data has been used to adjust Tesistivity
logs when a substantial salinity gradient occurs in a well.
SPONTANEOUS POTENTIAL LOGS. The interpretation of SP logs, unlike
conductivity, temperature, and caliper logs, is generally not
straightforward because the parameters of interest, the depths of
formation boundaries, formation permeability, and formation water
quality are not directly measured. Instead, the naturally occurring
electrical potentials measured with SP logs provide only a very
indirect determination of these parameters which is subject to
considerable differences in interpretation.
Electropotentials from wells in sedimentary rocks arise
primarily from electrochemical sources and electrokinetic potentials
generally are negligible. Consequently, conventional interpretative
techniques used for SP logs from continental wells, which are generally
in sedimentary rocks, are based on potentials from electrochemical
sources and ignore electrokinetic potentials. Interpretation of SP
logs from the few wells in sedimentary rocks in Hawaii (three wells
logged in this study) follows conventional SP interpretative practices.
Figure 11 shows SP and resistivity logs of a sequence of reef de
posits and interbedded muds of probable terrestrial origin. Opposite
the reef deposits, the SP log shows negative deflections, indicating
these formations were more permeable than the muds and that the for
mation water was more saline than the drilling mud in the borehole.
The general increase of negative SP with depth in this well was
caused by increasing salinity in the formation water with depth.
Most wells in Hawaii, however, are in basalts with remarkably

44
uniform chemical composition, so that conventional interpretative
techniques for SP logs are not applicable. The contributing pro
portions of potential from electrochemical and electrokinetic
sources are not known at present, but the electrokinetic potential
from fluid flow is suspected to be dominant.
Generally, in basalts, positive SP deflections occur opposite
zones with flow from the aquifer into the well and negative SP
deflections occur opposite zones with flow from the well into the
aquifer on the no-flow base (see Fig. 12). However, this is not
always true . In some instances SP deflections are not observed or
are in reversed position opposite zones which are shown by resistivity
and conductivity logs to be permeable, water-contributing formations.
Because of these uncertainties, SP logs from wells in Hawaiian basalts.
have been used primarily to supplement and, where possible, to con
firm the findings of resistivity and other geophysical well logs.
Furthermore, owing to the uncertain nature of the SP logs, no attempt
was made to apply quantitative interpretations to SP logs in Hawaiian
rocks.
RESISTIVITY LOGS. The interpretation of resistivity logs is not
always straightforward because, like SP logs, resistivity logs do
not provide a direct measure of the parameters of greatest interest,
namely, formation lithology and porosity. Instead, resistivity logs
measure the composite resistivity of the borehole, the invaded zone
if drilling mud was used, and the formation and formation fluid.
From this information, formation lithology and porosity must be
ascertained. Nonetheless, resitivity logs have proved to be most
useful for obtaining geologic and hydrologic information from water
wells in Hawaii.
Basalt is normally among the most resistive rocks and the
values of resistivity range to 100,000 ohmmeters (see Table 2).
Surface resistivity surveys in Hawaii indicate values ranging from
about .5 to 300 ohmmeters (Hussong and Cox, 1967) and 800 to 1,000
ohmmeters (Keller, 1967). Zohdy (1966) found resistivity values of
fresh basalt saturated with fresh water in the Waianae Range and in
the Pohakuloa area on the island of Hawaii to be 300 to 700 ohmmeters.
The values of down-hole resistivity found in the WRRC study agree
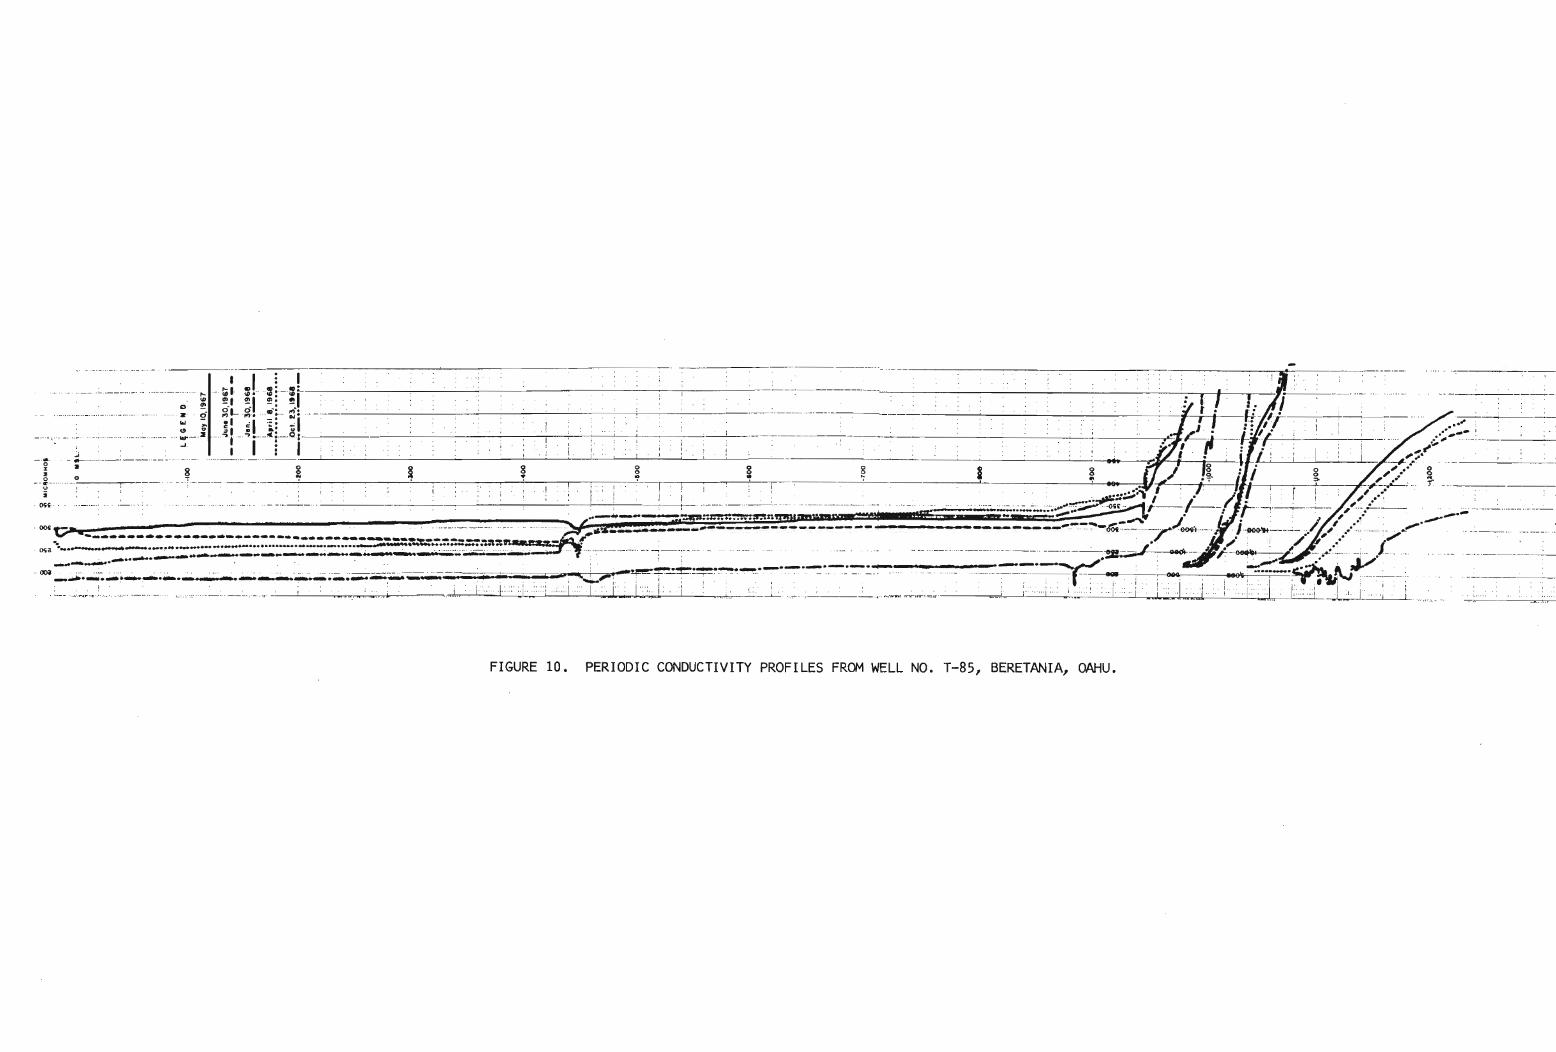
_.....ox2o
-- ~ - -
i()';~
.. ._. ..__. ..... -- --_..__ . ~ ...__._._-_... .. ~
'".. !!z ci..='__.2oJ
.:.;- _..----..__._ .-'"-.:I
o
• •• Jz _.J ..
.,
,
i
jI
o~
- ----,-------- _ ._ ----_.
':::0:: •• ::':..:r.:n
.tt
••i I ' II i i 1
4S
-~~----_..,~..- __ I
...,'" ;
".~..,I-~J--'--:-..:...~---l_-'-_,-L----.~~ . •~
, .- 0,.. Q
~r---r----:--+---~__-/--.L; .. ~, .',,~ •••• I
----~ J. ~~........
FIGURE 10. PERIODIC CONDUCTIVITY PROFILES FROM WELL NO. T-85, BERETANIA, OAHU.

3" PVC coalng p.rfor.... for 4 ' ....ry !I'
ILoos. cora l ond lond
Tuff ! ? )
Ruf IImu ton.
,•,
4
•,
I
•,,I Brown mud
I
I
A Hard ...f IImuton.V
,200 . ~, Thln- bid d.d beachrock
Brown mud
Hord IrOQmento l rul
Brown orQo nlc mud
Sponton.oUlPoI.nllol
If- 10mv--JlR'llltlvlfY
"!I olwnm.tnll
PR
47
If'SNa Shotf Normal64
MLN=
Lone Normal6' L- LateralPits Polnt RU \ltlwlty
6L
FIGURE 11. ELECTRIC LOGS AND GEOLOGIC LOG FROM WELL NO . T-133-1~ EWA BEACH~ OAHU .

48
. .
dl..1
SPo SpantOMClUll PllI..,lIl11PRoPotnl "."III.lty
I6"SNoIS"Sllart Nalm.'84" lN0S4"lCIIII Narmal
S 'V,'lafar"
al COlin, ---...,
din" Iloaall
p.rmeabll baaall.Ith d.na. lon.a
poor 10 modlrol. ly
"'ry d.n.. c===========:~~boao•
Inlarpralotl!!!! 21 EllolrlC J.!A!
2' 01 cov.d motarlal
~ p.rmaobll boao" withvary d.... lon.a, low ",I'tlvlly J_
_ _ I_O_""_.:.p_ro_b_o_bly.:..-W_'Q.!°Ltha.!!!!"!,!:d!!!...roCk ( ".Ib."... _.....---------:pI::r::m::'::obI::;:I;;:IIy~ ~("
plrm.obla bOlolt
parm._ boaolt
moat 1I0w Irom h.,.
·," ,•...,•""·"•
Soft red rockflow increoa.d
,(S(~iV"t>t.QX from V3 10 lullpip.
Orlll,,~ Lot Potential
Soft br-. cby
'. 7 p".•.''';. -
SL r. ~
.;,IllICl< IIlOld, 9"MI~.:~.... and abeam waah
:i:- ~ :_•.s: .~;,.
~ '
10 .• c -~~!:. '~
_.'-'-:«.
" . .......' .~;;,
.," Hardpacked ..-.I'.20 ~: "Ind river waIh
,e. •• ·.-" ... ... SP
~ '" ',/
" .- :'" Hard traY raek
"''' '' ~"'"30 "" "'"~ " ""
taft .fYI rackflrat ••tlr
40 • · ,.•• • " .
IlO
-,,., ~
., I
• ~
60 · ,·"·10 " ~
"",..
~ (.. .."
" ..10 ", ..".. ......... .....
"90~
"~
.......~
'".. '".."100
110
Noll' Lower loR ..oioll.lt, dua to ohl/flHnll ofcurr.nt uplloll b,cou.. 01 rlliall.. rock
FIGURE 12. ELECTRIC LOGS AND GEOLOGIC LOG FROM WELL NO. 200-4 , PEARL CITY, OAHU.

TABLE 2. RESISTIVITIES OF ROCK IN HAWAII AND COMPARATIVERESISTIVITIES ELSEWHERE (VALUES IN OHMMETERS).
RESISTIVITY VALUES FROM ELECTRIC WELL LOGGING
49
WRRC ( 1966, 1967, 1968 OAHU AND KAUAI)
BASALT SATURATED WITH FRESH WATER, EXTREMES
BASALT SATURATED WITH FRESH WATER, NORMAL VALUES
BASALT SATURATED WITH FRESH WATER, CHANGE IN RE~ISTI VI TIES IN ANY ONE WELL
CORALS SATURATED WITH FRESH WATER, EWA BEACH
CLAYS SATURATED WITH FRESH WATER, EWA BEACH
BASALT SATURATED WITH SALT WATER
ELECTRO-TECHNI CAL LABORATORIES ( BULLETIN EL-215, 1961)
GROUND WATER
SEA WATER (30, 000 PPM)
SOFT ROCKS (2 5% POROSITY, SATURATED)
FIRM ROCKS (25%POROSI TY, SATURATED)
HARD ROCKS (6% POROSITY, SATURATED)
LOG MASTER SERVI CES MANUAL (SELECTED FORMATIONS BASED ON SINGLE POINT)
LIMESTONE (POROUS AND DENSE)
SHELL OR CLAY
SAND OR SANDS TONE
RESISTIVITY VALUES FROM SURFACE SURVEYS
300-700
450-550
5-100503::
500::
UNRELIABLE
0.1-30
0.3
1-300
4-1,000
40-5,000
20-10 6
1-100
1-1,000
HUSSONG & COX ( 1967, PAHALA, HAWAII)
UNWEATHERED AA
UNWEATHERED PAHOEHOE
WEATHERED LAVAS
DRY SOIL
WET SOIL
FRESH WATER SATURATED LAVAS, GENERALLY
FRESH WATER SATURATED LAVAS, MAX IMUM
ZOHDY (1965, 1966, MOKULEIA, OAHU AND POHAKULOA, HAWAII)
CLAY SATURATED WITH BRACKISH TO SALI NE WATER
CLAY SATURATED WITH BRACKISH TO FRESH WATER
CLAY AND SILTY SAND WITH FRESH WATER
SAND AND CORAL
WEATHERED BASALT WITH FRESH WATER
FRESH BASALT WITH FRESH WATER
FRESH BASALT WITH SALINE WATER
KELLER ( 1962, KILAUEA VOLCANO)
SHALLOW, VERY RECENT FLOWS
UNDERLY ING BASALT ABOVE SEA LEVEL
OLDER ROCKS BELOW SEA LEVEL
10,000-200,000
5,000-20,000
1,000-8,000
500-5,000
50-500
.5-300
485
1-3
5-8
11-25
80-400
30-60
300-700
30-40
50,000-100,000
800-1,000
LESS THAN 10
::DEPENDI NG ON ELECTRODE USED, RESISTIVITY VARIED SLIGHTLY BUT THE 3-OIiM"1ETERGREATER VALUE PERSISTED FOR CORAL. THE BASALT WAS 3-9 OIiM"1ETERS GREATER THANCORALS .

50
with Zohdy's values and range from 300 to approximately 700 ohmmeters.
The highest values were found in wells of the Makaha area which pene
trate a dike compartment in Waianae basalts saturated with water
having a conductivity of 350 to 370 micromhos. The lowest values of 290
to 340 ohmmeters weTe found in Koolau flows in the Kaimuki area of
Honolulu. Comparison of surface resistivity with down-hole resistivity
values should be made only with great care as surface resistivities
are the averages of large volumes of rocks, including low resistive
soils, whereas borehole values indicate the resistivity of only a
small volume of material near the bore.
Interpretation of resistivity logs from the wells in sedimentary
rocks in Hawaii generally is similar to interpretation of resistivity
logs from wells in continental sedimentary rocks. From Figure 1]
it can be seen that low resistivities occur opposite the muddy zones
which consist predominately of ionized clays, intermediate resis
tivities occur opposite the more porous but un-ionized reef and
beach-rock deposits, and high resistivities occur opposite dense
reef limestone and aa basalt. Interpretation of resistivity logs
from wells in Hawaiian basalts, however, is considerably different
from that of logs in sedimentary rocks. In basalts, intermediate to
high resistivities generally occur opposite dense impermeable zones
such as the cores of aa and thick pahoehoe flows, and low resis
tivities occur opposite porous water-bearing zones such as permeable
pahoehoe and aa clinker (Fig. 12). Care must be taken not to confuse
low-resistivity, porous, water-saturated basalts, which generally
have high permeabilities, with highly weathered basalts and buried
soils, which also have low resistivities but in general, low per
meabilities. In Hawaiian water wells this is not a common problem,
however, as weathered layers and soils are not common in the flanks
of the volcanic shields formed by lava flows laid down in rapid
succession, which constitutes the ma jor aquifers. Even on Kauai,
the oldest and the most geologically complex of the Hawaiian islands,
no logs were obtained which were thought to indicate soils or
weathered layers. SP logs often may be used to aid in the inter
pretation of suspected buried soils or weathered zones because
these zones generally have very low SP's .

When used in conjunction with other available geophysical logs,
the interpretative methods described are usually adequate for quick
qualitative appraisals and yield useful information concerning the
location and general characteristics of water-yielding formations.
However, if, true formation resistivity or other quantitative in
formation is desired, the following factors must be considered:
(1) borehole diameter effects and bed thickness in relation to
electrode spacing, which cause measured apparent resistivities to
differ from true formation resistivities, and (2) temperature and
water quality variations which cause measured formation resistivities
to vary from resistivities at standardized temperatures and sa
linities.
The well diameter affects apparent resistivity because the
zone where resistivity is indicated by the sonde includes the well,
filled only with water or drilling fluid, as well as the water
saturated rock. Furthermore, in wells containing brackish or saline
water the ease of electrical flow often is greater in the borehole
fluid than through the rocks. Consequently, the well-logging current
may be shunted up the borehole and may bypass the rock formations,
thus suppressing values of measured apparent resistivity. This
shunting phenomenon also is often encountered in logging wells in
dense limestone formations (Patten and Bennett, 1963). In order to
overcome this problem and make logs from wells in limestone more
quantitative, special limestone logging devices are used. Hummel
and kulke (1937) suggest a quan ~itative correction for l0gS from
wells in which shunting is a problem, however, their method applies
only to a few restricted cases and is based on mud-filled bores.
As discussed in the preceding section 0n fundamentals, the
well-diameter effects are most pronounc3d for resistivities indi
cated by the point resistivity sonde, whose logs are in any case used
only in a qualitative way except in the location of tops and bottoms
of beds. For the multi-electrode sondes, the well diameter effects
are not critical in qualitative evaluation in wells of less than
about 24 inches in diameter in fresh water. Most of the water
wells in Hawaii have nominal diameters of 12 inches or less and none
that have been logged have nominal diameters exceeding 24 inches.
51

52
However, in the clinker beds which constitute some of the most permea
ble portions of basalt lava aquifers, it is not uncommon that caving
has resulted in the enlargement of a well far beyond its nominal diam
eter. The effect of such caving on apparent resistivity is to exag
gerate the a l r eady low apparent resistivity, thus making clinker zones
even more easily distinguishable from dense zones. Lava tubes also
produce similar low resistivity zones. The logging results indicate,
however, that even in l 2-inch diameter wells containing brackish water
(conductivities exceeding about 5,000 micromhos or borehole fluid
resistivities less than about 2 ohmmeters) the contrast in apparent
formation resistivities is materially reduced.
When accurate true formation r esistivity is desired, it is
necessary to account for we l l diameter. Schlumberger departure curves
(Anonymous, 1962, p. B-2) can be used to compute the effects of bore
hole diameter on formation resistivity. Based on the ratio of
R16
fRm, where R16 is the apparent resistivity measured by the l6-inch
normal sonde and R is the resistivity of the drilling fluid, thesemcurves are primarily useful only for logs from mud-filled holes in
sedimentary formations. If the resistivity of the borehole water, R ,wcan be substituted for R , a sample correction can be applied tomresistivities measured in Hawaiian wells. For example, the measured
R16 in Well #277- 102 at Makaha, Oahu r anged from 380 to 560 ohmmeters
and the resistivity of the borehole water is 21 ohmmeters. The correct
ed resistivities using the Schlumberger curves for a l2-inch diameter
hole are 440 and 690 ohmmeters, respectively.
The validity of substituting R for R , or ev en using the Schlum-w mberger curves in Hawaii at all, is questionable because the curves are
based on a three-l ayer case consisting of a mud-filled borehole, an
invaded zone, and the uninvaded formation. Further , the Schlumberger
corrections ar e available only for l6- inch normal and l8-foot lateral
configurations. In Hawai ian we l ls only two different res istivity lay
ers exist, a wat er-filled borehol e and a formation which is saturated
with borehole fluid. It is anticipated that curves similar to those
given by Schlumb erger can be computed for the two-layer case pertinent
to Hawaiian wel l s whi ch wi l l pr ovi de cor rections for borehole diameter
effects for eac h of t he logging sondes i n us e in the Hawaiian program.

53
A correction for bed thickness must be made in the determina
tion of true formation resistivity if the thickness of the bed is
less than approximately twice the electrode spacing. The average
resistivities indicated by the long normal and lateral logs are
thought to represent true average formation resistivities for sec
tions on the order of ten feet or more. The short normal logs
commonly indicate true formation resistivities for sections with
thickne~ses greater than three feet except where the well diameter
is considerably enlarged by caving. The true formation resistivity
is rarely of concern in Hawaiian lava flows or lava flow sequences
for thicknesses less than three feet.
Resistivity varies with changes in temperature (see Fig. 13).
A change of 5°C in the water temperature amounts to about a 20 per
cent change in resistivity, decreasing for colder and increasing for
warmer waters. It is often desirable to correct resistivity values
to a single standardized temperature. In water quality studies the
usual standard reference temperature for comparisons of resistivity
or conductivity is 25°C (77°F). In oil-well logging, Schlumberger uses
75°F (24°C). As indicated earlier, the range of temperatures found
in ground waters on Oahu is relatively small and is only a few de
grees centigrade or less in any given well. Furthermore, wells on
Oahu normally show quite uniform temperatures throughout their depth,
varying from well to well from about 19° to 24°C. Hence apparent
formation resistivities OIl Oahu should be increased by about 8 to 24
percent to conform to standard reference temperatures. However, for
the purposes of local interpretation this is not considered necessary
if the range of temperature is restricted to a few degrees because
usefulness of a log is not changed by a uniform small change of resist
ivity.
The conductivity of water in Hawaiian wells, as indicated in the
previous section on interpretation of fluid conductivity logs, often
changes during logging, especially in deep wells. Because water in the
borehole generally is identical to formation water in Hawaiian wells,
increases in borehole fluid conductivity cause apparent formation re
sistivities to decrease and decreases cause resistivities to increase.
Often it is desirable to apply a correction to resistivity values so
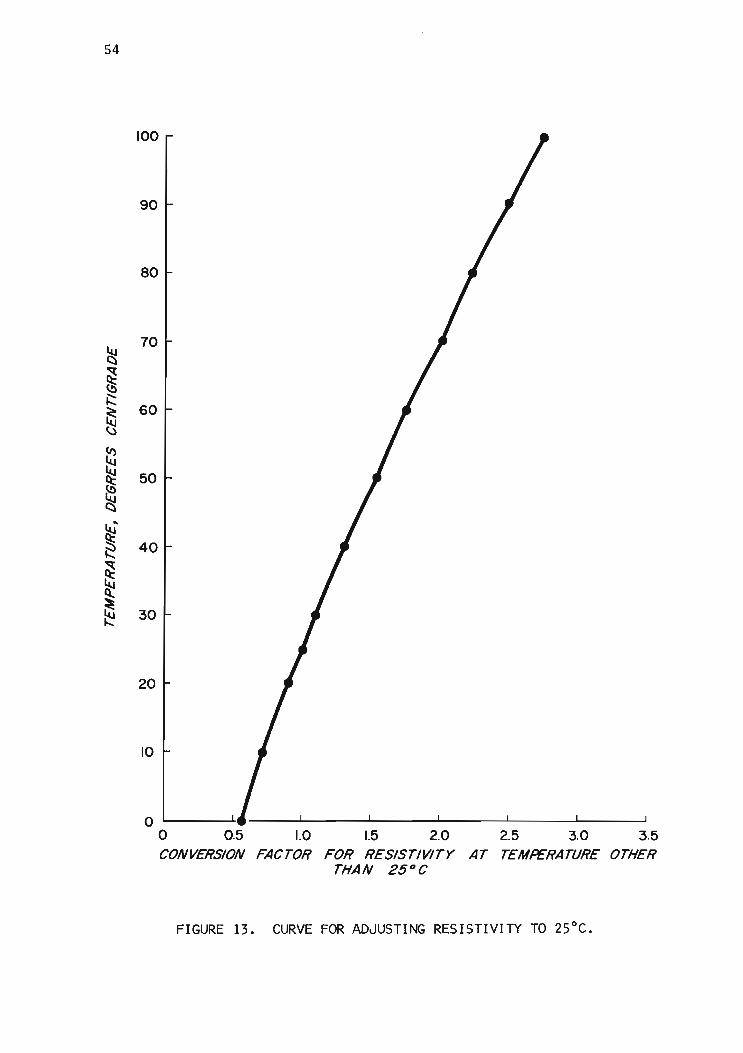
54
100
90
80
~70
~Q)
i:::60
~(j
~~ 50ees!,t,s"
~ 40
'"~~~ 30I-.::
20
10
oo 0.5 1.0 1.5 2.0CONVERSION FACTOR FOR RESISTIVITY
THAN 25 DC
2.5 3.0 3.5AT TEMPERATURE OTHER
FIGURE 13. CURVE FOR ADJUSTING RESISTIVITY TO 25°C.

55
that they are standardized to a constant borehole water conductivity.
If the resistivity log is not corrected, in some cases erroneous in
terpretation may result. For example, low resistivity resulting from
high formation water conductivity may be confused with low resistivity
resulting from highly porous rock layers such as clinkers. A simple
empirical method of correcting the measured formation resistivities
to a constant fluid resistivity using the conductivity log is outlined
below:
1) Pick appropriate points on the fluid conductivity log and
convert the conductivities to resistivities by using Figure
14 or equation 9:
Resistance (ohmmeter 2jmeter) - 10,000 (9)- Speclflc Conductance (mlcromhos) .
2) Select a convenient point on the conductivity curve, pref
erably a low value, to serve as a reference value.
3) Subtract or add the reciprocal values of conductance to the
resistivity curve according to whether the particular point
exceeds (add) or is less (subtract) than the reference
conductivity.
Figure 9 shows a l6-inch short normal resistivity log corrected
to a constant fluid conductivity of 285 micromhos (fluid .r es i s t i vi t y
of 35 ohmmeters). This value was used for reference because it is the
lowest value of conductivity measured in the hole.
OBTAINING WELL YIELD FROM ELECTRIC WELL LOGS. Probably the most im
portant information, which well logs might contribute, is an estimate
of the yield or potential yield of the well or the permeability of the
aquifers. The logging techniques used in this study cannot directly
indicate yield or permeability, but it was hoped that an estimation of
aquifer porosity in the basalt flows might be correlative with permea
bili ty.
Data from logs of wells drilled in Hawaiian basalts, however, do
not appear to yield reliable quantitative porosity values. This pri
marily is because (i) the apparent resistivities measured in this study
do not always provide accurate indications of true formation resistiv
ity, especially in brackish water-filled holes, and as discussed in the

56
'"Qx
.>-I-.....>.....I-U"l.....
N U"l0 UJ
OCx
~0I-
~ >-
~I-.....>
~.....I-
cs U::>
)..... Cl
"- ~s ui:::: u..~ 0
~ zQ 0Q:;: .....x U"l
OCUJ
~U
..:tr-i
UJOC::>l!l.....u..
00
X<I' '" N -0 -0 Q 0x x x x
SOHWOY:JIW '.-<.LIAI.J.:JnONO:J

57
previous section, good corrections for the various well diameters,
bed thicknesses, and water quality effects are not yet available,
and (ii) the currently available formulas, such as equation (8) and
tables from standard logging references were developed for obtaining
porosity information primarily in sedimentary formations and are
not applicable to Hawaiian rocks without great modification. In
particular, the constant M in equation (8) is difficult to evaluate
in Hawaiian basalts because it probably is extremely variable.
Furthermore, equation (8) is basically empirical in nature, even in
sedimentary formations, and should not be applied to an aquifer until
experimental control has established the validity of the equation
in the aquifer and the value of the constant M for the aquifer.
An attempt was made to calculate representative porosities
for Hawaiian aquifers using several different borehole fluid con
ductivities and arbitrary values of M. Values of porosity given
for the maximum and minimum resistivities measured in Hawaiian
wells, 300 to 700 ohmmeters, respectively, should indicate the
range of possible porosities in Hawaiian aquifers. These results
are summarized in Table 3. In general, no single set of maximum
TABLE 3. SM-1PLE POROS ITY CALCULATIONS
CONDUCTIVITY Rw Ro 1 Ro 2. m(MICROMHOS) (OHMMETERS) (OHMMETERS) (OHMMETERS)
POROSITY IN PERCENTAGE
<P1 <P2.
1 33 14100 100 300 700 2 57 38 3 7
3 69 52
1 17 7.1200 50 300 700 2 41 27 6 14
3 55 41
1 6.7 2.9500 20 300 700 2 26 17 15 35
3 40 32
1 3.3 1.41000 10 300 700 2 19 12 30 70
3 35 24
and minimum values are very close to what is generally thought to
be the true range of porosities in Hawaiian basaltic aquifers.
Probably the most reasonable values are obtained by using M = 2
and a fluid conductivity of either 200 or 500 micromhos.
However, in both of these cases, the range between minimum and
58
maximum porosities appears to be too small and the minimum porosities
calculated from the maximum resistivity of 700 ohmmeters appear to
be much too high. A sample porosity calculation, using equation (8),
is given below:
Assume: R = 20 ohmmeters (conductivity = 500 michomhos)w
R = 300 ohmmeters01
R = 700 ohmmeters02
M = 2
Then: F = R /Ro w
Fl = 300/20 = 15
Fz = 700/20 = 35
epM = l/F
<PI =V1il5 x 100 = 26%
<1>2 =V1i35 X 100 = 17%
In general, a distinct lack of data exists for porosity determi
nations from electric logs of water wells in consolidated rock, espe
cially in bores filled with fresh water. At one point in the investi
gation, some thought was given to making laboratory measurements of
resistivity on core samples. However, a core sample would be unlikely
to possess the quantity or the wide range of void types responsible
for conducting electric current on the scale measured in the field,
nor would resistivity from this method provide a representative aquifer
sample. Also, the difficulty of coring increases with increased
porosity, so that a representative formation ratio of voids to solids
in the core would be difficult if not impossible to obtain.
Actually, permeability or effective porosity rather than the
intrinsic porosity measured in the field or laboratory is the desired
quantitative factor relating to yield of water. In sands and sandstone,
porosity is reasonably related to potential yield because porosity
generally results from micro-structure in granular material; except
for cinders, this is perhaps not completely correct for basalt aquifers.
From fresh basalt exposures, one can easily observe the wide variation
of structures varying from pure micro to very large macro sizes that

59
govern porosity. The structures include cracks and joints of all sizes,
vesicles of varying size and number, cavities and lava tubes, irregular
contacts between flows and most important, the clinker zones. Water
flow in these structures ranges from very low in dense unjointed rock
or rock with poorly connected vesicles to conduit flow of large mag
nitude (Table 4). For example, porosity in a vesicular flow
TABLE 4. TOTAL POROSITY IN CORES OF KOOLAU BASALTS FROM OAHU (AFTERWENTWORTH~ 1938).
LOCATION
HOLE 22-43'
22-77'
24-75'24-154'27-333'27'374"
PERCENTAGE POROSITY
4,2.6
58.3
51.444.35.26.5
might be high, but because the vesicles are poorly interconnected both
effective yield and permeability are low, whereas, some large cracks
of clinkers would have much higher yield and permeability.
From correlation of good driller's logs with electric logs and
well performance, clinker zones seem to be the best water producers,
and, especially if unweathered, have poroslties up to perhaps 50 per
cent. At the other end of the porosity scale dense flows may have
porosities of less than 5 percent, cracks included.
Borehole Photographic and Television Logging
In addition to the conventional well-logging techniques re
viewed in the third chapter of this report and the geophysical
logging techniques which were introduced through the project and
the results of which are the principal topic of this report, two
optical logging techniques have been used in Hawaiian wells. One
involves television with incidental photography of the television
screen and the other involves down-hole photography.
WELL INSPECTION BY TELEVISION. The first Hawaiian trial of down-hole
television was made by Layne International, Incorporated in April
1960 for Kekaha Sugar Company, Kauai. Five old wells on the Mana

60
plain where casings were obstructed were surveyed in an attempt to
identify the nature of the obstructions.
Muddy water and oil limited visibility in two of the wells but
the nature of the obstructions in the other three was indicated clear
lyon the television screen. Photographs of the screen (Figs. l5a,
l5b, and l5c) show the obstructions in two of the wells. No surveys
were made below the casings or in unobstructed wells.
The Honolulu Board of Water Supply attempted television in
spection of a leaky well casing at Beretania Pumping Station in
July, 1968 ~nd retained the services of Penetron Western, a firm
then engaged in television inspection of sewers in Honolulu. Image
quality during the brief transmission period was good, however,
the attempt was unsuccessful owing to malfunction of the quartz
iodine lighting system . No further attempts were made with tele
vision. The casing inspection was subsequently completed with the
Laval-type stereo well camera described in the following section of
this report.
WELL INSPECTION BY PHOT000GS. A Laval-type well camera using a pair
of matched lenses for stereo photography was used to photograph 22
wells on Oahu (electric logs were available for 9 of the wells).
The work was performed for the Honolulu Board of Water Supply by
Western Well Services of Hanford, California during the summer of
1968. The Water Resources Research Center logger was used to lower
and to operate the camera and to monitor footage. Exposures were
made every two feet to provide a slight photo overlap. A fast strobe
light permitted continuous exposure of film without stopping the
winch. A total of 2,759 feet of the basal aquifer were recorded .
The images were recorded on 35 millimeter black and white ne
gative film which was developed in the field in a daylight developing
tank. Image quality was excellent in general and considerable detail
could be discerned . Use of 35 mm focal-length lenses minimized but
did not eliminate all problems of focus. However, the study of nega
tive images is inconvenient in that considerable time is required for
becoming accustomed to them. Furthermore, the camera was aimed down
ward because the well bores were too small to accomodate an attach
ment for taking pictures at right angles which would have made inter-
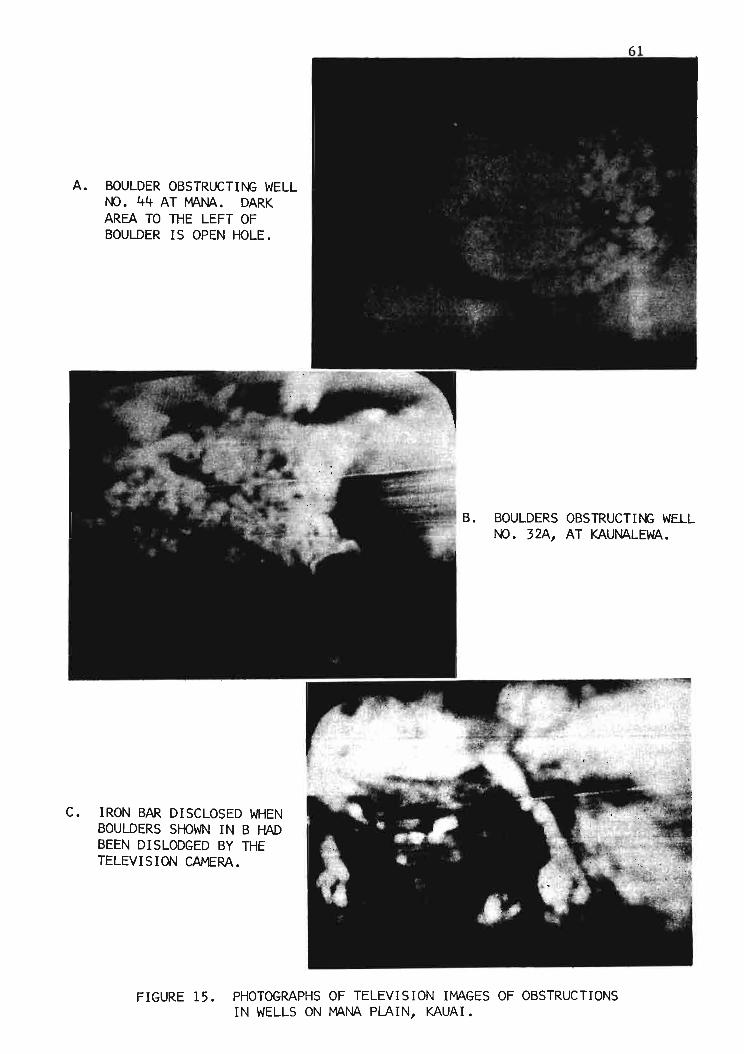
A. BOULDER OBSTRUCTING WELLt-.() • 44 AT tAANA. DARKAREA TO THE LEFT OFBOULDER IS OPEN HOLE.
C. IRON BAR DISCLOSED WHENBOULDERS SHOWN IN B HADBEEN DISLODGED BY THETELEVISION CAMERA.
BOULDERS OBSTRUCTING WELLI\lO • 32A, AT KAUNALEWA.
FIGURE 15. PHOTOGRAPHS OF TELEVISION IMAGES OF OBSTRUCTIONSIN WELLS ON tAANA PLAIN, KAUAI.

62
pretation easier. Despite image excellence, determination of the type
of lava in view is not always easy. Drilling sometimes obliterates rock
textures and structures useful in identification. Color reversal film
and a view normal to the well bore would make identification easier and
more positive.
Nevertheless, positive and useful identification of flow types
can be made. For example, pahoehoe flows frequently show curved
color bands, or curved ribs projecting into the bore, or character
istically hemispherically shaped voids left by drainage of liquid lava.
Clinker zones exhibit irregularly shaped bores of variable dimensions
in which individual clinkers can be commonly distinguished. Vesicles
appear frequently in dense flows. Very dense, thick flows show uni
form bores of circular shape in which vertical jointing can be seen.
Sometimes fracture cones occur where the drill bit passes from a dense
flow into weaker rock and the hole "bells" out. Soft format i.ons j such
as weathered rock, or perhaps ash beds, on occasion, show cable stria
tions from the drilling operation.
Correlation between the photo logs and the electric logs is very
good. An example of comparison of the driller's log, a photolog and
electric logs is shown in Figure 16. Note that the electric log
interpretation has lithologic character not normally obtainable from
electric logs alone. This additional detail is supplied by the photo
log and gives a more composite, comprehensive appraisal of the zone.
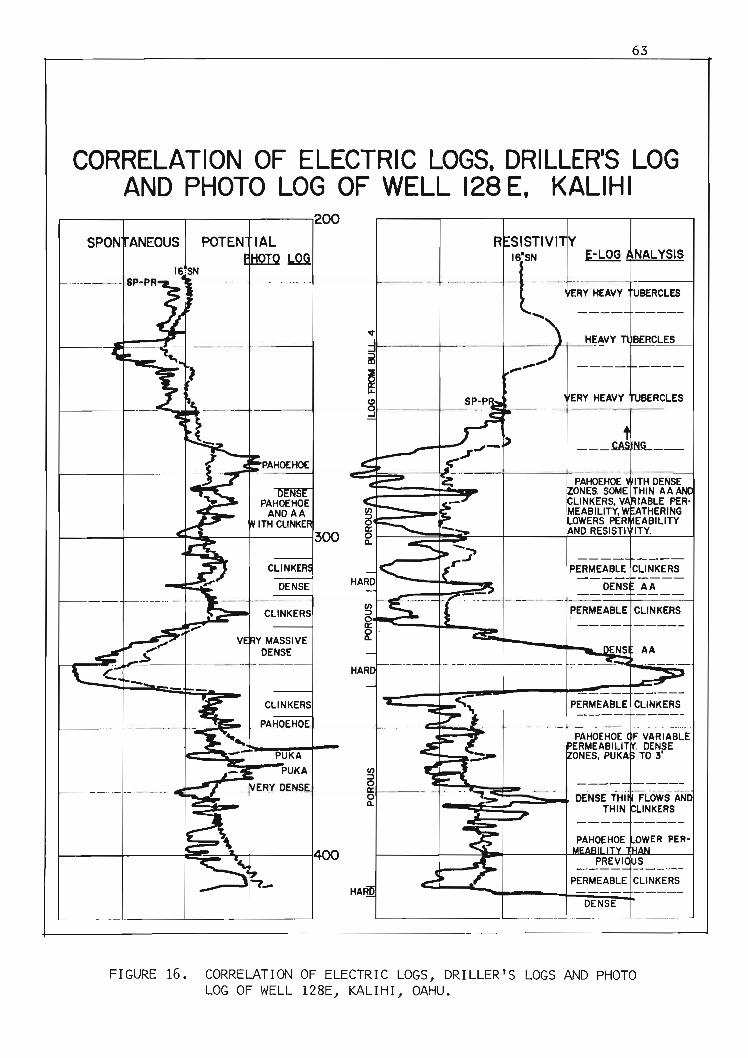
63
CORRELATION OF ELECTRIC LOGS, DRILLER'S LOGAND PHOTO LOG OF WELL 128 E, KALIHI
....----...,----,------.-----,200
PERMEABLE CLINKERS---- ----DENS AA
PERMEABLE CLINKERS
PAHOEHOE ITH DENSEONES. SOME THIN AA ANLINKERS, VA IABLE PER-
MEABILITY, W ATHERINGOWERS PER EABILITYNO RESISTI ITY.
~---I--.. _._- - -_. _-
R SISTIVI Y
-- -- ~t~ ---:;; ;~~~"-+-----+----1--H~~VY T BERCLES
--'
so
~ - ---·-1·-- -.·~"';:::-~~==:::=.-t
HAR
CLINKERS
PAHOEHOE
r====~~=~PUKAPUKA
ERY DENSE
16SN
SPON ANEOUS POTEN IAL:r J.Q!l
1-----+----1ii:!!!!~...-&Ir+-------1400
DENSE
- - .._ ---- -- - - --'-- - - --'-- - - ---'
FIGURE 16. CORRELATION OF ELECTRIC LOGS, DRILLER'S LOGS AND PHOTOLOG OF WELL 128E, KALIHI, OAHU.

64
CONCLUSIONS AND RECOMMENDATIONS
Conclusions
The problems of geophysical well logging, and in ~articular
electric well logging, in Hawaii are unusual because of the relatively
uniform composition of the basalts which constitute most of the aqui
fers and the complex relation of porosity to resistivity in basaltic
aquifers and because logging usually is performed in water-filled
boreholes.
Spontaneous potentials in local rocks are thought to result
from electrochemical reactions and from fluid flow and probably pri
marily from the latter because of the uniformity of rock composition
and the water-filled condition of the wells. Consequently, in Hawaiian
basalts, positive SP's generally indicate zones with flow from the
aquifer into the well. Negative SP's generally indicate the reverse
condition, or zones with flow from the well into the aquifer. Spon
taneous potential logs from wells in sedimentary formations commonly
are used to locate permeable zones and to estimate formation water
quality. In Hawaii, however, owing to the lack of chemical contrast
in the rocks and because the fluid conductivity module measures water
quality directly, SP logs are used primarily for correlation with re
sistivity, conductivity, and caliper logs.
The elaborate and sophisticated methods devised for the quanti
tative interpretation of formation resistivity logs in oil wells and
in water wells in sedimentary rocks are generally not applicable in
Hawaii . Furthermore, in Hawaii many of the devices such as neutron
logs and borehole flow logs, which might have made the resistivity
interpretation more quantitative, were not available to this investi
gation. Where logging does produce good results, the circumstances
of water-filled wells and an imperfect knowledge of formation resis
tivity factors for Hawaiian basalts prevent the successful application
of standard resistivity interpretation techniques for quantitatively
reliable determination of porosity at present. Nevertheless, resistivity
logging produced much important qualitative information and some quan
titative informati~n; Successful resistivity logging in Hawaii probably
is due to a favorable ratio of resistivities of formation water to
65
formation resistivity.
Electric logging and the other geophysical well-logging techniques
tested in Hawaii in this study supplied much of the desirable geologic,
hydrologic, and geometric information discussed in the section of this
report on "Types of Well-Log Information in Hawaii." As indicated
earlier, the geologic information desired from logging consists primar
ily of identifying rock characteristics and types. Both SP logs and
resistivity logs from the few wells in Hawaiian sedimentary formations
yielded useful information. Spontaneous potential logs commonly indicatepermeable zones and resistivity logs are useful indicators of rock
types and other rock characteristics. Resistivity logs from wells in
basaltic aquifers indicate the location and thickness of each bed and
the number and total thicknesses of permeable and less permeable for
mations and are extremely useful as indicators of water-yielding zones.
High resistivities generally are indicative of dense impermeable ba
salts and low resistivities are indicative of porous permeable zones
most likely to contribute water to the borehole. The highly variable
thickness and lateral extent of individual lava flows, which results
from topographic control, hampers correlation of the logs except where
the wells are close together.
None of the electric logging techniques employed in this study
can provide positive identification of rock types. H0wever, the bore
hole photography used recently by the Honolulu Board of Water Supply
provides identification of most Hawaiian rock types.
Hydrologic information desired from logging consists of measure
ments of rock porosity and permeability, head, flow velocity, water
salinity or conductivity, and water temperature. Thus far, electric
well logging and other geophysical well-logging methods employed in
Hawaii have not provided quantitative measurements of rock porosity
and permeability. However, as indicated above, considerable qualitative
information on water yield from Hawaiian basalts is provided .by resis
tivity logging. Quantitative estimation of porosities might be made
possible by the use of computed correction curves for the diameter of
and fluid-conductivity in the wells and should be facilitated by the
addition of a radioactive logging capability.
Conductivity and temperature logs give a direct quantitative mea
sure of water conductivity and water temperature, and provide considerable
66
insight into the depth, thickness, quality, and temperature of waters
contained in the wells of Hawaii. Furthermore, borehole conductivity
and temperature data aid in the interpretation of complex dynamic
Ghyben-Herzberg lens relationships.
Few reliable measurements of head, and no quantitative measure
ments of flow velocity were made during this study. It is hoped that
future addition of a borehole flow-meter will provide measurement of
flow velocity for use in quantitative estimates of water yields. Fur
thermore, calip~r logging will enable the detection of sections of
the borehole wall suitable for sealing with packers for possible head
determinations.
Geome~ric information desired from logging consists primarily
of measurements of well diameter as well as depth to the water and
dep-ch of the casing and the hole. Although the caliper module has
not performed as well as expected and has been subjec-c to non-lin
earity of readout and instability and frequent repairs, caliper
logs give a direct quantative measure of well diameter. Recent
alterations of the caliper module's design should allow the device
to perform to its expected capability. Spontaneous potential and
resistivity logs also provide direc~ measurements of depth to the
water and depth of the casing and the hole.
Recommendations
In general, the goals of the well-logging program have been
successfully met and the usefulness of the electric logging equipment
in the study of Hawaiian aquifers has been affirmed over the past
two years. However, a number of suggested recommendations to improve
log~ing programs are listed below.
Equipment
1) Acquisition of a neutron module to allow determination of
formation bulk porosity in situ which presently is not
available from resistivity logs.
2) Addition of a borehole flow-meter unit to enable deter-
mination of velocities in well bores, and the location of
horizons contributing and receiving water, as well as the
location of leaky casings.
3) Conversion of the winch from mechanical to hydraulic drive
to provide more efficient logging operations.
4) Periodic updating of the basic logging equipment to offset
the decrease in reliability with age and to take advantage
of advancements in the field of well logging by the purchase
of new systems.
67
Logging
1)
Programs
Computer-calculated
diameters should be
correction curves for different well
prepared for each resistivity logging
sonde.
2) On future wells penetrating to salt water, consideration
should be given to experimenting with drilling-mud makeup
to obtain better logs.
3) Key wells should be monitored periodically for seasonal
and long-term changes of salinity and temperature to pro
vide greater understanding of the Ghyben-Herzberg lens
(this program has already been initiated by the Honolulu
Board of Water Supply) .
4) The necessary chemical analytical data should be compiled
so that departure curves can be made for the relationship
of specific conductance to total dissolved solids in the
various hydrologic units of Oahu.
5) Logs of wells drilled on other islands of the state should
be obtained whenever possible.
6) Personnel from all interested agencies should be trained
in the use of well-logging equipment to increase the man
power pool.

68
ACKNOWLEDGEMENTS
The authors wish to express their grateful appreciation and
acknowledgements to the following people and agencies for having made
possible this study.
L. S. Lau, Associate Director of the Water Resources Research
Center, provided general guidance to the project, especially in the
period from August 1966 to August 1967, when D. C. Cox was on sabbat
ical leave, and was instrumental in obtaining funds for the second
year of the project.
The Honolulu Board of Water Supply provided financial support
and active field support to the well logging project. The late E. J.
Morgan, former manager of the BWS, and G. A. L. Yuen, his successor,
provided encouragement through their interest in logging capabilities.
S. P. Bowles, especially, assisted in the planning of the project,
and both he and C. M. Murata participated in much of the logging oper
ation. Glenn Masui and Joe Grance also assisted in logging. The
Board of Water Supply further complemented the logging project by a
program of down-hole photography the results of which are summarized
in this report.
The Hawaii Department of Land anoNatural Resources, Division
of Water and Land Development provided not only financial ·support, but
thanks to the interest of its Manager, R.T. Chuck, DOWALD also pro
vided field assistance. Dan Lum, Harvey Young, and Stanley Shin as
sisted in logging DOWALD wells on Oahu, and Richard Teragawa assisted
in logging DOWALD wells on Kauai and arranged for pickup and reshipment
of the logging jeep.
Robert Dale and Isao Yamashiro of the U. S. Geolo gical Survey
provided assistance in logging some of the wells on Oahu.
The Kauai Board of Water Supply, especially Manager Walter Briant
and Deputy Manager Larry Nisnikawa made arrangements for logging of
irrigation wells on Kekaha and Lihue plantations on Kauai.
The Craddick brothers, managers of the local division of Layne
International, cooperated by allowing WRRC to fit logging into their
otherwise tight well-drilling schedules. The local division of Roscoe
Moss Company also cooperated similarly. Owners of agricultural wells
on both Kauai and Oahu cooperated by arranging for access to their wells.

Graduate assistants G. T. Bandy, Tsegaye Hailu, and Melvin
Caskey frequently assisted in logging, and Mr. Bandy and Mr. Hailu
learned to operate the logger.
Paul H. Jones, well-logging expert of the U. S. Geological Sur
vey, Baton Rouge Office, provided much appreciated encouragement and
supplied several technical papers.
69

70
BIBLIOGRAPHY
Anonymous. undated. Log-master instruction manuaZ. Log-Master Services Inc. Enid, Oklahoma.
Anonymous. 1958.ment No.8 .
Introduction to Sohl.umberqer ioel.l: Zogging.Schlumberger Well Surveying Corporation.
Docu-
Anonymous . 1961. Peineip Lee and appl.icacione of eLeota-io weU Zogging.Electro-Technical Laboratories. Mandrel Industries Inc. Houston,Texas.
Anonymous. 1962. Log interpretation charts. Schlumberger Well Surveying Corporation.
Anonymous. 1963. Water finder technique. Mandrel Industries~ Inc. Houston, Texas.
Cox, D. C. 1954. Shape of the mixing curve in a Ghyben-Hergberg Zens.29th Annual Meeting. Hawaiian Academy of Sciences Proceedings.p. 9-10.
Cox, D. C. 1965. Bl-eetx-io iael.l: Zogging parameters and equipment.Memorandum Report No.1. Water Resources Research Center. University of Hawaii. 8 p.
Cox, D. C., and C. Lao. 1967. DeveZopment of deep monitoring stationin the Pearl: Harbor ground water area on Oahu. Technical ReportNo.4. Water Resources Research Center. University of Hawaii.34 p.
Cox, D. C., F. L. Peterson, W. M. Adams, C. Lao, J. F. Campbell, andR. D. Huber. 1969. CoastaZ evidences of ground water conditionsin the vicinity of AnaehoomaZu and Ialami lo, South Kohala , Hawaii.Technical Report No. 24. Water Resources Research Center. University of Hawaii. 53 p.
Davis, S. N., and R. J. M. DeWiest. 1966. Hydrogeology. John Wileyand Sons. 463 p.
Guyod, H. 1952. Electric well logging fUndamentaZs. Houston, Texas.164 p.
Guyod, H. 1954. "Electrical well logging." Advance print for articles IN Science of Petroleum. Vol. VI, Part 2. Oxford University Press .
Guyod, H. 1957. "Electric detective, investigation of ground watersupplies with electric logs. Water WeZZ JournaZ. March volume.
Guyod, H. 1965. Interpretation of el.eotx-io Loqe and gamma ray 'logsin water wells. Mandrel Industries, Inc. Houston, Texas. 36 p.

71
Hummel, J. N., and O. Ruike. 1937. "Oer einflub der dickspulung anfden scheinbaren spezifischen widerstand." Beit r . Angew. Geophys.Vol. 6, No.3. pp. 265- 270.
Hussong, O. M., and O. C. Cox. 1967. Es timati on of ground water configuration near> Pahala~ Hawaii using el ectri cal resistivitytechniques. Technical Report No. 17. Water Resources ResearchCenter. University of Hawaii. 35 p.
Jones, P. H., and T. B. Burford. 1951. "Electrical logging appliedto ground water exploration." Geophysics. Vol. 16, No. 1.
Keller, G. V. 1967. Electro-magnetic methods. Five seminars atUniversity of Hawaii.
Lao, C. 1967. Electric well logging of Oahu~ progress report.orandum Report No. 10. Water Resources Research Center.versity of Hawaii. 7 p.
MemUni-
Lau; L. S. 1960. Laboratory inves tigati on of sea wat er i ntrusion intogroundwater aquifers. Honolulu Board of Water Supply. 91 p.
Lau, L. S. 1962. Water development of Kalauao basal springs - hydraulicmodel studies. Honolulu Board of Water Supply. 102 p.
Lau, L. S. 1967. Dynamic and static studi es of seawater i nt rus i on.Technical Report No.3. Water Resources Research Center. University of Hawaii . 31 p.
Lau, L. S. 1967. Seawater encroachment in Hawaiian Ghyben-Herzbergsystems. Proceedings of the National Symposium on Ground-WaterHydrology. San Francisco, California.
Lynch, E. J. 1962. For>mation eva luat ion. Harper and Row. 422 p.
Macdonald, G. A., D. A. Davis, and O. C. Cox. 1960. Geology andground wat er resources of the island of Kauai, Hawaii. BulletinNo. 13. Hawaii Division of Hydrography.
McCombs, J. 1928. Met hods of exp lor i ng and repairing leaky ar>tesianwells on the island of Oahu~ Hawaii. U. S. Geol . Surv. WaterSupply Paper 596-A.
Palmer, H. S. 1927. The geology of t he Honolulu ar>tesian system.Report to the Legislature of the Territory of Hawaii. HonoluluSewer and Water Commiss ion. 68 p.
Patten, E. P., and G. O. Bennett . 1963. Application of electricaland radioactive well l ogging to ground water hydrology. u. S.Geol. Surv. Water Supply Paper 1544-0.
Pirson, S. J . 1957. Format i on evaluation by log i nterpret ation. Reprinted from World Oil.

72
Pirson, S. J. 1963. Handbook of weLL Log anaLysis. Prentice Hall.326 p.
Stearns, H. T., and K. N. Vaksvik . 1935. GeoLogy and ground waterresources of the isLand of Oahu~ Hawaii. Bulletin No.1. HawaiiDivision of Hydrography. 479 p .
Stearns, H. T., and K. N. Vaksvik. 1938. Records of the driLLed weLLson the isLand of Oahu~ Hawaii. Bulletin No.4. Hawaii Divisionof Hydrography. 213 p.
Stearns, H. T.Hawaii.
1939. GeoLogic map and guide of the isLand of Oahu~
Bulletin No.2. Hawaii Division of Hydrography. 75 p.
Stearns, H. T. 1940. SuppLement for the geoLogy and ground water resources of the isLand of Oahu~ Hawaii. Bulletin No.5. HawaiiDivision of Hydrography. 164 p.
Stearns, H. T., and G. A. Macdonald. 1942. GeoLogy and ground waterresources of Maui~ Hawaii. Bulletin No.7. Hawaii Divisionof Hydrography. 344 p.
Stearns, H. T., and G. A. Macdonald. 1946. GeoLogy and ground waterresources of the isLand of Hawaii. Bulletin No.9. Hawaii Division of Hydrography. 363 p.
Stearns, H. T., and G. A. Macdonald. 1947. GeoLogy and ground waterresources of the isLand of MoLokai~ Hawaii. Bulletin No. 11.Hawaii Division of Hydrography. 113 p.
Turcan, A. N. 1966. CaLcuLation of water quaLity from eLectricaL Logstheory and practice. Water Resources Pamphlet No. 19.. Department of Conservation, Louisiana Geological Survey and Departmentof Public Works . Baton Rouge, Louisiana.
Visher, F. N., and J. F. Mink. 1964. Ground water resources of southern Oahu~ Hawaii. U. S. Geol. Surv. Water Supply Paper 1778.133 p.
Wentworth, C. K. 1938. GeoLogy and ground water resources of thePaLoLo-WaiaLae district. Unpublished report. Honolulu Boardof Water Supply. 274 p.
Wentworth, C. K. 1939. The specific gravity of sea water and GhybenHerzberg ratio at HonoLuLu. University of Hawaii Bulletin.Vol. 18, No.8 .
Wentworth, C. K. 1940.Manoa-Makiki area.Supply. 150 p.
GeoLogy and ground water resources of theUnpublished report. Honolulu Board of Water
Wentworth, C. K. 1941. GeoLogy and ground water resources of the EaLihiarea. Unpublished report. Honolulu Board of Water Supply.137 p.

Wentworth, C. K. 1941.Nuuanu-Pauoa area.Supply. 223 p.
73
Geology and ground water resources of theUnpublished report. Honolulu Board of Water
Wentworth, C. K. 1942. Geology and ground water resources of theMoanalua-Halawa area. Unpublished report. Honolulu Board ofWater Supply. 156 p.
Wentworth, C. K. 1945.Pearl Harbor area.Supply. 181 p.
Geology and ground water resources of theUnpublished report. Honolulu Board of Water
Wentworth, C. K. 1951. Geology and ground water resources of theHonolulu-Pearl Harbor area3 Oahu. Unpublished report. HonoluluBoard of Water Supply. III p.
Whitman, H. M. 1965. Estimatingin southwestern3 Louisiana.Department of Conservation,Department of Public Works.
water quality from electrical logsWater Resources Pamphlet No. 16.
Louisiana Geological Survey andBaton Rouge, Louisiana.
Zohdy, A. A. R. 1966. Preliminary report in the resistivity methodon the islands of Oahu and Hawaii3 Hawaii. Open file report.u. S. Geol. Surv. 42 p.


APPENDICES


APPENDIX A. LOCATION MAPS OF WELLS LOGGED
ON OAHU AND KAUAI

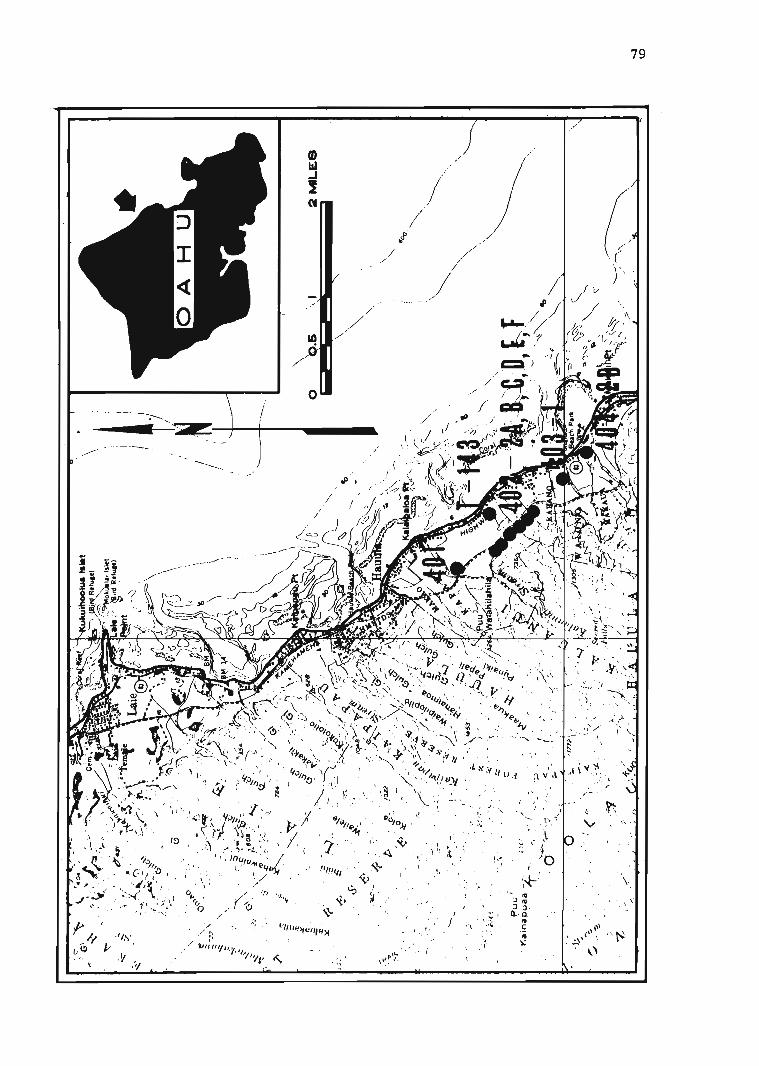
79
"
\ .
, "
~ ~/. ~ . -
( -.,
" , ~
, -
. ~,
. \. ; . . ~. '.
.\\ (\'
.' -*" '.
.. ~:-. :~.~'--- r: :.'
~
,,~ ~.f
" ,, .I ', .
, "--.. ~:'" ~• " : I
1.. I
.. ". ~ . J .!.... .. " .. ,....."
,....
I
". \. , . ~ ·.:i
" . j
I t , '
/
I,
j' ,} {/;
/ /./ /
.(
,I )'-_.- J / 1/
/ ' .
..~, )
/
' .. ,.
/
o
-----..
·Y •,,/
~ ' - " ' ---- .
----'-.--.--=-••1-' .....:.;,,~---j-t/_---,-_-.

80
~"".h.. ,- ..• It11"• •t l!!ll:
10~ 0,..It
? -{e, 0 ~
}'t ~~...!i
~ ~ n-o - r.
~t~... ?oe:>
~
~./.~ .
. .. -: I I I
r; .' . : ., •~

2MILES
00......
~
. :".: ~~.
-eS
-c' J
CJ~
'/~7
. '''"
-e,e.....
.~
~: .'
?-
aauCrat er #
$- ..,. ~"
"<, .-K 0 '-~
, 0
#~~$'
'".... ,'l;'"
~ V rrca.....,.
o
-.' l~: " -~t.. 9ZrrlP~ <"... ~-- -
...;'J . ,' '-'
..-:: '" .,.o ,,(i-'~ .
. -/:/::: ~...~~ ..~,," ../ '#
,-: ?fV' ~.,) 1'1-" t::i -: ...".~#.;/) , .:::- e. ' tlI
;- ,.,' (.-::- ~~ I!S '
.....G J,~ . ; ' • -<-~'3 ts\ , ~ •.~ : "
'4.7 I . -: . , .. . ;)e(""-''- ~i<,~ C;-~ 1>~~i,'~' . ..;>- 0
•.,#.~~ .:s-'. " -.:. ~_ ...1>'S " . . - . 1\ '
_ 0 ' "" \\O~Q1."Wi-o!, ~!p..,... :;~ , o-: I4J-ss»
,~-."" s ", : 115 :~i ''./ ' .
.~:
":. ~
1,.. / ':/~
Flats'?-
I ,~ __O.6
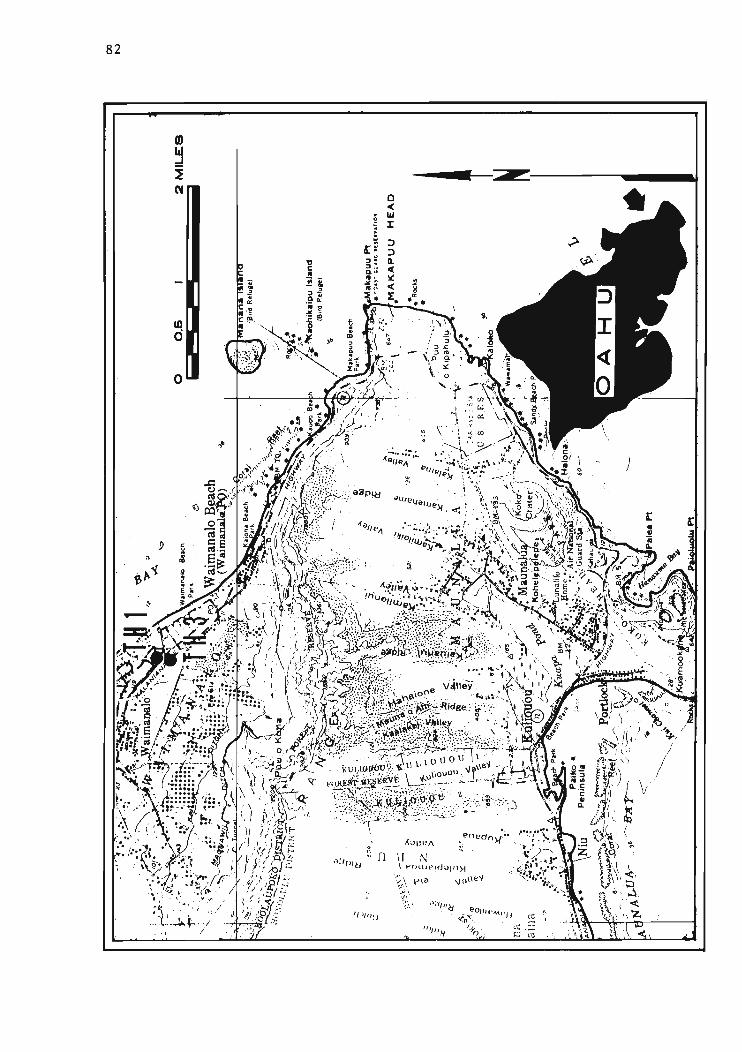
82
)
•------~.--- ...l
o
10o
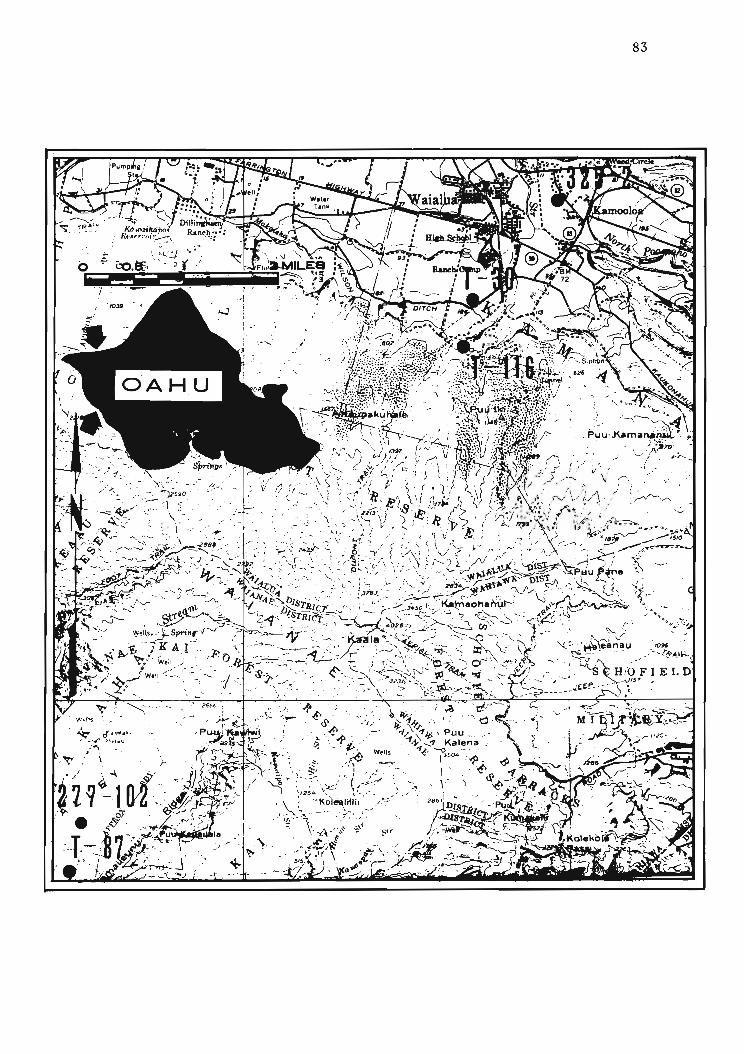
83

00~
II'.
' : '.... ,
, ,Be-row p·t '
0.5-- ----rt3u~~1:":: '"0

../~
:.e~
00VI
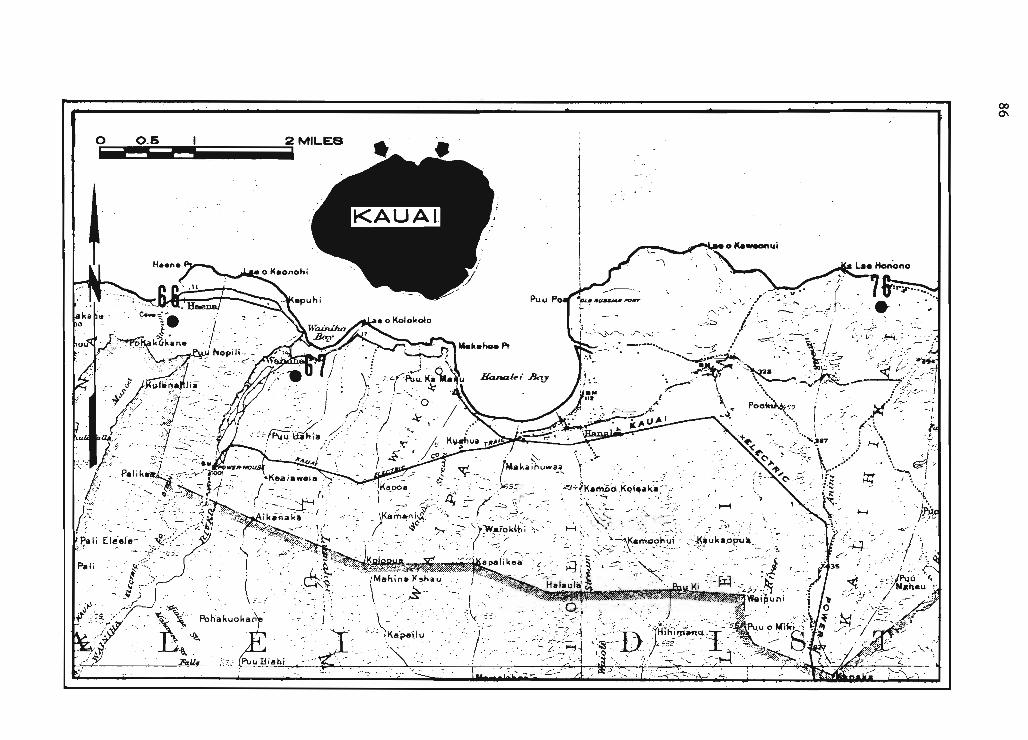
000\
---- -
~
~~>.:~~~ --.--;.
.~JHr~.~'"
1 - - ~ ,i' - " /-,:~' . • "• _ "-IV,", J - ' - .•• •• • ;::, /
,." .C _:::':,.. <c::« / J/ .z.. .. ;..; . .• .....::..".:;:.<1:- <::.1fu: { ..;' " .H'. ~~ :. . s. , • £ .;='''' ) .i .. . ..
•.- ' ~"28 ' • . ~; . :::::: . ~ ." , ':' ".r. . \~ '~- " '" . 1-:=..·· / : .. .;
\
.... . _ ;,. .Y" '-' v / :' ' ..' " .' I · - •...! -~----.
~~., ..Poo~ ,~ : '. i :J:~.-=-- . I• v - " . r ' . ' u " ;'.,,; ..
"; ... ...\ ./ ;r -"r:- . •tI"1 <:
.. .... ! /:~ ..
"_/ .:""~87 ' j .... f.t t' ~ . ".:L \ l '"-i \ .:" .;.. .- ,- .~...., :.. r;!";,...' \\.... . . ' '.~ If.. .. tx; "-' I ~
.- . I ~. J
·····i•.[;;"tI~?t
' ;/ },
: : ~i~j+'·- &- .. ""'".. ... . ..-:' -; <..~
. 7.. ... ~ .::::-
. ~~: .....
': ' I"~.' ,..,
2MILEB0 .5o
" ,,'" .rau.r : , »
. -_ . - .Hic.- . "
~. '
, r';f'~~Ke lc=tk·a n. - l-....~..:~~Nopi" - . :
, 'j,;'Wl.'C ,'~ ~
1,47)lg{
,, :~ ~{r . S" ;"' :' - '~' -' k-, A;;';·~~l ilc~~~'~:~iOO\ ~':""
l ·.· · c<;tt~I> ( .:; S'j,. . ' .__ <-. _ ' I~~k.na ka ' · /t~r [I ' ~ - '~: ,;: . r' :--c. '~ ·r ,. . (.~" ?~ '• •, I . ~ee.: ;?~~~;; :.,_', , ~' . \ ~ .~ _ "~:~:..; . ~ ,Pa l; . . ' 11 <" I "
. ~ '} r\J ..~:' : ~:. \ . .r: " ". ,,~, ... . ,'.:~ ' .~ • " . r : .r:';
~'~' :.,,:.j/ '-' - "'-D" X" Pohakuoka~ -
,:~. : ... . ~ .~'?/ . ' '. '-l!. -

.!•-'"o;)
••.....
• ~ ------..-_-
10o
87

88
-_.•~~,---~--~(/JW.J
sN
10o
o
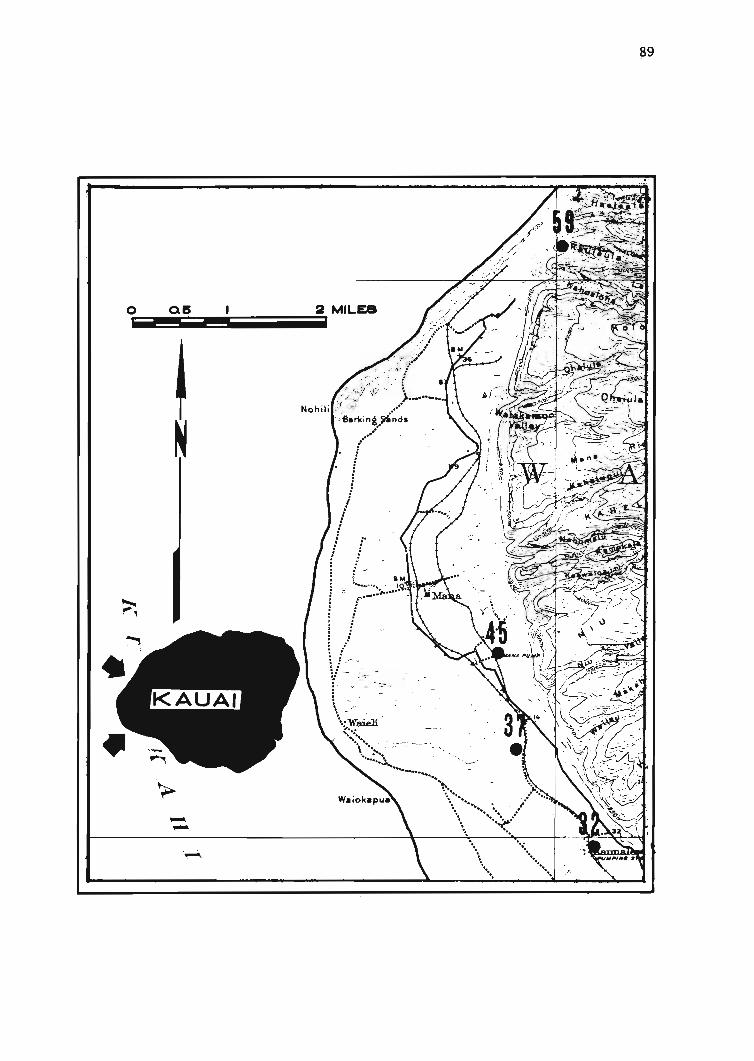
---- -o 05
-~.
2 MIL.ES
""~
"....."':"
" " "". .',
89

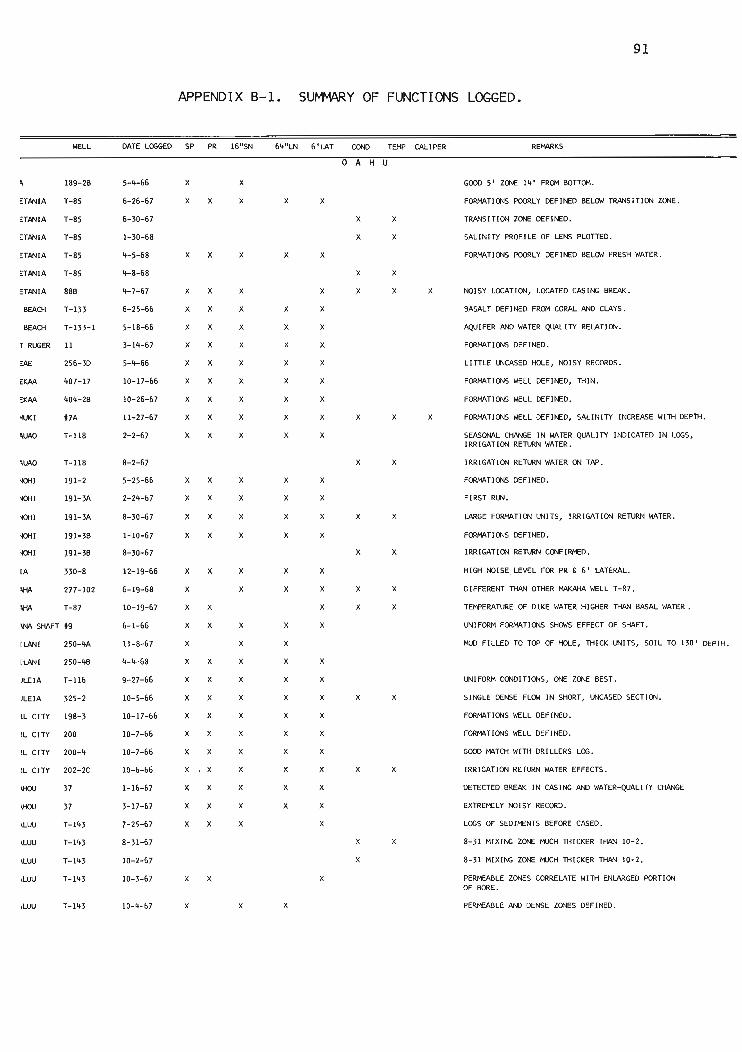
91
APPENDIX 8-1. SUMMARY OF FUNCTIONS LOGGED.
WELL DATE LOGGED SP PR 16"SN 64"LN 6 'LAT COND TEMP CALIPER REMARKS
o A H U
BEACH T-13 3
BEACH T-133-1
r RUGER 11
OAE 256- 30
EKAA 407-17
oKAA 404-2B
NOISY LOCATION, LOCATED CASING BREAK.
BASALT DEFINED FRQ'I CORAL AND CLAYS.
AQU I FER AND WATER QUALITY RELATION .
FORMATI ONS DEFINED .
LITTLE UNCASED HOLE, NOISY RECORDS .
FORMATIONS WELL DEFINED, THIN.
FORMATIONS WELL DEFINED.
TRANS ITION ZONE DEFINED.
SALINITY PROFILE OF LENS PLOTTED .
FORMATIONS POORLY DEFINED BELOW TRANSITION ZONE.
FORMATIONS POORLY DEFINED BELOW FRESH WATER .
GOOD 5 ' ZONE 14' FRQ'I BDTTQ'I .
x
x
x
x
x
x
x
x
x
x
x
x
x
x
x
x
x
xx
x
x
x
x
x
x
x
x
x
x
x
x
x
x
x
x
x
x
x
x
x
x
x
x
x
x
x
x
x
x
x
x
x
x
x
x5-4-66
6-26-67
6-30-67
1-30-68
4-5-68
4-8-68
4-7-67
6-25-66
5-18-66
3-14-67
5-4-66
10-26-67
10-17-66
T-85
T-85
88B
T-85
T-85
189-2B
T-85
oTANI A
oTANIA
oTANIA
oTANIA
oTANIA
oTANIA
"IJKl
~UAD
*7A
T-118
11-27-67
2-2-67
x
x
x
x
x
x
x
x
x
x
x x x FORMATIONS WELL DEFINED, SALINITY INCREASE WITH DEPTH.
SEASONAL CHANGE IN WATER QUALITY INDICATED IN LOGS,IRRIGATION RETURN WATER .
~UAD
'lCti1
'lCti1
'lCti1
T-118
191-2
191-3A
191-3A
8- 2- 67
5-25-66
2-24-67
8-30-67
x
x
x
x
x
x
x
x
x
x
x
x
x
x
x
x
x
x
x
IRRIGATION RETURN WATER ON TAP.
FORMATIONS DEFINED.
FIRST RUN.
LARGE FORMATION UNITS, IRRIGATION RETURN WATER.
'lCti1
'lCti1
191-3B
191-3B
1-10-67
8-30-67
x x x x x
x x
FORMATIONS DEFINED .
I RRIGATI ON RET\,RN CONFI Rl-'ED.
IA 330-8 12-19-66 x x x x x HIGH NOISE LEVEL FOR PR s 6' LATERAL .
\HA
\HA
277- 102
T-87
6-19-68
10-19-67
x
x x
x x x
x
x
x
x
x
DIFFERENT THAN OTHER MAKAHA WELL T- 87 .
TEMPERATURE OF 0 IKE WATER HIGHER THAN BASAL WATER •
INA SHAFT *9 6-1-66 x x x x x UNIFORM FORMATIONS SHOWS EFFECT OF SHAFT.
~L CITY 198-3
[LANI
[LANI
JLEIA
JLEIA
250-4A
250-4B
T-116
325-2
11-8-67
4-4-68
9- 27-66
10-5-66
10-17-66
x
x
x
x
x
x
x
x
x
x
x
x
x
x
x
x
x
x
x
x
x
x
x
x x
MUD FILLED TO TOP OF HOLE, THICK UNITS, SOIL TO 130 ' DEPTH .
UNIFORM CONDITIONS, ONE ZONE BEST .
SINGLE DENSE FLOW IN SHORT, UNCASED SECTION .
FORMATIONS WELL DEFINED.
~L CITY 200
u, CITY 200-4
u, CITY 202- 2C
10-7-66
10-7-66
10-6-66
x
x
x
x
x
x
x
x
x
x
x
x
x
x
x x x
FORMATIONS WELL DEFINED .
GOOD MATCH WITH DRILLERS LOG.
IRRIGATION RETURN WATER EFFECTS .
\HOU
\HOU
\LUU
\LUU
\LUU
37
37
T-143
T-143
T-143
T-143
1-16-67
3-1 7-67
7-25-67
8-31-67
10-2-67
10-3-67
x
x
x
x
x
x
x
x
x
x
x
x
x
x
x
x
x
x
x
x
DETECTED BREAK IN CASING AND WATER-QUALITY CHANGE
EXTREMELY NOISY RECORD.
LOGS OF SEDIMENTS BEFORE CASED .
8-31 MIXING ZONE MUCH THICKER THAN 10-2.
8-31 MIXING ZONE MJeH THICKER THAN 10-2 .
PERMEABLE ZONES CORRELATE WITH ENLARGED PORTIONOF BORE .
,LUU T-143 10-4-67 x x x PERMEABLE AND DENSE ZONES DEFINED.
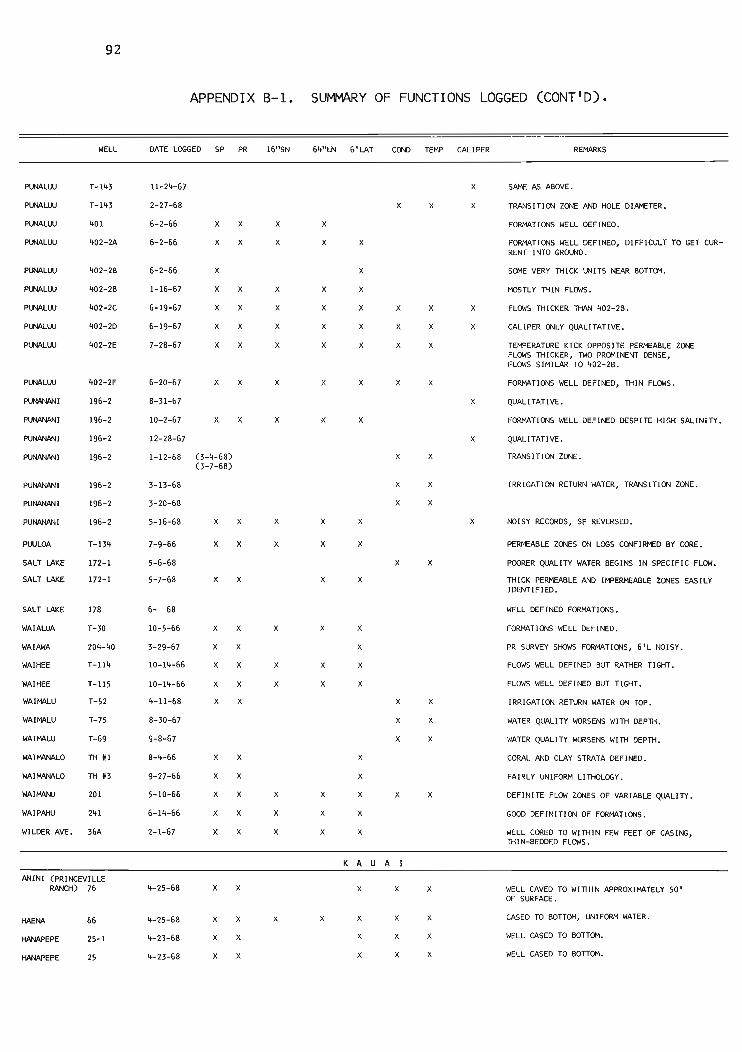
92
APPENDIX B-1. SUMMARY OF FUNCTIONS LOGGED (CONT'D).
WELL DATE LOGGED SP PR 16"SN 64"LN 6'LAT COND TEMP CALI PER REMARKS
PU'lALW
Pll'lALW
Pll'lALW
Pll'lALUU
PUNALW
Pll'lALW
Pll'lALW
Pll'lALW
Pll'lALW
T-143
T-143
401
402-2A
402-2B
402-2B
402-2C
402-2D
402-2E
11-24-67
2-27-68
6-2-66
6-2-66
6-2-66
1-16-67
6-19-67
6-19-67
7-28-67
x
x
x
x
x
x
x
x
x
x
x
x
x
X
X
X
X
X
X
X
X
X
X
X
X
X
X
X
X
X
X
X
X
X
X
X
X
X
X
x
X
X
X
SAME AS ABOVE.
TRANS ITI ON ZONE AND HOLE DIA'lETER •
FORMATIONS WELL DEFINED.
FORMATIONS WELL DEFINED, DIFFICULT TO GET CURRENT INTO GRQU\lD.
SOME VERY THICK l-NITS NEAR BOTTOM.
MOSTLY THIN FLOWS .
FLOWS THICKER THAN 402-2B .
CALIPER ONLY QUALITATIVE.
TEMPERATURE KICK OPPOSITE PERMEABLE ZONEFLOWS THICKER, TWO PROMINENT DENSE ,FLOWS SIMILAR TO 402-2B.
x
x
Pll'lALW
Pll'lANAN1
Pll'lANAN1
PUNANANI
PUNANANI
402-2F
196-2
196-2
196-2
196-2
6-20-67
8-31-67
10-2-67
12-28-67
1-12-68 0-4-68)0 -7- 68)
x
x
X
X
X
x
X
X
X
X
X
X
X
X
FORMATIONS WELL DEFINED, THIN FLOWS .
QUALITATIVE.
FORMATIONS WELL DEFINED DESPITE HIGH SALINITY.
QUALITATIVE.
TRANSITI ON ZONE.
WA IPAHU 241
WILDER AVE. 36A
PUNANANI
PUNANANI
PUNANAN I
PWLOA
SALT LAKE
SALT LAKE
SALT LAKE
WAIALUA
WAIAWA
WAIHEE
WAIHEE
WAIMALU
WAIMALU
WAlMALU
WAIMANALO
WAIMANALO
WAIMANU
196- 2
196-2
196-2
T-134
172-1
172-1
178
T-30
204-40
T-114
T-115
T-52
T-75
T-69
THU
TH 13
201
3-13-68
3-20- 68
5-16-68
7-9-66
5-6-68
5-7-68
6- 68
10-5-66
3-29-67
10-14-66
10-14-66
4-11-68
8-30-67
9-8-67
8-4-66
9-27-66
5-10-66
6-14-66
2-1-67
x
x
x
x
x
x
x
x
x
x
x
x
x
x
x
x
x
x
x
x
X
X
X
X
X
X
X
X
X
X
X
X
X
X
X
X
X
X
X
X
X
X
X
x
X
X
X
X
X
X
X
X
X
X
X
X
X
X
X
X
X
X
X
X
X
X
X
X
X
X
I RR IGATION RETURN WATER, TRANS IT ION ZONE.
NOISY RECORDS, SP REVERSED.
PERMEABLE ZONES ON LOGS CONFIRMED BY CORE.
POORER QUALITY WATER BEGINS IN SPECIFIC FLOW.
THICK PERMEABLE AND IMPERMEABLE ZONES EAS I LYIDENTIFIED.
WELL DEFINED FORMATIONS.
FORMATIONS WELL DEFINED.
PR SURVEY SHOWS FORMATIONS, 6 'L NOISY .
FLOWS WELL DEFINED BUT RATHER TIGHT .
FLOWS WELL DEFINED BUT TIGHT.
IRRIGATION RETURN WATER ON TOP.
WATER QUALITY WORSENS WITH DEPTH .
WATER QUALITY WORSENS WITH DEPTH.
CORAL AND CLAY STRATA DEFINED.
FAIRLY UNIFORM LITHOLOGY.
DEFINITE FLOW ZONES OF VARIABLE QUALITY .
GOOD DEFINITION OF FORMATIONS .
WELL CORED TO WITHIN FEW FEET OF CASING,THI N-BEDDED FLOWS .
K A U A I
ANINI (PRINCEVILLERANCH) 76 .....25-68 X X X X X WELL CAVED TO WITHIN APPROXIMATELY 50'
OF SURFACE .
HAENA
HANAPEPE
HANAPEPE
66
25-1
25
4-25-68
4-23-68
4-23-68
X
X
X
X
X
X
X X X
X
X
X
X
X
X
X
X
CASED TO BOTTOM, UNIFORM WATER .
WELL CASED TO BOTTOM .
WELL CASED TO BOTTOM.

93
APPENDIX s-r. SU~Y OF FUNCTIONS LOGGED (CONT'D).
WELL ""'IT. LOGGeD SP PR 16"S N 64" LN &'LAT CON:> TE/oP CALIPER REMARKS
KALEPA 10 4-22- 68 X X X X X X X LOGS SHO</ WATER FR~ BOTT~ 10 '.
KAUNALEWA 32 4- 2&- 68 X X X X X
KEKAHA 37 4-2&-&8 X X X X X X X
KEKAHA 45 4-2&-&8 X X OBSTRUCTED CASlf11:; AT 33'.
POLIKULE 59 9- &7 X X X X X CASED IlEARLY TO BOTT~ SHO.</ED SLI GHTLY SALTl ERWATER AT BOTT~.
WAILUA 8-1 9-25-67 X X X X X X X LOCATED RETURN l RRIGATlON WATER, RECa+Et-llEDSEALIfII:; HORI ZON.
WAII-EA 2& 9- &7 X X X X X
WAI NIHA 67 4-2&-&8 X X X X X X X SMALL, SHARP INCREASE OF SALINITY NEAR BOTT~.

94
APPENDIX B-2. SUMMARY OF SP'S, APPARENT RESISTIVITIES, CONDUCTIVITIES,AND TEMPERATURES MEASURED.
RESI STIVITY (IN CtM'E TERS)
AlEA
WELL LOCATI(»l
189- 2B
SP" PR 16" SN 64" LN
o A H U
6' LSPECIFIC C<NJUCTIV ITY
(IN MICR0411OS)TEW'ERATURE
(IN a c )
BERETANIA
BERETANIA
EWA BEACH
EWA BEACH
FORT RLGER
HOAEAE
IOLEKAA
IOLEKAA
KAIMJK I
KALAUAO
KAONOiI
KAONOi I
KAONOi I
KLN IA
MAKAHA
MAKAHA
MANANA SHAFT
MILILANI
MILI LAN I
MOKULEIA
MOKULEIA
PEARL CITY
PEARL CITY
PEARL CI TY
PEARL CITY
PUNAHOU
PUNALW
PUNALW
PUNALW
PUNALW
PUNALW
PUNALW
PUNALW
PUNALW
PLNANANI
PWLOA
SALT LAKE
T- 85
88B
T-133
T-1 33-1
11
256-30
407-17
404-2B
7A
T-11 8
191-2
191-3A
191-3 B
330- 8
277- 102
T- 87
450- 4A
450- 4B
T-116
325- 2
198-3
200
200-4
202- 2C
37
T-14 3
401
402- 2A
402- 2B
402- 2C
402-20
402-2 E
402-2F
196-2
T-134
172-1
70
125
100
20
130
40
180
200
100
250
25
95
200
10
65
45
30
7200
100
750
100
80
125
175
100
7200
85
75
440-480
610- 710
6 35- 775
390-405
290-515
730-910
700-970
80-3 80
585-690
500- ?
654- 745
775- 875
675- ?
700-810
665-685
735- 835
40-740
770-875
420-530
1000-1380
760-1000
890-11 40
950-1200
650- 695
590-620
550-630
545-580
225-3 00
350-530
450
400-455
325'-380
310-3 70
450-470
450-485
470-475
380- 560
375-420
60-280
235-245
480-490
495-515
460-510
465
310- 460
485-490
470
480- 525
445- ?
435-540
430-530
285- 485
485-495
305-430
390- 460
370
405-605
380- 395
325-375
385-430
370- 470
440-465
485- 540
465- 565
335-425
0-120
235- 275
475- ?
460-490
500-585
350- 595
485-495
340-435
58-595
425-525
485-?
430-520
475- 550
480-520
320-530
495-500
355-405
440-480
370
490-505
480-490
315-330
290-340
485-490
490- 495
470 - 475
460-480
250-390
410-?
315- 465
480-490
455-585
475-505
505-560
500-505
270-380
515-565
500 -530
500-505
500- 505
425-560
475-525
490-500
130-165
185-44,000
160- 200
13,000-31,500
265- 305
145- 240
125- 225
120- 225
475- 485
350- 370
290- 620
170-49,000
250- 480
195- 25
130- 140
220
260- 35, 000
650- 1,580
19.8-23 .6
21.5-22 .0
20.1-20.5
20.0-21. 3
19.8-21.5
19 .4-21.1
23 . 7- 23.8
25 . 1- 25.2
22.6-23.7
19.5-23. 3
21.0
20.0
19.0-19.7
18 .9-20 .3
20.0-24.1
20 .9-21.2
SALT LAKE 178
WAIALUA T-30 25 600-645 645-695 475-485 480-490
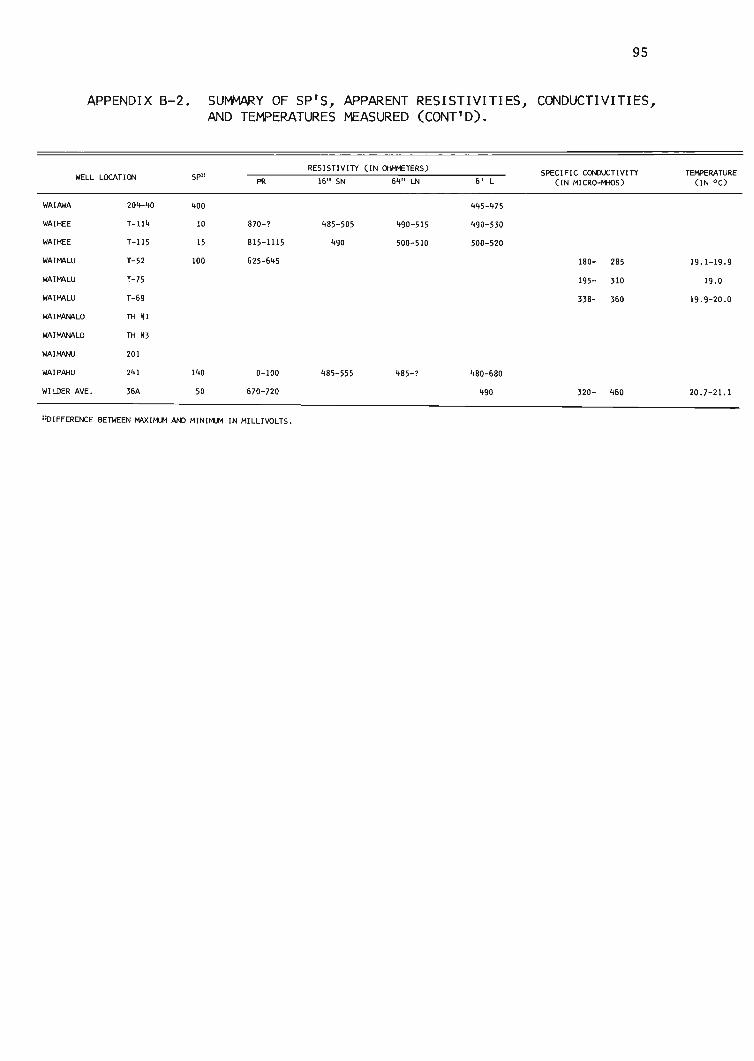
95
APPEND IX B-2. SUMMARY OF SP'S, APPARENT RESISTIVITIES, CONDUCTIVITIES,AND TEMPERATURES MEASURED (CONT'D) .
RESISTIVITY (IN CH"I'ETERS)SPECIFIC C<NXJCTlVITY TEMPERATUREWELL LOCATION SP" PR 16" SN 64" LN 6' L (IN MICRo-M-iOS) (IN ° C)
WAIAWA 204-40 400 445-475
WAI HEE T-1I4 10 870-? 485- 505 490-515 490- 530
WAIHEE T-1I5 15 81 5-1115 490 500-51 0 500-520
WAIMALU T-52 100 625 -645 180- 285 19 .1 -19.9
WAIMALU T- 75 195- 310 19. 0
WAIMALU T-69 338- 360 19.9-20.0
WAIMANALO THU
WA IMANALO THB
WA IMANU 201
WAIPAHU 241 140 0- 100 485-555 485- ? 480 - 680
WILDER AVE. 36A 50 670-720 490 320- 460 20 .7 - 21.1
" DIFFERENCE BETWEEN MAXIM...M AND MINIM...M IN MILLIVOLTS.


97
APPENDIX C. LIST OF EQUIPMENT
Item Description
Recorder
Depth MeasurementSystem
Hoist Unit
A. C. Generatoror
A. C. Alternator
Point ResistivityElectrode
6' Lateral Electrode
Cable ElectrodeAssembly
Caliper tool
Specific Conductanceand Temperature Sonde
Log-Master Model LMR-D dual-channel recorderand selector panel. Self-balancing potentiometric D. C. millivolt recorder. Simultaneous recording of spontaneous potentialand resistivity. Individual recording oftemperature, specific conductance, calipersurveys, and other logs .
Selsyn generator at cable hoist-head controlssynchronous motor-driven odometer and chartpaper system.
Log-Master ,Model LMH-15-POE. Drum drivenby an electric motor through gear reducerand variable speed transmission. Drumcapacity of 1500 feet of 3/16" O. D. stainless reverse laid 3-conductor cable. Quickchange cable head.
2500 watt, 115 VAC, 60 cycle gasoline-poweredgenerator.1250 watt, 115 VAC, 60 cycle gasoline-poweredalternator. Minimum recommended size.
Log-Master Model LME-2A. Used for SpontaneousPotential and Point Resistivity surveys.
Log-Master Model LME-2-LN. Used for SP-PRand 6' Lateral resistivity surveys.
Log-Master Model LME-2-CE. Used in conjunction with 6' Lateral electrode to obtain 16"Short Normal and 64" Long Normal resistivitysurveys.
Neltronic Instrument Corporation Model MO.3-arm borehole caliper measuring minimumdiameter of hole. Retractable arms.
Beckman Instruments Model DWSM-2. Deep wellsolubridge for Specific Conductance Surveysof water in well. Selectable ranges usingcell constants of 0.2, 2.0, and 20, temperature compensated output. Temperature recordedas separate but not simultaneuous function.


99
APPENDIX D. OPERATIONAL PROCEDURES
It is not the intent of this section to repeat information already
contained in the manufacturer's instruction manual for the logger. The
discussion will dwell on procedures that were found to facilitate logging
or to be necessary from local experience in Hawaii.
General Check-Out
A check of the recorder is always in order before commencing logging
to verify that the power h~okups and cable hookups are proper and the
recorder is operating and calibrated.
The selsyn sheave should be centered over the well to minimize
catching of the cable head or sonde on the walls of the bore and to
avoid problems brought about by eccentricity. In particular, failure
to center the caliper tool in the bore may result in erroneous readings.
All of the arms are linked together aud drive a single potentiometer.
If the sonde is eccentrically supported in the hole so that its weight
causes unequal compression of the arms, the diameter indicated by the
sonde is smaller than the actual well diameter .
In ,r es i s t i vi t y surveys, the use of a ground electrode is required.
In some situations the ground electrode may have to be shifted to obtain
the greatest signal -to-noise ratio. Usually, placement of the ground
close to the well casing produces the best results . If the water level
in the well can be r eached with the electrode, this usually is desirable.
In dry areas with very porous soils, difficulty may arise in keeping the
electrode immersed in fluid; therefore, an adequate supply of water must
be kept on hand. Experience has shown that pouring water on the elec
trode produces a dynamic potential which causes a change in the setting
of the base . To avoid this, enough water must poured into a hole to
last the duration of logging. A mud slurry can be used to retain water .
No ground electrode is needed to make caliper, temperature, or conducti
vity surveys as the signal voltage travels on a single wire and the
armored cable serves as ground.
In resistjvity logging, it may be difficult to establish and maintain
100
an adequate current through the ground. Certain geological conditions,
oil on the sondes, or a poor ground contact may cause the current, as
indicated on the meter, to drop below recommended values. If only the
6' lateral is affected, then the other logs probably will be satisfac
tory. If no current can be induced downhole, this is a certain indica
tion of an open circuit in the logging-line connections, usua~ly in the
cable head or the slip-ring assembly. If the recommended values of
current are not maintained, the range of current should be recorded be
cause the value of resistivity depends upon this current (VI - V2 =1
Ie T VA 1) 0 h ' h l'b .. l'd'~ or e = ~TIr' t erw1se, t e ca 1 rat10n 1S not va 1 , ~.e'J
one inch on the chart will not be 5, 10, 25, 50, or 100 ohmmeters. The
alternative is to select a given lower maintainable value of current and
refer back to the table in the manufacturer's manual for the particular
logging function being used. The indicated chart scales will then be
some constant proportion of the nominal value .
Safety Precautions
The following safety precautions especially should be observed when
operating the logging equipment:
1) The ground connection at the jumper cables should be double
checked when running conductivity, temperature, or caliper
surveys as high voltage is used to activate motors in these
devices. Unless a good connection to ground is obtained the
operator may suffer an uncomfortable electrical shock upon
activation of these motors.
2) The rotary switch should be off when resistivity sondes are
being changed or a shock will result if the uninsulated portion
of the sondes are touched. Furthermore, the Rotary Switch must
be off when running conductivity, temperature, and caliper
surveys.
3) If it is necessary to guide the logging cable onto the winch
by hand to obtain even rewinding, care should be taken not to
get ftngers, hands, or clothing between the winch drum and

101
the line as severe injury could result, especially when the
heavier tools are in the well.
Preliminary Operations
After all components have been checked and found to be functioning
properly, and the control panel has been set up for the desired logging
survey, the next step is to position the top of the cable head at a
known reference such as the top of the well casing. For logs of con
ductivity, temperature, and caliper or any other added capability, the
left hand jumper wires should be removed from the tip and ground positions
and the proper leads from the control module should be plugged in. No
ground electrode is required for these surveys.
DEPTH MEASUREMENT. The depth measurement system on the recorder records
footage going in or coming out of the well. Contrary to what the manual
appears to indicate, it is not possible to reverse the counter as it
operates only in the forward position. No way has been found to set
depth reference footages per the instructions. Rather than starting
the records at the depth indicated on the footage counter, the reference
footages should be added to this depth and the pens placed accordingly,
which results in the proper vertical footages. Unless extreme or
compressed vertical details are desired, the most useful gear ratio is
one inch of chart to a twenty-foot depth.
RANGE AND BASE. After the most suitable range, or sensitivity, has been
selected for most of the run, the base sometimes will change when the
sonde reaches the bottom. This may result from a change of hole geometry,
from bottom effects, or from the change of position of the upper poten
tial pickup in the cable electrode assembly when the cable goes slack
in the well.
Sometimes the base is different going down the hole than when
coming up, which may cause the record to run either off the chart or
into the left channel. In either case, the base should be reset, and
the sonde relowered into the hole and started up again for another run.
In addition, for the sake of maintaining sensitivity, it may be de
sirable to change the setting of the base or range somewhere in the
record.


103
APPENDIX E. TROUBLE-SHOOTING PROCEDURES
This section has been subdivided into (1) mechanical and (2)
electrical troubles and included to help locate trouble sources so
repairs can be effected quickly . On-the-spot repairs can save much
time as wells are often located some distance from where the bulk of
repair equipment is kept . Only a minimum ability in the manual arts
is assumed necessary to diagnose and complete repairs to all but the
most complex systems.
Mechanical
A. C. ALTERNATOR. If the crankcase oil is changed regularly and clean
gasoline is used, this unit ordinarily is trouble free. Hard starting
usually is caused by a dirty spark plug, improperly gapped spark plug,
or an accumulation of carbon in the head. A weak spark or lack of
spark usually can be traced to the magneto system where the breaker
points should be checked for proper gap, pitting, sticking and cleanli
ness. Also, the capacitor should be checked for open and shorted
conditions and the coil for shorts and continuity; These tests on the
ignition system are easily accomplished with a multitester which should
be carried as standard equipment for servicing the logging gear.
Poor running in the idle position can be usually traced to the
carburetion system. Checks should be made to see that the choke is
fully open, the fuel bowl, tank, and lines are free of sediment, and
the needle jets for idle and running are adjusted for maximum efficiency.
Sometimes the alternator will perform poorly under loads when the
hoist mechanism is actuated and drawing maximum power. The above checks
should be performed first. If the trouble is not alleviated, then the
voltage output of the alternator should be checked to see if it is
within the suggested limits of 115 to 120 volts . If not, the governor
posit ion should be reset accordingly. If the unit still malfunctions,
the cylinder compression should be checked with a suitable gauge. Com
pression of 90 psi and below, together with undue oil consumption and
oil fouling of the spark plug, indicates that a general overhaul is
necessary.
104
If the power source checks out, then the trouble is located in the
capacitor "start" portion of the electric winch motor. See the following
section.
CABLE HOIST. This unit is prone to frequent breakdown owing to the high
stresses imposed by the weight of logging tools and cable and also be
cause of some inherent design deficiencies in the variable-speed trans
mission unit. The transmission should be checked periodically during
logging of deep wells for overheating. The first indication of distress
is grinding noises. When grinding noises begin, a breakdown is inuninent.
The weakest components in the transmission are: (1) the ring gear
which is made of non-hardened metal, (2) the three pinion gears which
rotate and drive the ring gear, and (3) the three bearings carrying the
roller cones. Spares for these parts should be kept on hand. The pro
per oil level must be maintained at all times. The oil should be changed
periodically in accordance with instructions, and oftener if the oil
becomes dirty. Only the specified oil should be used.
Stalling or stopping the hoist with the variable-speed control should
be avoided. Rapid stops or starts of the hoist should also be avoided,
as these place undue strain on the transmission components. With prac
tice, smooth engagements and disengagements of the brake coordinated with
control of the motor can be learned. Extremes of speed, either low or
high, should be avoided. Logging speeds should not exceed thirty feet
per minute. There are two brakes on the hoist. The high ratio brake,
which has been added, is easiest to apply, but the low ratio brake is
more efficient under heavy loads.
The starter section of the electric motor has given trouble several
times. When this occurs the high current consumption of the starting
capacitors overloads the power since the motor overheats . The trouble
has been traced to the contact points failing to open when the motor has
reached speed. The flat copper spring only requires a slight tension
to keep the points closed in the non-operating condition. After the
motor is started, the points open to cut out the capacitor section,
and the motor continues under reduced power consumption. Action of
the points can be observed through the ventilation and inspection ports
on the unattached end of the motor .
IDS
Electrical
RECORDER AND CONTROL PANEL. Because the control panel contains only
mechanical switches, potentiometers, and a milliameter, it is not prone
to failure. However, the brushes on the rotary switch should be checked
for wear. The recorder is much more complex and consists of two separate
tube-type amplifiers. Proper functioning of the recorder amplifiers
should be the first check in the case of any malfunction of the logger.
The recorder is easily isolated from the other components by placing
the test-log switch in the "test" position and noting whether the recorder
responds normally to the base control c~langes and to standard calibration
procedures. If either or both channels are inoperative, the most obvious
checks are the AC power to the recorder, the use in each amplifier, and
the tubes in each sect ion. Remove the screws holding the component to
the recorder housing and check to see if the tubes light up. If all the
tubes in one amplifier are out, check the fuse. If only one or a few are
out, replace them with new tubes after all of the tubes are pUlled out
and checked on a reliable tube checker. Defective and weak tubes should
be discarded. If this does not correct the trouble then the entire am
plifier circuit must be checked. An electronics repairman may have to
do the work if the logging operator doesn't have the necessary background.
The 4S-volt pen-drive battery also should be checked for proper
voltage under load conditions and replaced if the voltage falls below 4S
volts. Two I.S-volt batteries supply reference voltages for each channel.
Both the pen-drive battery and the reference batteries should be checked
periodically, and more frequently when the batteries are nearing the end
of usefulness. The recorder may still respond to basing and calibration
procedures even if the batteries are substantially below par. However,
under load, the pens gradually will drift outwards from the center of
the chart showing a christmas tree effect.
If the recorder fails to respond when using the conductivity or the
caliper sonde, check to be certain that, for the channel involved, one
end of the cable connecting the recorder to the control panel is dis
connected. Otherwise, the incoming signal bucks the internal reference
voltage and is thus negated.
1
11
106
Wiggly lines in the record not due to formation changes usually
are caused by the gain control being set too high. This may be diffi
cult to separate from rapid changes in the formation such as may be
induced by drilling-mud invasion in thin-bedded flows or strong random
transient electrical fields from power lines or transformers. Cyclical
noise of lower frequency which repeats itself every few feet or more has
been traced to the slip-ring assembly on the hoist. Irregularity of the
slip-ring surfaces and eccentricity of the slip rings with respect to
the main shaft of the winch to which it is attached were causes of noise
peaks recorded every four feet. The signal frequently was strong enough
to mask out any changes produced by the formation. The slip ring assembly
was removed and turned on a lathe to a perfectly smooth surface. Next,
in attaching the assembly back to the shaft, the allen screws were care
fully adjusted until there was no perceptible eccentricity noted by the
rise and fall of the spring contacts as the winch was turned. Be certain
the allen screws are tight and also tighten them only when the brake has
been applied to the winch drum; otherwise, when the brake is applied the
force is also applied to the slip rings which tends to slide the assembly
along the shaft. Magnetization of the logging cable and winch armature
should also be checked as this can be a small periodic noise equal to
TID showing up on the logs.
In obtaining logs that might go off scale, a lower range or sensiti
vity should be used or the signal and record will be lost for the interval
the pen is off scale. The continued straining of the pen against the
stop will result in wear of the pen-drive clutch surfaces.
CALIPER TOOL. Beyond checking for burned out fuses, the complexity of
the circuit indicates that the unit should be serviced by a competent
electronics repairman. If the ground lead is left disconnected and the
caliper motor activated, the operator will receive an electric shock as
he provides the ground path. Before beginning a logging run the tightness
of the caliper arms should be checked. Periodic checks of the module in
the high and low positions of the arms and the c?librating switch is
recommended.
SPECIFIC CONDUCTANCE AND TEMPERATURE SONDE.. This equipment has been
relatively tr~uble free after initial problems were corrected by the

107
manufacturer and the electronics shop of the Hawaii Institute of Geo
physics . A leaky O-ring seal where the conductivity cell unit plugs
into the instrument body at the bottom was initially very troublesome.
The replacement O-ring, smaller than the original, has prevented leaks
for a year and shows no signs of impending leakage. The only other
source of trouble with this device is the occasional failure of the
batteries to hold a charge. Although the instruction manual does not
state this, the body of the sonde must be grounded to the command set
when charging, otherwise, the batteries in the downhole portion will
not charge properly. While charging, the tip of the charging wire and
the port in the sonde must be clean and making good electrical contact
which can be verified by a spark when the ground wire is touched to the
command set. At present, the charging part has been bypassed by running
a wire inside the sonde which can be pulled out from the top when needed.
Troubles with this sonde and also the caliper sonde can be isolated from
the logging line and recorder sections by simply using short jumper
cables and noting whether the command module still indicates the proper
signals.
SP-RESISTIVITY LOGGING SONDES, ELECTRODE CABLE ASSEMBLY, LOGGING CABLE
AND CABLE HEAD. Except for the cable head, the other components are
relatively trouble free but the same trouble-shooting procedures used
for the cable head also apply to them. Broken or high resistance connec
tions easily can be located with an ohmmeter. Because of the large
stresses on the cable at the cable head and because water does enter into
the upper side of the head, the cable has to be reheaded periodically.
Failure to do so will result in an inability to obtain a proper log.
The manufacturer suggests that vaseline be used to pack the cable head,
but experience has shown emulsification and consequent deterioration
occurs soon after. Silicone grease is more expensive, but longer lasting
and more reliable. The outside of the cable head should be thoroughly
wiped clean before re-wrapping, or the tape will not adhere tightly.
The first layer of wrapping should be self-vulcanizing rubber tape.
Plastic electrician's tape should be wrapped over the rubber tape as the
final layer. A neat job of wrapping insures a water-proof cable connec
tion . A permanent solution would be to fill the inspection part of the

108
cable head with butyl rubber and put the cable wires and connectors
into a simple waterproof unit.
If the recorder section checks out, the fault is usually in the
downhole components. If trouble is indicated in the downhole portion
of the logger, that is, from the control panel through the winch,
logging line, and sonde, the following order or trouble shooting is
suggested:
1) Remove the cover from the slip rings and check to see that
the slip ring assembly has not slipped on the winch shaft
and broken any of the four wires leading from the logging line
to the slip rings.
2) Check the cable from the slip ring to the recorder for conti
nuity with an ohmmeter by pulling the jumper wires from the
right hand side of the panel and checking through these wires
to the bands on the slip rings .
3) If the logging tools are out of the hole, a quick check of
the leads in the cable head can be made to see whether they
have parted or not. Although there is an ample s t r ai n loop
for each conductor wire at the cable head, this component
seems surprisingly fragile.
4) Continuity should be checked from the tip, band, body, and
ground of the sonde to the corresponding pull -out leads on
the recorder.
This procedure should isolate the wire which is causing the diffi
culty. The proper phonoplugs and jacks can be substituted for the
sondes as well.
Related Documents