Application of a multivariate seizure detection and prediction method to non-invasive and intracranial long-term EEG recordings Ariane Schad a, * , Kaspar Schindler b , Bjo ¨ rn Schelter a,c , Thomas Maiwald a , Armin Brandt d , Jens Timmer a,c , Andreas Schulze-Bonhage d,c a FDM, Freiburg Center for Data Analysis and Modeling, University of Freiburg, Eckerstr. 1, 79104 Freiburg, Germany b Clinic of Neurology, Inselspital Bern, Switzerland c Bernstein Center for Computational Neuroscience Freiburg, University of Freiburg, Germany d Epilepsy Center, University Hospital of Freiburg, Breisacher Str. 64, 79106 Freiburg, Germany Accepted 22 September 2007 Available online 26 November 2007 Abstract Objective: Retrospective evaluation and comparison of performances of a multivariate method for seizure detection and prediction on simultaneous long-term EEG recordings from scalp and intracranial electrodes. Methods: Two multivariate techniques based on simulated leaky integrate-and-fire neurons were investigated in order to detect and pre- dict seizures. Both methods were applied and assessed on 423 h of EEG and 26 seizures in total, recorded simultaneously from the scalp and intracranially continuously over several days from six patients with pharmacorefractory epilepsy. Results: Features generated from simultaneous scalp and intracranial EEG data showed a similar dynamical behavior. Significant per- formances with sensitivities of up to 73%/62% for scalp/invasive EEG recordings given an upper limit of 0.15 false detections per hour were obtained. Up to 59%/50% of all seizures could be predicted from scalp/invasive EEG, given a maximum number of 0.15 false pre- dictions per hour. A tendency to better performances for scalp EEG was obtained for the detection algorithm. Conclusions: The investigated methods originally developed for non-invasive EEG were successfully applied to intracranial EEG. Espe- cially, concerning seizure detection the method shows a promising performance which is appropriate for practical applications in EEG monitoring. Concerning seizure prediction a significant prediction performance is indicated and a modification of the method is suggested. Significance: This study evaluates simultaneously recorded non-invasive and intracranial continuous long-term EEG data with respect to seizure detection and seizure prediction for the first time. Ó 2007 International Federation of Clinical Neurophysiology. Published by Elsevier Ireland Ltd. All rights reserved. Keywords: Epilepsy; Long-term EEG analysis; Intracranial EEG; Non-invasive EEG; Seizure detection; Seizure prediction 1. Introduction Epilepsy patients are afflicted with sudden and recurrent brain dysfunctions, which manifest as seizures. Because most patients cannot anticipate seizure occurrences, life- threatening situations may arise in day-to-day situations (Cockerell et al., 1994). Therefore, treatment strategies are needed to reduce the psychological stress on patients and their social environment to improve their quality of life (Murray, 1993). Nowadays most epilepsy patients are treated by antiepi- leptic medications. In the case of pharmacorefractory focal epilepsy, surgical removal of brain tissues early involved in the seizure generation is a possible treatment. Diagnostic evaluations of EEG recordings of patients are necessary to determine the seizure onset zone. Patients undergo a long-term monitoring, i.e. simultaneous EEG and video recordings with scalp, and – if necessary – also with intra- cranial electrodes. Due to the apparent unpredictability of 1388-2457/$32.00 Ó 2007 International Federation of Clinical Neurophysiology. Published by Elsevier Ireland Ltd. All rights reserved. doi:10.1016/j.clinph.2007.09.130 * Corresponding author. Tel.: +49 761 203 7709; fax: +49 761 203 7700. E-mail address: [email protected] (A. Schad). www.elsevier.com/locate/clinph Clinical Neurophysiology 119 (2008) 197–211

Welcome message from author
This document is posted to help you gain knowledge. Please leave a comment to let me know what you think about it! Share it to your friends and learn new things together.
Transcript
www.elsevier.com/locate/clinph
Clinical Neurophysiology 119 (2008) 197–211
Application of a multivariate seizure detection and prediction methodto non-invasive and intracranial long-term EEG recordings
Ariane Schad a,*, Kaspar Schindler b, Bjorn Schelter a,c, Thomas Maiwald a,Armin Brandt d, Jens Timmer a,c, Andreas Schulze-Bonhage d,c
a FDM, Freiburg Center for Data Analysis and Modeling, University of Freiburg, Eckerstr. 1, 79104 Freiburg, Germanyb Clinic of Neurology, Inselspital Bern, Switzerland
c Bernstein Center for Computational Neuroscience Freiburg, University of Freiburg, Germanyd Epilepsy Center, University Hospital of Freiburg, Breisacher Str. 64, 79106 Freiburg, Germany
Accepted 22 September 2007Available online 26 November 2007
Abstract
Objective: Retrospective evaluation and comparison of performances of a multivariate method for seizure detection and prediction onsimultaneous long-term EEG recordings from scalp and intracranial electrodes.Methods: Two multivariate techniques based on simulated leaky integrate-and-fire neurons were investigated in order to detect and pre-dict seizures. Both methods were applied and assessed on 423 h of EEG and 26 seizures in total, recorded simultaneously from the scalpand intracranially continuously over several days from six patients with pharmacorefractory epilepsy.Results: Features generated from simultaneous scalp and intracranial EEG data showed a similar dynamical behavior. Significant per-formances with sensitivities of up to 73%/62% for scalp/invasive EEG recordings given an upper limit of 0.15 false detections per hourwere obtained. Up to 59%/50% of all seizures could be predicted from scalp/invasive EEG, given a maximum number of 0.15 false pre-dictions per hour. A tendency to better performances for scalp EEG was obtained for the detection algorithm.Conclusions: The investigated methods originally developed for non-invasive EEG were successfully applied to intracranial EEG. Espe-cially, concerning seizure detection the method shows a promising performance which is appropriate for practical applications in EEGmonitoring. Concerning seizure prediction a significant prediction performance is indicated and a modification of the method issuggested.Significance: This study evaluates simultaneously recorded non-invasive and intracranial continuous long-term EEG data with respect toseizure detection and seizure prediction for the first time.� 2007 International Federation of Clinical Neurophysiology. Published by Elsevier Ireland Ltd. All rights reserved.
Keywords: Epilepsy; Long-term EEG analysis; Intracranial EEG; Non-invasive EEG; Seizure detection; Seizure prediction
1. Introduction
Epilepsy patients are afflicted with sudden and recurrentbrain dysfunctions, which manifest as seizures. Becausemost patients cannot anticipate seizure occurrences, life-threatening situations may arise in day-to-day situations(Cockerell et al., 1994). Therefore, treatment strategiesare needed to reduce the psychological stress on patients
1388-2457/$32.00 � 2007 International Federation of Clinical Neurophysiolo
doi:10.1016/j.clinph.2007.09.130
* Corresponding author. Tel.: +49 761 203 7709; fax: +49 761 203 7700.E-mail address: [email protected] (A. Schad).
and their social environment to improve their quality of life(Murray, 1993).
Nowadays most epilepsy patients are treated by antiepi-leptic medications. In the case of pharmacorefractory focalepilepsy, surgical removal of brain tissues early involved inthe seizure generation is a possible treatment. Diagnosticevaluations of EEG recordings of patients are necessaryto determine the seizure onset zone. Patients undergo along-term monitoring, i.e. simultaneous EEG and videorecordings with scalp, and – if necessary – also with intra-cranial electrodes. Due to the apparent unpredictability of
gy. Published by Elsevier Ireland Ltd. All rights reserved.
198 A. Schad et al. / Clinical Neurophysiology 119 (2008) 197–211
seizures, monitoring takes several days to weeks and isaccompanied by the collection and visual inspection oflarge amounts of EEG and video data. Automatic detec-tion of seizure onsets in EEG can facilitate long-term epi-lepsy monitoring for diagnostic purposes (Gotman, 1990,1999), e.g. by on-line detection systems that trigger warn-ing mechanism to alert medical staff (Saab and Gotman,2005).
Seizure warning devices could also be used for moreeffective therapeutic treatments. For instance, upcomingseizures could be suppressed by electric stimulation ordelivery of short-acting drugs (Stein et al., 2000; Osorioet al., 2005). Alarm systems could also be utilized to warnpatients. They also allow behavioral adjustments. Suchdevices would be of particular interest for epilepsy patientsto whom present treatments fail or are ineffective.
In recent years, efforts were undertaken to automaticallydetect and predict epileptic seizures using EEG data.Numerous univariate, bivariate and multivariate algo-rithms were published based on EEG analysis of single ormultiple electrodes to solve the problem of seizure detec-tion (Osorio et al., 1998; Gotman, 1990, 1999; Schindleret al., 2001; Jerger et al., 2001, 2005; Frei et al., 2002; Saaband Gotman, 2005; Bhavaraju et al., 2006) and prediction(Lehnertz and Elger, 1998; Iasemidis et al., 1990; Le vanQuyen et al., 1999, 2000; Mormann et al., 2000, 2003a,b,2006; Le van Quyen et al., 2001a,b; Jerger et al., 2001; Littet al., 2001; Navarro et al., 2002; Schindler et al., 2002).Especially multivariate approaches have become a focusof attention recently in EEG analysis as promising toolsin epilepsy research (Mueller et al., 2006; Bialonski andLehnertz, 2006; Schindler et al., 2007).
In general, a detection or a prediction method isdesigned and evaluated with respect to scalp or invasiveEEG data. Whereas in most studies seizure detection orprediction has been performed on either intracranial ornon-invasive, surface EEG data, it yet remains an openquestion whether intracranial or non-invasive, surfaceEEG should be preferred. This paper is motivated by thisquestion.
If one attempts to compare a prediction or detectionmethod based on univariate or bivariate measures appliedto scalp and intracranial EEG recordings, the problemarises how to choose the electrodes in order to obtain a reli-able comparison between those positioned on the scalp andfor example with those positioned at the seizure onset zone.If the electrode or channel combination is not determinedin advance by explicit criteria, using different electrodecombinations for the comparison and performance evalua-tion leads to undesirable multiple testing problems (Schel-ter et al., 2006a).
Hence, in this paper we examined a multivariate methodfor automatic seizure detection based on neuronal net-works using simulated leaky integrate-and-fire neurons,which was introduced by Schindler et al. (2001). It is basedon a simulated neuronal cell model that extracts spatio-temporal information from multi-channel EEG recordings,
like spatially synchronous, fast-transient and rhythmicactivities, as they often appear in EEG patterns from epi-leptic activity (Engel, 1987; Dichter and Ayala, 1987). Ina subsequent publication, a modification of the detectionalgorithm was presented to detect pre-seizure changes fromEEG in order to achieve a prediction of seizure onsets(Schindler et al., 2002). These two algorithms yield mea-sures for seizure detection and prediction, which are char-acterized by a few continuously adjustable parameters. Bydefinition they predict or detect using a one dimensionalfeature even though they can take into account informa-tion of all EEG electrodes. The here investigated twomethods possess the unique advantage that a preselectionof electrodes is not necessary and thus the above-men-tioned multiple testing problem between performancesfrom different selections of electrode combinations doesnot emerge.
While both algorithms mentioned above have beenapplied to scalp and foramen ovale EEG recordings before(Schindler et al., 2001, 2002; Sazonov et al., 2002) we inves-tigated the questions whether these two methods are alsoapplicable to intracranial EEG, what kind of differenceswill occur when compared with applications to scalpEEG, and whether they perform better on scalp or intra-cranial EEG data.
To obtain reliable comparisons, we used continuouslong-term EEG data from six patients with simultaneousrecordings from scalp and intracranial EEG. This allowscomparison of the respective features calculated fromscalp and invasive EEG recordings for the detection andthe prediction method directly. The data comprise longinterictal periods, which are necessary for assessing a highspecificity. Sleep and awake phases as well as sub-clinicalevents were not excluded from the data as they are part ofa realistic EEG sample and occur also in prospective set-tings regarding seizure detection and prediction utilizingEEG.
Seizure detection as well as seizure prediction perfor-mance were evaluated and compared retrospectively in apatient-individual manner using both types of EEG data.The seizure prediction performance was assessed with theseizure prediction characteristic in terms of sensitivity,specificity, and intervention times (Winterhalder et al.,2003). A reliable prediction method has to be superior toa prediction by chance, hence the evaluated performanceswere compared with a random predictor (Mormannet al., 2006; Schelter et al., 2006a). For assessing the perfor-mance of the investigated detection method, we adaptedthe concept of the seizure prediction characteristic withits statistical evaluation for seizure detection.
In the following section, we set out the used data pooland the patients’ characteristics and give an outline of theinvestigated methods. The evaluation procedure of the sei-zure detection and seizure prediction method is described.In Section 3, the results obtained on scalp and invasiveEEG recordings are presented and compared. A discussionof the results follows in Section 4.
A. Schad et al. / Clinical Neurophysiology 119 (2008) 197–211 199
2. Methods
2.1. EEG data and patient characteristics
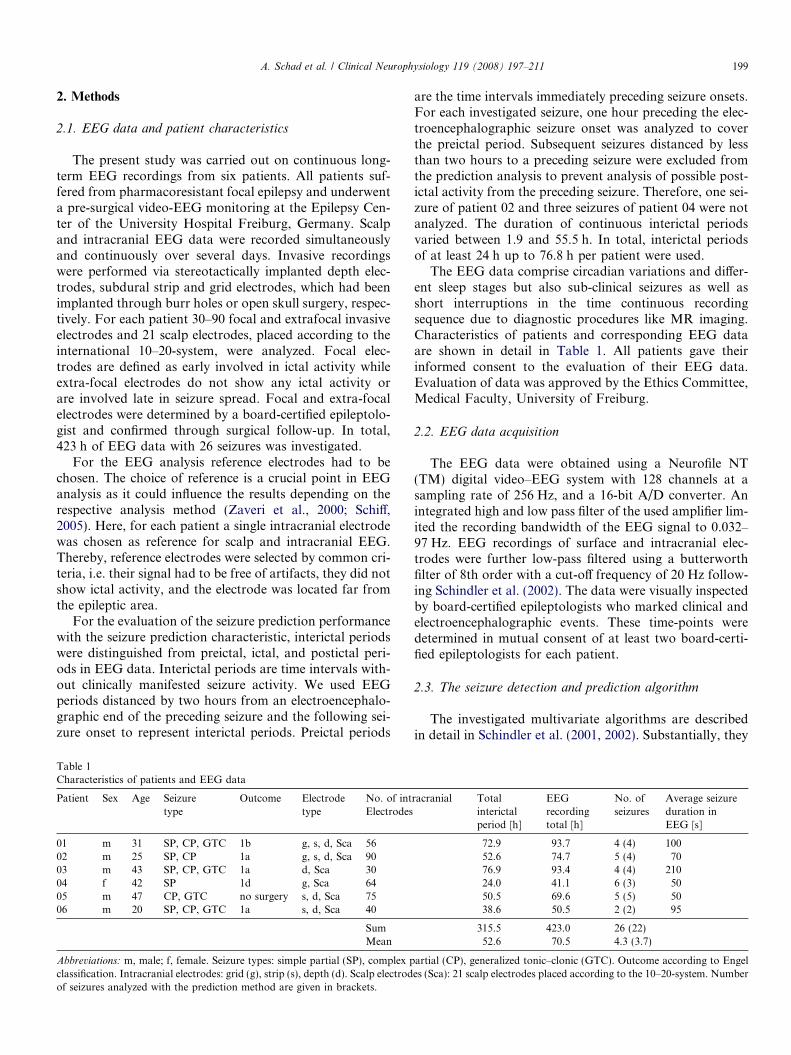
The present study was carried out on continuous long-term EEG recordings from six patients. All patients suf-fered from pharmacoresistant focal epilepsy and underwenta pre-surgical video-EEG monitoring at the Epilepsy Cen-ter of the University Hospital Freiburg, Germany. Scalpand intracranial EEG data were recorded simultaneouslyand continuously over several days. Invasive recordingswere performed via stereotactically implanted depth elec-trodes, subdural strip and grid electrodes, which had beenimplanted through burr holes or open skull surgery, respec-tively. For each patient 30–90 focal and extrafocal invasiveelectrodes and 21 scalp electrodes, placed according to theinternational 10–20-system, were analyzed. Focal elec-trodes are defined as early involved in ictal activity whileextra-focal electrodes do not show any ictal activity orare involved late in seizure spread. Focal and extra-focalelectrodes were determined by a board-certified epileptolo-gist and confirmed through surgical follow-up. In total,423 h of EEG data with 26 seizures was investigated.
For the EEG analysis reference electrodes had to bechosen. The choice of reference is a crucial point in EEGanalysis as it could influence the results depending on therespective analysis method (Zaveri et al., 2000; Schiff,2005). Here, for each patient a single intracranial electrodewas chosen as reference for scalp and intracranial EEG.Thereby, reference electrodes were selected by common cri-teria, i.e. their signal had to be free of artifacts, they did notshow ictal activity, and the electrode was located far fromthe epileptic area.
For the evaluation of the seizure prediction performancewith the seizure prediction characteristic, interictal periodswere distinguished from preictal, ictal, and postictal peri-ods in EEG data. Interictal periods are time intervals with-out clinically manifested seizure activity. We used EEGperiods distanced by two hours from an electroencephalo-graphic end of the preceding seizure and the following sei-zure onset to represent interictal periods. Preictal periods
Table 1Characteristics of patients and EEG data
Patient Sex Age Seizuretype
Outcome Electrodetype
No. of intElectrodes
01 m 31 SP, CP, GTC 1b g, s, d, Sca 5602 m 25 SP, CP 1a g, s, d, Sca 9003 m 43 SP, CP, GTC 1a d, Sca 3004 f 42 SP 1d g, Sca 6405 m 47 CP, GTC no surgery s, d, Sca 7506 m 20 SP, CP, GTC 1a s, d, Sca 40
SumMean
Abbreviations: m, male; f, female. Seizure types: simple partial (SP), complex pclassification. Intracranial electrodes: grid (g), strip (s), depth (d). Scalp electrodof seizures analyzed with the prediction method are given in brackets.
are the time intervals immediately preceding seizure onsets.For each investigated seizure, one hour preceding the elec-troencephalographic seizure onset was analyzed to coverthe preictal period. Subsequent seizures distanced by lessthan two hours to a preceding seizure were excluded fromthe prediction analysis to prevent analysis of possible post-ictal activity from the preceding seizure. Therefore, one sei-zure of patient 02 and three seizures of patient 04 were notanalyzed. The duration of continuous interictal periodsvaried between 1.9 and 55.5 h. In total, interictal periodsof at least 24 h up to 76.8 h per patient were used.
The EEG data comprise circadian variations and differ-ent sleep stages but also sub-clinical seizures as well asshort interruptions in the time continuous recordingsequence due to diagnostic procedures like MR imaging.Characteristics of patients and corresponding EEG dataare shown in detail in Table 1. All patients gave theirinformed consent to the evaluation of their EEG data.Evaluation of data was approved by the Ethics Committee,Medical Faculty, University of Freiburg.
2.2. EEG data acquisition
The EEG data were obtained using a Neurofile NT(TM) digital video–EEG system with 128 channels at asampling rate of 256 Hz, and a 16-bit A/D converter. Anintegrated high and low pass filter of the used amplifier lim-ited the recording bandwidth of the EEG signal to 0.032–97 Hz. EEG recordings of surface and intracranial elec-trodes were further low-pass filtered using a butterworthfilter of 8th order with a cut-off frequency of 20 Hz follow-ing Schindler et al. (2002). The data were visually inspectedby board-certified epileptologists who marked clinical andelectroencephalographic events. These time-points weredetermined in mutual consent of at least two board-certi-fied epileptologists for each patient.
2.3. The seizure detection and prediction algorithm
The investigated multivariate algorithms are describedin detail in Schindler et al. (2001, 2002). Substantially, they
racranial Totalinterictalperiod [h]
EEGrecordingtotal [h]
No. ofseizures
Average seizureduration inEEG [s]
72.9 93.7 4 (4) 10052.6 74.7 5 (4) 7076.9 93.4 4 (4) 21024.0 41.1 6 (3) 5050.5 69.6 5 (5) 5038.6 50.5 2 (2) 95
315.5 423.0 26 (22)52.6 70.5 4.3 (3.7)
artial (CP), generalized tonic–clonic (GTC). Outcome according to Engeles (Sca): 21 scalp electrodes placed according to the 10–20-system. Number
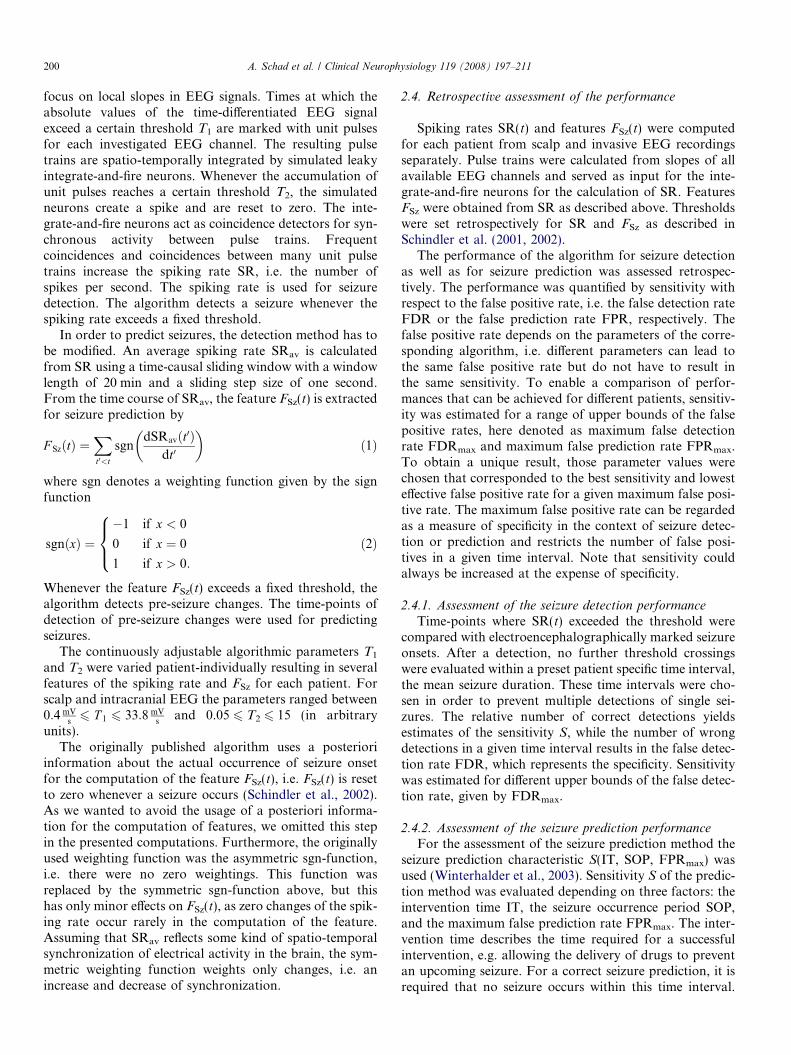
200 A. Schad et al. / Clinical Neurophysiology 119 (2008) 197–211
focus on local slopes in EEG signals. Times at which theabsolute values of the time-differentiated EEG signalexceed a certain threshold T1 are marked with unit pulsesfor each investigated EEG channel. The resulting pulsetrains are spatio-temporally integrated by simulated leakyintegrate-and-fire neurons. Whenever the accumulation ofunit pulses reaches a certain threshold T2, the simulatedneurons create a spike and are reset to zero. The inte-grate-and-fire neurons act as coincidence detectors for syn-chronous activity between pulse trains. Frequentcoincidences and coincidences between many unit pulsetrains increase the spiking rate SR, i.e. the number ofspikes per second. The spiking rate is used for seizuredetection. The algorithm detects a seizure whenever thespiking rate exceeds a fixed threshold.
In order to predict seizures, the detection method has tobe modified. An average spiking rate SRav is calculatedfrom SR using a time-causal sliding window with a windowlength of 20 min and a sliding step size of one second.From the time course of SRav, the feature FSz(t) is extractedfor seizure prediction by
F SzðtÞ ¼Xt0<t
sgndSRavðt0Þ
dt0
� �ð1Þ
where sgn denotes a weighting function given by the signfunction
sgnðxÞ ¼�1 if x < 0
0 if x ¼ 0
1 if x > 0:
8><>: ð2Þ
Whenever the feature FSz(t) exceeds a fixed threshold, thealgorithm detects pre-seizure changes. The time-points ofdetection of pre-seizure changes were used for predictingseizures.
The continuously adjustable algorithmic parameters T1
and T2 were varied patient-individually resulting in severalfeatures of the spiking rate and FSz for each patient. Forscalp and intracranial EEG the parameters ranged between0:4 mV
s6 T 1 6 33:8 mV
sand 0.05 6 T2 6 15 (in arbitrary
units).The originally published algorithm uses a posteriori
information about the actual occurrence of seizure onsetfor the computation of the feature FSz(t), i.e. FSz(t) is resetto zero whenever a seizure occurs (Schindler et al., 2002).As we wanted to avoid the usage of a posteriori informa-tion for the computation of features, we omitted this stepin the presented computations. Furthermore, the originallyused weighting function was the asymmetric sgn-function,i.e. there were no zero weightings. This function wasreplaced by the symmetric sgn-function above, but thishas only minor effects on FSz(t), as zero changes of the spik-ing rate occur rarely in the computation of the feature.Assuming that SRav reflects some kind of spatio-temporalsynchronization of electrical activity in the brain, the sym-metric weighting function weights only changes, i.e. anincrease and decrease of synchronization.
2.4. Retrospective assessment of the performance
Spiking rates SR(t) and features FSz(t) were computedfor each patient from scalp and invasive EEG recordingsseparately. Pulse trains were calculated from slopes of allavailable EEG channels and served as input for the inte-grate-and-fire neurons for the calculation of SR. FeaturesFSz were obtained from SR as described above. Thresholdswere set retrospectively for SR and FSz as described inSchindler et al. (2001, 2002).
The performance of the algorithm for seizure detectionas well as for seizure prediction was assessed retrospec-tively. The performance was quantified by sensitivity withrespect to the false positive rate, i.e. the false detection rateFDR or the false prediction rate FPR, respectively. Thefalse positive rate depends on the parameters of the corre-sponding algorithm, i.e. different parameters can lead tothe same false positive rate but do not have to result inthe same sensitivity. To enable a comparison of perfor-mances that can be achieved for different patients, sensitiv-ity was estimated for a range of upper bounds of the falsepositive rates, here denoted as maximum false detectionrate FDRmax and maximum false prediction rate FPRmax.To obtain a unique result, those parameter values werechosen that corresponded to the best sensitivity and lowesteffective false positive rate for a given maximum false posi-tive rate. The maximum false positive rate can be regardedas a measure of specificity in the context of seizure detec-tion or prediction and restricts the number of false posi-tives in a given time interval. Note that sensitivity couldalways be increased at the expense of specificity.
2.4.1. Assessment of the seizure detection performance
Time-points where SR(t) exceeded the threshold werecompared with electroencephalographically marked seizureonsets. After a detection, no further threshold crossingswere evaluated within a preset patient specific time interval,the mean seizure duration. These time intervals were cho-sen in order to prevent multiple detections of single sei-zures. The relative number of correct detections yieldsestimates of the sensitivity S, while the number of wrongdetections in a given time interval results in the false detec-tion rate FDR, which represents the specificity. Sensitivitywas estimated for different upper bounds of the false detec-tion rate, given by FDRmax.
2.4.2. Assessment of the seizure prediction performanceFor the assessment of the seizure prediction method the
seizure prediction characteristic S(IT, SOP, FPRmax) wasused (Winterhalder et al., 2003). Sensitivity S of the predic-tion method was evaluated depending on three factors: theintervention time IT, the seizure occurrence period SOP,and the maximum false prediction rate FPRmax. The inter-vention time describes the time required for a successfulintervention, e.g. allowing the delivery of drugs to preventan upcoming seizure. For a correct seizure prediction, it isrequired that no seizure occurs within this time interval.
A. Schad et al. / Clinical Neurophysiology 119 (2008) 197–211 201
The seizure occurrence period reflects a possible temporalvariability of the occurrence of a predicted seizure.
For each patient the time courses of the features FSz(t)from scalp and invasive EEG recordings were separatedinto interictal and preictal periods. Whenever the featureFSz crossed the threshold in upward direction a seizurewas predicted. The prediction was judged to be correct ifan electroencephalographic marked seizure occurredwithin the seizure occurrence period. Sensitivity was esti-mated on the preictal data segments from the relative num-ber of correct predictions, while the false prediction ratewas determined on interictal segments. Sensitivity was esti-mated for different values of FPRmax, IT, and SOP.
The seizure prediction characteristic was comparedwith the performance of an unspecific random predictor(Schelter et al., 2006a). The random predictor is basedon a Poisson process. Its performance can be derivedfrom a binomial distribution with probabilityP ¼ 1� e�SOP�FPRmax . From the performance of the randompredictor, a significance level can be calculated. A criticalvalue rrand,a for the sensitivity of a random predictioncan be determined analytically as a function of FPRmax
and SOP, the total amount K of investigated seizures,and significance level a as
rrand;a ¼1
KmaxfkjP binomfk; K; Pg > ag � 100% ð3Þ
with
P binomfk; K; Pg ¼ 1�Xj<k
K
j
� �P jð1� P ÞK�j
!d
: ð4Þ
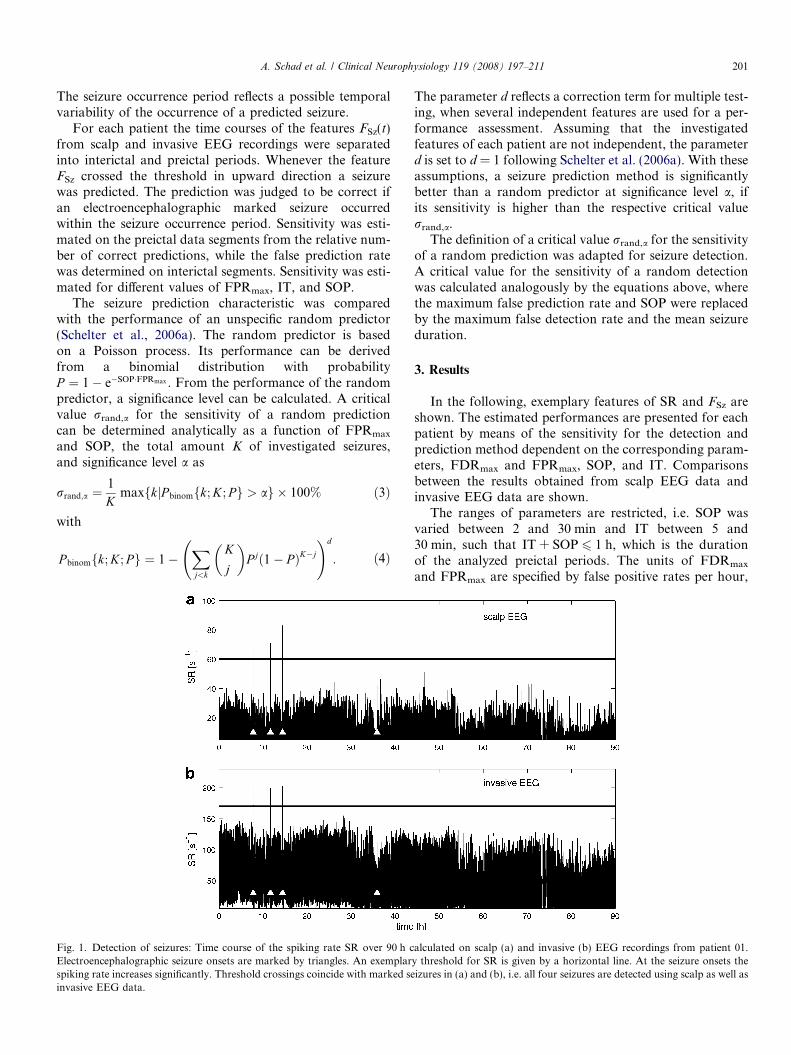
Fig. 1. Detection of seizures: Time course of the spiking rate SR over 90 h cElectroencephalographic seizure onsets are marked by triangles. An exemplarspiking rate increases significantly. Threshold crossings coincide with marked seinvasive EEG data.
The parameter d reflects a correction term for multiple test-ing, when several independent features are used for a per-formance assessment. Assuming that the investigatedfeatures of each patient are not independent, the parameterd is set to d = 1 following Schelter et al. (2006a). With theseassumptions, a seizure prediction method is significantlybetter than a random predictor at significance level a, ifits sensitivity is higher than the respective critical valuerrand,a.
The definition of a critical value rrand,a for the sensitivityof a random prediction was adapted for seizure detection.A critical value for the sensitivity of a random detectionwas calculated analogously by the equations above, wherethe maximum false prediction rate and SOP were replacedby the maximum false detection rate and the mean seizureduration.
3. Results
In the following, exemplary features of SR and FSz areshown. The estimated performances are presented for eachpatient by means of the sensitivity for the detection andprediction method dependent on the corresponding param-eters, FDRmax and FPRmax, SOP, and IT. Comparisonsbetween the results obtained from scalp EEG data andinvasive EEG data are shown.
The ranges of parameters are restricted, i.e. SOP wasvaried between 2 and 30 min and IT between 5 and30 min, such that IT + SOP 6 1 h, which is the durationof the analyzed preictal periods. The units of FDRmax
and FPRmax are specified by false positive rates per hour,
alculated on scalp (a) and invasive (b) EEG recordings from patient 01.y threshold for SR is given by a horizontal line. At the seizure onsets theizures in (a) and (b), i.e. all four seizures are detected using scalp as well as
480 482 484 486 488 4900
20
40
60
80
100seizure 1
SR
[1/s
]
716 718 720 722 724 7260
20
40
60
80
100seizure 2
880 882 884 886 888 8900
20
40
60
80
100seizure 3
time [min]
SR
[1/s
]
2168 2170 2172 2174 2176 21780
20
40
60
80
100seizure 4
time [min]
480 482 484 486 488 4900
50
100
150
200
seizure 1
SR
[1/s
]
716 718 720 722 724 7260
50
100
150
200
seizure 2
880 882 884 886 888 8900
50
100
150
200
seizure 3
time [min]
SR
[1/s
]
2168 2170 2172 2174 2176 21780
50
100
150
200
seizure 4
time [min]
(a) scalp EEG
(b) invasive EEG
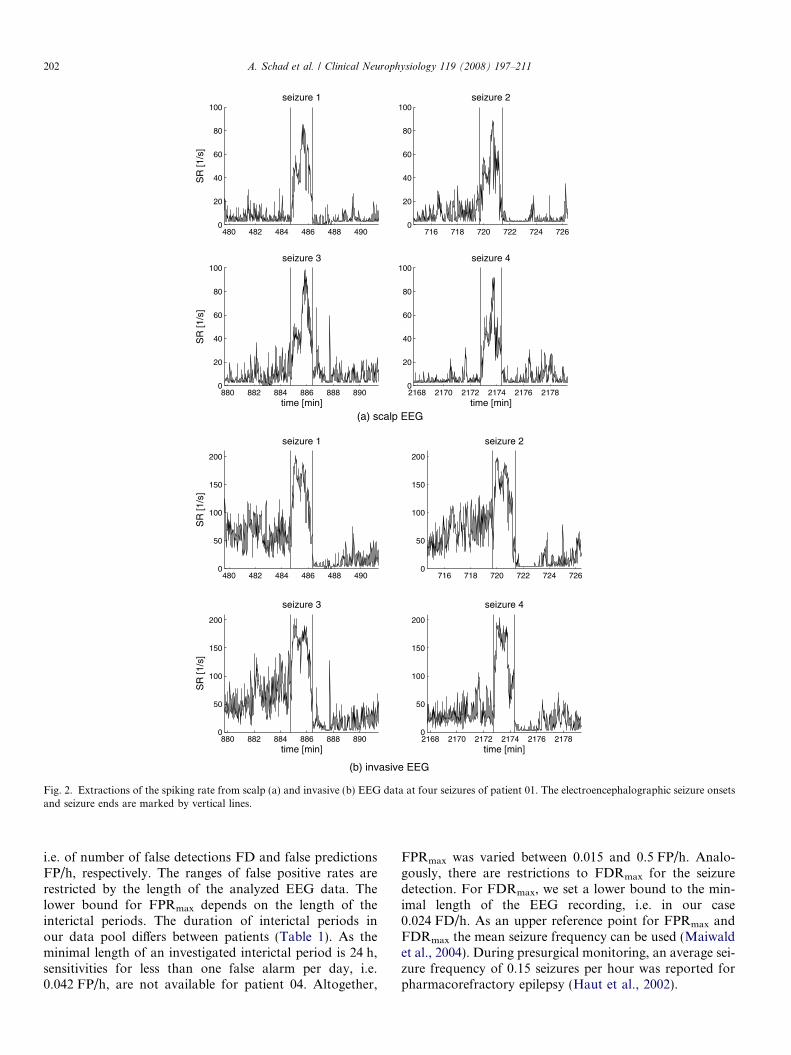
Fig. 2. Extractions of the spiking rate from scalp (a) and invasive (b) EEG data at four seizures of patient 01. The electroencephalographic seizure onsetsand seizure ends are marked by vertical lines.
202 A. Schad et al. / Clinical Neurophysiology 119 (2008) 197–211
i.e. of number of false detections FD and false predictionsFP/h, respectively. The ranges of false positive rates arerestricted by the length of the analyzed EEG data. Thelower bound for FPRmax depends on the length of theinterictal periods. The duration of interictal periods inour data pool differs between patients (Table 1). As theminimal length of an investigated interictal period is 24 h,sensitivities for less than one false alarm per day, i.e.0.042 FP/h, are not available for patient 04. Altogether,
FPRmax was varied between 0.015 and 0.5 FP/h. Analo-gously, there are restrictions to FDRmax for the seizuredetection. For FDRmax, we set a lower bound to the min-imal length of the EEG recording, i.e. in our case0.024 FD/h. As an upper reference point for FPRmax andFDRmax the mean seizure frequency can be used (Maiwaldet al., 2004). During presurgical monitoring, an average sei-zure frequency of 0.15 seizures per hour was reported forpharmacorefractory epilepsy (Haut et al., 2002).
1 2 3 4 5 6 7 8 9 10 11 12 13 14 15 16 17 18 19 20 21 22 23 24 25 26–100
0
100
200
late
ncy s [s
]
1 2 3 4 5 6 7 8 9 10 11 12 13 14 15 16 17 18 19 20 21 22 23 24 25 26–100
0
100
200la
tenc
y i [s]
1 2 3 4 5 6 7 8 9 10 11 12 13 14 15 16 17 18 19 20 21 22 23 24 25 26–100
0
100
200
seizure
Δ [s
]
(a) scalp EEG
(b) invasive EEG
(c) Δ = latencyi– latency
s
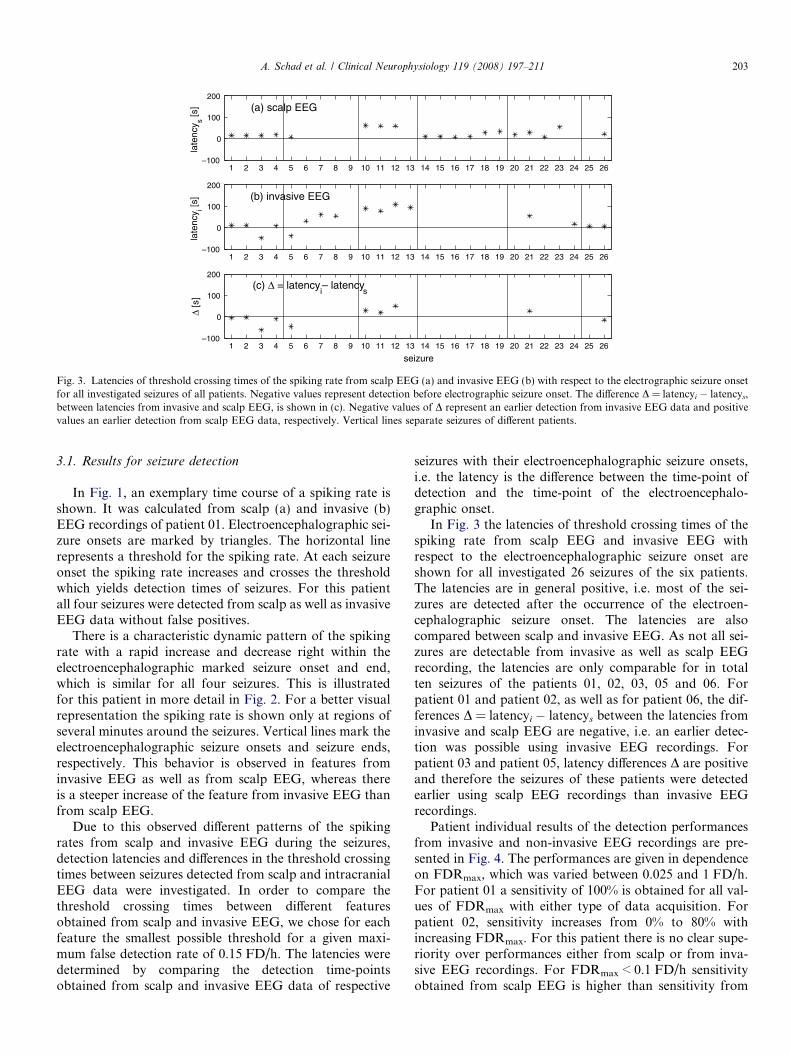
Fig. 3. Latencies of threshold crossing times of the spiking rate from scalp EEG (a) and invasive EEG (b) with respect to the electrographic seizure onsetfor all investigated seizures of all patients. Negative values represent detection before electrographic seizure onset. The difference D = latencyi � latencys,between latencies from invasive and scalp EEG, is shown in (c). Negative values of D represent an earlier detection from invasive EEG data and positivevalues an earlier detection from scalp EEG data, respectively. Vertical lines separate seizures of different patients.
A. Schad et al. / Clinical Neurophysiology 119 (2008) 197–211 203
3.1. Results for seizure detection
In Fig. 1, an exemplary time course of a spiking rate isshown. It was calculated from scalp (a) and invasive (b)EEG recordings of patient 01. Electroencephalographic sei-zure onsets are marked by triangles. The horizontal linerepresents a threshold for the spiking rate. At each seizureonset the spiking rate increases and crosses the thresholdwhich yields detection times of seizures. For this patientall four seizures were detected from scalp as well as invasiveEEG data without false positives.
There is a characteristic dynamic pattern of the spikingrate with a rapid increase and decrease right within theelectroencephalographic marked seizure onset and end,which is similar for all four seizures. This is illustratedfor this patient in more detail in Fig. 2. For a better visualrepresentation the spiking rate is shown only at regions ofseveral minutes around the seizures. Vertical lines mark theelectroencephalographic seizure onsets and seizure ends,respectively. This behavior is observed in features frominvasive EEG as well as from scalp EEG, whereas thereis a steeper increase of the feature from invasive EEG thanfrom scalp EEG.
Due to this observed different patterns of the spikingrates from scalp and invasive EEG during the seizures,detection latencies and differences in the threshold crossingtimes between seizures detected from scalp and intracranialEEG data were investigated. In order to compare thethreshold crossing times between different featuresobtained from scalp and invasive EEG, we chose for eachfeature the smallest possible threshold for a given maxi-mum false detection rate of 0.15 FD/h. The latencies weredetermined by comparing the detection time-pointsobtained from scalp and invasive EEG data of respective
seizures with their electroencephalographic seizure onsets,i.e. the latency is the difference between the time-point ofdetection and the time-point of the electroencephalo-graphic onset.
In Fig. 3 the latencies of threshold crossing times of thespiking rate from scalp EEG and invasive EEG withrespect to the electroencephalographic seizure onset areshown for all investigated 26 seizures of the six patients.The latencies are in general positive, i.e. most of the sei-zures are detected after the occurrence of the electroen-cephalographic seizure onset. The latencies are alsocompared between scalp and invasive EEG. As not all sei-zures are detectable from invasive as well as scalp EEGrecording, the latencies are only comparable for in totalten seizures of the patients 01, 02, 03, 05 and 06. Forpatient 01 and patient 02, as well as for patient 06, the dif-ferences D = latencyi � latencys between the latencies frominvasive and scalp EEG are negative, i.e. an earlier detec-tion was possible using invasive EEG recordings. Forpatient 03 and patient 05, latency differences D are positiveand therefore the seizures of these patients were detectedearlier using scalp EEG recordings than invasive EEGrecordings.
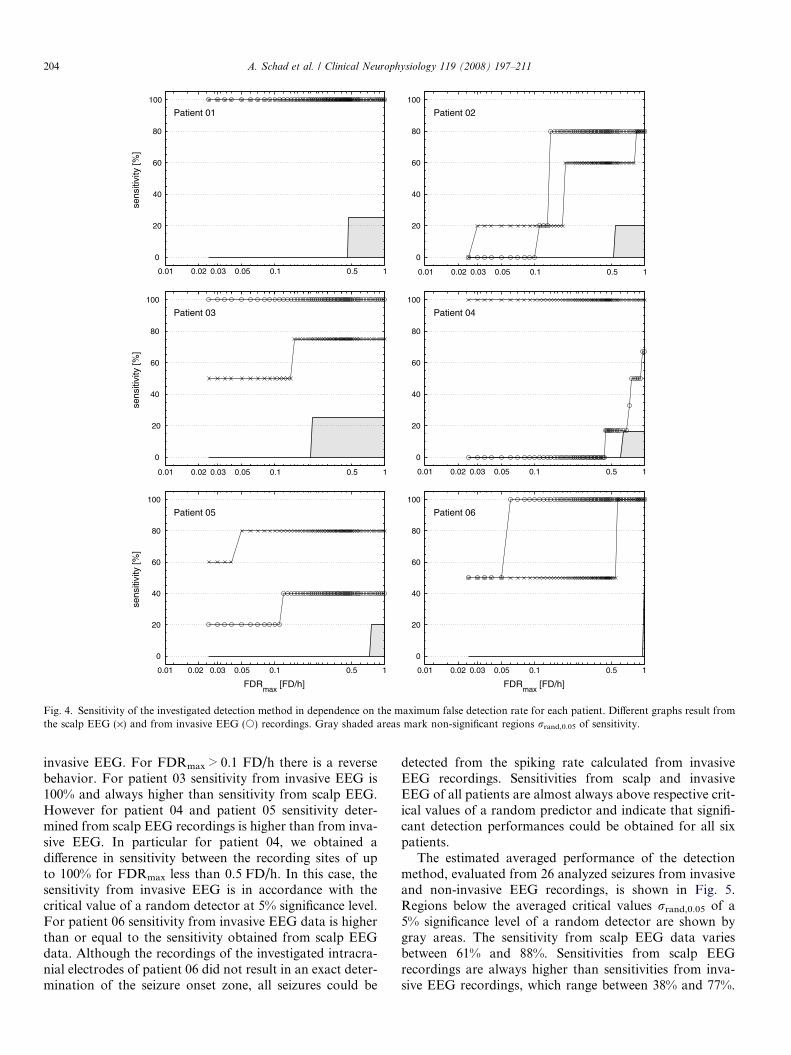
Patient individual results of the detection performancesfrom invasive and non-invasive EEG recordings are pre-sented in Fig. 4. The performances are given in dependenceon FDRmax, which was varied between 0.025 and 1 FD/h.For patient 01 a sensitivity of 100% is obtained for all val-ues of FDRmax with either type of data acquisition. Forpatient 02, sensitivity increases from 0% to 80% withincreasing FDRmax. For this patient there is no clear supe-riority over performances either from scalp or from inva-sive EEG recordings. For FDRmax < 0.1 FD/h sensitivityobtained from scalp EEG is higher than sensitivity from
sens
itivi
ty [%
]
Patient 01
0
20
40
60
80
100
Patient 02
0
20
40
60
80
100
sens
itivi
ty [%
]
Patient 03
0.01 0.02 0.03 0.05 0.1 0.5 1
0.01 0.02 0.03 0.05 0.1 0.5 1 0.01 0.02 0.03 0.05 0.1 0.5 1
0.01 0.02 0.03 0.05 0.1 0.5 1
0.01 0.02 0.03 0.05 0.1 0.5 10.01 0.02 0.03 0.05 0.1 0.5 1
0
20
40
60
80
100
Patient 04
0
20
40
60
80
100
FDRmax
[FD/h]
sens
itivi
ty [%
]
Patient 05
0
20
40
60
80
100
FDRmax
[FD/h]
Patient 06
0
20
40
60
80
100
Fig. 4. Sensitivity of the investigated detection method in dependence on the maximum false detection rate for each patient. Different graphs result fromthe scalp EEG (·) and from invasive EEG (s) recordings. Gray shaded areas mark non-significant regions rrand,0.05 of sensitivity.
204 A. Schad et al. / Clinical Neurophysiology 119 (2008) 197–211
invasive EEG. For FDRmax > 0.1 FD/h there is a reversebehavior. For patient 03 sensitivity from invasive EEG is100% and always higher than sensitivity from scalp EEG.However for patient 04 and patient 05 sensitivity deter-mined from scalp EEG recordings is higher than from inva-sive EEG. In particular for patient 04, we obtained adifference in sensitivity between the recording sites of upto 100% for FDRmax less than 0.5 FD/h. In this case, thesensitivity from invasive EEG is in accordance with thecritical value of a random detector at 5% significance level.For patient 06 sensitivity from invasive EEG data is higherthan or equal to the sensitivity obtained from scalp EEGdata. Although the recordings of the investigated intracra-nial electrodes of patient 06 did not result in an exact deter-mination of the seizure onset zone, all seizures could be
detected from the spiking rate calculated from invasiveEEG recordings. Sensitivities from scalp and invasiveEEG of all patients are almost always above respective crit-ical values of a random predictor and indicate that signifi-cant detection performances could be obtained for all sixpatients.
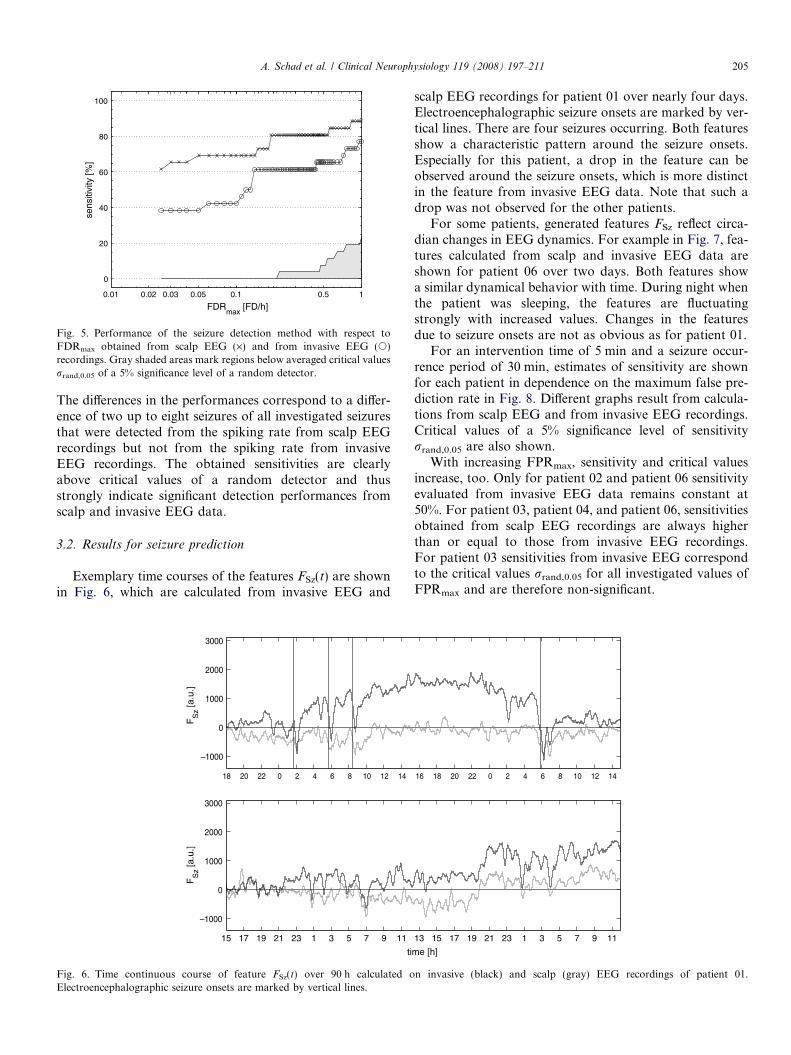
The estimated averaged performance of the detectionmethod, evaluated from 26 analyzed seizures from invasiveand non-invasive EEG recordings, is shown in Fig. 5.Regions below the averaged critical values rrand,0.05 of a5% significance level of a random detector are shown bygray areas. The sensitivity from scalp EEG data variesbetween 61% and 88%. Sensitivities from scalp EEGrecordings are always higher than sensitivities from inva-sive EEG recordings, which range between 38% and 77%.
FDRmax
[FD/h]
sens
itivi
ty [%
]
0.01 0.02 0.03 0.05 0.1 0.5 1
0
20
40
60
80
100
Fig. 5. Performance of the seizure detection method with respect toFDRmax obtained from scalp EEG (·) and from invasive EEG (s)recordings. Gray shaded areas mark regions below averaged critical valuesrrand,0.05 of a 5% significance level of a random detector.
A. Schad et al. / Clinical Neurophysiology 119 (2008) 197–211 205
The differences in the performances correspond to a differ-ence of two up to eight seizures of all investigated seizuresthat were detected from the spiking rate from scalp EEGrecordings but not from the spiking rate from invasiveEEG recordings. The obtained sensitivities are clearlyabove critical values of a random detector and thusstrongly indicate significant detection performances fromscalp and invasive EEG data.
3.2. Results for seizure prediction
Exemplary time courses of the features FSz(t) are shownin Fig. 6, which are calculated from invasive EEG and
18 20 22 0 2 4 6 8 10 12 14
–1000
0
1000
2000
3000
FS
z [a.u
.]
15 17 19 21 23 1 3 5 7 9 11
–1000
0
1000
2000
3000
ti
FS
z [a.u
.]
Fig. 6. Time continuous course of feature FSz(t) over 90 h calculated oElectroencephalographic seizure onsets are marked by vertical lines.
scalp EEG recordings for patient 01 over nearly four days.Electroencephalographic seizure onsets are marked by ver-tical lines. There are four seizures occurring. Both featuresshow a characteristic pattern around the seizure onsets.Especially for this patient, a drop in the feature can beobserved around the seizure onsets, which is more distinctin the feature from invasive EEG data. Note that such adrop was not observed for the other patients.
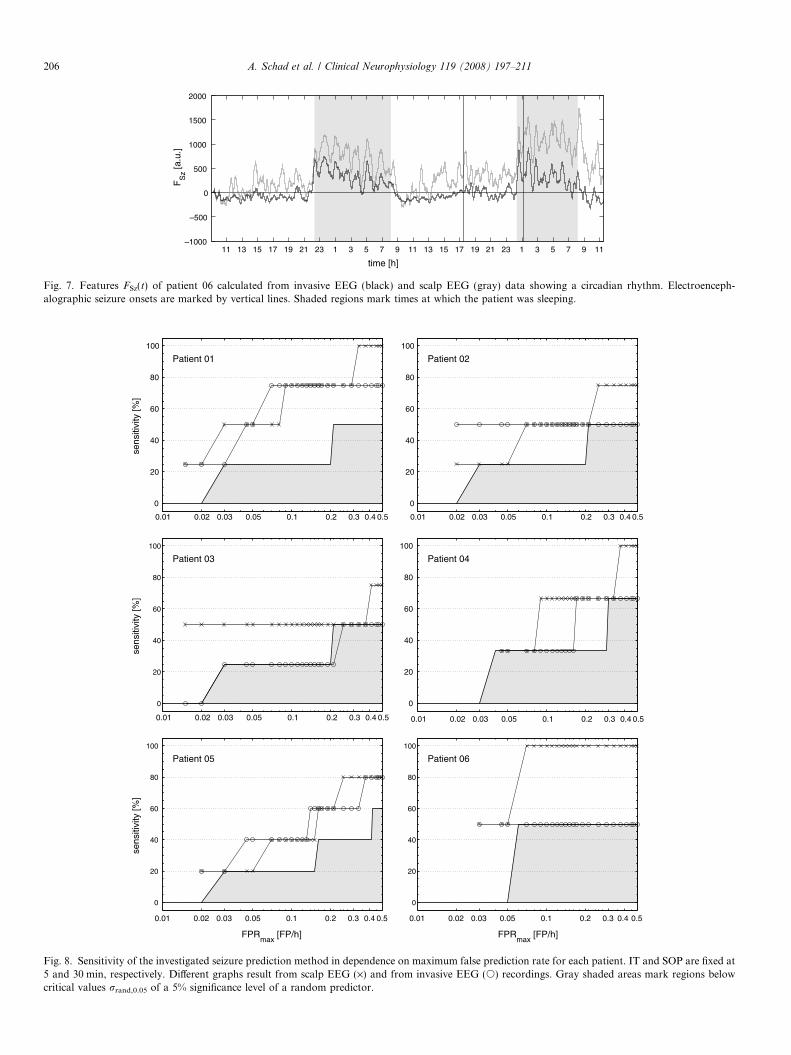
For some patients, generated features FSz reflect circa-dian changes in EEG dynamics. For example in Fig. 7, fea-tures calculated from scalp and invasive EEG data areshown for patient 06 over two days. Both features showa similar dynamical behavior with time. During night whenthe patient was sleeping, the features are fluctuatingstrongly with increased values. Changes in the featuresdue to seizure onsets are not as obvious as for patient 01.
For an intervention time of 5 min and a seizure occur-rence period of 30 min, estimates of sensitivity are shownfor each patient in dependence on the maximum false pre-diction rate in Fig. 8. Different graphs result from calcula-tions from scalp EEG and from invasive EEG recordings.Critical values of a 5% significance level of sensitivityrrand,0.05 are also shown.
With increasing FPRmax, sensitivity and critical valuesincrease, too. Only for patient 02 and patient 06 sensitivityevaluated from invasive EEG data remains constant at50%. For patient 03, patient 04, and patient 06, sensitivitiesobtained from scalp EEG recordings are always higherthan or equal to those from invasive EEG recordings.For patient 03 sensitivities from invasive EEG correspondto the critical values rrand,0.05 for all investigated values ofFPRmax and are therefore non-significant.
16 18 20 22 0 2 4 6 8 10 12 14
13 15 17 19 21 23 1 3 5 7 9 11
me [h]
n invasive (black) and scalp (gray) EEG recordings of patient 01.
time [h]
FS
z [a.u
.]
11 13 15 17 19 21 23 1 3 5 7 9 11 13 15 17 19 21 23 1 3 5 7 9 11–1000
–500
0
500
1000
1500
2000
Fig. 7. Features FSz(t) of patient 06 calculated from invasive EEG (black) and scalp EEG (gray) data showing a circadian rhythm. Electroenceph-alographic seizure onsets are marked by vertical lines. Shaded regions mark times at which the patient was sleeping.
sens
itivi
ty [%
]
Patient 01
0.01 0.02 0.03 0.05 0.1 0.2 0.3 0.4 0.5
0
20
40
60
80
100
Patient 02
0.01 0.02 0.03 0.05 0.1 0.2 0.3 0.4 0.5
0.01 0.02 0.03 0.05 0.1 0.2 0.3 0.4 0.50.01 0.02 0.03 0.05 0.1 0.2 0.3 0.4 0.5
0.01 0.02 0.03 0.05 0.1 0.2 0.3 0.4 0.5 0.01 0.02 0.03 0.05 0.1 0.2 0.3 0.4 0.5
0
20
40
60
80
100
sens
itivi
ty [%
]
Patient 03
0
20
40
60
80
100
Patient 04
0
20
40
60
80
100
FPRmax
[FP/h]
sens
itivi
ty [%
]
Patient 05
0
20
40
60
80
100
FPRmax
[FP/h]
Patient 06
0
20
40
60
80
100
Fig. 8. Sensitivity of the investigated seizure prediction method in dependence on maximum false prediction rate for each patient. IT and SOP are fixed at5 and 30 min, respectively. Different graphs result from scalp EEG (·) and from invasive EEG (s) recordings. Gray shaded areas mark regions belowcritical values rrand,0.05 of a 5% significance level of a random predictor.
206 A. Schad et al. / Clinical Neurophysiology 119 (2008) 197–211
FPRmax
[FP/h]
sens
itivi
ty [%
]
0.01 0.02 0.03 0.05 0.1 0.2 0.3 0.4 0.50
20
40
60
80
100
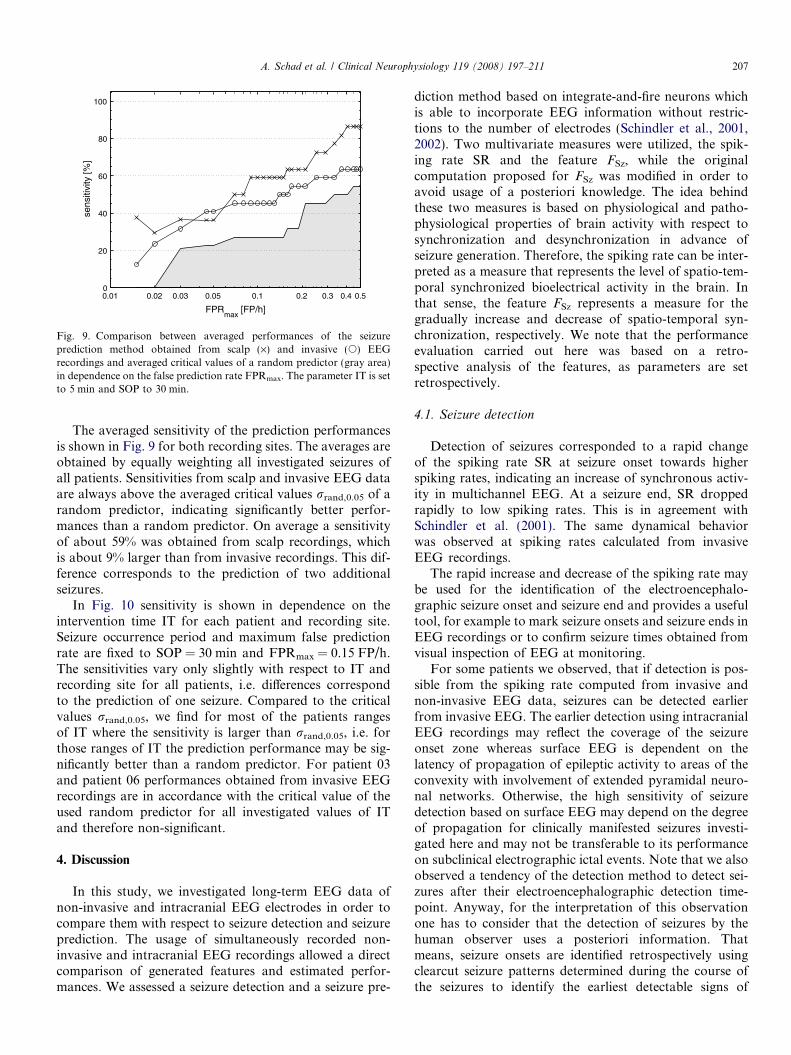
Fig. 9. Comparison between averaged performances of the seizureprediction method obtained from scalp (·) and invasive (s) EEGrecordings and averaged critical values of a random predictor (gray area)in dependence on the false prediction rate FPRmax. The parameter IT is setto 5 min and SOP to 30 min.
A. Schad et al. / Clinical Neurophysiology 119 (2008) 197–211 207
The averaged sensitivity of the prediction performancesis shown in Fig. 9 for both recording sites. The averages areobtained by equally weighting all investigated seizures ofall patients. Sensitivities from scalp and invasive EEG dataare always above the averaged critical values rrand,0.05 of arandom predictor, indicating significantly better perfor-mances than a random predictor. On average a sensitivityof about 59% was obtained from scalp recordings, whichis about 9% larger than from invasive recordings. This dif-ference corresponds to the prediction of two additionalseizures.
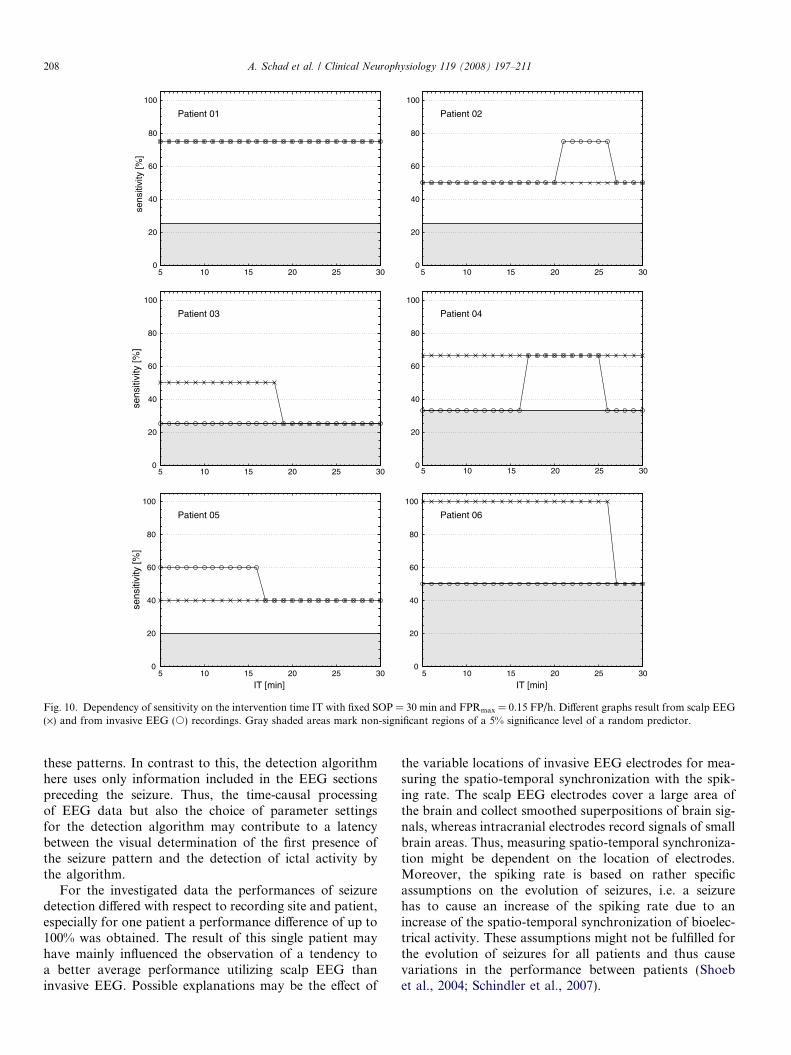
In Fig. 10 sensitivity is shown in dependence on theintervention time IT for each patient and recording site.Seizure occurrence period and maximum false predictionrate are fixed to SOP = 30 min and FPRmax = 0.15 FP/h.The sensitivities vary only slightly with respect to IT andrecording site for all patients, i.e. differences correspondto the prediction of one seizure. Compared to the criticalvalues rrand,0.05, we find for most of the patients rangesof IT where the sensitivity is larger than rrand,0.05, i.e. forthose ranges of IT the prediction performance may be sig-nificantly better than a random predictor. For patient 03and patient 06 performances obtained from invasive EEGrecordings are in accordance with the critical value of theused random predictor for all investigated values of ITand therefore non-significant.
4. Discussion
In this study, we investigated long-term EEG data ofnon-invasive and intracranial EEG electrodes in order tocompare them with respect to seizure detection and seizureprediction. The usage of simultaneously recorded non-invasive and intracranial EEG recordings allowed a directcomparison of generated features and estimated perfor-mances. We assessed a seizure detection and a seizure pre-
diction method based on integrate-and-fire neurons whichis able to incorporate EEG information without restric-tions to the number of electrodes (Schindler et al., 2001,2002). Two multivariate measures were utilized, the spik-ing rate SR and the feature FSz, while the originalcomputation proposed for FSz was modified in order toavoid usage of a posteriori knowledge. The idea behindthese two measures is based on physiological and patho-physiological properties of brain activity with respect tosynchronization and desynchronization in advance ofseizure generation. Therefore, the spiking rate can be inter-preted as a measure that represents the level of spatio-tem-poral synchronized bioelectrical activity in the brain. Inthat sense, the feature FSz represents a measure for thegradually increase and decrease of spatio-temporal syn-chronization, respectively. We note that the performanceevaluation carried out here was based on a retro-spective analysis of the features, as parameters are setretrospectively.
4.1. Seizure detection
Detection of seizures corresponded to a rapid changeof the spiking rate SR at seizure onset towards higherspiking rates, indicating an increase of synchronous activ-ity in multichannel EEG. At a seizure end, SR droppedrapidly to low spiking rates. This is in agreement withSchindler et al. (2001). The same dynamical behaviorwas observed at spiking rates calculated from invasiveEEG recordings.
The rapid increase and decrease of the spiking rate maybe used for the identification of the electroencephalo-graphic seizure onset and seizure end and provides a usefultool, for example to mark seizure onsets and seizure ends inEEG recordings or to confirm seizure times obtained fromvisual inspection of EEG at monitoring.
For some patients we observed, that if detection is pos-sible from the spiking rate computed from invasive andnon-invasive EEG data, seizures can be detected earlierfrom invasive EEG. The earlier detection using intracranialEEG recordings may reflect the coverage of the seizureonset zone whereas surface EEG is dependent on thelatency of propagation of epileptic activity to areas of theconvexity with involvement of extended pyramidal neuro-nal networks. Otherwise, the high sensitivity of seizuredetection based on surface EEG may depend on the degreeof propagation for clinically manifested seizures investi-gated here and may not be transferable to its performanceon subclinical electrographic ictal events. Note that we alsoobserved a tendency of the detection method to detect sei-zures after their electroencephalographic detection time-point. Anyway, for the interpretation of this observationone has to consider that the detection of seizures by thehuman observer uses a posteriori information. Thatmeans, seizure onsets are identified retrospectively usingclearcut seizure patterns determined during the course ofthe seizures to identify the earliest detectable signs of
sens
itivi
ty [%
]
Patient 01
5 10 15 20 25 30
5 10 15 20 25 30 5 10 15 20 25 30
0
20
40
60
80
100
Patient 02
5 10 15 20 25 300
20
40
60
80
100
sens
itivi
ty [%
]
Patient 03
0
20
40
60
80
100
Patient 04
0
20
40
60
80
100
IT [min]
sens
itivi
ty [%
]
Patient 05
5 10 15 20 25 300
20
40
60
80
100
IT [min]
Patient 06
5 10 15 20 25 300
20
40
60
80
100
Fig. 10. Dependency of sensitivity on the intervention time IT with fixed SOP = 30 min and FPRmax = 0.15 FP/h. Different graphs result from scalp EEG(·) and from invasive EEG (s) recordings. Gray shaded areas mark non-significant regions of a 5% significance level of a random predictor.
208 A. Schad et al. / Clinical Neurophysiology 119 (2008) 197–211
these patterns. In contrast to this, the detection algorithmhere uses only information included in the EEG sectionspreceding the seizure. Thus, the time-causal processingof EEG data but also the choice of parameter settingsfor the detection algorithm may contribute to a latencybetween the visual determination of the first presence ofthe seizure pattern and the detection of ictal activity bythe algorithm.
For the investigated data the performances of seizuredetection differed with respect to recording site and patient,especially for one patient a performance difference of up to100% was obtained. The result of this single patient mayhave mainly influenced the observation of a tendency toa better average performance utilizing scalp EEG thaninvasive EEG. Possible explanations may be the effect of
the variable locations of invasive EEG electrodes for mea-suring the spatio-temporal synchronization with the spik-ing rate. The scalp EEG electrodes cover a large area ofthe brain and collect smoothed superpositions of brain sig-nals, whereas intracranial electrodes record signals of smallbrain areas. Thus, measuring spatio-temporal synchroniza-tion might be dependent on the location of electrodes.Moreover, the spiking rate is based on rather specificassumptions on the evolution of seizures, i.e. a seizurehas to cause an increase of the spiking rate due to anincrease of the spatio-temporal synchronization of bioelec-trical activity. These assumptions might not be fulfilled forthe evolution of seizures for all patients and thus causevariations in the performance between patients (Shoebet al., 2004; Schindler et al., 2007).
A. Schad et al. / Clinical Neurophysiology 119 (2008) 197–211 209
For the evaluation of the investigated multivariatedetection method, we made no preselection of electrodeseither for scalp or invasive EEG. For the here used mul-tivariate algorithms it is not necessary to select certainsingle electrodes to measure spatial synchronous activityin the brain. The simulated integrate and fire neuronsof the algorithms can be regarded as coincidence detec-tors that extract electrodes that comprise this type ofactivity via the spatio-temporal integration. This is incontrast to former evaluations of published bivariate pre-diction measures where it was necessary to compare elec-trodes pairwise, which led to multiple testing problems(Schelter et al., 2006a). This problem can be avoidedusing multivariate algorithms like the here investigatedones.
In an earlier evaluation of the detection method whichwas used in this study applied to about 11 h scalp EEGrecordings of 15 patients by Sazonov et al. (2002), a sensi-tivity of 87% and a false detection rate of about 61.18 FD/hwere found. This result agrees with ours, though we inves-tigated false detection rates 61 FD/h. Compared to otherpublished detection methods like, for instance, Wilsonet al. (2004) or Saab and Gotman (2005), our results showsimilar detection ability, when choosing comparable falsedetection rates.
4.2. Seizure prediction
For a successful seizure prediction with regard to clinicalapplications, required values of sensitivity, specificity, andprediction times strongly depend on the mechanism of anintervention system and its effect on patient (Winterhalderet al., 2003). Although we obtained an average sensitivityof 59% from scalp EEG and 50% from invasive EEG onour data pool, for clinical applications sensitivity shouldbe increased to obtain a sufficient seizure prediction withsmall FPRmax (FPRmax < 0.15 FP/h) (Aschenbrenner-Scheibe et al., 2003; Maiwald et al., 2004). This is basedon considerations, that e.g. for pharmacorefractorypatients with a typical mean seizure frequency of three sei-zures per month (Bauer and Burr, 2001), for an interven-tion system with a false prediction rate of 0.15 FP/h, upto 97% of all alarms would be false alarms, even for a sen-sitivity of 100%. If we apply these considerations to ourresults obtained from 420 h EEG and 22 seizures, a sensi-tivity of 50% would cause 85% false alarms.
An important standard for the assessment of the perfor-mance of a prediction method is the comparison with theperformance of a random predictor (Mormann et al.,2006). A critical value rrand,a for a significance level a ofsuch a random predictor was presented for estimations ofsensitivity of prediction methods from EEG signals in anearlier study (Schelter et al., 2006a). The comparison ofthe performances of the prediction method investigatedwith rrand,a for a = 0.05 indicates that on average the pre-diction method may perform better than an unspecific ran-dom predictor regardless of the recording site of the
investigated EEG, but for single patients also non-signifi-cant sensitivities were obtained. Further, a reliable predic-tion method should provide a patient specific value for theintervention time. In our study, for most patients sensitiv-ity is nearly independent of the investigated duration of thechosen intervention time IT.
A possible explanation of this insufficient performancemay be found by regarding the features itself. Characteris-tically for the seizure prediction pattern of the investigatedmethod, the feature FSz increases before seizure onset. Butthis pattern also appears within interictal segments, duringwhich FSz oscillates irregularly with comparable amplitudeto preictal segments. For one patient we also found a char-acteristic sudden drop in FSz which interrupts the increaseof FSz some minutes in advance of the seizure onset. Forother patients, features obtained from scalp as well as frominvasive EEG recordings actually showed circadian varia-tions. This indicates that the feature FSz is also sensitiveto non-seizure related brain activities.
For patient 06, an extensive coverage of brain areasmostly secondarily involved in epileptic activity shows par-ticularly clearly a circadian rhythmicity which correspondswell to changes in vigilance derived from sleep staging ofsurface EEG. Thus, there is a major increase in the baselineof the feature FSz when this patient fell asleep and adecrease to a lower level of FSz when the patient awokeagain over several cycles. Altogether these observationsconfirm well the results of a previous study based onnon-intracranial EEG (Schindler et al., 2002), where thefeatures also oscillated with increased amplitude duringnight, indicating sleep induced changes of the measure.
Such circadian changes may markedly affect the perfor-mance of seizure prediction algorithms when a singlethreshold crossing is used as a criterion for the identifica-tion of the preictal period (Schelter et al., 2006b). Forexample increases of the feature FSz during sleep may causeincreased false predictions at night, due to the applicationof a fixed threshold in the presented retrospective analysis.The usage of a continuously adapted threshold compensat-ing for increases of mean and variance of the feature mayobviate such false predictions during sleep and thusimprove the performance (Mormann et al., 2003a; Estelleret al., 2005; Schelter et al., 2006b). Moreover, an analysis offalse predictions, for example by visual inspection of fea-tures and respective EEG data in a retrospective analysis,may help to provide insights into underlying mechanismscausing false predictions (Navarro et al., 2005). But notethat false predictions during periods of sleep may not havethe same therapeutic implications for patients (Schelteret al., 2006b).
Thus, the measure used here certainly does not onlyreflect synchronous behavior of pathological activity asexpected in the seizure onset zone but also physiologicalchanges. Such not epilepsy-related variability may limitthe specificity of the measure for seizure prediction butotherwise it may offer additional fields of implementations.Interestingly the features obtained from simultaneous scalp
210 A. Schad et al. / Clinical Neurophysiology 119 (2008) 197–211
and intracranial EEG recordings comprise a very similardynamic behavior and showed similar influences of seizureand non-seizure related influences from EEG.
4.3. Conclusions and outlook
Features of the prediction method obtained from scalpand corresponding invasive EEG recordings showed a sim-ilar dynamical behavior. Conspicuous differences betweenthe respective performances were not observed. An adapta-tion of the investigated multivariate prediction methodoriginally developed for non-invasive EEG to intracranialEEG data is possible. The prediction performancesachieved on the investigated data pool were not sufficientregarding a clinical valid seizure prediction with large sen-sitivities and specificities, but alterations of the predictionalgorithm, e.g. utilizing dynamical thresholds, in order toimprove the performance are conceivable.
Further we observed that seizure detection is also possi-ble on intracranial EEG recordings. Depending on thepatient, detection performances may be superior utilizingscalp or intracranial EEG. Due to the obtained detectionperformances, possible supporting applications of thedetection method are conceivable, for instance an auto-matic detection of epileptic seizures during clinical moni-toring with large sensitivities and reasonable falsedetection rates.
We observed influences of sleep on the spiking rate andFSz. Future investigations will examine the effects of sleepas well as changes of vigilance, and subclinical seizureson the performance of the considered detection and predic-tion method. In this study and previous applications of theinvestigated detection and prediction method, fixed thresh-olds were used for seizure detection and prediction. A fur-ther current point of interest is the application ofdynamical thresholds in order to improve performances(Schelter et al., 2006b).
In particular, the usage of time-continuous, simulta-neous EEG recordings of scalp and invasive electrodesenables new possibilities in analyzing multivariate seizuredetection and prediction algorithms. It may provide newinsights into underlying mechanisms of generation andpropagation of seizures as well as physiological synchroni-zation mechanisms. Thus, further collection of such data isan important objective and will improve future efforts instatistical validations in this field.
Acknowledgements
This work was supported by the German Federal Min-istry of Education and Research (BMBF Grant01GQ0420) and the German Science Foundation (DFGTransregio-SFB TR3/A2, Ti 315/2-1). Note that a com-mercial implementation of the detection algorithm is al-ready available, integrated in a software package fromEEMAGINE Medical Imaging Solutions GmbH by thework of A. Sazonov (Sazonov et al., 2002).
References
Aschenbrenner-Scheibe R, Maiwald T, Winterhalder M, Voss HU,Timmer J, Schulze-Bonhage A. How well can epileptic seizures bepredicted? An evaluation of a nonlinear method. Brain2003;126:2616–26.
Bauer J, Burr W. Course of chronic focal epilepsy resistant to anticon-vulsant treatment. Seizure 2001;10:239–46.
Bhavaraju NC, Frei MG, Osorio I. Analog seizure detection andperformance evaluation. IEEE Trans Biomed Eng 2006;53:238–45.
Bialonski S, Lehnertz K. Identifying phase synchronization clustersin spatially extended dynamical systems. Phys Rev E2006;74:051909.
Cockerell O, Johnson A, Sander J, Hart Y, Goodridge D, Shorvon S.Mortality from epilepsy: results from a prospective population-basedstudy. Lancet 1994:918–21.
Dichter MA, Ayala GF. Cellular mechanisms of epilepsy: a status report.Science 1987;237:157–64.
Engel Jr J. Outcome with respect to epileptic seizures. In: Engel Jr J,editor. Surgical treatment of the epilepsies. New York: Raven Press;1987. p. 553–71.
Esteller R, Echauz J, D’Alessandro M, Worrell G, Cranstoun S,Vachtsevanos G, et al. Continuous energy variation during the seizurecycle: towards an on-line accumulated energy. Clin Neurophysiol2005;116:517–26.
Frei MG, Haas SM, Osorio I. Adaptation of a real-time seizuredetection algorithm. Stochastic Theory and Control: Proceedings ofa Workshop held in Lawrence, Kansas. Berlin/Heidelberg: Springer;2002. p. 131–6.
Gotman J. Automatic seizure detection: improvements and evaluation.Electroencephalogr Clin Neurophysiol 1990;76:317–24.
Gotman J. Automatic detection of seizures and spikes. J Clin Neuro-physiol 1999;116:130–40.
Haut SR, Swick C, Freeman K, Spencer S. Seizure clustering duringepilepsy monitoring. Epilepsia 2002;43:711–5.
Iasemidis L, Sackellares J, Zaveri H, Williams W. Phase space topographyand the Lyapunov exponent of electrocorticograms in partial seizures.Brain Topogr 1990;2:187–201.
Jerger KK, Netoff TI, Francis JT, Sauer T, Pecora L, Weinstein SL, et al.Early seizure detection. J Clin Neurophysiol 2001;18:259–68.
Jerger KK, Weinstein SL, Sauer T, Schiff SJ. Multivariate lineardiscrimination of seizures. Clin Neurophysiol 2005;116:545–51.
Le van Quyen M, Martinerie J, Baulac M, Varela F. Anticipating epilepticseizures in real time by a non-linear analysis of similarity between EEGrecordings. Neuroreport 1999;10:2149–55.
Le van Quyen M, Adam C, Martinerie J, Baulac M, Clemenceau S, VarelaF. Spatio-temporal characterizations of non-linear changes in intra-cranial activities prior to human temporal lobe seizures. Eur JNeurosci 2000;12:2124–34.
Le van Quyen M, Martinerie J, Navarro V, Baulac M, Varela F.Characterizing neurodynamic changes before seizures. J Clin Neuro-physiol 2001a;18:191–208.
Le van Quyen M, Martinerie J, Navarro V, Boon P, D’Have M, Adam C,et al. Anticipation of epileptic seizures from standard EEG recordings.Lancet 2001b;357:183–8.
Lehnertz K, Elger C. Can epileptic seizures be predicted? Evidence fromnonlinear time series analysis of brain electrical activity. Phys Rev Lett1998;80:5019–22.
Litt B, Esteller R, Echauz J, D’Alessandro M, Shor R, Henry T, et al.Epileptic seizures may begin hours in advance of clinical onset: areport of five patients. Neuron 2001;30:51–64.
Maiwald T, Winterhalder M, Aschenbrenner-Scheibe R, Voss H, Schulze-Bonhage A, Timmer J. Comparison of three nonlinear seizureprediction methods by means of the seizure prediction characteristic.Physica D 2004;194:357–68.
Mormann F, Lehnertz K, David P, Elger C. Mean phase coherence as ameasure for phase synchronization and its application to the EEG ofepilepsy patients. Physica D 2000;144:358–69.
A. Schad et al. / Clinical Neurophysiology 119 (2008) 197–211 211
Mormann F, Andrzejak R, Kreuz T, Rieke C, David P, Elger C, et al.Automated detection of a pre-seizure state based on a decrease insynchronization in intracranial EEG recordings from epilepsy patient.Phys Rev E 2003a;67:021912.
Mormann F, Kreuz T, Andrzejak R, David P, Lehnertz K, Elger C.Epileptic seizures are preceded by a decrease in synchronization.Epilepsy Res 2003b;53:173–85.
Mormann F, Elger CE, Lehnertz K. Seizure anticipation: from algorithmsto clinical practice. Curr Opin Neurol 2006;19:187–93.
Mueller M, Jimenez YL, Rummel C, Baier G. Localized short-rangecorrelations in the spectrum of the equal-time correlation matrix. PhysRev E 2006;74:041119.
Murray J. Coping with the uncertainty of uncontrolled epilepsy. Seizure1993;2:167–78.
Navarro V, Martinerie J, Le Van Quyen M, Clemenceau S, Adam C,Baulac M, et al. Seizure anticipation in human neocortical partialepilepsy. Brain 2002;125:640–55.
Navarro V, Martinerie J, Quyen MLV, Baulac M. Seizure anticipation:Do mathematical measures correlate with video–EEG evaluation?Epilepsia 2005;46:385–96.
Osorio I, Frei M, Wilkinson S. Real-time automated detection andquantitative analysis of seizures and short-term prediction of clinicalonset. Epilepsia 1998;39:615–27.
Osorio I, Frei MG, Bhavaraju NC, Sunderam S, Giftakis J, BhavarajuNC, et al. Automated seizure abatement in humans using electricalstimulation. Ann Neurol 2005;57:258–68.
Saab ME, Gotman J. A system to detect the onset of epileptic seizures inscalp EEG. Clin Neurophysiol 2005;116:427–42.
Sazonov A, Schindler K, Duempelmann M, Loher T, Donati F, Mathis J,et al. Evaluation of a method for automatic detection of epilepticseizures from electroencephalogram (EEG). Epilepsia 2002;43(Suppl7):50.
Schelter B, Winterhalder M, Maiwald T, Brandt A, Schad A, Schulze-Bonhage A, et al. Testing statistical significance of multivariate timeseries analysis techniques for epileptic seizure prediction. Chaos2006a;16:013108.
Schelter B, Winterhalder M, Maiwald T, Brandt A, Schad A, Timmer J,et al. Do false predictions of seizures depend on the state of vigilance?A report from two seizure-prediction methods and proposed remedies.Epilepsia 2006b;47:2058–70.
Schiff SJ. Dangerous phase. Neuroinformatics 2005;3:315–8.Schindler K, Wiest R, Kollar M, Donati F. Using simulated neuronal cell
models for detection of epileptic seizures in foramen ovale and scalpEEG. Clin Neurophysiol 2001;112:1006–17.
Schindler K, Wiest R, Kollar M, Donati F. EEG analysis with simulatedneuronal cell models helps to detect pre-seizure changes. ClinNeurophysiol 2002;113:604–14.
Schindler K, Leung H, Elger CE, Lehnertz K. Assessing seizure dynamicsby analysing the correlation structure of multichannel intracranialEEG. Brain 2007;130:65–77.
Shoeb A, Edwards H, Connolly J, Bourgeois B, Treves ST, Guttag J.Patient-specific seizure onset detection. Epilepsy Behav 2004;5:483–98.
Stein AG, Eder HG, Blum DE, Drachev A, Fisher RS. An automateddrug delivery system for focal epilepsy. Epilepsy Res 2000;39:103–14.
Wilson SB, Scheuer ML, Emerson RG, Gabor AJ. Seizure detection:evaluation of the Reveal algorithm. Clin Neurophysiol2004;115:2280–91.
Winterhalder M, Maiwald T, Voss HU, Aschenbrenner-Scheibe R,Timmer J, Schulze-Bonhage A. The seizure prediction characteristic:a general framework to assess and compare seizure predictionmethods. Epilepsy Behav 2003;4:318–25.
Zaveri HP, Duckrow RB, Spencer SS. The effect of a scalp reference signalon coherence measurements of intracranial electroencephalograms.Clin Neurophysiol 2000;111:1293–9.
Related Documents