Simultaneous MEG and intracranial EEG recordings during attentive reading Sarang S. Dalal a,b,c , Sylvain Baillet d,e , Claude Adam d,e , Antoine Ducorps d,e , Denis Schwartz d,e , Karim Jerbi a,b,c,f , Olivier Bertrand a,b,c , Line Garnero d,e , Jacques Martinerie d,e , Jean-Philippe Lachaux a,b,c,d,e, ⁎ a Dynamique Cérébrale et Cognition, INSERM Unité 821, Lyon, France b Institut Fédératif des Neurosciences, Lyon, France c Université Lyon 1, France d Laboratoire de Neurosciences Cognitives et Imagerie Cérébrale, CNRS UPR640-LENA, Hôpital de la Salpêtrière, Paris, France e UPMC Univ. Paris 06, France f Laboratoire de Physiologie de la Perception et de l'Action, CNRS UMR 7152, Collège de France, Paris, France abstract article info Article history: Received 23 January 2007 Revised 23 December 2008 Accepted 9 January 2009 Available online 24 January 2009 Keywords: Magnetoencephalography Subdural electrodes Intracranial electroencephalography Electrocorticography Epilepsy surgery Gamma band Source localization Beamformer The relationship between neural oscillations recorded at various spatial scales remains poorly understood partly due to an overall dearth of studies utilizing simultaneous measurements. In an effort to study quantitative markers of attention during reading, we performed simultaneous magnetoencephalography (MEG) and intracranial electroencephalography (iEEG) recordings in four epileptic patients. Patients were asked to attend to a specific color when presented with an intermixed series of red words and green words, with words of a given color forming a cohesive story. We analyzed alpha, beta, and gamma band oscillatory responses to the word presentation and compared the strength and spatial organization of those responses in both electrophysiological recordings. Time-frequency analysis of iEEG revealed a network of clear attention- modulated high gamma band (50–150 Hz) power increases and alpha/beta (9–25 Hz) suppressions in response to the words. In addition to analyses at the sensor level, MEG time-frequency analysis was performed at the source level using a sliding window beamformer technique. Strong alpha/beta suppressions were observed in MEG reconstructions, in tandem with iEEG effects. While the MEG counterpart of high gamma band enhancement was difficult to interpret at the sensor level in two patients, MEG time-frequency source reconstruction revealed additional activation patterns in accordance with iEEG results. Importantly, iEEG allowed us to confirm that several sources of gamma band modulation observed with MEG were indeed of cortical origin rather than EMG muscular or ocular artifact. © 2009 Elsevier Inc. All rights reserved. Introduction An increasing body of evidence gathered over the last fifteen years suggests that most cognitive functions, from sensory and motor processing to language or memory, involve the formation of local neural assemblies characterized by synchronous oscillations in the gamma band, i.e., at frequencies starting at 40 Hz (for reviews, see Singer, 1999; Tallon-Baudry and Bertrand, 1999). Interestingly, the formation of such assemblies seems to depend upon the degree of attention allocated by subjects or animals to the task at hand (Bauer et al., 2006; Bichot et al., 2005; Fries et al., 2001; Gruber et al., 1999; Steinmetz et al., 2000; Tallon-Baudry et al., 2005), which suggests that monitoring gamma band activity could provide a quantitative measure reflecting attention. Indeed, in a recent intracerebral EEG study, which manipulated explicitly the attention of subjects in a verbal working memory task, we found that gamma band responses were stronger for attended stimuli, later recalled, than for unattended ones (Mainy et al., 2007). We have all experienced the effect of attention fluctuations on performance in the context of reading, sometimes having the sen- sation of “flying over” entire pages without truly absorbing their meaning. The previously mentioned studies led us to hypothesize that it may be possible to monitor the degree of attention during reading by measuring the spectral power in the alpha, beta, and gamma bands. Testing this hypothesis in healthy individuals assumes that attention-related power modulations in the lower alpha and beta bands as well as those in the gamma band can be detected with noninvasive recordings such as MEG or scalp level EEG. The present study tackles this issue by investigating the degree and precision by which gamma band power (and to a lesser extent, alpha and beta band) modulations of cortical activity can be recovered at the scalp level in individual subjects during attentive NeuroImage 45 (2009) 1289–1304 ⁎ Corresponding author. Dynamique Cérébrale et Cognition, INSERM Unité 821, Centre Hospitalier Le Vinatier, 69500 Bron, France. E-mail address: [email protected] (J.-P. Lachaux). 1053-8119/$ – see front matter © 2009 Elsevier Inc. All rights reserved. doi:10.1016/j.neuroimage.2009.01.017 Contents lists available at ScienceDirect NeuroImage journal homepage: www.elsevier.com/locate/ynimg

Welcome message from author
This document is posted to help you gain knowledge. Please leave a comment to let me know what you think about it! Share it to your friends and learn new things together.
Transcript
NeuroImage 45 (2009) 1289–1304
Contents lists available at ScienceDirect
NeuroImage
j ourna l homepage: www.e lsev ie r.com/ locate /yn img
Simultaneous MEG and intracranial EEG recordings during attentive reading
Sarang S. Dalal a,b,c, Sylvain Baillet d,e, Claude Adam d,e, Antoine Ducorps d,e, Denis Schwartz d,e,Karim Jerbi a,b,c,f, Olivier Bertrand a,b,c, Line Garnero d,e, Jacques Martinerie d,e, Jean-Philippe Lachaux a,b,c,d,e,⁎a Dynamique Cérébrale et Cognition, INSERM Unité 821, Lyon, Franceb Institut Fédératif des Neurosciences, Lyon, Francec Université Lyon 1, Franced Laboratoire de Neurosciences Cognitives et Imagerie Cérébrale, CNRS UPR640-LENA, Hôpital de la Salpêtrière, Paris, Francee UPMC Univ. Paris 06, Francef Laboratoire de Physiologie de la Perception et de l'Action, CNRS UMR 7152, Collège de France, Paris, France
⁎ Corresponding author. Dynamique Cérébrale et CognHospitalier Le Vinatier, 69500 Bron, France.
E-mail address: [email protected] (J.-P. Lachaux).
1053-8119/$ – see front matter © 2009 Elsevier Inc. Alldoi:10.1016/j.neuroimage.2009.01.017
a b s t r a c t
a r t i c l e i n f oArticle history:
The relationship between n Received 23 January 2007Revised 23 December 2008Accepted 9 January 2009Available online 24 January 2009Keywords:MagnetoencephalographySubdural electrodesIntracranial electroencephalographyElectrocorticographyEpilepsy surgeryGamma bandSource localizationBeamformer
eural oscillations recorded at various spatial scales remains poorly understoodpartly due to an overall dearth of studies utilizing simultaneous measurements. In an effort to studyquantitative markers of attention during reading, we performed simultaneous magnetoencephalography(MEG) and intracranial electroencephalography (iEEG) recordings in four epileptic patients. Patients wereasked to attend to a specific color when presented with an intermixed series of red words and green words,with words of a given color forming a cohesive story. We analyzed alpha, beta, and gamma band oscillatoryresponses to the word presentation and compared the strength and spatial organization of those responses inboth electrophysiological recordings. Time-frequency analysis of iEEG revealed a network of clear attention-modulated high gamma band (50–150 Hz) power increases and alpha/beta (9–25 Hz) suppressions inresponse to the words. In addition to analyses at the sensor level, MEG time-frequency analysis wasperformed at the source level using a sliding window beamformer technique. Strong alpha/beta suppressionswere observed in MEG reconstructions, in tandem with iEEG effects. While the MEG counterpart of highgamma band enhancement was difficult to interpret at the sensor level in two patients, MEG time-frequencysource reconstruction revealed additional activation patterns in accordance with iEEG results. Importantly,iEEG allowed us to confirm that several sources of gamma band modulation observed with MEG were indeedof cortical origin rather than EMG muscular or ocular artifact.
© 2009 Elsevier Inc. All rights reserved.
Introduction
An increasing body of evidence gathered over the last fifteen yearssuggests that most cognitive functions, from sensory and motorprocessing to language or memory, involve the formation of localneural assemblies characterized by synchronous oscillations in thegamma band, i.e., at frequencies starting at 40 Hz (for reviews, seeSinger, 1999; Tallon-Baudry and Bertrand, 1999). Interestingly, theformation of such assemblies seems to depend upon the degree ofattention allocated by subjects or animals to the task at hand (Baueret al., 2006; Bichot et al., 2005; Fries et al., 2001; Gruber et al., 1999;Steinmetz et al., 2000; Tallon-Baudry et al., 2005), which suggests thatmonitoring gamma band activity could provide a quantitative
ition, INSERMUnité 821, Centre
rights reserved.
measure reflecting attention. Indeed, in a recent intracerebral EEGstudy, which manipulated explicitly the attention of subjects in averbal working memory task, we found that gamma band responseswere stronger for attended stimuli, later recalled, than for unattendedones (Mainy et al., 2007).
We have all experienced the effect of attention fluctuations onperformance in the context of reading, sometimes having the sen-sation of “flying over” entire pages without truly absorbing theirmeaning. The previously mentioned studies led us to hypothesizethat it may be possible to monitor the degree of attention duringreading by measuring the spectral power in the alpha, beta, andgamma bands. Testing this hypothesis in healthy individualsassumes that attention-related power modulations in the loweralpha and beta bands as well as those in the gamma band can bedetected with noninvasive recordings such as MEG or scalp levelEEG. The present study tackles this issue by investigating thedegree and precision by which gamma band power (and to a lesserextent, alpha and beta band) modulations of cortical activity can berecovered at the scalp level in individual subjects during attentive
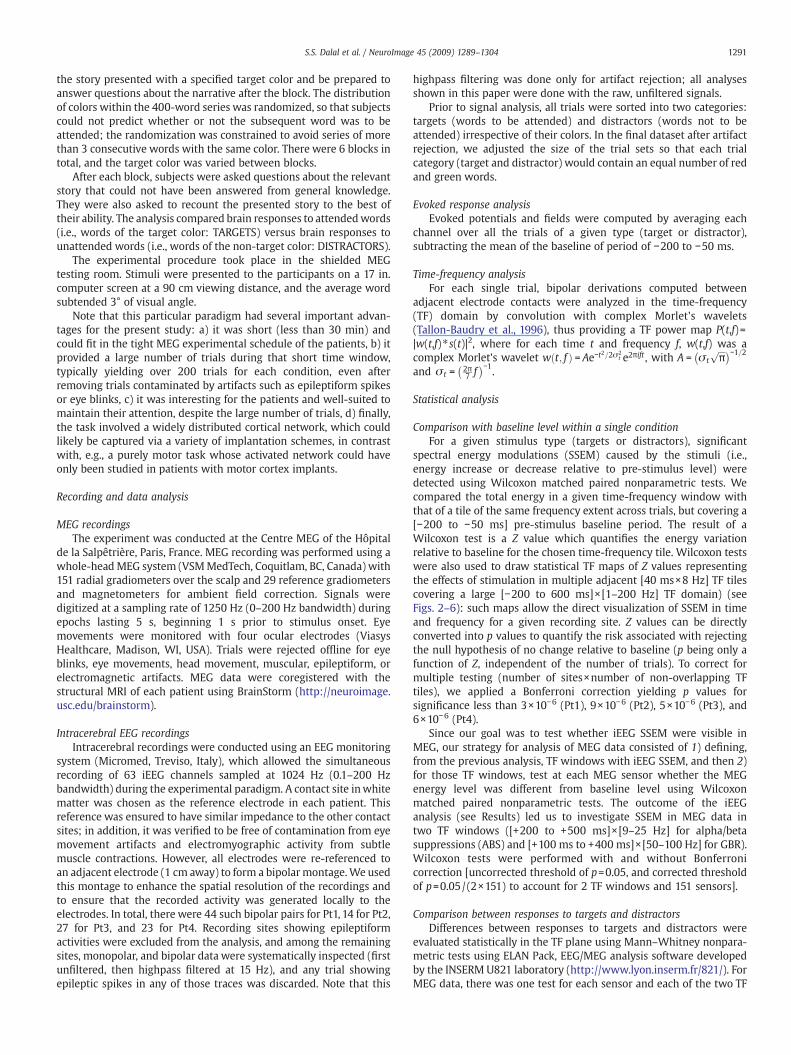
Table 1Table of patient characteristics
Patient Gender/age
Surface video-EEG(seizure onset)
MRI Intracranial locationof seizure onset
Surgical outcome(Engel's classa)
Pt1 F/33 R and L temporal n.l. R and L neocorticaltemporal (MTG)
Not resected
Pt2 F/28 R temporal (mostlyanterior)
n.l. R mid-temporalbasal
IIIa
Pt3 M/45 L posteriortemporal andoccipital
n.l. L posterior temporalbasal
IV
Pt4 M/39 R anterior frontaland temporal
n.l. R temporal pole Not resected
Abbreviations: L = left; R = right; MTG = middle temporal gyrus; n.l. = no lesion.a From Engel (1987).
1290 S.S. Dalal et al. / NeuroImage 45 (2009) 1289–1304
reading. The ability of surface-level electrophysiological measure-ments to detect gamma band response (GBR) is still a matter ofdebate. Although it has been more than a decade since the firstreports of gamma band power modulations at the scalp level withEEG (Tallon-Baudry et al., 1996, 1999; Rodriguez et al., 1999; Mülleret al., 2000), with MEG reports arriving more recently (Kaiser et al.,2002, 2004; Osipova et al., 2006; Vidal et al., 2006; Guggisberget al., 2008; Dalal et al., 2008a), those responses have mostly beendetected through population-level statistics. The relatively limitednumber of such reports has so far impeded the use of GBR as aresearch or clinical index even though increasing results fromintracranial EEG suggest that high gamma band modulations couldbe used as functional markers (Lachaux et al., 2005, 2006;Sederberg et al., 2003; Szurhaj et al., 2005; Tallon-Baudry et al.,2005; Tanji et al., 2005) tightly related to task-related hemody-namic variations measured by fMRI (Kim et al., 2004; Niessinget al., 2005; Lachaux et al., 2007). In contrast, other importantelectrophysiological indices such as the N100 evoked potential andmismatch negativity (MMN) are routinely used for both researchand clinical purposes. The absence of GBR from clinical use thuscannot be fully explained by the younger age of the field andcertainly not to a lack of interest by the EEG/MEG community;more likely, it is due to acknowledged methodological difficultiesassociated with extracting gamma response components fromnoninvasive recordings (Trujillo et al., 2005; Hoogenboom et al.,2006).
Moreover, the failure to detect EEG/MEG GBR in a given subjectcan be a source of confusion. For example, the technical limitations ofEEG/MEG could have prevented detection, due to a low signal tonoise ratio in the gamma band or insufficient spatial resolution.Alternatively, it could have been the result of individual subjectdifferences. For example, a subject may have employed a differentstrategy or been less attentive than the others, and thereforeemployed different cortical mechanisms that may not have involvedGBR.
To evaluate our ability to noninvasively recover cortical GBR, andtheir modulation by attention during reading, we designed anexperiment to simultaneously record MEG and intracerebral EEG(iEEG) responses in epileptic patients implanted with depth electro-des and subdural strips for clinical reasons. Such simultaneousrecordings provided a unique way to compare the spectral contentof the scalp traces of GBR, as well as lower-frequency modulations, tothose recorded directly from the cortex via the implanted depthelectrodes. It was considered more advantageous to record iEEGsimultaneously with MEG as opposed to scalp EEG, due to thedifficulty recording from EEG electrode caps in patients withintracerebral electrodes, as well as the likely considerable changesin electric field propagation caused by the implants and craniotomies(Kirchberger et al., 1998).
We simultaneously recorded both MEG and iEEG data in fourpatients while they performed a simple reading task with variablelevels of attention depending on instructions on whether to attend tothe narratives formed by the words. In addition to being a proof ofconcept of simultaneous MEG and iEEG data acquisition, this studypresents and discusses the MEG correlates of strong intracerebralalpha, beta, and gamma power modulations generated by wordstimuli in temporal, occipital, and parietal lobes. The experimentaldesign is the same used in a comprehensive iEEG study from ourgroup (Jung et al., 2008), and originally implemented by Nobre et al.(1998) for an fMRI experiment.
Previous human studies have described simultaneous acquisitionof MEG and iEEG to evaluate high-amplitude epileptiform spikes(Mikuni et al., 1997; Sutherling et al., 2001; Shigeto et al., 2002; Oishiet al., 2002). However, to our knowledge, this experiment comprisesthe first successful simultaneous recordings to study cognitivefunction.
Methods
Subjects
Simultaneous MEG and iEEG recordings were obtained from fourpatients with intractable epilepsy (referred to as Pt1–Pt4) who werecandidates for resective surgery. Table 1 summarizes their clinical,neuroimaging, and video-EEG characteristics. Intracranial electrodeswere implanted in these patients for preresection seizure localizationand functional mapping of critical language and motor areas.Electrode implants were guided strictly by clinical indications andresearch recordings were approved by the local institutional reviewboard. Upon informed consent, the experiments were conductedwhile each patient was alert and on minimal medication. All patientswere implanted with depth electrodes and, in the case of Pt1,additionally with subdural strips placed on the cortical surface.Depth electrodes were inserted stereotactically through the aid of aLeksell frame using an “orthogonal” approach; electrode strips wereplaced via burr holes, also precisely positioned using stereotacticcoordinates (Dormont et al., 1997). The brain regions explored werebilateral temporal in Pt1, the whole right temporal lobe with its basaland posterior part in Pt2, the whole left temporal lobe with itsjunction to the occipital and parietal lobes in Pt3, and anteriortemporal and frontal regions in the right hemisphere of Pt4.
Electrode implantation
Each patient was implanted with 7 to 9 linear electrode arrays.Each depth electrode array had a diameter of 1 mm. Both depthelectrode arrays and subdural strips contained 4 to 8 cylindricalcontacts of 2.3 mm length, 10 mm apart center-to-center (Ad-TechMedical, Racine, WI, USA). Therefore, various mesial and lateralcortical areas were evaluated, including sulcal cortex. A total of 174sites were recorded from the four patients, with 68 in the lefthemisphere and 106 in the right hemisphere. The electrode contactswere identified directly on the patients' MRI, then segmented and 3D-rendered using BrainVisa (http://brainvisa.info) and in-houseMATLABcode.
Paradigm
An experimental paradigm similar to Nobre et al. (1998) was used,modified with slightly longer interstimulus intervals to adjust for thelate latencies of the attentional modulations reported in that study. Ineach block of the experiment, the subjects were presented with 400words shown individually at a rapid rate (words presented for 100 mswith an interstimulus interval of 800±100 ms) on a black computerscreen. 200 words were presented in green and the other 200presented in red, with words of a given color forming a meaningfuland simple short story in French. The subjects were instructed to read
1291S.S. Dalal et al. / NeuroImage 45 (2009) 1289–1304
the story presented with a specified target color and be prepared toanswer questions about the narrative after the block. The distributionof colors within the 400-word series was randomized, so that subjectscould not predict whether or not the subsequent word was to beattended; the randomization was constrained to avoid series of morethan 3 consecutive words with the same color. There were 6 blocks intotal, and the target color was varied between blocks.
After each block, subjects were asked questions about the relevantstory that could not have been answered from general knowledge.They were also asked to recount the presented story to the best oftheir ability. The analysis compared brain responses to attendedwords(i.e., words of the target color: TARGETS) versus brain responses tounattended words (i.e., words of the non-target color: DISTRACTORS).
The experimental procedure took place in the shielded MEGtesting room. Stimuli were presented to the participants on a 17 in.computer screen at a 90 cm viewing distance, and the average wordsubtended 3° of visual angle.
Note that this particular paradigm had several important advan-tages for the present study: a) it was short (less than 30 min) andcould fit in the tight MEG experimental schedule of the patients, b) itprovided a large number of trials during that short time window,typically yielding over 200 trials for each condition, even afterremoving trials contaminated by artifacts such as epileptiform spikesor eye blinks, c) it was interesting for the patients and well-suited tomaintain their attention, despite the large number of trials, d) finally,the task involved a widely distributed cortical network, which couldlikely be captured via a variety of implantation schemes, in contrastwith, e.g., a purely motor task whose activated network could haveonly been studied in patients with motor cortex implants.
Recording and data analysis
MEG recordingsThe experiment was conducted at the Centre MEG of the Hôpital
de la Salpêtrière, Paris, France. MEG recording was performed using awhole-head MEG system (VSMMedTech, Coquitlam, BC, Canada) with151 radial gradiometers over the scalp and 29 reference gradiometersand magnetometers for ambient field correction. Signals weredigitized at a sampling rate of 1250 Hz (0–200 Hz bandwidth) duringepochs lasting 5 s, beginning 1 s prior to stimulus onset. Eyemovements were monitored with four ocular electrodes (ViasysHealthcare, Madison, WI, USA). Trials were rejected offline for eyeblinks, eye movements, head movement, muscular, epileptiform, orelectromagnetic artifacts. MEG data were coregistered with thestructural MRI of each patient using BrainStorm (http://neuroimage.usc.edu/brainstorm).
Intracerebral EEG recordingsIntracerebral recordings were conducted using an EEG monitoring
system (Micromed, Treviso, Italy), which allowed the simultaneousrecording of 63 iEEG channels sampled at 1024 Hz (0.1–200 Hzbandwidth) during the experimental paradigm. A contact site inwhitematter was chosen as the reference electrode in each patient. Thisreference was ensured to have similar impedance to the other contactsites; in addition, it was verified to be free of contamination from eyemovement artifacts and electromyographic activity from subtlemuscle contractions. However, all electrodes were re-referenced toan adjacent electrode (1 cm away) to form a bipolar montage.We usedthis montage to enhance the spatial resolution of the recordings andto ensure that the recorded activity was generated locally to theelectrodes. In total, there were 44 such bipolar pairs for Pt1, 14 for Pt2,27 for Pt3, and 23 for Pt4. Recording sites showing epileptiformactivities were excluded from the analysis, and among the remainingsites, monopolar, and bipolar data were systematically inspected (firstunfiltered, then highpass filtered at 15 Hz), and any trial showingepileptic spikes in any of those traces was discarded. Note that this
highpass filtering was done only for artifact rejection; all analysesshown in this paper were done with the raw, unfiltered signals.
Prior to signal analysis, all trials were sorted into two categories:targets (words to be attended) and distractors (words not to beattended) irrespective of their colors. In the final dataset after artifactrejection, we adjusted the size of the trial sets so that each trialcategory (target and distractor) would contain an equal number of redand green words.
Evoked response analysisEvoked potentials and fields were computed by averaging each
channel over all the trials of a given type (target or distractor),subtracting the mean of the baseline of period of −200 to −50 ms.
Time-frequency analysisFor each single trial, bipolar derivations computed between
adjacent electrode contacts were analyzed in the time-frequency(TF) domain by convolution with complex Morlet's wavelets(Tallon-Baudry et al., 1996), thus providing a TF power map P(t,f)=|w(t,f)⁎s(t)|2, where for each time t and frequency f, w(t,f) was acomplex Morlet's wavelet w t; fð Þ = Ae−t2=2σ2
t e2πift , with A = σ tffiffiffiπ
p� �−1=2
and σ t = 2π7 f
� �−1.
Statistical analysis
Comparison with baseline level within a single conditionFor a given stimulus type (targets or distractors), significant
spectral energy modulations (SSEM) caused by the stimuli (i.e.,energy increase or decrease relative to pre-stimulus level) weredetected using Wilcoxon matched paired nonparametric tests. Wecompared the total energy in a given time-frequency window withthat of a tile of the same frequency extent across trials, but covering a[−200 to −50 ms] pre-stimulus baseline period. The result of aWilcoxon test is a Z value which quantifies the energy variationrelative to baseline for the chosen time-frequency tile. Wilcoxon testswere also used to draw statistical TF maps of Z values representingthe effects of stimulation in multiple adjacent [40 ms×8 Hz] TF tilescovering a large [−200 to 600 ms]×[1–200 Hz] TF domain) (seeFigs. 2–6): such maps allow the direct visualization of SSEM in timeand frequency for a given recording site. Z values can be directlyconverted into p values to quantify the risk associated with rejectingthe null hypothesis of no change relative to baseline (p being only afunction of Z, independent of the number of trials). To correct formultiple testing (number of sites×number of non-overlapping TFtiles), we applied a Bonferroni correction yielding p values forsignificance less than 3×10⁻⁶ (Pt1), 9×10⁻⁶ (Pt2), 5×10⁻⁶ (Pt3), and6×10−6 (Pt4).
Since our goal was to test whether iEEG SSEM were visible inMEG, our strategy for analysis of MEG data consisted of 1) defining,from the previous analysis, TF windows with iEEG SSEM, and then 2)for those TF windows, test at each MEG sensor whether the MEGenergy level was different from baseline level using Wilcoxonmatched paired nonparametric tests. The outcome of the iEEGanalysis (see Results) led us to investigate SSEM in MEG data intwo TF windows ([+200 to +500 ms]×[9–25 Hz] for alpha/betasuppressions (ABS) and [+100 ms to +400 ms]×[50–100 Hz] for GBR).Wilcoxon tests were performed with and without Bonferronicorrection [uncorrected threshold of p=0.05, and corrected thresholdof p=0.05/(2×151) to account for 2 TF windows and 151 sensors].
Comparison between responses to targets and distractorsDifferences between responses to targets and distractors were
evaluated statistically in the TF plane using Mann–Whitney nonpara-metric tests using ELAN Pack, EEG/MEG analysis software developedby the INSERM U821 laboratory (http://www.lyon.inserm.fr/821/). ForMEG data, there was one test for each sensor and each of the two TF
1292 S.S. Dalal et al. / NeuroImage 45 (2009) 1289–1304
windows defined above, again with two significance thresholds:uncorrected p=0.05, and corrected p=0.05/(2×151). For iEEG data,there was one test for each recording site and each of the two TFwindows defined above, with significance thresholds of p=0.05uncorrected, and p=0.05/M corrected, where M is the number ofrecording sites (M=44 for Pt1, 14 for Pt2, 27 for Pt3, and 23 for Pt4).
Cross-sites synchrony analysisCross-sites synchrony was evaluated using wavelet-based
estimation measuring the degree of phase-locking between certainspectral components of the response (alpha, beta, and gammaresponses) (Lachaux et al., 2002). In short, the analysis extracts thetime course of the instantaneous phase-difference between twosignals in each trial around a frequency of interest (as computedusing Morlet's wavelets), and estimates the circular variance of thatdifference on a sliding window the duration of which depends onthe analyzed frequency (8 cycles of oscillations). This circularvariance is a time-varying measure of phase-locking between 0 (nophase-locking) and 1 (complete synchrony) which is averagedacross trials to provide an average measure of synchrony betweensignals.
GBR dipole moment estimationThe dipole moment of GBR sources detected with iEEG was
coarsely estimated via a standard source-field model and the Hilberttransform. First, for each single trial, the bipolar iEEG data wasbandpass filtered to 50–100 Hz (100–150 Hz for Pt4) and Hilberttransformed to extract the GBR envelope. These envelopes were thenaveraged across trials. The maximum value over the 300–700 msinterval for each bipolar channel was then noted.
The relationship between recorded voltage and dipole moment isgiven by the following equation (Malmivuo and Plonsey, 1995):
Φ≈p cosθ4πσr2
; ð1Þ
where Φ is the measured voltage potential at a given electrode, p isthe dipolemoment, r is the distance between the dipole and electrode,θ is the angle between the dipole axis and the electrode location, andσ is the tissue conductivity. For the purpose of this estimate, weassume that a bipolar iEEG pair records a dipole located at themidpoint between the two locations and oriented along their axis (i.e.,r=5 mm and θ=0). Then, applying Eq. (1) to the difference of the two(opposite) voltages:
Φ1−Φ2≈2p
4πσ 0:005ð Þ2: ð2Þ
Finally, rearranging to solve for the dipole moment p, we obtain:
p≈2πσ 0:005ð Þ2 Φ1−Φ2ð Þ: ð3Þ
We use σ=0.285 S/m, from the in vivo conductivity of human graymatter reported by Latikka et al. (2001).
MEG source reconstructionWe used NUTMEG (Dalal et al., 2004) to perform MEG source
reconstruction. A multisphere head model (Huang et al., 1999) wascomputed for each patient's sensor configuration and head geometry.
The timecourses of the neural generators of the evoked fields werereconstructed using a minimum variance beamformer (Van Veenet al., 1997). Beamformer weights were computed from the samplecovariance of the unaveraged data and subsequently applied to theaveraged sensor data to yield timecourses over a grid of voxelsspanning the head volume. The results near electrode locations werecompared with intracranial ERPs to assess data quality.
Separately, the oscillatory dynamics of the sources were recon-structed using a related time-frequency beamformer technique(Dalal et al., 2008a). This method outputs a spectrogram for each ofthe voxels spanning the head volume. The power bands chosen were4–9 Hz, 9–25 Hz, 25–45 Hz, 55–95 Hz, 105–145 Hz, and 155–195 Hz.The power line frequency of 50 Hz and its harmonics at 100 Hz and150Hzwere avoided to reduce noise. Aswith the iEEG and sensorMEGspectrograms, post-stimulus power modulations were contrastedrelative to the baseline period using Wilcoxon Z-scores.
MEG sensitivityFinally, the multisphere head model was applied in order to
estimate the sensitivity of MEG to locations probed with intracranialelectrodes using the following procedure: A simulated unit dipole wasplaced at the midpoint between each bipolar electrode pair. As theorientation of sources detected with iEEG is generally uncertain – yethas a profound impact on MEG signal –we simulated a distribution oforientations, from −π
2 to + π2 radians of elevation and −π to +π of
azimuth, sampled every π36 radians. The head model was used to
calculate the theoretical MEG sensor distribution for each orientationat each brain location. The estimated magnetic fields for each sensorwere then normalized by the maximum magnetic field (generated bya unit dipole anywhere in the brain) that could be detected by thatsensor, yielding relative sensitivity (Malmivuo and Plonsey, 1995).Finally, for each dipole orientation at each brain location, themaximum relative sensitivity (i.e., the relative sensitivity at the mostsensitive MEG sensor) was determined.
Results
Evoked potentials and fields
Fig. 1 displays the event-related fields (MEG ERFs), beamformersource reconstructions, and potentials (iEEG ERPs) obtained byaveraging directly the raw MEG and iEEG signals across trials foreach condition. At all three levels of recording, evoked responses wereclear and reproducible across conditions, with perhaps Pt2's sourcereconstruction suffering from increased noise. Intracerebral ERPsmeasured directly in the occipital and temporal lobes are showntogether with the corresponding MEG scalp topographies, and the ERFtrace at the sensor showing maximal response, for each patient andfor both targets and distractors. In patients Pt1, Pt3, and Pt4, twoconsecutive bipolar pairs recorded ERPs with opposite polarities,indicating local sources. In all four patients, the MEG topography atthe peak latency showed a clear amplitude peak over occipital sensors,consistent with the occipito-temporal responses found in iEEG.
Stimulus-induced spectral energy modulations
To compare oscillatory responses at the cortical and MEG level, weused a simple two-step strategy: a) use iEEG data to detect possiblealpha, beta, and gamma band responses at the cortical level, and b)test for similar effects at the sensor level, at the same latencies andfrequency range. At both levels, responses were defined as significantenergy increases or decreases relative to the [−200 to −50 ms] pre-stimulus baseline (using Wilcoxon tests, as explained in the Methodssection).
iEEG recordingsClear gamma band responses (GBRs) to target words were
observed in all four patients, distributed over the temporal, occipital,and parietal cortex, in both hemispheres (note that there were noelectrodes in the frontal lobes) (Pt1: GBR in 14 out of 44 bipolar pairs;Pt2: 1/14; Pt3: 3/27; Pt4: 2/23) (see Figs. 2–6 and S1 for the preciselocations of GBRs for target words on individual 3D MRI renderings).The time and frequency extents of those responses were remarkably
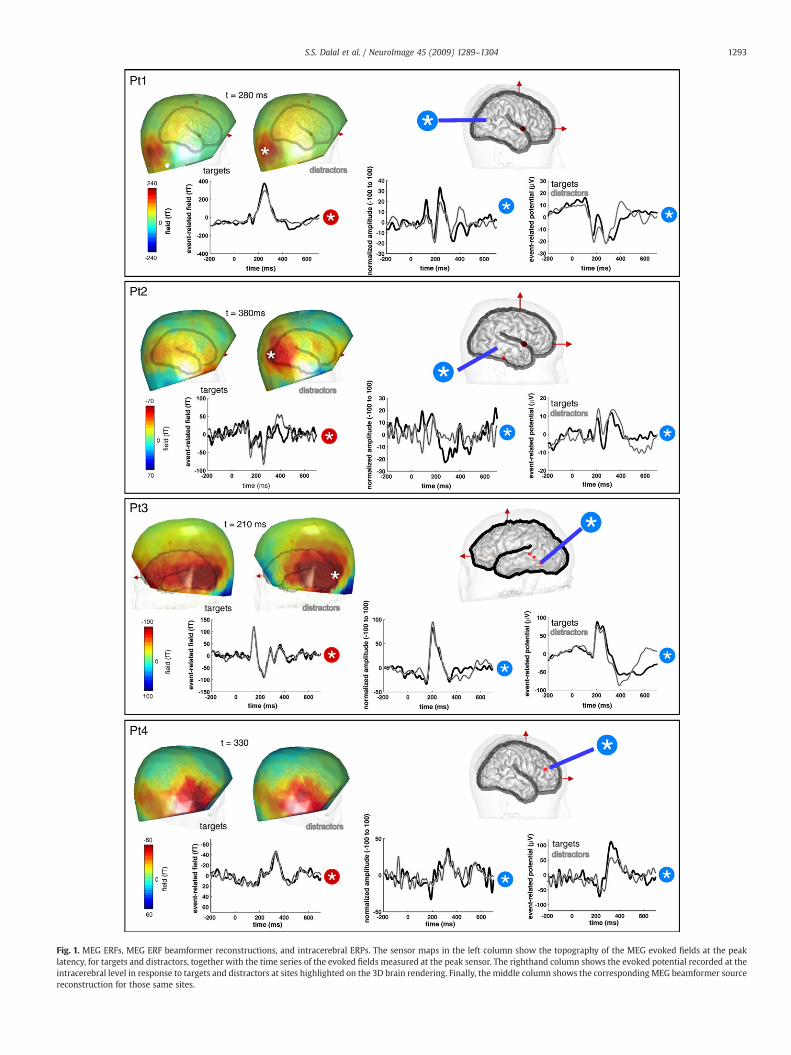
Fig. 1. MEG ERFs, MEG ERF beamformer reconstructions, and intracerebral ERPs. The sensor maps in the left column show the topography of the MEG evoked fields at the peaklatency, for targets and distractors, together with the time series of the evoked fields measured at the peak sensor. The righthand column shows the evoked potential recorded at theintracerebral level in response to targets and distractors at sites highlighted on the 3D brain rendering. Finally, the middle column shows the corresponding MEG beamformer sourcereconstruction for those same sites.
1293S.S. Dalal et al. / NeuroImage 45 (2009) 1289–1304
1294 S.S. Dalal et al. / NeuroImage 45 (2009) 1289–1304
consistent across sites and patients with their highest energyconcentrated in the [100–400 ms] time window. Some of thoseresponses (Pt1: 6/14; Pt2: 0/1; Pt3: 2/3; Pt4: 0/2) were stronger fortargets than for distractors (KW, pb0.05, corrected), while the reverseeffect did not occur. Also, we found no cortical site producing GBRssolely for distractors; however, we observed some negative GBRs, i.e.,gamma band suppressions (see Fig. 7).
Frequencies in the alpha and beta bands (9–25 Hz) werecharacterized by a common pattern opposite to GBRs, with energydecreases between 200ms and 500ms (see Figs. S2–S6). For statisticalanalysis, all frequencies in that range were pooled together, and
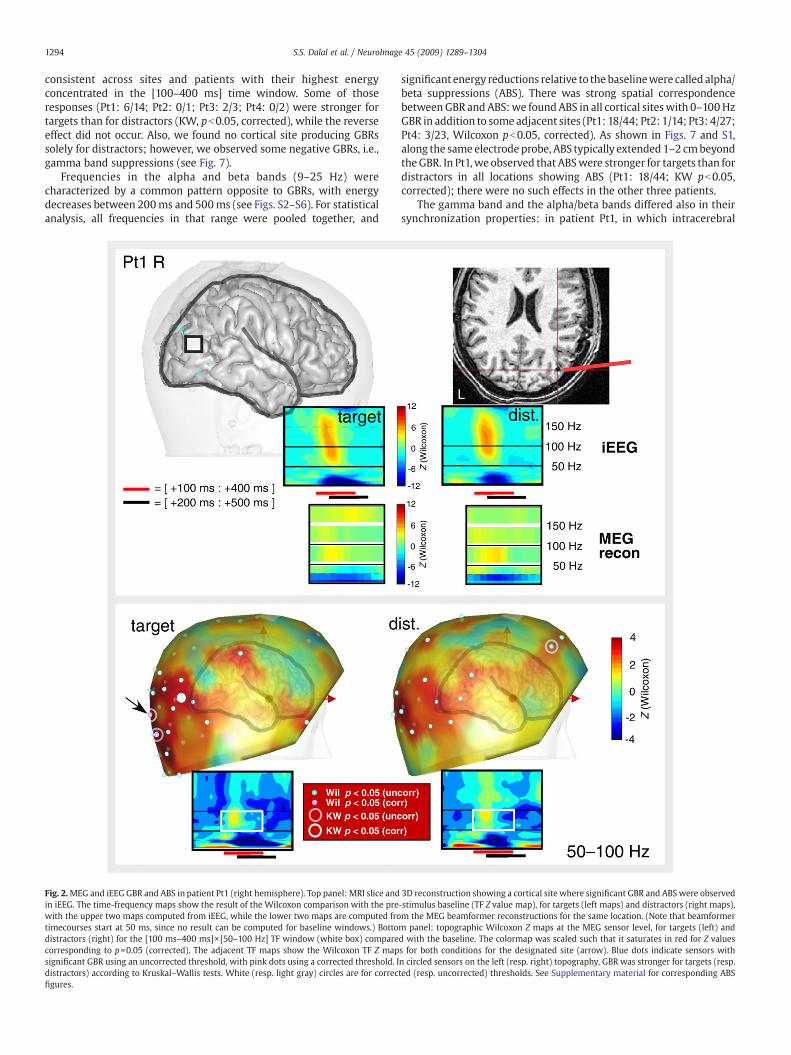
Fig. 2.MEG and iEEG GBR and ABS in patient Pt1 (right hemisphere). Top panel: MRI slice andin iEEG. The time-frequency maps show the result of the Wilcoxon comparison with the prewith the upper two maps computed from iEEG, while the lower two maps are computed frotimecourses start at 50 ms, since no result can be computed for baseline windows.) Bottodistractors (right) for the [100 ms–400 ms]×[50–100 Hz] TF window (white box) comparecorresponding to p=0.05 (corrected). The adjacent TF maps show the Wilcoxon TF Z mapsignificant GBR using an uncorrected threshold, with pink dots using a corrected threshold. Idistractors) according to Kruskal–Wallis tests. White (resp. light gray) circles are for correcfigures.
significant energy reductions relative to the baselinewere called alpha/beta suppressions (ABS). There was strong spatial correspondencebetweenGBR and ABS:we foundABS in all cortical siteswith 0–100HzGBR in addition to some adjacent sites (Pt1: 18/44; Pt2: 1/14; Pt3: 4/27;Pt4: 3/23, Wilcoxon pb0.05, corrected). As shown in Figs. 7 and S1,along the same electrode probe, ABS typically extended 1–2 cmbeyondtheGBR. In Pt1,we observed that ABSwere stronger for targets than fordistractors in all locations showing ABS (Pt1: 18/44; KW pb0.05,corrected); there were no such effects in the other three patients.
The gamma band and the alpha/beta bands differed also in theirsynchronization properties: in patient Pt1, in which intracerebral
3D reconstruction showing a cortical site where significant GBR and ABS were observed-stimulus baseline (TF Z value map), for targets (left maps) and distractors (right maps),m the MEG beamformer reconstructions for the same location. (Note that beamformerm panel: topographic Wilcoxon Z maps at the MEG sensor level, for targets (left) andd with the baseline. The colormap was scaled such that it saturates in red for Z valuess for both conditions for the designated site (arrow). Blue dots indicate sensors withn circled sensors on the left (resp. right) topography, GBR was stronger for targets (resp.ted (resp. uncorrected) thresholds. See Supplementary material for corresponding ABS
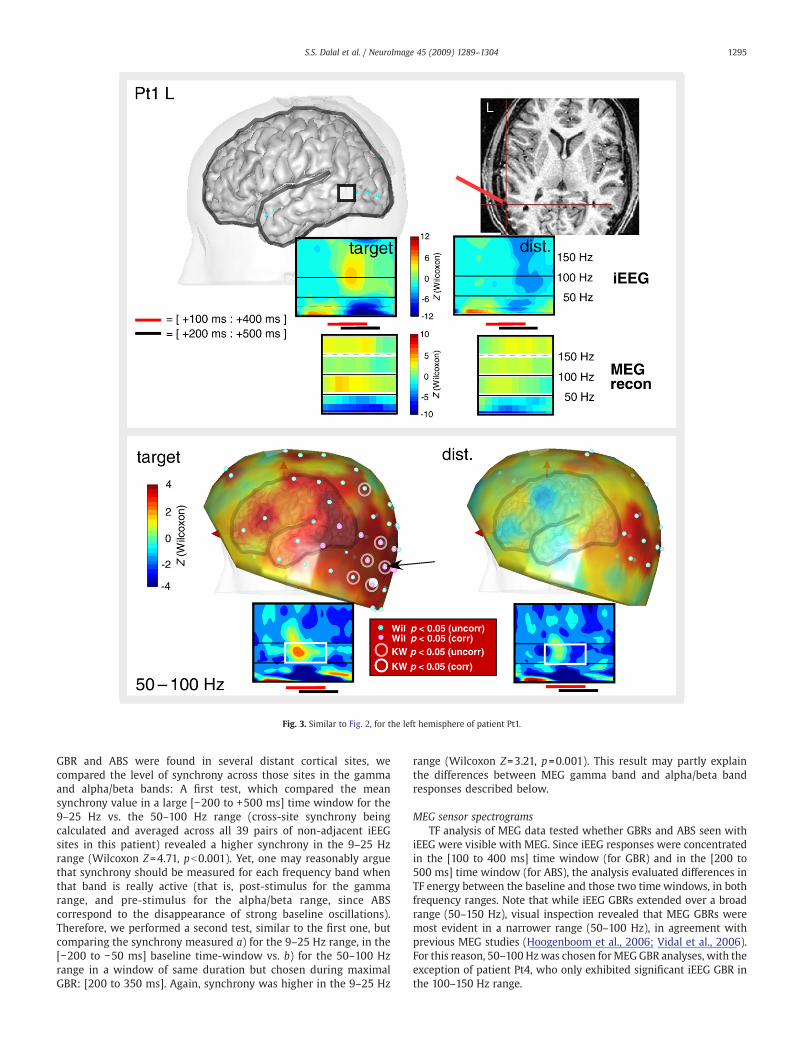
Fig. 3. Similar to Fig. 2, for the left hemisphere of patient Pt1.
1295S.S. Dalal et al. / NeuroImage 45 (2009) 1289–1304
GBR and ABS were found in several distant cortical sites, wecompared the level of synchrony across those sites in the gammaand alpha/beta bands: A first test, which compared the meansynchrony value in a large [−200 to +500 ms] time window for the9–25 Hz vs. the 50–100 Hz range (cross-site synchrony beingcalculated and averaged across all 39 pairs of non-adjacent iEEGsites in this patient) revealed a higher synchrony in the 9–25 Hzrange (Wilcoxon Z=4.71, pb0.001). Yet, one may reasonably arguethat synchrony should be measured for each frequency band whenthat band is really active (that is, post-stimulus for the gammarange, and pre-stimulus for the alpha/beta range, since ABScorrespond to the disappearance of strong baseline oscillations).Therefore, we performed a second test, similar to the first one, butcomparing the synchrony measured a) for the 9–25 Hz range, in the[−200 to −50 ms] baseline time-window vs. b) for the 50–100 Hzrange in a window of same duration but chosen during maximalGBR: [200 to 350 ms]. Again, synchrony was higher in the 9–25 Hz
range (Wilcoxon Z=3.21, p=0.001). This result may partly explainthe differences between MEG gamma band and alpha/beta bandresponses described below.
MEG sensor spectrogramsTF analysis of MEG data tested whether GBRs and ABS seen with
iEEG were visible with MEG. Since iEEG responses were concentratedin the [100 to 400 ms] time window (for GBR) and in the [200 to500 ms] time window (for ABS), the analysis evaluated differences inTF energy between the baseline and those two time windows, in bothfrequency ranges. Note that while iEEG GBRs extended over a broadrange (50–150 Hz), visual inspection revealed that MEG GBRs weremost evident in a narrower range (50–100 Hz), in agreement withprevious MEG studies (Hoogenboom et al., 2006; Vidal et al., 2006).For this reason, 50–100 Hzwas chosen forMEG GBR analyses, with theexception of patient Pt4, who only exhibited significant iEEG GBR inthe 100–150 Hz range.
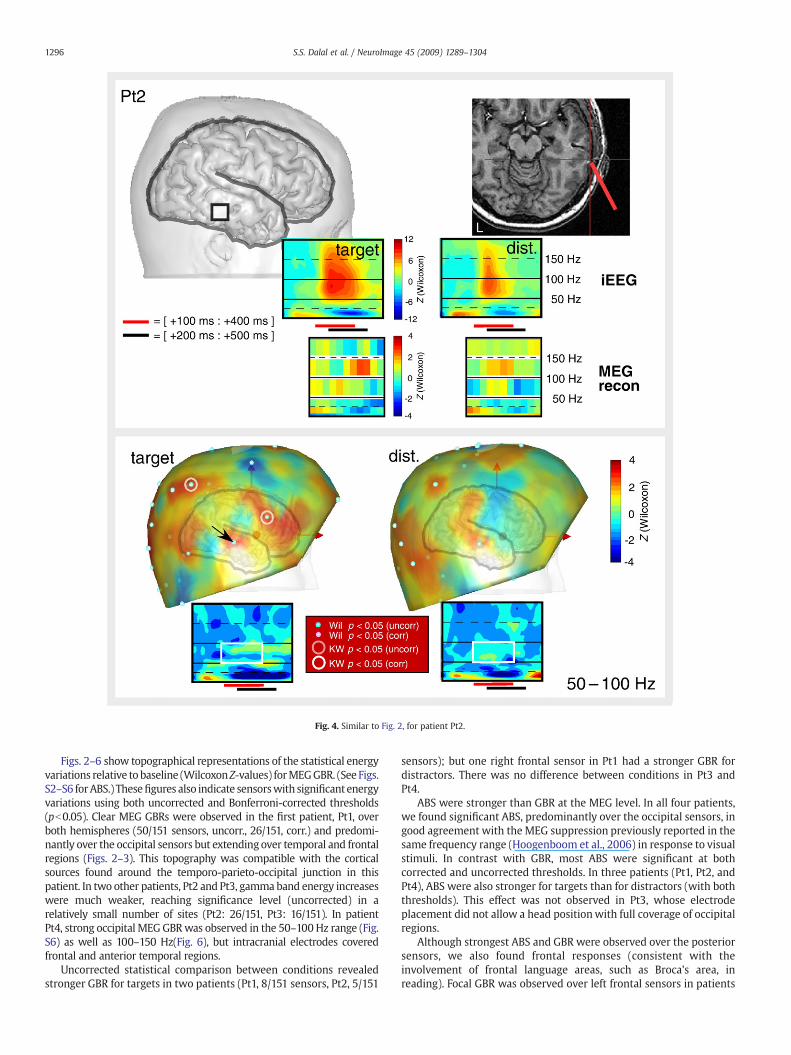
Fig. 4. Similar to Fig. 2, for patient Pt2.
1296 S.S. Dalal et al. / NeuroImage 45 (2009) 1289–1304
Figs. 2–6 show topographical representations of the statistical energyvariations relative to baseline (WilcoxonZ-values) forMEGGBR. (See Figs.S2–S6 forABS.) Thesefigures also indicate sensorswith significant energyvariations using both uncorrected and Bonferroni-corrected thresholds(pb0.05). Clear MEG GBRs were observed in the first patient, Pt1, overboth hemispheres (50/151 sensors, uncorr., 26/151, corr.) and predomi-nantly over the occipital sensors but extending over temporal and frontalregions (Figs. 2–3). This topography was compatible with the corticalsources found around the temporo-parieto-occipital junction in thispatient. In two other patients, Pt2 and Pt3, gamma band energy increaseswere much weaker, reaching significance level (uncorrected) in arelatively small number of sites (Pt2: 26/151, Pt3: 16/151). In patientPt4, strong occipital MEGGBRwas observed in the 50–100 Hz range (Fig.S6) as well as 100–150 Hz(Fig. 6), but intracranial electrodes coveredfrontal and anterior temporal regions.
Uncorrected statistical comparison between conditions revealedstronger GBR for targets in two patients (Pt1, 8/151 sensors, Pt2, 5/151
sensors); but one right frontal sensor in Pt1 had a stronger GBR fordistractors. There was no difference between conditions in Pt3 andPt4.
ABS were stronger than GBR at the MEG level. In all four patients,we found significant ABS, predominantly over the occipital sensors, ingood agreement with the MEG suppression previously reported in thesame frequency range (Hoogenboom et al., 2006) in response to visualstimuli. In contrast with GBR, most ABS were significant at bothcorrected and uncorrected thresholds. In three patients (Pt1, Pt2, andPt4), ABS were also stronger for targets than for distractors (with boththresholds). This effect was not observed in Pt3, whose electrodeplacement did not allow a head positionwith full coverage of occipitalregions.
Although strongest ABS and GBR were observed over the posteriorsensors, we also found frontal responses (consistent with theinvolvement of frontal language areas, such as Broca's area, inreading). Focal GBR was observed over left frontal sensors in patients
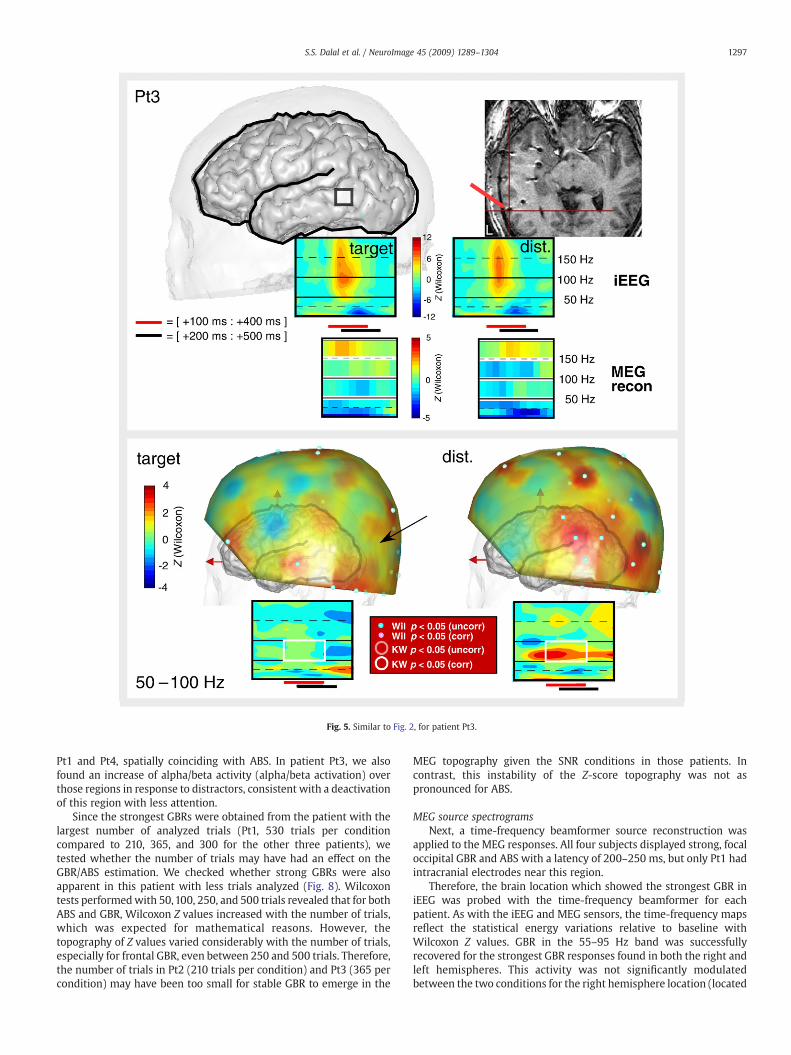
Fig. 5. Similar to Fig. 2, for patient Pt3.
1297S.S. Dalal et al. / NeuroImage 45 (2009) 1289–1304
Pt1 and Pt4, spatially coinciding with ABS. In patient Pt3, we alsofound an increase of alpha/beta activity (alpha/beta activation) overthose regions in response to distractors, consistent with a deactivationof this region with less attention.
Since the strongest GBRs were obtained from the patient with thelargest number of analyzed trials (Pt1, 530 trials per conditioncompared to 210, 365, and 300 for the other three patients), wetested whether the number of trials may have had an effect on theGBR/ABS estimation. We checked whether strong GBRs were alsoapparent in this patient with less trials analyzed (Fig. 8). Wilcoxontests performedwith 50,100, 250, and 500 trials revealed that for bothABS and GBR, Wilcoxon Z values increased with the number of trials,which was expected for mathematical reasons. However, thetopography of Z values varied considerably with the number of trials,especially for frontal GBR, even between 250 and 500 trials. Therefore,the number of trials in Pt2 (210 trials per condition) and Pt3 (365 percondition) may have been too small for stable GBR to emerge in the
MEG topography given the SNR conditions in those patients. Incontrast, this instability of the Z-score topography was not aspronounced for ABS.
MEG source spectrogramsNext, a time-frequency beamformer source reconstruction was
applied to the MEG responses. All four subjects displayed strong, focaloccipital GBR and ABS with a latency of 200–250 ms, but only Pt1 hadintracranial electrodes near this region.
Therefore, the brain location which showed the strongest GBR iniEEG was probed with the time-frequency beamformer for eachpatient. As with the iEEG and MEG sensors, the time-frequency mapsreflect the statistical energy variations relative to baseline withWilcoxon Z values. GBR in the 55–95 Hz band was successfullyrecovered for the strongest GBR responses found in both the right andleft hemispheres. This activity was not significantly modulatedbetween the two conditions for the right hemisphere location (located
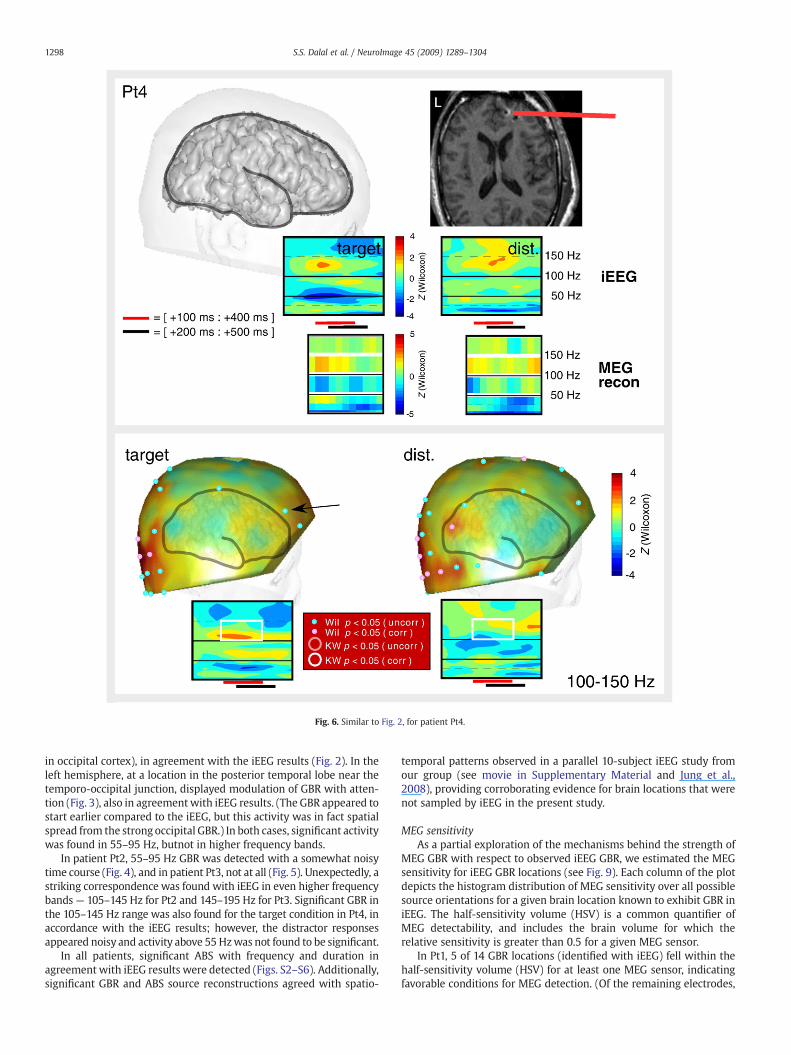
Fig. 6. Similar to Fig. 2, for patient Pt4.
1298 S.S. Dalal et al. / NeuroImage 45 (2009) 1289–1304
in occipital cortex), in agreement with the iEEG results (Fig. 2). In theleft hemisphere, at a location in the posterior temporal lobe near thetemporo-occipital junction, displayed modulation of GBR with atten-tion (Fig. 3), also in agreementwith iEEG results. (The GBR appeared tostart earlier compared to the iEEG, but this activity was in fact spatialspread from the strong occipital GBR.) In both cases, significant activitywas found in 55–95 Hz, butnot in higher frequency bands.
In patient Pt2, 55–95 Hz GBR was detected with a somewhat noisytime course (Fig. 4), and in patient Pt3, not at all (Fig. 5). Unexpectedly, astriking correspondence was found with iEEG in even higher frequencybands — 105–145 Hz for Pt2 and 145–195 Hz for Pt3. Significant GBR inthe 105–145 Hz range was also found for the target condition in Pt4, inaccordance with the iEEG results; however, the distractor responsesappeared noisy and activity above 55 Hzwas not found to be significant.
In all patients, significant ABS with frequency and duration inagreement with iEEG results were detected (Figs. S2–S6). Additionally,significant GBR and ABS source reconstructions agreed with spatio-
temporal patterns observed in a parallel 10-subject iEEG study fromour group (see movie in Supplementary Material and Jung et al.,2008), providing corroborating evidence for brain locations that werenot sampled by iEEG in the present study.
MEG sensitivityAs a partial exploration of the mechanisms behind the strength of
MEG GBR with respect to observed iEEG GBR, we estimated the MEGsensitivity for iEEG GBR locations (see Fig. 9). Each column of the plotdepicts the histogram distribution of MEG sensitivity over all possiblesource orientations for a given brain location known to exhibit GBR iniEEG. The half-sensitivity volume (HSV) is a common quantifier ofMEG detectability, and includes the brain volume for which therelative sensitivity is greater than 0.5 for a given MEG sensor.
In Pt1, 5 of 14 GBR locations (identified with iEEG) fell within thehalf-sensitivity volume (HSV) for at least one MEG sensor, indicatingfavorable conditions for MEG detection. (Of the remaining electrodes,
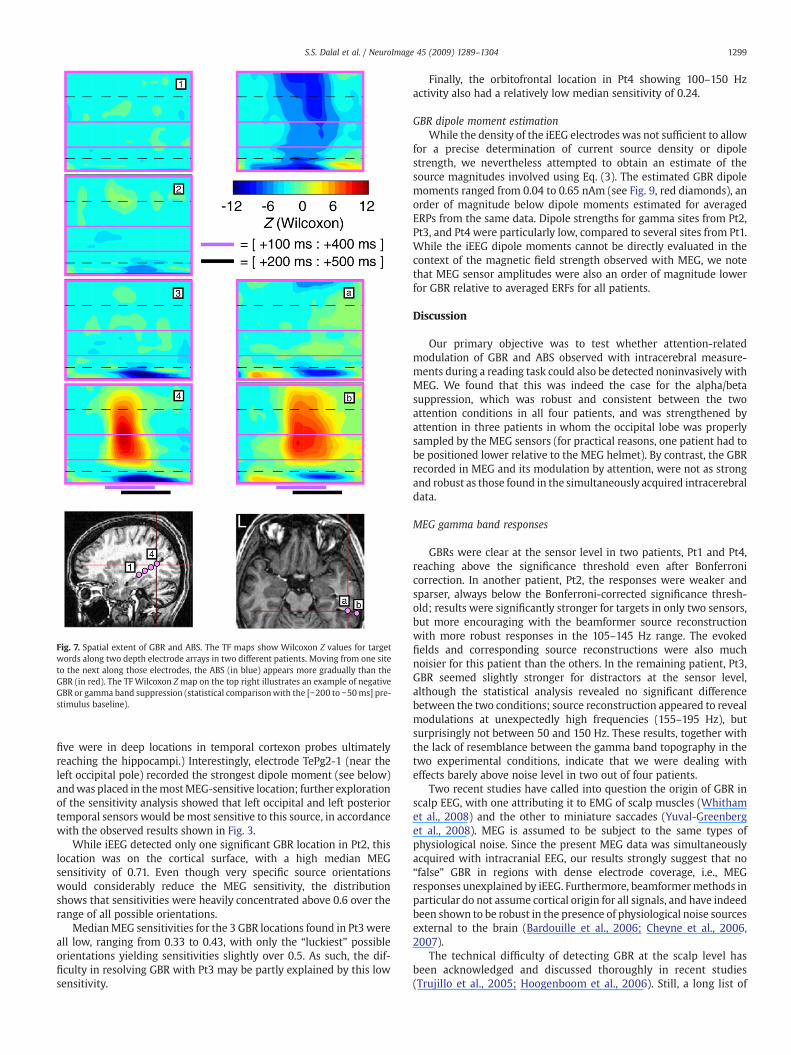
Fig. 7. Spatial extent of GBR and ABS. The TF maps show Wilcoxon Z values for targetwords along two depth electrode arrays in two different patients. Moving from one siteto the next along those electrodes, the ABS (in blue) appears more gradually than theGBR (in red). The TF Wilcoxon Zmap on the top right illustrates an example of negativeGBR or gamma band suppression (statistical comparisonwith the [−200 to −50ms] pre-stimulus baseline).
1299S.S. Dalal et al. / NeuroImage 45 (2009) 1289–1304
five were in deep locations in temporal cortexon probes ultimatelyreaching the hippocampi.) Interestingly, electrode TePg2-1 (near theleft occipital pole) recorded the strongest dipole moment (see below)andwas placed in themostMEG-sensitive location; further explorationof the sensitivity analysis showed that left occipital and left posteriortemporal sensors would bemost sensitive to this source, in accordancewith the observed results shown in Fig. 3.
While iEEG detected only one significant GBR location in Pt2, thislocation was on the cortical surface, with a high median MEGsensitivity of 0.71. Even though very specific source orientationswould considerably reduce the MEG sensitivity, the distributionshows that sensitivities were heavily concentrated above 0.6 over therange of all possible orientations.
MedianMEG sensitivities for the 3 GBR locations found in Pt3 wereall low, ranging from 0.33 to 0.43, with only the “luckiest” possibleorientations yielding sensitivities slightly over 0.5. As such, the dif-ficulty in resolving GBR with Pt3 may be partly explained by this lowsensitivity.
Finally, the orbitofrontal location in Pt4 showing 100–150 Hzactivity also had a relatively low median sensitivity of 0.24.
GBR dipole moment estimationWhile the density of the iEEG electrodes was not sufficient to allow
for a precise determination of current source density or dipolestrength, we nevertheless attempted to obtain an estimate of thesource magnitudes involved using Eq. (3). The estimated GBR dipolemoments ranged from 0.04 to 0.65 nAm (see Fig. 9, red diamonds), anorder of magnitude below dipole moments estimated for averagedERPs from the same data. Dipole strengths for gamma sites from Pt2,Pt3, and Pt4 were particularly low, compared to several sites from Pt1.While the iEEG dipole moments cannot be directly evaluated in thecontext of the magnetic field strength observed with MEG, we notethat MEG sensor amplitudes were also an order of magnitude lowerfor GBR relative to averaged ERFs for all patients.
Discussion
Our primary objective was to test whether attention-relatedmodulation of GBR and ABS observed with intracerebral measure-ments during a reading task could also be detected noninvasively withMEG. We found that this was indeed the case for the alpha/betasuppression, which was robust and consistent between the twoattention conditions in all four patients, and was strengthened byattention in three patients in whom the occipital lobe was properlysampled by the MEG sensors (for practical reasons, one patient had tobe positioned lower relative to the MEG helmet). By contrast, the GBRrecorded in MEG and its modulation by attention, were not as strongand robust as those found in the simultaneously acquired intracerebraldata.
MEG gamma band responses
GBRs were clear at the sensor level in two patients, Pt1 and Pt4,reaching above the significance threshold even after Bonferronicorrection. In another patient, Pt2, the responses were weaker andsparser, always below the Bonferroni-corrected significance thresh-old; results were significantly stronger for targets in only two sensors,but more encouraging with the beamformer source reconstructionwith more robust responses in the 105–145 Hz range. The evokedfields and corresponding source reconstructions were also muchnoisier for this patient than the others. In the remaining patient, Pt3,GBR seemed slightly stronger for distractors at the sensor level,although the statistical analysis revealed no significant differencebetween the two conditions; source reconstruction appeared to revealmodulations at unexpectedly high frequencies (155–195 Hz), butsurprisingly not between 50 and 150 Hz. These results, together withthe lack of resemblance between the gamma band topography in thetwo experimental conditions, indicate that we were dealing witheffects barely above noise level in two out of four patients.
Two recent studies have called into question the origin of GBR inscalp EEG, with one attributing it to EMG of scalp muscles (Whithamet al., 2008) and the other to miniature saccades (Yuval-Greenberget al., 2008). MEG is assumed to be subject to the same types ofphysiological noise. Since the present MEG data was simultaneouslyacquired with intracranial EEG, our results strongly suggest that no“false” GBR in regions with dense electrode coverage, i.e., MEGresponses unexplained by iEEG. Furthermore, beamformermethods inparticular do not assume cortical origin for all signals, and have indeedbeen shown to be robust in the presence of physiological noise sourcesexternal to the brain (Bardouille et al., 2006; Cheyne et al., 2006,2007).
The technical difficulty of detecting GBR at the scalp level hasbeen acknowledged and discussed thoroughly in recent studies(Trujillo et al., 2005; Hoogenboom et al., 2006). Still, a long list of
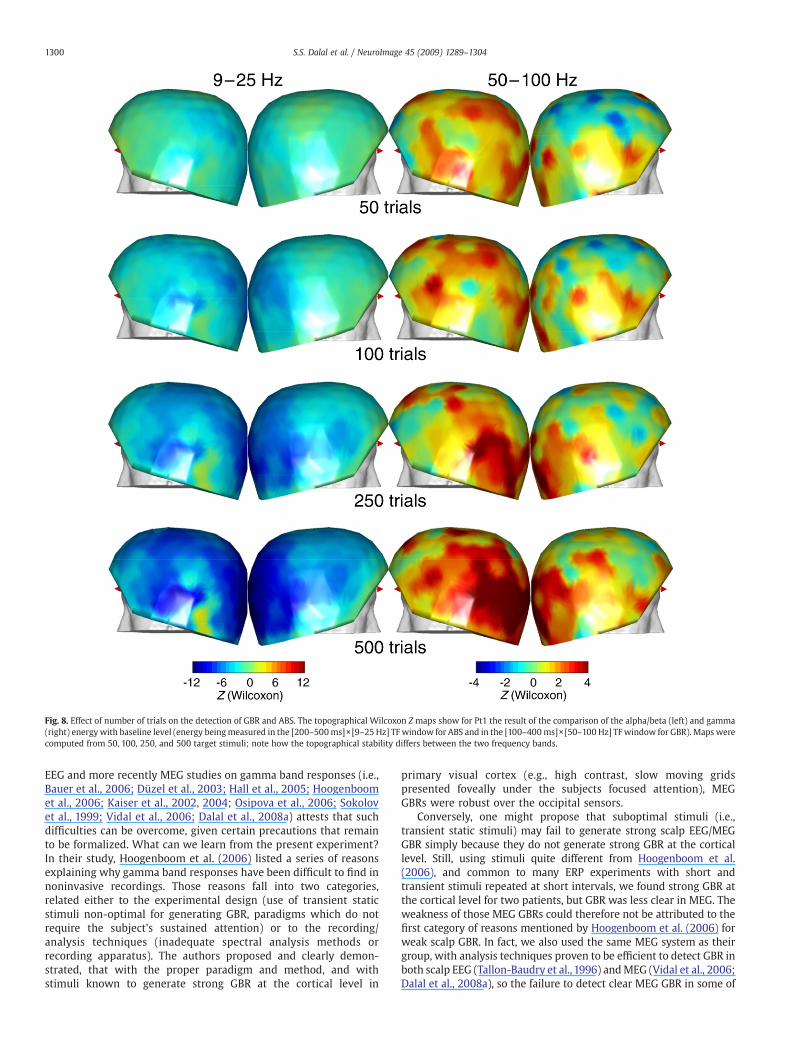
Fig. 8. Effect of number of trials on the detection of GBR and ABS. The topographical Wilcoxon Z maps show for Pt1 the result of the comparison of the alpha/beta (left) and gamma(right) energywith baseline level (energy beingmeasured in the [200–500ms]×[9–25 Hz] TF window for ABS and in the [100–400ms]×[50–100 Hz] TF window for GBR). Maps werecomputed from 50, 100, 250, and 500 target stimuli; note how the topographical stability differs between the two frequency bands.
1300 S.S. Dalal et al. / NeuroImage 45 (2009) 1289–1304
EEG and more recently MEG studies on gamma band responses (i.e.,Bauer et al., 2006; Düzel et al., 2003; Hall et al., 2005; Hoogenboomet al., 2006; Kaiser et al., 2002, 2004; Osipova et al., 2006; Sokolovet al., 1999; Vidal et al., 2006; Dalal et al., 2008a) attests that suchdifficulties can be overcome, given certain precautions that remainto be formalized. What can we learn from the present experiment?In their study, Hoogenboom et al. (2006) listed a series of reasonsexplaining why gamma band responses have been difficult to find innoninvasive recordings. Those reasons fall into two categories,related either to the experimental design (use of transient staticstimuli non-optimal for generating GBR, paradigms which do notrequire the subject's sustained attention) or to the recording/analysis techniques (inadequate spectral analysis methods orrecording apparatus). The authors proposed and clearly demon-strated, that with the proper paradigm and method, and withstimuli known to generate strong GBR at the cortical level in
primary visual cortex (e.g., high contrast, slow moving gridspresented foveally under the subjects focused attention), MEGGBRs were robust over the occipital sensors.
Conversely, one might propose that suboptimal stimuli (i.e.,transient static stimuli) may fail to generate strong scalp EEG/MEGGBR simply because they do not generate strong GBR at the corticallevel. Still, using stimuli quite different from Hoogenboom et al.(2006), and common to many ERP experiments with short andtransient stimuli repeated at short intervals, we found strong GBR atthe cortical level for two patients, but GBR was less clear in MEG. Theweakness of those MEG GBRs could therefore not be attributed to thefirst category of reasons mentioned by Hoogenboom et al. (2006) forweak scalp GBR. In fact, we also used the same MEG system as theirgroup, with analysis techniques proven to be efficient to detect GBR inboth scalp EEG (Tallon-Baudry et al., 1996) andMEG (Vidal et al., 2006;Dalal et al., 2008a), so the failure to detect clear MEG GBR in some of
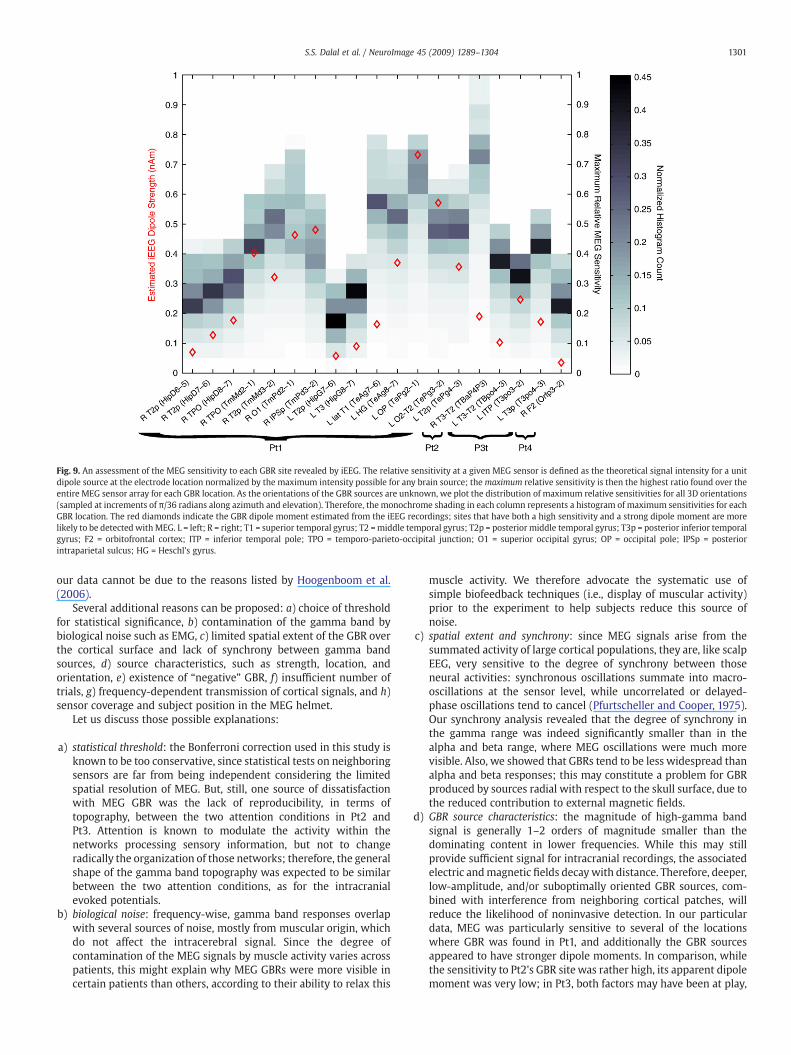
Fig. 9. An assessment of the MEG sensitivity to each GBR site revealed by iEEG. The relative sensitivity at a given MEG sensor is defined as the theoretical signal intensity for a unitdipole source at the electrode location normalized by the maximum intensity possible for any brain source; themaximum relative sensitivity is then the highest ratio found over theentire MEG sensor array for each GBR location. As the orientations of the GBR sources are unknown, we plot the distribution of maximum relative sensitivities for all 3D orientations(sampled at increments of π/36 radians along azimuth and elevation). Therefore, the monochrome shading in each column represents a histogram of maximum sensitivities for eachGBR location. The red diamonds indicate the GBR dipole moment estimated from the iEEG recordings; sites that have both a high sensitivity and a strong dipole moment are morelikely to be detected with MEG. L = left; R = right; T1 = superior temporal gyrus; T2 =middle temporal gyrus; T2p = posterior middle temporal gyrus; T3p = posterior inferior temporalgyrus; F2 = orbitofrontal cortex; ITP = inferior temporal pole; TPO = temporo-parieto-occipital junction; O1 = superior occipital gyrus; OP = occipital pole; IPSp = posteriorintraparietal sulcus; HG = Hes chl's gyrus.
1301S.S. Dalal et al. / NeuroImage 45 (2009) 1289–1304
our data cannot be due to the reasons listed by Hoogenboom et al.(2006).
Several additional reasons can be proposed: a) choice of thresholdfor statistical significance, b) contamination of the gamma band bybiological noise such as EMG, c) limited spatial extent of the GBR overthe cortical surface and lack of synchrony between gamma bandsources, d) source characteristics, such as strength, location, andorientation, e) existence of “negative” GBR, f) insufficient number oftrials, g) frequency-dependent transmission of cortical signals, and h)sensor coverage and subject position in the MEG helmet.
Let us discuss those possible explanations:
a) statistical threshold: the Bonferroni correction used in this study isknown to be too conservative, since statistical tests on neighboringsensors are far from being independent considering the limitedspatial resolution of MEG. But, still, one source of dissatisfactionwith MEG GBR was the lack of reproducibility, in terms oftopography, between the two attention conditions in Pt2 andPt3. Attention is known to modulate the activity within thenetworks processing sensory information, but not to changeradically the organization of those networks; therefore, the generalshape of the gamma band topography was expected to be similarbetween the two attention conditions, as for the intracranialevoked potentials.
b) biological noise: frequency-wise, gamma band responses overlapwith several sources of noise, mostly from muscular origin, whichdo not affect the intracerebral signal. Since the degree ofcontamination of the MEG signals by muscle activity varies acrosspatients, this might explain why MEG GBRs were more visible incertain patients than others, according to their ability to relax this
muscle activity. We therefore advocate the systematic use ofsimple biofeedback techniques (i.e., display of muscular activity)prior to the experiment to help subjects reduce this source ofnoise.
c) spatial extent and synchrony: since MEG signals arise from thesummated activity of large cortical populations, they are, like scalpEEG, very sensitive to the degree of synchrony between thoseneural activities: synchronous oscillations summate into macro-oscillations at the sensor level, while uncorrelated or delayed-phase oscillations tend to cancel (Pfurtscheller and Cooper, 1975).Our synchrony analysis revealed that the degree of synchrony inthe gamma range was indeed significantly smaller than in thealpha and beta range, where MEG oscillations were much morevisible. Also, we showed that GBRs tend to be less widespread thanalpha and beta responses; this may constitute a problem for GBRproduced by sources radial with respect to the skull surface, due tothe reduced contribution to external magnetic fields.
d) GBR source characteristics: the magnitude of high-gamma bandsignal is generally 1–2 orders of magnitude smaller than thedominating content in lower frequencies. While this may stillprovide sufficient signal for intracranial recordings, the associatedelectric andmagnetic fields decaywith distance. Therefore, deeper,low-amplitude, and/or suboptimally oriented GBR sources, com-bined with interference from neighboring cortical patches, willreduce the likelihood of noninvasive detection. In our particulardata, MEG was particularly sensitive to several of the locationswhere GBR was found in Pt1, and additionally the GBR sourcesappeared to have stronger dipole moments. In comparison, whilethe sensitivity to Pt2's GBR sitewas rather high, its apparent dipolemoment was very low; in Pt3, both factors may have been at play,
1302 S.S. Dalal et al. / NeuroImage 45 (2009) 1289–1304
as the estimated dipole strength was relatively low in addition tobeing poorly situated for MEG detection.
e) gamma band suppression: our observation of decreased gammaband responses could constitute another reason for weak GBR inMEG, as localized decrease in gamma power would partiallycancel, at the scalp level, gamma band enhancements. Gammaband suppression has been repeatedly observed in EEG, especiallyat the intracranial level (Lachaux et al., 2005).
f) number of trials: the strongest MEG GBRs were observed with thedataset containing the largest number of viable trials (Pt1, 530trials), while the results were not apparent when the analyses wereinstead conducted with less than 250 trials. In contrast, there were210 and 365 analyzed trials in patients Pt2 and Pt3 respectively.Therefore, the number of trials was likely a strong factor in thedifferent GBR results across our three subjects.These results suggest that for static transient stimuli the detectionof GBR may require more trials than sustained stimuli (in this case,over 500; the experimental design in Hoogenboom et al. (2006)used six blocks of 75 trials). Those numbers differ markedly fromthose found in classic ERP experimental designs, and may seemimpractically largewhen testing several experimental conditions. Acommon alternative to using such large numbers of trials is toperform group statistics across several subjects, as most EEG/MEGstudies do (Kaiser et al., 2004; Vidal et al., 2006). Such groupstatistics can reveal patterns of GBR recurrent across severalindividuals, not necessarily apparent in all the individual subjectsbecause of low SNR. However, this strategy was ill-suited for thepresent study, which aimed to provide quantitative measures ofattention in individual subjects. Alternatively, new signal proces-sing techniques may be able to resolve neural signals, includingGBR, from fewer trials (Zumer et al., 2007).
g) frequency-dependent propagation: it is commonly stated that theskull and scalp effectively act as a lowpass filter, thereby passinglower frequency signals with more gain than higher frequencysignals. A handful of studies have attempted to quantify andexplain the frequency dependence of cortex-to-scalp signaltransmission. Some studies conclude that various head tissueshave significant reactivity, i.e., the conductivity of various headtissues are frequency-dependent even in the range of interest forEEG/MEG, with higher frequencies generally having higherconductivities than lower frequencies (Gabriel et al., 1996; Stinstraand Peters, 1998; Akhtari et al., 2003). The implications of thisrelationship for cortex-to-scalp signal transmission are not clear,but the simulations of Stinstra and Peters (1998) demonstrate thathigher conductivities counterintuitively result in lower gains witha spherical head model, perhaps due to the effects of volumeconduction. However, a study by Pfurtscheller and Cooper (1975)provides convincing evidence that the lowpass filter effect isprimarily due to polyphasic summation, i.e., the phase variance ofan activated cortical patch results in greater attenuation of higher-frequency signals when spatially averaged by a scalp EEG/MEGsensor. Unfortunately, such analysis of phase variance over corticalpatches was not feasible with our electrode spacing and coverage.
h) sensor coverage and head position: an MEG system with densersensor spacing may also increase the likelihood of recovering GBR,though this remains to be demonstrated; we are investigating thepossibility of further simultaneous recordings of MEG and iEEGwith a 275-channel system. Additionally, the weakest GBRs wereobtained from patient Pt3 whose brain was especially low relativeto the helmet. For this patient, it is possible that coverage of theoccipital and inferior temporal regions was incomplete, makingthe topography of both ABS and GBR difficult to interpret at thesensor level and reducing the SNR at the source level. Thisstressed the need to check the distance between the brain and thesensors before the experiment, a somewhat trivial, yet useful,precaution.
Alpha band suppressions
The topography of ABS was consistent across conditions, and thestatistical differences between conditions were strong. Consideringthe difficulty sometimes associated with extracting MEG GBR, onecan wonder why ABS were so much more clear than GBR in MEGdata. The main reason is that the problems listed above for GBR donot apply to ABS. First, the signal to noise ratio in the alpha and betabands is much better than in the gamma band, in part because thesignal is stronger; it is well known that the spectral energy of EEGand MEG data roughly decreases as frequency increases following a1/f law. Furthermore, noise sources are weaker, e.g., the spectrum ofEMG artifact rarely extends below 25 Hz (Tallon et al., 1995). Inaddition, we showed that the synchrony level between distant siteswas higher in the alpha/beta range than in the gamma range, inagreement with previous experimental (Tallon-Baudry et al., 2001;Lachaux et al., 2005) and theoretical studies (Kopell et al., 2000).Massively synchronous oscillations of this kind sum together inmacroscopic MEG signals and are more visible at the sensor level;consequently, the post-stimulus suppression or desynchronization ofthese oscillations is also more visible in MEG signals. Finally, our datashowed that ABS extended over wider cortical areas than GBR, aresult consistent with previous intracranial studies (Crone et al.,1998a,b), and also found at the MEG level (Hoogenboom et al., 2006;Dalal et al., 2008a). This may also explain why the alpha/beta bandmodulations were more visible at the MEG level. ABS thereforeconstitutes a noninvasive index of attention during reading, whichcan be reliably measured even in single subjects. This furthersupports the role of ABS as a quantitative marker of attention(Palva and Palva, 2007; Hanslmayr et al., 2007).
A further interesting feature of ABS is that they often coincide withGBR at the cortical level. The precise nature of this relationshipremains to be understood: most of the time, GBR seems to occursimultaneously with ABS (Crone et al., 1998a,b; Lachaux et al., 2005,2006; Mainy et al., 2007), but the converse is not necessarily true, asshown here. Also, the reactivity of GBR and ABS to experimentalmanipulation seems to be somewhat different (Lachaux et al., 2005),but to an extent that is still undetermined. If the correlation is found tobe systematic in certain cortical structures and experimental situa-tions, ABS may constitute a convenient “tip of the iceberg” easilyvisible from scalp recordings and signaling the presence of underlying,less accessible GBR.
Validation of MEG head models and source reconstruction algorithms
The present data also provides a unique opportunity to test therelative performance of oscillatory source reconstruction algorithms.One important problem common to all methods is the accuracy of thehead models used to estimate the lead field. We are currentlyinvestigating using these simultaneous recordings to empiricallycalculate the leadfield andevaluate its impact on source reconstructionaccuracy (Dalal et al., 2008b).
Finally, over the last few years, several algorithms have beenproposed to reconstruct such sources and have been demonstratedto recover GBR in primary sensory cortices (Gross et al., 2001; Davidet al., 2003; Hall et al., 2005; Dalal et al., 2008a). Applications ofthese algorithms to more complex networks, while encouraging(van Wassenhove and Nagarajan, 2007; Guggisberg et al., 2008; VanDer Werf et al., 2008), are thus far scant. We have seen that thesources of gamma band responses in our task were multiple andwidespread across the occipital, temporal, and parietal cortices;they should also involve language-related frontal areas, such asBroca's area and precentral gyrus (Jung et al., 2008; Mainy et al.,2008). It would be particularly compelling to evaluate various MEGsource reconstruction methodologies in the context of thesecomplex activations.
1303S.S. Dalal et al. / NeuroImage 45 (2009) 1289–1304
Acknowledgments
The authors would like to thank Florence Bouchet, Jean-ClaudeBourzeix, and Laurent Hugueville for their technical help. JPL wassupported by a grant from the Fondation Fyssen. SSD was supportedby a Bourse Chateaubriand from the Government of France and aMarie Curie Fellowship from the European Commission.
Appendix A. Supplementary data
Supplementary data associated with this article can be found, inthe online version, at doi:10.1016/j.neuroimage.2009.01.017.
References
Akhtari, M., Bryant, H.C., Emin, D., Merrifield, W., Mamelak, A.N., Flynn, E.R., Shih, J.J.,Mandelkern, M., Matlachov, A., Ranken, D.M., Best, E.D., DiMauro, M.A., Lee, R.R.,Sutherling, W.W., 2003. A model for frequency dependence of conductivities of thelive human skull. Brain Topogr. 16, 39–55.
Bardouille, T., Picton, T.W., Ross, B., 2006. Correlates of eye blinking as determined bysynthetic aperture magnetometry. Clin. Neurophysiol. 117, 952–958.
Bauer, M., Oostenveld, R., Peeters, M., Fries, P., 2006. Tactile spatial attention enhancesgamma-band activity in somatosensory cortex and reduces low-frequency activityin parieto-occipital areas. J. Neurosci. 26, 490–501.
Bichot, N.P., Rossi, A.F., Desimone, R., 2005. Parallel and serial neural mechanisms forvisual search in macaque area V4. Science 308, 529–534.
Cheyne, D., Bakhtazad, L., Gaetz, W., 2006. Spatiotemporal mapping of cortical activityaccompanying voluntary movements using an event-related beamformingapproach. Hum. Brain Mapp. 27, 213–229.
Cheyne, D., Bostan, A.C., Gaetz, W., Pang, E.W., 2007. Event-related beamforming: arobust method for presurgical functional mapping using MEG. Clin. Neurophysiol.118, 1691–1704.
Crone, N.E., Miglioretti, D.L., Gordon, B., Lesser, R.P., 1998a. Functional mapping ofhuman sensorimotor cortex with electrocorticographic spectral analysis. II. Event-related synchronization in the gamma band. Brain 121, 2301–2315.
Crone, N.E., Miglioretti, D.L., Gordon, B., Sieracki, J.M., Wilson, M.T., Uematsu, S., Lesser,R.P., 1998b. Functional mapping of human sensorimotor cortex with electrocortico-graphic spectral analysis. I. Alpha and beta event-related desynchronization. Brain121, 2271–2299.
Dalal, S.S., Zumer, J.M., Agrawal, V., Hild, K.E., Sekihara, K., Nagarajan, S.S., 2004. NUTMEG:a neuromagnetic source reconstruction toolbox. Neurol. Clin. Neurophysiol. 52.
Dalal, S.S., Guggisberg, A.G., Edwards, E., Sekihara, K., Findlay, A.M., Canolty, R.T., Berger,M.S., Knight, R.T., Barbaro, N.M., Kirsch, H.E., Nagarajan, S.S., 2008a. Five-dimensional neuroimaging: localization of the time-frequency dynamics of corticalactivity. NeuroImage 40, 1686–1700.
Dalal, S.S., Jerbi, K., Bertrand, O., Garnero, L., Baillet, S., Martinerie, J., Lachaux, J.-P.,2008b. Experimental calculation of magnetic lead fields using MEG simultaneouslyacquired with intracranial EEG [abstract]. Abstracts of the 14th Annual Meeting ofthe Organization for Human Brain Mapping. NeuroImage 41 (Suppl 1), e1.
David, O., Cosmelli, D., Hasboun, D., Garnero, L., 2003. A multitrial analysis for revealingsignificant corticocortical networks in magnetoencephalography and electro-encephalography. NeuroImage 20, 186–201.
Dormont, D., Cornu, P., Pidoux, B., Bonnet, A.M., Biondi, A., Oppenheim, C., Hasboun, D.,Damier, P., Cuchet, E., Philippon, J., Agid, Y., Marsault, C., 1997. Chronic thalamicstimulation with three-dimensional MR stereotactic guidance. AJNR Am. J.Neuroradiol. 18, 1093–1107.
Düzel, E., Habib, R., Schott, B., Schoenfeld, A., Lobaugh, N., McIntosh, A.R., Scholz, M.,Heinze, H.J., 2003. A multivariate, spatiotemporal analysis of electromagnetic time-frequency data of recognition memory. NeuroImage 18, 185–197.
Engel, J., 1987. Outcome with respect to epileptic seizures. In: Engel, J. (Ed.), SurgicalTreatment of the Epilepsies. Raven Press, New York, pp. 553–571.
Fries, P., Reynolds, J.H., Rorie, A.E., Desimone, R., 2001. Modulation of oscillatoryneuronal synchronization by selective visual attention. Science 291, 1560–1563.
Gabriel, S., Lau, R.W., Gabriel, C., 1996. The dielectric properties of biological tissues: II.Measurements in the frequency range 10 Hz to 20 GHz. Phys. Med. Biol. 41,2251–2269.
Gross, J., Kujala, J., Hämäläinen, M., Timmermann, L., Schnitzler, A., Salmelin, R., 2001.Dynamic imaging of coherent sources: studying neural interactions in the humanbrain. Proc. Natl. Acad. Sci. U. S. A. 98, 694–699.
Gruber, T., Müller, M.M., Keil, A., Elbert, T., 1999. Selective visual–spatial attention altersinduced gamma band responses in the human EEG. Clin. Neurophysiol. 110,2074–2085.
Guggisberg, A.G., Dalal, S.S., Findlay, A.M., Nagarajan, S.S., 2008. High-frequencyoscillations in distributed neural networks reveal the dynamics of human decisionmaking. Front. Hum. Neurosci. 1, 14.
Hall, S.D., Holliday, I.E., Hillebrand,A., Singh, K.D., Furlong, P.L., Hadjipapas, A., Barnes,G.R.,2005. The missing link: analogous human and primate cortical gamma oscillations.NeuroImage 26, 13–17.
Hanslmayr, S., Aslan, A., Staudigl, T., Klimesch, W., Herrmann, C.S., Bäuml, K.H., 2007.Prestimulus oscillations predict visual perception performance between andwithinsubjects. NeuroImage 37, 1465–1473.
Hoogenboom, N., Schoffelen, J.-M., Oostenveld, R., Parkes, L.M., Fries, P., 2006. Localizinghuman visual gamma-band activity in frequency, time and space. NeuroImage 29,764–773.
Huang, M.X., Mosher, J.C., Leahy, R.M., 1999. A sensor-weighted overlapping-spherehead model and exhaustive head model comparison for MEG. Phys. Med. Biol. 44,423–440.
Jung, J., Mainy, N., Kahane, P., Minotti, L., Hoffmann, D., Bertrand, O., Lachaux, J.-P., 2008.The neural bases of attentive reading. Hum. Brain Mapp. 29, 1193–1206.
Kaiser, J., Lutzenberger,W., Ackermann,H., Birbaumer, N., 2002. Dynamics of gamma-bandactivity induced by auditory pattern changes in humans. Cereb. Cortex 12, 212–221.
Kaiser, J., Bühler, M., Lutzenberger, W., 2004. Magnetoencephalographic gamma-bandresponses to illusory triangles in humans. NeuroImage 23, 551–560.
Kim, D.-S., Ronen, I., Olman, C., Kim, S.-G., Ugurbil, K., Toth, L.J., 2004. Spatial relationshipbetween neuronal activity and BOLD functional MRI. NeuroImage 21, 876–885.
Kirchberger, K., Hummel, C., Stefan, H., 1998. Postoperative multichannel magneto-encephalography in patients with recurrent seizures after epilepsy surgery. ActaNeurol. Scand. 98, 1–7.
Kopell, N., Ermentrout, G.B., Whittington, M.A., Traub, R.D., 2000. Gamma rhythms andbeta rhythms have different synchronization properties. Proc. Natl. Acad. Sci. U. S. A.97, 1867–1872.
Lachaux, J.-P., Lutz, A., Rudrauf, D., Cosmelli, D., Le Van Quyen, M., Martinerie, J., Varela,F., 2002. Estimating the time-course of coherence between single-trial brainsignals: an introduction to wavelet coherence. Neurophysiol. Clin. 32, 157–174.
Lachaux, J.-P., George, N., Tallon-Baudry, C., Martinerie, J., Hugueville, L., Minotti, L.,Kahane, P., Renault, B., 2005. The many faces of the gamma band response tocomplex visual stimuli. NeuroImage 25, 491–501.
Lachaux, J.-P., Hoffmann, D., Minotti, L., Berthoz, A., Kahane, P., 2006. Intracerebraldynamics of saccade generation in the human frontal eye field and supplementaryeye field. NeuroImage 30, 1302–1312.
Lachaux, J.P., Fonlupt, P., Kahane, P., Minotti, L., Hoffmann, D., Bertrand, O., Baciu, M., 2007.Relationship between task-related gamma oscillations and BOLD signal: new insightsfrom combined fMRI and intracranial EEG. Hum. Brain Mapp. 28, 1368–1375.
Latikka, J., Kuurne, T., Eskola, H., 2001. Conductivity of living intracranial tissues. Phys.Med. Biol. 46, 1611–1616.
Mainy, N., Kahane, P., Minotti, L., Hoffmann, D., Bertrand, O., Lachaux, J.-P., 2007. Neuralcorrelates of consolidation in working memory. Hum. Brain Mapp. 28, 183–193.
Mainy, N., Jung, J., Baciu, M., Kahane, P., Schoendorff, B., Minotti, L., Hoffmann, D.,Bertrand, O., Lachaux, J.-P., 2008. Cortical dynamics of word recognition. Hum. BrainMapp. 29, 1215–1230.
Malmivuo, J., Plonsey, R., 1995. Bioelectromagnetism—Principles and Applications ofBioelectric and Biomagnetic Fields. Oxford University Press, New York.
Mikuni, N., Nagamine, T., Ikeda, A., Terada, K., Taki, W., Kimura, J., Kikuchi, H., Shibasaki,H., 1997. Simultaneous recording of epileptiform discharges by MEG and subduralelectrodes in temporal lobe epilepsy. NeuroImage 5, 298–306.
Müller, M.M., Gruber, T., Keil, A., 2000. Modulation of induced gamma band activity inthe human EEG by attention and visual information processing. Int. J. Psychophysiol.38, 283–299.
Niessing, J., Ebisch, B., Schmidt, K.E., Niessing, M., Singer, W., Galuske, R.A.W., 2005.Hemodynamic signals correlate tightly with synchronized gamma oscillations.Science 309, 948–951.
Nobre, A.C., Allison, T., McCarthy, G., 1998. Modulation of human extrastriate visualprocessing by selective attention to colours and words. Brain 121 (Pt 7), 1357–1368.
Oishi, M., Otsubo, H., Kameyama, S., Morota, N., Masuda, H., Kitayama, M., Tanaka, R.,2002. Epileptic spikes: magnetoencephalography versus simultaneous electro-corticography. Epilepsia 43, 1390–1395.
Osipova, D., Takashima, A., Oostenveld, R., Fernández, G., Maris, E., Jensen, O., 2006.Theta and gamma oscillations predict encoding and retrieval of declarativememory. J. Neurosci. 26, 7523–7531.
Palva, S., Palva, J.M., 2007. New vistas for alpha-frequency band oscillations. TrendsNeurosci. 30, 150–158.
Pfurtscheller, G., Cooper, R., 1975. Frequency dependence of the transmission of the EEGfrom cortex to scalp. Electroencephalogr. Clin. Neurophysiol. 38, 93–96.
Rodriguez, E., George, N., Lachaux, J.P., Martinerie, J., Renault, B., Varela, F.J., 1999.Perception's shadow: long-distance synchronization of human brain activity.Nature 397, 430–433.
Sederberg, P.B., Kahana, M.J., Howard, M.W., Donner, E.J., Madsen, J.R., 2003. Theta andgamma oscillations during encoding predict subsequent recall. J. Neurosci. 23,10809–10814.
Shigeto, H., Morioka, T., Hisada, K., Nishio, S., Ishibashi, H., Kira, D.i., Tobimatsu, S., Kato,M., 2002. Feasibility and limitations of magnetoencephalographic detection ofepileptic discharges: simultaneous recording of magnetic fields and electro-corticography. Neurol. Res. 24, 531–536.
Singer, W., 1999. Neuronal synchrony: a versatile code for the definition of relations?Neuron 24, 49–65 111.
Sokolov, A., Lutzenberger, W., Pavlova, M., Preissl, H., Braun, C., Birbaumer, N., 1999.Gamma-band MEG activity to coherent motion depends on task-driven attention.NeuroReport 10, 1997–2000.
Steinmetz, P.N., Roy, A., Fitzgerald, P.J., Hsiao, S.S., Johnson, K.O., Niebur, E., 2000.Attention modulates synchronized neuronal firing in primate somatosensorycortex. Nature 404, 187–190.
Stinstra, J.G., Peters, M.J., 1998. The volume conductor may act as a temporal filter on theECG and EEG. Med. Biol. Eng. Comput. 36, 711–716.
Sutherling, W.W., Akhtari, M., Mamelak, A.N., Mosher, J., Arthur, D., Sands, S., Weiss, P.,Lopez, N., DiMauro, M., Flynn, E., Leah, R., 2001. Dipole localization of humaninduced focal afterdischarge seizure in simultaneous magnetoencephalographyand electrocorticography. Brain Topogr. 14, 101–116.
1304 S.S. Dalal et al. / NeuroImage 45 (2009) 1289–1304
Szurhaj, W., Bourriez, J.-L., Kahane, P., Chauvel, P., Mauguière, F., Derambure, P., 2005.Intracerebral study of gamma rhythm reactivity in the sensorimotor cortex. Eur. J.Neurosci. 21, 1223–1235.
Tallon-Baudry, C., Bertrand, O., 1999. Oscillatory gamma activity in humans and its rolein object representation. Trends Cogn. Sci. 3, 151–162.
Tallon-Baudry, C., Bertrand, O., Delpuech, C., Pernier, J., 1996. Stimulus specificity ofphase-locked and non-phase-locked 40 Hz visual responses in human. J. Neurosci.16, 4240–4249.
Tallon-Baudry, C., Bertrand, O., Fischer, C., 2001. Oscillatory synchrony between humanextrastriate areas during visual short-term memory maintenance. J. Neurosci. 21(RC177), 1–5.
Tallon-Baudry, C., Bertrand, O., Hénaff, M.-A., Isnard, J., Fischer, C., 2005. Attentionmodulates gamma-band oscillations differently in the human lateral occipitalcortex and fusiform gyrus. Cereb. Cortex 15, 654–662.
Tallon, C., Bertrand, O., Bouchet, P., Pernier, J., 1995. Gamma-range activity evoked bycoherent visual stimuli in humans. Eur. J. Neurosci. 7, 1285–1291.
Tanji, K., Suzuki, K., Delorme, A., Shamoto, H., Nakasato, N., 2005. High-frequencygamma-band activity in the basal temporal cortex during picture-naming andlexical-decision tasks. J. Neurosci. 25, 3287–3293.
Trujillo, L.T., Peterson, M.A., Kaszniak, A.W., Allen, J.J.B., 2005. EEG phase synchronydifferences across visual perception conditions may depend on recording andanalysis methods. Clin. Neurophysiol. 116, 172–189.
Van Der Werf, J., Jensen, O., Fries, P., Medendorp, W.P., 2008. Gamma-band activity inhuman posterior parietal cortex encodes the motor goal during delayedprosaccades and antisaccades. J. Neurosci. 28, 8397–8405.
Van Veen, B.D., van Drongelen, W., Yuchtman, M., Suzuki, A., 1997. Localization of brainelectrical activity via linearly constrained minimum variance spatial filtering. IEEETrans. Biomed. Eng. 44, 867–880.
van Wassenhove, V., Nagarajan, S.S., 2007. Auditory cortical plasticity in learning todiscriminate modulation rate. J. Neurosci. 27, 2663–2672.
Vidal, J.R., Chaumon, M., O'Regan, J.K., Tallon-Baudry, C., 2006. Visual grouping andthe focusing of attention induce gamma-band oscillations at differentfrequencies in human magnetoencephalogram signals. J. Cogn. Neurosci. 18,1850–1862.
Whitham, E.M., Lewis, T., Pope, K.J., Fitzgibbon, S.P., Clark, C.R., Loveless, S.,Delosangeles, D., Wallace, A.K., Broberg, M., Willoughby, J.O., 2008. Thinkingactivates EMG in scalp electrical recordings. Clin. Neurophysiol. 119,1166–1175.
Yuval-Greenberg, S., Tomer, O., Keren, A.S., Nelken, I., Deouell, L.Y., 2008. Transientinduced gamma-band response in EEG as a manifestation of miniature saccades.Neuron 58, 429–441.
Zumer, J.M., Attias, H.T., Sekihara, K., Nagarajan, S.S., 2007. A probabilistic algorithmintegrating source localization and noise suppression for MEG and EEG data.NeuroImage 37, 102–115.
Related Documents


