APPENDIX E Socioeconomics This appendix contains tabular data and supporting materials for Section 4.3: Social, Economic, and Demographic Characteristics of the Area and used in the analysis of socioeconomics for this EIS. E-1 Technical Memorandum: Economic Impact of Proposed Regional Air Service at Mammoth Yosemite Airport (2006) E-2 Additional Economic Summary Tables E-3 Technical Memorandum: Mammoth Yosemite Airport DEIS Economic Impact of Airport Expansion E-4 Traffic Information

Welcome message from author
This document is posted to help you gain knowledge. Please leave a comment to let me know what you think about it! Share it to your friends and learn new things together.
Transcript

APPENDIX E Socioeconomics
This appendix contains tabular data and supporting materials for Section 4.3: Social, Economic, and Demographic Characteristics of the Area and used in the analysis of socioeconomics for this EIS.
E-1 Technical Memorandum: Economic Impact of Proposed Regional Air Service at
Mammoth Yosemite Airport (2006) E-2 Additional Economic Summary Tables E-3 Technical Memorandum: Mammoth Yosemite Airport DEIS Economic Impact of
Airport Expansion E-4 Traffic Information

W:\12006395_Mammoth\EIS\Appendices\Working Files\Appendix Intros.doc\9/26/2007
Appendix E-1
Technical Memorandum: Economic Impact of Proposed Regional Air Service at Mammoth Yosemite Airport
The purpose of this technical memorandum is to evaluate the economic impact of the Proposed Action Alternative for the Mammoth Yosemite Airport in the Town of Mammoth Lakes, California. This appendix contains a description of local development activity, calculation of the composite regression model used in the analysis, and a presentation of changes in economic output as a result of the regional service alternative.
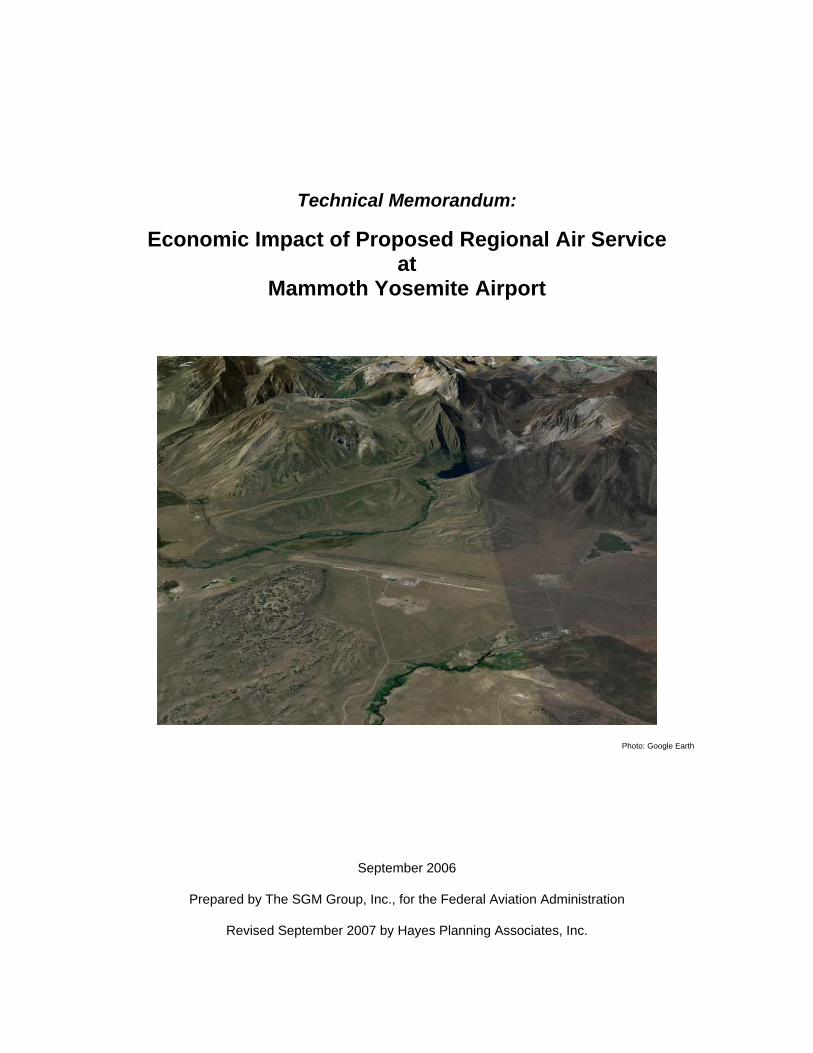
Technical Memorandum:
Economic Impact of Proposed Regional Air Service at
Mammoth Yosemite Airport
Photo: Google Earth
September 2006
Prepared by The SGM Group, Inc., for the Federal Aviation Administration
Revised September 2007 by Hayes Planning Associates, Inc.

The SGM Group, Inc. Page 1 11/2/2007
TABLE OF CONTENTS
1.0 Introduction ............................................................................................................................................. 3 2.0 Existing Conditions.................................................................................................................................. 5
2.1 Background................................................................................................................................ 5 2.2 Mammoth Lakes and Mono County .......................................................................................... 5
2.2.1 Mammoth Lakes.........................................................................................................5 2.2.2 Mono County ..............................................................................................................7 2.2.3 Mono County Tourism................................................................................................9
2.3 Two-County Socioeconomic Study Area—Economic Profile .................................................... 9 2.4 Summary—Existing Conditions............................................................................................... 10
3.0 Economic and Development Impacts of the Proposed Action.............................................................. 11 3.1 Overview of Socioeconomic Methodology and Terminology .................................................. 11
3.1.1 Regression Modeling................................................................................................11 3.1.1 Regression Modeling................................................................................................12 3.1.2 Input-Output Model Application................................................................................13 3.1.3 Determining Population, Housing and Development Impacts..................................15
3.2 Economic Impacts ................................................................................................................... 16 3.2.1 Employment Opportunities .......................................................................................16 3.2.2 Value Added.............................................................................................................16 3.2.3 Tax Related Impacts ................................................................................................16 3.2.4 Additional Measures of Economic Value..................................................................17
3.3 Development Impacts.............................................................................................................. 17 3.4 Summary of Economic and Development Impacts ................................................................. 18
4.0 Glossary ................................................................................................................................................ 20
Table and Figures ....................................................................................................................................... 22
Endnotes ..................................................................................................................................................... 50

The SGM Group, Inc. Page 2 11/2/2007
LIST OF TABLES Table 1: Forecast Enplanements—Proposed Action.................................................................................. 24 Table 2: Two-County Study Area 2000-2005.............................................................................................. 25 Table 3: Distribution of Housing Units by Jurisdiction and Type 2000—2005........................................... 26 Table 4: Change in Development since 2004............................................................................................. 27 Table 5: Estimated Change in Existing Commercial Development 2004-2005 .......................................... 28 Table 6: Historic Skier Visits Mammoth and June Mountains 1980-2006 .................................................. 29 Table 7: Yosemite Visitation Data 1980-2005............................................................................................. 30 Table 8: Estimated Total Output for Inyo and Mono Counties 2005........................................................... 31 Table 9: Two-County Employment and Population 1990-2005 .................................................................. 32 Table 10: Alternative Employment Forecast Models—Summary Output ................................................... 34 Table 11: Composite Model ........................................................................................................................ 35 Table 12: No-Action Alternative Forecasts—Mono and Inyo Counties 2008-2015 .................................... 36 Table 13: Population and Employment Impact—Mono and Inyo Counties 2008-2015.............................. 37 Table 14: Development Impact—Mono and Inyo Counties 2008-2015..................................................... 38 Table 15: Total Employment Impact by Economic Sector Proposed Action 2015 ..................................... 39 Table 16: Total Value Added Impact Proposed Action 2015...................................................................... 40 Table 17: Total Taxes—Proposed Action Model 2015 ............................................................................... 41 Table 18: Indirect Business Taxes—Proposed Action 2015...................................................................... 42 Table 19: Total Output Proposed Action 2015............................................................................................ 43 Table 20: Employee Compensation Proposed Action 2015 ....................................................................... 44 Table 21: Average Employee Salaries Proposed Action Model 2015 ........................................................ 45 Table 22: Summary—Geographic Distribution of Socioeconomic Impacts 2008 and 2015....................... 47 LIST OF FIGURES Figure 1: Updated Composite Model .......................................................................................................... 48 Figure 2: Updated MMH Model................................................................................................................... 49 Figure 3: Population and Employment Forecast—Mono and Inyo Counties 2000-2015 ........................... 50 Figure 4: Two-County Employment Impact—Distribution by Economic Sector 2015................................. 51

The SGM Group, Inc. Page 3 11/2/2007
1.0 Introduction The purpose of this technical memorandum is to evaluate the proposed Horizon Airlines operation specifications amendment for the Mammoth Yosemite Airport (MMH) in the Town of Mammoth Lakes, California. Horizon Airlines has proposed initiating regional air carrier service into MMH (MMH). Under this proposal, service would be provided using existing airport facilities, involving no runway modification or construction of new facilities. The only airport modification would be a remodel of an existing maintenance building to serve as a passenger terminal to accommodate updated passenger security requirements. This remodeling of an existing building is not subject to FAA approval. This proposed Horizon Airlines MMH operation specifications amendment is referred to as the Proposed Action for the remainder of this study.
This technical memorandum also refers to a previous study entitled Technical Memorandum: Mammoth Yosemite Airport DEIS—Economic Impact of Airport Expansion, May 2005, which was also prepared by The SGM Group, Inc. This previous study was conducted in conjunction with the earlier environmental impact statement concerning a proposed MMH runway expansion. In October 2005 the FAA stopped work on the proposed airport expansion EIS. Since then the Town of Mammoth Lakes focused its efforts on the pursuit of airline services that was regional in nature and could be accommodated within the existing facilities at MMH. Horizon Airlines submitted its letter of intent to provide regional carrier air service to the Federal Aviation Administration (FAA) in May 2006 resulting in the preparation of this EIS (71 FR 41859). This report references the previous May 2005 technical memorandum and relies upon parts of the May 2005 memorandum that remain valid today. The referenced material pertains to concepts and information that did not depend upon the specific proposal that was being evaluated at that time. The May 2005 technical memorandum is included as Appendix E-3.
This analysis examines the potential economic effects of the Proposed Action using the same methodology applied in the earlier technical memorandum that examined potential economic impacts linked to implementation of broader commercial service.1 The procedure retains the original case studies but updates the composite model based on changes in local MMH market area information used in the original application. The significant decrease in the total number of enplanements for the regional versus the runway extension alternative indicate that updating the individual case studies would not result in measurable change to the total output. Changes in local taxation and visitation data, where available, were incorporated in the update.
One significant change from the original study is that construction costs are not included in this analysis since the interior remodeling of an existing building to accommodate passenger handling is not subject to FAA approval. Also, fiscal analysis updates are not included because of the reduced overall development-related impacts. For the purpose of this updated impact study, the baseline year has been shifted to 2005. Initially, it was anticipated that the Horizon Air Service to MMH would begin in 2008. Consequently, this technical memorandum forecasts socioeconomic impacts for the years 2008 to 2015. However, since the completion of the economic modeling, the starting year for the Horizon Air Service was delayed until 2009. The projected impacts are considered representative for the revised analysis period of 2009-2015 since the forecast of aviation activity indicates that the maximum level of operations would be reached prior to the 2015 analysis year.
As in the previous study, the Two-County Socioeconomic Study Area, which includes Mono and Inyo counties, the Town of Mammoth Lakes and the City of Bishop, was selected as the basis for the economic impact analysis for several reasons: First, although it represents an area larger than that selected for other components of the Environmental Impact Statement, counties are the smallest jurisdiction for which economic data are available on a consistent basis; and, second, this area encompasses the primary area that could be affected by changes in the resort economy that dominates the area. Year-round access throughout the area is available primarily along the north-south transportation corridor centered on California’s US Route 395. East-west access throughout a significant portion of the region is often unavailable during the winter season, the period of time during which the resort center serves a major portion of the region’s visitors. As a result, the potential change in

The SGM Group, Inc. Page 4 11/2/2007
employment throughout the impact area, although tied to year-round activities, is most affected by opportunities linked to winter-season visitors.
As shown in Table 1, forecasts provided by the Town indicate that initial service would include two flights per day between Los Angeles International (LAX) and Mammoth Yosemite (MMH). This initial service would run for 112 days beginning with the 2008/2009 winter season, generating approximately 10,200 departing passengers (enplanements). From 2008 through 2011, the number of daily winter flights would increase from two to eight, with expanding service to Las Vegas, northern and southern California. The number of winter enplanements during this period would increase to 60,900.
By 2012, summer service of two additional flights per day may be added for a two-month period, with additional enplanements expected to start at 5,500 in 2012, increasing to 6,250 in later years. By 2013 the total number of annual enplanements is projected reach 67,200. This total represents the maximum that can be accommodated under the Proposed Action based on the fact that the proposed passenger terminal facility and aircraft apronwould only be capable of processing one aircraft at a time.
A key assumption in this analysis is that enplanements represent “additional new visitors” to the Mammoth Lakes area, rather than passengers who would have driven from Los Angeles to Mammoth Lakes in the absence of commercial air service. This analysis assumes the regional service between Los Angeles and MMH would primarily function as a connecting flight, thereby allowing skiers and other tourists to fly from their local airport to Los Angeles International Airport (LAX) and from LAX to MMH. Assuming that enplanements signify “additional new visitors” insures that this EIS discloses the maximum potential for environmental impacts in terms of effect on future growth and development. However, it is likely that some percentage of visitors that currently drive approximately 300 miles from the Los Angeles area would take advantage of the new commercial service; therefore, this analysis is quite conservative and may over-predict what could occur if service to MMH were initiated.
The magnitude for potential tourism-related socioeconomic impact is best understood by first estimating the potential additional visitor days that could result from the Proposed Action. The Mammoth Lakes Visitor’s Bureau estimates an annual average of 2.8 million visitors come to the Town of Mammoth Lakes. The winter season, from November through April attracts approximately 1.3 million visitors and in the summer season, June through September, the town hosts approximately 1.5 million tourists. Visitors in both seasons stay an average of four days. The off-seasons (i.e. shoulder seasons) for tourism in the area are spring and fall. The tourism industry dominates the employment characteristics of the region. In 2005, the accommodations and food services sectors accounted for approximately 20 percent of the employment and 16 percent of the industrial output in the Socioeconomic Study Area (SMG, Inc., 2006).
During the first year of regional air service at MMH (winter season of 2008-2009), it is forecasted that there would be two flights per day for 112 days during the ski season - resulting in approximately 10,214 passenger enplanements. These enplanements could represent 10,214 “new visitors,” who are projected to stay in the area an average of four nights based on data from the Mammoth Lakes Visitors Bureau. This represents an increase of 40,856 additional “visitor days” during the 2008-2009 winter season. By 2015, it is forecasted that there would be two flights per day for 60 days during the summer and eight flights per day during 112 days of the winter season. As a result, there could be 6,240 enplanements during the summer season and 60,928 enplanements during the winter season. Assuming an average of four nights per visit for summer and winter visitors, an additional 268,672 additional annual visitor days is projected in 2015. Information from the Mammoth Lakes Visitors Bureau indicates that the Town of Mammoth Lakes experiences an average of approximately 11,200,000 annual visitor days. Thus, the Proposed Action could potentially result in a 0.4 percent increase in total annual visitor days in 2009, and a 2.4 percent increase in total annual visitor days in 2015.
Section 2 is an update in the description of existing conditions and local development activity. Section 3 gives an overview of the socioeconomic methodology and terminology as well as a presentation of the potential socioeconomic and development impacts resulting from the Proposed Action.

The SGM Group, Inc. Page 5 11/2/2007
2.0 Existing Conditions
2.1 Background Since preparation of the earlier May 2005 study, development-related activity in the Mammoth Lakes market area has continued in concert with local economic conditions. The updated description of existing economic conditions and development activity in the Mammoth Lakes region provides a context in which to evaluate the revised economic impacts of the Proposed Action at MMH. Section 2.2 updates market conditions in the Mammoth Lakes region. Total economic output for the Two-County Study Area is re-examined in Section 2.3, The Two-County Socioeconomic Study Area Economic Profile. Section 2.4 presents a summary of the existing conditions. As input to the analysis for all jurisdictions, revised baseline demographic and housing data were available from the California Department of Finance, Demographic Research Division, as this division offers the most current data by subarea. Employment data was derived from several sources. Total employment by county was available through the Bureau of Economic Analysis (BEA) of the U.S. Department of Commerce, Regional Economic Information Service. Subarea employment distribution was provided by the State of California, Employment Development Department, Labor Market Information Division (LMI). As information from these sources is used in this analysis, its application is defined and purpose described.
2.2 Mammoth Lakes and Mono County
2.2.1 Mammoth Lakes
The Town of Mammoth Lakes, California, the center of economic activity in the region, is located in Mono County on the east side of the Sierra Nevada mountain range and is the only incorporated jurisdiction within Mono County. Located at an elevation of 7,800 feet, directly below Mammoth Mountain’s summit of 11,053 feet, the town is nearly equidistant from the Los Angeles Basin and San Francisco in terms of drive time.2 In the winter, the Los Angeles Basin is approximately a six-hour drive and San Francisco, a seven-hour drive. The closest major city with an international airport is Reno, Nevada, which is a three-hour drive to the north/northwest. The incorporated boundaries of the town measure approximately 25 square miles; however, only four square miles of developable land are located within the town limits. The Inyo National Forest surrounds the remaining land area, which effectively contains its growth.3
Mammoth Lakes is continuing to experience an increasing level of private sector investment and development. In 1997, Intrawest acquired nearly 60 percent ownership in Mammoth Mountain and expected to invest nearly $750 million in improvements in the Town of Mammoth Lakes and the Mountain over the next decade.4 In early 2006, Starwood Capital Group acquired 85 percent of Intrawest interests. Preceding that acquisition, Starwood Capital Group also acquired an 85 percent interest in MMSA. In addition, other large development sites have been recapitalized by nationally recognized investment companies.5
As a result of this investment, the Town of Mammoth Lakes is continuing to experience growth rates greater than those realized in the greater Eastern Sierra region. In this study, the Eastern Sierra region refers to the geographic area covering Mono and Inyo counties, including the Town of Mammoth Lakes and the City of Bishop. As of January 2005, the full-time resident population of the Town of Mammoth Lakes was estimated by the California Department of Finance at 7,602, a 7.2 percent increase since 2000 (Table 2).6
In 2005, according to the California Department of Finance, there were a total of 8,962 housing units with a vacancy rate of nearly 65 percent, indicating the magnitude of the second home market in the Town.7 Housing unit distribution is shown in Table 3. A large percentage of homeowners maintain a primary residence elsewhere (primarily in Southern California) and spend only part of the time in Mammoth’s mountain resort.8 The ratio of permanent residents to visitors is important in understanding Mammoth Lakes’ population and the potential economic impacts. The town experiences large fluctuations in the total non-resident population because of the seasonal nature of its tourism-dependent economy. In the

The SGM Group, Inc. Page 6 11/2/2007
winter, during the peak tourist season, the community and the ski area require additional employees to meet peak service demands. As a result, the resident population coupled with the tourism population can exceed 35,000 people during the peak winter tourism season.9 The town, therefore, accommodates a significantly larger population when the transient tourist populations are present.
The demands and resulting impacts from these population fluctuations, from the average daily residents to peak occupancy periods, are currently being addressed by the area as it continues to evolve from a primarily ski resort to a four-season resort. Over the last decade, in response to growing demand for additional year-round activities, two golf courses have been built, a variety of summer music festivals have been introduced, and other special events such as national road and mountain bike events have been organized. The expansion is designed to help draw golfers, music lovers, cyclists, hikers and participants in other activities and to attract a more stable year-round tourism base.
The Town of Mammoth Lakes has addressed several measures in anticipation of potential growth, and is in the process of recommending a specific plan to limit the high density residential uses consistent with a mountain resort community while providing for a mix of commercial and visitor lodging along with affordable workforce housing. The private sector is responding to this plan with a new kind of residential product following a growing trend in ski/recreational areas experienced elsewhere in the country. Since Intrawest Corporation‘s initial participation at Mammoth Mountain beginning in 1996, several nationally recognized resort developers, in addition to and as replacements for the Intrawest Corporation, have successfully initiated construction in this market.10
In anticipation of growth in year-round tourism, the type of development currently proposed is primarily high-density residential with resort-associated retail—a product that differs from the existing housing stock, which is primarily single-family homes and small condominium/townhouse complexes. The type of high-density residential product entering the market, along with resort condominiums, is fractional-share ownership for condominiums. Under this management framework, an owner buys into a portion of the real estate (i.e. two weeks per year) with a sales price prorated as a function of the number of vacation weeks purchased. This partial ownership, referred to as a residence club concept, is the fastest growing segment of the luxury vacation home industry. This residential product has been marketed at several resort destinations including Aspen, Vail, and Telluride in Colorado; Heavenly Valley Ski Resort, and Northstar Club, Lake Tahoe; and the Teton Club in Jackson Hole, Wyoming.11 The Town of Mammoth Lakes is expecting five or six residential products of this type to enter the market by the year 2010. These residential complexes offer all the services and product finishes of a five-star hotel, coupled with direct access to the mountain and ski areas. There are three projects now approved for fractional ownership: the 80/50 private-residence club, Altis, and Swiss Chalet. Sales prices are expected to range up to $2,000 per square foot.12
The growing second home market coupled with increased developer investment in Mammoth Lakes has helped to stimulate a rise in real estate prices. Over an eight-year period, multi-family residential prices have increased from an average of $100 per square foot to just over $600 per square foot.13 Major residential developments proposed or currently in the planning process include several projects that are described in the following section.
Snow Creek Resort is a master-planned, full service resort situated on 345 acres.14 At completion, Snow Creek will include 2,300 units of resort residential development consisting of single-family homes, multi-family condominiums, overnight lodging, 150,000 square feet of resort commercial building (including an athletic club), and an 18-hole golf course. Approximately 40 percent of the residential product is complete and 20 percent of the commercial development is occupied. Nine holes of the eighteen-hole course are in play. Prices for the new residential units, which range in size from 2,500 to 3,000 square feet, are approximately $1.0 million. The majority of these units are owner-occupied, serving primarily as second homes to Southern Californians.
Sierra Star Development Corporation has a current total of 1,251 units planned along the Sierra Star golf course and up to 80,000 square feet of commercial space. Within that development, Intrawest completed approximately 139 units to date.15

The SGM Group, Inc. Page 7 11/2/2007
North Village, located at the intersection of Route 203 and Lake Mary Road, is a planned residential/commercial node of four different planned residential projects with a total of 3,020 bedrooms. The major companies at North Village are now Intrastar, Intrawest, 80/50, Hillside/Meridian Group, Western Resort Properties, and Dempsey Corporation. In addition to the 3,020 bedrooms for residential and lodging, there are approximately 135,000 square feet of commercial space.16 Prices are expected to range from $500 per square foot to over $2,000 per square foot. Over the last six years, condominium unit prices at this location for multi-family units have increased from an average of $150 per square foot to over $500.
As shown in Table 4, approximately 485 residential units have been added to the Town of Mammoth Lakes inventory since 2004. In addition, nearly 13,200 square feet of commercial space has been added since preparation of the earlier study, including some space that entered the market in late 2004 as well as in 2005.17 As a result, the updated 2005 base year estimate of existing commercial inventory in the Town of Mammoth Lakes, as shown in Table 5, is nearly 1.2 million square feet.
2.2.2 Mono County
Mono County is located on the eastern side of the Sierra Nevada, along the California-Nevada border. The main highway providing year-round access is US 395. Located within the county are the Inyo and Toiyabe National Forests, Mono Basin National Forest Scenic Area, Devils Postpile National Monument, Bodie State Historic Park, and portions of Yosemite National Park and the Ansel Adams Wilderness. The Town of Mammoth Lakes is the only incorporated community in the county. The Mono County government oversees the unincorporated areas, including June Lake, Bridgeport, Crowley Lake, Bodie, Lee Vining, Benton, Convict Lake, Twin Lakes, Walker, Topaz, and Coleville. Mammoth Mountain Ski area and June Lake Ski areas are among the major employers.
Development in Mono County is limited by the lack of large concentrations of private lands outside of existing communities. Parcels of private land large enough for development are often agricultural and not available for development.18 Furthermore, much of the land is not suitable for development, either because of the steep topography, lack of access, or as a result of the threat of a natural disaster from seismic or volcanic activity, avalanche, or flooding.19
Land use within the unincorporated areas of Mono County is constrained by land ownership. Approximately 94 percent of the land in the county is publicly owned; 88 percent is federally owned; and the State, the Los Angeles Department of Water and Power, or Native American Tribal groups own the remainder. The majority of private land within the county is concentrated in community areas, with the remainder dispersed throughout the county in small parcels.20 The population of Mono County (including the Town of Mammoth Lakes) grew by almost 30 percent from 9,960 in 1990 to 12,853 in 2000.21 In 2005 the population was estimated at 13,537 (Table 2).22 There are nearly as many housing units in the county as there are inhabitants, but more than half of them serve as vacation retreats or second homes for people residing in larger cities. A total of 13,210 housing units are located in the county with approximately 56 percent designated as vacant.23 This high vacancy rate is indicative of the large second home market in the county. The growth in the second home market appears to result from increasing development pressures in Antelope Valley and the northern areas of the county, from Chalfont and the Bishop area, and in the Long Valley community around Crowley Lake. The Crowley Lake area development is a spin-off of increasing development pressure in the Mammoth area. Growth is expected to continue in the future, with county population expected to peak in the future at approximately 27,400—an increase of 102 percent over current levels.24 The majority of the residents in the county live near the town of Mammoth Lakes. The resident or permanent population, however, represents only a fraction of the total actual population during peak visitation periods. It is estimated that the population of the county triples during the summer and winter seasons because of the number of visitors.

The SGM Group, Inc. Page 8 11/2/2007
The Mono County economy is largely driven by tourism, generated by year-round recreational opportunities offered from its Eastern Sierra location accessible throughout the year. According to local sources, this growth can be attributed to a recent increase in retirees settling in Mammoth Lakes in particular and Mono County in general. 25 Economic conditions are contributing to an increase in the number of Californians choosing to retire early, and an increasing number of retirees are choosing to locate in Mammoth Lakes and Mono County. The retirement market is fueled by the lifestyle based on access to nature and outdoor recreational activities. In addition, the investment Intrawest Corporation made beginning in 1996 in Mammoth Mountain and June Mountain has upgraded the ski resort, including the ski area, mountain services, lodging and mountain facilities. These improvements have helped to make Mammoth Mountain one of the top ski resorts in the country. Intrawest, recently acquired in large-part by Starwood Capital Group, has been a leading developer of the village-centered resort concept in North America with a similar project at Whistler in British Columbia, and Copper Mountain and Squaw Valley in California. This investment in the Town, the Mountain, and in other winter activities, along with the opening of two new golf courses, has made this resort a premier four-season resort.26
These recently upgraded recreation facilities have helped to attract families back to the area who for years went elsewhere during a period of decline in the early 1990s.27 These families are now buying into the upgraded real estate and investing in second homes, helping to drive up a second-home market that is now priced in excess of $500,000 per unit.28 Additional large-scale development in Mono County has continued as described in the following sections, now in planning stages, may continue to drive additional growth and development.
June Lake: As reported in the earlier technical memorandum (May 2005), the developer has been seeking approval for a 110–acre site located on the Old Rodeo Grounds at June Lake, between Gull and Silver Lakes. The development is expected to include approximately 652 multi-family units plus 102 single-family lots. The site is located across from the June Mountain ski area, which is operated by Mammoth Mountain. The entire project is expected to be phased in over a ten-year period. Plans also include up to 14,500 square feet of supporting retail. This development is designed to appeal to the second-home owner.29
Additional single-family development underway or proposed is located primarily around Crowley Lake and Long Valley. This development activity, described in the May 2005 Technical Memorandum, includes Paradise Community, Chalfont, White Mountain Estates, King Lake, and Crowley Lake. New homes planned in these communities are intended as vacation retreats or second homes for people residing in larger cities. Prices are expected to average approximately $600,000 for a single-family home.30 In addition, by the end of 2005, the total existing estimated commercial space in Mono County had grown to 2.96 million square feet as shown in Table 5.
Overall, the services, retail trade, and government sectors dominate Mono County’s employment. Industry projections for the future estimate that the job growth in Mono County will continue in the same three sectors. In 2005 the accommodations, entertainment, food, and retail trade sectors represented more than 40 percent of the total employment, while the government sector accounted for an additional 26 percent of total employment.31 This distribution is expected to continue, particularly in terms of accommodations and related services, as the county continues to grow. Government, including education, city and county government continues to be a major employment sector in the county, and this sector is expected to see some growth as the demand for government services, particularly local government, expands in concert with expected population growth.
The major job centers in the county are concentrated in Mammoth Lakes (services, retail trade, and government), June Lake (seasonal services and retail trade) and Bridgeport (government). The county’s major employers include June Mountain Ski Area, Mammoth Elementary School, Mammoth Hospital, Mammoth Lakes Fire Department, Mammoth Mountain Inn, Mammoth Mountain Ski area, Mono County government, Mountainside Grill (restaurant), and Whiskey Creek at Mammoth (restaurant).32
The SGM Group, Inc. Page 9 11/2/2007
2.2.3 Mono County Tourism
Tourism is the major generator of economic activity in the study region, and both Mono County and the Town of Mammoth Lakes offer distinct seasonal attractions, including skiing and snow-related sports in the winter and mountain biking, hiking, golfing, fishing, horse back riding and rock–climbing in the summer. During the 1980s Mammoth Mountain was the premier ski resort in the nation based on the number of skier visits, fueled by an annual average of 384 inches of snowfall per year.33 In the summer, major area attractions include Yosemite National Park, the Ansel Adams and John Muir Wilderness areas, and Mono Lake.
The Mammoth Lakes Visitor’s Bureau estimates an annual average of 2.8 million visitors per year. The winter season, from November through April attracts approximately 1.3 million visitors and in the summer season, June through September, the town hosts approximately 1.5 million tourists.34 The shoulder seasons are spring and fall.
The historic skier-day statistics provided by Mammoth Mountain Ski Area for Mammoth Mountain and June Mountain are shown in Table 6. As indicated, Mammoth Mountain recently reached a new peak skier visitation in the 2005-2006 season with nearly 1.54 million skiers. This total compares to a low of 865,628 skier visits experienced during the 1996-1997 season. In 1996, in an attempt to reverse the decline, Mammoth Mountain and Intrawest began investing in the Mountain, improving snowmaking capabilities while renovating the mountain lodging and ski facilities. As shown in Table 6, beginning in the 2000-2001 season, the skier numbers have improved steadily.
During 2005, as shown in Table 7, Yosemite National Park estimated a total of approximately 3.3 million visitors, a slight decline from the 2003 total of 3.38 million. These visitors also visit other regional attractions such as Mono Lake, June Lake, and Devils Postpile National Monument. Regional tourists may only visit Yosemite National Park and the Devils Postpile National Monument during the summer months, since the local entrances to these parks are closed by snowfall during the winter months. The average summer visitor spends 4.3 nights per visit.35 The Mammoth Lakes Visitor’s Bureau estimates that typical winter visitors to Mammoth Lakes travel in small groups averaging four people. On average, three of the four visitors ski and one person in the group does not. The average winter visitor spends four nights per visit, which usually includes a weekend.36
Mammoth Mountain ski area has a 24,000 skier maximum daily capacity, which is a factor limiting the potential for increased winter recreation activity.37 Sherwin Bowl, located east of Mammoth Mountain, is the one area of potential mountain expansion. This area is already served by infrastructure, but there is little or no potential for obtaining approval from the U.S. Forest Service for additional development. An Environmental Impact Review was completed in the nearly 1990s with a Record of Decision that was active only through 1998. As a result, the decision has since lapsed. The area could have accommodated an additional 8,000 skiers per day.38
June Lake Ski Area, approximately 30 minutes from Mammoth Mountain, also owned by Mammoth Mountain, sold approximately 95,000 ski passes in 2005-2006 and averages about 800 skiers per day in a busy month and up to 2,750 per day on the busiest weekend of the year, President’s Day. The skier capacity stated in the June Lake Master Plan allows for 4,000 skiers at one time on the Mountain.39 In comparison to Mammoth Mountain, June Mountain generally has greater appeal to families and those learning to ski or snowboard.
2.3 Two-County Socioeconomic Study Area—Economic Profile This section of the existing conditions analysis updates the combined economic characteristics for the Two-County Socioeconomic Study Area. Table 8 summarizes data describing the Two-County Study Area, including industry output, employment, compensation, income, taxes, and total value added.40 The summary also indicates the percentage distribution by economic sector for the two counties.

The SGM Group, Inc. Page 10 11/2/2007
The discussion that follows describes relative strengths and weaknesses of individual economic sectors, and their importance to the future growth and development of the counties. In addition, the baseline information is indicative of the potential qualitative impacts of the Proposed Action in helping to identify and understand what elements of the economy could experience the greatest impacts. Tourism is the major industry in the region, but there is no single economic sector identified as the “tourism industry” sector. As a result, discussions of economic activity related to tourism aggregate data from several separate sectors, including accommodation and food services; retail services; arts, entertainment and recreation; and portions of other sectors.
Table 8 summarizes the latest available data for the two counties including sector-by-sector values reflecting areawide economic activity. The information provided should be viewed as a snapshot of the value of local economic conditions as last measured. Data for the latest year available was used to estimate current economic activity, based on application of consumer price indices for the affected time period.
In 2005 the two-county employment base of 21,433 generated overall industry output equal to nearly $1.9 billion. Total employee compensation exceeded $690 million, with value added on the order of $1.25 billion. Of that total, the real estate sector captured nearly 5.8 percent of the employment but nearly 12.7 percent of the total industry output and over 12.8 percent of value added for the two counties. The accommodations and food services sector added an additional 20 percent of the employment, nearly 16 percent of the industry output, and just over 14 percent of value added. The strength of the government sector is also evident, with nearly 26.7 percent of the employment, 43 percent of the employee compensation, and over 32 percent of the value added. The high percentage of value added and employee compensation components of the county’s economy follows from the earlier information that average wages in the government sector are significantly greater than those in other dominant sectors of the local economy. Together, the four primary sectors of the two-county economy—real estate, accommodation and food services, government, and retail trade—account for nearly 67 percent of the total county employment and more nearly 70 percent of the total value added.
As shown in Table 9, annual full- and part-time employment for the Two-County Socioeconomic Study Area has grown from 17,057 in 1990 to approximately 21,433 in 2005.41 During the same period, population has grown from 28,237 in 1990 to just over 32,110 in 2005. Employment growth has averaged just over 1.5 percent annually during this 15-year period; population growth only 0.86 percent. In this summary, population is resident population in the two counties; employment is an annual average of full- and part-time employment in the two counties, reported by place or work.
2.4 Summary—Existing Conditions The existing conditions analysis provides a picture of past development trends and examines future demand for growth and development in the two-county region. The majority of the expanded growth in the region has occurred since 1996 when Intrawest Corporation purchased a 60 percent interest in Mammoth and June Mountains along with the developable real estate. Development in Mammoth of three new village areas (The Village at Mammoth, Sierra Star, and Juniper Springs) brought a new character to the resort, different in nature, at a price that the area had not previously seen.
This new development, both residential and commercial, is luxury in character and links Mammoth’s commercial /residential area to the ski resort in a manner similar to that of the nation’s other premier winter resorts. At the same time, Intrawest Corporation, and now Starwood Capital Group, and Mammoth Mountain upgraded the ski area’s lodging facilities and the ski operations. This development has helped to change the character of the ski area.
Two new golf courses and a variety of summer programs have helped to expand the summer season in Mammoth, contributing to a growing effort to make this area a four-season resort. The increased pace of development in Mammoth Lakes has spilled over to neighboring Inyo County, which is also dependent on the tourism industry, albeit summer rather than winter visitation. This expansion can be documented in Inyo County in the form of stabilizing the tourism base, creating a more attractive environment for year-round young retirees and summer tourism.

The SGM Group, Inc. Page 11 11/2/2007
3.0 Economic and Development Impacts of the Proposed Action
3.1 Overview of Socioeconomic Methodology and Terminology This section describes the methodology used to determine the economic and development impacts of the Proposed Action. As discussed in the May 2005 Technical Memorandum, change in employment is the key to estimating the overall economic and development impacts of the Proposed Action. As shown in the diagram below, the case study and MMH regression models were updated in order to determine the potential change in full and part-time job opportunities resulting from the Proposed Action. Measuring the economic value attributed to the estimated increase in employment is accomplished through application of input-output models and refers to value added, total output, employee compensation, taxes, and other measurable factors. The revised Proposed Action employment forecasts are then used to estimate the changes in population, housing, and commercial development attributed to the overall increased employment in the Two-County Study Area.
Revised Population,
Housing and Commercial Development Forecasts -
Proposed Action
Alternative
Employment Forecasts -
Proposed Action Alternative
Net Economic Impacts of Proposed Action• Value Added • Tax Impacts • Total Output • Employee Compensation • Indirect Business Taxes
MMH Enplanement Forecasts for Proposed Action
2005 Technical Memorandum and Case Study Analysis
No-Action Forecasts
Regression Modeling• Case Study Composite Model Update • MMH Model Update
IMPLAN Input-Output Modeling
The SGM Group, Inc. Page 12 11/2/2007
3.1.1 Regression Modeling
The forecast model used to estimate change in employment in the study area is fundamentally linked to the number of enplanements associated with proposed levels of service at MMH for the Proposed Action. Estimates of future enplanements reflect the potential number of visitors to the area as a result of air service. The airport sponsor, with approval by the Federal Aviation Administration, provides the estimate of future enplanements at the airport as a primary input to the employment change forecasts as indicated in Table 1.42
The analytical process used in the economic impact study builds on the case study approach documented in the original technical memorandum. Using several locations with similar airport and resort characteristics, two regression models were derived that demonstrated the link between changes in airport activity and change in defined market area employment. The case study composite model demonstrated that as airport service increased, employment in the jurisdictions served by the airport increased as linked to the change in enplanements. The results of the case studies were then compiled into a second composite model that used the data collected for each of the local applications along with similar data for the Mammoth Yosemite area, including existing employment, taxes associated with visitor activity, visitation to major recreation facilities, and use of ski resorts.
Case Study Composite Model The case study models were used primarily to test the methodology and to determine whether the approach yielded reasonable estimates of potential impacts on future employment as a function of available data. That data included taxes generated from visitor spending, enplanements at airports serving the particular locations, skier activity, and visits at nearby national parks where appropriate. As reported in the earlier technical memorandum, output of the case studies indicated that a link between levels of visitor activity, measured in part by the number of enplanements, could be used to forecast impacts of levels of airport service on market area employment. The models indicated that enplanements were neither the only nor most significant contributor to the employment forecast, but still a measurable contributor.
In this updated application of the model to the Proposed Action, the output of individual case studies was not directly used, but the data on which the case studies were based was used to compile the composite model. The composite model was updated to include revised BEA employment and population numbers, updated skier visits and taxation data, as well as updated national park visitation data for the years available. With these changes, the revised composite model generated a coefficient for enplanements slightly different from that calculated in the original study—a reduction to 0.01724 from 0.01817 (Table 10). Coupled with the significant change in forecast enplanements at MMH, the application of the forecasting model resulted in decreased estimated employment and related economic impacts for the Mammoth Yosemite study area.
The updated Composite Model is presented in the following equation:
Total Employment = (0.000656024*Taxes)+(0.003093262 * Skier Days) +
(0.003203912*Park Visits) + (0.017235135 * Enplanements)
Data used as input to the model is shown in Table 11, and the model derivation is shown in Figure 1. When compared to the original case study models, the enplanements coefficient for the composite model remains comparable to experience at the Colorado airports included in the analysis.
The methodology used in the analysis is an adaptation and application of what is known in the literature as “Benefit Transfer.” Benefit transfer is a term referring to the use of existing information and knowledge to new contexts. In particular, the process used in this analysis is an adaptation and use of economic information derived from specific study areas to a site with similar resources and conditions—in this case
The SGM Group, Inc. Page 13 11/2/2007
a transfer of information derived from a carefully selected set of case study examples to a similar future case affecting the Town of Mammoth Lakes and the Proposed Action use of MMH.43
MMH Model As in the earlier runway extension alternative study, the next step in the economic analysis generates an estimate of relevant growth and development factors in Mono and Inyo Counties for the revised target years 2008 through 2015. The factors used to create the forecasting model necessary to estimate economic impacts include population, transient occupancy taxes, Yosemite National Park visitors, and overall ski activity. The model estimates changes in employment associated with Proposed Action, and changes in employment are then used to measure potential change in economic value.
As with the case study applications, the MMH model uses enplanement forecasts to estimate the change in total regional employment linked to the Proposed Action. As defined, the affected region includes two counties: Mono and Inyo. Estimating change for each of the input variables over time, given their previous cyclical variation, is, in fact, only an estimate. Forecasts for each of the significant variables are used to derive a baseline employment estimate (without implementation of the Proposed Action) for the period of time 2006 through 2015. The desired output of the model is an estimate of change in total employment as a function of total enplanements attributed to implementing the Proposed Action.
As shown in Table 12, each of the data categories is projected through 2015 for the No-Action Alternative. Transient occupancy taxes are estimated based on trend analysis from 1992 through 2005. Yosemite visitors are estimated based on an existing data through 2005 and an assumed constant increase of 1 percent per year over time. Since long-range major planning efforts for the future of Yosemite National Park are currently underway, this forecast is used only as a source to help measure the change in total employment output. Ski activity is also estimated on the basis of trend analysis of existing data from 1992 through 2005. Population estimates are derived separately and not included as input to the forecast model. Because of the nature of the resort economy, population becomes a dependent variable, a function of the projected change in employment using average labor force participation rates experienced over time.
The resulting impact model is shown in Figure 2 with the added coefficient measuring the contribution linked to enplanements as derived from the composite forecast model.
Total employment = (1.344176746 * TOT / 1,000) + (2.645986501 * Yosemite Visitors / 1,000) +
(0.246061993 * Skier Days / 1,000) + (0.017235135 * Enplanements)
“TOT” refers to “transient occupancy taxes.” These taxes are collected on top of lodging fees and represent a contribution to the economy from visitors. The output of the model application is summarized in Table 13. Application of the revised Proposed Action model generates the outputs shown in Tables 13 and 14. By 2015, enplanements projected for the Proposed Action would generate an additional 1,158 full- and part-time employees (averaged on an annual basis). The change in employment linked to the Proposed Action is the number used for the input output model application. Measuring the change in economic value and other results of the input output model are discussed in the next section.
3.1.2 Input-Output Model Application As in the previous technical memorandum, this updated economic impact analysis uses input-output models prepared by IMPLAN to measure the value of direct, indirect, and induced spending on the economy. These models build on existing conditions and linkage characteristics to predict the potential capture within a defined region of a direct infusion of capital. In this case, visitor spending by air travelers is the predominant source for the infusion of capital that has the potential for creating measurable economic impacts.

The SGM Group, Inc. Page 14 11/2/2007
Throughout the impact analysis discussion, it is important to maintain the distinction between input-output terminology and NEPA definitions of similar terms as discussed in this section. The terms direct impact, indirect impacts, and induced impacts have the following meanings for the purposes of this technical memorandum.
Input- Output Definitions
Direct Impacts: Consists of both on-airport and off-airport direct impacts. On-Airport Direct Impacts: Represents the on-site economic impacts that would not occur unless the
Proposed Action is implemented. Airport job opportunities include airline representatives, screeners, baggage handlers and other airport staff necessary to support the Horizon Air Service.
Off-Airport Direct Impacts (Visitor Spending): Off-airport direct impacts are expenditures made in the regional area by air travelers who are visiting from outside of the region. These expenditures include items such as lodging, food, entertainment, and retail purchases.
Indirect Impacts: The economic activity of local suppliers to the airport and tourist-related businesses that accommodate the air travelers. Two examples of local suppliers would be fuel suppliers to the airport and food distributors that service local restaurants. Induced Impacts: Induced impacts are the spin-off impacts reflecting the recycling of dollars through the economy associated with the spending of direct and indirect employees. Examples would be airport employees, waiters, or fuel transport workers spending their salaries for housing, food and other services. This round of spending in turns generates more job opportunities in the regional economy. Economic impacts related to the airport fall into three categories as shown in the previous diagram and discussed below:
Direct Impacts: According to Input-Output analysis, direct impacts result from the direct infusion of capital spending ensuing from a particular change in economic activity. In this case, the increased level of visitor activity as measured by the Proposed Action enplanement forecast represents the infusion of new capital. New visitors increase the level of expenditure in the surrounding region, and that change in level of expenditure increases the demand for goods and services. For example, increasing the number of visitors requires an increase in the level of employment in the retail, accommodations, and entertainment sectors of the economy. These increased expenditures, especially when they occur during midweek when previous levels of activity were often reduced, increase employment. The estimated change in the level of employment is defined as a direct effect of the change in capital expenditures in the defined study region. One can consider these effects to be both “On-Airport” and “Off-Airport” direct effects. On-Airport direct effects include the increase in employment at the airport itself. Forecasts of increased employment at the airport are minimal and appear under the economic sector “transportation and warehousing.” Off-Airport direct effects include the additional jobs created from visitor spending in the accommodations, retail trade, service, construction and government sectors. The input-output analysis concludes that approximately 820 additional direct jobs (both full- and part-time) would occur in 2015 throughout the Two-County Study Area, with only 10 to 12 jobs at the airport itself. The forecast distribution of the jobs is shown in Table 15 in the Technical Memorandum.
Indirect Impacts: Within the framework of input-output analysis, indirect impacts refer to additional local jobs, material, equipment, and services required to produce non-labor resources that contribute to direct employment and increases in direct output. For example, increases in restaurant employment are categorized as direct impacts. Indirect impacts would refer to additional employment in service industries

The SGM Group, Inc. Page 15 11/2/2007
that supply the restaurants. For example, additional jobs occur in the wholesale food sector because storage and distribution of additional food is required to respond to the increased demand for restaurant services. All of the jobs created in the economic sectors that supply or enable the direct impacts are classified as “indirect.”
Induced Impacts: Input-output analysis uses the term “induced” to refer to all local jobs, materials, equipment, and services required to fulfill the household demands for goods and services, generated by the wages of additional direct and indirect employees. For example, new employees at restaurants servicing the increased demand linked to changes in visitor expenditures earn salaries. These salaries become “household” income. Expenditure of household income creates another round of increased demand for goods and services to meet the increased needs of new households. Increased demand associated with changes in household expenditures is defined as “induced” impact. This increased demand includes all sectors of the economy to some degree, characteristic of normal expenditures patterns in this resort economy.
Application of the input-output model generates an estimate of the potential value linked to implementation of the Proposed Action as a result of a potential increase in population and employment. Measuring economic benefits associated with the Proposed Action is based on the differential employment associated with its potential impacts versus how the region would develop for the No-Action Alternative. If there is an effect on employment as a result of the proposed change in service, then there is value associated with those changes in terms of employment compensation, value-added, output and tax benefits. This economic impact analysis uses input-output models prepared by IMPLAN to measure the value of direct, indirect, and induced spending on the economy. These models build on existing conditions and linkage characteristics to predict the potential capture within a defined region of a direct infusion of capital. In this case the direct infusion of capital has the potential for creating measurable economic impacts. In addition, an increase in population and employment generates an increase in development; and, in 2015, the estimated increase in development is a function of a projected increase of 1,158 employees over and above that which is expected to occur without the Proposed Action. It is important that projected changes in total employment do not begin to appear until and after 2008, when the Proposed Action to the airport is expected to begin.
3.1.3 Determining Population, Housing and Development Impacts Additional employment linked to the Proposed Action will, in turn, increase the demand for housing and commercial development. Increased housing demand is proportional to the projected increase in population; increased demand for commercial/retail space is proportional to projected increase in employment. Employment change can be used to estimate this additional development through a series of steps. Using current development averages, it is possible to estimate the extent of commercial development potential that might be linked to the Proposed Action.
Using past trends in labor force participation rates, future change in employment can be used to estimate a concurrent change in population. Further, past trends in housing construction and occupancy data, including average persons per household, can be used to translate future population change into an estimate of change in future demand for housing units. Existing housing unit distribution patterns can also be used to estimate how this increase in demand for housing units is translated into housing type. Similarly, past history in average square feet of retail and commercial space per employee can be used to generate an estimate of change in demand for commercial and retail space. Where information is available, past trends can also help to generate an estimate of possible distribution of increased development demand by jurisdiction.
It should be noted that the ability to realize potential development opportunities is dependent on numerous significant factors in addition to airport-linked potential, including market feasibility, compatibility with approved land use plans in both counties and the incorporated areas within those counties, and availability of suitable land for development.

The SGM Group, Inc. Page 16 11/2/2007
3.2 Economic Impacts
3.2.1 Employment Opportunities
The projected total employment difference between the No-Action and Proposed Action alternatives, including direct, indirect, and induced, is shown for all three employment categories in Table 15. As shown in Table 13, changes do not appear until after the Proposed Action operations at the airport begin—starting in 2008. Beginning in that year, the resulting employment differences between the No-Action and Proposed Action alternatives begin to grow as enplanements increase from 10,214 in 2008 to nearly 67,200 in 2015 as cited in Table 1.44 The change in total population and employment over time is also shown in Figure 3. Application of the forecasting model indicates that the projected employment differential is expected to increase from 176 in 2008 to 1,158 in 2015 (Table 13).
Total employment change is comprised of direct, indirect, and induced effects represented by the multiplier effect. By 2015, this employment multiplier effect (ratio of total employment to direct employment) is expected to reach 1.41, which reflects the dominance of the service industry in the two counties. This multiplier effect, which is a measure of the ratio of direct employment to total employment, equals 1.41 using data shown in Table 15 (1,158/821). For each 100 new jobs created, an additional 41 jobs result in support of changes in direct employment. As shown in Table 13, overall employment in the Two-County Study Area is projected to grow to 26,235 by 2015 without the Proposed Action and to 27,393 with implementation of Proposed Action.45 Employment benefits in Mono and Inyo counties, linked to the Proposed Action, are shown for 2015 and include direct, indirect, and induced employment attributed to employment changes at the airport (Table 15). Projected distribution of the air-service linked employment is shown in Figure 4.
The value of the expected change in employment over time, however, is related to expected employment compensation; iterative expenditures by households in purchasing additional goods and services; and the taxes paid by individuals, households and businesses. The value represented by these expenditures is discussed in the next section of this study.
3.2.2 Value Added As indicated in the introduction, value added is the combination of wages, state and local taxes paid by households, dividends, interest, and profit. Value added represents the total sum of value created by business and household expenditures in the region or study area and, as such, is an effective measure of economic activity. In economic terms, value added is also known as gross regional product.
As shown in Table 16, value added for the two counties based on the projected employment benefit is approximately $67.5 million by 2015. For this value, the multiplier effect is on the order of 1.39. For every $1,000 value added generated as a result of new employment, $390 addition is created as a result of indirect and induced employment in support of direct employment. As shown in Table 16, there are four primary economic sectors affected by the increase in employment: retail trade, real estate and rental services, accommodations and food services, and government. Together, these sectors account for more than 60 percent of the increased allocation. The total value added shown combines contributions from increased airport employment, visitor-generated employment, and other regional employment increases within the Two-County Study Area.
3.2.3 Tax Related Impacts
Table 17 illustrates the potential tax increments associated with implementation of the Proposed Action by 2015. This output as shown combines contributions from all three components, including airport, visitor-generated, and net regional. Total 2015 tax benefits associated with implementing Proposed Action are estimated to be nearly $14.8 million—a total that is already included in value added. This total incorporates the entire tax-related contributions of the estimate 1,158 additional employees and their associated business activities attributed to the proposed improvement project.46 Indirect business taxes

The SGM Group, Inc. Page 17 11/2/2007
associated with implementing Proposed Action are estimated to be just over $5.9 million in 2015—a total also included in value added (Tables 17 and 18).
3.2.4 Additional Measures of Economic Value
Other measures of economic value shown in Tables 19 through 21 include total output and employee compensation. Total output (Table 19), which represents a single total measuring the overall value of an industry’s total production, is estimated at just over $105.2 million in 2015. Employee compensation (Table 20), one of the components of value added, is expected to reach nearly $35 million by that date. Average salaries (combined full- and part-time) are shown in Table 21 and are expected to vary from a low of $7,500 to a high in the mid $80,000s. The overall average in 2006 dollars is estimated at $30,200 and represents a combination of full- and part-time average compensation by economic sector.
3.3 Development Impacts This section of the analysis reviews the process used to estimate change in development activity and the potential output in a manner similar to that used in the earlier analysis of the runway extension alternative. This analysis generates an order-of-magnitude estimate of the possible demand for additional residential and commercial space linked to the Proposed Action. Actual realization of these projections is a function of changing market conditions as well as public and private sector policies and marketing efforts. Past trends can be used to predict an estimate of potential development activity as a way to frame the possible impacts linked to the Proposed Action. An increase in development demand grows out of any increase in regional tourism and related economic activity, and this increased demand affects future fiscal considerations.
The employment difference linked to the Proposed Action is projected to grow from just over 176 in 2008 to 1,158 in 2015. During the same time period, population growth associated with that estimated employment change is expected to increase from just over 252 to just nearly 1,520 (Table 22). Estimated population change is based on past trends in the ratio of number of employees to resident population, evaluated using historic data from 1990 through 2005.
Population forecasts are coupled with housing stock data to measure the historic relationship between resident population and total number of housing units. Historic data on the number of housing units, both occupied and total are also shown in Table 22 and are derived from data supplied by the California Department of Finance.47 Based on these historic conditions, the forecast change in population linked to the Proposed Action is projected to result in a change in total number of housing units from nearly 178 in 2008 to 1,088 by 2015, with occupied unit change linked to airport service increasing from 108 in 2008 to 646 in 2015 (Table 22). The estimate of vacancy rates for future development, based on historic housing market parameters, would likely be less for employee-based residential development; however, a significant percentage of additional housing may continue to represent a seasonal market. As a result, annual average vacancy rates may still be close to those characteristic of earlier historic data. Using the existing market trends, therefore, represents a worst-case estimate of vacancy rates over time. The demand resulting from the Proposed Action could impact limited development opportunities on a smaller scale.
Table 22 also indicates recent distribution of housing units for each jurisdiction in the Two-County Study Area. That distribution is used to estimate the potential distribution of additional housing units by jurisdiction in 2015. The distribution by jurisdiction is subject to changing market conditions over an extended period of time, but the data illustrated in this table indicate a possible configuration assuming recent current development patterns continue. Out of the total of 1,088 additional units, it is estimated that nearly 64% percent would be located in the Town of Mammoth Lakes. Ultimately, the actual distribution within the Town could be less as determined by availability of developable land, land use constraints, and market value. The allocation of units in the Town would require a significant component of high-end second homes compatible with current market trends. Smaller numbers of units are projected for the remaining jurisdictions, again subject to land availability and market value.

The SGM Group, Inc. Page 18 11/2/2007
Commercial development estimates are based on an inventory of existing space by jurisdiction, coupled with historic trends in average square feet per employee. As shown, approximately 6.2 million square feet of commercial development currently exists in the study area. This estimate is based primarily on county assessment data and growth estimates based in increases in employment over the past two years. Estimated employment by jurisdiction is used to calculate an average square feet per employee. That estimate is then applied to the total change in employment forecast for 2015 to determine additional commercial and retail space that could result from implementation of the Proposed Action.
Current commercial space inventories include an estimate of total commercial space in Inyo County of approximately 2.6 million square feet,48 and total commercial space in the Town of Mammoth Lakes, of approximately 1.2 million square feet.49 Using current employment, the Inyo County total implies an average of nearly 290 square feet of commercial space, including industrial, office, and retail uses, per employee. Total commercial space in Mono County is on the order of 2.96 million square feet with approximately 1.77 million located in the unincorporated areas of the county. Based on an existing employment of just over 10,150, the average square feet per employee in Mono County is approximately 292.
Using the existing ratio of square feet per employee, the two-county market area would realize an increase in demand for approximately 51,200 in 2008 and the beginning of service, growing to 336,750 square feet of additional commercial/retail space by 2015 as a result of increased economic activity linked to the availability of regional air service (Table 22). Of the 2015 total, nearly 90,000 square feet is allocated to the Town of Mammoth Lakes (27 percent of total), with an additional 58,670 square feet estimated for the remainder of Mono County (17 percent). A total of 188,225 square feet (56 percent) is estimated for Inyo County, including the City of Bishop. The percentage distribution is based on existing patterns of employment by subarea shown in Table 22. Using existing distribution patterns results in an illustrative example of how future commercial development patterns might occur.
3.4 Summary of Economic and Development Impacts The technical analysis measures potential economic impacts associated with the Proposed Action at MMH. The impacts measured are based on the enplanement forecasts provided by the study sponsor and approved by the FAA. What is important beyond the technical components is the demonstrated link between airport accessibility and economic growth and development in the Two-County Study Area. The Proposed Action is not expected to result in immediate impacts to the surrounding jurisdictions of Mono and Inyo counties, but rather continue to contribute to the ability to attract new resort-based businesses in support of existing growth and development patterns.
It is important to recognize that the Proposed Action by itself will not solve economic problems relating to seasonal and weekly variations in visitor-based activity. Whatever economic improvements or changes might occur in terms of increased occupancy rates during mid-week or during shoulder seasons is encompassed in the economic impacts measured on an average annual basis. Data does not exist to allow a direct measurement of potential changes in mid-week or seasonal activity levels. It is possible only to estimate potential effects on an average annual basis.
Relevant baseline conditions and estimated impacts linked to the Proposed Action are summarized in Table 22. Baseline conditions are shown for 2005, and impacts are measured for 2008 (initial year of operation) and 2015 (target year).
In 2008, impacts linked to initial operation of the airport as a regional facility with estimated enplanements just over 10,200, include the following:
Two-County Employment: 176 Commercial development: 51,206 square feet Population: 252 Total housing: 178 units Occupied housing: 108 units

The SGM Group, Inc. Page 19 11/2/2007
By 2015 impacts linked to the Proposed Action, with service accommodating nearly 67,170 enplanements, are projected to increase as follows:
Two-County Employment: 1,158 Commercial development: 336,736 square feet Population: 1,518 Total housing: 1,088 units Occupied housing: 646 units
The analysis indicates that, beginning in 2008, change in employment in the two counties, resulting from airport service and related development, is expected to grow from approximately 176 to 1,158 by 2015, including additional employment at the airport, additional employment associated with tourism, and additional employment associated with other service sector economic activity characteristic of the two-county economy. These changes are annual and cumulative, and would continue to increase if the period of analysis were extended.
The economic value of the estimated employment change is based on the measured value added. By 2015, value added is expected to reach $67.5 million. Again, value added benefits are annual and cumulative and would continue to grow in relation to the effects of implementing the Proposed Action versus No-Action Alternative (Table 16).
Associated with change in employment is change in employment compensation. Employment compensation is also included in value added. As shown in Table 20, total employment compensation associated with Proposed Action is projected to reach nearly $35 million by 2015. As with all of the impact measures for the study area regional economy, the major contribution to employee compensation originates in the retail trade, real estate services, accommodation and food services, and government sectors with a combined 60% percent of the total. Using employment compensation and full- and part-time employment for the Two-County Study Area, it is possible to estimate average 2015 salaries for each affected economic sector in 2006 dollars. Table 21 displays overall average salaries in 2015 which are projected to be on the order of nearly $30,000. All average salaries are stated in 2006 dollars, and include both full- and part-time employment.
The economic sectors with the most significant contribution to the forecast employment change in 2015 exhibit some of the lowest average salaries. For example, the real estate and rental services sector, representing approximately 14.8 percent of the total additional employment forecast for 2015, is expected to experience an average annual salary of approximately $18,500 (in 2006 dollars). The accommodations and food services sector is expected to generate average salaries on the order of $23,400. In contrast, the highest average salary sector, utilities, which is only projected to contribute 2.5 percent of the additional employment, is forecast to experience an average annual salary on the order of $86,800. The manufacturing sector, with 2.2 percent of the incremental employment, is expected to generate average salaries on the order of $27,000; and the government sector is projected to account for nearly 23 percent of the additional employment and average nearly $51,500 in annual salary. Overall, salary forecasts indicate that additional employment linked to the Proposed Action may not earn annual incomes sufficient to support acquisition of market-rate housing in and around the Town of Mammoth Lakes. Average salaries, measured in 2006 dollars, represent an annual average of full- and part-time employment.
Other financial impacts include taxes associated with increased employment and related income. Total taxes generated by the difference in employment by 2015 are estimated to be on the order of $14.8 million (Table 17). Of this total, approximately $5.9 million are indirect business taxes, $1.8 million are generated as the result of household expenditures, $4.3 million from employee compensation, $2.37 million as the result of corporations, and $321,600 from proprietary income.
This analysis demonstrates that regional economic impacts associated with the Proposed Action at MMH do not begin to manifest themselves until after operational activity begins in 2008, with usage and increased economic effects forecast for 2015. The airport can be a contributor to the future growth and

The SGM Group, Inc. Page 20 11/2/2007
development in the Mono and Inyo counties, helping to increase the overall return on investment projected in the region from both the public and private sectors. The differences between the Proposed Action and No-Action Alternatives, although starting out small, grow as the effects of providing service at the airport are realized. Change in employment is the key variable to measuring the value of Proposed Action.
4.0 Glossary The following are definitions for terms used throughout the impact valuation analysis. These terms refer to the various reports produced as part of the IMPLAN modeling effort in measuring the potential value of economic impacts of the Proposed Action at MMH.50
Total Output
Total Output, or Industry Output, is a single number reported in dollars for each industry included in the analysis. These dollars represent the value of an industry’s total production. In this analysis, output is reported by industry sectors, and broken down as direct, indirect, and induced. Output can be defined either as the total value of purchases by intermediate and final consumers, or by intermediate outlays plus value-added. Output can also be thought of as a value of sales plus or minus inventory.
Employment
Employment is reported as a single number of jobs for each industry. Data can be reported for individual industries or aggregated into categories. In this analysis, employment data is reported as an aggregated output. Employment includes total wage and salary employees as well as self-employed jobs in a defined region. It includes both full-time and part-time workers and is measured in annual average jobs. The IMPLAN database for the two counties included in the model (Mono and Inyo Counties) draws on three primary data sets: The ES202 data (Unemployment Insurance Covered Employment and Wages Program from the Bureau of Labor Statistics, U.S. Department of Labor), the Regional Economic Information System from the Bureau of Economic Analysis of the Department of Commerce (R.E.I.S.), and County Business Patterns from the U.S. Department of Census.
Value Added
There are four subcomponents of value-added:
• Employee Compensation, • Proprietary Income, • Other Property Type Income, and • Indirect Business Taxes.
Employee compensation describes the total payroll costs of each industry used in the analysis. It includes wages and salaries of workers who are paid by employers, as well as benefits such as health and life insurance, retirement payments, and non-cash compensation. Employee compensation is derived for each reported industry from ES202 and REIS data.
Proprietary income consists of payments received as income by self-employed individuals. Any income received for payment of self-employed work, as reported on Federal tax forms, is counted in this category. Totals include income received by private business owners, doctors, lawyers, and other similar business activities.
Labor income is the combination of employee compensation and proprietary income.

The SGM Group, Inc. Page 21 11/2/2007
Other property type income consists of payments for rents, royalties, and dividends. Payments to individuals in the form of rents received on property, royalties from contracts, and dividends paid by corporations are included in this category as well as corporate profits earned by corporations.
Indirect business taxes consist of excise taxes, property taxes, fees, licenses, and sales taxes paid by businesses. These taxes occur during the normal operation of businesses but do not include taxes on profit or income. Baseline indirect business taxes for the affected jurisdictions are derived from U.S. Bureau of Economic Analysis Gross State Product data.
Total Taxes
As shown in the Tax Impact table included in the analysis, total taxes include estimates of all taxes paid by households and businesses at the Federal, State, and Local levels. These taxes include corporate taxes, taxes based on proprietary income, personal taxes based on household income, and indirect business taxes generated in the course of doing business as defined above. Total taxes are initially reported in the year determined by the initial IMPLAN model data inputs—in this case that year was 2003. The only IMPLAN category that can be measured in terms of individual external reporting years is the Indirect Business Taxes category. As a result, analysis of this category is first reported in both 2003 dollars and 2006 dollars to determine an estimated inflation ratio. That estimated ratio is then applied to the total tax output as an approximation of the total tax impact in 2006 dollars, comparable with other output tables for the analysis. Individual categories within the tax analysis are not subject to the same average inflation ratios, but the application of the ratio measured for the Indirect Business Tax category represents a reasonable estimate of expected escalation.

The SGM Group, Inc. Page 22 11/2/2007
Table and Figures

The SGM Group, Inc. Page 23 11/2/2007
TABLE 1: FORECAST ENPLANEMENTS—PROPOSED ACTION
Source: URS

The SGM Group, Inc. Page 24 11/2/2007
TABLE 2: TWO-COUNTY STUDY AREA 2000-2005
Subarea 2000 2005 Distribution as of 2005
Net-Change 2000-2005
Growth Distribution
Employment Mammoth Lakes 5,051 5,576 26.02% 525 25.72%Balance of Mono County 4,151 4,578 21.36% 427 20.92%City of Bishop 2,113 2,327 10.86% 214 10.63%Balance of Inyo County 8,078 8,953 41.77% 875 42.87%
Two-County Study Area 19,393 21,433 100.00% 2,041 100.00% Population Mammoth Lakes 7,093 7,602 23.67% 509 38.59%Balance of Mono County 5,760 5,935 18.48% 175 13.27%City of Bishop 3,575 3,641 11.34% 66 5.00%Balance of Inyo County 14,370 14,939 46.51% 569 43.14%
Two-County Study Area 30,798 32,117 100.00% 1,319 100.00% Total Units Mammoth Lakes 7,960 8,962 40.05% 1,002 63.54%Balance of Mono County 3,797 4,248 18.98% 451 28.60%City of Bishop 1,867 1,875 8.38% 8 0.51%Balance of Inyo County 7,175 7,291 32.58% 116 7.36%
Two-County Study Area 20,799 22,376 100.00% 1,577 100.00% Occupied Units Mammoth Lakes 2,814 3,168 23.38% 354 49.72%Balance of Mono County 2,323 2,576 19.01% 253 35.53%City of Bishop 1,684 1,692 12.49% 8 1.12%Balance of Inyo County 6,019 6,116 45.13% 97 13.62%
Two-County Study Area 12,840 13,552 100.00% 712 100.00%
Sources: The SGM Group, Inc.; Hayes Planning Associates, Inc.; State of California, Department of Finance, E-4 Population Estimates for Cities, Counties and the State 2001-2006 with 2000 Benchmark, Sacramento, California, May 2006; US Bureau of Economic Analysis, May 2006: http://www.bea.gov/bea/regional/statelocal.htm; and California Labor Market Information Service, May 2006: http://www.labormarketinfo.edd.ca.gov/ and California MapStats from Fed Stats, US Census 2000, http://www.fedstats.gov/qf/states/06000.html .
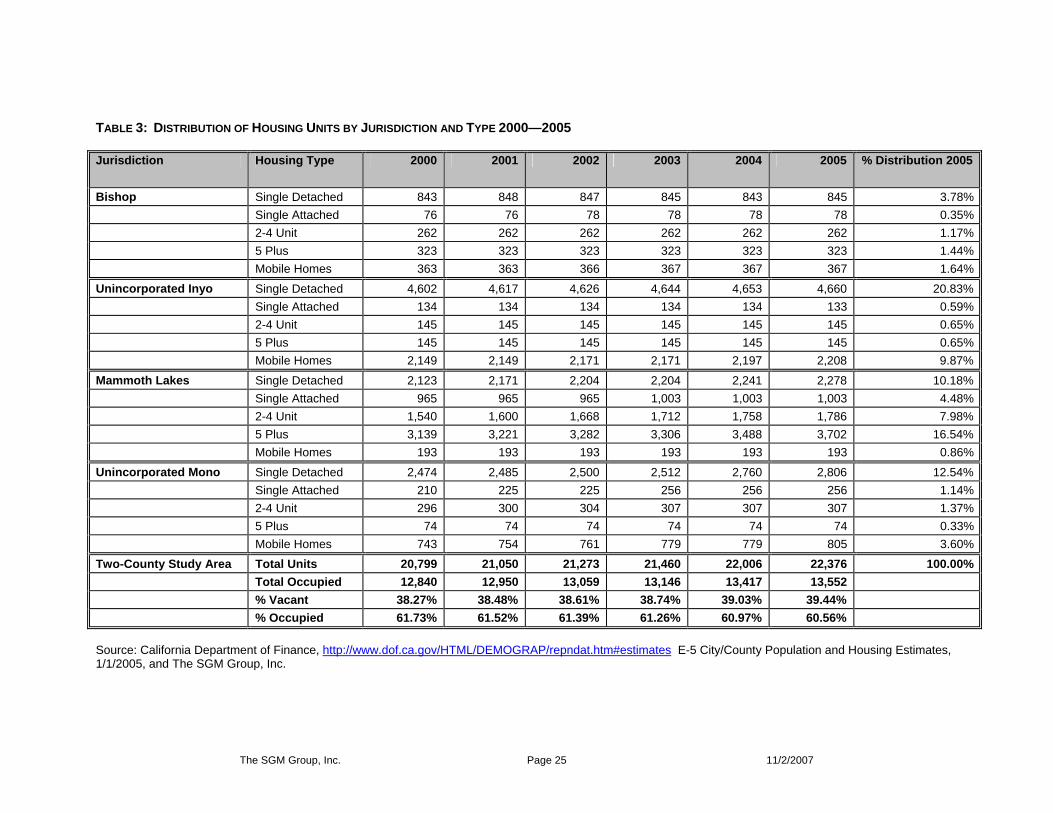
The SGM Group, Inc. Page 25 11/2/2007
TABLE 3: DISTRIBUTION OF HOUSING UNITS BY JURISDICTION AND TYPE 2000—2005 Jurisdiction Housing Type 2000 2001 2002 2003 2004 2005 % Distribution 2005
Bishop Single Detached 843 848 847 845 843 845 3.78% Single Attached 76 76 78 78 78 78 0.35% 2-4 Unit 262 262 262 262 262 262 1.17% 5 Plus 323 323 323 323 323 323 1.44% Mobile Homes 363 363 366 367 367 367 1.64%Unincorporated Inyo Single Detached 4,602 4,617 4,626 4,644 4,653 4,660 20.83% Single Attached 134 134 134 134 134 133 0.59% 2-4 Unit 145 145 145 145 145 145 0.65% 5 Plus 145 145 145 145 145 145 0.65% Mobile Homes 2,149 2,149 2,171 2,171 2,197 2,208 9.87%Mammoth Lakes Single Detached 2,123 2,171 2,204 2,204 2,241 2,278 10.18% Single Attached 965 965 965 1,003 1,003 1,003 4.48% 2-4 Unit 1,540 1,600 1,668 1,712 1,758 1,786 7.98% 5 Plus 3,139 3,221 3,282 3,306 3,488 3,702 16.54% Mobile Homes 193 193 193 193 193 193 0.86%Unincorporated Mono Single Detached 2,474 2,485 2,500 2,512 2,760 2,806 12.54% Single Attached 210 225 225 256 256 256 1.14% 2-4 Unit 296 300 304 307 307 307 1.37% 5 Plus 74 74 74 74 74 74 0.33% Mobile Homes 743 754 761 779 779 805 3.60%Two-County Study Area Total Units 20,799 21,050 21,273 21,460 22,006 22,376 100.00% Total Occupied 12,840 12,950 13,059 13,146 13,417 13,552 % Vacant 38.27% 38.48% 38.61% 38.74% 39.03% 39.44% % Occupied 61.73% 61.52% 61.39% 61.26% 60.97% 60.56% Source: California Department of Finance, http://www.dof.ca.gov/HTML/DEMOGRAP/repndat.htm#estimates E-5 City/County Population and Housing Estimates, 1/1/2005, and The SGM Group, Inc.

The SGM Group, Inc. Page 26 11/2/2007
TABLE 4: CHANGE IN DEVELOPMENT SINCE 2004
Jurisdiction Land Use Type 2005
(added since previous study)
Mammoth Lakes Single Family 54
Multi family 431
Hotel/Motel
Commercial sq. feet 13,193
Mono County Units
Commercial sq. feet 19,484
Inyo County Units
Commercial sq. feet 35,755
Two-County Study Area Units 485
Commercial sq. feet 68,432
Source: Town of Mammoth Lakes, Summer 2006; and The SGM Group, Inc., Technical Memorandum May 2005 Table 3.

The SGM Group, Inc. Page 27 11/2/2007
TABLE 5: ESTIMATED CHANGE IN EXISTING COMMERCIAL DEVELOPMENT 2004-2005
Jurisdiction Existing Commercial Development 2004
Estimated Commercial Development
2005
Difference*
Mammoth Lakes 1,183,000 1,196,193 13,193Unincorporated Mono County 1,747,100 1,766,584 19,484Bishop 641,200 648,351 7,151Unincorporated Inyo County 2,564,800 2,593,404 28,604
Total: 6,136,100 6,204,532 68,432
Source: The SGM Group, Inc.
*Note: The estimate of change in commercial development from 2004 to 2005 is based on change in employment linked to average square feet per employment.

The SGM Group, Inc. Page 28 11/2/2007
TABLE 6: HISTORIC SKIER VISITS MAMMOTH AND JUNE MOUNTAINS 1980-2006
Season/Year Mammoth June Total 1980-81 983,979 1981-82 1,359,376 1982-83 1,259,160 1983-84 1,280,798 1984-85 1,230,750 1985-86 1,428,958 1986-87 697,457 85,476 782,9331987-88 1,143,133 81,146 1,224,2791988-89 1,065,313 93,986 1,159,2991989-90 1,011,915 68,213 1,080,1281990-91 484,350 26,036 510,3861991-92 918,114 60,212 978,3261992-93 935,928 59,831 995,7591993-94 731,850 38,829 770,6791994-95 976,391 84,626 1,061,0171995-96 813,153 66,669 879,8221996-97 800,982 64,646 865,6281997-98 901,729 66,109 967,8381998-99 908,618 51,120 959,7381999-2000 895,293 33,766 929,0592000-2001 1,122,082 34,033 1,156,1152001-2002 1,154,441 59,751 1,214,1922002-2003 1,284,110 81,691 1,365,8012003-2004 1,310,107 89,536 1,399,6432004-2005 1,428,138 86,066 1,514,2042005-2006 1,441,618 95,023 1,536,641
Source: Mammoth Mountain, May 2006
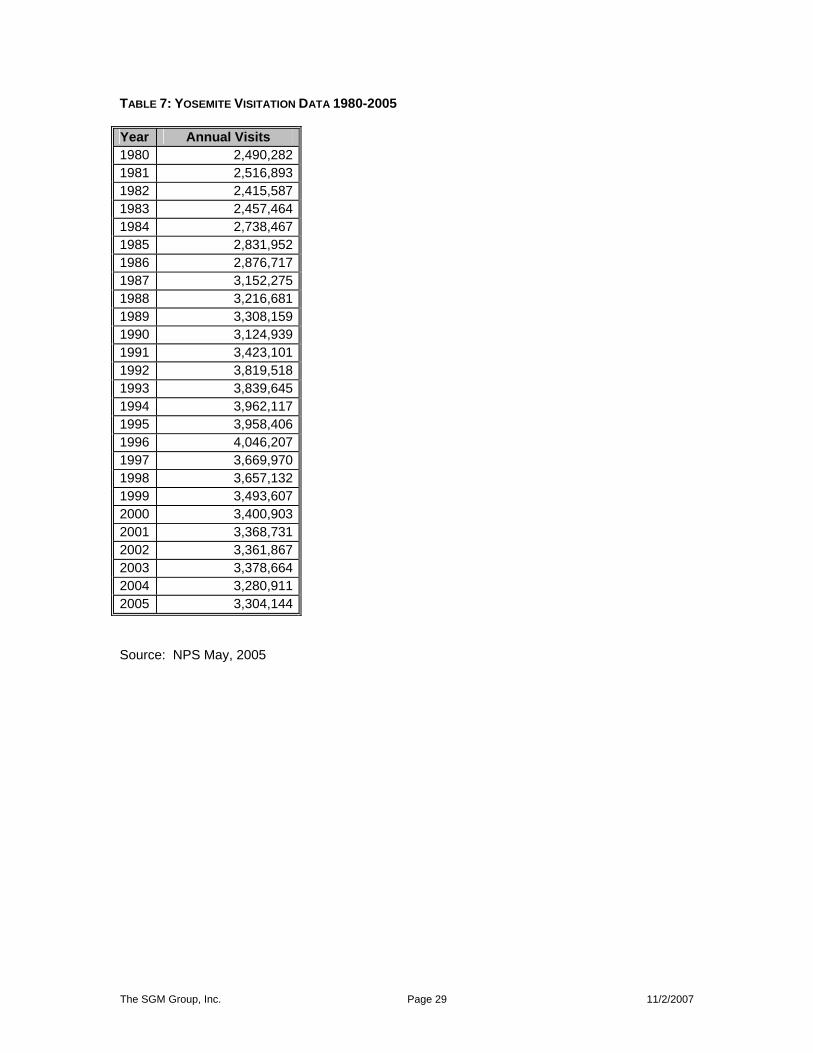
The SGM Group, Inc. Page 29 11/2/2007
TABLE 7: YOSEMITE VISITATION DATA 1980-2005 Year Annual Visits 1980 2,490,282 1981 2,516,893 1982 2,415,587 1983 2,457,464 1984 2,738,467 1985 2,831,952 1986 2,876,717 1987 3,152,275 1988 3,216,681 1989 3,308,159 1990 3,124,939 1991 3,423,101 1992 3,819,518 1993 3,839,645 1994 3,962,117 1995 3,958,406 1996 4,046,207 1997 3,669,970 1998 3,657,132 1999 3,493,607 2000 3,400,903 2001 3,368,731 2002 3,361,867 2003 3,378,664 2004 3,280,911 2005 3,304,144
Source: NPS May, 2005
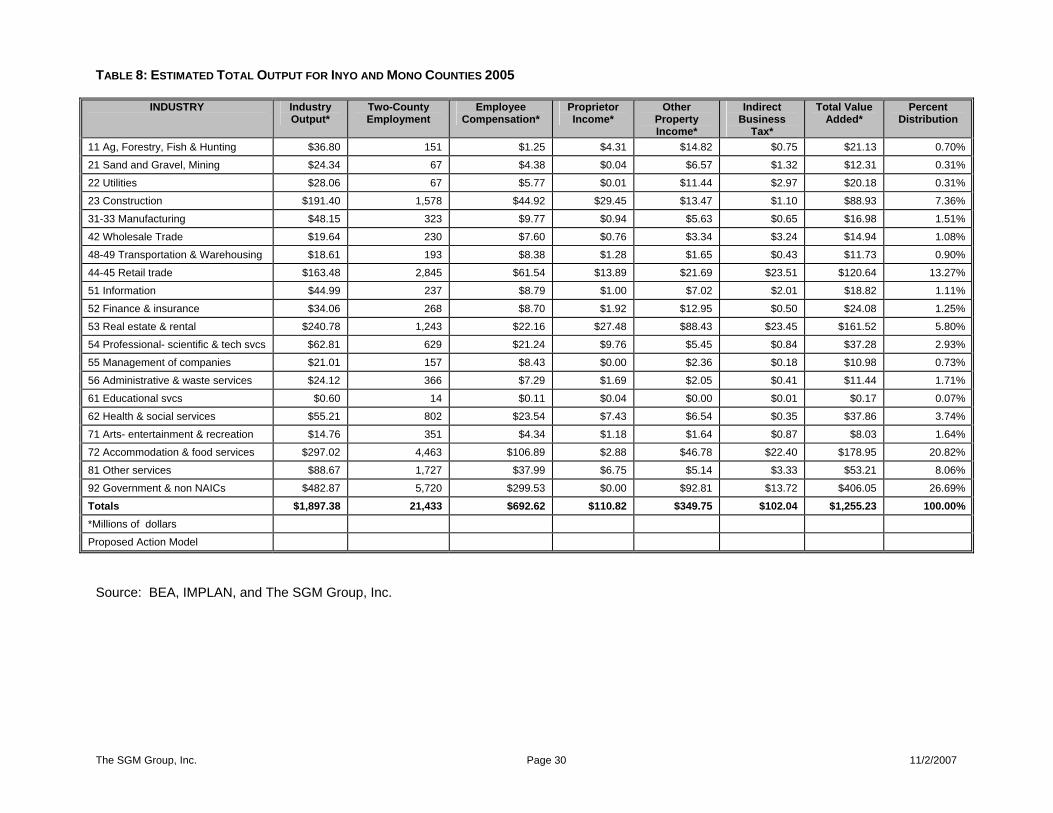
The SGM Group, Inc. Page 30 11/2/2007
TABLE 8: ESTIMATED TOTAL OUTPUT FOR INYO AND MONO COUNTIES 2005
INDUSTRY Industry Output*
Two-County Employment
Employee Compensation*
Proprietor Income*
Other Property Income*
Indirect Business
Tax*
Total Value Added*
Percent Distribution
11 Ag, Forestry, Fish & Hunting $36.80 151 $1.25 $4.31 $14.82 $0.75 $21.13 0.70%
21 Sand and Gravel, Mining $24.34 67 $4.38 $0.04 $6.57 $1.32 $12.31 0.31%
22 Utilities $28.06 67 $5.77 $0.01 $11.44 $2.97 $20.18 0.31%
23 Construction $191.40 1,578 $44.92 $29.45 $13.47 $1.10 $88.93 7.36%
31-33 Manufacturing $48.15 323 $9.77 $0.94 $5.63 $0.65 $16.98 1.51%
42 Wholesale Trade $19.64 230 $7.60 $0.76 $3.34 $3.24 $14.94 1.08%
48-49 Transportation & Warehousing $18.61 193 $8.38 $1.28 $1.65 $0.43 $11.73 0.90%
44-45 Retail trade $163.48 2,845 $61.54 $13.89 $21.69 $23.51 $120.64 13.27%
51 Information $44.99 237 $8.79 $1.00 $7.02 $2.01 $18.82 1.11%
52 Finance & insurance $34.06 268 $8.70 $1.92 $12.95 $0.50 $24.08 1.25%
53 Real estate & rental $240.78 1,243 $22.16 $27.48 $88.43 $23.45 $161.52 5.80%
54 Professional- scientific & tech svcs $62.81 629 $21.24 $9.76 $5.45 $0.84 $37.28 2.93%
55 Management of companies $21.01 157 $8.43 $0.00 $2.36 $0.18 $10.98 0.73%
56 Administrative & waste services $24.12 366 $7.29 $1.69 $2.05 $0.41 $11.44 1.71%
61 Educational svcs $0.60 14 $0.11 $0.04 $0.00 $0.01 $0.17 0.07%
62 Health & social services $55.21 802 $23.54 $7.43 $6.54 $0.35 $37.86 3.74%
71 Arts- entertainment & recreation $14.76 351 $4.34 $1.18 $1.64 $0.87 $8.03 1.64%
72 Accommodation & food services $297.02 4,463 $106.89 $2.88 $46.78 $22.40 $178.95 20.82%
81 Other services $88.67 1,727 $37.99 $6.75 $5.14 $3.33 $53.21 8.06%
92 Government & non NAICs $482.87 5,720 $299.53 $0.00 $92.81 $13.72 $406.05 26.69%
Totals $1,897.38 21,433 $692.62 $110.82 $349.75 $102.04 $1,255.23 100.00%*Millions of dollars
Proposed Action Model
Source: BEA, IMPLAN, and The SGM Group, Inc.
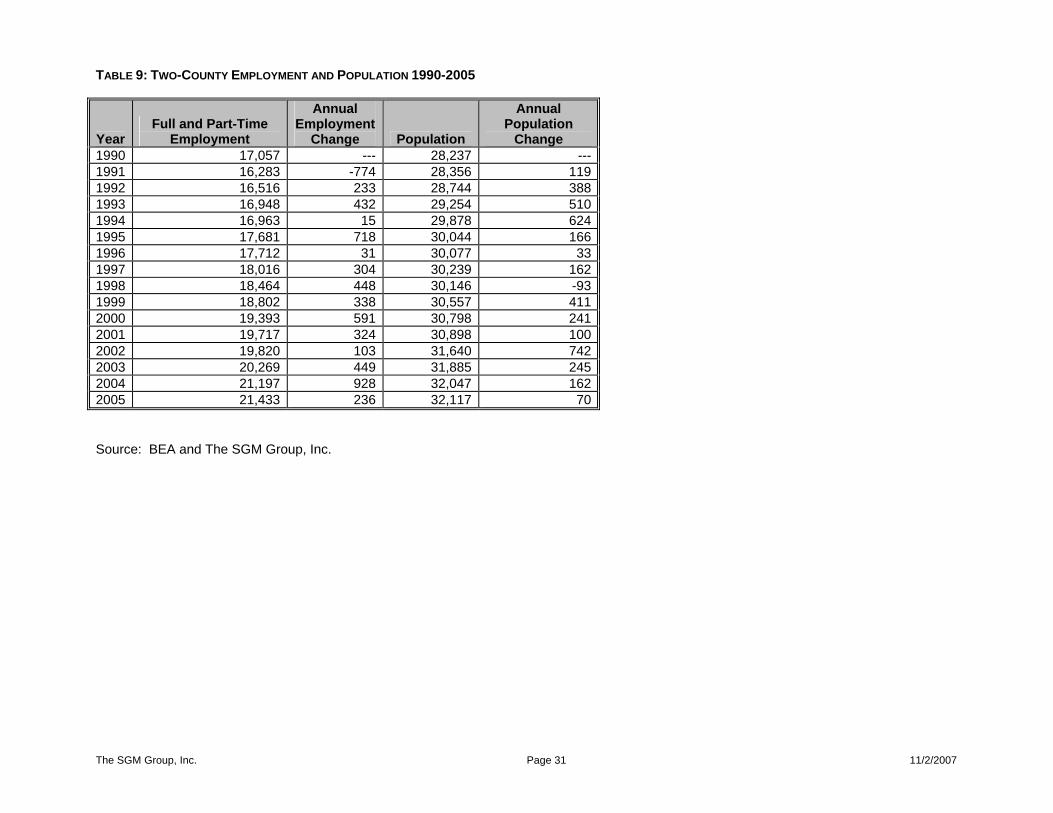
The SGM Group, Inc. Page 31 11/2/2007
TABLE 9: TWO-COUNTY EMPLOYMENT AND POPULATION 1990-2005
Year Full and Part-Time
Employment
Annual Employment
Change Population
Annual Population
Change 1990 17,057 --- 28,237 ---1991 16,283 -774 28,356 1191992 16,516 233 28,744 3881993 16,948 432 29,254 5101994 16,963 15 29,878 6241995 17,681 718 30,044 1661996 17,712 31 30,077 331997 18,016 304 30,239 1621998 18,464 448 30,146 -931999 18,802 338 30,557 4112000 19,393 591 30,798 2412001 19,717 324 30,898 1002002 19,820 103 31,640 7422003 20,269 449 31,885 2452004 21,197 928 32,047 1622005 21,433 236 32,117 70
Source: BEA and The SGM Group, Inc.

The SGM Group, Inc. Page 32 11/2/2007
TABLE 10: ALTERNATIVE EMPLOYMENT FORECAST MODELS—SUMMARY OUTPUT
Zero Constant Models--Statistical Coefficients
Alternative 1 Alternative 2 Alternative 3 Alternative 4 Alternative 5 Alternative 6
Enplanement Regression Factors
Eagle County 0.040415137 0.040415137 0.040415137 0.040415137 0.040415137 0.040415137Aspen/Pitkin 0.002428992 0.002428992 0.002428992 0.002428992 0.002428992 0.002428992Telluride 0.010949552 0.010949552 0.010949552 0.010949552 0.010949552 0.010949552Jackson Hole 0.013834 0.013834 0.013834 0.013834 0.013834 0.013834 Overall Average: 0.01690692 0.01690692 0.01690692 0.01690692 0.01690692 0.01690692 Average: Eagle/Aspen/Telluride 0.017931227 0.017931227 0.017931227 0.017931227 0.017931227 0.017931227Average: Eagle/Aspen 0.021422065 0.021422065 0.021422065 0.021422065 0.021422065 0.021422065 Composite Model 0.016471579 0.017774161 0.023440756 0.02456452 0.026099537 0.017235135 Overall average 0.01668925 0.01734054 0.020173838 0.02073572 0.021503228 0.017071027 Employment-Composite 2,752 2,970 3,917 4,105 4,361 1,158 Preferred Model: 0.017235135Source: The SGM Group, Inc.
Note: As in the previous study, this table illustrates outputs of several tested regression models measuring enplanement component coefficients. Glacier Park was not included, since it was determined that the characteristic data available were not comparable to the situation at Mammoth Lakes. The coefficient chosen for future forecasts for the two-county Mono and Inyo impact model was the composite model coefficient: 0.017235. That model appeared to represent the most consistent logical application of the available annual historic data. This model output used data from case study examples as well as from Mono and Inyo Counties, and used available data from 1993 through 2002 (the latest year for which all categories had data).

The SGM Group, Inc. Page 33 11/2/2007
TABLE 11: COMPOSITE MODEL
Year Full and Part-Time
Employment
Population Taxes Skier Days
Enplanements* Park Visitation** Model Projected
Employment
Difference: Actual -Forecast
1993 98,386 118,773 $60,974,922 8,123,006 564,858 6,751,838 96,495 1,891 1994 105,025 124,373 $74,434,532 8,357,890 581,850 7,008,262 107,166 (2,141)1995 109,762 129,306 $79,389,563 8,480,668 556,998 7,083,691 110,610 (848)1996 113,648 133,047 $85,221,757 8,844,492 620,713 7,058,378 116,578 (2,930)1997 119,916 137,994 $90,006,735 8,939,658 715,849 6,559,483 120,053 (137)1998 124,686 142,276 $99,722,437 8,637,902 769,604 6,777,962 127,120 (2,434)1999 128,288 146,678 $102,580,029 8,318,844 727,756 6,624,988 126,796 1,492 2000 133,153 149,896 $109,507,157 9,198,607 730,905 6,239,136 132,880 273 2001 134,783 153,360 $113,606,607 8,865,102 863,025 6,127,257 136,456 (1,673)2002 135,068 156,564 $112,638,499 9,341,602 846,000 6,335,544 137,669 (2,601)
*Includes Montrose in Telluride numbers
**Includes Yosemite and Yellowstone National Parks
Source: The SGM Group, Inc.; Eagle/Vail; Aspen/Pitkin; Telluride/Montrose; Jackson Hole Airport Manager; NPS; Finance Departments, Colorado and Wyoming; Colorado Ski Country USA; Mammoth Mountain; BEA; Yosemite National Park Manager; and FAA. Note: The primary approach used to estimate the statistical contribution of enplanements to total employment combined comparable data from the case study examples with similar data from Mono and Inyo Counties to derive a composite employment forecast model. This model used four factors that appeared to be statistically significant in generating an estimate of total employment: taxes (particularly those related to visitor activity), skier visits, enplanements, and National Park visitation. Adding population to the mix resulted in illogical signs for regression model coefficients. The resulting application indicates a statistical contribution by enplanements of approximately 8% to 10% to the total full- and part-time employment. Park Visitation in this model includes visitors to Yosemite and Yellowstone National Parks. Skier days include combined totals reported for Eagle-Vail, Aspen, Telluride, and Mammoth Lakes. Population refers to permanent residents (population was compiled as part of the background analysis but not used in the regression model). Total Employment is full- and part-time employment on a county level as reported by BEA. Counties included in this model are those referenced for Eagle-Vail (Eagle, Colorado), Aspen (Pitkin, Colorado), Telluride (San Miguel, Montrose, and Ouray Counties Colorado), Jackson Hole (Teton, Wyoming), and Mono/Inyo Counties. Enplanement data for Telluride also includes Montrose Airport.
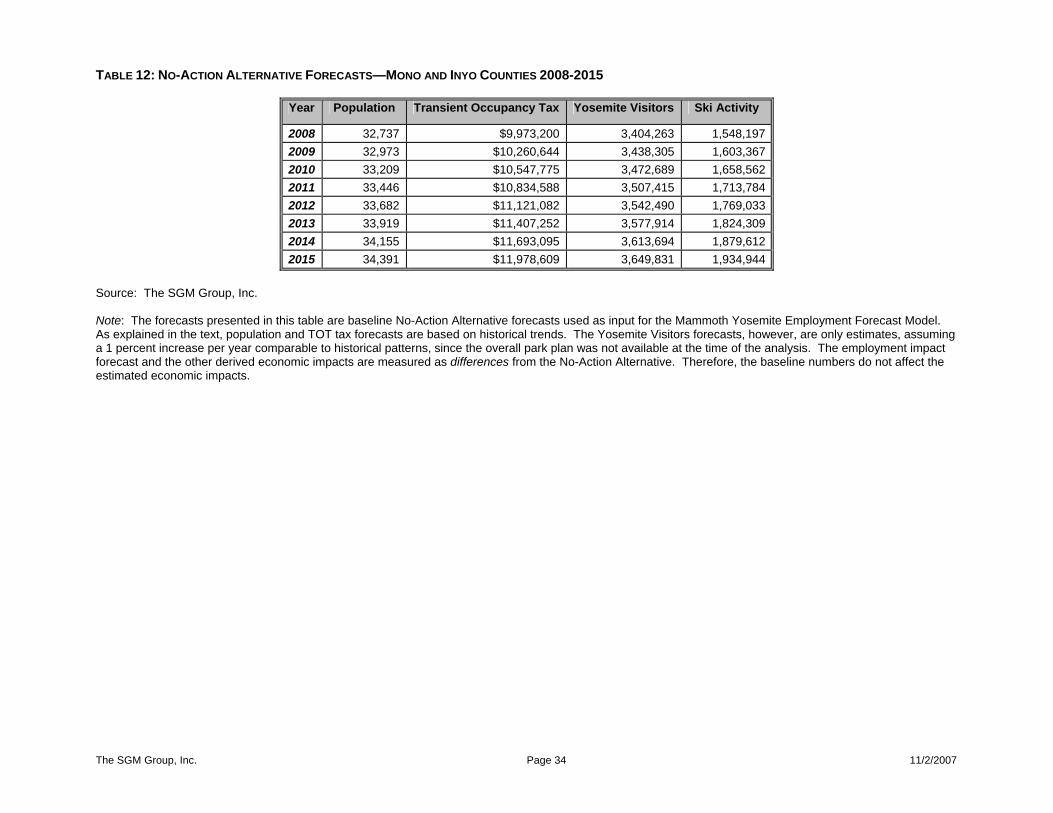
The SGM Group, Inc. Page 34 11/2/2007
TABLE 12: NO-ACTION ALTERNATIVE FORECASTS—MONO AND INYO COUNTIES 2008-2015
Year Population Transient Occupancy Tax Yosemite Visitors Ski Activity
2008 32,737 $9,973,200 3,404,263 1,548,197 2009 32,973 $10,260,644 3,438,305 1,603,367 2010 33,209 $10,547,775 3,472,689 1,658,562 2011 33,446 $10,834,588 3,507,415 1,713,784 2012 33,682 $11,121,082 3,542,490 1,769,033 2013 33,919 $11,407,252 3,577,914 1,824,309 2014 34,155 $11,693,095 3,613,694 1,879,612 2015 34,391 $11,978,609 3,649,831 1,934,944
Source: The SGM Group, Inc. Note: The forecasts presented in this table are baseline No-Action Alternative forecasts used as input for the Mammoth Yosemite Employment Forecast Model. As explained in the text, population and TOT tax forecasts are based on historical trends. The Yosemite Visitors forecasts, however, are only estimates, assuming a 1 percent increase per year comparable to historical patterns, since the overall park plan was not available at the time of the analysis. The employment impact forecast and the other derived economic impacts are measured as differences from the No-Action Alternative. Therefore, the baseline numbers do not affect the estimated economic impacts.
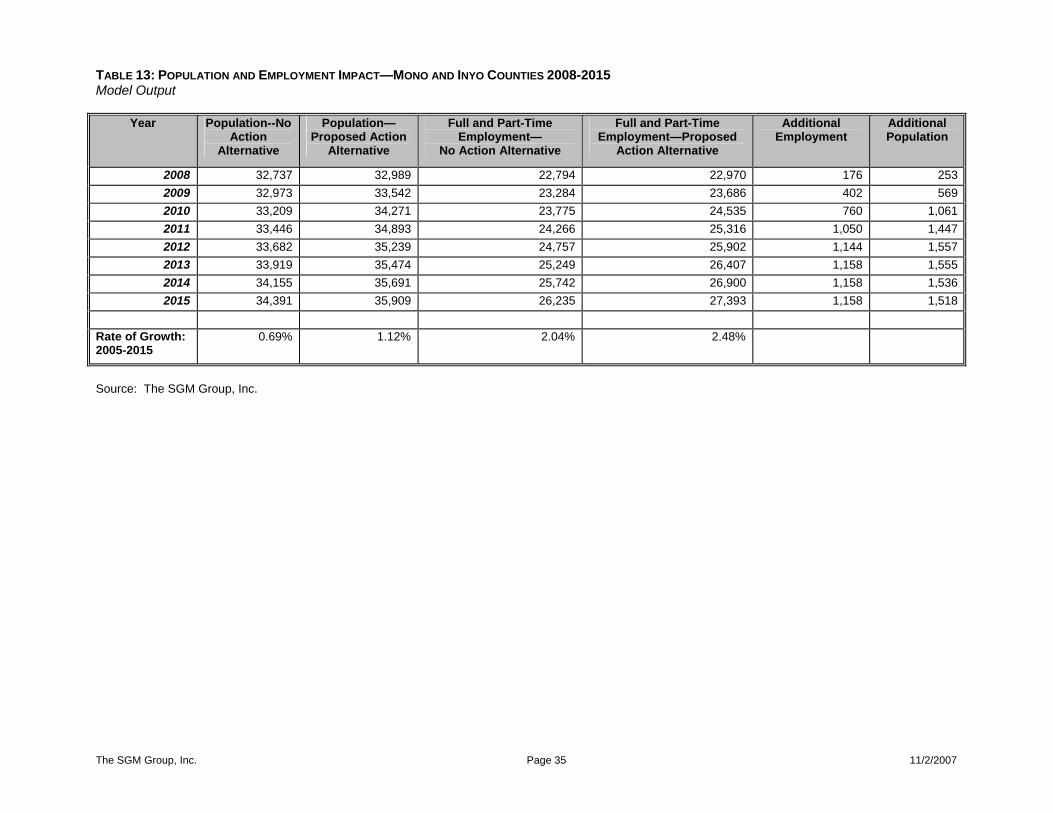
The SGM Group, Inc. Page 35 11/2/2007
TABLE 13: POPULATION AND EMPLOYMENT IMPACT—MONO AND INYO COUNTIES 2008-2015 Model Output
Year Population--No Action
Alternative
Population—Proposed Action
Alternative
Full and Part-Time Employment—
No Action Alternative
Full and Part-Time Employment—Proposed
Action Alternative
Additional Employment
Additional Population
2008 32,737 32,989 22,794 22,970 176 253 2009 32,973 33,542 23,284 23,686 402 569 2010 33,209 34,271 23,775 24,535 760 1,061 2011 33,446 34,893 24,266 25,316 1,050 1,447 2012 33,682 35,239 24,757 25,902 1,144 1,557 2013 33,919 35,474 25,249 26,407 1,158 1,555 2014 34,155 35,691 25,742 26,900 1,158 1,536 2015 34,391 35,909 26,235 27,393 1,158 1,518
Rate of Growth: 2005-2015
0.69% 1.12% 2.04% 2.48%
Source: The SGM Group, Inc.

The SGM Group, Inc. Page 36 11/2/2007
TABLE 14: DEVELOPMENT IMPACT—MONO AND INYO COUNTIES 2008-2015 Model Output
Year Housing Units—
No Action Alternative
Housing Units— Proposed Action
Alternative
Additional Housing Units
Additional Occupied Housing Units
Occupancy Rate Additional Commercial Development (sq. ft.)—
(Mammoth)
Additional Lodging Units
(Mammoth)
2008 22,834 23,012 178 108 60.43% 13,662 12
2009 23,078 23,480 401 242 60.28% 31,159 27
2010 23,322 24,073 751 452 60.13% 58,963 52
2011 23,565 24,592 1,027 616 59.97% 81,494 72
2012 23,809 24,917 1,108 663 59.82% 88,813 78
2013 24,053 25,162 1,109 662 59.67% 89,840 79
2014 24,296 25,394 1,098 654 59.52% 89,840 79
2015 24,540 25,628 1,088 646 59.37% 89,840 79
Rate of Growth: 2005-2015
0.93% 1.37% Located in the Two-County Region
Located in the Two-County Region
Located in the Town of Mammoth
Located in the Town of Mammoth
Source: The SGM Group, Inc.

The SGM Group, Inc. Page 37 11/2/2007
TABLE 15: TOTAL EMPLOYMENT IMPACT BY ECONOMIC SECTOR PROPOSED ACTION 2015 Model Output
Industry Direct* Indirect* Induced* Total* % Distribution
Major Sectors 92 Government & non NAICs (AGG) 169 7 46 222 19.14%44-45 Retail trade (AGG) 132 12 50 194 16.79%72 Accommodation & food services (AGG) 141 7 32 180 15.52%81 Other services (AGG) 65 10 27 102 8.81%53 Real estate & rental (AGG) 57 12 7 76 6.54%23 Construction (AGG) 70 4 1 74 6.42%62 Health & social services (AGG) 36 0 23 59 5.08%54 Professional- scientific & tech services (AGG) 27 16 4 47 4.05%56 Administrative & waste services (AGG) 17 14 3 34 2.92%71 Arts- entertainment & recreation (AGG) 18 3 9 29 2.54%31-33 Manufacturing (AGG) 21 5 2 29 2.48%52 Finance & insurance (AGG) 14 4 5 23 1.97%51 Information (AGG) 12 5 4 20 1.76%42 Wholesale Trade (AGG) 10 3 4 17 1.50%48-49 Transportation & Warehousing (AGG) 10 6 2 17 1.49%55 Management of companies (AGG) 8 5 1 14 1.21%11 Ag, Forestry, Fish & Hunting (AGG)* 8 2 0 10 0.85%22 Utilities (AGG) 3 1 1 6 0.48%21 Mining, Sand and Gravel (AGG) 3 1 0 4 0.35%61 Educational services (AGG) 1 0 0 1 0.10%
Total 822 117 221 1,158 100.0% Source: The SGM Group, Inc., and IMPLAN *Note: In this and all similar tables that follow, AGG indicates that the economic sector is an aggregate of numerous subsectors.

The SGM Group, Inc. Page 38 11/2/2007
TABLE 16: TOTAL VALUE ADDED IMPACT PROPOSED ACTION 2015 Model Output
Industry Direct* Indirect* Induced* Total* % Distribution
92 Government & non NAICs (AGG) $11,766,523 $503,663 $3,174,567 $15,444,753 22.87%53 Real estate & rental (AGG) $7,381,742 $1,698,370 $924,226 $10,004,338 14.81%44-45 Retail trade (AGG) $5,590,205 $522,428 $2,211,664 $8,324,297 12.32%72 Accommodation & food services (AGG) $5,823,576 $227,582 $865,493 $6,916,650 10.24%23 Construction (AGG) $3,842,604 $220,450 $40,508 $4,103,561 6.08%81 Other services (AGG) $2,080,188 $380,774 $776,337 $3,237,299 4.79%62 Health & social services (AGG) $1,730,668 $10,045 $1,136,223 $2,876,936 4.26%54 Professional- scientific & tech services (AGG) $1,605,308 $941,921 $256,192 $2,803,421 4.15%52 Finance & insurance (AGG) $1,214,716 $396,993 $446,758 $2,058,467 3.05%22 Utilities (AGG) $1,019,230 $363,105 $313,130 $1,695,465 2.51%51 Information (AGG) $949,175 $384,804 $320,465 $1,654,445 2.45%31-33 Manufacturing (AGG) $1,157,191 $248,630 $108,278 $1,514,099 2.24%11 Ag, Forestry, Fish & Hunting (AGG) $1,065,545 $110,357 $52,648 $1,228,551 1.82%42 Wholesale Trade (AGG) $666,073 $208,878 $254,317 $1,129,268 1.67%56 Administrative & waste services (AGG) $539,835 $420,548 $86,574 $1,046,957 1.55%48-49 Transportation & Warehousing (AGG) $590,914 $328,255 $107,327 $1,026,496 1.52%55 Management of companies (AGG) $553,275 $387,126 $88,315 $1,028,716 1.52%21 Mining, Sand and Gravel Extraction (AGG) $621,635 $138,309 $31,938 $791,882 1.17%71 Arts- entertainment & recreation (AGG) $405,051 $33,023 $204,052 $642,126 0.95%61 Educational services (AGG) $8,321 $242 $4,946 $13,509 0.02%
Total $48,611,775 $7,525,501 $11,403,958 $67,541,233 100.00%Multiplier 1.41
* 2006 Dollars
Source: The SGM Group, Inc., and IMPLAN

The SGM Group, Inc. Page 39 11/2/2007
TABLE 17: TOTAL TAXES—PROPOSED ACTION MODEL 2015 Model Output
Employee Compensation
Proprietary Income
Household Expenditures
Enterprises (Corporation)
Indirect Business
Taxes
Total
Corporate Profits Tax 1,175,369 1,175,369 Indirect Bus Tax: Custom Duty 149,453 149,453 Indirect Bus Tax: Excise Taxes 476,991 476,991 Indirect Bus Tax: Fed NonTaxes 162,023 162,023 Personal Tax: Income Tax 71,871 71,871 Personal Tax: NonTaxes (Fines- Fees) Social Ins Tax- Employee Contribution 1,966,361 321,658 2,288,019 Social Ins Tax- Employer Contribution 2,032,886 2,032,886
Federal Government
Non- Defense
Total 3,999,247 321,658 71,871 1,175,369 788,467 6,356,611 Corporate Profits Tax 369,789 369,789 Dividends 825,666 825,666 Indirect Bus Tax: Motor Vehicle Lic 39,927 39,927 Indirect Bus Tax: Other Taxes 402,942 402,942 Indirect Bus Tax: Property Tax 1,916,461 1,916,461 Indirect Bus Tax: S/L NonTaxes 232,319 232,319 Indirect Bus Tax: Sales Tax 2,553,933 2,553,933 Indirect Bus Tax: Severance Tax 712 712 Personal Tax: Income Tax 1,112,430 1,112,430 Personal Tax: Motor Vehicle License 44,393 44,393 Personal Tax: NonTaxes (Fines- Fees 566,974 566,974 Personal Tax: Other Tax (Fish/Hunt) 7,077 7,077 Personal Tax: Property Taxes 22,747 22,747 Social Ins Tax- Employee Contribution 81,600 81,600 Social Ins Tax- Employer Contribution 264,702 264,702
State/Local Government
Non- Education
Total 346,302 1,753,620 1,195,456 5,146,294 8,441,672 Total (2006 Dollars) 4,345,548 321,658 1,825,492 2,370,824 5,934,761 14,798,283
Source: IMPLAN and The SGM Group, Inc.

The SGM Group, Inc. Page 40 11/2/2007
TABLE 18: INDIRECT BUSINESS TAXES—PROPOSED ACTION 2015 Model Output
Industry Direct* Indirect* Induced* Total*
44-45 Retail trade (AGG) $1,094,749 $102,341 $432,901 $1,629,991 53 Real estate & rental (AGG) $1,067,199 $279,328 $139,634 $1,486,162 72 Accommodations & food services (AGG) $733,654 $26,648 $93,936 $854,239 92 Government & non NAICs (AGG) $397,467 $17,013 $107,235 $521,716 81 Other services (AGG) $160,571 $38,759 $55,002 $254,332 22 Utilities (AGG) $149,769 $53,356 $46,012 $249,138 42 Wholesale Trade (AGG) $144,225 $45,228 $55,067 $244,521 51 Information (AGG) $101,598 $42,581 $36,085 $180,264 21 Mining, Sand and Gravel (AGG) $66,648 $15,688 $3,608 $85,944 71 Arts- entertainment & recreation (AGG) $43,902 $2,946 $22,797 $69,645 54 Professional- scientific & tech services (AGG) $36,284 $21,290 $5,791 $63,364 23 Construction (AGG) $47,356 $2,717 $499 $50,571 11 Ag, Forestry, Fish & Hunting (AGG) $37,920 $6,521 $2,289 $46,730 52 Finance & insurance (AGG) $25,404 $9,581 $8,029 $43,014 31-33 Manufacturing (AGG) $35,723 $3,604 $2,091 $41,417 56 Administrative & waste services (AGG) $19,483 $14,835 $3,110 $37,428 48-49 Transportation & Warehousing (AGG) $21,517 $7,937 $2,341 $31,794 62 Health & social services (AGG) $16,170 $88 $10,504 $26,762 55 Management of companies (AGG) $9,140 $6,395 $1,459 $16,994 61 Educational Services (AGG) $453 $13 $269 $735
Total $4,209,232 $696,869 $1,028,659 $5,934,761 *2006 Dollars
Source: IMPLAN and The SGM Group, Inc.

The SGM Group, Inc. Page 41 11/2/2007
TABLE 19: TOTAL OUTPUT PROPOSED ACTION 2015 Model Output
Industry Direct* Indirect* Induced* Total* 92 Government & non NAICs (AGG) $13,992,383 $598,940 $3,775,096 $18,366,418 53 Real estate & rental (AGG) $11,008,958 $2,497,460 $1,372,058 $14,878,476 72 Accommodation & food services (AGG) $9,582,200 $411,310 $1,699,112 $11,692,621 44-45 Retail trade (AGG) $7,552,903 $709,777 $3,005,630 $11,268,310 23 Construction (AGG) $8,270,085 $474,454 $87,181 $8,831,720 81 Other services (AGG) $3,574,863 $698,973 $1,297,736 $5,571,572 54 Professional- scientific & tech services (AGG) $2,704,453 $1,586,848 $431,604 $4,722,905 62 Health & social services (AGG) $2,527,614 $14,264 $1,650,520 $4,192,397 31-33 Manufacturing (AGG) $3,126,259 $707,283 $353,899 $4,187,441 51 Information (AGG) $2,268,368 $916,690 $759,767 $3,944,826 52 Finance & insurance (AGG) $1,718,549 $553,563 $631,173 $2,903,286 22 Utilities (AGG) $1,416,897 $504,775 $435,302 $2,356,975 11 Ag, Forestry, Fish & Hunting (AGG) $1,855,280 $288,407 $106,112 $2,249,799 56 Administrative & waste services (AGG) $1,138,137 $886,269 $182,510 $2,206,915 55 Management of companies (AGG) $1,058,903 $740,913 $169,025 $1,968,841 48-49 Transportation & Warehousing (AGG) $937,954 $521,469 $183,002 $1,642,425 21 Mining, Sand and Gravel (AGG) $1,229,002 $280,247 $64,724 $1,573,974 42 Wholesale Trade (AGG) $875,735 $274,627 $334,369 $1,484,731 71 Arts- entertainment & recreation (AGG) $744,350 $60,716 $355,993 $1,161,059 61 Educational services (AGG) $30,144 $877 $17,917 $48,938
Total $75,613,036 $12,727,861 $16,912,731 $105,253,626
Multiplier 1.39 *2006 Dollars
Source: The SGM Group, Inc., and IMPLAN

The SGM Group, Inc. Page 42 11/2/2007
TABLE 20: EMPLOYEE COMPENSATION PROPOSED ACTION 2015 Model Output
Industry Direct* Indirect* Induced* Total* 92 Government & non NAICs (AGG) $8,679,686 $371,532 $2,341,749 $11,392,966 72 Accommodation & food services (AGG) $3,457,803 $144,214 $581,713 $4,183,730 44-45 Retail trade (AGG) $2,827,033 $256,474 $1,085,989 $4,169,496 81 Other services (AGG) $1,360,916 $218,290 $504,878 $2,084,084 23 Construction (AGG) $1,940,802 $111,344 $20,459 $2,072,605 62 Health & social services (AGG) $1,081,754 $5,657 $696,391 $1,783,803 54 Professional- scientific & tech services (AGG) $914,502 $536,588 $145,946 $1,597,035 53 Real estate & rental (AGG) $1,009,015 $262,884 $131,805 $1,403,704 55 Management of companies (AGG) $425,220 $297,526 $67,875 $790,620 31-33 Manufacturing (AGG) $569,299 $148,658 $58,452 $776,409 51 Information (AGG) $443,380 $176,624 $145,634 $765,638 48-49 Transportation & Warehousing (AGG) $422,132 $246,643 $80,993 $749,767 52 Finance & insurance (AGG) $439,011 $149,805 $157,539 $746,356 56 Administrative & waste services (AGG) $343,822 $268,172 $55,153 $667,147 42 Wholesale Trade (AGG) $338,689 $106,211 $129,317 $574,217 22 Utilities (AGG) $291,605 $103,885 $89,587 $485,078 71 Arts- entertainment & recreation (AGG) $218,942 $11,452 $111,779 $342,174 21 Mining, Sand and Gravel (AGG) $221,047 $46,153 $10,816 $278,016 11 Ag, Forestry, Fish & Hunting (AGG) $63,348 $10,647 $3,139 $77,135 61 Educational services (AGG) $5,429 $158 $3,227 $8,813
Total $25,053,434 $3,472,917 $6,422,441 $34,948,791 *2006 Dollars
Source: The SGM Group, Inc., and IMPLAN

The SGM Group, Inc. Page 43 11/2/2007
TABLE 21: AVERAGE EMPLOYEE SALARIES PROPOSED ACTION MODEL 2015 Model Output
Industry Direct* Indirect* Induced* Total* 22 Utilities (AGG) $86,842 $86,842 $86,842 $86,842 21 Mining, Sand and Gravel (AGG) $68,389 $67,394 $72,356 $68,367 55 Management of companies (AGG) $56,510 $56,510 $56,510 $56,510 92 Government & non NAICs (AGG) $51,414 $51,414 $51,414 $51,414 48-49 Transportation & Warehousing (AGG) $43,045 $44,761 $42,705 $43,557 51 Information (AGG) $37,107 $38,138 $38,602 $37,618 54 Professional- scientific & tech services (AGG) $34,031 $34,031 $34,031 $34,031 42 Wholesale Trade (AGG) $33,010 $33,010 $33,010 $33,010 52 Finance & insurance (AGG) $32,517 $35,329 $31,000 $32,702 62 Health & social services (AGG) $29,987 $35,944 $30,846 $30,333 23 Construction (AGG) $27,901 $27,901 $27,901 $27,901 31-33 Manufacturing (AGG) $26,606 $30,098 $24,692 $27,049 72 Accommodation & food services (AGG) $24,560 $20,679 $18,229 $23,285 44-45 Retail trade (AGG) $21,392 $21,529 $21,571 $21,447 81 Other services (AGG) $20,929 $21,953 $18,700 $20,439 56 Administrative & waste services (AGG) $19,806 $19,637 $19,771 $19,735 53 Real estate & rental (AGG) $17,784 $21,817 $19,034 $18,540 71 Arts- entertainment & recreation (AGG) $12,098 $4,367 $12,884 $11,640 11 Ag, Forestry, Fish & Hunting (AGG) $8,076 $6,967 $6,770 $7,842 61 Educational Services (AGG) $7,499 $7,499 $7,499 $7,499
Total $30,512 $30,060 $29,048 $30,188 *2006 Dollars
Source: The SGM Group, Inc., and IMPLAN

The SGM Group, Inc. Page 44 11/2/2007
Note: The tables labeled “Model Output” illustrate the impact model output and represent the potential economic impact of proposed Mammoth Yosemite operation specifications amendment alternative. These impact forecasts use the composite regression model illustrated in Figure 2. As shown, in 2015 the Proposed Action is expected to generate approximately 1,158 additional full- and part-time employees in Mono and Inyo Counties when compared to the No-Action Alternative. This total increase is based on the forecasted composite regression model enplanement contribution of 1.724%. Overall, this additional employment in 2015 (the study target year) represents a 4.4% employment increase over the No-Action Alternative. Based on the measured labor-force participation rates for the two counties, the additional resident population in 2015 attributed to the Proposed Action is expected to reach 1,518.
As a result of the estimated population increase, 1,088 additional housing units in Mono and Inyo Counties are expected in 2015, with 646 occupied. The applied average occupancy rate of 59% reflects the importance of the 2nd home market in the Mammoth Lakes area and is based on a forecast of historic occupancy rates.
Using past development activity ratios for the Town of Mammoth Lakes, additional commercial/industrial/retail space in the Town should reach approximately 89,840 square feet by 2015, with an addition of 79 lodging units. The estimate of additional lodging units is based on ratios characteristic of past history. Proposed additions to the market that represent a change in market character, including the new condominium hotels proposed by the private sector, are not represented in these forecasts; however, since the forecasts are derived as a “difference” between the “with” and “without” alternatives, estimates of resulting benefits are consistent with past development history. The increase in commercial/industrial/retail space and lodging units is estimated only for the Town of Mammoth Lakes because comprehensive data on total existing lodging units and commercial space for the two counties is not available.
The forecasted change in employment as a function of the Proposed Action for MMH provides the basis for derivation of the two-county input-output model. Using that input-output model, change in employment translates into estimated change in value-added, change in total output, and change in taxes for the Two-County Study Area.

The SGM Group, Inc. Page 45 11/2/2007
TABLE 22: SUMMARY—GEOGRAPHIC DISTRIBUTION OF SOCIOECONOMIC IMPACTS 2008 AND 2015
2008 2015 Proposed Action No-Action Proposed Action Subarea 2005 No-Action
Incremental Change
Total 2008-2015 Total Incremental Change
Total
Employment Mammoth Lakes 5,576 5,930 50 5,981 1,022 6,952 332 7,284Balance of Mono County 4,578 4,868 33 4,901 608 5,476 217 5,693City of Bishop 2,327 2,475 19 2,493 357 2,832 122 2,954Balance of Inyo County 8,953 9,521 74 9,595 1,453 10,974 487 11,462
Total 21,433 22,794 176 22,970 3,441 26,235 1,158 27,393Population Mammoth Lakes 7,602 7,867 108 7,974 705 8,572 648 9,220Balance of Mono County 5,935 6,026 37 6,063 243 6,269 223 6,492City of Bishop 3,641 3,675 14 3,689 92 3,767 84 3,851Balance of Inyo County 14,939 15,169 94 15,263 614 15,783 564 16,347
Total 32,117 32,737 252 32,989 1,654 34,391 1,518 35,909Total Housing Mammoth Lakes 8,962 9,253 113 9,366 1,084 10,337 691 11,028Balance of Mono County 4,248 4,379 51 4,430 478 4,857 301 5,158City of Bishop 1,875 1,877 1 1,878 10 1,887 7 1,894Balance of Inyo County 7,291 7,325 13 7,338 134 7,459 89 7,548
Total 22,376 22,834 178 23,012 1,706 24,540 1,088 25,628Occupied Housing Mammoth Lakes 3,168 3,306 54 3,360 343 3,649 321 3,970Balance of Mono County 2,576 2,675 38 2,713 255 2,930 239 3,169City of Bishop 1,692 1,695 1 1,696 7 1,702 6 1,708Balance of Inyo County 6,116 6,154 15 6,168 85 6,239 80 6,319
Total 13,552 13,829 108 13,937 691 14,520 646 15,166
Commercial Development
Mammoth Lakes 1,196,193 1,272,147 13,662 1,285,808 356,642 1,628,789 89,840 1,718,629Balance of Mono County 1,766,584 1,878,755 8,922 1,887,677 112,295 1,991,050 58,671 2,049,721City of Bishop 648,351 689,519 5,725 695,243 128,680 818,199 37,645 855,844Balance of Inyo County 2,593,404 2,758,074 22,898 2,780,972 402,435 3,160,509 150,580 3,311,089
Total 6,204,532 6,598,494 51,206 6,649,701 1,000,053 7,598,548 336,736 7,935,284
Source: The SGM Group, Inc., and Hayes Planning Associates, Inc. Note: Numbers may not add as a result of rounding
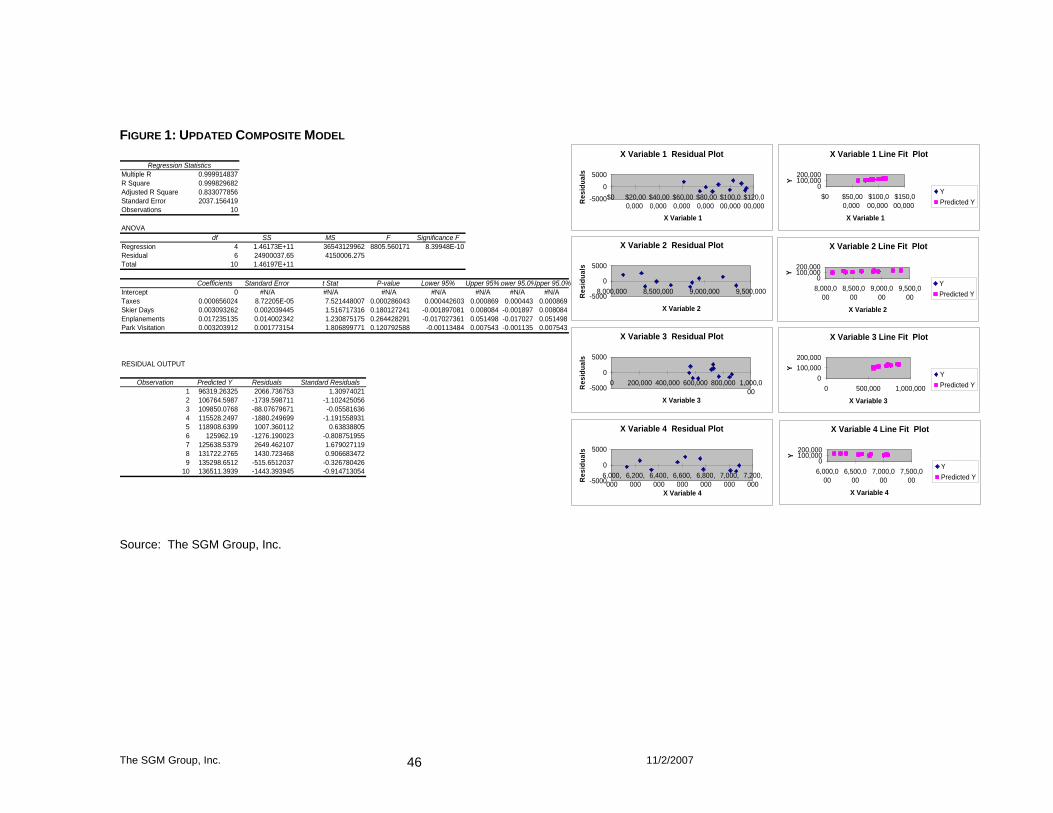
The SGM Group, Inc. 11/2/2007 46
FIGURE 1: UPDATED COMPOSITE MODEL
Regression StatisticsMultiple R 0.999914837R Square 0.999829682Adjusted R Square 0.833077856Standard Error 2037.156419Observations 10
ANOVAdf SS MS F Significance F
Regression 4 1.46173E+11 36543129962 8805.560171 8.39948E-10Residual 6 24900037.65 4150006.275Total 10 1.46197E+11
Coefficients Standard Error t Stat P-value Lower 95% Upper 95%Lower 95.0%Upper 95.0%Intercept 0 #N/A #N/A #N/A #N/A #N/A #N/A #N/ATaxes 0.000656024 8.72205E-05 7.521448007 0.000286043 0.000442603 0.000869 0.000443 0.000869Skier Days 0.003093262 0.002039445 1.516717316 0.180127241 -0.001897081 0.008084 -0.001897 0.008084Enplanements 0.017235135 0.014002342 1.230875175 0.264428291 -0.017027361 0.051498 -0.017027 0.051498Park Visitation 0.003203912 0.001773154 1.806899771 0.120792588 -0.00113484 0.007543 -0.001135 0.007543
RESIDUAL OUTPUT
Observation Predicted Y Residuals Standard Residuals1 96319.26325 2066.736753 1.309740212 106764.5987 -1739.598711 -1.1024250563 109850.0768 -88.07679671 -0.055816364 115528.2497 -1880.249699 -1.1915589315 118908.6399 1007.360112 0.638388056 125962.19 -1276.190023 -0.8087519557 125638.5379 2649.462107 1.6790271198 131722.2765 1430.723468 0.9066834729 135298.6512 -515.6512037 -0.326780426
10 136511.3939 -1443.393945 -0.914713054
X Variable 1 Residual Plot
-5000
0
5000
$0 $20,000,000
$40,000,000
$60,000,000
$80,000,000
$100,000,000
$120,000,000
X Variable 1
Res
idua
ls
X Variable 2 Residual Plot
-5000
0
5000
8,000,000 8,500,000 9,000,000 9,500,000
X Variable 2
Res
idua
ls
X Variable 3 Residual Plot
-5000
0
5000
0 200,000 400,000 600,000 800,000 1,000,000
X Variable 3
Res
idua
ls
X Variable 4 Residual Plot
-5000
0
5000
6,000,000
6,200,000
6,400,000
6,600,000
6,800,000
7,000,000
7,200,000
X Variable 4
Res
idua
ls
X Variable 1 Line Fit Plot
0100,000200,000
$0 $50,000,000
$100,000,000
$150,000,000
X Variable 1
Y
YPredicted Y
X Variable 2 Line Fit Plot
0100,000200,000
8,000,000
8,500,000
9,000,000
9,500,000
X Variable 2
Y
YPredicted Y
X Variable 3 Line Fit Plot
0100,000200,000
0 500,000 1,000,000
X Variable 3
Y
YPredicted Y
X Variable 4 Line Fit Plot
0100,000200,000
6,000,000
6,500,000
7,000,000
7,500,000
X Variable 4
Y
YPredicted Y
Source: The SGM Group, Inc.

The SGM Group, Inc. 11/2/2007 47
FIGURE 2: UPDATED MMH MODEL
Regression StatisticsMultiple R 0.999823227R Square 0.999646485Adjusted R Square 0.899575782Standard Error 399.3835778Observations 13
ANOVAdf SS MS F ignificance F
Regression 3 4510436846 1503478949 9425.772322 4.73E-16Residual 10 1595072.422 159507.2422Total 13 4512031919
Coefficients Standard Error t Stat P-value Lower 95%Upper 95%Lower 95.0%Upper 95.0%Intercept 0 #N/A #N/A #N/A #N/A #N/A #N/A #N/ATOT 1.344176746 0.149027497 9.019655912 4.05765E-06 1.012123 1.676231 1.012123 1.676231Yosemite 2.645986501 0.125148981 21.14269308 1.24581E-09 2.367137 2.924836 2.367137 2.924836Skier 0.246061993 1.04432383 0.23561848 0.818483994 -2.080836 2.57296 -2.080836 2.57296
RESIDUAL OUTPUT
Observation Predicted Y Residuals Standard Residuals1 16523.46788 -7.467875507 -0.0213195752 16924.45862 23.54138157 0.0672068313 16714.54182 248.4581822 0.7093078664 18037.11202 -356.1120175 -1.0166421295 18350.57442 -638.5744189 -1.8230265346 17901.05069 114.9493139 0.3281616737 18224.58041 239.4195852 0.6835041368 18136.98996 665.0100385 1.8984959469 18996.3333 396.6666967 1.13241917
10 19703.19751 13.80249213 0.03940387911 20391.71112 -571.7111168 -1.63214263712 20636.26814 -21.90385174 -0.06253194913 20910.04994 -22.27419597 -0.063589222
X Variable 1 Residual Plot
-1000
0
1000
$0 $2,000 $4,000 $6,000 $8,000 $10,000
X Variable 1
Res
idua
ls
X Variable 2 Residual Plot
-1000
0
1000
- 1,000 2,000 3,000 4,000 5,000
X Variable 2
Res
idua
ls
X Variable 3 Residual Plot
-1000
0
1000
- 500 1,000 1,500
X Variable 3
Res
idua
ls
X Variable 1 Line Fit Plot
-20,00040,000
$0 $5,000 $10,000
X Variable 1
Y
YPredicted Y
X Variable 2 Line Fit Plot
-20,00040,000
- 2,000 4,000 6,000
X Variable 2
Y
YPredicted Y
X Variable 3 Line Fit Plot
-20,00040,000
- 500 1,000 1,500
X Variable 3
Y
YPredicted Y
Source: The SGM Group, Inc.

The SGM Group, Inc. 11/2/2007 48
FIGURE 3: POPULATION AND EMPLOYMENT FORECAST—MONO AND INYO COUNTIES 2000-2015
-
5,000
10,000
15,000
20,000
25,000
30,000
35,000
40,000
2000 2001 2002 2003 2004 2005 2006 2007 2008 2009 2010 2011 2012 2013 2014 2015
Population--No Action Population--Proposed ActionFull and Part-Time Employment--No Action Full and Part-Time Employment--Proposed Action
Historic
Forecast
Source: The SGM Group, Inc.
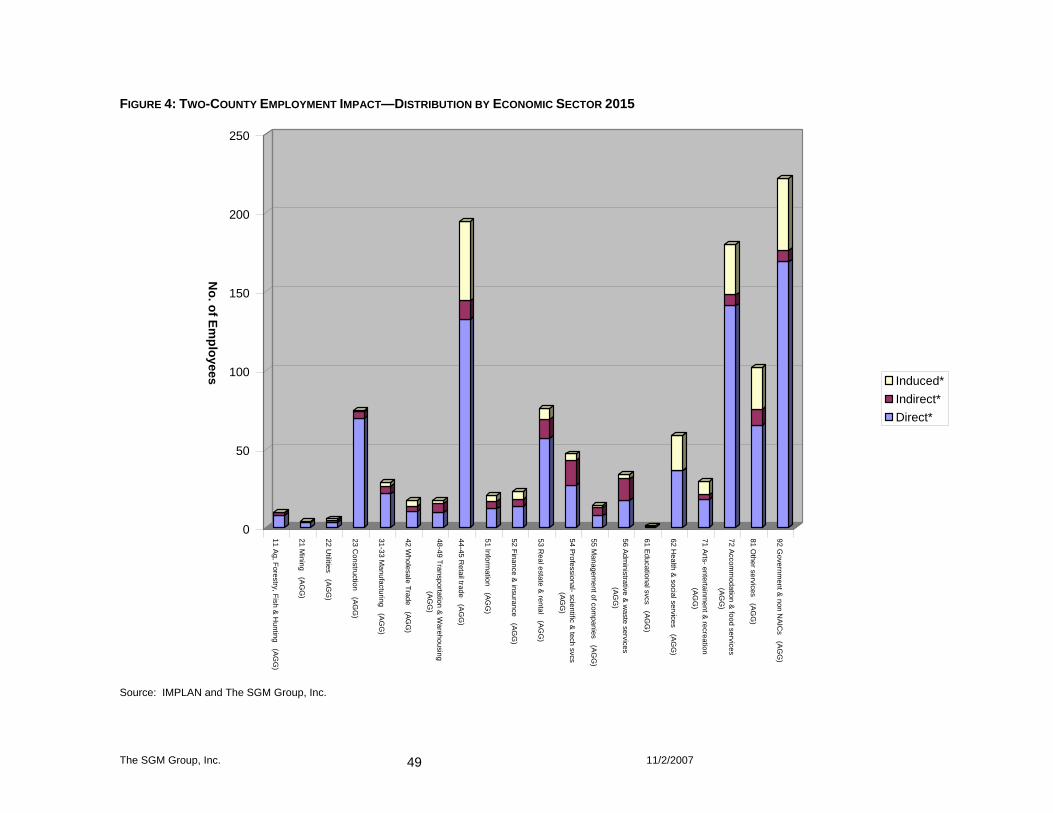
The SGM Group, Inc. 11/2/2007 49
FIGURE 4: TWO-COUNTY EMPLOYMENT IMPACT—DISTRIBUTION BY ECONOMIC SECTOR 2015
0
50
100
150
200
250
No. of Em
ployees
11 Ag, Forestry, Fish & H
unting (AGG
)
21 Mining (A
GG
)
22 Utilities (AG
G)
23 Construction (AG
G)
31-33 Manufacturing (A
GG
)
42 Wholesale Trade (AG
G)
48-49 Transportation & Warehousing
(AGG
)
44-45 Retail trade (A
GG
)
51 Information (A
GG
)
52 Finance & insurance (AG
G)
53 Real estate & rental (A
GG
)
54 Professional- scientific &
tech svcs (AG
G)
55 Managem
ent of companies (A
GG
)
56 Adm
inistrative & waste services
(AGG
)
61 Educational svcs (AG
G)
62 Health &
social services (AGG
)
71 Arts- entertainm
ent & recreation (AG
G)
72 Accom
modation &
food services (AG
G)
81 Other services (AG
G)
92 Governm
ent & non N
AIC
s (AG
G)
Induced*Indirect*Direct*
Source: IMPLAN and The SGM Group, Inc.

The SGM Group, Inc. 11/2/2007 50
Endnotes 1 The SGM Group, Inc., Technical Memorandum: Mammoth Yosemite Airport DEIS—Economic Impact of Airport Expansion, Prepared for the Federal Aviation Administration, May 2005. 2 Mammoth Lakes Fact Sheet, Mammoth Lakes Visitors Bureau, updated 5/18/04. 3 Ibid. 4 Mammoth Lakes Winter Visitor Survey, Final Report, Prepared by the Town of Mammoth Lakes, June 2002. 5 Town of Mammoth Lakes, “Notes on Technical Memorandum Economic Impact of Airport Expansion,” Summer 2006. 6 California Department of Finance, Demographic Research Unit, and Table2: E-5. City/County Population and Housing Estimates, 1/1/2005. In this analysis, California data is used in lieu of comparable data from the Town of Mammoth Lakes for population and housing because the state maintains an historic record that facilitates trend analysis and housing type distribution evaluation. 7 California Department of Finance, Demographic Research Unit, .Table2: E-5. City/County Population and Housing Estimates, 1/1/2005. I 8 Mammoth Lakes Winter 2002 Visitor Survey Report, Record of Interviews Intrawest Corporation and Mammoth Lakes Visitors Bureau. 9 Town of Mammoth Lakes, “Notes on Technical Memorandum Economic Impact of Airport Expansion,” Summer 2006 10 Mammoth Lakes region, Record of Contact personal interviews with Coldwell Banker, local real estate agents and local developers, 5/20-5/25/04. 11 “The World’s Finest Resorts” brochure and interview with Mammoth Realty Group, 5/21/04 12 Mammoth Realty Group and Coldwell Banker personal interviews, 5/21/04. 13 Realtor and local developer interviews 5/20-5/25/04. 14 Dempsey Construction, Town of Mammoth Lakes Community Development Department, and Town of Mammoth Lakes Land Use Element Draft, 7/13/04. 15 Town of Mammoth, Notes on Technical Memorandum Economic Impact of Airport Expansion,” Summer 2006 16 Ibid. 17 Ibid. 18 Mono County Land Use Element, http://www.monocounty.ca.gov/nd, May 2004. 19 Mono County GIS. 20 Mono County Land Use Element,, http://www.monocounty.ca.gov/nd, May 2004 21 U.S. Census 1980 and 1990; U.S. Census 2000, Summary File 1, Table P1: Total Population and Mono County Housing Element, Adopted 2004. 22 California Department of Finance, Demographic Research Unit, City/County Population and Housing Estimates, 1/1/05. 23 Ibid. 24 Superior Court of California, County of Mono, Facilities Master Plan, May 6, 2003.

The SGM Group, Inc. 11/2/2007 51
25 Summary of interviews with local real estate agents and developers in Mammoth Lakes, 5/20/04-5/25/04. 26 Ibid. 27 Ibid. 28 Ibid. 29 Intrawest Corporation Interview, 5/25/04. 30 Mono County Community Development Department personal interviews, 5/24/04 and telephone interviews with Mono County project planners, 6/04 and 7/04. 31IMPLAN, Summer 2005. 32 Ibid. 33 Mammoth Lakes Visitors Bureau, Mammoth Lakes Fact Sheet, updated 5/18/04. 34 Ibid. 35 Mammoth Lakes Summer Visitor Survey Report, 2002 36 Mammoth Lakes Winter 2002 Visitor Survey Report, Mammoth Lakes Visitors Bureau. 37 Mammoth Mountain, personal interview, 5/20/04. 38 Summary of interviews with local real estate agents and developers in Mammoth Lakes, 5/20/04-5/25/04. 39 Mammoth Mountain, telephone interview, 10/04 40 Definitions of Input-Output modeling components are included at the end of this technical memorandum. That discussion includes a description of the Input-Output models as well as definitions of Value Added, Total Output, and other components of the evaluation. 41 Population and employment data through 2003 are provided by BEA, US Department of Commerce; forecasts through 2005 are prepared by The SGM Group, Inc. 42 URS Forecast Enplanements, Mammoth Yosemite Airport, Summer 2006. 43 See for example, “Benefit Transfer of Outdoor Recreation Use Values,” by Randall S. Rosenberger and John B. Loomis, US Department of Agriculture, Forest Service,
Rocky Mountain Research Station, 2001. Benefit transfer is a practical way to evaluate economic impacts of future environmental resource development strategies when primary research is not possible. In this case, because of a lack of previous experience at Mammoth Yosemite, it is not possible to test previously experienced service impacts on regional employment or future growth and development. Using comparable experience at similar sites therefore becomes a potential alternative analytical strategy.
The case studies reviewed in the initial technical memorandum provided background examples of the potential economic effects of air service on regional employment in a surrounding affected region. Based on that analysis, a composite model was derived to estimate the potential impacts of similar air service improvements on the Two-County study area surrounding Mammoth Yosemite Airport.
44 URS Forecast Enplanements, Mammoth Yosemite Airport, Summer 2006. 45 The SGM Group, Inc. 46 IMPLAN prepares tax outputs based on the latest regional coefficients, which for this model was 2003. Only Indirect Business Taxes can be converted directly to 2006 dollars. Using that example, the inflation rate from 2003 to 2006 dollars is approximately 108 percent, resulting in a 2006 value for total tax benefit of $14.8 million.
The SGM Group, Inc. 11/2/2007 52
47 California Department of Finance, Research Division, http://www.dof.ca.gov/HTML/DEMOGRAP/repndat.htm#estimates 48 Inyo County Assessor’s Office, September 2004 (includes City of Bishop). 49 Town of Mammoth Lakes, Updated Comprehensive Plan, September 2004. 50 MIG, Inc., IMPLAN Professional, Version 2.0, User’s Guide, June, 2000, pp. 125-126, 253.

W:\12006395_Mammoth\EIS\Appendices\Working Files\Appendix Intros.doc\9/26/2007
Appendix E-2
Additional Economic Summary Tables This appendix is provided in support of the discussion in Section 4.3.3 of the EIS. This appendix contains more detailed economic data describing the existing economic conditions within the Two-County Study Area. Table Title
E-2.1 Economic Sectors and Average Wages for the Two-County Study Area, 2005 E-2.2 Economic Sectors for Mono and Inyo Counties, January 2001 – June 2004 E-2.3 Average Annual wages for Mono and Inyo Counties and the Two-County Study
Area, 2002 E-2.4 Seasonal Economic Indicators for the Town of Mammoth Lakes and Mono
County, 2005-2006
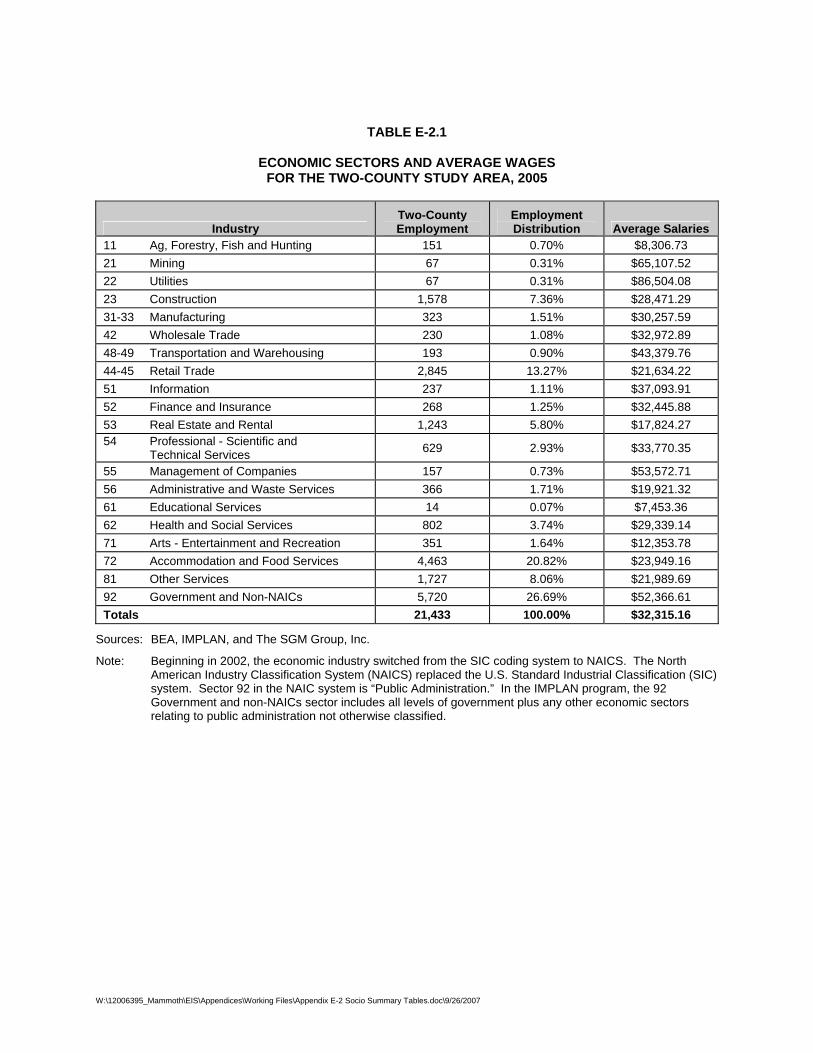
W:\12006395_Mammoth\EIS\Appendices\Working Files\Appendix E-2 Socio Summary Tables.doc\9/26/2007
TABLE E-2.1
ECONOMIC SECTORS AND AVERAGE WAGES FOR THE TWO-COUNTY STUDY AREA, 2005
Industry Two-County Employment
Employment Distribution Average Salaries
11 Ag, Forestry, Fish and Hunting 151 0.70% $8,306.73 21 Mining 67 0.31% $65,107.52 22 Utilities 67 0.31% $86,504.08 23 Construction 1,578 7.36% $28,471.29 31-33 Manufacturing 323 1.51% $30,257.59 42 Wholesale Trade 230 1.08% $32,972.89 48-49 Transportation and Warehousing 193 0.90% $43,379.76 44-45 Retail Trade 2,845 13.27% $21,634.22 51 Information 237 1.11% $37,093.91 52 Finance and Insurance 268 1.25% $32,445.88 53 Real Estate and Rental 1,243 5.80% $17,824.27 54 Professional - Scientific and Technical Services 629 2.93% $33,770.35
55 Management of Companies 157 0.73% $53,572.71 56 Administrative and Waste Services 366 1.71% $19,921.32 61 Educational Services 14 0.07% $7,453.36 62 Health and Social Services 802 3.74% $29,339.14 71 Arts - Entertainment and Recreation 351 1.64% $12,353.78 72 Accommodation and Food Services 4,463 20.82% $23,949.16 81 Other Services 1,727 8.06% $21,989.69 92 Government and Non-NAICs 5,720 26.69% $52,366.61 Totals 21,433 100.00% $32,315.16
Sources: BEA, IMPLAN, and The SGM Group, Inc.
Note: Beginning in 2002, the economic industry switched from the SIC coding system to NAICS. The North American Industry Classification System (NAICS) replaced the U.S. Standard Industrial Classification (SIC) system. Sector 92 in the NAIC system is “Public Administration.” In the IMPLAN program, the 92 Government and non-NAICs sector includes all levels of government plus any other economic sectors relating to public administration not otherwise classified.
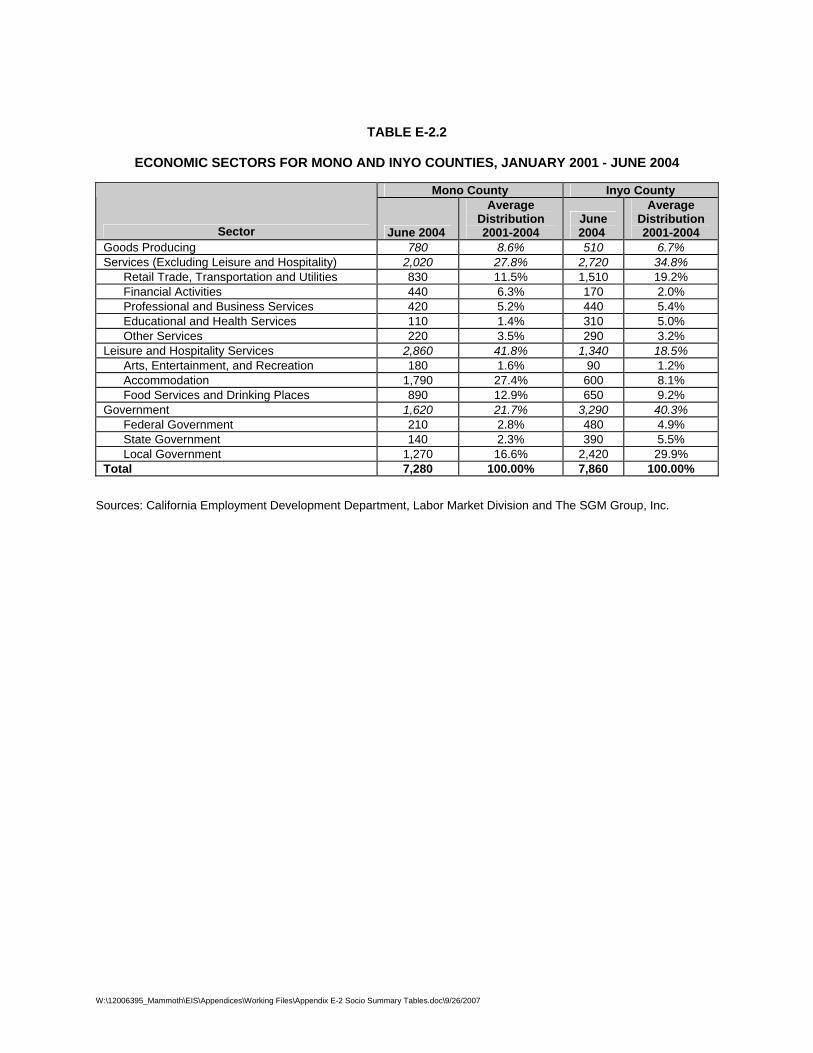
W:\12006395_Mammoth\EIS\Appendices\Working Files\Appendix E-2 Socio Summary Tables.doc\9/26/2007
TABLE E-2.2
ECONOMIC SECTORS FOR MONO AND INYO COUNTIES, JANUARY 2001 - JUNE 2004
Mono County Inyo County
Sector June 2004
Average Distribution 2001-2004
June 2004
Average Distribution 2001-2004
Goods Producing 780 8.6% 510 6.7% Services (Excluding Leisure and Hospitality) 2,020 27.8% 2,720 34.8% Retail Trade, Transportation and Utilities 830 11.5% 1,510 19.2% Financial Activities 440 6.3% 170 2.0% Professional and Business Services 420 5.2% 440 5.4% Educational and Health Services 110 1.4% 310 5.0% Other Services 220 3.5% 290 3.2% Leisure and Hospitality Services 2,860 41.8% 1,340 18.5% Arts, Entertainment, and Recreation 180 1.6% 90 1.2% Accommodation 1,790 27.4% 600 8.1% Food Services and Drinking Places 890 12.9% 650 9.2% Government 1,620 21.7% 3,290 40.3% Federal Government 210 2.8% 480 4.9% State Government 140 2.3% 390 5.5% Local Government 1,270 16.6% 2,420 29.9% Total 7,280 100.00% 7,860 100.00%
Sources: California Employment Development Department, Labor Market Division and The SGM Group, Inc.
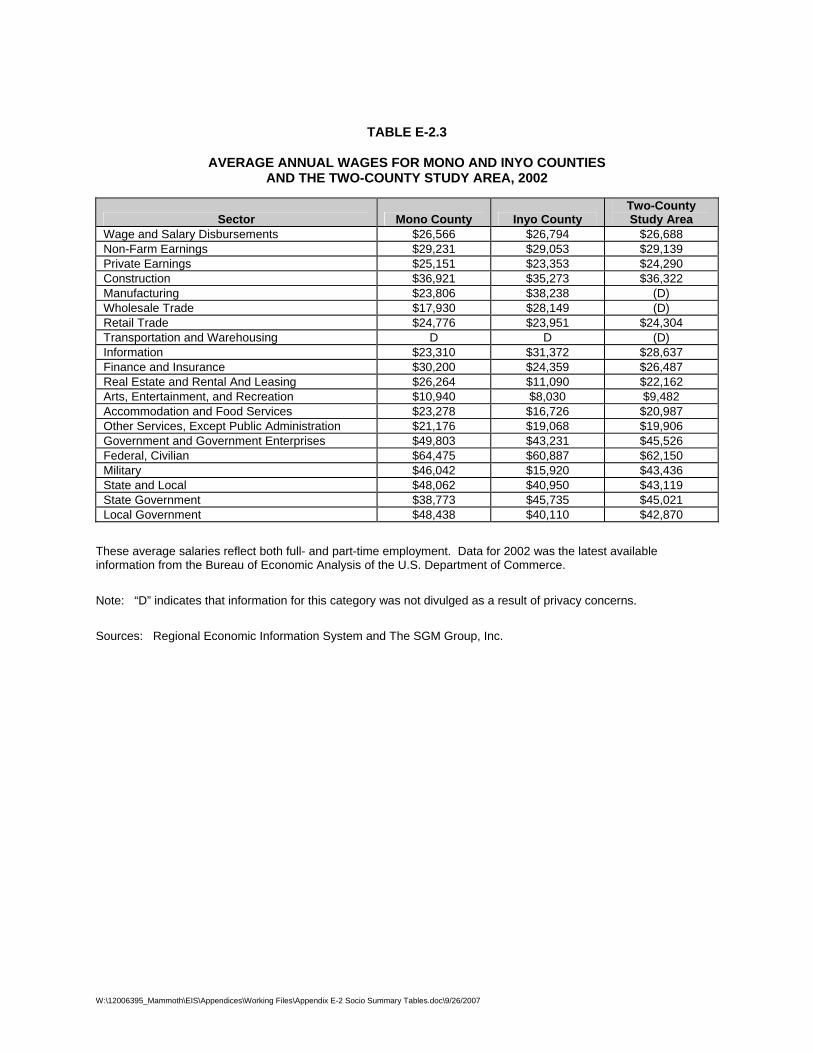
W:\12006395_Mammoth\EIS\Appendices\Working Files\Appendix E-2 Socio Summary Tables.doc\9/26/2007
TABLE E-2.3
AVERAGE ANNUAL WAGES FOR MONO AND INYO COUNTIES AND THE TWO-COUNTY STUDY AREA, 2002
Sector Mono County Inyo County Two-County Study Area
Wage and Salary Disbursements $26,566 $26,794 $26,688 Non-Farm Earnings $29,231 $29,053 $29,139 Private Earnings $25,151 $23,353 $24,290 Construction $36,921 $35,273 $36,322 Manufacturing $23,806 $38,238 (D) Wholesale Trade $17,930 $28,149 (D) Retail Trade $24,776 $23,951 $24,304 Transportation and Warehousing D D (D) Information $23,310 $31,372 $28,637 Finance and Insurance $30,200 $24,359 $26,487 Real Estate and Rental And Leasing $26,264 $11,090 $22,162 Arts, Entertainment, and Recreation $10,940 $8,030 $9,482 Accommodation and Food Services $23,278 $16,726 $20,987 Other Services, Except Public Administration $21,176 $19,068 $19,906 Government and Government Enterprises $49,803 $43,231 $45,526 Federal, Civilian $64,475 $60,887 $62,150 Military $46,042 $15,920 $43,436 State and Local $48,062 $40,950 $43,119 State Government $38,773 $45,735 $45,021 Local Government $48,438 $40,110 $42,870
These average salaries reflect both full- and part-time employment. Data for 2002 was the latest available information from the Bureau of Economic Analysis of the U.S. Department of Commerce. Note: “D” indicates that information for this category was not divulged as a result of privacy concerns. Sources: Regional Economic Information System and The SGM Group, Inc.

W:\12006395_Mammoth\EIS\Appendices\Working Files\Appendix E-2 Socio Summary Tables.doc\9/26/2007
TABLE E-2.4
SEASONAL ECONOMIC INDICATORS FOR THE TOWN OF MAMMOTH LAKES AND MONO COUNTY, 2005-2006
National Park and Monument Visitation
Mammoth Mountain And June Lake Resorts
2005-2006 Mono County Yosemite
Month
Mammoth Lakes
Occupancy 2005
Devils Postpile
2005 Total
Tioga Pass 2003
Mammoth Mountain
Skier Days
June Mountain
Skier Days
Average Company
Payroll 2005
Employment
2005 Unemployment
Rate January 53% 0 91,238 0 323,002 24,530 2,386 8,870 4.6% February 54% 0 103,756 0 279,290 25,517 2,357 8,810 4.7%
March 56% 0 143,335 0 259,743 18,489 2,322 8,590 4.5% April 36% 0 195,385 0 253,868 12,533 2,139 8,430 4.1% May 23% 0 304,552 0 67,911 0 1,259 7,410 5.7% June 27% 1,093 413,124 82,701 23,059 0 899 7,430 5.8% July 49% 25,473 554,567 157,209 6,486 0 803 7,470 5.8%
August 49% 28,760 485,643 189,337 0 0 774 7,520 5.3% September 37% 12,076 430,134 143,809 0 0 785 7,420 5.2%
October 22% 0 318,508 78,632 0 0 817 7,590 5.4% November 20% 0 152,671 2,154 55,784 0 1,417 8,080 5.2% December 44% 0 111,231 0 225,931 13,954 2,166 9,250 3.8%
Total --- 67,402 3,304,144 653,842 1,495,074 95,023 --- --- 5.0%
Sources: Mammoth Lakes Visitors Bureau, National Park Public Use Statistics Website and Yosemite National Park, Mammoth Mountain, Hayes Planning Associates, and California Employment Development Department Labor Market Information.

W:\12006395_Mammoth\EIS\Appendices\Working Files\!! Appendix Intros.doc\11/2/2007
Appendix E-3 Technical Memorandum: Mammoth Yosemite Airport DEIS Economic Impact of Airport Expansion This appendix is provided in support of Section 5.11 of the EIS. This memorandum was updated as reported in Appendix E-1.

Technical Memorandum:
MAMMOTH YOSEMITE AIRPORT DEIS
ECONOMIC IMPACT OF AIRPORT EXPANSION
May 2005
Prepared for: The Federal Aviation Administration
Prepared by: The SGM Group, Inc.
12010 Canter Lane Reston, Virginia
20191-2113
www.The-SGM-Group.com Voice: 703.860.1838 Fax: 509.461.8306

The SGM Group, Inc. Page i 5/10/2005
Table of Contents I. Introduction................................................................................................................................... 1 II: Existing Conditions ..................................................................................................................... 3
Mammoth Lakes and Mono County ............................................................................................ 3 Mammoth Lakes ..................................................................................................................... 3 Mono County........................................................................................................................... 5 Mono County Tourism............................................................................................................. 7
Bishop and Inyo County .............................................................................................................. 9 Bishop ..................................................................................................................................... 9 Inyo County............................................................................................................................. 9 Inyo County Tourism............................................................................................................. 10
Study Area Economic Profile .................................................................................................... 11 Summary—Existing Conditions................................................................................................. 12
III: Case Studies—Economic Impact Analysis ............................................................................. 14 Introduction................................................................................................................................ 14 Economic Impacts of Airport Accessibility................................................................................. 16
Telluride Regional Airport ..................................................................................................... 16 Eagle County Regional Airport (Vail) .................................................................................... 19 Aspen-Pitkin County/Sardy Field .......................................................................................... 22 Jackson Hole Airport............................................................................................................. 24
Composite Model ...................................................................................................................... 26 Mammoth Yosemite Airport Model............................................................................................ 27
IV: Measuring Economic Value .................................................................................................... 28 Input-Output Model Application................................................................................................. 28 Long-Term Employment Benefits.............................................................................................. 30 The Economic Value of Long-Term Effects .............................................................................. 32
Value Added ......................................................................................................................... 32 Tax Related Impacts ............................................................................................................. 32
Additional Measures of Economic Value................................................................................... 32 Summary—Economic Value ..................................................................................................... 33
V. Development Impacts and Fiscal Analysis ............................................................................... 35 Population and Development................................................................................................ 35
Fiscal Impact Analysis............................................................................................................... 37 Fiscal Impact—Town of Mammoth Lakes............................................................................. 38 Fiscal Impact—Remainder of Mono County ......................................................................... 38 Fiscal Impact—City of Bishop............................................................................................... 39 Fiscal Impact—Remainder of Inyo County ........................................................................... 39
Summary—Fiscal Impacts ........................................................................................................ 40 VI: Economic Impacts of Construction ......................................................................................... 41
Regional Economic Leakage .................................................................................................... 42 Glossary......................................................................................................................................... 43 References ....................................................................................................................................R-i Endnotes...................................................................................................................................... R-iii

The SGM Group, Inc. Page ii 5/10/2005
Tables Table 1: Forecast Annual Enplanements--Mammoth Yosemite Airport 2007-20017.................... 45 Table 2: City/County Population and Housing Estimates—January 2004 .................................... 46 Table 3: Proposed Large-Scale Development Activity 2004......................................................... 47 Table 4: Two-County Commercial/Industrial Development—August 2004................................... 48 Table 5: Average Annual Wages—Mono County 2001-2002 ....................................................... 49 Table 6: Mammoth Skier Days—1986-2004 ................................................................................. 50 Table 7: Yosemite National Park Visitors—1992-2003 ................................................................. 51 Table 8: Housing Characteristics—Two-County Study Area 2000-2004 ...................................... 52 Table 9: Development Activity, by Use, Inyo County, 1999-2003 ................................................. 53 Table 10: Output, Value Added and Employment—Mono County 2001....................................... 54 Table 11: Percentage Distribution by Economic Sector—Mono County 2001.............................. 55 Table 12: Output, Value Added and Employment—Inyo County 2001......................................... 56 Table 13: Percentage Distribution by Economic Sector—Inyo County 2001................................ 57 Table 14: Employment and Population—Two-County Study Area 1990-2004 ............................. 58 Table 15: Case Study Airport Characteristics ............................................................................... 59 Table 16: Telluride and Montrose Regional Airport Case Study—Area Analysis 1993-2003....... 60 Table 17: Telluride and Montrose Regional Airport—Employment Forecast Model 1993-2001... 61 Table 18: Eagle County Regional Airport—Area Analysis and Employment Forecast Model 1993-
2002 ...................................................................................................................................... 62 Table 19: Aspen Case Study—Area Analysis 1993-2003............................................................. 63 Table 20: Aspen/Pitkin County Airport—Employment Forecast Model 1993-2002 ...................... 64 Table 21: Jackson Hole Airport—Area Analysis and Employment Forecast Model 1992-2002 ... 65 Table 22: Composite Forecast Model—Employment Forecast Model 1993-2002 ....................... 66 Table 23: Alternative Employment Forecast Models—Summary Output...................................... 67 Table 24: Target Year Forecasts—Mono and Inyo Counties 2007-2017...................................... 68 Table 25: Population and Employment Forecast—Mono and Inyo Counties 2007-2017 ............. 69 Table 26: Development Impact—Mono and Inyo Counties 2007-2017 ........................................ 70 Table 27: Two-County Employment Impact—Distribution by Economic Sector 2007-2017......... 72 Table 28: Employment Impact—Airport Improvement Project 2017 ............................................. 73 Table 29: Value Added—Airport Improvement Project 2017 ........................................................ 74 Table 30: Total Output—Airport Improvement Project 2017 ......................................................... 75 Table 31: Employee Compensation—Airport Improvement Project 2017..................................... 76 Table 32: Average Employee Compensation by Sector—2017.................................................... 77 Table 33: Indirect Business Taxes—Airport Improvement Project 2017....................................... 78 Table 34: Taxes—Airport Improvement Project 2017 ................................................................... 79 Table 35: Housing Development Impact Summary—2017 ........................................................... 80 Table 36: Population and Housing Impacts—2017....................................................................... 81 Table 37: Existing Commercial Development Patterns—2004 ..................................................... 82 Table 38: Employment by Sub Area—2004 .................................................................................. 83 Table 39: Forecast Commercial Development Patterns—2017.................................................... 84 Table 40: Fiscal Impact—Town of Mammoth Lakes—2017 ......................................................... 85 Table 41: Mono County Budget Allocation 2003-2004.................................................................. 86 Table 42: Mono County Per Capita Revenues and Expenditures—FY 2003-2004 ...................... 87 Table 43: Mono County Fiscal Impact Summary 2017 ................................................................. 88 Table 44: City of Bishop Budget Allocation 2003-2004................................................................. 90 Table 45: City of Bishop Per Capita Revenues and Expenditures—FY 2003-2004 ..................... 92 Table 46: City of Bishop Fiscal Impact Summary—2017.............................................................. 94 Table 47: Inyo County Budget Allocation 2003-2004.................................................................... 96 Table 48: Inyo County Per Capita Revenues and Expenditures—FY 2003-2004 ........................ 97 Table 49: Inyo County Fiscal Impact Summary 2017.................................................................... 98 Table 50: Construction Cost Estimates Mammoth Yosemite Airport ............................................ 99 Table 51: Summary Economic Impacts of Construction—Mono and Inyo Counties .................. 100 Table 52: Construction Employment Impact—Mono and Inyo Counties..................................... 101

The SGM Group, Inc. Page iii 5/10/2005
Table 53: Construction Total Output—Mono and Inyo Counties................................................. 102 Table 54: Construction Value Added—Mono and Inyo Counties................................................ 103 Table 55: Construction Employee Compensation—Mono and Inyo Counties ............................ 104 Table 56: Construction Labor Income—Mono and Inyo Counties .............................................. 105 Table 57: Construction Indirect Business Taxes—Mono and Inyo Counties .............................. 106 Table 58: Construction Total Taxes—Mono and Inyo Counties.................................................. 107 Table 59: Summary Economic Impacts of Construction ............................................................. 108
Figures Figure 1: Location Map--Mammoth Yosemite Airport.................................................................. 109 Figure 2: Economic Impact Analysis Methodology...................................................................... 110 Figure 3: Average Annual Wages--Mono County 2001-2002 ..................................................... 111 Figure 4: Mono County Monthly Employment by Sector 2001-2004........................................... 113 Figure 5: Mono County Monthly Employment Percentage Distribution by Sector 2000-2004.... 114 Figure 6: Inyo County Monthly Employment by Sector 2001-2004............................................. 115 Figure 7: Inyo County Monthly Employment Percentage Distribution by Sector 2001-2004 ...... 116 Figure 8: Percentage Distribution by Economic Sector—Mono County 2001 ............................ 117 Figure 9: Industry Output by Economic Sector—Mono County 2001 ......................................... 118 Figure 10: Employment Distribution by Economic Sector—Mono County 2001......................... 119 Figure 11: Total Value Added by Economic Sector—Mono County 2001 .................................. 120 Figure 12: Percentage Distribution by Economic Sector—Inyo County 2001............................. 121 Figure 13: Industry Output by Economic Sector—Inyo County 2001.......................................... 122 Figure 14: Employment Distribution by Economic Sector—Inyo County 2001 ........................... 123 Figure 15: Total Value Added by Economic Sector—Inyo County 2001..................................... 124 Figure 16: Comparative Employment Distribution by Economic Sector—Mono and Inyo Counties
2001 .................................................................................................................................... 125 Figure 17: Comparative Industry Output by Economic Sector—Mono and Inyo Counties 2001 126 Figure 18: Comparative Value Added by Economic Sector—Mono and Inyo Counties 2001 .... 127 Figure 19: Population and Employment Growth--Mono and Inyo Counties1990-2004............... 128 Figure 20: Telluride/Montrose Regional Airports Model .............................................................. 129 Figure 21: Eagle County Regional Airport Model ........................................................................ 130 Figure 22: Aspen/Pitkin County Airport Model ............................................................................ 131 Figure 23: Jackson Hole Airport Model ....................................................................................... 132 Figure 24: Composite Forecast Model ........................................................................................ 133 Figure 25: Mammoth Yosemite Airport Model............................................................................. 134 Figure 26: Population and Employment Forecast—Mono and Inyo Counties 2005-2017.......... 135 Figure 27: Two-County Employment Impact—Distribution by Economic Sector 2007-2017...... 136 Figure 28: Housing Characteristics—Mono and Inyo Counties 2000-2004 ................................ 137 Figure 29: Economic Leakage—Seven Counties versus Mono and Inyo Counties.................... 138

The SGM Group, Inc. Page 1 5/10/2005
I. Introduction Mammoth Yosemite Airport is located approximately six miles east of the Town of Mammoth Lakes, in Mono County, California (Figure 1). Under the proposed airport improvement project, the Town of Mammoth Lakes would expand the airport to accommodate commercial jet aircraft up to the size of a B-757-200. Proposed improvements would include new or expanded airside and landside facilities and associated changes to how existing property is used as well as other landside improvements:
• Extend Runway 9/27 by 1,200 feet to the west for a total length of 8,200 feet,
• Strengthen the runway and taxiways to accommodate up to B-757-200 aircraft,
• Widen the runway from 100 to 150 feet by adding 50 feet of pavement on the south side of the runway and shifting the runway centerline 25 feet to the south,
• Widen the parallel taxiway from 50 to 75 feet by adding 20 feet of pavement on the south side and five feet on the north side,
• Widen selected connecting taxiways from 50 to 75 feet,
• Extend the parallel taxiway to match the runway extension,
• Add an air carrier apron to accommodate three air carrier aircraft with expansion capabilities to accommodate up to six air carrier aircraft,
• Install a localized navigation facility, and
• Implement new flight procedures.
A second build alternative under consideration consists of extending Runway 9/27 2,000 feet to the west for a total length of 9,000 feet. All of the remaining improvements would be the same as those described for the proposed project. As indicated in Table 1, proposed improvements at Mammoth Yosemite Airport are expected to generate commercial air service with total annual enplanements of 29,300 beginning in 2007, increasing to 167,100 by 2017.1
An additional alternative could involve construction of runway and terminal improvements at Eastern Sierra Regional Airport located in the City of Bishop. Details concerning the characteristics of possible improvements at Eastern Sierra have not yet been defined; however, general economic impacts derived for potential improvements at Mammoth Yosemite would be comparable to those that could be experienced if the improvements were implemented at Eastern Sierra.
The analysis that follows examines potential economic effects of proposed improvements in a two-county region that includes Mono and Inyo Counties, the area surrounding the Town of Mammoth Lakes. This two-county impact area, which represents a broader area than the impact area defined for other topic areas in the DEIS, has been selected because data available is often limited to defined jurisdictions. The smallest jurisdiction for which detailed economic information is available over time is primarily at the county level.
The impact study follows the analytical process illustrated conceptually in Figure 2. As shown, this process begins with an evaluation of existing economic conditions in the defined two-county study area, including an analysis of population growth in general and employment growth by economic sector. This review establishes baseline economic conditions within the study area and is the foundation on which projections of future growth and development are built.
Supplementing the initial existing conditions analysis is a study of similar historic growth and development experience affecting winter resort communities in comparable locations served by commercial airports. These case studies specifically examine how change in airport accessibility has affected area wide employment historically.

The SGM Group, Inc. Page 2 5/10/2005
The information gathered for both the existing conditions analysis as well as from the case study evaluations is blended into a comprehensive view of how airport access contributes to economic value in resort communities. Resort economies are fundamentally different than typical regional economies—resort environments attract visitors, and those visitors create a demand for services. In part, people who arrive at these locations via commercial air service are representative of the total visitor population, contributing to growth in economic activity. As a result, change in air service helps to generate change in demand for employment in the service- and resort-based economy. In turn, change in employment contributes to economic value through an increase in total output, value added, employee compensation, additional taxes, and other component measures of economic activity.
Other attributes are measured through evaluation of potential fiscal impacts, an examination of the potential change in revenues and expenditures that could be experienced by local jurisdictions associated with proposed improvement programs. The broader region has traditionally developed in concert with the winter resort activities, supplemented and complemented by summer visitation to surrounding national parks and recreational attractions. Increasing accessibility has the potential to enhance that process. In evaluating the overall economic impacts, this study considers both long-term regional effects as well as short-term effects related to construction expenditures.
The primary issue addressed by this economic impact study is whether or not a link could be established between the proposed airport improvements and a change in employment. Without that link, it is difficult to estimate the value of economic impacts associated with the proposed action. Improvements at the airport that result in commercial air service lead to improved accessibility for the community. As a resort economy centered on the activities at Mammoth Lakes and other facilities and attractions throughout the region, accessibility is important. Any means to improve accessibility could result in an increased economic activity. An increase in economic activity associated with particular economic sectors characteristic of a resort economy has the potential to generate additional employment throughout the region. Measuring that potential change is the critical process in measuring potential economic impacts associated with the proposed improvements.

The SGM Group, Inc. Page 3 5/10/2005
II: Existing Conditions The description of the existing economic conditions and development activity in the Mammoth Lakes region provides a context in which to evaluate long-term economic impacts of proposed improvements to the Mammoth Yosemite Airport. Using a broad understanding of these conditions, it is the objective of the impact analysis to identify and measure the linkage between an improved level of access to the region and change in local and regional economic activity. Measuring that linkage is based on two major tasks. The first involves an evaluation of comparable experience in case study locations similar to that of Mammoth Lakes. The second involves applying that experience to the Mammoth regional economic forecasts. The following section begins this process with a description of recent development trends and overall regional economic conditions.
The first section summarizes market conditions in the Mammoth Lakes region, which includes Mono and Inyo counties and the only two incorporated areas, the Town of Mammoth Lakes and the City of Bishop. The two-county area was selected as the basis for the economic impact analysis for several reasons. First, although it represents an area larger than that selected for other components of the Environmental Impact Analysis, counties are the smallest jurisdiction for which long-term economic data are available on a consistent basis. Second, this area encompasses the primary area that could be affected by changes in the resort economy that dominates the area. Year-round access throughout the area is available primarily along the north-south transportation corridor centered on California’s US Route 395. East-west access throughout a significant portion of the region is often unavailable during the winter season, the period of time during which the resort center serves a major portion of the region’s visitors. As a result, the potential change in employment throughout the impact area, although tied to year-round activities, is most affected by opportunities linked to winter-season activities.
As input to the analysis for all jurisdictions, baseline demographic and housing data were available from the California Department of Finance, Demographic Research Division, as this division offers the most current data by subarea. Employment data was derived from several sources. Total employment by county was available through the Bureau of Economic Analysis of the U.S. Department of Commerce, Regional Economic Information Service. Subarea employment distribution was provided by the State of California, Employment Development Department, Labor Market Information Division (LMI). As information from these sources is used in this analysis, its application is defined and purpose described.
Mammoth Lakes and Mono County
Mammoth Lakes
The Town of Mammoth Lakes, California, the center of economic activity in the region, is located in Mono County on the east side of the Sierra Nevada mountain range and is the only incorporated jurisdiction within Mono County. Located at an elevation of 7,800 feet, directly below Mammoth Mountain’s summit of 11,053 feet, the town is nearly equidistant from the Los Angeles Basin and San Francisco in terms of drive time.2 The Los Angeles Basin is approximately a six-hour drive and San Francisco, a seven-hour drive. The closest major city with an international airport is Reno, Nevada, which is a three-hour drive to the north/northwest. The incorporated boundaries of the town measure approximately 25 square miles; however, only four square miles of developable land are located within the town limits. The Inyo National Forest surrounds the remaining land area, which effectively contains its growth.3
Mammoth Lakes is currently experiencing an increasing level of private sector development activity led by the Intrawest Corporation, one of the largest resort developers in North America. Intrawest has acquired 60 percent ownership in Mammoth Mountain and expects to invest nearly $750 million in improvements in the Town of Mammoth Lakes and the Mountain over the next decade.4 As a result of this investment, the Town of Mammoth Lakes is experiencing growth rates greater than those realized in the greater Eastern Sierra region. In this study, the Eastern

The SGM Group, Inc. Page 4 5/10/2005
Sierra region refers to the geographic area covering Mono and Inyo counties, including the Town of Mammoth Lakes and the City of Bishop. As of January 2004, the full-time resident population was estimated by the California Department of Finance at 7,470, a total that represents a growth rate of 56 percent over the period 1990 to 2004.5 Half of the full-time population is between the ages of 25 and 54 with a median age of 32 years (Table 2).6
In 2004, according to the California Department of Finance, there were a total of 8,680 housing units with a vacancy rate of 65 percent, indicating the magnitude of the second home market in the Town.7 A large percentage of homeowners maintain a primary residence elsewhere (primarily in Southern California) and spend only part of the time in Mammoth’s mountain resort.8 The ratio of permanent residents to visitors is important in understanding Mammoth Lakes’ population and the potential economic impacts. The town experiences large fluctuations in the total non-resident population because of the seasonal nature of its tourism-dependent economy. In the winter, during the peak tourist season, the community and the ski area require additional employees to meet peak service demands. As a result, the resident population coupled with the tourism population can exceed 35,000 people during the peak winter tourism season.9 The town, therefore, accommodates a significantly larger population when temporary tourist populations are present.
The demands and resulting impacts from these population fluctuations, from the average daily residents to peak occupancy periods, are currently being addressed by the area as it continues to evolve from a primarily ski resort to a four-season resort. Over the last decade, in response to growing demand for additional year-round activities, two golf courses have been built, a variety of summer music festivals have been introduced, and other special events such as national road and mountain bike events have been organized. The expansion is designed to help draw golfers, music lovers, cyclists, hikers and participants in other activities and to attract a more stable year-round tourism base. The permanent population in the Town of Mammoth Lakes at build-out is expected to reach 11,000 with a peak capacity of about 57,400 people.10
The Town of Mammoth Lakes has addressed several measures in anticipation of this potential growth, recommending a specific plan to limit the high density residential uses consistent with a mountain resort community and to provide for a mix of commercial and visitor lodging along with affordable workforce housing. The private sector is responding to this plan with a new kind of residential product following a growing trend in ski/recreational areas experienced elsewhere in the country. Since Intrawest Corporation‘s initial participation at Mammoth Mountain beginning in 1996, several nationally recognized resort developers, in addition to the Intrawest Corporation, have successfully initiated construction in this market.11
In anticipation of this growth in year-round tourism, the type of development currently proposed is primarily high-density residential with resort-associated retail—a product that differs from the existing housing stock, which is primarily single-family homes and small condominium/townhouse complexes. The type of high-density residential product entering the market, along with resort condominiums, is fractional-share ownership for condominiums. Under this management framework, an owner buys into a portion of the real estate (i.e. two weeks per year) with a sales price prorated as a function of the number of vacation weeks purchased. This partial ownership, referred to as a residence club concept, is the fastest growing segment of the luxury vacation home industry. This residential product has been marketed at several resort destinations including Aspen, Vail, and Telluride in Colorado; and Heavenly Valley Ski Resort, and Northstar Club, Lake Tahoe; and the Teton Club in Jackson Hole, Wyoming.12 The Town of Mammoth Lakes is expecting five or six residential products of this type to enter the market by the year 2010. These residential complexes offer all the services and product finishes of a five-star hotel, coupled with direct access to the mountain and ski areas. There are two projects of this genre currently in preliminary stages of development: a five-star hotel (the Westin) and the 80/50 private-residence club that has over 150 reservations for the initial phase of 45 units. Sales prices are expected to range up to $2,000 per square foot.13

The SGM Group, Inc. Page 5 5/10/2005
The growing second home market and Intrawest’s investment in Mammoth Lakes have helped to stimulate a rise in real estate prices. Over an eight-year period, multi-family residential prices have increased from an average of $100 per square foot to just over $600 per square foot.14 Major residential developments proposed or currently in the planning process include several projects that are described in the following section (Table 3).
Snow Creek Resort is a master-planned, full service resort situated on 345 acres.15 At completion, Snow Creek will include 2,300 units of resort residential development consisting of single-family homes, multi-family condominiums, overnight lodging, 150,000 square feet of resort commercial building (including an athletic club), and an 18-hole golf course. Approximately 40 percent of the residential product is complete and 20 percent of the commercial development is occupied. Nine holes of the eighteen-hole course are in play. Prices for the new residential units, which range in size from 2,500 to 3,000 square feet, are approximately $1.0 million. The majority of these units are owner-occupied, serving primarily as second homes to Southern Californians.
Intrawest Corporation plans to develop a total of 2,800 residential units in Mammoth Lakes with a variety of residential housing types ranging from golf-course townhouses to condominium hotel units.16 Since 1994, Intrawest has added approximately 800 units to the market. An additional 2,000 units are proposed to be added to the Mammoth Lakes residential market over the next 12 years. Also proposed are 45,000 square feet of supporting commercial space. Units are expected to range in price from $480 per square foot to over $600 per square foot.
North Village, located at the intersection of Route 203 and Lake Mary Road, is a planned residential/commercial node of four different planned residential projects with a total of 3,000 bedrooms. Intrawest Corporation, Dempsey Construction, the 80/50 private residence, and the local developer Ward Jones, plan units for this area of the Town.17 These four developers plan to build a variety of second home units from a luxury hotel/condominium product to fractional share resort condominium units. Prices are expected to range from $500 per square foot to over $2,000 per square foot. Over the last six years, condominium unit prices at this location for multi-family units have increased from an average of $150 per square foot to over $500.
As shown in Table 3, approximately 4,270 residential units are proposed as additions to the Town of Mammoth Lakes market along with approximately 165,100 square feet of associated retail space. These proposed additions will increase the number of housing units by 50 percent from an existing base of 8,680 units, and add nearly 15 percent to existing supply of commercial space for a total of 1.35 million square feet. The existing commercial inventory in the Town of Mammoth Lakes, as shown in Table 4, is approximately 1.18 million square feet. The majority of this space is located in small shopping centers, with ground floor retail/office space with street frontage along Main Street and along Old Mammoth Road.
Mono County
Mono County is located on the eastern side of the Sierra Nevada, along the California-Nevada border. The main highway providing year-round access is US 395. Located within the county are the Inyo and Toiyabe National Forests, Mono Basin National Forest Scenic Area, Devils Postpile National Monument, Bodie State Historic Park, and portions of Yosemite National Park and the Ansel Adams Wilderness. The Town of Mammoth Lakes is the only incorporated community in the county. The Mono County government oversees the unincorporated areas, including June Lake, Bridgeport, Crowley Lake, Bodie, Lee Vining, Benton, Convict Lake, Twin Lakes, Walker, Topaz, and Coleville. Mammoth Mountain Ski area and June Lake Ski areas are among the major employers.
Development in Mono County is limited by the lack of large concentrations of private lands outside of existing communities. Parcels of private land large enough for development are often agricultural and not available for development.18 Furthermore, much of the land is not suitable for

The SGM Group, Inc. Page 6 5/10/2005
development, either because of the steep topography, lack of access, or as a result of the threat of a natural disaster from seismic or volcanic activity, avalanche, or flooding.19
Land use within the unincorporated areas of Mono County is constrained by land ownership. Approximately 94 percent of the land in the county is publicly owned; 88 percent is federally owned; and the State, the Los Angeles Department of Water and Power, or Native American Tribal groups own the remainder. The majority of private land within the county is concentrated in community areas, with the remainder dispersed throughout the county in small parcels.20 The population of Mono County (including the Town of Mammoth Lakes) grew by almost 32 percent from 9,960 in 1990 to 12,850 in 2000.21 In 2004 the population was estimated at 13,520 (Table 2).22 There are nearly as many housing units in the county as there are inhabitants, but more than half of them serve as vacation retreats or second homes for people residing in larger cities. A total of 12,860 housing units are located in the county with approximately 56 percent designated as vacant.23 This high vacancy rate is indicative of the large second home market in the county. The growth in the second home market appears to result from increasing development pressures in Antelope Valley and the northern areas of the county, from Chalfont and the Bishop area, and in the Long Valley community around Crowley Lake. The Crowley Lake area development activity is a spin-off of increasing development pressure in the Mammoth area. Growth is expected to continue in the future, with county population expected to reach 27,400 by 2022—an increase of 112 percent over current levels.24 The majority of the residents in the county live near the town of Mammoth Lakes. The resident or permanent population, however, represents only a fraction of the total actual population during peak visitation periods. It is estimated that the population of the county triples during the summer and winter seasons because of the number of visitors.
The Mono County economy is largely driven by tourism, generated by year-round recreational opportunities offered from its Eastern Sierra location accessible throughout the year. According to local sources, this growth can be attributed to a recent increase in retirees settling in Mammoth Lakes in particular and Mono County in general. 25 Economic conditions are contributing to an increase in the number of Californians choosing to retire early, and an increasing number of retirees are choosing to locate in Mammoth Lakes and Mono County. The retirement market is fueled by the lifestyle based on access to nature and outdoor recreational activities. In addition, the investment Intrawest Corporation made beginning in 1996 in Mammoth Mountain and June Mountain has upgraded the ski resort, including the ski area, mountain services, lodging and mountain facilities. These improvements have helped to make Mammoth Mountain one of the top ski resorts in the country. Intrawest is a leading developer of this village-centered resort concept in North America with similar product at Whistler in British Columbia, and Copper Mountain and Squaw Valley in California. This investment in the Town, the Mountain, and in other winter activities, along with the opening of two new golf courses, has made this resort a premier four-season resort.26
These recently upgraded recreation facilities have helped to attract families back to the area who for years went elsewhere during a period of decline in the early 1990s.27 These families are now buying into the upgraded real estate and investing in second homes, helping to drive up a second-home market that is now priced in excess of $500,000 per unit.28 Additional large-scale development in Mono County, as described in the following sections, now in planning stages, may continue to drive additional growth and development.
Intrawest at June Lake: Intrawest Corporation is currently seeking approval for a 110–acre site located on the Old Rodeo Grounds at June Lake, between Gull and Silver Lakes. The development is expected to include approximately 652 multi-family units plus 102 single-family lots. The site is located across from the June Mountain ski area, which is operated by Mammoth Mountain. The entire project is expected to be phased in over a ten-year period. Plans also include up to 14,500 square feet of supporting retail. This development is designed to appeal to the second-home owner.29

The SGM Group, Inc. Page 7 5/10/2005
Additional single-family development underway or proposed is located primarily around Crowley Lake and Long Valley. This development activity, shown in Table 3, includes Paradise Community, Chalfont, White Mountain Estates, King Lake, and Crowley Lake. New homes planned in these communities are intended as vacation retreats or second homes for people residing in larger cities. Prices are expected to average approximately $600,000 for a single-family home.30 As shown in Table 3, build-out of the remaining projects will increase the seasonal population, adding another 1,130 housing units to the county housing supply. In general, these homes are expected to average from $400,000 to $600,000 in current dollars.
Proposed new industrial/commercial space in Mono County is concentrated around the Mammoth Yosemite Airport, June Lake, Crowley Lake, and in the Long Valley Area. The total estimated additional space is approximately 2.93 million square feet and includes retail, commercial, and light industrial projects. Table 4 shows the inventory of commercial space in the county, much of which is supporting retail such as convenience stores and light industrial/warehousing.
Overall, the services, retail trade, and government sectors dominate Mono County’s employment; and industry projections for the future estimate that the job growth in Mono County will continue in the same three sectors. In 2003 the leisure and hospitality services sector represented about 40 percent of the total employment, while the government sector accounted for an additional 22 percent of total employment.31 This distribution is expected to continue, particularly in terms of accommodations and related services, as the county continues to grow. Food services alone accounts for approximately 13 percent of total employment, with growth expected to continue along with tourism.32 Government, including education, city and county government continues to be a major employment sector in the county, and this sector is expected to see some growth as the demand for government services, particularly local government, expands in concert with expected population growth.
Since 1997, annual average unemployment rates in the county have declined, suggesting a moderately strengthening economy in the area. From 1997 though the first half of 2004, Mono County’s unemployment rate dropped 5.1 percentage points, from a high of 10.3 percent in 1997 to 5.4 percent through the first half of 2004.33 The job growth and economic health of Mono County can be attributed to continued growth in tourist activity and a resulting growth in the accommodations and retail services sectors. Average annual wages in Mono County for 2001 and 2002, shown in Table 5 and Figures 3-5, expressed in 2002 dollars, range from $10,940 in the arts, entertainment and recreation field to $64,500 in federal and civilian government. These average salaries reflect both full- and part-time employment. Data for 2002 was the latest available information from the Bureau of Economic Analysis of the US Department of Commerce.
The major job centers in the county are concentrated in Mammoth Lakes (services, retail trade, and government), June Lake (seasonal services and retail trade) and Bridgeport (government). The county’s major employers include June Mountain Ski Area, Mammoth Elementary School, Mammoth Hospital, Mammoth Lakes Fire Department, Mammoth Mountain Inn, Mammoth Mountain Ski area, Mono County government, Mountainside Grill (restaurant), and Whiskey Creek at Mammoth (restaurant).34
Mono County Tourism
Tourism is the major generator of economic activity in the study region, and both Mono County and the Town of Mammoth Lakes offer distinct seasonal attractions, including skiing and snow-related sports in the winter and mountain biking, hiking golfing, fishing, horse back riding and rock–climbing in the summer. During the 1980s Mammoth Mountain was the premier ski resort in the nation based on the number of skier visits, fueled by an annual average of 384 inches of snowfall per year.35 In the summer, major area attractions include Yosemite National Park, the Ansel Adams and John Muir Wilderness areas, and Mono Lake.
The Mammoth Lakes Visitor’s Bureau estimates an annual average of 2.8 million visitors per year. The winter season, from November through April attracts approximately 1.3 million visitors

The SGM Group, Inc. Page 8 5/10/2005
and in the summer season, June through September, the town hosts approximately 1.5 million tourists.36 The shoulder seasons are spring and fall.
The historic skier-day statistics provided by Mammoth Mountain Ski Area for Mammoth Mountain and June Mountain are shown in Table 6. As indicated, Mammoth Mountain reached a peak skier visitation in 1985-1986 season with approximately 1.43 million skiers. During this time, the Mountain was ranked the number one ski area in the nation.37 Throughout the following decade, little was done to maintain the success of the mountain, while other national resorts improved their facilities in an effort to capture more of the skier market.38 In the 1996-1997 the number of skiers at Mammoth Mountain declined to approximately 800,000. Other resorts, including Vail and Aspen, began improving their facilities, emphasizing guest services, which helped to attract skiers away from Mammoth Mountain. Since 1996, this condition has turned around as Mammoth Mountain and Intrawest began investing in the Mountain, improving snowmaking capabilities, renovating the mountain lodging and ski facilities. As shown in Table 6, the skier numbers have started to improve. In the 2003/04 season, the Mammoth Mountain Ski Area attracted a total of 1.3 million skiers in Mammoth with an additional 89,500 skiers at June Lake. During the 2003 summer season, as shown in Table 7, Yosemite National Park estimated a total of approximately 3.475 million visitors. These visitors also visit other regional attractions such as Mono Lake, June Lake, and Devils Postpile National Monument. The average summer visitor spends 4.3 nights per visit.39 The Mammoth Lakes Visitor’s Bureau estimates that typical winter visitors to Mammoth Lakes travel in small groups averaging four people. On average, three of the four visitors ski and one person in the group does not. The average winter visitor spends four nights per visit, which usually include a weekend.40
According to the Town of Mammoth Lakes Finance Department, there are over 4,300 rentable rooms in Mammoth Lakes, including hotels, motels, inns, condominiums, bed and breakfast accommodations, cabins, and campgrounds. Occupancy rates in the winter months average 54 percent; occupancy rates in the summer months are on the order of 39 percent. Occupancies in February peak at 56 percent. In the lowest months, May and October, they range from 21 to 26 percent. Occupancy rates, even in the winter months, are low during midweek when compared with the weekends because of the character of the local tourist market. Over 80 percent of the existing market depends on the weekend drive-up tourist or second-home owner from Southern California. As shown in Table 3, an additional 189 units are expected to be added to the market in Mono County and Mammoth Lakes in 2004; 250 units are proposed for 2005; and for 2006 and beyond, an additional 4,964 units are proposed. If built as planned, the number of rentable rooms could double within the foreseeable future. At this time, no definitive date is forecast for completion of proposed projects beyond 2005.41
Mammoth Mountain Visitors Bureau estimates that over 80 percent of the visitors, throughout the year, are from California, primarily southern California—Los Angeles, Orange County, and San Diego. Over 50 percent have household incomes greater than $100,000. The skier profile is slightly different with 97 percent from Southern California in 2002/2003 and only a small percentage from elsewhere, including international tourism from the U.K. It is estimated that Mammoth Mountain captures 2 percent of the total U.S. skier visits. The total number of skiers and snowboarders in the U.S is estimated at 57.3 million.42
Mammoth Mountain ski area has a 24,000 skier maximum daily capacity, which is a factor limiting the potential for increased winter recreation activity.43 Sherwin Bowl, located east of Mammoth Mountain, is the one area of potential mountain expansion. This area is already served by infrastructure, but there is little or no potential for obtaining approval from the U.S. Forest Service for additional development. An Environmental Impact Review was completed in the nearly 1990s with a Record of Decision that was active only through 1998. As a result, the decision has since lapsed. The area could have accommodated an additional 8,000 skiers per day.44
June Lake Ski Area, approximately 30 minutes from Mammoth Mountain, also owned by Mammoth Mountain, sold approximately 89,000 ski passes in 2003-2004 and averages about 800 skiers per day in a busy month and up to 2,750 per day on the busiest weekend of the year,

The SGM Group, Inc. Page 9 5/10/2005
President’s Day. The skier capacity stated in the June Lake Master Plan allows for 4,000 skiers at one time on the Mountain.45 In comparison to Mammoth Mountain, June Mountain generally has greater appeal to families and those learning to ski or snowboard.
Bishop and Inyo County
Bishop
The second of the two incorporated jurisdictions within the study area, the City of Bishop, encompasses approximately 2.5 square miles and is located on the north end of Inyo County, approximately 45 miles south of the Mammoth Yosemite Airport. It is the only incorporated area within Inyo County and, as indicated, a possible location of an additional airport development alternative. The population of Bishop is estimated at 3,630 persons.46 As shown in Table 2, the State of California, Department of Finance, estimates a total of 1,870 housing units with a 9.8 percent vacancy rate. The housing unit mix is broken down as follows: 49 percent single-family units, 31 percent multifamily, and 20 percent mobile homes. Traditionally, only year-round residents have lived in the city, as indicated by the vacancy rates. Recently there has been a new trend towards second-home ownership, and 87 percent of the recent real estate transactions in the city involved sales to second-home buyers for prices exceeding $250,000.47 The city is nearly built-out with only six acres left that are currently vacant and under private ownership. As a result, there is limited opportunity for additional growth within the city limits (Table 8).48
The city has an estimated 820 motel/hotel rooms in 22 properties.49 There are no campgrounds within the city limits.50 The City of Bishop has the largest bed base in Inyo County and is the most developed area of the county. Bishop offers visitors access to many popular camping, fishing, hiking, and winter activity sports that are located in the Bishop Creek Recreation Area. The area is a popular destination for visitors heading to and from Mammoth Lakes during both the summer and winter tourist seasons. The summer season is the busiest season for Bishop, stretching from mid-March through the end of November.51 Tourism is estimated to represent 25 percent of the local economy.52 The City of Bishop’s labor-force is estimated at 1,210 employees with a current unemployment rate of approximately 5.3 percent.53 Commercial development is concentrated primarily along Main Street with a new K-Mart Shopping Center that was built in 2000. The center includes a 105,300 square foot K-Mart store and a 5,500 square foot Von’s grocery store. Distribution of development space is shown in Table 9. The City of Bishop’s economy has been steady over the past several years primarily relying on summer tourist recreation trade and the winter tourism spillover from Mammoth Lakes. Lodging is more affordable in Bishop, with significantly less snowfall than Mammoth Lakes. As a result, the city can serve as an alternative overnight location for winter vacationers.54
Inyo County
The total land area of Inyo County is approximately 10,140 square miles. Approximately 98.1 percent of this land is in public ownership, with the federal government holding most of this land. The extent of public ownership has important implications for land use regulation in the county, because the amount of private land available for development is less than 2 percent of the total county area. As indicated, the City of Bishop is the only incorporated city in Inyo County. The population estimates for the county (including the City of Bishop) as of January 2004, prepared by the State of California, Department of Finance was 18,515 (Table 2). This total represents a 1.2 percent growth over the population in 1990, which was estimated at 18,280 persons.55 A significant percentage of this population growth is in the 65 and over age group bracket. The county estimates that the overall population of Inyo County will reach 20,700 by 2020.56
Inyo County offers potential for absorption of spillover growth and development from Mono County; however, the majority of buildable private land in Inyo County is already developed.57 Many of the remaining vacant parcels are owned either by government entities or characterized by infrastructure and/or environmental constraints that preclude their development. Given these constraints, the rate of housing growth has been minimal in Inyo County in recent years. In 1980,

The SGM Group, Inc. Page 10 5/10/2005
Inyo County had a housing stock of 8,480 units, which increased to 8,710 units in 1990 and 9,150 in 2004. 58 59 This growth represents a 2.7 percent increase since 1980, and a 5.15 percent increase from 1990 to 2004. Generally, housing is concentrated in the City of Bishop, which represents 20 percent of the total housing stock, and in communities that parallel Highway 395. Most of the growth has occurred adjacent to the City of Bishop and in the Starlite Estates and Mustang Mesa communities.60 As shown in Table 3, Inyo County has three new residential developments planned with a total of 370 units. All of the new proposed development is single-family homes in subdivisions, with prices ranging from about $300,000 to $1 million. The recent influx of homebuyers in Inyo County includes young retirees from the Los Angeles/Southern California area. As a result, housing prices have been increasing, especially in the areas located between Bishop and the Mono County line.61
The overall vacancy rate in the county is estimated at just below 15 percent, which is attributed to that portion of the market serving primarily as second homes, additional recreational-oriented units, and company–owned and not rented to the general public (i.e. LADWP-owned houses).62
Commercial/industrial development in Inyo County as shown in Table 9 has averaged an annual growth rate of 50,000 square feet over the last five years (excluding the 165,800 square foot K-mart retail center). Much of this is growth is attributed to additional small businesses serving the local community. This growth is expected to continue at a steady pace in parallel to local residential population growth. There has been no significant overnight accommodation development since the year 2000.
Employment in Inyo County is dependent on the services sector. Approximately 44 percent of the employees in the county are employed by the services sector. The next largest category is retail trade at 21 percent and public administration with approximately 15 percent of the total. Most of the county employers are small enterprises, with an average of 9 employees per business.63 Most of the employers serve the local market. Tourism-related employment is the growth sector in Inyo County. Despite the slow population growth, Inyo County has maintained a stable economy in the local serving retail and commercial sector with a strong base of retirees (Figures 6 and 7).64
Inyo County Tourism
As a tourism area, Inyo County is rich in history, culture, nature-related, and recreational opportunities. A county of wide open spaces, Inyo has the most unique elevation range—from 282 feet below sea level located at Badwater in Death Valley National Park, to the highest point in the 48 contiguous states at Mt. Whitney at 14,497 feet. Death Valley is the largest National Park in the 48 states, with almost 3 million acres of desert wilderness. Because of the variation of topography and seasons, tourist visitation levels fluctuate for each geographic region within Inyo County. In general, the tourist season stretches from May through September when occupancy rates countywide exceed 90 percent. During the winter months, October through April, occupancy rates are about 30 percent.65 Summer and spring are the peak seasons for the area from Lone Pine to Bishop, the southern end of the county, along Highway 395; however, summer is Death Valley’s lowest tourist season, except for international visitors. Throughout the county, international visitors are highest in the summer. Conversely, while the winter months are not very busy along Highway 395, it is the busiest season for Death Valley.66
The majority of county visitors are from Southern California, primarily from Los Angeles, San Diego, and Orange County.67 Death Valley, however, attracts more visitors from Las Vegas and from international locations. The City of Bishop attracts more tourists from Reno, Nevada. The Coalition of County Chambers of Commerce of Inyo County estimates that over 1 million visitors, domestic and international drive along Highway 395 on route to Southern California, Las Vegas, Reno, and other areas, passing through the communities located in Inyo County. Inyo County’s visitation peaks in the summer months, and the majority of summer visitors stay in Inyo County for an average of 1 to 3 nights.68

The SGM Group, Inc. Page 11 5/10/2005
Inyo County and the City of Bishop have experienced limited growth over the last two decades as a result of the scarcity of developable land, yet these areas have maintained a strong seasonal tourism base and a stable retail/commercial core. The growth that has occurred in Inyo County has primarily resulted from spillover in demand originating in the Mammoth Lakes market.
Study Area Economic Profile
This section of the existing conditions analysis examines economic characteristics of each of the two counties. Using current employment distribution for each county, it is possible to apply input-output models to determine current levels of economic output on a county-by-county basis. Economic output is measured in terms of value added, total output, labor income, and related tax generation.69
The discussion that follows describes relative strengths and weaknesses of individual economic sectors, and their importance to the future growth and development in the counties. In addition, the baseline information is indicative of the potential qualitative impacts of proposed airport improvements in the long-term, helping to identify and understand what elements of the economy could experience primary economic impacts. Tourism is the major industry in the region, but there is no single economic sector identified as the “tourism industry” sector. As a result, discussions of economic activity related to tourism aggregate data from several separate sectors, including accommodation and food services; retail services; arts, entertainment and recreation; and portions of other sectors.
Table 10 summarizes the latest available data for Mono County including overall expenditure data and sector-by-sector values reflecting countywide economic activity. Data on structural matrices, the factors that measure the interaction among local economic sectors and the surrounding region, lag behind other available information. Therefore, this analysis of economic value is limited to 2001 sector interaction information, although employment information, as reported in previous tables, is available through early 2004. The information provided should be viewed as a snapshot of the value of local economic conditions as last measured. Because of limited availability of current data, measures of economic output build on the last year collected. In terms of required data for use of the input-output model available for this analysis, the latest available date for required transaction coefficients was 2001. As a result, information from that year was used in estimating relative economic output for the two counties. Although this structural matrix data is several years old, it remains illustrative of the relative strengths and weaknesses of individual economic sectors and how those strengths and weaknesses differ between the two counties as relevant transaction coefficients change slowly over time.
In 2001, an employment base of 9,500 in Mono County generated overall productivity equal to nearly $603 million. Total employee compensation exceeded $208 million, with value added on the order of $384 million. Table 11 and Figure 8 illustrate the percentage distribution by economic sector for Mono County in 2001, showing the dominance of the resort-based industry. For example, the real estate sector captured nearly 9.5 percent of the employment but nearly 15.5 percent of the total industry output and over 17.2 percent of value added for the county. The accommodations and food services sector added an additional 27 percent of the employment, nearly 23 percent of the industry output, and just over 21 percent of value added. The strength of the government sector is also evident, with nearly 19 percent of the employment, nearly 38 percent of the employee compensation, and over 29 percent of the value added. The high percentage of value added and employee compensation components of the county’s economy follows from the earlier information that average wages in the government sector are significantly greater than those in other dominant sectors of the local economy. Together, the four primary sectors of the Mono County economy—real estate, accommodation and food services, government, and retail trade—account for nearly 67 percent of the total county employment and more than 75 percent of the total value added. Figures 6 through 11 graphically illustrate the data contained in the relevant two tables.

The SGM Group, Inc. Page 12 5/10/2005
Similar data for Inyo County is shown in Tables 12 and 13 and illustrated in Figures 12 through 15. Inyo County, with a 2001 employment base of 10,328, generated total industry output of nearly $685 million, employee compensation of just over $240 million, and value added of nearly $398 million.70 When compared with Mono County, however, the distribution among economic sectors is significantly different. In Inyo County, the real estate sector captured only 2.8 percent of industrial output with an employment base of just over 3 percent. Retail trade captured just over 9.6 percent of industry output from 13.5 percent of employment—the result of relatively low wages when compared to other dominant sectors of the local economy. The government sector accounted for over 28 percent of the total industry output from nearly 26 percent of the employment, generating over 45 percent of local employee compensation. In contrast to Mono County, the same four sectors for Inyo County, retail trade, real estate, accommodation and food services, and government, account for nearly 58 percent of the total employment and nearly 63 percent of the total value added; however, the dominance shifts to government and retail trade as the primary contributors.
In general, Mono County demonstrates stronger resort economy characteristics, reinforcing conclusions drawn from data contained in the previous set of tables and figures. A comparison of outputs for the two counties is shown in Figures 16 through 18.
As shown in Table 14 and Figure 19, annual full- and part-time employment for the two-county impact area has grown from 17,057 in 1990 to approximately 21,057 in 2004.71 During the same period, population has grown from 28,398 in 1990 to nearly 31,800 in 2004. Employment growth has averaged just over 1.5 percent annually during this 14-year period; population growth only 0.81 percent. In this summary, population is resident population in the two counties; employment is an annual average of full- and part-time employment.
Summary—Existing Conditions
The existing conditions analysis provides a picture of past development trends and examines future demand for growth and development in the two-county region. The majority of the expanded growth in the region has occurred since 1996 when Intrawest Corporation purchased a 60 percent interest in Mammoth and June Mountains along with the developable real estate. Development in Mammoth of three new village areas (The Village at Mammoth, Sierra Star, and Juniper Springs) brought a new character to the resort, different in nature, at a price that the area had not previously seen.
This new development, both residential and commercial, is luxury in character and links Mammoth’s commercial /residential area to the ski resort in a manner similar to that of the nation’s other premier winter resorts. At the same time, Intrawest Corporation and Mammoth Mountain upgraded the ski area’s lodging facilities and the ski operations. This development has helped to change the character of the ski area.
Two new golf courses and a variety of summer programs have helped to expand the summer season in Mammoth, contributing to a growing effort to make this area a four-season resort. The increased pace of development in Mammoth Lakes has spilled over to neighboring Inyo County, which is also dependent on the tourism industry, albeit summer rather than winter visitation. This expansion can be documented in Inyo County in the form of stabilizing the tourism base, creating a more attractive environment for year-round young retirees and summer tourism.
This region continues to draw approximately 83 percent of its visitors from Southern California in the winter and 94 percent in the summer.72 Most of the visitation is extended weekend stay, averaging approximately 4 days.
Future development is limited in both Inyo and Mono Counties by land ownership. The majority of the remaining land is publicly owned, either by the U.S. Forest Service or the Bureau of Land Management. The majority of private land within the counties is concentrated in community areas, with the remainder dispersed through the counties in small parcels. Those parcels of

The SGM Group, Inc. Page 13 5/10/2005
private land that may be large enough for development are in many cases agricultural lands that are not available for development. As a result, opportunities for additional growth and development in this two-county area are constrained.
The next phase of the economic impact study is designed to demonstrate a potential link between changes in accessibility in a resort economy and potential change in the employment base represented by the existing conditions evaluation. This step involves case studies of similar resort communities that already have airport access. Development activity in similar environments with commercial air service can possibly be used to demonstrate a link between change in access, measured by change in number of passenger enplanements, and overall economic conditions. Similar experience in comparable resort communities can provide a basis on which to measure potential change in the Mammoth Lakes region, and the next section of the economic impact analysis examines applicable case study areas. Based on that examination, forecasting models are derived to measure the link between airport accessibility and regional employment conditions.
The SGM Group, Inc. Page 14 5/10/2005
III: Case Studies—Economic Impact Analysis Introduction
Measuring the long-term economic impacts of airport accessibility on resort communities differs from that of traditional urban economics. In more traditional regional economies, airport activity results from changing demand for accessibility into the area to serve the requirements of an existing economic activity center. The greater the employment base and the broader the market served, the greater the demand for improved transportation access.
In a ski resort community, the situation is generally reversed. The economy is based on a concentration of activities that result from patrons or visitors coming to the area in response to special attractions. The level of resulting employment is therefore a function of the level of visitation coupled with the required employment base to serve that level of visitation. As a result, in contrast to a more traditional urban environment, employment is the dependent factor while the number of visitors coming to the community is primarily an independent factor. Increasing the number of visitors, as measured in this case by one component of that visitation, the number of enplanements increases the demand for employees in the service- and accommodations-based based economy.
This section of the analysis describes characteristics of airport-related growth and development based on a review and analysis of four case-study airports, and the link between changes in airport access and economic activity. The paragraphs that follow include a summary of airline operations and enplanement data relating to airports operating in a manner comparable to proposed future operations at Mammoth Yosemite Airport. Because of the lack of past history with respect to localized impacts of improvements in airport-based access in the Mammoth Lakes region, the use of case-study examples is important to the derivation of a model linking changes in capacity and activity with changes in tourism demand in the region. A selective review of similar case-study examples is therefore necessary to establish statistical relationships between changes in airport activity and changes in levels of tourism and related employment.
Initially, three of the four case-study airports were selected based on the updated Ricondo & Associates, “Forecasts of Aviation Demand Final Report, Mammoth Yosemite Airport, May 2004.” The intent of the selection process was to develop a cross section of facilities with commercial air service that have characteristics similar to the Mammoth region, including national caliber skiing, a winter and summer tourism base, elevation (geographic and topographic terrain), remote location (far from a major metropolitan area and therefore, airport), and access and regional demographic information including tourism-based employment. The initial locations selected were then refined in the course of our study based on interviews with Mammoth Mountain, ski resort developers, and other ski areas. The case study airports were intended to be those airports with existing regional and commercial air service that exhibit similar characteristics to what is expected to occur at the improved facility proposed for Mammoth Yosemite airport. The following four airports were ultimately considered:
• Telluride and Montrose Regional Airports (considered as a pair), Colorado;
• Aspen-Pitkin County Airport, Colorado;
• Eagle County Regional Airport (Vail), Colorado; and
• Jackson Hole Airport, Wyoming.
These case study areas were chosen because of the similarities of their regions to the Mammoth Lakes area and because of the availability of data to support an analysis of the relationship of air service to economic development over time. Telluride is a relatively remote location served by two regional airports. The other three case study examples were originally referenced in the Ricondo study. Summary characteristics for each of these airports are shown in Table 15.

The SGM Group, Inc. Page 15 5/10/2005
Three other airports were initially considered but not selected, based on regional differences compared to the Mammoth Lakes region or because of information constraints: Yampa Valley Regional Airport in Hayden, Colorado, serving Steamboat Springs; Glacier Park International Airport in Kalispell, Montana, serving Big Mountain ski area and Glacier National Park; and Whistler/ Blackcomb Ski Resort in Vancouver, Canada. Yampa Valley Regional Airport was not selected, as the airport is located only three hours from the Denver metropolitan area and within two hours of the Eagle County Regional Airport and Aspen-Pitkin Airport. Given the proximity and level of service provided at Denver, these airports likely serve some ski visitors traveling to the Yampa Valley/Steamboat Springs area. In addition, Yampa Valley Regional just began service during the summer in the summer of 2002, so there was little trend data to evaluate.
Glacier Park International Airport in Kalispell, Montana, also was not selected because of a lack of sufficient economic development data and a lack of data on local economic conditions. Data is apparently not collected on a local basis for Flathead County where the airport is located. Demographic data is only available through the 2000 U.S. Census and State of Montana, and there are no current published figures. Local development data, for Flathead County, such as sewer data also was not available, as most of the county is on septic tanks or drain fields and the county has no uniform building code. 73 In addition, the ski area, Big Mountain, is primarily a local mountain and not considered the same national caliber as Mammoth Lakes in terms of snow conditions and/or terrain. Big Mountain estimates approximately 500,000 skiers per year but comparable data for a series of years was not available.74 Based on the lack of baseline economic conditions data and limited resort comparability, Glacier Park International Airport was not selected as a case study.
Whistler/Backcomb Ski Resort, located in British Columbia, is served by Vancouver International Airport approximately 10 miles from downtown Vancouver and 45 minutes from the ski area. While the ski area is comparable to the Mammoth Lakes area, the airport is a large international facility with daily jet service to Asia, Europe, and Mexico City, not comparable in size to the proposed expansion at Mammoth Yosemite airport. The Vancouver metropolitan area has over 2.1 million people. This airport was ruled out as a case study facility based on both airport size and regional population base.
The case studies selected offer the possibility of examining long-term effects of airport accessibility over time on an average annual basis by studying the historic changes in the relationship between regional employment and airport enplanements for the selected case study examples. In this approach, it is possible to test the existence of a statistical relationship between airport activity as measured by the number of enplanements and overall average annual employment as a function of several factors. Additional factors are chosen on the basis of data availability as well as relationship to levels of activity at a specific resort community, and these other factors can include, for example, visits to national parks, skier days, retail expenditures, and tax receipts. In the long-term, a demonstrated link between changes in airport activity and levels of employment provides a basis for measuring the change in economic value linked to airport accessibility. This analytical approach is used in the long-term economic impact analysis section. The results of this long-term analysis encompass any intrinsic change in value associated with improved seasonal variations when measured on an annual average basis.
The methodology used to forecast the potential impact of the proposed airport improvement project is based on derivation of multi-variable linear regression models. These models are used to forecast future employment as a function of related historic characteristics and trends. As part of this process, two different approaches were used. The first involved preparation of employment forecast models for each of the case study airports, using annual data comparable among the four. Tables 16 through 21 represent the test models for each of the selected case study areas. In all of the models, “Total Employment” includes full- and part-time employment as reported by BEA (Bureau of Economic Analysis, US Department of Commerce), and population is resident (not visitor) population in the county jurisdiction in which the airport is located. For each location, the applicable jurisdiction is defined.75

The SGM Group, Inc. Page 16 5/10/2005
Economic value is measured in terms of change in value-added, total output, taxes, employee compensation, and labor income, all based on changes in employment as well as other factors. Additional impacts include an evaluation of potential changes in fiscal effects. Economic impacts in these categories are addressed in other sections of the document. Definitions for each factor appear at the end of the impact analysis text. From the perspective of the Town of Mammoth Lakes and the long-term General Plan, increased accessibility to the area provides a potential tool or mechanism to enhance marketability. Marketing the area is a qualitative effort; however, improving accessibility has the potential to help improve the ability to enhance that effort over time.
Economic Impacts of Airport Accessibility
Out of the group of case study locations initially considered, four specific locations were ultimately used to derive statistical models. The four case study areas used in the initial statistical modeling effort included the following:
• Telluride and Montrose Regional Airports,
• Eagle County Regional Airport (Vail),
• Aspen/Pitkin County Airport, and
• Jackson Hole Airport (Wyoming).
Each of these airports serves a mountain-resort area centered on skiing in the winter and additional national park visitation or other summer attractions.76
Telluride Regional Airport
Telluride is the county seat of San Miguel County, Colorado, located on the southern half of the Western Slope of the Rocky Mountains. It is surrounded by public land, and lies in a box canyon with one access road. Until the 1970s it was relatively undeveloped. As resort development began, real estate prices started to increase.77 Uranium mines, which were the base of the economy, continued to operate well into the 1980s. In the 1990s small-acreage “ranchette” development began, and the tourism industry began to take over mining and agriculture as the driving economic force. Telluride is located seven hours from Denver, six hours from Colorado Springs, and two hours from Durango, Colorado.78
Telluride markets itself as two towns in one: Telluride and Mountain Village. These two towns are a 12-minute gondola ride from each other. Telluride is nestled at the base of Telluride Ski Mountain (8,750 feet), surrounded by 13,000-foot peaks. The town is less than one mile long, so all accommodations are located within a short walk to Main Street, shops and restaurants, or to the two ski lifts and the year-round gondola accessing the Mountain. The valley floor and Town Park are popular with cross-country skiers. Town Park also has an ice-skating rink and a sledding hill. Telluride was ranked as one of the top ten ski resorts in North America by “SKI” and “Skiing.” 79 The resort town has a full-time population of approximately 1,985. In peak tourist season the population of the town can reach over 10,000.80
The European-style Mountain Village is at an elevation of 9,450 feet; it is the center of skiing operations and the ski school. The 92-acre Village offers slope-side accommodations where skiers can ski in-and-out of the lodging complex, and reach lift ticket windows, equipment rental facilities, restaurants and shops as well as cross-country and snowshoeing trails. The Village is also a summer resort with an 18-hole golf course and 3,000 acres of National Forest for hiking and biking.81
Two airports serve Telluride: Telluride Regional Airport (FAA location identifier TEX) in San Miguel County, Colorado; and Montrose Regional Airport (FAA location identifier MTJ) in

The SGM Group, Inc. Page 17 5/10/2005
Montrose County, Colorado. Montrose Airport is located approximately 70 miles to the northeast. The choice of including Montrose Regional Airport as part of the analysis is a result of changing agreements among the airports and the airline companies providing service. Airline guarantee programs are currently focused on providing jet service at Montrose. As a result, the number of enplanements at Telluride has recently declined while service at Montrose has increased.82
Montrose Regional Airport facility covers approximately 1,137 acres at an elevation of 5,759 feet. It is served by a single 7,500 by 100 foot runway. Skywest and Continental Airlines provide commercial air service, with daily service to and from Denver (Skywest) and Houston (Continental). There are approximately 11 flights per day departing and arriving. The airport currently experiences approximately 70,000 enplanements per year, of which nearly 40 percent are air-carrier based and 60 percent commuter-service based.
The Telluride Regional Airport encompasses over 540 acres at an elevation just under 9,100 feet. It is a publicly owned airport served by a single-asphalt runway that is 6,870 feet long by 100 feet wide, which accommodates small regional jets.83 It is located approximately ten minutes from the Town of Telluride and the neighboring ski resort town of Mountain Village. At the top of Deep Creek Mesa, it is North America’s highest commercial airport, 9,078 feet above sea level. The airport maintains operations 365 days per year. The airport was built in 1985, initially without any commercial service. It attracted commercial air service beginning in 1991, and by 1992 it offered 21 commercial flights per day. In 1995 air service peaked with 42,500 enplanements with 65 percent on commercial flights and the remainder on general aviation carriers. In 1994-1995, Continental Airlines, the major carrier in and out of Telluride, cancelled service out of all airports west of the Mississippi, which resulted in several years of declining airline enplanements. In 2003 there were an estimated 30,500 enplanements, of which 51 percent were related to commercial service.84 Telluride Regional Airport enplanements are shown in Table 16 and indicate the trends since 1993 when commercial air service was securely established. According to the Telluride Airport manager, the declining trend can be attributed to three factors: First, the runway capability is limited to D-III, which restricts the type of aircraft flying into the facility; second, as indicated, the community’s airline guarantee program is directed to securing jet service into Montrose Airport, resulting in a loss of service to that facility; and third, general aviation traffic has shifted to larger private jets servicing an influx in second home owners from Texas.85
Telluride Regional Airport offers daily air access from two cities: Denver and Phoenix. There are daily flights from Phoenix on America West Express and from Denver on Great Lakes Airlines. America West flies 19-seat Beechcraft 1900 aircraft and Great Lakes Airlines flies 37-seat deHavilland-8 propeller jets.86
According to the Telluride Airport Authority, the enplanement figures for the summer and winter are approximately the same. The largest originating tourist markets served include New York, Dallas, and Atlanta via the nearby airport, Montrose, and through Denver with connections to Telluride. Since 1995, the airport has relied heavily on General Aviation and private jets as this resort community serves as a second-home market to patrons from Texas. In 1994, 35 percent of the enplanements were general aviation. By contrast, in 2003, 49 percent of the enplanements were via private planes. This shift in enplanements indicated growth of the tourism industry and the second home market in Telluride despite a decline in commercial air service.
In the past, in order to sustain commercial service to the area, the Town of Telluride and Mountain Village have requested a volunteer tax from local businesses and the ski resort. This volunteer tax has generated $2 to $3 million to help subsidize air service. This year an excise tax of 2 percent has been imposed on local businesses to help improve the overall subsidy.87
Although the Town has not calculated the number of tourists that visit the area annually, the best measure used over the years is that provided by the ski resort. According to their estimates, the area generates approximately one million tourists per year. This number is derived from the number of ski passes sold in the winter, occupancy rates in the Town, and use of the summer

The SGM Group, Inc. Page 18 5/10/2005
recreation facilities. According to the Telluride Visitor’s information Center, summer tourism has begun to rival winter tourism in the Telluride area, despite the additional winter air service. The town has created a strong arts community that balances the ski industry in the summer. 88
As shown in Table 16, skier days in the winter have increased from 300,400 in 1993 to 367,800 in 2003, a 22 percent increase over an 11-year period. The peak year was 1998 with 382,500 skier days. In the summer, the Town of Telluride and the Town of Mountain Village host a variety of festivals, each of which draw between 3,000 and 6,000 visitors to the area. The Blue Grass Festival (6,000 people), the Jazz Festival (3,000 people), and a film festival (6,000 people) are major attractions. Summer visitors are primarily from Colorado, Texas, and Arizona. The majority of winter visitors are from Texas—primarily from the Houston and Dallas areas.89
Occupancy rates for the Town, from 1997 to the 2003 as shown in Table 16, were provided by the Telluride Visitor’s Center. These rates indicate that average annual occupancy ranges between 30 and 39 percent. Winter occupancy rates are higher and range from 43 percent to 59 percent, on average. February and March are traditionally the busiest months. Summer occupancy rates are between 36 percent and 45 percent with July and August the peak months. The average stay in the area is 4 days. Monthly data provided by the Visitors Information Center indicate that the shoulder seasons occur in April and May and again in October and November with occupancy rates during those months hovering between 10 and 20 percent historically.90 According to the Visitors Information Center, the key to sustaining the current level of occupancy and improving rates in the shoulder seasons is improved marketing for the two conference hotels in Telluride and Mountain Village, which together can accommodate approximately 500 people.
Table 16 indicates population and employment for the three counties that include the two airports serving Telluride: San Miguel, Montrose, and Ouray Counties. Telluride Regional Airport is located in San Miguel County; Montrose Regional Airport is located in Montrose County, and Ouray County covers the intervening area. Over the last decade this area has experienced steady growth as the employment base has shifted from mining to tourism. The population of the three-county area was nearly 46,500 in 2002 with an employment base of 30,897 (the last reported year).91
The Town of Telluride considers a regional airport providing service to the area essential to maintaining the tourism base, particularly because of its dependence on the Texas second-home market. The Town, as most resort communities, experiences seasonal market variations in occupancy rates. Attempts to minimize seasonal variation have concentrated on marketing efforts to expand and lengthen the summer season through summer arts and music programs and festivals, and by encouraging convention business using available meeting and convention facilities in the shoulder seasons. Over the past three decades, despite a decline in commercial air service, this community has moved successfully from a mining-based economy to a tourism-based economy.
Data available and selected for the Telluride/Montrose employment forecast model includes the following:
• Total annual employment—San Miguel, Montrose, and Ouray Counties,
• Population—San Miguel, Montrose, and Ouray Counties,
• Sales and Use Tax—San Miguel, Montrose, and Ouray Counties,
• Skier Days at Telluride, and
• Number of Enplanements—Telluride and Montrose Regional Airports.
County-level employment data is available from the Bureau of Economic Analysis of the US Department of Commerce, but is currently available only through 2002.92 Population data, for the sake of annual consistency, was also provided through BEA. Sales and Use Tax data was

The SGM Group, Inc. Page 19 5/10/2005
available from the Department of Local Affairs (DoLA) for the State of Colorado, but only through 2001.93 The number of skiers was available through the 2003/2004 season from Colorado Ski Country USA.94 Output of the model is shown in Table 17 and Figure 20.
Two sources were used to evaluate the number of enplanements for the two airports, including FAA TAF forecasts95 and additional information provided by the Telluride Airport Manager.96 Enplanement data provided by the airport manager had the advantage of including passengers on general aviation service, information not usually available. The resulting statistical models were tested using both sources, with more consistent results attributed to the combined FAA-TAF enplanement data for the two airports.
Data available for the evaluation is shown in Table 16. Several variations of linear regression models were tested, but as it turned out, including population generated an unacceptable coefficient for number of skiers. The final linear regression model relies on measuring total employment as a function of sales and use tax, number of ski visits, and enplanements.
)*01095.0()*01696.0()/*004028.0(
tsenplanemenskierdaysUseTaxSalesymentTotalEmplo ++=
The full output of the Telluride regression model is shown in Table 17 and Figure 20, including the relevant statistical factors and the fit of the forecast output. For the purposes of this analysis, the critical output is the coefficient for enplanements, indicating a statistical link between number of boarding passengers and total three-county employment.
For the reported years, the enplanement contribution to overall full- and part-time employment in the three-county area averaged between 12 and 15 percent; i.e. for this model approximately 12.7 percent of the total three-county employment is statistically linked to the number of annual enplanements at the two airports. As a result, an increase in the number of visitors to the resort community increases demands on the local and regional service sector employment as well as other economic sectors to a lesser extent, and airport access contributes to that increase.
Eagle County Regional Airport (Vail)
The Town of Vail is located in Eagle County in west central Colorado, 120 miles west of Denver. It is surrounded by the White River National Forest; Interstate 70 is the major transportation corridor east to Denver and west to Grand Junction.
The history of Vail as a ski resort began with the 1939 construction of Highway 6 from Denver through the Gore Valley. During World War II, the Army’s Tenth Mountain Division used the Vail area for backcountry survival training. After the war, several of the men who trained there were drawn back to the mountain valleys for the recreational lifestyle it offers. The veterans, teaming up with a uranium prospector drew up a plan for the ski resort. The plan was successful, and construction of the ski area began in 1962. By winter 1965, the Town of Vail was incorporated. Vail Mountain had the first gondola in the United States, along with two double chairlifts and a beginner poma lift, serving six square miles of terrain. Supporting retail opened soon after.97 Over the last four decades, Vail has been on a quest to become “the premier mountain resort community in North America.”98
Vail Resorts Development Company and the Town of Vail recently launched the first of several projects as part of a project called Vail’s New Dawn.99 This $500 million redevelopment program is an attempt to fulfill the goal of becoming the premier mountain resort community in North America. Over the past 10 years, Vail Resorts has invested over $125 million in improvements to the Mountain. Additional plans call for new skier service facilities, additional shopping, dining and lodging, a new ice skating rink, entertainment venue, enhanced streetscapes.

The SGM Group, Inc. Page 20 5/10/2005
Vail marketing efforts describe a resort designed to combine the facilities of an alpine resort with a small-town commercial and residential environment. The Vail area offers a variety of recreational opportunities with 1,100 acres of open space, 350,000 acres of national forest, 5,290 ski-able acres, 15 miles of recreational paths, an outdoor amphitheater, and the highest botanical gardens in the world.100 In 2002, the population of the Town of Vail was 4,500 and the surrounding county is 44,970 (Table 18).
Total county employment and population are growing steadily as shown in Table 18. Vail Mountain is the largest employer for the county. Since 1993, overall employment in the county has grown from 24,200 to 39,100, which represents a steady annual average increase of 6 percent. This growth can be attributed to the efforts put forth by the Vail Resorts Development Company and the Town of Vail to improve the ski area and related winter activities. In addition, Vail has attempted to attract the non-skier in the winter offering a variety of retail shops and a lively town environment. Summer activities are marketed to include hiking and mountain biking.
The figures in Table 18 related to sales and use tax also reflect the area’s steady growth. The collected sales and use tax has increased from $6.6 m to $14.6m over a ten year period. This growth rate of 12 percent per year is a reflection of the successful retail environment and the strong second home market provided by the town and the county.101 102 Local officials estimate that as much as 75 percent of the Town of Vail housing stock is second homes.103
There are seven ski resorts located in the Vail area: Arapahoe Basin, Beaver Creek, Breckenridge, Copper Mountain, Keystone, Vail, and Ski Cooper. Combined, the number of skier days at these resorts has increased from 5.5 million in 1993 to 6.2 million in 2002, as shown in Table18. This growth pattern has been steady over the last decade averaging an annual average growth rate of 1.3 percent. These seven resorts provide 115 ski lifts, 780 ski trails, and 13,341 ski-able acres.104 Vail, Beaver Creek, Breckenridge, Keystone and Heavenly are marketed together under the PEAKS Discount and reward program.
Eagle County Regional Airport (FAA location identifier EGE) serves this area and is located just 30 minutes west of Vail on Interstate 70. A single 8,000 by 150 foot runway serves the airport, which covers over 630 acres at an elevation just above 6,500 feet.105 Commercial air service began in 1992 with approximately 35,000 enplanements.106 One year later, in 1993, as shown in Table 18, the airport experienced a 50 percent growth in enplanements, increasing to 53,000 passengers. The airport has continued to experience steady growth since then and served 163,900 passengers in 2002. This change represents an average annual growth rate of 16.7 percent. In 2000 air passengers peaked at 183,500.
Eagle County Regional Airport offers non-stop service from 13 major cities across the country on six of the largest domestic airlines with 757-jet service.107 In the winter, American, Continental, Delta, Northwest, and U.S. Airways provide non-stop jet service between EGE and major U.S. cities, including Atlanta, Charlotte, Chicago, Cincinnati, Dallas, Denver, Houston, Los Angeles, Miami, Minneapolis, New York, Newark, and Philadelphia. In the summer, United Airlines flies daily, non-stop B-757 to Denver, and American Airlines flies daily non-stop to Dallas. The New York/New Jersey, Illinois, and Texas markets are the strongest markets for the airport.108 The Vail area is a large second home market to visitors with primary residence in Texas.
The Vail/Eagle County Airport has traditionally served the winter ski market; however, enplanement figures in the summer months have increased considerably over the years because of flight guarantees and incentives to increase enplanement figures during the summer season. The Vail/Eagle County Airport has also continued to improve as part of the regional upgrading. The airport opened a new passenger terminal in 1996. Improvements in 2003 and 2004 included a new control tower taxiway improvement overlay, installation of T/W lighting, new navigational aid systems to improve access into Eagle County Airport during inclement weather.109 The facilities for private aircraft are offered through the Vail Valley Jet Center, which has seven acres of ramp parking and over 110,000 square feet of hanger space. The jet center offers catering

The SGM Group, Inc. Page 21 5/10/2005
services, flight planning assistance, aircraft maintenance and cleaning, and full concierge services.110
The Vail/Eagle County area has recognized the need to be proactive to maintain their position as a premier national resort community. The efforts by the Town of Vail and Vail Resorts Development Company in the last decade to improve the resort community and infuse $500 million phased over several decades indicate a local awareness of the competitive nature of the winter ski market. Attempts to upgrade the ski facility, to link the regional ski areas together and market them as a package, along with subsidizing air service in the slower months indicate a local, focused effort to maintain Vail’s national position as a successful mountain resort. The data displayed in Table 18 and the local interviews support the conclusion that, despite a competitive recreation market, the Vail region has maintained its market share in the last decade, with a strong steady growth in the numbers of skiers, enplanements, sales and use tax, and employment base. Market share has remained in an environment where three other commercial airports serve the broader competing region: Yampa Valley Regional Airport (85 miles), Aspen (100 miles), and Denver International Airport (110 miles).
In contrast to Telluride, which is developing a year round tourist market, with arts and festivals in the summer and small conventions in the shoulder seasons to balance the winter season; Vail is improving the existing infrastructure: the Mountain, the airport and the retail/ non-skier market to continue to bill itself as the premier U.S. mountain resort.
Data available for the Eagle County Regional Airport employment forecast model includes the following:
• Total annual employment—Eagle County,
• Population—Eagle County,
• Sales and Use Tax—Eagle County,
• Skier days at resorts in the Vail region, and
• Number of enplanements.
As with the Telluride study, county-level employment data is available from BEA through 2002. Population is also from BEA, and sales and use tax data was available from DoLA, but only through 2001. The number of skiers was available through the 2003/2004 season from Colorado Country USA, and includes the individual resorts of Arapahoe Basin, Beaver Creek, Breckenridge, Copper Mountain, Keystone, Ski Cooper, and Vail—all of which are within the same region. Data on the number of enplanements is from the FAA Terminal Airport Forecasts System.
Data available for the evaluation is shown in Table 16. As in all case study models, several regression calculations were tested to determine a most reasonable application. In this case, the best-fit linear regression model includes factors relating to population, skier days, and enplanements. The pattern on sales and use tax collections during the evaluation years experienced more than two changes in direction, which resulted in an unreasonable coefficient when included in the model. The final equation selected is the following:
)*04041.0()*00126.0()*564.0( tsenplanemenskierdaysPopulationymentTotalemplo ++=
Output of the Eagle County Regional Airport model is shown in Table 18 and Figure 21, including the relevant statistical factors as well as the fit of the forecast output. In the case of Eagle County, the two most significant contributors to the forecast of total employment are population and enplanements. On average, the enplanements component is statistically responsible for 15.5 percent of the estimated total employment in a given year.

The SGM Group, Inc. Page 22 5/10/2005
Aspen-Pitkin County/Sardy Field
The City of Aspen is located in the west central segment of Colorado’s Rocky Mountain, 220 miles west of Denver via I-70. The Aspen/Pitkin County Airport is located four miles from the City of Aspen and within four to nine miles from each of the Aspen ski areas. Sunlight is located approximately 40 miles away in Glenwood Springs. The Aspen/Pitkin County Airport is one of Colorado’s 13 commercial service airports (there are a total of 79 public use airports in the state) and is the third busiest airport in the state based on enplanements.111 In 2002 there were over 336,000 annual enplanements. The state estimates that over 80 percent of the annual enplanements are visitors to the region.112 These visitors usually pursue recreational interests such as skiing, fishing, hiking, and hunting (Table 19).
The Aspen-Pitkin County Airport (FAA location identifier ASE) began operation in 1946 as a privately-owned facility with a gravel landing strip. The primary user at that time was the Aspen Institute, the forerunner to Aspen Airways. The original facility consisted of a log cabin terminal building and a single gravel runway. In 1956, Aspen Airport Corporation officially deeded the Airport to Pitkin County making it a publicly-owned, public-use airport. In 1958 the airport was officially dedicated as the Aspen/Pitkin County Airport. In 1976 a new 17,500 square foot terminal building was constructed and in 1983 the single runway at Aspen/Pitkin County was lengthened and widened to 7,006 feet long by 100 feet wide with air traffic limited to aircraft with a wingspan of less than 96 feet by county ordinance.113
The terminal area was redeveloped in 1986/87, and included new vehicular access roadways coupled with an expansion of the new terminal to 38,000 square feet.114 The restriction to aircraft with a wingspan of less than 96 feet is the result of a county regulation adopted in the early 1990s. Service into and out of Aspen is limited to smaller commercial aircraft such as the Dash 8, the Avro 85 regional jet and the BAE 146-200/300.115 Winter commercial air service is provided by Air Wisconsin operating as United Express, Mesa Air operating as America West Express, and Mesaba Airlines operating as Northwest Jet Airlink.116 There are 18 flights per day in the winter with an average load factor in 2002/2003 of 63.5 percent.117 Winter load factors over the last 18-years have averaged between 50 and 70 percent.118 During the summer, the number of flights is adjusted based on load factors, but there are generally 10 commercial flights per day.119 There are three other commercial airports located in the surrounding region contributing to regional accessibility: Eagle County Regional Airport (78 miles), Yampa Valley Regional Airport (155 miles), and Denver International Airport (220 miles).120
Enplanement figures shown in Table 19 reflect the passenger history of the airport. Over the last decade, from 1993 to 2002 the number of enplanements has grown from 251,000 to 336,600. This increase represents a 35 percent growth in passenger traffic. The peak year was 2001 when there were 363,700 enplanements. An analysis of the monthly enplanements shows that typically, 35 percent of the annual enplanements are in the winter months—December through March.121 The largest winter markets draw nationally from New York, California, and Texas.122 The recently experienced increase in total enplanements is most likely the result of significant growth in the volume of air taxi (charter) and commuter service. The airport does not track air taxi enplanements. The growth in FAA reported total enplanements is primarily attributed to a significant increase in the category listed as commuter since 2001.
The airport service area encompasses five ski resorts: Aspen Mountain, Snowmass, Buttermilk, Aspen Highlands, and Sunlight ski resorts, totaling 5,240 acres of ski-able terrain.123 Annual skier days for these resorts are shown in Table 19. During the past ten ski seasons, from 1993 to 2003, the 1997/98 ski season experienced the highest level of activity with a total of 1.66 million skiers. Since then the number of skiers using the five resorts overall has declined. In 2003 there were 1.39 million skiers visiting the Aspen area resorts, an annual average decline of 4.5 percent.
Aspen has created an active summer tourist market with a variety of educational as well as recreational activities. The peak summer months occur from late June through late August. The Aspen area hosts the Aspen Music Festival and School, an annual Food and Wine Festival, The

The SGM Group, Inc. Page 23 5/10/2005
Aspen Institute summer series with Executive seminars, and the Aspen Writer’s Foundation offering summer camps and retreats for writers. The Aspen Music Festival, which hosts approximately 100,000 visitors in the summer for a 9-week period from June through August, is internationally renowned and has been running for 55 years.124 Summer recreational activities include golf and tennis, horseback riding, kayaking, yoga camps, and spa treatment facilities. Aspen has created a year-round resort with skiing and winter sports in the winter along with educational classical music and food and wine programs, hiking and golfing in the summer. The city also offers year-round shopping at high-end retail boutiques and day spa centers.
Table 19 shows the sales and use tax figures for the years 1993 to 2003. Sales and use taxes increased from 1993 to 1998, from $11.7 to $17.5 million. Since 1998 there has been a steady decline to pre–1994 figures. The sales and use taxes collected in 2002 totaled $14.1 million. This decline in collections reflects an economy that is in flux, changing to accommodate escalating real estate prices local-serving retailers are moving out of the core downtown area and are being replaced by trendy tourist-serving boutique shops. Total 2002 employment in the county was 21,600, which has been declining since 2000 paralleling a declining local skier market.125
Table 19 illustrates the annual fluctuations in occupancy rates year-round and for the summer and winter seasons. Aspen’s highest occupancy rates were in the “heyday period” during the years 1996-1998. The busiest months were February, March, and August when occupancies ranged between 80 and 90 percent.126 The slowest months were experienced during the shoulder seasons including April, May, and November. For the last three years, average annual occupancies have been on the order of 53 percent, which reflects an overall decline in the tourism industry, both in the winter and summer months. The average summer occupancy rates are between 60 and 70 percent. The average winter occupancy rates generally range between 70 and 80 percent. Coupled with declining occupancy rates, the number of lodging pillows (or beds—the standard measuring for estimated number of visitor accommodations) has also declined since 1995 when there were an estimated 9,400 lodging pillows. In 2000, the area had a low of 7,750 pillows. Currently there are an estimated 8,000 lodging pillows. This trend reflects the lodging unit conversion to rental properties or commercial space.127 The spiraling real estate prices in Aspen and lodging prices have also contributed to the unstable overnight accommodations market in Aspen.128
The City of Aspen and Pitkin County have faced several years of declining tourist-related economic activity attributed to spiraling real estate prices, several difficult ski seasons without sufficient snow, the 9/11 terrorist events, and the general slowdown of the U.S. tourist travel markets.129 The local population has also shifted away from Pitkin County and the City of Aspen, where real estate prices have been increasing, to areas up valley including New Castle, Elk Run, and Blue Lake. As a result, the number of year-round residents in Aspen and Pitkin County has been declining while the number of second-home owners has been increasing. Local public officials estimate that about 50 percent of the residents are second-home owners.130 Pitkin County’s population in 2002 was estimated at 14,900. The City of Aspen has a population of about 5,800. Where employment exceeds population, it is the result of a combination of factors, including commutation from outlying areas and the inclusion of full- and part-time employment. As counted, population only includes year-round population.
The Aspen market profile indicates a booming market occurred in the early 1990s. Since 1997/98, however, this market has been in flux with declining skier visitation numbers, a changing retail environment, and soaring real estate prices. Aspen has been successful in creating a year-round tourism market with a strong arts and cultural center in the summer to complement the winter skier market. Aspen’s economy, however, like many other resorts has been struggling with the need for diversification, changing its economic base from a dependence on a younger skier market and related visitor expenditures to one relying on real estate activity, construction, driven by a growing semi-retired/retired community.131

The SGM Group, Inc. Page 24 5/10/2005
Data available and selected for the Aspen-Pitkin employment forecast model includes the following:
• Total annual employment—Pitkin County,
• Resident population—Pitkin County,
• Sales and use tax—Pitkin County,
• Ski visits—Aspen resort area (includes Aspen Mountain, Aspen Highlands, Buttermilk Mountain, Snowmass, and Sunlight)132, and
• Number of enplanements.
Sources of data are the same as those previously indicated, including enplanements.133 Data available for the evaluation is shown in Table 19. Various regression models were tested, with the model generating the strongest correlation illustrated in Table 20 and Figure 22. In the case of Aspen-Pitkin, a negative coefficient for the number of skier days is consistent with the data, given the pattern of decline over the past several years. The last two years, including the 2003-2004 season, have begun to indicate a slight increase in the level of activity in general, but not in those facilities closest to the town of Aspen. The final regression model forecasting total employment as a function of chosen variables includes population, sales and use tax, ski visits, and enplanements.
)*00243.0()*00326.0()/*000115.0()*5709.1(
tsenplanemenskierdaysUseTaxSalesPopulationymentTotalemplo
+−+=
Using this model, the enplanements component contribution for Aspen-Pitkin is significantly less than that compiled for both Telluride and Eagle County. As a result, the percentage employment benefit linked to changes in the number of enplanements is on the order of 3 percent over the past 5 years.
Jackson Hole Airport
Jackson Hole Airport is located in northwest Wyoming, in Grand Teton National Park about 10 miles from the City of Jackson. Nearby attractions include Grand Teton and Yellowstone National Parks, Bridger-Teton and Caribou/Targhee National Forests, Gros Ventre, and Jedediah Smith Wilderness areas and the Snake River. Ski resorts in the area include Snow King, Jackson Hole Mountain Resort, and Grand Targhee Summer and Ski Resort. The Jackson Hole area has two distinct seasonal attractions: skiing and winter sports in three resorts in the winter; and two national parks, Grand Teton and Yellowstone, in the summer. This area has traditionally been dominated by summer tourism as the two national parks provide a large summer attraction. Yellowstone Park visitation, as shown in Table 21, averages about 3 million visitors per year. Summer activities include national park visitation, whitewater rafting on the Snake River, and the Grand Teton Music Festival. Visitors typically drive to the area in the summer and stay 7-10 days, either camping or lodging, in the accommodations located throughout the valley.134
In the 1940s, to diversify the economic base, the Jackson Hole area opened its first ski resort, Snow King. In the 1980s following the success of this local resort, Jackson Hole Mountain and Grand Targhee ski resort opened for skiing.135 Combined, these resorts average about 595,000 skier days per year. The largest resort is Jackson Hole Mountain with about 375,000 skier days per year.136 The average winter stay for tourists is 4 to 5 days.137 Lodging occupancy rates available for the winter months of 2004 through the Jackson Hole Chamber of Commerce were 52 percent in January, 69 percent in February, and 55 percent in March. At that time, the Chamber of Commerce had not gathered monthly occupancy data for previous years.138
The Jackson Hole Airport (FAA location identifier JAC) is a publicly-owned facility located on approximately 533 acres in Teton County, Wyoming. Located at an elevation of about 6,450 feet,

The SGM Group, Inc. Page 25 5/10/2005
it is served by a single 6,300 by 150 foot runway. Although commercial air service to Jackson Hole began in 1959, it only began in earnest in 1986 when the Jackson Mountain Resort initiated a revenue-guarantee program with the City of Jackson for commercial air service.139 Prior to 1986, the nearest active commercial airports were located in Salt Lake City, Utah; Billings, Montana; or Denver, Colorado. Jackson Hole Airport currently offers commercial service via American Airlines, Delta, Northwest, United, and United Express. Flights originate from Cincinnati, Chicago, Salt Lake City, Atlanta, Minneapolis, and Denver.140 During the winter season, airlines use Boeing 757 jets (with a seating capacity of 178 passengers) and 737-300 jets (seating capacity up to 128 passengers), Airbus 319s (seating capacity up to 124 passengers), and deHavilland Dash–8 Turboprops (seating capacity of 46-60 passengers). The arrival of commercial air service has increased accessibility by tourists and second-home owners.141
An examination of monthly enplanements in 2003 indicates that the busiest months for air carriers occur during July and August with the slowest during the shoulder months of November and April.142 This pattern has remained consistent since the mid-1980s, when air service began in earnest. Air traffic during the winter months, December through March, represents 35 percent of total enplanements; and traffic during the summer months, June through August, represents 37 percent of total enplanements.143 Overall, enplanements have been relatively constant over the last eleven years, ranging between 167,400 in 2001 (post 9/11) and 192,300 in 1992. The level of activity depends on numerous factors including snow levels and airline service provided.144 The largest origination markets are Chicago, Denver, New York, California and Texas.145
The City of Jackson is located in Teton County, which lies in a long mountain valley known as Jackson Hole.146 The year-round population of the City of Jackson is about 8,800.147 The population of Teton County in 2002 was nearly 18,600. This population has increased steadily since 1992 with an average annual increase of 500 per year or 4 percent (Table 21). Land prices have escalated about 15 percent per year between 1986 and the mid-1990s, making it relatively expensive to develop and live in the area.148 Consequently, the local population growth has slowed while the second-home market has grown. The U.S. Census Bureau estimates that 20 percent of the housing stock is for seasonal use and second-home owners.
Employment in Teton County has grown with population, as shown in Table 21. Over the last eleven years total employment has increased from 15,800 to 23,700, at an average annual increase of 4.5 percent. Employment is higher in the summer months, during the peak tourist season, than during the winter months. Sales, use, and retail taxes collected, also an indicator of the growth in Teton County, are shown in Table 21. Tax collections have more than doubled in the last eleven years in concert with growth in the ski areas, the expanding second-home market, and the escalating real estate prices. As in previous examples, employment is larger than population as a result of commutation into the area from outlying counties as well as because total employment includes both full- and part-time jobs. Population only includes year-round residents.
Jackson Hole, with the improved accessibility via air, is becoming more of a winter resort. Traditionally a summer resort-destination locale with the nearby national parks, the opening of the two ski resorts in the 1980s with non-stop air service from points east has encouraged winter visitation, particularly from the New York /Chicago markets. This case study indicates characteristics similar to those of the Mammoth Lakes area in that the summer tourist market is, in part, driven by the proximity to major national parks that attract several million tourists yearly.
As shown in Table 21, data available for the employment forecast model includes the following:
• Total employment—Teton County,
• Resident population—Teton County,
• Sales, use, and retail taxes—Teton County,
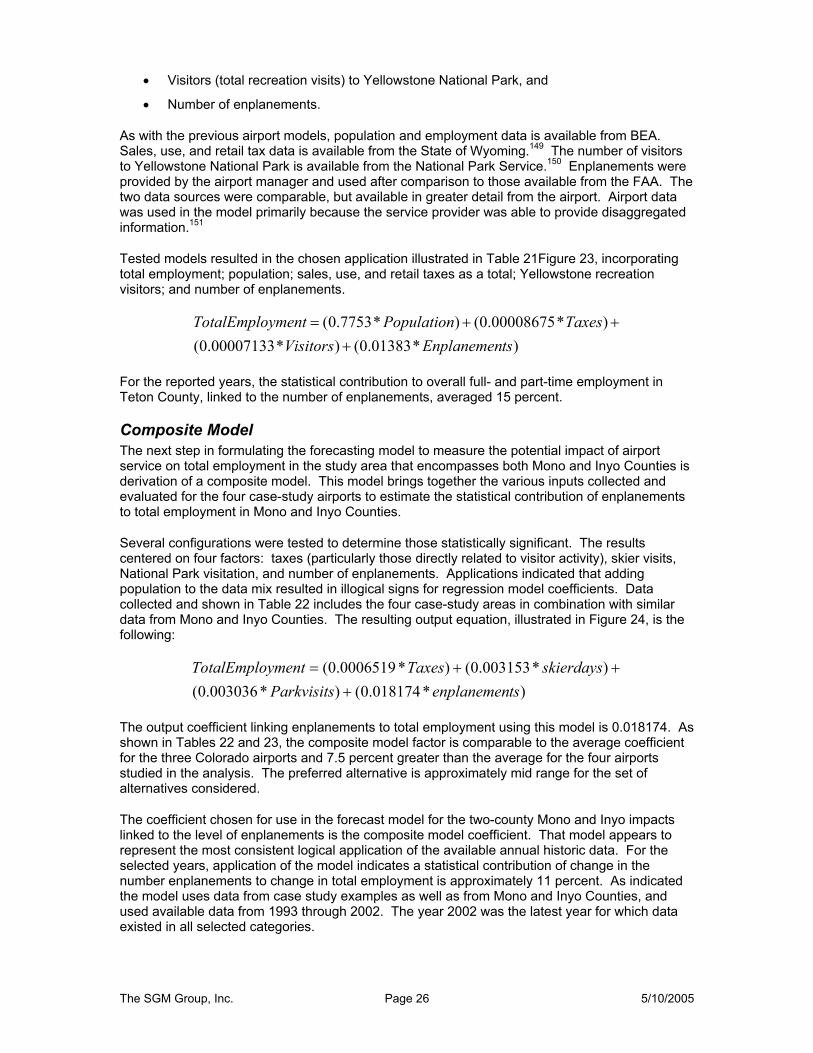
The SGM Group, Inc. Page 26 5/10/2005
• Visitors (total recreation visits) to Yellowstone National Park, and
• Number of enplanements.
As with the previous airport models, population and employment data is available from BEA. Sales, use, and retail tax data is available from the State of Wyoming.149 The number of visitors to Yellowstone National Park is available from the National Park Service.150 Enplanements were provided by the airport manager and used after comparison to those available from the FAA. The two data sources were comparable, but available in greater detail from the airport. Airport data was used in the model primarily because the service provider was able to provide disaggregated information.151
Tested models resulted in the chosen application illustrated in Table 21Figure 23, incorporating total employment; population; sales, use, and retail taxes as a total; Yellowstone recreation visitors; and number of enplanements.
)*01383.0()*00007133.0()*00008675.0()*7753.0(
tsEnplanemenVisitorsTaxesPopulationymentTotalEmplo
+++=
For the reported years, the statistical contribution to overall full- and part-time employment in Teton County, linked to the number of enplanements, averaged 15 percent.
Composite Model The next step in formulating the forecasting model to measure the potential impact of airport service on total employment in the study area that encompasses both Mono and Inyo Counties is derivation of a composite model. This model brings together the various inputs collected and evaluated for the four case-study airports to estimate the statistical contribution of enplanements to total employment in Mono and Inyo Counties.
Several configurations were tested to determine those statistically significant. The results centered on four factors: taxes (particularly those directly related to visitor activity), skier visits, National Park visitation, and number of enplanements. Applications indicated that adding population to the data mix resulted in illogical signs for regression model coefficients. Data collected and shown in Table 22 includes the four case-study areas in combination with similar data from Mono and Inyo Counties. The resulting output equation, illustrated in Figure 24, is the following:
)*018174.0()*003036.0()*003153.0()*0006519.0(
tsenplanemenParkvisitsskierdaysTaxesymentTotalEmplo
+++=
The output coefficient linking enplanements to total employment using this model is 0.018174. As shown in Tables 22 and 23, the composite model factor is comparable to the average coefficient for the three Colorado airports and 7.5 percent greater than the average for the four airports studied in the analysis. The preferred alternative is approximately mid range for the set of alternatives considered.
The coefficient chosen for use in the forecast model for the two-county Mono and Inyo impacts linked to the level of enplanements is the composite model coefficient. That model appears to represent the most consistent logical application of the available annual historic data. For the selected years, application of the model indicates a statistical contribution of change in the number enplanements to change in total employment is approximately 11 percent. As indicated the model uses data from case study examples as well as from Mono and Inyo Counties, and used available data from 1993 through 2002. The year 2002 was the latest year for which data existed in all selected categories.
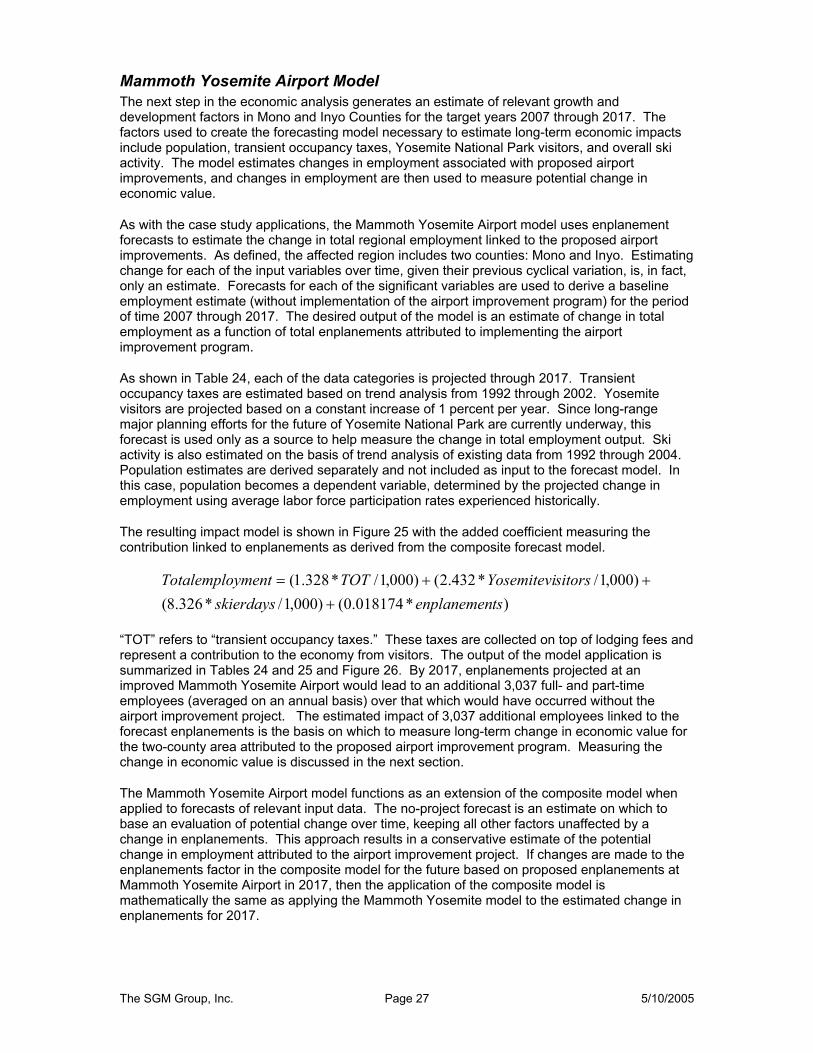
The SGM Group, Inc. Page 27 5/10/2005
Mammoth Yosemite Airport Model The next step in the economic analysis generates an estimate of relevant growth and development factors in Mono and Inyo Counties for the target years 2007 through 2017. The factors used to create the forecasting model necessary to estimate long-term economic impacts include population, transient occupancy taxes, Yosemite National Park visitors, and overall ski activity. The model estimates changes in employment associated with proposed airport improvements, and changes in employment are then used to measure potential change in economic value.
As with the case study applications, the Mammoth Yosemite Airport model uses enplanement forecasts to estimate the change in total regional employment linked to the proposed airport improvements. As defined, the affected region includes two counties: Mono and Inyo. Estimating change for each of the input variables over time, given their previous cyclical variation, is, in fact, only an estimate. Forecasts for each of the significant variables are used to derive a baseline employment estimate (without implementation of the airport improvement program) for the period of time 2007 through 2017. The desired output of the model is an estimate of change in total employment as a function of total enplanements attributed to implementing the airport improvement program.
As shown in Table 24, each of the data categories is projected through 2017. Transient occupancy taxes are estimated based on trend analysis from 1992 through 2002. Yosemite visitors are projected based on a constant increase of 1 percent per year. Since long-range major planning efforts for the future of Yosemite National Park are currently underway, this forecast is used only as a source to help measure the change in total employment output. Ski activity is also estimated on the basis of trend analysis of existing data from 1992 through 2004. Population estimates are derived separately and not included as input to the forecast model. In this case, population becomes a dependent variable, determined by the projected change in employment using average labor force participation rates experienced historically.
The resulting impact model is shown in Figure 25 with the added coefficient measuring the contribution linked to enplanements as derived from the composite forecast model.
)*018174.0()000,1/*326.8()000,1/*432.2()000,1/*328.1(
tsenplanemenskierdayssitorsYosemiteviTOTymentTotalemplo
+++=
“TOT” refers to “transient occupancy taxes.” These taxes are collected on top of lodging fees and represent a contribution to the economy from visitors. The output of the model application is summarized in Tables 24 and 25 and Figure 26. By 2017, enplanements projected at an improved Mammoth Yosemite Airport would lead to an additional 3,037 full- and part-time employees (averaged on an annual basis) over that which would have occurred without the airport improvement project. The estimated impact of 3,037 additional employees linked to the forecast enplanements is the basis on which to measure long-term change in economic value for the two-county area attributed to the proposed airport improvement program. Measuring the change in economic value is discussed in the next section.
The Mammoth Yosemite Airport model functions as an extension of the composite model when applied to forecasts of relevant input data. The no-project forecast is an estimate on which to base an evaluation of potential change over time, keeping all other factors unaffected by a change in enplanements. This approach results in a conservative estimate of the potential change in employment attributed to the airport improvement project. If changes are made to the enplanements factor in the composite model for the future based on proposed enplanements at Mammoth Yosemite Airport in 2017, then the application of the composite model is mathematically the same as applying the Mammoth Yosemite model to the estimated change in enplanements for 2017.

The SGM Group, Inc. Page 28 5/10/2005
IV: Measuring Economic Value This section of the analysis uses the output of the employment-change model to measure potential long-term economic value attributed to implementing the proposed improvement project at Mammoth Yosemite Airport. Change in employment is the key to estimating the overall economic impact of the proposed improvements. Based on past trends, change in employment can be used to estimate change in population and housing. Coupled with other components of growth and development, this change can also be used to estimate a change in commercial development attributed to the overall increased employment in the two-county impact area. Measuring economic value attributed to the estimated increase in employment is accomplished through application of input-output models and refers to value added, total output, employee compensation, taxes, and other measurable factors.
The forecast model used to estimate change in employment in the study area is fundamentally linked to the number of enplanements associated with proposed improvements at Mammoth Yosemite Airport. Estimates of future enplanements reflect the potential number of visitors to the area as a result of air service. The airport sponsor, with approval by the Federal Aviation Administration, provides the estimate of future enplanements at the airport as a primary input to the employment change forecasts.152 The enplanement forecasts are projected to be the same for all of the build alternatives; therefore, the economic value would likewise be the same.
Input-Output Model Application
The long-term economic impact analysis uses input-output models prepared by IMPLAN to measure the value of direct, indirect, and induced spending on the economy. These models build on existing conditions and linkage characteristics to predict the potential capture within a defined region of a direct infusion of capital. In this case the direct infusion of capital has the potential for creating measurable economic impacts.
To illustrate the principles involved, consider the example of increasing activity in the local and regional service and retail sectors—two important economic sectors that could expand in the study region as a function of improved airport accessibility. Both of these sectors are important to the two counties as well as to the broader region. For both the service and retail trade sectors, multipliers are relatively small, primarily because of the lack of diverse intermediate products. These sectors are responsive to increases in population and employment, through change in demand for products as well as services. Both the services and retail trade sectors rely on visitor access to generate regional income. In a resort economy, access to increased visitors and resulting expenditures drives the local economy. Service sector employment is directly linked to increased local expenditures. Increased retail activity creates an increased demand for product. Where retail product comes from affects the intensity of the multiplier effect. These requirements or inputs are known as intermediate demands, in contrast to final demands, which are the requirements for consumption by individuals or households.
In input-output analysis, the pattern of intermediate demands is the prime consideration. By examining the relationship between intermediate demand, individual economic sector output, and final demand, it is possible to predict the effects of a forecast change in the output of one industry on the rest of the economy, and also the effects on each industry of a change in national output. Understanding and predicting these relationships is essential to forecasting the impact of changes in the ability to support additional manufacturing and other related business service activities.
Other components of spending include household spending resulting from wages received by workers in the study region. Wages received by employees are spent on housing, food, clothing, and other required living expenses; and, subsequently, these expenditures serve as income to those providing the services to households. Expenditures continue to multiply as long as they are captured within the region. These subsequent rounds of expenditures to acquire additional goods and services are defined as induced impacts generated by the initial direct expenditure. The

The SGM Group, Inc. Page 29 5/10/2005
increased value of goods and services produced in the region that are required as direct inputs to construction and industrial facilities help to attract new industry and service-based companies into the region. This increased level of attraction is, at least in part, a result of expanded capacity of the airport and represents indirect impacts resulting from the initial improvement program expenditures.
The combination of indirect and induced effects has a “ripple-like” quality, passing from one layer of the economy to the next. The ripple effect is reduced, however, when the goods and services purchased, or labor resources employed, originate outside the two counties comprising the study area. It is necessary to estimate this leakage function in evaluating the total impact of the successive rounds of spending in the economy, and this estimate is generated by examining the capacity of the local economy to provide the product and labor resources required for construction and manufacturing. The indirect and induced effects of the initial direct expenditures of a public project are defined, respectively, as follows:
• Indirect: The local jobs, materials, equipment, and services required to produce the non-labor resources; and
• Induced: The local jobs, materials, equipment, and services required to fulfill the household demands for goods and services, which are generated by the wages of additional employees.
The ripple impact of the indirect and induced effects multiplies the original impact of the purchase, represented by the cost of new construction of the airport improvements and the projected scale of associated economic activity. The common measure of the magnitude of the ripple effect is called a multiplier. A multiplier measures the total magnitude of the impact on each particular economic indicator as a multiple of the initial, direct effect. For instance, a multiplier of 1.0 would signify no ripple effect, as the total impact was only 1.0 times the initial impact. In contrast, a multiplier of 2.0 would imply that the total impact of the proposed investment is twice the direct effect.
The actual magnitude of a multiplier depends on the likelihood that goods and services purchased in a region would be produced in, or provided from, that region. A common technique used in the performance of an economic impact study is to determine the total direct “economic impact” (by which most studies mean the impact on one economic indicator: the total output) of the project and then multiply that amount by an assumed multiplier. Such a method is inherently inaccurate, since the actual multiplier depends on the nature of the purchases, the types of materials with which the goods are produced, and the particular purchase patterns of the geographic region being measured.
IMPLAN is a PC-based input-output model used to estimate the total economic impact of the proposed development alternatives when measured against the baseline employment projections, originally formulated for the U.S. Forest Service, and is currently maintained by a non-profit group at the University of Minnesota. It does not assume a multiplier but, rather, uses past consumption and production patterns in the surrounding region to estimate what portion of the purchased goods and services originate or are produced in the region. The resulting multiplier represents the total impact that the model estimates, per indicator measured, divided by the amount of the original direct impact on that indicator.
The calculation of indirect and induced effects requires an input-output technology coefficients matrix, otherwise known as the direct coefficients matrix. Elements in this matrix express the dollar’s worth of each resource required per dollar’s worth of production. Generally, the data in such a matrix are based on data collected by region-specific surveys, or by “regionalizing” a national technology coefficients matrix. The latter are produced by several sources, most notably, the Bureau of Labor Statistics (BLS) of the US Department of Labor and the Bureau of Economic Analysis (BEA) of the US Department of Commerce.

The SGM Group, Inc. Page 30 5/10/2005
The technological coefficients allow for the determination of changes in demand for resources by a sector associated with a change in employment or production in that sector. In regional analysis, these demands will, in general, only be partially fulfilled by other sectors in the same region. All or part of the purchases of many goods and some services will leak out of the region and result in payments for goods and services imported from other regions. These leakages reduce the indirect and induced effects on the economy of the region where the direct changes occur and consequently reduce the multiplier effects of that change. The input-output model used in this analysis represents an application developed over many years. This process allows for an estimate of necessary region-specific data for any region beginning at the county level.
The model is based on the application of regional Social Accounting Matrices, or “SAMs.” It creates balanced industry by commodity input-output accounts as well as complete social accounting matrices. The default trade flow assumptions are Regional Purchase Coefficients (RPCs), which are derived using an econometric equation that predicts local purchases based on the region’s specific characteristics. The ratio of locally purchased to imported goods is perhaps the most significant factor affecting subsequent multipliers. The greater quantity of goods purchased locally, the more local economic activity will result and the larger the output multiplier.153
The Social Accounts of a region track the monetary flows between industries and institutions. In particular, the input-output accounts are a subset of the entire social accounts of a region. Social accounts track all monetary flows, both market and non-market. The market flows are those between producers of goods and services and consumers, both industrial, and non-industrial (i.e. households, government, investment, and trade). The non-market flows are those between households and government, government and households, capital and households and so on. These flows are often called inter-institutional transfers.154
Sources of information used to establish these models include the following:
• US Bureau of Economic Analysis Benchmark I/O Accounts of the US, • US Bureau of Economic Analysis Output Estimates, • US Bureau of Economic Analysis REIS Program, • US Bureau of Labor Statistics ES202 Program, • US Bureau of Labor Statistics Consumer Expenditure Survey, • US Census Bureau County Business Patterns, • US Census Bureau Decennial Census and Population Surveys, • US Census Bureau Economic Censuses and Surveys, • US Department of Agriculture, • US Geological Survey,,, • 528 Industrial Sectors, typically 4 digit SIC in manufacturing, 2-3 digit for other sectors,
and • All elements balanced to the National Income and Product Accounts.
The model application provides a basis for translating estimated changes in direct employment to value of total goods and services generated by resulting demand within Mono and Inyo counties.
Long-Term Employment Benefits
As discussed, measuring long-term economic benefits associated with the proposed improvements at Mammoth Yosemite Airport is based on the differential employment associated with the build alternative versus a no-action alternative. If there is an effect on long-term employment as a result of the proposed improvements, then there is value associated with those improvements in terms of employment compensation, value-added, and tax benefits. The employment related to the airport falls into three categories: airport-related employment located on site, visitor industry-generated employment related to the number of visitors passing through the airport, and additional net regional employment associated with other industries that locate in the area because of the proximity of the airport. The estimated change in employment is

The SGM Group, Inc. Page 31 5/10/2005
determined by application of the employment forecast model derived from the case study analysis discussed in the previous section of this report. As previously mentioned, the airport sponsor, with approval by the FAA, provides the enplanements forecast used to generate estimated change in employment in the study region.
The projected total employment difference between the no-action and build alternatives, including direct, indirect, and induced, is shown for all three employment categories in Table 25. Long-term changes do not appear until after commercial operations at the airport begin—starting in 2007. Beginning in that year, the resulting employment differences between the no-action and build alternatives begin to grow as enplanements increase from 29,300 in 2007 to 167,100 in 2017.155 The change in total employment by category over time is also shown by component in Table 27 and Figure 27. As shown, application of the forecasting model indicates that the projected employment differential is expected to increase from just over 530 in 2007 to 3,037 in 2017. Short-term employment impacts associated with construction are discussed in a separate section of this analysis.
Total employment change is comprised of direct, indirect, and induced effects represented by the multiplier effect. By 2017, this employment multiplier effect (ratio of total employment to direct employment) is expected to reach 1.39, which reflects the dominance of the service industry in the two counties. This multiplier effect, which is a measure of the ratio of direct employment to total employment, equals 1.39 using data shown in Table 28 (3,037/2,186). For each 100 new jobs created, an additional 39 jobs result in support of changes in direct employment. As shown in Table 25, overall employment in the two-county area is projected to grow to nearly 27,700 by 2017 without the proposed airport improvements and to nearly 30,725 with the proposed airport improvements.156 Employment benefits in Mono and Inyo counties, linked to the proposed improvements, are shown for 2017 and include direct, indirect, and induced employment attributed to employment changes at the airport (Table 28).
The value of the expected change in employment over time, however, is related to expected employment compensation; iterative expenditures by households in purchasing additional goods and services; and the taxes paid by individuals, households and businesses. The value represented by these expenditures is discussed in the next section of this study.

The SGM Group, Inc. Page 32 5/10/2005
The Economic Value of Long-Term Effects
The value of long-term economic impacts is a function of the projected differential change in total employment attributed to the proposed improvements at Mammoth Yosemite Airport.157 In the previous section, total estimated long-term change in the two-county study-area employment was calculated to include changes in direct airport employment, increases in employment associated with the visitor industry, and employment in other economic sectors. Using the techniques described, the analysis was able to determine the total employment change attributed to increased capacity at the airport, which is projected to reach 3,037 in 2017. It is important that projected changes in total employment do not begin to appear until and after 2007, when the improved airport is expected to begin operation. The next sections of this report summarize the economic value associated with each component of the projected change in employment as an estimate of the total value of long-term economic effects. As indicated previously, short-term impacts associated with construction are discussed in a separate section of this memorandum; however, the definitions of impact measures are the same.
Value Added
As indicate in the introduction, value added is the combination of wages, state and local taxes paid by households, dividends, interest, and profit. Value added represents the total sum of value created by business and household expenditures in the region or study area and, as such, is an effective measure of economic activity. In economic terms, value added is also known as gross regional product.
As shown in Table 29, value added for the two counties based on the projected employment benefit is approximately $138.6 million by 2017. For this value, the multiplier effect is on the order of 1.38. For every $1,000 value added generated as a result of new employment, $380 addition is created as a result of indirect and induced employment in support of direct employment. The primary economic sectors affected include accommodation and food services and government, each with approximately 24 percent of the total value generated. The total value added shown combines contributions from increased airport employment, visitor-generated employment, and other regional employment increases within the two-county study area.
Tax Related Impacts
Table 34 illustrates the potential tax increments associated with implementation of the proposed improvements by 2017. This output as shown combines contributions from all three components, including airport, visitor-generated, and net regional. Total 2017 tax benefits associated with building the proposed improvements are estimated to be nearly $35.4 million—a total that is already included in value added. This total incorporates the entire tax-related contributions of the estimate 3,037 additional employees and their associated business activities attributed to the proposed improvement project.158 Indirect business taxes associated with building the proposed improvements are shown in Table 33 and are estimated to be $8.54 million in 2017—a total also included in value added.
Additional Measures of Economic Value
Other measures of economic value shown in tables 30 through 34 include total output, employee compensation, and indirect business taxes. Total output (Table 30), which represents a single total measuring the overall value of an industry’s total production, is estimated at nearly $240 in 2017. Employee compensation (Table 32), one of the components of value added, is expected to reach nearly $76 million by that date.

The SGM Group, Inc. Page 33 5/10/2005
Summary—Economic Value
The technical analysis measures potential long-term economic impacts associated with the proposed improvements at Mammoth Yosemite Airport. The impacts measured are based on the enplanement forecasts provided by the study sponsor and approved by the FAA. What is important beyond the technical components is the demonstrated link between airport accessibility and long-term economic growth and development in the two-county study area. The proposed improvements are not expected to result in immediate benefits to the surrounding jurisdictions of Mono and Inyo counties, but rather continue to contribute to the long-term ability to attract new resort-based industry in support of existing growth and development patterns.
Airport investment may be a necessary element in realizing long-term growth and development benefits, but not the only element required. Over time, a lack of investment in supporting infrastructure can have a detrimental effect on economic stability in a region, and the potential order-of-magnitude value of that impact is apparent from the analysis. It is also important to recognize that airport access by itself will not solve economic problems relating to seasonal and weekly variations in visitor-based activity. Whatever economic improvements or changes might occur in terms of increased occupancy rates during mid-week or during shoulder seasons is encompassed in the economic impacts measured on an average annual basis. Data does not exist to allow a direct measurement of potential changes in mid-week or seasonal activity levels. It is possible only to estimate potential long-term effects on an average annual basis.
Beginning in 2007, change in employment in the two counties, resulting from airport and related development, is expected to grow from approximately 530 to 3,037 by 2017, including additional employment at the airport, additional employment associated with tourism, and additional employment associated with other serviced sector economic activity characteristic of the two-county economy (Table 26). These changes are annual and cumulative, and would continue to increase if the period of analysis were extended.
The economic value of the estimated employment change is based on the measured value added. By 2017, value added is expected to reach nearly $139 million. Again, value added benefits are annual and cumulative and would continue to grow in relation to the effects of Build versus No-Action Alternative (Table 29).
Associated with change in employment is change in employment compensation. Employment compensation is also included in value added. As shown in Table 31, total employment compensation associated with the proposed improvements is projected to reach nearly $76 million by 2017. As with all of the impact measures for the study area regional economy, the major contribution to employee compensation originates in the accommodation and food services and government sectors with a combined 47 percent of the total. Using employment compensation and full- and part-time employment for the two-county study area, it is possible to estimate average 2017 salaries for each affected economic sector in 2004 dollars. Table 32 displays overall average salaries in 2017 which are projected to be on the order of nearly $25,000. All average salaries are stated in 2004 dollars, and include both full- and part-time employment.
The economic sectors with the most significant contribution to the forecast employment change in 2017 exhibit some of the lowest average salaries. For example, the accommodation and food services sector, representing nearly 32 percent of the total additional employment forecast for 2017, is expected to experience an average annual salary of approximately $17,500 (in 2004 dollars). In contrast, the highest average salary sector, manufacturing, which is only projected to contribute 5.4 percent of the additional employment, is forecast to experience an average annual salary on the order of $50,000. The government sector is projected to account for 16.5 percent of the additional employment and average nearly $37,300 in annual salary. Overall, salary forecasts indicate, in the long-term, that additional employment linked to the proposed airport improvement project may not earn annual incomes sufficient to support acquisition of market-rate

The SGM Group, Inc. Page 34 5/10/2005
housing in and around the Town of Mammoth Lakes. Average salaries, measured in 2004 dollars, represent an annual average of full- and part-time employment.
Other financial impacts include taxes associated with increased employment and related income. Total taxes generated by the difference in employment by 2017 are estimated to be on the order of $35.4 million (Table 34). Of this total, approximately $8.54 million are indirect business taxes, $14.95 million are generated as the result of household expenditures, $8.64 million from employee compensation, $2.64 million as the result of corporations, and nearly $605,000 from proprietary income.
This analysis demonstrates that long-term regional economic impacts associated with the proposed airport improvement project at Mammoth Yosemite Airport do not begin to manifest themselves until after operational activity begins in 2007, with significant usage and increased economic effects forecast for 2017. The airport can be an important contributor to the future growth and development in the Mono and Inyo counties, helping to increase the overall return on investment projected in the region from both the public and private sectors. The differences between the build and no-action alternatives, although starting out relatively small, begin to grow as the long-term effects of airport improvement are realized. Change in employment is the key basic variable to measuring the value of airport improvement project. Investment in the airport improvement project is not the only contributor to long-term regional growth and development, but the analysis demonstrates that the economic benefits are measurable and potentially significant over time.

The SGM Group, Inc. Page 35 5/10/2005
V. Development Impacts and Fiscal Analysis Application of the input-output model generates an estimate of the potential value linked to implementation of the proposed airport improvement program as a result of a potential increase in population and employment. In addition, an increase in population and employment generates an increase in development; and, in 2017, the estimated increase in development is a function of a projected increase of 3,037 employees over and above that which is expected to occur without the airport improvement project. The ability to realize potential development opportunities is dependent on numerous significant factors in addition to airport-linked potential, including market feasibility, compatibility with approved land use plans in both counties and the incorporated areas within those counties, and availability of suitable land for development. Using current development averages, it is possible to estimate the extent of commercial development potential that might be linked to the airport improvement project. Additional employment linked to the proposed airport improvement program will, in turn, increase the demand for housing and commercial development. Increased housing demand is proportional to the projected increase in population; increased demand for commercial/retail space is proportional to projected increase in employment. Employment change can be used to estimate this additional development through a series of steps.
Using past trends in labor force participation rates, future change in employment can be used to estimate a concurrent change in population. Further, past trends in housing construction and occupancy data, including average persons per household, can be used to translate future population change into an estimate of change in future demand for housing units. Existing housing unit distribution patterns can also be used to estimate how this increase in demand for housing units is translated into housing type. Similarly, past history in average square feet of retail and commercial space per employee can be used to generate an estimate of change in demand for commercial and retail space. Where information is available, past trends can also help to generate an estimate of possible distribution of increased development demand by jurisdiction.
This section of the analysis reviews the process used to estimate change in development activity and the potential output. This analysis generates an order-of-magnitude estimate of the possible demand for additional residential and commercial space linked to the proposed airport improvements. Actual realization of these projections in the long-term is a function of changing market conditions as well as public and private sector policies and marketing efforts. Past trends can be used to predict an estimate of potential development activity as a way to frame the possible impacts linked to proposed airport improvements. An increase in development demand grows out of any increase in regional tourism and related economic activity, and this increased demand affects future fiscal considerations.
Population and Development
The employment difference linked to the airport improvement project is projected to grow from just over 500 in 2007 to 3,037 in 2017. During the same time period, population growth associated with that estimated employment change is expected to increase from just over 760 to just over 3,820 (Table 25). Estimated population change is based on past trends in the ratio of number of employees to resident population, evaluated using historic data from 1990 through 2003.
Population forecasts are coupled with housing stock data to measure the historic relationship between resident population and total number of housing units. Historic data on the number of housing units, both occupied and total, is also shown in Table 35 and is derived from data supplied by the California Department of Finance.159 Based on these historic conditions, the forecast change in population is projected to result in a change in total number of housing units from nearly 540 in 2007 to 2,755 by 2017, with occupied unit change increasing from 326 in 2007 to 1,627 in 2017 (Table 26). The choice of vacancy rates for future development, based on

The SGM Group, Inc. Page 36 5/10/2005
historic housing market parameters, would likely be less for employee-based residential development; however, a significant percentage of additional housing may continue to represent a seasonal market. As a result, annual average vacancy rates may still be close to those characteristic of earlier historic data. Using the existing market trends, therefore, represents a worst-case estimate of vacancy rates over time. The resulting demand could impact limited development opportunities on a smaller scale.
Table 35 and Figure 28 indicate recent distribution of housing units by type for each jurisdiction in the two-county study area. That distribution is used to estimate the potential distribution of additional housing units by type and jurisdiction in 2017, as shown in Table 36. The distribution by type and jurisdiction is subject to changing market conditions over an extended period of time, but the data illustrated in this table indicates a possible configuration assuming recent current development patterns continue. Out of the total of 2,755 units, it is estimated that nearly 39.5 percent would be located in the Town of Mammoth Lakes. Ultimately, the actual distribution within the Town would be less as determined by availability of developable land, land use constraints, and market value. The allocation of units in the Town would require a significant component of high-end second homes compatible with current market trends. Smaller numbers of units are projected for the remaining jurisdictions, again subject to land availability and market value.
Commercial development estimates are based on an inventory of existing space by jurisdiction, coupled with historic trends in average square feet per employee (Table 35). As shown, approximately 6.14 million square feet of commercial development exists in the study area. This estimate is based primarily on county assessment data. Estimated employment by jurisdiction is used to calculate an average square feet per employee. That estimate is then applied to the total change in employment forecast for 2017 to determine additional commercial and retail space that could result from implementation of the proposed airport improvement program
Current commercial space inventories include an estimate of total commercial space in Inyo County of approximately 3.2 million square feet,160 and total commercial space in the Town of Mammoth Lakes, of approximately 1.183 million square feet.161 Using current employment, the Inyo County total implies an average of nearly 290 square feet of commercial space, including industrial, office, and retail uses, per employee. Total commercial space in Mono County is on the order of 2.93 million square feet with approximately 1.75 million located in the unincorporated areas of the county. Based on an existing employment of just over 10,000, the average square feet per employee in Mono County is approximately 293.
Using the existing ratio of square feet per employee, the two-county market area would realize an increase in demand for approximately 882,000 square feet of commercial/retail space by 2017 as a result of increased economic activity linked to the airport improvement project (Table 39). Of that total, nearly 246,600 square feet is allocated to the Town of Mammoth Lakes (28 percent of total), with an additional 201,700 square feet estimated for the remainder of Mono County (23 percent). A total of 434,400 square feet (49 percent) is estimated for Inyo County, including the City of Bishop. The percentage distribution is based on existing patterns of employment by subarea shown in Table 38. Using existing distribution patterns results in an illustrative example of how future commercial development patterns might occur.
Estimated population and employment impacts, in combination with the projected change in the number of housing units and the potential increase in commercial/retail square feet in the two-county study region, provide the input necessary to measure potential fiscal impacts in 2017 for each of the affected jurisdictions. The fiscal impact component of the economic analysis is addressed in the next section.

The SGM Group, Inc. Page 37 5/10/2005
Fiscal Impact Analysis
The last element of analysis of long-term economic impacts involves an evaluation of the potential fiscal effects of the proposed action on affected jurisdictions. This analysis is based on existing local budget parameters and is an order-of-magnitude estimate of the possible long-term effects. Long-term impacts on fiscal conditions actually involve numerous decisions and conditions that are not trend oriented and cannot, as a result, be forecast over time. What follows is a best-case estimate of the potential impacts of the proposed action as it might affect Mono and Inyo counties, and the individual jurisdictions of the Town of Mammoth Lakes and the City of Bishop.
Fiscal impacts are predicated on the estimated changes in employment, population, and related development activity linked to the airport improvement program in 2017. As shown in Tables 36, total additional occupied housing units, projected for the four jurisdictions included in the study region, are expected to reach 1,627 out of a total projected 2,755 units. At the same time, total additional employment is expected to reach 3,037 with additional commercial development reaching nearly 882,000 square feet (Table 39). To measure the potential fiscal effects of the expected increase in development activity in 2017, it is necessary to allocate changes to the individual jurisdictions included in the analysis.
Because the Town of Mammoth Lakes has its own Fiscal Impact Model, the inputs used to measure a long-term change in revenues and expenses have been adapted to that model for the Town component of the study. The Mammoth Lakes model is based on changes in development activity rather than employment and population. The Mammoth Lakes model encompasses all estimated changes in development, including seasonal lodging units and second homes. As shown in Table 40, the additional development projected for the Town includes 1,087 total residential units, 208 lodging units, nearly 246,000 square feet of commercial development, and approximately 840 additional jobs. The projected development increases linked to improvements at the airport are used in the Town’s fiscal impact model to estimate a change in overall revenues and expenses associated with those increases against previously calculated long-term baseline values.162
Mono and Inyo counties and the City of Bishop do not currently use fiscal impact models. As a result, for these jurisdictions the method used to estimate potential long-term fiscal effects of projected increased development activity is based on per capita estimates using the last actual budget for each jurisdiction. The development increases linked to proposed improvements at the airport are disaggregated as a function of existing patterns of development. Existing patterns will change over time, and potential capture rates will also change; however, sufficient historic data does not exist to forecast long-term changes in these patterns given the complexity of factors that can influence those changes over time. In addition, budget expenditures are affected by changing conditions and are not always representative of historic trends.
Therefore, as an estimate of potential effects, the existing patterns of distribution are used as a best estimate of possible future effects. Total revenues and expenditures are allocated to a percentage of population and employment for major budget categories. Existing total population and employment are then used to calculate average per capita revenues and expenditures. These averages are then applied to projected increases in population and employment linked to the proposed airport improvement project. The 2004 local budgets include the cost of providing services to the current tourist and seasonal populations; therefore, the per capita averages would reflect these costs. What is apparent from the analysis is that the concentration of higher-valued economic activity will continue to occur in and around the Town of Mammoth Lakes where the center of regional attraction exists and will continue to exist. The actual distribution of impacts will occur as a function of land availability and development capacity as well as market demand.
As shown in Table 25, the overall projected population impact associated with the proposed airport improvement program is 3,824 in 2017. Based on existing percentage distribution patterns, the future allocation to affected jurisdictions in the study area is shown in Table 36. As

The SGM Group, Inc. Page 38 5/10/2005
shown, projected population growth in the City of Bishop is 291 with 1,294 in the remainder of Inyo County. Population growth impacts in the Town of Mammoth Lakes are projected to be 1,518 with 721 in the remainder of Mono County. The number of occupied housing units is projected to increase by 139 in the City of Bishop and 538 in the remainder of Inyo County; by 642 in the Town of Mammoth Lakes and 309 in the remainder of Mono County. Throughout the two-county impact area, the average number of persons per occupied housing unit is expected to be 2.35, ranging from 2.36 in the Town of Mammoth Lakes, to 2.10 in the City of Bishop, and to 2.41 in the unincorporated area of Inyo County.
Fiscal Impact—Town of Mammoth Lakes As indicated, the fiscal impact analysis for the Town of Mammoth Lakes uses their existing fiscal impact model. As part of the updated master plan, the Town created this model to estimate long-term effects for the build-out scenario. To measure the potential long-term effects of airport expansion, the build-out scenario has been used as a baseline model because there is no specific target date set for the realization of build-out conditions. Since the estimate of economic impacts associated with proposed airport improvements is based on change from a no-action option, using the existing model as a baseline conditions estimate allows for a specific calculation of fiscal impacts as a function of available airport access.
Application of the fiscal impact model relies on the output of the development forecasts linked to airport service improvements. This output includes changes in the number of housing units by type, change in the number of housing units, increased employment, and change in the estimated commercial development as shown in Table 40. Coupled with the projected increase in housing units and lodging units located in the Town, these additions to the development base comprise the inputs to the Town’s fiscal model. Using these values as input to the fiscal impact model, the results indicate a positive cash flow condition.
The fiscal impact model used by the Town of Mammoth Lakes applies future tax rates to potential changes in commercial and residential development. The inputs used to determine the possible effects of proposed improvements at Mammoth Yosemite Airport are based on the projected changes in commercial and residential development associated with the expected change in employment and population. As shown in Table 40, total additional commercial development allocated to the Town is nearly 246,000 square feet in 2017. As shown, the steps used to reach this estimate are based on average square feet per employee attributed to existing development patterns. Using the distribution of employment by sub area coupled with existing commercial square footage in the Town generates a percentage applied to future increases. As a result, just 840 additional employees are projected for the Town. At an average of nearly 293 square feet per employee, this additional employment translates to nearly 246,000 square feet of additional commercial development.
As indicated in Table 40, the net change in revenues is estimated at nearly $2.95 million; the net change in expenditures is nearly $1.82 million. The net positive cash flow change is therefore nearly $1.14 million, resulting in a fiscal impact ratio of 1.63. The net positive effect does not resolve the overall long-term issue for the Town of potential fiscal difficulties, but it does indicate that long-term effects for the Town attributed to proposed improvements at the airport are positive.
Fiscal Impact—Remainder of Mono County As indicated previously, Mono County does not have access to a fiscal impact model. As a result, the process used to estimate potential long-term fiscal effects of projected increased development activity is based on per capita estimates using the last actual budget for the county. Total revenues and expenditures are allocated to a percentage of population and employment for major budget categories as shown in Tables 41 and 42. Existing total population and employment are then used to calculate average per capita revenues and expenditures. These averages are then applied to projected increases in population and employment as shown in Table 42. Based on these averages, the net benefit to the remainder of Mono County is
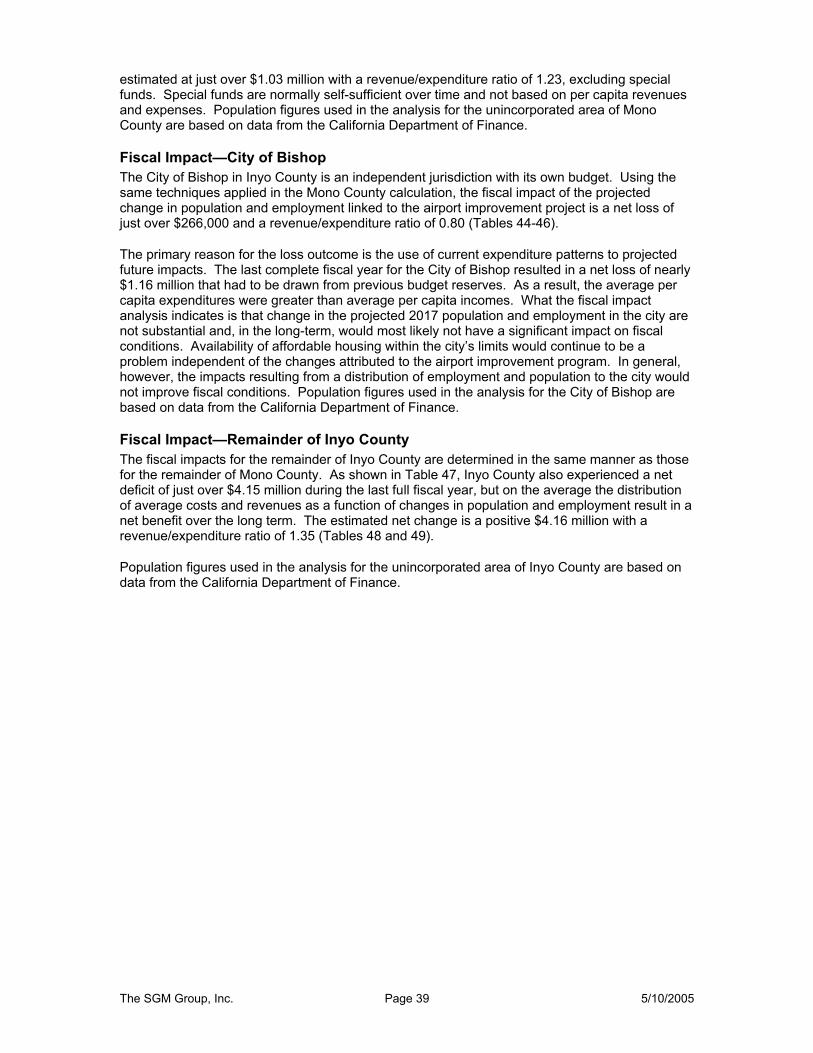
The SGM Group, Inc. Page 39 5/10/2005
estimated at just over $1.03 million with a revenue/expenditure ratio of 1.23, excluding special funds. Special funds are normally self-sufficient over time and not based on per capita revenues and expenses. Population figures used in the analysis for the unincorporated area of Mono County are based on data from the California Department of Finance.
Fiscal Impact—City of Bishop The City of Bishop in Inyo County is an independent jurisdiction with its own budget. Using the same techniques applied in the Mono County calculation, the fiscal impact of the projected change in population and employment linked to the airport improvement project is a net loss of just over $266,000 and a revenue/expenditure ratio of 0.80 (Tables 44-46).
The primary reason for the loss outcome is the use of current expenditure patterns to projected future impacts. The last complete fiscal year for the City of Bishop resulted in a net loss of nearly $1.16 million that had to be drawn from previous budget reserves. As a result, the average per capita expenditures were greater than average per capita incomes. What the fiscal impact analysis indicates is that change in the projected 2017 population and employment in the city are not substantial and, in the long-term, would most likely not have a significant impact on fiscal conditions. Availability of affordable housing within the city’s limits would continue to be a problem independent of the changes attributed to the airport improvement program. In general, however, the impacts resulting from a distribution of employment and population to the city would not improve fiscal conditions. Population figures used in the analysis for the City of Bishop are based on data from the California Department of Finance.
Fiscal Impact—Remainder of Inyo County The fiscal impacts for the remainder of Inyo County are determined in the same manner as those for the remainder of Mono County. As shown in Table 47, Inyo County also experienced a net deficit of just over $4.15 million during the last full fiscal year, but on the average the distribution of average costs and revenues as a function of changes in population and employment result in a net benefit over the long term. The estimated net change is a positive $4.16 million with a revenue/expenditure ratio of 1.35 (Tables 48 and 49).
Population figures used in the analysis for the unincorporated area of Inyo County are based on data from the California Department of Finance.
The SGM Group, Inc. Page 40 5/10/2005
Summary—Fiscal Impacts
The fiscal impact analysis indicates that the long-term impacts of development linked to proposed improvements at Mammoth Yosemite Airport are expected to be positive for each of the jurisdictions except the City of Bishop. The benefits that are shown are most pronounced in the Town of Mammoth Lakes, but only as a function of Town’s ability to absorb the increased economic activity beyond that which would otherwise occur. In general, the overall effect on fiscal conditions is not expected to be significant except in terms of a potential increase in the demand for affordable housing along with services linked to that increase. Availability of affordable housing remains a concern for the entire region with or without the airport improvement program. The airport improvement program is projected to create economic value for the region. It remains for the jurisdictions to consider and implement effective policies to capture a portion of that increased economic value in support housing programs necessary for realization of that increase.
The fiscal impact analysis also demonstrates that the primary benefit from potential for increased economic activity associated with the proposed improvements to Mammoth Yosemite Airport will occur in and around the Town of Mammoth Lakes. The major center of attraction is located in the town, and that center of activity will continue to capture a major portion of the estimated increase in economic value. The higher potential fiscal impact ratio for the town in comparison to that projected for the other three jurisdictions indicates that the higher value improvements will continue to concentrate in the area of the town. Support services linked to additional population and service retail locating outside of the Town will tend to concentrate in those areas where additional housing development could occur. That development pattern will generally be associated with service sector support at lower economic value than those sectors concentrating in the Town area. The indicated hierarchy of development activity is consistent with the lower fiscal impact ratios projected for the remainder of Mono County, the unincorporated areas of Inyo County, and the City of Bishop.
The variation in fiscal impact ratios appears to indicate and reinforce the conclusion that the proposed airport improvement can contribute to an increase in the economic viability of a resort industry centered on the Town of Mammoth by increasing accessibility to the region. Additional activity in the outlying areas is consistent with the need for increased service sector and hospitality sector support, but that additional activity is less highly valued economically than the primary activities associated with the resort center. The result is a small enhancement to the outlying areas in terms of fiscal effects, except in the City of Bishop. Bishop is currently experiencing a short-fall in the revenue/expense ratio, and that short-fall would most likely affect the realization of benefits in the future, if changes in the local tax and revenue structure are not implemented in the interim.
The analysis also concludes that the primary concentration of economic benefits from the most valued components of the economy would most likely occur in the areas where attractions are most dominant. The area around the Town of Mammoth Lakes would continue to capture its share of increased economic activity within the constraints of land availability, land use policy, and related development costs. While the components of greatest value would concentrate in that area, additional economic activity would spin off into the surrounding environments, including the remainder of Mono County and into Inyo County. Primary components resulting from an overflow would include additional housing and service sector support elements into areas that can accommodate affordable housing and the population that follows that demand. Provision of affordable housing will continue to be a concern, with the expected growth associated with sectors of the economy that do not generate annual wages sufficient to purchase housing in the high-valued areas of the region. Alternative locations for the airport would tend to shift support development to the alternative locations; however, the primary components of linked economic growth and development would continue to occur in and around the Town of Mammoth Lakes in support of the activity center that draws patrons to the region.

The SGM Group, Inc. Page 41 5/10/2005
VI: Economic Impacts of Construction The last section of the economic impact analysis addresses the short-term effects of construction. Economic impacts of construction are primarily limited to the specific period of time during which construction expenditures occur and represent an infusion of capital into the local economy. The extent to which a specific region benefits from this infusion of capital is a function of the ability of the local economy to provide both the labor and supplies required during construction. Where that ability is limited, economic effects leak out of the region into surrounding areas where additional capability exists. Construction costs would be similar for both Mammoth Yosemite Airport build alternatives. Construction costs for a build alternative at Eastern Sierra Regional Airport in Bishop have not yet been derived but would be similar to those estimated for Mammoth Yosemite.
The analysis that follows addresses both the overall estimate of construction impacts and the amount of economic benefits that might accrue to counties outside of the two-county impact area. The set of tables included presents the results of the economic impact analysis of proposed airport construction. This analysis is based on the construction cost estimate for the various components making up the proposed improvement project, including runway construction, taxiway improvements, aprons, and terminal facilities along with the equipment necessary to service these facilities. As shown in Table 50, estimated capital cost of construction for the 19 project components is expected to reach nearly $32.8 million with additional engineering and architecture costs of nearly $8.5 million. Total project costs are estimated at $41.28 million, all expressed in 2004 constant dollars.163 As indicated, project costs include all components—from the supplemental environmental studies, runway and taxiway improvements, parking lots, holding aprons, the terminal building, and other support facilities. The total construction costs are used as the direct component of the total output presented as Tables 51 and 53. Total construction costs are the basis for application of the input-output model used to calculate overall industry output, value added, employment, employee compensation, and various components of tax revenue. Each of these outputs is shown in the tables that follow.164
Economic impact in terms of employment and value are shown in Tables 52 through 59. Total output for the construction expenditures is estimated at $59 million (Table 53). Total value added is nearly $30 million (Table 54), with employee compensation expected to reach nearly $19 million (Table 55). Total taxes generated by the infusion of capital are expected to reach just over $8.2 million (Table 58). Total employment is projected at just fewer than 750 jobs (Table 52). All economic values are measured in 2004 dollars.
Unlike long-term economic impacts, impacts generated by construction activities generally occur only during the construction period. In addition, a significant portion of the economic benefits attributed to construction leak out of the study region encompassing Mono and Inyo counties because of the lack of an extensive construction industry with experience related to airport construction activities. The impacts measured and reported in the following tables represent that component captured within the study area. Broader short-term economic impacts experienced in outlying counties during the period of construction are outside the scope of this analysis.
Based on the estimated period of construction, the overall benefits would occur as a function of the percentage distribution of expenditures over that timeframe. Preparing the analysis in constant 2004 dollars avoids a subsequent need to escalate costs as a function of the actual start and completion date of construction activities.
As indicated previously, economic impacts of construction generally occur in the year in which expenditures are made. The disposition of impacts over time is therefore a function of the percentage distribution of construction costs based on the program implementation schedule. Since all impact measures are presented in constant 2004 dollars, the measured impacts can be distributed over time as a function of the build-out schedule as soon as that schedule is known. The total impacts, in terms of jobs as well as value, remain the same.

The SGM Group, Inc. Page 42 5/10/2005
Regional Economic Leakage The two-county study area that includes Mono and Inyo counties represents a major portion of the broader area that will contribute to the airport construction program with respect to employment and other measures of economic impact. The two counties, however, have only limited resources to allocate to the construction program because of limited experience in comparable construction activities historically. The number of companies located in the two-county region with experience in related construction activities is limited, and the resulting multiplier effects illustrated in Table 51 show this existing limitation. As derived from the two-county summary table 5, the multiplier effects within the two-county impact area from implementation of the construction program are relatively small, averaging 1.45 for employment, 1.43 for total output, and 1.55 for value added. These ratios characterize an economy where additional resources are required from outside the region to implement the proposed improvement program. The need to bring in outside resources means that a portion of estimated economic benefits attributed to the construction program “leak” out of the study area to a broader region.
In the case of long-term impacts, the situation is generally different. The resulting impacts are predominantly captured within the two-county study area because the resources exist historically to capture potential economic benefits. In this case, the primary economic sectors already existing within the two-county area are those that are most prone to experience long-term benefits from the proposed improvements.
To test the potential extent of leakage of economic benefits attributed to construction of the proposed airport improvement program, the economic effects of direct expenditures represented by the estimated costs were tested within a broader seven-county region. This broader region adds five counties to the primary impact area for the purpose of extending the analysis: Los Angeles County, Tulare, Kings, San Bernadino, and Kern. These counties represent a region that has the potential to contribute significantly to the contracting activities associated with construction of the proposed improvements at Mammoth Yosemite Airport.165 Although they may not be the only external counties that experience some economic impacts attributed to the proposed improvement program, they represent a significant additional area that could contribute resources required to implement the construction project. Total impacts generated within the seven-county area are shown in Table 59 along with the estimated leakage beyond Mono and Inyo counties.
As shown in Table 59, the broader seven-county region would experience approximately the same total number of jobs, and could generate additional total output exceeding $21.8 million, along with a $14.1 million increase in value added. Additional employee compensation could reach nearly $8.6 million, and additional taxes could reach $3.9 million. For this broader impact region, multipliers increase to 1.83 for employment, 1.96 for total output, and 2.10 for value added. These higher multipliers are more representative of a primary impact area when measuring economic impacts of construction expenditures. As a result of the comparison, possible economic leakage from the two-county study area is illustrated comparatively in Figure 29.

The SGM Group, Inc. Page 43 5/10/2005
Glossary
The following are definitions for terms used throughout the impact valuation analysis. These terms refer to the various reports produced as part of the IMPLAN modeling effort in measuring the potential value of long-term economic impacts of proposed improvements at Mammoth Yosemite Airport.166
Total Output
Total Output, or Industry Output, is a single number reported in dollars for each industry included in the analysis. These dollars represent the value of an industry’s total production. In this analysis, output is reported by industry sectors, and broken down as direct, indirect, and induced. Output can be defined either as the total value of purchases by intermediate and final consumers, or by intermediate outlays plus value-added. Output can also be thought of as a value of sales plus or minus inventory.
Employment
Employment is reported as a single number of jobs for each industry. Data can be reported for individual industries or aggregated into categories. In this analysis, employment data is reported as an aggregated output. Employment includes total wage and salary employees as well as self-employed jobs in a defined region. It includes both full-time and part-time workers and is measured in annual average jobs. The IMPLAN database for the two counties included in the model (Mono and Inyo Counties) draws on three primary data sets: The ES202 data (Unemployment Insurance Covered Employment and Wages Program from the Bureau of Labor Statistics, U.S. Department of Labor), the Regional Economic Information System from the Bureau of Economic Analysis of the Department of Commerce (R.E.I.S.), and County Business Patterns from the U.S. Department of Census.
Value Added
There are four subcomponents of value-added:
1. Employee Compensation,
2. Proprietary Income,
3. Other Property Type Income, and
4. Indirect Business Taxes.
Employee compensation describes the total payroll costs of each industry used in the analysis. It includes wages and salaries of workers who are paid by employers, as well as benefits such as health and life insurance, retirement payments, and non-cash compensation. Employee compensation is derived for each reported industry from ES202 and REIS data.
Proprietary income consists of payments received as income by self-employed individuals. Any income received for payment of self-employed work, as reported on Federal tax forms, is counted in this category. Totals include income received by private business owners, doctors, lawyers, and other similar business activities.
Labor income is the combination of employee compensation and proprietary income.
Other property type income consists of payments for rents, royalties, and dividends. Payments to individuals in the form of rents received on property, royalties from

The SGM Group, Inc. Page 44 5/10/2005
contracts, and dividends paid by corporations are included in this category as well as corporate profits earned by corporations.
Indirect business taxes consist of excise taxes, property taxes, fees, licenses, and sales taxes paid by businesses. These taxes occur during the normal operation of businesses but do not include taxes on profit or income. Baseline indirect business taxes for the affected jurisdictions are derived from U.S. Bureau of Economic Analysis Gross State Product data.
Total Taxes
As shown in the Tax Impact table included in the analysis, total taxes include estimates of all taxes paid by households and businesses at the Federal, State, and Local levels. These taxes include corporate taxes, taxes based on proprietary income, personal taxes based on household income, and indirect business taxes generated in the course of doing business as defined above. Total taxes are initially reported in the year determined by the initial IMPLAN model data inputs—in this case that year was 2001. The only IMPLAN category that can be measured in terms of individual external reporting years is the Indirect Business Taxes category. As a result, analysis of this category is first reported for both 2001 and 2004 to determine an estimated inflation ratio. That estimated ratio is then applied to the total tax output as an approximation of the total 2004 tax impact. Individual categories within the tax analysis are not subject to the same average inflation ratios, but the application of the ratio measured for the Indirect Business Tax category represents a reasonable estimate of expected escalation.

The SGM Group, Inc. Page 45 5/10/2005
Table 1: Forecast Annual Enplanements--Mammoth Yosemite Airport 2007-20017 Average Day and Peak Hour Projections 2007 2012 2017
Annual Enplanements 29,300 136,800 167,100 Peak Month 8,500 27,400 33,400 Average Day 280 900 1,100 Peak Hour 280 320 360 Aircraft Departures
Air Carriers Annual 370 1,335 1,524 Peak Month 70 270 300 Average Day 2.3 8.9 9.8 Peak Hour 2.3 2.5 2.8
Regional/Commuters Annual 0 530 606 Peak Month 0 110 120 Average Day 0 3.6 3.9 Peak Hour 0 1.1 1.2
General Aviation and Military Annual 3,825 4,475 5,175 Peak Month 570 670 780 Average Day 18.7 22 25.6 Peak Hour 2.8 3.3 3.8
Source: “Updated Forecast of Aviation Demand—Final Report, Mammoth Yosemite Airport,” Prepared for The Town of Mammoth Lakes by Ricondo & Associates, Inc., May 2004, Table 28, p. 36.

The SGM Group, Inc. Page 46 5/10/2005
Table 2: City/County Population and Housing Estimates—January 2004 Mono and Inyo Counties
COUNTY/CITY POPULATION HOUSING UNITS
-------- SINGLE -------- ----- MULTIPLE -----
TOTAL HOUSE-HOLD
GROUP QUARTERS TOTAL DETACHED ATTACHED 2 TO 4 5 PLUS MOBILE
HOMES OCCUPIED PCT VACANT
PERSONS PER HOUSE-
HOLD INYO COUNTY
BISHOP 3,632 3,555 77 1,873 843 78 262 323 367 1,690 9.77% 2.104 BALANCE OF COUNTY 14,883 14,678 205 7,274 4,653 134 145 145 2,197 6,102 16.11 2.405 INCORPORATED 3,632 3,555 77 1,873 843 78 262 323 367 1,690 9.77 2.104 COUNTY TOTAL 18,515 18,233 282 9,147 5,496 212 407 468 2,564 7,792 14.81 2.340
MONO COUNTY
MAMMOTH LAKES 7,472 7,254 218 8,683 2,241 1,003 1,758 3,488 193 3,069 64.66 2.364 BALANCE OF COUNTY 6,048 5,968 80 4,176 2,760 256 307 74 779 2,556 38.79 2.335 INCORPORATED 7,472 7,254 218 8,683 2,241 1,003 1,758 3,488 193 3,069 64.66 2.364 COUNTY TOTAL 13,520 13,222 298 12,859 5,001 1,259 2,065 3,562 972 5,625 56.26 2.351
TWO COUNTIES
BISHOP + MAMMOTH LAKES 11,104 10,809 295 10,556 3,084 1,081 2,020 3,811 560 4,759 54.92% 2.271 BALANCE OF COUNTIES 20,931 20,646 285 11,450 7,413 390 452 219 2,976 8,658 24.38% 2.385 INCORPORATED 11,104 10,809 295 10,556 3,084 1,081 2,020 3,811 560 4,759 54.92% 2.271 2-COUNTY TOTAL 32,035 31,455 580 22,006 10,497 1,471 2,472 4,030 3,536 13,417 39.03% 2.344
Source: http://www.dof.ca.gov/HTML/DEMOGRAP/repndat.htm#estimates; The SGM Group, Inc.

The SGM Group, Inc. Page 47 5/10/2005
Table 3: Proposed Large-Scale Development Activity 2004 SUBDIVISION/PROJECT 2004 2005 2006+ TOTAL Town of Mammoth Lakes Snow Creek
• Residential (units) 30 1,451 1,481 • Commercial (sq. ft.) 120,000 120,000
Intrawest • Residential (units) 189 175 1,833 2197 • Commercial (sq. ft.) 4,600 11,000 29,500 45,100
Ward Jones • Residential (units) 200 200
80/50 Condominiums 45 105 150 Dempsey- North Village 125 125 Mammoth lakes Housing, Inc. Old Mammoth Road 96 96 Mammoth Lakes Housing II 24 24 Subtotal – Town of Mammoth Lakes (units) 189 250 3834 4273 Subtotal – Town of Mammoth Lakes Commercial (sq. ft.) 4,600 11,000 149,500 165,100 Mono County
• June Lake Intrawest (residential units) 754 754 • June Lake Intrawest - (commercial square feet) 14,500 14,500 • Lake Ridge Estates 118 118 • Paradise Community 50 50 • Chalfont 53 53 • White Mountain Estates 57 57 • King Lake 50 50 • Crowley Lake 48 48
Subtotal Mono County (units) 1,130 1,130 Subtotal Mono County Commercial (sq. ft.) 14,500 14,500 Inyo County
• Pine Creek (units) 189 189 • Mesta Mesa (units) 117 117 • 10-acre home sites 64 64
Subtotal Inyo County 370 370 Total Residential Units Planned – Two County Area 189 250 5,334 5,773 Total Commercial Square Feet – Two County Area 4,600 11,000 164,000 179,600
Source: County of Mono Community Development Department; Mammoth Lakes Housing, Inc,; Inyo County Planning Department; Intrawest Resort Development Group; Dempsey Construction and Real Estate Development Consulting; and The SGM Group, Inc., field interviews, summer 2004.

The SGM Group, Inc. Page 48 5/10/2005
Table 4: Two-County Commercial/Industrial Development—August 2004
COMMERCIAL/INDUSTRIAL SPACE TOTAL (SQ. FT.)
Inyo County 3,206,000 (Includes City of Bishop) Unincorporated Mono County
• June Lake Area 104,500 • Crowley Lake Area 16,500 • Long Valley Area 702,500
Subtotal Unincorporated Mono County 823,500 Estimated Additional Square Feet on other areas of Mono County 923,600 Estimated total for Mono County 2,930,000 Town of Mammoth Lakes 1,183,000 Total—Two County Area 6,136,000
Source: Town of Mammoth Lakes, Community Development Department, County of Inyo Office of Assessor, City of Bishop - Planning Office, Long Valley Fire Protection District Development Impact Fee Calculation and Nexus Report, June Lake Fire Protection District Development Fee Calculation and Nexus Report, March 2003; and The SGM Group, Inc.
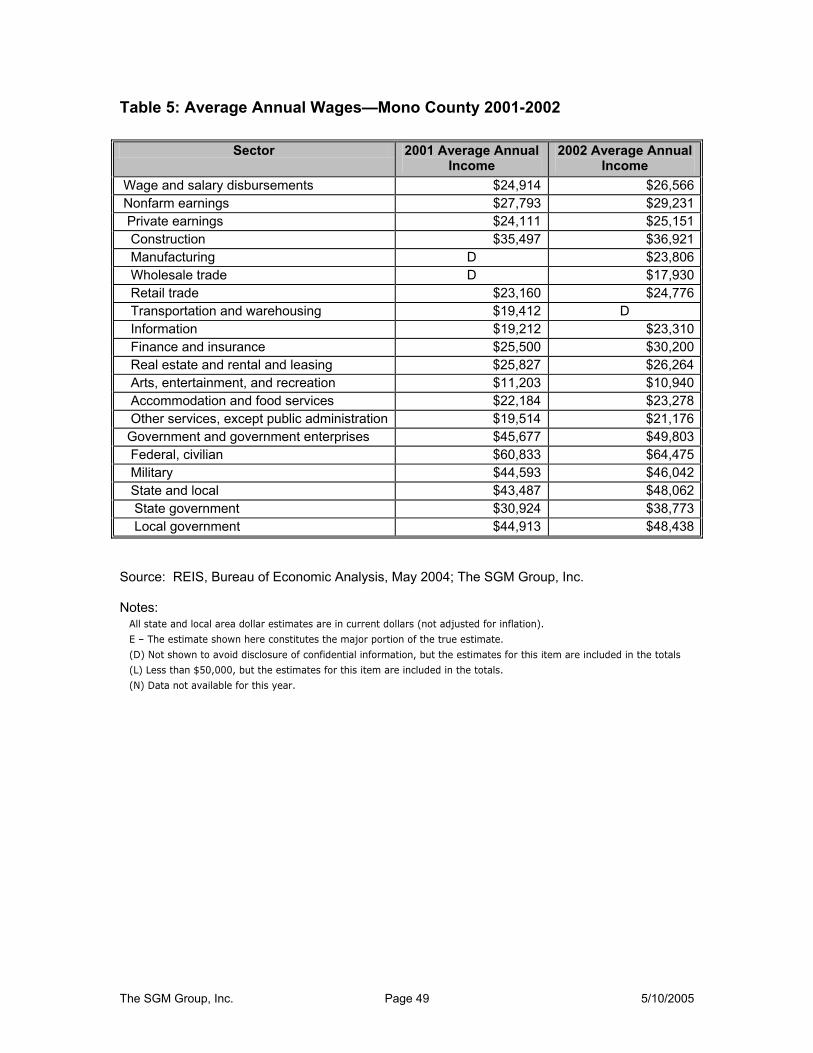
The SGM Group, Inc. Page 49 5/10/2005
Table 5: Average Annual Wages—Mono County 2001-2002
Sector 2001 Average Annual Income
2002 Average Annual Income
Wage and salary disbursements $24,914 $26,566 Nonfarm earnings $27,793 $29,231 Private earnings $24,111 $25,151 Construction $35,497 $36,921 Manufacturing D $23,806 Wholesale trade D $17,930 Retail trade $23,160 $24,776 Transportation and warehousing $19,412 D Information $19,212 $23,310 Finance and insurance $25,500 $30,200 Real estate and rental and leasing $25,827 $26,264 Arts, entertainment, and recreation $11,203 $10,940 Accommodation and food services $22,184 $23,278 Other services, except public administration $19,514 $21,176 Government and government enterprises $45,677 $49,803 Federal, civilian $60,833 $64,475 Military $44,593 $46,042 State and local $43,487 $48,062 State government $30,924 $38,773 Local government $44,913 $48,438 Source: REIS, Bureau of Economic Analysis, May 2004; The SGM Group, Inc. Notes:
All state and local area dollar estimates are in current dollars (not adjusted for inflation).
E – The estimate shown here constitutes the major portion of the true estimate.
(D) Not shown to avoid disclosure of confidential information, but the estimates for this item are included in the totals.
(L) Less than $50,000, but the estimates for this item are included in the totals.
(N) Data not available for this year.

The SGM Group, Inc. Page 50 5/10/2005
Table 6: Mammoth Skier Days—1986-2004
Season/Year Mammoth June Total 1980-81 983,979 1981-82 1,359,376 1982-83 1,259,160 1983-84 1,280,798 1984-85 1,230,750 1985-86 1,428,958 1986-87 697,457 85,476 782,933 1987-88 1,143,133 81,146 1,224,279 1988-89 1,065,313 93,986 1,159,299 1989-90 1,011,915 68,213 1,080,128 1990-91 484,350 26,036 510,386 1991-92 918,114 60,212 978,326 1992-93 935,928 59,831 995,759 1993-94 731,850 38,829 770,679 1994-95 976,391 84,626 1,061,017 1995-96 813,153 66,669 879,822 1996-97 800,982 64,646 865,628 1997-98 901,729 66,109 967,838 1998-99 908,618 51,120 959,738 1999-2000 895,293 33,766 929,059 2000-2001 1,122,082 34,033 1,156,115 2001-2002 1,154,441 59,751 1,214,192 2002-2003 1,284,110 81,691 1,365,801 2003-2004 1,310,107 89,536 1,399,643
Source: Mammoth Mountain, November 2004.
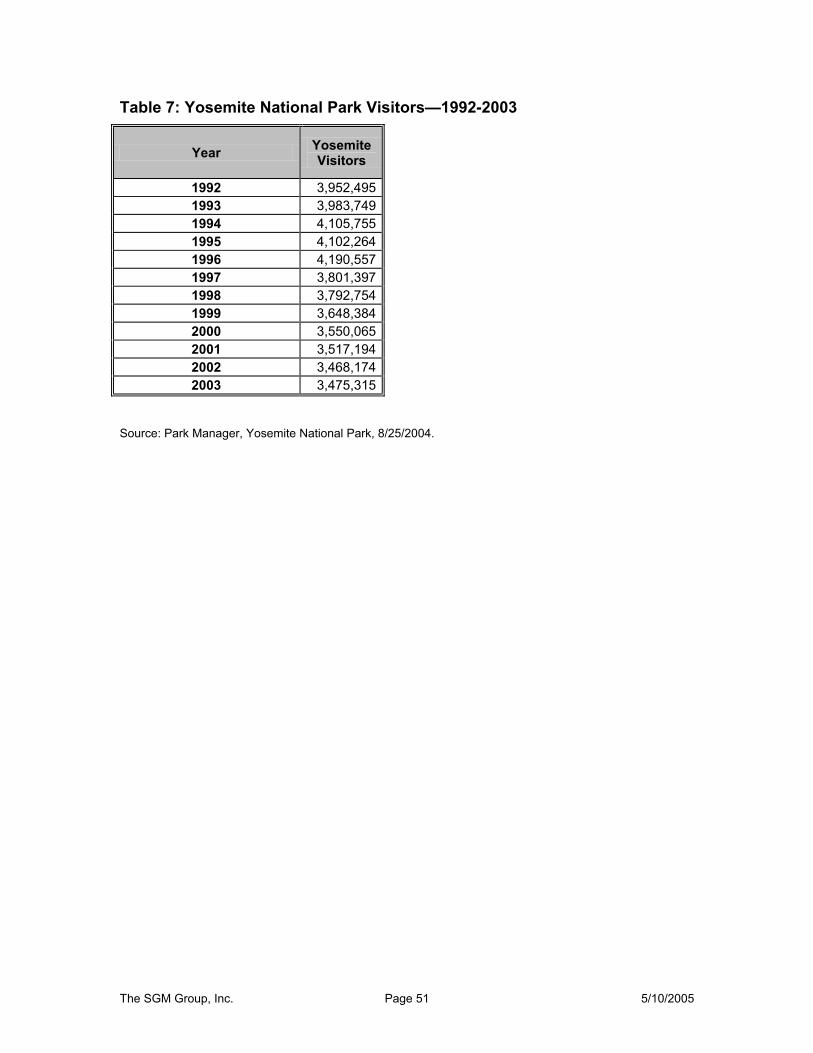
The SGM Group, Inc. Page 51 5/10/2005
Table 7: Yosemite National Park Visitors—1992-2003
Year Yosemite Visitors
1992 3,952,495 1993 3,983,749 1994 4,105,755 1995 4,102,264 1996 4,190,557 1997 3,801,397 1998 3,792,754 1999 3,648,384 2000 3,550,065 2001 3,517,194 2002 3,468,174 2003 3,475,315
Source: Park Manager, Yosemite National Park, 8/25/2004.

The SGM Group, Inc. Page 52 5/10/2005
Table 8: Housing Characteristics—Two-County Study Area 2000-2004
Housing Distribution 2000 2001 2002 2003 2004
Bishop Single Detached 843 848 847 845 843 Single Attached 76 76 78 78 78 2-4 Unit 262 262 262 262 262 5 Plus 323 323 323 323 323 Mobile Homes 363 363 366 367 367
Unincorporated Inyo Single Detached 4,602 4,617 4,626 4,644 4,653 Single Attached 134 134 134 134 134 2-4 Unit 145 145 145 145 145 5 Plus 145 145 145 145 145 Mobile Homes 2,149 2,149 2,171 2,171 2,197
Mammoth Lakes Single Detached 2,123 2,171 2,204 2,204 2,241 Single Attached 965 965 965 1,003 1,003 2-4 Unit 1,540 1,600 1,668 1,712 1,758 5 Plus 3,139 3,221 3,282 3,306 3,488 Mobile Homes 193 193 193 193 193
Unincorporated Mono Single Detached 2,474 2,485 2,500 2,512 2,760 Single Attached 210 225 225 256 256 2-4 Unit 296 300 304 307 307 5 Plus 74 74 74 74 74 Mobile Homes 743 754 761 779 779
Total Units 20,799 21,050 21,273 21,460 22,006 Total Occupied 12,840 12,950 13,059 13,146 13,417 % Vacant 38.27% 38.48% 38.61% 38.74% 39.03%
Source: The SGM Group, Inc.; California Department of Finance, Demographic Research Division.

The SGM Group, Inc. Page 53 5/10/2005
Table 9: Development Activity, by Use, Inyo County, 1999-2003 (In square feet)
JURISDICTION 1999 2000 2001 2002 2003
Inyo Co Residential 104,068 108,498 87,289 85,266 70,510 Commercial/Industrial 27,357 203,537 23,710 13,352 38,350 Motel 34,096 15,502 0 0 0 Total 165,521 327,537 110,999 98,618 108,860 City of Bishop Residential 1,995 5,498 4,547 4,446 0 Commercial/Industrial 105,462 0 3,100 0 0 Total 107,457 5,498 7,647 4,446 0 Total 272,978 333,035 118,646 103,064 108,860
Source: County of Inyo Office of Assessor, City of Bishop – Planning; and The SGM Group, Inc.

The SGM Group, Inc. Page 54 5/10/2005
Table 10: Output, Value Added and Employment—Mono County 2001
Industry Industry Output* Employment Employee
Compensation* Proprietor Income*
Other Property Income*
Indirect Business
Tax*
Total Value
Added* 11 Ag, Forestry, Fish & Hunting $5.37 121.51 $0.22 -$0.95 $0.71 $0.11 $0.09 21 Mining $4.15 17.81 $0.87 $0.00 $0.17 $0.23 $1.27 22 Utilities $1.14 58.22 $0.16 $0.13 $0.33 $0.12 $0.74 23 Construction $78.78 928.07 $23.89 $8.52 -$2.59 $0.63 $30.45 31-33 Manufacturing $8.51 65.69 $1.58 $0.12 $1.39 $0.20 $3.29 42 Wholesale Trade $0.90 99.84 $0.19 $0.01 $0.05 $0.10 $0.35 48-49 Transportation & Warehousing $2.60 37.98 $1.10 $0.03 $0.15 $0.01 $1.29 44-45 Retail trade $50.00 1,061.14 $19.06 $3.16 $2.31 $5.25 $29.79 51 Information $6.43 81.04 $1.49 $0.28 $0.62 $0.11 $2.50 52 Finance & insurance $10.54 117.09 $2.28 $0.20 $2.97 $0.20 $5.65 53 Real estate & rental $93.29 901.72 $10.48 $4.33 $40.55 $10.70 $66.07 54 Professional- scientific & tech svcs $24.41 469.07 $10.82 $2.93 $4.23 $0.18 $18.17 55 Management of companies $0.89 36.11 $0.03 $0.00 $0.00 $0.00 $0.03 56 Administrative & waste services $8.39 134.81 $2.91 $0.49 $1.06 $0.26 $4.72 61 Educational svcs $0.52 103.30 $0.06 $0.00 $0.04 $0.00 $0.11 62 Health & social services $13.23 218.36 $6.20 $1.23 $1.75 $0.10 $9.28 71 Arts- entertainment & recreation $7.03 245.06 $2.11 $0.86 $0.83 $0.30 $4.10 72 Accommodation & food services $138.29 2,571.40 $40.01 $14.34 $17.05 $9.92 $81.32 81 Other services $23.99 444.15 $5.74 $1.39 $4.44 $0.66 $12.24 92 Government $124.31 1,789.64 $78.82 $0.00 $30.13 $3.60 $112.55
Totals $602.76 9,502.00 $208.02 $37.07 $106.20 $32.70 $384.00
*Millions of dollars Source: BEA, IMPLAN, and The SGM Group, Inc.
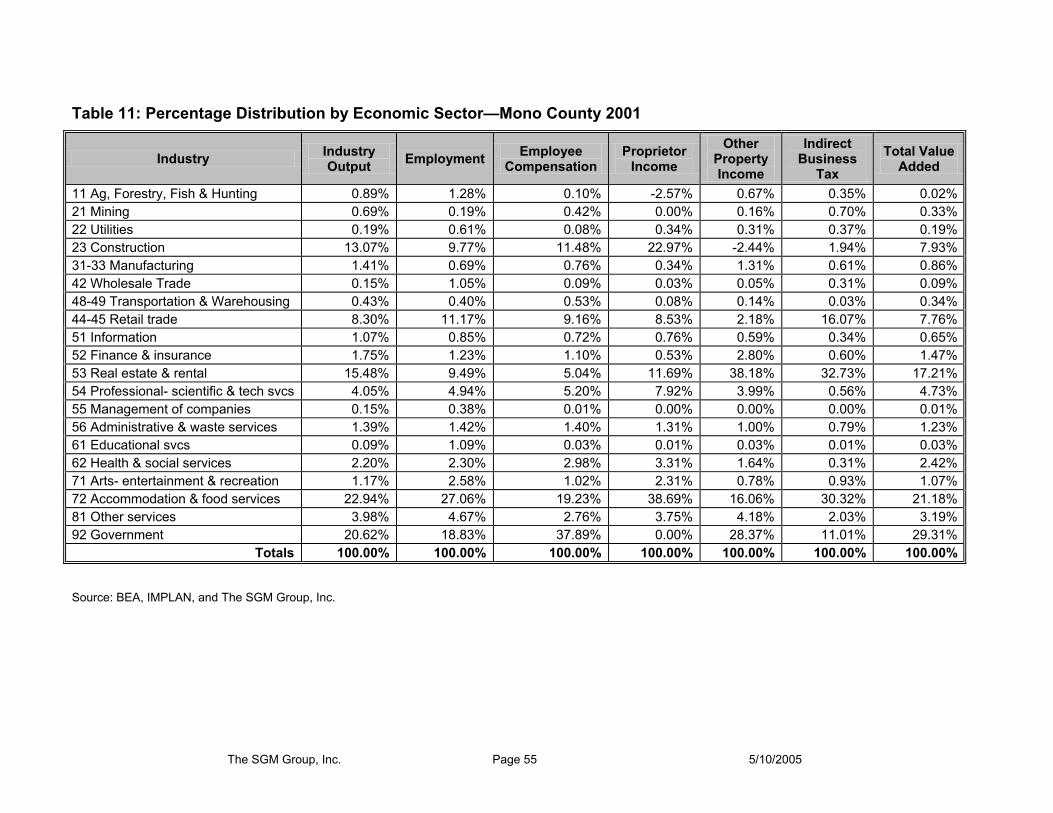
The SGM Group, Inc. Page 55 5/10/2005
Table 11: Percentage Distribution by Economic Sector—Mono County 2001
Industry Industry Output Employment Employee
Compensation Proprietor
Income Other
Property Income
Indirect Business
Tax Total Value
Added
11 Ag, Forestry, Fish & Hunting 0.89% 1.28% 0.10% -2.57% 0.67% 0.35% 0.02% 21 Mining 0.69% 0.19% 0.42% 0.00% 0.16% 0.70% 0.33% 22 Utilities 0.19% 0.61% 0.08% 0.34% 0.31% 0.37% 0.19% 23 Construction 13.07% 9.77% 11.48% 22.97% -2.44% 1.94% 7.93% 31-33 Manufacturing 1.41% 0.69% 0.76% 0.34% 1.31% 0.61% 0.86% 42 Wholesale Trade 0.15% 1.05% 0.09% 0.03% 0.05% 0.31% 0.09% 48-49 Transportation & Warehousing 0.43% 0.40% 0.53% 0.08% 0.14% 0.03% 0.34% 44-45 Retail trade 8.30% 11.17% 9.16% 8.53% 2.18% 16.07% 7.76% 51 Information 1.07% 0.85% 0.72% 0.76% 0.59% 0.34% 0.65% 52 Finance & insurance 1.75% 1.23% 1.10% 0.53% 2.80% 0.60% 1.47% 53 Real estate & rental 15.48% 9.49% 5.04% 11.69% 38.18% 32.73% 17.21% 54 Professional- scientific & tech svcs 4.05% 4.94% 5.20% 7.92% 3.99% 0.56% 4.73% 55 Management of companies 0.15% 0.38% 0.01% 0.00% 0.00% 0.00% 0.01% 56 Administrative & waste services 1.39% 1.42% 1.40% 1.31% 1.00% 0.79% 1.23% 61 Educational svcs 0.09% 1.09% 0.03% 0.01% 0.03% 0.01% 0.03% 62 Health & social services 2.20% 2.30% 2.98% 3.31% 1.64% 0.31% 2.42% 71 Arts- entertainment & recreation 1.17% 2.58% 1.02% 2.31% 0.78% 0.93% 1.07% 72 Accommodation & food services 22.94% 27.06% 19.23% 38.69% 16.06% 30.32% 21.18% 81 Other services 3.98% 4.67% 2.76% 3.75% 4.18% 2.03% 3.19% 92 Government 20.62% 18.83% 37.89% 0.00% 28.37% 11.01% 29.31%
Totals 100.00% 100.00% 100.00% 100.00% 100.00% 100.00% 100.00%
Source: BEA, IMPLAN, and The SGM Group, Inc.

The SGM Group, Inc. Page 56 5/10/2005
Table 12: Output, Value Added and Employment—Inyo County 2001
Industry Industry Output* Employment Employee
Compensation* Proprietor Income*
Other Property Income*
Indirect Business
Tax*
Total Value
Added* 11 Ag, Forestry, Fish & Hunting $10.06 185.24 $1.17 -$1.19 -$0.01 $0.18 $0.15 21 Mining $32.16 182.71 $6.05 $0.72 $2.12 $0.96 $9.86 22 Utilities $13.26 107.01 $1.79 $1.41 $3.91 $1.47 $8.57 23 Construction $46.46 535.94 $14.10 $5.03 -$1.53 $0.37 $17.98 31-33 Manufacturing $59.85 244.31 $6.95 $0.60 $4.77 $0.36 $12.67 42 Wholesale Trade $6.81 114.52 $2.37 $0.13 $0.62 $1.26 $4.39 48-49 Transportation & Warehousing $13.70 184.71 $4.42 $0.31 $1.41 $0.12 $6.26 44-45 Retail trade $65.81 1,396.75 $25.35 $4.18 $2.99 $6.77 $39.29 51 Information $16.06 134.61 $3.40 $0.64 $0.99 $0.56 $5.60 52 Finance & insurance $10.57 154.97 $2.52 $0.10 $4.57 $0.15 $7.34 53 Real estate & rental $19.08 313.98 $1.80 $0.82 $8.53 $2.15 $13.30 54 Professional- scientific & tech svcs $21.59 338.58 $9.40 $2.56 $3.69 $0.30 $15.94 55 Management of companies $4.87 85.45 $2.28 $0.08 $0.15 $0.07 $2.58 56 Administrative & waste services $10.78 322.23 $4.52 $0.93 $1.11 $0.14 $6.70 61 Educational svcs $2.37 65.00 $1.18 $0.07 $0.28 $0.02 $1.55 62 Health & social services $33.86 684.15 $14.96 $3.44 $3.25 $0.20 $21.85 71 Arts- entertainment & recreation $5.34 252.10 $1.33 $0.54 $0.75 $0.24 $2.86 72 Accommodation & food services $67.52 1,608.74 $18.64 $7.56 $5.19 $4.37 $35.75 81 Other services $51.39 747.63 $9.64 $3.12 $10.70 $1.67 $25.13 92 Government $193.43 2,669.37 $109.12 $0.00 $45.28 $5.67 $160.07
Totals $684.98 10,328.00 $240.99 $31.07 $98.75 $27.02 $397.83 *Millions of dollars Source: BEA, IMPLAN, and The SGM Group, Inc.

The SGM Group, Inc. Page 57 5/10/2005
Table 13: Percentage Distribution by Economic Sector—Inyo County 2001
Industry Industry Output Employment Employee
Compensation Proprietor
Income Other
Property Income
Indirect Business
Tax Total Value
Added
11 Ag, Forestry, Fish & Hunting 1.47% 1.79% 0.48% -3.82% -0.01% 0.66% 0.04% 21 Mining 4.69% 1.77% 2.51% 2.33% 2.15% 3.56% 2.48% 22 Utilities 1.94% 1.04% 0.74% 4.52% 3.96% 5.45% 2.16% 23 Construction 6.78% 5.19% 5.85% 16.19% -1.55% 1.38% 4.52% 31-33 Manufacturing 8.74% 2.37% 2.88% 1.93% 4.83% 1.33% 3.18% 42 Wholesale Trade 0.99% 1.11% 0.98% 0.43% 0.63% 4.67% 1.10% 48-49 Transportation & Warehousing 2.00% 1.79% 1.83% 1.01% 1.43% 0.43% 1.57% 44-45 Retail trade 9.61% 13.52% 10.52% 13.45% 3.03% 25.06% 9.88% 51 Information 2.34% 1.30% 1.41% 2.07% 1.01% 2.06% 1.41% 52 Finance & insurance 1.54% 1.50% 1.04% 0.32% 4.62% 0.57% 1.84% 53 Real estate & rental 2.79% 3.04% 0.75% 2.65% 8.64% 7.96% 3.34% 54 Professional- scientific & tech svcs 3.15% 3.28% 3.90% 8.24% 3.73% 1.11% 4.01% 55 Management of companies 0.71% 0.83% 0.95% 0.27% 0.15% 0.26% 0.65% 56 Administrative & waste services 1.57% 3.12% 1.87% 3.00% 1.12% 0.52% 1.68% 61 Educational svcs 0.35% 0.63% 0.49% 0.24% 0.29% 0.06% 0.39% 62 Health & social services 4.94% 6.62% 6.21% 11.07% 3.29% 0.72% 5.49% 71 Arts- entertainment & recreation 0.78% 2.44% 0.55% 1.75% 0.76% 0.89% 0.72% 72 Accommodation & food services 9.86% 15.58% 7.73% 24.33% 5.25% 16.17% 8.99% 81 Other services 7.50% 7.24% 4.00% 10.04% 10.83% 6.16% 6.32% 92 Government 28.24% 25.85% 45.28% 0.00% 45.85% 20.97% 40.24%
Totals 100.00% 100.00% 100.00% 100.00% 100.00% 100.00% 100.00% Source: BEA, IMPLAN, and The SGM Group, Inc.

The SGM Group, Inc. Page 58 5/10/2005
Table 14: Employment and Population—Two-County Study Area 1990-2004
Year Full and Part-Time Employment Population
1990 17,057 28,237 1991 16,283 28,356 1992 16,516 28,744 1993 16,948 29,254 1994 16,963 29,878 1995 17,681 30,044 1996 17,712 30,077 1997 18,016 30,239 1998 18,464 30,146 1999 18,802 30,557 2000 19,393 30,798 2001 19,830 30,896 2002 20,284 31,331 2003 20,869 31,554 2004 21,140 31,791
Source: BEA, US Department of Commerce; US Census; The SGM Group, Inc.

The SGM Group, Inc. Page 59 5/10/2005
Table 15: Case Study Airport Characteristics
Airport Aspen/Pitkin County, Sardy Field
Jackson Hole Airport
Telluride Regional
Montrose Regional
Eagle County Regional Airport
Mammoth Yosemite Airport
Eastern Sierra Regional Airport
Physical Characteristics
Location Aspen, Colorado Jackson, Wyoming
Telluride, Colorado
Montrose, Colorado Vail, Colorado Mammoth Lakes,
CA Bishop, CA
Number of Runways 1 1 1 1 1 1 3
Length and Width 7,006 ft. by 100 ft. 6,300 ft. by 150 ft. 6,870 ft. by 100 ft. 7,500 ft. by 100 ft. 8,000 ft. by 150 ft. 7,000 ft. by 100 ft.
5,566 ft. by 100 ft 7,498 ft. by 100 ft. 5,500 ft. by 100 ft.
Elevation 7,820 ft. 6,451 ft. 9,078 ft. 5,759 ft. 6,500 ft. 7,128 ft. 4,120 ft. 2002 Passenger Boardings 188,330 184,874 17,264 70,510 163,948 --- ---
Large Certified 176,918 (93.9%) 121,970 (66.0%) --- 27,669 (39.2%) --- --- --- Small & Commuter 11,085 (5.9%) 62,467 (33.8%) 17,264 (100%) 42,841 (60.8%) --- --- --- Air Taxi 327 (0.2%) 437 (0.2%) --- --- --- --- --- FFC & In-Transit 0 0 --- --- --- --- ---
Economic Indicators
Enplanements Available Available Available Available Available No Commercial Service
No Commercial Service
Lodging Occupancy Rate Available Available 2004 Available Not applicable Not available Available Not Available
Tax Data Sales, Use, and Retail Tax
Sales, Use and Retail Tax
Sales and Use Tax Sales and Use Tax Sales and Use
Tax Transient
Occupancy Tax Transient
Occupancy Tax National Park Visitation Not applicable Available Not applicable Not applicable Not applicable Available Available
Skier Days Available Available Available Not applicable Available Available Not applicable Wastewater Flows Available Available --- --- --- Available Available
Employment Pitkin County Teton County San Miguel County
Montrose County and Ouray County Eagle County Mono County Inyo County
Population Estimates Available Available Available Available Available Available Available
Sources: FAA Airport Master Records (9/30/04), FAA CY 2002 Passenger Boardings at Commercial Service Airports by Type of Carrier; Hayes Planning Associates, Inc.; and The SGM Group, Inc. The analysis combines Telluride and Montrose Regional Airports into one characteristic facility.

The SGM Group, Inc. Page 60 5/10/2005
Table 16: Telluride and Montrose Regional Airport Case Study—Area Analysis 1993-2003
YEAR 3-COUNTY POPULATION
3-COUNTY TOTAL
EMPLOYMENT
3-COUNTY SALES
AND USE TAX
SKIER DAYS
ENPLANEMENTS TELLURIDE PLUS
MONTROSE
ANNUAL AVERAGE
OCCUPANCY RATE
AVG ANNUAL SUMMER
OCCUPANCY RATES
(JUNE-SEPT)
AVG. ANNUAL WINTER
OCCUPANCY RATES
(DEC- MARCH)
OCCUPIED ANNUAL PILLOW NIGHTS
1993 34,575 22,175 $4,154,573 300,388 62,004 N/A N/A N/A N/A 1994 36,360 24,081 $4,686,962 301,748 63,594 N/A N/A N/A N/A 1995 38,157 25,269 $4,812,208 270,916 59,773 N/A N/A N/A N/A 1996 39,542 25,979 $4,548,717 306,507 63,674 N/A N/A N/A N/A 1997 40,774 27,296 $4,839,694 375,027 76,668 38% 45% 58% 632,900 1998 41,927 28,188 $5,616,120 382,467 80,340 39% 41% 59% 657,100 1999 42,925 29,134 $5,728,895 309,737 94,922 37% 43% 54% 663,000 2000 44,000 30,175 $5,927,019 334,506 83,825 33% 43% 43% 588,200 2001 45,073 30,503 $5,746,168 341,370 91,328 30% 36% 43% 553,900 2002 46,466 30,897 $5,824,695 367,252 87,774 33% 37% 50% 638,100 2003 N/A N/A N/A 367,775 88,842 33% 40% 47% 659,700
Source: Telluride Visitors Information Center, FAA TAF Enplanement Data; The SGM Group, Inc. Note: The three counties used in this analysis include Miguel, Montrose, and Ouray Counties. The total enplanements reflect combined FAA TAF numbers for Telluride and Montrose airports. The occupancy rate data applies to Telluride only.

The SGM Group, Inc. Page 61 5/10/2005
Table 17: Telluride and Montrose Regional Airport—Employment Forecast Model 1993-2001
Year Total 3-County Employment
Total 3-County Employment
Model Forecast Difference (Actual-Forecast)
1993 22,175 22,505 (330) 1994 24,081 24,690 (609) 1995 25,269 24,629 640 1996 25,979 24,214 1,765 1997 27,296 26,690 606 1998 28,188 29,984 (1,796) 1999 29,134 29,364 (230) 2000 30,175 30,461 (286) 2001 30,503 29,931 572 Source: http://www.media-coloradoski.com/; http://dola.colorado.gov/cedis/county/cty2.cfm?choice=1; Telluride Airport Manager; Regional Economic Information System, Bureau of Economic Analysis (BEA); The SGM Group, Inc.
Note: The methodology used to forecast the potential impact of the proposed airport improvement project is based on derivation of regression models to forecast future employment using related historic characteristics and trends. As part of this process, two different approaches were used. The first involved preparation of employment forecast models for each of the case study airports, using annual data comparable among the five. This table and the several that follow represent the test models for each of the selected case study areas. In the Telluride case study, the available data included existing employment, population, taxes related as least in part to visitor activity, ski visits, and enplanements. In this case, annual data for all included variables was available only through 2001. In 2001, the enplanements factor contribution to overall employment was between 9% and 10%. The statistical model is shown in Figure 20.
In this model and all of the models that follow, “Total Employment” includes full- and part-time employment as reported by BEA, and population is resident (not visitor) population in the county jurisdiction in which the airport is located. Telluride is located in San Miguel County, Colorado.
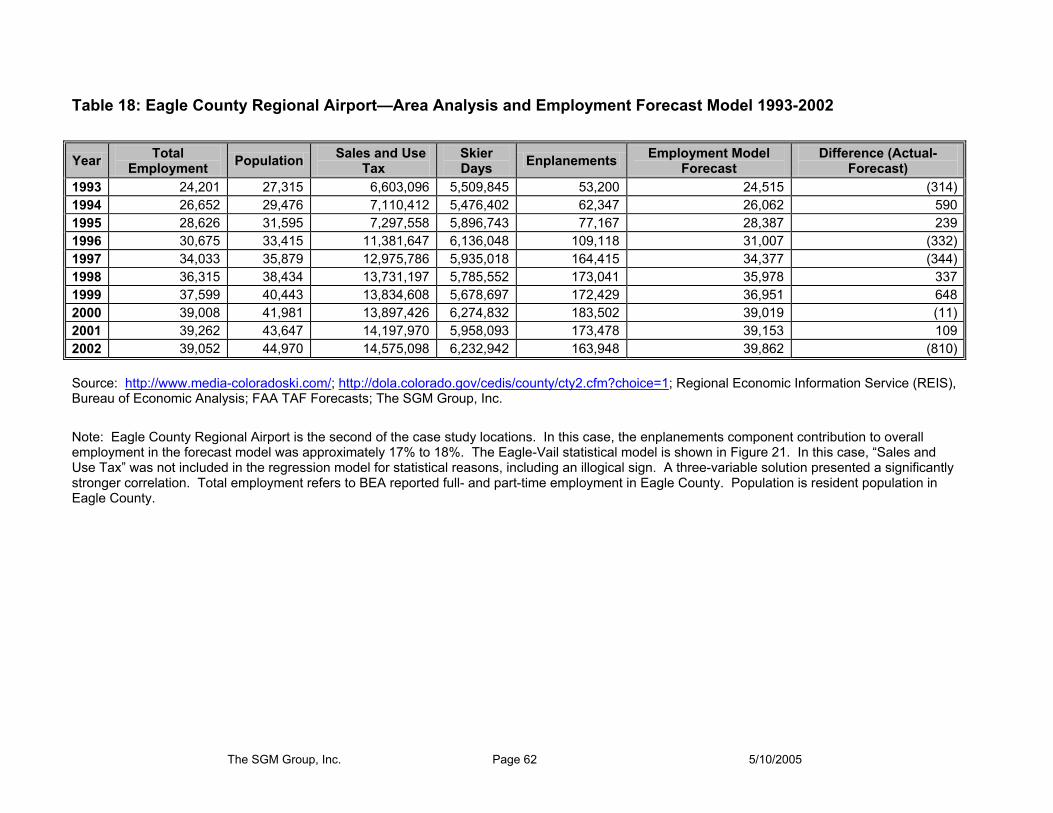
The SGM Group, Inc. Page 62 5/10/2005
Table 18: Eagle County Regional Airport—Area Analysis and Employment Forecast Model 1993-2002
Year Total Employment Population Sales and Use
Tax Skier Days Enplanements Employment Model
Forecast Difference (Actual-
Forecast) 1993 24,201 27,315 6,603,096 5,509,845 53,200 24,515 (314) 1994 26,652 29,476 7,110,412 5,476,402 62,347 26,062 590 1995 28,626 31,595 7,297,558 5,896,743 77,167 28,387 239 1996 30,675 33,415 11,381,647 6,136,048 109,118 31,007 (332) 1997 34,033 35,879 12,975,786 5,935,018 164,415 34,377 (344) 1998 36,315 38,434 13,731,197 5,785,552 173,041 35,978 337 1999 37,599 40,443 13,834,608 5,678,697 172,429 36,951 648 2000 39,008 41,981 13,897,426 6,274,832 183,502 39,019 (11) 2001 39,262 43,647 14,197,970 5,958,093 173,478 39,153 109 2002 39,052 44,970 14,575,098 6,232,942 163,948 39,862 (810) Source: http://www.media-coloradoski.com/; http://dola.colorado.gov/cedis/county/cty2.cfm?choice=1; Regional Economic Information Service (REIS), Bureau of Economic Analysis; FAA TAF Forecasts; The SGM Group, Inc.
Note: Eagle County Regional Airport is the second of the case study locations. In this case, the enplanements component contribution to overall employment in the forecast model was approximately 17% to 18%. The Eagle-Vail statistical model is shown in Figure 21. In this case, “Sales and Use Tax” was not included in the regression model for statistical reasons, including an illogical sign. A three-variable solution presented a significantly stronger correlation. Total employment refers to BEA reported full- and part-time employment in Eagle County. Population is resident population in Eagle County.

The SGM Group, Inc. Page 63 5/10/2005
Table 19: Aspen Case Study—Area Analysis 1993-2003
Year Population Total Employment
Sales and Use Tax Skier Days Enplanements
Average Annual
Occupancy Rate
Average Summer
Occupancy Rates
(June-Sept)
Average Winter Occupancy
Rates (Dec-March)
Number of Pillows
Occupied Annual Pillow
Nights
1993 13,896 18,462 $11,748,197 1,542,094 250,981 52% 63% 63% N/A N/A 1994 14,339 19,225 $15,224,298 1,518,723 251,533 58% 64% 76% N/A N/A 1995 14,603 19,660 $15,636,045 1,433,187 204,907 58% 71% 76% 9,400 1,989,980 1996 14,519 20,316 $15,693,101 1,536,309 206,672 62% 71% 75% 9,487 2,146,908 1997 14,920 21,092 $16,454,539 1,661,775 217,343 62% 68% 80% 8,583 1,942,333 1998 14,886 21,129 $17,529,685 1,510,145 251,448 62% 71% 79% 8,102 1,833,483 1999 15,081 21,076 $15,153,675 1,401,351 219,909 57% 70% 70% 8,185 1,702,889 2000 14,765 21,721 $14,493,216 1,433,154 214,358 60% 69% 72% 7,750 1,697,250 2001 14,870 21,681 $14,997,597 1,351,447 363,654 53% 63% 70% 7,907 1,529,609 2002 14,935 21,599 $14,116,941 1,375,607 336,589 53% 60% 67% 7,838 1,516,261 2003 N/A N/A N/A 1,390,283 N/A 53% 61% 68% 7,838 1,516,261
Source: http://www.media-coloradoski.com/; http://dola.colorado.gov/cedis/county/cty2.cfm?choice=1; Regional Economic Information Service, Bureau of Economic Analysis, US Department of Commerce; FAA TAF Forecasts; Aspen Chamber Resort Association; The SGM Group, Inc. Note: Total employment is full- and part-time employment located in Pitkin County as reported by BEA. Population is resident population in Pitkin County.

The SGM Group, Inc. Page 64 5/10/2005
Table 20: Aspen/Pitkin County Airport—Employment Forecast Model 1993-2002
Year Total Employment
Employment Model Forecast
Difference (Actual-Forecast)
1993 18,462 18,766 (304) 1994 19,225 19,938 (713) 1995 19,660 20,566 (906) 1996 20,316 20,109 207 1997 21,092 20,443 649 1998 21,129 21,090 39 1999 21,076 21,401 (325) 2000 21,721 20,712 1,009 2001 21,681 21,563 118 2002 21,599 21,420 179
Source: Source: http://www.media-coloradoski.com/; http://dola.colorado.gov/cedis/county/cty2.cfm?choice=1; Regional Economic Information Service, Bureau of Economic Analysis; FAA TAF Forecasts; The SGM Group, Inc.
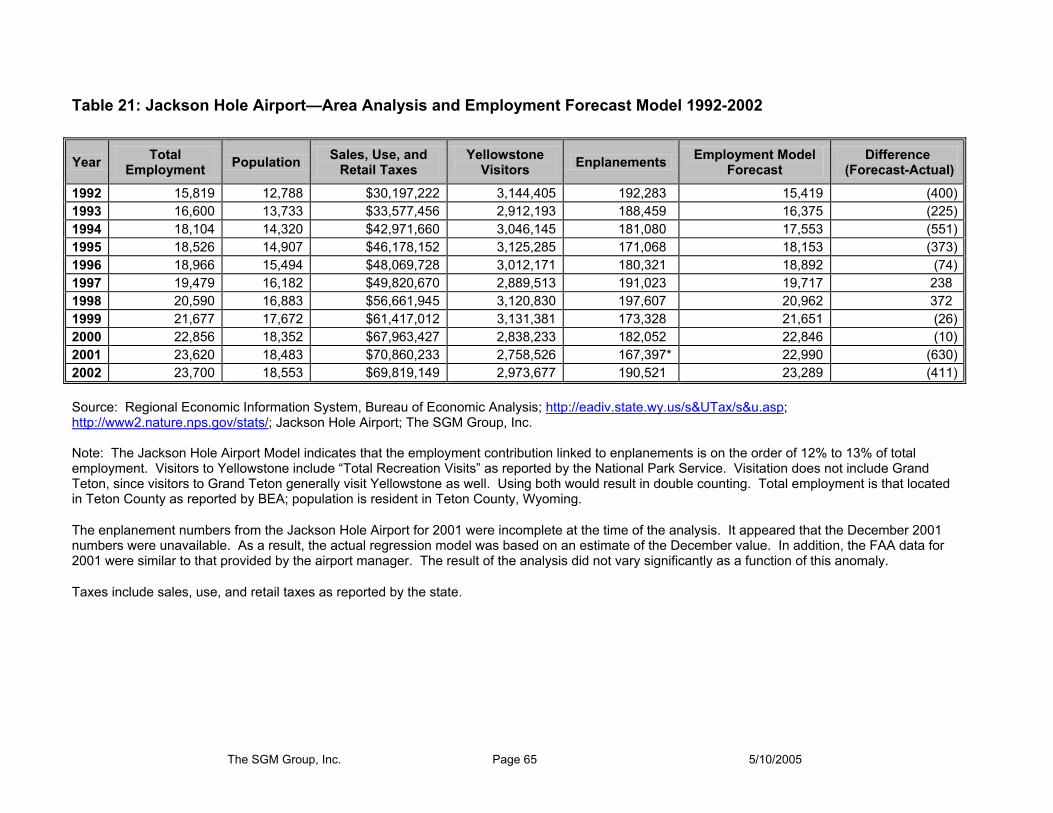
The SGM Group, Inc. Page 65 5/10/2005
Table 21: Jackson Hole Airport—Area Analysis and Employment Forecast Model 1992-2002
Year Total Employment Population Sales, Use, and
Retail Taxes Yellowstone
Visitors Enplanements Employment Model Forecast
Difference (Forecast-Actual)
1992 15,819 12,788 $30,197,222 3,144,405 192,283 15,419 (400) 1993 16,600 13,733 $33,577,456 2,912,193 188,459 16,375 (225) 1994 18,104 14,320 $42,971,660 3,046,145 181,080 17,553 (551) 1995 18,526 14,907 $46,178,152 3,125,285 171,068 18,153 (373) 1996 18,966 15,494 $48,069,728 3,012,171 180,321 18,892 (74) 1997 19,479 16,182 $49,820,670 2,889,513 191,023 19,717 238 1998 20,590 16,883 $56,661,945 3,120,830 197,607 20,962 372 1999 21,677 17,672 $61,417,012 3,131,381 173,328 21,651 (26) 2000 22,856 18,352 $67,963,427 2,838,233 182,052 22,846 (10) 2001 23,620 18,483 $70,860,233 2,758,526 167,397* 22,990 (630) 2002 23,700 18,553 $69,819,149 2,973,677 190,521 23,289 (411) Source: Regional Economic Information System, Bureau of Economic Analysis; http://eadiv.state.wy.us/s&UTax/s&u.asp; http://www2.nature.nps.gov/stats/; Jackson Hole Airport; The SGM Group, Inc. Note: The Jackson Hole Airport Model indicates that the employment contribution linked to enplanements is on the order of 12% to 13% of total employment. Visitors to Yellowstone include “Total Recreation Visits” as reported by the National Park Service. Visitation does not include Grand Teton, since visitors to Grand Teton generally visit Yellowstone as well. Using both would result in double counting. Total employment is that located in Teton County as reported by BEA; population is resident in Teton County, Wyoming.
The enplanement numbers from the Jackson Hole Airport for 2001 were incomplete at the time of the analysis. It appeared that the December 2001 numbers were unavailable. As a result, the actual regression model was based on an estimate of the December value. In addition, the FAA data for 2001 were similar to that provided by the airport manager. The result of the analysis did not vary significantly as a function of this anomaly.
Taxes include sales, use, and retail taxes as reported by the state.

The SGM Group, Inc. Page 66 5/10/2005
Table 22: Composite Forecast Model—Employment Forecast Model 1993-2002
Year Total Employment Population Taxes Skier
Days Enplanements Park Visitation
Model: Employment Projection
Difference (Actual–Forecast)
1993 98,386 118,773 $60,974,922 8,123,006 554,644 6,895,942 96,383 2,003 1994 105,025 124,373 $74,434,532 8,357,890 558,554 7,151,900 106,746 (1,721) 1995 109,762 129,306 $79,389,463 8,480,668 512,915 7,227,549 109,763 (1) 1996 113,648 133,047 $85,225,493 8,844,492 559,785 7,202,728 115,491 (1,843) 1997 119,916 137,994 $90,013,289 8,939,658 649,449 6,690,910 118,988 928 1998 124,686 142,276 $99,728,647 8,637,902 702,436 6,913,584 126,009 (1,323) 1999 128,288 146,678 $102,655,390 8,318,844 660,588 6,779,765 125,744 2,544 2000 133,153 149,896 $109,502,288 9,198,607 663,737 6,388,298 131,850 1,303 2001 134,896 152,969 $113,604,068 8,865,102 795,857 6,275,720 135,532 (636) 2002 135,532 156,255 $112,636,982 9,341,602 778,832 6,441,851 136,599 (1,067) Source: The SGM Group, Inc.; Eagle/Vail; Aspen/Pitkin; Telluride/Montrose; Jackson Hole Airport Manager; NPS; Finance Departments, Colorado and Wyoming; Colorado Ski Country USA; Mammoth Mountain; BEA; Yosemite National Park Manager; and FAA. Note: The second approach used to estimate the statistical contribution of enplanements to total employment combined comparable data from the case study examples with similar data from Mono and Inyo Counties to derive a composite employment forecast model. This model used four factors that appeared to be statistically significant in generating an estimate of total employment: taxes (particularly those related to visitor activity), skier visits, enplanements, and National Park visitation. Adding population to the mix resulted in illogical signs for regression model coefficients. The resulting application indicates a statistical contribution by enplanements of approximately 9% to 11% to the total full- and part-time employment. Park Visitation in this model includes visitors to Yosemite and Yellowstone National Parks. Skier days include combined totals reported for Eagle-Vail, Aspen, Telluride, and Mammoth Lakes. Population refers to permanent residents. Total Employment is full- and part-time employment on a county level as reported by BEA. Counties included in this model are those referenced for Eagle-Vail (Eagle, Colorado), Aspen (Pitkin, Colorado), Telluride (San Miguel, Montrose, and Ouray Counties Colorado), Jackson Hole (Teton, Wyoming), and Mono/Inyo Counties. Enplanement data for Telluride as includes Montrose Airport.
The resulting enplanements coefficient of 0.01817 is comparable to that resulting from individual case study models, which for Telluride, Aspen/Pitkin, and Eagle/Vail averaged 0.021. The composite forecast model is shown in Figure 24.

The SGM Group, Inc. Page 67 5/10/2005
Table 23: Alternative Employment Forecast Models—Summary Output
Zero Constant Models--Statistical Coefficients
Alternative 1 Alternative 2 Alternative 3 Alternative 4 Alternative 5 Preferred Model
Enplanement Regression Factors
Eagle County 0.040415137 0.040415137 0.040415137 0.040415137 0.040415137 0.040415137 Aspen/Pitkin 0.002428992 0.002428992 0.002428992 0.002428992 0.002428992 0.002428992 Telluride 0.010949552 0.010949552 0.010949552 0.010949552 0.010949552 0.010949552 Jackson Hole 0.013834 0.013834 0.013834 0.013834 0.013834 0.013834 Overall Average: 0.01690692 0.01690692 0.01690692 0.01690692 0.01690692 0.01690692 Average: Eagle/Aspen/Telluride 0.017931227 0.017931227 0.017931227 0.017931227 0.017931227 0.017931227 Average: Eagle/Aspen 0.021422065 0.021422065 0.021422065 0.021422065 0.021422065 0.021422065 Composite Model 0.016471579 0.017774161 0.023440756 0.02456452 0.026099537 0.018174317 Overall average 0.01668925 0.01734054 0.020173838 0.02073572 0.021503228 0.017540619 Employment-Composite 2,752 2,970 3,917 4,105 4,361 3,037 Preferred Model: 0.018174317
Source: The SGM Group, Inc. Note: This table illustrates outputs of several tested regression models measuring enplanement component coefficients. Glacier Park was not included, since it was determined that the characteristic data available were not comparable to the situation at Mammoth Lakes. The coefficient chosen for future forecasts for the two-county Mono and Inyo impact model was the composite model coefficient: 0.01817. That model appeared to represent the most consistent logical application of the available annual historic data. This model output used data from case study examples as well as from Mono and Inyo Counties, and used available data from 1993 through 2002 (the latest year for which all categories had data).

The SGM Group, Inc. Page 68 5/10/2005
Table 24: Target Year Forecasts—Mono and Inyo Counties 2007-2017
Year Population Transient Occupancy Tax Mammoth and Inyo Yosemite Visitors Skier Days MMH Enplanements
2007 32,500 $9,449,972 3,616,427 1,491,074 29,300 2008 32,737 $9,733,810 3,652,591 1,542,466 50,800 2009 32,973 $10,017,314 3,689,117 1,593,888 72,300 2010 33,209 $10,300,483 3,726,008 1,645,340 93,800 2011 33,446 $10,583,313 3,763,268 1,696,822 115,300 2012 33,682 $10,865,800 3,800,901 1,748,335 136,800 2013 33,919 $11,147,940 3,838,910 1,799,880 142,860 2014 34,155 $11,429,731 3,877,299 1,851,455 148,920 2015 34,391 $11,711,169 3,916,072 1,903,063 154,980 2016 34,628 $11,992,251 3,955,233 1,954,702 161,040 2017 34,864 $12,272,972 3,994,785 2,006,374 167,100 Source: The SGM Group, Inc.; Enplanements—Ricondo Associates, May 2004.

The SGM Group, Inc. Page 69 5/10/2005
Table 25: Population and Employment Forecast—Mono and Inyo Counties 2007-2017 Model Output
Year Population—
No Action Alternative
Population— Build
Alternative
Full and Part-Time Employment—
No Action Alternative
Full and Part-Time Employment—
Build Alternative Additional
Employment Additional Population
2000 30,798 30,798 19,393 19,393 - - 2001 30,896 30,896 19,830 19,830 - - 2002 31,331 31,331 20,284 20,284 - - 2003 31,554 31,554 20,869 20,869 - - 2004 31,791 31,791 21,140 21,140 - - 2005 32,027 32,027 21,574 21,574 - - 2006 32,264 32,264 22,081 22,081 - - 2007 32,500 33,266 22,588 23,121 533 766 2008 32,737 34,045 23,096 24,019 923 1,309 2009 32,973 34,809 23,604 24,918 1,314 1,836 2010 33,209 35,557 24,113 25,818 1,705 2,348 2011 33,446 36,292 24,622 26,717 2,095 2,846 2012 33,682 37,014 25,131 27,618 2,486 3,332 2013 33,919 37,353 25,642 28,238 2,596 3,434 2014 34,155 37,690 26,152 28,859 2,707 3,535 2015 34,391 38,025 26,663 29,480 2,817 3,633 2016 34,628 38,357 27,175 30,102 2,927 3,730 2017 34,864 38,689 27,687 30,724 3,037 3,824
Annual Rate of Growth:
2005-2017 0.71% 1.59% 2.10% 2.99%
Source: Forecast: The SGM Group, Inc.

The SGM Group, Inc. Page 70 5/10/2005
Table 26: Development Impact—Mono and Inyo Counties 2007-2017 Model Output
Year Total Housing
Units—No Action Alternative*
Total Housing Units—Build Alternative*
Additional Occupied Housing
Units* Additional Housing
Units* Occupancy
Rate
Additional Commercial
Development (Sq. ft.)**
Additional Lodging Units**
2000 20,799 20,799 - - 61.73% - - 2001 21,050 21,050 - - 61.52% - - 2002 21,273 21,273 - - 61.39% - - 2003 21,460 21,460 - - 61.26% - - 2004 22,006 22,006 - - 60.97% - - 2005 22,088 22,088 - - 60.89% - - 2006 22,331 22,331 - - 60.74% - - 2007 22,575 23,113 326 538 60.59% 43,092 36 2008 22,818 23,739 557 921 60.44% 74,712 63 2009 23,061 24,357 781 1,296 60.29% 106,333 90 2010 23,305 24,966 999 1,661 60.14% 137,953 117 2011 23,548 25,567 1,211 2,019 59.98% 169,573 144 2012 23,792 26,161 1,418 2,370 59.83% 201,194 170 2013 24,035 26,484 1,461 2,449 59.68% 210,106 178 2014 24,278 26,805 1,504 2,527 59.53% 219,019 186 2015 24,521 27,125 1,546 2,604 59.38% 227,931 193 2016 24,765 27,444 1,587 2,680 59.23% 236,844 201 2017 25,008 27,763 1,627 2,755 59.08% 245,756 208
Projected Rate of Growth: 2005-2017
1.04% 1.92%
Source: Forecast—The SGM Group, Inc.; existing information—California Department of Finance, Demographic Research Division. * Total increase in Mono and Inyo Counties. ** Total increase in the Town of Mammoth Lakes.

The SGM Group, Inc. Page 71 5/10/2005
Note: The tables labeled “Model Output” illustrate the impact model output and represent the potential economic impact of proposed Mammoth Yosemite Airport improvements. These impact forecasts use the composite regression model illustrated in Figure 24. As shown, in 2017 the proposed airport improvement project is expected to generate approximately 3,037 additional full- and part-time employees in Mono and Inyo Counties when compared to the no-action alternative. This total increase is based on the forecasted composite regression model enplanement contribution of 1.8997%. Overall, this additional employment in 2017 (the first full year of activity) represents an 11% employment increase over the no-action alternative. Based on the measured labor-force participation rates for the two counties, the additional resident population in 2017 attributed to airport improvements is expected to reach 3,824.
As a result of the estimated population increase, 2,755 additional housing units in Mono and Inyo Counties are expected in 2017, with 1,627 occupied. The applied average occupancy rate of 59% reflects the importance of the 2nd home market in the Mammoth Lakes area and is based on a forecast of historic occupancy rates.
Using past development activity ratios for the Town of Mammoth Lakes, additional commercial/industrial/retail space in the Town should reach nearly 246.000 square feet by 2017, with an addition of 208 lodging units. The estimate of additional lodging units is based on ratios characteristic of past history. Proposed additions to the market that represent a change in market character, including the new condominium hotels proposed by the private sector, are not represented in these forecasts; however, since the forecasts are derived as a “difference” between the “with” and “without” alternatives, estimates of resulting benefits are consistent with past development history. The increase in commercial/industrial/retail space and lodging units is estimated only for the Town of Mammoth Lakes because comprehensive data on total existing lodging units and commercial space for the two counties is not available.
The forecasted change in employment as a function of proposed improvements to the Mammoth Yosemite Airport provides the basis for derivation of the two-county input-output model. Using that input-output model, change in employment translates into estimated change in value-added, change in total output, and change in taxes for the two-county impact area.
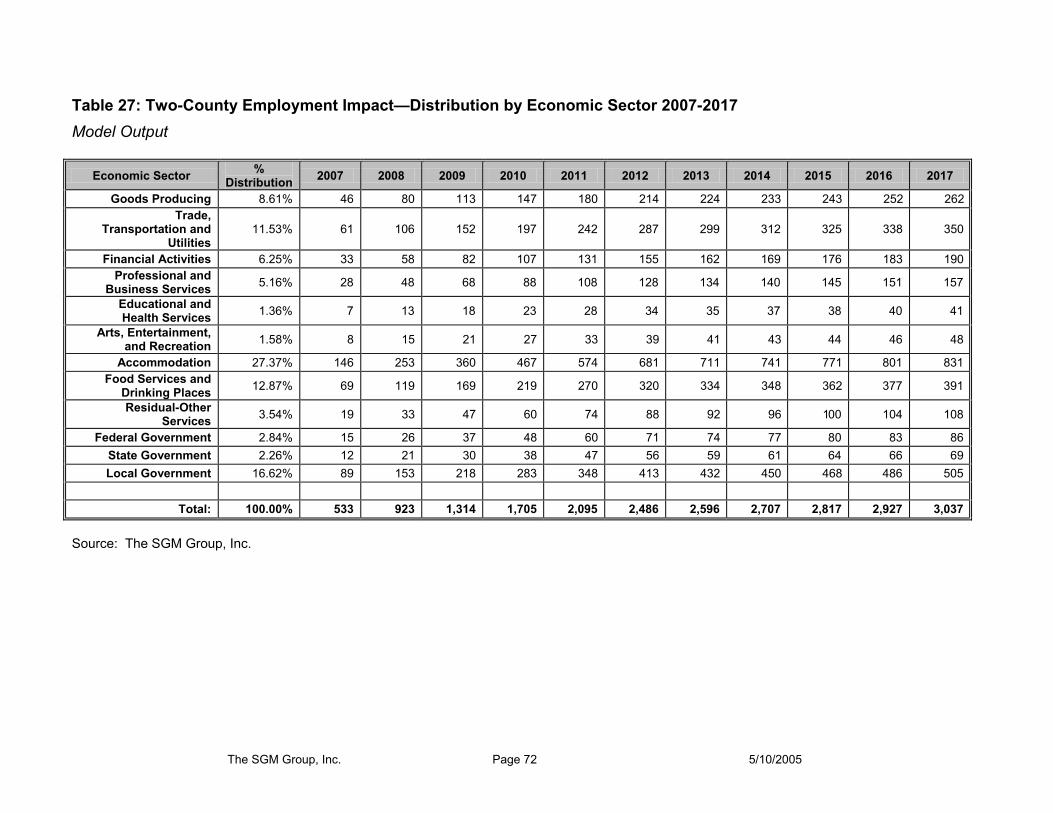
The SGM Group, Inc. Page 72 5/10/2005
Table 27: Two-County Employment Impact—Distribution by Economic Sector 2007-2017 Model Output
Economic Sector % Distribution 2007 2008 2009 2010 2011 2012 2013 2014 2015 2016 2017
Goods Producing 8.61% 46 80 113 147 180 214 224 233 243 252 262 Trade,
Transportation and Utilities
11.53% 61 106 152 197 242 287 299 312 325 338 350
Financial Activities 6.25% 33 58 82 107 131 155 162 169 176 183 190 Professional and
Business Services 5.16% 28 48 68 88 108 128 134 140 145 151 157
Educational and Health Services 1.36% 7 13 18 23 28 34 35 37 38 40 41
Arts, Entertainment, and Recreation 1.58% 8 15 21 27 33 39 41 43 44 46 48
Accommodation 27.37% 146 253 360 467 574 681 711 741 771 801 831 Food Services and
Drinking Places 12.87% 69 119 169 219 270 320 334 348 362 377 391
Residual-Other Services 3.54% 19 33 47 60 74 88 92 96 100 104 108
Federal Government 2.84% 15 26 37 48 60 71 74 77 80 83 86 State Government 2.26% 12 21 30 38 47 56 59 61 64 66 69 Local Government 16.62% 89 153 218 283 348 413 432 450 468 486 505
Total: 100.00% 533 923 1,314 1,705 2,095 2,486 2,596 2,707 2,817 2,927 3,037
Source: The SGM Group, Inc.

The SGM Group, Inc. Page 73 5/10/2005
Table 28: Employment Impact—Airport Improvement Project 2017 Industry Direct* Indirect* Induced* Total*
1 11 Ag, Forestry, Fish & Hunting - 2 2 4
19 21 Mining - 0 0 0 30 22 Utilities - 11 5 16 33 23 Construction - 34 3 36 46 31-33 Manufacturing 150 9 6 165
390 42 Wholesale Trade - 10 6 16 391 48-49 Transportation & Warehousing 281 25 7 313 401 44-45 Retail trade - 15 107 122 413 51 Information 40 20 7 67 425 52 Finance & insurance 125 9 14 148 431 53 Real estate & rental - 38 23 61 437 54 Professional- scientific & tech services 166 108 21 296 451 55 Management of companies - 9 3 12 452 56 Administrative & waste services - 33 9 42 461 61 Educational services 24 15 6 45 464 62 Health & social services 26 0 66 92 475 71 Arts- entertainment & recreation 35 9 28 72 479 72 Accommodations & food services 876 19 76 971 482 81 Other services - 16 41 58 495 92 Government (Federal, State, and Local) 463 26 12 500 Total 2,186 409 443 3,037 *Number of Jobs Source: The SGM Group, Inc., and IMPLAN

The SGM Group, Inc. Page 74 5/10/2005
Table 29: Value Added—Airport Improvement Project 2017 Industry Direct* Indirect* Induced* Total*
1 11 Ag, Forestry, Fish & Hunting $1,796 $3,515 $5,311
19 21 Mining $1,132 $76 $1,208 30 22 Utilities $690,648 $347,642 $1,038,290 33 23 Construction $1,222,407 $105,014 $1,327,421 46 31-33 Manufacturing $11,471,679 $485,510 $290,800 $12,247,989
390 42 Wholesale Trade $228,116 $148,698 $376,814 391 48-49 Transportation & Warehousing $11,443,852 $1,015,194 $242,400 $12,701,447 401 44-45 Retail trade $516,578 $3,425,545 $3,942,123 413 51 Information $1,582,043 $784,977 $337,345 $2,704,365 425 52 Finance & insurance $8,511,759 $529,906 $812,132 $9,853,797 431 53 Real estate & rental $2,954,175 $1,816,037 $4,770,212 437 54 Professional- scientific & tech services $7,742,795 $4,803,320 $995,688 $13,541,801 451 55 Management of companies $216,766 $73,006 $289,772 452 56 Administrative & waste services $1,050,189 $259,756 $1,309,945 461 61 Educational services $191,977 $125,799 $91,469 $409,245 464 62 Health & social services $460,329 $111 $2,662,334 $3,122,774 475 71 Arts- entertainment & recreation $721,263 $74,349 $434,019 $1,229,631 479 72 Accommodations & food services $31,739,076 $537,495 $1,634,614 $33,911,184 482 81 Other services $827,408 $1,422,388 $2,249,796 495 92 Government (Federal, State, and Local) $26,900,754 $1,464,861 $5,184,753 $33,550,370
Total $100,765,527 $17,530,734 $20,287,230 $138,583,492 *2004 Dollars Source: The SGM Group, Inc., and IMPLAN.

The SGM Group, Inc. Page 75 5/10/2005
Table 30: Total Output—Airport Improvement Project 2017 Industry Direct* Indirect* Induced* Total*
1 11 Ag, Forestry, Fish & Hunting $62,907 $88,787 $151,694
19 21 Mining $3,592 $224 $3,816 30 22 Utilities $1,068,438 $537,889 $1,606,326 33 23 Construction $2,751,474 $272,366 $3,023,840 46 31-33 Manufacturing $22,453,806 $1,405,964 $940,453 $24,800,224
390 42 Wholesale Trade $371,449 $242,130 $613,580 391 48-49 Transportation & Warehousing $24,559,822 $2,026,318 $537,780 $27,123,918 401 44-45 Retail trade $827,330 $5,648,541 $6,475,871 413 51 Information $2,783,363 $2,343,167 $867,795 $5,994,325 425 52 Finance & insurance $12,484,677 $811,983 $1,424,290 $14,720,951 431 53 Real estate & rental $4,194,456 $2,572,289 $6,766,745 437 54 Professional- scientific & tech services $10,092,599 $6,273,473 $1,347,404 $17,713,476 451 55 Management of companies $477,178 $160,712 $637,891 452 56 Administrative & waste services $1,895,084 $432,921 $2,328,005 461 61 Educational services $360,108 $233,449 $152,346 $745,903 464 62 Health & social services $923,093 $263 $3,975,967 $4,899,323 475 71 Arts- entertainment & recreation $1,174,037 $211,102 $752,742 $2,137,881 479 72 Accommodations & food services $48,547,008 $942,149 $3,290,943 $52,780,100 482 81 Other services $1,537,491 $2,698,192 $4,235,683 495 92 Government (Federal, State, and Local) $52,869,136 $3,054,088 $7,085,294 $63,008,516
Total $176,247,648 $30,491,354 $33,029,063 $239,768,065 *2004 Dollars Source: The SGM Group, Inc., and IMPLAN

The SGM Group, Inc. Page 76 5/10/2005
Table 31: Employee Compensation—Airport Improvement Project 2017
Industry Direct* Indirect* Induced* Total*
1 11 Ag, Forestry, Fish & Hunting $7,024 $12,690 $19,714 19 21 Mining $771 $51 $822 30 22 Utilities $143,410 $72,064 $215,474 33 23 Construction $981,041 $84,171 $1,065,212 46 31-33 Manufacturing $7,737,659 $300,553 $167,059 $8,205,271
390 42 Wholesale Trade $123,339 $80,399 $203,738 391 48-49 Transportation & Warehousing $8,540,294 $755,651 $173,845 $9,469,790 401 44-45 Retail trade $345,356 $2,226,017 $2,571,373 413 51 Information $911,360 $505,327 $190,782 $1,607,469 425 52 Finance & insurance $2,563,947 $188,813 $282,439 $3,035,199 431 53 Real estate & rental $466,113 $292,019 $758,132 437 54 Professional- scientific & tech services $4,580,327 $2,914,206 $590,140 $8,084,673 451 55 Management of companies $191,592 $64,528 $256,119 452 56 Administrative & waste services $620,135 $164,565 $784,700 461 61 Educational services $117,710 $79,836 $77,017 $274,563 464 62 Health & social services $368,118 $90 $1,816,559 $2,184,767 475 71 Arts- entertainment & recreation $298,575 $47,603 $212,184 $558,362 479 72 Accommodation & food services $15,723,707 $283,510 $923,365 $16,930,582 482 81 Other services $311,707 $608,152 $919,860 495 92 Government (Federal, State, and Local) $17,244,128 $915,392 $502,315 $18,661,834 Total $58,085,824 $9,181,468 $8,540,361 $75,807,652 *2004 Dollars Source: The SGM Group, Inc., and IMPLAN.
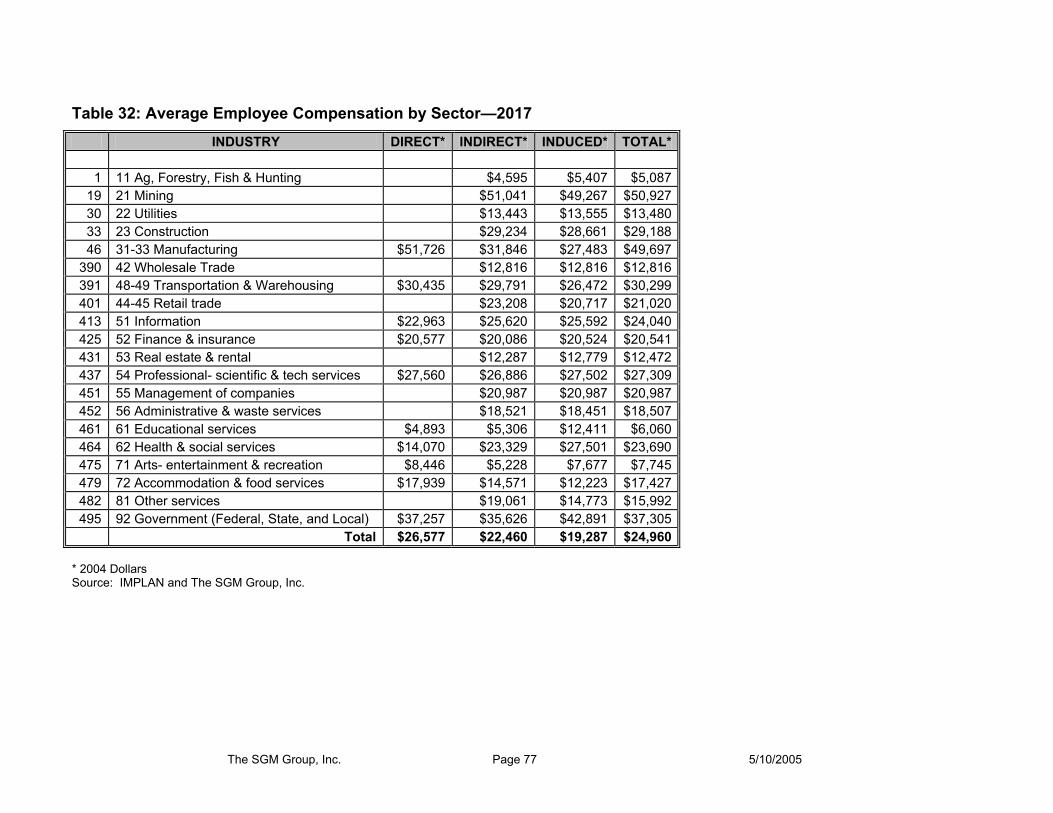
The SGM Group, Inc. Page 77 5/10/2005
Table 32: Average Employee Compensation by Sector—2017 INDUSTRY DIRECT* INDIRECT* INDUCED* TOTAL*
1 11 Ag, Forestry, Fish & Hunting $4,595 $5,407 $5,087
19 21 Mining $51,041 $49,267 $50,927 30 22 Utilities $13,443 $13,555 $13,480 33 23 Construction $29,234 $28,661 $29,188 46 31-33 Manufacturing $51,726 $31,846 $27,483 $49,697
390 42 Wholesale Trade $12,816 $12,816 $12,816 391 48-49 Transportation & Warehousing $30,435 $29,791 $26,472 $30,299 401 44-45 Retail trade $23,208 $20,717 $21,020 413 51 Information $22,963 $25,620 $25,592 $24,040 425 52 Finance & insurance $20,577 $20,086 $20,524 $20,541 431 53 Real estate & rental $12,287 $12,779 $12,472 437 54 Professional- scientific & tech services $27,560 $26,886 $27,502 $27,309 451 55 Management of companies $20,987 $20,987 $20,987 452 56 Administrative & waste services $18,521 $18,451 $18,507 461 61 Educational services $4,893 $5,306 $12,411 $6,060 464 62 Health & social services $14,070 $23,329 $27,501 $23,690 475 71 Arts- entertainment & recreation $8,446 $5,228 $7,677 $7,745 479 72 Accommodation & food services $17,939 $14,571 $12,223 $17,427 482 81 Other services $19,061 $14,773 $15,992 495 92 Government (Federal, State, and Local) $37,257 $35,626 $42,891 $37,305
Total $26,577 $22,460 $19,287 $24,960 * 2004 Dollars Source: IMPLAN and The SGM Group, Inc.

The SGM Group, Inc. Page 78 5/10/2005
Table 33: Indirect Business Taxes—Airport Improvement Project 2017 Industry Direct* Indirect* Induced* Total*
1 11 Ag, Forestry, Fish & Hunting $928 $1,379 $2,308
19 21 Mining $193 $11 $204 30 22 Utilities $119,375 $60,207 $179,582 33 23 Construction $24,071 $2,398 $26,468 46 31-33 Manufacturing $193,418 $8,804 $5,322 $207,544
390 42 Wholesale Trade $65,630 $42,781 $108,412 391 48-49 Transportation & Warehousing $612,896 $21,090 $3,611 $637,597 401 44-45 Retail trade $85,071 $587,425 $672,497 413 51 Information $23,198 $54,424 $34,085 $111,707 425 52 Finance & insurance $193,787 $15,531 $24,970 $234,288 431 53 Real estate & rental $443,243 $281,949 $725,192 437 54 Professional- scientific & tech services $58,983 $44,756 $12,597 $116,335 451 55 Management of companies $5,790 $1,950 $7,740 452 56 Administrative & waste services (AGG) $34,135 $9,629 $43,765 461 61 Educational services $3,244 $1,996 $555 $5,795 464 62 Health & social services $2,940 $1 $23,748 $26,690 475 71 Arts- entertainment & recreation $62,583 $4,554 $34,232 $101,369 479 72 Accommodation & food services $3,956,901 $66,277 $198,963 $4,222,142 482 81 Other services $48,878 $83,146 $132,024 495 92 Government (Federal, State, and Local) $88,640 $5,395 $888,705 $982,740 Total $5,196,589 $1,050,144 $2,297,664 $8,544,398 *2004 Dollars Source: The SGM Group, Inc.; IMPLAN

The SGM Group, Inc. Page 79 5/10/2005
Table 34: Taxes—Airport Improvement Project 2017
Source: The SGM Group, Inc., and IMPLAN.
Employee Compensation
Proprietary Income
Household Expenditures
Enterprises (Corporation)
Indirect Business Taxes Total
Corporate Profits Tax $2,116,337 $2,116,337 Indirect Bus Tax: Custom Duty $196,556 $196,556 Indirect Bus Tax: Excise Taxes $632,605 $632,605 Indirect Bus Tax: Fed Non-Taxes $223,272 $223,272 Personal Tax: Estate and Gift Tax Personal Tax: Income Tax $10,749,862 $10,749,862 Personal Tax: Non-Taxes (Fines-Fees) $91,818 $91,818 Social Ins Tax- Employee Contribution $4,082,900 $604,719 $4,687,619 Social Ins Tax- Employer Contribution $4,228,064 $4,228,064
Federal Government
Non-Defense
Total $8,310,964 $604,719 $10,841,680 $2,116,337 $1,052,433 $22,926,133 Corporate Profits Tax $517,222 $517,222 Dividends $6,145 $6,145 Indirect Bus Tax: Motor Vehicle License $51,915 $51,915 Indirect Bus Tax: Other Taxes $422,604 $422,604 Indirect Bus Tax: Property Tax $2,642,342 $2,642,342 Indirect Bus Tax: S/L Non-Taxes $469,872 $469,872 Indirect Bus Tax: Sales Tax $3,903,239 $3,903,239 Indirect Bus Tax: Severance Tax $1,992 $1,992 Personal Tax: Estate and Gift Tax Personal Tax: Income Tax $3,118,628 $3,118,628 Personal Tax: Motor Vehicle License $98,493 $98,493 Personal Tax: Non-Taxes (Fines-Fees) $831,761 $831,761 Personal Tax: Other Tax (Fish/Hunt) $14,396 $14,396 Personal Tax: Property Taxes $42,903 $42,903 Social Ins Tax- Employee Contribution $71,095 $71,095 Social Ins Tax- Employer Contribution $255,943 $255,943
State/Local Government
Non-Education
Total $327,038 $4,106,181 $523,367 $7,491,965 $12,448,551 Total (2004 Dollars) $8,638,002 $604,719 $14,947,861 $2,639,704 $8,544,398 $35,374,684
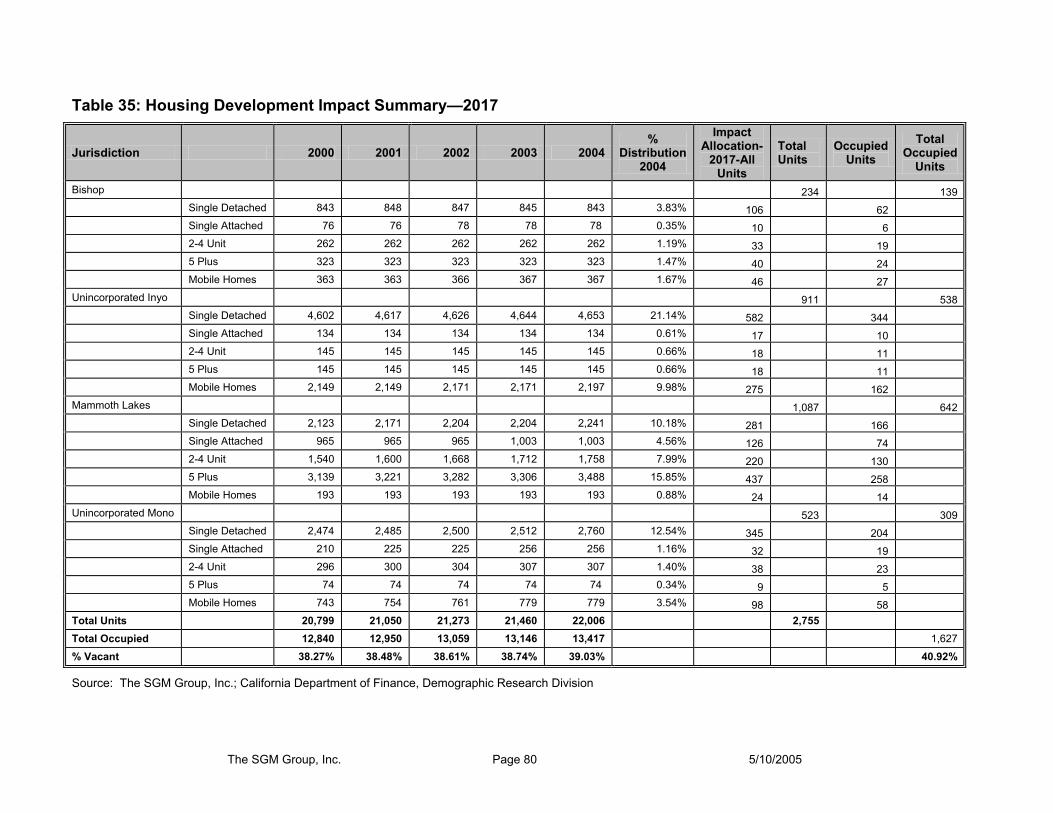
The SGM Group, Inc. Page 80 5/10/2005
Table 35: Housing Development Impact Summary—2017
Jurisdiction 2000 2001 2002 2003 2004 %
Distribution 2004
Impact Allocation-
2017-All Units
Total Units
Occupied Units
Total Occupied
Units
Bishop 234 139 Single Detached 843 848 847 845 843 3.83% 106 62 Single Attached 76 76 78 78 78 0.35% 10 6 2-4 Unit 262 262 262 262 262 1.19% 33 19 5 Plus 323 323 323 323 323 1.47% 40 24 Mobile Homes 363 363 366 367 367 1.67% 46 27 Unincorporated Inyo 911 538 Single Detached 4,602 4,617 4,626 4,644 4,653 21.14% 582 344 Single Attached 134 134 134 134 134 0.61% 17 10 2-4 Unit 145 145 145 145 145 0.66% 18 11 5 Plus 145 145 145 145 145 0.66% 18 11 Mobile Homes 2,149 2,149 2,171 2,171 2,197 9.98% 275 162 Mammoth Lakes 1,087 642 Single Detached 2,123 2,171 2,204 2,204 2,241 10.18% 281 166 Single Attached 965 965 965 1,003 1,003 4.56% 126 74 2-4 Unit 1,540 1,600 1,668 1,712 1,758 7.99% 220 130 5 Plus 3,139 3,221 3,282 3,306 3,488 15.85% 437 258 Mobile Homes 193 193 193 193 193 0.88% 24 14 Unincorporated Mono 523 309 Single Detached 2,474 2,485 2,500 2,512 2,760 12.54% 345 204 Single Attached 210 225 225 256 256 1.16% 32 19 2-4 Unit 296 300 304 307 307 1.40% 38 23 5 Plus 74 74 74 74 74 0.34% 9 5 Mobile Homes 743 754 761 779 779 3.54% 98 58 Total Units 20,799 21,050 21,273 21,460 22,006 2,755 Total Occupied 12,840 12,950 13,059 13,146 13,417 1,627 % Vacant 38.27% 38.48% 38.61% 38.74% 39.03% 40.92%
Source: The SGM Group, Inc.; California Department of Finance, Demographic Research Division

The SGM Group, Inc. Page 81 5/10/2005
Table 36: Population and Housing Impacts—2017
COUNTY/CITY TOTAL
POPULATION-2004
Persons Per Household-
2004
Occupied Housing Units- 2017
Population Impact-
2017 Persons per Occupied Housing
Unit-2017 INYO COUNTY
BISHOP 3,632 2.10 139 291 2.10 BALANCE OF COUNTY 14,883 2.41 538 1,294 2.41 INCORPORATED 3,632 2.10 139 291 2.10 COUNTY TOTAL 18,515 2.34 676 1,585 2.34
MONO COUNTY MAMMOTH LAKES 7,472 2.36 642 1,518 2.36 BALANCE OF COUNTY 6,048 2.33 309 721 2.33 INCORPORATED 7,472 2.36 642 1,518 2.36 COUNTY TOTAL 13,520 2.35 951 2,239 2.35
TWO COUNTIES BISHOP + MAMMOTH LAKES 11,104 2.27 781 1,809 2.32 BALANCE OF COUNTIES 20,931 2.38 847 2,015 2.38 INCORPORATED 11,104 2.27 781 1,809 2.32 2-COUNTY TOTAL 32,035 2.34 1,627 3,824 2.35
Source: http://www.dof.ca.gov/HTML/DEMOGRAP/repndat.htm#estimates; The SGM Group, Inc.
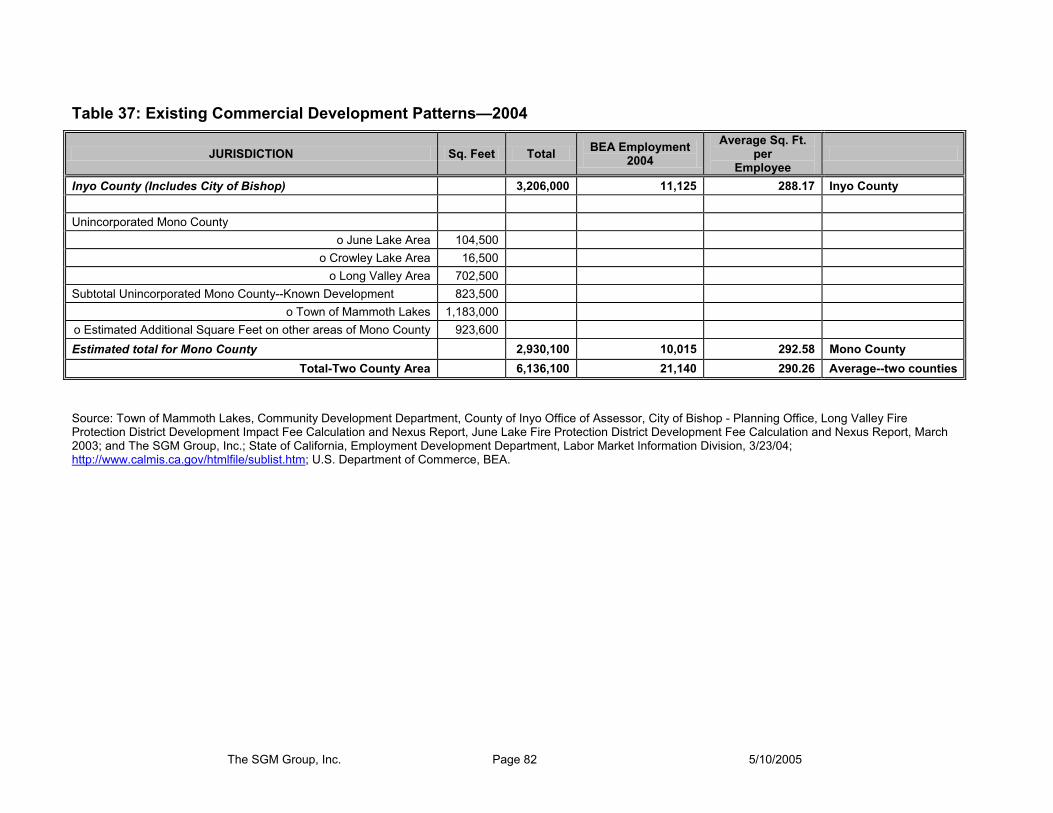
The SGM Group, Inc. Page 82 5/10/2005
Table 37: Existing Commercial Development Patterns—2004
JURISDICTION Sq. Feet Total BEA Employment 2004
Average Sq. Ft. per
Employee
Inyo County (Includes City of Bishop) 3,206,000 11,125 288.17 Inyo County Unincorporated Mono County
o June Lake Area 104,500 o Crowley Lake Area 16,500
o Long Valley Area 702,500 Subtotal Unincorporated Mono County--Known Development 823,500
o Town of Mammoth Lakes 1,183,000 o Estimated Additional Square Feet on other areas of Mono County 923,600 Estimated total for Mono County 2,930,100 10,015 292.58 Mono County
Total-Two County Area 6,136,100 21,140 290.26 Average--two counties
Source: Town of Mammoth Lakes, Community Development Department, County of Inyo Office of Assessor, City of Bishop - Planning Office, Long Valley Fire Protection District Development Impact Fee Calculation and Nexus Report, June Lake Fire Protection District Development Fee Calculation and Nexus Report, March 2003; and The SGM Group, Inc.; State of California, Employment Development Department, Labor Market Information Division, 3/23/04; http://www.calmis.ca.gov/htmlfile/sublist.htm; U.S. Department of Commerce, BEA.

The SGM Group, Inc. Page 83 5/10/2005
Table 38: Employment by Sub Area—2004
Area Labor Force Employment Sep-2004 Inyo County 7,290 6,910
Big Pine CDP 410 410 City of Bishop 1,490 1,430
Dixon Lane-Meadow Creek-CDP 920 870 Lone Pine CDP 680 640
West Bishop CDP 1,210 1,180 Other Unincorporated 2,580 2,380
Total Unincorporated 5,800 5,480
City of Bishop 1,490 1,430 Mono County 7,400 7,010 Mammoth Lakes Town 4,140 3,850 Unincorporated 3,260 3,160
Total—Mono and Inyo Counties 14,690 13,920
Source: State of California, Employment Development Department, Labor Market Information Division, 3/23/04; http://www.calmis.ca.gov/htmlfile/sublist.htm; The SGM Group, Inc.

The SGM Group, Inc. Page 84 5/10/2005
Table 39: Forecast Commercial Development Patterns—2017
JURISDICTION LMI
Employment 2004
% Distribution
Existing Commercial Development
2004
Impact Commercial Square Feet
2017
Impact Employment Distribution
2017 Mammoth Lakes 3,850 27.66% 1,183,000 245,756 840 Unincorporated Mono County 3,160 22.70% 1,747,100 201,712 689 Bishop 1,430 10.27% 663,470 89,904 312 Unincorporated Inyo County 5,480 39.37% 2,542,530 344,528 1,196
Total: 13,920 100.00% 6,136,100 881,901 3,037 Source: The SGM Group, Inc.; California Employment Development Department, Labor Market Information Division, March 2004.

The SGM Group, Inc. Page 85 5/10/2005
Table 40: Fiscal Impact—Town of Mammoth Lakes—2017
LAND USE BUILDOUT UNIT COUNT ALLOCATED
REVENUES ALLOCATED
EXPENDITURES NET FISCAL
IMPACT
Single Family Dwellings 2,862 Dwelling Units 2,045,323 5,211,701 (3,166,378)
Apartments Affordable Apartments 808 Dwelling Units 656,186 2,080,331 (1,424,145) Market Rate Apartments 1,228 Dwelling Units 991,330 3,161,048 (2,169,718)
Multi-Family Condominiums Traditional Condominiums 7,472 Dwelling Units 10,105,575 16,769,531 (6,663,957)
Timeshares Traditional 0 Dwelling Units 0 0 0 High-End 0 Dwelling Units 0 0 0 Private Residence Club 0 Dwelling Units 0 0 0
Mobile Homes 145 Dwelling Units 112,531 373,327 (260,796) Full Service Lodging
Traditional Lodging Resort 2,936 Units 10,635,190 7,433,833 3,201,356 Commercial 1,759 Units 3,403,632 4,270,199 (866,567) USFS 330 Units 603,354 801,069 (197,714) Airport 0 Units 0 0 0 Timeshares Traditional 0 Units 0 0 0 High-End 0 Units 0 0 0 Private Residence Club 0 Units 0 0 0
Limited Service Lodging 0 Units 0 0 0
Commercial/Office Uses
Retail 1,158,605 Square Feet 2,832,460 3,915,646 (1,083,186)
Office 433,151 Square Feet 351,021 1,463,887 (1,112,866) Industrial Uses 424,000 Square Feet 65,998 1,432,959 (1,366,961) TOTALS
MMH Project Impact-2017 Additional Housing Units 1,087 Units
Additional Lodging Units 208 Units
Additional Commercial Space 245,756 Square Feet
Additional Employment 840 Jobs Town of Mammoth Lakes: Fiscal Impact—Airport Improvement Program 2017
Change in Revenues $2,954,264 Change in Expenses $1,815,932 Net Change $1,138,332 Ratio—Revenues/Expenses 1.63
Source: Town of Mammoth Lakes; The SGM Group, Inc.

The SGM Group, Inc. Page 86 5/10/2005
Table 41: Mono County Budget Allocation 2003-2004
Mono County Budget Allocation FY 2003-2004 Actual Budget % to
Population % to
Employment Revenues $27,884,438 Taxes $12,692,347 80% 20% Intergovernmental Revenues $7,117,936 66% 34% Charges for Services $2,298,609 40% 60% Prior Year Fund Balance $4,100,000 66% 34% Fines Forfeit and Penalties $467,347 66% 34% Licenses and Permits $439,356 5% 95% Use Of Money and Property $155,670 0% 100% Misc. $142,519 66% 34% Other Fin. Sources $470,654 66% 34% $27,884,438 Road Fund $3,696,287 66% 34% Other Funds $3,820,913 100% 0% $7,517,200 General Fund Expenditures $22,826,969 General Government $7,335,263 66% 34% Public Protection $8,051,369 66% 34% Public Ways and Facilities $448,703 66% 34% Health & Sanitation $4,201,737 66% 34% Public Assistance $2,260,996 100% Education $28,665 66% 34% Recreation & Cultural $500,236 100% $22,826,969 Road Fund $3,807,176 66% 34% Other Funds $4,421,395 100% 0% Budget Balance $5,057,469
TOTAL
Source: County of Mono, 2004-2005 Final Budget- Actual 2003/2004 Revenues and Mono County Budget by Function Expenditures and Transfers- Expenditures 2003/2004 Actual and a special report prepared by Mono County Budget Office for The SGM Group, Inc.; Employment for Mono County Unincorporated is from LMI Subarea data, http://www.calmis.ca.gov/htmlfile/sublist.htm and The SGM Group, Inc.
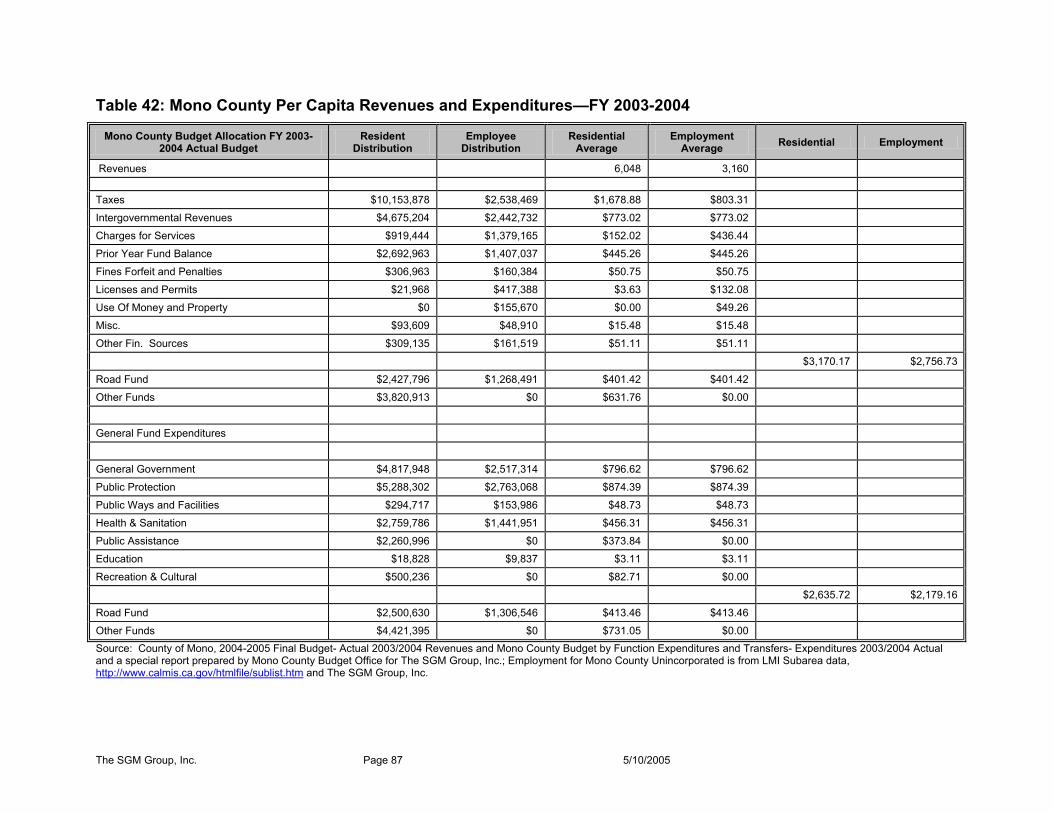
The SGM Group, Inc. Page 87 5/10/2005
Table 42: Mono County Per Capita Revenues and Expenditures—FY 2003-2004
Mono County Budget Allocation FY 2003-2004 Actual Budget
Resident Distribution
Employee Distribution
Residential Average
Employment Average Residential Employment
Revenues 6,048 3,160 Taxes $10,153,878 $2,538,469 $1,678.88 $803.31 Intergovernmental Revenues $4,675,204 $2,442,732 $773.02 $773.02 Charges for Services $919,444 $1,379,165 $152.02 $436.44 Prior Year Fund Balance $2,692,963 $1,407,037 $445.26 $445.26 Fines Forfeit and Penalties $306,963 $160,384 $50.75 $50.75 Licenses and Permits $21,968 $417,388 $3.63 $132.08 Use Of Money and Property $0 $155,670 $0.00 $49.26 Misc. $93,609 $48,910 $15.48 $15.48 Other Fin. Sources $309,135 $161,519 $51.11 $51.11 $3,170.17 $2,756.73 Road Fund $2,427,796 $1,268,491 $401.42 $401.42 Other Funds $3,820,913 $0 $631.76 $0.00 General Fund Expenditures General Government $4,817,948 $2,517,314 $796.62 $796.62 Public Protection $5,288,302 $2,763,068 $874.39 $874.39 Public Ways and Facilities $294,717 $153,986 $48.73 $48.73 Health & Sanitation $2,759,786 $1,441,951 $456.31 $456.31 Public Assistance $2,260,996 $0 $373.84 $0.00 Education $18,828 $9,837 $3.11 $3.11 Recreation & Cultural $500,236 $0 $82.71 $0.00 $2,635.72 $2,179.16 Road Fund $2,500,630 $1,306,546 $413.46 $413.46 Other Funds $4,421,395 $0 $731.05 $0.00 Source: County of Mono, 2004-2005 Final Budget- Actual 2003/2004 Revenues and Mono County Budget by Function Expenditures and Transfers- Expenditures 2003/2004 Actual and a special report prepared by Mono County Budget Office for The SGM Group, Inc.; Employment for Mono County Unincorporated is from LMI Subarea data, http://www.calmis.ca.gov/htmlfile/sublist.htm and The SGM Group, Inc.

The SGM Group, Inc. Page 88 5/10/2005
Table 43: Mono County Fiscal Impact Summary 2017
Mono County Budget Allocation FY 2003-2004 Actual Budget
Additional Population
Additional Employment
Total Impact Revenues
Total Impact Expenditures Net Change Ratio
Population and Employment Increment 950 908 Taxes $1,595,178 $729,716 Intergovernmental Revenues $734,476 $702,195 Charges for Services $144,445 $396,459 Prior Year Fund Balance $423,065 $404,471 Fines Forfeit and Penalties $48,224 $46,105 Licenses and Permits $3,451 $119,984 Use Of Money and Property $0 $44,749 Misc. $14,706 $14,060 Other Fin. Sources $48,565 $46,431 $5,516,281 Road Fund $381,408 $364,644 Other Funds $600,267 $0 $1,346,319 General Fund Expenditures General Government $756,901 $723,635 Public Protection $830,794 $794,280 Public Ways and Facilities $46,300 $44,265 Health & Sanitation $433,563 $414,508 Public Assistance $355,203 $0 Education $2,958 $2,828 Recreation & Cultural $78,587 $0 $4,483,823 $1,032,458 1.23

The SGM Group, Inc. Page 89 5/10/2005
Road Fund $392,850 $375,584 Other Funds $694,603 $0 $1,463,036 ($116,718) 0.92 Budget Balance TOTAL $6,862,600 $5,946,859 $915,740 1.15
Source: County of Mono, 2004-2005 Final Budget - Actual 2003/2004 Revenues and Mono County Budget by Function Expenditures and Transfers - Expenditures 2003/2004 Actual and a special report prepared by Mono County Budget Office for The SGM Group, Inc.; Employment for Mono County Unincorporated is from LMI Subarea data, http://www.calmis.ca.gov/htmlfile/sublist.htm and The SGM Group, Inc.
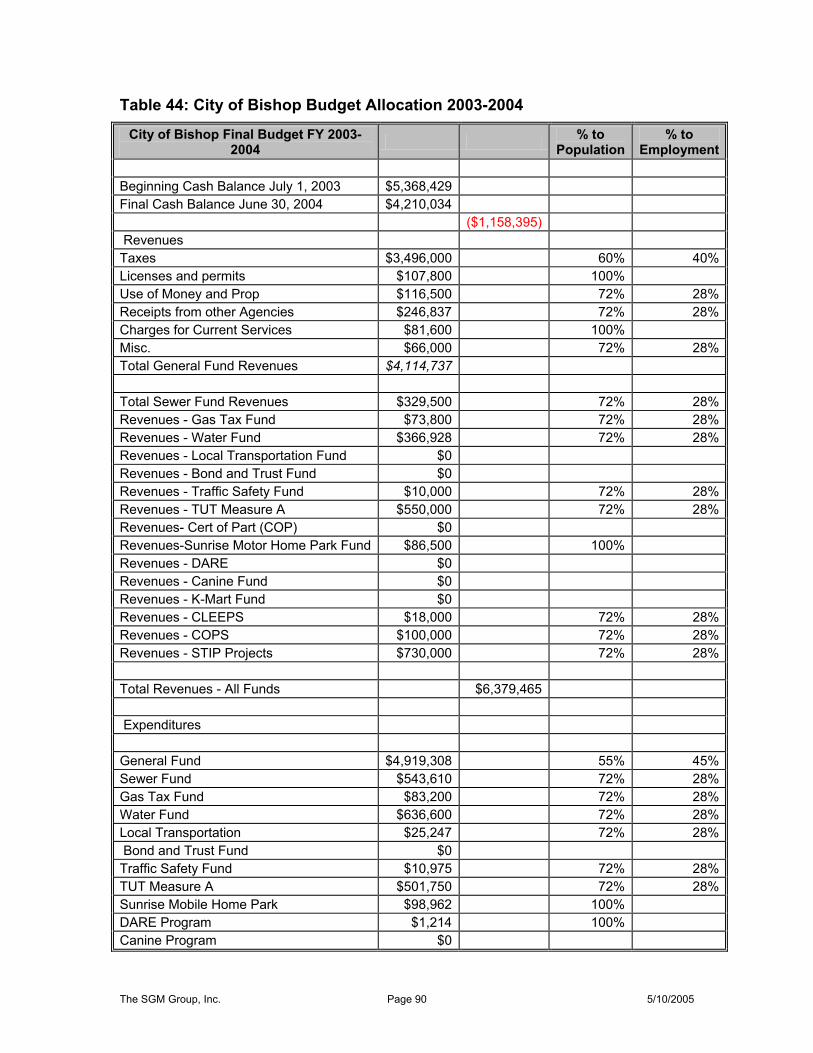
The SGM Group, Inc. Page 90 5/10/2005
Table 44: City of Bishop Budget Allocation 2003-2004
City of Bishop Final Budget FY 2003-2004 % to
Population % to
Employment
Beginning Cash Balance July 1, 2003 $5,368,429 Final Cash Balance June 30, 2004 $4,210,034 ($1,158,395) Revenues Taxes $3,496,000 60% 40% Licenses and permits $107,800 100% Use of Money and Prop $116,500 72% 28% Receipts from other Agencies $246,837 72% 28% Charges for Current Services $81,600 100% Misc. $66,000 72% 28% Total General Fund Revenues $4,114,737 Total Sewer Fund Revenues $329,500 72% 28% Revenues - Gas Tax Fund $73,800 72% 28% Revenues - Water Fund $366,928 72% 28% Revenues - Local Transportation Fund $0 Revenues - Bond and Trust Fund $0 Revenues - Traffic Safety Fund $10,000 72% 28% Revenues - TUT Measure A $550,000 72% 28% Revenues- Cert of Part (COP) $0 Revenues-Sunrise Motor Home Park Fund $86,500 100% Revenues - DARE $0 Revenues - Canine Fund $0 Revenues - K-Mart Fund $0 Revenues - CLEEPS $18,000 72% 28% Revenues - COPS $100,000 72% 28% Revenues - STIP Projects $730,000 72% 28% Total Revenues - All Funds $6,379,465 Expenditures General Fund $4,919,308 55% 45% Sewer Fund $543,610 72% 28% Gas Tax Fund $83,200 72% 28% Water Fund $636,600 72% 28% Local Transportation $25,247 72% 28% Bond and Trust Fund $0 Traffic Safety Fund $10,975 72% 28% TUT Measure A $501,750 72% 28% Sunrise Mobile Home Park $98,962 100% DARE Program $1,214 100% Canine Program $0
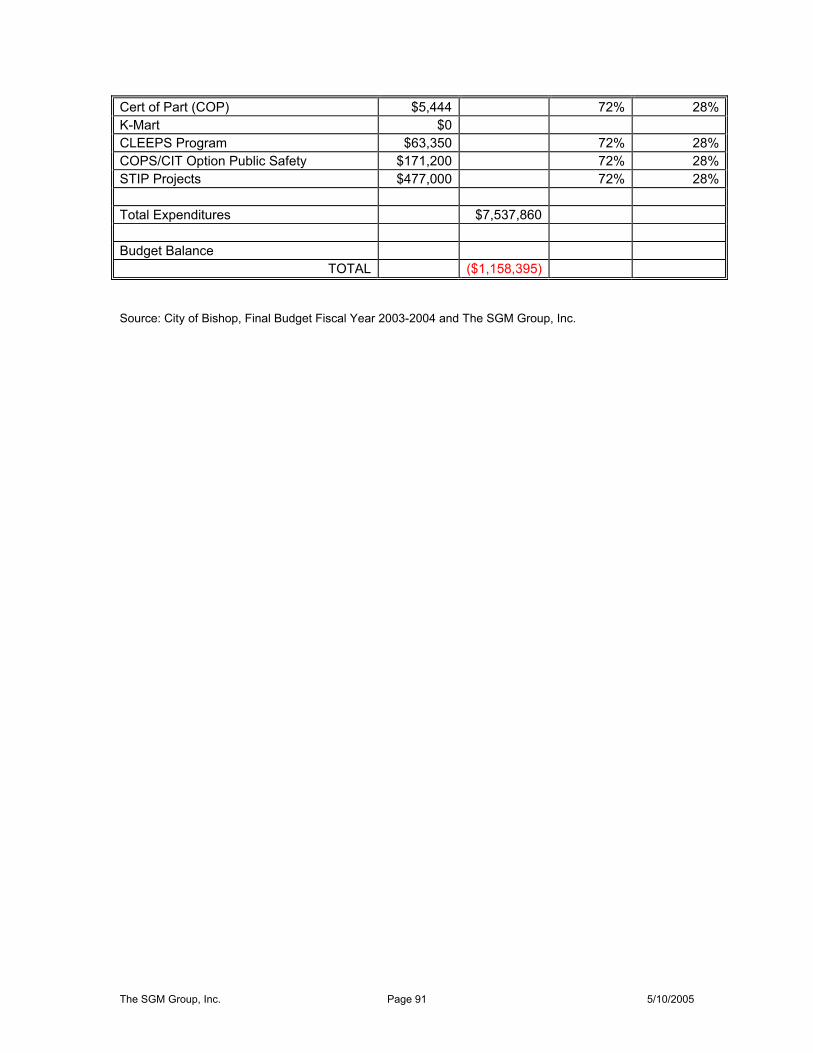
The SGM Group, Inc. Page 91 5/10/2005
Cert of Part (COP) $5,444 72% 28% K-Mart $0 CLEEPS Program $63,350 72% 28% COPS/CIT Option Public Safety $171,200 72% 28% STIP Projects $477,000 72% 28% Total Expenditures $7,537,860 Budget Balance
TOTAL ($1,158,395)
Source: City of Bishop, Final Budget Fiscal Year 2003-2004 and The SGM Group, Inc.

The SGM Group, Inc. Page 92 5/10/2005
Table 45: City of Bishop Per Capita Revenues and Expenditures—FY 2003-2004
City of Bishop Final Budget FY 2003-2004
Resident Distribution
Employee Distribution
Residential Average
Employment Average Residential Employment
Population and Employment Increment 3,632 1,430 Revenues Taxes $2,097,600 $1,398,400 $577.53 $977.90 Licenses and permits $107,800 $0 $29.68 $0.00 Use of Money and Prop $83,589 $32,911 $23.01 $23.01 Receipts from other Agencies $177,106 $69,731 $48.76 $48.76 Charges for Current Services $81,600 $0 $22.47 $0.00 Misc. $47,355 $18,645 $13.04 $13.04 Total General Fund Revenues Total Sewer Fund Revenues $236,417 $93,083 $65.09 $65.09 Revenues - Gas Tax Fund $52,952 $20,848 $14.58 $14.58 Revenues - Water Fund $263,272 $103,656 $72.49 $72.49 Revenues - Local Transportation Fund $0 $0 $0.00 $0.00 Revenues - Bond and Trust Fund $0 $0 $0.00 $0.00 Revenues - Traffic Safety Fund $7,175 $2,825 $1.98 $1.98 Revenues - TUT Measure A $394,627 $155,373 $108.65 $108.65 Revenues- Cert of Part (COP) $0 $0 $0.00 $0.00 Revenues-Sunrise Motor Home Park Fund $86,500 $0 $23.82 $0.00 Revenues - DARE $0 $0 $0.00 $0.00 Revenues - Canine Fund $0 $0 $0.00 $0.00 Revenues - K-Mart Fund $0 $0 $0.00 $0.00 Revenues - CLEEPS $12,915 $5,085 $3.56 $3.56 Revenues - COPS $71,750 $28,250 $19.76 $19.76 Revenues - STIP Projects $523,777 $206,223 $144.21 $144.21 Total Revenues - All Funds $1,168.62 $1,493.03

The SGM Group, Inc. Page 93 5/10/2005
Expenditures General Fund $2,705,619 $2,213,689 $744.94 $1,548.03 Sewer Fund $390,042 $153,568 $107.39 $107.39 Gas Tax Fund $59,696 $23,504 $16.44 $16.44 Water Fund $456,762 $179,838 $125.76 $125.76 Local Transportation $18,115 $7,132 $4.99 $4.99 Bond and Trust Fund $0 $0 $0.00 $0.00 Traffic Safety Fund $7,875 $3,100 $2.17 $2.17 TUT Measure A $360,007 $141,743 $99.12 $99.12 Sunrise Mobile Home Park $98,962 $0 $27.25 $0.00 DARE Program $1,214 $0 $0.33 $0.00 Canine Program $0 $0 $0.00 $0.00 Cert of Part (COP) $3,906 $1,538 $1.08 $1.08 K-Mart $0 $0 $0.00 $0.00 CLEEPS Program $45,454 $17,896 $12.51 $12.51 COPS/CIT Option Public Safety $122,837 $48,363 $33.82 $33.82 STIP Projects $342,249 $134,751 $94.23 $94.23 Total Expenditures $1,270.03 $2,045.54
Source: City of Bishop, Final Budget Fiscal Year 2003-2004 and The SGM Group, Inc.
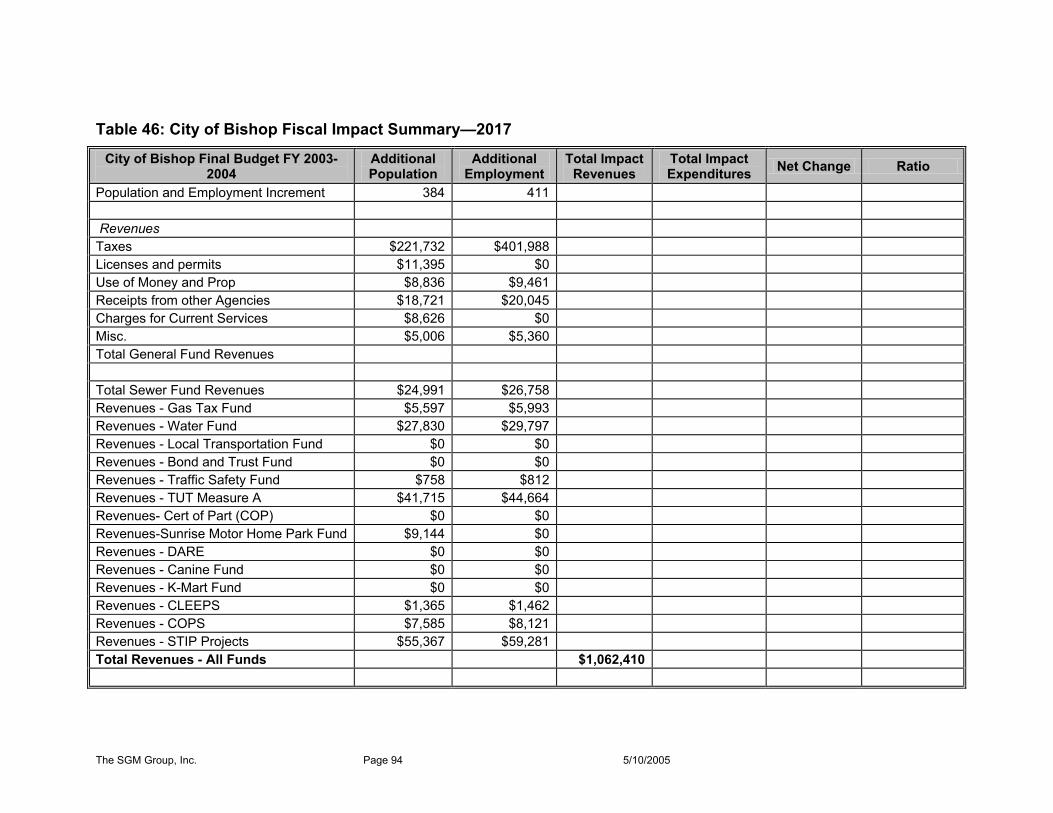
The SGM Group, Inc. Page 94 5/10/2005
Table 46: City of Bishop Fiscal Impact Summary—2017
City of Bishop Final Budget FY 2003-2004
Additional Population
Additional Employment
Total Impact Revenues
Total Impact Expenditures Net Change Ratio
Population and Employment Increment 384 411 Revenues Taxes $221,732 $401,988 Licenses and permits $11,395 $0 Use of Money and Prop $8,836 $9,461 Receipts from other Agencies $18,721 $20,045 Charges for Current Services $8,626 $0 Misc. $5,006 $5,360 Total General Fund Revenues Total Sewer Fund Revenues $24,991 $26,758 Revenues - Gas Tax Fund $5,597 $5,993 Revenues - Water Fund $27,830 $29,797 Revenues - Local Transportation Fund $0 $0 Revenues - Bond and Trust Fund $0 $0 Revenues - Traffic Safety Fund $758 $812 Revenues - TUT Measure A $41,715 $44,664 Revenues- Cert of Part (COP) $0 $0 Revenues-Sunrise Motor Home Park Fund $9,144 $0 Revenues - DARE $0 $0 Revenues - Canine Fund $0 $0 Revenues - K-Mart Fund $0 $0 Revenues - CLEEPS $1,365 $1,462 Revenues - COPS $7,585 $8,121 Revenues - STIP Projects $55,367 $59,281 Total Revenues - All Funds $1,062,410

The SGM Group, Inc. Page 95 5/10/2005
Expenditures General Fund $286,004 $636,354 Sewer Fund $41,230 $44,145 Gas Tax Fund $6,310 $6,756 Water Fund $48,283 $51,697 Local Transportation $1,915 $2,050 Bond and Trust Fund $0 $0 Traffic Safety Fund $832 $891 TUT Measure A $38,055 $40,746 Sunrise Mobile Home Park $10,461 $0 DARE Program $128 $0 Canine Program $0 $0 Cert of Part (COP) $413 $442 K-Mart $0 $0 CLEEPS Program $4,805 $5,144 COPS/CIT Option Public Safety $12,985 $13,903 STIP Projects $36,178 $38,736 Total Expenditures $1,328,465 ($266,055) 0.80
Source: City of Bishop, Final Budget Fiscal Year 2003-2004 and The SGM Group, Inc.

The SGM Group, Inc. Page 96 5/10/2005
Table 47: Inyo County Budget Allocation 2003-2004
Inyo County Budget Allocation FY 2003-2004 Actual Budget % to Population % to Employment
Revenues $64,739,672 Taxes - Property $8,479,200 67% 33% Taxes - Other $4,242,204 33% 67% Licenses and permits $302,500 10% 90% Fines and Forfeitures $1,331,100 73% 27% Rev Use of Money and Prop $860,926 0% 100% Aid from other Government Agencies $35,270,458 20% 80% Charges for Current Services $9,065,695 0% 100% Other Revenue $5,187,589 0% 100% $64,739,672 Expenditures $68,893,580 General Government $14,497,262 73% 27% Public Protection $20,971,169 73% 27% Public Ways and Facilities $12,006,365 20% 80% Health & Sanitation $10,339,801 73% 27% Public Assistance $7,780,064 100% 0% Education $778,727 73% 27% Recreation & Cultural $2,270,192 73% 27% Reserves $250,000 73% 27% $68,893,580 Budget Balance ($4,153,908)
Source: County of Inyo, 2003-2004 Board Approved Budget Schedule 5, Schedule 7 and Schedule 8A and The SGM Group, Inc.
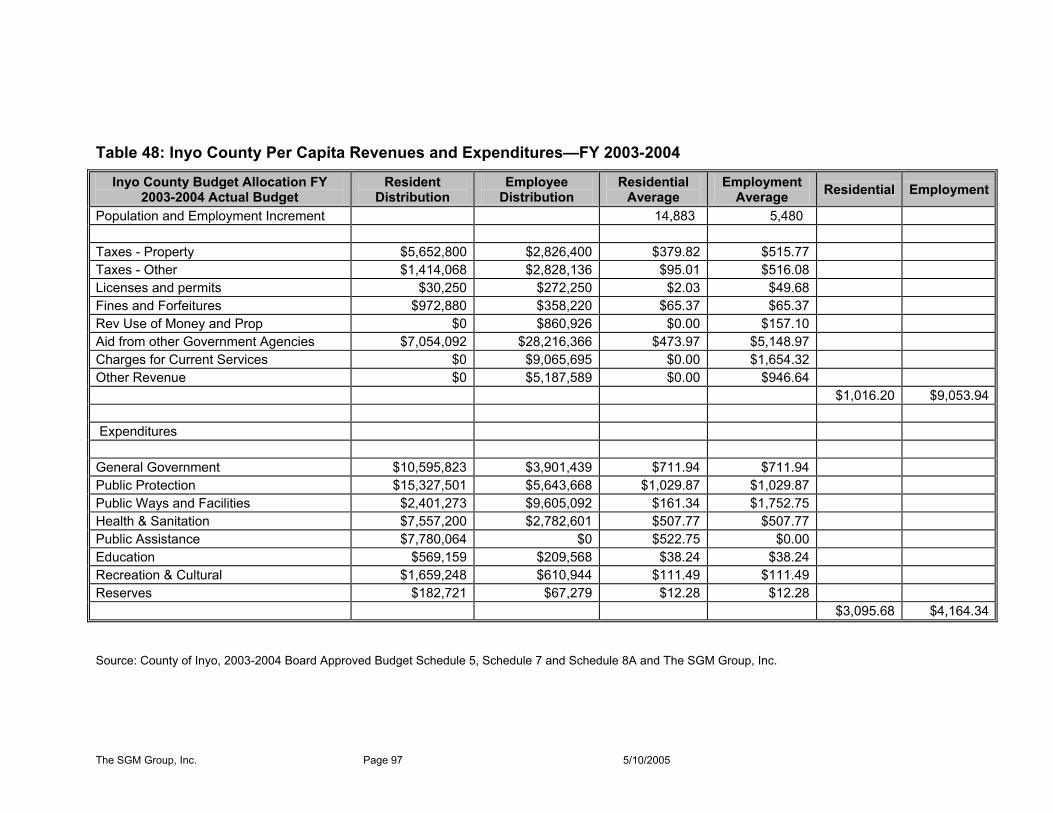
The SGM Group, Inc. Page 97 5/10/2005
Table 48: Inyo County Per Capita Revenues and Expenditures—FY 2003-2004
Inyo County Budget Allocation FY 2003-2004 Actual Budget
Resident Distribution
Employee Distribution
Residential Average
Employment Average Residential Employment
Population and Employment Increment 14,883 5,480 Taxes - Property $5,652,800 $2,826,400 $379.82 $515.77 Taxes - Other $1,414,068 $2,828,136 $95.01 $516.08 Licenses and permits $30,250 $272,250 $2.03 $49.68 Fines and Forfeitures $972,880 $358,220 $65.37 $65.37 Rev Use of Money and Prop $0 $860,926 $0.00 $157.10 Aid from other Government Agencies $7,054,092 $28,216,366 $473.97 $5,148.97 Charges for Current Services $0 $9,065,695 $0.00 $1,654.32 Other Revenue $0 $5,187,589 $0.00 $946.64 $1,016.20 $9,053.94 Expenditures General Government $10,595,823 $3,901,439 $711.94 $711.94 Public Protection $15,327,501 $5,643,668 $1,029.87 $1,029.87 Public Ways and Facilities $2,401,273 $9,605,092 $161.34 $1,752.75 Health & Sanitation $7,557,200 $2,782,601 $507.77 $507.77 Public Assistance $7,780,064 $0 $522.75 $0.00 Education $569,159 $209,568 $38.24 $38.24 Recreation & Cultural $1,659,248 $610,944 $111.49 $111.49 Reserves $182,721 $67,279 $12.28 $12.28 $3,095.68 $4,164.34
Source: County of Inyo, 2003-2004 Board Approved Budget Schedule 5, Schedule 7 and Schedule 8A and The SGM Group, Inc.
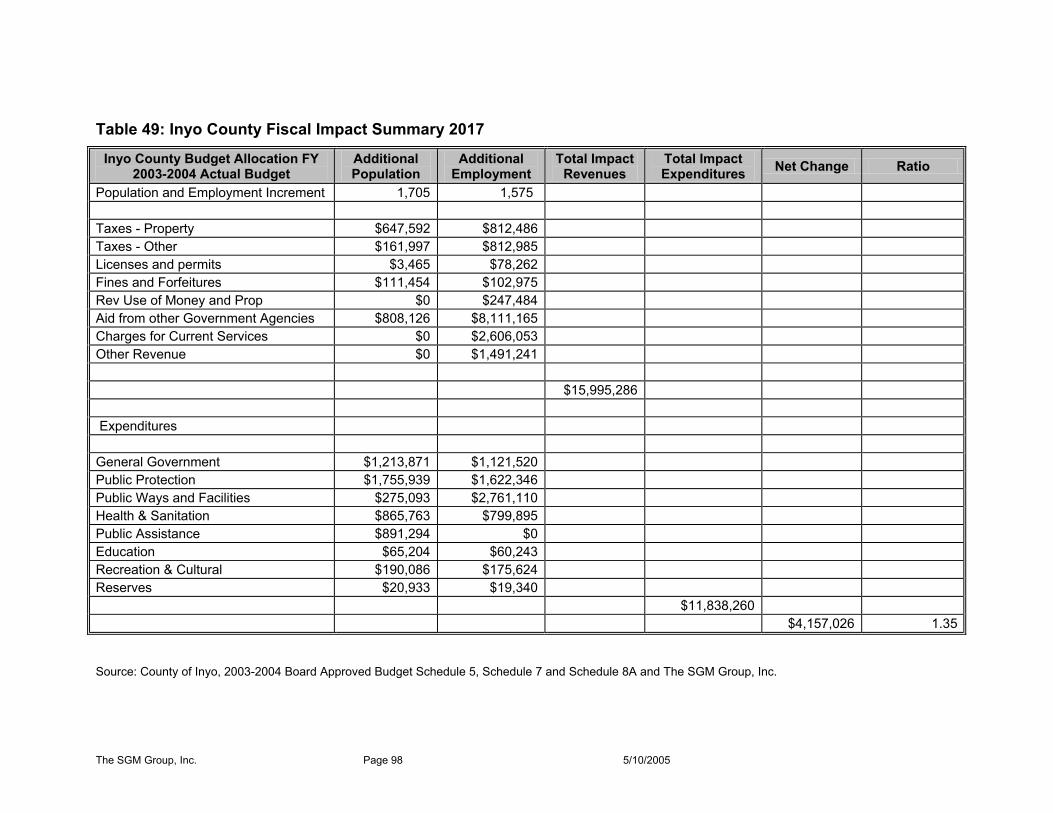
The SGM Group, Inc. Page 98 5/10/2005
Table 49: Inyo County Fiscal Impact Summary 2017
Inyo County Budget Allocation FY 2003-2004 Actual Budget
Additional Population
Additional Employment
Total Impact Revenues
Total Impact Expenditures Net Change Ratio
Population and Employment Increment 1,705 1,575 Taxes - Property $647,592 $812,486 Taxes - Other $161,997 $812,985 Licenses and permits $3,465 $78,262 Fines and Forfeitures $111,454 $102,975 Rev Use of Money and Prop $0 $247,484 Aid from other Government Agencies $808,126 $8,111,165 Charges for Current Services $0 $2,606,053 Other Revenue $0 $1,491,241 $15,995,286 Expenditures General Government $1,213,871 $1,121,520 Public Protection $1,755,939 $1,622,346 Public Ways and Facilities $275,093 $2,761,110 Health & Sanitation $865,763 $799,895 Public Assistance $891,294 $0 Education $65,204 $60,243 Recreation & Cultural $190,086 $175,624 Reserves $20,933 $19,340 $11,838,260 $4,157,026 1.35
Source: County of Inyo, 2003-2004 Board Approved Budget Schedule 5, Schedule 7 and Schedule 8A and The SGM Group, Inc.
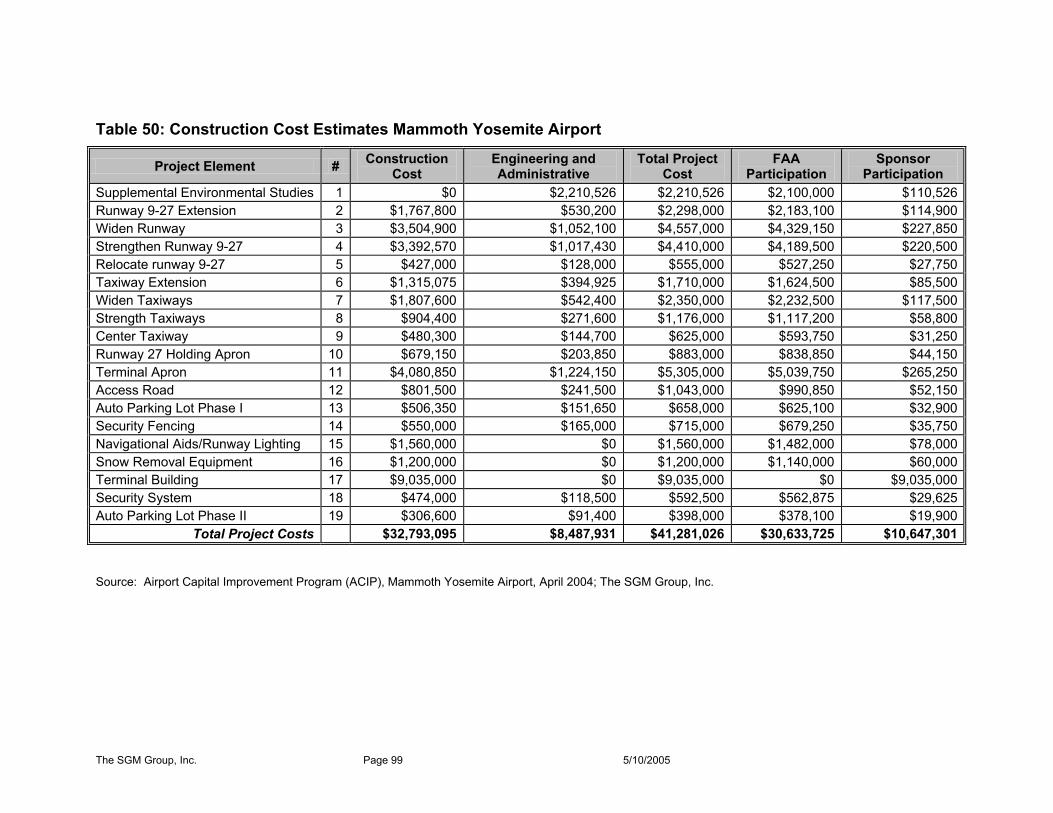
The SGM Group, Inc. Page 99 5/10/2005
Table 50: Construction Cost Estimates Mammoth Yosemite Airport
Project Element # Construction Cost
Engineering and Administrative
Total Project Cost
FAA Participation
Sponsor Participation
Supplemental Environmental Studies 1 $0 $2,210,526 $2,210,526 $2,100,000 $110,526 Runway 9-27 Extension 2 $1,767,800 $530,200 $2,298,000 $2,183,100 $114,900 Widen Runway 3 $3,504,900 $1,052,100 $4,557,000 $4,329,150 $227,850 Strengthen Runway 9-27 4 $3,392,570 $1,017,430 $4,410,000 $4,189,500 $220,500 Relocate runway 9-27 5 $427,000 $128,000 $555,000 $527,250 $27,750 Taxiway Extension 6 $1,315,075 $394,925 $1,710,000 $1,624,500 $85,500 Widen Taxiways 7 $1,807,600 $542,400 $2,350,000 $2,232,500 $117,500 Strength Taxiways 8 $904,400 $271,600 $1,176,000 $1,117,200 $58,800 Center Taxiway 9 $480,300 $144,700 $625,000 $593,750 $31,250 Runway 27 Holding Apron 10 $679,150 $203,850 $883,000 $838,850 $44,150 Terminal Apron 11 $4,080,850 $1,224,150 $5,305,000 $5,039,750 $265,250 Access Road 12 $801,500 $241,500 $1,043,000 $990,850 $52,150 Auto Parking Lot Phase I 13 $506,350 $151,650 $658,000 $625,100 $32,900 Security Fencing 14 $550,000 $165,000 $715,000 $679,250 $35,750 Navigational Aids/Runway Lighting 15 $1,560,000 $0 $1,560,000 $1,482,000 $78,000 Snow Removal Equipment 16 $1,200,000 $0 $1,200,000 $1,140,000 $60,000 Terminal Building 17 $9,035,000 $0 $9,035,000 $0 $9,035,000 Security System 18 $474,000 $118,500 $592,500 $562,875 $29,625 Auto Parking Lot Phase II 19 $306,600 $91,400 $398,000 $378,100 $19,900
Total Project Costs $32,793,095 $8,487,931 $41,281,026 $30,633,725 $10,647,301
Source: Airport Capital Improvement Program (ACIP), Mammoth Yosemite Airport, April 2004; The SGM Group, Inc.

The SGM Group, Inc. Page 100 5/10/2005
Table 51: Summary Economic Impacts of Construction—Mono and Inyo Counties
Impact Category Direct Indirect Induced Total Impact Employment
Number of Jobs (Full- and Part-Time) 516 104 127 746
Value Measures (2004 Dollars) Total Output $41,281,026 $8,305,054 $9,465,613 $59,051,692 Value Added $19,296,295 $4,816,638 $5,814,073 $29,927,005 Employee Compensation $14,119,889 $2,395,498 $2,447,311 $18,962,698 Labor Income $18,815,005 $2,961,232 $2,996,295 $24,772,532 Indirect Business Taxes $363,936 $290,167 $658,527 $1,312,630 Total Taxes - - - $8,208,247
Source: IMPLAN, and The SGM Group, Inc.

The SGM Group, Inc. Page 101 5/10/2005
Table 52: Construction Employment Impact—Mono and Inyo Counties Industry Direct Indirect Induced Total
1 11 Ag, Forestry, Fish & Hunting - 0.2 0.7 0.9 19 21 Mining - 0.0 0.0 0.0 30 22 Utilities - 0.9 1.5 2.4 33 23 Construction 349.6 1.3 0.8 351.7 46 31-33 Manufacturing - 2.3 1.7 4.1
390 42 Wholesale Trade - 2.3 1.8 4.1 391 48-49 Transportation & Warehousing - 8.1 1.9 10.0 401 44-45 Retail trade - 14.7 30.8 45.5 413 51 Information - 2.0 2.1 4.1 425 52 Finance & insurance - 1.9 3.9 5.8 431 53 Real estate & rental - 9.4 6.5 15.9 437 54 Professional- scientific & tech svcs 166.0 36.3 6.1 208.4 451 55 Management of companies - 1.2 0.9 2.1 452 56 Administrative & waste services - 5.6 2.6 8.2 461 61 Educational svcs - 0.9 1.8 2.6 464 62 Health & social services - 0.0 18.9 18.9 475 71 Arts- entertainment & recreation - 1.2 7.9 9.1 479 72 Accommodation & food services - 3.9 21.7 25.5 482 81 Other services - 9.4 11.8 21.2 495 92 Government - 2.1 3.4 5.4 Total Jobs (Full- and Part-Time) 515.6 103.6 126.9 746.0
Source: IMPLAN and The SGM Group, Inc.

The SGM Group, Inc. Page 102 5/10/2005
Table 53: Construction Total Output—Mono and Inyo Counties Industry Direct* Indirect* Induced* Total*
1 11 Ag, Forestry, Fish & Hunting $0 $7,396 $25,438 $32,834 19 21 Mining $0 $2,305 $64 $2,369 30 22 Utilities $0 $91,566 $154,002 $245,567 33 23 Construction $32,793,112 $111,010 $78,057 $32,982,179 46 31-33 Manufacturing $0 $625,423 $269,434 $894,856
390 42 Wholesale Trade $0 $88,923 $69,369 $158,293 391 48-49 Transportation & Warehousing $0 $698,002 $154,118 $852,120 401 44-45 Retail trade $0 $817,086 $1,618,525 $2,435,611 413 51 Information $0 $229,759 $248,647 $478,406 425 52 Finance & insurance $0 $167,408 $408,125 $575,533 431 53 Real estate & rental $0 $1,308,355 $736,294 $2,044,648 437 54 Professional- scientific & tech svcs $8,487,914 $2,036,646 $386,059 $10,910,619 451 55 Management of companies $0 $63,560 $46,053 $109,614 452 56 Administrative & waste services $0 $243,991 $124,056 $368,047 461 61 Educational svcs $0 $13,990 $43,703 $57,692 464 62 Health & social services $0 $82 $1,139,250 $1,139,331 475 71 Arts- entertainment & recreation $0 $31,418 $215,814 $247,231 479 72 Accommodation & food services $0 $189,468 $943,344 $1,132,812 482 81 Other services $0 $1,342,893 $773,528 $2,116,421 495 92 Government $0 $235,775 $2,031,733 $2,267,508
Total $41,281,026 $8,305,054 $9,465,613 $59,051,692
* 2004 Dollars Source: IMPLAN and The SGM Group, Inc.

The SGM Group, Inc. Page 103 5/10/2005
Table 54: Construction Value Added—Mono and Inyo Counties Industry Direct* Indirect* Induced* Total*
1 11 Ag, Forestry, Fish & Hunting $0 $1,152 $1,007 $2,159 19 21 Mining $0 $1,346 $22 $1,368 30 22 Utilities $0 $59,155 $99,532 $158,687 33 23 Construction $12,965,643 $45,577 $30,094 $13,041,314 46 31-33 Manufacturing $0 $89,541 $83,322 $172,864
390 42 Wholesale Trade $0 $54,610 $42,601 $97,211 391 48-49 Transportation & Warehousing $0 $282,470 $69,468 $351,938 401 44-45 Retail trade $0 $510,182 $981,551 $1,491,734 413 51 Information $0 $89,957 $96,647 $186,604 425 52 Finance & insurance $0 $103,030 $232,656 $335,686 431 53 Real estate & rental $0 $910,836 $519,834 $1,430,670 437 54 Professional- scientific & tech svcs $6,330,652 $1,527,347 $285,277 $8,143,276 451 55 Management of companies $0 $28,873 $20,920 $49,794 452 56 Administrative & waste services $0 $148,323 $74,436 $222,759 461 61 Educational svcs $0 $7,619 $26,241 $33,860 464 62 Health & social services $0 $24 $762,848 $762,872 475 71 Arts- entertainment & recreation $0 $13,919 $124,435 $138,355 479 72 Accommodation & food services $0 $110,541 $468,559 $579,099 482 81 Other services $0 $708,826 $407,781 $1,116,607 495 92 Government $0 $123,308 $1,486,841 $1,610,149
Total $19,296,295 $4,816,638 $5,814,073 $29,927,005
* 2004 Dollars Source: IMPLAN and The SGM Group, Inc.

The SGM Group, Inc. Page 104 5/10/2005
Table 55: Construction Employee Compensation—Mono and Inyo Counties Industry Direct* Indirect* Induced* Total*
1 11 Ag, Forestry, Fish & Hunting $0 $702 $3,635 $4,338 19 21 Mining $0 $876 $15 $891 30 22 Utilities $0 $12,207 $20,633 $32,840 33 23 Construction $10,168,315 $36,760 $24,121 $10,229,195 46 31-33 Manufacturing $0 $73,893 $47,868 $121,761
390 42 Wholesale Trade $0 $29,527 $23,034 $52,561 391 48-49 Transportation & Warehousing $0 $184,924 $49,822 $234,746 401 44-45 Retail trade $0 $341,079 $637,841 $978,920 413 51 Information $0 $50,543 $54,663 $105,207 425 52 Finance & insurance $0 $37,365 $80,921 $118,287 431 53 Real estate & rental $0 $199,485 $83,635 $283,120 437 54 Professional- scientific & tech svcs $3,951,574 $916,772 $169,085 $5,037,430 451 55 Management of companies $0 $25,520 $18,491 $44,011 452 56 Administrative & waste services $0 $93,676 $47,159 $140,835 461 61 Educational svcs $0 $4,995 $22,097 $27,092 464 62 Health & social services $0 $17 $520,506 $520,523 475 71 Arts- entertainment & recreation $0 $8,686 $60,832 $69,517 479 72 Accommodation & food services $0 $57,810 $264,676 $322,486 482 81 Other services $0 $233,818 $174,354 $408,172 495 92 Government $0 $86,843 $143,922 $230,766
Total $14,119,889 $2,395,498 $2,447,311 $18,962,698
* 2004 Dollars Source: IMPLAN and The SGM Group, Inc.

The SGM Group, Inc. Page 105 5/10/2005
Table 56: Construction Labor Income—Mono and Inyo Counties Industry Direct* Indirect* Induced* Total*
1 11 Ag, Forestry, Fish & Hunting $0 -$901 -$2,239 -$3,140 19 21 Mining $0 $921 $15 $935 30 22 Utilities $0 $21,816 $36,857 $58,673 33 23 Construction $13,767,308 $49,982 $32,755 $13,850,045 46 31-33 Manufacturing $0 $84,567 $51,427 $135,995
390 42 Wholesale Trade $0 $31,191 $24,332 $55,523 391 48-49 Transportation & Warehousing $0 $199,746 $52,857 $252,603 401 44-45 Retail trade $0 $389,274 $739,783 $1,129,057 413 51 Information $0 $60,073 $64,968 $125,042 425 52 Finance & insurance $0 $39,229 $85,512 $124,741 431 53 Real estate & rental $0 $247,188 $116,484 $363,672 437 54 Professional- scientific & tech svcs $5,047,697 $1,169,004 $214,597 $6,431,298 451 55 Management of companies $0 $26,454 $19,168 $45,622 452 56 Administrative & waste services $0 $112,096 $56,031 $168,126 461 61 Educational svcs $0 $5,291 $23,519 $28,809 464 62 Health & social services $0 $20 $639,488 $639,508 475 71 Arts- entertainment & recreation $0 $12,091 $85,768 $97,858 479 72 Accommodation & food services $0 $80,769 $389,730 $470,499 482 81 Other services $0 $345,578 $221,322 $566,900 495 92 Government $0 $86,843 $143,922 $230,766
Total $18,815,005 $2,961,232 $2,996,295 $24,772,532
* 2004 Dollars Source: IMPLAN and The SGM Group, Inc.
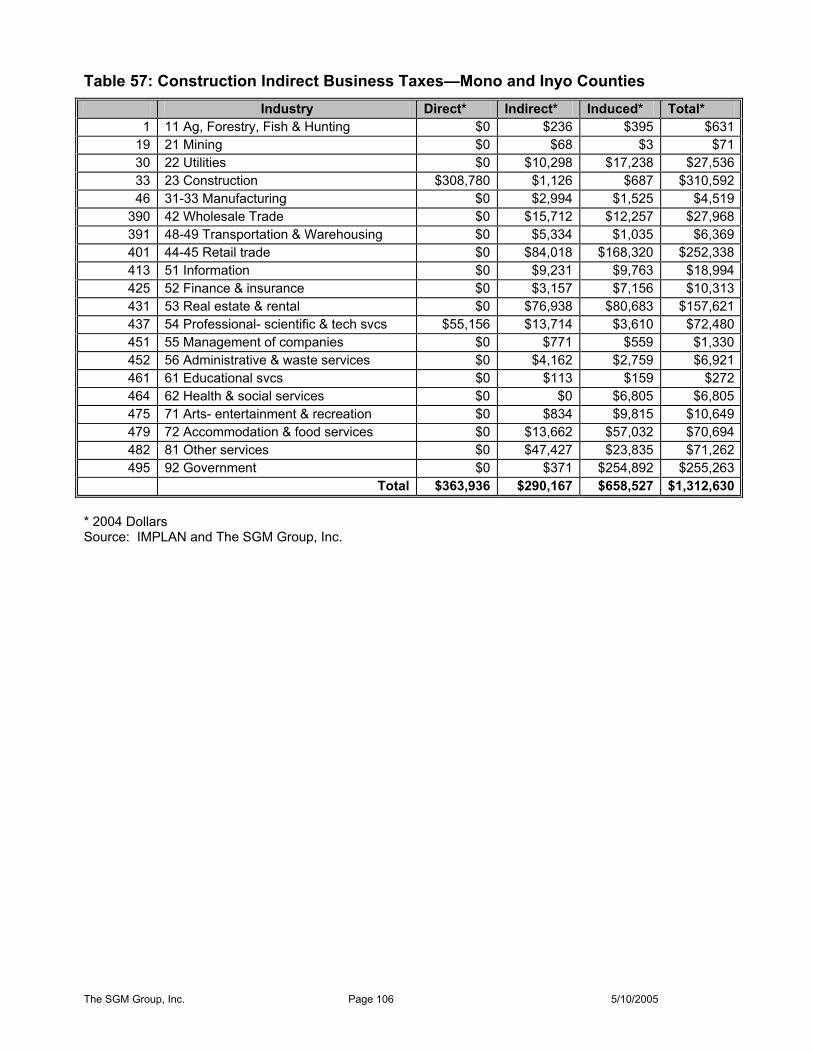
The SGM Group, Inc. Page 106 5/10/2005
Table 57: Construction Indirect Business Taxes—Mono and Inyo Counties Industry Direct* Indirect* Induced* Total*
1 11 Ag, Forestry, Fish & Hunting $0 $236 $395 $631 19 21 Mining $0 $68 $3 $71 30 22 Utilities $0 $10,298 $17,238 $27,536 33 23 Construction $308,780 $1,126 $687 $310,592 46 31-33 Manufacturing $0 $2,994 $1,525 $4,519
390 42 Wholesale Trade $0 $15,712 $12,257 $27,968 391 48-49 Transportation & Warehousing $0 $5,334 $1,035 $6,369 401 44-45 Retail trade $0 $84,018 $168,320 $252,338 413 51 Information $0 $9,231 $9,763 $18,994 425 52 Finance & insurance $0 $3,157 $7,156 $10,313 431 53 Real estate & rental $0 $76,938 $80,683 $157,621 437 54 Professional- scientific & tech svcs $55,156 $13,714 $3,610 $72,480 451 55 Management of companies $0 $771 $559 $1,330 452 56 Administrative & waste services $0 $4,162 $2,759 $6,921 461 61 Educational svcs $0 $113 $159 $272 464 62 Health & social services $0 $0 $6,805 $6,805 475 71 Arts- entertainment & recreation $0 $834 $9,815 $10,649 479 72 Accommodation & food services $0 $13,662 $57,032 $70,694 482 81 Other services $0 $47,427 $23,835 $71,262 495 92 Government $0 $371 $254,892 $255,263
Total $363,936 $290,167 $658,527 $1,312,630
* 2004 Dollars Source: IMPLAN and The SGM Group, Inc.

The SGM Group, Inc. Page 107 5/10/2005
Table 58: Construction Total Taxes—Mono and Inyo Counties
Employee Compensation
Proprietary Income
Household Expenditure
Enterprise (Corporation)
Indirect Business Taxes Total
Corporate Profits Tax $192,634 $192,634 Indirect Bus Tax: Custom Duty $30,196 $30,196 Indirect Bus Tax: Excise Taxes $97,184 $97,184 Indirect Bus Tax: Fed NonTaxes $34,300 $34,300 Personal Tax: Estate and Gift Tax Personal Tax: Income Tax $3,035,392 $3,035,392 Personal Tax: NonTaxes (Fines- Fees $25,931 $25,931 Social Ins Tax- Employee Contribution $1,017,279 $282,442 $1,299,721 Social Ins Tax- Employer Contribution $1,053,448 $1,053,448
Federal Government NonDefense
Total $2,070,727 $282,442 $3,061,323 $192,634 $161,680 $5,768,806 Corporate Profits Tax $47,079 $47,079 Dividends $559 $559 Indirect Bus Tax: Motor Vehicle Lic $7,975 $7,975 Indirect Bus Tax: Other Taxes $64,922 $64,922 Indirect Bus Tax: Property Tax $405,929 $405,929 Indirect Bus Tax: S/L NonTaxes $72,184 $72,184 Indirect Bus Tax: Sales Tax $599,634 $599,634 Indirect Bus Tax: Severance Tax $306 $306 Personal Tax: Estate and Gift Tax Personal Tax: Income Tax $880,539 $880,539 Personal Tax: Motor Vehicle License $27,817 $27,817 Personal Tax: NonTaxes (Fines- Fees $234,845 $234,845 Personal Tax: Other Tax (Fish/Hunt) $4,067 $4,067 Personal Tax: Property Taxes $12,101 $12,101 Social Ins Tax- Employee Contribution $17,714 $17,714 Social Ins Tax- Employer Contribution $63,770 $63,770
State/Local Govt NonEducation
Total $81,483 $1,159,369 $47,638 $1,150,950 $2,439,441 Total $2,152,210 $282,442 $4,220,692 $240,272 $1,312,630 $8,208,247
* 2004 Dollars Source: IMPLAN and The SGM Group, Inc.

The SGM Group, Inc. Page 108 5/10/2005
Table 59: Summary Economic Impacts of Construction Seven-County Region versus Two-County Study Area
Impact Category Mono & Inyo Counties
Seven Counties Leakage
% Capture in Mono & Inyo
Counties Employment
Number of Jobs (Full- or Part-Time) 746 743 Value Measures (2004 Dollars)
Total Output $59,051,692 $80,880,448 $21,828,756 73.01% Value Added $29,927,005 $44,052,147 $14,125,142 67.94% Employee Compensation $18,962,698 $27,560,968 $8,598,270 68.80% Labor Income $24,772,532 $34,966,833 $10,194,300 70.85% Indirect Business Taxes $1,312,630 $2,512,497 $1,199,868 52.24% Total Taxes $8,208,247 $12,136,880 $3,928,634 67.63%
Source: IMPLAN and The SGM Group, Inc.
Note: The seven-county region includes Los Angeles County, Tulare, Kings, San Bernadino, and Kern in addition to Mono and Inyo Counties.

The SGM Group, Inc. Page 109 5/10/2005
Figure 1: Location Map--Mammoth Yosemite Airport
Mono County
Inyo County
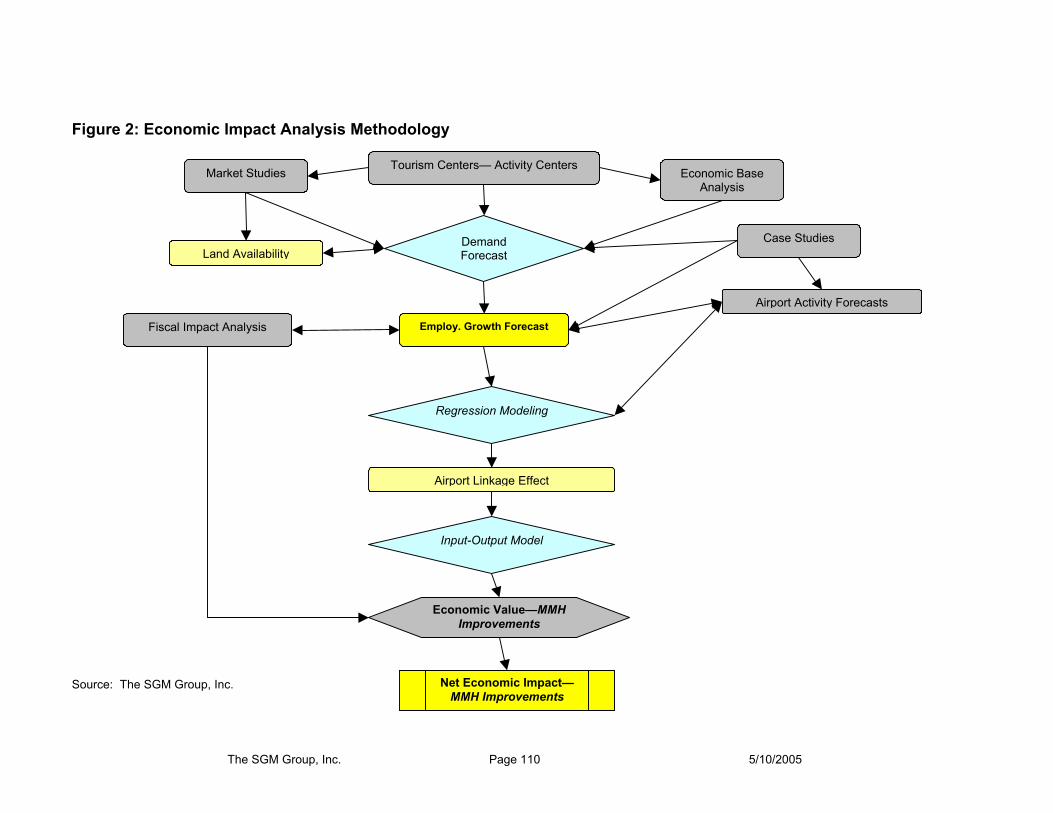
The SGM Group, Inc. Page 110 5/10/2005
Figure 2: Economic Impact Analysis Methodology
Source: The SGM Group, Inc.
Fiscal Impact Analysis
Demand Forecast
Market Studies Tourism Centers— Activity Centers Economic Base
Analysis
Case Studies Land Availability
Employ. Growth Forecast
Regression Modeling
Input-Output Model
Economic Value—MMH Improvements
Net Economic Impact—MMH Improvements
Airport Linkage Effect
Airport Activity Forecasts

The SGM Group, Inc. Page 111 5/10/2005
Figure 3: Average Annual Wages--Mono County 2001-2002
$0
$10,000
$20,000
$30,000
$40,000
$50,000
$60,000
$70,000
2001 Average Annual Income 2002 Average Annual Income
Wage and salary disbursements Nonfarm earnings Private earnings Construction Manufacturing Wholesale trade Retail trade Transportation and warehousing Information Finance and insurance Real estate and rental and leasing Arts, entertainment, and recreation Accommodation and food services Other services, except public administration Government and government enterprises Federal, civilian Military State and local State government Local government
Source: Regional Economic Information System, Bureau of Economic Analysis, May 2004; The SGM Group, Inc.
The SGM Group, Inc. Page 112 5/10/2005
Note: The calculation of average annual wages by economic sector is used to help measure the potential affect on affordable housing requirements in the region. Although only data for Mono County is shown, similar data exists for Inyo County. In general, average wages are relatively low when compared with the required financial support necessary for acquisition of new housing in the Mammoth Lakes area. As indicated, additional employment concentrated within the accommodations and services sector has the potential to exacerbate an otherwise occurring affordable housing shortage in the two-county study region. The only economic sector with an average annual wage (2002 dollars) over $60,000 is the federal government sector. Most sectors are well under $40,000 per year (2002 dollars).

The SGM Group, Inc. Page 113 5/10/2005
Figure 4: Mono County Monthly Employment by Sector 2001-2004
0
1,000
2,000
3,000
4,000
5,000
6,000
7,000
8,000
9,000
Jan-01
Feb-01
Mar-01
Apr-01
May-01
Jun-01
Jul-01
Aug-01
Sep-01
Oct-01
Nov-01
Dec-01
Jan-02
Feb-02
Mar-02
Apr-02
May-02
Jun-02
Jul-02
Aug-02
Sep-02
Oct-02
Nov-02
Dec-02
Jan-03
Feb-03
Mar-03
Apr-03
May-03
Jun-03
Jul-03
Aug-03
Sep-03
Oct-03
Nov-03
Dec-03
Jan-04
Feb-04
Mar-04
Apr-04
May-04
Jun-04
Goods Producing Trade, Transportation and Utilities Financial Activities Professional and Business Services Educational and Health Services Arts, Entertainment, and Recreation Accommodation Food Services and Drinking Places Residual-Other Services Federal Government State Government Local Government
Source: California Employment Development Department Labor Market Information; The SGM Group, Inc.
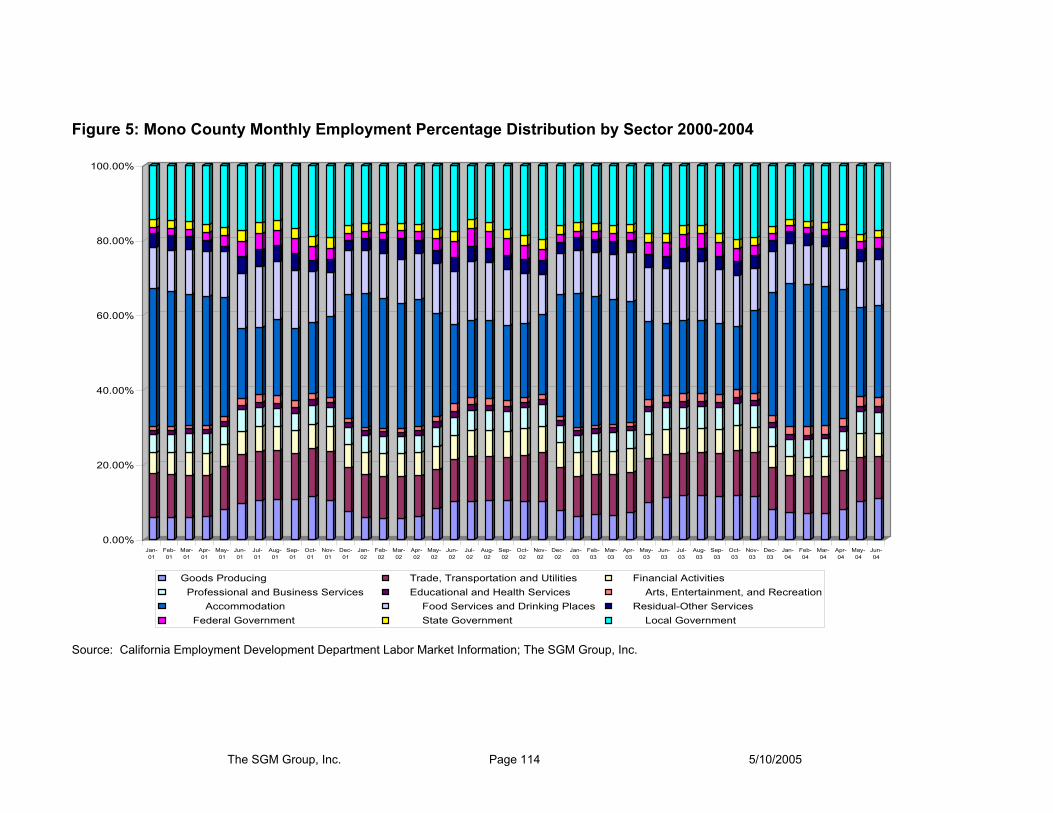
The SGM Group, Inc. Page 114 5/10/2005
Figure 5: Mono County Monthly Employment Percentage Distribution by Sector 2000-2004
0.00%
20.00%
40.00%
60.00%
80.00%
100.00%
Jan-01
Feb-01
Mar-01
Apr-01
May-01
Jun-01
Jul-01
Aug-01
Sep-01
Oct-01
Nov-01
Dec-01
Jan-02
Feb-02
Mar-02
Apr-02
May-02
Jun-02
Jul-02
Aug-02
Sep-02
Oct-02
Nov-02
Dec-02
Jan-03
Feb-03
Mar-03
Apr-03
May-03
Jun-03
Jul-03
Aug-03
Sep-03
Oct-03
Nov-03
Dec-03
Jan-04
Feb-04
Mar-04
Apr-04
May-04
Jun-04
Goods Producing Trade, Transportation and Utilities Financial Activities Professional and Business Services Educational and Health Services Arts, Entertainment, and Recreation Accommodation Food Services and Drinking Places Residual-Other Services Federal Government State Government Local Government
Source: California Employment Development Department Labor Market Information; The SGM Group, Inc.

The SGM Group, Inc. Page 115 5/10/2005
Figure 6: Inyo County Monthly Employment by Sector 2001-2004
0
1,000
2,000
3,000
4,000
5,000
6,000
7,000
8,000
9,000
Jan-01
Feb-01
Mar-01
Apr-01
May-01
Jun-01
Jul-01
Aug-01
Sep-01
Oct-01
Nov-01
Dec-01
Jan-02
Feb-02
Mar-02
Apr-02
May-02
Jun-02
Jul-02
Aug-02
Sep-02
Oct-02
Nov-02
Dec-02
Jan-03
Feb-03
Mar-03
Apr-03
May-03
Jun-03
Jul-03
Aug-03
Sep-03
Oct-03
Nov-03
Dec-03
Jan-04
Feb-04
Mar-04
Apr-04
May-04
Jun-04
Natural Resources and Mining Construction Manufacturing Wholesale Trade Retail Trade Transportation, Warehousing and Utilities Information Financial Activities Professional and Business Services Educational and Health Services Arts, Entertainment, and Recreation Accommodation Food Services and Drinking Places Other Services Federal Government State Government Local Government
Source: California Employment Development Department Labor Market Information; The SGM Group, Inc.

The SGM Group, Inc. Page 116 5/10/2005
Figure 7: Inyo County Monthly Employment Percentage Distribution by Sector 2001-2004
0.00%
20.00%
40.00%
60.00%
80.00%
100.00%
Jan-01
Feb-01
Mar-01
Apr-01
May-01
Jun-01
Jul-01
Aug-01
Sep-01
Oct-01
Nov-01
Dec-01
Jan-02
Feb-02
Mar-02
Apr-02
May-02
Jun-02
Jul-02
Aug-02
Sep-02
Oct-02
Nov-02
Dec-02
Jan-03
Feb-03
Mar-03
Apr-03
May-03
Jun-03
Jul-03
Aug-03
Sep-03
Oct-03
Nov-03
Dec-03
Jan-04
Feb-04
Mar-04
Apr-04
May-04
Jun-04
Natural Resources and Mining Construction Manufacturing Wholesale Trade Retail Trade Transportation, Warehousing and Utilities Information Financial Activities Professional and Business Services Educational and Health Services Arts, Entertainment, and Recreation Accommodation Food Services and Drinking Places Other Services Federal Government State Government Local Government
Source: California Employment Development Department Labor Market Information; The SGM Group, Inc.

The SGM Group, Inc. Page 117 5/10/2005
Figure 8: Percentage Distribution by Economic Sector—Mono County 2001
-10.00%
10.00%
30.00%
50.00%
70.00%
90.00%
110.00%
IndustryOutput*
Employment EmployeeCompensation*
ProprietorIncome*
Other PropertyIncome*
IndirectBusiness Tax*
Total ValueAdded*
92 Government & non NAICs81 Other services72 Accomodation & food services71 Arts- entertainment & recreation62 Health & social services61 Educational svcs56 Administrative & waste services55 Management of companies54 Professional- scientific & tech svcs53 Real estate & rental52 Finance & insurance51 Information44-45 Retail trade48-49 Transportation & Warehousing42 Wholesale Trade31-33 Manufacturing23 Construction22 Utilities21 Mining11 Ag, Forestry, Fish & Hunting
Source: The SGM Group, Inc.

The SGM Group, Inc. Page 118 5/10/2005
Figure 9: Industry Output by Economic Sector—Mono County 2001
$0.00
$20.00
$40.00
$60.00
$80.00
$100.00
$120.00
$140.00
*Mill
ion
$
11 Ag, Forestry, Fish & Huntin
21 Mining22 Utilities23 Construction
31-33 Manufacturing
42 Wholesale Trade
48-49 Transportation & Warehousi
44-45 Retail trade
51 Information52 Finance & insurance
53 Real estate & renta
54 Professional- scientific & tech sv
55 Management of companie
56 Administrative & waste service
61 Educational svcs
62 Health & social service
71 Arts- entertainment & recreatio
72 Accomodation & food service
81 Other services
92 Government & non NAIC
Industry Output*
Source: IMPLAN and The SGM Group, Inc.

The SGM Group, Inc. Page 119 5/10/2005
Figure 10: Employment Distribution by Economic Sector—Mono County 2001
0.00
500.00
1,000.00
1,500.00
2,000.00
2,500.00
3,000.00
Nu
mb
er o
f Jo
11 Ag, Forestry, Fish & Hunt
21 Mining
22 Utilities23 Construction
31-33 Manufacturin
42 Wholesale Trad
48-49 Transportation & Warehou
44-45 Retail trad
51 Information
52 Finance & insuran
53 Real estate & rent
54 Professional- scientific & tech
55 Managem
ent of compan
56 Administrative & waste serv
61 Educational svc
62 Health & social servic
71 Arts- entertainment & recrea
72 Accomodation & food servi
81 Other service
92 Government & non NAI
BEA Employment Distribution
Source: BEA, IMPLAN and The SGM Group, Inc.
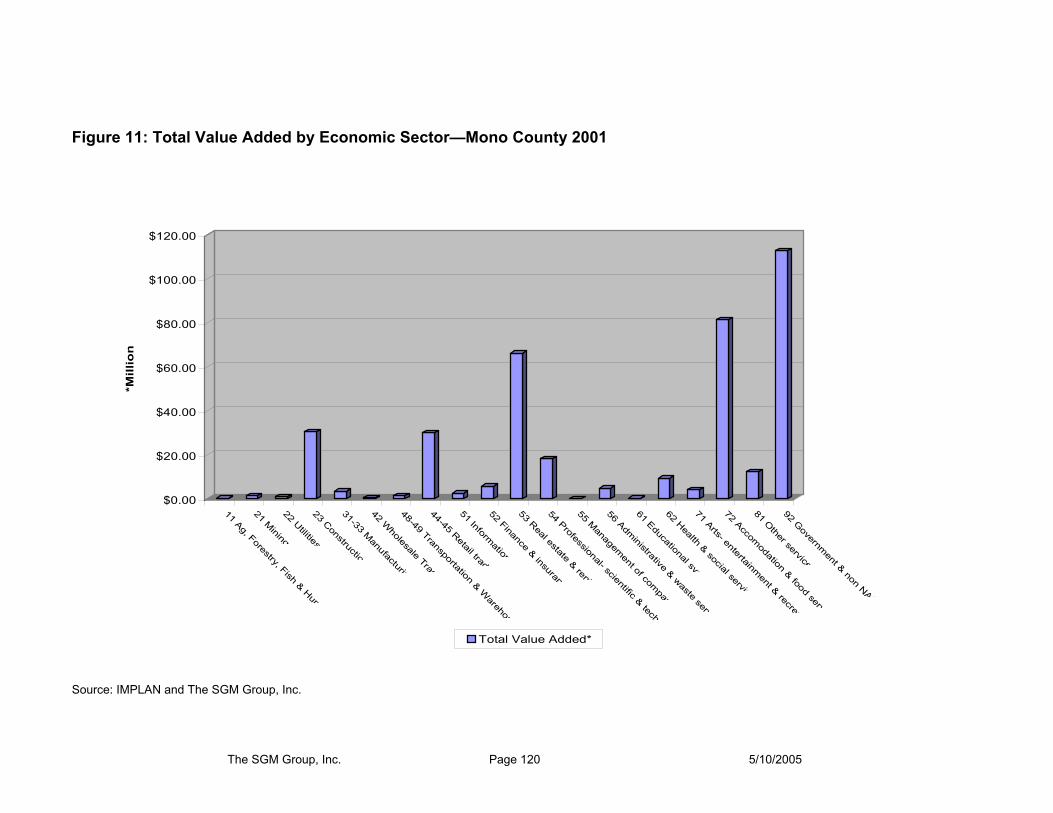
The SGM Group, Inc. Page 120 5/10/2005
Figure 11: Total Value Added by Economic Sector—Mono County 2001
$0.00
$20.00
$40.00
$60.00
$80.00
$100.00
$120.00
*Mill
ion
11 Ag, Forestry, Fish & Hunt
21 Mining
22 Utilities23 Construction
31-33 Manufacturin
42 Wholesale Trad
48-49 Transportation & Warehou
44-45 Retail trad
51 Information
52 Finance & insuran
53 Real estate & rent
54 Professional- scientific & tech
55 Managem
ent of compan
56 Administrative & waste serv
61 Educational svc
62 Health & social servic
71 Arts- entertainment & recrea
72 Accomodation & food servi
81 Other service
92 Government & non NAI
Total Value Added*
Source: IMPLAN and The SGM Group, Inc.
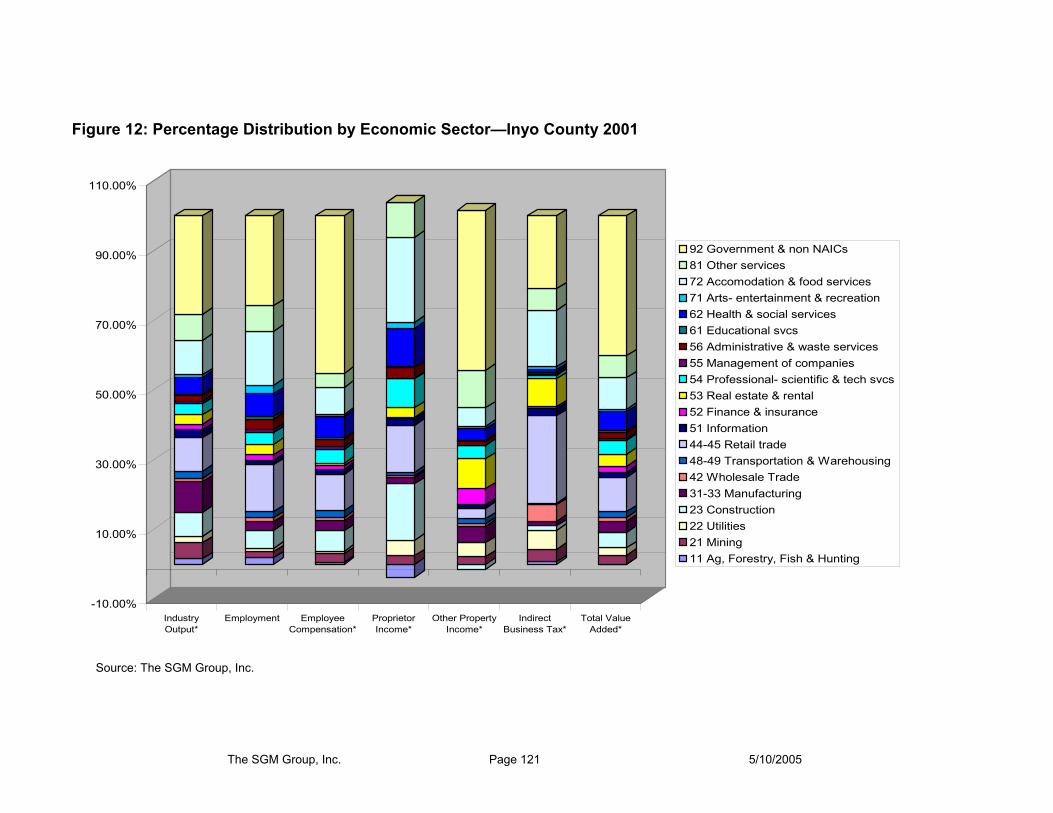
The SGM Group, Inc. Page 121 5/10/2005
Figure 12: Percentage Distribution by Economic Sector—Inyo County 2001
-10.00%
10.00%
30.00%
50.00%
70.00%
90.00%
110.00%
IndustryOutput*
Employment EmployeeCompensation*
ProprietorIncome*
Other PropertyIncome*
IndirectBusiness Tax*
Total ValueAdded*
92 Government & non NAICs81 Other services72 Accomodation & food services71 Arts- entertainment & recreation62 Health & social services61 Educational svcs56 Administrative & waste services55 Management of companies54 Professional- scientific & tech svcs53 Real estate & rental52 Finance & insurance51 Information44-45 Retail trade48-49 Transportation & Warehousing42 Wholesale Trade31-33 Manufacturing23 Construction22 Utilities21 Mining11 Ag, Forestry, Fish & Hunting
Source: The SGM Group, Inc.
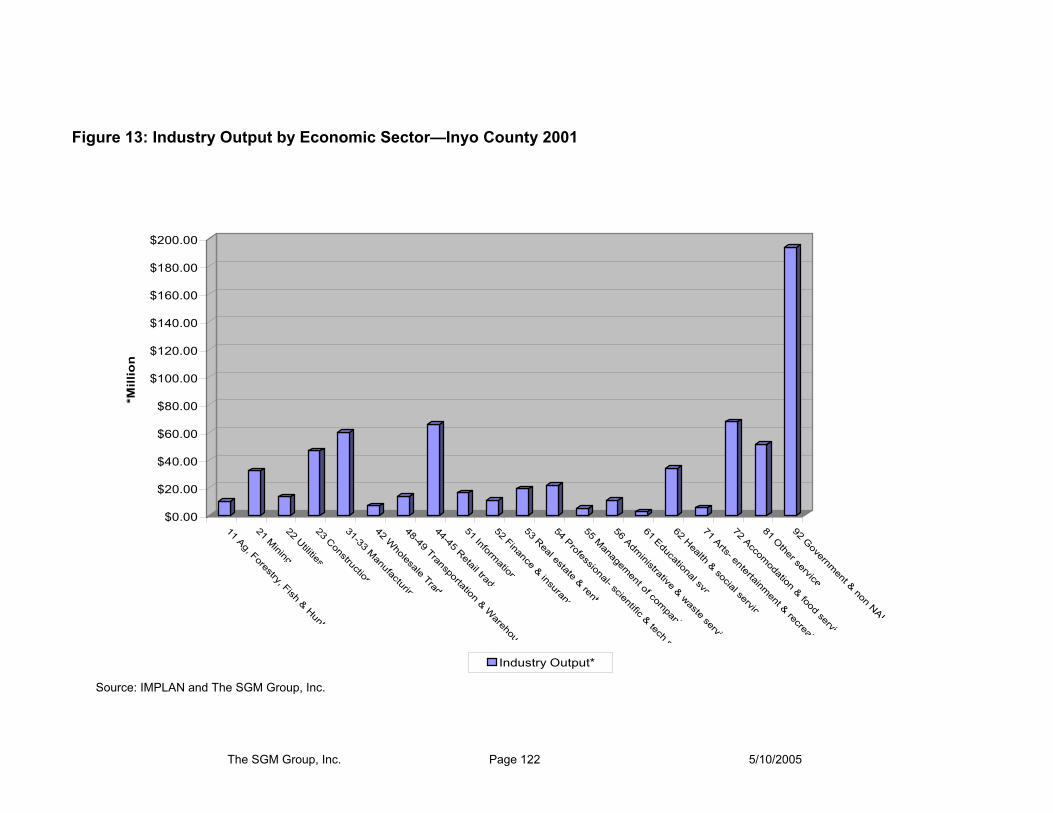
The SGM Group, Inc. Page 122 5/10/2005
Figure 13: Industry Output by Economic Sector—Inyo County 2001
$0.00
$20.00
$40.00
$60.00
$80.00
$100.00
$120.00
$140.00
$160.00
$180.00
$200.00
*Mill
ion
11 Ag, Forestry, Fish & Hunti
21 Mining
22 Utilities23 Construction
31-33 Manufacturin
42 Wholesale Trade
48-49 Transportation & Warehous
44-45 Retail trade
51 Information
52 Finance & insuranc
53 Real estate & renta
54 Professional- scientific & tech s
55 Managem
ent of compani
56 Administrative & waste servic
61 Educational svc
62 Health & social service
71 Arts- entertainment & recreat
72 Accomodation & food servic
81 Other services
92 Government & non NAIC
Industry Output*
Source: IMPLAN and The SGM Group, Inc.

The SGM Group, Inc. Page 123 5/10/2005
Figure 14: Employment Distribution by Economic Sector—Inyo County 2001
0.00
500.00
1,000.00
1,500.00
2,000.00
2,500.00
3,000.00
Nu
mb
er o
f Jo
b
11 Ag, Forestry, Fish & Hunti
21 Mining
22 Utilities23 Construction
31-33 Manufacturin
42 Wholesale Trade
48-49 Transportation & Warehous
44-45 Retail trade
51 Information
52 Finance & insuranc
53 Real estate & renta
54 Professional- scientific & tech s
55 Managem
ent of compani
56 Administrative & waste servic
61 Educational svc
62 Health & social service
71 Arts- entertainment & recreat
72 Accomodation & food servic
81 Other services
92 Government & non NAIC
BEA Employment Distribution
Source: BEA, IMPLAN and The SGM Group, Inc.
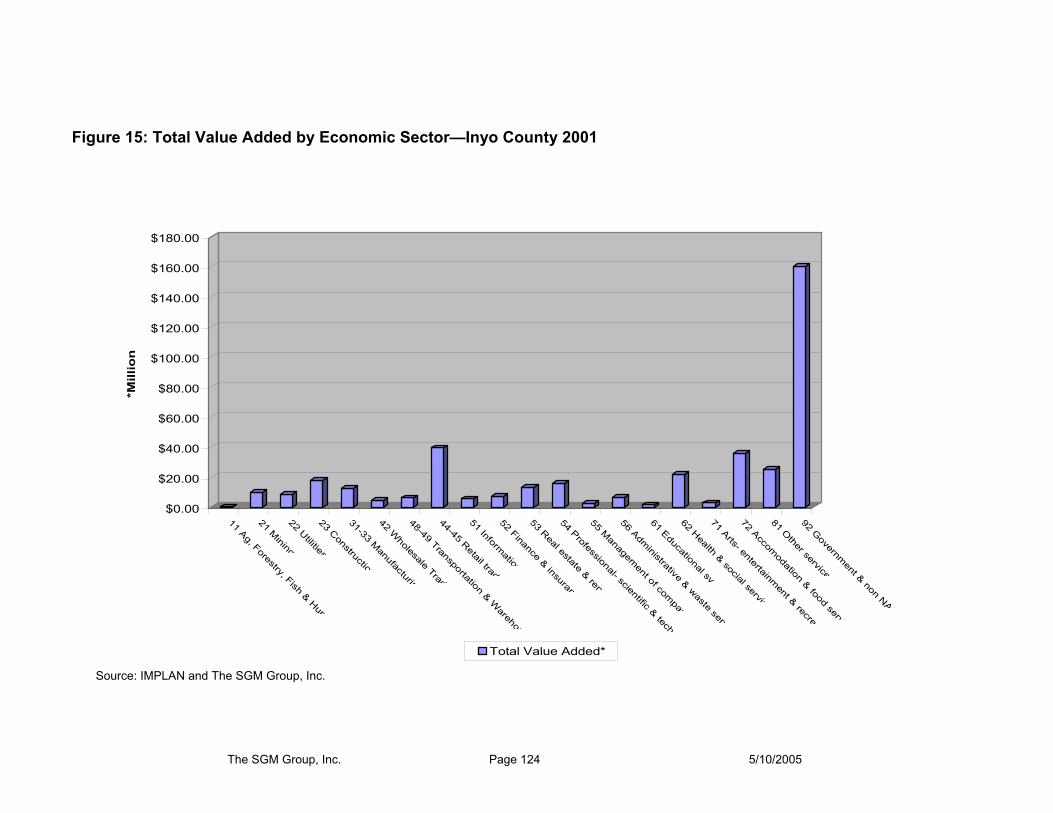
The SGM Group, Inc. Page 124 5/10/2005
Figure 15: Total Value Added by Economic Sector—Inyo County 2001
$0.00
$20.00
$40.00
$60.00
$80.00
$100.00
$120.00
$140.00
$160.00
$180.00
*Mill
ion
11 Ag, Forestry, Fish & Hunt
21 Mining
22 Utilities23 Construction
31-33 Manufacturin
42 Wholesale Trad
48-49 Transportation & Warehou
44-45 Retail trad
51 Information
52 Finance & insuran
53 Real estate & rent
54 Professional- scientific & tech
55 Managem
ent of compan
56 Administrative & waste serv
61 Educational svc
62 Health & social servic
71 Arts- entertainment & recrea
72 Accomodation & food servi
81 Other service
92 Government & non NAI
Total Value Added*
Source: IMPLAN and The SGM Group, Inc.

The SGM Group, Inc. Page 125 5/10/2005
Figure 16: Comparative Employment Distribution by Economic Sector—Mono and Inyo Counties 2001
0.00
500.00
1,000.00
1,500.00
2,000.00
2,500.00
3,000.00
Nu
mb
er o
f Jo
11 Ag, Forestry, Fish & Hun
21 Mining
22 Utilities23 Constructio
31-33 Manufacturin
42 Wholesale Trad
48-49 Transportation & Wareho
44-45 Retail trad
51 Information
52 Finance & insuran
53 Real estate & ren
54 Professional- scientific & tech
55 Managem
ent of compa
56 Administrative & waste ser
61 Educational svc
62 Health & social servi
71 Arts- entertainment & recre
72 Accomodation & food serv
81 Other service
92 Governm
ent & non NA
Employment Inyo Employment Mono
Source: The SGM Group, Inc.
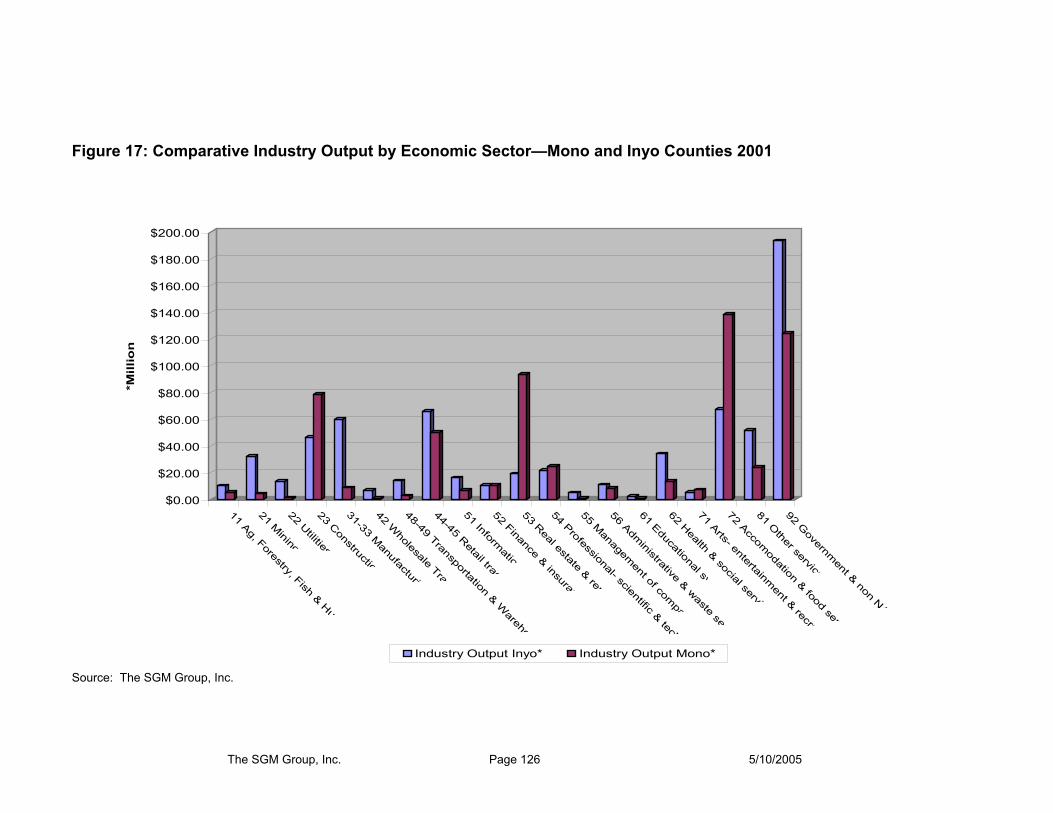
The SGM Group, Inc. Page 126 5/10/2005
Figure 17: Comparative Industry Output by Economic Sector—Mono and Inyo Counties 2001
$0.00
$20.00
$40.00
$60.00
$80.00
$100.00
$120.00
$140.00
$160.00
$180.00
$200.00
*Mill
ion
11 Ag, Forestry, Fish & Hu
21 Mining
22 Utilities23 Constructio
31-33 Manufacturi
42 Wholesale Trad
48-49 Transportation & Wareho
44-45 Retail trad
51 Informatio
52 Finance & insuran
53 Real estate & ren
54 Professional- scientific & tech
55 Managem
ent of compa
56 Administrative & waste ser
61 Educational sv
62 Health & social servi
71 Arts- entertainment & recre
72 Accomodation & food ser
81 Other service
92 Governm
ent & non NA
Industry Output Inyo* Industry Output Mono*
Source: The SGM Group, Inc.

The SGM Group, Inc. Page 127 5/10/2005
Figure 18: Comparative Value Added by Economic Sector—Mono and Inyo Counties 2001
$0.00
$20.00
$40.00
$60.00
$80.00
$100.00
$120.00
$140.00
$160.00
$180.00
* M
illio
n
11 Ag, Forestry, Fish & Hu
21 Mining
22 Utilities23 Constructio
31-33 Manufacturi
42 Wholesale Trad
48-49 Transportation & Wareho
44-45 Retail trad
51 Informatio
52 Finance & insuran
53 Real estate & ren
54 Professional- scientific & tech
55 Managem
ent of compa
56 Administrative & waste se
61 Educational sv
62 Health & social serv
71 Arts- entertainment & recr
72 Accomodation & food ser
81 Other service
92 Governm
ent & non NA
Total Value Added Inyo* Total Value Added Mono*
Source: The SGM Group, Inc.

The SGM Group, Inc. Page 128 5/10/2005
Figure 19: Population and Employment Growth--Mono and Inyo Counties1990-2004
-
5,000
10,000
15,000
20,000
25,000
30,000
35,000
1990 1991 1992 1993 1994 1995 1996 1997 1998 1999 2000 2001 2002 2003 2004
Full and Part-Time EmploymentPopulation
Source: Bureau of Economic Analysis, US Department of Commerce (1990-2002); The SGM Group, Inc., (2003-2004).

The SGM Group, Inc. Page 129 5/10/2005
Figure 20: Telluride/Montrose Regional Airports Model SUMMARY OUTPUT-Three County with Montrose and Telluride FAA Enplanements
Regression StatisticsMultiple R 0.935198641R Square 0.874596498Adjusted R Square 0.666128664Standard Error 1158.730103Observations 9
ANOVAdf SS MS F ignificance F
Regression 3 56184161 18728054 13.94852 0.007287Residual 6 8055933 1342655Total 9 64240094
Coefficients tandard Erro t Stat P-value Lower 95%Upper 95% Lower 95.0% Upper 95.0%Intercept 0 #N/A #N/A #N/A #N/A #N/A #N/A #N/AThree-County Sales and Use Tax 0.004027536 0.001083 3.719927 0.009853 0.001378 0.006677 0.001378281 0.006676791Skier Days 0.016955607 0.010062 1.6851 0.142949 -0.007665 0.041577 -0.00766543 0.04157664Enplanements 0.010949552 0.060481 0.18104 0.862296 -0.137043 0.158942 -0.13704281 0.158941914
RESIDUAL OUTPUT
Observation Predicted Y Residualsndard Residuals1 22504.8709 -329.8709 -0.3486642 24689.55638 -608.5564 -0.6432273 24629.37567 639.6243 0.6760654 24214.33731 1764.663 1.8651985 26690.33445 605.6655 0.6401716 29983.77489 -1795.775 -1.8980837 29364.46535 -230.4654 -0.2435958 30460.88323 -285.8832 -0.302179 29931.03703 571.963 0.604549
X Variable 1 Residual Plot
-2000
0
2000
0 2000000 4000000 6000000 8000000
X Variable 1
Res
idua
ls
X Variable 2 Residual Plot
-2000
0
2000
0 100000 200000 300000 400000 500000
X Variable 2
Res
idua
ls
X Variable 3 Residual Plot
-2000
0
2000
0 20000 40000 60000 80000 100000
X Variable 3R
esid
uals
X Variable 1 Line Fit Plot
02000040000
0 2E+06 4E+06 6E+06 8E+06
X Variable 1
Y
YPredicted Y
X Variable 2 Line Fit Plot
02000040000
0 200000 400000 600000
X Variable 2
Y
YPredicted Y
X Variable 3 Line Fit Plot
02000040000
0 50000 100000
X Variable 3
Y
YPredicted Y
Source: The SGM Group, Inc.

The SGM Group, Inc. Page 130 5/10/2005
Figure 21: Eagle County Regional Airport Model SUMMARY OUTPUT--Eagle-Vail
Regression StatisticsMultiple R 0.996594811R Square 0.993201218Adjusted R Square 0.848401566Standard Error 525.6251184Observations 10
ANOVAdf SS MS F Significance F
Regression 3 282524667.7 94174889 340.8654 4.33226E-07Residual 7 1933972.356 276281.8Total 10 284458640.1
Coefficients Standard Error t Stat P-value Lower 95% Upper 95% Lower 95.0% Upper 95.0%Intercept 0 #N/A #N/A #N/A #N/A #N/A #N/A #N/APopulation 0.563964416 0.074698432 7.549883 0.000132 0.387330817 0.740598014 0.387330817 0.740598014Skier Days 0.001263301 0.000317418 3.979933 0.005324 0.000512728 0.002013873 0.000512728 0.002013873Enplanements 0.040415137 0.007952722 5.081925 0.001428 0.021609952 0.059220323 0.021609952 0.059220323
RESIDUAL OUTPUT
Observation Predicted Y Residuals ndard Residuals1 24515.36368 -314.3636775 -0.7148372 26061.51948 590.480519 1.3427043 28386.52944 239.4705582 0.5445364 31006.56288 -331.5628801 -0.7539475 34377.04574 -344.0457434 -0.7823326 35977.77532 337.2246826 0.7668217 36951.05578 647.9442188 1.4733728 39019.04756 -11.04755759 -0.0251219 39153.35437 108.645625 0.247051
10 39861.53994 -809.539936 -1.840828
X Variable 1 Residual Plot
-1000
0
1000
0 0 0 1 1 1 1
X Variable 1
Resid
uals
X Variable 2 Residual Plot
-1000
0
1000
5,400,000
5,600,000
5,800,000
6,000,000
6,200,000
6,400,000
X Variable 2
Resid
uals
X Variable 3 Residual Plot
-1000
0
1000
- 0 0 1 1 1
X Variable 3
Resid
uals
X Variable 1 Line Fit Plot
0
50,000
0 1 1 2X Variable 1
Y
YPredicted Y
X Variable 2 Line Fit Plot
050,000
5,000,000
5,500,000
6,000,000
6,500,000
X Variable 2
Y
YPredicted Y
X Variable 3 Line Fit Plot
0
50,000
- 1 1X Variable 3
Y
YPredicted Y
Source: The SGM Group, Inc.

The SGM Group, Inc. Page 131 5/10/2005
Figure 22: Aspen/Pitkin County Airport Model SUMMARY OUTPUT--Aspen/Pitkin Airport
Regression StatisticsMultiple R 0.858177727R Square 0.736469011Adjusted R Square 0.438036849Standard Error 713.7097088Observations 10
ANOVAdf SS MS F ignificance F
Regression 4 8541167.61 2135291.902 4.19193 0.073983Residual 6 3056289.29 509381.5484Total 10 11597456.9
Coefficients Standard Error t Stat P-value Lower 95%Upper 95%Lower 95.0%Upper 95.0%Intercept 0 #N/A #N/A #N/A #N/A #N/A #N/A #N/APopulation 1.570904153 0.369218175 4.254677202 0.005353 0.667459 2.474349 0.667459 2.474349Sales and Use Tax 0.000114673 0.00019055 0.601800227 0.569333 -0.000352 0.000581 -0.000352 0.000581Ski Visits -0.003255091 0.002386358 -1.364041481 0.221505 -0.009094 0.002584 -0.009094 0.002584Enplanements 0.002428992 0.005176518 0.469232735 0.655469 -0.010238 0.015095 -0.010238 0.015095
RESIDUAL OUTPUT PROBABILITY OUTPUT
Observation Predicted Y Residuals Standard Residuals Percentile Y1 18766.46259 -304.4625918 -0.550727433 5 184622 19938.4045 -713.4044962 -1.290442365 15 192253 20565.51287 -905.512867 -1.637937764 25 196604 20108.71539 207.2846068 0.374946948 35 203165 20443.48106 648.5189415 1.173074071 45 210766 21089.77101 39.22898566 0.070959386 55 210927 21401.15892 -325.1589197 -0.588164004 65 211298 20712.01123 1008.988769 1.825110243 75 215999 21563.39762 117.602384 0.212725178 85 21681
10 21420.13504 178.864961 0.323540046 95 21721
X Variable 1 Residual Plot
-2000
0
2000
13,500 14,000 14,500 15,000 15,500
X Variable 1
Res
idua
ls
X Variable 2 Residual Plot
-2000
0
2000
0 5,000,000 10,000,000
15,000,000
20,000,000
X Variable 2
Res
idua
ls
X Variable 3 Residual Plot
-2000
0
2000
0 500,000 1,000,000 1,500,000 2,000,000
X Variable 3
Res
idua
ls
X Variable 4 Residual Plot
-2000
0
2000
- 100,000 200,000 300,000 400,000
X Variable 4
Res
idua
ls
X Variable 1 Line Fit Plot
18,00020,00022,000
13,500
14,000
14,500
15,000
15,500
X Variable 1
Y
YPredicted Y
X Variable 2 Line Fit Plot
18,00020,00022,000
0 5,000,000
10,000,000
15,000,000
20,000,000
X Variable 2
Y
YPredicted Y
X Variable 3 Line Fit Plot
18,00020,00022,000
0 500,000
1,000,000
1,500,000
2,000,000
X Variable 3
Y
YPredicted Y
X Variable 4 Line Fit Plot
18,00020,00022,000
- 100,000
200,000
300,000
400,000
X Variable 4
Y
YPredicted Y
Normal Probability Plot
180002000022000
0 20 40 60 80 100
Sample Percentile
Y
Source: The SGM Group, Inc.
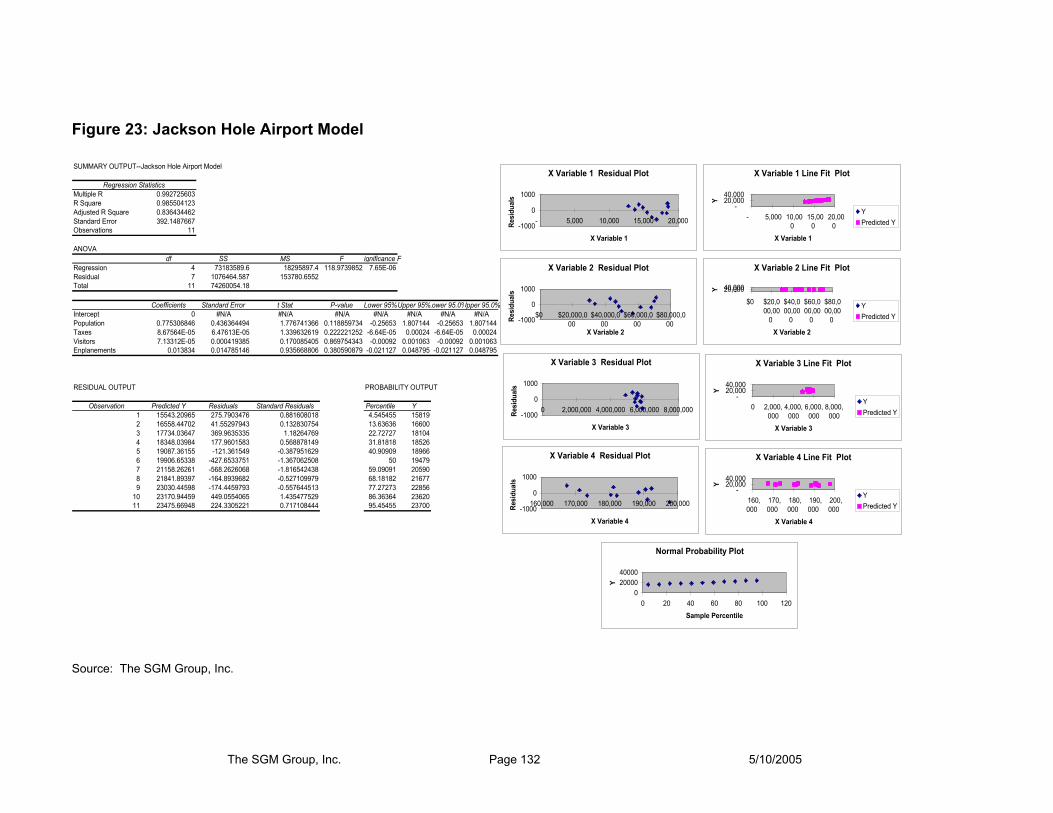
The SGM Group, Inc. Page 132 5/10/2005
Figure 23: Jackson Hole Airport Model SUMMARY OUTPUT--Jackson Hole Airport Model
Regression StatisticsMultiple R 0.992725603R Square 0.985504123Adjusted R Square 0.836434462Standard Error 392.1487667Observations 11
ANOVAdf SS MS F ignificance F
Regression 4 73183589.6 18295897.4 118.9739852 7.65E-06Residual 7 1076464.587 153780.6552Total 11 74260054.18
Coefficients Standard Error t Stat P-value Lower 95%Upper 95%Lower 95.0%Upper 95.0%Intercept 0 #N/A #N/A #N/A #N/A #N/A #N/A #N/APopulation 0.775306846 0.436364494 1.776741366 0.118859734 -0.25653 1.807144 -0.25653 1.807144Taxes 8.67564E-05 6.47613E-05 1.339632619 0.222221252 -6.64E-05 0.00024 -6.64E-05 0.00024Visitors 7.13312E-05 0.000419385 0.170085405 0.869754343 -0.00092 0.001063 -0.00092 0.001063Enplanements 0.013834 0.014785146 0.935668806 0.380590879 -0.021127 0.048795 -0.021127 0.048795
RESIDUAL OUTPUT PROBABILITY OUTPUT
Observation Predicted Y Residuals Standard Residuals Percentile Y1 15543.20965 275.7903476 0.881608018 4.545455 158192 16558.44702 41.55297943 0.132830754 13.63636 166003 17734.03647 369.9635335 1.18264769 22.72727 181044 18348.03984 177.9601583 0.568878149 31.81818 185265 19087.36155 -121.361549 -0.387951629 40.90909 189666 19906.65338 -427.6533751 -1.367062508 50 194797 21158.26261 -568.2626068 -1.816542438 59.09091 205908 21841.89397 -164.8939682 -0.527109979 68.18182 216779 23030.44598 -174.4459793 -0.557644513 77.27273 22856
10 23170.94459 449.0554065 1.435477529 86.36364 2362011 23475.66948 224.3305221 0.717108444 95.45455 23700
X Variable 1 Residual Plot
-1000
0
1000
- 5,000 10,000 15,000 20,000
X Variable 1
Resi
dual
s
X Variable 2 Residual Plot
-1000
0
1000
$0 $20,000,000
$40,000,000
$60,000,000
$80,000,000
X Variable 2
Resi
dual
s
X Variable 3 Residual Plot
-1000
0
1000
0 2,000,000 4,000,000 6,000,000 8,000,000
X Variable 3
Resi
dual
s
X Variable 4 Residual Plot
-1000
0
1000
160,000 170,000 180,000 190,000 200,000
X Variable 4Re
sidu
als
X Variable 1 Line Fit Plot
-20,00040,000
- 5,000 10,000
15,000
20,000
X Variable 1
Y
YPredicted Y
X Variable 2 Line Fit Plot
-20,00040,000
$0 $20,000,00
0
$40,000,00
0
$60,000,00
0
$80,000,00
0X Variable 2
Y
YPredicted Y
X Variable 3 Line Fit Plot
-20,00040,000
0 2,000,000
4,000,000
6,000,000
8,000,000
X Variable 3
Y
YPredicted Y
X Variable 4 Line Fit Plot
-20,00040,000
160,000
170,000
180,000
190,000
200,000
X Variable 4
Y
YPredicted Y
Normal Probability Plot
02000040000
0 20 40 60 80 100 120Sample Percentile
Y
Source: The SGM Group, Inc.
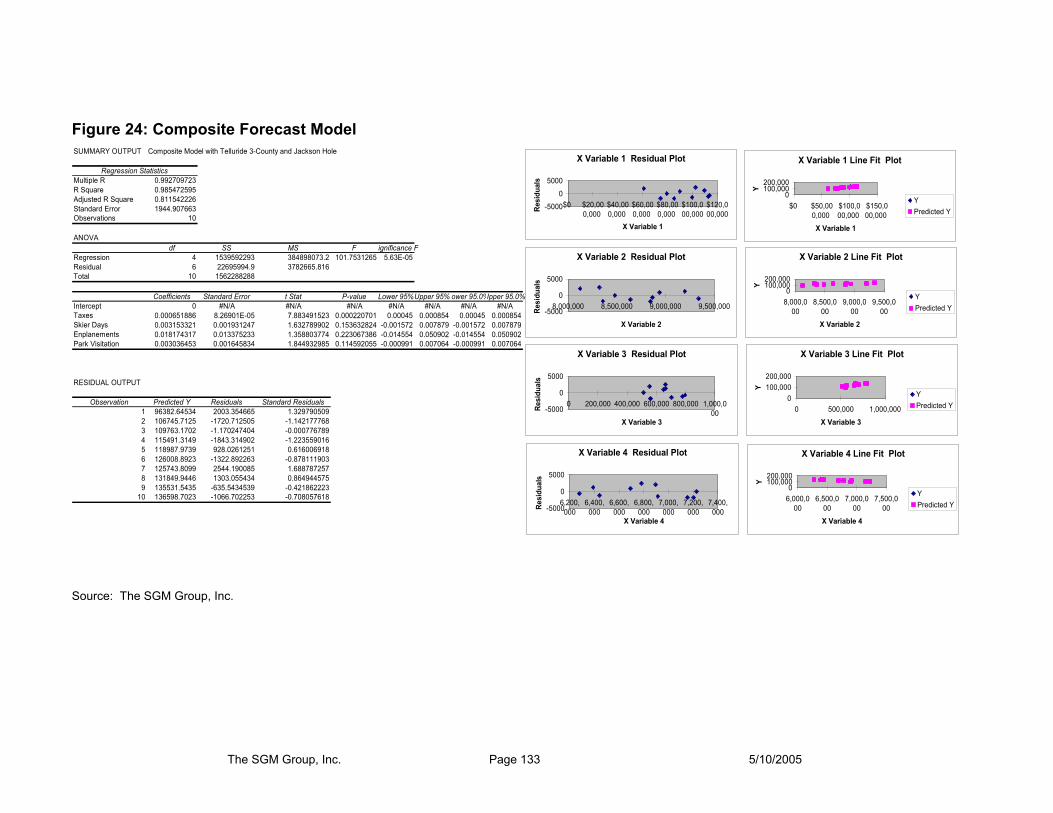
The SGM Group, Inc. Page 133 5/10/2005
Figure 24: Composite Forecast Model SUMMARY OUTPUT Composite Model with Telluride 3-County and Jackson Hole
Regression StatisticsMultiple R 0.992709723R Square 0.985472595Adjusted R Square 0.811542226Standard Error 1944.907663Observations 10
ANOVAdf SS MS F ignificance F
Regression 4 1539592293 384898073.2 101.7531265 5.63E-05Residual 6 22695994.9 3782665.816Total 10 1562288288
Coefficients Standard Error t Stat P-value Lower 95%Upper 95%Lower 95.0%Upper 95.0%Intercept 0 #N/A #N/A #N/A #N/A #N/A #N/A #N/ATaxes 0.000651886 8.26901E-05 7.883491523 0.000220701 0.00045 0.000854 0.00045 0.000854Skier Days 0.003153321 0.001931247 1.632789902 0.153632824 -0.001572 0.007879 -0.001572 0.007879Enplanements 0.018174317 0.013375233 1.358803774 0.223067386 -0.014554 0.050902 -0.014554 0.050902Park Visitation 0.003036453 0.001645834 1.844932985 0.114592055 -0.000991 0.007064 -0.000991 0.007064
RESIDUAL OUTPUT
Observation Predicted Y Residuals Standard Residuals1 96382.64534 2003.354665 1.3297905092 106745.7125 -1720.712505 -1.1421777683 109763.1702 -1.170247404 -0.0007767894 115491.3149 -1843.314902 -1.2235590165 118987.9739 928.0261251 0.6160069186 126008.8923 -1322.892263 -0.8781119037 125743.8099 2544.190085 1.6887872578 131849.9446 1303.055434 0.8649445759 135531.5435 -635.5434539 -0.421862223
10 136598.7023 -1066.702253 -0.708057618
X Variable 1 Residual Plot
-50000
5000
$0 $20,000,000
$40,000,000
$60,000,000
$80,000,000
$100,000,000
$120,000,000
X Variable 1
Resi
dual
s
X Variable 2 Residual Plot
-5000
0
5000
8,000,000 8,500,000 9,000,000 9,500,000
X Variable 2
Resi
dual
s
X Variable 3 Residual Plot
-5000
0
5000
0 200,000 400,000 600,000 800,000 1,000,000
X Variable 3
Resi
dual
s
X Variable 4 Residual Plot
-5000
0
5000
6,200,000
6,400,000
6,600,000
6,800,000
7,000,000
7,200,000
7,400,000
X Variable 4
Resi
dual
s
X Variable 1 Line Fit Plot
0100,000200,000
$0 $50,000,000
$100,000,000
$150,000,000
X Variable 1
Y
YPredicted Y
X Variable 2 Line Fit Plot
0100,000200,000
8,000,000
8,500,000
9,000,000
9,500,000
X Variable 2
Y
YPredicted Y
X Variable 3 Line Fit Plot
0100,000200,000
0 500,000 1,000,000X Variable 3
Y
YPredicted Y
X Variable 4 Line Fit Plot
0100,000200,000
6,000,000
6,500,000
7,000,000
7,500,000
X Variable 4
Y
YPredicted Y
Source: The SGM Group, Inc.

The SGM Group, Inc. Page 134 5/10/2005
Figure 25: Mammoth Yosemite Airport Model SUMMARY OUTPUT--Mono and Inyo County Employment Forecast Model
Regression StatisticsMultiple R 0.970552558R Square 0.941972267Adjusted R Square 0.802465334Standard Error 333.2967924Observations 11
ANOVAdf SS MS F Significance F
Regression 3 14426293.62 4808764.541 43.28837114 6.90273E-05Residual 8 888694.0145 111086.7518Total 11 15314987.64
Coefficients Standard Error t Stat P-value Lower 95% Upper 95% Lower 95.0% Upper 95.0%Intercept 0 #N/A #N/A #N/A #N/A #N/A #N/A #N/ATOT/1,000 1.328092865 0.123734211 10.73343305 4.99213E-06 1.042761079 1.613424651 1.042761079 1.613424651Yosemite Visitor/1,000 2.432304774 0.124566445 19.52616347 4.91826E-08 2.14505385 2.719555697 2.14505385 2.719555697Ski Visits/1,000 0.832640545 0.899018789 0.926165899 0.381450388 -1.240501841 2.905782932 -1.240501841 2.905782932
RESIDUAL OUTPUT
Observation Predicted Y Residuals Standard Residuals1 16540.98578 -24.98578025 -0.0879049092 16827.88935 120.1106501 0.4225729883 16768.21929 194.7807096 0.6852770054 17969.22333 -288.2233324 -1.0140266065 18260.87692 -548.8769212 -1.9310574096 17917.78003 98.21996914 0.3455572497 18244.74684 219.2531635 0.7713759318 18308.3132 493.6867982 1.7368876579 19187.89247 205.1075342 0.721608813
10 19927.78659 -97.78658581 -0.34403252111 20597.50915 -313.5091458 -1.102987091
X Variable 1 Residual Plot
-1000
0
1000
$0 $2,000 $4,000 $6,000 $8,000 $10,000
X Variable 1
Res
idu
a
X Variable 2 Residual Plot
-1000
0
1000
- 1,000 2,000 3,000 4,000 5,000
X Variable 2
Res
idu
a
X Variable 3 Residual Plot
-1000
0
1000
- 500 1,000 1,500
X Variable 3
Res
idu
a
X Variable 1 Line Fit Plot
-20,00040,000
$0 $5,000 $10,000X Variable 1
Y
YPredicted Y
X Variable 2 Line Fit Plot
-20,00040,000
- 1,000 2,000 3,000 4,000 5,000
X Variable 2
Y
YPredicted Y
X Variable 3 Line Fit Plot
-20,00040,000
- 500 1,000 1,500X Variable 3
Y
YPredicted Y
Source: The SGM Group, Inc.

The SGM Group, Inc. Page 135 5/10/2005
Figure 26: Population and Employment Forecast—Mono and Inyo Counties 2005-2017
-
5,000
10,000
15,000
20,000
25,000
30,000
35,000
40,000
45,000
2000 2001 2002 2003 2004 2005 2006 2007 2008 2009 2010 2011 2012 2013 2014 2015 2016 2017
Population--No Project Population--with ProjectFull and Part-Time Employment--No Project Full and Part-Time Employment--with Project
Existing
Forecast
Source: The SGM Group, Inc.

The SGM Group, Inc. Page 136 5/10/2005
Figure 27: Two-County Employment Impact—Distribution by Economic Sector 2007-2017 Model Output
-
500
1,000
1,500
2,000
2,500
3,000
3,500
2007 2008 2009 2010 2011 2012 2013 2014 2015 2016 2017
Goods Producing Trade, Transportation and Utilities Financial Activities Professional and Business Services Educational and Health Services Arts, Entertainment, and Recreation Accommodation Food Services and Drinking Places Residual-Other Services Federal Government State Government Local Government
Source: The SGM Group, Inc.

The SGM Group, Inc. Page 137 5/10/2005
Figure 28: Housing Characteristics—Mono and Inyo Counties 2000-2004
0
5,000
10,000
15,000
20,000
25,000
2000 2001 2002 2003 2004Year
Unincorporated Mono Mobile HomesUnincorporated Mono 5 PlusUnincorporated Mono 2-4 UnitUnincorporated Mono Single AttachedUnincorporated Mono Single DetachedMammoth Lakes Mobile HomesMammoth Lakes 5 PlusMammoth Lakes 2-4 UnitMammoth Lakes Single AttachedMammoth Lakes Single DetachedUnincorporated Inyo Mobile HomesUnincorporated Inyo 5 PlusUnincorporated Inyo 2-4 UnitUnincorporated Inyo Single AttachedUnincorporated Inyo Single DetachedBishop Mobile HomesBishop 5 PlusBishop 2-4 UnitBishop Single AttachedBishop Single Detached
Source: The SGM Group, Inc.; California Department of Finance, Demographic Research Division

The SGM Group, Inc. Page 138 5/10/2005
Figure 29: Economic Leakage—Seven Counties versus Mono and Inyo Counties Economic Value
$0
$10,000,000
$20,000,000
$30,000,000
$40,000,000
$50,000,000
$60,000,000
$70,000,000
$80,000,000
$90,000,000
Total Output Value Added Employee Compensation
Labor Income Indirect BusinessTaxes
Total Taxes
Total Impact Leakage
Source: IMPLAN and The SGM Group, Inc.

The SGM Group, Inc. Page R-i 5/10/2005
References 1. Aspen Chamber Resort Association, Historical Monthly Occupancy 1985-7/04, e-mail
transmittal July 2, 2004.
2. Aspen Consolidated Sanitation District Wastewater Treatment Plant, monthly data, 01/92 – 05/04, e-mail transmittal August 10, 2004.
3. Aspen/Pitkin County Airport [Online]. Master Plan – Draft Report. November 2003, page A.1-A.35. Retrieved July 2004 from www.aspenairport.com.
4. California Employment Development Department Labor Market Information for Mono and Inyo Counties.
5. City of Bishop, City of Bishop, New Building Construction, fax transmittal, August 2, 2004.
6. City of Bishop, Final Budget Fiscal Year 2003-2004.
7. Colorado Ski County USA’s, Colorado Skier Data, http://www.media-coloradoski.com
8. County of Inyo, Final County Budget, Fiscal Year ending June 30, 2004.
9. County of Mono Final Budget 2004-2005 (approved 2003-2004) and special report prepared by Mono County Budget Office.
10. FAA. 2004. Airport Master Records for the Aspen/Pitkin County Sardy Field, Jackson Hole, Eastern Sierra Regional and Mammoth Lakes-Yosemite Airports. September 30, 2004.
11. H&K Consulting, Superior Court of California, County of Mono, Facilities Master Plan, May 6, 2003
12. Intrawest Resort Development Group, Development Calendar Summary for Mammoth Lakes, 1999-2014, September 2004.
13. Inyo County Assessor’s, New Construction, e-mail transmittal, August 23, 2004.
14. Inyo County Assessor’s Office, Development by Type of Use, e-mail transmittal, September 2, 2004.
15. Inyo County General Plan, December 2001
16. Jackson Hole Airport, Monthly Enplanements, 1964-2003 and Jackson Hole Airport Chronology, e-mail transmittal, June 21, 2004.
17. Jackson Hole Historical Society and Museum. [Online] “A Brief History of Jackson’s Hole.” Retrieved October 26, 2004 from www.tetonwyo.org/histoc/nav/100281.shtm
18. Jackson Hole, Wyoming Chamber of Commerce. Lodging Occupancy Reports faxed to Hayes Planning Associates on 12/8/04.
19. Mammoth Lakes Visitors Bureau. Mammoth Lakes General Information Binder, 5/19/04.
20. Mammoth Mountain, Mammoth Mountain Ski Area, Historical Paid Skier Days, 1960-2004.
21. MIG, Inc. IMPLAN Professional Version 2.0, User’s Guide; Analysis Guide; Data Guide; 2nd Edition, June 2000.

The SGM Group, Inc. Page R-ii 5/10/2005
22. Strategic Marketing Group, Tourism Assessment, Coalition of County Chambers of Commerce of Inyo County, n.d.
23. Telluride & Mountain Village Convention & Visitor’s Bureau, Historical Occupancy Statistics 1997-6/04, e-mail transmittal, August 17, 2004.
24. Telluride Regional Airport, 14-year Statistics, received August 2004.
25. Town of Mammoth Lakes, CA. Fiscal Impact Model, October 2004.
26. Town of Mammoth Lakes, CA. The Town of Mammoth Lakes Draft General Plan, July 2004. Retrieved July 2004 from www.townofmammothlakes.com
27. Vail/Eagle County Airport official website, http://www.eaglecounty.us/.
28. Yosemite National Park, Yosemite National Park Visitor Use Statistics, 1985-2004, e-mail transmittal August 25, 2004.

The SGM Group, Inc. Page R-iii 5/10/2005
Endnotes 1 Ricondo & Associates, Inc., “Updated Forecast of Aviation Demand—Final Report, Mammoth Yosemite Airport,” Prepared for The Town of Mammoth Lakes, May 2004, Table 28, p. 36. 2 Mammoth Lakes Fact Sheet, Mammoth Lakes Visitors Bureau, updated 5/18/04. 3 Ibid. 4 Mammoth Lakes Winter Visitor Survey, Final Report, Prepared by the Town of Mammoth Lakes, June 2002. 5 California Department of Finance, Demographic Research Unit, and Table2: E-5. City/County Population and Housing Estimates, 1/1/2004. In this analysis, California data is used in lieu of comparable data from the Town of Mammoth Lakes for population and housing because the state maintains an historic record that facilitates trend analysis and housing type distribution evaluation. 6 Town of Mammoth Lakes Land Use Element Draft, 7/13/04. 7 California Department of Finance, Demographic Research Unit, Op. Cit. 8 Mammoth Lakes Winter 2002 Visitor Survey Report, Record of Interviews Intrawest Corporation and Mammoth Lakes Visitors Bureau. 9 Town of Mammoth Lakes, Op. cit. 10 Town of Mammoth Lakes Draft General Plan Update, Summer 2004 11 Mammoth Lakes region, Record of Contact personal interviews with Coldwell Banker, local real estate agents and local developers, 5/20-5/25/04. 12 “The World’s Finest Resorts” brochure and interview with Mammoth Realty Group, 5/21/04 13 Mammoth Realty Group and Coldwell Banker personal interviews, 5/21/04. 14 Realtor and local developer interviews 5/20-5/25/04. 15 Dempsey Construction, Town of Mammoth Lakes Community Development Department, and Town of Mammoth Lakes Land Use Element Draft, 7/13/04. 16 Interview with Intrawest Corporation, 5/25/04 17 Interviews with Dempsey Construction, Intrawest Corporation, Mammoth Realty Group, and Coldwell Banker 5/20-5/25/04. 18 Mono County Land Use Element, http://www.monocounty.ca.gov/nd, May 2004. 19 Mono County GIS. 20 Mono County Land Use Element, Op. Cit. 21 U.S. Census 1980 and 1990; U.S. Census 2000, Summary File 1, Table P1: Total Population and Mono County Housing Element, Adopted 2004. 22 California Department of Finance, Demographic Research Unit, City/County Population and Housing Estimates, 1/1/04. 23 Ibid. 24 Superior Court of California, County of Mono, Facilities Master Plan, May 6, 2003. 25 Summary of interviews with local real estate agents and developers in Mammoth Lakes, 5/20/04-5/25/04. 26 Ibid. 27 Ibid. 28 Ibid. 29 Intrawest Corporation Interview, 5/25/04. 30 Mono County Community Development Department personal interviews, 5/24/04 and telephone interviews with Mono County project planners, 6/04 and 7/04. 31Labor Market Information Division, Employment Development Department, State of California, June 2004. 32 Ibid. 33 Ibid. 34 Ibid. 35 Mammoth Lakes Visitors Bureau, Mammoth Lakes Fact Sheet, updated 5/18/04.

The SGM Group, Inc. Page R-iv 5/10/2005
36 Ibid. 37 Mammoth Lakes Visitors Bureau, Mammoth lakes General Information, May 17, 2004 38 Summary of interviews with local developers and Mammoth Lakes Visitors Bureau, 5/04. 39 Mammoth Lakes Summer Visitor Survey Report, 2002 40 Mammoth Lakes Winter 2002 Visitor Survey Report, Mammoth Lakes Visitors Bureau. 41 Summary of interviews with Intrawest Corporation, local real estate agents and developers in Mammoth Lakes 5/20/04-5/25/04. Build-out schedules are dependent on market conditions and sales pace. 42 Mammoth Mountain Demographics, Winter 2000-2001. 43 Mammoth Mountain, personal interview, 5/20/04. 44 Summary of interviews with local real estate agents and developers in Mammoth Lakes, 5/20/04-5/25/04. 45 Mammoth Mountain, telephone interview, 10/04 46 State of California, Department of Finance, E-5 City/County Population and Housing Estimates, 2004. 47 City of Bishop, City Administrator, Interview, 5/21/04. 48 Ibid. 49 Tourism Assessment, Coalition of County Chambers of Commerce of Inyo County, U/D. 50 City Administrator, City of Bishop, 5/21/04. 51 Interview with the Bishop Area Chamber of Commerce and Visitors Bureau, 5/21/04. 52 Ibid. 53 State of California, Employment Development Department Labor Market Information Division. 54 Interview with the Bishop Area Chamber of Commerce and Visitors Bureau, 5/21/04. 55 ADE Data from California Department of Finance, City/County Population and Housing Estimates, Inyo County General Plan, December 2001. 56 Inyo County General Plan, December 2001. 57 Ibid. 58 U.S. Department of Commerce, Bureau of Census, 1980. 59 State of California, Department of Finance, E-5 City/County Population and Housing Estimates, 2004. 60 Inyo County General Plan, December 2001. 61 Interview with Inyo County Planning Director, 5/21/04. 62 State of California, Department of Finance, Op. cit. 63 Inyo County General Plan, December 2001 and interview with Inyo County Planning Director, 5/21/04. 64 Ibid. 65 Inyo County Treasurer Tax Collector, 5/21/04 66 Ibid. 67 Tourism Assessment, Coalition of County Chambers of Commerce of Inyo County and CALTRANS, District 9, System Planning Branch, US 395 Origin and Destination Study, 2000. 68 Ibid. 69 Definitions of Input-Output modeling components are included at the end of this technical memorandum. That discussion includes a description of the Input-Output models as well as definitions of Value Added, Total Output, and other components of the evaluation. 70 Data used to determine total output for the county is provided through the Input-Output models prepared by IMPLAN, with the latest available transaction coefficient data available only through 2001. 71 Population and employment data through 2002 are provided by BEA, US Department of Commerce; forecasts through 2004 are prepared by The SGM Group, Inc. 72 2002 NSOS (National Skier/Boarder Opinion Survey) Summer Report and Findings, Mammoth Lakes Visitors Bureau. 73 Series of telephone interviews Flathead County planner and Flathead County Assessor, State of Montana, Montana Census and Economic Information Center, 6/04 and 7/04.
The SGM Group, Inc. Page R-v 5/10/2005
74 Big Mountain Ski Resort, telephone interview, 7/04 75 One important characteristic of the Mammoth Lakes economy in particular and of ski resort economies in general, is that retail expenditures are predominantly generated by exogenous rather than endogenous forces. Sales and use taxes result primarily from visitor activity—from those coming into the area not residing in the area. Household-generated retail expenditures represent only a small contribution by comparison. The total amount of retail expenditures is a function of the number of visitors, the type of visitors, and often by their length of stay. The longer a party stays in the resort, the greater the potential expenditure on retail and shopping activities. Visitors include those who come to ski, and some who come to participate in alternative activities. Where the shift is more to the alternatives, it is possible that retail expenditures go up. When visitors come from further distances and come by air rather than drive, they often represent a wealthier clientele, and that clientele can spend more.
In a market-driven economy as a resort environment is, the greater the retail expenditure potential, the greater the demand for retail services and related employment. Therefore, the number of employees in the retail and related sectors is a function of exogenous pressures represented by visitors to the resort. Using sales and use tax values adds a dimension to the analysis by incorporating change in expenditure patterns attributed to access, length of stay, and character. As a result, it is legitimate to use sales and use taxes as an exogenous variable in the regression models. Nothing in this process is without some correlation, and there is indeed some autocorrelation between sales and use taxes and number of visitors, but the added dimension of using this variable does seem to contribute positively to the overall employment modeling effort.
Population, however, is not nearly as independent of employment, connected by a linear ratio represented by the labor-force participation rate. To use population, which represents primarily permanent residents, to predict total employment, only relates to a small proportion of the overall employment in a resort community. In fact, using resident population as a primary variable to predict employment in a resort economy misses the point. Employment is generated by demand for visitor-related services: primarily visitor activities, visitor accommodations, and visitor-based retail expenditures. Only a relatively small component of total employment is a result of household expenditures by permanent residents. Employment in the analysis often exceeds population, as indicated, because of commuting patterns from outside the counties used in the analysis, and as a result of part-time jobs. Employment is measured at place of work; population is measured at place of residence. People employed in the community often live outside the community. It is also possible that individuals have more than one job and that employees come to the resort area from counties not included in the analysis. 76 The case-study evaluations examine historic experience as a basis for deriving predictive models linking employment to airport accessibility, measured as a function of annual enplanements. It is important to recognize, however, that weekly variations in occupancy rates as well as seasonal variations throughout the year are characteristic of resort economies. These characteristic variations exist even with active airport operations, operations and levels of activity that change with demand. What cannot be demonstrated empirically is how much impact airport operations have on seasonal variations for a specific resort community. It is reasonable to assume that increased accessibility contributes to an improvement in occupancy rate variation during the year—the effect, however, cannot be measured. 77 Affordable Housing in Mountain resort Towns: Policy Recommendations for June Lake, Mono County, CA, spring, 2004, UC Irvine. 78 The official Telluride website. 79 Ibid. 80 Ibid. 81 Ibid. 82 E-mail correspondence with Richard Nuttall, Telluride Regional Airport Manager, March 23, 2005. 83 5010Web: Airport Summary and Activity Data, G.C.R. & Associates, Inc., http://www.gcr1.com/5010WEB/, December 4, 2004. 84 Telephone interview with Telluride Regional Airport Manager, 7/04 85 Richard Nuttall, op. cit. 86 Telephone interviews with Great Lakes Airlines, America West and the official Telluride website. 87 Series of telephone conversations with the manager of the Telluride Visitor’s Information Center, 7/04-11/04. 88 Ibid. 89 Ibid. 90 Telluride Visitor’s Information Center 91 US Department of Commerce, Bureau of Economic Analysis, Regional Economic Information System, June 2004. 92 Bureau of Economic Analysis, US Department of Commerce: http://www.bea.gov/bea/regional/reis/ 93 Colorado County General Revenues, Colorado Department of Local Affairs, http://dola.colorado.gov/cedis/county/cty2.cfm?choice=1 94 Colorado Ski Country USA's http://www.media-coloradoski.com/ 95 FAA/APO Terminal Airport Forecasts (TAF) System, APO WinTAF Version 5.0 96 E-Mail data transmission, Richard Nuttall, Telluride Airport Manager, June 17, 2004, [email protected]

The SGM Group, Inc. Page R-vi 5/10/2005
97 Vail Resorts Development Company 98 Ibid. 99 Ibid. 100 Ibid. 101 Telephone interviews with the Town of Vail and Eagle County, July 2004 102 Telephone Interview Town of Vail Community Development Department, 7/13/04. 103 “Ski Magazine,” November 29, 2000. 104 Final Supplement to Subsequent EIR – Appendix H- Historical Forecast of Aviation Demand, Ricondo & Associates, March 2002. 105 5010Web: Airport Summary and Activity Data, Op. Cit. 106 Telephone Interview with EGE Airport Manager, 6/18/04. 107 Vail/Eagle County Airport official web site 108Telephone Interview with EGE Airport Manager, 6/18/04. 109 Ibid. 110 Town of Vail official website. 111 Aspen Pitkin County Airport Statistics, Summer 2004 and telephone interview with Airport Manager, 8/10/04 112 Aspen Pitkin County Airport Statistics, Summer 2004 113 Aspen-Pitkin County Airport Draft Master Plan, page B-13, HPA Telephone interview with Steve Howard, Aspen/Pitkin County Airport. 114 Aspen/ Pitkin County Airport, Master Plan Draft Report, November 2003 115 Ibid. 116 Ibid. 117 Aspen/Pitkin County Airport, 18-year historical perspective of winter enplanements vs. total seats, 1985/86-2003/04. 118 Ibid. 119 Telephone interview with Aspen/Pitkin County Airport, August, 2004 120 Aspen/ Pitkin County Airport, Master Plan Draft Report, November 2003 121 Ibid. 122 Telephone interview with Aspen/Pitkin County Airport, August, 2004 123 Ricondo & Associates, “Updated Forecasts of Aviation Demand,” May 2004. Aspen resort actually encompasses only four of the five ski areas listed, excluding Sunlight. Since the enplanements forecasts developed in the Ricondo report also included Sunlight as being served by the Aspen airport, all five resorts have been included in the case study. 124 Telephone Interview with the Aspen Music Festival, August, 2004 125 BEA, US Department of Commerce, June 2004 (2002 is the latest year reported). 126 Telephone interview with the Aspen Consolidated Sanitation District, 8/04 127 Telephone interview with the Aspen Chamber Association and Aspen Chamber Resort Historical Monthly Occupancy, 1995-7/04. 128 Telephone interviews with the Aspen Chamber Resort Association, Aspen Consolidated Sanitation District, Stay Aspen/ Snowmass, Town of Aspen and the Northwest Council of Governments, Summer, 2004. 129 Telephone interviews with the Aspen Chamber Resort Association, Aspen Consolidated Sanitation District, Stay Aspen/ Snowmass, Town of Aspen and the Northwest Council of Governments, Summer, 2004. 130 Telephone Interview, Town of Aspen, 6/24/04 131 Summary of telephone interviews with the Aspen Chamber Resort Association, Aspen Consolidated Sanitation District, Stay Aspen/ Snowmass, Town of Aspen and the Northwest Council of Governments, Summer 2004. 132 Including Sunlight in the analysis does not alter the resulting model significantly. The model was compiled for both the four- and five-resort ski statistics, but maintained the five locations in order to be consistent with the Ricondo study.

The SGM Group, Inc. Page R-vii 5/10/2005
133 BEA, Colorado County General Revenues, Colorado Department of Local Affairs, http://dola.colorado.gov/cedis/county/cty2.cfm?choice=1, Colorado Ski Country USA’s http://www.media-coloradoski.com/, and FAA/APO Terminal Airport Forecasts (TAF) System, APO WinTAF Version 5.0. 134 Telephone interviews, Jackson Hole Chamber of Commerce, Summer 2004 135 Grand Teton Park & Jackson Hole Visitor’s Guide, 2004 136 Telephone Interview, Grand Targhee Resort, 6/04 137 Telephone interview Jackson Hole Camber of Commerce, 6/04. 138 Additional occupancy data for specific dates can been found in Technical Memorandum: “Mammoth Yosemite Airport DEIS Seasonal Market Characteristics,” January 2005, prepared by Hayes Planning Associates for URS, Town of Mammoth Lakes and FAA. 139 Telephone interview with Jackson Hole airport officials, 6/16/04. 140 The official website for Jackson Hole Airport, Winter 2004. 141 Summary of a series of telephone interviews with the Rocky Mountain Lodging Group, Jackson Hole Chamber of Commerce, Jackson Hole Ski area and Jackson Hole Airport staff, Summer, 2004. 142 Jackson Hole Airport monthly enplanements, 1964-2003, 143 Jackson Hole Airport monthly enplanements, 2003 and interview with Jackson Hole Airport staff, 6/04. 144 Telephone interview with Jackson hole Airport, 6/21/04 145 Ibid. 146 Jackson Hole Chamber of Commerce. 147 U.S. Census Bureau (2000) 148 Teton County 149 State of Wyoming: http://revenue.state.wy.us/PortalVBVS/DesktopDefault.aspx?tabindex=3&tabid=10 150 National Park Service, Public Use Statistics Office, http://www2.nature.nps.gov/stats/ 151 Jackson Hole Airport Manager, provided via e-mail, 7/16/04. The enplanement numbers provided by the airport manager for December 2001 were apparently not available at the time of the analysis; however, the total provided for the year was comparable to that available from FAA. The analysis was not significantly affected by the single month’s data. 152 “Updated Forecast of Aviation Demand, Final Report, Mammoth Yosemite Airport,” Ricondo & Associates, Inc., May 2004. 153 IMPLAN Professional, Version 2.0, Social Accounting & Impact Analysis Software, 2nd Edition—June 2000, p. 14-15. 154 Elements of the Social Accounting Mix, Technical Report TR-98002, MIG, n.d., p. 1ff. 155 Ricondo & Associates, Op. Cit. 156 The SGM Group, Inc. 157 Short-term economic impacts linked to construction are discussed in a separate section of the memorandum. 158 IMPLAN prepares tax outputs based on the latest regional coefficients, which for this model was 2001. Only Indirect Business Taxes can be converted directly to 2004 dollars. Using that example, the inflation rate from 2001 to 2004 dollars is approximately 108.89 percent, resulting in a 2004 value for total tax benefit of $46.6 million. 159 California Department of Finance, Research Division, http://www.dof.ca.gov/HTML/DEMOGRAP/repndat.htm#estimates 160 Inyo County Assessor’s Office, September 2004 (includes City of Bishop). 161 Town of Mammoth Lakes, Updated Comprehensive Plan, September 2004. 162 Town of Mammoth Lakes, Fiscal Impact Model, FIR Version 15, December 2004. 163 Airport Capital Improvement Program (ACIP), Mammoth Yosemite Airport, Mammoth Lakes, California, April 5, 2004. 164 IMPLAN Professional, Version 2.0.1024, June 2004, Minnesota IMPLAN Group, Inc., Minnesota. www.implan.com 165 Telephone interviews and subsequent e-mail with local construction firms, 10/6/04 166 MIG, Inc., IMPLAN Professional, Version 2.0, User’s Guide, June, 2000, pp. 125-126, 253.

W:\12006395_Mammoth\EIS\Appendices\Working Files\!! Appendix Intros.doc\11/2/2007
Appendix E-4
Traffic Information This appendix contains traffic information for U.S. 395 within Mono and Inyo counties. Table Title
E-4.1 U.S. 395 Traffic Conditions E-4.2 Level of Service Description

W:\12006395_Mammoth\EIS\Appendices\Working Files\Appendix E-4 Tables.doc\11/2/2007
TABLE E-4.1 U.S. 395 TRAFFIC CONDITIONS
1997
County Segment
(Post Mile) LOS AADT Percent Trucks/
Percent Bus Mono 0 - 7.5 A 5,200 6 / 6 Mono 7.5 - 25.8 A 5,500 6 / 6 Mono 25.8 - 44.2 A 4,100 12 / 6 Mono 44.2 - 51.3 A 4,200 13 / 6 Inyo 118.8 - 129.5 A 6,300 4 / 8 Inyo 115.2 - 118.8 E 15,700 6 / 8 Inyo 100.6 - 115.2 A 6,800 10 / 8
Source: CALTRANS, 2000.
1 See Table E-3.2 for level of service (LOS) information.
TABLE E-4.2 LEVEL OF SERVICE DESCRIPTION
Level of Service Description
Volume to Capacity
A Excellent operation. All approaches to the intersection appear quite open, turning movements are easily made, and nearly all drivers find freedom of operation. 0-0.60
B Very good operation. Many drivers begin to feel somewhat restricted within platoons
of vehicles. This represents stable flow. An approach to an intersection may occasionally be fully utilized and traffic queues start to form.
0.61-0.70
C Good operation. Occasionally, drivers may have to wait more than 60 seconds, and back-ups may develop behind turning vehicles. Most drivers feel somewhat restricted. 0.71-0.80
D Fair operation. Cars are sometimes required to wait more than 60 seconds during
short peaks. There are no long-standing traffic queues. This level is typically associated with design practice for peak periods.
0.81-0.90
E Poor operation. Some long-standing vehicular queues develop on critical approaches to intersections. Delays may be up to several minutes. 0.81-0.90
F
Forced flow. Represents jammed conditions. Backups from locations downstream or on the cross street may restrict or prevent movement of vehicles out of the intersection approach lanes; therefore, volumes carried are not predictable. Potential for stop and
go type traffic flow.
0.91-1.00
Source: Highway Capacity Manual, Special Report 209, Transportation Research Board, Washington, D.C., 1985 Interim Materials on Highway Capacity, NCHRP Circular 212, 1982.
Related Documents