Feasibility Study for a Federal Inspection Service Facility at Long Beach Airport PLEASE NOTE: The information, analysis, assessments and opinions contained in this document are intended for general evaluation purposes only. This document is intended for use only by its specified client and is NOT intended for use, reliance or in making financial/investment decisions by outside parties. W9Y17400-1 Appendix E. LGB Airport Scope and Capability Analysis

Welcome message from author
This document is posted to help you gain knowledge. Please leave a comment to let me know what you think about it! Share it to your friends and learn new things together.
Transcript

Feasibility Study for a Federal Inspection Service Facility at Long Beach Airport
PLEASE NOTE: The information, analysis, assessments and opinions contained in this document are intended for general evaluation
purposes only. This document is intended for use only by its specified client and is NOT intended for use, reliance or in making
financial/investment decisions by outside parties.
W9Y17400-1
Appendix E. LGB Airport Scope and Capability Analysis

THIS PAGE INTENTIONALLY LEFT BLANK
Feasibility Study for a Federal Inspection Service
Facility at Long Beach Airport
LGB Airport Scope and Capability
W9Y17400-1
September 30, 2016
LGB Airpor t Scope and C apability City of Long Beach

LGB Airport Scope and Capability
2
Feasibility Study for a Federal Inspection Service Facility at Long Beach Airport
Project No: W9Y17400
Document Title: LGB Airport Scope and Capability
Document No: W9Y17400-1
Revision: 0
Date: September 30, 2016
Project Manager: Dave Tomber
Author: Tayvin Saks
File Name: 20160930.E - APPENDIX E - LGB Scope and Capability.docx
Jacobs Engineering Group Inc.
1500 Hughes Way, Suite 400
Long Beach, California 90810
United States
T +1.310.847.2500
F +1.310.847.2599
www.jacobs.com
Document history and status
Revision Date Description By Review Approved

LGB Airport Scope and Capability
3
Contents
1. LGB Airfield Infrastructure Review ......................................................................................................... 4
2. Airside Scope and Capability .................................................................................................................. 6
3. Critical Airside Components ................................................................................................................. 11
4. Recommendation for Airside Infrastructure Improvements .............................................................. 12
5. LGB Landside Infrastructure Review .................................................................................................... 13
6. Traffic Flow Model .................................................................................................................................. 15
7. Critical Landside Components .............................................................................................................. 18
8. Recommendation for Landside Infrastructure Improvement ............................................................. 19
LGB Airport Scope and Capability
4
1. LGB Airfield Infrastructure Review
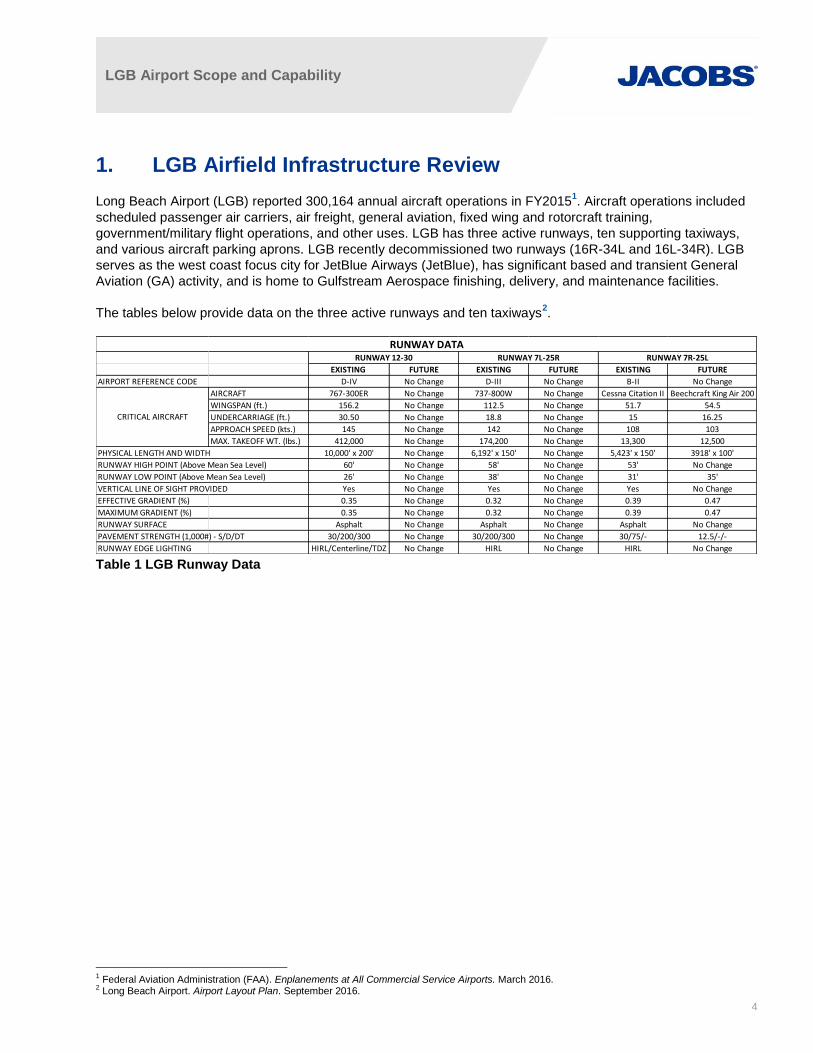
Long Beach Airport (LGB) reported 300,164 annual aircraft operations in FY20151. Aircraft operations included
scheduled passenger air carriers, air freight, general aviation, fixed wing and rotorcraft training,
government/military flight operations, and other uses. LGB has three active runways, ten supporting taxiways,
and various aircraft parking aprons. LGB recently decommissioned two runways (16R-34L and 16L-34R). LGB
serves as the west coast focus city for JetBlue Airways (JetBlue), has significant based and transient General
Aviation (GA) activity, and is home to Gulfstream Aerospace finishing, delivery, and maintenance facilities.
The tables below provide data on the three active runways and ten taxiways2.
Table 1 LGB Runway Data
1 Federal Aviation Administration (FAA). Enplanements at All Commercial Service Airports. March 2016. 2 Long Beach Airport. Airport Layout Plan. September 2016.
EXISTING FUTURE EXISTING FUTURE EXISTING FUTURE
AIRPORT REFERENCE CODE D-IV No Change D-III No Change B-II No Change
AIRCRAFT 767-300ER No Change 737-800W No Change Cessna Citation II Beechcraft King Air 200
WINGSPAN (ft.) 156.2 No Change 112.5 No Change 51.7 54.5
UNDERCARRIAGE (ft.) 30.50 No Change 18.8 No Change 15 16.25
APPROACH SPEED (kts.) 145 No Change 142 No Change 108 103
MAX. TAKEOFF WT. (lbs.) 412,000 No Change 174,200 No Change 13,300 12,500
PHYSICAL LENGTH AND WIDTH 10,000' x 200' No Change 6,192' x 150' No Change 5,423' x 150' 3918' x 100'
RUNWAY HIGH POINT (Above Mean Sea Level) 60' No Change 58' No Change 53' No Change
RUNWAY LOW POINT (Above Mean Sea Level) 26' No Change 38' No Change 31' 35'
VERTICAL LINE OF SIGHT PROVIDED Yes No Change Yes No Change Yes No Change
EFFECTIVE GRADIENT (%) 0.35 No Change 0.32 No Change 0.39 0.47
MAXIMUM GRADIENT (%) 0.35 No Change 0.32 No Change 0.39 0.47
RUNWAY SURFACE Asphalt No Change Asphalt No Change Asphalt No Change
PAVEMENT STRENGTH (1,000#) - S/D/DT 30/200/300 No Change 30/200/300 No Change 30/75/- 12.5/-/-
RUNWAY EDGE LIGHTING HIRL/Centerline/TDZ No Change HIRL No Change HIRL No Change
CRITICAL AIRCRAFT
RUNWAY 12-30 RUNWAY 7L-25R RUNWAY 7R-25L
RUNWAY DATA

LGB Airport Scope and Capability
5
Table 2 LGB Runway End Data
Table 3 LGB Taxiway Data
Existing 12 30 7L 25R 7R 25L
Future No Change No Change 8L 26R 8R 26L
Existing 33° 49' 34.331" N 33° 48' 24.720" N 33° 49' 21.937" N 33° 49' 21.716" N 33° 48' 49.784" N 33° 48' 49.827" N
Future No Change No Change No Change No Change 33° 48' 50.031" N 33° 48' 50.063" N
Existing 118° 09' 41.525" W 118° 08' 17.317" W 118° 09' 48.688" W 118° 08' 35.294" W 118° 09' 40.688" W 118° 08' 36.414" W
Future No Change No Change No Change No Change No Change 118° 08' 54.254" W
Existing 60.4' 25.7' 58.1' 38.1' 52.8' 31.3'
Future No Change No Change No Change No Change No Change 34.6'
Existing Precision Precision Non-Precision Non-Precision Non-Precision Non-Precision
Future No Change No Change No Change No Change Visual Visual
Existing 1,350' 2,000' 1,305' 532' None 1,505'
Future No Change No Change No Change No Change None None
Existing 52.9' 38.4' 52.8' 47.6' 58.1' 45.8'
Future No Change No Change No Change No Change No Change No Change
ExistingPAPI, REIL, GPS
MALSR, PAPI, ILS,
GPS, VORNone PAPI, REIL, GPS None PAPI, REIL
Future No Change No Change None No Change None No Change
Existing 1 1/8 mile 1/2 mile Visual 1 mile Visual Visual
Future No Change No Change No Change No Change No Change No Change
Existing 34:1 50:1/40:1 20:1 34:1 20:1 20:1
Future No Change No Change No Change 34:01:00 No Change No Change
Existing
Future
Existing 1000' 414' 219' 240' 300' 300'
Future No Change No Change No Change No Change No Change No Change
Existing
Future
Existing 200' 200' 163' 200' 200' 200'
Future No Change No Change No Change No Change No Change No Change
Existing
Future
Existing 414' 1000' 170' 340' 300' 300'
Future No Change No Change No Change No Change No Change No Change
Existing
Future 125' 200'
RUNWAY END DATA
No Change 250'
800' 500'
No Change No Change
500' 150'
No Change No Change
No Change
244'
400' 400'
RUNWAY
END
COORDINATES
LATITUDE
LONGITUDE
RUNWAY END ELEVATIONS
(Above Mean Sea Level)
RUNWAY MARKINGS
DISPLACED THRESHOLD
RUNWAY TOUCH DOWN
ZONE ELEVATION (MSL)
NAGIVATION AIDS
APPROACH VISIBILITY
(Minimums)
APPROACH SLOPE
239' 148'
APPROACH END OF RUNWAY
DISTANCE FROM RUNWAY
CENTERLINE TO HOLD BARS
500'RUNWAY SAFETY AREA (Width)
RUNWAY SAFETY AREA
(Length Beyond Runway End)
OBSTACLE FREE ZONE (Width)
OBSTACLE FREE ZONE
(Length Beyond Runway End)
OBJECT FREE AREA (Width)
OBJECT FREE AREA
(Length Beyond Runway End)
No Change
No Change
400'
No Change
800'
EXISTING FUTURE EXISTING FUTURE EXISTING FUTURE EXISTING FUTURE EXISTING FUTURE EXISTING FUTURE EXISTING FUTURE
A IV No Change 5 No Change 75' No Change Asphalt No Change N/A No Change 171' No Change 259' No Change
B IV No Change 5 No Change 65' No Change Asphalt No Change 460' No Change 79' No Change 131' No Change
C IV No Change 5 No Change 75' No Change PCC No Change 300' No Change 171' No Change 259' No Change
D IV No Change 5 No Change 75' No Change Asphalt No Change 350' No Change 171' No Change 259' No Change
E II N/A 3 N/A 50' N/A Asphalt No Change N/A N/A 49' N/A 90' N/A
F IV II / III / IV 5 2 / 3 / 5 100' 35' / 50' / 75' Asphalt No Change 275' No Change 79' No Change 131' No Change
G IV No Change 5 No Change 75' No Change Asphalt No Change N/A No Change 171' No Change 259' No Change
J III No Change 3 No Change 75' No Change Asphalt No Change 400' No Change 49' No Change 100' No Change
K IV No Change 5 No Change 75' No Change PCC No Change 400' 400' <171' 171' <259' 259'
L IV No Change 5 No Change 75' No Change Asphalt No Change 400' No Change 171' No Change 259' No Change
TAXIWAY DATA
TAXIWAYAIRPLANE DESIGN TAXIWAY DESIGN WIDTH SURFACE TYPE RWY CL TO TWY CL TAXIWAY SAFETY TAXIWAY OBJECT

LGB Airport Scope and Capability
6
2. Airside Scope and Capability
Currently, LGB is served by a combination of narrow-body aircraft for commercial flights. As of July 2016, the
fleet mix included those in the Airbus A320 family, Boeing 737 family, and the Bombardier CRJ700 and CRJ900.
UPS flies the Boeing 767-300F and FedEx flies the Airbus A300F for air cargo operations. From the Market
Analysis3, JetBlue will continue to utilize its A320 fleet to operate potential international flights. All gates and
aircraft parking positions at the LGB terminal can accommodate and service the entire A320 family, including the
Airbus A321-200, which is the largest variant in the series. All terminal gates are able to accommodate up to
Airplane Design Group III, which includes Boeing 737 and Airbus A320. Aircraft parking positions 1, 2, and 10
are wider and can also accommodate Boeing 757-300, which is classified as Airplane Design Group IV.
Manufacturer Aircraft AAC4 ADG
5 TDG
6
Airbus A300F C IV 5
Airbus A319 C III 3
Airbus A320 C III 3
Airbus A321 C III 3
Boeing 737-700W C III 3
Boeing 737-800W D III 3
Boeing 737-900W D III 3
Boeing 757-300W D IV 4
Boeing 767-300F D IV 5
Bombardier CRJ700 C II 3
Bombardier CRJ900 C III 3
Table 4 LGB Aircraft Fleet Mix
LGB has the infrastructure to support the next generation of aircraft. Over the last 50 years, the aviation industry
has cut fuel consumption, CO2 emissions by more than 80%, NOx emissions by 90%, and noise by 75%. The
technology pipeline of products in development mirrors these improvement trends. The next generation
A320neo, the aircraft that will most affect LGB in the future, will reduce emissions and noise while meeting
market demands. The A320neo family includes sharklet wingtip devices and engine improvements that will
improve its noise footprint by 15 decibels.
There are also many types of aircraft flown by the GA community that are capable of flying to international
markets. These include, but are not limited to, the family of Gulfstream Aerospace jets, Cessna Citation jets,
and Boeing Business jets.
3 LaCosta Consulting Group. Market Analysis For Long Beach Airport. August 2016. 4 Aircraft Approach Category (AAC). A grouping of aircraft based on a reference landing speed (VREF), if specified, or if VREF is not specified, 1.3 times
stall speed (VSO) at the maximum certificated landing weight. VREF, VSO, and the maximum certificated landing weight are those values as established for the aircraft by the certification authority of the country of registry.
5 Airplane Design Group (ADG). A classification of aircraft based on wingspan and tail height. 6 Taxiway Design Group (TDG). A classification of airplanes based on outer to outer Main Gear Width (MGW) and Cockpit to Main Gear distance
(CMG).
LGB Airport Scope and Capability
7
Inside the terminal, the holdroom level of service was evaluated using International Air Transport Association (IATA) Airport Development Reference Manual, 10
th Edition. The key factors used in the IATA approach are:
Holdroom area.
Number of aircraft seats.
Number of passengers based on an assumed load factor.
Ratio of seated to standing passengers.
Loss of available seats due to passengers putting personal belongings on an adjacent seat.
Potential to use seating in an adjacent holdroom.
Space per seated passenger.
Space per standing passenger. The holdroom level of service guideline developed by IATA is based on the available square feet per passenger. IATA defines three levels of service for holdroom size:
Over Design (>15.6 square feet per passenger).
Optimum (12.9 to 15.6 square feet per passenger).
Suboptimum (<12.9 square feet per passenger). Due to ongoing airline and aircraft scheduling changes, the IATA level of service approach for designing new airport terminals is based on the largest aircraft that can fit on a gate. The results of this analysis are show in Table 5 below.
Table 5 Holdroom Level of Service on Existing Gate Striping
A useful analysis for evaluating existing terminal holdrooms is to adapt the IATA approach based on the
scheduled aircraft using each gate. The results of this analysis for the existing flight schedule are shown in
Table 6 below. Based on IATA standards, holdroom size is “Optimum” or better in all cases. The results
indicate that the holdrooms have the capacity and flexibility to accommodate typical airline operational changes
to meet market demand, such as additional flights and larger aircraft.

LGB Airport Scope and Capability
8
Table 6 Holdroom Level of Service on Existing Flight Schedule The holdrooms were also analyzed with the potential additional of international flights for both a South and North FIS Options in in Tables 7 and 8 below. The results indicate that based on IATA standards, the holdroom size is “Optimum” or better in all cases.
Table 7 Holdroom Level of Service Based on Future Flight Schedule for South FIS Facility Option
Table 8 Holdroom Level of Service on Future Flight Schedule for North FIS Facility Option

LGB Airport Scope and Capability
9
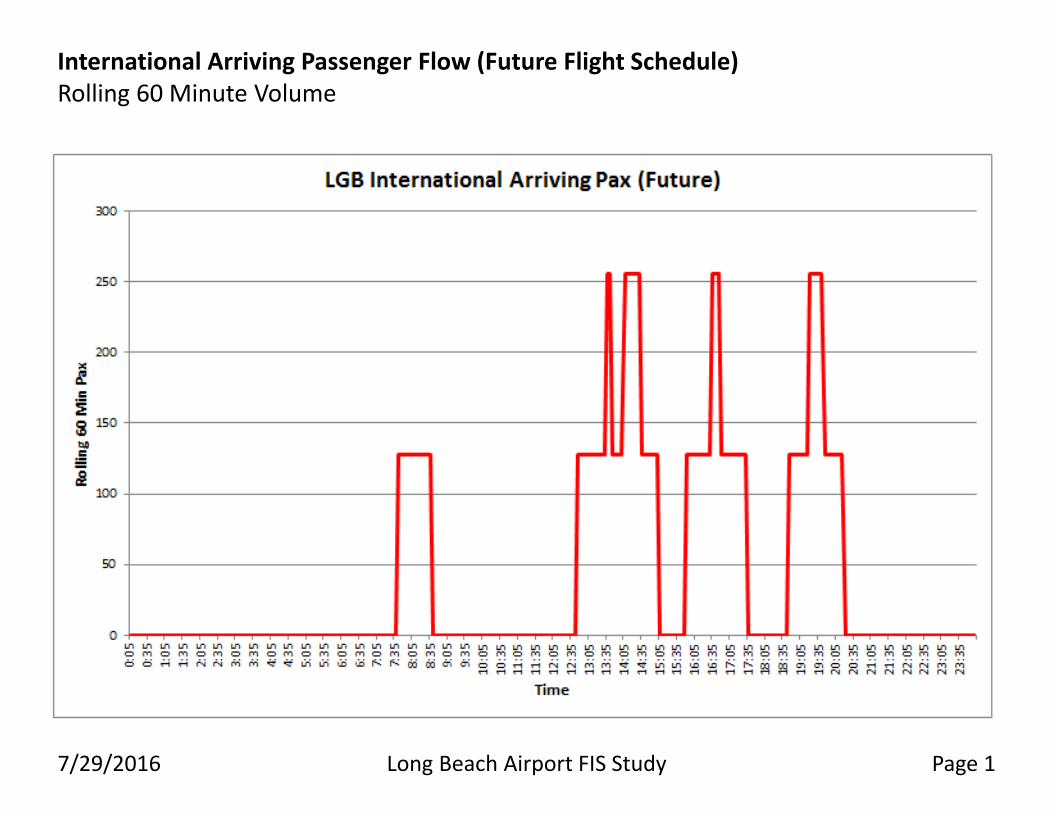
Figure 1 shows all arriving international passengers based on time using the Market Analysis simulated
international flight schedule. Peak time periods for arrivals would be in the early afternoon in the 1:40PM to
2:30PM time range, around 4:45PM, and around 7:40PM.
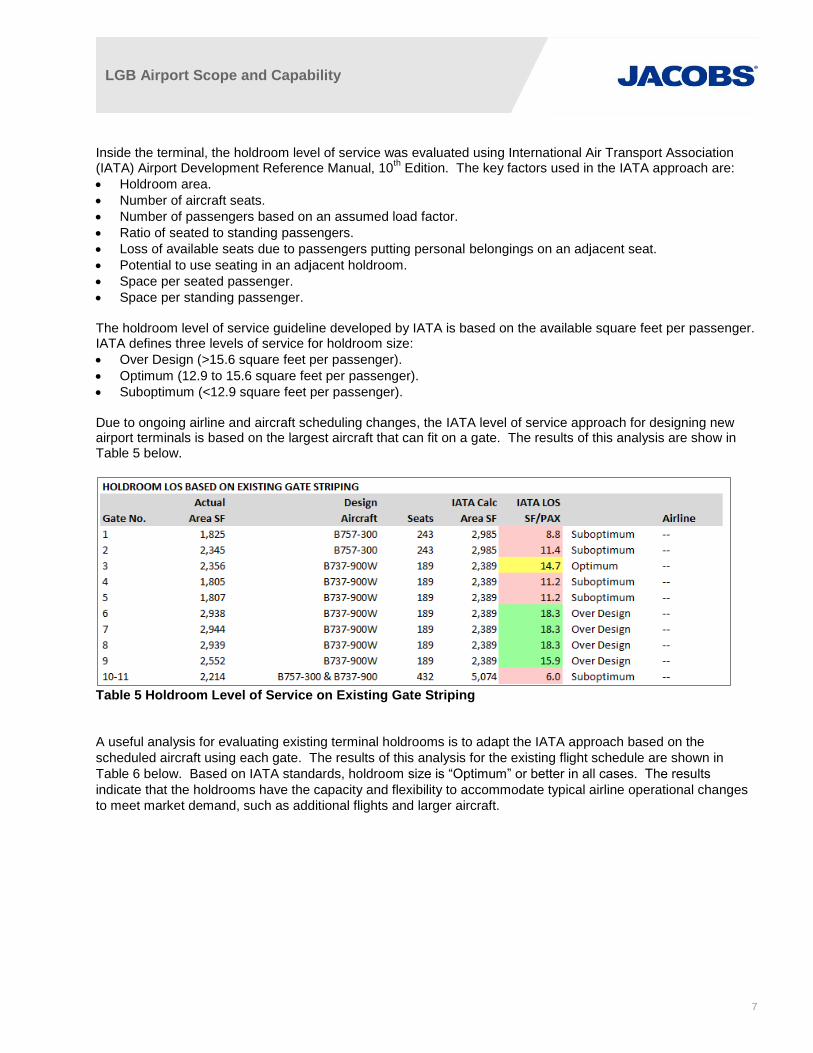
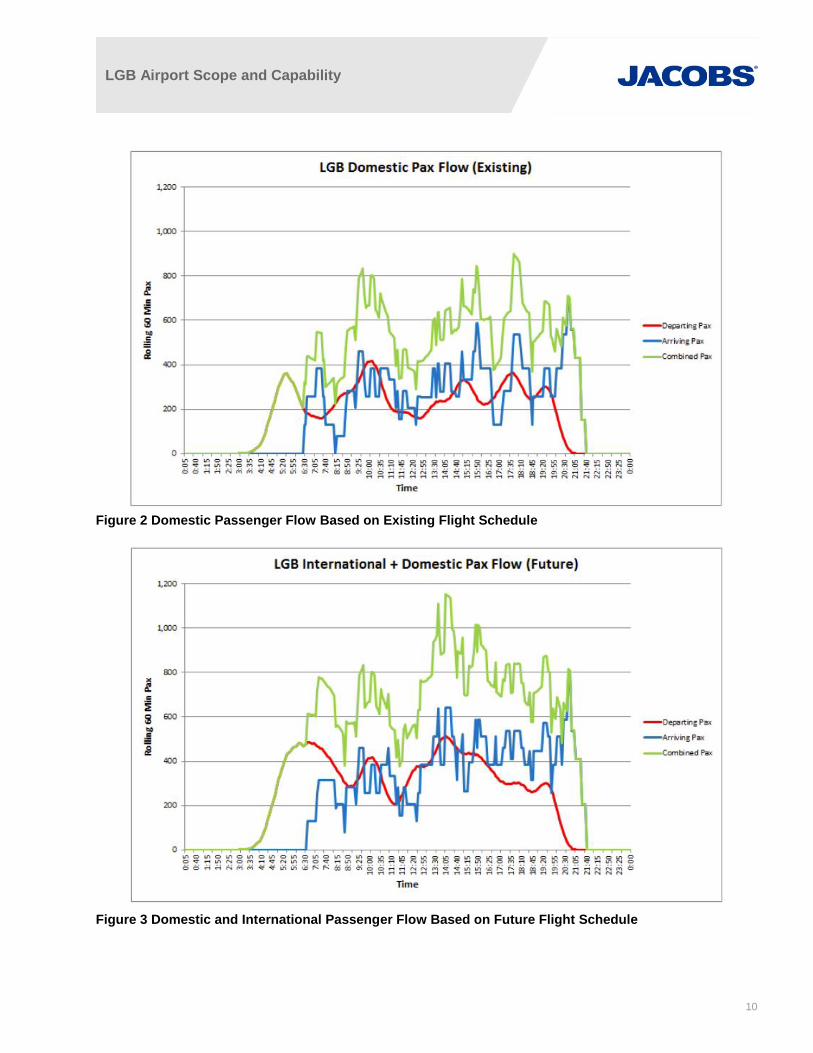
Figure 2 shows domestic passenger flow using the existing flight schedule. The combined number of
passengers is below 1,000 per rolling 60 minutes.
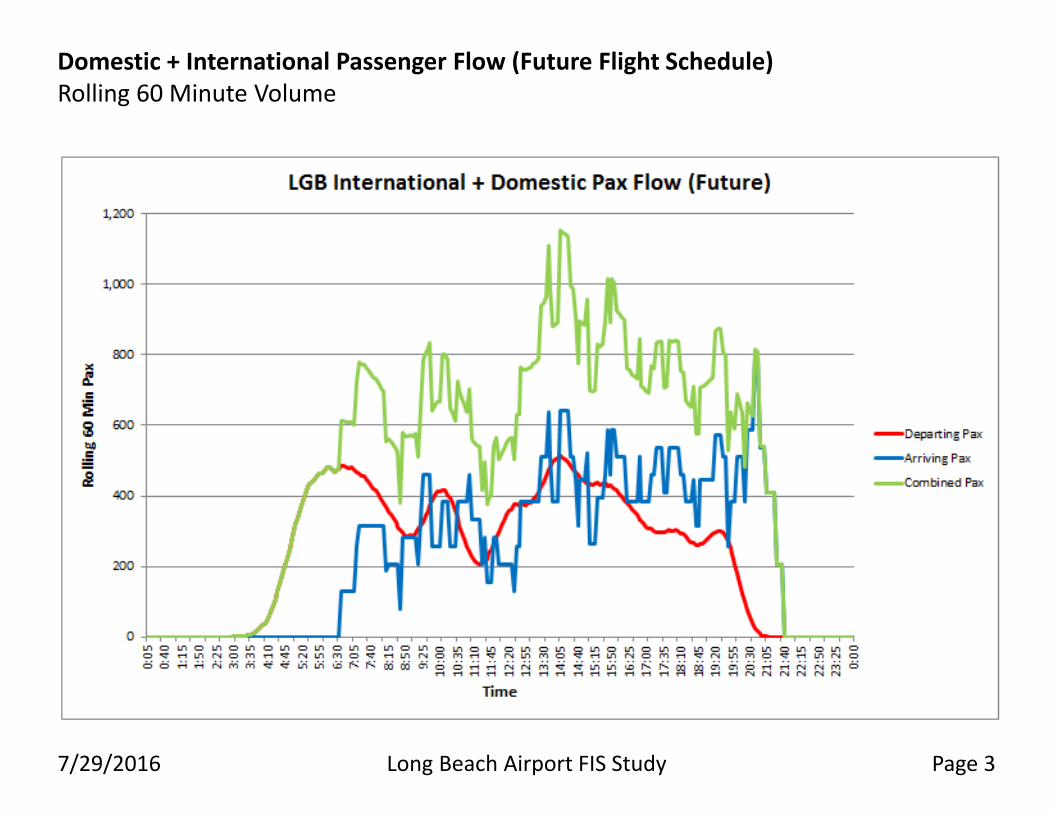
Figure 3 shows domestic and international passenger flow using the Market Analysis simulated international
flight schedule. There are peak periods on the afternoon where the combined number of passengers is above
1,000 per rolling 60 minutes.
Figure 1 International Arriving Passenger Flow Based on Future Flight Schedule
LGB Airport Scope and Capability
10
Figure 2 Domestic Passenger Flow Based on Existing Flight Schedule
Figure 3 Domestic and International Passenger Flow Based on Future Flight Schedule

LGB Airport Scope and Capability
11
3. Critical Airside Components
The critical airside component of an airport is the runway and taxiway system. The primary runway for air carrier
operation is Runway 12-30. The secondary runway for air carrier operation is Runway 7L-25R. The primary
taxiways between the air carrier runways and the terminal are Taxiways C, K, and L.
Airside Component
AAC4 ADG
5 TDG
6
Runway 12-30 D IV
Runway 7L-25R D III
Taxiway C IV 5
Taxiway K IV 5
Taxiway L IV 5
Table 4 Critical Airfield Components
Other critical components are aircraft parking positons and gates. To support international flight service, LGB
will need to have the appropriate amount of aircraft parking positions. As noted in Federal Inspection Service
Facility Development Alternatives7, there are three potential options – a north FIS alternative and two south FIS
alternatives.
The south concourse has four aircraft gates and is supported by aircraft parking positions 1 – 4. The north
concourse has seven aircraft gates and is supported by aircraft parking positions 5 – 11. In Option 1, the current
aircraft parking position 11 would be decommissioned, and new parking positions 11 and 12 would need to be
constructed. The new aircraft parking positions 11 and 12 would be the primary parking positions for Option 1.
For Options 2 and 3 aircraft parking positions 1 and 2 would be the primary aircraft parking positions; no new
aircraft parking construction is needed.
The following table provides information regarding aircraft parking capabilities at each of the existing aircraft
parking positions within the Terminal Area.
Aircraft Parking Positions
1 2 3 4 5 6 7 8 9 10 11
A320
A321-100
B737-700W
B737-900W
B757-300
B757-200W
CRJ700
CRJ900
Table 5 Existing Aircraft Parking Positions
7 Jacobs. Federal Inspection Service Facility Development Alternatives. August 2016.

LGB Airport Scope and Capability
12
4. Recommendation for Airside Infrastructure Improvements
Option 1 would require two aircraft parking positions to be constructed. Aircraft parking position 11 would be
decommissioned, and new parking positions 11 and 12 would need to be constructed. The new aircraft parking
positions 11 and 12 would be the primary positions for Option 1.
Options 2 and 3 require no new parking positions to be constructed. For Option 3, the current Security
Screening Checkpoint (SSCP) located on the south side will need to be repurposed as part of the FIS Facility
and a new SSCP would be constructed on the north side.
Within the existing concourse, Outbound Search Rooms (OSR) will need to be constructed per U.S. Customs
and Border Protection (CBP) Airport Technical Design Standard (ATDS) requirements8. One OSR will be
needed for each two gates serving international departures. Option 1 would require one OSR in the north
concourse; Options 2 and 3 would require one OSR in the south concourse.
8 U.S. Customs and Border Protection. Airport Technical Design Standard. Signature Version. June 2012.

LGB Airport Scope and Capability
13
5. LGB Landside Infrastructure Review
LGB is situated on approximately 1,166 acres in central Long Beach on Donald Douglas Drive and is located
just north of Interstate-405 (I-405) and bound by Cherry Avenue to the west, City of Lakewood and Douglas
Park to the north, and North Lakewood Boulevard to the east.
Vehicular access to LGB is provided at North Lakewood Boulevard at Donald Douglas Drive/East Wardlow
Road. Donald Douglas Drive loops into LGB providing access to the terminal as well as the short term parking
structure (Lot A), long term parking structure (Lot B), car rental lot, and office spaces. Also present is an
extension of the south side of the Donald Douglas Drive to exit onto North Lakewood Boulevard, with
southbound North Lakewood Boulevard access (right turn) only.
In November 2005, an Environmental Impact Report (EIR) was conducted for the Long Beach Airport Terminal
Area Improvement Project9. The EIR evaluated the potential impacts associated with additional commercial
carrier flights and full utilization of the 25 minimum commuter flights provided for in the Airport Noise
Compatibility Ordinance. The full utilization of 25 commuter flights and a total of 52 commercial carrier flights are
identified as the Optimized Flights scenario in the EIR.
With the Optimized Flights scenario, the EIR evaluated traffic impact for future Year 2020 and concluded that
the full utilization of commuter and commercial flights are not causally related9.
The Optimized Flights scenario is the maximum reasonable flight level that could potentially occur with
optimized operational procedures and aircraft and still be within the noise budgets permitted by the Airport Noise
Compatibility Ordinance9.
Currently, all passenger access to LGB is via Donald Douglas Drive and North Lakewood Boulevard.
Lakewood Boulevard runs north-south and is classified as a regional roadway in the City of Long Beach’s
General Plan. There are four lanes in each direction within the study area, a raised median, and a 45 MPH
speed limit. In 2014, the daily traffic volume was approximately 44,300 vehicles per day.
Donald Douglas Drive serves as the entrance road to the Long Beach Airport as well as a limited amount of
office space; Million Air, a franchised GA services company; Gulfstream aircraft manufacturing; and other
aviation businesses. Donald Douglas Drive forms a one-way, two-lane loop through the terminal area. The
roadway is two lanes in each direction between the loop and North Lakewood Boulevard. In 2016, the daily
traffic volume was approximately 13,000 vehicles per day.
The street opposite of Donald Douglas Drive at Lakewood Boulevard, East Wardlow Road, is a four-lane
roadway with a 35 mile per hour speed limit. The daily traffic volume in 2014 was approximately 10,500 vehicles
per day.
Parking capacity was analyzed using the following data obtained from Long Beach Airport staff:
Daily overnight night volumes from 2015.
Monthly enplaned passenger activity from 2015.
Annual enplaned passenger activity from 2015.
Number of existing parking stalls in Lots A and B.
Existing and future planning day flight schedules. There are a total of 3,007 parking stalls in Lots A and B (1,018 parking stalls in Lot A and 1,989 parking stalls in Lot B). July was the busiest month of the year for passenger activity in 2015. During that month, the greatest
9 BonTerra Consulting. Long Beach Airport Terminal Area Improvement Project EIR. November 2005.

LGB Airport Scope and Capability
14
number of overnight parked vehicles was 1,401. This represents a parking demand level that is approximately 47% of total parking capacity. The future planning day flight schedule has a 22.5% increase in the number seats compared to the existing flight schedule. Assuming the same parking patterns, an increase of 22.5% in passenger activity would result in an overnight demand in July for 1,716 parking stalls, or 57% of capacity. There appears to be ample parking capacity to meet demand into the future for many scenarios:
Growth from the increased passenger activity of new international flights.
Variations in overnight parking demand during months where there may fewer passengers but length of stay increases (e.g. seasonal business versus leisure traffic).
Annual year over year growth.
LGB is currently served by four Long Beach Transit routes with connections to major locations in Los Angeles
County and Orange County. Long Beach Transit Route #111 runs between Downtown Long Beach and
Lakewood Center Mall. From the Downtown Long Beach Transit Mall, the route travels through Long Beach
along Broadway, crossing Cherry Avenue, Redondo Avenue; then along Ximeno Avenue to North Lakewood
Boulevard. It then proceeds north along North Lakewood Boulevard, then through LGB, then continues north
towards the Lakewood Mall and South Street where it then continues south back to Downtown Long Beach.
Route #111 operates daily and starts operation at about 5:00 AM and runs until 12:30AM.
Long Beach Transit Routes #102 and #104 both serve the same route but different days of operations. The
route starts at Carson Street and Norwalk Boulevard, travels south along Norwalk Boulevard, then west along
East Wardlow Road, then south along Studebaker Road, then west along Spring Street into LGB, and then
continuing down North Lakewood Boulevard and traveling west on Willow Street towards Santa Fe Ave. Route
#102 operates only on weekdays from around 5:30 AM until 9:00 PM. Route #104 operates daily with weekday
service beginning at 6:00 AM until 7:00 PM and weekend service from 6:45 AM until 6:40 PM.
Long Beach Transit Route #176 provides transit between Technology Place on PCH and Lakewood Mall. The
route starts at Technology Place and runs east along PCH before continuing north on Lakewood Boulevard,
stopping at LGB, and then continuing north again along North Lakewood Boulevard, east on Carson Street, and
then north along Clark Ave to Lakewood Mall . Route #176 operates only on weekdays from around 6:45 AM
until 6:15 PM.

LGB Airport Scope and Capability
15
6. Traffic Flow Model
To assess current traffic conditions at Long Beach Airport, a traffic study was conducted in May 2016 to analyze
key points such as the entrance and exit of LGB and various locations along Donald Douglas Drive. The
intersection of Lakewood Boulevard and Donald Douglas Drive/East Wardlow Road was set up with cameras to
record all movements for three peak hour periods on May 17, 2016: 7-9AM, 4-6PM, and 9-11PM. A similar
camera set up was established at the Donald Douglas Drive exit onto North Lakewood Boulevard. One-way tube
counts were set up all along Donald Douglas Drive and connecting roads at 14 strategic locations to count the
number of vehicles driving over these points over a 24 hour period on May 17, 2016. Two-way tube counts were
set up a few feet in from the main entrance into LGB as well as a few feet before the south side exit to capture
the number of vehicles coming into and out of the Airport for a full one week period.
The video-based data collection set up at the intersection and exit of the Airport allows for recording of turning
movements to accurately count all vehicles and pedestrians activity at these busy locations. The light weight and
inconspicuous camera systems were installed by a single Field Technician in less than ten minutes. The small,
neutral-colored enclosures were mounted on existing infrastructure, in this case the traffic light poles, well above
the average individual’s sightline. In this way, the camera systems do not impact the public’s behavior.
After the video is recorded, the data is reviewed in the field and also at a local operations office before being
sent to a Video Reduction Center (VRC) where it is processed to produce highly accurate data. At the VRC,
video quality and accuracy of paperwork is verified before the video is backed-up to the consultant’s secure
server. Trained technicians then reduce the digital video footage into usable data, typically at speeds faster than
real-time. This allows for more efficient collection of traffic data, and significantly increases efficiency when
counting slow-moving traffic such as pedestrians and cyclists.
For less complex study locations where vehicles are typically driving straight, the tube count system was used to
capture vehicle data. The system consists of small black rubber hoses placed perpendicular to the flow of traffic
and away from curves, driveways, and turn lanes to measure the number of cars traveling a particular stretch of
roadway over a 24 hour period. The tubes cannot be placed in areas where vehicles will stop or park on them.
To understand where vehicles are going (i.e. main terminal, parking structure, offices, car rental, etc.), tubes
were set up before and after connecting roads (Barbara London Drive) where vehicles may turn into. The black
rubber tubes are closed on one end and are held down by ropes tied to nails on the ground. The other end is
plugged into a device called a counter. Gorilla tape was used to keep the tubes from excessively moving. When
the wheel of a car hits the tube, the pressure creates a pneumatic (air) pulse, which is measured by the counter.
The counter records each individual hit with a timestamp. This information was used to create reports about the
number of vehicles using a particular stretch of roadway.
The figure below shows the locations of where the traffic study was conducted. The red pins represent the turn
movement counts with the camera system for peak hour periods in one day; the blue pins represent the one-
way tube counts for a full 24 hour period; the purple pins represent the two-way tube counts for a full 7 day
period.

LGB Airport Scope and Capability
16
Figure 4 Map of Traffic Study Locations
In addition to vehicular traffic condition, passenger traffic entering and exiting the terminal was evaluated. Using
the existing flight schedule with the Market Analysis simulated international flight schedule, passenger traffic
models were created to review potential impacts to the terminal and front curb area.
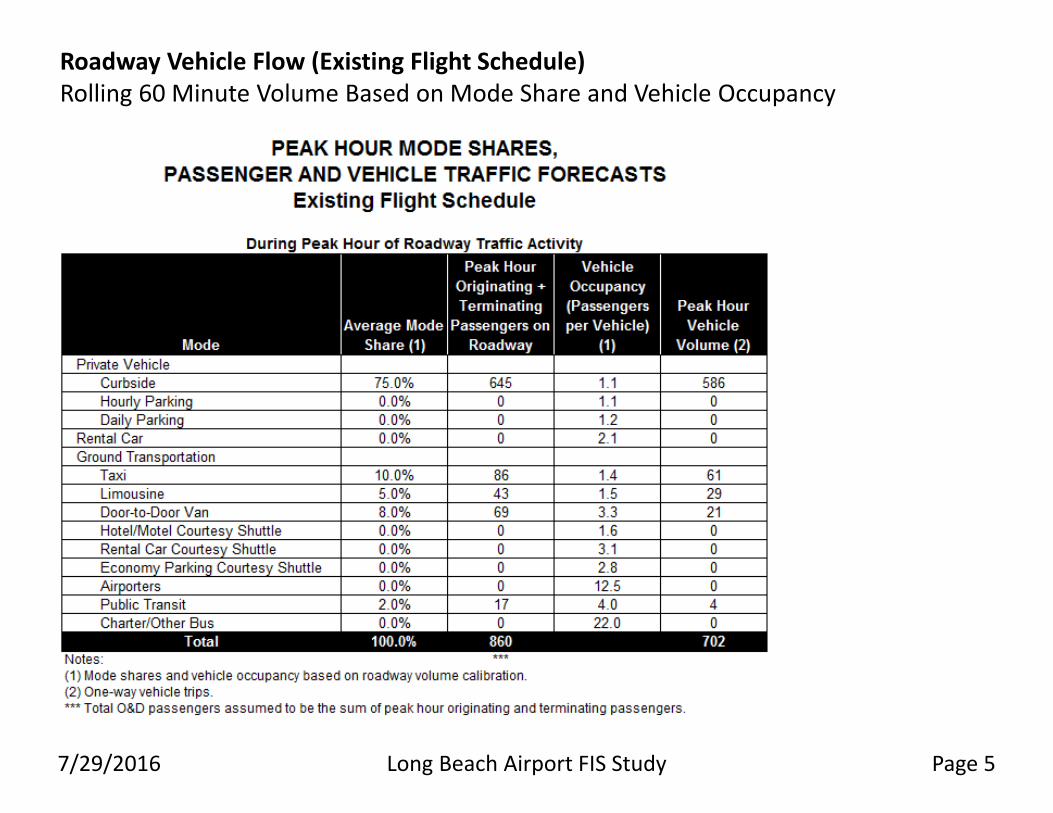
The next step is to convert the passenger volumes below into vehicle volumes based on an assumed mode
split. Using this data, a roadway curb analysis was performed to determine the Level of Service for the curb in
front of the terminal and the outer curb that sits in the middle of the road lanes of Donald Douglas Drive in front
of the terminal.
The methodology for determining capacity and level of service for the vehicle curbside used an industry standard approach that is described below. STEP 1—The capacity and level of service analysis for the vehicle curbside used planning day flight schedules for two activity levels: 1) a current existing planning day flight schedule; and 2) a future planning day flight schedule with potential new international flights. The planning day flight schedules represent activity on an average day in a busy month, and included the following data:
Airline
Aircraft type and number of seats
Scheduled arrival and departure times
Load factor (percentage of passengers relative to total seats), assumed to be 85% for all flights
Terminating factor (percentage of local passengers not connecting to another flight), assumed to be 100% for all flights
STEP 2—The planning day flight schedules were used to model passenger volumes throughout the planning day on a clock hour, 5-minute, and rolling 60-minute basis. Passenger volumes were calculated for arriving, departing and combined (total arriving and departing) flows. In addition to the data described in STEP 1, additional assumptions included:
Passenger reporting profile assumptions for departing passengers (percentage at the terminal prior to scheduled departure time). The profile varied based on time of day and whether the flight was domestic or international.

LGB Airport Scope and Capability
17
Passenger reporting profile assumptions for arriving passengers (percentage at the curb after scheduled arrival time).
STEP 3—Passenger volumes were converted to vehicle volumes based on the following factors:
Average mode share (private vehicle, rental car, taxi, limousine, shuttle, and public transit).
Average vehicle occupancy for each mode. STEP 4—Vehicle volumes derived from the current existing flight schedule were compared to clock hour survey data available from the same time period. The purpose of this calibration was to ensure that the analytical models were reasonably representing actual volumes during the combined peak, which is used for subsequent curbside capacity and level of service analysis. The method used for this calibration was GEH statistic, a standard formula used in traffic modeling to compare two sets of traffic volumes. A GEH value of 5.0 or less is considered a good match between modeled and actual volumes. The modeled volumes during the combined peak (greatest demand on the curb) had a GEH value of 1.0 compared to survey data on May 19, 2016 and 2.7 on May 19, 2016. STEP 5—Vehicle curbside capacity and level of service was analyzed for the current and future activity levels using the rolling 60-minute volume during the combined peak (largest total arriving and departing volume). The curb analysis used level of level of service designations from the Highway Capacity Manual (“LOS A” through “LOS F”). The key assumptions used in the curbside model are as follows:
Peak hour design volume for each vehicle mode at the combined peak
Average vehicle dwell time for each mode
Effective vehicle length for each mode
Effective curb length
Number of curb parking lanes
Number of curb through lanes
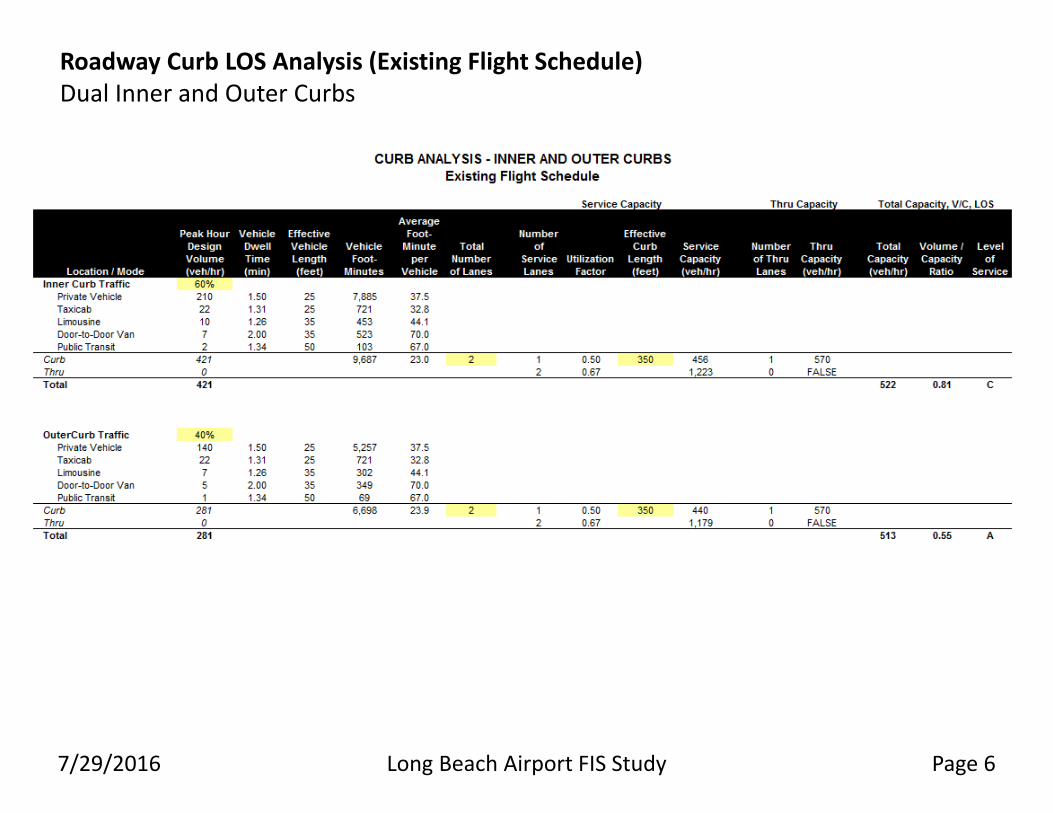
Through lane capacity (vehicles per hour) The results for the vehicle curbside analysis are as follows:
The comparison of modeled to actual roadway clock hour volumes was a good match during the combined peak (largest total arriving and departing clock hour volume). This validates the model for use in the subsequent curbside analysis.
The existing curbside is configured with dual inner and outer curbsides. Each curbside has two lanes. A single roadway lane goes into and out of each curbside. The level of service performance of the existing dual curbside is acceptable with the current existing flight schedule demand. The level of service performance of the existing dual curbside is at or near capacity with the future flight schedule demand. The level of service performance with the future flight schedule demand can be improved, made acceptable and better than exists today, with conversion to a four-lane single curb with two roadway lanes going into and out of the curbside.
With the existing flight schedule, the inner curb traffic received a Level of Service score of C; the outer curb
traffic received a Level of Service score of A. With the simulated international flight schedule, the inner curb
traffic received a Level of Service score of E; the outer curb traffic received a Level of Service score of B. The
decrease in Level of Service score for the simulated flight schedule is due to the increased passenger flow from
the international departures and arrivals.
A roadway curb Level of Service analysis was performed for a situation where there is no outer curb and only
the existing curb directly in front of the terminal. It received a Level of Service Score of B.

LGB Airport Scope and Capability
18
7. Critical Landside Components
The critical components of an airport are the areas in front of the terminal for passenger drop off and pickup,
passenger and employee parking, and pre-security infrastructure. Most passengers will enter the airport through
some mode of transportation such as personal cars, public transportation, taxis, etc.
LGB Airport Scope and Capability
19
8. Recommendation for Landside Infrastructure Improvement
Based on analysis of the traffic study data and results of the traffic flow model , removing the island curb in front
of the Terminal will ease vehicle congestion and improve the level of service for LGB. Removing the island curb
will allow for the construction of two drop off/pickup lanes and two through-traffic lanes. Level of service is
estimated to increase from E (poor) to B (good) for the simulated LGB schedule activity with international flights.
This improvement is recommended regardless of development of the FIS Facility as it will also improve level of
service from C (fair) to B (good) for the existing LGB schedule activity. Additional reduction of vehicle
congestion in front of the Terminal can be realized through the relocation of the entrance to the Gulfstream
leasehold to the intersection of Barbara London Drive and Donald Douglas Drive.

CATEGORY
EXISTINGEXISTINGEXISTINGEXISTING FUTURE FUTURE FUTURE FUTURE
PAPI, REIL
GPS
None
MALSR, PAPI
ILS, GPS, VOR
PAPI, REIL
GPS
Same
Same
0.32
0.32
Non-Precision
1 Mile
0.32
0.32
Non-Precision
Visual Same
SameSame
Same
0.35
0.35
Same
Same
Precision
1/2 Mile
0.35
0.35
Precision
Same
Same
Same
Same
Same
47.6'
38.1'
58.1'
38.1'
52.8'
58.1'
58.1'
38.1'
Same
Same
Same
Same
38.4'
25.7'
60.4'
Same
25.7
150'
34:1
150'
20:1
Same
Same
HIRLSameHIRL
Same
Same
200'Same
Same
50:1 / 40:1Same
SameHIRL / CL / TDZSame
60.4'
52.9'
60.4'
25.7'
Line of Sight Requirement Met
200'
34:1
HIRL / CL
Same
Same Same
Same Same
Same
Same
Same
Runway end coordinates and elevations were surveyed in accordance with FAA AC 150/5300-18B by Woolpert.
(1)
Runway Width
End Elevation (MSL)
Touchdown Zone Elevation (MSL)
Pavement Strength (x 1,000 lbs.)
Runway Lighting
Runway Marking
Runway Decision Height (MSL)
Approach Visibility Minimums
Approach Slope
Departure Surface Slope
Runway End Coordinates
Displaced Threshold
Displaced Threshold Coordinates
Maximum Elevation
Effective Gradient %
Runway Geodetic Azimuth
Departure Reference Code
Critical Design Aircraft
Critical Design Aircraft Wingspan
Criticial Design Aircraft Approach Speed (Knots)
Critical Aircraft MTOW (LBS)
-Displacement
-Elevation
-Latitude
-Longitude
Maximum Gradient %
Same
Same
Same
Same
D/III
737-800W
112.5'
142
174,200
Same
Same
D/III
Boeing
112.5'
Same
Same
D/IV
Boeing
156.2'
145
412,000
(1)
Yes YesYesSame Same Same Same
S-30
D-200
DT-300
S-30
D-200
DT-300
S-30
D-70
DT-110
D-70
DT-110
118° 08' 17.317"
33° 48' 24.720"
118° 09' 48.688"
33° 49' 21.937"
118° 08' 35.294"
33° 49' 21.716"
(4)
(Q)
800'
OFA WIDTH
800'
800'
800'
1,000'
414'
170'
340'
RUNWAY
(X)
400'
OFZ WIDTH
200'
400'
400'
400'
200'
163'
200'
1,000'
1,000'
OFA LENGTH
STANDARD
21
(C)
RPZ LENGTH
RUNWAY
Existing 25R
Existing 7L
Existing 30
500'Existing 12
(W )(W )
RPZ OUTER WIDTHRPZ INNER WIDTH RSA WIDTH
500'
(L)
RSA LENGTH
STANDARD
Existing 7R 1,000' 700'
Future 12
Future 30
Future 8L
Future 26R
Future 8R
PACS OR SACS DESIGNATION PID
LAT (NAD 83) LONG (NAD 83)
PACS
SACS
LGB ARP 2 AD9431 33° 49' 03.05" 39.0'118° 09' 07.05"
LGB AP 1961 STA K2 AD9433
Airport Elevation
60.4' (MSL)
Existing Airport Reference Point
Lat. 33° 49' 03.480"
Long. 118° 09' 05.310"
Mean Max Temperature Hottest Month
83.8° F. / 28.8° C., August
Combined Wind Coverage (all Weather 20 kts)100.00%
Distance & Direction From Long Beach
Owner
City of Long Beach
Magnetic Declination
12° 3' East
Existing/Future Airport Reference Code (ARC)
Terminal Navigational Aids
DATACATEGORY
D-IV
Airport Role
Commercial Service - Small Hub
Sectional ChartLos Angeles
Los Angeles Center
Public Facility
TRACON
September 2016; Source: NOAA NGDC
MALSR, Beacon
PAPI
CL Lights, TDZ Lights, HIRL, REIL
ILS / VOR / RNAV
Visual Navigational Aids
Long Beach, CA
Future Airport Reference Point
Aircraft Rescue and Firefighting Index
Time Zone
UTC -8 (UTC -7 during Daylight Saving Time)
304' Same325' Same 212' Same Visual Same
Same
500'
250'
33° 49' 34.42" 60.8'118° 09' 44.17"
Existing/Future 12
Existing/Future 30
Existing 7L
Existing 25R
Future 26R
TORA TODA LDA ASDA
7,414'
DESCRIPTION DIMENSION STANDARD
DISTANCE FROM DISTANCE TO
Runway 12-30 Centerline Runway 12-30 Holdbars
SEPARATION
Ex. Runway 7L-25R Centerline Ex. Runway 7L-25R Holdbars
IFR WIND ROSE ALL WEATHER WIND ROSEVFR WIND ROSE
SAFETY AREA KEY MAP
RSA RSA RSA
L
WW QCX
NOT TO SCALE
OFZ
OFZ
RSA RSA RSA
ROFA ROFA
ROFA ROFA
RP
ZR
PZ
R
P
Z
R
P
Z
R
P
Z
1
31.2'
2,000'
118° 08' 34.157"
33° 48' 38.644"
118° 09' 41.525"
33° 49' 34.331"
Same
100.00%
20 Knots
16 Knots
13 Knots
10.5 Knots
COMPONENT
CROSSWIND
99.96% 99.99%
99.97%
99.67%
99.05%
99.78%
99.38%
98.99%
99.95%
99.66%
99.10%
COVERAGE
VFR
COVERAGE
IFR
COVERAGE
ALL WEATHER
(5)
Existing and future blast pads are asphalt.
Taxiways are 75' wide unless otherwise dimensioned on Sheets 3 and 4 of this ALP set.
Lat. 33° 49' 04.546"
Long. 118° 09' 06.808"
BEYOND STOP END
RSA LENGTH
BEYOND STOP END
OFA LENGTH
2
FAR Part 77 Category SameVisual SameSameSame PrecisionNon-Precision
12 30 7L 25R
EX. / FUT. RUNWAY 12-30
WIND COVERAGE
EX. / FUT. SEPARATION & HOLD BAR DATA
(1)
AC Asphalt Cement
ADG Airplane Design Group
ARC Airport Reference Code
AIRC Aircraft
ARFF Aircraft Rescue and Firefighting
ARTCC Air Route Traffic Control Center
ASDA Accelerate-Stop Distance Available
ASOS Automated Surface Observation System
ATCT Air Traffic Control Tower
BRL Building Restriction Line
CAT Category
CL Centerline
DME Distance Measuring Equipment
D Dual
DT Dual Tandem
DH Decision Height
EL. or ELEV Elevation
EX Existing
FAR Federal Aviation Regulations
FATO Final Approach and Take Off
FOMO Fixed or Moveable Object
FUT Future
GA General Aviation
GQS Glide Path Qualification Surface
GPA Glide Path Angle
GPS Global Positioning System
HIRL High Intensity Runway Lights
IFR Instrument Flight Rules
ILS Instrument Landing System
LAT Latitude
LBS Pounds
LDA Landing Distance Available
LNAV Lateral Navigation
LOC Localizer
LONG Longitude
LPV Localizer Performance with Vertical Guidance
MALSR Medium Intensity Approach Lighting System with Runway Alignment Indicator Lights
MIRL Medium Intensity Runway Lights
MSL Mean Sea Level
MTOW Maximum Takeoff Weight
NA Not Authorized
NGS National Geodetic Survey
NOAA National Oceanic and Atmospheric Administration
NOTAM Notices to Airmen
NGS National Geodetic Survey
NPI Non Precision Instrument
OCS Obstacle Clearance Surface
OFA Object Free Area
OFZ Obstacle Free Zone
OL Obstruction Light
PACS Primary Airport Control Station
PAPI Precision Approach Path Indicator
PCC Portland Cement Concrete
PCN Pavement Classification Number
PID Point Identification
PIR Precision Instrument Runway
POFZ Precision Obstacle Free Zone
RDC Runway Design Code
REIL Runway End Identifier Lights
RNAV Area Navigation
RNP Required Navigation Performance
ROFA Runway Object Free Area
ROFA Runway Object Free Area
RPZ Runway Protection Zone
RRC Runway Reference Code
RSA Runway Safety Area
RTR Remote Transmitter and Receiver
RVR Runway Visual Range
RWY Runway
SACS Secondary Airport Control Station
TLN Taxilane
TWY Taxiway
TBD To Be Determined
TCH Threshold Crossing Height
TDG Taxiway Design Group
TDZ Touchdown Zone
TDZE Touchdown Zone Elevation
TERPS Terminal Instrument Procedures
THLD Threshold
TLOF Touchdown and Lift Off
TODA Take Off Distance Available
TOFA Taxiway Object Free Area
TORA Take Off Run Available
TRACON Terminal Radar Approach Control
TSA Taxiway Safety Area
S Single
UTC Coordinated Universal Time
VFR Visual Flight Rules
VGSI Visual Glide Slope Indicator
VIS Visual
VNAV Vertical Navigation
VOR/DME Very High-Frequency (VHF) Omni-Directional Range / Distance Measuring Equipment
VORTAC Very High-Frequency (VHF) Omni-Directional Range / Tactical Air Naviation
WAAS Wide Area Augmentation System
(6)
Taxiway surface composition at LGB is composed of both AC and PCC, refer to the Taxiway Group Data Table.
SameSameSameSame AsphaltAsphaltRunway Surface Composition
Same Same40:1 Same
ARTCC
Airport Use
Location
Taxiway Design Group 5 3 3
Same Same Same Same
Pavement Classification Number (PCN) 62/F/A/X/T Same Same 54/F/B/W/T Same 54/F/B/W/T Same62/F/A/X/T
Same
Same Same
Same
Existing 25L
Future 26L
500'
250'
R
P
Z
R
P
Z
R
P
Z
RP
ZR
PZ
RP
Z
CENTRAL
PORTION
OF THE
RPZ
POFZ
ABBREVIATIONS
20 Knot Wind Rose - ARC: D-IV 20 Knot Wind Rose - ARC: D-IV 20 Knot Wind Rose - ARC: D-IV
SURVEY MONUMENTS
SACS LGB AP 1961 STA L2 AD9432 33° 48' 23.30" 23.5'118° 08' 18.13"
3 Miles NE
EXISTING/FUTURE DECLARED DISTANCES
RUNWAY
10,000' 10,000' 9,414'
Future 8L
6,192' 4,887' 6,192'
AIRPORT DATA
EXISTING NONSTANDARD CONDITIONS
1,700'
2,500'
Same
1,700'
Departure RPZ Existing 12
Departure RPZ Future 12
500'
Same
Departure RPZ Existing 30
Departure RPZ Future 30
500'
500'
Same
500'
1,000'
500'
1,010'
1,750'
1,010' 1,000'
Same Same
500' 414'
Same Same
RUNWAY PROTECTION ZONE AND RUNWAY SAFETY AREA DIMENSIONS
1,000'
Same
1,000'
Same
Existing 25R
Existing 7L
Existing 30
Existing 12
Future 12
Future 30
Future 8L
Future 26R
1000'
1000'
OBJECT FREE AREA AND OBSTACLE FREE ZONE DIMENSIONS
EXISTING/FUTURE RUNWAY DATA TABLE
52.9'
1350'
118° 09' 30.155"
33° 49' 24.937"
Vertically
Guided
Critical Design Aircraft Tail Height 41.2'52.6'
C
Southern California TRACON (SCT)
Long Beach Airport (Daugherty Field) (LGB)
PACS and SACS are protected by a concrete encasing. For each of the monuments listed in the above table, use the PID to retrieve the NGS Data
(1)
Horizontal Datum: North American Datum of 1983 (NAD 83 2010.00 Adjustment).
(2)
(3)
Vertical Datum: North American Vertical Datum 1988 (NAVD 1988).
Sheet which contains detailed information about each survey monument. Monuments are also identified in plan on Sheets 3 and 4 of this ALP set.
Refer to Sheet 4 for proposed improvements to meet non-standard conditions.
(1)
(3)
(1)
Taxiway Lighting SameSameSameSame MITL
Same Same Same Same
SameSame
Data collected from the National Oceanic and Atmospheric Administration's (NOAA);
(1)
Dates: 12/2005 through 12/2015; Number of Observations: 120,248.
Runway Length 6,192'SameSame10,000' 10,000' 6,192'
Runway 7R-25L Runway Blast Pads 200' X 200'0' X 0'
Runway 7L-25R Runway Blast Pads 95' X 150'0' X 0'
Runway 7R-25L Shoulder Width 10'0'
See Sheet 6 for more detail regarding the existing and future declared distances at LGB.
(1)
BEYOND STOP END
OFZ LENGTH
1 1/8 Mile
5Taxiway A
Taxiway B
Taxiway C
Taxiway D
Approach Reference Code / Runway Design Code (RDC) D/III/VIS D/III/5000D/IV/5000
TAXIWAY GROUP DATA
75'
65'
75'
Fut. Runway 8L-26R Centerline Fut. Runway 8L-26R Holdbars
EXISTING
WIDTH
FUTURE
WIDTH
ELEVATION
E
180
S
W
360
N
28
27
22
21
17
16
11
10
KNOTS
WIND COVERAGE:
94.00 %
+
+
+
+
+
+
+
.1
+
+
+
+
+
.1
.1
.1
.1
+
+
.1
.1
.1
+
+
.1
.2
.4
.8
1.2
.9
.5
.2
.1
+
+
+
+
+
+
+
+
+
+
+
+
+
+
+
+
+
+
+
+
+
.1
.1
+
+
+
+
+
+
+
+
+
+
+
+
+
+
+
+
+
+
+
+
+
+
+
+
100.00 %
CALM WIND COVERAGE:
E
180
S
W
360
N
28
27
22
21
17
16
11
10
KNOTS
WIND COVERAGE:
96.30 %
+
.1
+
+
.1
.1
.1
.2
.3
.8
.3
.1
+
.1
.1
.1
.1
.1
.1
.1
+
.2
.1
.1
+
+
+
+
+
.1
+
.2
.1
+
+
+
+
+
+
+
+
+
+
99.99 %
CALM WIND COVERAGE:
E
180
S
W
360
N
28
27
22
21
17
16
11
10
KNOTS
WIND COVERAGE:
93.40 %
+
+
+
+
+
+
+
.1
.1
+
+
+
+
.1
.1
.1
+
+
+
.1
.1
.1
+
+
.1
.2
.4
.9
1.4
1.1
.6
.2
.1
+
+
+
+
+
+
+
+
+
+
+
+
+
+
+
+
+
+
+
.1
.1
+
.1
.1
+
+
+
+
+
+
+
+
+
+
+
+
+
+
+
+
+
100.00 %
CALM WIND COVERAGE:
99.97%
20 Knots
16 Knots
13 Knots
10.5 Knots
COMPONENT
CROSSWIND
99.93% 99.97%
99.90%
99.56%
99.04%
99.61%
98.69%
97.73
99.88%
99.52%
98.99%
COVERAGE
VFR
COVERAGE
IFR
COVERAGE
ALL WEATHER
FUT. RUNWAYS 8L/R-26L/R
WIND COVERAGE
100.00%
20 Knots
16 Knots
13 Knots
10.5 Knots
COMPONENT
CROSSWIND
99.99% 100.00%
100.00%
99.94%
99.78%
99.92%
99.75%
99.47%
99.99%
99.93%
99.77%
COVERAGE
VFR
COVERAGE
IFR
COVERAGE
ALL WEATHER
ALL RUNWAYS
WIND COVERAGE
Existing 7R
Existing 25L
Future 8R
5,423'
5,423'
5,423'
3,918'
5,423'
5,423'
Future 26L
EXISTINGEXISTING FUTURE FUTURE
PAPI, REIL
Same
0.39
0.39
Same
0.39
0.39
52.8'
31.3'
Same
Same
Same
52.8'
31.3' 34.6'
Same Same
34.6'
0.47
0.47
Cessna
B/II
0.47
0.47
B/II
51.7'
13,300
YesYes Same Same
Same Same
34.6'
1,505'
118° 08' 54.254"
33° 48' 49.820"
Visual (Utility)
SameSame
Same
Same Same
SameSame
B/II/VISB/II/VIS
8L 26R 7R 25L8R 26L
Same
Same
Same
Same
Same
Same
Same
Same
52.8'
1,305'
118° 09' 33.215"
33° 49' 21.894"
None NoneSame Same
39.5'
532'
118° 08' 41.599"
33° 49' 21.737"
None
5,423' 5,423'SameSame 3,918'
100'100'
34.6'Same
54.3Same
SameSame
SameSame
VisualVisual
150'150'
Boeing
156.2'
145
412,000
5
52.6'
Same
Same
Same
Same
Same
D/IV
D/IV/2400 Same
Same
Minimum Elevation
IFR Conditions occur approximately 7.5% of each year.
(2)
National Climactic Data Center (NCDC); Station: Long Beach Daugherty Field Airport;
Same
31.3'52.8'
45.8'58.1'
S-30
D-75
HIRLHIRL
Non-PrecisionNon-Precision
VisualVisual
20:120:1
Visual Visual
VisualVisual
AsphaltAsphalt AsphaltAsphalt
118° 09' 40.688"
33° 48' 49.784"
118° 08' 36.414"
33° 48' 49.827"
None SameSame
Same Same
Same Same
Same Same
Same Same
Same Same
142
174,200
41.2'
108
Same Same B/II/VIS Small Airc.
Same Same Same Same
54.5'
12,500
103
Future 26L
Future 8R
Existing 7R
Existing 25L
500' 300' 400' 200'300'
500' 300' 400' 200'300'
Taxiway E
Taxiway F
Taxiway G
Taxiway J
Taxiway K
Taxiway L
75'
50'
100'
75'
75'
75'
75'
5
5
5
5
5
MITL MITL MITL MITL MITL
40:1 40:1 40:1 40:140:1
Non-Vertically
Guided
Non-Vertically
Guided
Vertically
Guided
Vertically
Guided
Vertically
Guided
8,650'10,000' 10,000' 10,000'
Non-Precision
1,000'
Same
1,000'
Same
300'
Same
300'
Same
300'
Same
300'
Same
219'
Same
240'
Same
150'
Same
150'
Same
500'
Same
500'
Same
1,700'
Same
1,700'
Same
1,010'
Same
1,010'
Same
Same
1,700'
Same
1,700'
Same
1,010'
Same
1,010'
Same
Same
1,000'
Same
450'
700'
450'
Aeronautical Survey Classification
Navaids and Visual Aids
Ex. Runway 7R-25L Centerline Ex. Runway 7R-25L Holdbars
Fut. Runway 8R-26L Centerline Fut. Runway 8R-26L Holdbars
Runway 12-30 Centerline
Runway 12-30 Centerline
Taxiway D Centerline
Taxiway L Centerline
Ex. Runway 7L-25R Centerline
Fut. Runway 8L-26R Centerline
Ex. Runway 7R-25L Centerline
Fut. Runway 8R-26L Centerline
Taxiway K Centerline
Taxiway K Centerline
Taxiway F Centerline
Taxiway F Centerline
Ex. Runway 7R-25L Centerline
Fut. Runway 8R-26L Centerline
Taxiway J Centerline
Taxiway J Centerline
Ex. Runway 7L-25R Centerline
Fut. Runway 8L-26R Centerline
Ex. Runway 7R-25L Centerline
Fut. Runway 8R-26L Centerline
Taxiway L1 Centerline Taxiway L2 Centerline
ADG IV Taxiway Centerline Fixed Or Moveable Object
ADG IV Taxilane Centerline Fixed Or Moveable Object
129.5'
112.5'
ADG IV TSA
ADG IV Taxiway OFA
ADG IV Taxilane OFA
ADG IV TWY Wingtip Clearance
ADG IV TLN Wingtip Clearance
171'
259'
225'
44'
27'
65.5'
57.5'
79'
131'
115'
26'
18'
ADG II Taxiway Centerline Fixed Or Moveable Object
ADG II Taxilane Centerline Fixed Or Moveable Object
ADG II TSA
ADG II Taxiway OFA
ADG II Taxilane OFA
ADG II TWY Wingtip Clearance
ADG II TLN Wingtip Clearance
TDG 5 Edge Safety Margin
TDG 5 Shoulder Width
TDG 2 Edge Safety Margin
TDG 2 Shoulder Width
TDG 1A/B Edge Safety Margin
TDG 1A/B Shoulder Width
30'
7.5'
15'
5'
10'
15'
6,192'
5,423'
5,423'
Same Same
244'
239'
148'
350'/400'
400'
400'
275'
400'
3,239'
340'
134.72°
122.63°
314.73°
302.65°
90.20°
78.12°
270.21°
258.13°
89.95°
77.87°
269.96°
257.88°
Yes
Magnetic Heading
Same
Same
Same
Same
Same
Same
Same
Same
Same
Same
Same
Same
EXISTING
TAXIWAY DESIGNATION
EXISTING
TDG
FUTURE
TDG
FUTURE
TAXIWAY DESIGNATION
IV
IV
II
IV
IV
IV
IV
III
IV
IV
EXISTING
ADG
FUTURE
ADG
EXISTING
TYPE
EXISTING
SURFACE COMPOSITION
FUTURE
SURFACE COMPOSITION
Asphalt
Asphalt
PCC
Asphalt
Asphalt
Asphalt
Taxiway D1
Taxiway D2
Taxiway D3
Taxiway D4
Taxiway F1
Taxiway F2
Taxiway F3
Taxiway J1
Taxiway J2
Taxiway K1
Taxiway K2
Taxiway K3
Taxiway L1
Taxiway L2
Taxiway L3
Parallel Taxiway
FUTURE
TYPE
Parallel Taxiway
Taxiway
Parallel Taxiway
Taxiway
Parallel Taxiway
Parallel Taxiway
Parallel Taxiway
Parallel Taxiway
Parallel Taxiway
Connector Taxiway
Connector Taxiway
Connector Taxiway
Connector Taxiway
Connector Taxiway
Connector Taxiway
Connector Taxiway
Connector Taxiway
Connector Taxiway
Connector Taxiway
Connector Taxiway
Connector Taxiway
Connector Taxiway
Connector Taxiway
Connector Taxiway
92'
101'
75'
75'
62'
63'
52'
45'
75'
65'
130'
130'
110'
130'
131'
5IV
5IV
5IV
5IV
II
II
II
5IV
5IV
IV
5IV
5IV
5IV
Asphalt
Asphalt
Asphalt
PCC
S-30
Same Same
Runway 12-30 has 350' centerline separation with Taxiway D between Taxiways D1 and D3. Between
Taxiways D3 and F, Taxiway D tapers away from Runway 12-30 and reaches 400' separation north of
Taxiway F until its terminus at Taxiway D4.
(1)
-Latitude
-Longitude
Critical Design Aircraft Undercarriage Width
2 2
Same Same Same Same Same
Same Same Same Same Same
Same Same Same Same
Same Same Same Same Same
Same
Same
Same
Same
Same
Same
Same 250'
Same
Same
400'
200'
Runway 12-30 to Taxiway D Centerline Separation 400'350'
Runway 7L-25R ROFA North of Runway uncontrolled 400'293'
Runway 7L-25R ROFA South of Runway contains aircraft parking 400'391'
Taxiway D OFA (from Centerline) 129.5'49.5'
(4)
Runway 12-30 ROFA truncated by service road 1,000'831
Portion South of Taxiway F of Taxiway D is non-standard. See Ex./Fut. Separation & Holdbar Table for detail.
(2)
Taxiway L OFA (from Centerline) 129.5'81.3'
Runway 7R-25L Shoulder Width 10'0'
Roads in RPZsNo Action
Use of Runway 16R-34L Alignment as Taxilane for ADG-III aircraft
Mitigation in Planning
GA Hold Apron Within Taxiway K OFA 129.5'83.7'
Compass Calibration Pad Within Taxiway J OFA 129.5'97.2'
Runway 7L-25R RSA from Runway 25R end 1,000'247'
Runway 7L-25R RSA from Runway 7L end1,000'163'
33 X 33'20 X 20'Helicopter Pad 1,2,4,5 & 6 TLOF Undersized
Non-standard Helicopter Pad markings
5
Taxiway B OFA (from Centerline) 129.5'85'
Helicopter Pads require windsock within 500' of pad
Taxiway B Width 75'65'
Taxiway J OFA (from Centerline) 129.5'69'
Taxiway F Width 75'100'
3
II
III 3
5
3
5
3
3
3
3
Blast Pad Dimensions (L x W in Feet) None200' X 250' NoneSame 200' X 250' Same 200' X 200' 200' X 200' 150' x 95' 150' x 95'None None
Taxiway D TSA (from Centerline)
85.5'49.5'
Use of service roads as Taxilanes for ADG-1A/B aircraft
Mitigation in Planning
Runway 7R-25L width75'150'
None
Departure RPZ Existing 25R
Departure RPZ Future 26R
500'
Same
Departure RPZ Existing 7L
Departure RPZ Future 8L
500'
Same
1,700'
Same
1,700'
Same
1,010'
Same
1,010'
Same
Departure RPZ Existing 25L
Departure RPZ Future 26L
500'
250'
Departure RPZ Existing 7R
Departure RPZ Future 8R
500'
Same
1,000'
Same
1,000'
250'
700'
450'
700'
450'
B/II/VIS Small Airc.
Taxiway A OFA (from Centerline) 129.5'119'
6,192' 4,887' 6,192'6,192'
6,192' 5,660' 6,192'6,192'
6,192' 5,660' 6,192'6,192'
3,918'
125'
118° 08' 54.254"
33° 48' 50.063"
118° 09' 40.688"
33° 48' 50.031"
S-12.5
S-30
D-75
S-12.5
Same Same Same Same
None None
Citation II
Beechcraft
King Air 200737-800W767-300ER 767-300ER
Declared Distances are applied in order to meet 1,000' RSA beyond runway end standard.
(1)
FAA Determination Letter dated May 4, 2011 approves existing non-standard RSA length beyond runway end.
(2)
(1)
(2)
250'
12.5' 15.0'
16.25'15.00'18.8'18.8'30.5'30.5' SameSameSameSame
ADG III Taxiway Centerline Fixed Or Moveable Object
ADG III Taxilane Centerline Fixed Or Moveable Object
93'
81'
ADG III TSA
ADG III Taxiway OFA
ADG III Taxilane OFA
ADG III TWY Wingtip Clearance
ADG III TLN Wingtip Clearance
118'
186'
162'
34'
27'
TDG 3 Edge Safety Margin
TDG 3 Shoulder Width 20'
10'
3,918' 3,918' 3,918' 3,918'
3,918'3,918'3,918'3,918'
Boeing
Same Same Same Same
Same
Same
Taxilane E
Same
Same
Same
Same
Same
Closed
Same
Taxiway F2
Taxiway F3
Taxiway F4
Same
Same
Taxiway N
Same
Same
Same
Same
Same
Same
Same
Same
Same
Taxiway L4 Connector Taxiway 50'3IITaxiway N Connector Taxiway
Closed Runway 16L-34R Closed Runway 75'3IITaxiway C Connector Taxiway
N/A N/A N/AN/AN/ATaxiway J3 Connector Taxiway
75' Asphalt
N/A35'
IV
II
II / III / IV
3
5IV
5
N/A N/A N/AN/AN/ATaxilane M Connector Taxiway N/A Asphalt25'I 1B
5
N/A N/A 75'N/AN/ATaxiway F1 Connector Taxiway 75' N/AIV 5
Closed N/A N/A
IV
2 / 3 / 5 35' / 50' / 75'Same
Taxilane 75'
Same 75' Asphalt
Asphalt
Asphalt
Asphalt
Asphalt
Asphalt
Asphalt
Asphalt
Asphalt
Asphalt
Asphalt
Asphalt
Asphalt
Asphalt
Asphalt
AsphaltSame Same Same
Asphalt
Asphalt
PCC
Same
Same
Same
Same
Same
Same
Same
Same
Same
Same
Same
Same
Same
Same
Same
Same
Same
Same
Same
Same
Same
Same
Same
Same
Same
Same
Same
Same
Same
Same
Same
Same
Same
Same
Same
Same
Same
Same
Same
Same
Same
Same
Same
Same
Same
Same
Same
Same
Same
Same
Same
Same
Same
Same
Same
Same
Same
Same
Same
IV
Same
Same
Same
Same
Same
Same
Same
Same
N/A
Same
Same
Same
Same
Same
Same
Same
Same
5
Same
Same
Same
Same
Same
Same
Same
Same
Same
Same
Same
Same
Same
Same
Same
Same
Same
Same
Same
Same
Same
Same
Same
Same
Same
Same
Same
Same
Same
Same
Same
Same
Same
Visual (Utility)
Cessna
51.7'
13,300
108
54.5'
12,500
103
2 2
Citation II
Beechcraft
King Air 200
12.5' 15.0'
16.25'15.00'
W 800'' X L 200'
OFZ
PRECISION
None
Same
None
None
None
None
None
None
None
None
None
79'
15'
ADG I Taxilane OFA
ADG I TLN Wingtip Clearance
(1)
(1)
(1)
J:\63292_LGB_ALP\00_CADD\ALP_Sheets\02_Airport_Data.dwg May 31, 2016 - 11:36am
6033 West Century Blvd, Suite 1050Los Angeles, California 90045
(310) 417-8777www.HNTB.com
Sponsor
OF
No. Revision
DATE: SHEETDRAWN: REVIEW:
The preparation of these documents was financed in part through a planning grant from the Federal Aviation Administration as provided under Section 505 of the Airport andAirway Improvement Act of 1982, as amended. The contents do not necessarily reflect the official views or policy of the FAA. Acceptance of these documents by the FAA doesnot in any way constitute a commitment on the part of the United States to participate in any development depicted herein nor does it indicate that the proposed development isenvironmentally acceptable in accordance with appropriate public laws.
LGB 12/12/2011Revision-
LONG BEACH AIRPORTLONG BEACH, CALIFORNIA
9/01/2016 24
Date
LGB 9/1/2016
AIRPORT DATA
KKP/JCDED JRB 2
International Arriving Passenger Flow (Future Flight Schedule)Rolling 60 Minute Volume
7/29/2016 Long Beach Airport FIS Study Page 1

7/29/2016 Long Beach Airport FIS Study Page 2
Domestic Passenger Flow (Existing Flight Schedule)Rolling 60 Minute Volume
7/29/2016 Long Beach Airport FIS Study Page 3
Domestic + International Passenger Flow (Future Flight Schedule)Rolling 60 Minute Volume

7/29/2016 Long Beach Airport FIS Study Page 4
Roadway Vehicle Flow Calibration (Existing Flight Schedule)Clock Hour Volume
7/29/2016 Long Beach Airport FIS Study Page 5
Roadway Vehicle Flow (Existing Flight Schedule)Rolling 60 Minute Volume Based on Mode Share and Vehicle Occupancy
7/29/2016 Long Beach Airport FIS Study Page 6
Roadway Curb LOS Analysis (Existing Flight Schedule)Dual Inner and Outer Curbs

7/29/2016 Long Beach Airport FIS Study Page 7
Roadway Vehicle Flow (Future Flight Schedule)Rolling 60 Minute Volume Based on Mode Share and Vehicle Occupancy

7/29/2016 Long Beach Airport FIS Study Page 8
Roadway Curb LOS Analysis (Future Flight Schedule)Dual Inner and Outer Curbs

7/29/2016 Long Beach Airport FIS Study Page 9
Roadway Curb LOS Analysis (Future Flight Schedule)Single Inner Curb

Feasibility Study for a Federal Inspection Service Facility at Long Beach Airport
AirlineSeat
CapacitySeat
Utilization Equip Flt#InbSta Dept Arvl
TotalArrivals
Load Factor 85% TO LGB
JetBlue 150 128 320 2135 SFO 6:15 7:35 1JetBlue 150 128 320 217 AUS 7:10 8:04 2Delta 70 60 CRJ7 tbd SLC 7:00 8:08 commuter 1
JetBlue 150 128 320 tbd GDL 7:00 8:35 3American 90 77 CRJ9 5663 PHX 7:45 9:09 4JetBlue 150 128 320 1121 PDX 7:15 9:36 5Delta 90 77 CRJ9 4644 SLC 8:32 9:38 6
Southwest 148 126 737-700 972 OAK 8:35 10:00 7JetBlue 150 128 320 1207 SEA 7:35 10:13 8JetBlue 150 128 320 147 OAK 9:00 10:18 9JetBlue 150 128 320 735 SFO 9:30 11:00 10JetBlue 150 128 320 211 LAS 10:15 11:19 11JetBlue 150 128 320 447 OAK 10:10 11:29 12
American 90 77 CRJ9 5661 PHX 10:35 11:55 13Delta 90 77 CRJ9 4589 SLC 11:25 12:25 14
JetBlue 150 128 320 231 SLC 11:54 12:44 15JetBlue 150 128 320 1435 SFO 11:59 13:27 16JetBlue 150 128 320 tbd LIR 8:35 13:40 17
Southwest 148 126 737-700 1024 OAK 12:20 13:45 18JetBlue 150 128 320 213 JFK 11:32 14:20 19JetBlue 150 128 320 tbd XXX tbd 14:30 20JetBlue 150 128 320 877 LAS 13:24 14:32 21JetBlue 150 128 320 1007 SEA 12:20 14:58 22JetBlue 150 128 320 tbd PVR 14:00 15:00 23Delta 70 60 CRJ7 tbd SLC 14:22 15:30 commuter 2
JetBlue 150 128 320 43 RNO 14:15 15:40 24American 90 77 CRJ9 5619 PHX 14:35 15:55 25JetBlue 150 128 320 1417 AUS 15:20 16:15 26
Southwest 148 126 737-700 18 OAK 15:05 16:30 27JetBlue 150 128 320 1521 PDX 14:10 16:31 28JetBlue 150 128 320 tbd MEX 14:30 16:45 29JetBlue 150 128 320 tbd XXX tbd 17:30 30JetBlue 150 128 320 379 LAS 16:25 17:31 31
UPS crew crew B763F 2908 SDF 16:10 17:35 32JetBlue 150 128 320 407 SEA 15:00 17:40 33FedEx crew crew A300F 1351 MEM 16:00 17:47 34Delta 90 77 CRJ9 4723 SLC 17:00 18:04 35
American 90 77 CRJ9 5668 PHX 16:43 18:15 36JetBlue 150 128 320 365 SMF 17:13 18:33 37JetBlue 150 128 320 531 SLC 17:50 18:37 38JetBlue 150 128 320 879 LAS 17:35 18:38 39Delta 70 60 CRJ7 tbd SLC 18:22 19:30 commuter 3
JetBlue 150 128 320 1179 LAS 18:35 19:38 40JetBlue 150 128 320 tbd SJD 18:10 19:40 41JetBlue 150 128 320 1635 SFO 18:20 19:43 42JetBlue 150 128 320 tbd CUN 16:50 20:15 43JetBlue 150 128 320 1621 PDX 18:23 20:41 44JetBlue 150 128 320 404 OAK 19:25 20:44 45
Southwest 148 126 737-700 2785 OAK 19:35 21:00 46Delta 90 77 CRJ9 4639 SLC 20:15 21:17 47
JetBlue 150 128 320 405 BOS 18:00 21:18 48American 90 77 CRJ9 5870 PHX 20:00 21:31 49JetBlue 150 128 320 1013 JFK 18:25 21:35 50
5,857 PAX/day
2,139,269 PAX/yr
20160719 - Projected Gate Plot (LGB).xlsxProjected PAX Demand PAGE 1 OF 9
7/19/20163:17 PM

Feasibility Study for a Federal Inspection Service Facility at Long Beach Airport
Total Departures Dept Arvl
OutbSta Flt# Equip
SeatCapacity
SeatUtilization Airline
FROM LGB Load Factor 85%
1 6:40 8:09 PHX 5662 CRJ9 90 77 American2 7:00 8:20 OAK 756 737-700 148 126 Southwest3 7:00 8:15 OAK 148 320 150 128 JetBlue4 7:20 1:10 SLC 4643 CRJ9 90 77 Delta5 7:20 8:47 SFO 736 320 150 128 JetBlue6 8:05 13:05 PVR tbd 320 150 128 JetBlue7 8:05 13:40 MEX tbd 320 150 128 JetBlue8 8:25 13:18 AUS 1416 320 150 128 JetBlue9 8:30 11:08 SLC 232 320 150 128 JetBlue10 9:00 11:35 SEA 406 320 150 128 JetBlue
commuter 1 9:00 11:40 SLC tbd CRJ7 70 60 Delta11 9:20 16:10 CUN tbd 320 150 128 JetBlue12 9:45 tbd XXX tbd 320 150 128 JetBlue13 10:00 11:20 PHX 5854 CRJ9 90 77 American14 10:18 13:05 SLC 4644 CRJ9 90 77 Delta15 10:25 11:33 LAS 880 320 150 128 JetBlue16 10:30 11:50 OAK 1853 737-700 148 126 Southwest17 11:10 13:21 PDX 1522 320 150 128 JetBlue18 11:28 14:01 SEA 1006 320 150 128 JetBlue19 11:49 13:14 SFO 1636 320 150 128 JetBlue20 12:05 13:26 SMF 266 320 150 128 JetBlue21 12:15 13:30 RNO 42 320 150 128 JetBlue22 12:30 13:57 PHX 5685 CRJ9 90 77 American23 13:05 15:52 SLC 4589 CRJ9 90 77 Delta24 13:35 21:57 JFK 514 320 150 128 JetBlue25 14:15 15:35 OAK 1863 737-700 148 126 Southwest26 14:25 17:14 SJD tbd 320 150 128 JetBlue27 14:25 17:05 SLC 532 320 150 128 JetBlue28 15:20 17:32 PDX 1622 320 150 128 JetBlue29 15:20 tbd XXX tbd 320 150 128 JetBlue30 15:45 21:55 LIR tbd 320 150 128 JetBlue31 15:45 16:52 LAS 380 320 150 128 JetBlue
commuter 2 16:00 18:47 SLC tbd CRJ7 70 60 Delta32 16:18 17:38 SFO 1436 320 150 128 JetBlue33 16:30 17:37 LAS 280 320 150 128 JetBlue34 16:35 18:00 PHX 5698 CRJ9 90 77 American35 17:00 18:20 OAK 1788 737-700 148 126 Southwest36 17:30 18:43 OAK 348 320 150 128 JetBlue37 17:30 22:30 GDL tbd 320 150 128 JetBlue38 17:40 19:53 PDX 1822 320 150 128 JetBlue39 18:20 19:26 LAS 1980 320 150 128 JetBlue40 18:32 21:15 SLC 4723 CRJ9 90 77 Delta41 18:26 21:02 SEA 206 320 150 128 JetBlue42 19:02 12:25 MEM 1351 A300F crew crew FedEx43 19:19 20:33 OAK 448 320 150 128 JetBlue44 19:25 20:46 PHX 5616 CRJ9 90 77 American45 19:34 2:09 SDF 905 767 crew crew UPS46 19:55 21:01 LAS 1780 320 150 128 JetBlue
commuter 3 20:00 22:47 SLC tbd CRJ7 70 60 Delta47 20:30 1:22 AUS 216 320 150 128 JetBlue48 21:10 5:36 BOS 404 320 150 128 JetBlue49 21:30 22:49 SFO 2136 320 150 128 JetBlue50 21:32 5:49 JFK 14 320 150 128 JetBlue
4.3 5,857 PAX/day
MAP 2,139,269 PAX/yr
20160719 - Projected Gate Plot (LGB).xlsxProjected PAX Demand PAGE 2 OF 9
7/19/20163:17 PM

Feasibility Study for a Federal Inspection Service Facility at Long Beach Airport
Aircraft AirlineSeat
CapacitySeat
Utilization Equip Flt#InbSta Dept Arvl
TotalArrivals
Parking Load Factor 85% TO LGB
6 JetBlue 150 128 320 2135 SFO 6:15 7:35 15 JetBlue 150 128 320 217 AUS 7:10 8:04 22 Delta 70 60 CRJ7 tbd SLC 7:00 8:08 commuter 111 JetBlue 150 128 320 tbd GDL 7:00 8:35 33 American 90 77 CRJ9 5663 PHX 7:45 9:09 44 JetBlue 150 128 320 1121 PDX 7:15 9:36 52 Delta 90 77 CRJ9 4644 SLC 8:32 9:38 61 Southwest 148 126 737-700 972 OAK 8:35 10:00 76 JetBlue 150 128 320 1207 SEA 7:35 10:13 87 JetBlue 150 128 320 147 OAK 9:00 10:18 95 JetBlue 150 128 320 735 SFO 9:30 11:00 108 JetBlue 150 128 320 211 LAS 10:15 11:19 114 JetBlue 150 128 320 447 OAK 10:10 11:29 123 American 90 77 CRJ9 5661 PHX 10:35 11:55 132 Delta 90 77 CRJ9 4589 SLC 11:25 12:25 146 JetBlue 150 128 320 231 SLC 11:54 12:44 154 JetBlue 150 128 320 1435 SFO 11:59 13:27 1612 JetBlue 150 128 320 tbd LIR 8:35 13:40 171 Southwest 148 126 737-700 1024 OAK 12:20 13:45 185 JetBlue 150 128 320 213 JFK 11:32 14:20 1911 JetBlue 150 128 320 tbd XXX tbd 14:30 208 JetBlue 150 128 320 877 LAS 13:24 14:32 216 JetBlue 150 128 320 1007 SEA 12:20 14:58 2212 JetBlue 150 128 320 tbd PVR 14:00 15:00 232 Delta 70 60 CRJ7 tbd SLC 14:22 15:30 commuter 27 JetBlue 150 128 320 43 RNO 14:15 15:40 243 American 90 77 CRJ9 5619 PHX 14:35 15:55 258 JetBlue 150 128 320 1417 AUS 15:20 16:15 261 Southwest 148 126 737-700 18 OAK 15:05 16:30 274 JetBlue 150 128 320 1521 PDX 14:10 16:31 2811 JetBlue 150 128 320 tbd MEX 14:30 16:45 2912 JetBlue 150 128 320 tbd XXX tbd 17:30 306 JetBlue 150 128 320 379 LAS 16:25 17:31 31
TWY L UPS crew crew B763F 2908 SDF 16:10 17:35 325 JetBlue 150 128 320 407 SEA 15:00 17:40 33
TWY F FedEx crew crew A300F 1351 MEM 16:00 17:47 342 Delta 90 77 CRJ9 4723 SLC 17:00 18:04 353 American 90 77 CRJ9 5668 PHX 16:43 18:15 368 JetBlue 150 128 320 365 SMF 17:13 18:33 377 JetBlue 150 128 320 531 SLC 17:50 18:37 384 JetBlue 150 128 320 879 LAS 17:35 18:38 392 Delta 70 60 CRJ7 tbd SLC 18:22 19:30 commuter 35 JetBlue 150 128 320 1179 LAS 18:35 19:38 4011 JetBlue 150 128 320 tbd SJD 18:10 19:40 416 JetBlue 150 128 320 1635 SFO 18:20 19:43 4212 JetBlue 150 128 320 tbd CUN 16:50 20:15 439 JetBlue 150 128 320 1621 PDX 18:23 20:41 448 JetBlue 150 128 320 404 OAK 19:25 20:44 451 Southwest 148 126 737-700 2785 OAK 19:35 21:00 462 Delta 90 77 CRJ9 4639 SLC 20:15 21:17 475 JetBlue 150 128 320 405 BOS 18:00 21:18 483 American 90 77 CRJ9 5870 PHX 20:00 21:31 497 JetBlue 150 128 320 1013 JFK 18:25 21:35 50
5,857 PAX/day
2,139,269 PAX/yr
20160719 - Projected Gate Plot (LGB).xlsxPAX Distribution (North FIS) PAGE 3 OF 9
7/19/20163:17 PM

Feasibility Study for a Federal Inspection Service Facility at Long Beach Airport
Total Departures Dept Arvl
OutbSta Flt# Equip
SeatCapacity
SeatUtilization Airline Aircraft
FROM LGB Load Factor 85% Parking
1 6:40 8:09 PHX 5662 CRJ9 90 77 American 32 7:00 8:20 OAK 756 737-700 148 126 Southwest 13 7:00 8:15 OAK 148 320 150 128 JetBlue 74 7:20 1:10 SLC 4643 CRJ9 90 77 Delta 25 7:20 8:47 SFO 736 320 150 128 JetBlue 56 8:05 13:05 PVR tbd 320 150 128 JetBlue 97 8:05 13:40 MEX tbd 320 150 128 JetBlue 108 8:25 13:18 AUS 1416 320 150 128 JetBlue 69 8:30 11:08 SLC 232 320 150 128 JetBlue 410 9:00 11:35 SEA 406 320 150 128 JetBlue 5
commuter 1 9:00 11:40 SLC tbd CRJ7 70 60 Delta 211 9:20 16:10 CUN tbd 320 150 128 JetBlue 912 9:45 tbd XXX tbd 320 150 128 JetBlue 813 10:00 11:20 PHX 5854 CRJ9 90 77 American 314 10:18 13:05 SLC 4644 CRJ9 90 77 Delta 215 10:25 11:33 LAS 880 320 150 128 JetBlue 416 10:30 11:50 OAK 1853 737-700 148 126 Southwest 117 11:10 13:21 PDX 1522 320 150 128 JetBlue 718 11:28 14:01 SEA 1006 320 150 128 JetBlue 619 11:49 13:14 SFO 1636 320 150 128 JetBlue 520 12:05 13:26 SMF 266 320 150 128 JetBlue 821 12:15 13:30 RNO 42 320 150 128 JetBlue 422 12:30 13:57 PHX 5685 CRJ9 90 77 American 323 13:05 15:52 SLC 4589 CRJ9 90 77 Delta 224 13:35 21:57 JFK 514 320 150 128 JetBlue 625 14:15 15:35 OAK 1863 737-700 148 126 Southwest 126 14:25 17:14 SJD tbd 320 150 128 JetBlue 1027 14:25 17:05 SLC 532 320 150 128 JetBlue 428 15:20 17:32 PDX 1622 320 150 128 JetBlue 829 15:20 tbd XXX tbd 320 150 128 JetBlue 930 15:45 21:55 LIR tbd 320 150 128 JetBlue 1031 15:45 16:52 LAS 380 320 150 128 JetBlue 6
commuter 2 16:00 18:47 SLC tbd CRJ7 70 60 Delta 232 16:18 17:38 SFO 1436 320 150 128 JetBlue 533 16:30 17:37 LAS 280 320 150 128 JetBlue 734 16:35 18:00 PHX 5698 CRJ9 90 77 American 335 17:00 18:20 OAK 1788 737-700 148 126 Southwest 136 17:30 18:43 OAK 348 320 150 128 JetBlue 837 17:30 22:30 GDL tbd 320 150 128 JetBlue 938 17:40 19:53 PDX 1822 320 150 128 JetBlue 439 18:20 19:26 LAS 1980 320 150 128 JetBlue 640 18:32 21:15 SLC 4723 CRJ9 90 77 Delta 241 18:26 21:02 SEA 206 320 150 128 JetBlue 542 19:02 12:25 MEM 1351 A300F crew crew FedEx TWY F43 19:19 20:33 OAK 448 320 150 128 JetBlue 844 19:25 20:46 PHX 5616 CRJ9 90 77 American 345 19:34 2:09 SDF 905 767 crew crew UPS TWY L46 19:55 21:01 LAS 1780 320 150 128 JetBlue 7
commuter 3 20:00 22:47 SLC tbd CRJ7 70 60 Delta 247 20:30 1:22 AUS 216 320 150 128 JetBlue 548 21:10 5:36 BOS 404 320 150 128 JetBlue 849 21:30 22:49 SFO 2136 320 150 128 JetBlue 650 21:32 5:49 JFK 14 320 150 128 JetBlue 9
4.3 5,857 PAX/day
MAP 2,139,269 PAX/yr
20160719 - Projected Gate Plot (LGB).xlsxPAX Distribution (North FIS) PAGE 4 OF 9
7/19/20163:17 PM
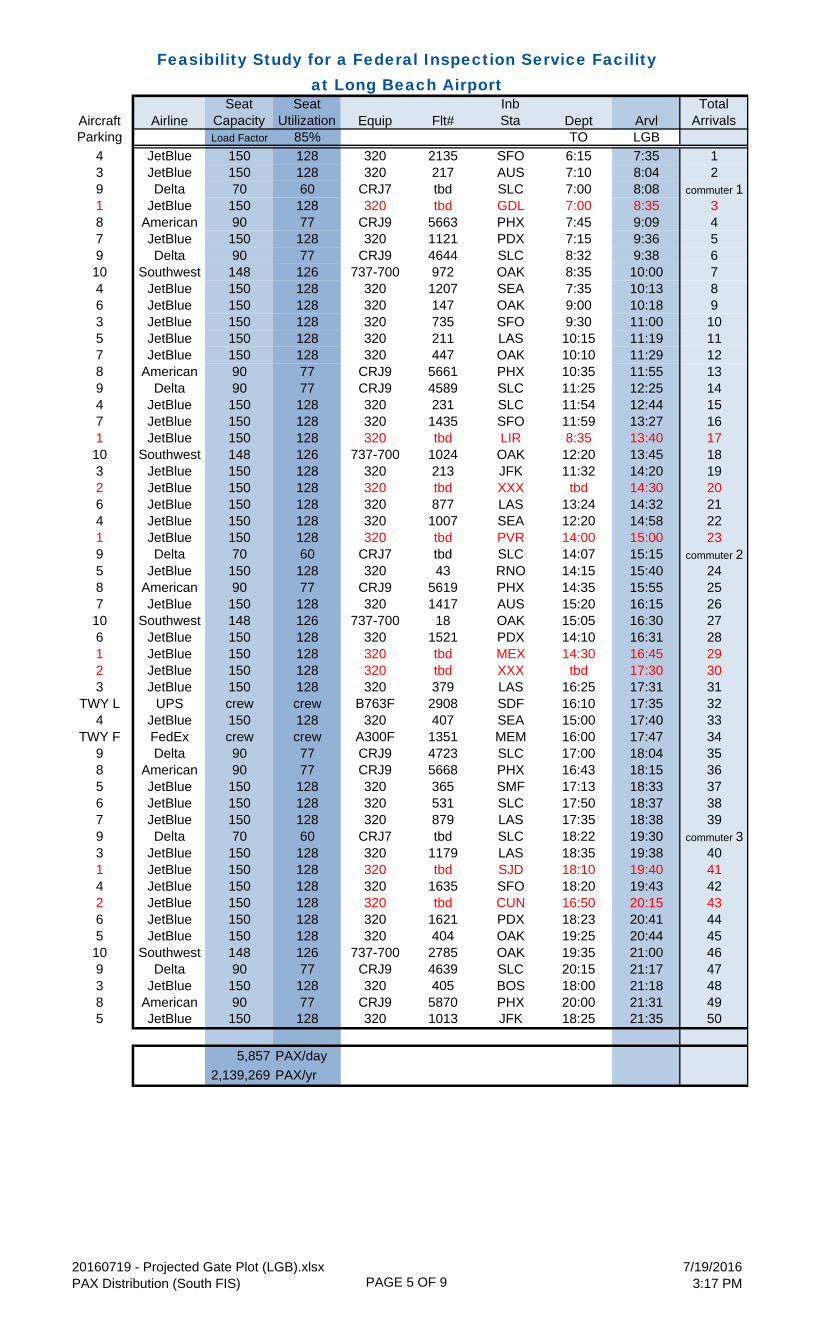
Feasibility Study for a Federal Inspection Service Facility at Long Beach Airport
Aircraft AirlineSeat
CapacitySeat
Utilization Equip Flt#InbSta Dept Arvl
TotalArrivals
Parking Load Factor 85% TO LGB
4 JetBlue 150 128 320 2135 SFO 6:15 7:35 13 JetBlue 150 128 320 217 AUS 7:10 8:04 29 Delta 70 60 CRJ7 tbd SLC 7:00 8:08 commuter 11 JetBlue 150 128 320 tbd GDL 7:00 8:35 38 American 90 77 CRJ9 5663 PHX 7:45 9:09 47 JetBlue 150 128 320 1121 PDX 7:15 9:36 59 Delta 90 77 CRJ9 4644 SLC 8:32 9:38 610 Southwest 148 126 737-700 972 OAK 8:35 10:00 74 JetBlue 150 128 320 1207 SEA 7:35 10:13 86 JetBlue 150 128 320 147 OAK 9:00 10:18 93 JetBlue 150 128 320 735 SFO 9:30 11:00 105 JetBlue 150 128 320 211 LAS 10:15 11:19 117 JetBlue 150 128 320 447 OAK 10:10 11:29 128 American 90 77 CRJ9 5661 PHX 10:35 11:55 139 Delta 90 77 CRJ9 4589 SLC 11:25 12:25 144 JetBlue 150 128 320 231 SLC 11:54 12:44 157 JetBlue 150 128 320 1435 SFO 11:59 13:27 161 JetBlue 150 128 320 tbd LIR 8:35 13:40 1710 Southwest 148 126 737-700 1024 OAK 12:20 13:45 183 JetBlue 150 128 320 213 JFK 11:32 14:20 192 JetBlue 150 128 320 tbd XXX tbd 14:30 206 JetBlue 150 128 320 877 LAS 13:24 14:32 214 JetBlue 150 128 320 1007 SEA 12:20 14:58 221 JetBlue 150 128 320 tbd PVR 14:00 15:00 239 Delta 70 60 CRJ7 tbd SLC 14:07 15:15 commuter 25 JetBlue 150 128 320 43 RNO 14:15 15:40 248 American 90 77 CRJ9 5619 PHX 14:35 15:55 257 JetBlue 150 128 320 1417 AUS 15:20 16:15 2610 Southwest 148 126 737-700 18 OAK 15:05 16:30 276 JetBlue 150 128 320 1521 PDX 14:10 16:31 281 JetBlue 150 128 320 tbd MEX 14:30 16:45 292 JetBlue 150 128 320 tbd XXX tbd 17:30 303 JetBlue 150 128 320 379 LAS 16:25 17:31 31
TWY L UPS crew crew B763F 2908 SDF 16:10 17:35 324 JetBlue 150 128 320 407 SEA 15:00 17:40 33
TWY F FedEx crew crew A300F 1351 MEM 16:00 17:47 349 Delta 90 77 CRJ9 4723 SLC 17:00 18:04 358 American 90 77 CRJ9 5668 PHX 16:43 18:15 365 JetBlue 150 128 320 365 SMF 17:13 18:33 376 JetBlue 150 128 320 531 SLC 17:50 18:37 387 JetBlue 150 128 320 879 LAS 17:35 18:38 399 Delta 70 60 CRJ7 tbd SLC 18:22 19:30 commuter 33 JetBlue 150 128 320 1179 LAS 18:35 19:38 401 JetBlue 150 128 320 tbd SJD 18:10 19:40 414 JetBlue 150 128 320 1635 SFO 18:20 19:43 422 JetBlue 150 128 320 tbd CUN 16:50 20:15 436 JetBlue 150 128 320 1621 PDX 18:23 20:41 445 JetBlue 150 128 320 404 OAK 19:25 20:44 4510 Southwest 148 126 737-700 2785 OAK 19:35 21:00 469 Delta 90 77 CRJ9 4639 SLC 20:15 21:17 473 JetBlue 150 128 320 405 BOS 18:00 21:18 488 American 90 77 CRJ9 5870 PHX 20:00 21:31 495 JetBlue 150 128 320 1013 JFK 18:25 21:35 50
5,857 PAX/day
2,139,269 PAX/yr
20160719 - Projected Gate Plot (LGB).xlsxPAX Distribution (South FIS) PAGE 5 OF 9
7/19/20163:17 PM

Feasibility Study for a Federal Inspection Service Facility at Long Beach Airport
Total Departures Dept Arvl
OutbSta Flt# Equip
SeatCapacity
SeatUtilization Airline Aircraft
FROM LGB Load Factor 85% Parking
1 6:40 8:09 PHX 5662 CRJ9 90 77 American 82 7:00 8:20 OAK 756 737-700 148 126 Southwest 103 7:00 8:15 OAK 148 320 150 128 JetBlue 54 7:20 1:10 SLC 4643 CRJ9 90 77 Delta 95 7:20 8:47 SFO 736 320 150 128 JetBlue 36 8:05 13:05 PVR tbd 320 150 128 JetBlue 17 8:05 13:40 MEX tbd 320 150 128 JetBlue 28 8:25 13:18 AUS 1416 320 150 128 JetBlue 49 8:30 11:08 SLC 232 320 150 128 JetBlue 710 9:00 11:35 SEA 406 320 150 128 JetBlue 3
commuter 1 9:00 11:40 SLC tbd CRJ7 70 60 Delta 911 9:20 16:10 CUN tbd 320 150 128 JetBlue 112 9:45 tbd XXX tbd 320 150 128 JetBlue 213 10:00 11:20 PHX 5854 CRJ9 90 77 American 814 10:18 13:05 SLC 4644 CRJ9 90 77 Delta 915 10:25 11:33 LAS 880 320 150 128 JetBlue 716 10:30 11:50 OAK 1853 737-700 148 126 Southwest 1017 11:10 13:21 PDX 1522 320 150 128 JetBlue 618 11:28 14:01 SEA 1006 320 150 128 JetBlue 419 11:49 13:14 SFO 1636 320 150 128 JetBlue 320 12:05 13:26 SMF 266 320 150 128 JetBlue 521 12:15 13:30 RNO 42 320 150 128 JetBlue 722 12:30 13:57 PHX 5685 CRJ9 90 77 American 823 13:05 15:52 SLC 4589 CRJ9 90 77 Delta 924 13:35 21:57 JFK 514 320 150 128 JetBlue 425 14:15 15:35 OAK 1863 737-700 148 126 Southwest 1026 14:25 17:14 SJD tbd 320 150 128 JetBlue 127 14:25 17:05 SLC 532 320 150 128 JetBlue 728 15:20 17:32 PDX 1622 320 150 128 JetBlue 629 15:20 tbd XXX tbd 320 150 128 JetBlue 230 15:45 21:55 LIR tbd 320 150 128 JetBlue 131 15:45 16:52 LAS 380 320 150 128 JetBlue 4
commuter 2 16:00 18:47 SLC tbd CRJ7 70 60 Delta 932 16:18 17:38 SFO 1436 320 150 128 JetBlue 333 16:30 17:37 LAS 280 320 150 128 JetBlue 534 16:35 18:00 PHX 5698 CRJ9 90 77 American 835 17:00 18:20 OAK 1788 737-700 148 126 Southwest 1036 17:30 18:43 OAK 348 320 150 128 JetBlue 737 17:30 22:30 GDL tbd 320 150 128 JetBlue 138 17:40 19:53 PDX 1822 320 150 128 JetBlue 639 18:20 19:26 LAS 1980 320 150 128 JetBlue 340 18:32 21:15 SLC 4723 CRJ9 90 77 Delta 941 18:26 21:02 SEA 206 320 150 128 JetBlue 442 19:02 12:25 MEM 1351 A300F crew crew FedEx TWY F43 19:19 20:33 OAK 448 320 150 128 JetBlue 544 19:25 20:46 PHX 5616 CRJ9 90 77 American 845 19:34 2:09 SDF 905 767 crew crew UPS TWY L46 19:55 21:01 LAS 1780 320 150 128 JetBlue 6
commuter 3 20:00 22:47 SLC tbd CRJ7 70 60 Delta 947 20:30 1:22 AUS 216 320 150 128 JetBlue 348 21:10 5:36 BOS 404 320 150 128 JetBlue 549 21:30 22:49 SFO 2136 320 150 128 JetBlue 450 21:32 5:49 JFK 14 320 150 128 JetBlue 6
4.3 5,857 PAX/day
MAP 2,139,269 PAX/yr
20160719 - Projected Gate Plot (LGB).xlsxPAX Distribution (South FIS) PAGE 6 OF 9
7/19/20163:17 PM

Feasibility Study for a Federal Inspection Service Facility at Long Beach Airport
pad 1 FL FL0700 A1000 D1030 A1345 D1415 A1630 D1700 RON 2100
pad 2 FL FL0720 A0943 D1018 A1225 D1305 A1804 D1840 RON 2117
pad 3 FL FL0645 A0906 D1000 A1157 D1230 A1549 D1635 A1807 D1925 RON 2117
pad 4
pad 5 FL FL0720 A0804 D0900 A0936 D1025 A1100 D1149 A1244 D1335 A1420 D1511 A1531 D1618 A1631 D1740 A1833 D1919 A1938 D2030 RON2118
pad 6 A0734 D0820 A1013 D1128 A1327 D1425 A1458 D1545 A1555 D1705 A1740 D1826 A1838 D1930 A1943 D2130
pad 7 FL FL 0700 A0723 D0830 A1018 D1110 A1119 D1205 A1432 D1520 A1540 D1630 A1731 D1820 A1837 D1955 A2019 D2110 RON 2135
pad 8 A0721 D0814 A1129 D1215 A2041 D2132
pad 9
pad 10
pad 11
Remote
American Airlines Delta Air Lines JetBlue Airways Southwest Airlines
23:0016:009:00 10:00 19:00 20:0017:00 18:00
Long Beach Airport JUL 2016 Flight Schedule, JetBlue Airways June Gate Plot
Source:
EXISTING GATE PLOT - LONG BEACH AIRPORT JULY 2016
5:00 6:00 7:00 8:00 21:00 22:0011:00 12:00 13:00 14:00 15:00
20160719 - Projected Gate Plot (LGB).xlsxExisting Gate Plot (JUL 2016) PAGE 7 OF 9
7/19/20163:17 PM

Feasibility Study for a Federal Inspection Service Facility at Long Beach Airport
pad 1 FL FL0700 A1000 D1030 A1345 D1415 A1630 D1700 RON 2100
pad 2 FL FL0720 A0808 D0900 A0938 D1018 A1225 D1305 A1530 D1600 A1804 D1832 A1930 D2000 RON 2117
pad 3 FL FL0640 A0909 D1000 A1155 D1230 A1555 D1635 A1815 D1925 RON 2131
pad 4 FL FL0830 A0936 D1025 A1129 D1215 A1327 D1425 A1631 D1740 RON1838
pad 5 FL FL0720 A0804 D0900 A1100 D1149 A1420 D1618 A1740 D1826 A1938 D2030 RON2118
pad 6 A0735 D0825 A1013 D1128 A1244 D1335 A1458 D1545 A1731 D1820 A1943 D2130
pad 7 FL FL0700 A1018 D1110 A1540 D1630 A1837 D1955 RON 2135
pad 8 FL FL0945 A1119 D1205 A1432 D1520 A1615 D1730 A1833 D1919 A2044 D2110 REPOSITION TO RON
pad 9 FL FL0805 D0920 D1520 D1730 A2041 D2132 REPOSITION TO RON
pad 10 FL FL0805 D1425 D1545 REPOSITION TO RON
pad 11 A0835 A1430 A1645 A1940
pad 12 A1340 A1500 A1730 A2015
Remote
American Airlines Delta Air Lines JetBlue Airways Southwest Airlines International Arrivals & Departures
PROJECTED GATE PLOT: FEDERAL INSPECTION SERVICES (FIS) FACILITY - NORTH ALTERNATIVE (OPTION 1)
5:00 6:00 7:00 8:00 9:00 10:00 11:00 12:00 22:00 23:00
Source: LaCosta Consulting Group, Market Analysis
19:00 20:00 21:0013:00 14:00 15:00 16:00 17:00 18:00
20160719 - Projected Gate Plot (LGB).xlsxGate Plot (North FIS) PAGE 8 OF 9
7/19/20163:17 PM

Feasibility Study for a Federal Inspection Service Facility at Long Beach Airport
pad 1 FL FL0805 A0835 D0920 A1340 D1425 A1500 D1545 A1645 D1730 RON1940
pad 2 FL FL0805 FL0945 A1430 D1520 A1730 RON2015
pad 3 FL FL0720 A0804 D0900 A1100 D1149 A1420 D1618 A1731 D1820 A1938 D2030 RON2118
pad 4 A0735 D0825 A1013 D1128 A1244 D1335 A1458 D1545 A1740 D1826 A1943 D2130
pad 5 FL FL 0700 A1119 D1205 A1540 D1630 A1833 D1919 A2044 D2110 RON 2135
pad 6 A1018 D1110 A1432 D1520 A1631 D1740 A1837 D1955 A2041 D2132
pad 7 FL FL0830 A0936 D1025 A1129 D1215 A1327 D1425 A1615 D1730 RON 1838
pad 8 FL FL0640 A0909 D1000 A1155 D1230 A1555 D1635 A1815 D1925 RON 2131
pad 9 FL FL0720 A0808 D0900 A0938 D1018 A1225 D1305 A1515 D1600 A1804 D1832 A1930 D2000 RON 2117
pad 10 FL FL0700 A1000 D1030 A1345 D1415 A1630 D1700 RON 2100
pad 11 FL REPOSITION TO RON
Remote
American Airlines Delta Air Lines JetBlue Airways Southwest Airlines International Arrivals & Departures
PROJECTED GATE PLOT: FEDERAL INSPECTION SERVICES (FIS) FACILITY - SOUTH ALTERNATIVE (OPTIONS 2&3)
5:00 6:00 7:00 8:00 9:00 10:00 11:00 12:00 22:00 23:00
Source: LaCosta Consulting Group, Market Analysis
19:00 20:00 21:0013:00 14:00 15:00 16:00 17:00 18:00
20160719 - Projected Gate Plot (LGB).xlsxGate Plot (South FIS) PAGE 9 OF 9
7/19/20163:17 PM
Page 1
Quality Counts Background: Quality Counts is a full-service transportation data collection firm headquartered in Tigard, Oregon, with
additional offices in: Tampa, FL; Baton Rouge, LA; Houston, TX; Charlotte, NC; Vienna, VA; Chicago, IL,
Philadelphia, PA; and Walnut Creek, CA. In addition to our fully staffed offices, we also have staffed
locations where trained field technicians and a solid equipment base are available in: Honolulu, HI;
Detroit, MI; Minneapolis-St Paul, MN; and Bismarck, ND among others.
Our projects and clients – both public and private – have given us extensive experience in the business
of transportation data collection nationwide. Across the country QC holds continuing contracts with
several state Departments of Transportation, Councils of Governments, Regional Planning Councils,
Counties, and Cities of varying sizes. Our data, in addition to being trusted for use at the planning level,
is also used for projects performed for the National Cooperative Highway Research Program (NCHRP).
Our parent company, Kittelson and Associates, Inc., is a nationally recognized engineering firm that’s
been in business for nearly 30 years. Since its inception in 2003, QC has conducted over 65,000 turning
movement counts, 25,000 tube counts, 1,900 travel time surveys, and over 1,000 13-vehicle
classification studies, along with thousands of hours of specialized studies including: Pedestrian Volume
& Movement Counts, Bicycle Counts, Origin-Destination Surveys, Travel-Time Surveys, Vehicular Gap
Studies, Radar Speed Surveys, Queue Length Surveys, Parking Demand/Supply Surveys, and many
others.
We provide service to a wide range of consulting engineering firms, colleges, jurisdictions,
municipalities, and developers, including the following subset of our client list:
AECOM DKS Associates Caltrans Fehr & Peers Cambridge Systematics Kimley-Horn and Associates CH2M Hill Washington County, OR City of Pleasanton, California Parsons Brinckerhoff County of San Mateo Port of Portland
QC combines leading-edge technology with traditional transportation data collection techniques to
ensure the most accurate and efficient data collection procedures. Whether clients require video or
Wavetronix radar data collection options, traditional tube counts, or unique data collection procedures,
QC has proven itself reliable time and time again. QC also features a convenient a convenient on-line
ordering and database system (see www.qualitycounts.net). Utilizing an internally-developed online
data warehouse, QC provides individuals with access to all of their data reports anytime with multiple
formatting options.

Page 2
ADT Tube Counts:
If you’ve been driving for any length of time, you’ve no doubt driven over one of those black strips of
tube stretched across the road. These small rubber hoses are used to measure the number of cars
traveling a particular stretch of roadway over a given period – usually 24 hours. They’re closed on one
end and are held down by ropes tied to nails on the ground. The other end is plugged into a device
called a counter (Jamar Apollyon). Finally, gorilla tape were used to keep the tubes from excessively
moving. When the wheel of a car hits the tube, the pressure creates a pneumatic (air) pulse, which is
measured by the counter. We call these “hits”. The counter records each individual hit with a
timestamp; this information is later used to create reports about the number, type and speed of the
vehicles using a stretch of roadway. QC field staff members are tasked with the proper deployment of
our tube equipment which may be beneficial to the engineers working on the project. For this project,
we utilized two road tubes per segment, using one of them as a back up. There were a total of 16
locations that were conducted using tube counts to collect data. These locations are indicated by the
blue and purple pins on the map below (Fig. 1). Our tube counts will generally meet the following
requirements:
1. Conducted on a midnight to midnight, 24-hour basis
2. Bi-directional
3. Conducted on Tuesday, Wednesday, or Thursday except holidays
4. No counts will be collected during adverse weather conditions.
5. No traffic counting will be allowed on City or School holidays.
6. Counts may be submitted in hard copy form and in electronic format (Excel (.xls) and Adobe
Acrobat (.pdf)).
Fig. 1 - Long Beach Airport Map:

Page 3
Work Zone Specifications:
Having conducted tens of thousands of road tube counts while servicing our government contracts and
private sector clientele, QC has developed a great deal of expertise in these studies. We have fine-tuned
our system to minimize the risks to both our staff and the public at large, while maximizing the accuracy
of our counts.
Each set up will take no longer than 15 minutes. QC will not impede traffic in any way, but we will need
to be parked on an accessible parking lot or the shoulder of the road (or nearby if applicable) during
installations and take downs. Tape and road nails will be used to safely secure the road tubes to
roads. For safety reasons, and to prevent the equipment from coming loose, QC will make sure our
equipment is as secure as possible. The machine traffic counter will be placed well off the roadway
attached to a sign or post with a chain and lock. The field technicians will be wearing reflective vests,
hard hats and safety goggles. Reflective cones will also be used to surround the work zone out of traffic
flow. We will use a flashing beacon light on top of our work vehicle. It will be parked as far off the
roadway as possible during installation and takedown (Fig. 2). All fieldwork will be conducted during
non-peak traffic hours.

Page 4
Fig. 2 - Traffic Control Plan:
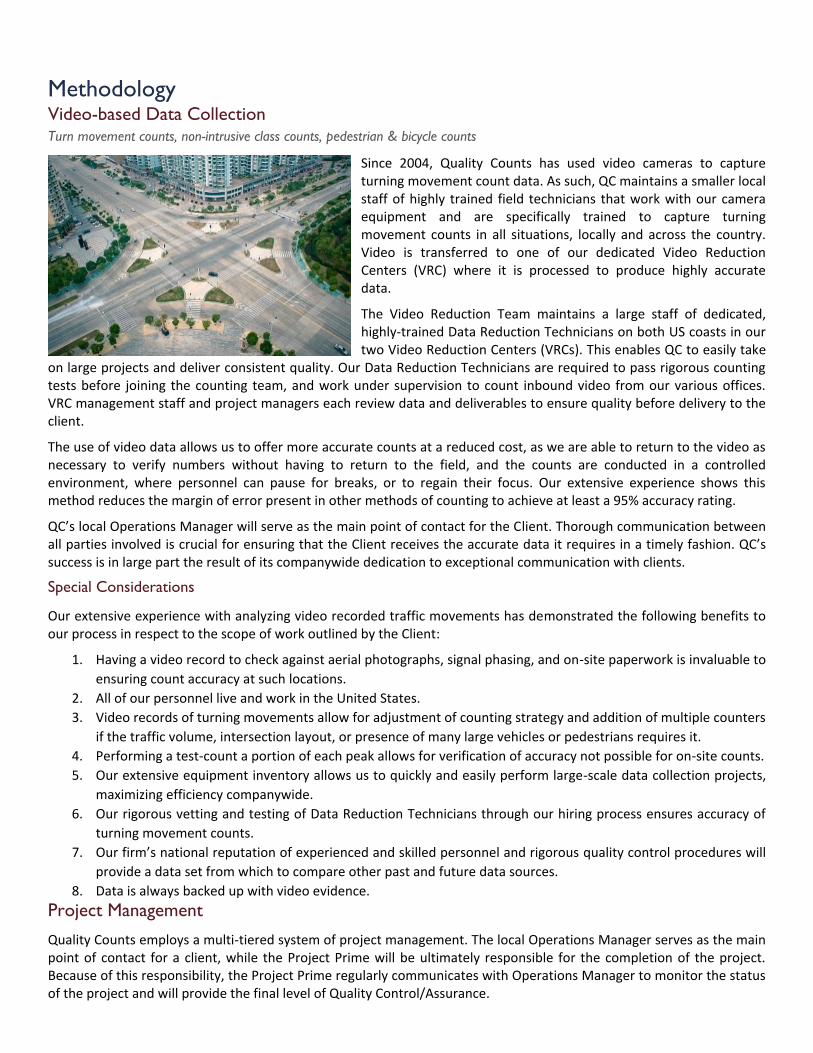
Methodology Video-based Data Collection Turn movement counts, non-intrusive class counts, pedestrian & bicycle counts
Since 2004, Quality Counts has used video cameras to capture turning movement count data. As such, QC maintains a smaller local staff of highly trained field technicians that work with our camera equipment and are specifically trained to capture turning movement counts in all situations, locally and across the country. Video is transferred to one of our dedicated Video Reduction Centers (VRC) where it is processed to produce highly accurate data.
The Video Reduction Team maintains a large staff of dedicated, highly-trained Data Reduction Technicians on both US coasts in our two Video Reduction Centers (VRCs). This enables QC to easily take
on large projects and deliver consistent quality. Our Data Reduction Technicians are required to pass rigorous counting tests before joining the counting team, and work under supervision to count inbound video from our various offices. VRC management staff and project managers each review data and deliverables to ensure quality before delivery to the client.
The use of video data allows us to offer more accurate counts at a reduced cost, as we are able to return to the video as necessary to verify numbers without having to return to the field, and the counts are conducted in a controlled environment, where personnel can pause for breaks, or to regain their focus. Our extensive experience shows this method reduces the margin of error present in other methods of counting to achieve at least a 95% accuracy rating.
QC’s local Operations Manager will serve as the main point of contact for the Client. Thorough communication between all parties involved is crucial for ensuring that the Client receives the accurate data it requires in a timely fashion. QC’s success is in large part the result of its companywide dedication to exceptional communication with clients.
Special Considerations
Our extensive experience with analyzing video recorded traffic movements has demonstrated the following benefits to our process in respect to the scope of work outlined by the Client:
1. Having a video record to check against aerial photographs, signal phasing, and on-site paperwork is invaluable to
ensuring count accuracy at such locations.
2. All of our personnel live and work in the United States.
3. Video records of turning movements allow for adjustment of counting strategy and addition of multiple counters
if the traffic volume, intersection layout, or presence of many large vehicles or pedestrians requires it.
4. Performing a test-count a portion of each peak allows for verification of accuracy not possible for on-site counts.
5. Our extensive equipment inventory allows us to quickly and easily perform large-scale data collection projects,
maximizing efficiency companywide.
6. Our rigorous vetting and testing of Data Reduction Technicians through our hiring process ensures accuracy of
turning movement counts.
7. Our firm’s national reputation of experienced and skilled personnel and rigorous quality control procedures will
provide a data set from which to compare other past and future data sources.
8. Data is always backed up with video evidence.
Project Management
Quality Counts employs a multi-tiered system of project management. The local Operations Manager serves as the main point of contact for a client, while the Project Prime will be ultimately responsible for the completion of the project. Because of this responsibility, the Project Prime regularly communicates with Operations Manager to monitor the status of the project and will provide the final level of Quality Control/Assurance.

Operations Managers review all locations, map the locations using Google Maps, and then schedule counts based on availability of valid counting days, equipment, and staff with respect to the project deadline. It is standard practice to design equipment deployment routes in a manner that maximizes efficiency, and reduces the potential impact on local traffic. These routes are then reviewed with the Field Technician(s) who will be deploying equipment. Technicians are equipped with a map, detailed written instructions, and internal data collection/tracking forms for each location.
Under the direction of an Operations Manager, Technicians prepare and test equipment, verifying timestamps, lens cleanliness, battery voltage, and proper equipment functioning before performing traffic data collection. Each location has a count-specific coversheet we call the Turn/Tube Counter’s Checklist, or TCCL (see figure 1), used to record details of the location and ensure effective internal project tracking. Preliminary information is added to the TCCL at the office. Once in the field, technicians create a graphic lane diagram of the intersection, noting any traffic control measures, speed limits, and land uses for reference.
The TCCL is sent to the VRC along with the collected video footage where it is used in project tracking and the quality control process.
Video Collection
After receiving the list of locations to be counted, QC Operations Managers will begin the preparation process to collect the requested data. Operations Managers will:
1. Map all locations using our online mapping and project management tools.
2. Review each location remotely using Google Street View.
3. Determine equipment requirements and optimal camera placements.
4. Prepare count-specific paperwork for project tracking.
5. Design optimal fieldwork routes.
6. Schedule video collection.
7. Notify the Video Reduction Center of anticipated schedule.
Project managers then communicate thoroughly with Field Technicians, providing them with printed maps of their routes, the requisite paperwork for each site, explanations of the project, and equipment requirements. Prior to leaving the office, Technicians prepare the required equipment bringing spare equipment with them to ensure efficient response in the event of unforeseen complications.
All vehicles used for traffic data collection will be equipped with a high-intensity roof-mounted strobe light which shall be activated as the traffic count vehicle approaches the work site. All Field Technicians shall wear high-visibility safety apparel that meets Performance Class 3 requirements of the ANSI/ISEA 107-2010 and safety glasses during field operations.
Figure 1
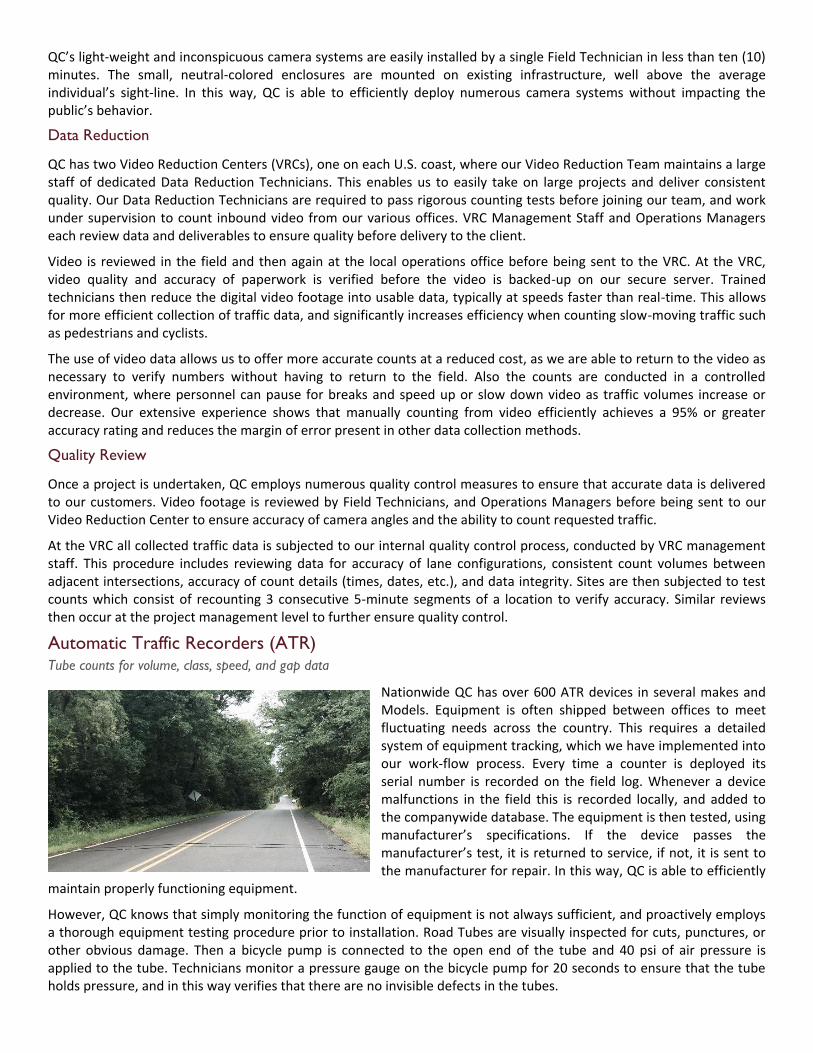
QC’s light-weight and inconspicuous camera systems are easily installed by a single Field Technician in less than ten (10) minutes. The small, neutral-colored enclosures are mounted on existing infrastructure, well above the average individual’s sight-line. In this way, QC is able to efficiently deploy numerous camera systems without impacting the public’s behavior.
Data Reduction
QC has two Video Reduction Centers (VRCs), one on each U.S. coast, where our Video Reduction Team maintains a large staff of dedicated Data Reduction Technicians. This enables us to easily take on large projects and deliver consistent quality. Our Data Reduction Technicians are required to pass rigorous counting tests before joining our team, and work under supervision to count inbound video from our various offices. VRC Management Staff and Operations Managers each review data and deliverables to ensure quality before delivery to the client.
Video is reviewed in the field and then again at the local operations office before being sent to the VRC. At the VRC, video quality and accuracy of paperwork is verified before the video is backed-up on our secure server. Trained technicians then reduce the digital video footage into usable data, typically at speeds faster than real-time. This allows for more efficient collection of traffic data, and significantly increases efficiency when counting slow-moving traffic such as pedestrians and cyclists.
The use of video data allows us to offer more accurate counts at a reduced cost, as we are able to return to the video as necessary to verify numbers without having to return to the field. Also the counts are conducted in a controlled environment, where personnel can pause for breaks and speed up or slow down video as traffic volumes increase or decrease. Our extensive experience shows that manually counting from video efficiently achieves a 95% or greater accuracy rating and reduces the margin of error present in other data collection methods.
Quality Review
Once a project is undertaken, QC employs numerous quality control measures to ensure that accurate data is delivered to our customers. Video footage is reviewed by Field Technicians, and Operations Managers before being sent to our Video Reduction Center to ensure accuracy of camera angles and the ability to count requested traffic.
At the VRC all collected traffic data is subjected to our internal quality control process, conducted by VRC management staff. This procedure includes reviewing data for accuracy of lane configurations, consistent count volumes between adjacent intersections, accuracy of count details (times, dates, etc.), and data integrity. Sites are then subjected to test counts which consist of recounting 3 consecutive 5-minute segments of a location to verify accuracy. Similar reviews then occur at the project management level to further ensure quality control.
Automatic Traffic Recorders (ATR) Tube counts for volume, class, speed, and gap data
Nationwide QC has over 600 ATR devices in several makes and Models. Equipment is often shipped between offices to meet fluctuating needs across the country. This requires a detailed system of equipment tracking, which we have implemented into our work-flow process. Every time a counter is deployed its serial number is recorded on the field log. Whenever a device malfunctions in the field this is recorded locally, and added to the companywide database. The equipment is then tested, using manufacturer’s specifications. If the device passes the manufacturer’s test, it is returned to service, if not, it is sent to the manufacturer for repair. In this way, QC is able to efficiently
maintain properly functioning equipment.
However, QC knows that simply monitoring the function of equipment is not always sufficient, and proactively employs a thorough equipment testing procedure prior to installation. Road Tubes are visually inspected for cuts, punctures, or other obvious damage. Then a bicycle pump is connected to the open end of the tube and 40 psi of air pressure is applied to the tube. Technicians monitor a pressure gauge on the bicycle pump for 20 seconds to ensure that the tube holds pressure, and in this way verifies that there are no invisible defects in the tubes.
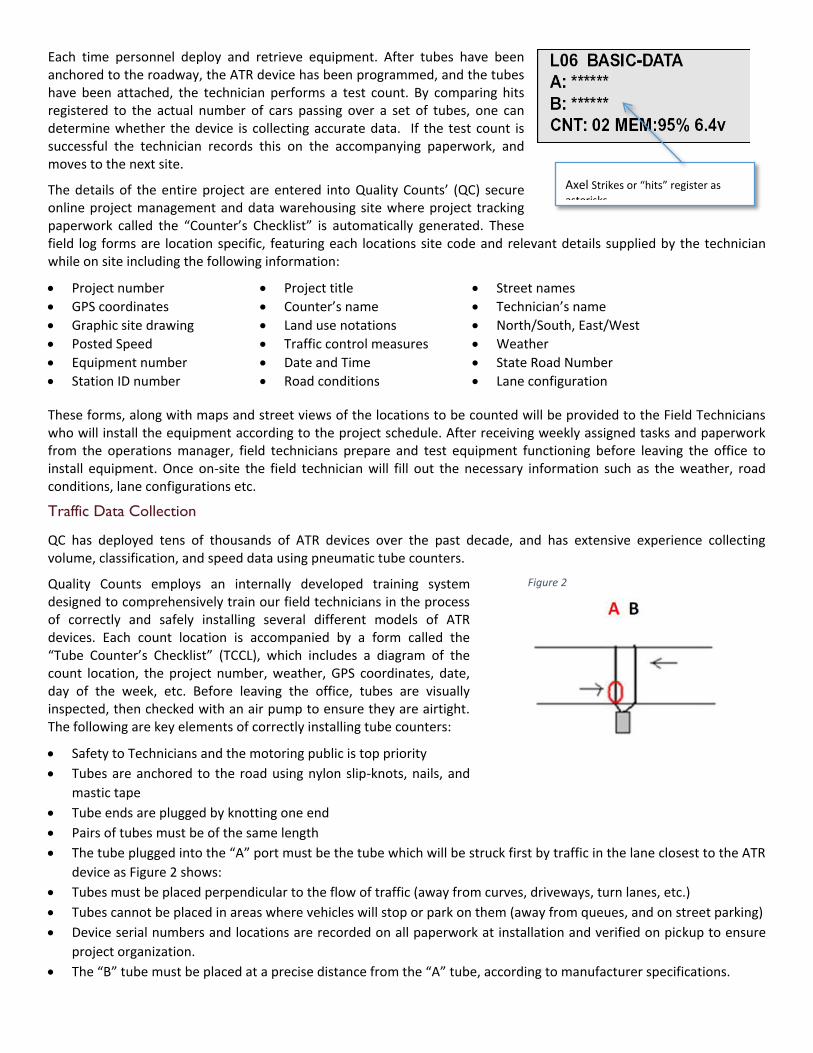
Each time personnel deploy and retrieve equipment. After tubes have been anchored to the roadway, the ATR device has been programmed, and the tubes have been attached, the technician performs a test count. By comparing hits registered to the actual number of cars passing over a set of tubes, one can determine whether the device is collecting accurate data. If the test count is successful the technician records this on the accompanying paperwork, and moves to the next site.
The details of the entire project are entered into Quality Counts’ (QC) secure online project management and data warehousing site where project tracking paperwork called the “Counter’s Checklist” is automatically generated. These field log forms are location specific, featuring each locations site code and relevant details supplied by the technician while on site including the following information:
Project number Project title Street names
GPS coordinates Counter’s name Technician’s name
Graphic site drawing Land use notations North/South, East/West
Posted Speed Traffic control measures Weather
Equipment number Date and Time State Road Number
Station ID number Road conditions Lane configuration
These forms, along with maps and street views of the locations to be counted will be provided to the Field Technicians who will install the equipment according to the project schedule. After receiving weekly assigned tasks and paperwork from the operations manager, field technicians prepare and test equipment functioning before leaving the office to install equipment. Once on-site the field technician will fill out the necessary information such as the weather, road conditions, lane configurations etc.
Traffic Data Collection
QC has deployed tens of thousands of ATR devices over the past decade, and has extensive experience collecting volume, classification, and speed data using pneumatic tube counters.
Quality Counts employs an internally developed training system designed to comprehensively train our field technicians in the process of correctly and safely installing several different models of ATR devices. Each count location is accompanied by a form called the “Tube Counter’s Checklist” (TCCL), which includes a diagram of the count location, the project number, weather, GPS coordinates, date, day of the week, etc. Before leaving the office, tubes are visually inspected, then checked with an air pump to ensure they are airtight. The following are key elements of correctly installing tube counters:
Safety to Technicians and the motoring public is top priority
Tubes are anchored to the road using nylon slip-knots, nails, and
mastic tape
Tube ends are plugged by knotting one end
Pairs of tubes must be of the same length
The tube plugged into the “A” port must be the tube which will be struck first by traffic in the lane closest to the ATR
device as Figure 2 shows:
Tubes must be placed perpendicular to the flow of traffic (away from curves, driveways, turn lanes, etc.)
Tubes cannot be placed in areas where vehicles will stop or park on them (away from queues, and on street parking)
Device serial numbers and locations are recorded on all paperwork at installation and verified on pickup to ensure
project organization.
The “B” tube must be placed at a precise distance from the “A” tube, according to manufacturer specifications.
Figure 2
Axel Strikes or “hits” register as
asterisks.
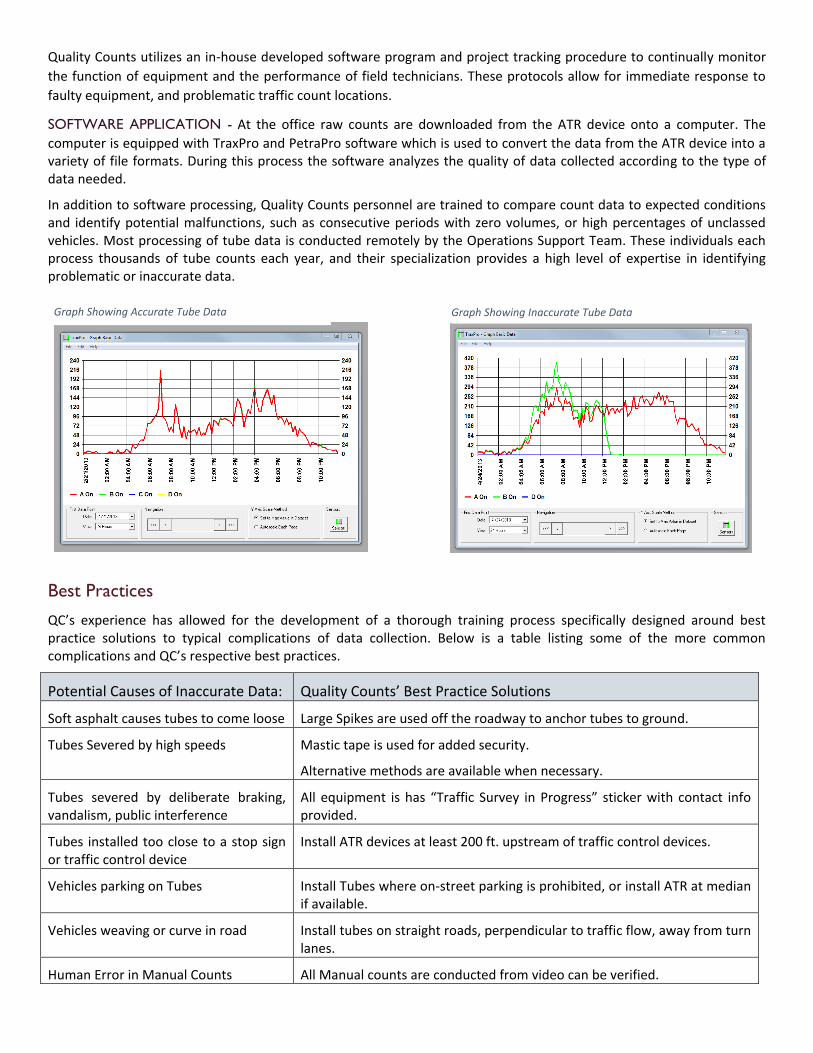
Quality Counts utilizes an in-house developed software program and project tracking procedure to continually monitor
the function of equipment and the performance of field technicians. These protocols allow for immediate response to
faulty equipment, and problematic traffic count locations.
SOFTWARE APPLICATION - At the office raw counts are downloaded from the ATR device onto a computer. The
computer is equipped with TraxPro and PetraPro software which is used to convert the data from the ATR device into a variety of file formats. During this process the software analyzes the quality of data collected according to the type of data needed.
In addition to software processing, Quality Counts personnel are trained to compare count data to expected conditions and identify potential malfunctions, such as consecutive periods with zero volumes, or high percentages of unclassed vehicles. Most processing of tube data is conducted remotely by the Operations Support Team. These individuals each process thousands of tube counts each year, and their specialization provides a high level of expertise in identifying problematic or inaccurate data.
Best Practices
QC’s experience has allowed for the development of a thorough training process specifically designed around best practice solutions to typical complications of data collection. Below is a table listing some of the more common complications and QC’s respective best practices.
Potential Causes of Inaccurate Data: Quality Counts’ Best Practice Solutions
Soft asphalt causes tubes to come loose Large Spikes are used off the roadway to anchor tubes to ground.
Tubes Severed by high speeds Mastic tape is used for added security.
Alternative methods are available when necessary.
Tubes severed by deliberate braking, vandalism, public interference
All equipment is has “Traffic Survey in Progress” sticker with contact info provided.
Tubes installed too close to a stop sign or traffic control device
Install ATR devices at least 200 ft. upstream of traffic control devices.
Vehicles parking on Tubes Install Tubes where on-street parking is prohibited, or install ATR at median if available.
Vehicles weaving or curve in road Install tubes on straight roads, perpendicular to traffic flow, away from turn lanes.
Human Error in Manual Counts All Manual counts are conducted from video can be verified.
Graph Showing Accurate Tube Data Graph Showing Inaccurate Tube Data

Sun glare compromises video Cameras angled to limit horizon view, or pointed north.
Water on lens (weather) Rain-X coating on lens, rain guard shield on lens.
Malfunctioning equipment Test counts are conducted on-site.
Bluetooth Devices too close to each other
Recommended 0.5 miles between units.
Table 1: potential causes of inaccurate traffic data and QC’s best practices response
Accuracy
Quality Counts employs numerous quality assurance practices when conducting traffic studies, a typical project follows the initial quality assurance procedure displayed in figure 2.
The most efficient way to ensure the collection of accurate traffic data is by employing best practices when planning and conducting a traffic count project. QC’s twelve years of nationwide experience has provided many opportunities to fine-tune our methodologies and best practices to ensure efficient collection of accurate traffic data. Table 1 summarizes many of the most common complications of data collection and quality counts solutions to avoid these problems.
Accuracy of count data must be verified even when best practices are used.
The final verification process of data is a comparison of simultaneous adjacent locations. Data is manually reviewed by Senior Operations Manager to ensure that data is consistent with typical traffic patterns and data at adjacent locations. When historical data is available, QC quality control personnel also have extensive experience comparing historical counts to collected data as an additional level of quality assurance.
Preliminary
•Determine Appropriate Equipment & Methodology
•Instruct Field Technicians in Safety Precautions
Installation
•On-site Inspection of Conditions
•Installation of Equipment Using Best Practices
•Preliminary Test Count, or digital verification
Verification
•Final Test Count at Removal, or digital verification
•Digital Validation of Collected Data
•Manual Verification of Data
Figure 2: QC’s initial quality assurance practices

cmirabueno
Typewriter
1
cmirabueno
Typewriter
9
cmirabueno
Typewriter
2
cmirabueno
Typewriter
3
cmirabueno
Typewriter
4
cmirabueno
Typewriter
5
cmirabueno
Typewriter
6
cmirabueno
Typewriter
7
cmirabueno
Typewriter
10
cmirabueno
Typewriter
11
cmirabueno
Typewriter
12
cmirabueno
Typewriter
13
cmirabueno
Typewriter
14
cmirabueno
Typewriter
15
cmirabueno
Typewriter
cmirabueno
Typewriter
20
cmirabueno
Typewriter
21

Type of peak hour being reported: Intersection Peak Method for determining peak hour: Total Entering Volume
Report generated on 5/25/2016 2:30 PM SOURCE: Quality Counts, LLC (http://www.qualitycounts.net) 1-877-580-2212
LOCATION: N Lakewood Blvd -- E Wardlow Rd QC JOB #: 13777701CITY/STATE: Long Beach, CA DATE: Tue, May 17 2016
15-Min CountPeriod
Beginning At
N Lakewood Blvd(Northbound)
N Lakewood Blvd(Southbound)
E Wardlow Rd(Eastbound)
E Wardlow Rd(Westbound)
Total HourlyTotals
Left Thru Right U Left Thru Right U Left Thru Right U Left Thru Right U7:00 AM 66 250 9 16 28 275 13 2 7 7 1 0 57 21 52 0 804
7:15 AM 70 332 21 11 49 302 9 1 6 3 1 1 104 23 47 0 9807:30 AM 52 311 37 11 68 344 16 0 10 3 4 1 121 25 61 0 1064
7:45 AM 60 421 25 7 46 328 16 1 13 4 2 0 113 28 62 0 1126 39748:00 AM 51 282 18 6 29 291 15 2 13 7 2 0 99 21 73 0 909 40798:15 AM 55 344 21 5 35 314 17 0 11 2 3 0 78 20 56 0 961 40608:30 AM 44 316 36 6 37 291 23 3 15 5 1 0 61 14 68 0 920 39168:45 AM 83 301 27 10 29 244 12 1 8 4 1 0 66 36 60 0 882 3672
Peak 15-Min Northbound Southbound Eastbound WestboundTotalFlowrates Left Thru Right U Left Thru Right U Left Thru Right U Left Thru Right U
All Vehicles 240 1684 100 28 184 1312 64 4 52 16 8 0 452 112 248 0 4504Heavy Trucks 28 20 0 0 36 0 4 0 0 4 0 0 92Pedestrians 4 0 0 0 4
Bicycles 0 1 0 0 5 0 0 0 0 0 0 0 6Railroad
Stopped Buses
Comments:
Peak-Hour: 7:15 AM -- 8:15 AMPeak 15-Min: 7:45 AM -- 8:00 AM
268 1346 101
196126556
44
17
9 437
97
243
1715
1517
70
777
1635
1746
310
388
0.89 0.94
0.84
0.89
0.91
5.2 1.8 2.0
1.01.73.6
18.2
0.0
0.0 0.2
0.0
0.4
2.3
1.6
11.4
0.3
2.0
1.3
1.3
4.1
2
2
6 0
0 1 0
070
0
0
0 1
1
0
NA
NA
NA NA
NA
NA
NA NA

Type of peak hour being reported: Intersection Peak Method for determining peak hour: Total Entering Volume
Report generated on 5/25/2016 2:30 PM SOURCE: Quality Counts, LLC (http://www.qualitycounts.net) 1-877-580-2212
LOCATION: N Lakewood Blvd -- E Wardlow Rd QC JOB #: 13777702CITY/STATE: Long Beach, CA DATE: Tue, May 17 2016
15-Min CountPeriod
Beginning At
N Lakewood Blvd(Northbound)
N Lakewood Blvd(Southbound)
E Wardlow Rd(Eastbound)
E Wardlow Rd(Westbound)
Total HourlyTotals
Left Thru Right U Left Thru Right U Left Thru Right U Left Thru Right U4:00 PM 44 384 48 2 48 383 17 3 20 13 8 0 26 18 36 0 10504:15 PM 57 363 48 2 49 391 23 3 15 11 9 0 24 20 34 0 10494:30 PM 37 350 57 5 79 333 22 1 32 27 15 0 36 32 42 0 1068
4:45 PM 45 392 52 3 52 343 20 4 21 14 7 0 24 9 39 0 1025 4192 5:00 PM 37 423 53 5 77 437 19 2 13 22 5 0 20 19 38 0 1170 4312
5:15 PM 46 393 69 8 72 351 19 5 16 18 10 0 58 12 33 0 1110 43735:30 PM 38 402 78 0 49 386 12 2 20 7 4 0 31 15 43 0 1087 43925:45 PM 45 385 58 2 35 319 15 2 9 6 4 0 23 15 39 0 957 4324
Peak 15-Min Northbound Southbound Eastbound WestboundTotalFlowrates Left Thru Right U Left Thru Right U Left Thru Right U Left Thru Right U
All Vehicles 148 1692 212 20 308 1748 76 8 52 88 20 0 80 76 152 0 4680Heavy Trucks 0 0 0 0 28 8 0 0 0 0 4 0 40Pedestrians 0 4 0 0 4
Bicycles 0 0 0 0 0 0 0 0 0 0 0 0 0Railroad
Stopped Buses
Comments:
Peak-Hour: 4:45 PM -- 5:45 PMPeak 15-Min: 5:00 PM -- 5:15 PM
182 1610 252
263151770
70
61
26 133
55
153
2044
1850
157
341
1846
1692
563
291
0.68 0.82
0.99
0.87
0.94
4.4 0.5 0.4
0.01.25.7
5.7
0.0
0.0 0.8
5.5
0.7
0.8
1.2
2.5
1.5
0.7
1.1
0.2
5.2
0
2
7 1
0 0 1
000
0
1
0 0
0
0
NA
NA
NA NA
NA
NA
NA NA

Type of peak hour being reported: Intersection Peak Method for determining peak hour: Total Entering Volume
Report generated on 5/25/2016 2:30 PM SOURCE: Quality Counts, LLC (http://www.qualitycounts.net) 1-877-580-2212
LOCATION: N Lakewood Blvd -- E Wardlow Rd QC JOB #: 13777703CITY/STATE: Long Beach, CA DATE: Tue, May 17 2016
15-Min CountPeriod
Beginning At
N Lakewood Blvd(Northbound)
N Lakewood Blvd(Southbound)
E Wardlow Rd(Eastbound)
E Wardlow Rd(Westbound)
Total HourlyTotals
Left Thru Right U Left Thru Right U Left Thru Right U Left Thru Right U
9:00 PM 28 128 10 1 11 179 4 1 4 5 5 1 9 9 12 0 407 9:15 PM 43 163 6 2 8 166 11 0 15 10 10 1 12 21 9 0 477
9:30 PM 27 107 10 2 4 157 10 6 17 11 21 0 8 16 6 0 4029:45 PM 16 99 8 0 5 149 6 3 9 2 6 0 7 9 2 0 321 1607
10:00 PM 20 102 7 1 7 134 1 3 15 10 8 0 9 7 4 0 328 152810:15 PM 3 86 4 1 6 101 0 4 2 1 5 0 4 1 3 0 221 127210:30 PM 3 75 5 0 5 82 1 2 10 10 8 0 2 0 3 0 206 107610:45 PM 4 71 7 3 3 71 1 0 2 1 2 0 6 2 4 0 177 932
Peak 15-Min Northbound Southbound Eastbound WestboundTotalFlowrates Left Thru Right U Left Thru Right U Left Thru Right U Left Thru Right U
All Vehicles 172 652 24 8 32 664 44 0 60 40 40 4 48 84 36 0 1908Heavy Trucks 8 0 0 0 0 0 4 0 0 0 0 0 12Pedestrians 0 0 0 0 0
Bicycles 0 1 0 0 0 0 0 0 0 0 0 0 1Railroad
Stopped Buses
Comments:
Peak-Hour: 9:00 PM -- 10:00 PMPeak 15-Min: 9:15 PM -- 9:30 PM
119 497 34
3865131
47
28
42 36
55
29
650
720
117
120
581
734
90
202
0.69 0.71
0.76
0.92
0.84
1.7 0.2 0.0
0.00.23.2
2.1
0.0
0.0 0.0
0.0
0.0
0.5
0.3
0.9
0.0
0.3
0.1
0.0
1.5
1
3
0 0
0 1 0
000
0
0
0 0
0
0
NA
NA
NA NA
NA
NA
NA NA

Type of peak hour being reported: Intersection Peak Method for determining peak hour: Total Entering Volume
Report generated on 5/25/2016 2:30 PM SOURCE: Quality Counts, LLC (http://www.qualitycounts.net) 1-877-580-2212
LOCATION: N Lakewood Blvd -- Donald Douglas Dr QC JOB #: 13777704CITY/STATE: Long Beach, CA DATE: Tue, May 17 2016
15-Min CountPeriod
Beginning At
N Lakewood Blvd(Northbound)
N Lakewood Blvd(Southbound)
Donald Douglas Dr(Eastbound)
Donald Douglas Dr(Westbound)
Total HourlyTotals
Left Thru Right U Left Thru Right U Left Thru Right U Left Thru Right U7:00 AM 0 0 0 0 0 311 11 0 0 0 26 0 0 0 0 0 348
7:15 AM 0 0 0 0 0 436 6 0 0 0 38 0 0 0 0 0 4807:30 AM 0 0 0 0 0 453 2 0 0 0 35 0 0 0 0 0 490
7:45 AM 0 0 0 0 0 470 2 0 0 0 85 0 0 0 0 0 557 18758:00 AM 0 0 0 0 0 398 2 0 0 0 60 0 0 0 0 0 460 19878:15 AM 0 0 0 0 0 395 2 0 0 0 43 0 0 0 0 0 440 19478:30 AM 0 0 0 0 0 356 2 0 0 0 30 0 0 0 0 0 388 18458:45 AM 0 0 0 0 0 311 5 0 0 0 63 0 0 0 0 0 379 1667
Peak 15-Min Northbound Southbound Eastbound WestboundTotalFlowrates Left Thru Right U Left Thru Right U Left Thru Right U Left Thru Right U
All Vehicles 0 0 0 0 0 1880 8 0 0 0 340 0 0 0 0 0 2228Heavy Trucks 0 0 0 0 44 0 0 0 12 0 0 0 56Pedestrians 0 0 0 0 0
Bicycles 0 0 0 0 0 0 0 0 0 0 0 0 0Railroad
Stopped Buses
Comments:
Peak-Hour: 7:15 AM -- 8:15 AMPeak 15-Min: 7:45 AM -- 8:00 AM
0 0 0
0175712
0
0
218 0
0
0
0
1769
218
0
0
1975
0
12
0.66 0.00
0.00
0.94
0.89
0.0 0.0 0.0
0.01.40.0
0.0
0.0
4.6 0.0
0.0
0.0
0.0
1.4
4.6
0.0
0.0
1.7
0.0
0.0
0
0
3 0
0 0 0
020
0
0
0 0
0
0
NA
NA
NA NA
NA
NA
NA NA
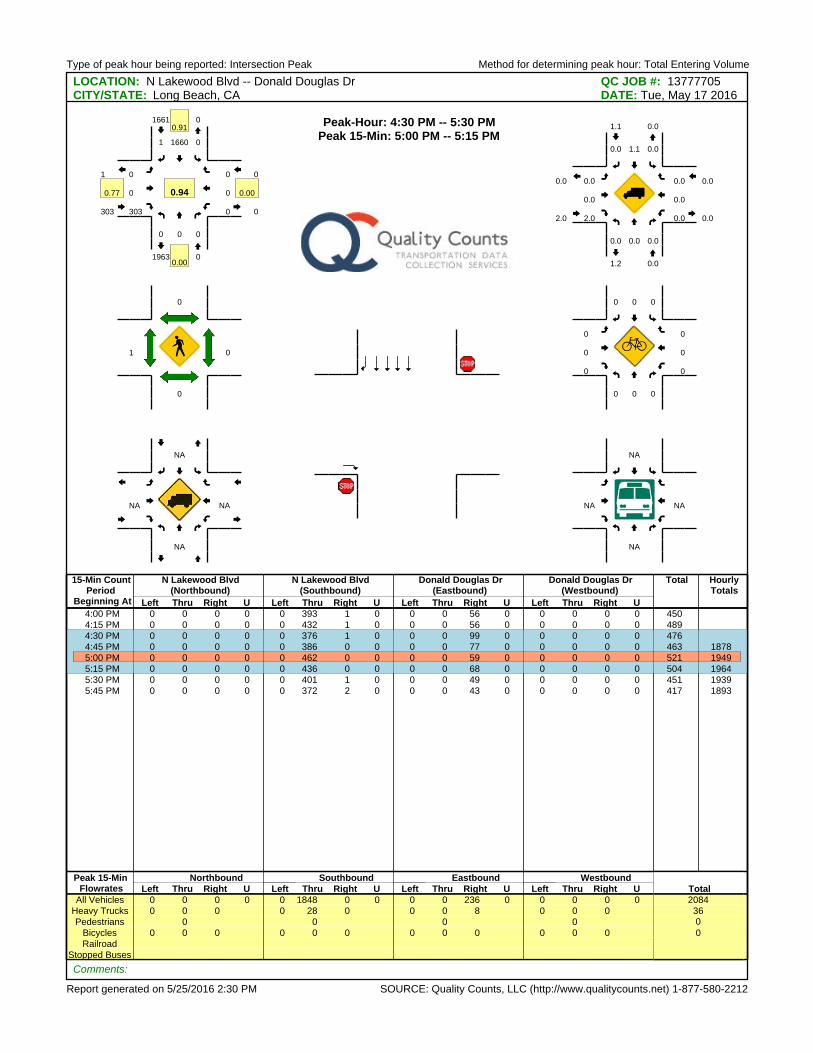
Type of peak hour being reported: Intersection Peak Method for determining peak hour: Total Entering Volume
Report generated on 5/25/2016 2:30 PM SOURCE: Quality Counts, LLC (http://www.qualitycounts.net) 1-877-580-2212
LOCATION: N Lakewood Blvd -- Donald Douglas Dr QC JOB #: 13777705CITY/STATE: Long Beach, CA DATE: Tue, May 17 2016
15-Min CountPeriod
Beginning At
N Lakewood Blvd(Northbound)
N Lakewood Blvd(Southbound)
Donald Douglas Dr(Eastbound)
Donald Douglas Dr(Westbound)
Total HourlyTotals
Left Thru Right U Left Thru Right U Left Thru Right U Left Thru Right U4:00 PM 0 0 0 0 0 393 1 0 0 0 56 0 0 0 0 0 4504:15 PM 0 0 0 0 0 432 1 0 0 0 56 0 0 0 0 0 489
4:30 PM 0 0 0 0 0 376 1 0 0 0 99 0 0 0 0 0 4764:45 PM 0 0 0 0 0 386 0 0 0 0 77 0 0 0 0 0 463 1878
5:00 PM 0 0 0 0 0 462 0 0 0 0 59 0 0 0 0 0 521 19495:15 PM 0 0 0 0 0 436 0 0 0 0 68 0 0 0 0 0 504 19645:30 PM 0 0 0 0 0 401 1 0 0 0 49 0 0 0 0 0 451 19395:45 PM 0 0 0 0 0 372 2 0 0 0 43 0 0 0 0 0 417 1893
Peak 15-Min Northbound Southbound Eastbound WestboundTotalFlowrates Left Thru Right U Left Thru Right U Left Thru Right U Left Thru Right U
All Vehicles 0 0 0 0 0 1848 0 0 0 0 236 0 0 0 0 0 2084Heavy Trucks 0 0 0 0 28 0 0 0 8 0 0 0 36Pedestrians 0 0 0 0 0
Bicycles 0 0 0 0 0 0 0 0 0 0 0 0 0Railroad
Stopped Buses
Comments:
Peak-Hour: 4:30 PM -- 5:30 PMPeak 15-Min: 5:00 PM -- 5:15 PM
0 0 0
016601
0
0
303 0
0
0
0
1661
303
0
0
1963
0
1
0.77 0.00
0.00
0.91
0.94
0.0 0.0 0.0
0.01.10.0
0.0
0.0
2.0 0.0
0.0
0.0
0.0
1.1
2.0
0.0
0.0
1.2
0.0
0.0
0
0
1 0
0 0 0
000
0
0
0 0
0
0
NA
NA
NA NA
NA
NA
NA NA
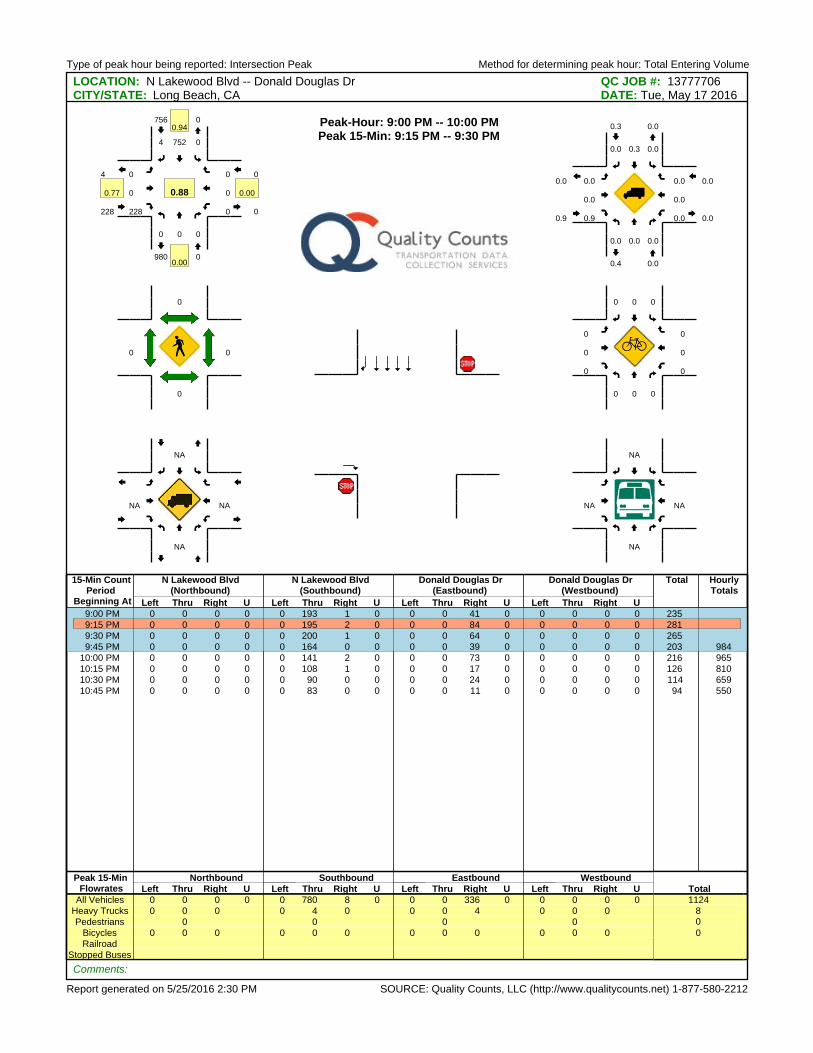
Type of peak hour being reported: Intersection Peak Method for determining peak hour: Total Entering Volume
Report generated on 5/25/2016 2:30 PM SOURCE: Quality Counts, LLC (http://www.qualitycounts.net) 1-877-580-2212
LOCATION: N Lakewood Blvd -- Donald Douglas Dr QC JOB #: 13777706CITY/STATE: Long Beach, CA DATE: Tue, May 17 2016
15-Min CountPeriod
Beginning At
N Lakewood Blvd(Northbound)
N Lakewood Blvd(Southbound)
Donald Douglas Dr(Eastbound)
Donald Douglas Dr(Westbound)
Total HourlyTotals
Left Thru Right U Left Thru Right U Left Thru Right U Left Thru Right U
9:00 PM 0 0 0 0 0 193 1 0 0 0 41 0 0 0 0 0 235 9:15 PM 0 0 0 0 0 195 2 0 0 0 84 0 0 0 0 0 281
9:30 PM 0 0 0 0 0 200 1 0 0 0 64 0 0 0 0 0 2659:45 PM 0 0 0 0 0 164 0 0 0 0 39 0 0 0 0 0 203 984
10:00 PM 0 0 0 0 0 141 2 0 0 0 73 0 0 0 0 0 216 96510:15 PM 0 0 0 0 0 108 1 0 0 0 17 0 0 0 0 0 126 81010:30 PM 0 0 0 0 0 90 0 0 0 0 24 0 0 0 0 0 114 65910:45 PM 0 0 0 0 0 83 0 0 0 0 11 0 0 0 0 0 94 550
Peak 15-Min Northbound Southbound Eastbound WestboundTotalFlowrates Left Thru Right U Left Thru Right U Left Thru Right U Left Thru Right U
All Vehicles 0 0 0 0 0 780 8 0 0 0 336 0 0 0 0 0 1124Heavy Trucks 0 0 0 0 4 0 0 0 4 0 0 0 8Pedestrians 0 0 0 0 0
Bicycles 0 0 0 0 0 0 0 0 0 0 0 0 0Railroad
Stopped Buses
Comments:
Peak-Hour: 9:00 PM -- 10:00 PMPeak 15-Min: 9:15 PM -- 9:30 PM
0 0 0
07524
0
0
228 0
0
0
0
756
228
0
0
980
0
4
0.77 0.00
0.00
0.94
0.88
0.0 0.0 0.0
0.00.30.0
0.0
0.0
0.9 0.0
0.0
0.0
0.0
0.3
0.9
0.0
0.0
0.4
0.0
0.0
0
0
0 0
0 0 0
000
0
0
0 0
0
0
NA
NA
NA NA
NA
NA
NA NA

Type of report: Tube Count - Volume Data
SOURCE: Quality Counts, LLC (http://www.qualitycounts.net)
LOCATION: Tube Count 1 QC JOB #: 13777707SPECIFIC LOCATION: Tube Count CITY/STATE: Long Beach, CA
DIRECTION: EBDATE: May 17 2016 - May 22 2016
Start TimeMon Tue
17-May-16Wed
18-May-16Thu
19-May-16Fri
20-May-16Average Weekday
Hourly TrafficSat
21-May-16Sun
22-May-16Average WeekHourly Traffic
Average Week Profile
12:00 AM 11 12 14 9 12 4 8 101:00 AM 6 11 13 8 10 8 3 82:00 AM 3 3 1 5 3 4 4 33:00 AM 0 3 2 3 2 4 0 24:00 AM 4 3 8 8 6 3 8 65:00 AM 26 31 22 38 29 31 25 296:00 AM 36 35 27 44 36 37 40 377:00 AM 67 57 50 62 59 53 49 568:00 AM 65 78 73 74 73 79 40 689:00 AM 104 90 86 112 98 92 93 96
10:00 AM 83 97 98 104 96 106 100 9811:00 AM 132 158 153 222 166 110 97 14512:00 PM 114 97 97 129 109 89 72 100
1:00 PM 134 143 159 147 146 127 96 1342:00 PM 142 150 161 132 146 101 121 1353:00 PM 265 298 260 293 279 93 107 2194:00 PM 164 182 187 185 180 118 136 1625:00 PM 125 176 139 122 141 87 68 1206:00 PM 136 163 181 146 157 94 101 1377:00 PM 123 73 99 99 99 64 148 1018:00 PM 90 84 120 111 101 115 127 1089:00 PM 105 121 144 145 129 107 126 125
10:00 PM 67 48 64 55 59 29 41 5111:00 PM 59 57 50 44 53 15 19 41Day Total 2061 2170 2208 2297 2189 1570 1629 1991
% WeekdayAverage 94.2% 99.1% 100.9% 104.9%% WeekAverage 103.5% 109.0% 110.9% 115.4% 109.9% 78.9% 81.8%AM Peak 11:00 AM 11:00 AM 11:00 AM 11:00 AM 11:00 AM 11:00 AM 10:00 AM 11:00 AMVolume 132 158 153 222 166 110 100 145
PM Peak 3:00 PM 3:00 PM 3:00 PM 3:00 PM 3:00 PM 1:00 PM 7:00 PM 3:00 PMVolume 265 298 260 293 279 127 148 219
Comments:
Page 1 of 5
Report generated on 5/25/2016 2:29 PM

Type of report: Tube Count - Volume Data
SOURCE: Quality Counts, LLC (http://www.qualitycounts.net)
LOCATION: Tube Count 1 QC JOB #: 13777707SPECIFIC LOCATION: Tube Count CITY/STATE: Long Beach, CA
DIRECTION: EBDATE: May 23 2016 - May 23 2016
Start TimeMon
23-May-16Tue Wed Thu Fri Average Weekday
Hourly TrafficSat Sun Average Week
Hourly TrafficAverage Week Profile
12:00 AM 7 7 71:00 AM 2 2 22:00 AM 2 2 23:00 AM 2 2 24:00 AM 4 4 45:00 AM 45 45 456:00 AM 45 45 457:00 AM 71 71 718:00 AM 58 58 589:00 AM 124 124 124
10:00 AM 118 118 11811:00 AM 184 184 18412:00 PM 101 101 101
1:00 PM 127 127 1272:00 PM 148 148 1483:00 PM 287 287 2874:00 PM 184 184 1845:00 PM 148 148 1486:00 PM 132 132 1327:00 PM 106 106 1068:00 PM 138 138 1389:00 PM 148 148 148
10:00 PM 56 56 5611:00 PM 53 53 53Day Total 2290 2290 2290
% WeekdayAverage 104.6%% WeekAverage 115.0% 100.0%AM Peak 11:00 AM 11:00 AM 11:00 AMVolume 184 184 184
PM Peak 3:00 PM 3:00 PM 3:00 PMVolume 287 287 287
Comments:
Page 2 of 5
Report generated on 5/25/2016 2:29 PM
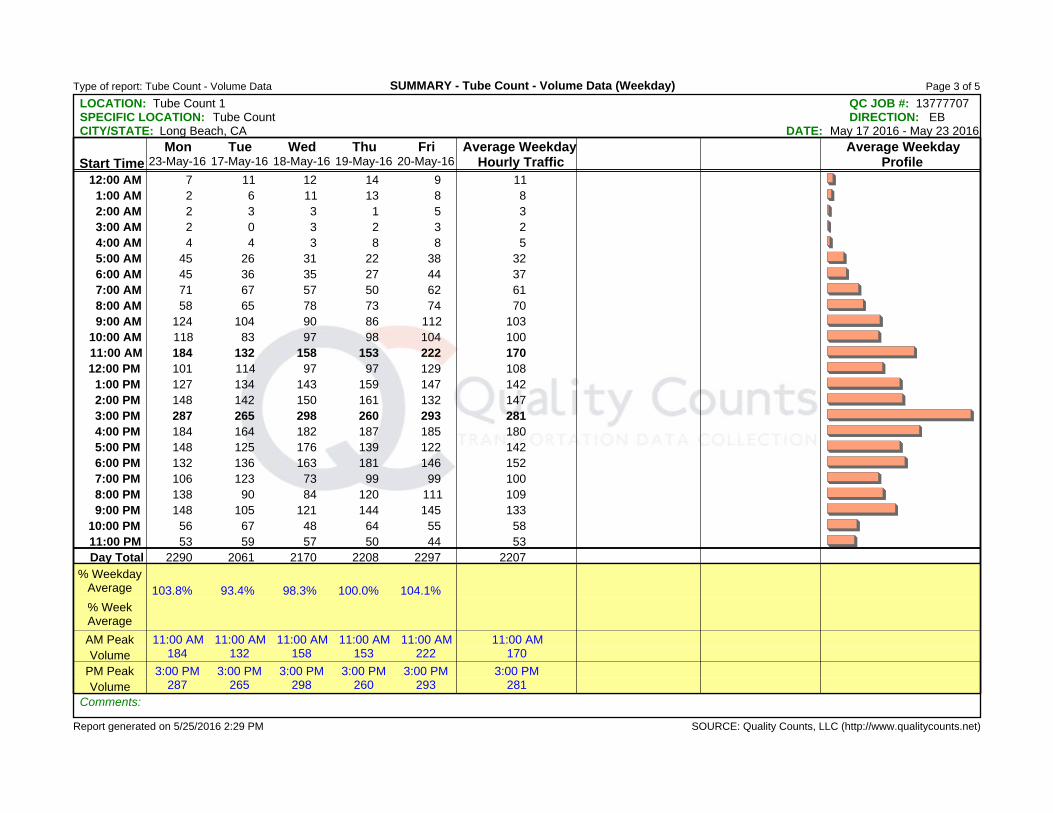
Type of report: Tube Count - Volume Data
SOURCE: Quality Counts, LLC (http://www.qualitycounts.net)
SUMMARY - Tube Count - Volume Data (Weekday)
LOCATION: Tube Count 1 QC JOB #: 13777707SPECIFIC LOCATION: Tube Count CITY/STATE: Long Beach, CA
DIRECTION: EBDATE: May 17 2016 - May 23 2016
Start TimeMon
23-May-16Tue
17-May-16Wed
18-May-16Thu
19-May-16Fri
20-May-16Average Weekday
Hourly TrafficAverage Weekday
Profile12:00 AM 7 11 12 14 9 11
1:00 AM 2 6 11 13 8 82:00 AM 2 3 3 1 5 33:00 AM 2 0 3 2 3 24:00 AM 4 4 3 8 8 55:00 AM 45 26 31 22 38 326:00 AM 45 36 35 27 44 377:00 AM 71 67 57 50 62 618:00 AM 58 65 78 73 74 709:00 AM 124 104 90 86 112 103
10:00 AM 118 83 97 98 104 10011:00 AM 184 132 158 153 222 17012:00 PM 101 114 97 97 129 108
1:00 PM 127 134 143 159 147 1422:00 PM 148 142 150 161 132 1473:00 PM 287 265 298 260 293 2814:00 PM 184 164 182 187 185 1805:00 PM 148 125 176 139 122 1426:00 PM 132 136 163 181 146 1527:00 PM 106 123 73 99 99 1008:00 PM 138 90 84 120 111 1099:00 PM 148 105 121 144 145 133
10:00 PM 56 67 48 64 55 5811:00 PM 53 59 57 50 44 53Day Total 2290 2061 2170 2208 2297 2207
% WeekdayAverage 103.8% 93.4% 98.3% 100.0% 104.1%% WeekAverage
AM Peak 11:00 AM 11:00 AM 11:00 AM 11:00 AM 11:00 AM 11:00 AMVolume 184 132 158 153 222 170
PM Peak 3:00 PM 3:00 PM 3:00 PM 3:00 PM 3:00 PM 3:00 PMVolume 287 265 298 260 293 281
Comments:
Page 3 of 5
Report generated on 5/25/2016 2:29 PM

Type of report: Tube Count - Volume Data
SOURCE: Quality Counts, LLC (http://www.qualitycounts.net)
SUMMARY - Tube Count - Volume Data (Weekend)
LOCATION: Tube Count 1 QC JOB #: 13777707SPECIFIC LOCATION: Tube Count CITY/STATE: Long Beach, CA
DIRECTION: EBDATE: May 21 2016 - May 22 2016
Start TimeSat
21-May-16Sun
22-May-16Average Weekend
Hourly TrafficAverage Weekend
Profile12:00 AM 4 8 6
1:00 AM 8 3 62:00 AM 4 4 43:00 AM 4 0 24:00 AM 3 8 65:00 AM 31 25 286:00 AM 37 40 397:00 AM 53 49 518:00 AM 79 40 609:00 AM 92 93 93
10:00 AM 106 100 10311:00 AM 110 97 10412:00 PM 89 72 81
1:00 PM 127 96 1122:00 PM 101 121 1113:00 PM 93 107 1004:00 PM 118 136 1275:00 PM 87 68 786:00 PM 94 101 987:00 PM 64 148 1068:00 PM 115 127 1219:00 PM 107 126 117
10:00 PM 29 41 3511:00 PM 15 19 17Day Total 1570 1629 1605
% WeekdayAverage
% WeekAverage 97.8% 101.5%AM Peak 11:00 AM 10:00 AM 11:00 AMVolume 110 100 104
PM Peak 1:00 PM 7:00 PM 4:00 PMVolume 127 148 127
Comments:
Page 4 of 5
Report generated on 5/25/2016 2:29 PM

Type of report: Tube Count - Volume Data
SOURCE: Quality Counts, LLC (http://www.qualitycounts.net)
SUMMARY - Tube Count - Volume Data (Week)
LOCATION: Tube Count 1 QC JOB #: 13777707SPECIFIC LOCATION: Tube Count CITY/STATE: Long Beach, CA
DIRECTION: EBDATE: May 17 2016 - May 23 2016
Start TimeMon
23-May-16Tue
17-May-16Wed
18-May-16Thu
19-May-16Fri
20-May-16Average Weekday
Hourly TrafficSat
21-May-16Sun
22-May-16Average WeekHourly Traffic
Average WeekProfile
12:00 AM 7 11 12 14 9 11 4 8 91:00 AM 2 6 11 13 8 8 8 3 72:00 AM 2 3 3 1 5 3 4 4 33:00 AM 2 0 3 2 3 2 4 0 24:00 AM 4 4 3 8 8 5 3 8 55:00 AM 45 26 31 22 38 32 31 25 316:00 AM 45 36 35 27 44 37 37 40 387:00 AM 71 67 57 50 62 61 53 49 588:00 AM 58 65 78 73 74 70 79 40 679:00 AM 124 104 90 86 112 103 92 93 100
10:00 AM 118 83 97 98 104 100 106 100 10111:00 AM 184 132 158 153 222 170 110 97 15112:00 PM 101 114 97 97 129 108 89 72 100
1:00 PM 127 134 143 159 147 142 127 96 1332:00 PM 148 142 150 161 132 147 101 121 1363:00 PM 287 265 298 260 293 281 93 107 2294:00 PM 184 164 182 187 185 180 118 136 1655:00 PM 148 125 176 139 122 142 87 68 1246:00 PM 132 136 163 181 146 152 94 101 1367:00 PM 106 123 73 99 99 100 64 148 1028:00 PM 138 90 84 120 111 109 115 127 1129:00 PM 148 105 121 144 145 133 107 126 128
10:00 PM 56 67 48 64 55 58 29 41 5111:00 PM 53 59 57 50 44 53 15 19 42Day Total 2290 2061 2170 2208 2297 2207 1570 1629 2030
% WeekdayAverage 103.8% 93.4% 98.3% 100.0% 104.1%% WeekAverage 112.8% 101.5% 106.9% 108.8% 113.2% 108.7% 77.3% 80.2%AM Peak 11:00 AM 11:00 AM 11:00 AM 11:00 AM 11:00 AM 11:00 AM 11:00 AM 10:00 AM 11:00 AMVolume 184 132 158 153 222 170 110 100 151
PM Peak 3:00 PM 3:00 PM 3:00 PM 3:00 PM 3:00 PM 3:00 PM 1:00 PM 7:00 PM 3:00 PMVolume 287 265 298 260 293 281 127 148 229
Comments:
Page 5 of 5
Report generated on 5/25/2016 2:29 PM

Type of report: Tube Count - Volume Data
SOURCE: Quality Counts, LLC (http://www.qualitycounts.net)
LOCATION: Tube Count 1 QC JOB #: 13777707SPECIFIC LOCATION: Tube Count CITY/STATE: Long Beach, CA
DIRECTION: EB/WBDATE: May 17 2016 - May 22 2016
Start TimeMon Tue
17-May-16Wed
18-May-16Thu
19-May-16Fri
20-May-16Average Weekday
Hourly TrafficSat
21-May-16Sun
22-May-16Average WeekHourly Traffic
Average Week Profile
12:00 AM 21 24 23 17 21 11 16 191:00 AM 12 21 27 13 18 16 11 172:00 AM 6 11 4 11 8 7 6 83:00 AM 9 12 11 12 11 10 11 114:00 AM 96 106 103 94 100 91 83 965:00 AM 376 388 320 428 378 361 301 3626:00 AM 480 433 444 465 456 293 291 4017:00 AM 454 387 413 407 415 320 274 3768:00 AM 432 459 441 478 453 362 317 4159:00 AM 541 547 487 595 543 532 470 529
10:00 AM 435 450 498 510 473 489 451 47211:00 AM 485 511 520 636 538 410 402 49412:00 PM 575 529 505 593 551 414 406 504
1:00 PM 530 505 570 556 540 474 440 5132:00 PM 511 588 583 573 564 460 534 5423:00 PM 593 664 645 686 647 440 461 5824:00 PM 502 563 556 611 558 455 550 5405:00 PM 403 506 467 469 461 386 413 4416:00 PM 473 568 595 548 546 371 440 4997:00 PM 419 302 408 397 382 265 554 3918:00 PM 321 309 457 494 395 438 433 4099:00 PM 313 378 371 381 361 284 322 342
10:00 PM 111 81 98 92 96 48 72 8411:00 PM 67 92 56 60 69 30 32 56Day Total 8165 8434 8602 9126 8584 6967 7290 8103
% WeekdayAverage 95.1% 98.3% 100.2% 106.3%% WeekAverage 100.8% 104.1% 106.2% 112.6% 105.9% 86.0% 90.0%AM Peak 9:00 AM 9:00 AM 11:00 AM 11:00 AM 9:00 AM 9:00 AM 9:00 AM 9:00 AMVolume 541 547 520 636 543 532 470 529
PM Peak 3:00 PM 3:00 PM 3:00 PM 3:00 PM 3:00 PM 1:00 PM 7:00 PM 3:00 PMVolume 593 664 645 686 647 474 554 582
Comments:
Page 1 of 5
Report generated on 5/25/2016 2:29 PM

Type of report: Tube Count - Volume Data
SOURCE: Quality Counts, LLC (http://www.qualitycounts.net)
LOCATION: Tube Count 1 QC JOB #: 13777707SPECIFIC LOCATION: Tube Count CITY/STATE: Long Beach, CA
DIRECTION: EB/WBDATE: May 23 2016 - May 23 2016
Start TimeMon
23-May-16Tue Wed Thu Fri Average Weekday
Hourly TrafficSat Sun Average Week
Hourly TrafficAverage Week Profile
12:00 AM 19 19 191:00 AM 12 12 122:00 AM 8 8 83:00 AM 13 13 134:00 AM 85 85 855:00 AM 440 440 4406:00 AM 499 499 4997:00 AM 470 470 4708:00 AM 450 450 4509:00 AM 590 590 590
10:00 AM 525 525 52511:00 AM 576 576 57612:00 PM 515 515 515
1:00 PM 558 558 5582:00 PM 546 546 5463:00 PM 653 653 6534:00 PM 557 557 5575:00 PM 472 472 4726:00 PM 432 432 4327:00 PM 376 376 3768:00 PM 465 465 4659:00 PM 358 358 358
10:00 PM 91 91 9111:00 PM 61 61 61Day Total 8771 8771 8771
% WeekdayAverage 102.2%% WeekAverage 108.2% 100.0%AM Peak 9:00 AM 9:00 AM 9:00 AMVolume 590 590 590
PM Peak 3:00 PM 3:00 PM 3:00 PMVolume 653 653 653
Comments:
Page 2 of 5
Report generated on 5/25/2016 2:29 PM

Type of report: Tube Count - Volume Data
SOURCE: Quality Counts, LLC (http://www.qualitycounts.net)
SUMMARY - Tube Count - Volume Data (Weekday)
LOCATION: Tube Count 1 QC JOB #: 13777707SPECIFIC LOCATION: Tube Count CITY/STATE: Long Beach, CA
DIRECTION: EB/WBDATE: May 17 2016 - May 23 2016
Start TimeMon
23-May-16Tue
17-May-16Wed
18-May-16Thu
19-May-16Fri
20-May-16Average Weekday
Hourly TrafficAverage Weekday
Profile12:00 AM 19 21 24 23 17 21
1:00 AM 12 12 21 27 13 172:00 AM 8 6 11 4 11 83:00 AM 13 9 12 11 12 114:00 AM 85 96 106 103 94 975:00 AM 440 376 388 320 428 3906:00 AM 499 480 433 444 465 4647:00 AM 470 454 387 413 407 4268:00 AM 450 432 459 441 478 4529:00 AM 590 541 547 487 595 552
10:00 AM 525 435 450 498 510 48411:00 AM 576 485 511 520 636 54612:00 PM 515 575 529 505 593 543
1:00 PM 558 530 505 570 556 5442:00 PM 546 511 588 583 573 5603:00 PM 653 593 664 645 686 6484:00 PM 557 502 563 556 611 5585:00 PM 472 403 506 467 469 4636:00 PM 432 473 568 595 548 5237:00 PM 376 419 302 408 397 3808:00 PM 465 321 309 457 494 4099:00 PM 358 313 378 371 381 360
10:00 PM 91 111 81 98 92 9511:00 PM 61 67 92 56 60 67Day Total 8771 8165 8434 8602 9126 8618
% WeekdayAverage 101.8% 94.7% 97.9% 99.8% 105.9%% WeekAverage
AM Peak 9:00 AM 9:00 AM 9:00 AM 11:00 AM 11:00 AM 9:00 AMVolume 590 541 547 520 636 552
PM Peak 3:00 PM 3:00 PM 3:00 PM 3:00 PM 3:00 PM 3:00 PMVolume 653 593 664 645 686 648
Comments:
Page 3 of 5
Report generated on 5/25/2016 2:29 PM
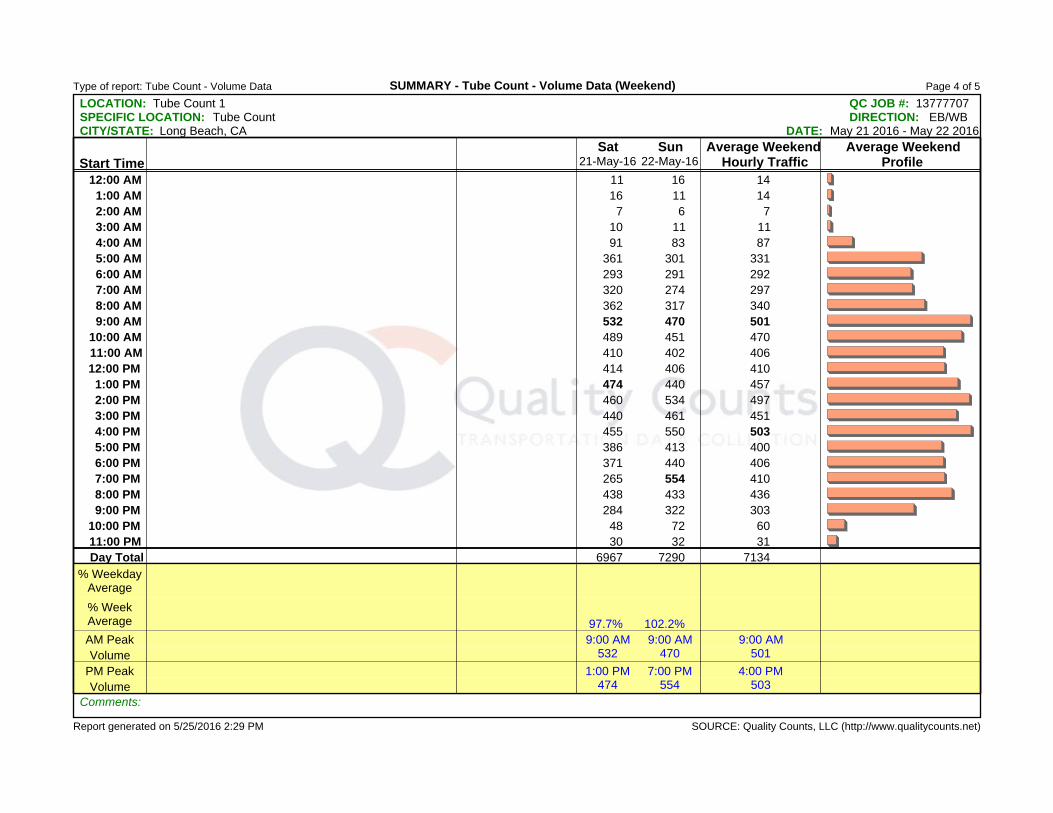
Type of report: Tube Count - Volume Data
SOURCE: Quality Counts, LLC (http://www.qualitycounts.net)
SUMMARY - Tube Count - Volume Data (Weekend)
LOCATION: Tube Count 1 QC JOB #: 13777707SPECIFIC LOCATION: Tube Count CITY/STATE: Long Beach, CA
DIRECTION: EB/WBDATE: May 21 2016 - May 22 2016
Start TimeSat
21-May-16Sun
22-May-16Average Weekend
Hourly TrafficAverage Weekend
Profile12:00 AM 11 16 14
1:00 AM 16 11 142:00 AM 7 6 73:00 AM 10 11 114:00 AM 91 83 875:00 AM 361 301 3316:00 AM 293 291 2927:00 AM 320 274 2978:00 AM 362 317 3409:00 AM 532 470 501
10:00 AM 489 451 47011:00 AM 410 402 40612:00 PM 414 406 410
1:00 PM 474 440 4572:00 PM 460 534 4973:00 PM 440 461 4514:00 PM 455 550 5035:00 PM 386 413 4006:00 PM 371 440 4067:00 PM 265 554 4108:00 PM 438 433 4369:00 PM 284 322 303
10:00 PM 48 72 6011:00 PM 30 32 31Day Total 6967 7290 7134
% WeekdayAverage
% WeekAverage 97.7% 102.2%AM Peak 9:00 AM 9:00 AM 9:00 AMVolume 532 470 501
PM Peak 1:00 PM 7:00 PM 4:00 PMVolume 474 554 503
Comments:
Page 4 of 5
Report generated on 5/25/2016 2:29 PM

Type of report: Tube Count - Volume Data
SOURCE: Quality Counts, LLC (http://www.qualitycounts.net)
SUMMARY - Tube Count - Volume Data (Week)
LOCATION: Tube Count 1 QC JOB #: 13777707SPECIFIC LOCATION: Tube Count CITY/STATE: Long Beach, CA
DIRECTION: EB/WBDATE: May 17 2016 - May 23 2016
Start TimeMon
23-May-16Tue
17-May-16Wed
18-May-16Thu
19-May-16Fri
20-May-16Average Weekday
Hourly TrafficSat
21-May-16Sun
22-May-16Average WeekHourly Traffic
Average WeekProfile
12:00 AM 19 21 24 23 17 21 11 16 191:00 AM 12 12 21 27 13 17 16 11 162:00 AM 8 6 11 4 11 8 7 6 83:00 AM 13 9 12 11 12 11 10 11 114:00 AM 85 96 106 103 94 97 91 83 945:00 AM 440 376 388 320 428 390 361 301 3736:00 AM 499 480 433 444 465 464 293 291 4157:00 AM 470 454 387 413 407 426 320 274 3898:00 AM 450 432 459 441 478 452 362 317 4209:00 AM 590 541 547 487 595 552 532 470 537
10:00 AM 525 435 450 498 510 484 489 451 48011:00 AM 576 485 511 520 636 546 410 402 50612:00 PM 515 575 529 505 593 543 414 406 505
1:00 PM 558 530 505 570 556 544 474 440 5192:00 PM 546 511 588 583 573 560 460 534 5423:00 PM 653 593 664 645 686 648 440 461 5924:00 PM 557 502 563 556 611 558 455 550 5425:00 PM 472 403 506 467 469 463 386 413 4456:00 PM 432 473 568 595 548 523 371 440 4907:00 PM 376 419 302 408 397 380 265 554 3898:00 PM 465 321 309 457 494 409 438 433 4179:00 PM 358 313 378 371 381 360 284 322 344
10:00 PM 91 111 81 98 92 95 48 72 8511:00 PM 61 67 92 56 60 67 30 32 57Day Total 8771 8165 8434 8602 9126 8618 6967 7290 8195
% WeekdayAverage 101.8% 94.7% 97.9% 99.8% 105.9%% WeekAverage 107.0% 99.6% 102.9% 105.0% 111.4% 105.2% 85.0% 89.0%AM Peak 9:00 AM 9:00 AM 9:00 AM 11:00 AM 11:00 AM 9:00 AM 9:00 AM 9:00 AM 9:00 AMVolume 590 541 547 520 636 552 532 470 537
PM Peak 3:00 PM 3:00 PM 3:00 PM 3:00 PM 3:00 PM 3:00 PM 1:00 PM 7:00 PM 3:00 PMVolume 653 593 664 645 686 648 474 554 592
Comments:
Page 5 of 5
Report generated on 5/25/2016 2:29 PM

Type of report: Tube Count - Volume Data
SOURCE: Quality Counts, LLC (http://www.qualitycounts.net)
LOCATION: Tube Count 1 QC JOB #: 13777707SPECIFIC LOCATION: Tube Count CITY/STATE: Long Beach, CA
DIRECTION: WBDATE: May 17 2016 - May 22 2016
Start TimeMon Tue
17-May-16Wed
18-May-16Thu
19-May-16Fri
20-May-16Average Weekday
Hourly TrafficSat
21-May-16Sun
22-May-16Average WeekHourly Traffic
Average Week Profile
12:00 AM 10 12 9 8 10 7 8 91:00 AM 6 10 14 5 9 8 8 92:00 AM 3 8 3 6 5 3 2 43:00 AM 9 9 9 9 9 6 11 94:00 AM 92 103 95 86 94 88 75 905:00 AM 350 357 298 390 349 330 276 3346:00 AM 444 398 417 421 420 256 251 3657:00 AM 387 330 363 345 356 267 225 3208:00 AM 367 381 368 404 380 283 277 3479:00 AM 437 457 401 483 445 440 377 433
10:00 AM 352 353 400 406 378 383 351 37411:00 AM 353 353 367 414 372 300 305 34912:00 PM 461 432 408 464 441 325 334 404
1:00 PM 396 362 411 409 395 347 344 3782:00 PM 369 438 422 441 418 359 413 4073:00 PM 328 366 385 393 368 347 354 3624:00 PM 338 381 369 426 379 337 414 3785:00 PM 278 330 328 347 321 299 345 3216:00 PM 337 405 414 402 390 277 339 3627:00 PM 296 229 309 298 283 201 406 2908:00 PM 231 225 337 383 294 323 306 3019:00 PM 208 257 227 236 232 177 196 217
10:00 PM 44 33 34 37 37 19 31 3311:00 PM 8 35 6 16 16 15 13 16Day Total 6104 6264 6394 6829 6401 5397 5661 6112
% WeekdayAverage 95.4% 97.9% 99.9% 106.7%% WeekAverage 99.9% 102.5% 104.6% 111.7% 104.7% 88.3% 92.6%AM Peak 6:00 AM 9:00 AM 6:00 AM 9:00 AM 9:00 AM 9:00 AM 9:00 AM 9:00 AMVolume 444 457 417 483 445 440 377 433
PM Peak 12:00 PM 2:00 PM 2:00 PM 12:00 PM 12:00 PM 2:00 PM 4:00 PM 2:00 PMVolume 461 438 422 464 441 359 414 407
Comments:
Page 1 of 5
Report generated on 5/25/2016 2:29 PM

Type of report: Tube Count - Volume Data
SOURCE: Quality Counts, LLC (http://www.qualitycounts.net)
LOCATION: Tube Count 1 QC JOB #: 13777707SPECIFIC LOCATION: Tube Count CITY/STATE: Long Beach, CA
DIRECTION: WBDATE: May 23 2016 - May 23 2016
Start TimeMon
23-May-16Tue Wed Thu Fri Average Weekday
Hourly TrafficSat Sun Average Week
Hourly TrafficAverage Week Profile
12:00 AM 12 12 121:00 AM 10 10 102:00 AM 6 6 63:00 AM 11 11 114:00 AM 81 81 815:00 AM 395 395 3956:00 AM 454 454 4547:00 AM 399 399 3998:00 AM 392 392 3929:00 AM 466 466 466
10:00 AM 407 407 40711:00 AM 392 392 39212:00 PM 414 414 414
1:00 PM 431 431 4312:00 PM 398 398 3983:00 PM 366 366 3664:00 PM 373 373 3735:00 PM 324 324 3246:00 PM 300 300 3007:00 PM 270 270 2708:00 PM 327 327 3279:00 PM 210 210 210
10:00 PM 35 35 3511:00 PM 8 8 8Day Total 6481 6481 6481
% WeekdayAverage 101.2%% WeekAverage 106.0% 100.0%AM Peak 9:00 AM 9:00 AM 9:00 AMVolume 466 466 466
PM Peak 1:00 PM 1:00 PM 1:00 PMVolume 431 431 431
Comments:
Page 2 of 5
Report generated on 5/25/2016 2:29 PM

Type of report: Tube Count - Volume Data
SOURCE: Quality Counts, LLC (http://www.qualitycounts.net)
SUMMARY - Tube Count - Volume Data (Weekday)
LOCATION: Tube Count 1 QC JOB #: 13777707SPECIFIC LOCATION: Tube Count CITY/STATE: Long Beach, CA
DIRECTION: WBDATE: May 17 2016 - May 23 2016
Start TimeMon
23-May-16Tue
17-May-16Wed
18-May-16Thu
19-May-16Fri
20-May-16Average Weekday
Hourly TrafficAverage Weekday
Profile12:00 AM 12 10 12 9 8 10
1:00 AM 10 6 10 14 5 92:00 AM 6 3 8 3 6 53:00 AM 11 9 9 9 9 94:00 AM 81 92 103 95 86 915:00 AM 395 350 357 298 390 3586:00 AM 454 444 398 417 421 4277:00 AM 399 387 330 363 345 3658:00 AM 392 367 381 368 404 3829:00 AM 466 437 457 401 483 449
10:00 AM 407 352 353 400 406 38411:00 AM 392 353 353 367 414 37612:00 PM 414 461 432 408 464 436
1:00 PM 431 396 362 411 409 4022:00 PM 398 369 438 422 441 4143:00 PM 366 328 366 385 393 3684:00 PM 373 338 381 369 426 3775:00 PM 324 278 330 328 347 3216:00 PM 300 337 405 414 402 3727:00 PM 270 296 229 309 298 2808:00 PM 327 231 225 337 383 3019:00 PM 210 208 257 227 236 228
10:00 PM 35 44 33 34 37 3711:00 PM 8 8 35 6 16 15Day Total 6481 6104 6264 6394 6829 6416
% WeekdayAverage 101.0% 95.1% 97.6% 99.7% 106.4%% WeekAverage
AM Peak 9:00 AM 6:00 AM 9:00 AM 6:00 AM 9:00 AM 9:00 AMVolume 466 444 457 417 483 449
PM Peak 1:00 PM 12:00 PM 2:00 PM 2:00 PM 12:00 PM 12:00 PMVolume 431 461 438 422 464 436
Comments:
Page 3 of 5
Report generated on 5/25/2016 2:29 PM

Type of report: Tube Count - Volume Data
SOURCE: Quality Counts, LLC (http://www.qualitycounts.net)
SUMMARY - Tube Count - Volume Data (Weekend)
LOCATION: Tube Count 1 QC JOB #: 13777707SPECIFIC LOCATION: Tube Count CITY/STATE: Long Beach, CA
DIRECTION: WBDATE: May 21 2016 - May 22 2016
Start TimeSat
21-May-16Sun
22-May-16Average Weekend
Hourly TrafficAverage Weekend
Profile12:00 AM 7 8 8
1:00 AM 8 8 82:00 AM 3 2 33:00 AM 6 11 94:00 AM 88 75 825:00 AM 330 276 3036:00 AM 256 251 2547:00 AM 267 225 2468:00 AM 283 277 2809:00 AM 440 377 409
10:00 AM 383 351 36711:00 AM 300 305 30312:00 PM 325 334 330
1:00 PM 347 344 3462:00 PM 359 413 3863:00 PM 347 354 3514:00 PM 337 414 3765:00 PM 299 345 3226:00 PM 277 339 3087:00 PM 201 406 3048:00 PM 323 306 3159:00 PM 177 196 187
10:00 PM 19 31 2511:00 PM 15 13 14Day Total 5397 5661 5536
% WeekdayAverage
% WeekAverage 97.5% 102.3%AM Peak 9:00 AM 9:00 AM 9:00 AMVolume 440 377 409
PM Peak 2:00 PM 4:00 PM 2:00 PMVolume 359 414 386
Comments:
Page 4 of 5
Report generated on 5/25/2016 2:29 PM
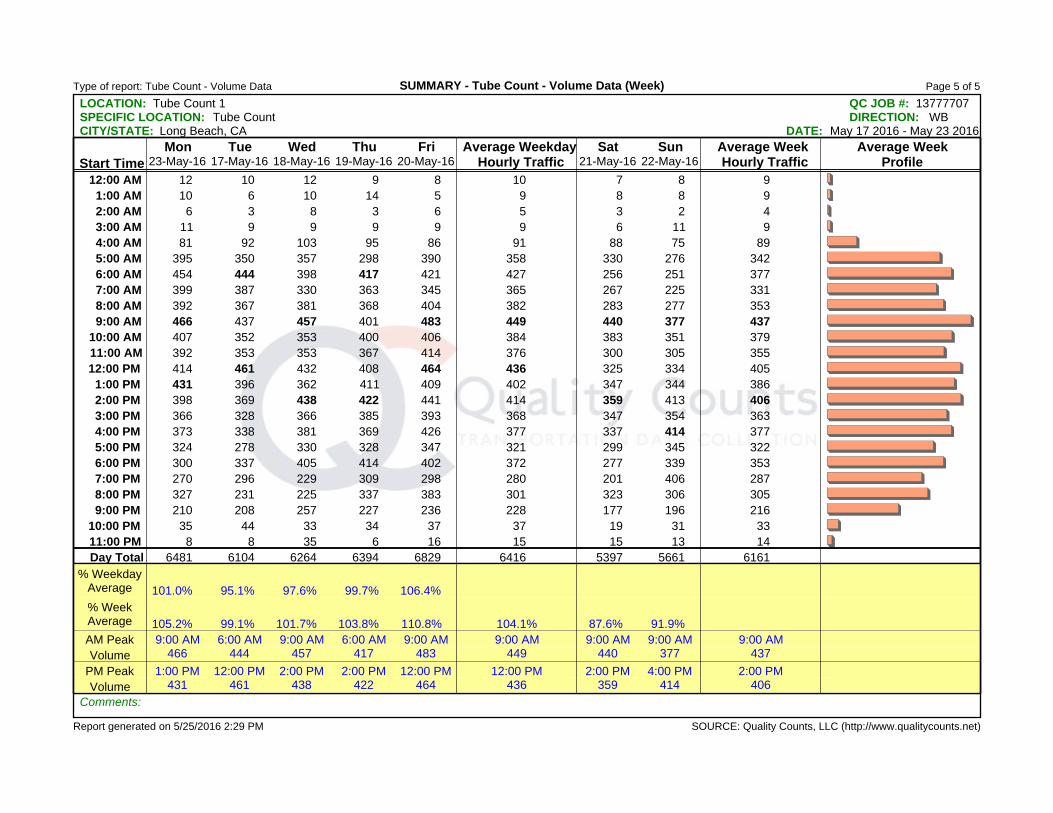
Type of report: Tube Count - Volume Data
SOURCE: Quality Counts, LLC (http://www.qualitycounts.net)
SUMMARY - Tube Count - Volume Data (Week)
LOCATION: Tube Count 1 QC JOB #: 13777707SPECIFIC LOCATION: Tube Count CITY/STATE: Long Beach, CA
DIRECTION: WBDATE: May 17 2016 - May 23 2016
Start TimeMon
23-May-16Tue
17-May-16Wed
18-May-16Thu
19-May-16Fri
20-May-16Average Weekday
Hourly TrafficSat
21-May-16Sun
22-May-16Average WeekHourly Traffic
Average WeekProfile
12:00 AM 12 10 12 9 8 10 7 8 91:00 AM 10 6 10 14 5 9 8 8 92:00 AM 6 3 8 3 6 5 3 2 43:00 AM 11 9 9 9 9 9 6 11 94:00 AM 81 92 103 95 86 91 88 75 895:00 AM 395 350 357 298 390 358 330 276 3426:00 AM 454 444 398 417 421 427 256 251 3777:00 AM 399 387 330 363 345 365 267 225 3318:00 AM 392 367 381 368 404 382 283 277 3539:00 AM 466 437 457 401 483 449 440 377 437
10:00 AM 407 352 353 400 406 384 383 351 37911:00 AM 392 353 353 367 414 376 300 305 35512:00 PM 414 461 432 408 464 436 325 334 405
1:00 PM 431 396 362 411 409 402 347 344 3862:00 PM 398 369 438 422 441 414 359 413 4063:00 PM 366 328 366 385 393 368 347 354 3634:00 PM 373 338 381 369 426 377 337 414 3775:00 PM 324 278 330 328 347 321 299 345 3226:00 PM 300 337 405 414 402 372 277 339 3537:00 PM 270 296 229 309 298 280 201 406 2878:00 PM 327 231 225 337 383 301 323 306 3059:00 PM 210 208 257 227 236 228 177 196 216
10:00 PM 35 44 33 34 37 37 19 31 3311:00 PM 8 8 35 6 16 15 15 13 14Day Total 6481 6104 6264 6394 6829 6416 5397 5661 6161
% WeekdayAverage 101.0% 95.1% 97.6% 99.7% 106.4%% WeekAverage 105.2% 99.1% 101.7% 103.8% 110.8% 104.1% 87.6% 91.9%AM Peak 9:00 AM 6:00 AM 9:00 AM 6:00 AM 9:00 AM 9:00 AM 9:00 AM 9:00 AM 9:00 AMVolume 466 444 457 417 483 449 440 377 437
PM Peak 1:00 PM 12:00 PM 2:00 PM 2:00 PM 12:00 PM 12:00 PM 2:00 PM 4:00 PM 2:00 PMVolume 431 461 438 422 464 436 359 414 406
Comments:
Page 5 of 5
Report generated on 5/25/2016 2:29 PM

Type of report: Tube Count - Volume Data
SOURCE: Quality Counts, LLC (http://www.qualitycounts.net)
LOCATION: Tube Count 9 QC JOB #: 13777708SPECIFIC LOCATION: Tube Count 9CITY/STATE: Long Beach, CA
DIRECTION: EBDATE: May 17 2016 - May 22 2016
Start TimeMon Tue
17-May-16Wed
18-May-16Thu
19-May-16Fri
20-May-16Average Weekday
Hourly TrafficSat
21-May-16Sun
22-May-16Average WeekHourly Traffic
Average Week Profile
12:00 AM 11 12 19 10 13 10 1 111:00 AM 10 11 15 11 12 9 9 112:00 AM 6 11 3 2 6 8 9 73:00 AM 6 1 6 4 4 6 6 54:00 AM 9 11 14 16 13 17 18 145:00 AM 84 81 80 110 89 112 99 946:00 AM 134 102 110 127 118 119 122 1197:00 AM 184 163 158 169 169 154 174 1678:00 AM 187 197 213 250 212 234 161 2079:00 AM 315 333 282 305 309 295 270 300
10:00 AM 295 312 332 354 323 349 264 31811:00 AM 270 247 332 339 297 279 249 28612:00 PM 284 260 226 249 255 208 223 242
1:00 PM 306 262 280 292 285 288 244 2792:00 PM 303 345 355 338 335 335 364 3403:00 PM 340 339 367 372 355 255 303 3294:00 PM 290 340 288 344 316 259 317 3065:00 PM 216 289 266 302 268 270 236 2636:00 PM 286 354 363 312 329 228 299 3077:00 PM 266 192 197 245 225 175 341 2368:00 PM 212 165 201 312 223 221 245 2269:00 PM 229 348 316 292 296 233 261 280
10:00 PM 123 67 55 73 80 40 54 6911:00 PM 46 73 59 49 57 20 13 43Day Total 4412 4515 4537 4877 4589 4124 4282 4459
% WeekdayAverage 96.1% 98.4% 98.9% 106.3%% WeekAverage 98.9% 101.3% 101.7% 109.4% 102.9% 92.5% 96.0%AM Peak 9:00 AM 9:00 AM 10:00 AM 10:00 AM 10:00 AM 10:00 AM 9:00 AM 10:00 AMVolume 315 333 332 354 323 349 270 318
PM Peak 3:00 PM 6:00 PM 3:00 PM 3:00 PM 3:00 PM 2:00 PM 2:00 PM 2:00 PMVolume 340 354 367 372 355 335 364 340
Comments:
Page 1 of 5
Report generated on 5/25/2016 2:29 PM

Type of report: Tube Count - Volume Data
SOURCE: Quality Counts, LLC (http://www.qualitycounts.net)
LOCATION: Tube Count 9 QC JOB #: 13777708SPECIFIC LOCATION: Tube Count 9CITY/STATE: Long Beach, CA
DIRECTION: EBDATE: May 23 2016 - May 23 2016
Start TimeMon
23-May-16Tue Wed Thu Fri Average Weekday
Hourly TrafficSat Sun Average Week
Hourly TrafficAverage Week Profile
12:00 AM 4 4 41:00 AM 15 15 152:00 AM 12 12 123:00 AM 5 5 54:00 AM 11 11 115:00 AM 118 118 1186:00 AM 150 150 1507:00 AM 197 197 1978:00 AM 208 208 2089:00 AM 334 334 334
10:00 AM 304 304 30411:00 AM 332 332 33212:00 PM 290 290 290
1:00 PM 308 308 3082:00 PM 311 311 3113:00 PM 344 344 3444:00 PM 330 330 3305:00 PM 251 251 2516:00 PM 296 296 2967:00 PM 170 170 1708:00 PM 270 270 2709:00 PM 257 257 257
10:00 PM 57 57 5711:00 PM 55 55 55Day Total 4629 4629 4629
% WeekdayAverage 100.9%% WeekAverage 103.8% 100.0%AM Peak 9:00 AM 9:00 AM 9:00 AMVolume 334 334 334
PM Peak 3:00 PM 3:00 PM 3:00 PMVolume 344 344 344
Comments:
Page 2 of 5
Report generated on 5/25/2016 2:29 PM
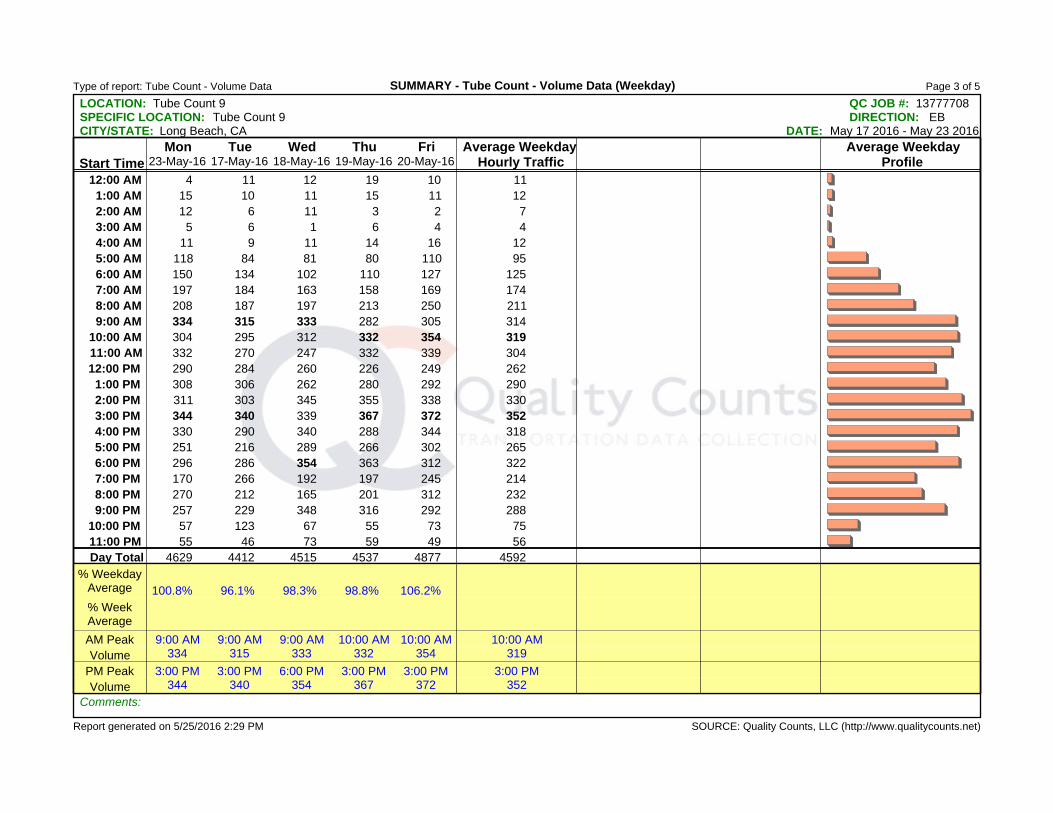
Type of report: Tube Count - Volume Data
SOURCE: Quality Counts, LLC (http://www.qualitycounts.net)
SUMMARY - Tube Count - Volume Data (Weekday)
LOCATION: Tube Count 9 QC JOB #: 13777708SPECIFIC LOCATION: Tube Count 9CITY/STATE: Long Beach, CA
DIRECTION: EBDATE: May 17 2016 - May 23 2016
Start TimeMon
23-May-16Tue
17-May-16Wed
18-May-16Thu
19-May-16Fri
20-May-16Average Weekday
Hourly TrafficAverage Weekday
Profile12:00 AM 4 11 12 19 10 11
1:00 AM 15 10 11 15 11 122:00 AM 12 6 11 3 2 73:00 AM 5 6 1 6 4 44:00 AM 11 9 11 14 16 125:00 AM 118 84 81 80 110 956:00 AM 150 134 102 110 127 1257:00 AM 197 184 163 158 169 1748:00 AM 208 187 197 213 250 2119:00 AM 334 315 333 282 305 314
10:00 AM 304 295 312 332 354 31911:00 AM 332 270 247 332 339 30412:00 PM 290 284 260 226 249 262
1:00 PM 308 306 262 280 292 2902:00 PM 311 303 345 355 338 3303:00 PM 344 340 339 367 372 3524:00 PM 330 290 340 288 344 3185:00 PM 251 216 289 266 302 2656:00 PM 296 286 354 363 312 3227:00 PM 170 266 192 197 245 2148:00 PM 270 212 165 201 312 2329:00 PM 257 229 348 316 292 288
10:00 PM 57 123 67 55 73 7511:00 PM 55 46 73 59 49 56Day Total 4629 4412 4515 4537 4877 4592
% WeekdayAverage 100.8% 96.1% 98.3% 98.8% 106.2%% WeekAverage
AM Peak 9:00 AM 9:00 AM 9:00 AM 10:00 AM 10:00 AM 10:00 AMVolume 334 315 333 332 354 319
PM Peak 3:00 PM 3:00 PM 6:00 PM 3:00 PM 3:00 PM 3:00 PMVolume 344 340 354 367 372 352
Comments:
Page 3 of 5
Report generated on 5/25/2016 2:29 PM

Type of report: Tube Count - Volume Data
SOURCE: Quality Counts, LLC (http://www.qualitycounts.net)
SUMMARY - Tube Count - Volume Data (Weekend)
LOCATION: Tube Count 9 QC JOB #: 13777708SPECIFIC LOCATION: Tube Count 9CITY/STATE: Long Beach, CA
DIRECTION: EBDATE: May 21 2016 - May 22 2016
Start TimeSat
21-May-16Sun
22-May-16Average Weekend
Hourly TrafficAverage Weekend
Profile12:00 AM 10 1 6
1:00 AM 9 9 92:00 AM 8 9 93:00 AM 6 6 64:00 AM 17 18 185:00 AM 112 99 1066:00 AM 119 122 1217:00 AM 154 174 1648:00 AM 234 161 1989:00 AM 295 270 283
10:00 AM 349 264 30711:00 AM 279 249 26412:00 PM 208 223 216
1:00 PM 288 244 2662:00 PM 335 364 3503:00 PM 255 303 2794:00 PM 259 317 2885:00 PM 270 236 2536:00 PM 228 299 2647:00 PM 175 341 2588:00 PM 221 245 2339:00 PM 233 261 247
10:00 PM 40 54 4711:00 PM 20 13 17Day Total 4124 4282 4209
% WeekdayAverage
% WeekAverage 98.0% 101.7%AM Peak 10:00 AM 9:00 AM 10:00 AMVolume 349 270 307
PM Peak 2:00 PM 2:00 PM 2:00 PMVolume 335 364 350
Comments:
Page 4 of 5
Report generated on 5/25/2016 2:29 PM

Type of report: Tube Count - Volume Data
SOURCE: Quality Counts, LLC (http://www.qualitycounts.net)
SUMMARY - Tube Count - Volume Data (Week)
LOCATION: Tube Count 9 QC JOB #: 13777708SPECIFIC LOCATION: Tube Count 9CITY/STATE: Long Beach, CA
DIRECTION: EBDATE: May 17 2016 - May 23 2016
Start TimeMon
23-May-16Tue
17-May-16Wed
18-May-16Thu
19-May-16Fri
20-May-16Average Weekday
Hourly TrafficSat
21-May-16Sun
22-May-16Average WeekHourly Traffic
Average WeekProfile
12:00 AM 4 11 12 19 10 11 10 1 101:00 AM 15 10 11 15 11 12 9 9 112:00 AM 12 6 11 3 2 7 8 9 73:00 AM 5 6 1 6 4 4 6 6 54:00 AM 11 9 11 14 16 12 17 18 145:00 AM 118 84 81 80 110 95 112 99 986:00 AM 150 134 102 110 127 125 119 122 1237:00 AM 197 184 163 158 169 174 154 174 1718:00 AM 208 187 197 213 250 211 234 161 2079:00 AM 334 315 333 282 305 314 295 270 305
10:00 AM 304 295 312 332 354 319 349 264 31611:00 AM 332 270 247 332 339 304 279 249 29312:00 PM 290 284 260 226 249 262 208 223 249
1:00 PM 308 306 262 280 292 290 288 244 2832:00 PM 311 303 345 355 338 330 335 364 3363:00 PM 344 340 339 367 372 352 255 303 3314:00 PM 330 290 340 288 344 318 259 317 3105:00 PM 251 216 289 266 302 265 270 236 2616:00 PM 296 286 354 363 312 322 228 299 3057:00 PM 170 266 192 197 245 214 175 341 2278:00 PM 270 212 165 201 312 232 221 245 2329:00 PM 257 229 348 316 292 288 233 261 277
10:00 PM 57 123 67 55 73 75 40 54 6711:00 PM 55 46 73 59 49 56 20 13 45Day Total 4629 4412 4515 4537 4877 4592 4124 4282 4483
% WeekdayAverage 100.8% 96.1% 98.3% 98.8% 106.2%% WeekAverage 103.3% 98.4% 100.7% 101.2% 108.8% 102.4% 92.0% 95.5%AM Peak 9:00 AM 9:00 AM 9:00 AM 10:00 AM 10:00 AM 10:00 AM 10:00 AM 9:00 AM 10:00 AMVolume 334 315 333 332 354 319 349 270 316
PM Peak 3:00 PM 3:00 PM 6:00 PM 3:00 PM 3:00 PM 3:00 PM 2:00 PM 2:00 PM 2:00 PMVolume 344 340 354 367 372 352 335 364 336
Comments:
Page 5 of 5
Report generated on 5/25/2016 2:29 PM
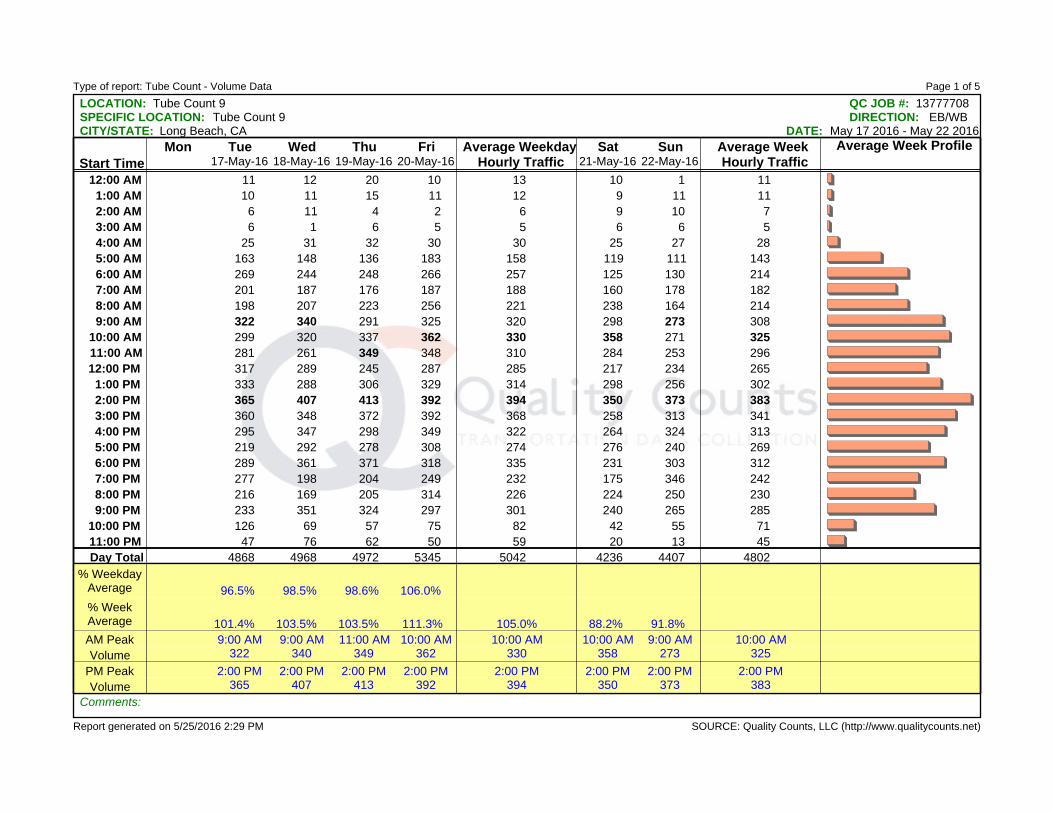
Type of report: Tube Count - Volume Data
SOURCE: Quality Counts, LLC (http://www.qualitycounts.net)
LOCATION: Tube Count 9 QC JOB #: 13777708SPECIFIC LOCATION: Tube Count 9CITY/STATE: Long Beach, CA
DIRECTION: EB/WBDATE: May 17 2016 - May 22 2016
Start TimeMon Tue
17-May-16Wed
18-May-16Thu
19-May-16Fri
20-May-16Average Weekday
Hourly TrafficSat
21-May-16Sun
22-May-16Average WeekHourly Traffic
Average Week Profile
12:00 AM 11 12 20 10 13 10 1 111:00 AM 10 11 15 11 12 9 11 112:00 AM 6 11 4 2 6 9 10 73:00 AM 6 1 6 5 5 6 6 54:00 AM 25 31 32 30 30 25 27 285:00 AM 163 148 136 183 158 119 111 1436:00 AM 269 244 248 266 257 125 130 2147:00 AM 201 187 176 187 188 160 178 1828:00 AM 198 207 223 256 221 238 164 2149:00 AM 322 340 291 325 320 298 273 308
10:00 AM 299 320 337 362 330 358 271 32511:00 AM 281 261 349 348 310 284 253 29612:00 PM 317 289 245 287 285 217 234 265
1:00 PM 333 288 306 329 314 298 256 3022:00 PM 365 407 413 392 394 350 373 3833:00 PM 360 348 372 392 368 258 313 3414:00 PM 295 347 298 349 322 264 324 3135:00 PM 219 292 278 308 274 276 240 2696:00 PM 289 361 371 318 335 231 303 3127:00 PM 277 198 204 249 232 175 346 2428:00 PM 216 169 205 314 226 224 250 2309:00 PM 233 351 324 297 301 240 265 285
10:00 PM 126 69 57 75 82 42 55 7111:00 PM 47 76 62 50 59 20 13 45Day Total 4868 4968 4972 5345 5042 4236 4407 4802
% WeekdayAverage 96.5% 98.5% 98.6% 106.0%% WeekAverage 101.4% 103.5% 103.5% 111.3% 105.0% 88.2% 91.8%AM Peak 9:00 AM 9:00 AM 11:00 AM 10:00 AM 10:00 AM 10:00 AM 9:00 AM 10:00 AMVolume 322 340 349 362 330 358 273 325
PM Peak 2:00 PM 2:00 PM 2:00 PM 2:00 PM 2:00 PM 2:00 PM 2:00 PM 2:00 PMVolume 365 407 413 392 394 350 373 383
Comments:
Page 1 of 5
Report generated on 5/25/2016 2:29 PM

Type of report: Tube Count - Volume Data
SOURCE: Quality Counts, LLC (http://www.qualitycounts.net)
LOCATION: Tube Count 9 QC JOB #: 13777708SPECIFIC LOCATION: Tube Count 9CITY/STATE: Long Beach, CA
DIRECTION: EB/WBDATE: May 23 2016 - May 23 2016
Start TimeMon
23-May-16Tue Wed Thu Fri Average Weekday
Hourly TrafficSat Sun Average Week
Hourly TrafficAverage Week Profile
12:00 AM 4 4 41:00 AM 15 15 152:00 AM 12 12 123:00 AM 5 5 54:00 AM 31 31 315:00 AM 192 192 1926:00 AM 298 298 2987:00 AM 225 225 2258:00 AM 218 218 2189:00 AM 342 342 342
10:00 AM 312 312 31211:00 AM 354 354 35412:00 PM 317 317 317
1:00 PM 334 334 3342:00 PM 380 380 3803:00 PM 364 364 3644:00 PM 335 335 3355:00 PM 260 260 2606:00 PM 298 298 2987:00 PM 176 176 1768:00 PM 273 273 2739:00 PM 258 258 258
10:00 PM 59 59 5911:00 PM 55 55 55Day Total 5117 5117 5117
% WeekdayAverage 101.5%% WeekAverage 106.6% 100.0%AM Peak 11:00 AM 11:00 AM 11:00 AMVolume 354 354 354
PM Peak 2:00 PM 2:00 PM 2:00 PMVolume 380 380 380
Comments:
Page 2 of 5
Report generated on 5/25/2016 2:29 PM

Type of report: Tube Count - Volume Data
SOURCE: Quality Counts, LLC (http://www.qualitycounts.net)
SUMMARY - Tube Count - Volume Data (Weekday)
LOCATION: Tube Count 9 QC JOB #: 13777708SPECIFIC LOCATION: Tube Count 9CITY/STATE: Long Beach, CA
DIRECTION: EB/WBDATE: May 17 2016 - May 23 2016
Start TimeMon
23-May-16Tue
17-May-16Wed
18-May-16Thu
19-May-16Fri
20-May-16Average Weekday
Hourly TrafficAverage Weekday
Profile12:00 AM 4 11 12 20 10 11
1:00 AM 15 10 11 15 11 122:00 AM 12 6 11 4 2 73:00 AM 5 6 1 6 5 54:00 AM 31 25 31 32 30 305:00 AM 192 163 148 136 183 1646:00 AM 298 269 244 248 266 2657:00 AM 225 201 187 176 187 1958:00 AM 218 198 207 223 256 2209:00 AM 342 322 340 291 325 324
10:00 AM 312 299 320 337 362 32611:00 AM 354 281 261 349 348 31912:00 PM 317 317 289 245 287 291
1:00 PM 334 333 288 306 329 3182:00 PM 380 365 407 413 392 3913:00 PM 364 360 348 372 392 3674:00 PM 335 295 347 298 349 3255:00 PM 260 219 292 278 308 2716:00 PM 298 289 361 371 318 3277:00 PM 176 277 198 204 249 2218:00 PM 273 216 169 205 314 2359:00 PM 258 233 351 324 297 293
10:00 PM 59 126 69 57 75 7711:00 PM 55 47 76 62 50 58Day Total 5117 4868 4968 4972 5345 5052
% WeekdayAverage 101.3% 96.4% 98.3% 98.4% 105.8%% WeekAverage
AM Peak 11:00 AM 9:00 AM 9:00 AM 11:00 AM 10:00 AM 10:00 AMVolume 354 322 340 349 362 326
PM Peak 2:00 PM 2:00 PM 2:00 PM 2:00 PM 2:00 PM 2:00 PMVolume 380 365 407 413 392 391
Comments:
Page 3 of 5
Report generated on 5/25/2016 2:29 PM
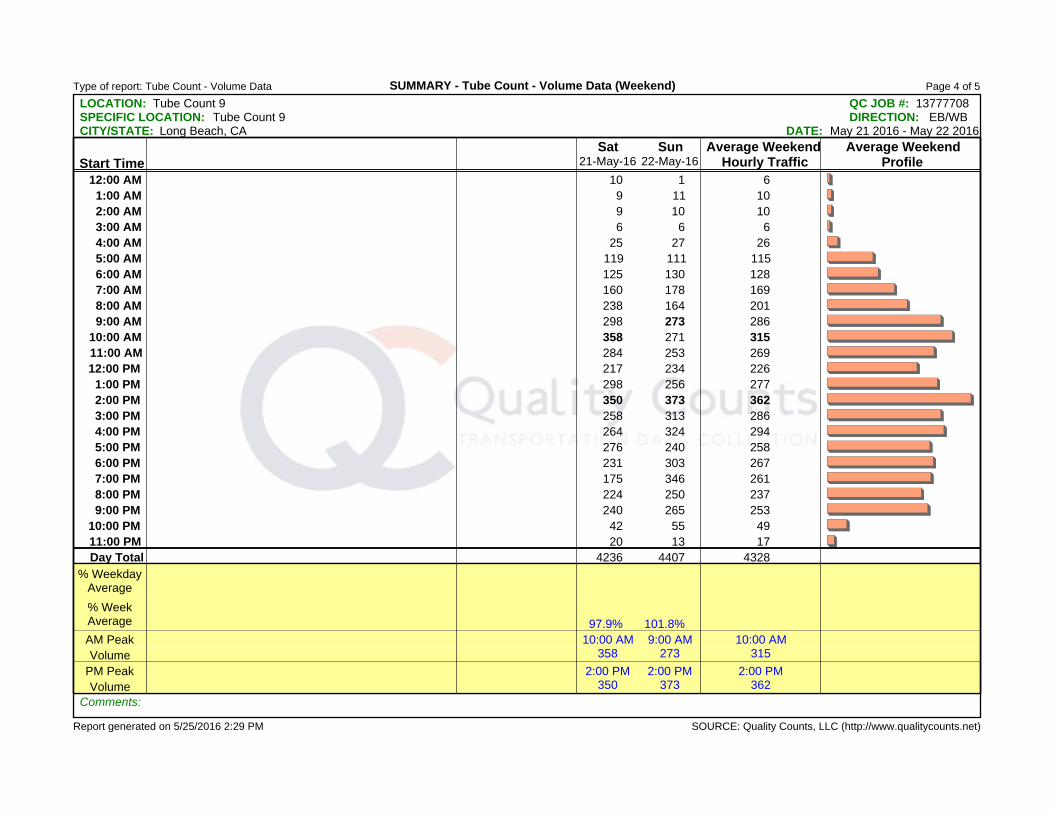
Type of report: Tube Count - Volume Data
SOURCE: Quality Counts, LLC (http://www.qualitycounts.net)
SUMMARY - Tube Count - Volume Data (Weekend)
LOCATION: Tube Count 9 QC JOB #: 13777708SPECIFIC LOCATION: Tube Count 9CITY/STATE: Long Beach, CA
DIRECTION: EB/WBDATE: May 21 2016 - May 22 2016
Start TimeSat
21-May-16Sun
22-May-16Average Weekend
Hourly TrafficAverage Weekend
Profile12:00 AM 10 1 6
1:00 AM 9 11 102:00 AM 9 10 103:00 AM 6 6 64:00 AM 25 27 265:00 AM 119 111 1156:00 AM 125 130 1287:00 AM 160 178 1698:00 AM 238 164 2019:00 AM 298 273 286
10:00 AM 358 271 31511:00 AM 284 253 26912:00 PM 217 234 226
1:00 PM 298 256 2772:00 PM 350 373 3623:00 PM 258 313 2864:00 PM 264 324 2945:00 PM 276 240 2586:00 PM 231 303 2677:00 PM 175 346 2618:00 PM 224 250 2379:00 PM 240 265 253
10:00 PM 42 55 4911:00 PM 20 13 17Day Total 4236 4407 4328
% WeekdayAverage
% WeekAverage 97.9% 101.8%AM Peak 10:00 AM 9:00 AM 10:00 AMVolume 358 273 315
PM Peak 2:00 PM 2:00 PM 2:00 PMVolume 350 373 362
Comments:
Page 4 of 5
Report generated on 5/25/2016 2:29 PM

Type of report: Tube Count - Volume Data
SOURCE: Quality Counts, LLC (http://www.qualitycounts.net)
SUMMARY - Tube Count - Volume Data (Week)
LOCATION: Tube Count 9 QC JOB #: 13777708SPECIFIC LOCATION: Tube Count 9CITY/STATE: Long Beach, CA
DIRECTION: EB/WBDATE: May 17 2016 - May 23 2016
Start TimeMon
23-May-16Tue
17-May-16Wed
18-May-16Thu
19-May-16Fri
20-May-16Average Weekday
Hourly TrafficSat
21-May-16Sun
22-May-16Average WeekHourly Traffic
Average WeekProfile
12:00 AM 4 11 12 20 10 11 10 1 101:00 AM 15 10 11 15 11 12 9 11 122:00 AM 12 6 11 4 2 7 9 10 83:00 AM 5 6 1 6 5 5 6 6 54:00 AM 31 25 31 32 30 30 25 27 295:00 AM 192 163 148 136 183 164 119 111 1506:00 AM 298 269 244 248 266 265 125 130 2267:00 AM 225 201 187 176 187 195 160 178 1888:00 AM 218 198 207 223 256 220 238 164 2159:00 AM 342 322 340 291 325 324 298 273 313
10:00 AM 312 299 320 337 362 326 358 271 32311:00 AM 354 281 261 349 348 319 284 253 30412:00 PM 317 317 289 245 287 291 217 234 272
1:00 PM 334 333 288 306 329 318 298 256 3062:00 PM 380 365 407 413 392 391 350 373 3833:00 PM 364 360 348 372 392 367 258 313 3444:00 PM 335 295 347 298 349 325 264 324 3165:00 PM 260 219 292 278 308 271 276 240 2686:00 PM 298 289 361 371 318 327 231 303 3107:00 PM 176 277 198 204 249 221 175 346 2328:00 PM 273 216 169 205 314 235 224 250 2369:00 PM 258 233 351 324 297 293 240 265 281
10:00 PM 59 126 69 57 75 77 42 55 6911:00 PM 55 47 76 62 50 58 20 13 46Day Total 5117 4868 4968 4972 5345 5052 4236 4407 4846
% WeekdayAverage 101.3% 96.4% 98.3% 98.4% 105.8%% WeekAverage 105.6% 100.5% 102.5% 102.6% 110.3% 104.3% 87.4% 90.9%AM Peak 11:00 AM 9:00 AM 9:00 AM 11:00 AM 10:00 AM 10:00 AM 10:00 AM 9:00 AM 10:00 AMVolume 354 322 340 349 362 326 358 273 323
PM Peak 2:00 PM 2:00 PM 2:00 PM 2:00 PM 2:00 PM 2:00 PM 2:00 PM 2:00 PM 2:00 PMVolume 380 365 407 413 392 391 350 373 383
Comments:
Page 5 of 5
Report generated on 5/25/2016 2:29 PM
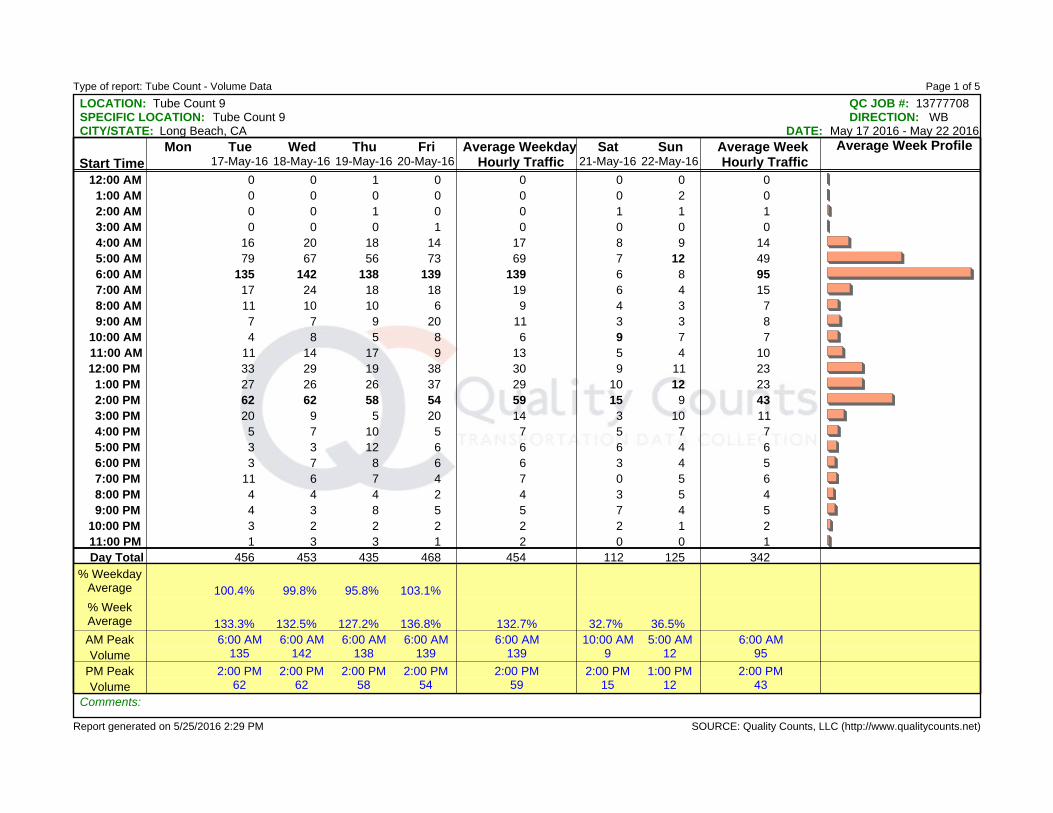
Type of report: Tube Count - Volume Data
SOURCE: Quality Counts, LLC (http://www.qualitycounts.net)
LOCATION: Tube Count 9 QC JOB #: 13777708SPECIFIC LOCATION: Tube Count 9CITY/STATE: Long Beach, CA
DIRECTION: WBDATE: May 17 2016 - May 22 2016
Start TimeMon Tue
17-May-16Wed
18-May-16Thu
19-May-16Fri
20-May-16Average Weekday
Hourly TrafficSat
21-May-16Sun
22-May-16Average WeekHourly Traffic
Average Week Profile
12:00 AM 0 0 1 0 0 0 0 01:00 AM 0 0 0 0 0 0 2 02:00 AM 0 0 1 0 0 1 1 13:00 AM 0 0 0 1 0 0 0 04:00 AM 16 20 18 14 17 8 9 145:00 AM 79 67 56 73 69 7 12 496:00 AM 135 142 138 139 139 6 8 957:00 AM 17 24 18 18 19 6 4 158:00 AM 11 10 10 6 9 4 3 79:00 AM 7 7 9 20 11 3 3 8
10:00 AM 4 8 5 8 6 9 7 711:00 AM 11 14 17 9 13 5 4 1012:00 PM 33 29 19 38 30 9 11 23
1:00 PM 27 26 26 37 29 10 12 232:00 PM 62 62 58 54 59 15 9 433:00 PM 20 9 5 20 14 3 10 114:00 PM 5 7 10 5 7 5 7 75:00 PM 3 3 12 6 6 6 4 66:00 PM 3 7 8 6 6 3 4 57:00 PM 11 6 7 4 7 0 5 68:00 PM 4 4 4 2 4 3 5 49:00 PM 4 3 8 5 5 7 4 5
10:00 PM 3 2 2 2 2 2 1 211:00 PM 1 3 3 1 2 0 0 1Day Total 456 453 435 468 454 112 125 342
% WeekdayAverage 100.4% 99.8% 95.8% 103.1%% WeekAverage 133.3% 132.5% 127.2% 136.8% 132.7% 32.7% 36.5%AM Peak 6:00 AM 6:00 AM 6:00 AM 6:00 AM 6:00 AM 10:00 AM 5:00 AM 6:00 AMVolume 135 142 138 139 139 9 12 95
PM Peak 2:00 PM 2:00 PM 2:00 PM 2:00 PM 2:00 PM 2:00 PM 1:00 PM 2:00 PMVolume 62 62 58 54 59 15 12 43
Comments:
Page 1 of 5
Report generated on 5/25/2016 2:29 PM

Type of report: Tube Count - Volume Data
SOURCE: Quality Counts, LLC (http://www.qualitycounts.net)
LOCATION: Tube Count 9 QC JOB #: 13777708SPECIFIC LOCATION: Tube Count 9CITY/STATE: Long Beach, CA
DIRECTION: WBDATE: May 23 2016 - May 23 2016
Start TimeMon
23-May-16Tue Wed Thu Fri Average Weekday
Hourly TrafficSat Sun Average Week
Hourly TrafficAverage Week Profile
12:00 AM 0 0 01:00 AM 0 0 02:00 AM 0 0 03:00 AM 0 0 04:00 AM 20 20 205:00 AM 74 74 746:00 AM 148 148 1487:00 AM 28 28 288:00 AM 10 10 109:00 AM 8 8 8
10:00 AM 8 8 811:00 AM 22 22 2212:00 PM 27 27 27
1:00 PM 26 26 262:00 PM 69 69 693:00 PM 20 20 204:00 PM 5 5 55:00 PM 9 9 96:00 PM 2 2 27:00 PM 6 6 68:00 PM 3 3 39:00 PM 1 1 1
10:00 PM 2 2 211:00 PM 0 0 0Day Total 488 488 488
% WeekdayAverage 107.5%% WeekAverage 142.7% 100.0%AM Peak 6:00 AM 6:00 AM 6:00 AMVolume 148 148 148
PM Peak 2:00 PM 2:00 PM 2:00 PMVolume 69 69 69
Comments:
Page 2 of 5
Report generated on 5/25/2016 2:29 PM
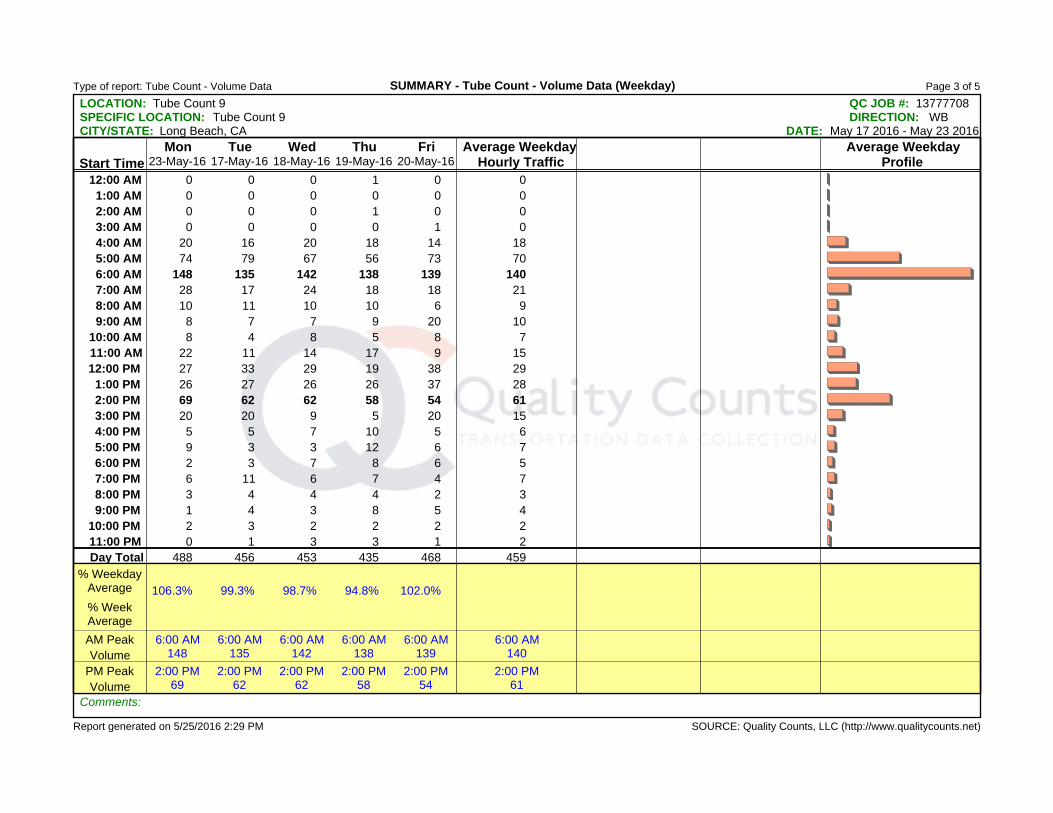
Type of report: Tube Count - Volume Data
SOURCE: Quality Counts, LLC (http://www.qualitycounts.net)
SUMMARY - Tube Count - Volume Data (Weekday)
LOCATION: Tube Count 9 QC JOB #: 13777708SPECIFIC LOCATION: Tube Count 9CITY/STATE: Long Beach, CA
DIRECTION: WBDATE: May 17 2016 - May 23 2016
Start TimeMon
23-May-16Tue
17-May-16Wed
18-May-16Thu
19-May-16Fri
20-May-16Average Weekday
Hourly TrafficAverage Weekday
Profile12:00 AM 0 0 0 1 0 0
1:00 AM 0 0 0 0 0 02:00 AM 0 0 0 1 0 03:00 AM 0 0 0 0 1 04:00 AM 20 16 20 18 14 185:00 AM 74 79 67 56 73 706:00 AM 148 135 142 138 139 1407:00 AM 28 17 24 18 18 218:00 AM 10 11 10 10 6 99:00 AM 8 7 7 9 20 10
10:00 AM 8 4 8 5 8 711:00 AM 22 11 14 17 9 1512:00 PM 27 33 29 19 38 29
1:00 PM 26 27 26 26 37 282:00 PM 69 62 62 58 54 613:00 PM 20 20 9 5 20 154:00 PM 5 5 7 10 5 65:00 PM 9 3 3 12 6 76:00 PM 2 3 7 8 6 57:00 PM 6 11 6 7 4 78:00 PM 3 4 4 4 2 39:00 PM 1 4 3 8 5 4
10:00 PM 2 3 2 2 2 211:00 PM 0 1 3 3 1 2Day Total 488 456 453 435 468 459
% WeekdayAverage 106.3% 99.3% 98.7% 94.8% 102.0%% WeekAverage
AM Peak 6:00 AM 6:00 AM 6:00 AM 6:00 AM 6:00 AM 6:00 AMVolume 148 135 142 138 139 140
PM Peak 2:00 PM 2:00 PM 2:00 PM 2:00 PM 2:00 PM 2:00 PMVolume 69 62 62 58 54 61
Comments:
Page 3 of 5
Report generated on 5/25/2016 2:29 PM
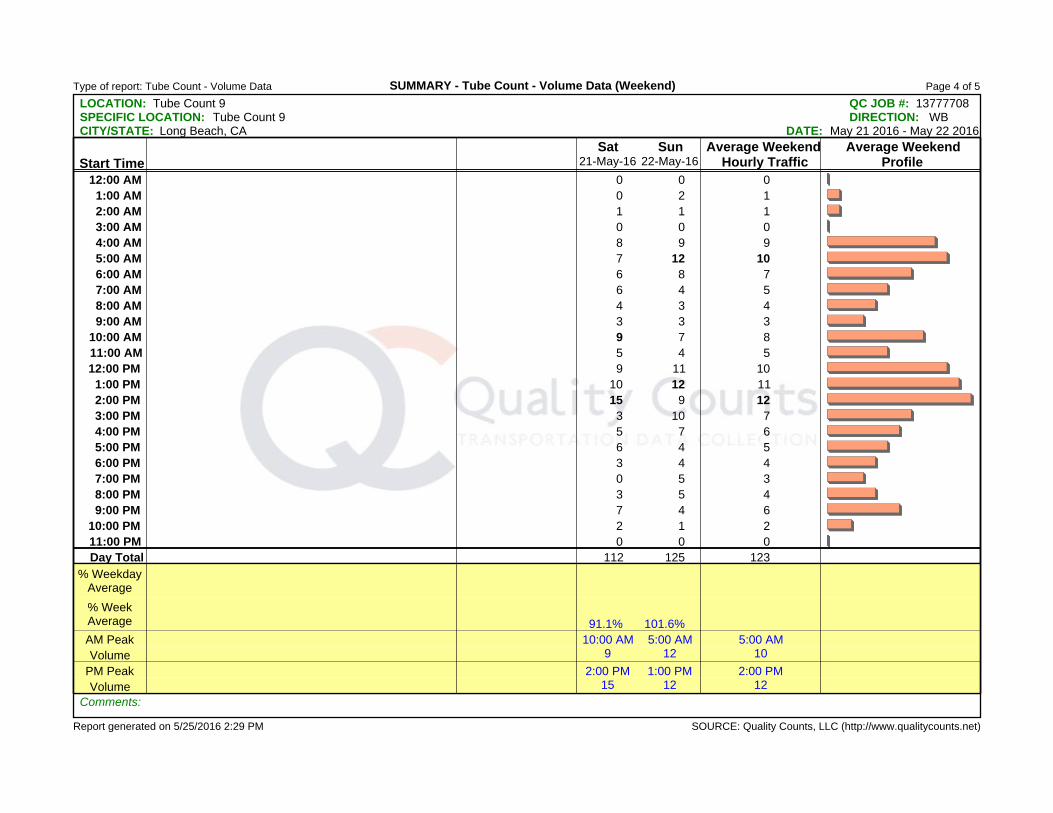
Type of report: Tube Count - Volume Data
SOURCE: Quality Counts, LLC (http://www.qualitycounts.net)
SUMMARY - Tube Count - Volume Data (Weekend)
LOCATION: Tube Count 9 QC JOB #: 13777708SPECIFIC LOCATION: Tube Count 9CITY/STATE: Long Beach, CA
DIRECTION: WBDATE: May 21 2016 - May 22 2016
Start TimeSat
21-May-16Sun
22-May-16Average Weekend
Hourly TrafficAverage Weekend
Profile12:00 AM 0 0 0
1:00 AM 0 2 12:00 AM 1 1 13:00 AM 0 0 04:00 AM 8 9 95:00 AM 7 12 106:00 AM 6 8 77:00 AM 6 4 58:00 AM 4 3 49:00 AM 3 3 3
10:00 AM 9 7 811:00 AM 5 4 512:00 PM 9 11 10
1:00 PM 10 12 112:00 PM 15 9 123:00 PM 3 10 74:00 PM 5 7 65:00 PM 6 4 56:00 PM 3 4 47:00 PM 0 5 38:00 PM 3 5 49:00 PM 7 4 6
10:00 PM 2 1 211:00 PM 0 0 0Day Total 112 125 123
% WeekdayAverage
% WeekAverage 91.1% 101.6%AM Peak 10:00 AM 5:00 AM 5:00 AMVolume 9 12 10
PM Peak 2:00 PM 1:00 PM 2:00 PMVolume 15 12 12
Comments:
Page 4 of 5
Report generated on 5/25/2016 2:29 PM

Type of report: Tube Count - Volume Data
SOURCE: Quality Counts, LLC (http://www.qualitycounts.net)
SUMMARY - Tube Count - Volume Data (Week)
LOCATION: Tube Count 9 QC JOB #: 13777708SPECIFIC LOCATION: Tube Count 9CITY/STATE: Long Beach, CA
DIRECTION: WBDATE: May 17 2016 - May 23 2016
Start TimeMon
23-May-16Tue
17-May-16Wed
18-May-16Thu
19-May-16Fri
20-May-16Average Weekday
Hourly TrafficSat
21-May-16Sun
22-May-16Average WeekHourly Traffic
Average WeekProfile
12:00 AM 0 0 0 1 0 0 0 0 01:00 AM 0 0 0 0 0 0 0 2 02:00 AM 0 0 0 1 0 0 1 1 03:00 AM 0 0 0 0 1 0 0 0 04:00 AM 20 16 20 18 14 18 8 9 155:00 AM 74 79 67 56 73 70 7 12 536:00 AM 148 135 142 138 139 140 6 8 1027:00 AM 28 17 24 18 18 21 6 4 168:00 AM 10 11 10 10 6 9 4 3 89:00 AM 8 7 7 9 20 10 3 3 8
10:00 AM 8 4 8 5 8 7 9 7 711:00 AM 22 11 14 17 9 15 5 4 1212:00 PM 27 33 29 19 38 29 9 11 24
1:00 PM 26 27 26 26 37 28 10 12 232:00 PM 69 62 62 58 54 61 15 9 473:00 PM 20 20 9 5 20 15 3 10 124:00 PM 5 5 7 10 5 6 5 7 65:00 PM 9 3 3 12 6 7 6 4 66:00 PM 2 3 7 8 6 5 3 4 57:00 PM 6 11 6 7 4 7 0 5 68:00 PM 3 4 4 4 2 3 3 5 49:00 PM 1 4 3 8 5 4 7 4 5
10:00 PM 2 3 2 2 2 2 2 1 211:00 PM 0 1 3 3 1 2 0 0 1Day Total 488 456 453 435 468 459 112 125 362
% WeekdayAverage 106.3% 99.3% 98.7% 94.8% 102.0%% WeekAverage 134.8% 126.0% 125.1% 120.2% 129.3% 126.8% 30.9% 34.5%AM Peak 6:00 AM 6:00 AM 6:00 AM 6:00 AM 6:00 AM 6:00 AM 10:00 AM 5:00 AM 6:00 AMVolume 148 135 142 138 139 140 9 12 102
PM Peak 2:00 PM 2:00 PM 2:00 PM 2:00 PM 2:00 PM 2:00 PM 2:00 PM 1:00 PM 2:00 PMVolume 69 62 62 58 54 61 15 12 47
Comments:
Page 5 of 5
Report generated on 5/25/2016 2:29 PM

Type of report: Tube Count - Volume Data
SOURCE: Quality Counts, LLC (http://www.qualitycounts.net)
LOCATION: Tube Count 2 QC JOB #: 13777709SPECIFIC LOCATION: Tube Count 2CITY/STATE: Long Beach, CA
DIRECTION: NBDATE: May 17 2016 - May 17 2016
Start TimeMon Tue
17-May-16Wed Thu Fri Average Weekday
Hourly TrafficSat Sun Average Week
Hourly TrafficAverage Week Profile
12:00 AM 9 9 91:00 AM 7 7 72:00 AM 2 2 23:00 AM 2 2 24:00 AM 9 9 95:00 AM 49 49 496:00 AM 90 90 907:00 AM 175 175 1758:00 AM 131 131 1319:00 AM 221 221 221
10:00 AM 211 211 21111:00 AM 264 264 26412:00 PM 269 269 269
1:00 PM 253 253 2532:00 PM 283 283 2833:00 PM 405 405 4054:00 PM 307 307 3075:00 PM 272 272 2726:00 PM 330 330 3307:00 PM 254 254 2548:00 PM 149 149 1499:00 PM 292 292 292
10:00 PM 103 103 10311:00 PM 62 62 62Day Total 4149 4149 4149
% WeekdayAverage 100.0%% WeekAverage 100.0% 100.0%AM Peak 11:00 AM 11:00 AM 11:00 AMVolume 264 264 264
PM Peak 3:00 PM 3:00 PM 3:00 PMVolume 405 405 405
Comments:
Page 1 of 1
Report generated on 5/25/2016 2:29 PM

Type of report: Tube Count - Volume Data
SOURCE: Quality Counts, LLC (http://www.qualitycounts.net)
LOCATION: Tube Count 3 QC JOB #: 13777710SPECIFIC LOCATION: Tube Count 3CITY/STATE: Long Beach, CA
DIRECTION: WBDATE: May 17 2016 - May 17 2016
Start TimeMon Tue
17-May-16Wed Thu Fri Average Weekday
Hourly TrafficSat Sun Average Week
Hourly TrafficAverage Week Profile
12:00 AM 11 11 111:00 AM 6 6 62:00 AM 3 3 33:00 AM 9 9 94:00 AM 87 87 875:00 AM 352 352 3526:00 AM 497 497 4977:00 AM 493 493 4938:00 AM 412 412 4129:00 AM 562 562 562
10:00 AM 464 464 46411:00 AM 485 485 48512:00 PM 601 601 601
1:00 PM 499 499 4992:00 PM 484 484 4843:00 PM 403 403 4034:00 PM 453 453 4535:00 PM 432 432 4326:00 PM 502 502 5027:00 PM 417 417 4178:00 PM 290 290 2909:00 PM 376 376 376
10:00 PM 74 74 7411:00 PM 13 13 13Day Total 7925 7925 7925
% WeekdayAverage 100.0%% WeekAverage 100.0% 100.0%AM Peak 9:00 AM 9:00 AM 9:00 AMVolume 562 562 562
PM Peak 12:00 PM 12:00 PM 12:00 PMVolume 601 601 601
Comments:
Page 1 of 1
Report generated on 5/25/2016 2:29 PM
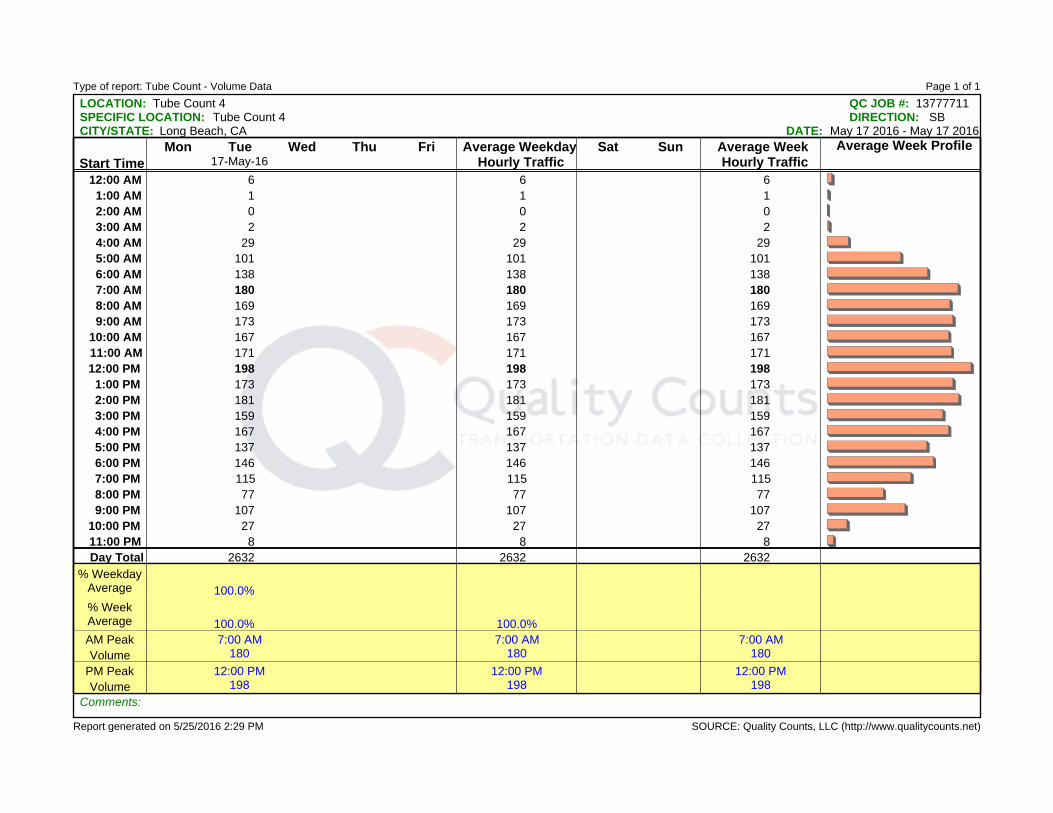
Type of report: Tube Count - Volume Data
SOURCE: Quality Counts, LLC (http://www.qualitycounts.net)
LOCATION: Tube Count 4 QC JOB #: 13777711SPECIFIC LOCATION: Tube Count 4CITY/STATE: Long Beach, CA
DIRECTION: SBDATE: May 17 2016 - May 17 2016
Start TimeMon Tue
17-May-16Wed Thu Fri Average Weekday
Hourly TrafficSat Sun Average Week
Hourly TrafficAverage Week Profile
12:00 AM 6 6 61:00 AM 1 1 12:00 AM 0 0 03:00 AM 2 2 24:00 AM 29 29 295:00 AM 101 101 1016:00 AM 138 138 1387:00 AM 180 180 1808:00 AM 169 169 1699:00 AM 173 173 173
10:00 AM 167 167 16711:00 AM 171 171 17112:00 PM 198 198 198
1:00 PM 173 173 1732:00 PM 181 181 1813:00 PM 159 159 1594:00 PM 167 167 1675:00 PM 137 137 1376:00 PM 146 146 1467:00 PM 115 115 1158:00 PM 77 77 779:00 PM 107 107 107
10:00 PM 27 27 2711:00 PM 8 8 8Day Total 2632 2632 2632
% WeekdayAverage 100.0%% WeekAverage 100.0% 100.0%AM Peak 7:00 AM 7:00 AM 7:00 AMVolume 180 180 180
PM Peak 12:00 PM 12:00 PM 12:00 PMVolume 198 198 198
Comments:
Page 1 of 1
Report generated on 5/25/2016 2:29 PM

Type of report: Tube Count - Volume Data
SOURCE: Quality Counts, LLC (http://www.qualitycounts.net)
LOCATION: Tube Count 5 QC JOB #: 13777712SPECIFIC LOCATION: Tube Count 5CITY/STATE: Long Beach, CA
DIRECTION: EBDATE: May 17 2016 - May 17 2016
Start TimeMon Tue
17-May-16Wed Thu Fri Average Weekday
Hourly TrafficSat Sun Average Week
Hourly TrafficAverage Week Profile
12:00 AM 14 14 141:00 AM 16 16 162:00 AM 6 6 63:00 AM 7 7 74:00 AM 15 15 155:00 AM 98 98 986:00 AM 211 211 2117:00 AM 316 316 3168:00 AM 281 281 2819:00 AM 458 458 458
10:00 AM 426 426 42611:00 AM 454 454 45412:00 PM 486 486 486
1:00 PM 431 431 4312:00 PM 459 459 4593:00 PM 458 458 4584:00 PM 412 412 4125:00 PM 370 370 3706:00 PM 512 512 5127:00 PM 470 470 4708:00 PM 323 323 3239:00 PM 436 436 436
10:00 PM 179 179 17911:00 PM 78 78 78Day Total 6916 6916 6916
% WeekdayAverage 100.0%% WeekAverage 100.0% 100.0%AM Peak 9:00 AM 9:00 AM 9:00 AMVolume 458 458 458
PM Peak 6:00 PM 6:00 PM 6:00 PMVolume 512 512 512
Comments:
Page 1 of 1
Report generated on 5/25/2016 2:29 PM
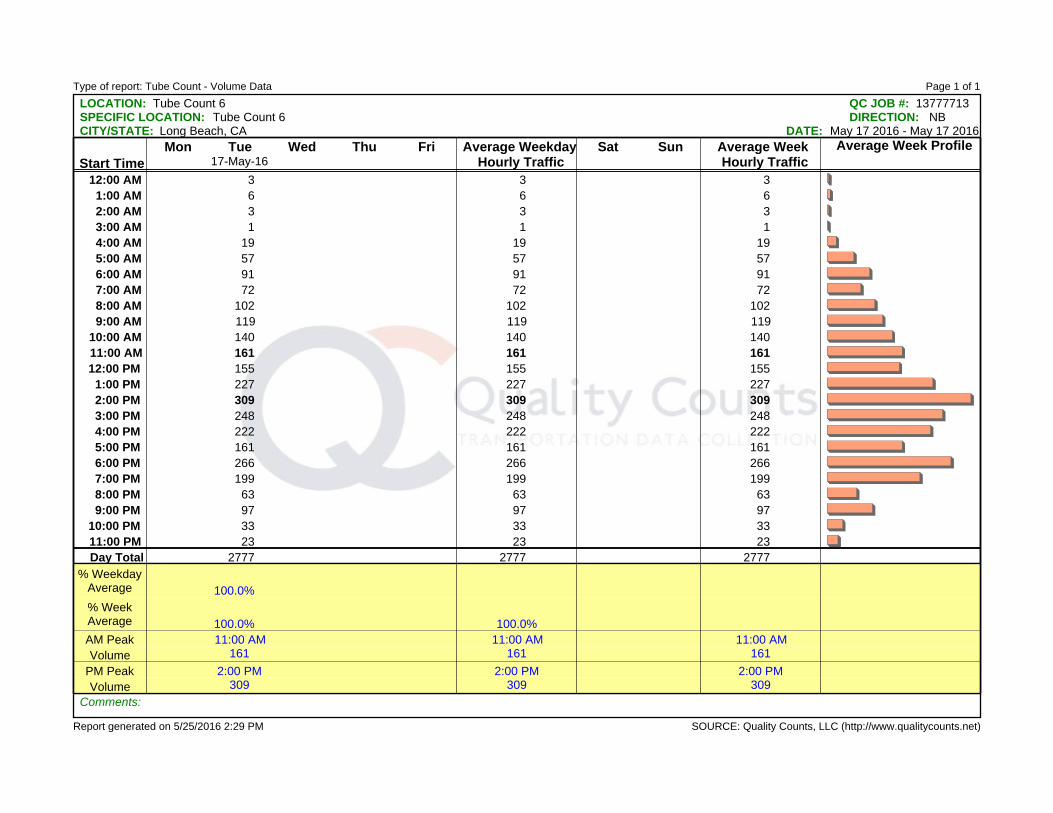
Type of report: Tube Count - Volume Data
SOURCE: Quality Counts, LLC (http://www.qualitycounts.net)
LOCATION: Tube Count 6 QC JOB #: 13777713SPECIFIC LOCATION: Tube Count 6CITY/STATE: Long Beach, CA
DIRECTION: NBDATE: May 17 2016 - May 17 2016
Start TimeMon Tue
17-May-16Wed Thu Fri Average Weekday
Hourly TrafficSat Sun Average Week
Hourly TrafficAverage Week Profile
12:00 AM 3 3 31:00 AM 6 6 62:00 AM 3 3 33:00 AM 1 1 14:00 AM 19 19 195:00 AM 57 57 576:00 AM 91 91 917:00 AM 72 72 728:00 AM 102 102 1029:00 AM 119 119 119
10:00 AM 140 140 14011:00 AM 161 161 16112:00 PM 155 155 155
1:00 PM 227 227 2272:00 PM 309 309 3093:00 PM 248 248 2484:00 PM 222 222 2225:00 PM 161 161 1616:00 PM 266 266 2667:00 PM 199 199 1998:00 PM 63 63 639:00 PM 97 97 97
10:00 PM 33 33 3311:00 PM 23 23 23Day Total 2777 2777 2777
% WeekdayAverage 100.0%% WeekAverage 100.0% 100.0%AM Peak 11:00 AM 11:00 AM 11:00 AMVolume 161 161 161
PM Peak 2:00 PM 2:00 PM 2:00 PMVolume 309 309 309
Comments:
Page 1 of 1
Report generated on 5/25/2016 2:29 PM

Type of report: Tube Count - Volume Data
SOURCE: Quality Counts, LLC (http://www.qualitycounts.net)
LOCATION: Tube Count 7 QC JOB #: 13777714SPECIFIC LOCATION: Tube Count 7CITY/STATE: Long Beach, CA
DIRECTION: SBDATE: May 17 2016 - May 17 2016
Start TimeMon Tue
17-May-16Wed Thu Fri Average Weekday
Hourly TrafficSat Sun Average Week
Hourly TrafficAverage Week Profile
12:00 AM 10 10 101:00 AM 10 10 102:00 AM 7 7 73:00 AM 6 6 64:00 AM 16 16 165:00 AM 116 116 1166:00 AM 139 139 1397:00 AM 232 232 2328:00 AM 196 196 1969:00 AM 310 310 310
10:00 AM 283 283 28311:00 AM 274 274 27412:00 PM 323 323 323
1:00 PM 262 262 2622:00 PM 265 265 2653:00 PM 327 327 3274:00 PM 278 278 2785:00 PM 208 208 2086:00 PM 309 309 3097:00 PM 250 250 2508:00 PM 200 200 2009:00 PM 240 240 240
10:00 PM 88 88 8811:00 PM 78 78 78Day Total 4427 4427 4427
% WeekdayAverage 100.0%% WeekAverage 100.0% 100.0%AM Peak 9:00 AM 9:00 AM 9:00 AMVolume 310 310 310
PM Peak 3:00 PM 3:00 PM 3:00 PMVolume 327 327 327
Comments:
Page 1 of 1
Report generated on 5/25/2016 2:29 PM

Type of report: Tube Count - Volume Data
SOURCE: Quality Counts, LLC (http://www.qualitycounts.net)
LOCATION: Tube Count 10 QC JOB #: 13777715SPECIFIC LOCATION: Tube Count CITY/STATE: Long Beach, CA
DIRECTION: WBDATE: May 17 2016 - May 17 2016
Start TimeMon Tue
17-May-16Wed Thu Fri Average Weekday
Hourly TrafficSat Sun Average Week
Hourly TrafficAverage Week Profile
12:00 AM 9 9 91:00 AM 6 6 62:00 AM 3 3 33:00 AM 9 9 94:00 AM 66 66 665:00 AM 305 305 3056:00 AM 424 424 4247:00 AM 448 448 4488:00 AM 395 395 3959:00 AM 531 531 531
10:00 AM 448 448 44811:00 AM 456 456 45612:00 PM 572 572 572
1:00 PM 456 456 4562:00 PM 456 456 4563:00 PM 386 386 3864:00 PM 456 456 4565:00 PM 396 396 3966:00 PM 481 481 4817:00 PM 404 404 4048:00 PM 272 272 2729:00 PM 367 367 367
10:00 PM 69 69 6911:00 PM 12 12 12Day Total 7427 7427 7427
% WeekdayAverage 100.0%% WeekAverage 100.0% 100.0%AM Peak 9:00 AM 9:00 AM 9:00 AMVolume 531 531 531
PM Peak 12:00 PM 12:00 PM 12:00 PMVolume 572 572 572
Comments:
Page 1 of 1
Report generated on 5/25/2016 2:29 PM
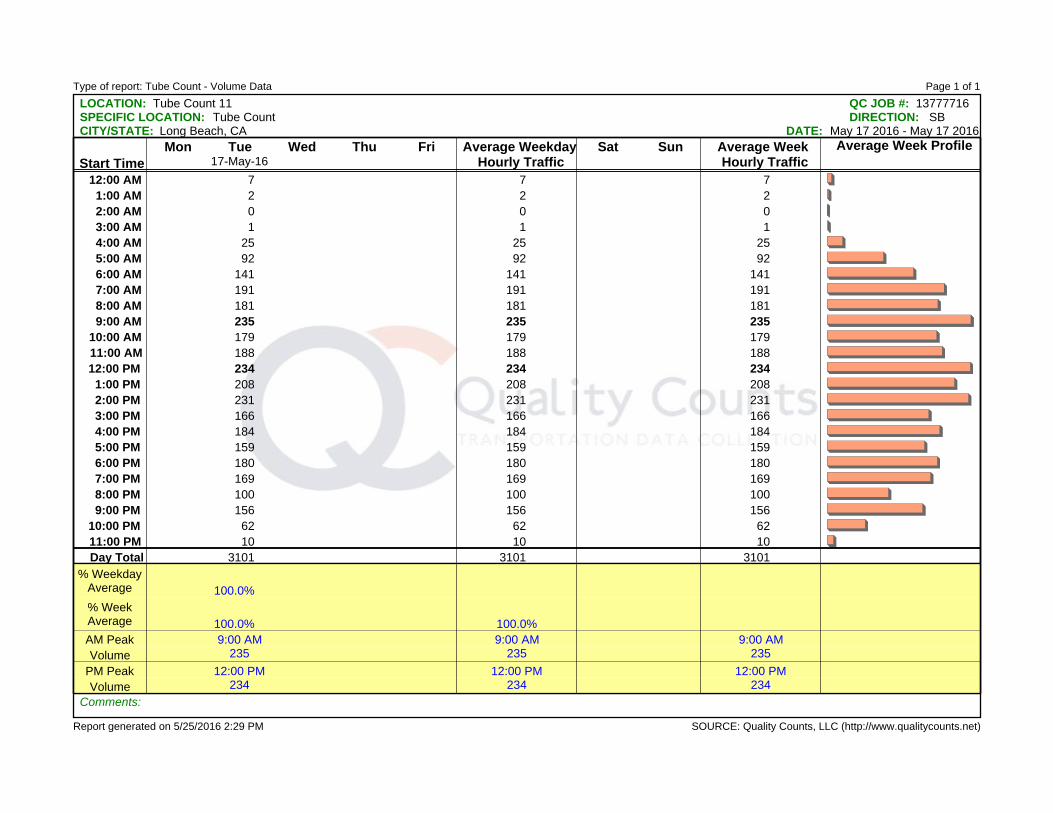
Type of report: Tube Count - Volume Data
SOURCE: Quality Counts, LLC (http://www.qualitycounts.net)
LOCATION: Tube Count 11 QC JOB #: 13777716SPECIFIC LOCATION: Tube Count CITY/STATE: Long Beach, CA
DIRECTION: SBDATE: May 17 2016 - May 17 2016
Start TimeMon Tue
17-May-16Wed Thu Fri Average Weekday
Hourly TrafficSat Sun Average Week
Hourly TrafficAverage Week Profile
12:00 AM 7 7 71:00 AM 2 2 22:00 AM 0 0 03:00 AM 1 1 14:00 AM 25 25 255:00 AM 92 92 926:00 AM 141 141 1417:00 AM 191 191 1918:00 AM 181 181 1819:00 AM 235 235 235
10:00 AM 179 179 17911:00 AM 188 188 18812:00 PM 234 234 234
1:00 PM 208 208 2082:00 PM 231 231 2313:00 PM 166 166 1664:00 PM 184 184 1845:00 PM 159 159 1596:00 PM 180 180 1807:00 PM 169 169 1698:00 PM 100 100 1009:00 PM 156 156 156
10:00 PM 62 62 6211:00 PM 10 10 10Day Total 3101 3101 3101
% WeekdayAverage 100.0%% WeekAverage 100.0% 100.0%AM Peak 9:00 AM 9:00 AM 9:00 AMVolume 235 235 235
PM Peak 12:00 PM 12:00 PM 12:00 PMVolume 234 234 234
Comments:
Page 1 of 1
Report generated on 5/25/2016 2:29 PM
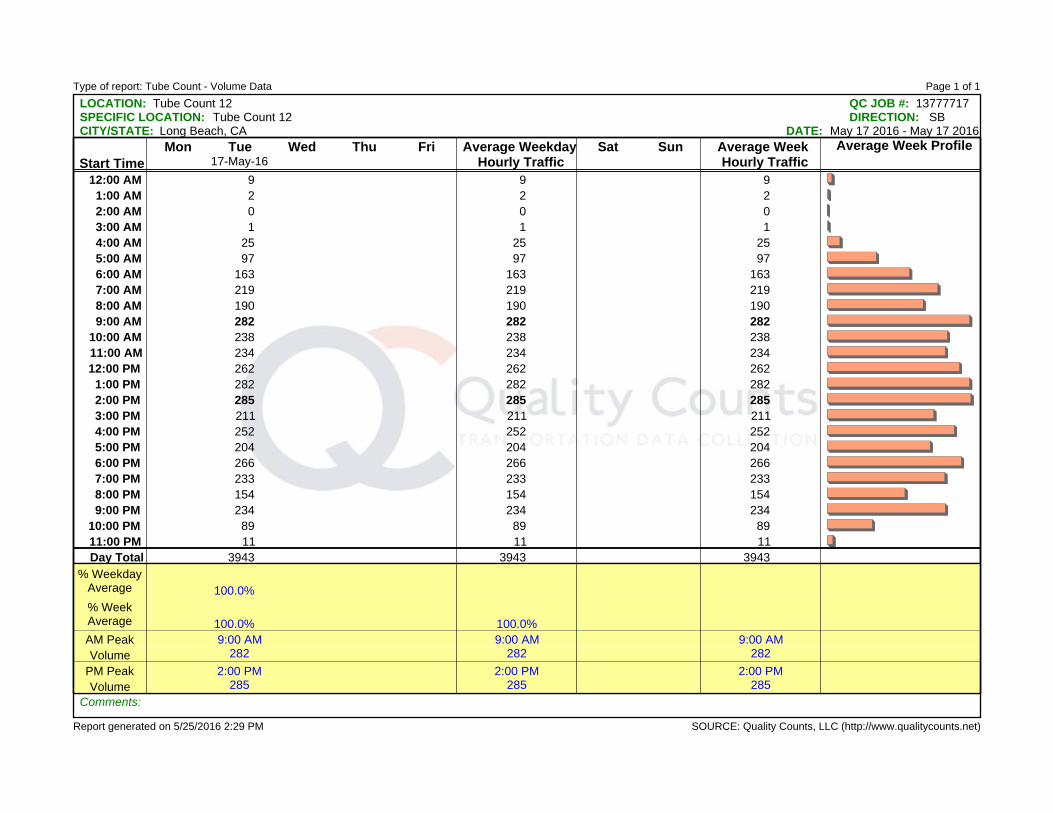
Type of report: Tube Count - Volume Data
SOURCE: Quality Counts, LLC (http://www.qualitycounts.net)
LOCATION: Tube Count 12 QC JOB #: 13777717SPECIFIC LOCATION: Tube Count 12CITY/STATE: Long Beach, CA
DIRECTION: SBDATE: May 17 2016 - May 17 2016
Start TimeMon Tue
17-May-16Wed Thu Fri Average Weekday
Hourly TrafficSat Sun Average Week
Hourly TrafficAverage Week Profile
12:00 AM 9 9 91:00 AM 2 2 22:00 AM 0 0 03:00 AM 1 1 14:00 AM 25 25 255:00 AM 97 97 976:00 AM 163 163 1637:00 AM 219 219 2198:00 AM 190 190 1909:00 AM 282 282 282
10:00 AM 238 238 23811:00 AM 234 234 23412:00 PM 262 262 262
1:00 PM 282 282 2822:00 PM 285 285 2853:00 PM 211 211 2114:00 PM 252 252 2525:00 PM 204 204 2046:00 PM 266 266 2667:00 PM 233 233 2338:00 PM 154 154 1549:00 PM 234 234 234
10:00 PM 89 89 8911:00 PM 11 11 11Day Total 3943 3943 3943
% WeekdayAverage 100.0%% WeekAverage 100.0% 100.0%AM Peak 9:00 AM 9:00 AM 9:00 AMVolume 282 282 282
PM Peak 2:00 PM 2:00 PM 2:00 PMVolume 285 285 285
Comments:
Page 1 of 1
Report generated on 5/25/2016 2:29 PM
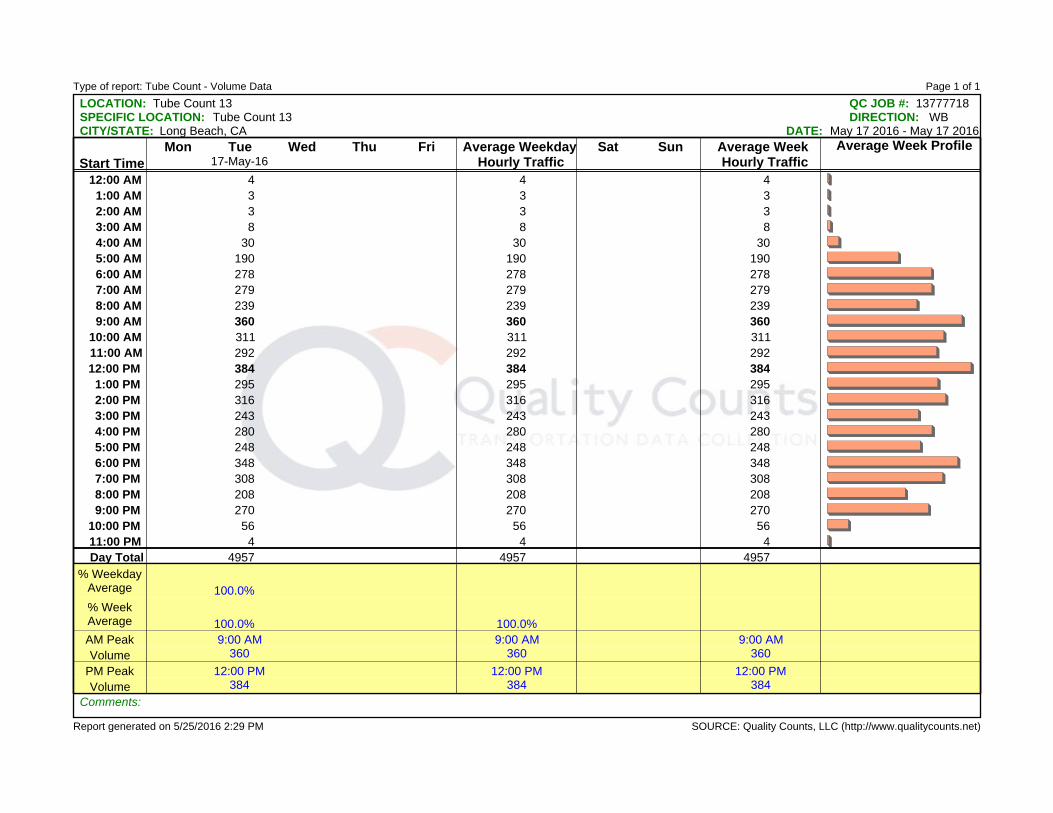
Type of report: Tube Count - Volume Data
SOURCE: Quality Counts, LLC (http://www.qualitycounts.net)
LOCATION: Tube Count 13 QC JOB #: 13777718SPECIFIC LOCATION: Tube Count 13CITY/STATE: Long Beach, CA
DIRECTION: WBDATE: May 17 2016 - May 17 2016
Start TimeMon Tue
17-May-16Wed Thu Fri Average Weekday
Hourly TrafficSat Sun Average Week
Hourly TrafficAverage Week Profile
12:00 AM 4 4 41:00 AM 3 3 32:00 AM 3 3 33:00 AM 8 8 84:00 AM 30 30 305:00 AM 190 190 1906:00 AM 278 278 2787:00 AM 279 279 2798:00 AM 239 239 2399:00 AM 360 360 360
10:00 AM 311 311 31111:00 AM 292 292 29212:00 PM 384 384 384
1:00 PM 295 295 2952:00 PM 316 316 3163:00 PM 243 243 2434:00 PM 280 280 2805:00 PM 248 248 2486:00 PM 348 348 3487:00 PM 308 308 3088:00 PM 208 208 2089:00 PM 270 270 270
10:00 PM 56 56 5611:00 PM 4 4 4Day Total 4957 4957 4957
% WeekdayAverage 100.0%% WeekAverage 100.0% 100.0%AM Peak 9:00 AM 9:00 AM 9:00 AMVolume 360 360 360
PM Peak 12:00 PM 12:00 PM 12:00 PMVolume 384 384 384
Comments:
Page 1 of 1
Report generated on 5/25/2016 2:29 PM

Type of report: Tube Count - Volume Data
SOURCE: Quality Counts, LLC (http://www.qualitycounts.net)
LOCATION: Tube Count 14 QC JOB #: 13777719SPECIFIC LOCATION: Tube Count 14CITY/STATE: Long Beach, CA
DIRECTION: NBDATE: May 17 2016 - May 17 2016
Start TimeMon Tue
17-May-16Wed Thu Fri Average Weekday
Hourly TrafficSat Sun Average Week
Hourly TrafficAverage Week Profile
12:00 AM 1 1 11:00 AM 2 2 22:00 AM 0 0 03:00 AM 0 0 04:00 AM 19 19 195:00 AM 31 31 316:00 AM 54 54 547:00 AM 57 57 578:00 AM 59 59 599:00 AM 62 62 62
10:00 AM 79 79 7911:00 AM 80 80 8012:00 PM 57 57 57
1:00 PM 61 61 612:00 PM 53 53 533:00 PM 35 35 354:00 PM 64 64 645:00 PM 63 63 636:00 PM 36 36 367:00 PM 42 42 428:00 PM 26 26 269:00 PM 39 39 39
10:00 PM 6 6 611:00 PM 0 0 0Day Total 926 926 926
% WeekdayAverage 100.0%% WeekAverage 100.0% 100.0%AM Peak 11:00 AM 11:00 AM 11:00 AMVolume 80 80 80
PM Peak 4:00 PM 4:00 PM 4:00 PMVolume 64 64 64
Comments:
Page 1 of 1
Report generated on 5/25/2016 2:29 PM

Type of report: Tube Count - Volume Data
SOURCE: Quality Counts, LLC (http://www.qualitycounts.net)
LOCATION: Tube Count 14 QC JOB #: 13777719SPECIFIC LOCATION: Tube Count 14CITY/STATE: Long Beach, CA
DIRECTION: NB/SBDATE: May 17 2016 - May 17 2016
Start TimeMon Tue
17-May-16Wed Thu Fri Average Weekday
Hourly TrafficSat Sun Average Week
Hourly TrafficAverage Week Profile
12:00 AM 2 2 21:00 AM 3 3 32:00 AM 0 0 03:00 AM 0 0 04:00 AM 21 21 215:00 AM 39 39 396:00 AM 98 98 987:00 AM 124 124 1248:00 AM 123 123 1239:00 AM 143 143 143
10:00 AM 189 189 18911:00 AM 174 174 17412:00 PM 124 124 124
1:00 PM 118 118 1182:00 PM 127 127 1273:00 PM 84 84 844:00 PM 117 117 1175:00 PM 113 113 1136:00 PM 87 87 877:00 PM 118 118 1188:00 PM 80 80 809:00 PM 77 77 77
10:00 PM 27 27 2711:00 PM 3 3 3Day Total 1991 1991 1991
% WeekdayAverage 100.0%% WeekAverage 100.0% 100.0%AM Peak 10:00 AM 10:00 AM 10:00 AMVolume 189 189 189
PM Peak 2:00 PM 2:00 PM 2:00 PMVolume 127 127 127
Comments:
Page 1 of 1
Report generated on 5/25/2016 2:29 PM
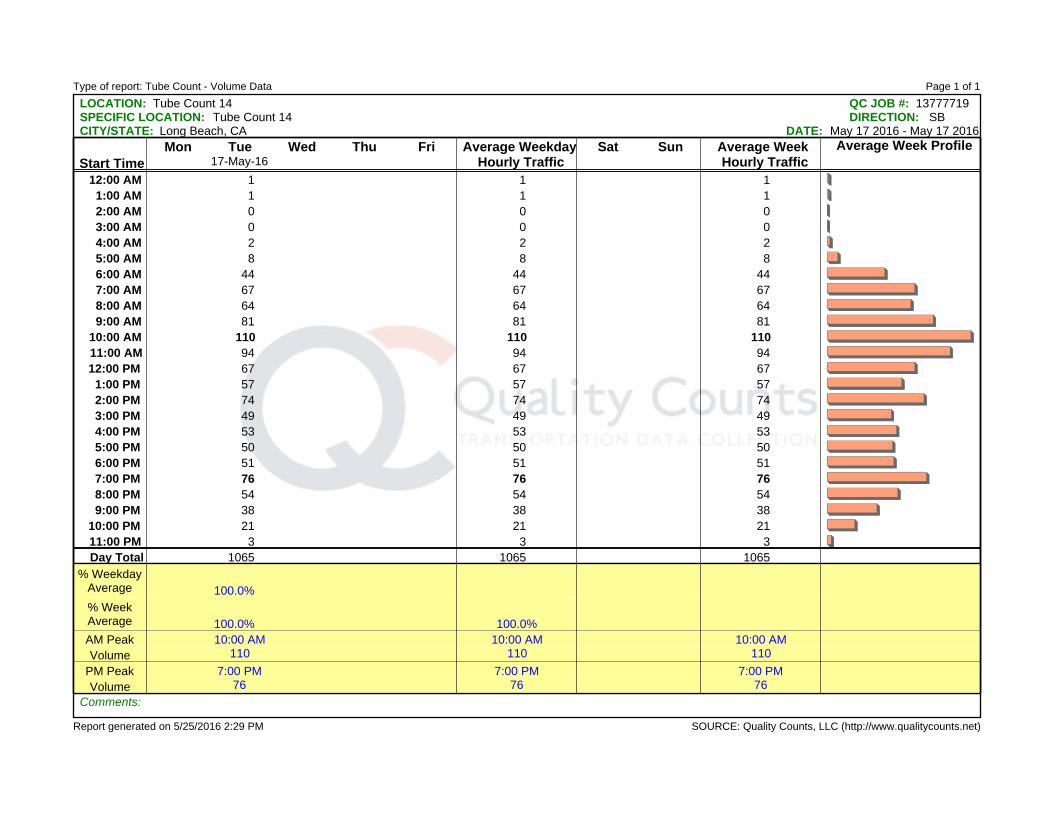
Type of report: Tube Count - Volume Data
SOURCE: Quality Counts, LLC (http://www.qualitycounts.net)
LOCATION: Tube Count 14 QC JOB #: 13777719SPECIFIC LOCATION: Tube Count 14CITY/STATE: Long Beach, CA
DIRECTION: SBDATE: May 17 2016 - May 17 2016
Start TimeMon Tue
17-May-16Wed Thu Fri Average Weekday
Hourly TrafficSat Sun Average Week
Hourly TrafficAverage Week Profile
12:00 AM 1 1 11:00 AM 1 1 12:00 AM 0 0 03:00 AM 0 0 04:00 AM 2 2 25:00 AM 8 8 86:00 AM 44 44 447:00 AM 67 67 678:00 AM 64 64 649:00 AM 81 81 81
10:00 AM 110 110 11011:00 AM 94 94 9412:00 PM 67 67 67
1:00 PM 57 57 572:00 PM 74 74 743:00 PM 49 49 494:00 PM 53 53 535:00 PM 50 50 506:00 PM 51 51 517:00 PM 76 76 768:00 PM 54 54 549:00 PM 38 38 38
10:00 PM 21 21 2111:00 PM 3 3 3Day Total 1065 1065 1065
% WeekdayAverage 100.0%% WeekAverage 100.0% 100.0%AM Peak 10:00 AM 10:00 AM 10:00 AMVolume 110 110 110
PM Peak 7:00 PM 7:00 PM 7:00 PMVolume 76 76 76
Comments:
Page 1 of 1
Report generated on 5/25/2016 2:29 PM

Type of report: Tube Count - Volume Data
SOURCE: Quality Counts, LLC (http://www.qualitycounts.net)
LOCATION: Tube Count 15 QC JOB #: 13777720SPECIFIC LOCATION: Tube Count 15CITY/STATE: Long Beach, CA
DIRECTION: WBDATE: May 17 2016 - May 17 2016
Start TimeMon Tue
17-May-16Wed Thu Fri Average Weekday
Hourly TrafficSat Sun Average Week
Hourly TrafficAverage Week Profile
12:00 AM 3 3 31:00 AM 3 3 32:00 AM 3 3 33:00 AM 7 7 74:00 AM 27 27 275:00 AM 169 169 1696:00 AM 236 236 2367:00 AM 255 255 2558:00 AM 212 212 2129:00 AM 338 338 338
10:00 AM 275 275 27511:00 AM 260 260 26012:00 PM 355 355 355
1:00 PM 259 259 2592:00 PM 273 273 2733:00 PM 226 226 2264:00 PM 252 252 2525:00 PM 233 233 2336:00 PM 321 321 3217:00 PM 271 271 2718:00 PM 195 195 1959:00 PM 246 246 246
10:00 PM 42 42 4211:00 PM 5 5 5Day Total 4466 4466 4466
% WeekdayAverage 100.0%% WeekAverage 100.0% 100.0%AM Peak 9:00 AM 9:00 AM 9:00 AMVolume 338 338 338
PM Peak 12:00 PM 12:00 PM 12:00 PMVolume 355 355 355
Comments:
Page 1 of 1
Report generated on 5/25/2016 2:29 PM
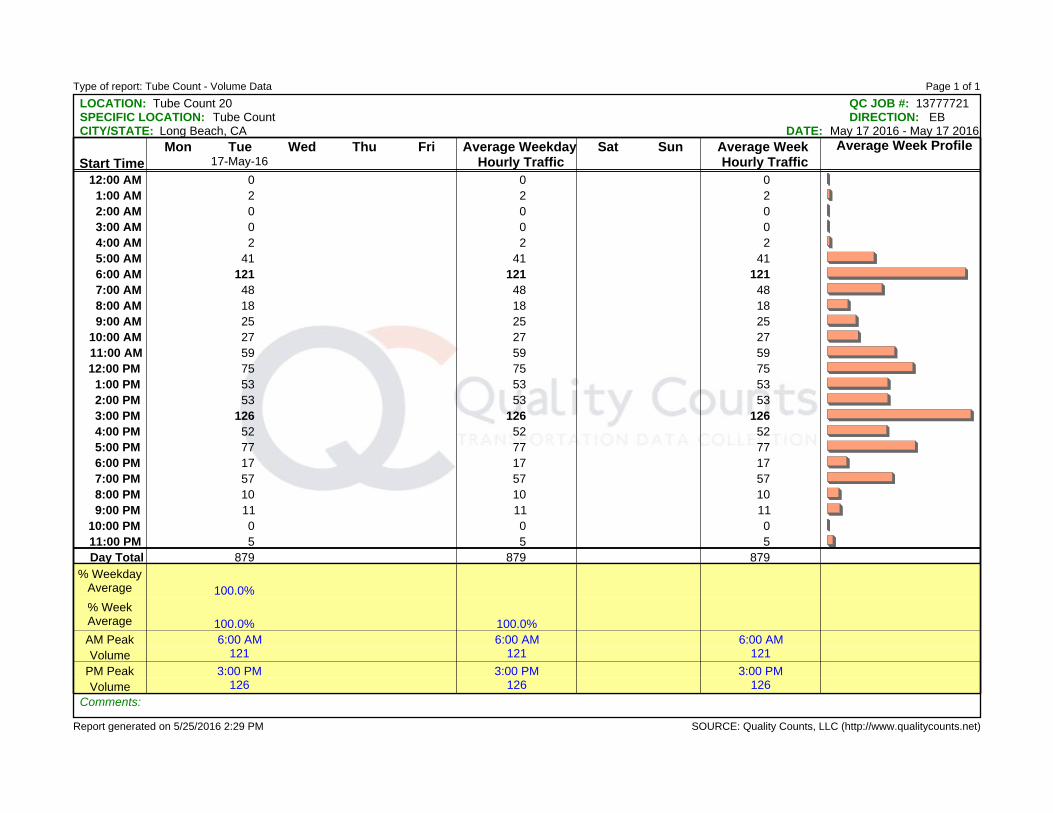
Type of report: Tube Count - Volume Data
SOURCE: Quality Counts, LLC (http://www.qualitycounts.net)
LOCATION: Tube Count 20 QC JOB #: 13777721SPECIFIC LOCATION: Tube Count CITY/STATE: Long Beach, CA
DIRECTION: EBDATE: May 17 2016 - May 17 2016
Start TimeMon Tue
17-May-16Wed Thu Fri Average Weekday
Hourly TrafficSat Sun Average Week
Hourly TrafficAverage Week Profile
12:00 AM 0 0 01:00 AM 2 2 22:00 AM 0 0 03:00 AM 0 0 04:00 AM 2 2 25:00 AM 41 41 416:00 AM 121 121 1217:00 AM 48 48 488:00 AM 18 18 189:00 AM 25 25 25
10:00 AM 27 27 2711:00 AM 59 59 5912:00 PM 75 75 75
1:00 PM 53 53 532:00 PM 53 53 533:00 PM 126 126 1264:00 PM 52 52 525:00 PM 77 77 776:00 PM 17 17 177:00 PM 57 57 578:00 PM 10 10 109:00 PM 11 11 11
10:00 PM 0 0 011:00 PM 5 5 5Day Total 879 879 879
% WeekdayAverage 100.0%% WeekAverage 100.0% 100.0%AM Peak 6:00 AM 6:00 AM 6:00 AMVolume 121 121 121
PM Peak 3:00 PM 3:00 PM 3:00 PMVolume 126 126 126
Comments:
Page 1 of 1
Report generated on 5/25/2016 2:29 PM
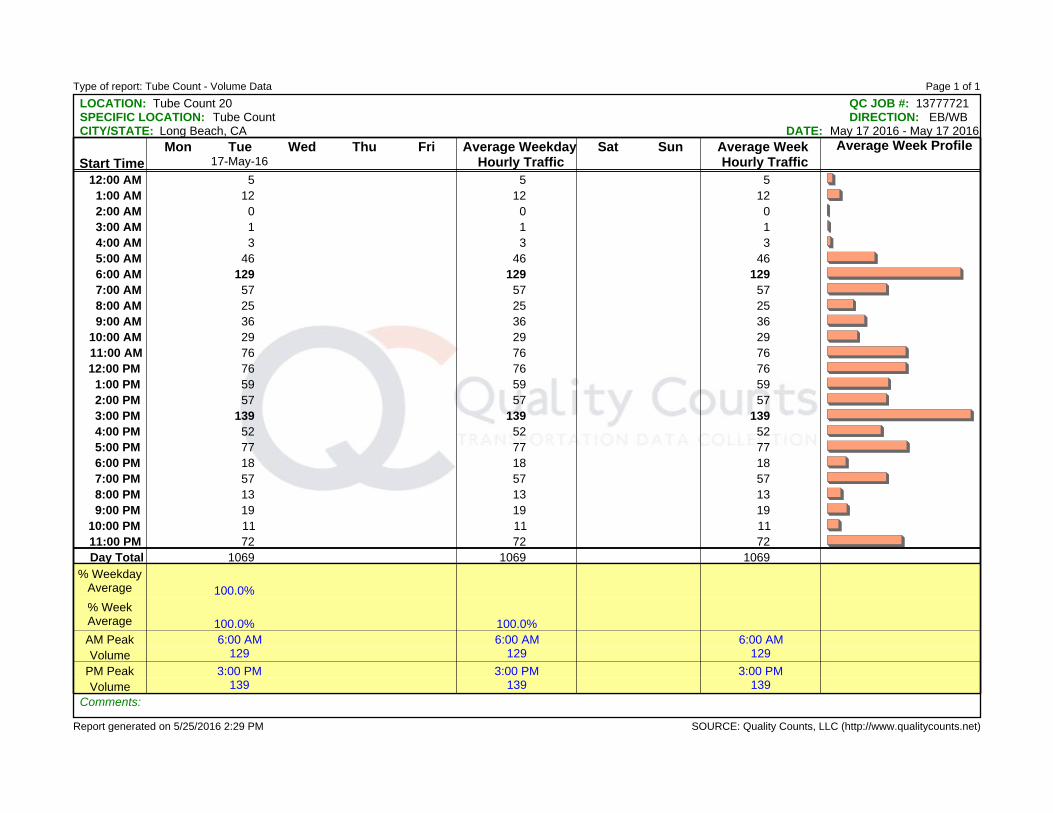
Type of report: Tube Count - Volume Data
SOURCE: Quality Counts, LLC (http://www.qualitycounts.net)
LOCATION: Tube Count 20 QC JOB #: 13777721SPECIFIC LOCATION: Tube Count CITY/STATE: Long Beach, CA
DIRECTION: EB/WBDATE: May 17 2016 - May 17 2016
Start TimeMon Tue
17-May-16Wed Thu Fri Average Weekday
Hourly TrafficSat Sun Average Week
Hourly TrafficAverage Week Profile
12:00 AM 5 5 51:00 AM 12 12 122:00 AM 0 0 03:00 AM 1 1 14:00 AM 3 3 35:00 AM 46 46 466:00 AM 129 129 1297:00 AM 57 57 578:00 AM 25 25 259:00 AM 36 36 36
10:00 AM 29 29 2911:00 AM 76 76 7612:00 PM 76 76 76
1:00 PM 59 59 592:00 PM 57 57 573:00 PM 139 139 1394:00 PM 52 52 525:00 PM 77 77 776:00 PM 18 18 187:00 PM 57 57 578:00 PM 13 13 139:00 PM 19 19 19
10:00 PM 11 11 1111:00 PM 72 72 72Day Total 1069 1069 1069
% WeekdayAverage 100.0%% WeekAverage 100.0% 100.0%AM Peak 6:00 AM 6:00 AM 6:00 AMVolume 129 129 129
PM Peak 3:00 PM 3:00 PM 3:00 PMVolume 139 139 139
Comments:
Page 1 of 1
Report generated on 5/25/2016 2:29 PM

Type of report: Tube Count - Volume Data
SOURCE: Quality Counts, LLC (http://www.qualitycounts.net)
LOCATION: Tube Count 20 QC JOB #: 13777721SPECIFIC LOCATION: Tube Count CITY/STATE: Long Beach, CA
DIRECTION: WBDATE: May 17 2016 - May 17 2016
Start TimeMon Tue
17-May-16Wed Thu Fri Average Weekday
Hourly TrafficSat Sun Average Week
Hourly TrafficAverage Week Profile
12:00 AM 5 5 51:00 AM 10 10 102:00 AM 0 0 03:00 AM 1 1 14:00 AM 1 1 15:00 AM 5 5 56:00 AM 8 8 87:00 AM 9 9 98:00 AM 7 7 79:00 AM 11 11 11
10:00 AM 2 2 211:00 AM 17 17 1712:00 PM 1 1 1
1:00 PM 6 6 62:00 PM 4 4 43:00 PM 13 13 134:00 PM 0 0 05:00 PM 0 0 06:00 PM 1 1 17:00 PM 0 0 08:00 PM 3 3 39:00 PM 8 8 8
10:00 PM 11 11 1111:00 PM 67 67 67Day Total 190 190 190
% WeekdayAverage 100.0%% WeekAverage 100.0% 100.0%AM Peak 11:00 AM 11:00 AM 11:00 AMVolume 17 17 17
PM Peak 11:00 PM 11:00 PM 11:00 PMVolume 67 67 67
Comments:
Page 1 of 1
Report generated on 5/25/2016 2:29 PM

Type of report: Tube Count - Volume Data
SOURCE: Quality Counts, LLC (http://www.qualitycounts.net)
LOCATION: Tube Count 21 QC JOB #: 13777722SPECIFIC LOCATION: Tube Count CITY/STATE: Long Beach, CA
DIRECTION: NBDATE: May 17 2016 - May 17 2016
Start TimeMon Tue
17-May-16Wed Thu Fri Average Weekday
Hourly TrafficSat Sun Average Week
Hourly TrafficAverage Week Profile
12:00 AM 2 2 21:00 AM 10 10 102:00 AM 1 1 13:00 AM 0 0 04:00 AM 2 2 25:00 AM 7 7 76:00 AM 9 9 97:00 AM 15 15 158:00 AM 9 9 99:00 AM 20 20 20
10:00 AM 8 8 811:00 AM 32 32 3212:00 PM 28 28 28
1:00 PM 23 23 232:00 PM 21 21 213:00 PM 36 36 364:00 PM 27 27 275:00 PM 14 14 146:00 PM 29 29 297:00 PM 9 9 98:00 PM 5 5 59:00 PM 11 11 11
10:00 PM 5 5 511:00 PM 6 6 6Day Total 329 329 329
% WeekdayAverage 100.0%% WeekAverage 100.0% 100.0%AM Peak 11:00 AM 11:00 AM 11:00 AMVolume 32 32 32
PM Peak 3:00 PM 3:00 PM 3:00 PMVolume 36 36 36
Comments:
Page 1 of 1
Report generated on 5/25/2016 2:29 PM

Type of report: Tube Count - Volume Data
SOURCE: Quality Counts, LLC (http://www.qualitycounts.net)
LOCATION: Tube Count 21 QC JOB #: 13777722SPECIFIC LOCATION: Tube Count CITY/STATE: Long Beach, CA
DIRECTION: NB/SBDATE: May 17 2016 - May 17 2016
Start TimeMon Tue
17-May-16Wed Thu Fri Average Weekday
Hourly TrafficSat Sun Average Week
Hourly TrafficAverage Week Profile
12:00 AM 5 5 51:00 AM 15 15 152:00 AM 1 1 13:00 AM 0 0 04:00 AM 14 14 145:00 AM 14 14 146:00 AM 29 29 297:00 AM 66 66 668:00 AM 35 35 359:00 AM 42 42 42
10:00 AM 33 33 3311:00 AM 59 59 5912:00 PM 78 78 78
1:00 PM 57 57 572:00 PM 48 48 483:00 PM 61 61 614:00 PM 46 46 465:00 PM 36 36 366:00 PM 45 45 457:00 PM 18 18 188:00 PM 8 8 89:00 PM 16 16 16
10:00 PM 12 12 1211:00 PM 7 7 7Day Total 745 745 745
% WeekdayAverage 100.0%% WeekAverage 100.0% 100.0%AM Peak 7:00 AM 7:00 AM 7:00 AMVolume 66 66 66
PM Peak 12:00 PM 12:00 PM 12:00 PMVolume 78 78 78
Comments:
Page 1 of 1
Report generated on 5/25/2016 2:29 PM

Type of report: Tube Count - Volume Data
SOURCE: Quality Counts, LLC (http://www.qualitycounts.net)
LOCATION: Tube Count 21 QC JOB #: 13777722SPECIFIC LOCATION: Tube Count CITY/STATE: Long Beach, CA
DIRECTION: SBDATE: May 17 2016 - May 17 2016
Start TimeMon Tue
17-May-16Wed Thu Fri Average Weekday
Hourly TrafficSat Sun Average Week
Hourly TrafficAverage Week Profile
12:00 AM 3 3 31:00 AM 5 5 52:00 AM 0 0 03:00 AM 0 0 04:00 AM 12 12 125:00 AM 7 7 76:00 AM 20 20 207:00 AM 51 51 518:00 AM 26 26 269:00 AM 22 22 22
10:00 AM 25 25 2511:00 AM 27 27 2712:00 PM 50 50 50
1:00 PM 34 34 342:00 PM 27 27 273:00 PM 25 25 254:00 PM 19 19 195:00 PM 22 22 226:00 PM 16 16 167:00 PM 9 9 98:00 PM 3 3 39:00 PM 5 5 5
10:00 PM 7 7 711:00 PM 1 1 1Day Total 416 416 416
% WeekdayAverage 100.0%% WeekAverage 100.0% 100.0%AM Peak 7:00 AM 7:00 AM 7:00 AMVolume 51 51 51
PM Peak 12:00 PM 12:00 PM 12:00 PMVolume 50 50 50
Comments:
Page 1 of 1
Report generated on 5/25/2016 2:29 PM

THIS PAGE INTENTIONALLY LEFT BLANK
Related Documents


![nf]s ;]jf cfof]u -sfo{ ;~rfng lgb]{lzsf, @)^& - psc.gov.np · nf]s ;]jf cfof]u -sfo{ ;~rfng_ lgb]{lzsf, @)^& lgb]{lzsf nfu' ldlt M @)^&.^.! klxnf] ;+zf]wg ldlt M @)^&.!).@$ bf]>f]](https://static.cupdf.com/doc/110x72/6082d105c887c069e27bd4c5/nfs-jf-cfofu-sfo-rfng-lgblzsf-pscgovnp-nfs-jf-cfofu.jpg)

![PsLs[t lgb]{zg, @)&&](https://static.cupdf.com/doc/110x72/62bbe2f8f90bfa25b433423c/pslst-lgbzg-ampamp.jpg)