APPENDIX

Welcome message from author
This document is posted to help you gain knowledge. Please leave a comment to let me know what you think about it! Share it to your friends and learn new things together.
Transcript

APPENDIX


TABLE OF CONTENTS
APPENDIX A – CORE VS. CASUAL PARTICIPATION TRENDS ........................................................
APPENDIX B – STATISTICALLY VALID SURVEY RESULTS ...........................................................
APPENDIX C – ONLINE COMMUNITY SURVEY .........................................................................
APPENDIX D – MALCOLM BALDRIGE SURVEY RESULTS .............................................................
APPENDIX E – PROGRAM CLASSIFICATION ............................................................................
APPENDIX F: SIMILAR PROVIDER BENCHMARK ......................................................................
APPENDIX G - ARROYO TRAILS SITE MASTER PLAN ................................................................


APPENDIX A – CORE VS. CASUAL PARTICIPATION TRENDS
GENERAL SPORTS
5-Year Trend 1-Year Trend# % # % # %
Golf * (2011, 2015 and 2016 data) 25,682 100% 24,120 100% 23,815 100% -7.3% -1.3%Basketball 23,708 100% 22,343 100% 23,401 100% -1.3% 4.7%
Casual (1-12 times) 7,389 31% 7,486 34% 8,546 37% 15.7% 14.2%Core(13+ times) 16,319 69% 14,857 66% 14,856 63% -9.0% 0.0%
Tennis 17,020 100% 18,079 100% 17,683 100% 3.9% -2.2%Baseball 12,976 100% 14,760 100% 15,642 100% 20.5% 6.0%
Casual (1-12 times) 3,931 30% 5,673 38% 6,405 41% 62.9% 12.9%Core (13+ times) 9,046 70% 9,087 62% 9,238 59% 2.1% 1.7%
Soccer (Outdoor) 12,944 100% 11,932 100% 11,924 100% -7.9% -0.1%Casual (1-25 times) 6,740 52% 6,342 53% 6,665 56% -1.1% 5.1%
Core (26+ times) 6,205 48% 5,590 47% 5,259 44% -15.2% -5.9%Softball (Slow Pitch) 7,411 100% 7,690 100% 7,283 100% -1.7% -5.3%
Casual (1-12 times) 2,825 38% 3,377 44% 3,060 42% 8.3% -9.4%Core(13+ times) 4,586 62% 4,314 56% 4,223 58% -7.9% -2.1%
Badminton 7,278 100% 7,354 100% 6,430 100% -11.7% -12.6%Casual (1-12 times) 5,092 70% 5,285 72% 4,564 71% -10.4% -13.6%
Core(13+ times) 2,185 30% 2,069 28% 1,867 29% -14.6% -9.8%Volleyball (Court) 6,384 100% 6,216 100% 6,317 100% -1.0% 1.6%
Casual (1-12 times) 2,553 40% 2,852 46% 2,939 47% 15.1% 3.1%Core(13+ times) 3,831 60% 3,364 54% 3,378 53% -11.8% 0.4%
Football, Flag 5,865 100% 6,173 100% 6,551 100% 11.7% 6.1%Casual (1-12 times) 2,963 51% 3,249 53% 3,572 55% 20.6% 9.9%
Core(13+ times) 2,902 49% 2,924 47% 2,979 45% 2.7% 1.9%Football, Touch 7,295 100% 5,686 100% 5,629 100% -22.8% -1.0%
Casual (1-12 times) 4,015 55% 3,304 58% 3,332 59% -17.0% 0.8%Core(13+ times) 3,280 45% 2,386 42% 2,297 41% -30.0% -3.7%
Volleyball (Sand/Beach) 4,505 100% 5,489 100% 4,947 100% 9.8% -9.9%Casual (1-12 times) 3,040 67% 3,989 73% 3,544 72% 16.6% -11.2%
Core(13+ times) 1,465 33% 1,500 27% 1,403 28% -4.2% -6.5%Football, Tackle 6,220 100% 5,481 100% 5,224 100% -16.0% -4.7%
Casual (1-25 times) 2,566 41% 2,242 41% 2,145 41% -16.4% -4.3%Core(26+ times) 3,655 59% 3,240 59% 3,078 59% -15.8% -5.0%
Gymnastics 5,115 100% 5,381 100% 4,805 100% -6.1% -10.7%Casual (1-49 times) 3,252 64% 3,580 67% 3,139 65% -3.5% -12.3%
Core(50+ times) 1,863 36% 1,800 33% 1,666 35% -10.6% -7.4%Soccer (Indoor) 4,617 100% 5,117 100% 5,399 100% 16.9% 5.5%
Casual (1-12 times) 2,006 43% 2,347 46% 2,657 49% 32.5% 13.2%Core(13+ times) 2,611 57% 2,770 54% 2,742 51% 5.0% -1.0%
Track and Field 4,257 100% 4,116 100% 4,161 100% -2.3% 1.1%Casual (1-25 times) 1,820 43% 1,961 48% 2,040 49% 12.1% 4.0%
Core(26+ times) 2,437 57% 2,155 52% 2,121 51% -13.0% -1.6%
Large Increase (greater than 25%)
Activity2012
Moderate Decrease (0% to -25%)
Moderate Increase(0% to 25%)
National Core vs Casual Participatory Trends - General Sports
2016 2017Participation Levels % Change
More Core Participants (56-74%)Core vs Casual Distribution
Participation Growth/Decline
Mostly Casual Participants (greater than 75%)
More Casual Participants (56-74%)
Evenly Divided (45-55% Core and Casual)
Large Decrease (less than -25%)
Mostly Core Participants (greater than 75%)

STRATEGIC MASTER PLAN 2020-2025
GENERAL SPORTS (CONT’D)
5-Year Trend 1-Year Trend# % # % # %
Cheerleading 3,244 100% 4,029 100% 3,816 100% 17.6% -5.3%Casual (1-25 times) 1,514 47% 2,365 59% 2,164 57% 42.9% -8.5%
Core(26+ times) 1,730 53% 1,664 41% 1,653 43% -4.5% -0.7%Ultimate Frisbee 5,131 100% 3,673 100% 3,126 100% -39.1% -14.9%
Casual (1-12 times) 3,647 71% 2,746 75% 2,270 73% -37.8% -17.3%Core(13+ times) 1,484 29% 927 25% 856 27% -42.3% -7.7%
Racquetball 4,070 100% 3,579 100% 3,526 100% -13.4% -1.5%Casual (1-12 times) 2,572 63% 2,488 70% 2,451 70% -4.7% -1.5%
Core(13+ times) 1,498 37% 1,092 30% 1,075 30% -28.2% -1.6%Pickleball N/A N/A 2,815 100% 3,132 100% N/A 11.3%Ice Hockey 2,363 100% 2,697 100% 2,544 100% 7.7% -5.7%
Casual (1-12 times) 1,082 46% 1,353 50% 1,227 48% 13.4% -9.3%Core(13+ times) 1,281 54% 1,344 50% 1,317 52% 2.8% -2.0%
Softball (Fast Pitch) 2,624 100% 2,467 100% 2,309 100% -12.0% -6.4%Casual (1-25 times) 1,245 47% 1,198 49% 1,077 47% -13.5% -10.1%
Core(26+ times) 1,379 53% 1,269 51% 1,232 53% -10.7% -2.9%Lacrosse 1,607 100% 2,090 100% 2,171 100% 35.1% 3.9%
Casual (1-12 times) 788 49% 1,153 55% 1,142 53% 44.9% -1.0%Core(13+ times) 819 51% 938 45% 1,030 47% 25.8% 9.8%
Roller Hockey 1,367 100% 1,929 100% 1,834 100% 34.2% -4.9%Casual (1-12 times) 875 64% 1,438 75% 1,419 77% 62.2% -1.3%
Core(13+ times) 493 36% 491 25% 415 23% -15.8% -15.5%Wrestling 1,922 100% 1,922 100% 1,896 100% -1.4% -1.4%
Casual (1-25 times) 965 50% 1,139 59% 1,179 62% 22.2% 3.5%Core(26+ times) 957 50% 782 41% 717 38% -25.1% -8.3%
Rugby 887 100% 1,550 100% 1,621 100% 82.8% 4.6%Casual (1-7 times) 526 59% 1,090 70% 1,097 68% 108.6% 0.6%
Core(8+ times) 361 41% 460 30% 524 32% 45.2% 13.9%Squash 1,290 100% 1,549 100% 1,492 100% 15.7% -3.7%
Casual (1-7 times) 928 72% 1,111 72% 1,044 70% 12.5% -6.0%Core(8+ times) 361 28% 437 28% 447 30% 23.8% 2.3%
Field Hockey 1,237 100% 1,512 100% 1,596 100% 29.0% 5.6%Casual (1-7 times) 578 47% 773 51% 897 56% 55.2% 16.0%
Core(8+ times) 659 53% 739 49% 700 44% 6.2% -5.3%Boxing for Competition 959 100% 1,210 100% 1,368 100% 42.6% 13.1%
Casual (1-12 times) 769 80% 1,035 86% 1,168 85% 51.9% 12.9%Core(13+ times) 190 20% 176 14% 199 15% 4.7% 13.1%
NOTE: Participation figures are in 000's for the US population ages 6 and overLarge Increase
(greater than 25%)
Activity2012
Moderate Decrease (0% to -25%)
Moderate Increase(0% to 25%)
National Core vs Casual Participatory Trends - General Sports
2016 2017Participation Levels % Change
More Core Participants (56-74%)Core vs Casual Distribution
Participation Growth/Decline
Mostly Casual Participants (greater than 75%)
More Casual Participants (56-74%)
Evenly Divided (45-55% Core and Casual)
Large Decrease (less than -25%)
Mostly Core Participants (greater than 75%)

GENERAL FITNESS
5-Year Trend 1-Year Trend# % # % # %
Fitness Walking 114,029 100% 107,895 100% 110,805 100% -2.8% 2.7%Casual (1-49 times) 35,267 31% 34,535 32% 35,326 32% 0.2% 2.3%
Core(50+ times) 78,762 69% 73,359 68% 75,479 68% -4.2% 2.9%Treadmill 50,839 100% 51,872 100% 52,966 100% 4.2% 2.1%
Casual (1-49 times) 22,248 44% 23,490 45% 24,444 46% 9.9% 4.1%Core(50+ times) 28,591 56% 28,381 55% 28,523 54% -0.2% 0.5%
Free Weights (Dumbbells/Hand Weights) N/A 100% 51,513 100% 52,217 100% N/A 1.4%Casual (1-49 times) N/A 18,245 35% 18,866 36% N/A 3.4%
Core(50+ times) N/A 33,268 65% 33,351 64% N/A 0.2%Running/Jogging 51,450 100% 47,384 100% 50,770 100% -1.3% 7.1%
Casual (1-49 times) 21,973 43% 21,764 46% 24,004 47% 9.2% 10.3%Core(50+ times) 29,478 57% 25,621 54% 26,766 53% -9.2% 4.5%
Stationary Cycling (Recumbent/Upright) 35,987 100% 36,118 100% 36,035 100% 0.1% -0.2%Casual (1-49 times) 18,265 51% 18,240 51% 18,447 51% 1.0% 1.1%
Core(50+ times) 17,722 49% 17,878 49% 17,588 49% -0.8% -1.6%Weight/Resistant Machines 38,999 100% 35,768 100% 36,291 100% -6.9% 1.5%
Casual (1-49 times) 15,383 39% 14,346 40% 14,496 40% -5.8% 1.0%Core(50+ times) 23,617 61% 21,422 60% 21,795 60% -7.7% 1.7%
Stretching 35,873 100% 33,771 100% 33,195 100% -7.5% -1.7%Casual (1-49 times) 8,996 25% 9,793 29% 10,095 30% 12.2% 3.1%
Core(50+ times) 26,877 75% 23,978 71% 23,100 70% -14.1% -3.7%Elliptical Motion Trainer* 28,560 100% 32,218 100% 32,283 100% 13.0% 0.2%
Casual (1-49 times) 13,638 48% 15,687 49% 15,854 49% 16.2% 1.1%Core(50+ times) 14,922 52% 16,532 51% 16,430 51% 10.1% -0.6%
Free Weights (Barbells) 26,688 100% 26,473 100% 27,444 100% 2.8% 3.7%Casual (1-49 times) 9,435 35% 10,344 39% 10,868 40% 15.2% 5.1%
Core(50+ times) 17,253 65% 16,129 61% 16,576 60% -3.9% 2.8%Yoga 23,253 100% 26,268 100% 27,354 100% 17.6% 4.1%
Casual (1-49 times) 13,305 57% 15,486 59% 16,454 60% 23.7% 6.3%Core(50+ times) 9,949 43% 10,782 41% 10,900 40% 9.6% 1.1%
Calisthenics/Bodyweight Exercise N/A 100% 25,110 100% 24,454 100% N/A -2.6%Casual (1-49 times) N/A 0 9,763 39% 10,095 41% N/A 3.4%
Core(50+ times) N/A 0 15,347 61% 14,359 59% N/A -6.4%Choreographed Exercise N/A 100% 21,839 100% 22,616 100% N/A 3.6%
Casual (1-49 times) N/A 0 14,158 65% 14,867 66% N/A 5.0%Core(50+ times) N/A 0 7,681 35% 7,748 34% N/A 0.9%
*Cardio Cross Trainer is merged to Elliptical Motion Trainer
Mostly Casual Participants (greater than 75%)
Moderate Increase(0% to 25%)Participation Growth/Decline Large Decrease
(less than -25%)
Core vs Casual Distribution Evenly Divided (45-55% Core and Casual)
More Casual Participants (56-74%)
More Core Participants (56-74%)
Mostly Core Participants (greater than 75%)
Moderate Decrease (0% to -25%)
Large Increase (greater than 25%)
National Core vs Casual Participatory Trends - General Fitness
% Change
NOTE: Participation figures are in 000's for the US population ages 6 and over
ActivityParticipation Levels
2012 2016 2017
STRATEGIC MASTER PLAN 2020-2025
GENERAL FITNESS (CONT’D)
5-Year Trend 1-Year Trend# % # % # %
Aerobics (High Impact) 16,178 100% 21,390 100% 21,476 100% 32.7% 0.4%Casual (1-49 times) 7,819 48% 11,801 55% 12,105 56% 54.8% 2.6%
Core(50+ times) 8,359 52% 9,589 45% 9,370 44% 12.1% -2.3%Stair Climbing Machine 12,979 100% 15,079 100% 14,948 100% 15.2% -0.9%
Casual (1-49 times) 7,303 56% 9,332 62% 9,501 64% 30.1% 1.8%Core(50+ times) 5,676 44% 5,747 38% 5,447 36% -4.0% -5.2%
Cross-Training Style Workout N/A 100% 12,914 100% 13,622 100% N/A 5.5%Casual (1-49 times) N/A N/A 6,430 50% 6,890 51% N/A 7.2%
Core(50+ times) N/A N/A 6,483 50% 6,732 49% N/A 3.8%Stationary Cycling (Group) 8,477 100% 8,937 100% 9,409 100% 11.0% 5.3%
Casual (1-49 times) 5,053 60% 5,751 64% 6,023 64% 19.2% 4.7%Core(50+ times) 3,424 40% 3,186 36% 3,386 36% -1.1% 6.3%
Pilates Training 8,519 100% 8,893 100% 9,047 100% 6.2% 1.7%Casual (1-49 times) 5,212 61% 5,525 62% 5,698 63% 9.3% 3.1%
Core(50+ times) 3,307 39% 3,367 38% 3,348 37% 1.2% -0.6%Trail Running 5,806 100% 8,582 100% 9,149 100% 57.6% 6.6%Cardio Kickboxing 6,725 100% 6,899 100% 6,693 100% -0.5% -3.0%
Casual (1-49 times) 4,455 66% 4,760 69% 4,671 70% 4.8% -1.9%Core(50+ times) 2,271 34% 2,139 31% 2,022 30% -11.0% -5.5%
Boot Camp Style Training 7,496 100% 6,583 100% 6,651 100% -11.3% 1.0%Casual (1-49 times) 4,787 64% 4,484 68% 4,637 70% -3.1% 3.4%
Core(50+ times) 2,709 36% 2,099 32% 2,014 30% -25.7% -4.0%Martial Arts 5,075 100% 5,745 100% 5,838 100% 15.0% 1.6%
Casual (1-12 times) 1,207 24% 1,964 34% 2,021 35% 67.4% 2.9%Core(13+ times) 3,869 76% 3,780 66% 3,816 65% -1.4% 1.0%
Boxing for Fitness 4,831 100% 5,175 100% 5,157 100% 6.7% -0.3%Casual (1-12 times) 2,075 43% 2,678 52% 2,738 53% 32.0% 2.2%
Core(13+ times) 2,756 57% 2,496 48% 2,419 47% -12.2% -3.1%Tai Chi 3,203 100% 3,706 100% 3,787 100% 18.2% 2.2%
Casual (1-49 times) 1,835 57% 2,245 61% 2,329 61% 26.9% 3.7%Core(50+ times) 1,369 43% 1,461 39% 1,458 39% 6.5% -0.2%
Barre N/A N/A 3,329 100% 3,436 100% N/A 3.2%Casual (1-49 times) N/A N/A 2,636 79% 2,701 79% N/A 2.5%
Core(50+ times) N/A N/A 693 21% 735 21% N/A 6.1%Triathlon (Traditional/Road) 1,789 100% 2,374 100% 2,162 100% 20.8% -8.9%
Casual (1 times) 616 34% 786 33% 754 35% 22.4% -4.1%Core(2+ times) 1,173 66% 1,589 67% 1,408 65% 20.0% -11.4%
Triathlon (Non-Traditional/Off Road) 1,075 100% 1,705 100% 1,878 100% 74.7% 10.1%Casual (1 times) 341 32% 647 38% 749 40% 119.6% 15.8%
Core(2+ times) 734 68% 1,058 62% 1,129 60% 53.8% 6.7%
Mostly Casual Participants (greater than 75%)
Moderate Increase(0% to 25%)Participation Growth/Decline Large Decrease
(less than -25%)
Core vs Casual Distribution Evenly Divided (45-55% Core and Casual)
More Casual Participants (56-74%)
More Core Participants (56-74%)
Mostly Core Participants (greater than 75%)
Moderate Decrease (0% to -25%)
Large Increase (greater than 25%)
National Core vs Casual Participatory Trends - General Fitness
% Change
NOTE: Participation figures are in 000's for the US population ages 6 and over
ActivityParticipation Levels
2012 2016 2017

OUTDOOR/ADVENTURE RECREATION
5-Year Trend 1-Year Trend# % # % # %
Hiking (Day) 34,519 100% 42,128 100% 44,900 100% 30.1% 6.6%Bicycling (Road) 39,790 100% 38,365 100% 38,866 100% -2.3% 1.3%
Casual (1-25 times) 18,966 48% 19,244 50% 20,212 52% 6.6% 5.0%Core(26+ times) 20,824 52% 19,121 50% 18,654 48% -10.4% -2.4%
Fishing (Freshwater) 39,002 100% 38,121 100% 38,346 100% -1.7% 0.6%Casual (1-7 times) 20,341 52% 20,308 53% 19,977 52% -1.8% -1.6%
Core(8+ times) 18,660 48% 17,813 47% 18,369 48% -1.6% 3.1%Camping (< 1/4 Mile of Vehicle/Home) 31,454 100% 26,467 100% 26,262 100% -16.5% -0.8%Camping (Recreational Vehicle) 15,903 100% 15,855 100% 16,159 100% 1.6% 1.9%
Casual (1-7 times) 8,316 52% 8,719 55% 9,332 58% 12.2% 7.0%Core(8+ times) 7,587 48% 7,136 45% 6,826 42% -10.0% -4.3%
Fishing (Saltwater) 12,000 100% 12,266 100% 13,062 100% 8.9% 6.5%Casual (1-7 times) 7,251 60% 7,198 59% 7,625 58% 5.2% 5.9%
Core(8+ times) 4,749 40% 5,068 41% 5,437 42% 14.5% 7.3%Birdwatching (>1/4 mile of Vehicle/Home) 13,535 100% 11,589 100% 12,296 100% -9.2% 6.1%Backpacking Overnight 7,933 100% 10,151 100% 10,975 100% 38.3% 8.1%Bicycling (Mountain) 7,265 100% 8,615 100% 8,609 100% 18.5% -0.1%
Casual (1-12 times) 3,270 45% 4,273 50% 4,389 51% 34.2% 2.7%Core(13+ times) 3,995 55% 4,342 50% 4,220 49% 5.6% -2.8%
Archery 7,173 100% 7,903 100% 7,769 100% 8.3% -1.7%Casual (1-25 times) 5,967 83% 6,650 84% 6,602 85% 10.6% -0.7%
Core(26+ times) 1,205 17% 1,253 16% 1,167 15% -3.2% -6.9%Fishing (Fly) 5,848 100% 6,456 100% 6,791 100% 16.1% 5.2%
Casual (1-7 times) 3,598 62% 4,183 65% 4,448 65% 23.6% 6.3%Core(8+ times) 2,250 38% 2,273 35% 2,344 35% 4.2% 3.1%
Skateboarding 6,227 100% 6,442 100% 6,382 100% 2.5% -0.9%Casual (1-25 times) 3,527 57% 3,955 61% 3,970 62% 12.6% 0.4%
Core(26+ times) 2,700 43% 2,487 39% 2,411 38% -10.7% -3.1%Roller Skating (In-Line) 6,647 100% 5,381 100% 5,268 100% -20.7% -2.1%
Casual (1-12 times) 4,548 68% 3,861 72% 3,853 73% -15.3% -0.2%Core(13+ times) 2,100 32% 1,520 28% 1,415 27% -32.6% -6.9%
Bicycling (BMX) 1,861 100% 3,104 100% 3,413 100% 83.4% 10.0%Casual (1-12 times) 856 46% 1,760 57% 2,039 60% 138.2% 15.9%
Core(13+ times) 1,005 54% 1,344 43% 1,374 40% 36.7% 2.2%Adventure Racing 1,618 100% 2,999 100% 2,529 100% 56.3% -15.7%
Casual (1 times) 672 42% 1,081 36% 899 36% 33.8% -16.8%Core(2+ times) 945 58% 1,918 64% 1,630 64% 72.5% -15.0%
Climbing (Traditional/Ice/Mountaineering) 2,189 100% 2,790 100% 2,527 100% 15.4% -9.4%
National Core vs Casual Participatory Trends - Outdoor / Adventure Recreation
NOTE: Participation figures are in 000's for the US population ages 6 and overModerate Increase
(0% to 25%)Moderate Decrease
(0% to -25%)Participation Growth/Decline Large Decrease (less than -25%)
ActivityParticipation Levels % Change
2012 2016 2017
Large Increase (greater than 25%)
More Core Participants (56-74%)Core vs Casual Distribution Evenly Divided (45-55% Core
and Casual)More Casual Participants
(56-74%)Mostly Casual Participants
(greater than 75%)Mostly Core Participants
(greater than 75%)

STRATEGIC MASTER PLAN 2020-2025
AQUATICS
WATER SPORTS/ACTIVITIES
5-Year Trend 1-Year Trend# % # % # %
Swimming (Fitness) 23,216 100% 26,601 100% 27,135 100% 16.9% 2.0%Casual (1-49 times) 15,139 65% 17,781 67% 18,319 68% 21.0% 3.0%
Core(50+ times) 8,077 35% 8,820 33% 8,815 32% 9.1% -0.1%Aquatic Exercise 9,177 100% 10,575 100% 10,459 100% 14.0% -1.1%
Casual (1-49 times) 5,785 63% 7,135 67% 7,222 69% 24.8% 1.2%Core(50+ times) 3,392 37% 3,440 33% 3,237 31% -4.6% -5.9%
Swimming (Competition) 2,502 100% 3,369 100% 3,007 100% 20.2% -10.7%Casual (1-49 times) 1,065 43% 1,881 56% 1,664 55% 56.2% -11.5%
Core(50+ times) 1,437 57% 1,488 44% 1,343 45% -6.5% -9.7%
Mostly Casual Participants (greater than 75%)
National Core vs Casual Participatory Trends - Aquatics
NOTE: Participation figures are in 000's for the US population ages 6 and overModerate Increase
(0% to 25%)Moderate Decrease
(0% to -25%)
More Core Participants (56-74%)
Large Increase (greater than 25%)
Mostly Core Participants (greater than 75%)
Participation Growth/Decline Large Decrease (less than -25%)
Core vs Casual Distribution Evenly Divided (45-55% Core and Casual)
More Casual Participants (56-74%)
ActivityParticipation Levels % Change
2012 2016 2017
5-Year Trend 1-Year Trend# % # % # %
Canoeing 9,813 100% 10,046 100% 9,220 100% -6.0% -8.2%Kayaking (Recreational) 8,187 100% 10,017 100% 10,533 100% 28.7% 5.2%Snorkeling 8,664 100% 8,717 100% 8,384 100% -3.2% -3.8%
Casual (1-7 times) 6,904 80% 6,945 80% 6,721 80% -2.7% -3.2%Core(8+ times) 1,760 20% 1,773 20% 1,663 20% -5.5% -6.2%
Jet Skiing 6,996 100% 5,783 100% 5,418 100% -22.6% -6.3%Casual (1-7 times) 5,125 73% 4,143 72% 3,928 72% -23.4% -5.2%
Core(8+ times) 1,870 27% 1,640 28% 1,490 28% -20.3% -9.1%Sailing 3,841 100% 4,095 100% 3,974 100% 3.5% -3.0%
Casual (1-7 times) 2,565 67% 2,833 69% 2,720 68% 6.0% -4.0%Core(8+ times) 1,276 33% 1,262 31% 1,254 32% -1.7% -0.6%
Water Skiing 4,434 100% 3,700 100% 3,572 100% -19.4% -3.5%Casual (1-7 times) 3,122 70% 2,667 72% 2,575 72% -17.5% -3.4%
Core(8+ times) 1,312 30% 1,033 28% 997 28% -24.0% -3.5%Rafting 3,756 100% 3,428 100% 3,479 100% -7.4% 1.5%Stand-Up Paddling 1,392 100% 3,220 100% 3,325 100% 138.9% 3.3%Kayaking (Sea/Touring) 2,446 100% 3,124 100% 2,955 100% 20.8% -5.4%Scuba Diving 2,781 100% 3,111 100% 2,874 100% 3.3% -7.6%
Casual (1-7 times) 1,932 69% 2,292 74% 2,113 74% 9.4% -7.8%Core(8+ times) 849 31% 819 26% 761 26% -10.4% -7.1%
Wakeboarding 3,368 100% 2,912 100% 3,005 100% -10.8% 3.2%Casual (1-7 times) 2,237 66% 2,017 69% 2,101 70% -6.1% 4.2%
Core(8+ times) 1,132 34% 895 31% 903 30% -20.2% 0.9%Surfing 2,545 100% 2,793 100% 2,680 100% 5.3% -4.0%
Casual (1-7 times) 1,544 61% 1,768 63% 1,705 64% 10.4% -3.6%Core(8+ times) 1,001 39% 1,024 37% 975 36% -2.6% -4.8%
Kayaking (White Water) 1,878 100% 2,552 100% 2,500 100% 33.1% -2.0%Boardsailing/Windsurfing 1,372 100% 1,737 100% 1,573 100% 14.7% -9.4%
Casual (1-7 times) 1,108 81% 1,449 83% 1,289 82% 16.3% -11.0%Core(8+ times) 264 19% 288 17% 284 18% 7.6% -1.4%
2017
National Core vs Casual Participatory Trends - Water Sports / Activities
NOTE: Participation figures are in 000's for the US population ages 6 and over
ActivityParticipation Levels % Change
2012 2016
Mostly Casual Participants (greater than 75%)
Participation Growth/Decline Large Decrease (less than -25%)
Core vs Casual Distribution Evenly Divided (45-55% Core and Casual)
More Casual Participants (56-74%)
Large Increase (greater than 25%)
Mostly Core Participants (greater than 75%)
More Core Participants (56-74%)
Moderate Increase(0% to 25%)
Moderate Decrease (0% to -25%)

APPENDIX B – STATISTICALLY VALID SURVEY RESULTS


…helping organizations make better decisions since 1982
Submitted to the Channahon Park District: By: ETC Institute 725 W. Frontier Lane, Olathe, Kansas 66061 December 2019
Channahon Park District Needs Assessment Survey
Findings Report
2019

Contents
Executive Summary ....................................................................... i
Section 1: Charts and Graphs ....................................................... 1
Section 2: Priority Investment Rating ......................................... 30
Section 3: Benchmarking Analysis .............................................. 38
Section 4: Tabular Data ............................................................... 45
Section 5: Survey Instrument ..................................................... 87

Channahon Park District Community Needs Assessment Survey
Executive Summary OverviewETC Institute administered a community needs assessment for The Channahon Park District the Fall of 2019. This survey will help establish priorities for the future improvement of parks and recreation facilities, programs and services within the community. In addition, the survey will aid the Channahon Park District in taking a resident‐driven approach to making decisions that will enrich the future of our community and positively affect the lives of its residents.
Methodology ETC Institute mailed a survey packet to randomly selected households in the Channahon Park District. Each survey packet contained a cover letter, a copy of the survey, and a postage‐paid return envelope. Residents were given the option of returning the survey by mail or completing it on‐line at channahonsurvey.org.
Ten days after the surveys were mailed, ETC Institute sent emails to households to encourage participation. The emails contained a link to the on‐line version of the survey to make it easy for residents to complete the survey. To prevent people who were not residents in the Channahon Park District from participating, everyone who completed the survey on‐line were required to enter their home address prior to submitting the survey.
The goal was to obtain completed surveys from at least 400 residents. The goal was met with a total of 400 residents completing the survey. The overall results for the sample of 400 households have a precision of at least +/‐ 4.9 at the 95% level of confidence.
This report contains the following:
• Charts showing the overall results of the survey (Section 1)• Priority Investment Rating (PIR) that identifies priorities for facilities and programs
(Section 2)• Benchmarking analysis comparing the Park District results to national results (Section 3)• Tabular data showing the overall results for all questions on the survey (Section 4)• A copy of the survey instrument (Section 5)
The major findings of the survey are summarized on the following pages.
Page i

Parks and Facilities Use and Rating Park Use: The top 2 most used parks by respondent households were: Central Park (57%) and Community Park (56%). Residents of households that indicated they had visited the park, rated the quality of 12 of the 14 parks as “excellent” or “good”.
Facility Use: The top 2 most used recreation and facilities used by respondent households were: Arrowhead Community Center (50%) and Heritage Crossing Field House (48%). Residents of households that indicated they had visited the facility rated the overall quality as "Excellent" or “Good” for all seven facilities rated.
Program Use and RatingsFourty (40%) of households surveyed indicated that they had participated in any recreation programs offered by the Channahon Park District during the past 12 months. Seventy‐two percent (72%) of respondents indicated the location of program facility as the primary reason they had participated in programs. Ninety‐one percent (91%) of households that indicated they had participated in a program rated the overall quality as "Excellent" or “Good”.
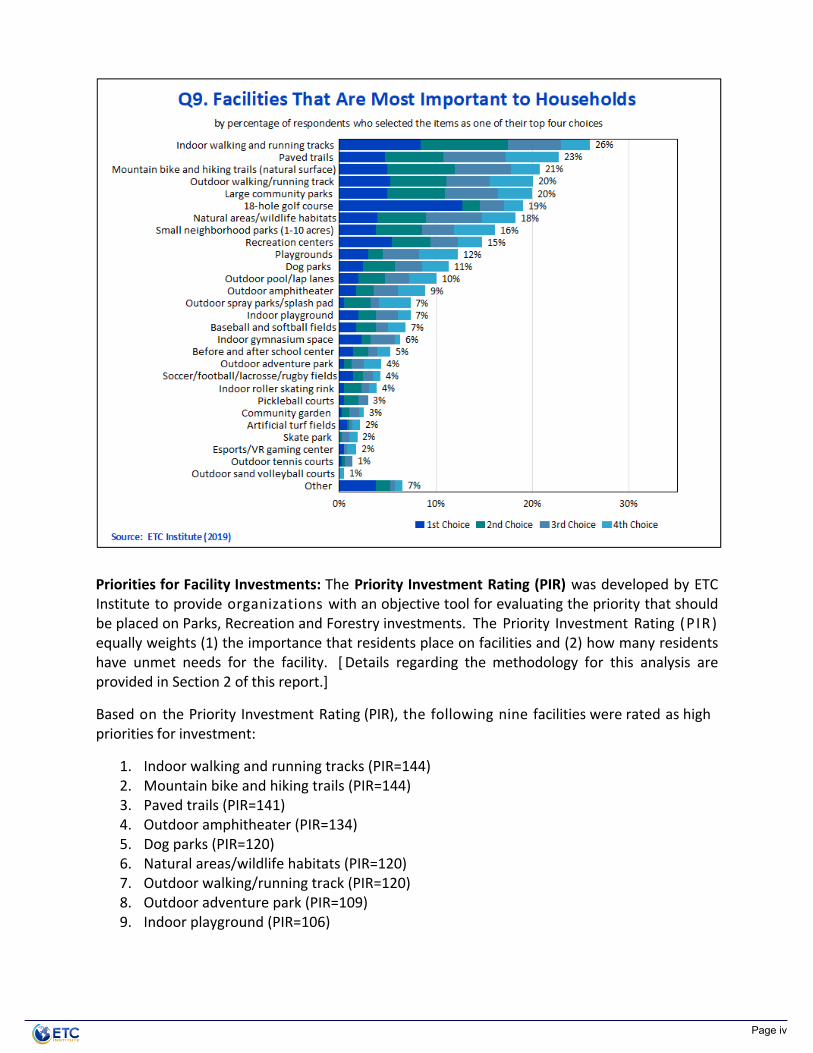
Information Sources Respondents were asked which information sources their household about Channahon Park District programs and activities. Over 80% of residents indicated they utilize the Channahon Park District Program Guide for information. The Channahon Park District Program Guide was also indicated by most residents (82%) as the most preferred information source.
Barriers to Park, Facility and Program Usage Respondents were asked to identify, from a list of 21 potential reasons, using parks, recreation facilities, and programs more often. The top two reasons, given by survey participants were: “program times are not convenient” (26%) and “not enough time” (24%).
Facility Needs and Priorities Facility Needs: Respondents were asked to identify if their household had a need for 30 facilities and rate how well their needs for each were currently being met. Based on this analysis, ETC Institute was able to estimate the number of households in the community that had the greatest “unmet” need for various facilities.
The four facilities with the highest number of households that have an unmet need were: Outdoor amphitheater ‐958 households Outdoor adventure park – 882 households Indoor playground ‐747 households Dog parks‐733 households
Page ii

The estimated number of households that have unmet needs for each of the 30 facilities that were assessed is shown in the chart below.
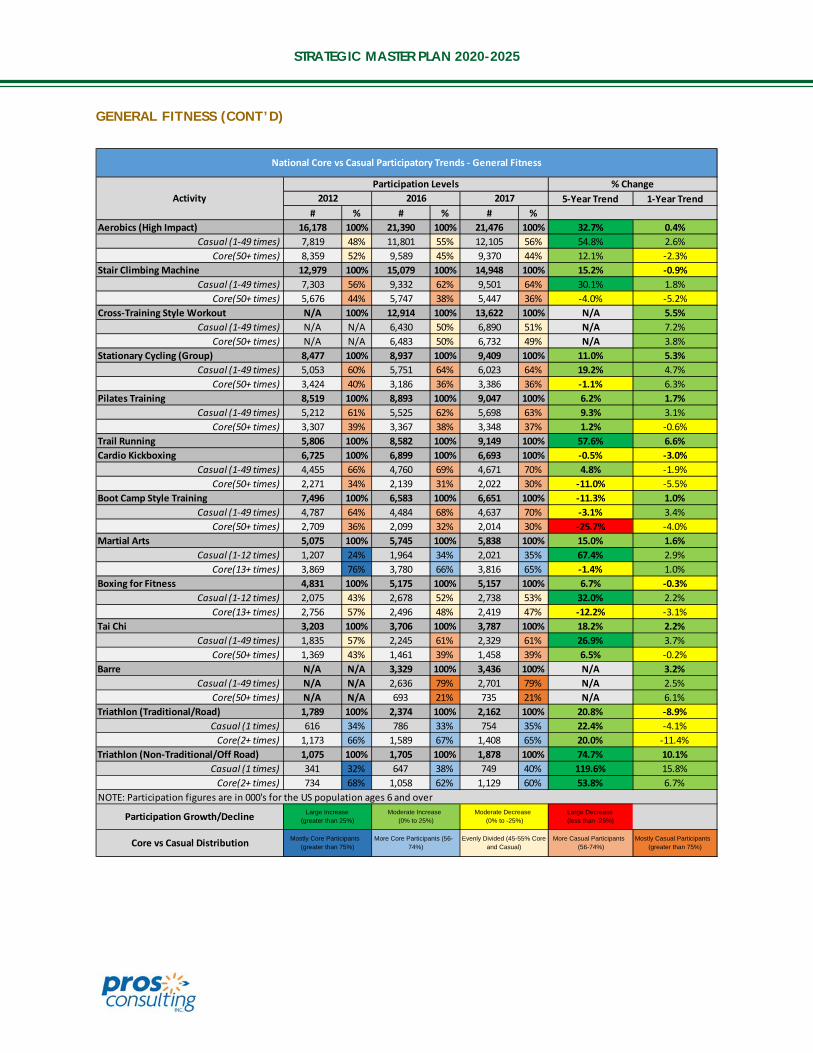
Facility Importance: In addition to assessing the needs for each facility, ETC Institute also assessed the importance that residents placed on each facility. Based on the sum of respondents’ top four choices the three most important facilities to residents were: Indoor walking and running tracks (26%), Paved trails (23%) and Mountain bike and hiking trails (21%).
The percentage of residents who selected each facility as one of their top four choices is shown on the chart on the next page.
Page iii
Priorities for Facility Investments: The Priority Investment Rating (PIR) was developed by ETC Institute to provide organizations with an objective tool for evaluating the priority that should be placed on Parks, Recreation and Forestry investments. The Priority Investment Rating (PIR) equally weights (1) the importance that residents place on facilities and (2) how many residents have unmet needs for the facility. [ Details regarding the methodology for this analysis are provided in Section 2 of this report.]
Based on the Priority Investment Rating (PIR), the following nine facilities were rated as high priorities for investment:
1. Indoor walking and running tracks (PIR=144)2. Mountain bike and hiking trails (PIR=144)3. Paved trails (PIR=141)4. Outdoor amphitheater (PIR=134)5. Dog parks (PIR=120)6. Natural areas/wildlife habitats (PIR=120)7. Outdoor walking/running track (PIR=120)8. Outdoor adventure park (PIR=109)9. Indoor playground (PIR=106)
Page iv

The chart below shows the Priority Investment Rating for each of the 30 facilities that were assessed on the survey.
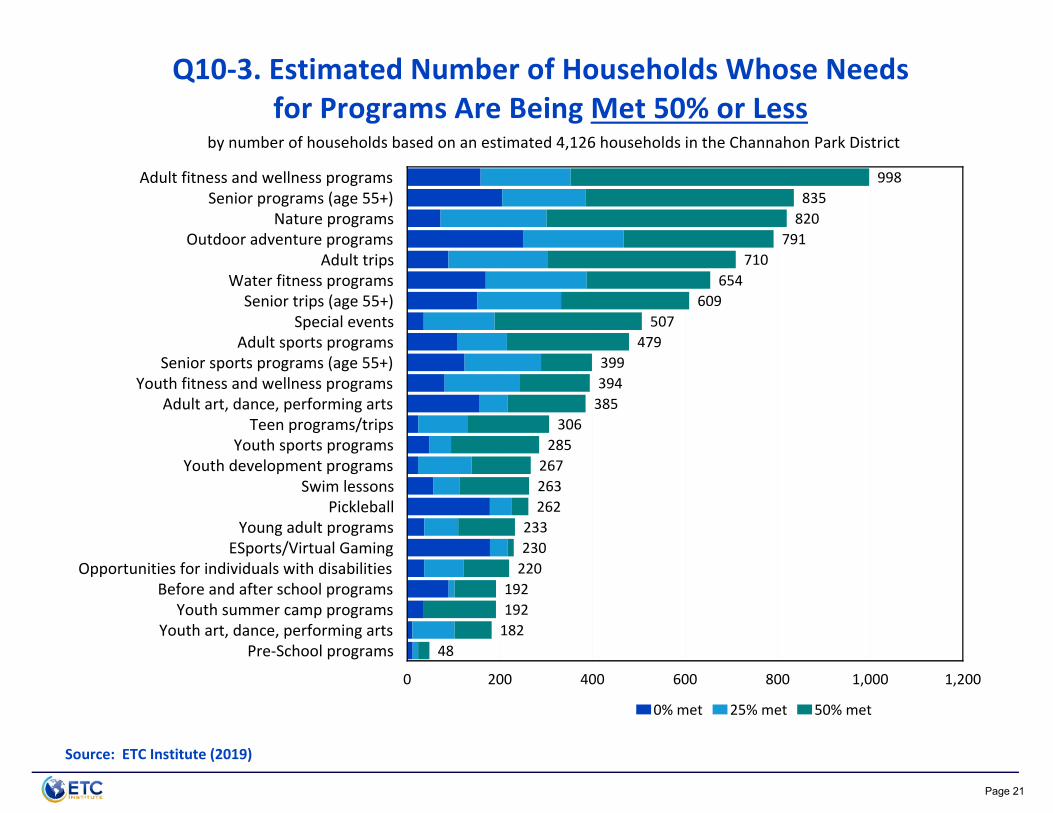
Program Needs and Priorities Activity Needs. Respondents were also asked to identify if their household had a need for 25 programs and rate how well their needs for each program were currently being met. Based on this analysis, ETC Institute was able to estimate the number of households in the community that had “unmet” needs for each program. The five activities with the highest percentage of households that have an unmet need were:
Adult fitness and wellness programs‐ 998 households Senior fitness, wellness and recreation programs (age 55+)‐ 835 households Nature programs‐ 820 households Outdoor adventure programs‐ 791 households Adult trips‐ 710 households
Page x

The estimated number of households that have unmet needs for each of the 25 activities that were assessed is shown in the chart below.
Program Importance. In addition to assessing the needs for each activity, ETC Institute also assessed the importance that residents place on each activity. Based on the sum of respondents’ top for choices, the most important activity to residents was adult fitness & wellness programs (41%).
Page xi

The percentage of residents who selected each activity as one of their top four choices is shown in the chart below.
Priorities for Programming Investments. Based on the priority investment rating (PIR), which was described briefly on page v of this Executive Summary and is described in more detail in Section 2 of this report, the following six programs were rated as “high priorities” for investment:
1. Adult fitness and wellness programs (PIR=200)2. Senior recreation programs (age 55+)(PIR=140)3. Nature programs(PIR=126)4. Adult trips (PIR=105)5. Outdoor adventure programs (PIR=104)6. Senior trips (age 55+) (PIR=101)
Page xii

The chart below shows the Priority Investment Rating (PIR) for each of the 25 activities that were rated.
Potential Improvements to the Park System Respondents were asked how supportive they would be projects Channahon Park District could take to improve the parks and recreation system. Sixty‐five percent (65%) of respondents indicated they would be “very supportive” or “somewhat supportive” of: developing new and connect existing trail system older recreation facilities. Sixty‐one percent (61%) respondents indicated they would be “very supportive” or “somewhat supportive” of repairing and improving infrastructure and security. Sixty‐one percent (61%) respondents indicated they would be “very supportive” or “somewhat supportive” of additional access to restrooms at parks.
The projects to improve the Recreation and Parks system respondents would be most willing to fund with their tax dollars were: developing new and connect existing trail system & connect existing trails (32%) and repair and improve infrastructure and security facilities (28%).
Page xiii

Additional Findings Seventy percent (70%) of respondents indicated Channahon Park District as the
organization they use for parks and recreation, 38% more than any other organization. Seventy‐eight percent (78%) of respondents were “very satisfied” or “somewhat
satisfied” with the overall value received from the Channahon Park District.
Conclusions and Recommendations In order to ensure that the Channahon Park District continues to meet the needs and expectations of the community, ETC Institute recommends that the Park District sustain and/or improve the performance in areas that were identified as “high priorities” by the Priority Investment Rating (PIR). The facilities and activities with the highest PIR ratings are listed below.
Facility Priorities
• Indoor walking and running tracks (PIR=144)• Mountain bike and hiking trails (PIR=144)• Paved trails (PIR=141)• Outdoor amphitheater (PIR=134)• Dog parks (PIR=120)• Natural areas/wildlife habitats (PIR=120)• Outdoor walking/running track (PIR=120)• Outdoor adventure park (PIR=109)• Indoor playground (PIR=106)
Program Priorities
Adult fitness and wellness programs (PIR=200) Senior programs (age 55+)(PIR=140) Nature programs (PIR=126) Adult trips (PIR=105) Outdoor adventure programs (PIR=104) Senior trips (age 55+) (PIR=101)
Page iv

Section 1 Charts and Graphs
Page 1

57%
56%
20%
13%
11%
10%
6%
5%
5%
4%
3%
3%
2%
5%
Central Park
Community Park
Arroyo Trails
Henneberry Park
Bluff Park
Deer Path Park
Amberleigh Park
Dupage Park
Yellow Pine Park
Diamond Park
Al Wood Park
Ridge Park
Swifton Park
Other
0% 20% 40% 60%
by percentage of respondents (multiple choices could be made)
Q1(1‐14). Which Channahon Park District parks hasyour household used over the past 12 months?
Source: ETC Institute (2019)
Page 2

by percentage of respondents who have used the park
Source: ETC Institute (2019)
Q1(1‐14)b. How would you rate the condition of the park?
.4%
.4%
67%
35%
64%
46%
54%
58%
22%
41%
50%
49%
60%
57%
29%
42%
32%
61%
32%
46%
38%
33%
67%
48%
38%
36%
20%
14%
14%
42%
4%
5%
8%
8%
8%
11%
7%
6%
7%
20%
19%
14%
16%
1%
5%
6%
8%
10%
43%
Central Park
Amberleigh Park
Community Park
Henneberry Park
Deer Path Park
Al Wood Park
Yellow Pine Park
Bluff Park
Diamond Park
Arroyo Trails
Ridge Park
Dupage Park
Swifton Park
Other
0% 20% 40% 60% 80% 100%
Excellent Good Fair Poor
Page 3

50%
48%
38%
35%
24%
24%
Arrowhead Community Center
Heritage Crossing Field House
Tomahawk Aquatic Center
Heritage Bluffs Golf Club
Picnic Pavilions
Skateland Recreation Center
0% 20% 40% 60%
by percentage of respondents (multiple choices could be made)
Source: ETC Institute (2019)
Q1(15‐21). Which Channahon Park District facilities has your household used over the past 12 months?
Page 4

Source: ETC Institute (2019)
Q1(15‐21)b. How would you rate the condition of the facility?by percentage of respondents who have used the facility
73%
61%
63%
54%
67%
33%
26%
37%
35%
41%
24%
35%
2%
2%
2%
5%
7%
22%
1%
10%
Heritage Bluffs Golf Club
Arrowhead Community Center
Heritage Crossing Field House
Tomahawk Aquatic Center
Picnic Pavilions
Skateland Recreation Center
0% 20% 40% 60% 80% 100%
Excellent Good Fair Poor
Page 5

40%61%
Yes No
Q2. Have you or other members of your household participated in any recreation programs offered by the Channahon Park District
during the past 12 months? by percentage of respondents
Source: ETC Institute (2019)
Page 6
Results from household responses included in benchmarking analysis

22%
48%
22%
6%
2%
1 program 2 to 3 programs 4 to 6 programs 7 to 10 programs 11+ programs
Q2a. How many different recreation programs have you or members of your household participated in over the past 12 months?
by percentage of respondents who have participated in a program
Source: ETC Institute (2019)
Page 7

72%
42%
37%
29%
26%
25%
22%
19%
1%
Location of program facility
Fees charged for class
Times program is offered
Quality of program content
Dates/days program is offered
Quality of program facility
Quality of instructors
Friends participate
Other
0% 20% 40% 60% 80%
Q2b. What are the primary reasons why your household has participated in Channahon Park District programs?by percentage of respondents who selected the reason as one of their top three choices
Source: ETC Institute (2019)
Page 8

42%
49%
8%
1%
Excellent Good Fair Poor
Q2c. How would you rate the overall quality of the Channahon Park District programs that you and members of your household have
participated in?by percentage of respondents who have participated in a program
Source: ETC Institute (2019)
Page 9

87%
46%
39%
36%
35%
24%
18%
14%
12%
7%
2%
0%
1%
Channahon Park District Program Guide
Channahon Park District website
Friends and neighbors
Digital signs and marquees
Newspaper articles/advertisements
Flyers at Park District facilities
Park District sign boards/yard sign
Park District email
Parks/Rec staff
School Virtual Backpack
Other
0% 20% 40% 60% 80% 100%
Q3. Which ways do you learn about Channahon Park District programs and activities?
Source: ETC Institute (2019)
by percentage of respondents (multiple choices could be made)
.3%
Page 10
Results from household responses included in benchmarking analysis
82%
48%
37%
24%
20%
17%
12%
14%
11%
6%
3%
6%
4%
Channahon Park District Program Guide
Channahon Park District website
Digital signs and marquees
Friends and neighbors
Newspaper articles/advertisements
Park District email
Flyers at Park District facilities
Park District sign boards/yard sign
Parks/Rec staff
School Virtual Backpack
Other
0% 10% 20% 30% 40% 50% 60% 70% 80% 90% 100%
1st Choice 2nd Choice 3rd Choice 4th Choice
Q4. Which information sources do you most prefer to use to learn about Channahon Park District programs and activities?
by percentage of respondents who selected the items as one of their top four choices
Source: ETC Institute (2019)
Page 11

Q5. What reasons prevent your household from using parks, recreation facilities, and programs more often?
Source: ETC Institute (2019)
26%24%
18%12%
9%7%
6%6%6%6%
5%4%
3%3%
2%2%2%
1%1%1%
13%
Program times are not convenientNot enough timeFees are too high
Program or facility not offeredNot enough choices
Facilities’ operating hours not convenientLack of quality programs
I do not know what is being offeredUse other agencies
Facilities do not have right equipmentClass full
Use facilities in other communitiesFacilities are not well maintained
Poor customer service by staffI do not know locations of facilities
Too far from our residenceSecurity is insufficient
Registration for programs is difficultLack of parking
Accessibility/transportationOther
0% 10% 20% 30% 40%
by percentage of respondents (multiple choices could be made)
Page 12
Results from household responses included in benchmarking analysis

Q6. What organizations that you and members of your household use for parks and recreation programs, services, and facilities?
Source: ETC Institute (2019)
70%
32%
28%
27%
24%
16%
15%
15%
6%
5%
5%
4%
3%
4%
Channahon Park District
Forest Preserve District
Library
Churches
School district
Youth sports associations
Private clubs (tennis, fitness and dance)
Neighboring park districts
YMCA
Other providers in Channahon
Local colleges
Homeowners associations/apartment complex
Private schools
Other
0% 20% 40% 60% 80%
by percentage of respondents (multiple choices could be made)
Page 13
Results from household responses included in benchmarking analysis
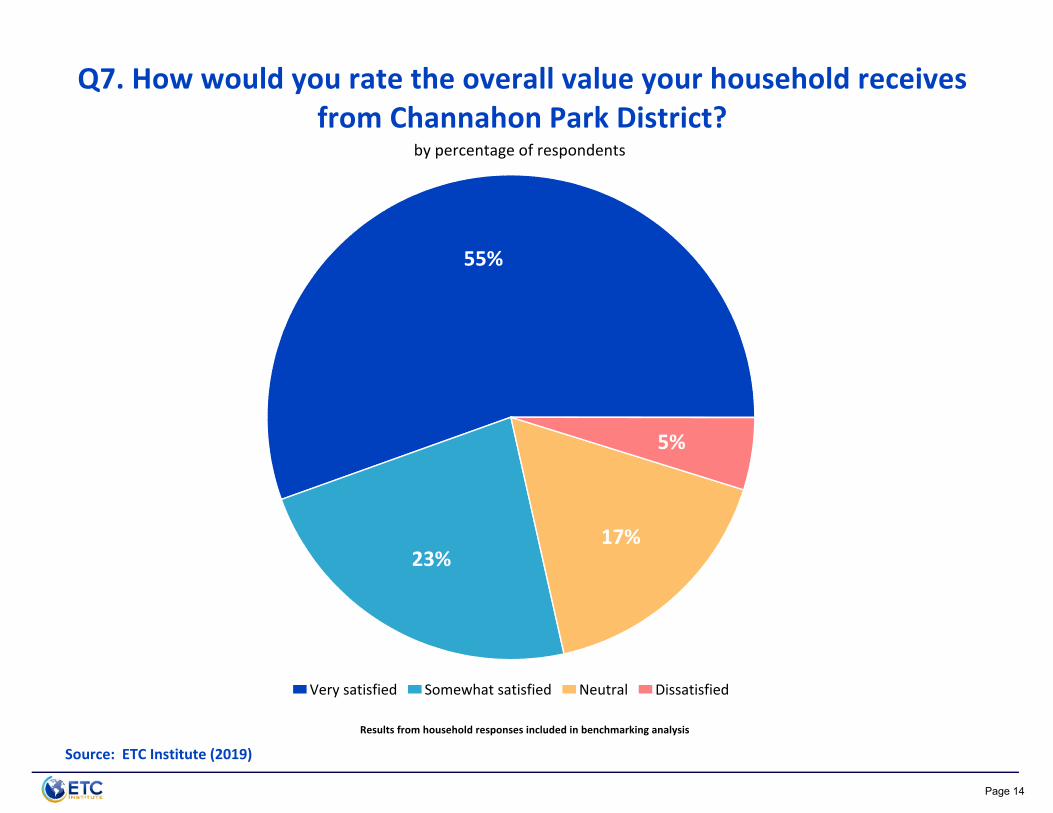
Q7. How would you rate the overall value your household receives from Channahon Park District?
Source: ETC Institute (2019)
by percentage of respondents
55%
23%17%
5%
Very satisfied Somewhat satisfied Neutral Dissatisfied
Page 14
Results from household responses included in benchmarking analysis

2,5582,558
2,3852,323
2,2282,179
1,9931,807
1,6711,560
1,4361,333
1,1971,188
1,1471,0321,023
866825
805734
681611
557495
433342342
301363
Indoor walking and running tracksPaved trails
Large community parksNatural areas/wildlife habitatsOutdoor walking/running trackMountain bike and hiking trails
Recreation centers Small neighborhood parks (1‐10 acres)
Playgrounds18‐hole golf course
Outdoor spray parks/splash padOutdoor pool/lap lanes
Indoor gymnasium space Dog parks
Outdoor amphitheaterOutdoor adventure parkIndoor roller skating rink
Indoor playgroundBaseball and softball fields
Soccer/Football/Lacrosse/Rugby fieldsOutdoor tennis courts
Outdoor basketball courtsSkate park
Community GardenBefore and after school centerOutdoor sand volleyball courts
Artificial turf fieldsPickleball courts
Esports/VR gaming centerOther:
0 500 1,000 1,500 2,000 2,500 3,000
Q8‐1. Estimated Number of Households That Have a Need for Various Facilities
Source: ETC Institute (2019)
by number of households based on an estimated 4,126 households in the Channahon Park District
Page 15

by percentage of respondents with a need for facilities
Source: ETC Institute (2019)
Q8‐2. How Well Facilities Meet the Needs of Respondent Households
71%78%
67%68%74%77%
68%54%
62%60%64%
57%50%51%55%59%
45%46%
59%45%
24%33%
23%15%13%15%
7%9%10%
28%16%
27%24%18%13%
21%34%
26%26%20%
25%30%29%24%19%
32%26%
9%22%
24%7%
16%12%13%7%
10%6%4%
2%
4%3%6%6%9%
6%7%6%
7%8%12%
10%16%
11%10%13%
17%18%18%
15%10%
19%12%
4%7%
8%9%15%
1%
1%
1%
1%
2%
2%
5%
2%
5%
6%2%
4%
2%
4%
5%
8%5%
6%9%
9%5%
9%12%
4%4%
10%2%
18%
1%
3%
1%
1%
3%
4%
2%
3%
5%
6%2%
6%7%
2%
5%9%7%
29%45%
34%50%
65%67%66%
74%53%
Skate parkLarge community parks
PlaygroundsRecreation centers18‐hole golf course
Outdoor tennis courtsOutdoor spray parks/splash pad
Baseball and softball fieldsSmall neighborhood parks (1‐10 acres)
Outdoor basketball courtsIndoor walking and running tracks
Outdoor walking/running trackSoccer/Football/Lacrosse/Rugby fields
Paved trailsNatural areas/wildlife habitats
Outdoor pool/lap lanesIndoor roller skating rink
Mountain bike and hiking trailsOutdoor sand volleyball courts
Indoor gymnasium space Before and after school center
Community Garden Dog parks
Pickleball courtsEsports/VR gaming center
Artificial turf fieldsOutdoor amphitheater
Outdoor adventure parkIndoor playground
0% 20% 40% 60% 80% 100%
100% met 75% met 50% met 25% met 0% met
Page 16

Q8‐3. Estimated Number of Households Whose Needs for Facilities Are Being Met 50% or Less
Source: ETC Institute (2019)
958882
747733
610512
479425410398
331296
266262250
231222219
169161159150140131
10510196
7612
324
Outdoor amphitheaterOutdoor adventure park
Indoor playgroundDog parks
Mountain bike and hiking trails Paved trails
Natural areas/wildlife habitatsIndoor walking and running tracks
Outdoor walking/running trackIndoor gymnasium space
Community GardenOutdoor pool/lap lanes
Artificial turf fieldsBefore and after school center
Pickleball courtsIndoor roller skating rink
Esports/VR gaming centerSmall neighborhood parks (1‐10 acres)
Outdoor spray parks/splash padSoccer/Football/Lacrosse/Rugby fields
Recreation centers Large community parks
Outdoor sand volleyball courts18‐hole golf course
PlaygroundsBaseball and softball fieldsOutdoor basketball courts
Outdoor tennis courtsSkate park
Other:0 200 400 600 800 1,000 1,200
0% met 25% met 50% met
by number of households based on an estimated 4,126 households in the Channahon Park District
Page 17

3%
1%
26%23%
21%20%20%
19%18%
16%15%
12%11%
10%9%
7%7%7%
6%5%
4%4%4%
3%2%2%2%
1%7%
Indoor walking and running tracksPaved trails
Mountain bike and hiking trails (natural surface)Outdoor walking/running track
Large community parks18‐hole golf course
Natural areas/wildlife habitatsSmall neighborhood parks (1‐10 acres)
Recreation centersPlaygroundsDog parks
Outdoor pool/lap lanesOutdoor amphitheater
Outdoor spray parks/splash padIndoor playground
Baseball and softball fieldsIndoor gymnasium space
Before and after school centerOutdoor adventure park
Soccer/football/lacrosse/rugby fieldsIndoor roller skating rink
Pickleball courtsCommunity garden Artificial turf fields
Skate parkEsports/VR gaming center
Outdoor tennis courtsOutdoor sand volleyball courts
Other0% 10% 20% 30%
1st Choice 2nd Choice 3rd Choice 4th Choice
Q9. Facilities That Are Most Important to Householdsby percentage of respondents who selected the items as one of their top four choices
Source: ETC Institute (2019)
Page 18
Results from household responses included in benchmarking analysis

2,5581,415
1,3621,126
1,0931,085
1,044970
928825
743743
611578
536536
495487487
454371
342309
26862
Adult fitness and wellness programsSenior programs (age 55+)
Nature programsAdult trips
Senior trips (age 55+)Special events
Outdoor adventure programsWater fitness programsYouth sports programs
Swim lessonsAdult sports programs
Youth fitness and wellness programsYouth summer camp programs
Adult art, dance, performing artsSenior sports programs (age 55+)Youth art, dance, performing arts
Teen programs/tripsBefore and after school programs
Youth development programsYoung adult programsPre‐School programs
Opportunities for individuals with disabilitiesPickleball
ESports/Virtual GamingOther
0 500 1,000 1,500 2,000 2,500 3,000
Q10‐1. Estimated Number of Households That Have a Need for Various Programs
Source: ETC Institute (2019)
by number of households based on an estimated 4,126 households in the Channahon Park District
Page 19

by percentage of respondents with a need for program
Source: ETC Institute (2019)
Q10‐2. How Well Programs Meet the Needs of Respondent Households
58%40%47%47%
32%22%26%25%22%22%19%
13%10%14%17%14%18%
13%17%14%
3%
12%12%10%
29%30%22%21%
34%39%34%
28%27%25%
26%32%
31%26%21%
24%18%
23%17%19%
23%13%
4%
5%
7%21%26%
18%15%25%
18%29%
27%20%26%25%32%38%
36%36%
29%36%
29%28%
21%31%
12%5%
3%
5%
7%17%8%
3%
14%16%
22%24%
17%13%
17%21%
19%25%15%
10%23%
31%21%
15%14%
3%
5%6%7%
2%
6%18%
3%
8%11%
5%14%15%
5%5%8%
11%15%
27%18%
23%24%
58%67%
Pre‐School programsYouth sports programs
Youth summer camp programsSwim lessons
Youth art, dance, performing artsAdult fitness and wellness programs
Before and after school programsSpecial events
Young adult programsYouth fitness and wellness programs
Youth development programsSenior trips (age 55+)
Senior programs (age 55+)Nature programs
Teen programs/tripsAdult trips
Opportunities for individuals with disabilitiesAdult sports programs
Adult art, dance, performing artsWater fitness programs
Senior sports programs (age 55+)Outdoor adventure programs
PickleballESports/Virtual Gaming
0% 20% 40% 60% 80% 100%
100% met 75% met 50% met 25% met 0% met
Page 20
Source: ETC Institute (2019)
Q10‐3. Estimated Number of Households Whose Needs for Programs Are Being Met 50% or Less
998835820
791710
654609
507479
399394385
306285
267263262
233230220
192192182
48
Adult fitness and wellness programsSenior programs (age 55+)
Nature programsOutdoor adventure programs
Adult tripsWater fitness programsSenior trips (age 55+)
Special eventsAdult sports programs
Senior sports programs (age 55+)Youth fitness and wellness programs
Adult art, dance, performing artsTeen programs/trips
Youth sports programsYouth development programs
Swim lessonsPickleball
Young adult programsESports/Virtual Gaming
Opportunities for individuals with disabilitiesBefore and after school programs
Youth summer camp programsYouth art, dance, performing arts
Pre‐School programs
0 200 400 600 800 1,000 1,200
0% met 25% met 50% met
by number of households based on an estimated 4,126 households in the Channahon Park District
Page 21

41%23%
18%17%
14%14%
13%10%10%
9%8%7%
7%6%6%6%5%5%5%5%4%4%
3%2%
Adult fitness and wellness programsSenior programs (age 55+)
Nature programsSenior trips (age 55+)
Youth sports programsAdult trips
Special eventsOutdoor adventure programs
Water fitness programsSwim lessons
Youth summer camp programsYouth fitness and wellness programs
Adult art, dance, performing artsAdult sports programs
Before and after school programsSenior sports programs (age 55+)Youth art, dance, performing arts
Youth development programsOpportunities for individuals with disabilities
Pre‐school programsPickleball
Teen programs/tripseSports/virtual gamingYoung adult programs
0% 10% 20% 30% 40% 50%
1st Choice 2nd Choice 3rd Choice 4th Choice
Q11. Programs That Are Most Important to Householdsby percentage of respondents who selected the program as one of their top four choices
Source: ETC Institute (2019)
Page 22
by percentage of household occupants
Results from household responses included in benchmarking analysis

Q12. How supportive are you of the following projects?by percentage of respondents
Source: ETC Institute (2019)
44%
43%
35%
32%
32%
33%
27%
26%
24%
27%
21%
25%
21%
18%
21%
19%
26%
24%
24%
21%
26%
26%
23%
20%
24%
17%
17%
18%
28%
35%
33%
34%
36%
37%
36%
37%
43%
37%
42%
44%
41%
50%
8%
4%
7%
11%
8%
9%
12%
12%
11%
17%
13%
15%
21%
14%
Develop new and connect existing trail system
Repair and improve infrastructure and security
Additional access to restrooms at parks
Upgrade existing neighborhood and community parks
Develop additional indoor recreation space
Upgrade existing pool
Acquire open space for passive activities
Upgrade existing playgrounds
Improved ADA accessibility at current facilities
Develop an outdoor amphitheater
Upgrade existing youth/adult athletic fields
Repurpose Skateland Recreation Center
Develop a large sports complex
Acquire open space for active activities
0% 20% 40% 60% 80% 100%
Very supportive Somewhat Supportive Not sure Not supportive
Page 23

32%
28%
23%
21%
21%
21%
17%
17%
15%
14%
13%
9%
5%
5%
7%
Develop new and connect existing trail system
Repair and improve infrastructure and security
Upgrade existing neighborhood and community parks
Upgrade existing pool
Additional access to restrooms at parks
Develop an outdoor amphitheater
Acquire open space for passive activities
Develop additional indoor recreation space
Repurpose Skateland Recreation Center
Develop a large sports complex
Upgrade existing playgrounds
Improved ADA accessibility at current facilities
Acquire open space for active activities
Upgrade existing youth/adult athletic fields
Other
0% 10% 20% 30% 40%
1st Choice 2nd Choice 3rd Choice 4th Choice
Q13. Which projects would you be most willing to fundwith your tax dollars?
by percentage of respondents who selected the items as one of their top four choices
Source: ETC Institute (2019)
Page 24
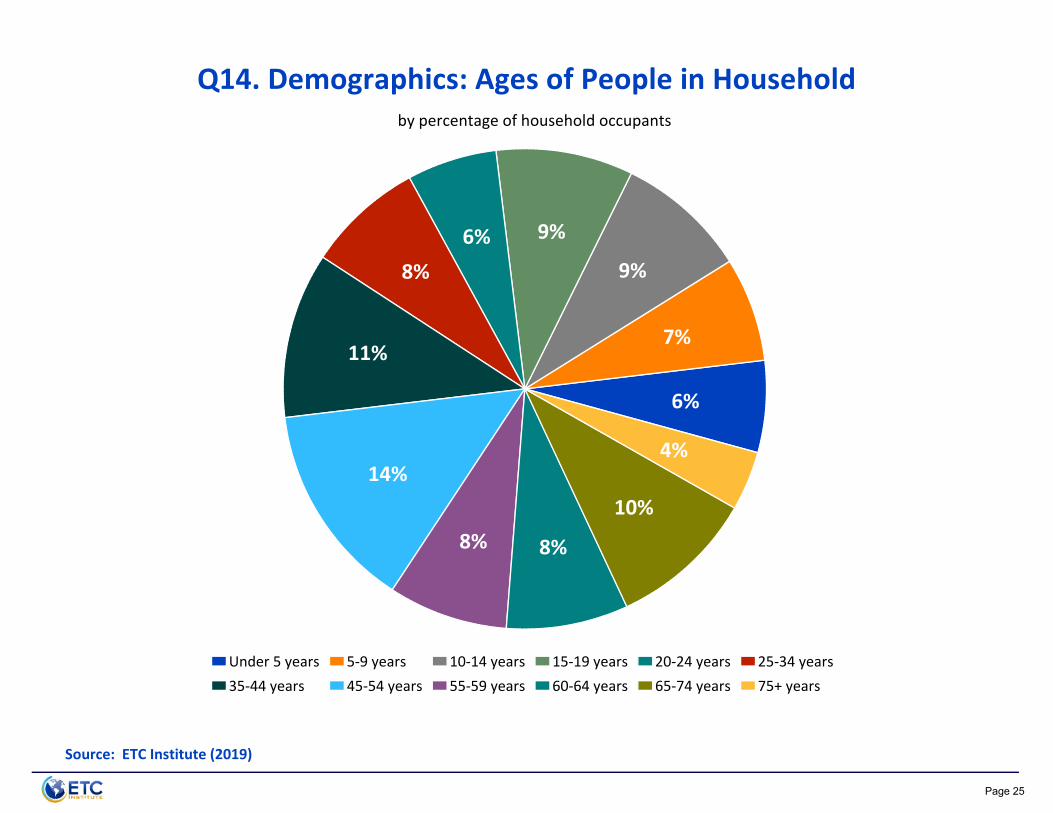
Q14. Demographics: Ages of People in Householdby percentage of household occupants
6%
7%
9%
9%6%8%
11%
14%
8% 8%
10%
4%
Under 5 years 5‐9 years 10‐14 years 15‐19 years 20‐24 years 25‐34 years35‐44 years 45‐54 years 55‐59 years 60‐64 years 65‐74 years 75+ years
Source: ETC Institute (2019)
Page 25

by percentage of respondents
Source: ETC Institute (2019)
16%
20%
22%
22%
20%
18‐34 35‐44 45‐54 55‐64 65+
Q15. Demographics: What is your age
Page 26

49%
51%
Male Female
Q16. Demographics: What is your gender?by percentage of respondents
Source: ETC Institute (2019)
Page 27

Q17. How many years have you lived in the Channahon Park District?
by percentage of respondents
Source: ETC Institute (2019)
12%
10%21%
19%
21%
17%
0‐5 6‐10 11‐15 16‐20 21‐30 31+
Page 28

94%
10%
1%
0%
1%
White/Caucasian
Hispanic/Latino
African American/Black
Asian
Other
0% 20% 40% 60% 80% 100%
Q18. Which of the following best describes your race?
Source: ETC Institute (2019)
by percentage of respondents (multiple choices could be made)
.5%
.3%
Page 29
Section 2 Priority Investment Rating
Page 30
Priority Investment Rating Channahon Park District
The Priority Investment Rating (PIR) was developed by ETC Institute to provide governments with an objective tool for evaluating the priority that should be placed on parks and recreation investments. The Priority Investment Rating was developed by ETC Institute to identify the facilities and programs residents think should receive the highest priority for investment. The priority investment rating reflects the importance residents place on items (sum of top 4 choices) and the unmet needs (needs that are only being partly or not met) for each facility/program relative to the facility/program that rated the highest overall. Since decisions related to future investments should consider both the level of unmet need and the importance of facilities and programs, the PIR weights each of these components equally. The PIR reflects the sum of the Unmet Needs Rating and the Importance Rating as shown in the equation below:
PIR = UNR + IR For example, suppose the Unmet Needs Rating for playgrounds is 26 (out of 100) and the Importance Rating for playgrounds is 47 (out of 100), the Priority Investment Rating for playgrounds would be 73 (out of 200). How to Analyze the Charts:
High Priority Areas are those with a PIR of at least 100. A rating of 100 or above generally indicates there is a relatively high level of unmet need and residents generally think it is important to fund improvements in these areas. Improvements in this area are likely to have a positive impact on the greatest number of households.
Medium Priority Areas are those with a PIR of 50‐99. A rating in this range generally indicates there is a medium to high level of unmet need or a significant percentage of residents generally think it is important to fund improvements in these areas.
Low Priority Areas are those with a PIR below 50. A rating in this range generally indicates there is a relatively low level of unmet need and residents do not think it is important to fund improvements in these areas. Improvements may be warranted if the needs of very specialized populations are being targeted.
The following pages show the Unmet Needs Rating, Importance Rating, and Priority Investment Rating for facilities and programs.
Page 31

10092
7877
6453
5044
4342
3531
2827
2624
2323
181717
1615
14111110
81
34
Outdoor amphitheaterOutdoor adventure park
Indoor playgroundDog parks
Mountain bike and hiking trailsPaved trails
Natural areas/wildlife habitatsIndoor walking and running tracks
Outdoor walking/running trackIndoor gymnasium space
Community Garden Outdoor pool/lap lanes
Artificial turf fieldsBefore and after school center
Pickleball courtsIndoor roller skating rink
Esports/VR gaming centerSmall neighborhood parks (1‐10 acres)
Outdoor spray parks/splash padSoccer/Football/Lacrosse/Rugby fields
Recreation centersLarge community parks
Outdoor sand volleyball courts18‐hole golf course
PlaygroundsBaseball and softball fieldsOutdoor basketball courts
Outdoor tennis courtsSkate park
Other
0 20 40 60 80 100
Unmet Needs Rating for Recreation Facilitiesthe rating for the item with the most unmet need=100
the rating of all other items reflects the relative amount of unmet need for each item compared to the item with the most unmet need
Source: ETC Institute (2019)
Page 32

Importance Rating for Recreation Facilitiesthe rating for the item rated as the most important=100
the rating of all other items reflects the relative level of importance for each item compared to the item rated as the most important100
8880
7777
7370
6257
4744
3934
2828
2724
201717
1512
108
77
52
25
Indoor walking and running tracksPaved trails
Mountain bike and hiking trailsOutdoor walking/running track
Large community parks18‐hole golf course
Natural areas/wildlife habitatsSmall neighborhood parks (1‐10 acres)
Recreation centersPlaygroundsDog parks
Outdoor pool/lap lanesOutdoor amphitheater
Outdoor spray parks/splash padIndoor playground
Baseball and softball fieldsIndoor gymnasium space
Before and after school centerOutdoor adventure park
Soccer/Football/Lacrosse/Rugby fieldsIndoor roller skating rink
Pickleball courtsCommunity Garden Artificial turf fields
Skate parkEsports/VR gaming center
Outdoor tennis courtsOutdoor sand volleyball courts
Other
0 20 40 60 80 100Source: ETC Institute (2019)
Page 33

Top Priorities for Investment for Facilities Based on the Priority Investment Rating
144 144
141 134
120 120 120
109 106
93 87
85 74
70 66
58 48
46 45
39 38 37 36
33 30
17 13
10 9
59
Indoor walking and running tracksMountain bike and hiking trails
Paved trailsOutdoor amphitheater
Dog parksNatural areas/wildlife habitatsOutdoor walking/running track
Outdoor adventure park Indoor playground
Large community parks18‐hole golf course
Small neighborhood parks (1‐10 acres)Recreation centers
Outdoor pool/lap lanesIndoor gymnasium space
PlaygroundsBefore and after school center
Outdoor spray parks/splash padCommunity Garden
Indoor roller skating rinkPickleball courts
Baseball and softball fieldsArtificial turf fields
Soccer/Football/Lacrosse/Rugby fieldsEsports/VR gaming center
Outdoor sand volleyball courtsOutdoor tennis courts
Outdoor basketball courtsSkate park
Other
0 40 80 120 160 200
Medium Priority(50‐99)
Low Priority(0‐49)
High Priority(100+)
Source: ETC Institute (2019)
Page 34
Source: ETC Institute (2019)
Page 35
10084
8279
7166
6151
484040
3931
29272626
2323
221919
1855
Adult fitness and wellness programsSenior recreation programs (age 55+)
Nature programsOutdoor adventure programs
Adult tripsWater fitness programsSenior trips (age 55+)
Special eventsAdult sports programs
Senior sports programs (age 55+)Youth fitness and wellness programs
Adult art, dance, performing artsTeen programs/trips
Youth sports programsYouth development programs
Swim lessonsPickleball
Young adult programsESports/Virtual Gaming
Opportunities for individuals with disabilitiesBefore and after school programs
Youth summer camp programsYouth art, dance, performing arts
Pre‐School programsOther
0 02 04 06 80 100
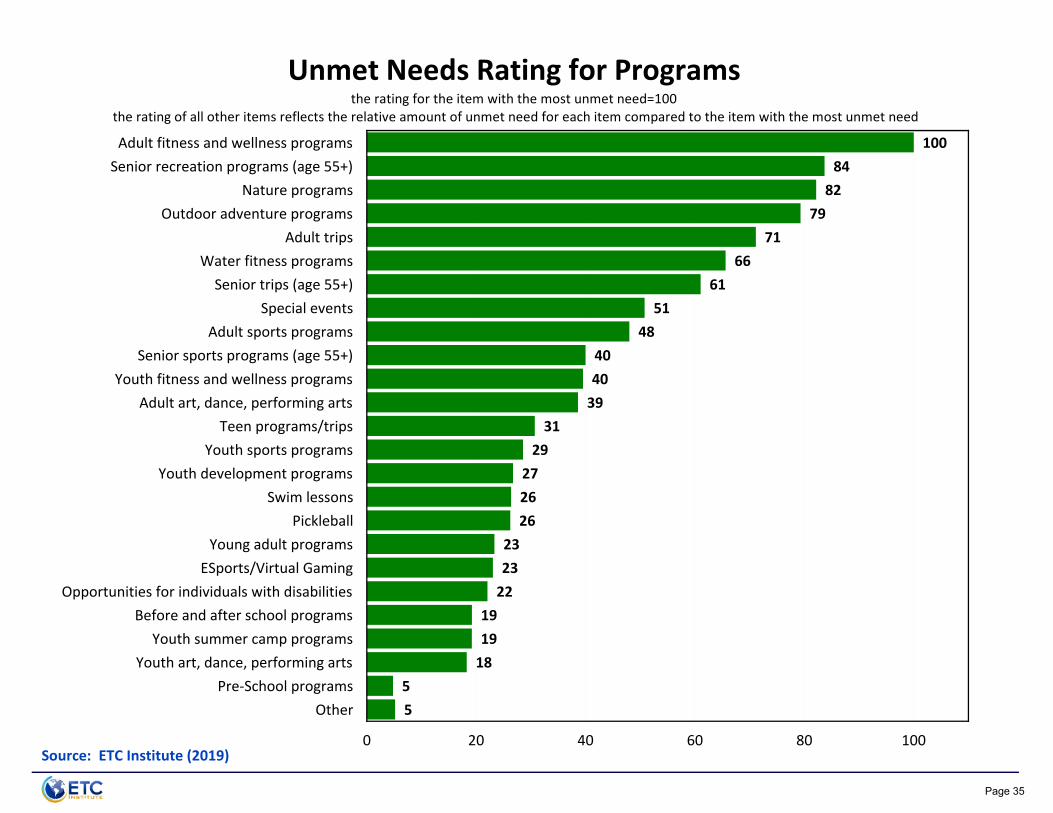
Unmet Needs Rating for Programsthe rating for the item with the most unmet need=100
the rating of all other items reflects the relative amount of unmet need for each item compared to the item with the most unmet need
Source: ETC Institute (2019)

Source: ETC Institute (2019)
Page 36
Importance Rating for Programsthe rating for the item rated as the most important=100
the rating of all other items reflects the relative level of importance for each item compared to the item rated as the most important
10056
4440
3534
312525
2218
181615
141413
121111
99
65
4
Adult fitness and wellness programsSenior recreation programs (age 55+)
Nature programsSenior trips (age 55+)
Youth sports programsAdult trips
Special eventsOutdoor adventure programs
Water fitness programsSwim lessons
Youth summer camp programsYouth fitness and wellness programs
Adult art, dance, performing artsAdult sports programs
Before and after school programsSenior sports programs (age 55+)Youth art, dance, performing arts
Youth development programsOpportunities for individuals with disabilities
Pre‐School programsPickleball
Teen programs/tripsESports/Virtual GamingYoung adult programs
Other
0 02 04 06 80 100Source: ETC Institute (2019)

Top Priorities for Investment for Programs Based on the Priority Investment Rating
200 140
126 105 104
101 90
81 63 63
57 54 54
49 39 39 38
36 33 33
31 29 28
16 10
Adult fitness and wellness programsSenior recreation programs (age 55+)
Nature programsAdult trips
Outdoor adventure programsSenior trips (age 55+)
Water fitness programsSpecial events
Youth sports programsAdult sports programs
Youth fitness and wellness programsAdult art, dance, performing artsSenior sports programs (age 55+)
Swim lessonsTeen programs/trips
Youth development programsYouth summer camp programs
PickleballBefore and after school programs
Opportunities for individuals with disabilitiesYouth art, dance, performing arts
ESports/Virtual GamingYoung adult programsPre‐School programs
Other
0 40 80 120 160 200
Medium Priority(50‐99)
Low Priority(0‐49)
High Priority(100+)
Source: ETC Institute (2019)
Page 37

Section 3 Benchmarking Data
Page 38

Benchmarking Summary Report Channahon Park District
Since 1998, ETC Institute has conducted household surveys for needs assessments, feasibility studies, customer satisfaction, fees and charges comparisons, and other parks and recreation issues in more than 400 communities in 49 states across the country.
The results of these surveys has provided an unparalleled data base of information to compare responses from household residents in client communities to “National Averages” and therefore provide a unique tool to “assist organizations in better decision making.”
Communities within the data base include a full‐range of municipal and county governments from 20,000 in population through over 1 million in population. They include communities in warm weather climates and cold weather climates, mature communities and some of the fastest growing cities and counties in the country.
“National Averages” have been developed for numerous strategically important parks and recreation planning and management issues including: customer satisfaction and usage of parks and programs; methods for receiving marketing information; reasons that prevent members of households from using parks and recreation facilities more often; priority recreation programs, parks, facilities and trails to improve or develop; priority programming spaces to have in planned community centers and aquatic facilities; potential attendance for planned indoor community centers and outdoor aquatic centers; etc.
Results from household responses for the Channahon Park District were compared to National Benchmarks to gain further strategic information. A summary of all tabular comparisons is shown on the following page.
Note: The benchmarking data contained in this report is protected intellectual property. Any reproduction of the benchmarking information in this report by persons or organizations not directly affiliated with Channahon Park District is not authorized without written consent from ETC Institute.
Page 39

Channahon Park District 2019 National Average
Have you or members of your household participated in City/County/Park District recreation programs during the past year?
Yes 40% 33%No 61% 67%
Ways respondents learn about recreation programs and activitiesChannahon Park District website 46% 36%
Facebook 39% 25%Friends and neighbors 36% 48%
Newspaper articles/advertisements 24% 16%Flyers at Park District facilities 18% 22%
Park District email 12% 16%Parks/Rec staff 7% 6%
Organizations used for parks and recreation programs and facilitiesChannahon Park District 70% 50%Forest Preserve District 32% 58%
Library 28% 0%Churches 27% 25%
School district 24% 25%Youth sports associations 16% 14%Neighboring park districts 15% 28%
Private clubs (tennis, fitness and dance) 15% 23%YMCA 6% 17%
Local colleges 5% 18%Homeowners associations/apartment complex 4% 14%
Private schools 3% 12%
Benchmarking for the Channahon Park District
Page 40

Channahon Park District 2019 National Average
Benchmarking for the Channahon Park District
Parks and recreation facilities that respondent households have a need forIndoor walking and running tracks 62% 37%
Large community parks 58% 51%Natural areas/wildlife habitats 56% 55%
Mountain bike and hiking trails (natural surface) 53% 22%Recreation centers (e.g. Arrowhead Recreation Center) 48% 28%
Small neighborhood parks (1-10 acres) 44% 53%Playgrounds 41% 40%
18-hole golf course 38% 22%Outdoor spray parks/splash pad 35% 24%
Outdoor pool/lap lanes 32% 29%Indoor gymnasium space 29% 28%
Dog parks 29% 30%Outdoor amphitheater 28% 31%
Baseball and softball fields 20% 18%Soccer/Football/Lacrosse/Rugby fields 20% 21%
Outdoor tennis courts 18% 21%Skate park 15% 11%
Community Garden (i.e. garden plots for residents) 14% 14%Outdoor sand volleyball courts 11% 15%
Page 41

Channahon Park District 2019 National Average
Benchmarking for the Channahon Park District
Most important parks and recreation facilities (sum of top choices)Indoor walking and running tracks 26% 15%
Mountain bike and hiking trails (natural surface) 21% 33%Large community parks 20% 19%
18-hole golf course 19% 9%Natural areas/wildlife habitats 18% 24%
Small neighborhood parks (1-10 acres) 16% 24%Recreation centers (e.g. Arrowhead Recreation Center) 15% 10%
Playgrounds 12% 17%Dog parks 11% 16%
Outdoor pool/lap lanes 10% 12%Outdoor amphitheater 9% 8%
Outdoor spray parks/splash pad 7% 8%Baseball and softball fields 7% 5%
Indoor gymnasium space 6% 5%Soccer/football/lacrosse/rugby fields 4% 7%
Community garden (i.e. garden plots for residents) 3% 9%Skate park 2% 2%
Outdoor tennis courts 1% 6%Outdoor sand volleyball courts 1% 2%
Page 42

Channahon Park District 2019 National Average
Benchmarking for the Channahon Park District
Programs and amenities that respondent households have a need forAdult fitness and wellness programs 62% 48%
Nature programs 33% 30%Special events 26% 39%
Water fitness programs 24% 26%Youth sports programs 23% 22%
Swim lessons 20% 22%Adult sports programs 18% 23%
Youth fitness and wellness programs 18% 17%Youth summer camp programs 15% 19%
Adult art, dance, performing arts 14% 21%Senior sports programs (age 55+) 13% 26%Youth art, dance, performing arts 13% 16%Before and after school programs 12% 16%
Pre-School programs 9% 13%Opportunities for individuals with disabilities 8% 10%
Most important programs and amenities (sum of top choices)
Adult fitness and wellness programs 41% 30%Nature programs 18% 14%
Senior trips (age 55+) 17% 16%Youth sports programs 14% 12%
Special events 13% 21%Water fitness programs 10% 11%
Youth summer camp programs 8% 8%Youth fitness and wellness programs 7% 6%
Adult art, dance, performing arts 7% 9%Adult sports programs 6% 10%
Before and after school programs 6% 8%Youth art, dance, performing arts 5% 5%
Opportunities for individuals with disabilities 5% 4%Pre-school programs 5% 7%Teen programs/trips 4% 6%
Page 43

Channahon Park District 2019 National Average
Benchmarking for the Channahon Park District
Reasons preventing the use of parks and recreation facilities and programs more often
Program times are not convenient 26% 18%Not enough time 24% 32%
Fees are too high 18% 15%Program or facility not offered 12% 18%
Facilities’ operating hours not convenient 7% 9%I do not know what is being offered 6% 35%
Lack of quality programs 6% 10%Use other agencies 6% 10%
Facilities do not have right equipment 6% 9%Class full 5% 5%
Use facilities in other communities 4% 11%Facilities are not well maintained 3% 10%
Poor customer service by staff 3% 3%I do not know locations of facilities 2% 14%
Too far from our residence 2% 14%Security is insufficient 2% 9%
Lack of parking 1% 7%Registration for programs is difficult 1% 3%
Accessibility/transportation 1% 3%Satisfaction with the overall value received from the Channahon Park District?
Very satisfied 55% 24%Somewhat satisfied 23% 35%
Neutral 17% 22%Somewhat dissatisfied 3% 6%
Very dissatisfied 2% 3%
Page 44

Section 4 Tabular Data
Page 45

Channahon Park District Community Survey Results
ETC Institute (2019) Page 1
Q1(1-14). Please indicate if you or any member of your household has used any of the following Channahon Park District parks during the past 12 months. (N=400) Yes No Q1-1. Al Wood Park 3.0% 97.0% Q1-2. Amberleigh Park 5.8% 94.3% Q1-3. Arroyo Trails 20.3% 79.8% Q1-4. Bluff Park 10.8% 89.3% Q1-5. Central Park 57.3% 42.8% Q1-6. Community Park 56.3% 43.8% Q1-7. Deer Path Park 9.5% 90.5% Q1-8. Diamond Park 4.0% 96.0% Q1-9. Dupage Park 5.3% 94.8% Q1-10. Henneberry Park 13.3% 86.8% Q1-11. Ridge Park 2.5% 97.5% Q1-12. Swifton Park 1.8% 98.3% Q1-13. Yellow Pine Park 4.5% 95.5% Q1-14. Other park 4.8% 95.3%
Page 46

Channahon Park District Community Survey Results
ETC Institute (2019) Page 2
Q1(1-14). If "YES," please rate the condition of the park. (N=293) Excellent Good Fair Poor Q1-1. Al Wood Park 58.3% 33.3% 8.3% 0.0% Q1-2. Amberleigh Park 34.8% 60.9% 4.3% 0.0% Q1-3. Arroyo Trails 49.4% 36.4% 6.5% 7.8% Q1-4. Bluff Park 40.5% 47.6% 7.1% 4.8% Q1-5. Central Park 67.3% 31.8% 0.0% 0.9% Q1-6. Community Park 63.8% 31.7% 4.6% 0.0% Q1-7. Deer Path Park 54.1% 37.8% 8.1% 0.0% Q1-8. Diamond Park 50.0% 37.5% 6.3% 6.3% Q1-9. Dupage Park 57.1% 14.3% 19.0% 9.5% Q1-10. Henneberry Park 46.2% 46.2% 7.7% 0.0% Q1-11. Ridge Park 60.0% 20.0% 20.0% 0.0% Q1-12. Swifton Park 28.6% 14.3% 14.3% 42.9% Q1-13. Yellow Pine Park 22.2% 66.7% 11.1% 0.0% Q1-14. Other park 42.1% 42.1% 15.8% 0.0%
Page 47

Channahon Park District Community Survey Results
ETC Institute (2019) Page 3
Q1(15-21). Please indicate if you or any member of your household has used any of the following Channahon Park District facilities during the past 12 months. (N=400) Yes No Q1-15. Arrowhead Community Center 50.3% 49.8% Q1-16. Heritage Bluffs Golf Club 34.5% 65.5% Q1-17. Heritage Crossing Field House 47.8% 52.3% Q1-18. Picnic Pavilions 24.3% 75.8% Q1-19. Skateland Recreation Center 24.3% 75.8% Q1-20. Tomahawk Aquatic Center 38.3% 61.8% Q1-21. Other facility 0.8% 99.3%
Q1(15-21). If "YES," please rate the condition of the facility. (N=314) Excellent Good Fair Poor Q1-15. Arrowhead Community Center 61.3% 36.6% 2.1% 0.0% Q1-16. Heritage Bluffs Golf Club 72.8% 25.7% 1.5% 0.0% Q1-17. Heritage Crossing Field House 63.0% 34.9% 2.1% 0.0% Q1-18. Picnic Pavilions 67.4% 24.2% 7.4% 1.1% Q1-19. Skateland Recreation Center 33.0% 35.1% 22.3% 9.6% Q1-20. Tomahawk Aquatic Center 54.1% 40.5% 5.4% 0.0% Q1-21. Other facility 100.0% 0.0% 0.0% 0.0%
Page 48

Channahon Park District Community Survey Results
ETC Institute (2019) Page 4
Q1-14. Other park Q1-14. Other park Number Percent Arrowhead 1 5.6 % DARYL COLE TRAIL 1 5.6 % Four Rivers 1 5.6 % Louis Moorman 2 11.1 % McClintoc 1 5.6 % NEW INCLUSIVE PARK 1 5.6 % PARK ON VALLEY ST 1 5.6 % PRAIRIE WETLANDS 1 5.6 % Red Hawk 4 22.2 % Rock Run Rookery 1 5.6 % SENECA PARK 1 5.6 % SENGO ADVENTURE GARDEN 1 5.6 % SOCCER PARK 1 5.6 % Three Rivers 1 5.6 % Total 18 100.0 %
Q1-21. Other facility Q1-21. Other facility Number Percent Dog Park on McClintock 1 33.3 % FITNESS CENTER 1 33.3 % FOUR RIVERS ENVIR CTR 1 33.3 % Total 3 100.0 %
Page 49

Channahon Park District Community Survey Results
ETC Institute (2019) Page 5
Q2. Have you or other members of your household participated in any recreation programs offered by the Channahon Park District during the past 12 months? Q2. Have you participated in any recreation programs offered by Channahon Park District during past 12 months Number Percent Yes 158 39.5 % No 242 60.5 % Total 400 100.0 %
Q2a. Approximately how many different recreation programs offered by the Channahon Park District have you or members of your household participated in over the past 12 months? Q2a. How many different recreation programs have you participated in over past 12 months Number Percent 1 program 35 22.2 % 2 to 3 programs 75 47.5 % 4 to 6 programs 34 21.5 % 7 to 10 programs 10 6.3 % 11+ programs 3 1.9 % Not provided 1 0.6 % Total 158 100.0 %
WITHOUT NOT PROVIDED Q2a. Approximately how many different recreation programs offered by the Channahon Park District have you or members of your household participated in over the past 12 months? (without "not provided") Q2a. How many different recreation programs have you participated in over past 12 months Number Percent 1 program 35 22.3 % 2 to 3 programs 75 47.8 % 4 to 6 programs 34 21.7 % 7 to 10 programs 10 6.4 % 11+ programs 3 1.9 % Total 157 100.0 %
Page 50
Channahon Park District Community Survey Results
ETC Institute (2019) Page 6
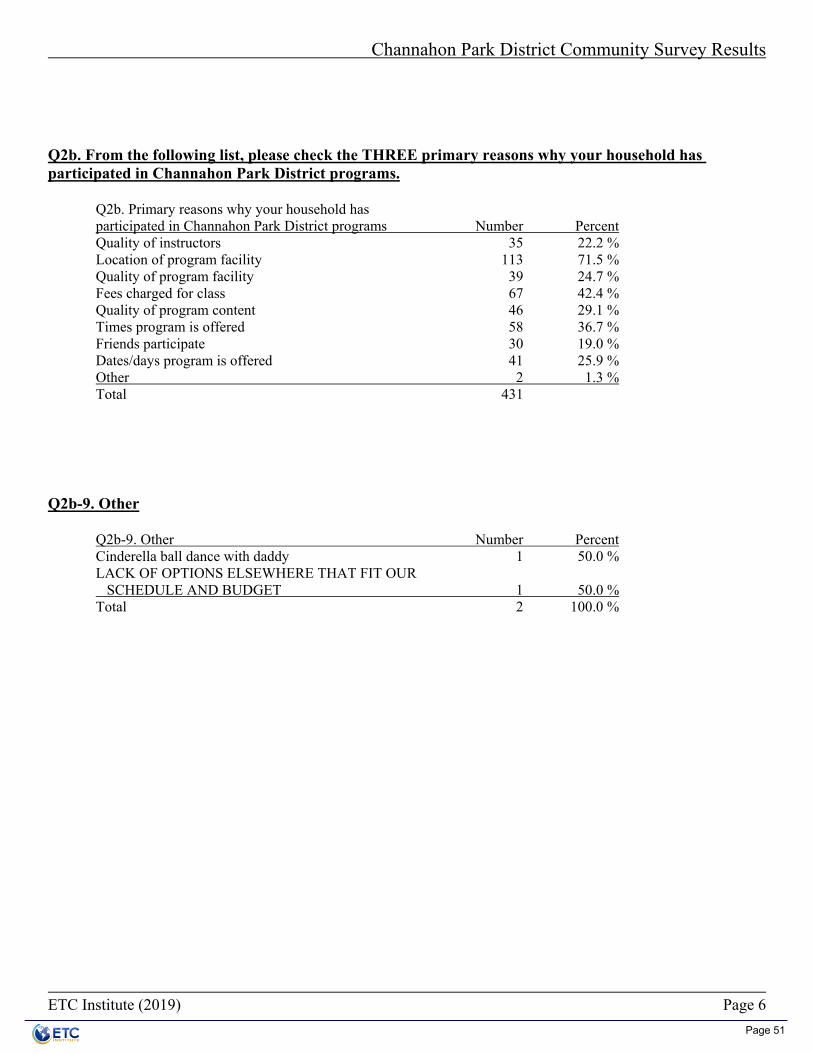
Q2b. From the following list, please check the THREE primary reasons why your household has participated in Channahon Park District programs. Q2b. Primary reasons why your household has participated in Channahon Park District programs Number Percent Quality of instructors 35 22.2 % Location of program facility 113 71.5 % Quality of program facility 39 24.7 % Fees charged for class 67 42.4 % Quality of program content 46 29.1 % Times program is offered 58 36.7 % Friends participate 30 19.0 % Dates/days program is offered 41 25.9 % Other 2 1.3 % Total 431
Q2b-9. Other Q2b-9. Other Number Percent Cinderella ball dance with daddy 1 50.0 % LACK OF OPTIONS ELSEWHERE THAT FIT OUR SCHEDULE AND BUDGET 1 50.0 % Total 2 100.0 %
Page 51
Channahon Park District Community Survey Results
ETC Institute (2019) Page 7
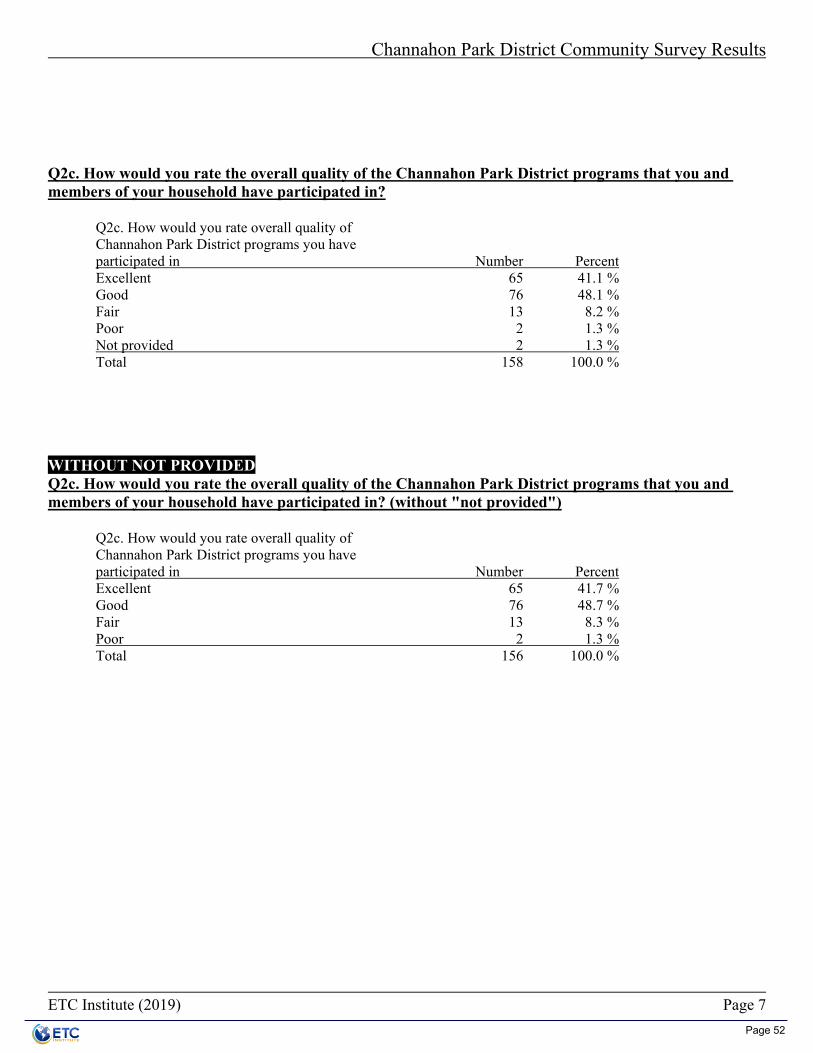
Q2c. How would you rate the overall quality of the Channahon Park District programs that you and members of your household have participated in? Q2c. How would you rate overall quality of Channahon Park District programs you have participated in Number Percent Excellent 65 41.1 % Good 76 48.1 % Fair 13 8.2 % Poor 2 1.3 % Not provided 2 1.3 % Total 158 100.0 % WITHOUT NOT PROVIDED Q2c. How would you rate the overall quality of the Channahon Park District programs that you and members of your household have participated in? (without "not provided") Q2c. How would you rate overall quality of Channahon Park District programs you have participated in Number Percent Excellent 65 41.7 % Good 76 48.7 % Fair 13 8.3 % Poor 2 1.3 % Total 156 100.0 %
Page 52

Channahon Park District Community Survey Results
ETC Institute (2019) Page 8
Q3. Please CHECK ALL of the ways you learn about Channahon Park District programs and activities. Q3. All the ways you learn about Channahon Park District programs & activities Number Percent Channahon Park District Program Guide 349 87.3 % Channahon Park District website 184 46.0 % Newspaper articles/advertisements 95 23.8 % Digital signs & marquees 139 34.8 % Flyers at Park District facilities 72 18.0 % Friends & neighbors 143 35.8 % Twitter 1 0.3 % Facebook 155 38.8 % Park District email 48 12.0 % Parks/Rec staff 27 6.8 % Park District sign boards/yard sign 56 14.0 % School Virtual Backpack 8 2.0 % Other 2 0.5 % Total 1279
Q3-13. Other Q3-13. Other Number Percent DIRECT ATTACHMENT TO SCHOOL NEWSLETTER OR FLYER FROM SCHOOL 1 50.0 % ONLY IF INFO MAILED TO ME 1 50.0 % Total 2 100.0 %
Page 53

Channahon Park District Community Survey Results
ETC Institute (2019) Page 9
Q4. Which THREE of the information sources listed in Question 3 do you MOST PREFER to use to learn about Channahon Park District programs and activities? Q4. Top choice Number Percent Channahon Park District Program Guide 237 59.3 % Channahon Park District website 29 7.3 % Newspaper articles/advertisements 8 2.0 % Digital signs & marquees 8 2.0 % Flyers at Park District facilities 4 1.0 % Friends & neighbors 3 0.8 % Facebook 43 10.8 % Park District email 13 3.3 % Parks/Rec staff 1 0.3 % Park District sign boards/yard sign 2 0.5 % None chosen 52 13.0 % Total 400 100.0 %
Q4. Which THREE of the information sources listed in Question 3 do you MOST PREFER to use to learn about Channahon Park District programs and activities? Q4. 2nd choice Number Percent Channahon Park District Program Guide 38 9.5 % Channahon Park District website 101 25.3 % Newspaper articles/advertisements 29 7.3 % Digital signs & marquees 35 8.8 % Flyers at Park District facilities 10 2.5 % Friends & neighbors 23 5.8 % Twitter 1 0.3 % Facebook 44 11.0 % Park District email 12 3.0 % Parks/Rec staff 3 0.8 % Park District sign boards/yard sign 9 2.3 % None chosen 95 23.8 % Total 400 100.0 %
Page 54

Channahon Park District Community Survey Results
ETC Institute (2019) Page 10
Q4. Which THREE of the information sources listed in Question 3 do you MOST PREFER to use to learn about Channahon Park District programs and activities? Q4. 3rd choice Number Percent Channahon Park District Program Guide 32 8.0 % Channahon Park District website 40 10.0 % Newspaper articles/advertisements 17 4.3 % Digital signs & marquees 34 8.5 % Flyers at Park District facilities 19 4.8 % Friends & neighbors 35 8.8 % Twitter 1 0.3 % Facebook 40 10.0 % Park District email 12 3.0 % Parks/Rec staff 5 1.3 % Park District sign boards/yard sign 14 3.5 % School Virtual Backpack 2 0.5 % Other 1 0.3 % None chosen 148 37.0 % Total 400 100.0 % SUM OF TOP 3 CHOICES Q4. Which THREE of the information sources listed in Question 3 do you MOST PREFER to use to learn about Channahon Park District programs and activities? (top 3) Q4. Sum of Top 3 Choices Number Percent Channahon Park District Program Guide 307 76.8 % Channahon Park District website 170 42.5 % Newspaper articles/advertisements 54 13.5 % Digital signs & marquees 77 19.3 % Flyers at Park District facilities 33 8.3 % Friends & neighbors 61 15.3 % Twitter 2 0.5 % Facebook 127 31.8 % Park District email 37 9.3 % Parks/Rec staff 9 2.3 % Park District sign boards/yard sign 25 6.3 % School Virtual Backpack 2 0.5 % Other 1 0.3 % None chosen 52 13.0 % Total 957
Page 55

Channahon Park District Community Survey Results
ETC Institute (2019) Page 11
Q5. Please CHECK ALL of the following reasons that prevent you or other members of your household from using parks, recreation facilities, and programs of the Channahon Park District MORE OFTEN. Q5. Reasons that prevent you from using parks, recreation facilities, & programs of Channahon Park District more often Number Percent Facilities are not well maintained 11 2.8 % Program or facility not offered 49 12.3 % Facilities do not have right equipment 23 5.8 % Security is insufficient 6 1.5 % Lack of quality programs 25 6.3 % Too far from our residence 7 1.8 % Class full 19 4.8 % Fees are too high 73 18.3 % Program times are not convenient 105 26.3 % Use facilities in other communities 16 4.0 % Poor customer service by staff 11 2.8 % I do not know locations of facilities 8 2.0 % Use other agencies 24 6.0 % I do not know what is being offered 25 6.3 % Facilities’ operating hours not convenient 28 7.0 % Registration for programs is difficult 4 1.0 % Lack of parking 4 1.0 % Not enough choices 36 9.0 % Not enough time 97 24.3 % Accessibility/transportation 3 0.8 % Other 50 12.5 % Total 624
Page 56
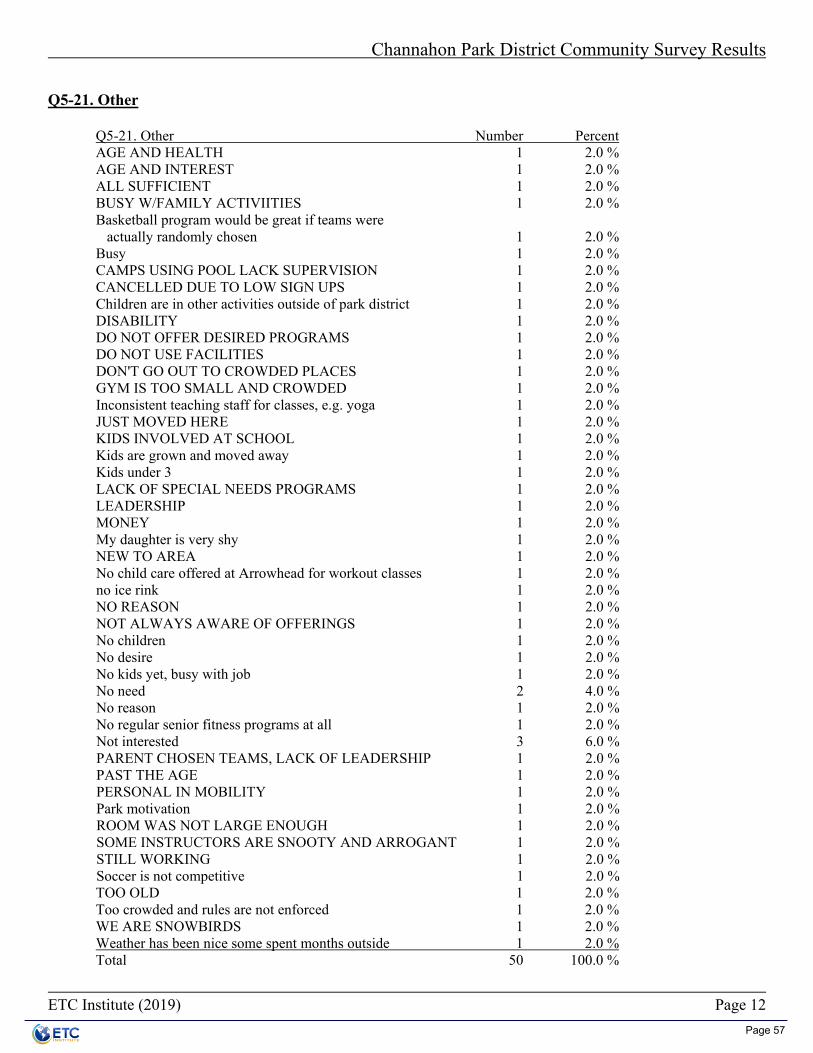
Channahon Park District Community Survey Results
ETC Institute (2019) Page 12
Q5-21. Other Q5-21. Other Number Percent AGE AND HEALTH 1 2.0 % AGE AND INTEREST 1 2.0 % ALL SUFFICIENT 1 2.0 % BUSY W/FAMILY ACTIVIITIES 1 2.0 % Basketball program would be great if teams were actually randomly chosen 1 2.0 % Busy 1 2.0 % CAMPS USING POOL LACK SUPERVISION 1 2.0 % CANCELLED DUE TO LOW SIGN UPS 1 2.0 % Children are in other activities outside of park district 1 2.0 % DISABILITY 1 2.0 % DO NOT OFFER DESIRED PROGRAMS 1 2.0 % DO NOT USE FACILITIES 1 2.0 % DON'T GO OUT TO CROWDED PLACES 1 2.0 % GYM IS TOO SMALL AND CROWDED 1 2.0 % Inconsistent teaching staff for classes, e.g. yoga 1 2.0 % JUST MOVED HERE 1 2.0 % KIDS INVOLVED AT SCHOOL 1 2.0 % Kids are grown and moved away 1 2.0 % Kids under 3 1 2.0 % LACK OF SPECIAL NEEDS PROGRAMS 1 2.0 % LEADERSHIP 1 2.0 % MONEY 1 2.0 % My daughter is very shy 1 2.0 % NEW TO AREA 1 2.0 % No child care offered at Arrowhead for workout classes 1 2.0 % no ice rink 1 2.0 % NO REASON 1 2.0 % NOT ALWAYS AWARE OF OFFERINGS 1 2.0 % No children 1 2.0 % No desire 1 2.0 % No kids yet, busy with job 1 2.0 % No need 2 4.0 % No reason 1 2.0 % No regular senior fitness programs at all 1 2.0 % Not interested 3 6.0 % PARENT CHOSEN TEAMS, LACK OF LEADERSHIP 1 2.0 % PAST THE AGE 1 2.0 % PERSONAL IN MOBILITY 1 2.0 % Park motivation 1 2.0 % ROOM WAS NOT LARGE ENOUGH 1 2.0 % SOME INSTRUCTORS ARE SNOOTY AND ARROGANT 1 2.0 % STILL WORKING 1 2.0 % Soccer is not competitive 1 2.0 % TOO OLD 1 2.0 % Too crowded and rules are not enforced 1 2.0 % WE ARE SNOWBIRDS 1 2.0 % Weather has been nice some spent months outside 1 2.0 % Total 50 100.0 %
Page 57

Channahon Park District Community Survey Results
ETC Institute (2019) Page 13
Q6. From the following list, please CHECK ALL of the organizations that you and members of your household use for parks and recreation programs, services, and facilities. Q6. Organizations you use for parks & recreation programs, services, & facilities Number Percent Channahon Park District 278 69.5 % Churches 107 26.8 % Youth sports associations (i.e. Channahon Baseball, Braves Football) 64 16.0 % YMCA 22 5.5 % School district 97 24.3 % Private schools 12 3.0 % Forest Preserve District 127 31.8 % Private clubs (tennis, fitness & dance) 61 15.3 % Neighboring park districts 61 15.3 % Other providers in Channahon 21 5.3 % Homeowners associations/apartment complex 15 3.8 % Local colleges 20 5.0 % Library 113 28.3 % Other 16 4.0 % None, do not use any organizations 53 13.3 % Total 1067 Q6-14. Other Q6-14. Other Number Percent Bank 1 6.3 % CHANNAHON TOWNSHIP 1 6.3 % Girl Scouts 1 6.3 % MBSA 1 6.3 % MINOOKA 1 6.3 % MY HOUSE IS GOOD ENOUGH 1 6.3 % Minooka community room is free for our meetings 1 6.3 % Morris Hospital senior exercise classes 1 6.3 % NEIGHBORING COMMUNITY LIBRARIES, SCOUTS 1 6.3 % PRIVATE CAMPGROUND 1 6.3 % RUSH SOCCER 1 6.3 % SCOUTS 2 12.5 % SPECIAL REC PROGRAM SRJC 1 6.3 % TRAVEL TEAMS 1 6.3 % Work 1 6.3 % Total 16 100.0 %
Page 58

Channahon Park District Community Survey Results
ETC Institute (2019) Page 14
Q7. Please rate your level of satisfaction with the overall value your household receives from Channahon Park District. Q7. Your level of satisfaction with overall value your household receives from Channahon Park District Number Percent Very satisfied 210 52.5 % Somewhat satisfied 87 21.8 % Neutral 64 16.0 % Somewhat dissatisfied 11 2.8 % Very dissatisfied 7 1.8 % Don't know 21 5.3 % Total 400 100.0 % WITHOUT DON’T KNOW Q7. Please rate your level of satisfaction with the overall value your household receives from Channahon Park District. (without "don't know") Q7. Your level of satisfaction with overall value your household receives from Channahon Park District Number Percent Very satisfied 210 55.4 % Somewhat satisfied 87 23.0 % Neutral 64 16.9 % Somewhat dissatisfied 11 2.9 % Very dissatisfied 7 1.8 % Total 379 100.0 %
Page 59

Channahon Park District Community Survey Results
ETC Institute (2019) Page 15
Q8. Please indicate if you or any member of your household has a need for each of the amenities/facilities listed below. (N=400) Yes No Q8-1. 18-hole golf course 37.8% 62.3% Q8-2. Artificial turf fields 8.3% 91.8% Q8-3. Baseball & softball fields 20.0% 80.0% Q8-4. Before & after school center 12.0% 88.0% Q8-5. Community garden (i.e. garden plots for residents) 13.5% 86.5% Q8-6. Dog parks 28.8% 71.3% Q8-7. Esports/VR gaming center 7.3% 92.8% Q8-8. Indoor roller skating rink 24.8% 75.3% Q8-9. Indoor gymnasium space (e.g. volleyball, basketball, pickleball) 29.0% 71.0% Q8-10. Indoor playground 21.0% 79.0% Q8-11. Indoor walking & running tracks 62.0% 38.0% Q8-12. Large community parks 57.8% 42.3% Q8-13. Mountain bike & hiking trails (natural surface) 52.8% 47.3% Q8-14. Natural areas/wildlife habitats 56.3% 43.8% Q8-15. Outdoor adventure park (i.e. high ropes, challenge courses, ziplines, BMX pump track, etc.) 25.0% 75.0% Q8-16. Outdoor amphitheater 27.8% 72.3% Q8-17. Outdoor basketball courts 16.5% 83.5% Q8-18. Outdoor pool/lap lanes 32.3% 67.8% Q8-19. Outdoor sand volleyball courts 10.5% 89.5%
Page 60

Channahon Park District Community Survey Results
ETC Institute (2019) Page 16
Q8. Please indicate if you or any member of your household has a need for each of the amenities/facilities listed below. Yes No Q8-20. Outdoor spray parks/splash pad 34.8% 65.3% Q8-21. Outdoor tennis courts 17.8% 82.3% Q8-22. Outdoor walking/running track 54.0% 46.0% Q8-23. Paved trails 62.0% 38.0% Q8-24. Pickleball courts 8.3% 91.8% Q8-25. Playgrounds 40.5% 59.5% Q8-26. Recreation centers (e.g. Arrowhead Recreation Center) 48.3% 51.8% Q8-27. Skate park 14.8% 85.3% Q8-28. Small neighborhood parks (1-10 acres) 43.8% 56.3% Q8-29. Soccer/football/lacrosse/rugby fields 19.5% 80.5% Q8-30. Other 8.8% 91.3%
Page 61

Channahon Park District Community Survey Results
ETC Institute (2019) Page 17
Q8. If "YES," please rate ALL of the amenities/facilities of this type in the Channahon Park District using a scale of 1 to 5, where 5 means the needs of your household are "100% Met" and 1 means "0% Met." (N=368) 100% met 75% met 50% met 25% met 0% met Q8-1. 18-hole golf course 73.6% 18.1% 6.3% 0.7% 1.4% Q8-2. Artificial turf fields 14.8% 7.4% 7.4% 3.7% 66.7% Q8-3. Baseball & softball fields 54.1% 33.8% 6.8% 5.4% 0.0% Q8-4. Before & after school center 23.5% 23.5% 14.7% 8.8% 29.4% Q8-5. Community garden (i.e. garden plots for residents) 33.3% 7.1% 9.5% 4.8% 45.2% Q8-6. Dog parks 22.5% 15.7% 18.6% 8.8% 34.3% Q8-7. Esports/VR gaming center 13.0% 13.0% 4.3% 4.3% 65.2% Q8-8. Indoor roller skating rink 45.2% 32.3% 12.9% 7.5% 2.2% Q8-9. Indoor gymnasium space (e.g. volleyball, basketball, pickleball) 45.1% 21.6% 17.6% 8.8% 6.9% Q8-10. Indoor playground 9.7% 4.2% 15.3% 18.1% 52.8% Q8-11. Indoor walking & running tracks 63.8% 19.7% 7.8% 6.0% 2.8% Q8-12. Large community parks 77.5% 16.3% 4.3% 1.0% 1.0% Q8-13. Mountain bike & hiking trails (natural surface) 46.2% 25.8% 17.2% 5.4% 5.4% Q8-14. Natural areas/wildlife habitats 55.3% 24.1% 11.1% 3.5% 6.0% Q8-15. Outdoor adventure park (i.e. high ropes, challenge courses, ziplines, BMX pump track, etc.) 8.9% 5.6% 8.9% 2.2% 74.4% Q8-16. Outdoor amphitheater 6.6% 9.9% 7.7% 9.9% 65.9% Q8-17. Outdoor basketball courts 59.6% 26.3% 7.0% 5.3% 1.8% Q8-18. Outdoor pool/lap lanes 59.0% 18.8% 10.3% 5.1% 6.8% Q8-19. Outdoor sand volleyball courts 58.8% 8.8% 17.6% 5.9% 8.8%
Page 62
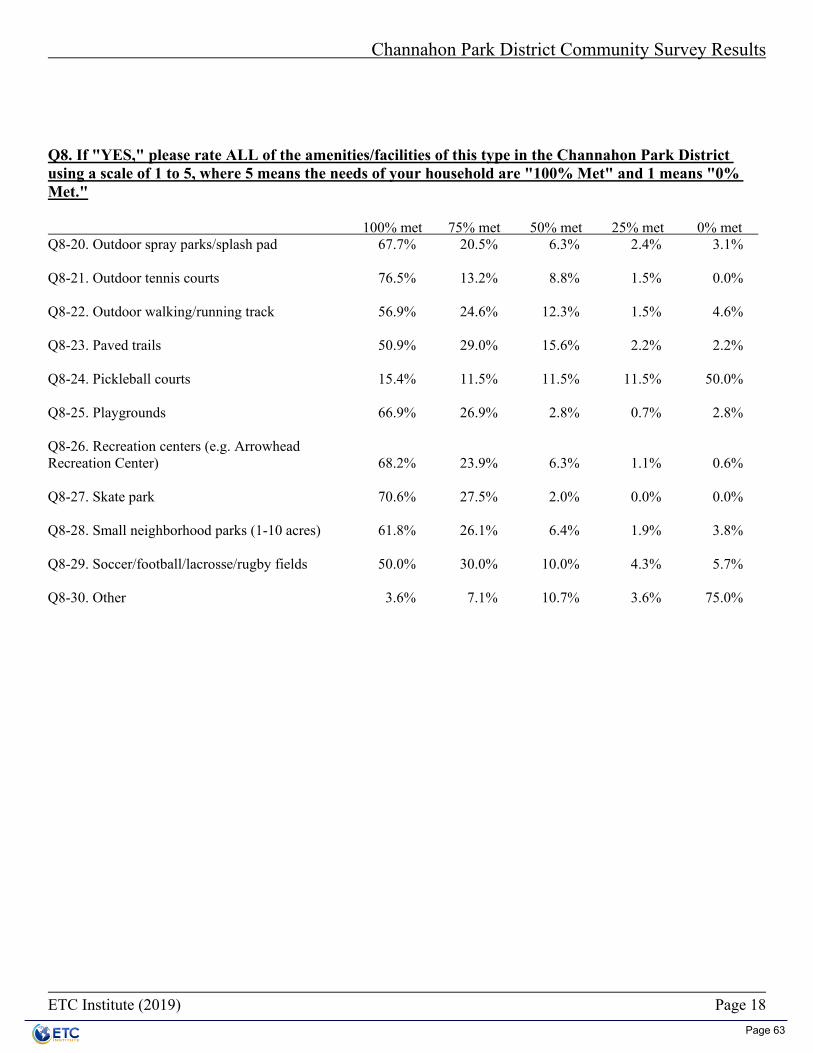
Channahon Park District Community Survey Results
ETC Institute (2019) Page 18
Q8. If "YES," please rate ALL of the amenities/facilities of this type in the Channahon Park District using a scale of 1 to 5, where 5 means the needs of your household are "100% Met" and 1 means "0% Met." 100% met 75% met 50% met 25% met 0% met Q8-20. Outdoor spray parks/splash pad 67.7% 20.5% 6.3% 2.4% 3.1% Q8-21. Outdoor tennis courts 76.5% 13.2% 8.8% 1.5% 0.0% Q8-22. Outdoor walking/running track 56.9% 24.6% 12.3% 1.5% 4.6% Q8-23. Paved trails 50.9% 29.0% 15.6% 2.2% 2.2% Q8-24. Pickleball courts 15.4% 11.5% 11.5% 11.5% 50.0% Q8-25. Playgrounds 66.9% 26.9% 2.8% 0.7% 2.8% Q8-26. Recreation centers (e.g. Arrowhead Recreation Center) 68.2% 23.9% 6.3% 1.1% 0.6% Q8-27. Skate park 70.6% 27.5% 2.0% 0.0% 0.0% Q8-28. Small neighborhood parks (1-10 acres) 61.8% 26.1% 6.4% 1.9% 3.8% Q8-29. Soccer/football/lacrosse/rugby fields 50.0% 30.0% 10.0% 4.3% 5.7% Q8-30. Other 3.6% 7.1% 10.7% 3.6% 75.0%
Page 63

Channahon Park District Community Survey Results
ETC Institute (2019) Page 19
Q8-30. Other Q8-30. Other Number Percent A climbing walk would be nice 1 2.9 % Better water access to the rivers in our area 1 2.9 % Dog parks in Grundy County part of Channahon 1 2.9 % FRISBEE GOLD COURSE 1 2.9 % Fishing at new park 1 2.9 % Fitness center 4 11.4 % Fitness center, cardio and weights 1 2.9 % GYMNASTICS 1 2.9 % ICE SKATING 1 2.9 % INDOOR FIELDS AND POOL 1 2.9 % INDOOR ICE RINK 1 2.9 % INDOOR SOCCER 1 2.9 % Ice skating rink and roller hockey rink 1 2.9 % Indoor pool 15 42.9 % Outdoor hockey rink 1 2.9 % SLEDDING HILL 1 2.9 % TRACK AT COMMUNITY PARKS 1 2.9 % Weight room 1 2.9 % Total 35 100.0 %
Page 64

Channahon Park District Community Survey Results
ETC Institute (2019) Page 20
Q9. Which FOUR of the amenities/facilities from the list in Question 8 are MOST IMPORTANT to your household? Q9. Top choice Number Percent 18-hole golf course 51 12.8 % Artificial turf fields 3 0.8 % Baseball & softball fields 7 1.8 % Before & after school center 6 1.5 % Community garden (i.e. garden plots for residents) 1 0.3 % Dog parks 10 2.5 % Esports/VR gaming center 2 0.5 % Indoor roller skating rink 2 0.5 % Indoor gymnasium space (e.g. volleyball, basketball, pickleball) 9 2.3 % Indoor playground 8 2.0 % Indoor walking & running tracks 34 8.5 % Large community parks 20 5.0 % Mountain bike & hiking trails (natural surface) 20 5.0 % Natural areas/wildlife habitats 16 4.0 % Outdoor adventure park (i.e. high ropes, challenge courses, ziplines, BMX pump track, etc.) 2 0.5 % Outdoor amphitheater 7 1.8 % Outdoor pool/lap lanes 8 2.0 % Outdoor spray parks/splash pad 2 0.5 % Outdoor tennis courts 1 0.3 % Outdoor walking/running track 21 5.3 % Paved trails 19 4.8 % Pickleball courts 2 0.5 % Playgrounds 12 3.0 % Recreation centers (e.g. Arrowhead Recreation Center) 22 5.5 % Small neighborhood parks (1-10 acres) 15 3.8 % Soccer/football/lacrosse/rugby fields 6 1.5 % Other 15 3.8 % None chosen 79 19.8 % Total 400 100.0 %
Page 65

Channahon Park District Community Survey Results
ETC Institute (2019) Page 21
Q9. Which FOUR of the amenities/facilities from the list in Question 8 are MOST IMPORTANT to your household? Q9. 2nd choice Number Percent 18-hole golf course 7 1.8 % Artificial turf fields 1 0.3 % Baseball & softball fields 8 2.0 % Before & after school center 6 1.5 % Community garden (i.e. garden plots for residents) 3 0.8 % Dog parks 13 3.3 % Indoor roller skating rink 7 1.8 % Indoor gymnasium space (e.g. volleyball, basketball, pickleball) 4 1.0 % Indoor playground 7 1.8 % Indoor walking & running tracks 36 9.0 % Large community parks 24 6.0 % Mountain bike & hiking trails (natural surface) 28 7.0 % Natural areas/wildlife habitats 20 5.0 % Outdoor adventure park (i.e. high ropes, challenge courses, ziplines, BMX pump track, etc.) 3 0.8 % Outdoor amphitheater 7 1.8 % Outdoor pool/lap lanes 11 2.8 % Outdoor spray parks/splash pad 11 2.8 % Outdoor tennis courts 1 0.3 % Outdoor walking/running track 23 5.8 % Paved trails 24 6.0 % Pickleball courts 6 1.5 % Playgrounds 6 1.5 % Recreation centers (e.g. Arrowhead Recreation Center) 16 4.0 % Skate park 1 0.3 % Small neighborhood parks (1-10 acres) 19 4.8 % Soccer/football/lacrosse/rugby fields 4 1.0 % Other 6 1.5 % None chosen 98 24.5 % Total 400 100.0 %
Page 66

Channahon Park District Community Survey Results
ETC Institute (2019) Page 22
Q9. Which FOUR of the amenities/facilities from the list in Question 8 are MOST IMPORTANT to your household? Q9. 3rd choice Number Percent 18-hole golf course 10 2.5 % Artificial turf fields 1 0.3 % Baseball & softball fields 5 1.3 % Before & after school center 4 1.0 % Community garden (i.e. garden plots for residents) 4 1.0 % Dog parks 11 2.8 % Esports/VR gaming center 1 0.3 % Indoor roller skating rink 3 0.8 % Indoor gymnasium space (e.g. volleyball, basketball, pickleball) 10 2.5 % Indoor playground 9 2.3 % Indoor walking & running tracks 22 5.5 % Large community parks 22 5.5 % Mountain bike & hiking trails (natural surface) 23 5.8 % Natural areas/wildlife habitats 23 5.8 % Outdoor adventure park (i.e. high ropes, challenge courses, ziplines, BMX pump track, etc.) 5 1.3 % Outdoor amphitheater 10 2.5 % Outdoor pool/lap lanes 10 2.5 % Outdoor spray parks/splash pad 3 0.8 % Outdoor tennis courts 3 0.8 % Outdoor walking/running track 18 4.5 % Paved trails 26 6.5 % Pickleball courts 4 1.0 % Playgrounds 15 3.8 % Recreation centers (e.g. Arrowhead Recreation Center) 11 2.8 % Skate park 3 0.8 % Small neighborhood parks (1-10 acres) 13 3.3 % Soccer/football/lacrosse/rugby fields 4 1.0 % Other 2 0.5 % None chosen 125 31.3 % Total 400 100.0 %
Page 67

Channahon Park District Community Survey Results
ETC Institute (2019) Page 23
Q9. Which FOUR of the amenities/facilities from the list in Question 8 are MOST IMPORTANT to your household? Q9. 4th choice Number Percent 18-hole golf course 8 2.0 % Artificial turf fields 3 0.8 % Baseball & softball fields 7 1.8 % Before & after school center 5 1.3 % Community garden (i.e. garden plots for residents) 2 0.5 % Dog parks 11 2.8 % Esports/VR gaming center 4 1.0 % Indoor roller skating rink 3 0.8 % Indoor gymnasium space (e.g. volleyball, basketball, pickleball) 2 0.5 % Indoor playground 5 1.3 % Indoor walking & running tracks 12 3.0 % Large community parks 14 3.5 % Mountain bike & hiking trails (natural surface) 12 3.0 % Natural areas/wildlife habitats 14 3.5 % Outdoor adventure park (i.e. high ropes, challenge courses, ziplines, BMX pump track, etc.) 7 1.8 % Outdoor amphitheater 11 2.8 % Outdoor pool/lap lanes 11 2.8 % Outdoor sand volleyball courts 2 0.5 % Outdoor spray parks/splash pad 13 3.3 % Outdoor walking/running track 18 4.5 % Paved trails 22 5.5 % Playgrounds 16 4.0 % Recreation centers (e.g. Arrowhead Recreation Center) 10 2.5 % Skate park 3 0.8 % Small neighborhood parks (1-10 acres) 17 4.3 % Soccer/football/lacrosse/rugby fields 3 0.8 % Other 3 0.8 % None chosen 162 40.5 % Total 400 100.0 %
Page 68
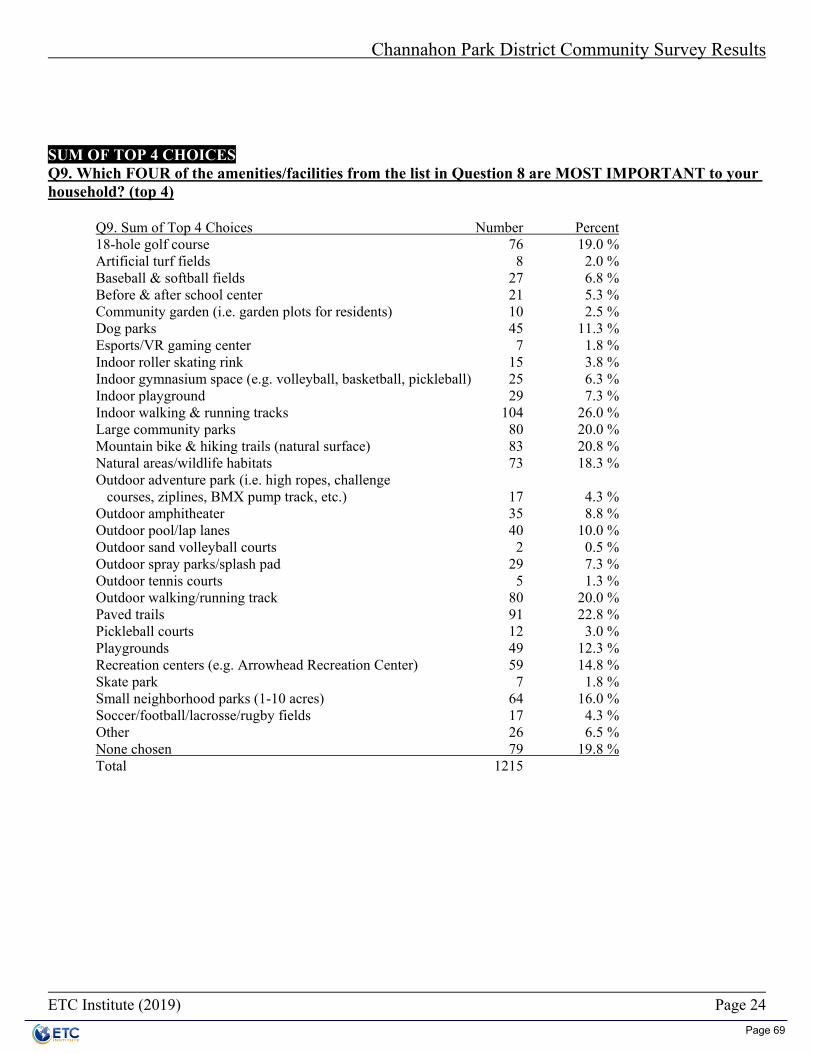
Channahon Park District Community Survey Results
ETC Institute (2019) Page 24
SUM OF TOP 4 CHOICES Q9. Which FOUR of the amenities/facilities from the list in Question 8 are MOST IMPORTANT to your household? (top 4) Q9. Sum of Top 4 Choices Number Percent 18-hole golf course 76 19.0 % Artificial turf fields 8 2.0 % Baseball & softball fields 27 6.8 % Before & after school center 21 5.3 % Community garden (i.e. garden plots for residents) 10 2.5 % Dog parks 45 11.3 % Esports/VR gaming center 7 1.8 % Indoor roller skating rink 15 3.8 % Indoor gymnasium space (e.g. volleyball, basketball, pickleball) 25 6.3 % Indoor playground 29 7.3 % Indoor walking & running tracks 104 26.0 % Large community parks 80 20.0 % Mountain bike & hiking trails (natural surface) 83 20.8 % Natural areas/wildlife habitats 73 18.3 % Outdoor adventure park (i.e. high ropes, challenge courses, ziplines, BMX pump track, etc.) 17 4.3 % Outdoor amphitheater 35 8.8 % Outdoor pool/lap lanes 40 10.0 % Outdoor sand volleyball courts 2 0.5 % Outdoor spray parks/splash pad 29 7.3 % Outdoor tennis courts 5 1.3 % Outdoor walking/running track 80 20.0 % Paved trails 91 22.8 % Pickleball courts 12 3.0 % Playgrounds 49 12.3 % Recreation centers (e.g. Arrowhead Recreation Center) 59 14.8 % Skate park 7 1.8 % Small neighborhood parks (1-10 acres) 64 16.0 % Soccer/football/lacrosse/rugby fields 17 4.3 % Other 26 6.5 % None chosen 79 19.8 % Total 1215
Page 69
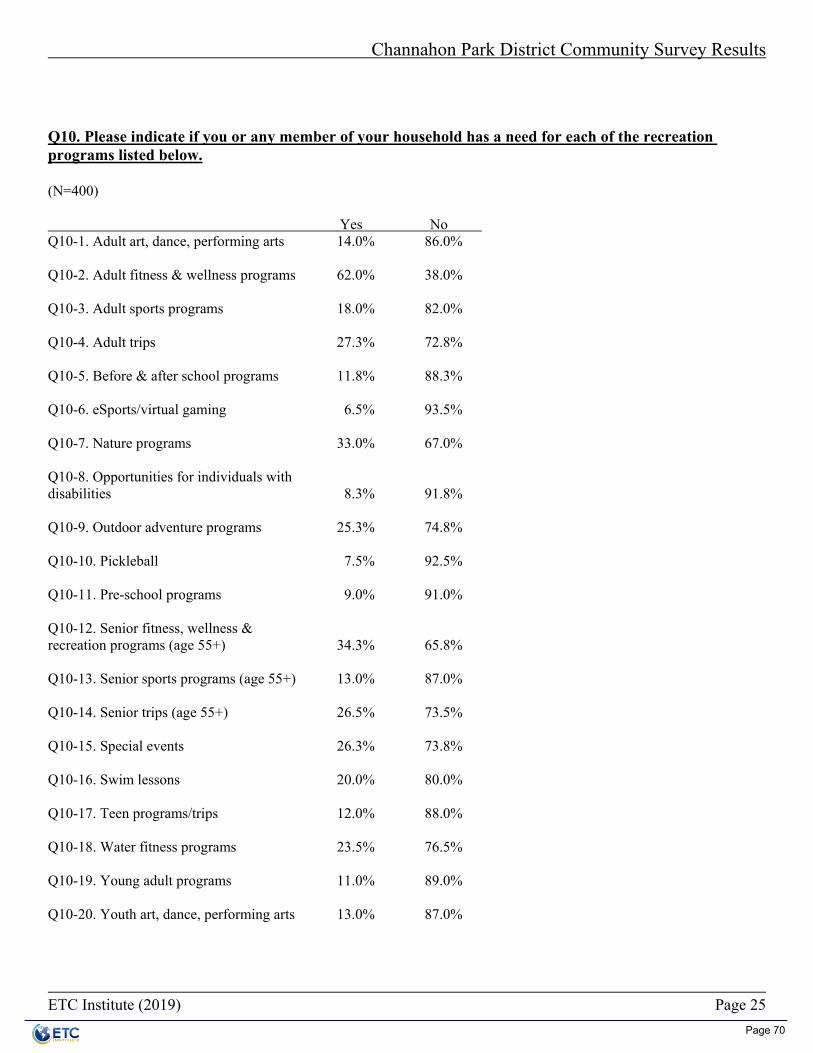
Channahon Park District Community Survey Results
ETC Institute (2019) Page 25
Q10. Please indicate if you or any member of your household has a need for each of the recreation programs listed below. (N=400) Yes No Q10-1. Adult art, dance, performing arts 14.0% 86.0% Q10-2. Adult fitness & wellness programs 62.0% 38.0% Q10-3. Adult sports programs 18.0% 82.0% Q10-4. Adult trips 27.3% 72.8% Q10-5. Before & after school programs 11.8% 88.3% Q10-6. eSports/virtual gaming 6.5% 93.5% Q10-7. Nature programs 33.0% 67.0% Q10-8. Opportunities for individuals with disabilities 8.3% 91.8% Q10-9. Outdoor adventure programs 25.3% 74.8% Q10-10. Pickleball 7.5% 92.5% Q10-11. Pre-school programs 9.0% 91.0% Q10-12. Senior fitness, wellness & recreation programs (age 55+) 34.3% 65.8% Q10-13. Senior sports programs (age 55+) 13.0% 87.0% Q10-14. Senior trips (age 55+) 26.5% 73.5% Q10-15. Special events 26.3% 73.8% Q10-16. Swim lessons 20.0% 80.0% Q10-17. Teen programs/trips 12.0% 88.0% Q10-18. Water fitness programs 23.5% 76.5% Q10-19. Young adult programs 11.0% 89.0% Q10-20. Youth art, dance, performing arts 13.0% 87.0%
Page 70

Channahon Park District Community Survey Results
ETC Institute (2019) Page 26
Q10. Please indicate if you or any member of your household has a need for each of the recreation programs listed below. Yes No Q10-21. Youth development programs 11.8% 88.3% Q10-22. Youth fitness & wellness programs 18.0% 82.0% Q10-23. Youth sports programs 22.5% 77.5% Q10-24. Youth summer camp programs 14.8% 85.3% Q10-25. Other 1.5% 98.5%
Page 71

Channahon Park District Community Survey Results
ETC Institute (2019) Page 27
Q10. If "YES," please rate the recreation programs of this type in the Channahon Park District using a scale of 1 to 5, where 5 means the needs of your household are "100% Met" and 1 means "0% Met." (N=337) 100% met 75% met 50% met 25% met 0% met Q10-1. Adult art, dance, performing arts 16.7% 16.7% 29.2% 10.4% 27.1% Q10-2. Adult fitness & wellness programs 21.9% 39.0% 25.2% 7.6% 6.2% Q10-3. Adult sports programs 12.9% 22.6% 35.5% 14.5% 14.5% Q10-4. Adult trips 13.5% 23.6% 36.0% 19.1% 7.9% Q10-5. Before & after school programs 26.3% 34.2% 18.4% 2.6% 18.4% Q10-6. eSports/virtual gaming 9.5% 4.8% 4.8% 14.3% 66.7% Q10-7. Nature programs 14.2% 25.7% 38.1% 16.8% 5.3% Q10-8. Opportunities for individuals with disabilities 17.9% 17.9% 28.6% 25.0% 10.7% Q10-9. Outdoor adventure programs 11.5% 12.6% 31.0% 20.7% 24.1% Q10-10. Pickleball 11.5% 3.8% 11.5% 15.4% 57.7% Q10-11. Pre-school programs 58.1% 29.0% 6.5% 3.2% 3.2% Q10-12. Senior fitness, wellness & recreation programs (age 55+) 10.0% 30.9% 31.8% 12.7% 14.5% Q10-13. Senior sports programs (age 55+) 2.6% 23.1% 20.5% 30.8% 23.1% Q10-14. Senior trips (age 55+) 12.7% 31.6% 25.3% 16.5% 13.9% Q10-15. Special events 25.0% 28.3% 29.3% 14.1% 3.3% Q10-16. Swim lessons 47.2% 20.8% 18.1% 6.9% 6.9% Q10-17. Teen programs/trips 16.7% 21.4% 35.7% 21.4% 4.8% Q10-18. Water fitness programs 13.8% 18.8% 27.5% 22.5% 17.5% Q10-19. Young adult programs 21.6% 27.0% 27.0% 16.2% 8.1% Q10-20. Youth art, dance, performing arts 31.9% 34.0% 14.9% 17.0% 2.1%
Page 72

Channahon Park District Community Survey Results
ETC Institute (2019) Page 28
Q10. If "YES," please rate the recreation programs of this type in the Channahon Park District using a scale of 1 to 5, where 5 means the needs of your household are "100% Met" and 1 means "0% Met." 100% met 75% met 50% met 25% met 0% met Q10-21. Youth development programs 19.0% 26.2% 26.2% 23.8% 4.8% Q10-22. Youth fitness & wellness programs 21.9% 25.0% 20.3% 21.9% 10.9% Q10-23. Youth sports programs 39.7% 29.5% 20.5% 5.1% 5.1% Q10-24. Youth summer camp programs 47.1% 21.6% 25.5% 0.0% 5.9% Q10-25. Other 16.7% 0.0% 16.7% 16.7% 50.0%
Q10-25. Other Q10-25. Other Number Percent Fishing or river related 1 16.7 % GYMNASTICS 1 16.7 % INDOOR WATER FITNESS 1 16.7 % MORE PROGRAMS FOR TEENS 1 16.7 % MUSIC PROGRAMS BEFORE JUNIOR HIGH 1 16.7 % SPECIAL EVENTS SWIMMING 1 16.7 % Total 6 100.0 %
Page 73

Channahon Park District Community Survey Results
ETC Institute (2019) Page 29
Q11. Which FOUR of the programs from the list in Question 10 are MOST IMPORTANT to your household? Q11. Top choice Number Percent Adult art, dance, performing arts 10 2.5 % Adult fitness & wellness programs 86 21.5 % Adult sports programs 1 0.3 % Adult trips 12 3.0 % Before & after school programs 10 2.5 % eSports/virtual gaming 2 0.5 % Nature programs 20 5.0 % Opportunities for individuals with disabilities 8 2.0 % Outdoor adventure programs 2 0.5 % Pickleball 5 1.3 % Pre-school programs 13 3.3 % Senior fitness, wellness & recreation programs (age 55+) 36 9.0 % Senior sports programs (age 55+) 2 0.5 % Senior trips (age 55+) 16 4.0 % Special events 9 2.3 % Swim lessons 6 1.5 % Water fitness programs 6 1.5 % Youth art, dance, performing arts 4 1.0 % Youth development programs 3 0.8 % Youth fitness & wellness programs 4 1.0 % Youth sports programs 24 6.0 % Youth summer camp programs 8 2.0 % Other 6 1.5 % None chosen 107 26.8 % Total 400 100.0 %
Page 74

Channahon Park District Community Survey Results
ETC Institute (2019) Page 30
Q11. Which FOUR of the programs from the list in Question 10 are MOST IMPORTANT to your household? Q11. 2nd choice Number Percent Adult art, dance, performing arts 6 1.5 % Adult fitness & wellness programs 37 9.3 % Adult sports programs 6 1.5 % Adult trips 20 5.0 % Before & after school programs 3 0.8 % eSports/virtual gaming 5 1.3 % Nature programs 18 4.5 % Opportunities for individuals with disabilities 3 0.8 % Outdoor adventure programs 16 4.0 % Pickleball 4 1.0 % Senior fitness, wellness & recreation programs (age 55+) 32 8.0 % Senior sports programs (age 55+) 9 2.3 % Senior trips (age 55+) 19 4.8 % Special events 10 2.5 % Swim lessons 11 2.8 % Teen programs/trips 2 0.5 % Water fitness programs 10 2.5 % Youth art, dance, performing arts 7 1.8 % Youth development programs 6 1.5 % Youth fitness & wellness programs 10 2.5 % Youth sports programs 15 3.8 % Youth summer camp programs 9 2.3 % Other 1 0.3 % None chosen 141 35.3 % Total 400 100.0 %
Page 75
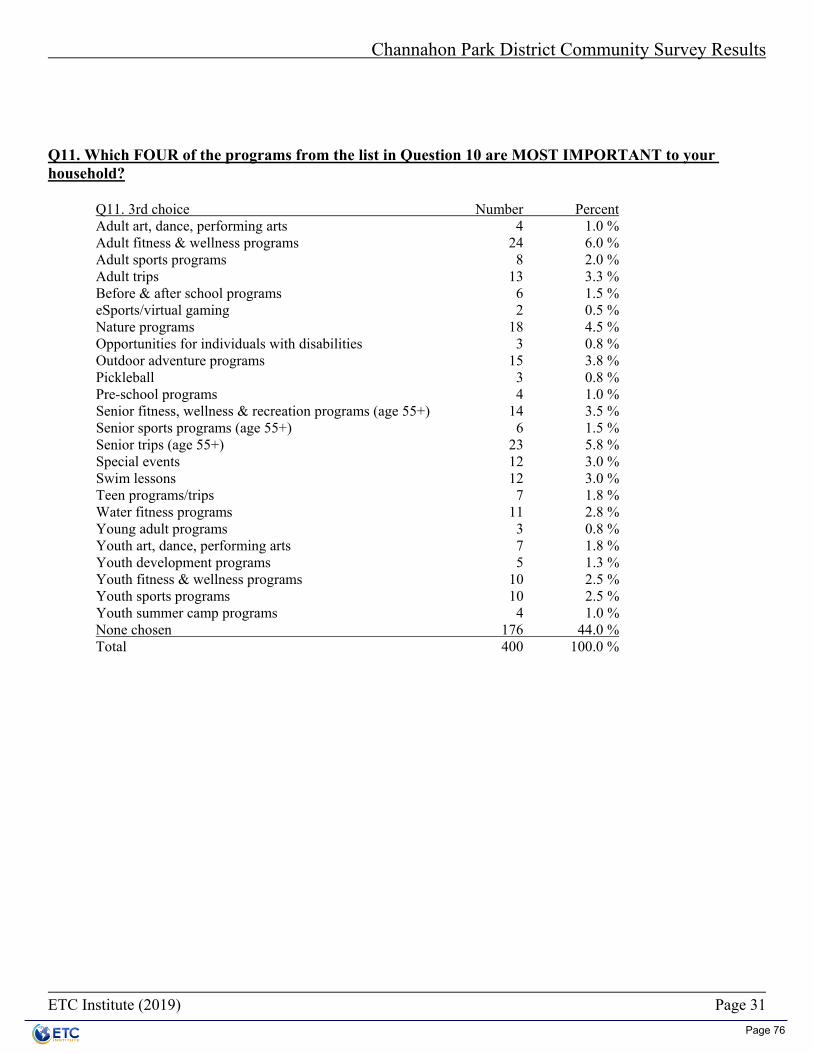
Channahon Park District Community Survey Results
ETC Institute (2019) Page 31
Q11. Which FOUR of the programs from the list in Question 10 are MOST IMPORTANT to your household? Q11. 3rd choice Number Percent Adult art, dance, performing arts 4 1.0 % Adult fitness & wellness programs 24 6.0 % Adult sports programs 8 2.0 % Adult trips 13 3.3 % Before & after school programs 6 1.5 % eSports/virtual gaming 2 0.5 % Nature programs 18 4.5 % Opportunities for individuals with disabilities 3 0.8 % Outdoor adventure programs 15 3.8 % Pickleball 3 0.8 % Pre-school programs 4 1.0 % Senior fitness, wellness & recreation programs (age 55+) 14 3.5 % Senior sports programs (age 55+) 6 1.5 % Senior trips (age 55+) 23 5.8 % Special events 12 3.0 % Swim lessons 12 3.0 % Teen programs/trips 7 1.8 % Water fitness programs 11 2.8 % Young adult programs 3 0.8 % Youth art, dance, performing arts 7 1.8 % Youth development programs 5 1.3 % Youth fitness & wellness programs 10 2.5 % Youth sports programs 10 2.5 % Youth summer camp programs 4 1.0 % None chosen 176 44.0 % Total 400 100.0 %
Page 76

Channahon Park District Community Survey Results
ETC Institute (2019) Page 32
Q11. Which FOUR of the programs from the list in Question 10 are MOST IMPORTANT to your household? Q11. 4th choice Number Percent Adult art, dance, performing arts 6 1.5 % Adult fitness & wellness programs 17 4.3 % Adult sports programs 10 2.5 % Adult trips 10 2.5 % Before & after school programs 4 1.0 % eSports/virtual gaming 1 0.3 % Nature programs 16 4.0 % Opportunities for individuals with disabilities 4 1.0 % Outdoor adventure programs 8 2.0 % Pickleball 3 0.8 % Pre-school programs 1 0.3 % Senior fitness, wellness & recreation programs (age 55+) 10 2.5 % Senior sports programs (age 55+) 5 1.3 % Senior trips (age 55+) 8 2.0 % Special events 19 4.8 % Swim lessons 7 1.8 % Teen programs/trips 5 1.3 % Water fitness programs 13 3.3 % Young adult programs 5 1.3 % Youth art, dance, performing arts 3 0.8 % Youth development programs 5 1.3 % Youth fitness & wellness programs 5 1.3 % Youth sports programs 8 2.0 % Youth summer camp programs 9 2.3 % None chosen 218 54.5 % Total 400 100.0 %
Page 77

Channahon Park District Community Survey Results
ETC Institute (2019) Page 33
SUM OF TOP 4 CHOICES Q11. Which FOUR of the programs from the list in Question 10 are MOST IMPORTANT to your household? (top 4) Q11. Sum of Top 4 Choices Number Percent Adult art, dance, performing arts 26 6.5 % Adult fitness & wellness programs 164 41.0 % Adult sports programs 25 6.3 % Adult trips 55 13.8 % Before & after school programs 23 5.8 % eSports/virtual gaming 10 2.5 % Nature programs 72 18.0 % Opportunities for individuals with disabilities 18 4.5 % Outdoor adventure programs 41 10.3 % Pickleball 15 3.8 % Pre-school programs 18 4.5 % Senior fitness, wellness & recreation programs (age 55+) 92 23.0 % Senior sports programs (age 55+) 22 5.5 % Senior trips (age 55+) 66 16.5 % Special events 50 12.5 % Swim lessons 36 9.0 % Teen programs/trips 14 3.5 % Water fitness programs 40 10.0 % Young adult programs 8 2.0 % Youth art, dance, performing arts 21 5.3 % Youth development programs 19 4.8 % Youth fitness & wellness programs 29 7.3 % Youth sports programs 57 14.3 % Youth summer camp programs 30 7.5 % Other 7 1.8 % None chosen 107 26.8 % Total 1065
Page 78

Channahon Park District Community Survey Results
ETC Institute (2019) Page 34
Q12. Please indicate how supportive you would be of each of the following major actions that the Channahon Park District could take to improve the parks and recreation system. (N=400) Very Somewhat Not supportive supportive Not sure supportive Q12-1. Repair & improve infrastructure & security 42.5% 18.8% 34.8% 4.0% Q12-2. Repurpose Skateland Recreation Center 24.5% 16.8% 43.8% 15.0% Q12-3. Upgrade existing pool 32.5% 21.0% 37.3% 9.3% Q12-4. Upgrade existing neighborhood & community parks 32.0% 23.8% 33.8% 10.5% Q12-5. Upgrade existing playgrounds 25.5% 26.3% 36.8% 11.5% Q12-6. Upgrade existing youth/adult athletic fields 21.3% 24.0% 41.8% 13.0% Q12-7. Improved ADA accessibility at current facilities 24.0% 22.5% 42.5% 11.0% Q12-8. Develop new & connect existing trail system 44.3% 20.5% 27.8% 7.5% Q12-9. Develop additional indoor recreation space (gyms & indoor programming spaces) 31.5% 24.3% 36.3% 8.0% Q12-10. Acquire open space for active activities (e.g. developing soccer, baseball, & softball fields) 18.3% 18.0% 50.3% 13.5% Q12-11. Develop an outdoor amphitheater 26.8% 19.5% 37.3% 16.5% Q12-12. Develop a large sports complex 21.3% 16.8% 41.0% 21.0% Q12-13. Additional access to restrooms at parks 35.3% 25.8% 32.5% 6.5% Q12-14. Acquire open space for passive activities (e.g. trails, picnicking) 26.8% 25.5% 36.0% 11.8% Q12-15. Other 94.3% 0.0% 0.0% 5.7%
Page 79

Channahon Park District Community Survey Results
ETC Institute (2019) Page 35
Q12-15. Other Q12-15. Other Number Percent ADD AN INDODOR POOL FOR WATER EXERCISE 1 2.9 % AN INDOOR ICE RINK 1 2.9 % AN INDOOR POOL WOULD BE WONDERFUL 1 2.9 % Adding park to Ravine Woods Neighborhood 1 2.9 % BATHROOM AT PLAYGROUND AREAS 1 2.9 % BMX track, mountain bike trails 1 2.9 % BOAT LAUNCH 1 2.9 % COMMUNITY GARDEN PLOTS 1 2.9 % Climbing wall 1 2.9 % Develop river property for fishing, senior access 1 2.9 % Dog Park in Grundy County part of Channahon 1 2.9 % GRASS ROOTS FESTIVAL REC 1 2.9 % ICE SKATING RINK 1 2.9 % INDOOR GOLF RANGE 1 2.9 % INDOOR ICE RINK 1 2.9 % INDOOR POOL 9 25.7 % Increase size and amount of equipment, dimensions fitness center 1 2.9 % Indoor and outdoor volleyball areas 1 2.9 % MAKE FITNESS CENTER BIGGER 1 2.9 % MORE TEEN PROGRAMS 1 2.9 % More biking trails 1 2.9 % OUTDOOR ALL WEATHER TRACK 1 2.9 % OUTDOOR TRACK AT COMMUNITY PARK ON MCCLINTOCK RD 1 2.9 % Outdoor hockey rink 1 2.9 % REPAIR AND IMPROVE SKATELAND 1 2.9 % RESTROOM NOT OPEN WHEN NEEDED AT EVENTS 1 2.9 % SLEDDING HILL 1 2.9 % Total 35 100.0 %
Page 80

Channahon Park District Community Survey Results
ETC Institute (2019) Page 36
Q13. Which FOUR of the items listed in Question 12 would you be MOST WILLING to fund with your tax dollars? Q13. Top choice Number Percent Repair & improve infrastructure & security 52 13.0 % Repurpose Skateland Recreation Center 8 2.0 % Upgrade existing pool 27 6.8 % Upgrade existing neighborhood & community parks 32 8.0 % Upgrade existing playgrounds 6 1.5 % Upgrade existing youth/adult athletic fields 4 1.0 % Improved ADA accessibility at current facilities 6 1.5 % Develop new & connect existing trail system 48 12.0 % Develop additional indoor recreation space (gyms & indoor programming spaces) 16 4.0 % Acquire open space for active activities (e.g. developing soccer, baseball, & softball fields) 3 0.8 % Develop an outdoor amphitheater 26 6.5 % Develop a large sports complex 16 4.0 % Additional access to restrooms at parks 18 4.5 % Acquire open space for passive activities (e.g. trails, picnicking) 16 4.0 % Other 23 5.8 % None chosen 99 24.8 % Total 400 100.0 % Q13. Which FOUR of the items listed in Question 12 would you be MOST WILLING to fund with your tax dollars? Q13. 2nd choice Number Percent Repair & improve infrastructure & security 25 6.3 % Repurpose Skateland Recreation Center 26 6.5 % Upgrade existing pool 25 6.3 % Upgrade existing neighborhood & community parks 17 4.3 % Upgrade existing playgrounds 16 4.0 % Upgrade existing youth/adult athletic fields 3 0.8 % Improved ADA accessibility at current facilities 8 2.0 % Develop new & connect existing trail system 34 8.5 % Develop additional indoor recreation space (gyms & indoor programming spaces) 26 6.5 % Acquire open space for active activities (e.g. developing soccer, baseball, & softball fields) 4 1.0 % Develop an outdoor amphitheater 27 6.8 % Develop a large sports complex 17 4.3 % Additional access to restrooms at parks 16 4.0 % Acquire open space for passive activities (e.g. trails, picnicking) 17 4.3 % Other 2 0.5 % None chosen 137 34.3 % Total 400 100.0 %
Page 81

Channahon Park District Community Survey Results
ETC Institute (2019) Page 37
Q13. Which FOUR of the items listed in Question 12 would you be MOST WILLING to fund with your tax dollars? Q13. 3rd choice Number Percent Repair & improve infrastructure & security 20 5.0 % Repurpose Skateland Recreation Center 14 3.5 % Upgrade existing pool 20 5.0 % Upgrade existing neighborhood & community parks 21 5.3 % Upgrade existing playgrounds 17 4.3 % Upgrade existing youth/adult athletic fields 5 1.3 % Improved ADA accessibility at current facilities 13 3.3 % Develop new & connect existing trail system 29 7.3 % Develop additional indoor recreation space (gyms & indoor programming spaces) 16 4.0 % Acquire open space for active activities (e.g. developing soccer, baseball, & softball fields) 5 1.3 % Develop an outdoor amphitheater 18 4.5 % Develop a large sports complex 15 3.8 % Additional access to restrooms at parks 18 4.5 % Acquire open space for passive activities (e.g. trails, picnicking) 18 4.5 % None chosen 171 42.8 % Total 400 100.0 % Q13. Which FOUR of the items listed in Question 12 would you be MOST WILLING to fund with your tax dollars? Q13. 4th choice Number Percent Repair & improve infrastructure & security 15 3.8 % Repurpose Skateland Recreation Center 13 3.3 % Upgrade existing pool 13 3.3 % Upgrade existing neighborhood & community parks 21 5.3 % Upgrade existing playgrounds 14 3.5 % Upgrade existing youth/adult athletic fields 6 1.5 % Improved ADA accessibility at current facilities 7 1.8 % Develop new & connect existing trail system 15 3.8 % Develop additional indoor recreation space (gyms & indoor programming spaces) 9 2.3 % Acquire open space for active activities (e.g. developing soccer, baseball, & softball fields) 9 2.3 % Develop an outdoor amphitheater 12 3.0 % Develop a large sports complex 9 2.3 % Additional access to restrooms at parks 33 8.3 % Acquire open space for passive activities (e.g. trails, picnicking) 18 4.5 % Other 1 0.3 % None chosen 205 51.3 % Total 400 100.0 %
Page 82

Channahon Park District Community Survey Results
ETC Institute (2019) Page 38
SUM OF TOP 4 CHOICES Q13. Which FOUR of the items listed in Question 12 would you be MOST WILLING to fund with your tax dollars? (top 4) Q13. Sum of Top 4 Choices Number Percent Repair & improve infrastructure & security 112 28.0 % Repurpose Skateland Recreation Center 61 15.3 % Upgrade existing pool 85 21.3 % Upgrade existing neighborhood & community parks 91 22.8 % Upgrade existing playgrounds 53 13.3 % Upgrade existing youth/adult athletic fields 18 4.5 % Improved ADA accessibility at current facilities 34 8.5 % Develop new & connect existing trail system 126 31.5 % Develop additional indoor recreation space (gyms & indoor programming spaces) 67 16.8 % Acquire open space for active activities (e.g. developing soccer, baseball, & softball fields) 21 5.3 % Develop an outdoor amphitheater 83 20.8 % Develop a large sports complex 57 14.3 % Additional access to restrooms at parks 85 21.3 % Acquire open space for passive activities (e.g. trails, picnicking) 69 17.3 % Other 26 6.5 % None chosen 99 24.8 % Total 1087
Page 83

Channahon Park District Community Survey Results
ETC Institute (2019) Page 39
Q14. Counting yourself, how many people in your household are... Mean Sum number 3.22 1262 Under 5 years 0.18 70 5-9 years 0.23 90 10-14 years 0.28 110 15-19 years 0.28 110 20-24 years 0.20 77 25-34 years 0.24 95 35-44 years 0.37 145 45-54 years 0.46 181 55-59 years 0.26 103 60-64 years 0.26 103 65-74 years 0.33 128 75+ years 0.13 50
Q15. What is your age? Q15. Your age Number Percent 18-34 62 15.5 % 35-44 77 19.3 % 45-54 88 22.0 % 55-64 86 21.5 % 65+ 79 19.8 % Not provided 8 2.0 % Total 400 100.0 % WITHOUT NOT PROVIDED Q15. What is your age? (without "not provided") Q15. Your age Number Percent 18-34 62 15.8 % 35-44 77 19.6 % 45-54 88 22.4 % 55-64 86 21.9 % 65+ 79 20.2 % Total 392 100.0 %
Page 84
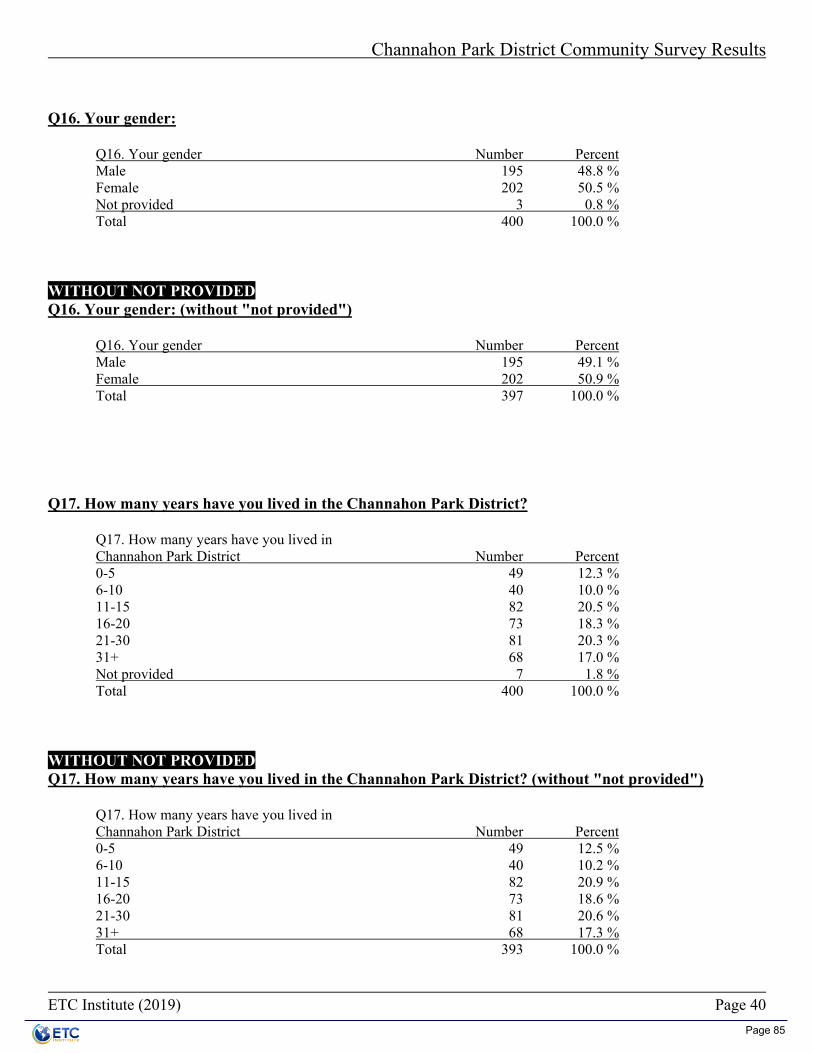
Channahon Park District Community Survey Results
ETC Institute (2019) Page 40
Q16. Your gender: Q16. Your gender Number Percent Male 195 48.8 % Female 202 50.5 % Not provided 3 0.8 % Total 400 100.0 % WITHOUT NOT PROVIDED Q16. Your gender: (without "not provided") Q16. Your gender Number Percent Male 195 49.1 % Female 202 50.9 % Total 397 100.0 %
Q17. How many years have you lived in the Channahon Park District? Q17. How many years have you lived in Channahon Park District Number Percent 0-5 49 12.3 % 6-10 40 10.0 % 11-15 82 20.5 % 16-20 73 18.3 % 21-30 81 20.3 % 31+ 68 17.0 % Not provided 7 1.8 % Total 400 100.0 % WITHOUT NOT PROVIDED Q17. How many years have you lived in the Channahon Park District? (without "not provided") Q17. How many years have you lived in Channahon Park District Number Percent 0-5 49 12.5 % 6-10 40 10.2 % 11-15 82 20.9 % 16-20 73 18.6 % 21-30 81 20.6 % 31+ 68 17.3 % Total 393 100.0 %
Page 85

Channahon Park District Community Survey Results
ETC Institute (2019) Page 41
Q18. Which of the following best describes your race? Q18. Your race Number Percent White/Caucasian 375 93.8 % African American/Black 5 1.3 % Hispanic/Latino 39 9.8 % Asian 1 0.3 % Other 2 0.5 % Total 422
Q18-5. Other Q18-5. Other Number Percent MIXED 2 100.0 % Total 2 100.0 %
Page 86

Section 5 Survey Instrument
Page 87

October 2019
Our mission is to serve by creating diverse
opportunities and experiences that enhance quali(v of life.
"A Few Minutes of Your Time Will Help Make the Channahon Park District a Better Place to Live,Work and Play"
Dear Channahon Park District Resident,
Your feedback is extremely important! The Channahon Park District is conducting a Community Needs Assessment survey to better understand our residents' priorities for the District. This survey is a significant component to our Strategic Master Plan. Our goal is to establish priorities for the future improvement of parks and recreation facilities, programs and services within the community. Your household was one of a limited number selected at random to receive this survey; therefore it is very important that you participate.
We appreciate your time ... We realize that this survey will take approximately 10-15 minutes to complete, but each question is important. The time you invest in completing this survey will aid the Channahon Park District in taking a resident-driven approach to making decisions that will enrich the future of our community and positively affect the lives of its residents.
Please complete and return your survey within the next two weeks ... We have selected ETC Institute, an independent consulting company, as our partner to administer this survey. They will compile the data received and present the results to the Channahon Park District. Your individual responses will remain confidential. The survey results will be made available on the Park District website. Please return your completed survey in the enclosed postagepaid envelope addressed to ETC Institute, 725 W. Fronteir Circle, Olathe, Kansas 66061.
If you have any questions, please feel free to contact the Channahon Park District's Executive Director, Mike Leonard, at 815- 521-3119 or [email protected]. Thank you for taking this opportunity to let your voice be heard.
zzou , �WJ�
Christop�ldwell President of the Board of Commissioners
24856 West Eames Street " Channahon, Illinois 60410
Michael J. Leonard Executive Director
815-467-7275 " F: 815-467-5677 .. Vil\�w.channahonpark.org
Page 88

Channahon Park District Needs Assessment Survey The Channahon Park District would like your input to help determine recreation and parks priorities for our community. This survey will take 10-15 minutes to complete. When you are finished, please return your survey in the enclosed postage-paid, return-reply envelope. If you prefer, you can complete the survey online at www.channahonsurvey.org. We greatly appreciate your time!
1. Please indicate if you or any member of your household has used any of the following Channahon Park District parks/facilities during the past 12 months by circling either "Yes" or "No". If "Yes", please rate the condition of the site by circling the corresponding number to the right.
Name of Park/Facility
Do you use this park/facility?
If "Yes", please rate the condition of the park/facility Excellent Good Fair Poor
Parks 01. Al Wood Park Yes No 4 3 2 1 02. Amberleigh Park Yes No 4 3 2 1 03. Arroyo Trails Yes No 4 3 2 1 04. Bluff Park Yes No 4 3 2 1 05. Central Park Yes No 4 3 2 1 06. Community Park Yes No 4 3 2 1 07. Deer Path Park Yes No 4 3 2 1 08. Diamond Park Yes No 4 3 2 1 09. Dupage Park Yes No 4 3 2 1 10. Henneberry Park Yes No 4 3 2 1 11. Ridge Park Yes No 4 3 2 1 12. Swifton Park Yes No 4 3 2 1 13. Yellow Pine Park Yes No 4 3 2 1 14. Other: ___________________________ Yes No 4 3 2 1
Facilities 15. Arrowhead Community Center Yes No 4 3 2 1 16. Heritage Bluffs Golf Club Yes No 4 3 2 1 17. Heritage Crossing Field House Yes No 4 3 2 1 18. Picnic Pavilions Yes No 4 3 2 1 19. Skateland Recreation Center Yes No 4 3 2 1 20. Tomahawk Aquatic Center Yes No 4 3 2 1 21. Other: ___________________________ Yes No 4 3 2 1
2. Have you or other members of your household participated in any recreation programs offered by the Channahon Park District during the past 12 months? ____(1) Yes [Answer Q2a-c.] ____(2) No [Skip to Q3.]
2a. Approximately how many different recreation programs offered by the Channahon Park District have you or members of your household participated in over the past 12 months? ____(1) 1 program ____(2) 2 to 3 programs
____(3) 4 to 6 programs ____(4) 7 to 10 programs
____(5) 11 or more programs
2b. From the following list, please check the THREE primary reasons why your household has participated in Channahon Park District programs. ____(01) Quality of instructors ____(02) Location of the program facility ____(03) Quality of the program facility ____(04) Fees charged for the class ____(05) Quality of program content
____(06) Times the program is offered ____(07) Friends participate ____(08) Dates/days the program is offered ____(09) Other: _______________________________
Page 89
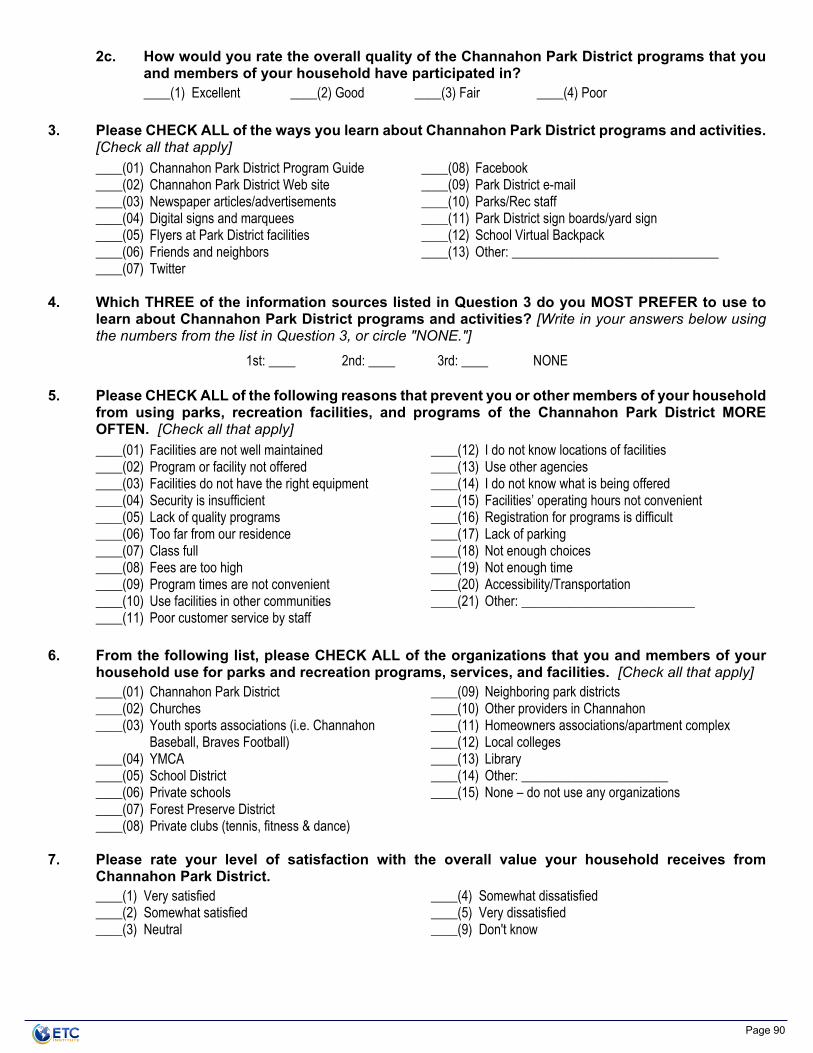
2c. How would you rate the overall quality of the Channahon Park District programs that you and members of your household have participated in? ____(1) Excellent ____(2) Good ____(3) Fair ____(4) Poor
3. Please CHECK ALL of the ways you learn about Channahon Park District programs and activities.
[Check all that apply] ____(01) Channahon Park District Program Guide ____(02) Channahon Park District Web site ____(03) Newspaper articles/advertisements ____(04) Digital signs and marquees ____(05) Flyers at Park District facilities ____(06) Friends and neighbors ____(07) Twitter
____(08) Facebook ____(09) Park District e-mail ____(10) Parks/Rec staff ____(11) Park District sign boards/yard sign ____(12) School Virtual Backpack ____(13) Other: _______________________________
4. Which THREE of the information sources listed in Question 3 do you MOST PREFER to use to
learn about Channahon Park District programs and activities? [Write in your answers below using the numbers from the list in Question 3, or circle "NONE."]
1st: ____ 2nd: ____ 3rd: ____ NONE 5. Please CHECK ALL of the following reasons that prevent you or other members of your household
from using parks, recreation facilities, and programs of the Channahon Park District MORE OFTEN. [Check all that apply]
____(01) Facilities are not well maintained ____(02) Program or facility not offered ____(03) Facilities do not have the right equipment ____(04) Security is insufficient ____(05) Lack of quality programs ____(06) Too far from our residence ____(07) Class full ____(08) Fees are too high ____(09) Program times are not convenient ____(10) Use facilities in other communities ____(11) Poor customer service by staff
____(12) I do not know locations of facilities ____(13) Use other agencies ____(14) I do not know what is being offered ____(15) Facilities’ operating hours not convenient ____(16) Registration for programs is difficult ____(17) Lack of parking ____(18) Not enough choices ____(19) Not enough time ____(20) Accessibility/Transportation ____(21) Other: __________________________
6. From the following list, please CHECK ALL of the organizations that you and members of your
household use for parks and recreation programs, services, and facilities. [Check all that apply]____(01) Channahon Park District ____(02) Churches ____(03) Youth sports associations (i.e. Channahon
Baseball, Braves Football) ____(04) YMCA ____(05) School District ____(06) Private schools ____(07) Forest Preserve District ____(08) Private clubs (tennis, fitness & dance)
____(09) Neighboring park districts ____(10) Other providers in Channahon ____(11) Homeowners associations/apartment complex ____(12) Local colleges ____(13) Library ____(14) Other: ______________________ ____(15) None – do not use any organizations
7. Please rate your level of satisfaction with the overall value your household receives from Channahon Park District. ____(1) Very satisfied ____(2) Somewhat satisfied ____(3) Neutral
____(4) Somewhat dissatisfied ____(5) Very dissatisfied ____(9) Don't know
Page 90

8. Please indicate if you or any member of your household has a need for each of the amenities/facilities listed below by circling either "Yes" or "No". Please don't limit your responses to what is currently provided by the Channahon Park District. If "Yes," please rate ALL of the amenities/facilities of this type in the Channahon Park District using a scale of 1 to 5, where 5 means the needs of your household are "100% Met" and 1 means "0% Met."
Type of Amenity/Facility
Do you have a need for this
amenity/facility?
If "Yes," how well are your needs being met?
100% Met 75% Met 50% Met 25% Met 0% Met 01. 18-hole golf course Yes No 5 4 3 2 1 02. Artificial turf fields Yes No 5 4 3 2 1 03. Baseball and softball fields Yes No 5 4 3 2 1 04. Before and after school center Yes No 5 4 3 2 1
05. Community Garden (i.e. garden plots for residents)
Yes No 5 4 3 2 1
06. Dog parks Yes No 5 4 3 2 1 07. Esports/VR gaming center Yes No 5 4 3 2 1 08. Indoor roller skating rink Yes No 5 4 3 2 1
09. Indoor gymnasium space (e.g. volleyball, basketball, pickleball)
Yes No 5 4 3 2 1
10. Indoor playground Yes No 5 4 3 2 1 11. Indoor walking and running tracks Yes No 5 4 3 2 1 12. Large community parks Yes No 5 4 3 2 1 13. Mountain bike and hiking trails (natural surface) Yes No 5 4 3 2 1 14. Natural areas/wildlife habitats Yes No 5 4 3 2 1
15. Outdoor adventure park (i.e. high ropes, challenge courses, ziplines, BMX pump track, etc.)
Yes No 5 4 3 2 1
16. Outdoor amphitheater Yes No 5 4 3 2 1 17. Outdoor basketball courts Yes No 5 4 3 2 1 18. Outdoor pool/lap lanes Yes No 5 4 3 2 1 19. Outdoor sand volleyball courts Yes No 5 4 3 2 1 20. Outdoor spray parks/splash pad Yes No 5 4 3 2 1 21. Outdoor tennis courts Yes No 5 4 3 2 1 22. Outdoor walking/running track Yes No 5 4 3 2 1 23. Paved trails Yes No 5 4 3 2 1 24. Pickleball courts Yes No 5 4 3 2 1 25. Playgrounds Yes No 5 4 3 2 1
26. Recreation centers (e.g. Arrowhead Recreation Center)
Yes No 5 4 3 2 1
27. Skate park Yes No 5 4 3 2 1 28. Small neighborhood parks (1-10 acres) Yes No 5 4 3 2 1 29. Soccer/Football/Lacrosse/Rugby fields Yes No 5 4 3 2 1 30. Other: ________________________________ Yes No 5 4 3 2 1
9. Which FOUR of the amenities/facilities from the list in Question 8 are MOST IMPORTANT to your household? [Write in your answers below using the numbers from the list in Question 8, or circle "NONE."]
1st: ____ 2nd: ____ 3rd: ____ 4th: ____ NONE
Page 91

10. Please indicate if you or any member of your household has a need for each of the recreation programs listed below by circling either "Yes" or "No". Please don't limit your responses to what is currently provided by the Channahon Park District.
If "Yes," please rate the recreation programs of this type in the Channahon Park District using a scale of 1 to 5, where 5 means the needs of your household are "100% Met" and 1 means "0% Met."
Type of Program
Do you have a need for this program?
If "Yes," how well are your needs being met? 100% Met 75% Met 50% Met 25% Met 0% Met
01. Adult art, dance, performing arts Yes No 5 4 3 2 1 02. Adult fitness and wellness programs Yes No 5 4 3 2 1 03. Adult sports programs Yes No 5 4 3 2 1 04. Adult trips Yes No 5 4 3 2 1 05. Before and after school programs Yes No 5 4 3 2 1 06. ESports/Virtual Gaming Yes No 5 4 3 2 1 07. Nature programs Yes No 5 4 3 2 1
08. Opportunities for individuals with disabilities
Yes No 5 4 3 2 1
09. Outdoor adventure programs Yes No 5 4 3 2 1 10. Pickleball Yes No 5 4 3 2 1 11. Pre-School programs Yes No 5 4 3 2 1
12. Senior fitness, wellness and recreation programs (age 55+)
Yes No 5 4 3 2 1
13. Senior sports programs (age 55+) Yes No 5 4 3 2 1 14. Senior trips (age 55+) Yes No 5 4 3 2 1 15. Special events Yes No 5 4 3 2 1 16. Swim lessons Yes No 5 4 3 2 1 17. Teen programs/trips Yes No 5 4 3 2 1 18. Water fitness programs Yes No 5 4 3 2 1 19. Young adult programs Yes No 5 4 3 2 1 20. Youth art, dance, performing arts Yes No 5 4 3 2 1 21. Youth development programs Yes No 5 4 3 2 1 22. Youth fitness and wellness programs Yes No 5 4 3 2 1 23. Youth sports programs Yes No 5 4 3 2 1 24. Youth summer camp programs Yes No 5 4 3 2 1 25. Other: ________________________ Yes No 5 4 3 2 1
11. Which FOUR of the programs from the list in Question 10 are MOST IMPORTANT to your household? [Write in your answers below using the numbers from the list in Question 10, or circle "NONE."]
1st: ____ 2nd: ____ 3rd: ____ 4th: ____ NONE
Page 92

12. Please indicate how supportive you would be of each of the following major actions that the Channahon Park District could take to improve the parks and recreation system.
How supportive are you of having the Channahon Park District... Very Supportive
Somewhat Supportive
Not Sure Not
Supportive
01. Repair and improve infrastructure and security 4 3 2 1 02. Repurpose Skateland Recreation Center 4 3 2 1 03. Upgrade existing pool 4 3 2 1 04. Upgrade existing neighborhood and community parks 4 3 2 1 05. Upgrade existing playgrounds 4 3 2 1 06. Upgrade existing youth/adult athletic fields 4 3 2 1 07. Improved ADA accessibility at current facilities 4 3 2 1 08. Develop new and connect the existing trail system 4 3 2 1 09. Develop additional indoor recreation space (gyms and indoor programming spaces) 4 3 2 1
10. Acquire open space for active activities (e.g. developing soccer, baseball, and softball fields)
4 3 2 1
11. Develop an outdoor amphitheater 4 3 2 1 12. Develop a large sports complex 4 3 2 1 13. Additional access to restrooms at parks 4 3 2 1 14. Acquire open space for passive activities (e.g. trails, picnicking) 4 3 2 1 15. Other: ____________________________________________________________ 4 3 2 1
13. Which FOUR of the items listed in Question 12 would you be MOST WILLING to fund with your tax dollars? [Write in your answers below using the numbers from the list in Question 12, or circle "NONE."]
1st: ____ 2nd: ____ 3rd: ____ 4th: ____ NONE
14. Counting yourself, how many people in your household are... Under 5 years: ____ 5 - 9 years: ____ 10 - 14 years: ____
15 - 19 years: ____ 20 - 24 years: ____ 25 - 34 years: ____
35 - 44 years: ____ 45 - 54 years: ____ 55 - 59 years: ____
60 - 64 years: ____ 65 - 74 years: ____ 75+ years: ____
15. What is your age? ______ years
16. Your gender: ____(1) Male ____(2) Female
17. How many years have you lived in the Channahon Park District? _____ years
18. Which of the following best describes your race? [Check all that apply.] ____(1) White/Caucasian ____(2) African American/Black ____(3) Hispanic/Latino
____(4) Asian ____(5) Other: _________________________
19. Do you have any other comments about the services provided or the job that the Channahon Park
District is doing?
Page 93

This concludes the survey – Thank you for your time! Please return your completed survey in the enclosed return-reply envelope addressed to:
ETC Institute, 725 W. Frontier Circle, Olathe, KS 66061
Your responses will remain completely confidential. The address information printed to the right will ONLY be used to help identify areas with specific needs. Thank you.
Page 94
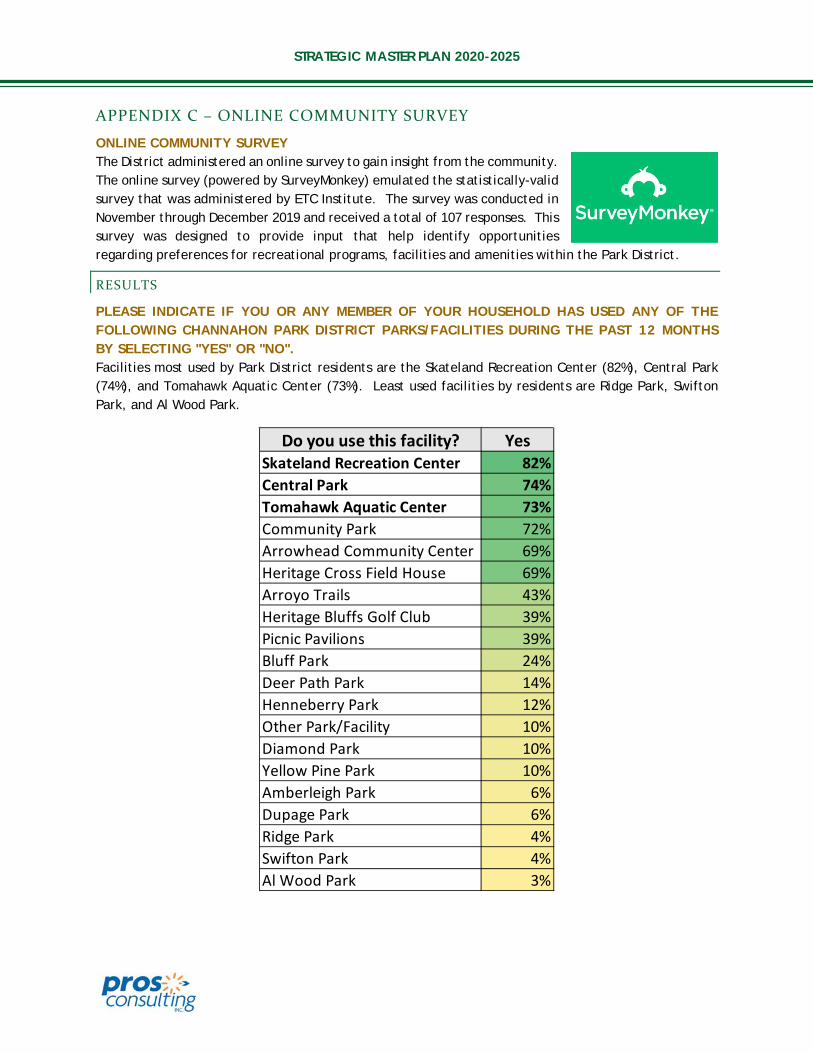
STRATEGIC MASTER PLAN 2020-2025
APPENDIX C – ONLINE COMMUNITY SURVEY
ONLINE COMMUNITY SURVEY The District administered an online survey to gain insight from the community. The online survey (powered by SurveyMonkey) emulated the statistically-valid survey that was administered by ETC Institute. The survey was conducted in November through December 2019 and received a total of 107 responses. This survey was designed to provide input that help identify opportunities regarding preferences for recreational programs, facilities and amenities within the Park District.
RESULTS
PLEASE INDICATE IF YOU OR ANY MEMBER OF YOUR HOUSEHOLD HAS USED ANY OF THE FOLLOWING CHANNAHON PARK DISTRICT PARKS/FACILITIES DURING THE PAST 12 MONTHS BY SELECTING "YES" OR "NO". Facilities most used by Park District residents are the Skateland Recreation Center (82%), Central Park (74%), and Tomahawk Aquatic Center (73%). Least used facilities by residents are Ridge Park, Swifton Park, and Al Wood Park.
Do you use this facility? YesSkateland Recreation Center 82%Central Park 74%Tomahawk Aquatic Center 73%Community Park 72%Arrowhead Community Center 69%Heritage Cross Field House 69%Arroyo Trails 43%Heritage Bluffs Golf Club 39%Picnic Pavilions 39%Bluff Park 24%Deer Path Park 14%Henneberry Park 12%Other Park/Facility 10%Diamond Park 10%Yellow Pine Park 10%Amberleigh Park 6%Dupage Park 6%Ridge Park 4%Swifton Park 4%Al Wood Park 3%
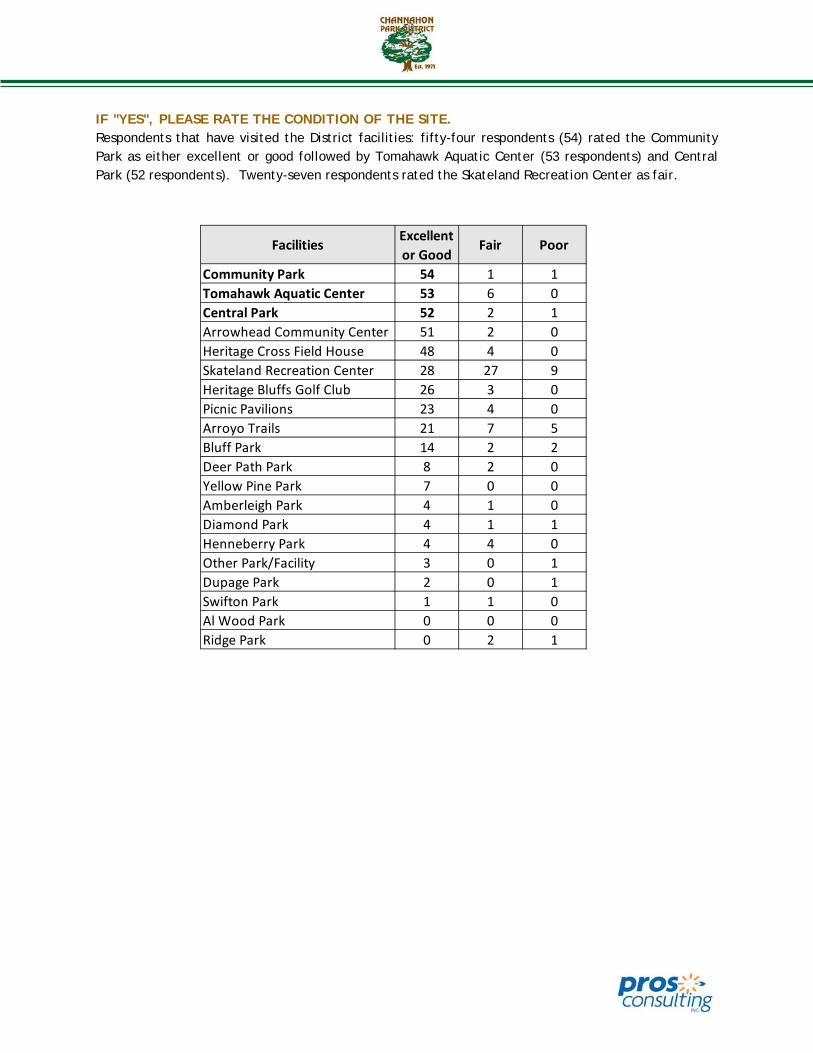
IF "YES", PLEASE RATE THE CONDITION OF THE SITE. Respondents that have visited the District facilities: fifty-four respondents (54) rated the Community Park as either excellent or good followed by Tomahawk Aquatic Center (53 respondents) and Central Park (52 respondents). Twenty-seven respondents rated the Skateland Recreation Center as fair.
FacilitiesExcellent or Good
Fair Poor
Community Park 54 1 1Tomahawk Aquatic Center 53 6 0Central Park 52 2 1Arrowhead Community Center 51 2 0Heritage Cross Field House 48 4 0Skateland Recreation Center 28 27 9Heritage Bluffs Golf Club 26 3 0Picnic Pavilions 23 4 0Arroyo Trails 21 7 5Bluff Park 14 2 2Deer Path Park 8 2 0Yellow Pine Park 7 0 0Amberleigh Park 4 1 0Diamond Park 4 1 1Henneberry Park 4 4 0Other Park/Facility 3 0 1Dupage Park 2 0 1Swifton Park 1 1 0Al Wood Park 0 0 0Ridge Park 0 2 1

STRATEGIC MASTER PLAN 2020-2025
HAVE YOU OR OTHER MEMBERS OF YOUR HOUSEHOLD PARTICIPATED IN ANY RECREATION PROGRAMS OFFERED BY THE CHANNAHON PARK DISTRICT DURING THE PAST 12 MONTHS? Sixty-nine percent (69%) of respondents have participated in recreation programs offered by the District.
APPROXIMATELY HOW MANY DIFFERENT RECREATION OR SPORTS PROGRAMS OFFERED BY THE CHANNAHON PARK DISTRICT HAVE YOU OR MEMBERS OF YOUR HOUSEHOLD PARTICIPATED IN OVER THE PAST 12 MONTHS? Eighty-eight percent (88%) of respondents that have participated in programs partake in 1-3 programs. Nine percent (9%) of respondents participated in 4 to 6 programs and 3% participated in 7 or more programs.
69%
31%
Participation in Recreation Programs
Yes
No
32%
56%
9%3%
0%
1 program 2 to 3 programs 4 to 6 programs 7 to 10 programs 11 or moreprograms
Number of Programs Participated In

PLEASE SELECT THREE PRIMARY REASONS WHY YOUR HOUSEHOLD HAS PARTICIPATED IN CHANNAHON PARK DISTRICT PROGRAMS. Majority of respondents (43 respondents) participated in programs due to the location of the program facility, followed by fees charged for the class and quality of program content.
HOW WOULD YOU RATE THE OVERALL QUALITY OF THE CHANNAHON PARK DISTRICT PROGRAMS THAT YOU AND MEMBERS OF YOUR HOUSEHOLD HAVE PARTICIPATED IN? Ninety-four percent (94%) of respondents that participate in programs rated the quality as excellent (37%) or good (57%). Four percent (4%) rated the quality as fair and 2% rated the quality of programs as poor.
0151617
212123
3043
Other
Quality of instructors
Times the program is offered
Quality of the program facility
Friends participate
Dates / days the program is offered
Quality of program content
Fees charged for the class
Location of the program facility
Reasons for Participating in Recreation ProgramsReason #1 Reason #2 Reason #3
37%
57%
4% 2%
Overall Quality of Recreation Programs
Excellent
Good
Fair
Poor

STRATEGIC MASTER PLAN 2020-2025
PLEASE CHECK ALL OF THE WAYS YOU LEARN ABOUT CHANNAHON PARK DISTRICT PROGRAMS AND ACTIVITIES. Top information sources for respondents to learn about the District’s programs activities are Park District program guide (78%), Park District Website (57%), and Facebook (55%).
WHICH THREE OF THE INFORMATION SOURCES LISTED IN QUESTION 6 DO YOU MOST PREFER TO USE TO LEARN ABOUT CHANNAHON PARK DISTRICT PROGRAMS AND ACTIVITIES? The most preferred information source by respondents are Park District program catalog/brochure (72 respondents), Facebook (49 respondents), and Park District Website (48 respondents).
Park District program guide 78%Park District Website 57%Facebook 55%Friends and neighbors 48%Digital Signs and marquees 34%Flyers at Park District facilities 16%Park District sign boards/yard signs 16%Park District e-mails 15%Newspaper articles/advertisements 13%Parks/Rec staff 8%Other 3%Twitter 0%School Virtual Backpack 0%
Information Sources
112234
913
1718
4849
72
School Virtual BackpackOther
TwitterParks/Rec staff
Park District sign boards/yard signsNewspaper articles/advertisements
Flyers at Park District facilitiesPark District e-mails
Digital Signs and marqueesFriends and neighbors
Park District WebsiteFacebook
Park District program catalog/brochure
Most Preferred Information SourcesChoice #1 Choice #2 Choice #3

PLEASE CHECK ALL OF THE FOLLOWING REASONS THAT PREVENT YOU OR OTHER MEMBERS OF YOUR HOUSEHOLD FROM USING PARKS, RECREATION FACILITIES, AND PROGRAMS OF THE CHANNAHON PARK DISTRICT MORE OFTEN. Thirty percent (30%) of respondents indicated not enough time as the top reason for not using parks, facilities, and programs followed by program times are not convenient (28%), and fees are too high (22%).
Not enough time 30%Program times are not convenient 28%Fees are too high 22%Program or facility not offered 20%Facilities are not well maintained 16%Use other agencies 15%Not enough choices 14%Facilities do not have the right equipment 10%Lack of quality programs 10%I do not know what is being offered 10%Too far from our residence 9%Poor customer service by staff 8%Facilities' operating hours not convenient 7%Other 7%Class full 6%Registration for programs is difficult 6%Security is insufficient 2%Use facilities in other communities 2%I do not know locations of facilities 2%Lack of parking at facilities/parks 0%Accessibility/Transportation 0%
Reasons for Not Using Parks, Facilities, and Programs

STRATEGIC MASTER PLAN 2020-2025
FROM THE FOLLOWING LIST, PLEASE CHECK ALL OF THE ORGANIZATIONS THAT YOU AND MEMBERS OF YOUR HOUSEHOLD USE FOR PARKS AND RECREATION PROGRAMS, SERVICES, AND FACILITIES. Organizations used the most for parks, recreation programs, services, and facilities are the Channahon Park District (85%), school district (43%). and the library (40%)
PLEASE RATE YOUR LEVEL OF SATISFACTION WITH THE OVERALL VALUE YOUR HOUSEHOLD RECEIVES FROM CHANNAHON PARK DISTRICT. Nearly half of survey respondents (48%) are very satisfied with their overall satisfaction level their household receives from the Park District. Twenty-seven percent (27%) of respondents are somewhat satisfied and 5% are somewhat or very dissatisfied.
Channahon Park District 85%School District 43%Library 40%Forest Preserve District 27%Churches 25%Youth sports associations (i.e. Channahon Baseball, Braves Football)
24%
Neighboring park districts 23%Private clubs (tennis, fitness & dance) 17%YMCA 9%Other providers in Channahon 8%None 5%Private Schools 4%Other 4%Homeowners association/apartment complex 3%
Organizations Used for Park and Recreation Experiences
48%
27%
20%
0% 3% 2%
Overall Satisfaction Level
Very satisfied
Somewhat satisfied
Neutral
Somewhat dissatisfied
Very dissatisfied
Don't know

PLEASE INDICATE IF YOU OR ANY MEMBER OF YOUR HOUSEHOLD HAS A NEED FOR EACH OF THE AMENITIES/FACILITIES LISTED BELOW BY SELECTING EITHER "YES" OR "NO". Top facilities/amenities respondents have a need for are:
• Biking and hiking trails (natural surface) – 45 respondents • Recreation centers (e.g. Arrowhead Recreation Center) – 41 respondents • Large community parks – 40 respondents • Paved trails – 38 respondents • Playgrounds – 37 respondents
Do You Have A Need for this Facility/Amenity YesBiking and hiking trails (natural surface) 45Recreation centers (e.g. Arrowhead Recreation Center)
41
Large community parks 40Paved trails 38Playgrounds 37Small neighborhood parks (1-10 acres) 37Outdoor spray parks/splash pad 34Natural areas/wildlife habitats 33Dog parks 30Outdoor adventure park (i.e. high ropes, challenge courses, ziplines, BMX pump tracks, etc.)
28
Outdoor pool/lap lanes 28Indoor gymnasium space (e.g. volleyball, basketball, pickleball)
26
Indoor walking running tracks 26Indoor playground 25Outdoor walking/running track 21Skate park 21Soccer/Football/Lacrosse/Rugby fields 19Outdoor amphitheater 18Community Garden (i.e. garden plots for residents) 17Outdoor tennis courts 16Outdoor basketball courts 1418-hole golf course 13Baseball and softball fields 12Other: 12Outdoor sand volleyball courts 11Before and after school center 9Artificial turf fields 6Pickleball Courts 6Esports/VR gaming center 4

STRATEGIC MASTER PLAN 2020-2025
WHICH FOUR OF THE AMENITIES/FACILITIES FROM THE LIST BELOW ARE MOST IMPORTANT TO YOUR HOUSEHOLD? By combining respondents top four choices; the most important amenities/facilities to respondents are:
• Bike and hiking trails (natural surface) – 20 respondents • Paved trails – 16 respondents • Dog parks – 16 respondents • Playground – 16 respondents • Small neighborhood parks (1-10 acres) – 14 respondents
011
2222
3444
666
77
899
101010
111212
141616
20
Outdoor basketball courtsBaseball and softball fields
Outdoor sand volleyball courtsArtificial turf fields
Esports/VR gaming centerOutdoor tennis courts
Pickleball CourtsOutdoor walking/running track
Community Garden (i.e. garden plots for residents)Indoor gymnasium space (e.g. volleyball, basketball, pickleball)
Soccer/Football/Lacrosse/Rugby fieldsBefore and after school center
Outdoor spray parks/splash padSkate park
18-hole golf courseIndoor playground
Outdoor amphitheaterOutdoor pool/lap lanes
Recreation centers (e.g. Arrowhead Recreation Center)Large community parks
Outdoor adventure park (i.e. high ropes, challenge course,…Other
Natural areas/wildlife habitatsIndoor walking running tracks
Small neighborhood parks (1-10 acres)Playgrounds
Dog parksPaved trails
Bike and hiking trails (natural surface)
Most Important Amenities/Facilities1st Choice 2nd Choice 3rd Choice 4th Choice
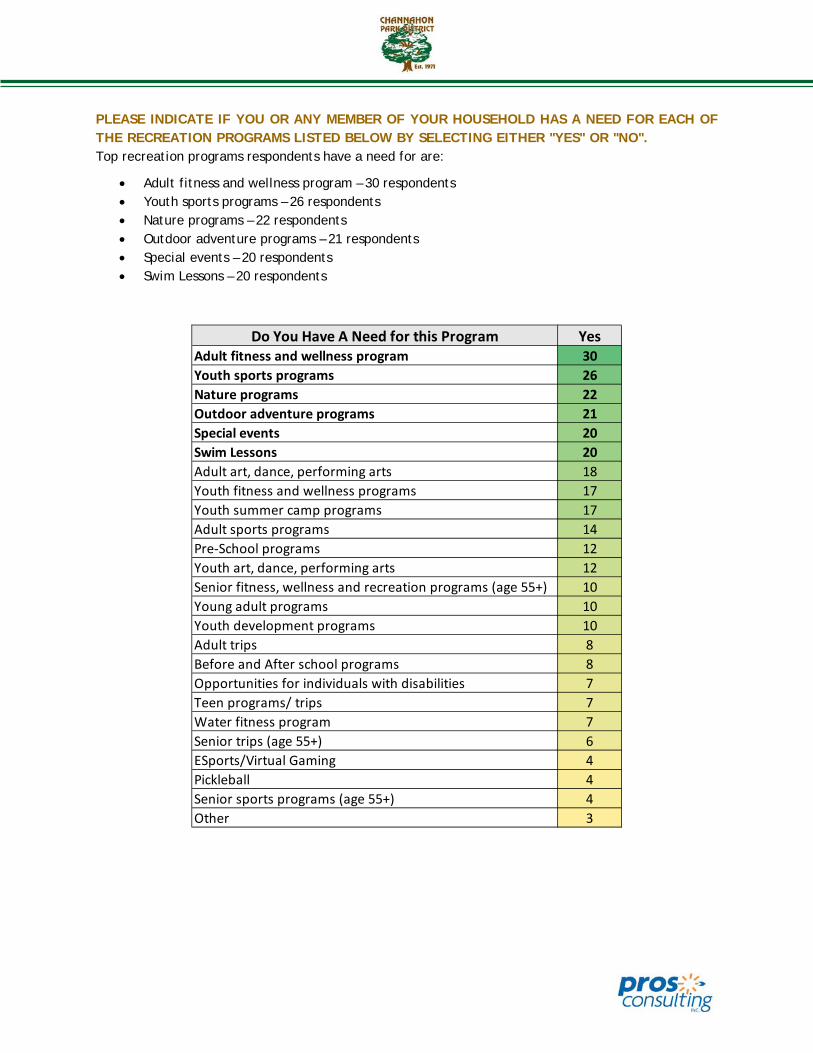
PLEASE INDICATE IF YOU OR ANY MEMBER OF YOUR HOUSEHOLD HAS A NEED FOR EACH OF THE RECREATION PROGRAMS LISTED BELOW BY SELECTING EITHER "YES" OR "NO". Top recreation programs respondents have a need for are:
• Adult fitness and wellness program – 30 respondents • Youth sports programs – 26 respondents • Nature programs – 22 respondents • Outdoor adventure programs – 21 respondents • Special events – 20 respondents • Swim Lessons – 20 respondents
Do You Have A Need for this Program YesAdult fitness and wellness program 30Youth sports programs 26Nature programs 22Outdoor adventure programs 21Special events 20Swim Lessons 20Adult art, dance, performing arts 18Youth fitness and wellness programs 17Youth summer camp programs 17Adult sports programs 14Pre-School programs 12Youth art, dance, performing arts 12Senior fitness, wellness and recreation programs (age 55+) 10Young adult programs 10Youth development programs 10Adult trips 8Before and After school programs 8Opportunities for individuals with disabilities 7Teen programs/ trips 7Water fitness program 7Senior trips (age 55+) 6ESports/Virtual Gaming 4Pickleball 4Senior sports programs (age 55+) 4Other 3

STRATEGIC MASTER PLAN 2020-2025
WHICH FOUR OF THE PROGRAMS ARE MOST IMPORTANT TO YOUR HOUSEHOLD? By combining respondents top four choices; the most important recreation programs to respondents are:
• Youth sports programs – 21 respondents • Adult fitness and wellness programs – 19 respondents • Nature programs – 18 respondents • Youth fitness and wellness programs – 17 respondents • Youth summer camp programs – 14 respondents • Outdoor adventure programs – 14 respondents
0122333
55555666788
111414
171819
21
OtherSenior sports programs (age 55+)
PickleballSenior trips (age 55+)
Adult tripsESports/Virtual Gaming
Teen programs/ tripsAdult art, dance, performing arts
Before and After school programsOpportunities for individuals with disabilities
Water fitness programYoung adult programsAdult sports programs
Pre-School programsSenior fitness, wellness and recreation programs…
Youth development programsSpecial events
Youth art, dance, performing artsSwim Lessons
Outdoor adventure programsYouth summer camp programs
Youth fitness and wellness programsNature programs
Adult fitness and wellness programYouth sports programs
Most Important Recreation Programs1st Choice 2nd Choice 3rd Choice 4th Choice

PLEASE INDICATE HOW SUPPORTIVE YOU WOULD BE OF EACH OF THE FOLLOWING MAJOR ACTIONS THAT THE CHANNAHON PARK DISTRICT COULD TAKE TO IMPROVE THE PARKS AND RECREATION SYSTEM. Major actions that respondents are very supportive for are develop new and connect the existing trail system, additional access to restrooms at parks, and repair and improve infrastructure and security.
Supportive of Major Actions Very Supportive
Somewhat Supportive
Not Sure Not Supportive
Develop new and connect the existing trail system
35 11 7 3
Additional access to restrooms at parks 32 17 3 2Repair and Improve infrastructure and security
30 18 8 1
Improve ADA accessibility at current facilities
27 18 10 1
Upgrade existing pool 26 13 15 4Upgrade existing playgrounds 22 20 12 2Re-purpose Skateland Recreation Center 20 6 5 28Upgrade existing neighborhood and community parks
20 22 10 3
Develop additional indoor recreation space (gyms and indoor programming spaces)
20 20 11 4
Develop an outdoor amphitheater 17 13 16 9acquire open space for passive activities (e.g. trails, picnicking)
17 22 9 7
Develop a large sports complex 12 15 17 11Upgrade existing youth/adult athletic fields
9 23 17 7
Acquire open spaces for active activities (e.g. developing soccer, baseball, and softball fields)
9 19 20 7
Other 6 0 7 1

STRATEGIC MASTER PLAN 2020-2025
WHICH FOUR POTENTIAL ACTIONS FROM THE LIST BELOW WOULD YOUR HOUSEHOLD BE MOST WILLING TO FUND WITH TAX DOLLARS? By combining respondents top three choices; the most important major actions respondents would be most willing to fund with tax dollars are:
• Develop new and connect existing trail system – 24 respondents • Upgrade existing pool – 18 respondents • Improve ADA accessibility at current facilities – 14 respondents • Repair and improve infrastructure and security – 14 respondents
23
56778
111213131414
1824
Acquire open space for passive activities (e.g. trails,…
Upgrade existing youth/adult athletic fields
Other:
Acquire open space for passive activities (e.g. trails,…
Develop additional indoor recreation space (gyms and…
Develop a large sports complex
Additional access to restrooms at parks
Upgrade existing neighborhood and community parks
Re-purpose Skateland Recreation Center
Upgrade existing playgrounds
Develop an outdoor amphitheater
Repair and Improve infrastructure and security
Improve ADA accessibility at current facilities
Upgrade existing pool
Develop new and connect the existing trail system
Most Important Major Action1st Choice 2nd Choice 3rd Choice
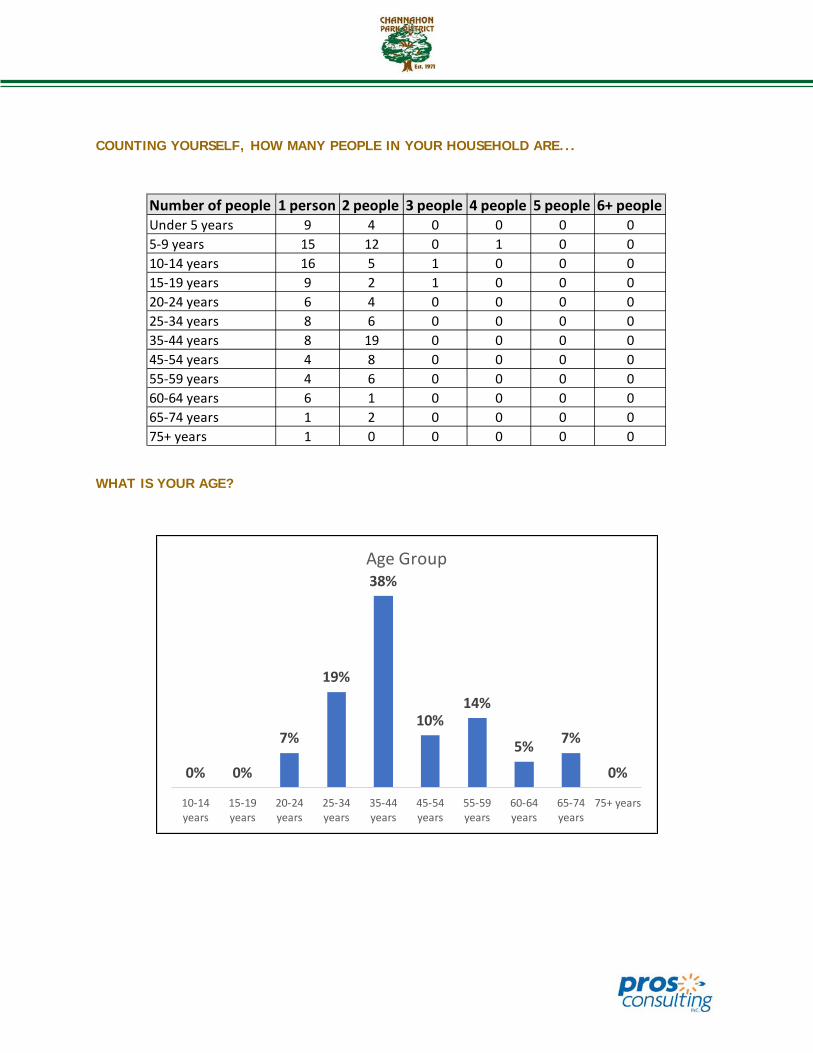
COUNTING YOURSELF, HOW MANY PEOPLE IN YOUR HOUSEHOLD ARE...
WHAT IS YOUR AGE?
Number of people 1 person 2 people 3 people 4 people 5 people 6+ peopleUnder 5 years 9 4 0 0 0 05-9 years 15 12 0 1 0 010-14 years 16 5 1 0 0 015-19 years 9 2 1 0 0 020-24 years 6 4 0 0 0 025-34 years 8 6 0 0 0 035-44 years 8 19 0 0 0 045-54 years 4 8 0 0 0 055-59 years 4 6 0 0 0 060-64 years 6 1 0 0 0 065-74 years 1 2 0 0 0 075+ years 1 0 0 0 0 0
0% 0%
7%
19%
38%
10%14%
5% 7%
0%
10-14years
15-19years
20-24years
25-34years
35-44years
45-54years
55-59years
60-64years
65-74years
75+ years
Age Group

STRATEGIC MASTER PLAN 2020-2025
YOUR GENDER:
HOW MANY YEARS HAVE YOU LIVED IN THE CHANNAHON PARK DISTRICT?
12%
88%
Gender
Male
Female
5%
25%
18%
11% 11%
21%
7%
2% 2%
Less than1 year
1-5 years 6-10years
11-15years
16-20years
21-30years
31-40years
41-50years
50+ years
Years Lived In Channahon Park District

WHICH OF THE FOLLOWING BEST DESCRIBES YOUR RACE?
95%
0% 0% 2% 3%
White/Caucasian AfricanAmerican/Black
Hispanic/Latino Asian Other
Race

STRATEGIC MASTER PLAN 2020-2025
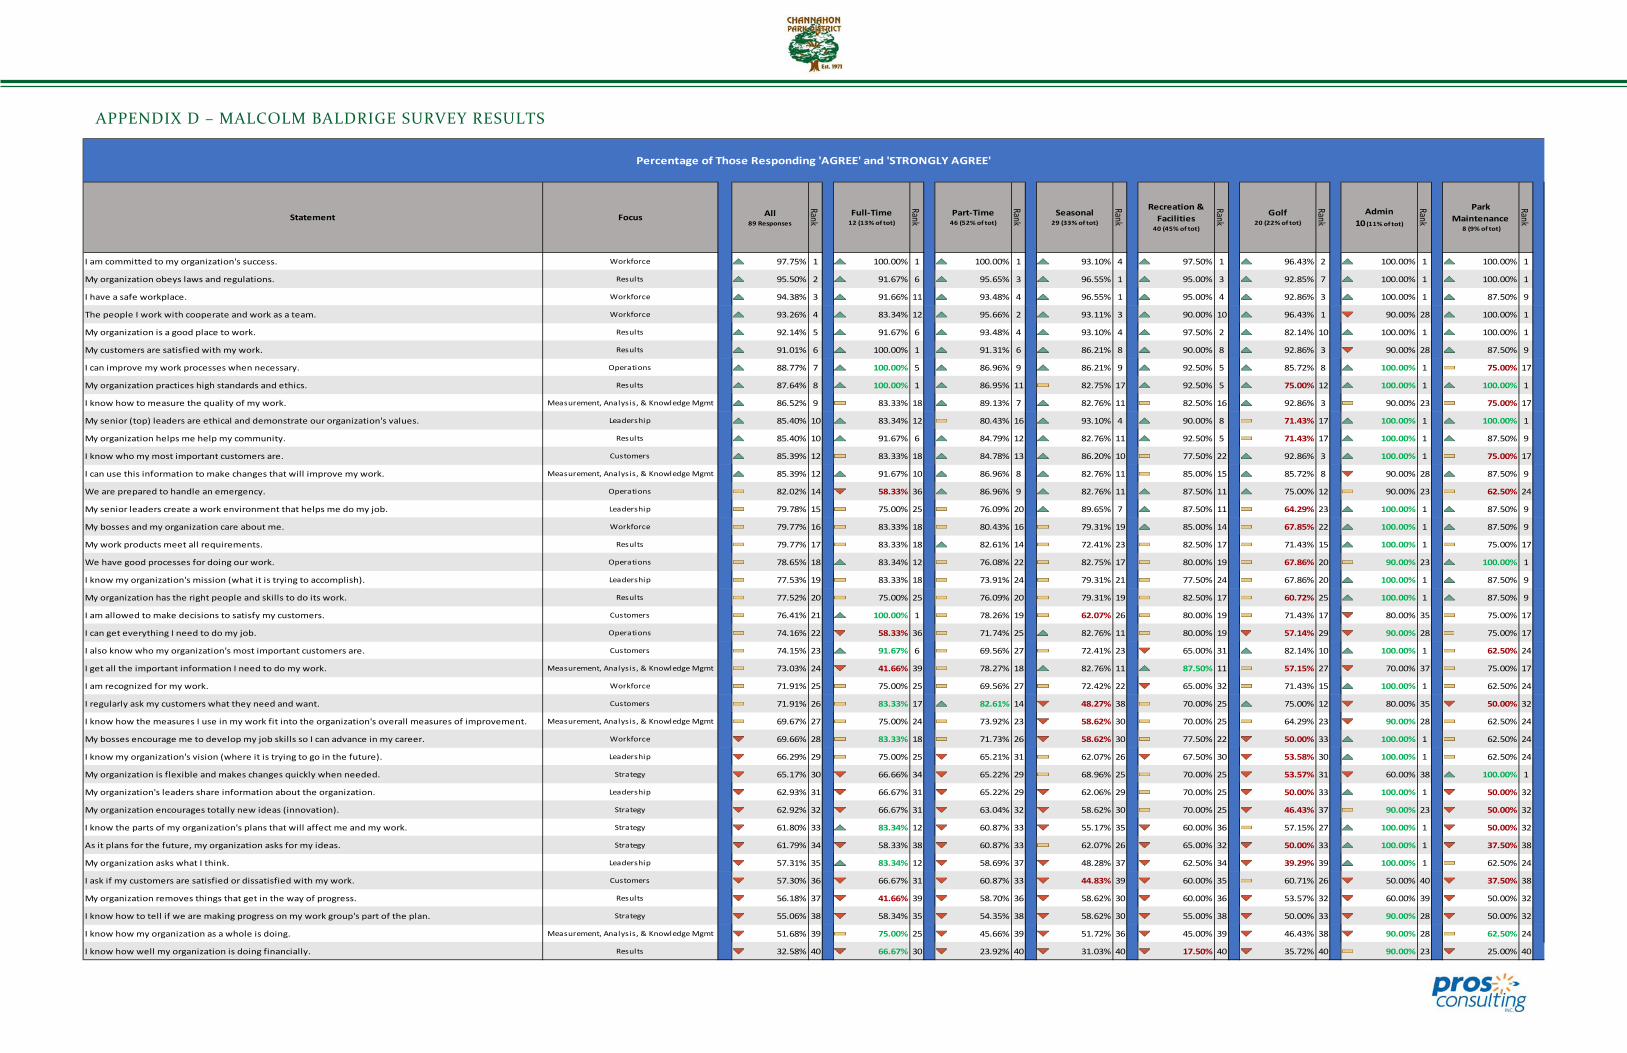
APPENDIX D – MALCOLM BALDRIGE SURVEY RESULTS
Statement Focus All89 Responses
Rank
Rank
Rank
Rank
Rank
Rank
Rank
Rank
I am committed to my organization's success. Workforce 97.75% 1 100.00% 1 100.00% 1 93.10% 4 97.50% 1 96.43% 2 100.00% 1 100.00% 1
My organization obeys laws and regulations. Results 95.50% 2 91.67% 6 95.65% 3 96.55% 1 95.00% 3 92.85% 7 100.00% 1 100.00% 1
I have a safe workplace. Workforce 94.38% 3 91.66% 11 93.48% 4 96.55% 1 95.00% 4 92.86% 3 100.00% 1 87.50% 9
The people I work with cooperate and work as a team. Workforce 93.26% 4 83.34% 12 95.66% 2 93.11% 3 90.00% 10 96.43% 1 90.00% 28 100.00% 1
My organization is a good place to work. Results 92.14% 5 91.67% 6 93.48% 4 93.10% 4 97.50% 2 82.14% 10 100.00% 1 100.00% 1
My customers are satisfied with my work. Results 91.01% 6 100.00% 1 91.31% 6 86.21% 8 90.00% 8 92.86% 3 90.00% 28 87.50% 9
I can improve my work processes when necessary. Operations 88.77% 7 100.00% 5 86.96% 9 86.21% 9 92.50% 5 85.72% 8 100.00% 1 75.00% 17
My organization practices high standards and ethics. Results 87.64% 8 100.00% 1 86.95% 11 82.75% 17 92.50% 5 75.00% 12 100.00% 1 100.00% 1
I know how to measure the quality of my work. Measurement, Analysis, & Knowledge Mgmt 86.52% 9 83.33% 18 89.13% 7 82.76% 11 82.50% 16 92.86% 3 90.00% 23 75.00% 17
My senior (top) leaders are ethical and demonstrate our organization's values. Leadership 85.40% 10 83.34% 12 80.43% 16 93.10% 4 90.00% 8 71.43% 17 100.00% 1 100.00% 1
My organization helps me help my community. Results 85.40% 10 91.67% 6 84.79% 12 82.76% 11 92.50% 5 71.43% 17 100.00% 1 87.50% 9
I know who my most important customers are. Customers 85.39% 12 83.33% 18 84.78% 13 86.20% 10 77.50% 22 92.86% 3 100.00% 1 75.00% 17
I can use this information to make changes that will improve my work. Measurement, Analysis, & Knowledge Mgmt 85.39% 12 91.67% 10 86.96% 8 82.76% 11 85.00% 15 85.72% 8 90.00% 28 87.50% 9
We are prepared to handle an emergency. Operations 82.02% 14 58.33% 36 86.96% 9 82.76% 11 87.50% 11 75.00% 12 90.00% 23 62.50% 24
My senior leaders create a work environment that helps me do my job. Leadership 79.78% 15 75.00% 25 76.09% 20 89.65% 7 87.50% 11 64.29% 23 100.00% 1 87.50% 9
My bosses and my organization care about me. Workforce 79.77% 16 83.33% 18 80.43% 16 79.31% 19 85.00% 14 67.85% 22 100.00% 1 87.50% 9
My work products meet all requirements. Results 79.77% 17 83.33% 18 82.61% 14 72.41% 23 82.50% 17 71.43% 15 100.00% 1 75.00% 17
We have good processes for doing our work. Operations 78.65% 18 83.34% 12 76.08% 22 82.75% 17 80.00% 19 67.86% 20 90.00% 23 100.00% 1
I know my organization's mission (what it is trying to accomplish). Leadership 77.53% 19 83.33% 18 73.91% 24 79.31% 21 77.50% 24 67.86% 20 100.00% 1 87.50% 9
My organization has the right people and skills to do its work. Results 77.52% 20 75.00% 25 76.09% 20 79.31% 19 82.50% 17 60.72% 25 100.00% 1 87.50% 9
I am allowed to make decisions to satisfy my customers. Customers 76.41% 21 100.00% 1 78.26% 19 62.07% 26 80.00% 19 71.43% 17 80.00% 35 75.00% 17
I can get everything I need to do my job. Operations 74.16% 22 58.33% 36 71.74% 25 82.76% 11 80.00% 19 57.14% 29 90.00% 28 75.00% 17
I also know who my organization's most important customers are. Customers 74.15% 23 91.67% 6 69.56% 27 72.41% 23 65.00% 31 82.14% 10 100.00% 1 62.50% 24
I get all the important information I need to do my work. Measurement, Analysis, & Knowledge Mgmt 73.03% 24 41.66% 39 78.27% 18 82.76% 11 87.50% 11 57.15% 27 70.00% 37 75.00% 17
I am recognized for my work. Workforce 71.91% 25 75.00% 25 69.56% 27 72.42% 22 65.00% 32 71.43% 15 100.00% 1 62.50% 24
I regularly ask my customers what they need and want. Customers 71.91% 26 83.33% 17 82.61% 14 48.27% 38 70.00% 25 75.00% 12 80.00% 35 50.00% 32
I know how the measures I use in my work fit into the organization's overall measures of improvement. Measurement, Analysis, & Knowledge Mgmt 69.67% 27 75.00% 24 73.92% 23 58.62% 30 70.00% 25 64.29% 23 90.00% 28 62.50% 24
My bosses encourage me to develop my job skills so I can advance in my career. Workforce 69.66% 28 83.33% 18 71.73% 26 58.62% 30 77.50% 22 50.00% 33 100.00% 1 62.50% 24
I know my organization's vision (where it is trying to go in the future). Leadership 66.29% 29 75.00% 25 65.21% 31 62.07% 26 67.50% 30 53.58% 30 100.00% 1 62.50% 24
My organization is flexible and makes changes quickly when needed. Strategy 65.17% 30 66.66% 34 65.22% 29 68.96% 25 70.00% 25 53.57% 31 60.00% 38 100.00% 1
My organization's leaders share information about the organization. Leadership 62.93% 31 66.67% 31 65.22% 29 62.06% 29 70.00% 25 50.00% 33 100.00% 1 50.00% 32
My organization encourages totally new ideas (innovation). Strategy 62.92% 32 66.67% 31 63.04% 32 58.62% 30 70.00% 25 46.43% 37 90.00% 23 50.00% 32
I know the parts of my organization's plans that will affect me and my work. Strategy 61.80% 33 83.34% 12 60.87% 33 55.17% 35 60.00% 36 57.15% 27 100.00% 1 50.00% 32
As it plans for the future, my organization asks for my ideas. Strategy 61.79% 34 58.33% 38 60.87% 33 62.07% 26 65.00% 32 50.00% 33 100.00% 1 37.50% 38
My organization asks what I think. Leadership 57.31% 35 83.34% 12 58.69% 37 48.28% 37 62.50% 34 39.29% 39 100.00% 1 62.50% 24
I ask if my customers are satisfied or dissatisfied with my work. Customers 57.30% 36 66.67% 31 60.87% 33 44.83% 39 60.00% 35 60.71% 26 50.00% 40 37.50% 38
My organization removes things that get in the way of progress. Results 56.18% 37 41.66% 39 58.70% 36 58.62% 30 60.00% 36 53.57% 32 60.00% 39 50.00% 32
I know how to tell if we are making progress on my work group's part of the plan. Strategy 55.06% 38 58.34% 35 54.35% 38 58.62% 30 55.00% 38 50.00% 33 90.00% 28 50.00% 32
I know how my organization as a whole is doing. Measurement, Analysis, & Knowledge Mgmt 51.68% 39 75.00% 25 45.66% 39 51.72% 36 45.00% 39 46.43% 38 90.00% 28 62.50% 24
I know how well my organization is doing financially. Results 32.58% 40 66.67% 30 23.92% 40 31.03% 40 17.50% 40 35.72% 40 90.00% 23 25.00% 40
Percentage of Those Responding 'AGREE' and 'STRONGLY AGREE'
Full-Time12 (13% of tot)
Part-Time46 (52% of tot)
Seasonal29 (33% of tot)
Recreation & Facilities
40 (45% of tot)
Golf20 (22% of tot)
Admin10 (11% of tot)
Park Maintenance
8 (9% of tot)

STRATEGIC MASTER PLAN 2020-2025

APPENDIX E – PROGRAM CLASSIFICATION
Classifications Essential
After the Bell After School Program Candy Bar Bingo
Spring Break Camp Hoppin' Holiday Egg Scramble
Winter Break Camp Fishing Derby
Extended Summer Camp Touch A Truck
Camp Heritage Independence Day Celebration
Teen Camp Movie in the Park
Kinder Kamp Scarecrow Shindig
TRIAD Community Lunch Winter Wonderland
Thanksgiving Potluck Week of Giving
Holiday Party

STRATEGIC MASTER PLAN 2020-2025
Classifications Important
Kids Connection Preschool Cooking Classes Pilates & Balance
Play and Learn Theatre Class Pilates Strength
Messy Art Science Class Pilates
Me Too First Aid for Little People Circuit Strength
Seasonal Hot Cocoa Party Magic Class HIIT
Seasonal Valentine's Day Art/Craft Classes Indoor Cycling
Seasonal Bunny Fun Babysitting Certification AB-solution ride
Lil Chefs Cooking Classes Volunteer Day Trip Strictly Strength
Spring Break Cooking Camp Volleyball Classes Saturday Cardio Challenge
Camp Exploration Tumbling Full Body Tone
Lil chefs Summer Cooking Camp Karate Barre' Strength
Learn to Swim Tennis POUND
Aqua Aerobics Spring/Fall Soccer League
Flick and Float Introduction to Sports classes
Floating Obstacle Course Youth basketball league
Jr. NBA Skills Challenge Flag football
Princess Ball Three Rivers Book Discussions
Flashlight Egg Hunt Big Bingo
Dog Gone Easter Egg Hunt Games & More
Fierce Fiesta 5K Zumba
1 Mile Family Color Run Zumba with Toning
Walk N Wag Cardio Kickboxing
Pre-Ballet & Tumbling Kickboxing/Tabata
Ballet & Tumbling Kickboxing with Step and Strength
Beginner Tap & Ballet Cardio Kickboxing with Intervals
Pee Wee Pom & Cheer 50+ Fitness
Hip Hop & More Forever Fit
Private & Team Lessons Hardcore Yoga
Ballet & tumbling Step 2 Yoga
Junior Tap & Ballet Yoga Intensity
Winter Break Dance Camp Vinyasa Yoga
Summer Dance Camp Power Yoga
Robotics Yogalates
Computer Animation Gentle Yoga
Keyboarding & Coding Yoga Strength
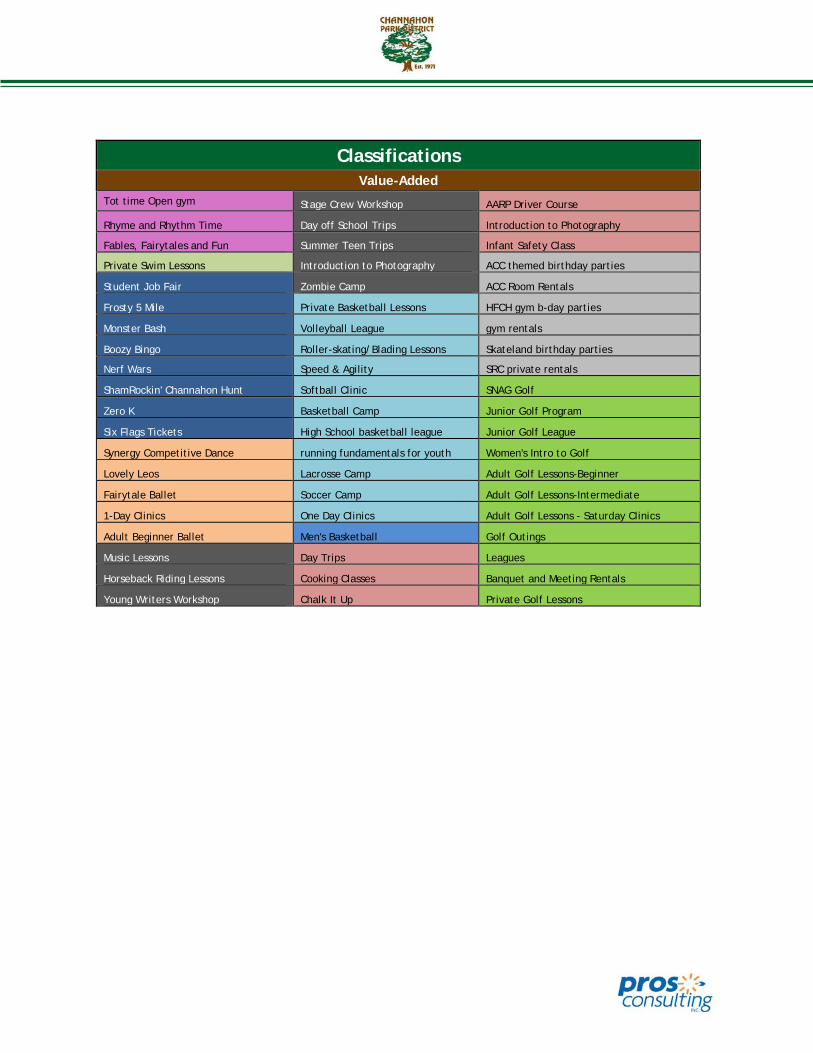
Classifications Value-Added
Tot time Open gym Stage Crew Workshop AARP Driver Course
Rhyme and Rhythm Time Day off School Trips Introduction to Photography
Fables, Fairytales and Fun Summer Teen Trips Infant Safety Class
Private Swim Lessons Introduction to Photography ACC themed birthday parties
Student Job Fair Zombie Camp ACC Room Rentals
Frosty 5 Mile Private Basketball Lessons HFCH gym b-day parties
Monster Bash Volleyball League gym rentals
Boozy Bingo Roller-skating/Blading Lessons Skateland birthday parties
Nerf Wars Speed & Agility SRC private rentals
ShamRockin' Channahon Hunt Softball Clinic SNAG Golf
Zero K Basketball Camp Junior Golf Program
Six Flags Tickets High School basketball league Junior Golf League
Synergy Competitive Dance running fundamentals for youth Women's Intro to Golf
Lovely Leos Lacrosse Camp Adult Golf Lessons-Beginner
Fairytale Ballet Soccer Camp Adult Golf Lessons-Intermediate
1-Day Clinics One Day Clinics Adult Golf Lessons - Saturday Clinics
Adult Beginner Ballet Men's Basketball Golf Outings
Music Lessons Day Trips Leagues
Horseback Riding Lessons Cooking Classes Banquet and Meeting Rentals
Young Writers Workshop Chalk It Up Private Golf Lessons

STRATEGIC MASTER PLAN 2020-2025
APPENDIX F: SIMILAR PROVIDER BENCHMARK
Other Service Providers
Name of Agency Location in the District / County
Operator (Public /
Private / Not-for-Profit
General Description
Price Comparison with your Services
Distance in minutes from your Prime
Facility
Three Rivers Library Channahon Local
Government Local Library Lower/Free 0.5 Miles
Kids Corner Preschool and Child Care
Channahon Private Preschool and child care
Slightly Higher 1 Mile
Peak Fitness Minooka Private Fitness Center / Group Fitness
Slightly Higher 3 Miles
Channahon School District 17
Channahon Local Government
Youth Athletic Camps and Pre-K learning Free 0 Miles
YMCA After School Program
Minooka School District Non for Profit
After School, Programming, Recreation
Higher 8 Miles
Chicago Rush Soccer Channahon/Minooka Private Youth Soccer Club Higher 4.1 Miles
Channahon Township Channahon/Minooka Public Senior Trips Lower 5.5 Miles
Minooka High School Minooka Public Summer Sports
Camps Lower/Free 3.7 Miles
Churches Channahon/Minooka Public preschool programs, camps, Lower/Free Local Area
Minooka Summer Camp Minooka Public 1/2-day summer
camp Lower 3 Miles
Joliet Park District Joliet Public
recreation programming/ sports/gymnastics/ preschool
Similar 8.1 Miles
Senior Housing Channahon Private programming Lower 0.6 Miles
Mistwood Golf Club Romeoville Private Golf Course Higher 16 Minutes
Cog Hill Golf & Country Club - #2 & #4 Courses
Lemont Private Golf Course Higher 32 Minutes
Ruffled Feathers Golf Club
Lemont Private Golf Course Similar 33 Minutes
Bolingbrook Golf Club Bolingbrook Public Golf Course Higher 21 Minutes
Arrowhead Golf Club Wheaton Public Golf Course Higher 37 Minutes
Springbrook Golf Course Naperville Public Golf Course Lower 31 Minutes

Naperbrook Golf Course Naperville Public Golf Course Lower 24 Minutes
Other Service Providers
Name of Agency Location in the District / County
Operator (Public /
Private / Not-for-Profit
General Description Price
Comparison with your Services
Distance in minutes from your Prime
Facility The Preserve @ Oak Meadows
Addison Public Golf Course Higher 45 Minutes
Cantigny Golf Wheaton Not-for-Profit Golf Course Higher 40 Minutes
Harborside International Golf Center
Chicago Private Golf Course Higher 46 inutes
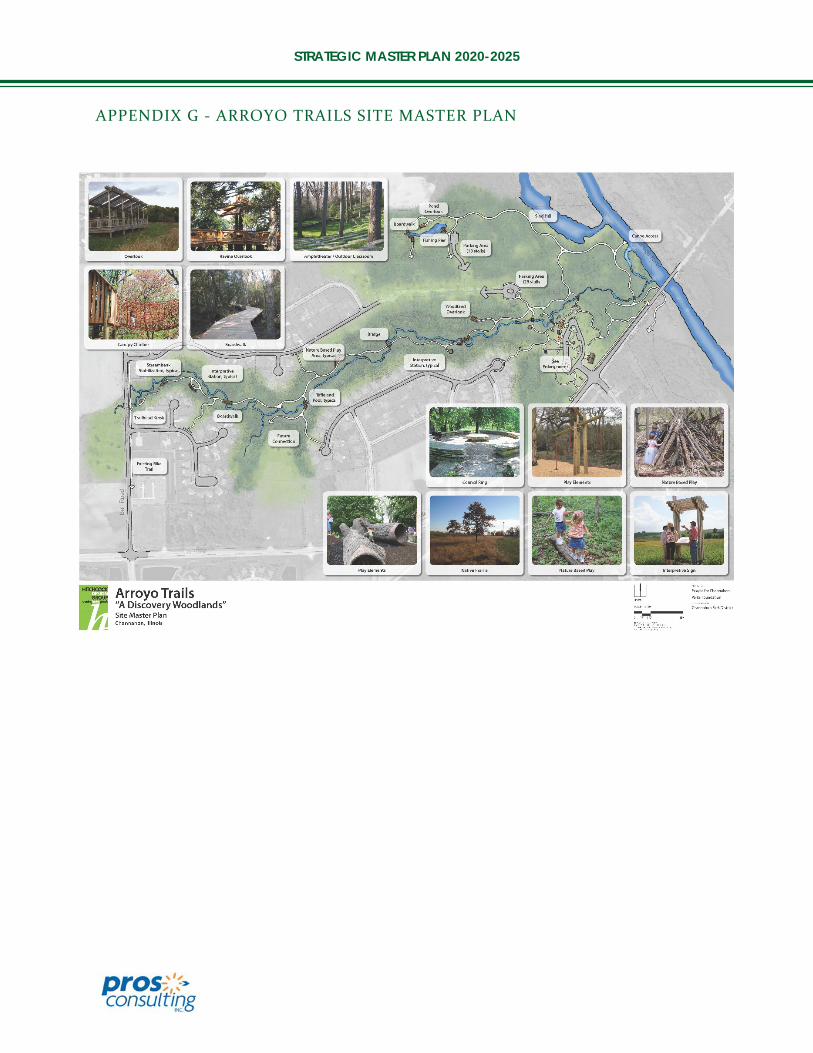
STRATEGIC MASTER PLAN 2020-2025
APPENDIX G - ARROYO TRAILS SITE MASTER PLAN


Related Documents