APPENDIX A AIR QUALITY & GHG IMPACT ANALYSIS

Welcome message from author
This document is posted to help you gain knowledge. Please leave a comment to let me know what you think about it! Share it to your friends and learn new things together.
Transcript

APPENDIX A
AIR QUALITY & GHG IMPACT ANALYSIS


AIR QUALITY and GHG IMPACT ANALYSES
GLADSTONE SENIOR VILLAS PROJECT
AZUSA, CALIFORNIA
Prepared for:
Phil Martin & Associates
Attn: Phil Martin
4860 Irvine Boulevard, Suite 203
Irvine, CA 92620
Date:
June 23, 2017
Project No.: P17-027 AQ

Gladstone Seniors AQ
- 1 -
METEOROLOGICAL SETTING
The climate of Azusa, as with all of Southern California, is governed largely by the strength and
location of the semi-permanent high-pressure center over the Pacific Ocean and the moderating
effects of the nearby vast oceanic heat reservoir. Local climatic conditions are characterized by
very warm summers, mild winters, infrequent rainfall, moderate daytime on-shore breezes, and
comfortable humidities. Unfortunately, the same climatic conditions that create such a desirable
living climate combine to severely restrict the ability of the local atmosphere to disperse the large
volumes of air pollution generated by the population and industry attracted in part by the climate.
Azusa is situated in an area where the pollutants generated in coastal portions of the Los Angeles
basin undergo photochemical reactions and then move inland across the project site during the
daily sea breeze cycle. The resulting smog at times gives the western San Gabriel Valley some of
the worst air quality in all of California. The worst air quality, however, has gradually been moving
eastward. The area of heaviest ozone air pollution has gradually moved eastward from Pasadena
in the 1960’s to Glendora and even Upland/Ontario in the 1990’s. Elevated smog levels
nevertheless persist in the El Monte area during the warmer months of the year. Despite dramatic
improvement in air quality in the local area throughout the last several decades, the project site is
expected to continue to experience some unhealthful air quality until beyond 2020.
Temperatures in the project vicinity average 62 degrees Fahrenheit annually with summer
afternoons in the low 90s and winter mornings in the low 40s. Temperatures much above 100 or
below 30 degrees occur infrequently only under unusual weather conditions and even then these
limits are not far exceeded.
In contrast to the slow annual variation of temperature, precipitation is highly variable seasonally.
Rainfall in the San Gabriel Valley averages 14 inches annually and falls almost exclusively from
late October to early April. Summers are very dry with frequent periods of 4-5 months of no rain
at all. Because much of the rainfall comes from the fringes of mid-latitude storms, a shift in the
storm track of a few hundred miles can mean the difference between a very wet year and a year
with drought conditions.
Winds across the project area are an important meteorological parameter because they control both
the initial rate of dilution of locally generated air pollutant emissions as well as their regional
trajectory. Local wind patterns show a fairly unidirectional daytime onshore flow from the SW-
W with a very weak offshore return flow from the NE that is strongest on winter nights when the
land is colder than the ocean. The onshore winds during the day average 6-8 mph, while the
offshore flow is often calm or drifts slowly westward at 1-3 mph. During the daytime, any locally
generated air emissions are thus transported eastward toward San Bernardino and Cajon Pass
without generating any localized air quality impacts.
The drainage winds which move slowly across the area at night have some potential for localized
stagnation. Fortunately, these winds have their origin in the San Gabriel Mountains where
background pollution levels are low such that any localized contributions do not create any
unhealthful impacts. The wind distribution is such that nominal project-related air quality impacts
occur more on a regional scale rather than in the immediate Azusa area. One other important wind

Gladstone Seniors AQ
- 2 -
condition occurs when a high pressure center forms over the western United States with sinking
air forced seaward through local canyons and mountain passes. The air warms by compression
and relative humidities drop dramatically. The dry, gusty winds from the N-NE create dust
nuisance potential around areas of soil disturbance such as construction sites.
In conjunction with the two dominant wind regimes that affect the rate and orientation of horizontal
pollutant transport, there are two similarly distinct types of temperature inversions that control the
vertical depth through which pollutants are mixed. The summer on-shore flow is capped by a
massive dome of warm, sinking air which caps a shallow layer of cooler ocean air. These
marine/subsidence inversions act like a giant lid over the basin. They allow for local mixing of
emissions, but they confine the entire polluted air mass within the basin until it escapes into the
desert or along the thermal chimneys formed along heated mountain slopes.
In winter, when the air near the ground cools while the air aloft remains warm, radiation inversions
are formed that trap low-level emissions such as automobile exhaust near their source. As
background levels of primary vehicular exhaust rise during the seaward return flow, the
combination of rising non-local baseline levels plus emissions trapped locally by these radiation
inversions creates micro-scale air pollution "hot spots" near freeways, shopping centers and other
traffic concentrations. Because the incoming air draining off the mountains into the San Gabriel
Valley during nocturnal radiation inversion conditions is relatively clean, the summer subsidence
inversions are a far more critical factor in determining Azusa area air quality than the winter time
local trapping inversions.

Gladstone Seniors AQ
- 3 -
AIR QUALITY SETTING
AMBIENT AIR QUALITY STANDARDS (AAQS)
In order to gauge the significance of the air quality impacts of the proposed project, those impacts,
together with existing background air quality levels, must be compared to the applicable ambient
air quality standards. These standards are the levels of air quality considered safe, with an adequate
margin of safety, to protect the public health and welfare. They are designed to protect those
people most susceptible to further respiratory distress such as asthmatics, the elderly, very young
children, people already weakened by other disease or illness, and persons engaged in strenuous
work or exercise, called "sensitive receptors." Healthy adults can tolerate occasional exposure to
air pollutant concentrations considerably above these minimum standards before adverse effects
are observed. Recent research has shown, however, that chronic exposure to ozone (the primary
ingredient in photochemical smog) may lead to adverse respiratory health even at concentrations
close to the ambient standard.
National AAQS were established in 1971 for six pollution species with states retaining the option
to add other pollutants, require more stringent compliance, or to include different exposure periods.
The initial attainment deadline of 1977 was extended several times in air quality problem areas
like Southern California. In 2003, the Environmental Protection Agency (EPA) adopted a rule,
which extended and established a new attainment deadline for ozone for the year 2021. Because
the State of California had established AAQS several years before the federal action and because
of unique air quality problems introduced by the restrictive dispersion meteorology, there is
considerable difference between state and national clean air standards. Those standards currently
in effect in California are shown in Table 1. Sources and health effects of various pollutants are
shown in Table 2.
The Federal Clean Air Act Amendments (CAAA) of 1990 required that the U.S. Environmental
Protection Agency (EPA) review all national AAQS in light of currently known health effects.
EPA was charged with modifying existing standards or promulgating new ones where appropriate.
EPA subsequently developed standards for chronic ozone exposure (8+ hours per day) and for
very small diameter particulate matter (called "PM-2.5"). New national AAQS were adopted in
1997 for these pollutants.
Planning and enforcement of the federal standards for PM-2.5 and for ozone (8-hour) were
challenged by trucking and manufacturing organizations. In a unanimous decision, the U.S.
Supreme Court ruled that EPA did not require specific congressional authorization to adopt
national clean air standards. The Court also ruled that health-based standards did not require
preparation of a cost-benefit analysis. The Court did find, however, that there was some
inconsistency between existing and "new" standards in their required attainment schedules. Such
attainment-planning schedule inconsistencies centered mainly on the 8-hour ozone standard. EPA
subsequently agreed to downgrade the attainment designation for a large number of communities
to “non-attainment” for the 8-hour ozone standard.

Gladstone Seniors AQ
- 4 -
Table 1
Gladstone Seniors AQ
- 5 -
Table 1 (continued)

Gladstone Seniors AQ
- 6 -
Table 2
Health Effects of Major Criteria Pollutants
Pollutants Sources Primary Effects
Carbon Monoxide
(CO) Incomplete combustion of fuels and other
carbon-containing substances, such as motor
exhaust.
Natural events, such as decomposition of
organic matter.
Reduced tolerance for exercise.
Impairment of mental function.
Impairment of fetal development.
Death at high levels of exposure.
Aggravation of some heart diseases (angina).
Nitrogen Dioxide
(NO2) Motor vehicle exhaust.
High temperature stationary combustion.
Atmospheric reactions.
Aggravation of respiratory illness.
Reduced visibility.
Reduced plant growth.
Formation of acid rain.
Ozone
(O3) Atmospheric reaction of organic gases with
nitrogen oxides in sunlight.
Aggravation of respiratory and
cardiovascular diseases.
Irritation of eyes.
Impairment of cardiopulmonary function.
Plant leaf injury.
Lead (Pb) Contaminated soil. Impairment of blood function and nerve
construction.
Behavioral and hearing problems in children.
Respirable Particulate
Matter
(PM-10)
Stationary combustion of solid fuels.
Construction activities.
Industrial processes.
Atmospheric chemical reactions.
Reduced lung function.
Aggravation of the effects of gaseous
pollutants.
Aggravation of respiratory and cardio
respiratory diseases.
Increased cough and chest discomfort.
Soiling.
Reduced visibility.
Fine Particulate Matter
(PM-2.5) Fuel combustion in motor vehicles,
equipment, and industrial sources.
Residential and agricultural burning.
Industrial processes.
Also, formed from photochemical reactions
of other pollutants, including NOx, sulfur
oxides, and organics.
Increases respiratory disease.
Lung damage.
Cancer and premature death.
Reduces visibility and results in surface
soiling.
Sulfur Dioxide
(SO2) Combustion of sulfur-containing fossil fuels.
Smelting of sulfur-bearing metal ores.
Industrial processes.
Aggravation of respiratory diseases (asthma,
emphysema).
Reduced lung function.
Irritation of eyes.
Reduced visibility.
Plant injury.
Deterioration of metals, textiles, leather,
finishes, coatings, etc.
Source: California Air Resources Board, 2002.
Gladstone Seniors AQ
- 7 -
Evaluation of the most current data on the health effects of inhalation of fine particulate matter
prompted the California Air Resources Board (ARB) to recommend adoption of the statewide
PM-2.5 standard that is more stringent than the federal standard. This standard was adopted in
2002. The State PM-2.5 standard is more of a goal in that it does not have specific attainment
planning requirements like a federal clean air standard, but only requires continued progress
towards attainment.
Similarly, the ARB extensively evaluated health effects of ozone exposure. A new state standard
for an 8-hour ozone exposure was adopted in 2005, which aligned with the exposure period for the
federal 8-hour standard. The California 8-hour ozone standard of 0.07 ppm is more stringent than
the federal 8-hour standard of 0.075 ppm. The state standard, however, does not have a specific
attainment deadline. California air quality jurisdictions are required to make steady progress
towards attaining state standards, but there are no hard deadlines or any consequences of non-
attainment. During the same re-evaluation process, the ARB adopted an annual state standard for
nitrogen dioxide (NO2) that is more stringent than the corresponding federal standard, and
strengthened the state one-hour NO2 standard.
As part of EPA’s 2002 consent decree on clean air standards, a further review of airborne
particulate matter (PM) and human health was initiated. A substantial modification of federal
clean air standards for PM was promulgated in 2006. Standards for PM-2.5 were strengthened, a
new class of PM in the 2.5 to 10 micron size was created, some PM-10 standards were revoked,
and a distinction between rural and urban air quality was adopted. In December, 2012, the federal
annual standard for PM-2.5 was reduced from 15 g/m3 to 12 g/m3 which matches the California
AAQS. The severity of the basin’s non-attainment status for PM-2.5 may be increased by this
action and thus require accelerated planning for future PM-2.5 attainment.
In response to continuing evidence that ozone exposure at levels just meeting federal clean air
standards is demonstrably unhealthful, EPA had proposed a further strengthening of the 8-hour
standard. A new 8-hour ozone standard was adopted in 2015 after extensive analysis and public
input. The adopted national 8-hour ozone standard is 0.07 ppm which matches the current
California standard. It will require three years of ambient data collection, then 2 years of non-
attainment findings and planning protocol adoption, then several years of plan development and
approval. Final air quality plans for the new standard are likely to be adopted around 2022.
Ultimate attainment of the new standard in ozone problem areas such as Southern California might
be after 2025.
In 2010 a new federal one-hour primary standard for nitrogen dioxide (NO2) was adopted. This
standard is more stringent than the existing state standard. Based upon air quality monitoring data
in the South Coast Air Basin, the California Air Resources Board has requested the EPA to
designate the basin as being in attainment for this standard. The federal standard for sulfur dioxide
(SO2) was also recently revised. However, with minimal combustion of coal and mandatory use of
low sulfur fuels in California, SO2 is typically not a problem pollutant.

Gladstone Seniors AQ
- 8 -
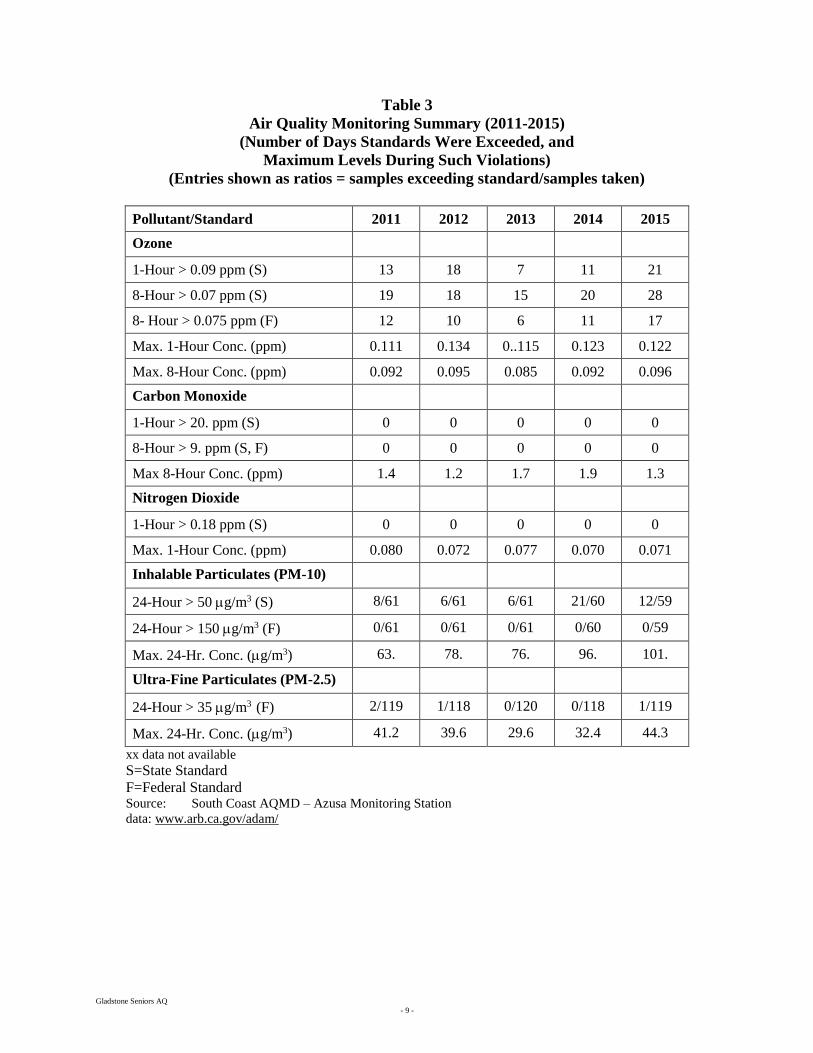
BASELINE AIR QUALITY
Existing levels of ambient air quality and historical trends in the project area are best documented
by measurements made by SCAQMD at its Azusa Monitoring Station. This station measures both
regional pollution levels such as dust (particulates) and smog, as well as levels of primary vehicular
pollutants such as carbon monoxide. Table 3 is a 5-year summary of monitoring data for the major
air pollutants compiled from this air monitoring station.
a. Photochemical smog (ozone) levels occasionally exceed standards. The 8-hour state ozone
standard was exceeded on five percent of all measured days and the 1-hour state standard
have been exceeded on approximately four percent of all days in the past five years. The
8-hour federal standard has been exceeded on three percent of days for the same period.
While ozone levels are still high, they are much lower than 10 to 20 years ago. Attainment
of all clean air standards in the project vicinity is not likely to occur soon, but the severity
and frequency of violations is expected to continue to slowly decline during the current
decade.
b. Measurements of carbon monoxide have shown very low baseline levels in comparison to
the most stringent one- and eight-hour standards.
c. Respirable dust (PM-10) levels exceed the state standard on approximately 17 percent of
measurement days, but the less stringent federal PM-10 standard has not been violated for
the same period. Year to year fluctuations of overall maximum 24-hour PM-10 levels seem
to follow no discernable trend, though 2011 had the lowest maximum 24-hour
concentration and 2015 the highest in recent history.
d. A substantial fraction of PM-10 is comprised of ultra-small diameter particulates capable
of being inhaled into deep lung tissue (PM-2.5). Year 2013 showed the fewest violations
in recent years. Both the frequency of violations of particulate standards, as well as high
percentage of PM-2.5, are occasional air quality concerns in the project area. Less than
one percent of all days exceeded the current national 24-hour standard of 35 g/m3 from
2011-2015 with only five violations of measured days.
Although complete attainment of every clean air standard is not yet imminent, extrapolation of the
steady improvement trend suggests that such attainment could occur within the reasonably near
future.
Gladstone Seniors AQ
- 9 -
Table 3
Air Quality Monitoring Summary (2011-2015)
(Number of Days Standards Were Exceeded, and
Maximum Levels During Such Violations)
(Entries shown as ratios = samples exceeding standard/samples taken)
Pollutant/Standard 2011 2012 2013 2014 2015
Ozone
1-Hour > 0.09 ppm (S) 13 18 7 11 21
8-Hour > 0.07 ppm (S) 19 18 15 20 28
8- Hour > 0.075 ppm (F) 12 10 6 11 17
Max. 1-Hour Conc. (ppm) 0.111 0.134 0..115 0.123 0.122
Max. 8-Hour Conc. (ppm) 0.092 0.095 0.085 0.092 0.096
Carbon Monoxide
1-Hour > 20. ppm (S) 0 0 0 0 0
8-Hour > 9. ppm (S, F) 0 0 0 0 0
Max 8-Hour Conc. (ppm) 1.4 1.2 1.7 1.9 1.3
Nitrogen Dioxide
1-Hour > 0.18 ppm (S) 0 0 0 0 0
Max. 1-Hour Conc. (ppm) 0.080 0.072 0.077 0.070 0.071
Inhalable Particulates (PM-10)
24-Hour > 50 g/m3 (S) 8/61 6/61 6/61 21/60 12/59
24-Hour > 150 g/m3 (F) 0/61 0/61 0/61 0/60 0/59
Max. 24-Hr. Conc. (g/m3) 63. 78. 76. 96. 101.
Ultra-Fine Particulates (PM-2.5)
24-Hour > 35 g/m3 (F) 2/119 1/118 0/120 0/118 1/119
Max. 24-Hr. Conc. (g/m3) 41.2 39.6 29.6 32.4 44.3
xx data not available
S=State Standard
F=Federal Standard Source: South Coast AQMD – Azusa Monitoring Station
data: www.arb.ca.gov/adam/
Gladstone Seniors AQ
- 10 -
AIR QUALITY PLANNING
The Federal Clean Air Act (1977 Amendments) required that designated agencies in any area of
the nation not meeting national clean air standards must prepare a plan demonstrating the steps
that would bring the area into compliance with all national standards. The SCAB could not meet
the deadlines for ozone, nitrogen dioxide, carbon monoxide, or PM-10. In the SCAB, the agencies
designated by the governor to develop regional air quality plans are the SCAQMD and the
Southern California Association of Governments (SCAG). The two agencies first adopted an Air
Quality Management Plan (AQMP) in 1979 and revised it several times as earlier attainment
forecasts were shown to be overly optimistic.
The 1990 Federal Clean Air Act Amendment (CAAA) required that all states with air-sheds with
“serious” or worse ozone problems submit a revision to the State Implementation Plan (SIP).
Amendments to the SIP have been proposed, revised and approved over the past decade. The most
current regional attainment emissions forecast for ozone precursors (ROG and NOx) and for
carbon monoxide (CO) and for particulate matter are shown in Table 4. Substantial reductions in
emissions of ROG, NOx and CO are forecast to continue throughout the next several decades.
Unless new particulate control programs are implemented, PM-10 and PM-2.5 are forecast to
slightly increase.
The Air Quality Management District (AQMD) adopted an updated clean air “blueprint” in August
2003. The 2003 Air Quality Management Plan (AQMP) was approved by the EPA in 2004. The
AQMP outlined the air pollution measures needed to meet federal health-based standards for ozone
by 2010 and for particulates (PM-10) by 2006. The 2003 AQMP was based upon the federal one-
hour ozone standard which was revoked late in 2005 and replaced by an 8-hour federal standard.
Because of the revocation of the hourly standard, a new air quality planning cycle was initiated.
With re-designation of the air basin as non-attainment for the 8-hour ozone standard, a new
attainment plan was developed. This plan shifted most of the one-hour ozone standard attainment
strategies to the 8-hour standard. As previously noted, the attainment date was to “slip” from 2010
to 2021. The updated attainment plan also includes strategies for ultimately meeting the federal
PM-2.5 standard.
Because projected attainment by 2021 required control technologies that did not exist yet, the
SCAQMD requested a voluntary “bump-up” from a “severe non-attainment” area to an “extreme
non-attainment” designation for ozone. The extreme designation was to allow a longer time period
for these technologies to develop. If attainment cannot be demonstrated within the specified
deadline without relying on “black-box” measures, EPA would have been required to impose
sanctions on the region had the bump-up request not been approved. In April 2010, the EPA
approved the change in the non-attainment designation from “severe-17” to “extreme.” This
reclassification set a later attainment deadline (2024), but also required the air basin to adopt even
more stringent emissions controls.

Gladstone Seniors AQ
- 11 -
Table 4
South Coast Air Basin Emissions Forecasts (Emissions in tons/day)
Pollutant 2010a 2015b 2020b 2025b
NOx 603 451 357 289
VOC 544 429 400 393
PM-10 160 155 161 165
PM-2.5 71 67 67 68
a2010 Base Year. bWith current emissions reduction programs and adopted growth forecasts.
Source: California Air Resources Board, 2013 Almanac of Air Quality
In other air quality attainment plan reviews, EPA had disapproved part of the SCAB PM-2.5
attainment plan included in the AQMP. EPA stated that the current attainment plan relied on PM-
2.5 control regulations that had not yet been approved or implemented. It was expected that a
number of rules that were pending approval would remove the identified deficiencies. If these
issues were not resolved within the next several years, federal funding sanctions for transportation
projects could result. The 2012 AQMP included in the current California State Implementation
Plan (SIP) was expected to remedy identified PM-2.5 planning deficiencies.
The federal Clean Air Act requires that non-attainment air basins have EPA approved attainment
plans in place. This requirement includes the federal one-hour ozone standard even though that
standard was revoked around eight years ago. There was no approved attainment plan for the one-
hour federal standard at the time of revocation. Through a legal quirk, the SCAQMD is now
required to develop an AQMP for the long since revoked one-hour federal ozone standard. Because
the current SIP for the basin contains a number of control measures for the 8-hour ozone standard
that are equally effective for one-hour levels, the 2012 AQMP was believed to satisfy hourly
attainment planning requirements.
AQMPs are required to be updated every three years. The 2012 AQMP was adopted in early 2013.
An updated AQMP was required for completion in 2016. The 2016 AQMP was adopted by the
SCAQMD Board in March, 2017, and has been submitted the California Air Resources Board for
forwarding to the EPA. The 2016 AQMP acknowledges that motor vehicle emissions have been
effectively controlled and that reductions in NOx, the continuing ozone problem pollutant, may
need to come from major stationary sources (power plants, refineries, landfill flares, etc.) . The
current attainment deadlines for all federal non-attainment pollutants are now as follows:
8-hour ozone (70 ppb) 2032
Annual PM-2.5 (12 g/m3) 2025
8-hour ozone (75 ppb) 2024 (old standard)
1-hour ozone (120 ppb) 2023 (rescinded standard)
24-hour PM-2.5 (35 g/m3) 2019
Gladstone Seniors AQ
- 12 -
The key challenge is that NOx emission levels, as a critical ozone precursor pollutant, are forecast
to continue to exceed the levels that would allow the above deadlines to be met. Unless additional
stringent NOx control measures are adopted and implemented, ozone attainment goals may not be
met.
The proposed project does not directly relate to the AQMP in that there are no specific air quality
programs or regulations governing senior living projects. Conformity with adopted plans, forecasts
and programs relative to population, housing, employment and land use is the primary yardstick
by which impact significance of planned growth is determined. The SCAQMD, however, while
acknowledging that the AQMP is a growth-accommodating document, does not favor designating
regional impacts as less-than-significant just because the proposed development is consistent with
regional growth projections. Air quality impact significance for the proposed project has therefore
been analyzed on a project-specific basis.

Gladstone Seniors AQ
- 13 -
AIR QUALITY IMPACT
STANDARDS OF SIGNIFICANCE
Air quality impacts are considered “significant” if they cause clean air standards to be violated
where they are currently met, or if they “substantially” contribute to an existing violation of
standards. Any substantial emissions of air contaminants for which there is no safe exposure, or
nuisance emissions such as dust or odors, would also be considered a significant impact.
Appendix G of the California CEQA Guidelines offers the following five tests of air quality impact
significance. A project would have a potentially significant impact if it:
a. Conflicts with or obstructs implementation of the applicable air quality plan.
b. Violates any air quality standard or contributes substantially to an existing or projected air
quality violation.
c. Results in a cumulatively considerable net increase of any criteria pollutants for which the
project region is non-attainment under an applicable federal or state ambient air quality
standard (including releasing emissions which exceed quantitative thresholds for ozone
precursors).
d. Exposes sensitive receptors to substantial pollutant concentrations.
e. Creates objectionable odors affecting a substantial number of people.
Primary Pollutants
Air quality impacts generally occur on two scales of motion. Near an individual source of
emissions or a collection of sources such as a crowded intersection or parking lot, levels of those
pollutants that are emitted in their already unhealthful form will be highest. Carbon monoxide
(CO) is an example of such a pollutant. Primary pollutant impacts can generally be evaluated
directly in comparison to appropriate clean air standards. Violations of these standards where they
are currently met, or a measurable worsening of an existing or future violation, would be
considered a significant impact. Many particulates, especially fugitive dust emissions, are also
primary pollutants. Because of the non-attainment status of the South Coast Air Basin (SCAB)
for PM-10, an aggressive dust control program is required to control fugitive dust during project
construction.
Secondary Pollutants
Many pollutants, however, require time to transform from a more benign form to a more
unhealthful contaminant. Their impact occurs regionally far from the source. Their incremental
regional impact is minute on an individual basis and cannot be quantified except through complex
photochemical computer models. Analysis of significance of such emissions is based upon a

Gladstone Seniors AQ
- 14 -
specified amount of emissions (pounds, tons, etc.) even though there is no way to translate those
emissions directly into a corresponding ambient air quality impact.
Because of the chemical complexity of primary versus secondary pollutants, the SCAQMD has
designated significant emissions levels as surrogates for evaluating regional air quality impact
significance independent of chemical transformation processes. Projects with daily emissions that
exceed any of the following emission thresholds are recommended by the SCAQMD to be
considered significant under CEQA guidelines.
Table 5
Daily Emissions Thresholds
Source: SCAQMD CEQA Air Quality Handbook, November, 1993 Rev.
Additional Indicators
In its CEQA Handbook, the SCAQMD also states that additional indicators should be used as
screening criteria to determine the need for further analysis with respect to air quality. The
additional indicators are as follows:
Project could interfere with the attainment of the federal or state ambient air quality
standards by either violating or contributing to an existing or projected air quality violation
Project could result in population increases within the regional statistical area which would
be in excess of that projected in the AQMP and in other than planned locations for the
project’s build-out year.
Project could generate vehicle trips that cause a CO hot spot.
Pollutant Construction Operations
ROG 75 55
NOx 100 55
CO 550 550
PM-10 150 150
PM-2.5 55 55
SOx 150 150
Lead 3 3

Gladstone Seniors AQ
- 15 -
CONSTRUCTION ACTIVITY IMPACTS
CalEEMod was developed by the SCAQMD to provide a model by which to calculate both
construction emissions and operational emissions from a variety of land use projects. It calculates
both the daily maximum and annual average emissions for criteria pollutants as well as total or
annual greenhouse gas (GHG) emissions.
Although exhaust emissions will result from on and off-site equipment, the exact types and
numbers of equipment will vary among contractors such that such emissions cannot be quantified
with certainty. Estimated construction emissions were modeled using CalEEMod2016.3.1 to
identify maximum daily emissions for each pollutant during project construction.
The proposed project entails demolition of three existing structures and construction of 60 units of
senior living space. Construction was modeled in CalEEMod2013.2.2 using default construction
equipment and schedule for a project of this size as shown in Table 6.
Table 6
Construction Activity Equipment Fleet
Phase Name and Duration Equipment
Demolition (20 days)
1 Concrete Saw
1 Dozer
3 Loader/Backhoes
Grading (4 days)
1 Grader
1 Dozer
1 Loader/Backhoe
Construction (200 days)
1 Crane
1 Generator Set
1 Loader/Backhoe
1 Forklift
Paving (10 days)
1 Paver
1 Paving Equipment
1 Cement Mixer
1 Loader/Backhoe
1 Roller
Utilizing this indicated equipment fleet and durations shown in Table 6 the following worst case
daily construction emissions are calculated by CalEEMod and are listed in Table 7.
Gladstone Seniors AQ
- 16 -
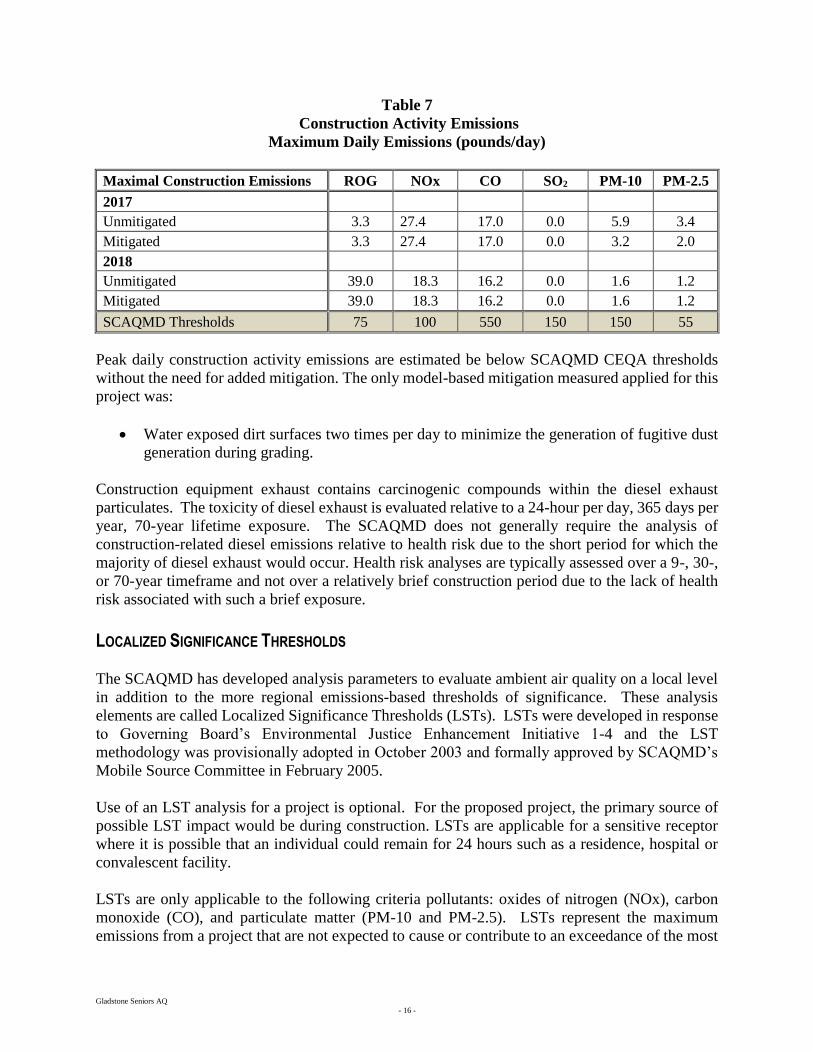
Table 7
Construction Activity Emissions
Maximum Daily Emissions (pounds/day)
Maximal Construction Emissions ROG NOx CO SO2 PM-10 PM-2.5
2017
Unmitigated 3.3 27.4 17.0 0.0 5.9 3.4
Mitigated 3.3 27.4 17.0 0.0 3.2 2.0
2018
Unmitigated 39.0 18.3 16.2 0.0 1.6 1.2
Mitigated 39.0 18.3 16.2 0.0 1.6 1.2
SCAQMD Thresholds 75 100 550 150 150 55
Peak daily construction activity emissions are estimated be below SCAQMD CEQA thresholds
without the need for added mitigation. The only model-based mitigation measured applied for this
project was:
Water exposed dirt surfaces two times per day to minimize the generation of fugitive dust
generation during grading.
Construction equipment exhaust contains carcinogenic compounds within the diesel exhaust
particulates. The toxicity of diesel exhaust is evaluated relative to a 24-hour per day, 365 days per
year, 70-year lifetime exposure. The SCAQMD does not generally require the analysis of
construction-related diesel emissions relative to health risk due to the short period for which the
majority of diesel exhaust would occur. Health risk analyses are typically assessed over a 9-, 30-,
or 70-year timeframe and not over a relatively brief construction period due to the lack of health
risk associated with such a brief exposure.
LOCALIZED SIGNIFICANCE THRESHOLDS
The SCAQMD has developed analysis parameters to evaluate ambient air quality on a local level
in addition to the more regional emissions-based thresholds of significance. These analysis
elements are called Localized Significance Thresholds (LSTs). LSTs were developed in response
to Governing Board’s Environmental Justice Enhancement Initiative 1-4 and the LST
methodology was provisionally adopted in October 2003 and formally approved by SCAQMD’s
Mobile Source Committee in February 2005.
Use of an LST analysis for a project is optional. For the proposed project, the primary source of
possible LST impact would be during construction. LSTs are applicable for a sensitive receptor
where it is possible that an individual could remain for 24 hours such as a residence, hospital or
convalescent facility.
LSTs are only applicable to the following criteria pollutants: oxides of nitrogen (NOx), carbon
monoxide (CO), and particulate matter (PM-10 and PM-2.5). LSTs represent the maximum
emissions from a project that are not expected to cause or contribute to an exceedance of the most

Gladstone Seniors AQ
- 17 -
stringent applicable federal or state ambient air quality standard, and are developed based on the
ambient concentrations of that pollutant for each source receptor area and distance to the nearest
sensitive receptor.
LST screening tables are available for 25, 50, 100, 200 and 500 meter source-receptor distances.
For this project, the nearest sensitive receptors are the residential uses adjacent to the project site
such that the most conservative 25 meter distance was modeled.
The SCAQMD has issued guidance on applying CalEEMod to LSTs. LST pollutant screening
level concentration data is currently published for 1, 2 and 5 acre sites for varying distances. For
this project, the most stringent thresholds for a 1 acre site were applied. The following thresholds
and emissions in Table 8 are therefore determined (pounds per day):
Table 8
LST and Project Emissions (pounds/day)
LST 1 acre/25 meters
East San Gabriel Valley CO NOx PM-10 PM-2.5
LST Thresholds 623 89 5 3
Max On-Site Emissions
Unmitigated 17 27 6 3
Mitigated 17 27 3 2
Exceeds Threshold? No No No No CalEEMod Output in Appendix
LSTs were compared to the maximum daily construction activities. As seen above, emissions will meet the LST for construction thresholds with the application of the following mitigation measure:
Exposed surfaces will be watered two times per day during grading activities LST impacts are less-than-significant with the application of this mitigation measure.
OPERATIONAL IMPACTS
Operational emissions were calculated using CalEEMod2016.3.1 for an assumed project opening
year of 2019. Trip rates were provided in the project traffic report. The traffic report predicts that
the project will generate 206 new daily trips. Although some trips are off-set by the existing three
homes, the worst-case assumption that all trips are new was quantified since results are much less
than significant.
In addition to mobile sources from vehicles, general development causes smaller amounts of “area
source” air pollution to be generated from on-site energy consumption and from off-site electrical
generation. These sources represent a minimal percentage of the total project NOx and CO
burdens, and a few percent other pollutants. The inclusion of such emissions adds negligibly to
the total significant project-related emissions burden as shown in Table 9.

Gladstone Seniors AQ
- 18 -
Table 9
Daily Operational Impacts
Operational Emissions (lbs/day)
Source ROG NOx CO SO2 PM-10 PM-2.5
Area 17.2 1.3 35.5 0.1 4.6 4.6
Energy 0.0 0.3 0.1 0.0 0.1 0.0
Mobile 0.5 2.2 6.1 0.0 1.5 0.4
Total 17.7 3.8 41.7 0.1 6.2 5.0
SCAQMD Threshold 55 55 550 150 150 55
Exceeds Threshold? No No No No No No
Source: CalEEMod2016.3.1 Output in Appendix
As seen in Table 9, the project would not cause any operational emissions to exceed their
respective SCAQMD CEQA significance thresholds. Operational emission impacts are judged to
be less than significant. No impact mitigation for operational activity emissions is considered
necessary to support this finding.
CONSTRUCTION EMISSIONS MINIMIZATION
Construction activities are not anticipated to cause dust emissions to exceed SCAQMD CEQA
thresholds. Nevertheless, emissions minimization through enhanced dust control measures is
recommended for use because of the non-attainment status of the air basin. Recommended
measures include:
Fugitive Dust Control
Apply soil stabilizers or moisten inactive areas.
Water exposed surfaces as needed to avoid visible dust leaving the construction site
(typically 2-3 times/day).
Cover all stock piles with tarps at the end of each day or as needed.
Provide water spray during loading and unloading of earthen materials.
Minimize in-out traffic from construction zone
Cover all trucks hauling dirt, sand, or loose material and require all trucks to maintain at
least two feet of freeboard
Sweep streets daily if visible soil material is carried out from the construction site
Similarly, ozone precursor emissions (ROG and NOx) are calculated to be below SCAQMD
CEQA thresholds. However, because of the regional non-attainment for photochemical smog, the
use of reasonably available control measures for diesel exhaust is recommended. Combustion
emissions control options include:

Gladstone Seniors AQ
- 19 -
Exhaust Emissions Control
Utilize well-tuned off-road construction equipment.
Establish a preference for contractors using Tier 3 or better rated heavy equipment.
Enforce 5-minute idling limits for both on-road trucks and off-road equipment.

Gladstone Seniors AQ
- 20 -
GREENHOUSE GAS EMISSIONS
“Greenhouse gases” (so called because of their role in trapping heat near the surface of the earth)
emitted by human activity are implicated in global climate change, commonly referred to as
“global warming.” These greenhouse gases contribute to an increase in the temperature of the
earth’s atmosphere by transparency to short wavelength visible sunlight, but near opacity to
outgoing terrestrial long wavelength heat radiation in some parts of the infrared spectrum. The
principal greenhouse gases (GHGs) are carbon dioxide, methane, nitrous oxide, ozone, and water
vapor. For purposes of planning and regulation, Section 15364.5 of the California Code of
Regulations defines GHGs to include carbon dioxide, methane, nitrous oxide, hydrofluorocarbons,
perfluorocarbons and sulfur hexafluoride. Fossil fuel consumption in the transportation sector (on-
road motor vehicles, off-highway mobile sources, and aircraft) is the single largest source of GHG
emissions, accounting for approximately half of GHG emissions globally. Industrial and
commercial sources are the second largest contributors of GHG emissions with about one-fourth
of total emissions.
California has passed several bills and the Governor has signed at least three executive orders
regarding greenhouse gases. GHG statues and executive orders (EO) include AB 32, SB 1368,
EO S-03-05, EO S-20-06 and EO S-01-07.
AB 32 is one of the most significant pieces of environmental legislation that California has
adopted. Among other things, it is designed to maintain California’s reputation as a “national and
international leader on energy conservation and environmental stewardship.” It will have wide-
ranging effects on California businesses and lifestyles as well as far reaching effects on other states
and countries. A unique aspect of AB 32, beyond its broad and wide-ranging mandatory provisions
and dramatic GHG reductions are the short time frames within which it must be implemented.
Major components of the AB 32 include:
Require the monitoring and reporting of GHG emissions beginning with sources or
categories of sources that contribute the most to statewide emissions.
Requires immediate “early action” control programs on the most readily controlled GHG
sources.
Mandates that by 2020, California’s GHG emissions be reduced to 1990 levels.
Forces an overall reduction of GHG gases in California by 25-40%, from business as usual,
to be achieved by 2020.
Must complement efforts to achieve and maintain federal and state ambient air quality
standards and to reduce toxic air contaminants.
Statewide, the framework for developing the implementing regulations for AB 32 is under way.
Maximum GHG reductions are expected to derive from increased vehicle fuel efficiency, from
greater use of renewable energy and from increased structural energy efficiency. Additionally,
through the California Climate Action Registry (CCAR now called the Climate Action Reserve),
general and industry-specific protocols for assessing and reporting GHG emissions have been

Gladstone Seniors AQ
- 21 -
developed. GHG sources are categorized into direct sources (i.e. company owned) and indirect
sources (i.e. not company owned). Direct sources include combustion emissions from on-and off-
road mobile sources, and fugitive emissions. Indirect sources include off-site electricity generation
and non-company owned mobile sources.
THRESHOLDS OF SIGNIFICANCE
In response to the requirements of SB97, the State Resources Agency developed guidelines for the
treatment of GHG emissions under CEQA. These new guidelines became state laws as part of
Title 14 of the California Code of Regulations in March, 2010. The CEQA Appendix G guidelines
were modified to include GHG as a required analysis element. A project would have a potentially
significant impact if it:
Generates GHG emissions, directly or indirectly, that may have a significant impact on the
environment, or,
Conflicts with an applicable plan, policy or regulation adopted to reduce GHG emissions.
Section 15064.4 of the Code specifies how significance of GHG emissions is to be evaluated. The
process is broken down into quantification of project-related GHG emissions, making a
determination of significance, and specification of any appropriate mitigation if impacts are found
to be potentially significant. At each of these steps, the new GHG guidelines afford the lead agency
with substantial flexibility.
Emissions identification may be quantitative, qualitative or based on performance standards.
CEQA guidelines allow the lead agency to “select the model or methodology it considers most
appropriate.” The most common practice for transportation/combustion GHG emissions
quantification is to use a computer model such as CalEEMod, as was used in the ensuing analysis.
The significance of those emissions then must be evaluated; the selection of a threshold of
significance must take into consideration what level of GHG emissions would be cumulatively
considerable. The guidelines are clear that they do not support a zero net emissions threshold. If
the lead agency does not have sufficient expertise in evaluating GHG impacts, it may rely on
thresholds adopted by an agency with greater expertise.
On December 5, 2008 the SCAQMD Governing Board adopted an Interim quantitative GHG
Significance Threshold for industrial projects where the SCAQMD is the lead agency (e.g.,
stationary source permit projects, rules, plans, etc.) of 10,000 Metric Tons (MT) CO2
equivalent/year CO2e. In September 2010, the SCAQMD CEQA Significance Thresholds GHG
Working Group released revisions which recommended a threshold of 3,000 MT CO2e for all land
use projects. This 3,000 MT/year recommendation has been used as a guideline for this analysis.
In the absence of an adopted numerical threshold of significance, project related GHG emissions
in excess of the guideline level are presumed to trigger a requirement for enhanced GHG reduction
at the project level.
Gladstone Seniors AQ
- 22 -
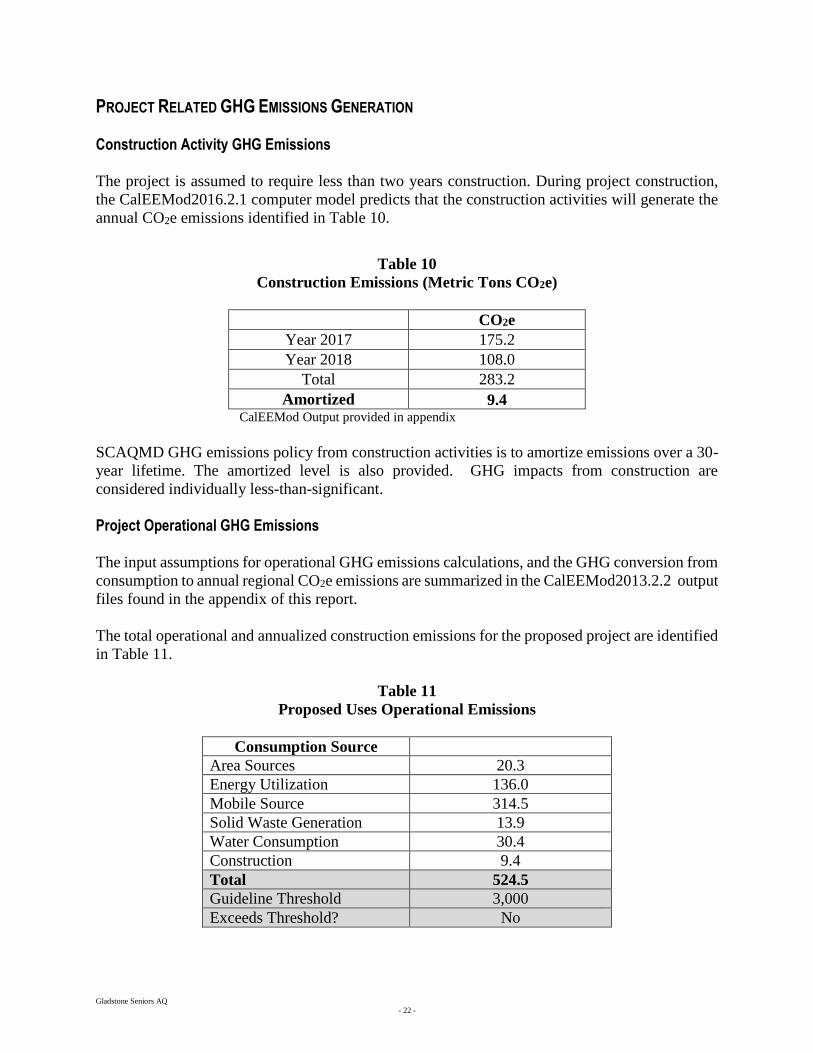
PROJECT RELATED GHG EMISSIONS GENERATION Construction Activity GHG Emissions
The project is assumed to require less than two years construction. During project construction,
the CalEEMod2016.2.1 computer model predicts that the construction activities will generate the
annual CO2e emissions identified in Table 10.
Table 10
Construction Emissions (Metric Tons CO2e)
CO2e
Year 2017 175.2
Year 2018 108.0
Total 283.2
Amortized 9.4 CalEEMod Output provided in appendix
SCAQMD GHG emissions policy from construction activities is to amortize emissions over a 30-
year lifetime. The amortized level is also provided. GHG impacts from construction are
considered individually less-than-significant.
Project Operational GHG Emissions
The input assumptions for operational GHG emissions calculations, and the GHG conversion from
consumption to annual regional CO2e emissions are summarized in the CalEEMod2013.2.2 output
files found in the appendix of this report.
The total operational and annualized construction emissions for the proposed project are identified
in Table 11.
Table 11
Proposed Uses Operational Emissions
Consumption Source
Area Sources 20.3
Energy Utilization 136.0
Mobile Source 314.5
Solid Waste Generation 13.9
Water Consumption 30.4
Construction 9.4
Total 524.5
Guideline Threshold 3,000
Exceeds Threshold? No
Gladstone Seniors AQ
- 23 -
Total project GHG emissions would be substantially below the proposed significance threshold of
3,000 MT suggested by the SCAQMD. Hence, the project would not result in generation of a
significant level of greenhouse gases.
CONSISTENCY WITH GHG PLANS, PROGRAMS AND POLICIES
The City of Azusa programs pertaining to greenhouse gas emissions are included in Natural
Environment Chapter of the City’s General Plan. These programs include the following, among
others:
AQ2 Land Use Patterns Encouraging Alternative Transportation
Encourage land use patterns that enable people to use alternative transportation methods such as
transit, walking, and cycling in their day-to-day activities. Expand opportunities for people to live
and work in close proximity.
AQ3 Promote Mixed-Use Development
Promote mixed-use development that provides commercial services close to residential zones and
employment centers, enabling citizens to walk or bicycle to services rather than drive. AQ5
Provide Sidewalks, Bicycle Lanes, and Bus Shelters
The City of Azusa has not yet developed a Greenhouse Gas Reduction Plan specific to new
residential development. The applicable GHG planning document is AB-32. As discussed above,
the project is not expected to result in a significant increase in GHG emissions. As a result, the
project results in GHG emissions below the recommended SCAQMD 3,000 ton threshold.
Therefore, the project would not conflict with any applicable plan, policy, or regulation to reduce
GHG emissions.

Gladstone Seniors AQ
- 24 -
CALEEMOD2016.3.1 COMPUTER MODEL OUTPUT
DAILY EMISISONS
ANNUAL EMISSIONS

Project Characteristics -
Land Use - 1.23 acre lot
Construction Phase - Demo: 20 days, Grading: 4 days, Construction: 200 days, Paving: 10 days
Demolition - 7500 sf demo
Vehicle Trips - trip generation rates per traffic report
Construction Off-road Equipment Mitigation -
Area Mitigation -
1.1 Land Usage
Land Uses Size Metric Lot Acreage Floor Surface Area Population
Apartments Mid Rise 60.00 Dwelling Unit 1.23 60,000.00 172
1.2 Other Project Characteristics
Urbanization
Climate Zone
Urban
9
Wind Speed (m/s) Precipitation Freq (Days)2.2 31
1.3 User Entered Comments & Non-Default Data
1.0 Project Characteristics
Utility Company Southern California Edison
2019Operational Year
CO2 Intensity (lb/MWhr)
702.44 0.029CH4 Intensity (lb/MWhr)
0.006N2O Intensity (lb/MWhr)
Gladstone Seniors AzusaSouth Coast Air Basin, Summer
CalEEMod Version: CalEEMod.2016.3.1 Date: 6/14/2017 3:45 PMPage 1 of 25
Gladstone Seniors Azusa - South Coast Air Basin, Summer

2.0 Emissions Summary
Table Name Column Name Default Value New Value
tblConstDustMitigation WaterUnpavedRoadVehicleSpeed 40 0
tblConstructionPhase PhaseEndDate 6/13/2017 5/8/2018
tblConstructionPhase PhaseEndDate 6/13/2017 4/23/2018
tblConstructionPhase PhaseEndDate 6/13/2017 7/11/2017
tblConstructionPhase PhaseEndDate 6/13/2017 7/17/2017
tblConstructionPhase PhaseEndDate 6/13/2017 5/8/2018
tblConstructionPhase PhaseStartDate 6/14/2017 4/25/2018
tblConstructionPhase PhaseStartDate 6/14/2017 7/18/2017
tblConstructionPhase PhaseStartDate 6/14/2017 7/12/2017
tblConstructionPhase PhaseStartDate 6/14/2017 4/25/2018
tblLandUse LotAcreage 1.58 1.23
tblProjectCharacteristics OperationalYear 2018 2019
tblVehicleTrips ST_TR 6.39 3.44
tblVehicleTrips SU_TR 5.86 3.44
tblVehicleTrips WD_TR 6.65 3.44
CalEEMod Version: CalEEMod.2016.3.1 Date: 6/14/2017 3:45 PMPage 2 of 25
Gladstone Seniors Azusa - South Coast Air Basin, Summer
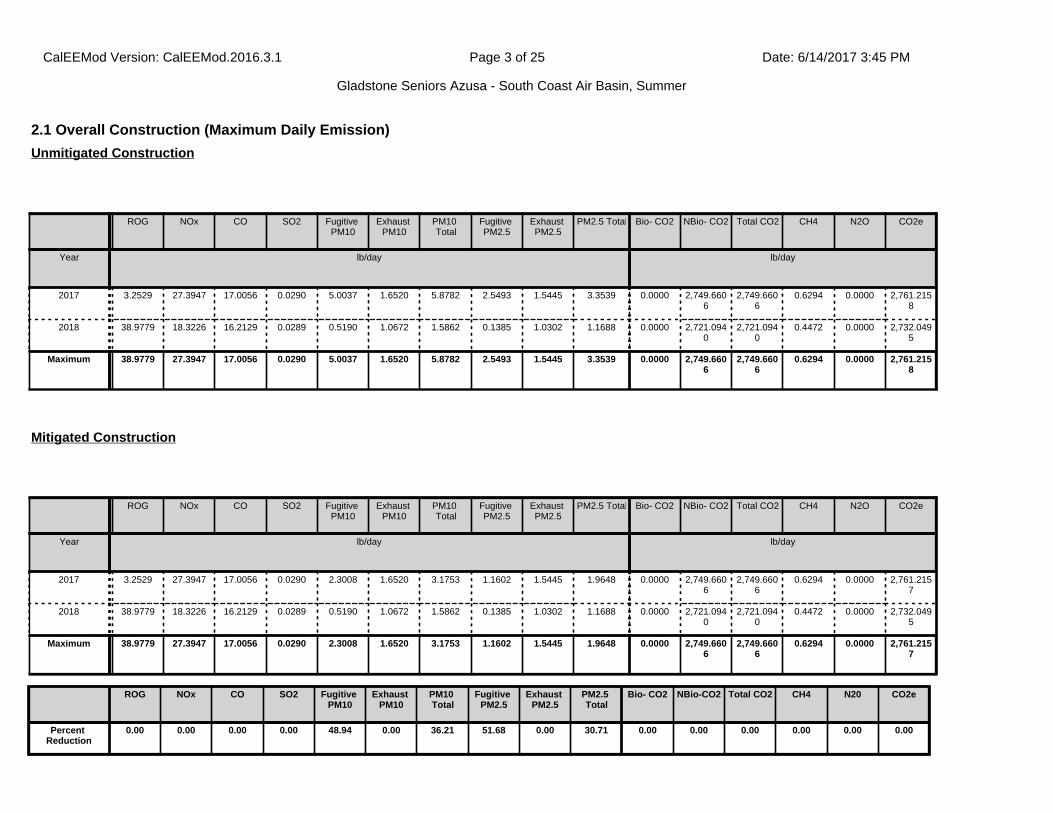
2.1 Overall Construction (Maximum Daily Emission)
ROG NOx CO SO2 Fugitive PM10
Exhaust PM10
PM10 Total
Fugitive PM2.5
Exhaust PM2.5
PM2.5 Total Bio- CO2 NBio- CO2 Total CO2 CH4 N2O CO2e
Year lb/day lb/day
2017 3.2529 27.3947 17.0056 0.0290 5.0037 1.6520 5.8782 2.5493 1.5445 3.3539 0.0000 2,749.6606
2,749.6606
0.6294 0.0000 2,761.2158
2018 38.9779 18.3226 16.2129 0.0289 0.5190 1.0672 1.5862 0.1385 1.0302 1.1688 0.0000 2,721.0940
2,721.0940
0.4472 0.0000 2,732.0495
Maximum 38.9779 27.3947 17.0056 0.0290 5.0037 1.6520 5.8782 2.5493 1.5445 3.3539 0.0000 2,749.6606
2,749.6606
0.6294 0.0000 2,761.2158
Unmitigated Construction
ROG NOx CO SO2 Fugitive PM10
Exhaust PM10
PM10 Total
Fugitive PM2.5
Exhaust PM2.5
PM2.5 Total Bio- CO2 NBio- CO2 Total CO2 CH4 N2O CO2e
Year lb/day lb/day
2017 3.2529 27.3947 17.0056 0.0290 2.3008 1.6520 3.1753 1.1602 1.5445 1.9648 0.0000 2,749.6606
2,749.6606
0.6294 0.0000 2,761.2157
2018 38.9779 18.3226 16.2129 0.0289 0.5190 1.0672 1.5862 0.1385 1.0302 1.1688 0.0000 2,721.0940
2,721.0940
0.4472 0.0000 2,732.0495
Maximum 38.9779 27.3947 17.0056 0.0290 2.3008 1.6520 3.1753 1.1602 1.5445 1.9648 0.0000 2,749.6606
2,749.6606
0.6294 0.0000 2,761.2157
Mitigated Construction
ROG NOx CO SO2 Fugitive PM10
Exhaust PM10
PM10 Total
Fugitive PM2.5
Exhaust PM2.5
PM2.5 Total
Bio- CO2 NBio-CO2 Total CO2 CH4 N20 CO2e
Percent Reduction
0.00 0.00 0.00 0.00 48.94 0.00 36.21 51.68 0.00 30.71 0.00 0.00 0.00 0.00 0.00 0.00
CalEEMod Version: CalEEMod.2016.3.1 Date: 6/14/2017 3:45 PMPage 3 of 25
Gladstone Seniors Azusa - South Coast Air Basin, Summer
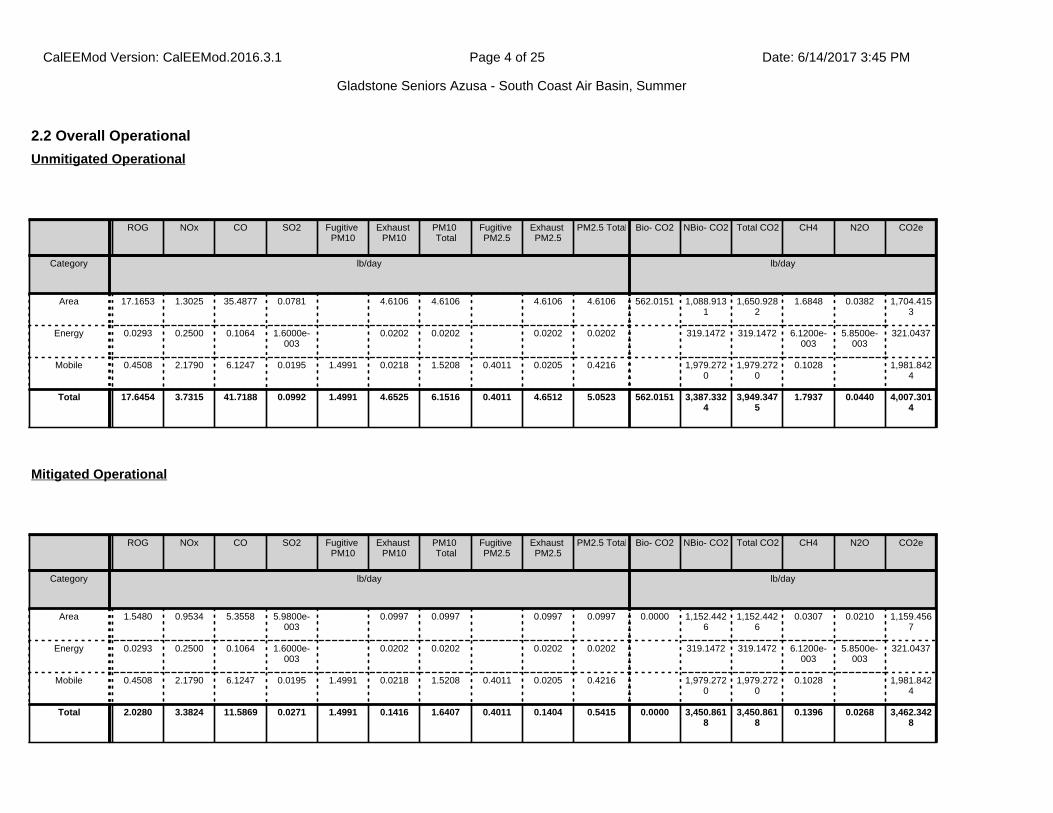
2.2 Overall Operational
ROG NOx CO SO2 Fugitive PM10
Exhaust PM10
PM10 Total
Fugitive PM2.5
Exhaust PM2.5
PM2.5 Total Bio- CO2 NBio- CO2 Total CO2 CH4 N2O CO2e
Category lb/day lb/day
Area 17.1653 1.3025 35.4877 0.0781 4.6106 4.6106 4.6106 4.6106 562.0151 1,088.9131
1,650.9282
1.6848 0.0382 1,704.4153
Energy 0.0293 0.2500 0.1064 1.6000e-003
0.0202 0.0202 0.0202 0.0202 319.1472 319.1472 6.1200e-003
5.8500e-003
321.0437
Mobile 0.4508 2.1790 6.1247 0.0195 1.4991 0.0218 1.5208 0.4011 0.0205 0.4216 1,979.2720
1,979.2720
0.1028 1,981.8424
Total 17.6454 3.7315 41.7188 0.0992 1.4991 4.6525 6.1516 0.4011 4.6512 5.0523 562.0151 3,387.3324
3,949.3475
1.7937 0.0440 4,007.3014
Unmitigated Operational
ROG NOx CO SO2 Fugitive PM10
Exhaust PM10
PM10 Total
Fugitive PM2.5
Exhaust PM2.5
PM2.5 Total Bio- CO2 NBio- CO2 Total CO2 CH4 N2O CO2e
Category lb/day lb/day
Area 1.5480 0.9534 5.3558 5.9800e-003
0.0997 0.0997 0.0997 0.0997 0.0000 1,152.4426
1,152.4426
0.0307 0.0210 1,159.4567
Energy 0.0293 0.2500 0.1064 1.6000e-003
0.0202 0.0202 0.0202 0.0202 319.1472 319.1472 6.1200e-003
5.8500e-003
321.0437
Mobile 0.4508 2.1790 6.1247 0.0195 1.4991 0.0218 1.5208 0.4011 0.0205 0.4216 1,979.2720
1,979.2720
0.1028 1,981.8424
Total 2.0280 3.3824 11.5869 0.0271 1.4991 0.1416 1.6407 0.4011 0.1404 0.5415 0.0000 3,450.8618
3,450.8618
0.1396 0.0268 3,462.3428
Mitigated Operational
CalEEMod Version: CalEEMod.2016.3.1 Date: 6/14/2017 3:45 PMPage 4 of 25
Gladstone Seniors Azusa - South Coast Air Basin, Summer

3.0 Construction Detail
Construction Phase
Phase Number
Phase Name Phase Type Start Date End Date Num Days Week
Num Days Phase Description
1 Architectural Coating Architectural Coating 4/25/2018 5/8/2018 5 10
2 Building Construction Building Construction 7/18/2017 4/23/2018 5 200
3 Demolition Demolition 6/14/2017 7/11/2017 5 20
4 Grading Grading 7/12/2017 7/17/2017 5 4
5 Paving Paving 4/25/2018 5/8/2018 5 10
OffRoad Equipment
ROG NOx CO SO2 Fugitive PM10
Exhaust PM10
PM10 Total
Fugitive PM2.5
Exhaust PM2.5
PM2.5 Total
Bio- CO2 NBio-CO2 Total CO2 CH4 N20 CO2e
Percent Reduction
88.51 9.36 72.23 72.69 0.00 96.96 73.33 0.00 96.98 89.28 100.00 -1.88 12.62 92.22 39.07 13.60
Residential Indoor: 121,500; Residential Outdoor: 40,500; Non-Residential Indoor: 0; Non-Residential Outdoor: 0; Striped Parking Area: 0 (Architectural Coating – sqft)
Acres of Grading (Site Preparation Phase): 0
Acres of Grading (Grading Phase): 1.5
Acres of Paving: 0
CalEEMod Version: CalEEMod.2016.3.1 Date: 6/14/2017 3:45 PMPage 5 of 25
Gladstone Seniors Azusa - South Coast Air Basin, Summer

Phase Name Offroad Equipment Type Amount Usage Hours Horse Power Load Factor
Architectural Coating Air Compressors 1 6.00 78 0.48
Paving Cement and Mortar Mixers 1 6.00 9 0.56
Demolition Concrete/Industrial Saws 1 8.00 81 0.73
Building Construction Generator Sets 1 8.00 84 0.74
Building Construction Cranes 1 6.00 231 0.29
Building Construction Forklifts 1 6.00 89 0.20
Paving Pavers 1 6.00 130 0.42
Paving Rollers 1 7.00 80 0.38
Demolition Rubber Tired Dozers 1 8.00 247 0.40
Grading Rubber Tired Dozers 1 6.00 247 0.40
Building Construction Tractors/Loaders/Backhoes 1 6.00 97 0.37
Demolition Tractors/Loaders/Backhoes 3 8.00 97 0.37
Grading Tractors/Loaders/Backhoes 1 7.00 97 0.37
Paving Tractors/Loaders/Backhoes 1 8.00 97 0.37
Grading Graders 1 6.00 187 0.41
Paving Paving Equipment 1 8.00 132 0.36
Building Construction Welders 3 8.00 46 0.45
Trips and VMT
Phase Name Offroad Equipment Count
Worker Trip Number
Vendor Trip Number
Hauling Trip Number
Worker Trip Length
Vendor Trip Length
Hauling Trip Length
Worker Vehicle Class
Vendor Vehicle Class
Hauling Vehicle Class
Architectural Coating 1 9.00 0.00 0.00 14.70 6.90 20.00 LD_Mix HDT_Mix HHDT
Building Construction 7 43.00 6.00 0.00 14.70 6.90 20.00 LD_Mix HDT_Mix HHDT
Demolition 5 13.00 0.00 34.00 14.70 6.90 20.00 LD_Mix HDT_Mix HHDT
Grading 3 8.00 0.00 0.00 14.70 6.90 20.00 LD_Mix HDT_Mix HHDT
Paving 5 13.00 0.00 0.00 14.70 6.90 20.00 LD_Mix HDT_Mix HHDT
CalEEMod Version: CalEEMod.2016.3.1 Date: 6/14/2017 3:45 PMPage 6 of 25
Gladstone Seniors Azusa - South Coast Air Basin, Summer

3.2 Architectural Coating - 2018
ROG NOx CO SO2 Fugitive PM10
Exhaust PM10
PM10 Total
Fugitive PM2.5
Exhaust PM2.5
PM2.5 Total Bio- CO2 NBio- CO2 Total CO2 CH4 N2O CO2e
Category lb/day lb/day
Archit. Coating 37.5435 0.0000 0.0000 0.0000 0.0000 0.0000 0.0000
Off-Road 0.2986 2.0058 1.8542 2.9700e-003
0.1506 0.1506 0.1506 0.1506 281.4485 281.4485 0.0267 282.1171
Total 37.8421 2.0058 1.8542 2.9700e-003
0.1506 0.1506 0.1506 0.1506 281.4485 281.4485 0.0267 282.1171
Unmitigated Construction On-Site
3.1 Mitigation Measures Construction
Water Exposed Area
Clean Paved Roads
CalEEMod Version: CalEEMod.2016.3.1 Date: 6/14/2017 3:45 PMPage 7 of 25
Gladstone Seniors Azusa - South Coast Air Basin, Summer
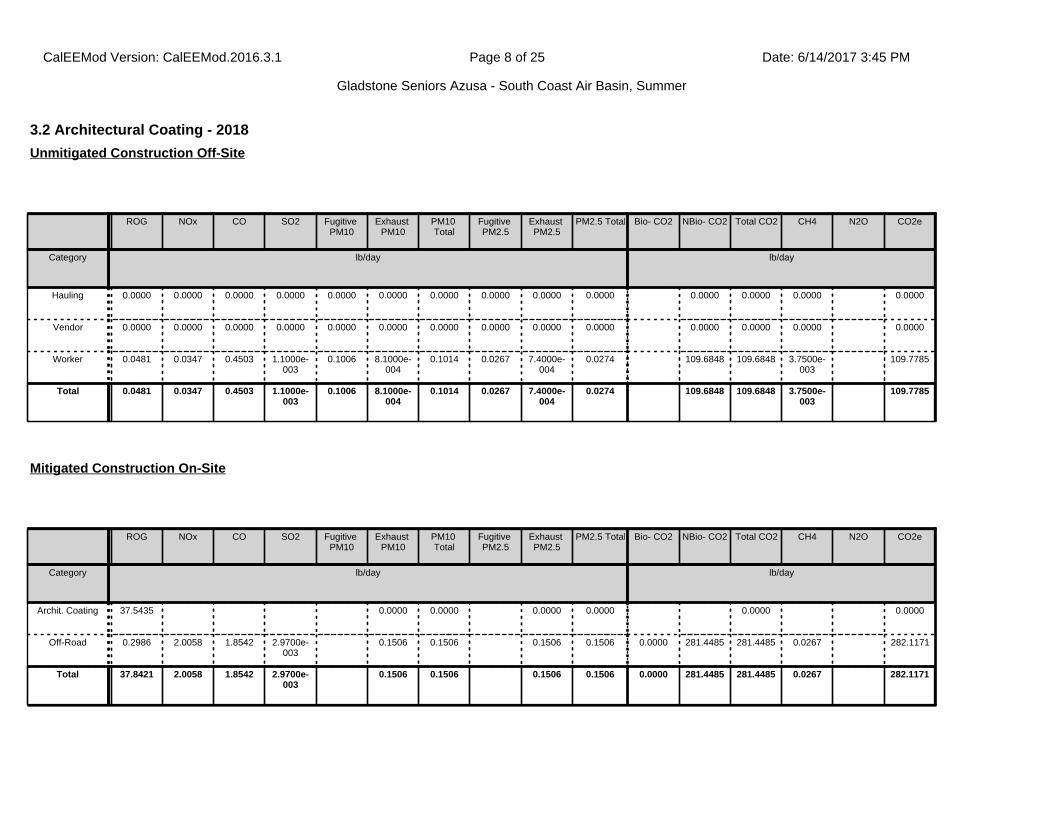
3.2 Architectural Coating - 2018
ROG NOx CO SO2 Fugitive PM10
Exhaust PM10
PM10 Total
Fugitive PM2.5
Exhaust PM2.5
PM2.5 Total Bio- CO2 NBio- CO2 Total CO2 CH4 N2O CO2e
Category lb/day lb/day
Hauling 0.0000 0.0000 0.0000 0.0000 0.0000 0.0000 0.0000 0.0000 0.0000 0.0000 0.0000 0.0000 0.0000 0.0000
Vendor 0.0000 0.0000 0.0000 0.0000 0.0000 0.0000 0.0000 0.0000 0.0000 0.0000 0.0000 0.0000 0.0000 0.0000
Worker 0.0481 0.0347 0.4503 1.1000e-003
0.1006 8.1000e-004
0.1014 0.0267 7.4000e-004
0.0274 109.6848 109.6848 3.7500e-003
109.7785
Total 0.0481 0.0347 0.4503 1.1000e-003
0.1006 8.1000e-004
0.1014 0.0267 7.4000e-004
0.0274 109.6848 109.6848 3.7500e-003
109.7785
Unmitigated Construction Off-Site
ROG NOx CO SO2 Fugitive PM10
Exhaust PM10
PM10 Total
Fugitive PM2.5
Exhaust PM2.5
PM2.5 Total Bio- CO2 NBio- CO2 Total CO2 CH4 N2O CO2e
Category lb/day lb/day
Archit. Coating 37.5435 0.0000 0.0000 0.0000 0.0000 0.0000 0.0000
Off-Road 0.2986 2.0058 1.8542 2.9700e-003
0.1506 0.1506 0.1506 0.1506 0.0000 281.4485 281.4485 0.0267 282.1171
Total 37.8421 2.0058 1.8542 2.9700e-003
0.1506 0.1506 0.1506 0.1506 0.0000 281.4485 281.4485 0.0267 282.1171
Mitigated Construction On-Site
CalEEMod Version: CalEEMod.2016.3.1 Date: 6/14/2017 3:45 PMPage 8 of 25
Gladstone Seniors Azusa - South Coast Air Basin, Summer

3.2 Architectural Coating - 2018
ROG NOx CO SO2 Fugitive PM10
Exhaust PM10
PM10 Total
Fugitive PM2.5
Exhaust PM2.5
PM2.5 Total Bio- CO2 NBio- CO2 Total CO2 CH4 N2O CO2e
Category lb/day lb/day
Hauling 0.0000 0.0000 0.0000 0.0000 0.0000 0.0000 0.0000 0.0000 0.0000 0.0000 0.0000 0.0000 0.0000 0.0000
Vendor 0.0000 0.0000 0.0000 0.0000 0.0000 0.0000 0.0000 0.0000 0.0000 0.0000 0.0000 0.0000 0.0000 0.0000
Worker 0.0481 0.0347 0.4503 1.1000e-003
0.1006 8.1000e-004
0.1014 0.0267 7.4000e-004
0.0274 109.6848 109.6848 3.7500e-003
109.7785
Total 0.0481 0.0347 0.4503 1.1000e-003
0.1006 8.1000e-004
0.1014 0.0267 7.4000e-004
0.0274 109.6848 109.6848 3.7500e-003
109.7785
Mitigated Construction Off-Site
3.3 Building Construction - 2017
ROG NOx CO SO2 Fugitive PM10
Exhaust PM10
PM10 Total
Fugitive PM2.5
Exhaust PM2.5
PM2.5 Total Bio- CO2 NBio- CO2 Total CO2 CH4 N2O CO2e
Category lb/day lb/day
Off-Road 2.9653 19.2365 14.3568 0.0220 1.2313 1.2313 1.1875 1.1875 2,043.8641
2,043.8641
0.4298 2,054.6085
Total 2.9653 19.2365 14.3568 0.0220 1.2313 1.2313 1.1875 1.1875 2,043.8641
2,043.8641
0.4298 2,054.6085
Unmitigated Construction On-Site
CalEEMod Version: CalEEMod.2016.3.1 Date: 6/14/2017 3:45 PMPage 9 of 25
Gladstone Seniors Azusa - South Coast Air Basin, Summer

3.3 Building Construction - 2017
ROG NOx CO SO2 Fugitive PM10
Exhaust PM10
PM10 Total
Fugitive PM2.5
Exhaust PM2.5
PM2.5 Total Bio- CO2 NBio- CO2 Total CO2 CH4 N2O CO2e
Category lb/day lb/day
Hauling 0.0000 0.0000 0.0000 0.0000 0.0000 0.0000 0.0000 0.0000 0.0000 0.0000 0.0000 0.0000 0.0000 0.0000
Vendor 0.0294 0.7764 0.2054 1.5600e-003
0.0384 6.7300e-003
0.0451 0.0111 6.4300e-003
0.0175 166.7145 166.7145 0.0121 167.0165
Worker 0.2582 0.1901 2.4434 5.4200e-003
0.4806 3.9900e-003
0.4846 0.1275 3.6800e-003
0.1312 539.0819 539.0819 0.0204 539.5908
Total 0.2876 0.9665 2.6488 6.9800e-003
0.5190 0.0107 0.5298 0.1385 0.0101 0.1486 705.7965 705.7965 0.0324 706.6073
Unmitigated Construction Off-Site
ROG NOx CO SO2 Fugitive PM10
Exhaust PM10
PM10 Total
Fugitive PM2.5
Exhaust PM2.5
PM2.5 Total Bio- CO2 NBio- CO2 Total CO2 CH4 N2O CO2e
Category lb/day lb/day
Off-Road 2.9653 19.2365 14.3568 0.0220 1.2313 1.2313 1.1875 1.1875 0.0000 2,043.8641
2,043.8641
0.4298 2,054.6085
Total 2.9653 19.2365 14.3568 0.0220 1.2313 1.2313 1.1875 1.1875 0.0000 2,043.8641
2,043.8641
0.4298 2,054.6085
Mitigated Construction On-Site
CalEEMod Version: CalEEMod.2016.3.1 Date: 6/14/2017 3:45 PMPage 10 of 25
Gladstone Seniors Azusa - South Coast Air Basin, Summer

3.3 Building Construction - 2017
ROG NOx CO SO2 Fugitive PM10
Exhaust PM10
PM10 Total
Fugitive PM2.5
Exhaust PM2.5
PM2.5 Total Bio- CO2 NBio- CO2 Total CO2 CH4 N2O CO2e
Category lb/day lb/day
Hauling 0.0000 0.0000 0.0000 0.0000 0.0000 0.0000 0.0000 0.0000 0.0000 0.0000 0.0000 0.0000 0.0000 0.0000
Vendor 0.0294 0.7764 0.2054 1.5600e-003
0.0384 6.7300e-003
0.0451 0.0111 6.4300e-003
0.0175 166.7145 166.7145 0.0121 167.0165
Worker 0.2582 0.1901 2.4434 5.4200e-003
0.4806 3.9900e-003
0.4846 0.1275 3.6800e-003
0.1312 539.0819 539.0819 0.0204 539.5908
Total 0.2876 0.9665 2.6488 6.9800e-003
0.5190 0.0107 0.5298 0.1385 0.0101 0.1486 705.7965 705.7965 0.0324 706.6073
Mitigated Construction Off-Site
3.3 Building Construction - 2018
ROG NOx CO SO2 Fugitive PM10
Exhaust PM10
PM10 Total
Fugitive PM2.5
Exhaust PM2.5
PM2.5 Total Bio- CO2 NBio- CO2 Total CO2 CH4 N2O CO2e
Category lb/day lb/day
Off-Road 2.5919 17.4280 13.8766 0.0220 1.0580 1.0580 1.0216 1.0216 2,030.8389
2,030.8389
0.4088 2,041.0596
Total 2.5919 17.4280 13.8766 0.0220 1.0580 1.0580 1.0216 1.0216 2,030.8389
2,030.8389
0.4088 2,041.0596
Unmitigated Construction On-Site
CalEEMod Version: CalEEMod.2016.3.1 Date: 6/14/2017 3:45 PMPage 11 of 25
Gladstone Seniors Azusa - South Coast Air Basin, Summer
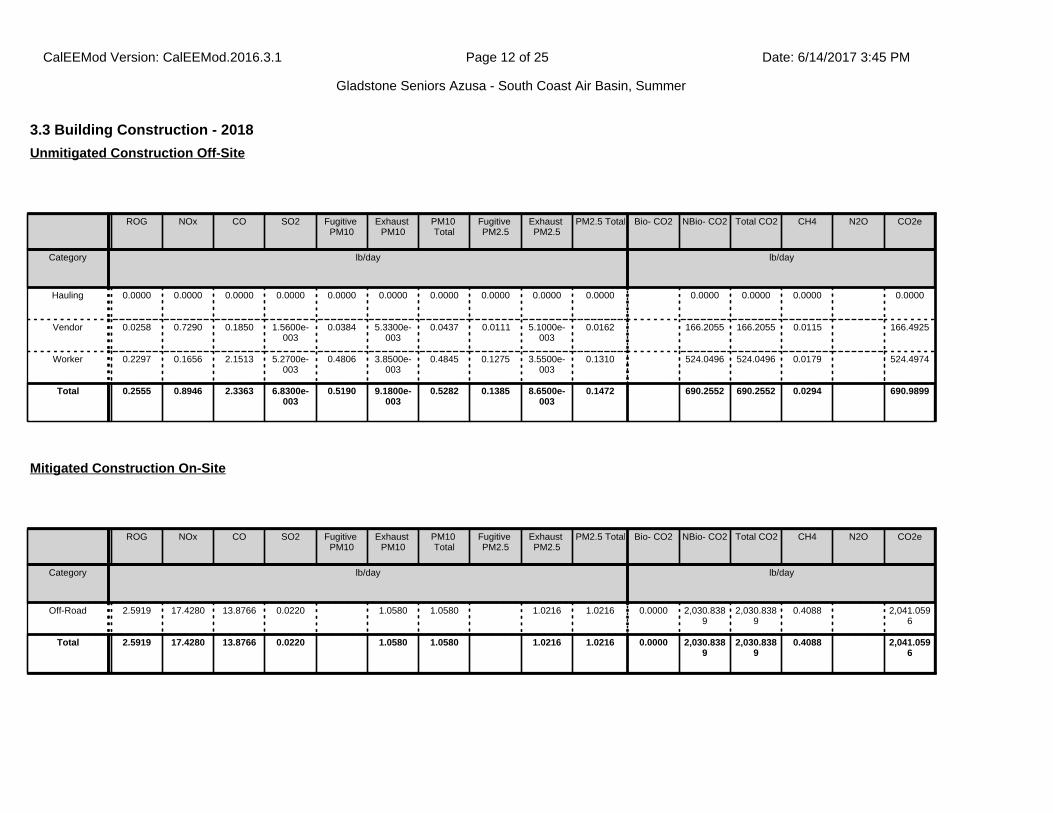
3.3 Building Construction - 2018
ROG NOx CO SO2 Fugitive PM10
Exhaust PM10
PM10 Total
Fugitive PM2.5
Exhaust PM2.5
PM2.5 Total Bio- CO2 NBio- CO2 Total CO2 CH4 N2O CO2e
Category lb/day lb/day
Hauling 0.0000 0.0000 0.0000 0.0000 0.0000 0.0000 0.0000 0.0000 0.0000 0.0000 0.0000 0.0000 0.0000 0.0000
Vendor 0.0258 0.7290 0.1850 1.5600e-003
0.0384 5.3300e-003
0.0437 0.0111 5.1000e-003
0.0162 166.2055 166.2055 0.0115 166.4925
Worker 0.2297 0.1656 2.1513 5.2700e-003
0.4806 3.8500e-003
0.4845 0.1275 3.5500e-003
0.1310 524.0496 524.0496 0.0179 524.4974
Total 0.2555 0.8946 2.3363 6.8300e-003
0.5190 9.1800e-003
0.5282 0.1385 8.6500e-003
0.1472 690.2552 690.2552 0.0294 690.9899
Unmitigated Construction Off-Site
ROG NOx CO SO2 Fugitive PM10
Exhaust PM10
PM10 Total
Fugitive PM2.5
Exhaust PM2.5
PM2.5 Total Bio- CO2 NBio- CO2 Total CO2 CH4 N2O CO2e
Category lb/day lb/day
Off-Road 2.5919 17.4280 13.8766 0.0220 1.0580 1.0580 1.0216 1.0216 0.0000 2,030.8389
2,030.8389
0.4088 2,041.0596
Total 2.5919 17.4280 13.8766 0.0220 1.0580 1.0580 1.0216 1.0216 0.0000 2,030.8389
2,030.8389
0.4088 2,041.0596
Mitigated Construction On-Site
CalEEMod Version: CalEEMod.2016.3.1 Date: 6/14/2017 3:45 PMPage 12 of 25
Gladstone Seniors Azusa - South Coast Air Basin, Summer

3.3 Building Construction - 2018
ROG NOx CO SO2 Fugitive PM10
Exhaust PM10
PM10 Total
Fugitive PM2.5
Exhaust PM2.5
PM2.5 Total Bio- CO2 NBio- CO2 Total CO2 CH4 N2O CO2e
Category lb/day lb/day
Hauling 0.0000 0.0000 0.0000 0.0000 0.0000 0.0000 0.0000 0.0000 0.0000 0.0000 0.0000 0.0000 0.0000 0.0000
Vendor 0.0258 0.7290 0.1850 1.5600e-003
0.0384 5.3300e-003
0.0437 0.0111 5.1000e-003
0.0162 166.2055 166.2055 0.0115 166.4925
Worker 0.2297 0.1656 2.1513 5.2700e-003
0.4806 3.8500e-003
0.4845 0.1275 3.5500e-003
0.1310 524.0496 524.0496 0.0179 524.4974
Total 0.2555 0.8946 2.3363 6.8300e-003
0.5190 9.1800e-003
0.5282 0.1385 8.6500e-003
0.1472 690.2552 690.2552 0.0294 690.9899
Mitigated Construction Off-Site
3.4 Demolition - 2017
ROG NOx CO SO2 Fugitive PM10
Exhaust PM10
PM10 Total
Fugitive PM2.5
Exhaust PM2.5
PM2.5 Total Bio- CO2 NBio- CO2 Total CO2 CH4 N2O CO2e
Category lb/day lb/day
Fugitive Dust 0.3691 0.0000 0.3691 0.0559 0.0000 0.0559 0.0000 0.0000
Off-Road 2.7625 26.7594 15.5573 0.0241 1.6477 1.6477 1.5404 1.5404 2,421.4229
2,421.4229
0.6125 2,436.7347
Total 2.7625 26.7594 15.5573 0.0241 0.3691 1.6477 2.0168 0.0559 1.5404 1.5963 2,421.4229
2,421.4229
0.6125 2,436.7347
Unmitigated Construction On-Site
CalEEMod Version: CalEEMod.2016.3.1 Date: 6/14/2017 3:45 PMPage 13 of 25
Gladstone Seniors Azusa - South Coast Air Basin, Summer

3.4 Demolition - 2017
ROG NOx CO SO2 Fugitive PM10
Exhaust PM10
PM10 Total
Fugitive PM2.5
Exhaust PM2.5
PM2.5 Total Bio- CO2 NBio- CO2 Total CO2 CH4 N2O CO2e
Category lb/day lb/day
Hauling 0.0178 0.5778 0.1109 1.3700e-003
0.0297 3.1400e-003
0.0328 8.1400e-003
3.0000e-003
0.0111 147.6295 147.6295 0.0108 147.8984
Vendor 0.0000 0.0000 0.0000 0.0000 0.0000 0.0000 0.0000 0.0000 0.0000 0.0000 0.0000 0.0000 0.0000 0.0000
Worker 0.0781 0.0575 0.7387 1.6400e-003
0.1453 1.2100e-003
0.1465 0.0385 1.1100e-003
0.0397 162.9783 162.9783 6.1500e-003
163.1321
Total 0.0958 0.6353 0.8496 3.0100e-003
0.1750 4.3500e-003
0.1794 0.0467 4.1100e-003
0.0508 310.6077 310.6077 0.0169 311.0305
Unmitigated Construction Off-Site
ROG NOx CO SO2 Fugitive PM10
Exhaust PM10
PM10 Total
Fugitive PM2.5
Exhaust PM2.5
PM2.5 Total Bio- CO2 NBio- CO2 Total CO2 CH4 N2O CO2e
Category lb/day lb/day
Fugitive Dust 0.1661 0.0000 0.1661 0.0252 0.0000 0.0252 0.0000 0.0000
Off-Road 2.7625 26.7594 15.5573 0.0241 1.6477 1.6477 1.5404 1.5404 0.0000 2,421.4229
2,421.4229
0.6125 2,436.7347
Total 2.7625 26.7594 15.5573 0.0241 0.1661 1.6477 1.8138 0.0252 1.5404 1.5655 0.0000 2,421.4229
2,421.4229
0.6125 2,436.7347
Mitigated Construction On-Site
CalEEMod Version: CalEEMod.2016.3.1 Date: 6/14/2017 3:45 PMPage 14 of 25
Gladstone Seniors Azusa - South Coast Air Basin, Summer

3.4 Demolition - 2017
ROG NOx CO SO2 Fugitive PM10
Exhaust PM10
PM10 Total
Fugitive PM2.5
Exhaust PM2.5
PM2.5 Total Bio- CO2 NBio- CO2 Total CO2 CH4 N2O CO2e
Category lb/day lb/day
Hauling 0.0178 0.5778 0.1109 1.3700e-003
0.0297 3.1400e-003
0.0328 8.1400e-003
3.0000e-003
0.0111 147.6295 147.6295 0.0108 147.8984
Vendor 0.0000 0.0000 0.0000 0.0000 0.0000 0.0000 0.0000 0.0000 0.0000 0.0000 0.0000 0.0000 0.0000 0.0000
Worker 0.0781 0.0575 0.7387 1.6400e-003
0.1453 1.2100e-003
0.1465 0.0385 1.1100e-003
0.0397 162.9783 162.9783 6.1500e-003
163.1321
Total 0.0958 0.6353 0.8496 3.0100e-003
0.1750 4.3500e-003
0.1794 0.0467 4.1100e-003
0.0508 310.6077 310.6077 0.0169 311.0305
Mitigated Construction Off-Site
3.5 Grading - 2017
ROG NOx CO SO2 Fugitive PM10
Exhaust PM10
PM10 Total
Fugitive PM2.5
Exhaust PM2.5
PM2.5 Total Bio- CO2 NBio- CO2 Total CO2 CH4 N2O CO2e
Category lb/day lb/day
Fugitive Dust 4.9143 0.0000 4.9143 2.5256 0.0000 2.5256 0.0000 0.0000
Off-Road 1.6023 18.2915 7.0342 0.0141 0.8738 0.8738 0.8039 0.8039 1,444.8958
1,444.8958
0.4427 1,455.9636
Total 1.6023 18.2915 7.0342 0.0141 4.9143 0.8738 5.7880 2.5256 0.8039 3.3295 1,444.8958
1,444.8958
0.4427 1,455.9636
Unmitigated Construction On-Site
CalEEMod Version: CalEEMod.2016.3.1 Date: 6/14/2017 3:45 PMPage 15 of 25
Gladstone Seniors Azusa - South Coast Air Basin, Summer

3.5 Grading - 2017
ROG NOx CO SO2 Fugitive PM10
Exhaust PM10
PM10 Total
Fugitive PM2.5
Exhaust PM2.5
PM2.5 Total Bio- CO2 NBio- CO2 Total CO2 CH4 N2O CO2e
Category lb/day lb/day
Hauling 0.0000 0.0000 0.0000 0.0000 0.0000 0.0000 0.0000 0.0000 0.0000 0.0000 0.0000 0.0000 0.0000 0.0000
Vendor 0.0000 0.0000 0.0000 0.0000 0.0000 0.0000 0.0000 0.0000 0.0000 0.0000 0.0000 0.0000 0.0000 0.0000
Worker 0.0480 0.0354 0.4546 1.0100e-003
0.0894 7.4000e-004
0.0902 0.0237 6.8000e-004
0.0244 100.2943 100.2943 3.7900e-003
100.3890
Total 0.0480 0.0354 0.4546 1.0100e-003
0.0894 7.4000e-004
0.0902 0.0237 6.8000e-004
0.0244 100.2943 100.2943 3.7900e-003
100.3890
Unmitigated Construction Off-Site
ROG NOx CO SO2 Fugitive PM10
Exhaust PM10
PM10 Total
Fugitive PM2.5
Exhaust PM2.5
PM2.5 Total Bio- CO2 NBio- CO2 Total CO2 CH4 N2O CO2e
Category lb/day lb/day
Fugitive Dust 2.2114 0.0000 2.2114 1.1365 0.0000 1.1365 0.0000 0.0000
Off-Road 1.6023 18.2915 7.0342 0.0141 0.8738 0.8738 0.8039 0.8039 0.0000 1,444.8958
1,444.8958
0.4427 1,455.9636
Total 1.6023 18.2915 7.0342 0.0141 2.2114 0.8738 3.0852 1.1365 0.8039 1.9404 0.0000 1,444.8958
1,444.8958
0.4427 1,455.9636
Mitigated Construction On-Site
CalEEMod Version: CalEEMod.2016.3.1 Date: 6/14/2017 3:45 PMPage 16 of 25
Gladstone Seniors Azusa - South Coast Air Basin, Summer

3.5 Grading - 2017
ROG NOx CO SO2 Fugitive PM10
Exhaust PM10
PM10 Total
Fugitive PM2.5
Exhaust PM2.5
PM2.5 Total Bio- CO2 NBio- CO2 Total CO2 CH4 N2O CO2e
Category lb/day lb/day
Hauling 0.0000 0.0000 0.0000 0.0000 0.0000 0.0000 0.0000 0.0000 0.0000 0.0000 0.0000 0.0000 0.0000 0.0000
Vendor 0.0000 0.0000 0.0000 0.0000 0.0000 0.0000 0.0000 0.0000 0.0000 0.0000 0.0000 0.0000 0.0000 0.0000
Worker 0.0480 0.0354 0.4546 1.0100e-003
0.0894 7.4000e-004
0.0902 0.0237 6.8000e-004
0.0244 100.2943 100.2943 3.7900e-003
100.3890
Total 0.0480 0.0354 0.4546 1.0100e-003
0.0894 7.4000e-004
0.0902 0.0237 6.8000e-004
0.0244 100.2943 100.2943 3.7900e-003
100.3890
Mitigated Construction Off-Site
3.6 Paving - 2018
ROG NOx CO SO2 Fugitive PM10
Exhaust PM10
PM10 Total
Fugitive PM2.5
Exhaust PM2.5
PM2.5 Total
Bio- CO2 NBio- CO2 Total CO2 CH4 N2O CO2e
Category lb/day lb/day
Off-Road 1.0182 10.4525 8.9926 0.0135 0.6097 0.6097 0.5618 0.5618 1,346.4360
1,346.4360
0.4113 1,356.7186
Paving 0.0000 0.0000 0.0000 0.0000 0.0000 0.0000 0.0000
Total 1.0182 10.4525 8.9926 0.0135 0.6097 0.6097 0.5618 0.5618 1,346.4360
1,346.4360
0.4113 1,356.7186
Unmitigated Construction On-Site
CalEEMod Version: CalEEMod.2016.3.1 Date: 6/14/2017 3:45 PMPage 17 of 25
Gladstone Seniors Azusa - South Coast Air Basin, Summer
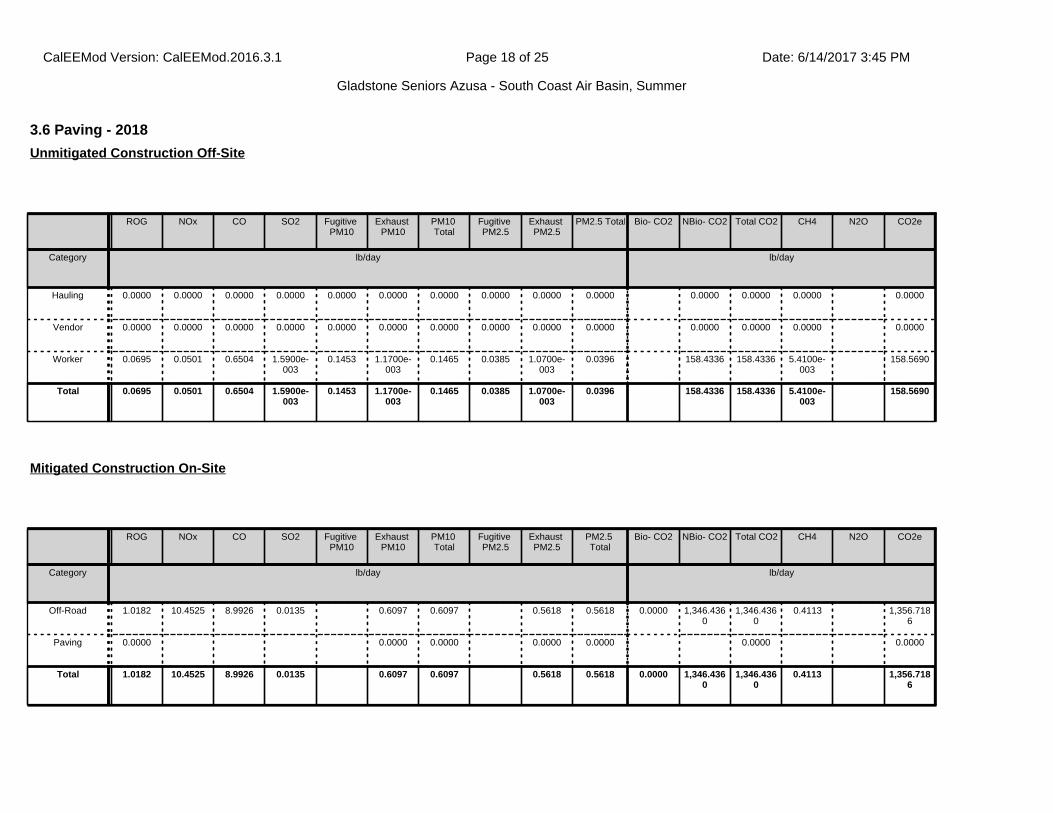
3.6 Paving - 2018
ROG NOx CO SO2 Fugitive PM10
Exhaust PM10
PM10 Total
Fugitive PM2.5
Exhaust PM2.5
PM2.5 Total Bio- CO2 NBio- CO2 Total CO2 CH4 N2O CO2e
Category lb/day lb/day
Hauling 0.0000 0.0000 0.0000 0.0000 0.0000 0.0000 0.0000 0.0000 0.0000 0.0000 0.0000 0.0000 0.0000 0.0000
Vendor 0.0000 0.0000 0.0000 0.0000 0.0000 0.0000 0.0000 0.0000 0.0000 0.0000 0.0000 0.0000 0.0000 0.0000
Worker 0.0695 0.0501 0.6504 1.5900e-003
0.1453 1.1700e-003
0.1465 0.0385 1.0700e-003
0.0396 158.4336 158.4336 5.4100e-003
158.5690
Total 0.0695 0.0501 0.6504 1.5900e-003
0.1453 1.1700e-003
0.1465 0.0385 1.0700e-003
0.0396 158.4336 158.4336 5.4100e-003
158.5690
Unmitigated Construction Off-Site
ROG NOx CO SO2 Fugitive PM10
Exhaust PM10
PM10 Total
Fugitive PM2.5
Exhaust PM2.5
PM2.5 Total
Bio- CO2 NBio- CO2 Total CO2 CH4 N2O CO2e
Category lb/day lb/day
Off-Road 1.0182 10.4525 8.9926 0.0135 0.6097 0.6097 0.5618 0.5618 0.0000 1,346.4360
1,346.4360
0.4113 1,356.7186
Paving 0.0000 0.0000 0.0000 0.0000 0.0000 0.0000 0.0000
Total 1.0182 10.4525 8.9926 0.0135 0.6097 0.6097 0.5618 0.5618 0.0000 1,346.4360
1,346.4360
0.4113 1,356.7186
Mitigated Construction On-Site
CalEEMod Version: CalEEMod.2016.3.1 Date: 6/14/2017 3:45 PMPage 18 of 25
Gladstone Seniors Azusa - South Coast Air Basin, Summer
4.0 Operational Detail - Mobile
4.1 Mitigation Measures Mobile
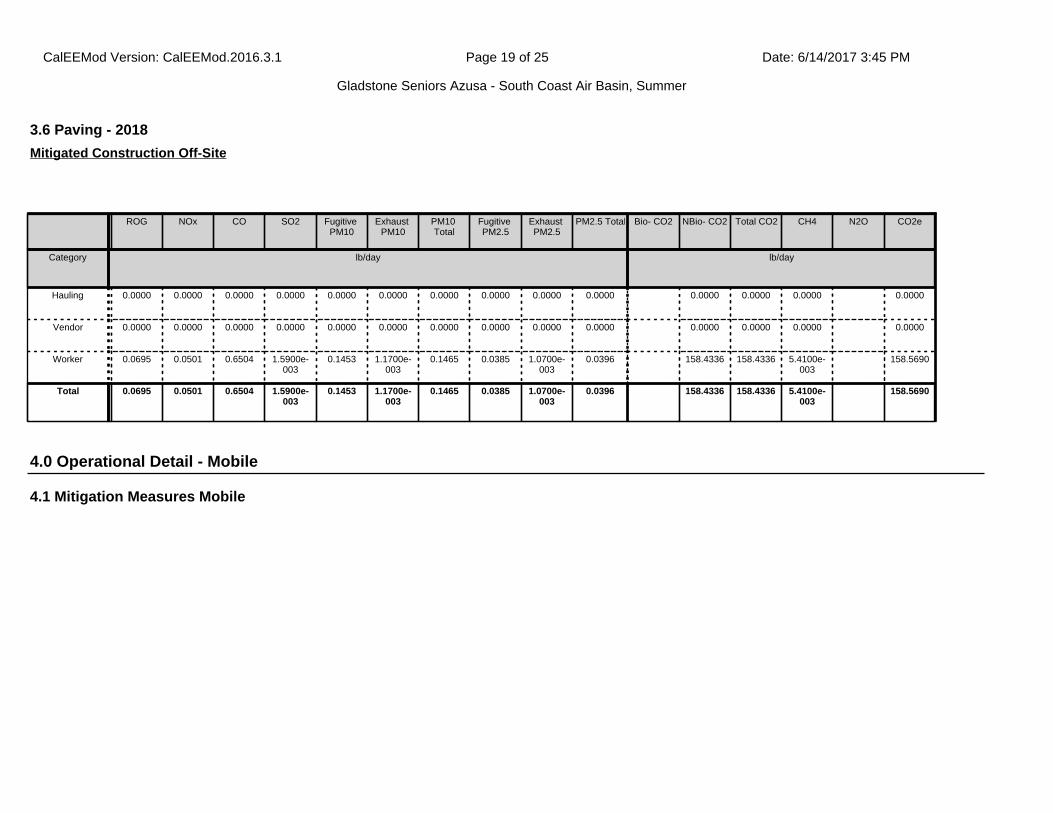
3.6 Paving - 2018
ROG NOx CO SO2 Fugitive PM10
Exhaust PM10
PM10 Total
Fugitive PM2.5
Exhaust PM2.5
PM2.5 Total Bio- CO2 NBio- CO2 Total CO2 CH4 N2O CO2e
Category lb/day lb/day
Hauling 0.0000 0.0000 0.0000 0.0000 0.0000 0.0000 0.0000 0.0000 0.0000 0.0000 0.0000 0.0000 0.0000 0.0000
Vendor 0.0000 0.0000 0.0000 0.0000 0.0000 0.0000 0.0000 0.0000 0.0000 0.0000 0.0000 0.0000 0.0000 0.0000
Worker 0.0695 0.0501 0.6504 1.5900e-003
0.1453 1.1700e-003
0.1465 0.0385 1.0700e-003
0.0396 158.4336 158.4336 5.4100e-003
158.5690
Total 0.0695 0.0501 0.6504 1.5900e-003
0.1453 1.1700e-003
0.1465 0.0385 1.0700e-003
0.0396 158.4336 158.4336 5.4100e-003
158.5690
Mitigated Construction Off-Site
CalEEMod Version: CalEEMod.2016.3.1 Date: 6/14/2017 3:45 PMPage 19 of 25
Gladstone Seniors Azusa - South Coast Air Basin, Summer
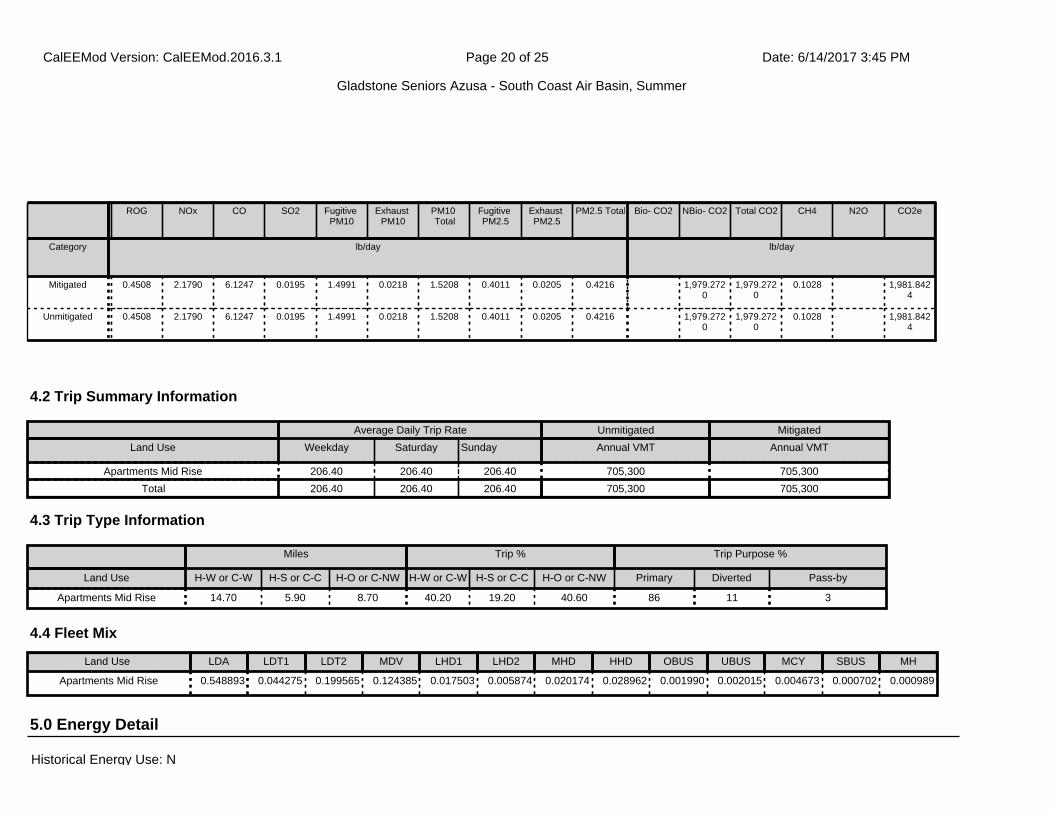
ROG NOx CO SO2 Fugitive PM10
Exhaust PM10
PM10 Total
Fugitive PM2.5
Exhaust PM2.5
PM2.5 Total Bio- CO2 NBio- CO2 Total CO2 CH4 N2O CO2e
Category lb/day lb/day
Mitigated 0.4508 2.1790 6.1247 0.0195 1.4991 0.0218 1.5208 0.4011 0.0205 0.4216 1,979.2720
1,979.2720
0.1028 1,981.8424
Unmitigated 0.4508 2.1790 6.1247 0.0195 1.4991 0.0218 1.5208 0.4011 0.0205 0.4216 1,979.2720
1,979.2720
0.1028 1,981.8424
4.2 Trip Summary Information
4.3 Trip Type Information
Average Daily Trip Rate Unmitigated Mitigated
Land Use Weekday Saturday Sunday Annual VMT Annual VMT
Apartments Mid Rise 206.40 206.40 206.40 705,300 705,300
Total 206.40 206.40 206.40 705,300 705,300
Miles Trip % Trip Purpose %
Land Use H-W or C-W H-S or C-C H-O or C-NW H-W or C-W H-S or C-C H-O or C-NW Primary Diverted Pass-by
Apartments Mid Rise 14.70 5.90 8.70 40.20 19.20 40.60 86 11 3
5.0 Energy Detail
4.4 Fleet Mix
Land Use LDA LDT1 LDT2 MDV LHD1 LHD2 MHD HHD OBUS UBUS MCY SBUS MH
Apartments Mid Rise 0.548893 0.044275 0.199565 0.124385 0.017503 0.005874 0.020174 0.028962 0.001990 0.002015 0.004673 0.000702 0.000989
Historical Energy Use: N
CalEEMod Version: CalEEMod.2016.3.1 Date: 6/14/2017 3:45 PMPage 20 of 25
Gladstone Seniors Azusa - South Coast Air Basin, Summer
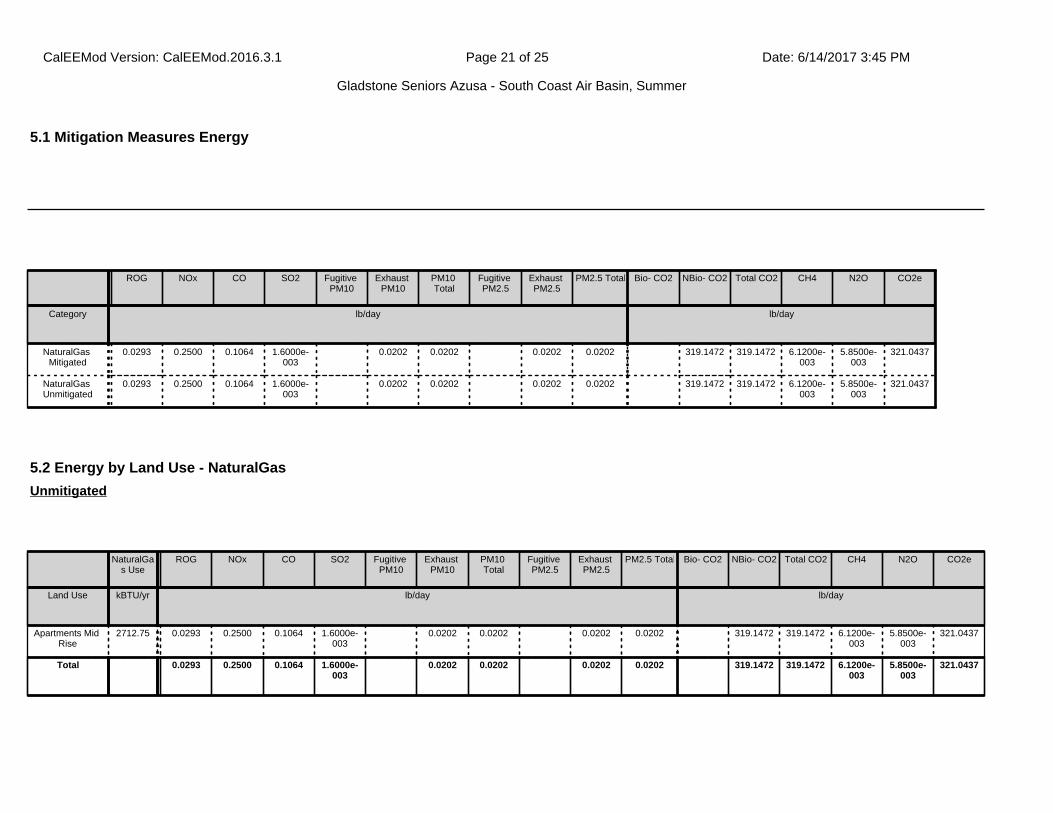
ROG NOx CO SO2 Fugitive PM10
Exhaust PM10
PM10 Total
Fugitive PM2.5
Exhaust PM2.5
PM2.5 Total Bio- CO2 NBio- CO2 Total CO2 CH4 N2O CO2e
Category lb/day lb/day
NaturalGas Mitigated
0.0293 0.2500 0.1064 1.6000e-003
0.0202 0.0202 0.0202 0.0202 319.1472 319.1472 6.1200e-003
5.8500e-003
321.0437
NaturalGas Unmitigated
0.0293 0.2500 0.1064 1.6000e-003
0.0202 0.0202 0.0202 0.0202 319.1472 319.1472 6.1200e-003
5.8500e-003
321.0437
5.2 Energy by Land Use - NaturalGas
NaturalGas Use
ROG NOx CO SO2 Fugitive PM10
Exhaust PM10
PM10 Total
Fugitive PM2.5
Exhaust PM2.5
PM2.5 Total Bio- CO2 NBio- CO2 Total CO2 CH4 N2O CO2e
Land Use kBTU/yr lb/day lb/day
Apartments Mid Rise
2712.75 0.0293 0.2500 0.1064 1.6000e-003
0.0202 0.0202 0.0202 0.0202 319.1472 319.1472 6.1200e-003
5.8500e-003
321.0437
Total 0.0293 0.2500 0.1064 1.6000e-003
0.0202 0.0202 0.0202 0.0202 319.1472 319.1472 6.1200e-003
5.8500e-003
321.0437
Unmitigated
5.1 Mitigation Measures Energy
CalEEMod Version: CalEEMod.2016.3.1 Date: 6/14/2017 3:45 PMPage 21 of 25
Gladstone Seniors Azusa - South Coast Air Basin, Summer
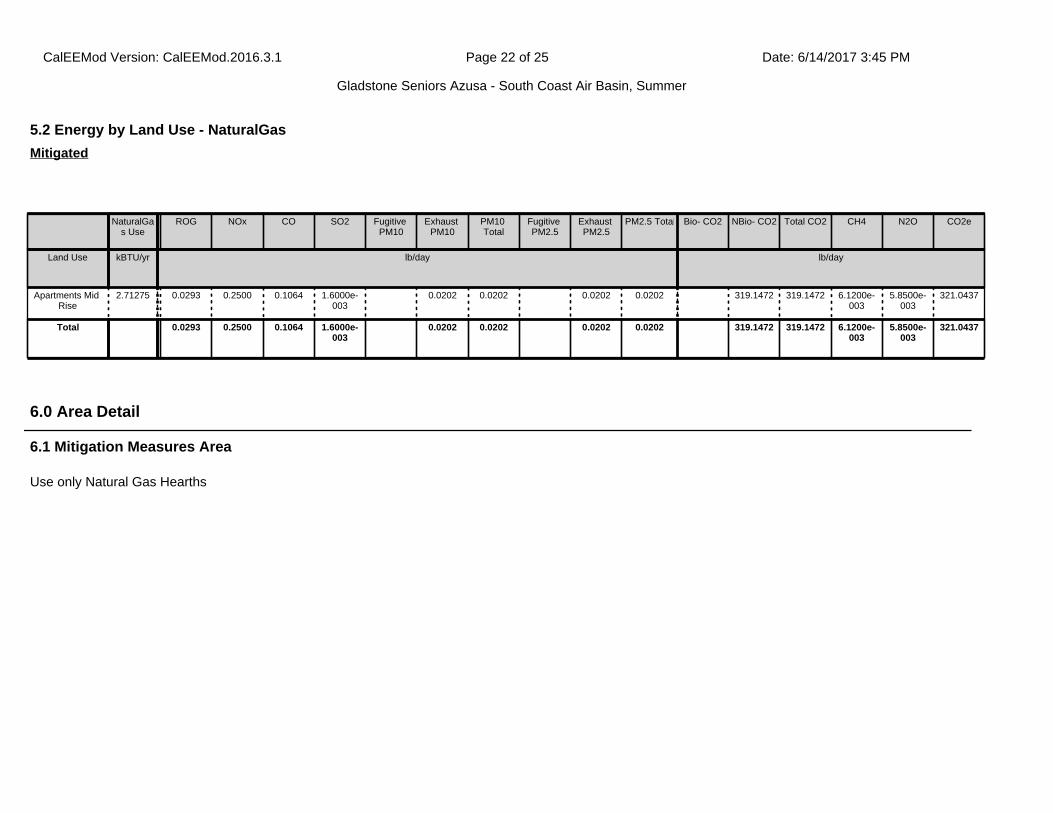
Use only Natural Gas Hearths
6.1 Mitigation Measures Area
6.0 Area Detail
5.2 Energy by Land Use - NaturalGas
NaturalGas Use
ROG NOx CO SO2 Fugitive PM10
Exhaust PM10
PM10 Total
Fugitive PM2.5
Exhaust PM2.5
PM2.5 Total Bio- CO2 NBio- CO2 Total CO2 CH4 N2O CO2e
Land Use kBTU/yr lb/day lb/day
Apartments Mid Rise
2.71275 0.0293 0.2500 0.1064 1.6000e-003
0.0202 0.0202 0.0202 0.0202 319.1472 319.1472 6.1200e-003
5.8500e-003
321.0437
Total 0.0293 0.2500 0.1064 1.6000e-003
0.0202 0.0202 0.0202 0.0202 319.1472 319.1472 6.1200e-003
5.8500e-003
321.0437
Mitigated
CalEEMod Version: CalEEMod.2016.3.1 Date: 6/14/2017 3:45 PMPage 22 of 25
Gladstone Seniors Azusa - South Coast Air Basin, Summer

ROG NOx CO SO2 Fugitive PM10
Exhaust PM10
PM10 Total
Fugitive PM2.5
Exhaust PM2.5
PM2.5 Total Bio- CO2 NBio- CO2 Total CO2 CH4 N2O CO2e
Category lb/day lb/day
Mitigated 1.5480 0.9534 5.3558 5.9800e-003
0.0997 0.0997 0.0997 0.0997 0.0000 1,152.4426
1,152.4426
0.0307 0.0210 1,159.4567
Unmitigated 17.1653 1.3025 35.4877 0.0781 4.6106 4.6106 4.6106 4.6106 562.0151 1,088.9131
1,650.9282
1.6848 0.0382 1,704.4153
6.2 Area by SubCategory
ROG NOx CO SO2 Fugitive PM10
Exhaust PM10
PM10 Total
Fugitive PM2.5
Exhaust PM2.5
PM2.5 Total Bio- CO2 NBio- CO2 Total CO2 CH4 N2O CO2e
SubCategory lb/day lb/day
Architectural Coating
0.1029 0.0000 0.0000 0.0000 0.0000 0.0000 0.0000
Consumer Products
1.1880 0.0000 0.0000 0.0000 0.0000 0.0000 0.0000
Hearth 15.7222 1.2449 30.5131 0.0778 4.5833 4.5833 4.5833 4.5833 562.0151 1,080.0000
1,642.0151
1.6760 0.0382 1,695.2834
Landscaping 0.1523 0.0576 4.9746 2.6000e-004
0.0273 0.0273 0.0273 0.0273 8.9131 8.9131 8.7500e-003
9.1319
Total 17.1653 1.3025 35.4877 0.0781 4.6106 4.6106 4.6106 4.6106 562.0151 1,088.9131
1,650.9282
1.6848 0.0382 1,704.4153
Unmitigated
CalEEMod Version: CalEEMod.2016.3.1 Date: 6/14/2017 3:45 PMPage 23 of 25
Gladstone Seniors Azusa - South Coast Air Basin, Summer

8.1 Mitigation Measures Waste
7.1 Mitigation Measures Water
7.0 Water Detail
8.0 Waste Detail
6.2 Area by SubCategory
ROG NOx CO SO2 Fugitive PM10
Exhaust PM10
PM10 Total
Fugitive PM2.5
Exhaust PM2.5
PM2.5 Total Bio- CO2 NBio- CO2 Total CO2 CH4 N2O CO2e
SubCategory lb/day lb/day
Architectural Coating
0.1029 0.0000 0.0000 0.0000 0.0000 0.0000 0.0000
Consumer Products
1.1880 0.0000 0.0000 0.0000 0.0000 0.0000 0.0000
Hearth 0.1048 0.8958 0.3812 5.7200e-003
0.0724 0.0724 0.0724 0.0724 0.0000 1,143.5294
1,143.5294
0.0219 0.0210 1,150.3248
Landscaping 0.1523 0.0576 4.9746 2.6000e-004
0.0273 0.0273 0.0273 0.0273 8.9131 8.9131 8.7500e-003
9.1319
Total 1.5480 0.9534 5.3558 5.9800e-003
0.0997 0.0997 0.0997 0.0997 0.0000 1,152.4426
1,152.4426
0.0307 0.0210 1,159.4567
Mitigated
9.0 Operational Offroad
Equipment Type Number Hours/Day Days/Year Horse Power Load Factor Fuel Type
10.0 Stationary Equipment
CalEEMod Version: CalEEMod.2016.3.1 Date: 6/14/2017 3:45 PMPage 24 of 25
Gladstone Seniors Azusa - South Coast Air Basin, Summer

11.0 Vegetation
Fire Pumps and Emergency Generators
Equipment Type Number Hours/Day Hours/Year Horse Power Load Factor Fuel Type
Boilers
Equipment Type Number Heat Input/Day Heat Input/Year Boiler Rating Fuel Type
User Defined Equipment
Equipment Type Number
CalEEMod Version: CalEEMod.2016.3.1 Date: 6/14/2017 3:45 PMPage 25 of 25
Gladstone Seniors Azusa - South Coast Air Basin, Summer
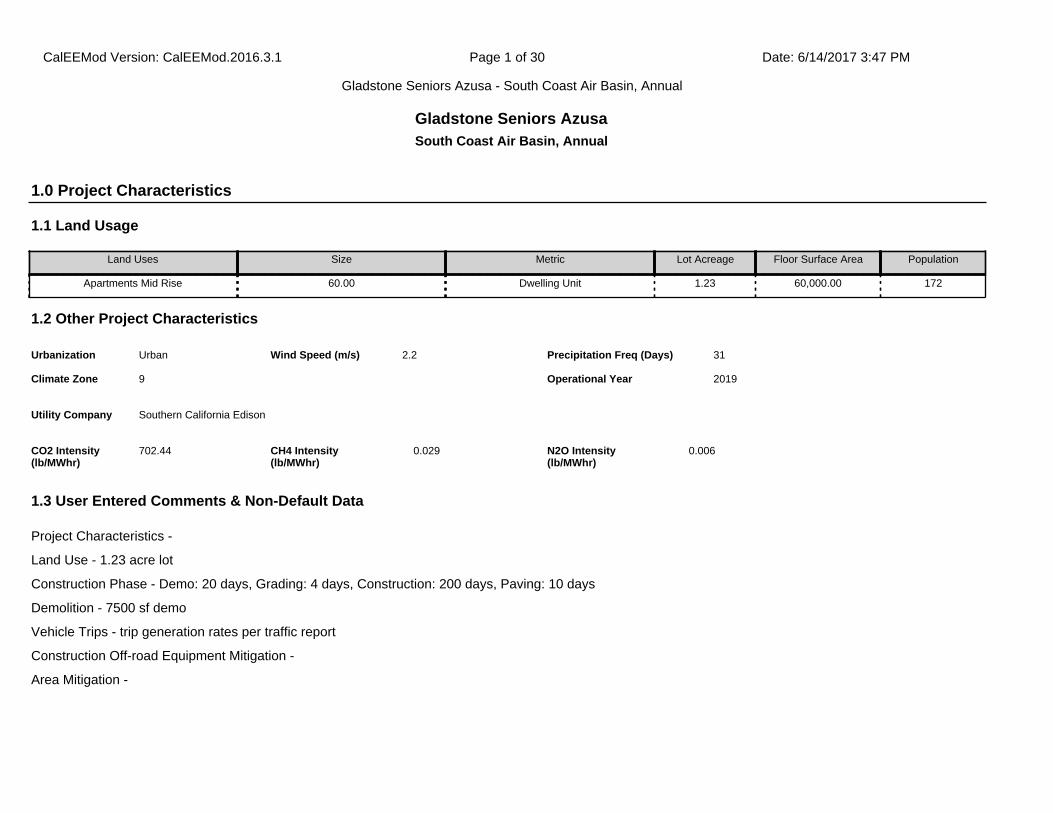
Project Characteristics -
Land Use - 1.23 acre lot
Construction Phase - Demo: 20 days, Grading: 4 days, Construction: 200 days, Paving: 10 days
Demolition - 7500 sf demo
Vehicle Trips - trip generation rates per traffic report
Construction Off-road Equipment Mitigation -
Area Mitigation -
1.1 Land Usage
Land Uses Size Metric Lot Acreage Floor Surface Area Population
Apartments Mid Rise 60.00 Dwelling Unit 1.23 60,000.00 172
1.2 Other Project Characteristics
Urbanization
Climate Zone
Urban
9
Wind Speed (m/s) Precipitation Freq (Days)2.2 31
1.3 User Entered Comments & Non-Default Data
1.0 Project Characteristics
Utility Company Southern California Edison
2019Operational Year
CO2 Intensity (lb/MWhr)
702.44 0.029CH4 Intensity (lb/MWhr)
0.006N2O Intensity (lb/MWhr)
Gladstone Seniors AzusaSouth Coast Air Basin, Annual
CalEEMod Version: CalEEMod.2016.3.1 Date: 6/14/2017 3:47 PMPage 1 of 30
Gladstone Seniors Azusa - South Coast Air Basin, Annual
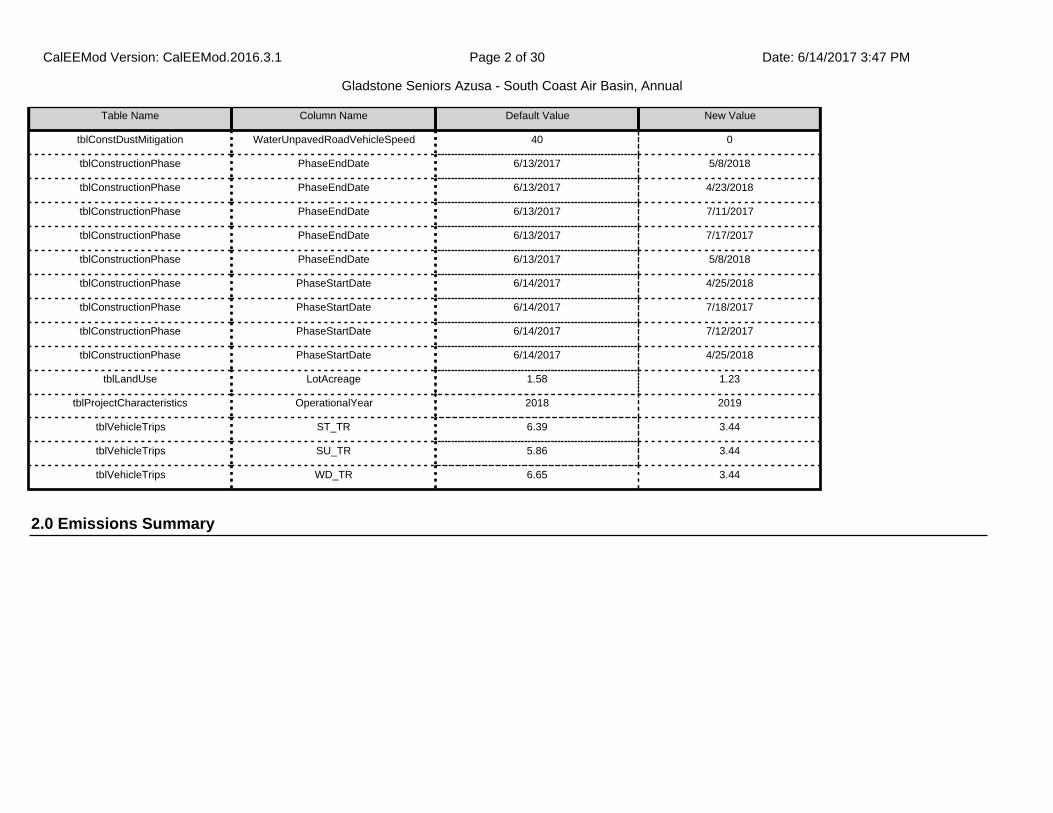
2.0 Emissions Summary
Table Name Column Name Default Value New Value
tblConstDustMitigation WaterUnpavedRoadVehicleSpeed 40 0
tblConstructionPhase PhaseEndDate 6/13/2017 5/8/2018
tblConstructionPhase PhaseEndDate 6/13/2017 4/23/2018
tblConstructionPhase PhaseEndDate 6/13/2017 7/11/2017
tblConstructionPhase PhaseEndDate 6/13/2017 7/17/2017
tblConstructionPhase PhaseEndDate 6/13/2017 5/8/2018
tblConstructionPhase PhaseStartDate 6/14/2017 4/25/2018
tblConstructionPhase PhaseStartDate 6/14/2017 7/18/2017
tblConstructionPhase PhaseStartDate 6/14/2017 7/12/2017
tblConstructionPhase PhaseStartDate 6/14/2017 4/25/2018
tblLandUse LotAcreage 1.58 1.23
tblProjectCharacteristics OperationalYear 2018 2019
tblVehicleTrips ST_TR 6.39 3.44
tblVehicleTrips SU_TR 5.86 3.44
tblVehicleTrips WD_TR 6.65 3.44
CalEEMod Version: CalEEMod.2016.3.1 Date: 6/14/2017 3:47 PMPage 2 of 30
Gladstone Seniors Azusa - South Coast Air Basin, Annual

2.1 Overall Construction
ROG NOx CO SO2 Fugitive PM10
Exhaust PM10
PM10 Total
Fugitive PM2.5
Exhaust PM2.5
PM2.5 Total Bio- CO2 NBio- CO2 Total CO2 CH4 N2O CO2e
Year tons/yr MT/yr
2017 0.2254 1.5155 1.1821 2.0100e-003
0.0457 0.0922 0.1379 0.0142 0.0883 0.1025 0.0000 174.4551 174.4551 0.0314 0.0000 175.2411
2018 0.3102 0.8063 0.7107 1.2500e-003
0.0218 0.0470 0.0689 5.8400e-003
0.0453 0.0511 0.0000 107.5427 107.5427 0.0181 0.0000 107.9954
Maximum 0.3102 1.5155 1.1821 2.0100e-003
0.0457 0.0922 0.1379 0.0142 0.0883 0.1025 0.0000 174.4551 174.4551 0.0314 0.0000 175.2411
Unmitigated Construction
ROG NOx CO SO2 Fugitive PM10
Exhaust PM10
PM10 Total
Fugitive PM2.5
Exhaust PM2.5
PM2.5 Total Bio- CO2 NBio- CO2 Total CO2 CH4 N2O CO2e
Year tons/yr MT/yr
2017 0.2254 1.5155 1.1821 2.0100e-003
0.0383 0.0922 0.1305 0.0111 0.0883 0.0995 0.0000 174.4549 174.4549 0.0314 0.0000 175.2410
2018 0.3102 0.8063 0.7107 1.2500e-003
0.0218 0.0470 0.0689 5.8400e-003
0.0453 0.0511 0.0000 107.5426 107.5426 0.0181 0.0000 107.9953
Maximum 0.3102 1.5155 1.1821 2.0100e-003
0.0383 0.0922 0.1305 0.0111 0.0883 0.0995 0.0000 174.4549 174.4549 0.0314 0.0000 175.2410
Mitigated Construction
ROG NOx CO SO2 Fugitive PM10
Exhaust PM10
PM10 Total
Fugitive PM2.5
Exhaust PM2.5
PM2.5 Total
Bio- CO2 NBio-CO2 Total CO2 CH4 N20 CO2e
Percent Reduction
0.00 0.00 0.00 0.00 11.00 0.00 3.60 15.40 0.00 2.01 0.00 0.00 0.00 0.00 0.00 0.00
CalEEMod Version: CalEEMod.2016.3.1 Date: 6/14/2017 3:47 PMPage 3 of 30
Gladstone Seniors Azusa - South Coast Air Basin, Annual

2.2 Overall Operational
ROG NOx CO SO2 Fugitive PM10
Exhaust PM10
PM10 Total
Fugitive PM2.5
Exhaust PM2.5
PM2.5 Total Bio- CO2 NBio- CO2 Total CO2 CH4 N2O CO2e
Category tons/yr MT/yr
Area 0.4511 0.0228 1.0032 1.0100e-003
0.0607 0.0607 0.0607 0.0607 6.3731 13.2577 19.6309 0.0200 4.3000e-004
20.2597
Energy 5.3400e-003
0.0456 0.0194 2.9000e-004
3.6900e-003
3.6900e-003
3.6900e-003
3.6900e-003
0.0000 135.3564 135.3564 4.4200e-003
1.6700e-003
135.9656
Mobile 0.0772 0.4153 1.0660 3.4100e-003
0.2679 3.9600e-003
0.2719 0.0718 3.7300e-003
0.0755 0.0000 314.0894 314.0894 0.0168 0.0000 314.5098
Waste 0.0000 0.0000 0.0000 0.0000 5.6026 0.0000 5.6026 0.3311 0.0000 13.8801
Water 0.0000 0.0000 0.0000 0.0000 1.2402 24.9427 26.1829 0.1284 3.2200e-003
30.3530
Total 0.5337 0.4836 2.0887 4.7100e-003
0.2679 0.0684 0.3362 0.0718 0.0681 0.1399 13.2159 487.6463 500.8622 0.5007 5.3200e-003
514.9682
Unmitigated Operational
Quarter Start Date End Date Maximum Unmitigated ROG + NOX (tons/quarter) Maximum Mitigated ROG + NOX (tons/quarter)
1 6-14-2017 9-13-2017 0.8312 0.8312
2 9-14-2017 12-13-2017 0.7636 0.7636
3 12-14-2017 3-13-2018 0.6965 0.6965
4 3-14-2018 6-13-2018 0.5679 0.5679
Highest 0.8312 0.8312
CalEEMod Version: CalEEMod.2016.3.1 Date: 6/14/2017 3:47 PMPage 4 of 30
Gladstone Seniors Azusa - South Coast Air Basin, Annual

2.2 Overall Operational
ROG NOx CO SO2 Fugitive PM10
Exhaust PM10
PM10 Total
Fugitive PM2.5
Exhaust PM2.5
PM2.5 Total Bio- CO2 NBio- CO2 Total CO2 CH4 N2O CO2e
Category tons/yr MT/yr
Area 0.2559 0.0184 0.6266 1.0000e-004
4.3100e-003
4.3100e-003
4.3100e-003
4.3100e-003
0.0000 13.9781 13.9781 1.2400e-003
2.4000e-004
14.0800
Energy 5.3400e-003
0.0456 0.0194 2.9000e-004
3.6900e-003
3.6900e-003
3.6900e-003
3.6900e-003
0.0000 135.3564 135.3564 4.4200e-003
1.6700e-003
135.9656
Mobile 0.0772 0.4153 1.0660 3.4100e-003
0.2679 3.9600e-003
0.2719 0.0718 3.7300e-003
0.0755 0.0000 314.0894 314.0894 0.0168 0.0000 314.5098
Waste 0.0000 0.0000 0.0000 0.0000 5.6026 0.0000 5.6026 0.3311 0.0000 13.8801
Water 0.0000 0.0000 0.0000 0.0000 1.2402 24.9427 26.1829 0.1284 3.2200e-003
30.3530
Total 0.3385 0.4793 1.7120 3.8000e-003
0.2679 0.0120 0.2799 0.0718 0.0117 0.0835 6.8428 488.3667 495.2095 0.4820 5.1300e-003
508.7885
Mitigated Operational
3.0 Construction Detail
Construction Phase
ROG NOx CO SO2 Fugitive PM10
Exhaust PM10
PM10 Total
Fugitive PM2.5
Exhaust PM2.5
PM2.5 Total
Bio- CO2 NBio-CO2 Total CO2 CH4 N20 CO2e
Percent Reduction
36.58 0.90 18.03 19.32 0.00 82.50 16.77 0.00 82.78 40.30 48.22 -0.15 1.13 3.75 3.57 1.20
CalEEMod Version: CalEEMod.2016.3.1 Date: 6/14/2017 3:47 PMPage 5 of 30
Gladstone Seniors Azusa - South Coast Air Basin, Annual

Phase Number
Phase Name Phase Type Start Date End Date Num Days Week
Num Days Phase Description
1 Architectural Coating Architectural Coating 4/25/2018 5/8/2018 5 10
2 Building Construction Building Construction 7/18/2017 4/23/2018 5 200
3 Demolition Demolition 6/14/2017 7/11/2017 5 20
4 Grading Grading 7/12/2017 7/17/2017 5 4
5 Paving Paving 4/25/2018 5/8/2018 5 10
OffRoad Equipment
Residential Indoor: 121,500; Residential Outdoor: 40,500; Non-Residential Indoor: 0; Non-Residential Outdoor: 0; Striped Parking Area: 0 (Architectural Coating – sqft)
Acres of Grading (Site Preparation Phase): 0
Acres of Grading (Grading Phase): 1.5
Acres of Paving: 0
CalEEMod Version: CalEEMod.2016.3.1 Date: 6/14/2017 3:47 PMPage 6 of 30
Gladstone Seniors Azusa - South Coast Air Basin, Annual
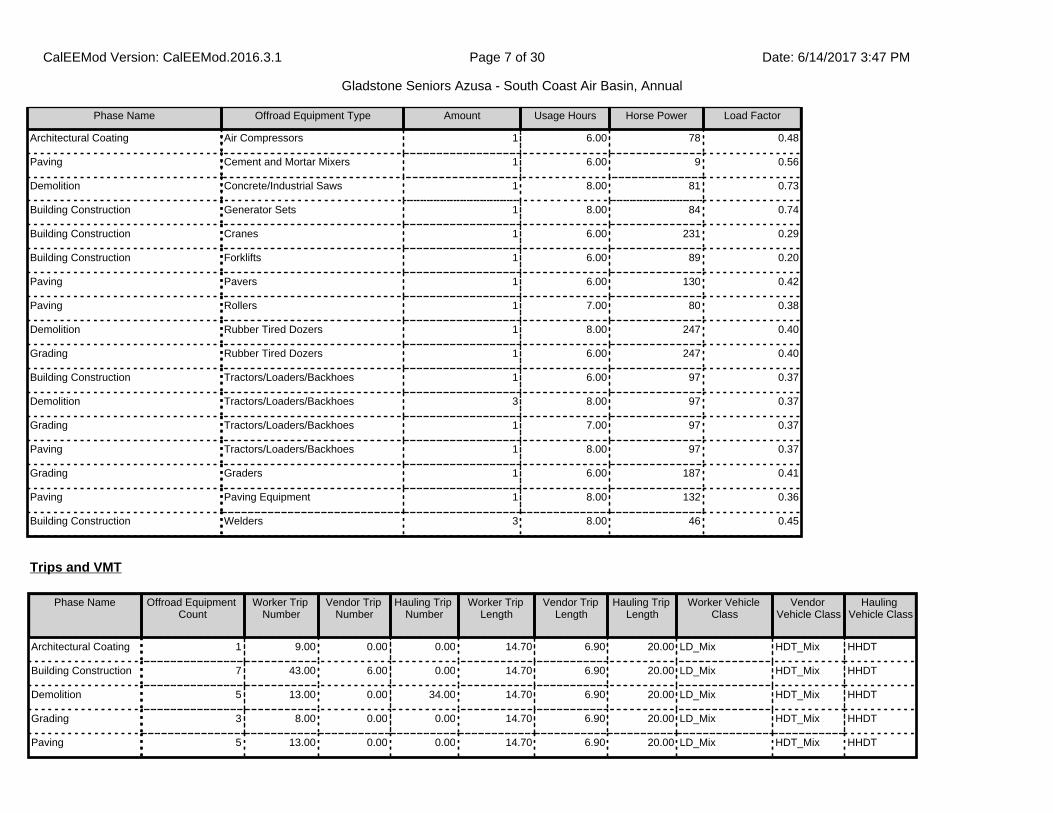
Phase Name Offroad Equipment Type Amount Usage Hours Horse Power Load Factor
Architectural Coating Air Compressors 1 6.00 78 0.48
Paving Cement and Mortar Mixers 1 6.00 9 0.56
Demolition Concrete/Industrial Saws 1 8.00 81 0.73
Building Construction Generator Sets 1 8.00 84 0.74
Building Construction Cranes 1 6.00 231 0.29
Building Construction Forklifts 1 6.00 89 0.20
Paving Pavers 1 6.00 130 0.42
Paving Rollers 1 7.00 80 0.38
Demolition Rubber Tired Dozers 1 8.00 247 0.40
Grading Rubber Tired Dozers 1 6.00 247 0.40
Building Construction Tractors/Loaders/Backhoes 1 6.00 97 0.37
Demolition Tractors/Loaders/Backhoes 3 8.00 97 0.37
Grading Tractors/Loaders/Backhoes 1 7.00 97 0.37
Paving Tractors/Loaders/Backhoes 1 8.00 97 0.37
Grading Graders 1 6.00 187 0.41
Paving Paving Equipment 1 8.00 132 0.36
Building Construction Welders 3 8.00 46 0.45
Trips and VMT
Phase Name Offroad Equipment Count
Worker Trip Number
Vendor Trip Number
Hauling Trip Number
Worker Trip Length
Vendor Trip Length
Hauling Trip Length
Worker Vehicle Class
Vendor Vehicle Class
Hauling Vehicle Class
Architectural Coating 1 9.00 0.00 0.00 14.70 6.90 20.00 LD_Mix HDT_Mix HHDT
Building Construction 7 43.00 6.00 0.00 14.70 6.90 20.00 LD_Mix HDT_Mix HHDT
Demolition 5 13.00 0.00 34.00 14.70 6.90 20.00 LD_Mix HDT_Mix HHDT
Grading 3 8.00 0.00 0.00 14.70 6.90 20.00 LD_Mix HDT_Mix HHDT
Paving 5 13.00 0.00 0.00 14.70 6.90 20.00 LD_Mix HDT_Mix HHDT
CalEEMod Version: CalEEMod.2016.3.1 Date: 6/14/2017 3:47 PMPage 7 of 30
Gladstone Seniors Azusa - South Coast Air Basin, Annual

3.2 Architectural Coating - 2018
ROG NOx CO SO2 Fugitive PM10
Exhaust PM10
PM10 Total
Fugitive PM2.5
Exhaust PM2.5
PM2.5 Total Bio- CO2 NBio- CO2 Total CO2 CH4 N2O CO2e
Category tons/yr MT/yr
Archit. Coating 0.1877 0.0000 0.0000 0.0000 0.0000 0.0000 0.0000 0.0000 0.0000 0.0000 0.0000
Off-Road 1.4900e-003
0.0100 9.2700e-003
1.0000e-005
7.5000e-004
7.5000e-004
7.5000e-004
7.5000e-004
0.0000 1.2766 1.2766 1.2000e-004
0.0000 1.2797
Total 0.1892 0.0100 9.2700e-003
1.0000e-005
7.5000e-004
7.5000e-004
7.5000e-004
7.5000e-004
0.0000 1.2766 1.2766 1.2000e-004
0.0000 1.2797
Unmitigated Construction On-Site
3.1 Mitigation Measures Construction
Water Exposed Area
Clean Paved Roads
CalEEMod Version: CalEEMod.2016.3.1 Date: 6/14/2017 3:47 PMPage 8 of 30
Gladstone Seniors Azusa - South Coast Air Basin, Annual

3.2 Architectural Coating - 2018
ROG NOx CO SO2 Fugitive PM10
Exhaust PM10
PM10 Total
Fugitive PM2.5
Exhaust PM2.5
PM2.5 Total Bio- CO2 NBio- CO2 Total CO2 CH4 N2O CO2e
Category tons/yr MT/yr
Hauling 0.0000 0.0000 0.0000 0.0000 0.0000 0.0000 0.0000 0.0000 0.0000 0.0000 0.0000 0.0000 0.0000 0.0000 0.0000 0.0000
Vendor 0.0000 0.0000 0.0000 0.0000 0.0000 0.0000 0.0000 0.0000 0.0000 0.0000 0.0000 0.0000 0.0000 0.0000 0.0000 0.0000
Worker 2.4000e-004
2.0000e-004
2.1000e-003
1.0000e-005
4.9000e-004
0.0000 5.0000e-004
1.3000e-004
0.0000 1.3000e-004
0.0000 0.4741 0.4741 2.0000e-005
0.0000 0.4745
Total 2.4000e-004
2.0000e-004
2.1000e-003
1.0000e-005
4.9000e-004
0.0000 5.0000e-004
1.3000e-004
0.0000 1.3000e-004
0.0000 0.4741 0.4741 2.0000e-005
0.0000 0.4745
Unmitigated Construction Off-Site
ROG NOx CO SO2 Fugitive PM10
Exhaust PM10
PM10 Total
Fugitive PM2.5
Exhaust PM2.5
PM2.5 Total Bio- CO2 NBio- CO2 Total CO2 CH4 N2O CO2e
Category tons/yr MT/yr
Archit. Coating 0.1877 0.0000 0.0000 0.0000 0.0000 0.0000 0.0000 0.0000 0.0000 0.0000 0.0000
Off-Road 1.4900e-003
0.0100 9.2700e-003
1.0000e-005
7.5000e-004
7.5000e-004
7.5000e-004
7.5000e-004
0.0000 1.2766 1.2766 1.2000e-004
0.0000 1.2797
Total 0.1892 0.0100 9.2700e-003
1.0000e-005
7.5000e-004
7.5000e-004
7.5000e-004
7.5000e-004
0.0000 1.2766 1.2766 1.2000e-004
0.0000 1.2797
Mitigated Construction On-Site
CalEEMod Version: CalEEMod.2016.3.1 Date: 6/14/2017 3:47 PMPage 9 of 30
Gladstone Seniors Azusa - South Coast Air Basin, Annual
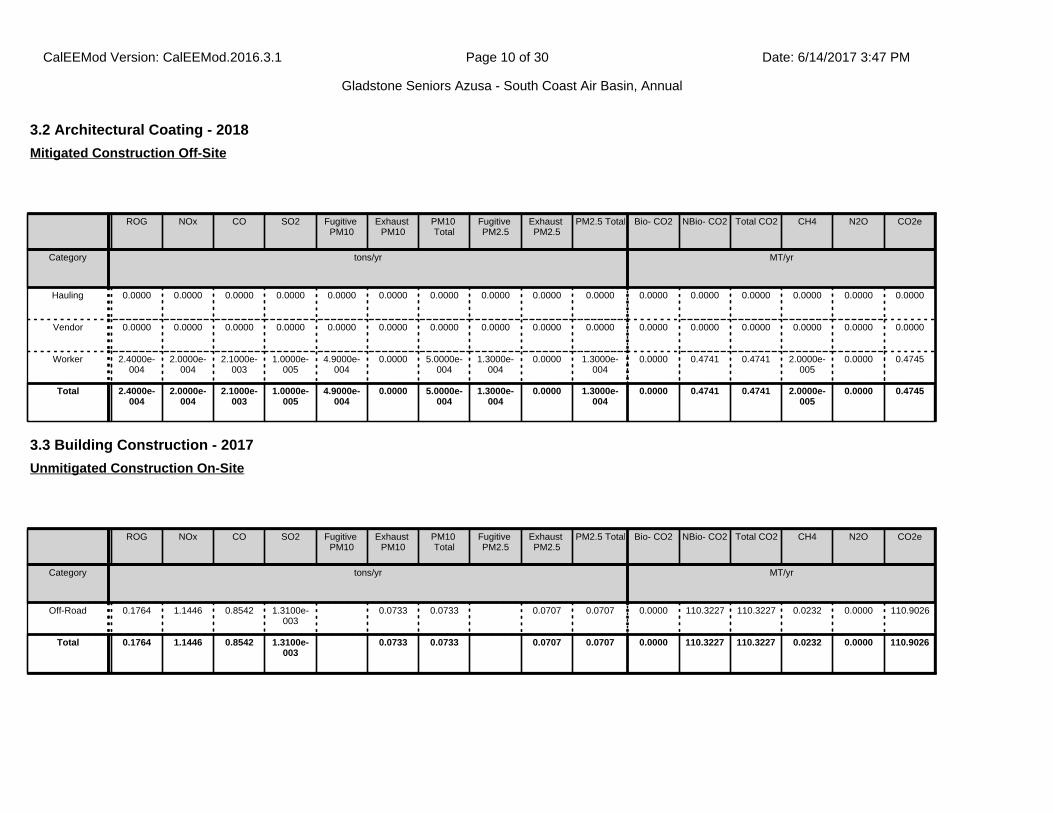
3.2 Architectural Coating - 2018
ROG NOx CO SO2 Fugitive PM10
Exhaust PM10
PM10 Total
Fugitive PM2.5
Exhaust PM2.5
PM2.5 Total Bio- CO2 NBio- CO2 Total CO2 CH4 N2O CO2e
Category tons/yr MT/yr
Hauling 0.0000 0.0000 0.0000 0.0000 0.0000 0.0000 0.0000 0.0000 0.0000 0.0000 0.0000 0.0000 0.0000 0.0000 0.0000 0.0000
Vendor 0.0000 0.0000 0.0000 0.0000 0.0000 0.0000 0.0000 0.0000 0.0000 0.0000 0.0000 0.0000 0.0000 0.0000 0.0000 0.0000
Worker 2.4000e-004
2.0000e-004
2.1000e-003
1.0000e-005
4.9000e-004
0.0000 5.0000e-004
1.3000e-004
0.0000 1.3000e-004
0.0000 0.4741 0.4741 2.0000e-005
0.0000 0.4745
Total 2.4000e-004
2.0000e-004
2.1000e-003
1.0000e-005
4.9000e-004
0.0000 5.0000e-004
1.3000e-004
0.0000 1.3000e-004
0.0000 0.4741 0.4741 2.0000e-005
0.0000 0.4745
Mitigated Construction Off-Site
3.3 Building Construction - 2017
ROG NOx CO SO2 Fugitive PM10
Exhaust PM10
PM10 Total
Fugitive PM2.5
Exhaust PM2.5
PM2.5 Total Bio- CO2 NBio- CO2 Total CO2 CH4 N2O CO2e
Category tons/yr MT/yr
Off-Road 0.1764 1.1446 0.8542 1.3100e-003
0.0733 0.0733 0.0707 0.0707 0.0000 110.3227 110.3227 0.0232 0.0000 110.9026
Total 0.1764 1.1446 0.8542 1.3100e-003
0.0733 0.0733 0.0707 0.0707 0.0000 110.3227 110.3227 0.0232 0.0000 110.9026
Unmitigated Construction On-Site
CalEEMod Version: CalEEMod.2016.3.1 Date: 6/14/2017 3:47 PMPage 10 of 30
Gladstone Seniors Azusa - South Coast Air Basin, Annual

3.3 Building Construction - 2017
ROG NOx CO SO2 Fugitive PM10
Exhaust PM10
PM10 Total
Fugitive PM2.5
Exhaust PM2.5
PM2.5 Total Bio- CO2 NBio- CO2 Total CO2 CH4 N2O CO2e
Category tons/yr MT/yr
Hauling 0.0000 0.0000 0.0000 0.0000 0.0000 0.0000 0.0000 0.0000 0.0000 0.0000 0.0000 0.0000 0.0000 0.0000 0.0000 0.0000
Vendor 1.7800e-003
0.0472 0.0129 9.0000e-005
2.2500e-003
4.0000e-004
2.6500e-003
6.5000e-004
3.9000e-004
1.0300e-003
0.0000 8.9010 8.9010 6.7000e-004
0.0000 8.9178
Worker 0.0153 0.0128 0.1364 3.1000e-004
0.0281 2.4000e-004
0.0283 7.4500e-003
2.2000e-004
7.6700e-003
0.0000 27.7304 27.7304 1.0500e-003
0.0000 27.7567
Total 0.0170 0.0600 0.1493 4.0000e-004
0.0303 6.4000e-004
0.0310 8.1000e-003
6.1000e-004
8.7000e-003
0.0000 36.6314 36.6314 1.7200e-003
0.0000 36.6745
Unmitigated Construction Off-Site
ROG NOx CO SO2 Fugitive PM10
Exhaust PM10
PM10 Total
Fugitive PM2.5
Exhaust PM2.5
PM2.5 Total Bio- CO2 NBio- CO2 Total CO2 CH4 N2O CO2e
Category tons/yr MT/yr
Off-Road 0.1764 1.1446 0.8542 1.3100e-003
0.0733 0.0733 0.0707 0.0707 0.0000 110.3225 110.3225 0.0232 0.0000 110.9025
Total 0.1764 1.1446 0.8542 1.3100e-003
0.0733 0.0733 0.0707 0.0707 0.0000 110.3225 110.3225 0.0232 0.0000 110.9025
Mitigated Construction On-Site
CalEEMod Version: CalEEMod.2016.3.1 Date: 6/14/2017 3:47 PMPage 11 of 30
Gladstone Seniors Azusa - South Coast Air Basin, Annual

3.3 Building Construction - 2017
ROG NOx CO SO2 Fugitive PM10
Exhaust PM10
PM10 Total
Fugitive PM2.5
Exhaust PM2.5
PM2.5 Total Bio- CO2 NBio- CO2 Total CO2 CH4 N2O CO2e
Category tons/yr MT/yr
Hauling 0.0000 0.0000 0.0000 0.0000 0.0000 0.0000 0.0000 0.0000 0.0000 0.0000 0.0000 0.0000 0.0000 0.0000 0.0000 0.0000
Vendor 1.7800e-003
0.0472 0.0129 9.0000e-005
2.2500e-003
4.0000e-004
2.6500e-003
6.5000e-004
3.9000e-004
1.0300e-003
0.0000 8.9010 8.9010 6.7000e-004
0.0000 8.9178
Worker 0.0153 0.0128 0.1364 3.1000e-004
0.0281 2.4000e-004
0.0283 7.4500e-003
2.2000e-004
7.6700e-003
0.0000 27.7304 27.7304 1.0500e-003
0.0000 27.7567
Total 0.0170 0.0600 0.1493 4.0000e-004
0.0303 6.4000e-004
0.0310 8.1000e-003
6.1000e-004
8.7000e-003
0.0000 36.6314 36.6314 1.7200e-003
0.0000 36.6745
Mitigated Construction Off-Site
3.3 Building Construction - 2018
ROG NOx CO SO2 Fugitive PM10
Exhaust PM10
PM10 Total
Fugitive PM2.5
Exhaust PM2.5
PM2.5 Total
Bio- CO2 NBio- CO2 Total CO2 CH4 N2O CO2e
Category tons/yr MT/yr
Off-Road 0.1050 0.7058 0.5620 8.9000e-004
0.0429 0.0429 0.0414 0.0414 0.0000 74.6150 74.6150 0.0150 0.0000 74.9905
Total 0.1050 0.7058 0.5620 8.9000e-004
0.0429 0.0429 0.0414 0.0414 0.0000 74.6150 74.6150 0.0150 0.0000 74.9905
Unmitigated Construction On-Site
CalEEMod Version: CalEEMod.2016.3.1 Date: 6/14/2017 3:47 PMPage 12 of 30
Gladstone Seniors Azusa - South Coast Air Basin, Annual

3.3 Building Construction - 2018
ROG NOx CO SO2 Fugitive PM10
Exhaust PM10
PM10 Total
Fugitive PM2.5
Exhaust PM2.5
PM2.5 Total Bio- CO2 NBio- CO2 Total CO2 CH4 N2O CO2e
Category tons/yr MT/yr
Hauling 0.0000 0.0000 0.0000 0.0000 0.0000 0.0000 0.0000 0.0000 0.0000 0.0000 0.0000 0.0000 0.0000 0.0000 0.0000 0.0000
Vendor 1.0600e-003
0.0302 7.8900e-003
6.0000e-005
1.5300e-003
2.2000e-004
1.7500e-003
4.4000e-004
2.1000e-004
6.5000e-004
0.0000 6.0383 6.0383 4.4000e-004
0.0000 6.0492
Worker 9.2300e-003
7.5800e-003
0.0814 2.0000e-004
0.0191 1.6000e-004
0.0193 5.0700e-003
1.4000e-004
5.2200e-003
0.0000 18.3465 18.3465 6.3000e-004
0.0000 18.3622
Total 0.0103 0.0377 0.0893 2.6000e-004
0.0206 3.8000e-004
0.0210 5.5100e-003
3.5000e-004
5.8700e-003
0.0000 24.3849 24.3849 1.0700e-003
0.0000 24.4114
Unmitigated Construction Off-Site
ROG NOx CO SO2 Fugitive PM10
Exhaust PM10
PM10 Total
Fugitive PM2.5
Exhaust PM2.5
PM2.5 Total Bio- CO2 NBio- CO2 Total CO2 CH4 N2O CO2e
Category tons/yr MT/yr
Off-Road 0.1050 0.7058 0.5620 8.9000e-004
0.0429 0.0429 0.0414 0.0414 0.0000 74.6149 74.6149 0.0150 0.0000 74.9904
Total 0.1050 0.7058 0.5620 8.9000e-004
0.0429 0.0429 0.0414 0.0414 0.0000 74.6149 74.6149 0.0150 0.0000 74.9904
Mitigated Construction On-Site
CalEEMod Version: CalEEMod.2016.3.1 Date: 6/14/2017 3:47 PMPage 13 of 30
Gladstone Seniors Azusa - South Coast Air Basin, Annual
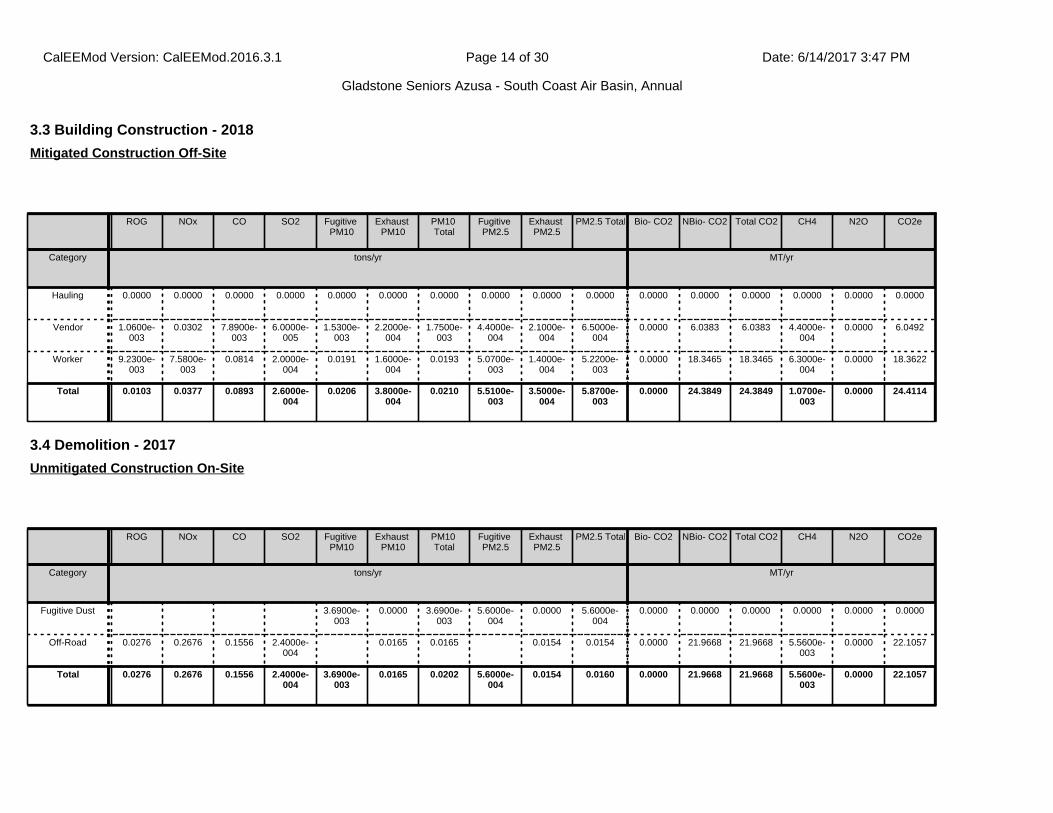
3.3 Building Construction - 2018
ROG NOx CO SO2 Fugitive PM10
Exhaust PM10
PM10 Total
Fugitive PM2.5
Exhaust PM2.5
PM2.5 Total Bio- CO2 NBio- CO2 Total CO2 CH4 N2O CO2e
Category tons/yr MT/yr
Hauling 0.0000 0.0000 0.0000 0.0000 0.0000 0.0000 0.0000 0.0000 0.0000 0.0000 0.0000 0.0000 0.0000 0.0000 0.0000 0.0000
Vendor 1.0600e-003
0.0302 7.8900e-003
6.0000e-005
1.5300e-003
2.2000e-004
1.7500e-003
4.4000e-004
2.1000e-004
6.5000e-004
0.0000 6.0383 6.0383 4.4000e-004
0.0000 6.0492
Worker 9.2300e-003
7.5800e-003
0.0814 2.0000e-004
0.0191 1.6000e-004
0.0193 5.0700e-003
1.4000e-004
5.2200e-003
0.0000 18.3465 18.3465 6.3000e-004
0.0000 18.3622
Total 0.0103 0.0377 0.0893 2.6000e-004
0.0206 3.8000e-004
0.0210 5.5100e-003
3.5000e-004
5.8700e-003
0.0000 24.3849 24.3849 1.0700e-003
0.0000 24.4114
Mitigated Construction Off-Site
3.4 Demolition - 2017
ROG NOx CO SO2 Fugitive PM10
Exhaust PM10
PM10 Total
Fugitive PM2.5
Exhaust PM2.5
PM2.5 Total Bio- CO2 NBio- CO2 Total CO2 CH4 N2O CO2e
Category tons/yr MT/yr
Fugitive Dust 3.6900e-003
0.0000 3.6900e-003
5.6000e-004
0.0000 5.6000e-004
0.0000 0.0000 0.0000 0.0000 0.0000 0.0000
Off-Road 0.0276 0.2676 0.1556 2.4000e-004
0.0165 0.0165 0.0154 0.0154 0.0000 21.9668 21.9668 5.5600e-003
0.0000 22.1057
Total 0.0276 0.2676 0.1556 2.4000e-004
3.6900e-003
0.0165 0.0202 5.6000e-004
0.0154 0.0160 0.0000 21.9668 21.9668 5.5600e-003
0.0000 22.1057
Unmitigated Construction On-Site
CalEEMod Version: CalEEMod.2016.3.1 Date: 6/14/2017 3:47 PMPage 14 of 30
Gladstone Seniors Azusa - South Coast Air Basin, Annual

3.4 Demolition - 2017
ROG NOx CO SO2 Fugitive PM10
Exhaust PM10
PM10 Total
Fugitive PM2.5
Exhaust PM2.5
PM2.5 Total Bio- CO2 NBio- CO2 Total CO2 CH4 N2O CO2e
Category tons/yr MT/yr
Hauling 1.8000e-004
5.9800e-003
1.1500e-003
1.0000e-005
2.9000e-004
3.0000e-005
3.2000e-004
8.0000e-005
3.0000e-005
1.1000e-004
0.0000 1.3302 1.3302 1.0000e-004
0.0000 1.3327
Vendor 0.0000 0.0000 0.0000 0.0000 0.0000 0.0000 0.0000 0.0000 0.0000 0.0000 0.0000 0.0000 0.0000 0.0000 0.0000 0.0000
Worker 7.8000e-004
6.5000e-004
6.9300e-003
2.0000e-005
1.4300e-003
1.0000e-005
1.4400e-003
3.8000e-004
1.0000e-005
3.9000e-004
0.0000 1.4090 1.4090 5.0000e-005
0.0000 1.4104
Total 9.6000e-004
6.6300e-003
8.0800e-003
3.0000e-005
1.7200e-003
4.0000e-005
1.7600e-003
4.6000e-004
4.0000e-005
5.0000e-004
0.0000 2.7392 2.7392 1.5000e-004
0.0000 2.7431
Unmitigated Construction Off-Site
ROG NOx CO SO2 Fugitive PM10
Exhaust PM10
PM10 Total
Fugitive PM2.5
Exhaust PM2.5
PM2.5 Total Bio- CO2 NBio- CO2 Total CO2 CH4 N2O CO2e
Category tons/yr MT/yr
Fugitive Dust 1.6600e-003
0.0000 1.6600e-003
2.5000e-004
0.0000 2.5000e-004
0.0000 0.0000 0.0000 0.0000 0.0000 0.0000
Off-Road 0.0276 0.2676 0.1556 2.4000e-004
0.0165 0.0165 0.0154 0.0154 0.0000 21.9668 21.9668 5.5600e-003
0.0000 22.1057
Total 0.0276 0.2676 0.1556 2.4000e-004
1.6600e-003
0.0165 0.0181 2.5000e-004
0.0154 0.0157 0.0000 21.9668 21.9668 5.5600e-003
0.0000 22.1057
Mitigated Construction On-Site
CalEEMod Version: CalEEMod.2016.3.1 Date: 6/14/2017 3:47 PMPage 15 of 30
Gladstone Seniors Azusa - South Coast Air Basin, Annual
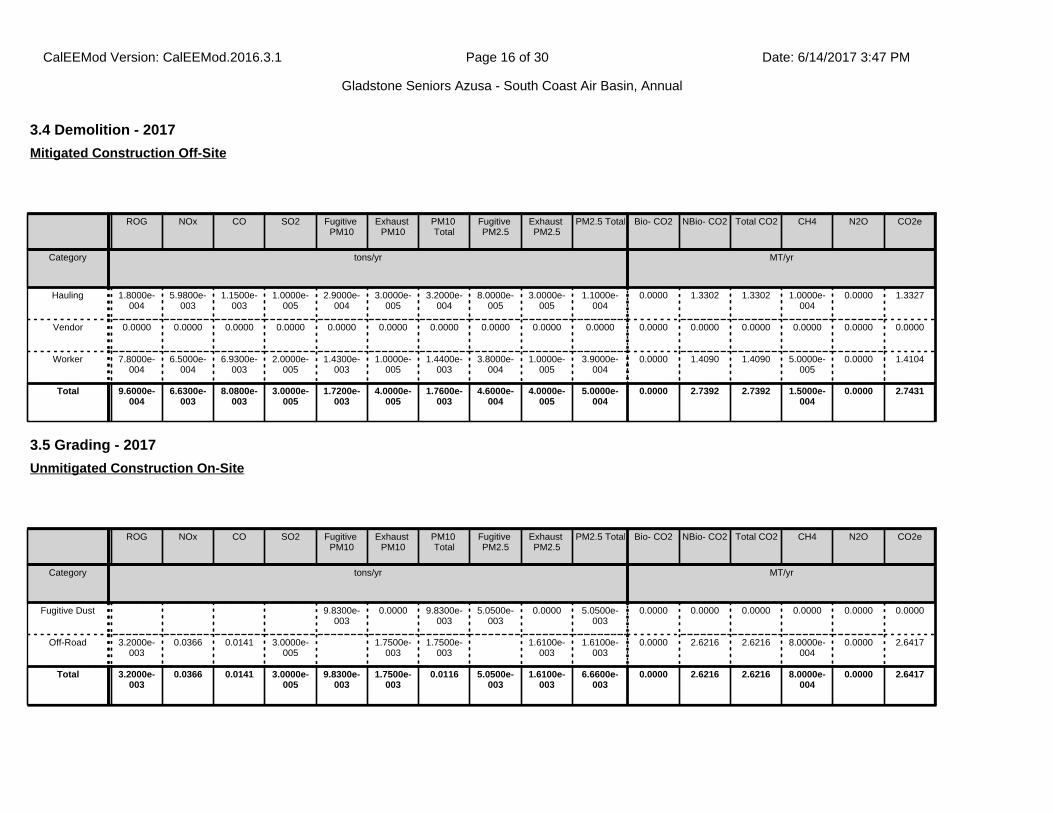
3.4 Demolition - 2017
ROG NOx CO SO2 Fugitive PM10
Exhaust PM10
PM10 Total
Fugitive PM2.5
Exhaust PM2.5
PM2.5 Total Bio- CO2 NBio- CO2 Total CO2 CH4 N2O CO2e
Category tons/yr MT/yr
Hauling 1.8000e-004
5.9800e-003
1.1500e-003
1.0000e-005
2.9000e-004
3.0000e-005
3.2000e-004
8.0000e-005
3.0000e-005
1.1000e-004
0.0000 1.3302 1.3302 1.0000e-004
0.0000 1.3327
Vendor 0.0000 0.0000 0.0000 0.0000 0.0000 0.0000 0.0000 0.0000 0.0000 0.0000 0.0000 0.0000 0.0000 0.0000 0.0000 0.0000
Worker 7.8000e-004
6.5000e-004
6.9300e-003
2.0000e-005
1.4300e-003
1.0000e-005
1.4400e-003
3.8000e-004
1.0000e-005
3.9000e-004
0.0000 1.4090 1.4090 5.0000e-005
0.0000 1.4104
Total 9.6000e-004
6.6300e-003
8.0800e-003
3.0000e-005
1.7200e-003
4.0000e-005
1.7600e-003
4.6000e-004
4.0000e-005
5.0000e-004
0.0000 2.7392 2.7392 1.5000e-004
0.0000 2.7431
Mitigated Construction Off-Site
3.5 Grading - 2017
ROG NOx CO SO2 Fugitive PM10
Exhaust PM10
PM10 Total
Fugitive PM2.5
Exhaust PM2.5
PM2.5 Total Bio- CO2 NBio- CO2 Total CO2 CH4 N2O CO2e
Category tons/yr MT/yr
Fugitive Dust 9.8300e-003
0.0000 9.8300e-003
5.0500e-003
0.0000 5.0500e-003
0.0000 0.0000 0.0000 0.0000 0.0000 0.0000
Off-Road 3.2000e-003
0.0366 0.0141 3.0000e-005
1.7500e-003
1.7500e-003
1.6100e-003
1.6100e-003
0.0000 2.6216 2.6216 8.0000e-004
0.0000 2.6417
Total 3.2000e-003
0.0366 0.0141 3.0000e-005
9.8300e-003
1.7500e-003
0.0116 5.0500e-003
1.6100e-003
6.6600e-003
0.0000 2.6216 2.6216 8.0000e-004
0.0000 2.6417
Unmitigated Construction On-Site
CalEEMod Version: CalEEMod.2016.3.1 Date: 6/14/2017 3:47 PMPage 16 of 30
Gladstone Seniors Azusa - South Coast Air Basin, Annual

3.5 Grading - 2017
ROG NOx CO SO2 Fugitive PM10
Exhaust PM10
PM10 Total
Fugitive PM2.5
Exhaust PM2.5
PM2.5 Total Bio- CO2 NBio- CO2 Total CO2 CH4 N2O CO2e
Category tons/yr MT/yr
Hauling 0.0000 0.0000 0.0000 0.0000 0.0000 0.0000 0.0000 0.0000 0.0000 0.0000 0.0000 0.0000 0.0000 0.0000 0.0000 0.0000
Vendor 0.0000 0.0000 0.0000 0.0000 0.0000 0.0000 0.0000 0.0000 0.0000 0.0000 0.0000 0.0000 0.0000 0.0000 0.0000 0.0000
Worker 1.0000e-004
8.0000e-005
8.5000e-004
0.0000 1.8000e-004
0.0000 1.8000e-004
5.0000e-005
0.0000 5.0000e-005
0.0000 0.1734 0.1734 1.0000e-005
0.0000 0.1736
Total 1.0000e-004
8.0000e-005
8.5000e-004
0.0000 1.8000e-004
0.0000 1.8000e-004
5.0000e-005
0.0000 5.0000e-005
0.0000 0.1734 0.1734 1.0000e-005
0.0000 0.1736
Unmitigated Construction Off-Site
ROG NOx CO SO2 Fugitive PM10
Exhaust PM10
PM10 Total
Fugitive PM2.5
Exhaust PM2.5
PM2.5 Total Bio- CO2 NBio- CO2 Total CO2 CH4 N2O CO2e
Category tons/yr MT/yr
Fugitive Dust 4.4200e-003
0.0000 4.4200e-003
2.2700e-003
0.0000 2.2700e-003
0.0000 0.0000 0.0000 0.0000 0.0000 0.0000
Off-Road 3.2000e-003
0.0366 0.0141 3.0000e-005
1.7500e-003
1.7500e-003
1.6100e-003
1.6100e-003
0.0000 2.6216 2.6216 8.0000e-004
0.0000 2.6417
Total 3.2000e-003
0.0366 0.0141 3.0000e-005
4.4200e-003
1.7500e-003
6.1700e-003
2.2700e-003
1.6100e-003
3.8800e-003
0.0000 2.6216 2.6216 8.0000e-004
0.0000 2.6417
Mitigated Construction On-Site
CalEEMod Version: CalEEMod.2016.3.1 Date: 6/14/2017 3:47 PMPage 17 of 30
Gladstone Seniors Azusa - South Coast Air Basin, Annual
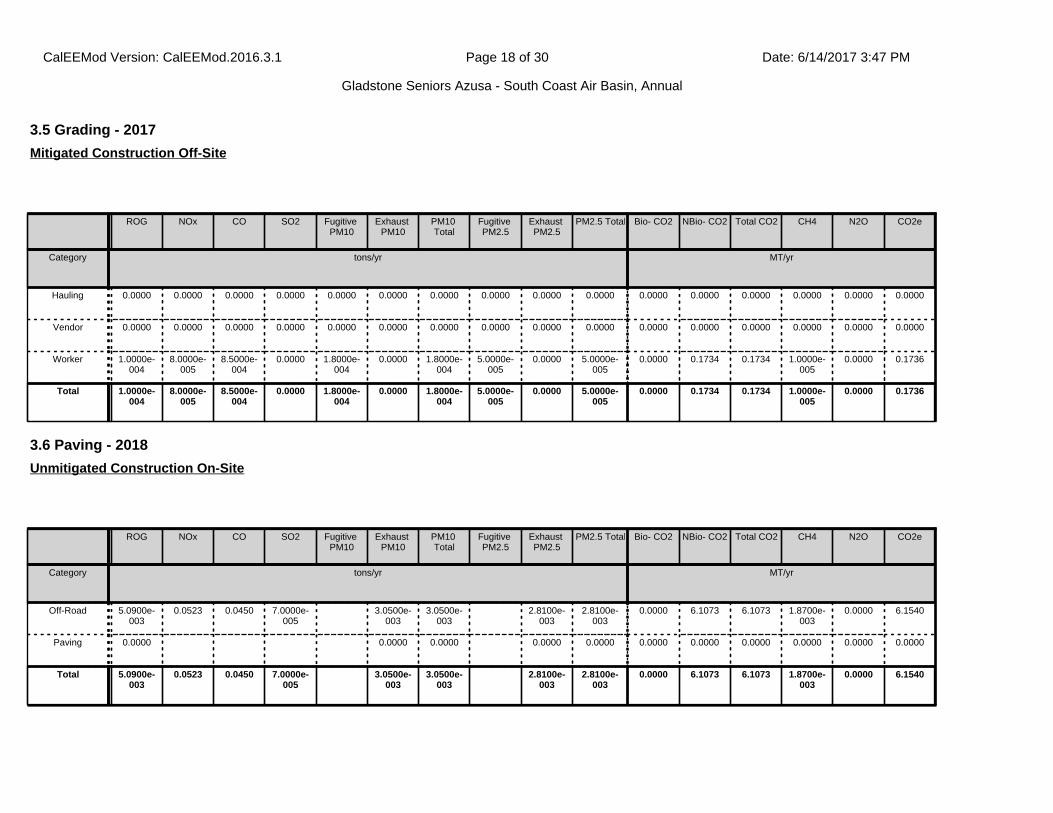
3.5 Grading - 2017
ROG NOx CO SO2 Fugitive PM10
Exhaust PM10
PM10 Total
Fugitive PM2.5
Exhaust PM2.5
PM2.5 Total Bio- CO2 NBio- CO2 Total CO2 CH4 N2O CO2e
Category tons/yr MT/yr
Hauling 0.0000 0.0000 0.0000 0.0000 0.0000 0.0000 0.0000 0.0000 0.0000 0.0000 0.0000 0.0000 0.0000 0.0000 0.0000 0.0000
Vendor 0.0000 0.0000 0.0000 0.0000 0.0000 0.0000 0.0000 0.0000 0.0000 0.0000 0.0000 0.0000 0.0000 0.0000 0.0000 0.0000
Worker 1.0000e-004
8.0000e-005
8.5000e-004
0.0000 1.8000e-004
0.0000 1.8000e-004
5.0000e-005
0.0000 5.0000e-005
0.0000 0.1734 0.1734 1.0000e-005
0.0000 0.1736
Total 1.0000e-004
8.0000e-005
8.5000e-004
0.0000 1.8000e-004
0.0000 1.8000e-004
5.0000e-005
0.0000 5.0000e-005
0.0000 0.1734 0.1734 1.0000e-005
0.0000 0.1736
Mitigated Construction Off-Site
3.6 Paving - 2018
ROG NOx CO SO2 Fugitive PM10
Exhaust PM10
PM10 Total
Fugitive PM2.5
Exhaust PM2.5
PM2.5 Total Bio- CO2 NBio- CO2 Total CO2 CH4 N2O CO2e
Category tons/yr MT/yr
Off-Road 5.0900e-003
0.0523 0.0450 7.0000e-005
3.0500e-003
3.0500e-003
2.8100e-003
2.8100e-003
0.0000 6.1073 6.1073 1.8700e-003
0.0000 6.1540
Paving 0.0000 0.0000 0.0000 0.0000 0.0000 0.0000 0.0000 0.0000 0.0000 0.0000 0.0000
Total 5.0900e-003
0.0523 0.0450 7.0000e-005
3.0500e-003
3.0500e-003
2.8100e-003
2.8100e-003
0.0000 6.1073 6.1073 1.8700e-003
0.0000 6.1540
Unmitigated Construction On-Site
CalEEMod Version: CalEEMod.2016.3.1 Date: 6/14/2017 3:47 PMPage 18 of 30
Gladstone Seniors Azusa - South Coast Air Basin, Annual

3.6 Paving - 2018
ROG NOx CO SO2 Fugitive PM10
Exhaust PM10
PM10 Total
Fugitive PM2.5
Exhaust PM2.5
PM2.5 Total Bio- CO2 NBio- CO2 Total CO2 CH4 N2O CO2e
Category tons/yr MT/yr
Hauling 0.0000 0.0000 0.0000 0.0000 0.0000 0.0000 0.0000 0.0000 0.0000 0.0000 0.0000 0.0000 0.0000 0.0000 0.0000 0.0000
Vendor 0.0000 0.0000 0.0000 0.0000 0.0000 0.0000 0.0000 0.0000 0.0000 0.0000 0.0000 0.0000 0.0000 0.0000 0.0000 0.0000
Worker 3.4000e-004
2.8000e-004
3.0400e-003
1.0000e-005
7.1000e-004
1.0000e-005
7.2000e-004
1.9000e-004
1.0000e-005
1.9000e-004
0.0000 0.6848 0.6848 2.0000e-005
0.0000 0.6854
Total 3.4000e-004
2.8000e-004
3.0400e-003
1.0000e-005
7.1000e-004
1.0000e-005
7.2000e-004
1.9000e-004
1.0000e-005
1.9000e-004
0.0000 0.6848 0.6848 2.0000e-005
0.0000 0.6854
Unmitigated Construction Off-Site
ROG NOx CO SO2 Fugitive PM10
Exhaust PM10
PM10 Total
Fugitive PM2.5
Exhaust PM2.5
PM2.5 Total Bio- CO2 NBio- CO2 Total CO2 CH4 N2O CO2e
Category tons/yr MT/yr
Off-Road 5.0900e-003
0.0523 0.0450 7.0000e-005
3.0500e-003
3.0500e-003
2.8100e-003
2.8100e-003
0.0000 6.1073 6.1073 1.8700e-003
0.0000 6.1540
Paving 0.0000 0.0000 0.0000 0.0000 0.0000 0.0000 0.0000 0.0000 0.0000 0.0000 0.0000
Total 5.0900e-003
0.0523 0.0450 7.0000e-005
3.0500e-003
3.0500e-003
2.8100e-003
2.8100e-003
0.0000 6.1073 6.1073 1.8700e-003
0.0000 6.1540
Mitigated Construction On-Site
CalEEMod Version: CalEEMod.2016.3.1 Date: 6/14/2017 3:47 PMPage 19 of 30
Gladstone Seniors Azusa - South Coast Air Basin, Annual

4.0 Operational Detail - Mobile
4.1 Mitigation Measures Mobile
3.6 Paving - 2018
ROG NOx CO SO2 Fugitive PM10
Exhaust PM10
PM10 Total
Fugitive PM2.5
Exhaust PM2.5
PM2.5 Total Bio- CO2 NBio- CO2 Total CO2 CH4 N2O CO2e
Category tons/yr MT/yr
Hauling 0.0000 0.0000 0.0000 0.0000 0.0000 0.0000 0.0000 0.0000 0.0000 0.0000 0.0000 0.0000 0.0000 0.0000 0.0000 0.0000
Vendor 0.0000 0.0000 0.0000 0.0000 0.0000 0.0000 0.0000 0.0000 0.0000 0.0000 0.0000 0.0000 0.0000 0.0000 0.0000 0.0000
Worker 3.4000e-004
2.8000e-004
3.0400e-003
1.0000e-005
7.1000e-004
1.0000e-005
7.2000e-004
1.9000e-004
1.0000e-005
1.9000e-004
0.0000 0.6848 0.6848 2.0000e-005
0.0000 0.6854
Total 3.4000e-004
2.8000e-004
3.0400e-003
1.0000e-005
7.1000e-004
1.0000e-005
7.2000e-004
1.9000e-004
1.0000e-005
1.9000e-004
0.0000 0.6848 0.6848 2.0000e-005
0.0000 0.6854
Mitigated Construction Off-Site
CalEEMod Version: CalEEMod.2016.3.1 Date: 6/14/2017 3:47 PMPage 20 of 30
Gladstone Seniors Azusa - South Coast Air Basin, Annual

ROG NOx CO SO2 Fugitive PM10
Exhaust PM10
PM10 Total
Fugitive PM2.5
Exhaust PM2.5
PM2.5 Total Bio- CO2 NBio- CO2 Total CO2 CH4 N2O CO2e
Category tons/yr MT/yr
Mitigated 0.0772 0.4153 1.0660 3.4100e-003
0.2679 3.9600e-003
0.2719 0.0718 3.7300e-003
0.0755 0.0000 314.0894 314.0894 0.0168 0.0000 314.5098
Unmitigated 0.0772 0.4153 1.0660 3.4100e-003
0.2679 3.9600e-003
0.2719 0.0718 3.7300e-003
0.0755 0.0000 314.0894 314.0894 0.0168 0.0000 314.5098
4.2 Trip Summary Information
4.3 Trip Type Information
Average Daily Trip Rate Unmitigated Mitigated
Land Use Weekday Saturday Sunday Annual VMT Annual VMT
Apartments Mid Rise 206.40 206.40 206.40 705,300 705,300
Total 206.40 206.40 206.40 705,300 705,300
Miles Trip % Trip Purpose %
Land Use H-W or C-W H-S or C-C H-O or C-NW H-W or C-W H-S or C-C H-O or C-NW Primary Diverted Pass-by
Apartments Mid Rise 14.70 5.90 8.70 40.20 19.20 40.60 86 11 3
5.0 Energy Detail
4.4 Fleet Mix
Land Use LDA LDT1 LDT2 MDV LHD1 LHD2 MHD HHD OBUS UBUS MCY SBUS MH
Apartments Mid Rise 0.548893 0.044275 0.199565 0.124385 0.017503 0.005874 0.020174 0.028962 0.001990 0.002015 0.004673 0.000702 0.000989
Historical Energy Use: N
CalEEMod Version: CalEEMod.2016.3.1 Date: 6/14/2017 3:47 PMPage 21 of 30
Gladstone Seniors Azusa - South Coast Air Basin, Annual
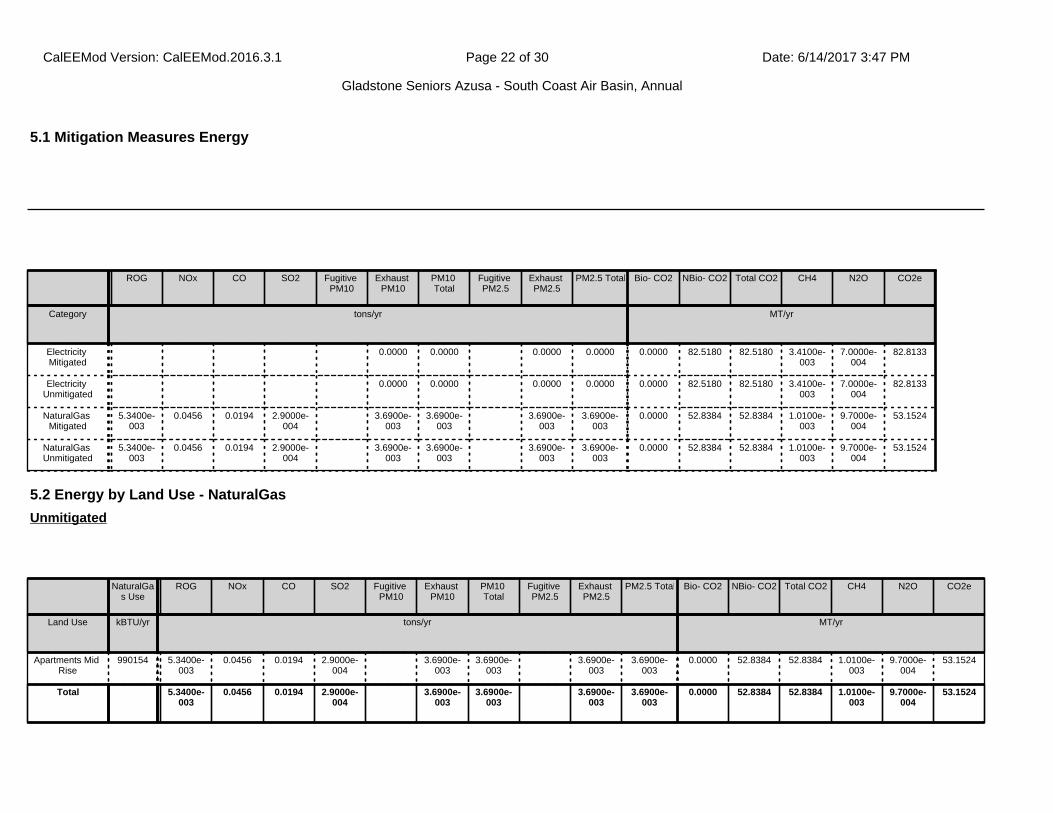
ROG NOx CO SO2 Fugitive PM10
Exhaust PM10
PM10 Total
Fugitive PM2.5
Exhaust PM2.5
PM2.5 Total Bio- CO2 NBio- CO2 Total CO2 CH4 N2O CO2e
Category tons/yr MT/yr
Electricity Mitigated
0.0000 0.0000 0.0000 0.0000 0.0000 82.5180 82.5180 3.4100e-003
7.0000e-004
82.8133
Electricity Unmitigated
0.0000 0.0000 0.0000 0.0000 0.0000 82.5180 82.5180 3.4100e-003
7.0000e-004
82.8133
NaturalGas Mitigated
5.3400e-003
0.0456 0.0194 2.9000e-004
3.6900e-003
3.6900e-003
3.6900e-003
3.6900e-003
0.0000 52.8384 52.8384 1.0100e-003
9.7000e-004
53.1524
NaturalGas Unmitigated
5.3400e-003
0.0456 0.0194 2.9000e-004
3.6900e-003
3.6900e-003
3.6900e-003
3.6900e-003
0.0000 52.8384 52.8384 1.0100e-003
9.7000e-004
53.1524
5.2 Energy by Land Use - NaturalGas
NaturalGas Use
ROG NOx CO SO2 Fugitive PM10
Exhaust PM10
PM10 Total
Fugitive PM2.5
Exhaust PM2.5
PM2.5 Total Bio- CO2 NBio- CO2 Total CO2 CH4 N2O CO2e
Land Use kBTU/yr tons/yr MT/yr
Apartments Mid Rise
990154 5.3400e-003
0.0456 0.0194 2.9000e-004
3.6900e-003
3.6900e-003
3.6900e-003
3.6900e-003
0.0000 52.8384 52.8384 1.0100e-003
9.7000e-004
53.1524
Total 5.3400e-003
0.0456 0.0194 2.9000e-004
3.6900e-003
3.6900e-003
3.6900e-003
3.6900e-003
0.0000 52.8384 52.8384 1.0100e-003
9.7000e-004
53.1524
Unmitigated
5.1 Mitigation Measures Energy
CalEEMod Version: CalEEMod.2016.3.1 Date: 6/14/2017 3:47 PMPage 22 of 30
Gladstone Seniors Azusa - South Coast Air Basin, Annual

5.2 Energy by Land Use - NaturalGas
NaturalGas Use
ROG NOx CO SO2 Fugitive PM10
Exhaust PM10
PM10 Total
Fugitive PM2.5
Exhaust PM2.5
PM2.5 Total Bio- CO2 NBio- CO2 Total CO2 CH4 N2O CO2e
Land Use kBTU/yr tons/yr MT/yr
Apartments Mid Rise
990154 5.3400e-003
0.0456 0.0194 2.9000e-004
3.6900e-003
3.6900e-003
3.6900e-003
3.6900e-003
0.0000 52.8384 52.8384 1.0100e-003
9.7000e-004
53.1524
Total 5.3400e-003
0.0456 0.0194 2.9000e-004
3.6900e-003
3.6900e-003
3.6900e-003
3.6900e-003
0.0000 52.8384 52.8384 1.0100e-003
9.7000e-004
53.1524
Mitigated
5.3 Energy by Land Use - Electricity
Electricity Use
Total CO2 CH4 N2O CO2e
Land Use kWh/yr MT/yr
Apartments Mid Rise
258985 82.5180 3.4100e-003
7.0000e-004
82.8133
Total 82.5180 3.4100e-003
7.0000e-004
82.8133
Unmitigated
CalEEMod Version: CalEEMod.2016.3.1 Date: 6/14/2017 3:47 PMPage 23 of 30
Gladstone Seniors Azusa - South Coast Air Basin, Annual
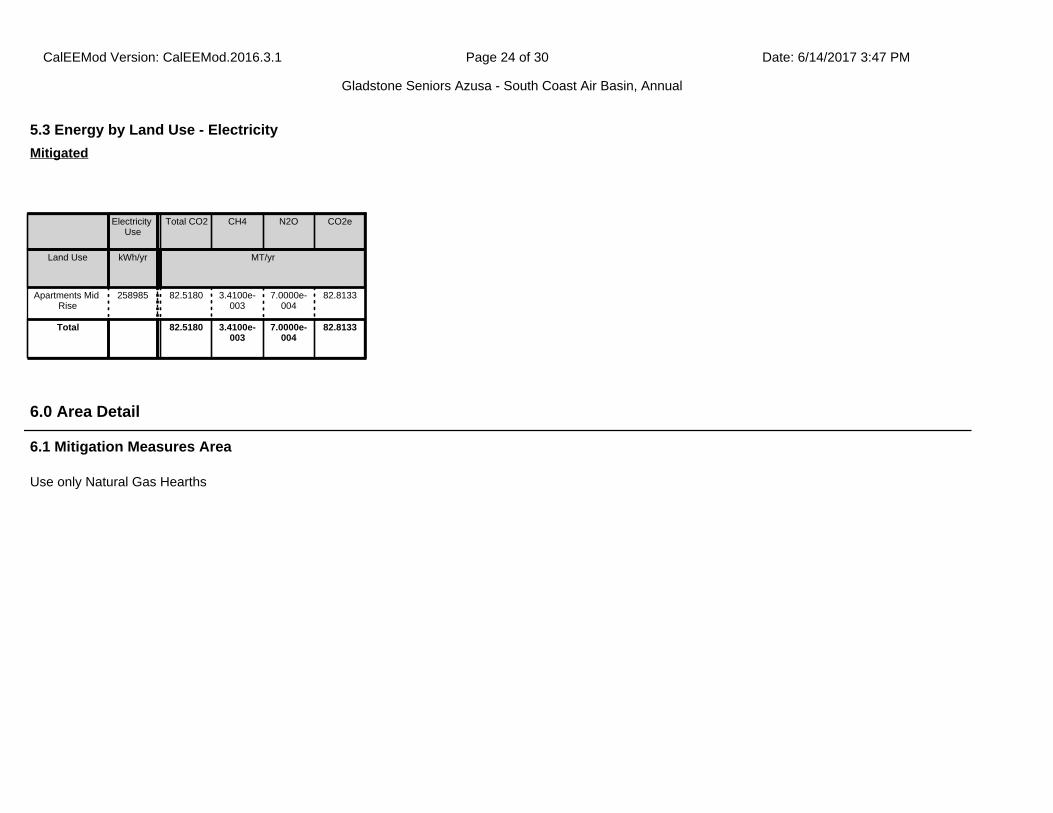
Use only Natural Gas Hearths
6.1 Mitigation Measures Area
6.0 Area Detail
5.3 Energy by Land Use - Electricity
Electricity Use
Total CO2 CH4 N2O CO2e
Land Use kWh/yr MT/yr
Apartments Mid Rise
258985 82.5180 3.4100e-003
7.0000e-004
82.8133
Total 82.5180 3.4100e-003
7.0000e-004
82.8133
Mitigated
CalEEMod Version: CalEEMod.2016.3.1 Date: 6/14/2017 3:47 PMPage 24 of 30
Gladstone Seniors Azusa - South Coast Air Basin, Annual
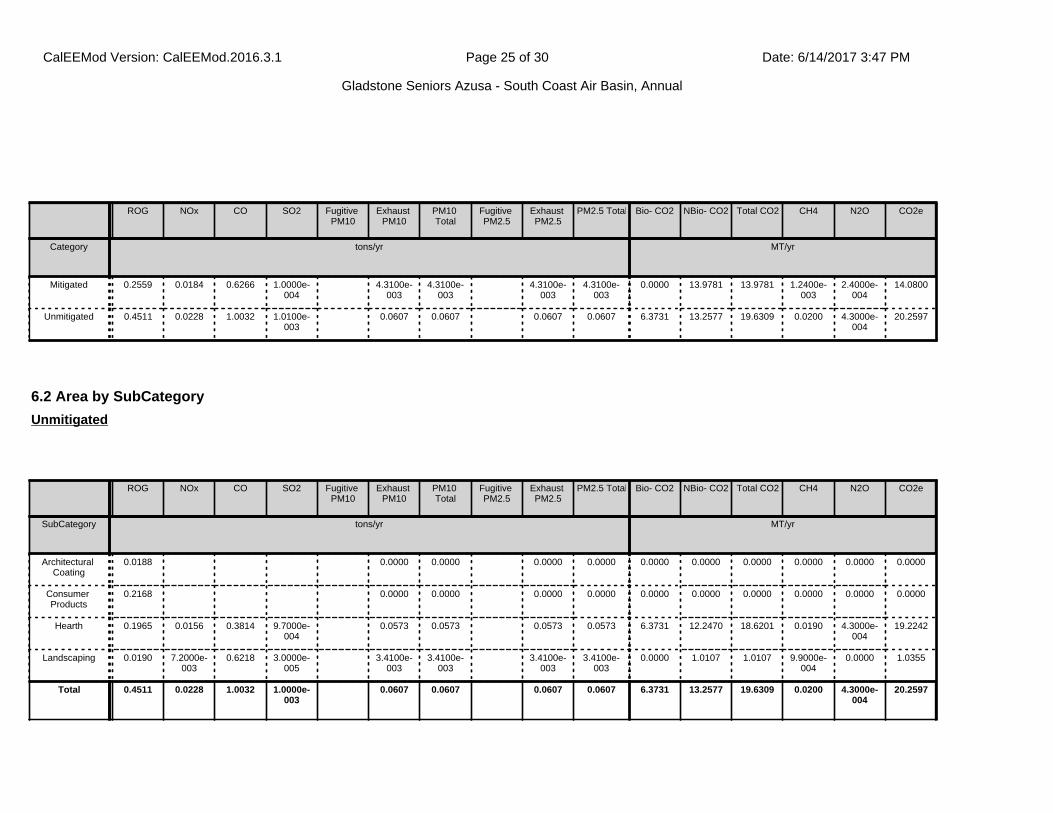
ROG NOx CO SO2 Fugitive PM10
Exhaust PM10
PM10 Total
Fugitive PM2.5
Exhaust PM2.5
PM2.5 Total Bio- CO2 NBio- CO2 Total CO2 CH4 N2O CO2e
Category tons/yr MT/yr
Mitigated 0.2559 0.0184 0.6266 1.0000e-004
4.3100e-003
4.3100e-003
4.3100e-003
4.3100e-003
0.0000 13.9781 13.9781 1.2400e-003
2.4000e-004
14.0800
Unmitigated 0.4511 0.0228 1.0032 1.0100e-003
0.0607 0.0607 0.0607 0.0607 6.3731 13.2577 19.6309 0.0200 4.3000e-004
20.2597
6.2 Area by SubCategory
ROG NOx CO SO2 Fugitive PM10
Exhaust PM10
PM10 Total
Fugitive PM2.5
Exhaust PM2.5
PM2.5 Total Bio- CO2 NBio- CO2 Total CO2 CH4 N2O CO2e
SubCategory tons/yr MT/yr
Architectural Coating
0.0188 0.0000 0.0000 0.0000 0.0000 0.0000 0.0000 0.0000 0.0000 0.0000 0.0000
Consumer Products
0.2168 0.0000 0.0000 0.0000 0.0000 0.0000 0.0000 0.0000 0.0000 0.0000 0.0000
Hearth 0.1965 0.0156 0.3814 9.7000e-004
0.0573 0.0573 0.0573 0.0573 6.3731 12.2470 18.6201 0.0190 4.3000e-004
19.2242
Landscaping 0.0190 7.2000e-003
0.6218 3.0000e-005
3.4100e-003
3.4100e-003
3.4100e-003
3.4100e-003
0.0000 1.0107 1.0107 9.9000e-004
0.0000 1.0355
Total 0.4511 0.0228 1.0032 1.0000e-003
0.0607 0.0607 0.0607 0.0607 6.3731 13.2577 19.6309 0.0200 4.3000e-004
20.2597
Unmitigated
CalEEMod Version: CalEEMod.2016.3.1 Date: 6/14/2017 3:47 PMPage 25 of 30
Gladstone Seniors Azusa - South Coast Air Basin, Annual
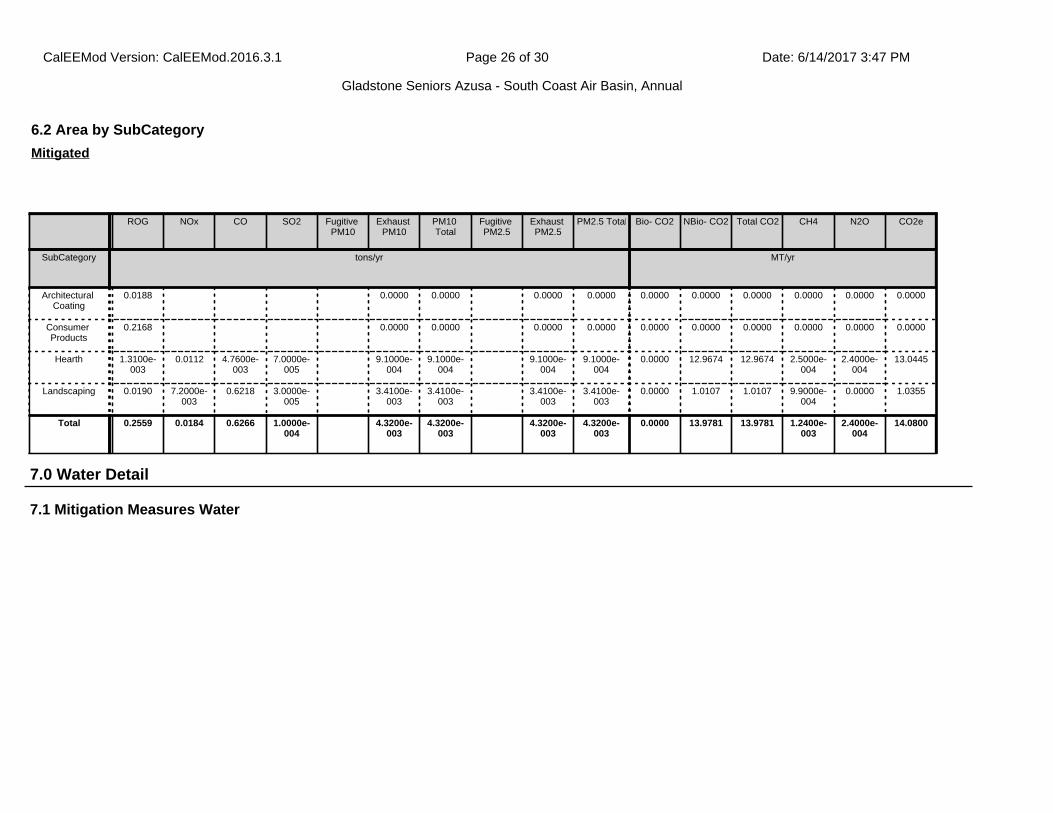
7.1 Mitigation Measures Water
7.0 Water Detail
6.2 Area by SubCategory
ROG NOx CO SO2 Fugitive PM10
Exhaust PM10
PM10 Total
Fugitive PM2.5
Exhaust PM2.5
PM2.5 Total Bio- CO2 NBio- CO2 Total CO2 CH4 N2O CO2e
SubCategory tons/yr MT/yr
Architectural Coating
0.0188 0.0000 0.0000 0.0000 0.0000 0.0000 0.0000 0.0000 0.0000 0.0000 0.0000
Consumer Products
0.2168 0.0000 0.0000 0.0000 0.0000 0.0000 0.0000 0.0000 0.0000 0.0000 0.0000
Hearth 1.3100e-003
0.0112 4.7600e-003
7.0000e-005
9.1000e-004
9.1000e-004
9.1000e-004
9.1000e-004
0.0000 12.9674 12.9674 2.5000e-004
2.4000e-004
13.0445
Landscaping 0.0190 7.2000e-003
0.6218 3.0000e-005
3.4100e-003
3.4100e-003
3.4100e-003
3.4100e-003
0.0000 1.0107 1.0107 9.9000e-004
0.0000 1.0355
Total 0.2559 0.0184 0.6266 1.0000e-004
4.3200e-003
4.3200e-003
4.3200e-003
4.3200e-003
0.0000 13.9781 13.9781 1.2400e-003
2.4000e-004
14.0800
Mitigated
CalEEMod Version: CalEEMod.2016.3.1 Date: 6/14/2017 3:47 PMPage 26 of 30
Gladstone Seniors Azusa - South Coast Air Basin, Annual
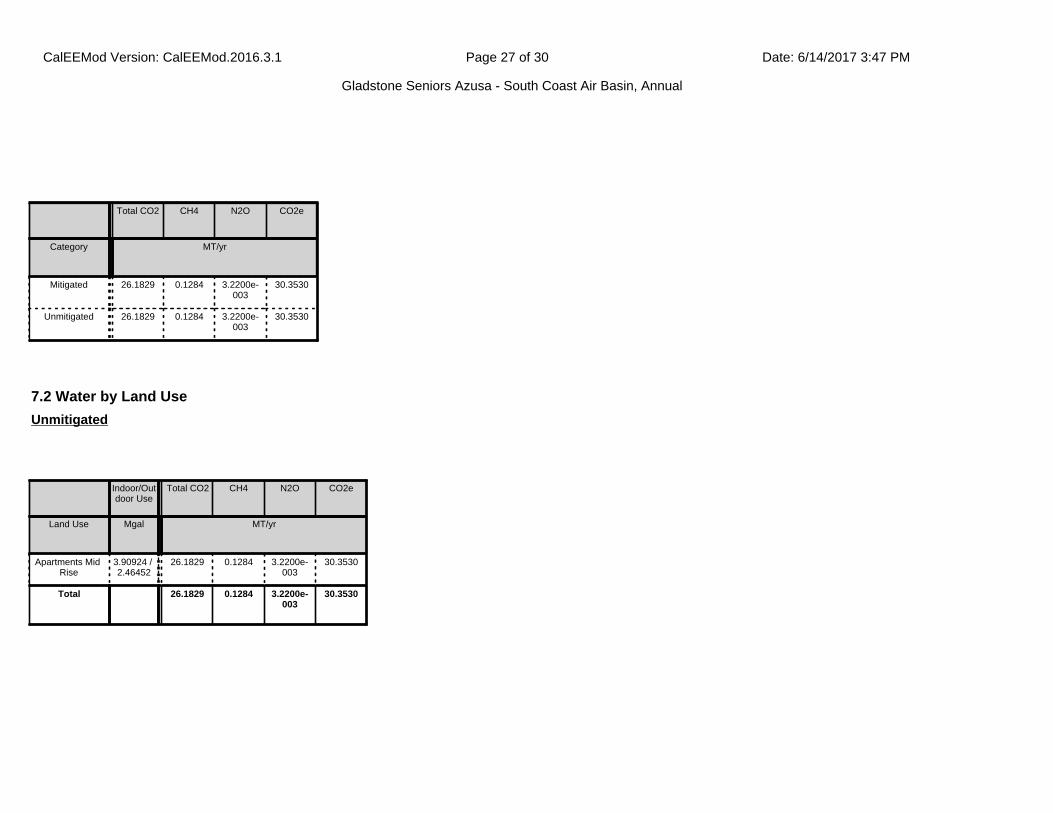
Total CO2 CH4 N2O CO2e
Category MT/yr
Mitigated 26.1829 0.1284 3.2200e-003
30.3530
Unmitigated 26.1829 0.1284 3.2200e-003
30.3530
7.2 Water by Land Use
Indoor/Outdoor Use
Total CO2 CH4 N2O CO2e
Land Use Mgal MT/yr
Apartments Mid Rise
3.90924 / 2.46452
26.1829 0.1284 3.2200e-003
30.3530
Total 26.1829 0.1284 3.2200e-003
30.3530
Unmitigated
CalEEMod Version: CalEEMod.2016.3.1 Date: 6/14/2017 3:47 PMPage 27 of 30
Gladstone Seniors Azusa - South Coast Air Basin, Annual

8.1 Mitigation Measures Waste
7.2 Water by Land Use
Indoor/Outdoor Use
Total CO2 CH4 N2O CO2e
Land Use Mgal MT/yr
Apartments Mid Rise
3.90924 / 2.46452
26.1829 0.1284 3.2200e-003
30.3530
Total 26.1829 0.1284 3.2200e-003
30.3530
Mitigated
8.0 Waste Detail
Total CO2 CH4 N2O CO2e
MT/yr
Mitigated 5.6026 0.3311 0.0000 13.8801
Unmitigated 5.6026 0.3311 0.0000 13.8801
Category/Year
CalEEMod Version: CalEEMod.2016.3.1 Date: 6/14/2017 3:47 PMPage 28 of 30
Gladstone Seniors Azusa - South Coast Air Basin, Annual

8.2 Waste by Land Use
Waste Disposed
Total CO2 CH4 N2O CO2e
Land Use tons MT/yr
Apartments Mid Rise
27.6 5.6026 0.3311 0.0000 13.8801
Total 5.6026 0.3311 0.0000 13.8801
Unmitigated
Waste Disposed
Total CO2 CH4 N2O CO2e
Land Use tons MT/yr
Apartments Mid Rise
27.6 5.6026 0.3311 0.0000 13.8801
Total 5.6026 0.3311 0.0000 13.8801
Mitigated
9.0 Operational Offroad
Equipment Type Number Hours/Day Days/Year Horse Power Load Factor Fuel Type
CalEEMod Version: CalEEMod.2016.3.1 Date: 6/14/2017 3:47 PMPage 29 of 30
Gladstone Seniors Azusa - South Coast Air Basin, Annual
11.0 Vegetation
10.0 Stationary Equipment
Fire Pumps and Emergency Generators
Equipment Type Number Hours/Day Hours/Year Horse Power Load Factor Fuel Type
Boilers
Equipment Type Number Heat Input/Day Heat Input/Year Boiler Rating Fuel Type
User Defined Equipment
Equipment Type Number
CalEEMod Version: CalEEMod.2016.3.1 Date: 6/14/2017 3:47 PMPage 30 of 30
Gladstone Seniors Azusa - South Coast Air Basin, Annual
Related Documents
![Appendix B TOC (AQ and GHG)...Draft Environmental Impact Report (Draft EIR) [State Clearinghouse No. 2012091037] for Los Angeles International Airport (LAX) West Aircraft Maintenance](https://static.cupdf.com/doc/110x72/5fdab3571ac10c38a76f3e65/appendix-b-toc-aq-and-ghg-draft-environmental-impact-report-draft-eir-state.jpg)