APPENDIX 7 GEOTECHNICAL INVESTIGATION (DOUGLAS PARTNERS)

Welcome message from author
This document is posted to help you gain knowledge. Please leave a comment to let me know what you think about it! Share it to your friends and learn new things together.
Transcript

APPENDIX 7
GEOTECHNICAL INVESTIGATION (DOUGLAS PARTNERS)

Report on Geotechnical Investigation
Proposed Residential Development Lot 3 and Lot 15597 Wilkins Street
Bellevue, WA
Prepared for Morefield Holdings
Project 82426.01 March 2015

Report on Geotechnical Investigation Project 82426.01 Lot 3 and Lot 15597 Wilkins Street, Bellevue, WA March 2015
Table of Contents
Page
1. Introduction ................................................................................................................... 1
2. Site Description ............................................................................................................ 2
3. Field Work Methods ...................................................................................................... 2
4. Field Work Results ........................................................................................................ 3
4.1 Ground Conditions ............................................................................................... 3
4.2 Groundwater ........................................................................................................ 3
4.3 Permeability Testing ............................................................................................ 4
5. Laboratory Testing ........................................................................................................ 4
6. Proposed Development ................................................................................................ 5
7. Comments .................................................................................................................... 6
7.1 Suitability of the Site for Development ................................................................. 6
7.2 Site Classification ................................................................................................ 6
7.3 Site Preparation ................................................................................................... 7
7.4 Design Parameters for Earth Retaining Systems ............................................... 11
7.5 Foundation Design ............................................................................................ 12
7.6 Pavement Design Parameters ........................................................................... 13
7.7 Soil Permeability ................................................................................................ 14
8. References ................................................................................................................. 14
9. Limitations .................................................................................................................. 14
Appendix A: About this Report
Appendix B: Drawings
Appendix C: Results of Field Work
Appendix D: Geotechnical Laboratory Testing

Page 1 of 15
Report on Geotechnical Investigation Project 82426.01 Lot 3 and Lot 15597 Wilkins Street, Bellevue, WA March 2015
Report on Geotechnical Investigation
Proposed Residential Development
Lot 3 and Lot 15597 Wilkins Street, Bellevue, WA
1. Introduction
This report presents the results of a geotechnical investigation undertaken by Douglas Partners Pty
Ltd (DP) for a proposed residential development located at Lot 3 and Lot 15597 Wilkins Street in
Bellevue, Western Australia. The investigation was commissioned on 21 January 2015, by
Mr Burditt Krost of Strategic Planning Institute P/L, and was undertaken in accordance with DP’s
proposal dated 18 December 2014.
It is understood that the site will be redeveloped with townhouses up to two storeys in height,
apartment buildings up to three storeys in height and associated access roads and car parking areas.
It is also understood that the existing Bellevue Primary School Building at the north eastern corner of
the site, will form part of the proposed development.
The objective of the geotechnical investigation was to assess the soil and groundwater conditions
underlying the site and subsequently provide comments and recommendations on:
• The suitability of the site for the proposed development;
• A description of the sub-surface conditions;
• The likely site classification in accordance with the requirements of AS 2870-2011, and
earthworks requirements to achieve Class A and Class S, where required;
• Likely thickness of sand filling to achieve a targeted site classification;
• Suitable site preparation and earthworks. Site preparation and earthworks requirements, likely
excavation conditions, compaction, recommended batter slopes and suitable materials for
structural filling;
• Appropriate foundation system(s) for the proposed structures;
• Recommended pavement design parameters including California bearing ratios;
• Assessment of the permeability of the soils and comment on the suitability of stormwater
disposal; and
• The depth to groundwater, if encountered.
The investigation included the excavation of seven test pits, two in situ permeability tests and
laboratory testing on selected samples.
Page 2 of 15
Report on Geotechnical Investigation Project 82426.01 Lot 3 and Lot 15597 Wilkins Street, Bellevue, WA March 2015
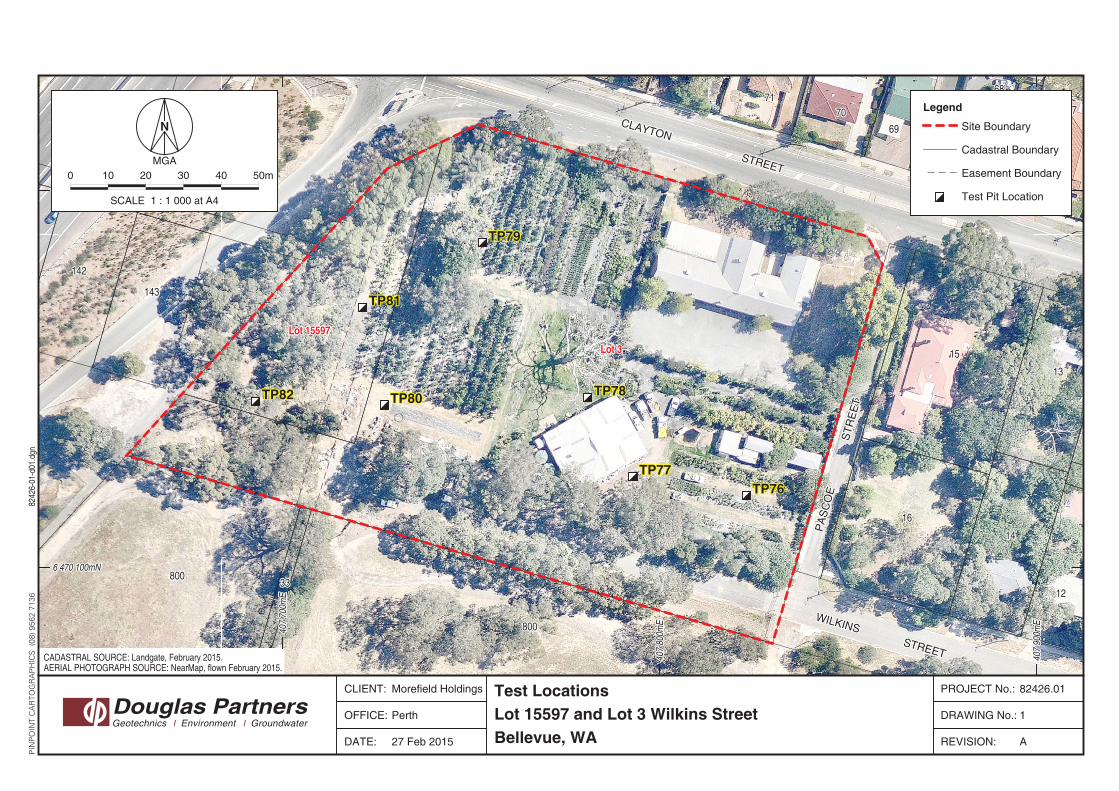
2. Site Description
The site comprises a trapezoidal shaped area of approximately 1.6 ha and is identified as Lot 3 and
Lot 15597 Wilkins Street in Bellevue, Western Australia. It is bounded by Clayton Street to the north,
Wilkins Street to the south, Pascoe Street to the east and Roe Highway on ramp to the west.
At the time of the investigation, the site was operating as a tree nursery, however it is understood from
Strategic Planning Institute P/L that it previously comprised Bellevue Primary School, with several
single storey buildings still present in the eastern part of the site. Several asphalt paved areas were
also present between the school buildings, and rows of potted plants were present across the open
parts of the site. The natural vegetation across the site comprised short grass and trees
approximately 10 m in height, generally located around the site boundaries. A stockpile of waste
building materials was observed at the south western corner of the site. The site surface was
relatively flat, with site levels generally sloping from RL 16.5 m AHD at the north eastern corner, to
RL 16.1 m AHD at south western corner the of the site.
The Perth 1:50 000 Environmental Geology sheet indicates that shallow sub surface conditions at the
site consist of pebbly silt of alluvial origin of the Guildford Formation, and is described as brown silt,
with common fine to coarse grained, subrounded laterite quartz sand and heavily weathered granite
pebbles.
Published ASS risk mapping indicates that the site is generally mapped as “no known risk of acid
sulphate soils occurring within 3 m of natural soil surface”. However, areas of “high to moderate risk of
acid sulphate soils occurring within 3 m of natural soil surface”, are shown approximately 200 m to the
northeast and 400 m to the northwest of the site.
The Perth Groundwater Atlas (2004) indicates that the groundwater was at a level of between
RL 8 m AHD and RL 9 m AHD in May 2003, which is at least 7 m below the lowest site level. The
above information from the Perth Groundwater Atlas (2004) should be treated with caution at this site.
3. Field Work Methods
Field work was carried out on 11 February 2015 and comprised the excavation of seven test pits, two
in situ permeability tests and dynamic penetrometer testing adjacent to each test pit location.
The test pits (TP76 to TP82) were excavated to a maximum depth of 3.0 m using an 8 tonne excavator
equipped with a 600 mm wide toothed bucket and were logged in general accordance with
AS1726-1993 by a suitably experienced geotechnical engineer from DP. Soil samples were recovered
from selected locations for subsequent laboratory testing.
The DCP tests were carried out adjacent to the test pit locations and in accordance with
AS 1289.6.3.2, to assess the in situ density of the shallow soils.
Two in situ permeability tests were carried out using the constant head method at TP81 and TP82 at
depths of 1.0 m and 0.3 m, respectively.

Page 3 of 15
Report on Geotechnical Investigation Project 82426.01 Lot 3 and Lot 15597 Wilkins Street, Bellevue, WA March 2015
Test locations were determined using GPS coordinates and are marked on Drawing 1 in Appendix B.
The surface elevations at each test location were surveyed by Strategic Planning Institute P/L, and are
quoted in m AHD.
4. Field Work Results
4.1 Ground Conditions
Detailed logs of the ground conditions and results of the field testing are presented in Appendix C,
together with notes defining descriptive terms and classification methods.
Ground conditions generally comprise stiff to very stiff cohesive materials of the Guildford Formation to
a maximum test termination depth of 3.0 m at TP78.
Topsoil approximately 0.12 m in thickness was recorded overlying the above materials at TP82, where
vegetation was present (i.e. no topsoil was recorded in hardstanding or filling areas).
Filling materials were generally poorly to well compacted and observed to contain varying amounts
clay, gravel, bricks, concrete, wire, glass, pipes and wood. This layer was recorded overlying the
Guildford Formation, to depths of between 0.4 m at TP79 and more than 1.2 m at TP81. Poorly
compacted filling materials were recorded at TP76, TP78 and TP81.
The depths below existing surface level and relative level to the base of the filling materials, is
summarised in Table 1.
Table 1: Summary of Depth to the Base of Filling and Approximate Relative Levels
Test Location
Ground Surface
Level
(m AHD)[1]
Depth to Base of Filling
(m)
Level to Base of Filling
(m AHD)[1]
TP76 16.50 0.50 16.00
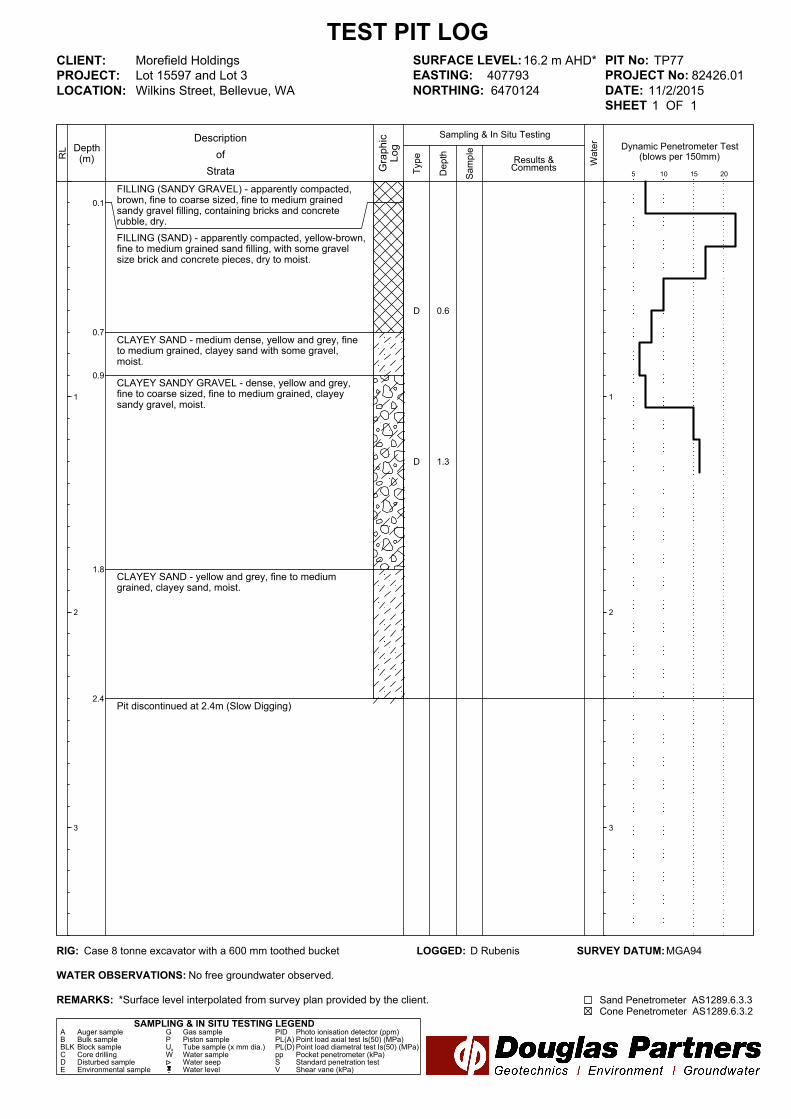
TP77 16.20 0.70 15.50
TP78 16.40 0.60 15.80
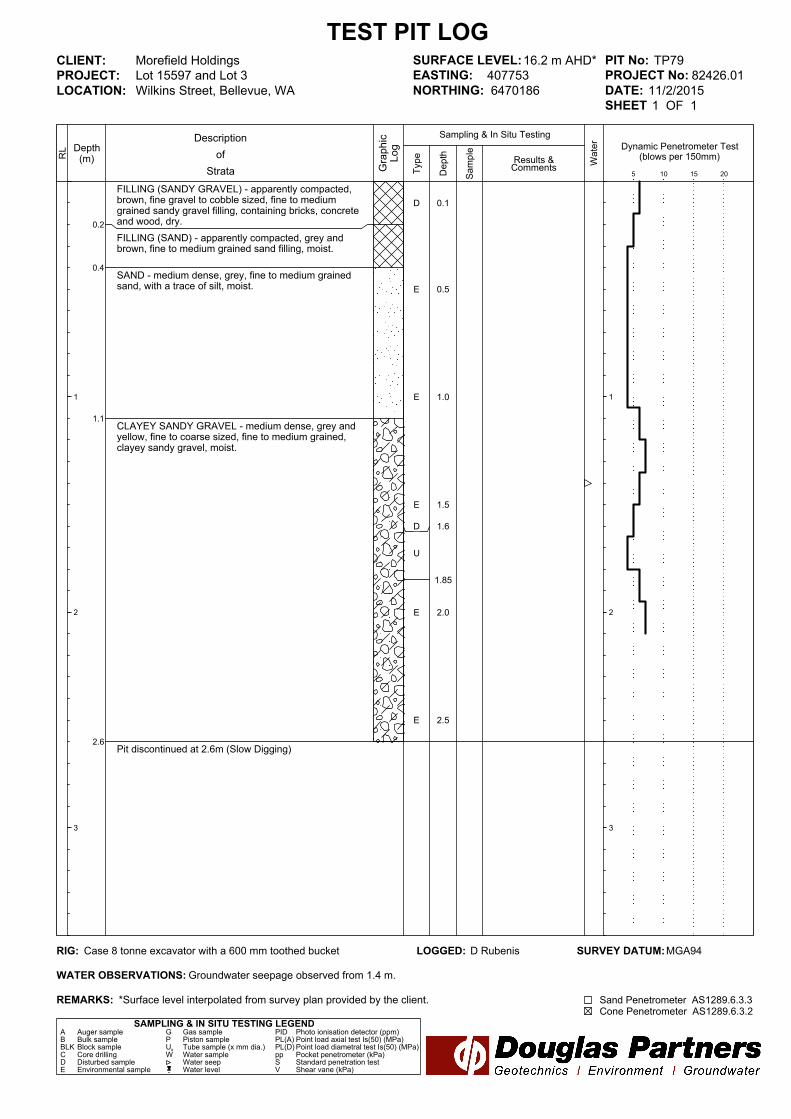
TP79 16.20 0.40 15.80
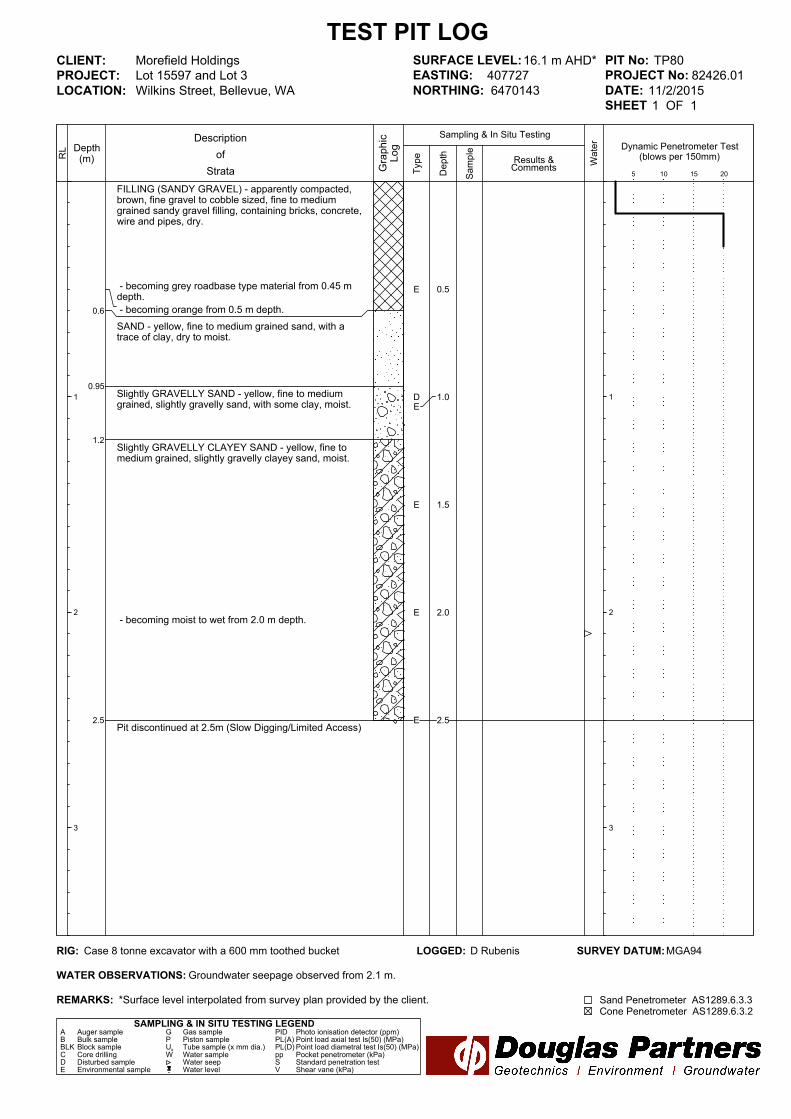
TP80 16.10 0.60 15.50
TP81 16.10 >1.2[2] <14.90
[2]
Notes: [1] Surface level surveyed by the client.
[2] A concrete pipe was encountered at the base of the test pit, and thus the increased thickness of filling is possibly localised.
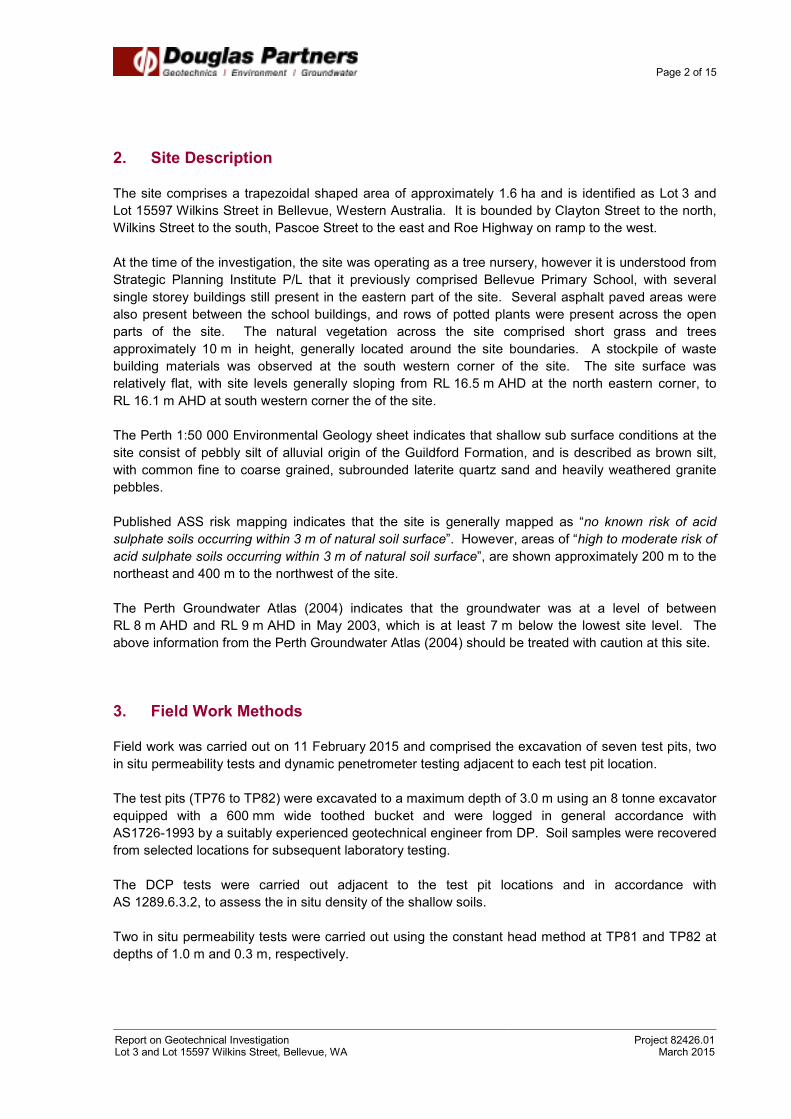
4.2 Groundwater
Groundwater seepages were observed at three test pit locations excavated on 11 February 2015. The
test pits were immediately backfilled following sampling, which precluded longer-term monitoring of
Page 4 of 15
Report on Geotechnical Investigation Project 82426.01 Lot 3 and Lot 15597 Wilkins Street, Bellevue, WA March 2015
groundwater levels. Groundwater seepage levels are summarised in Table 2 and are recorded on the
test pit logs in Appendix C.
Table 2: Summary of Observed Groundwater Seepage Levels on 11 February 2015
Test Location Ground Surface Level
(m AHD)[1]
Groundwater Seepage
Depth
(m)
Groundwater
Seepage Level
(m AHD) [2]
TP78 16.40 1.30 15.10
TP79 16.20 1.40 14.80
TP80 16.10 2.10 14.00 Notes: [1] Surface level surveyed by the client
[2]: Groundwater Level = Surface Level – Groundwater Depth.
It should be noted that groundwater levels are affected by climatic conditions and soil permeability and
will therefore vary with time.
4.3 Permeability Testing
Two in situ permeability tests were carried out using the constant head method at TP81 and TP82 at
depths of 1.0 m and 0.3 m, respectively. Field permeability values were estimated using the method
described in AS1547 App.4.1F. Results of the permeability analysis are summarised in Table 3.
Table 3: Summary of In Situ Permeability Testing
Test Location Depth
(m)
Measured Permeability
(m/s)
Material
TP81 1.0 2.2 x 10⁻⁵ Filling (Sandy Clay with some gravel)
TP82 0.3 4.0 x 10⁻⁵ Slightly Clayey Sandy Gravel
5. Laboratory Testing
A geotechnical laboratory testing programme was carried out on selected soil samples by a NATA
registered laboratory. Testing included the determination of the:
• Particle size distribution on three samples,
• Atterberg limits and linear shrinkage on two samples,
• Maximum modified dry density (MMDD) on one sample,
• California bearing ratio (CBR) on one sample,
• Shrink swell index on one sample.
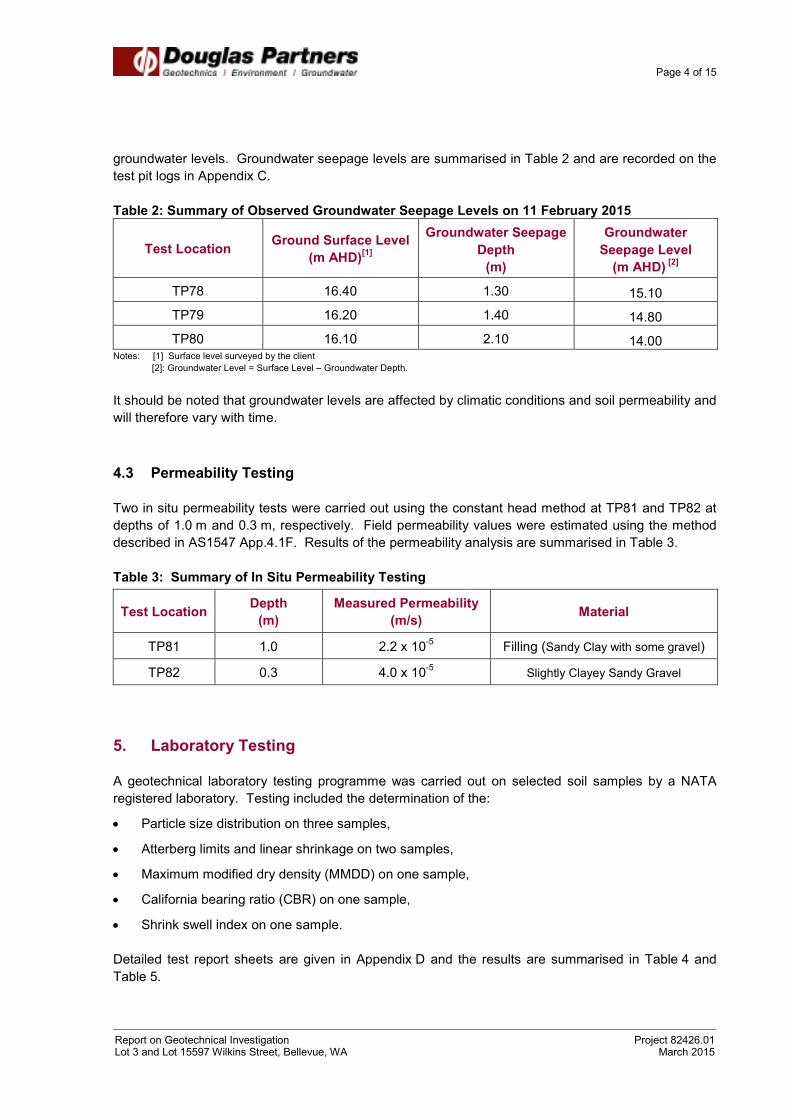
Detailed test report sheets are given in Appendix D and the results are summarised in Table 4 and
Table 5.
Page 5 of 15
Report on Geotechnical Investigation Project 82426.01 Lot 3 and Lot 15597 Wilkins Street, Bellevue, WA March 2015
Table 4: Summary of Laboratory Testing for Soil Classification
Test Depth
(m)
Fines
(%)
Sand
(%)
Gravel
(%)
LL
(%)
PL
(%)
PI
(%)
LS
(%)
Iss
(%) Material
TP76 2.1 68 31 1 59 17 42 11 - Sandy Clay with a trace of gravel
TP81 0.8 – 1.1 53 37 10 39 14 25 9 0.9 Filling (Sandy Clay with some gravel)
TP82 0.8 19 42 39 - - - - - Slightly Clayey Sandy Gravel
Notes:
-The % fines is the amount of particles smaller than 75 µm;
- LL: liquid limit - LS: linear shrinkage
- PL: plastic limit - Iss: shrink-swell index.
- PI: plasticity index - ‘-‘ means ‘Not Tested’
Table 5: Summary of Laboratory Testing for Pavement Design Parameters
Test Depth (m) OMC (%) MMDD (t/m3) CBR (%) Swell (%) Material
TP82 0.8 10 2.02 40 0 Slightly Clayey Sandy Gravel
Notes: - OMC: optimum moisture content - CBR: California Bearing Ratio - MMDD: modified maximum dry density
6. Proposed Development
It is understood that the proposed residential development is to comprise:
• Townhouses up to two storeys in height along the southern and eastern site boundaries of the
site;
• Apartment blocks up to three storeys in height at the central part, along the western site boundary
and at the north western corner of the site; and
• Associated roadways and public open space areas.
It is also understood that the existing Bellevue Primary School Building at the north eastern corner of
the site, is to be left in place, forming part of the proposed development.
Page 6 of 15
Report on Geotechnical Investigation Project 82426.01 Lot 3 and Lot 15597 Wilkins Street, Bellevue, WA March 2015
7. Comments
7.1 Suitability of the Site for Development
The results of the investigation indicate that ground conditions across the site generally consist of
granular filling overlying granular and cohesive materials of the Guildford Formation, except at TP82
where filling was not recorded. The base of the filling materials generally varied between 0.4 m and
more than 1.2 m below existing ground level, as described in Table 1.
Groundwater seepages were encountered in some of the test pits, at depths of between 1.2 m and
2.1 m below existing ground level on 11 February 2015. Shallow clayey soils and groundwater are
likely to impose some limitations or possibly preclude on site stormwater disposal using soakwells at
this site. However this is dependent on the finished levels of the project (see Section 7.7 for more
details).
From a geotechnical standpoint, the land is physically capable of development for the proposed
buildings, provided that the provisions outlined in the subsequent subsections of the report are taken
into consideration, and recommendations are implemented.
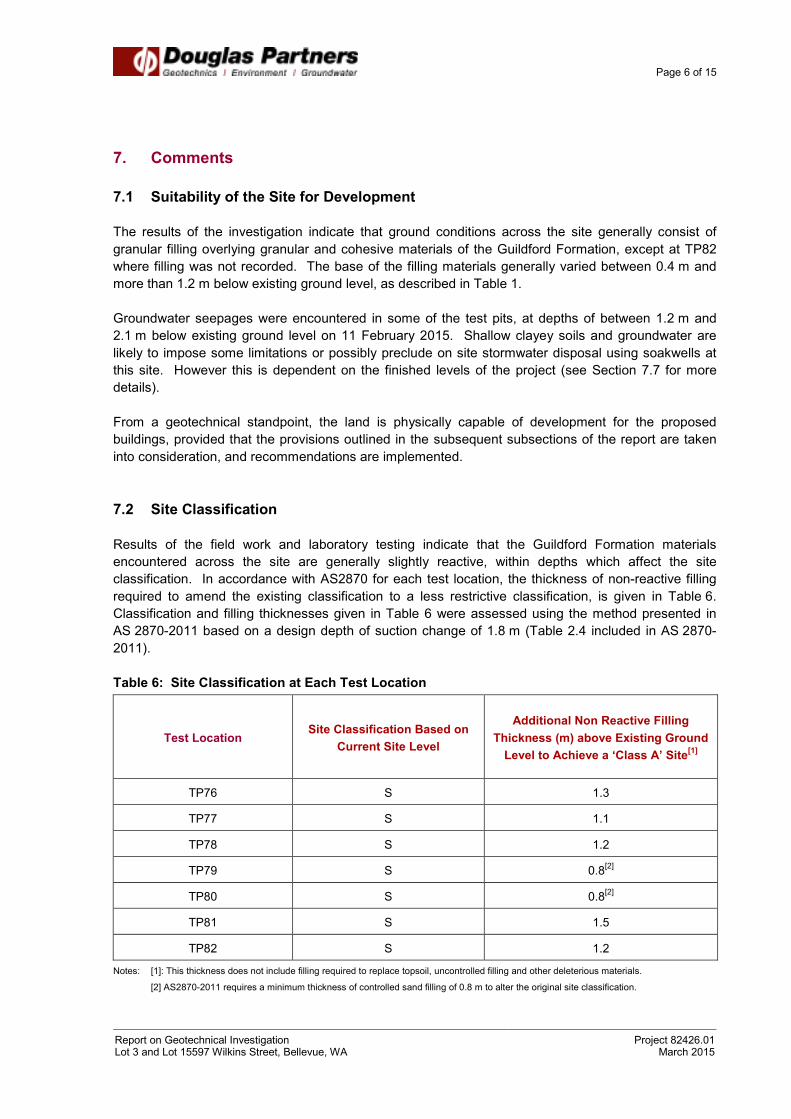
7.2 Site Classification
Results of the field work and laboratory testing indicate that the Guildford Formation materials
encountered across the site are generally slightly reactive, within depths which affect the site
classification. In accordance with AS2870 for each test location, the thickness of non-reactive filling
required to amend the existing classification to a less restrictive classification, is given in Table 6.
Classification and filling thicknesses given in Table 6 were assessed using the method presented in
AS 2870-2011 based on a design depth of suction change of 1.8 m (Table 2.4 included in AS 2870-
2011).
Table 6: Site Classification at Each Test Location
Test Location Site Classification Based on
Current Site Level
Additional Non Reactive Filling
Thickness (m) above Existing Ground
Level to Achieve a ‘Class A’ Site[1]
TP76 S 1.3
TP77 S 1.1
TP78 S 1.2
TP79 S 0.8[2]
TP80 S 0.8[2]
TP81 S 1.5
TP82 S 1.2
Notes: [1]: This thickness does not include filling required to replace topsoil, uncontrolled filling and other deleterious materials.
[2] AS2870-2011 requires a minimum thickness of controlled sand filling of 0.8 m to alter the original site classification.
Page 7 of 15
Report on Geotechnical Investigation Project 82426.01 Lot 3 and Lot 15597 Wilkins Street, Bellevue, WA March 2015
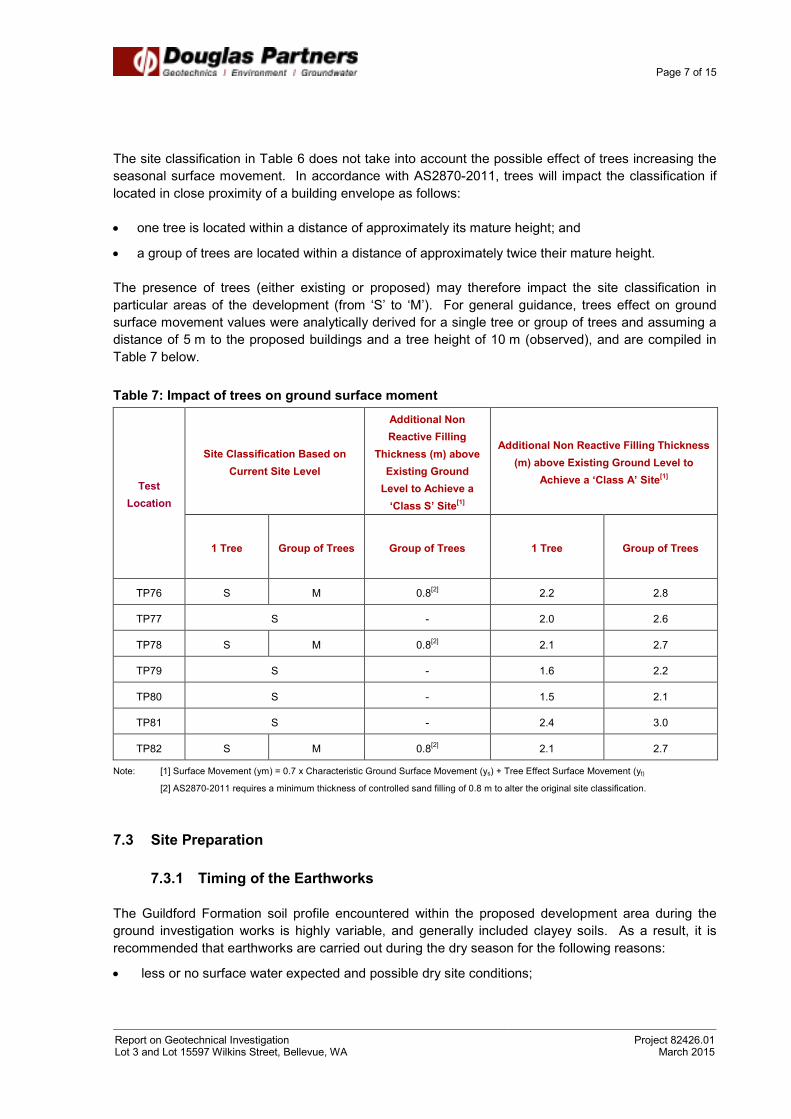
The site classification in Table 6 does not take into account the possible effect of trees increasing the
seasonal surface movement. In accordance with AS2870-2011, trees will impact the classification if
located in close proximity of a building envelope as follows:
• one tree is located within a distance of approximately its mature height; and
• a group of trees are located within a distance of approximately twice their mature height.
The presence of trees (either existing or proposed) may therefore impact the site classification in
particular areas of the development (from ‘S’ to ‘M’). For general guidance, trees effect on ground
surface movement values were analytically derived for a single tree or group of trees and assuming a
distance of 5 m to the proposed buildings and a tree height of 10 m (observed), and are compiled in
Table 7 below.
Table 7: Impact of trees on ground surface moment
Test
Location
Site Classification Based on
Current Site Level
Additional Non
Reactive Filling
Thickness (m) above
Existing Ground
Level to Achieve a
‘Class S’ Site[1]
Additional Non Reactive Filling Thickness
(m) above Existing Ground Level to
Achieve a ‘Class A’ Site[1]
1 Tree Group of Trees Group of Trees 1 Tree Group of Trees
TP76 S M 0.8[2] 2.2 2.8
TP77 S - 2.0 2.6
TP78 S M 0.8[2] 2.1 2.7
TP79 S - 1.6 2.2
TP80 S - 1.5 2.1
TP81 S - 2.4 3.0
TP82 S M 0.8[2] 2.1 2.7
Note: [1] Surface Movement (ym) = 0.7 x Characteristic Ground Surface Movement (ys) + Tree Effect Surface Movement (yt)
[2] AS2870-2011 requires a minimum thickness of controlled sand filling of 0.8 m to alter the original site classification.
7.3 Site Preparation
7.3.1 Timing of the Earthworks
The Guildford Formation soil profile encountered within the proposed development area during the
ground investigation works is highly variable, and generally included clayey soils. As a result, it is
recommended that earthworks are carried out during the dry season for the following reasons:
• less or no surface water expected and possible dry site conditions;

Page 8 of 15
Report on Geotechnical Investigation Project 82426.01 Lot 3 and Lot 15597 Wilkins Street, Bellevue, WA March 2015
• reducing the water management needs, if any, compared to wet season;
• better plant trafficability; and
• handling, conditioning and compacting the subgrade should be easier.
In the event that the earthworks are programmed to be undertaken in winter, it is recommended that
an earthworks contractor with successful experience in working with clayey materials in wet
conditions, be selected.
7.3.2 Stripping
All topsoil, vegetation and deleterious material such as the stockpile of waste building materials
observed at the south western corner of the site, should be stripped from building envelopes and
pavement areas. Tree roots remaining from any clearing operations should be completely removed.
A visual assessment indicates that the topsoil is generally sandy with some organic materials
(rootlets). Topsoil could be re-used as non-structural filling and for landscaping purposes, or blended
with clean sand to form a structural filling material of low organic content. It should be noted that
blended topsoil is anticipated to have a lower permeability than clean sand, and therefore possible
implication on drainage design will need to be considered.
7.3.3 Removal of Existing Filling
Bricks, concrete, wire, glass, pipes and wood were recorded during the ground investigation works
within the filling material at TP76, TP77 and TP79 to TP81 locations. Although not recorded at TP78
and TP82, the possibility of the above mentioned foreign materials be present within these parts of the
site cannot be precluded at this stage.
Based on the above, it is considered that the encountered filling forms an unsuitable foundation
material in its current condition, with possible unpredictable settlements occuring if shallow footings
were constructed on this uncontrolled filling. Also, excavating this material will preclude any risk of
detrimental perception of the proposed development if any debris are excavated by a lot owner
following completion of the development.
As such, it is recommended that this material be excavated and removed from site or treated as
outlined in Section 7.3.8 if re-used as structural filling.
Anticipated excavation depths for removal of possible uncontrolled filling, are presented in Table 1.
7.3.4 Proof Rolling and Compaction
It is recommended that following the excavation of the uncontrolled filling and prior to any filling, the
natural subgrade be assessed by a geotechnical engineer to assess the suitability and in particular to
determine whether uncontrolled filling, previous natural topsoil, deletrious materials, vegetation or
roots remain at the original surface level. Any such materials will require removal and the excavations
backfilled with material of similar geotechnical properties to the surrounding ground.

Page 9 of 15
Report on Geotechnical Investigation Project 82426.01 Lot 3 and Lot 15597 Wilkins Street, Bellevue, WA March 2015
The in situ granular materials of the Guildford Formation encountered beneath the filling were
generally medium dense to dense. However, some very loose and loose materials were encountered
to depths up to 1.95 m at two locations (TP76 and TP78), and can occur at other locations owing to
the intrinsic variation of the Guildford Formation.
Therefore, it is recommended that proof rolling be undertaken as described below.
Once the natural subgrade has been assessed by a geotechnical engineer, it is recommended that the
exposed subgrade beneath the building and pavement envelopes be proof rolled using a heavy roller
(14 tonne minimum deadweight) under geotechnical supervision. Any areas that show signs of
excessive deformation during compaction should be continually compacted until deformation ceases
or, alternatively, the poor quality material should be excavated and replaced with suitable structural
filling compacted to achieve a dry density ratio of not less than 95% relative to modified compaction for
granular subgrade (i.e. sand) and 95% relative to standard compaction for cohesive (i.e. clayey)
subgrade. Other compaction criteria apply within pavement areas, as detailed in Section 7.6.
The use of vibratory modes should be at the discretion of the earthworks contractor based on the
encountered subgrade, the depth to groundwater, and the size and type of compaction plant. A
smooth drum roller is preferred to compact sandy subgrade and a sheepfoot roller to compact clayey
subgrade. The use of vibration is not recommended to compact clayey subgrade or where shallow
groundwater is within the depth of influence of the roller. Furthermore, static mode should be adopted
within a distance of approximately 10 m of any existing structures.
Compaction control of the sand could be carried out using a Perth sand penetrometer (PSP) test in
accordance with test method AS 1289.6.3.3. It should be noted that PSP is not suitable for granular
materials with particles larger than 2 mm. It is suggested that the sand subgrade should be
compacted to achieve a minimum blow count of 8 blows per 300 mm rod penetration to a depth of not
less than 1.0 m below foundation level. It should be noted that this compaction level has not been
directly correlated to a dry density of 95% relative to modified compaction. Lower blow counts than
the above level may be acceptable provided that a correlation between Perth sand penetrometer
(PSP) test and dry density ratio has been established by a NATA accredited laboratory and following
review by a geotechnical engineer. It is recommended that compaction control of clayey materials, be
carried out using a nuclear surface moisture-density gauge, in accordance with AS 1289.5.8.1.
7.3.5 Excavation Conditions and Groundwater
Shallow excavation are anticipated to be undertaken mostly through dense and stiff to very stiff
materials. Given the highly variable nature of the Guildford Formation, and in particular with respect to
the slow excavation rates experienced within the soils profile at particular locations, the use of a
powerful excavator (i.e. 20 tonne or heavier) is recommended for excavation operations. The
occurrence of cemented layers cannot be precluded within the Guildford Formation, and thus the
provision for tynes and hydraulic breakers is recommended.
During construction, some loosening of the surface in foundation excavations in granular materials is
expected. Therefore the top 300 mm in the base of any excavation should be re-compacted using a
vibratory plate compactor prior to construction of any footings.
Page 10 of 15
Report on Geotechnical Investigation Project 82426.01 Lot 3 and Lot 15597 Wilkins Street, Bellevue, WA March 2015
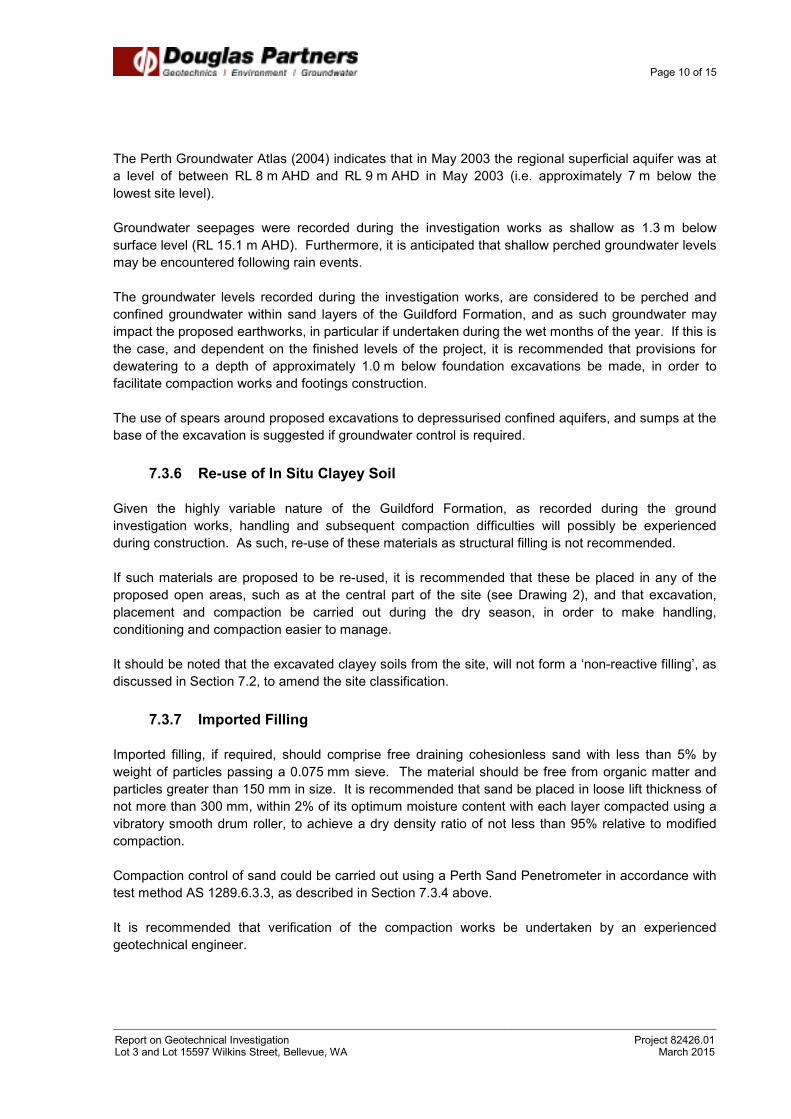
The Perth Groundwater Atlas (2004) indicates that in May 2003 the regional superficial aquifer was at
a level of between RL 8 m AHD and RL 9 m AHD in May 2003 (i.e. approximately 7 m below the
lowest site level).
Groundwater seepages were recorded during the investigation works as shallow as 1.3 m below
surface level (RL 15.1 m AHD). Furthermore, it is anticipated that shallow perched groundwater levels
may be encountered following rain events.
The groundwater levels recorded during the investigation works, are considered to be perched and
confined groundwater within sand layers of the Guildford Formation, and as such groundwater may
impact the proposed earthworks, in particular if undertaken during the wet months of the year. If this is
the case, and dependent on the finished levels of the project, it is recommended that provisions for
dewatering to a depth of approximately 1.0 m below foundation excavations be made, in order to
facilitate compaction works and footings construction.
The use of spears around proposed excavations to depressurised confined aquifers, and sumps at the
base of the excavation is suggested if groundwater control is required.
7.3.6 Re-use of In Situ Clayey Soil
Given the highly variable nature of the Guildford Formation, as recorded during the ground
investigation works, handling and subsequent compaction difficulties will possibly be experienced
during construction. As such, re-use of these materials as structural filling is not recommended.
If such materials are proposed to be re-used, it is recommended that these be placed in any of the
proposed open areas, such as at the central part of the site (see Drawing 2), and that excavation,
placement and compaction be carried out during the dry season, in order to make handling,
conditioning and compaction easier to manage.
It should be noted that the excavated clayey soils from the site, will not form a ‘non-reactive filling’, as
discussed in Section 7.2, to amend the site classification.
7.3.7 Imported Filling
Imported filling, if required, should comprise free draining cohesionless sand with less than 5% by
weight of particles passing a 0.075 mm sieve. The material should be free from organic matter and
particles greater than 150 mm in size. It is recommended that sand be placed in loose lift thickness of
not more than 300 mm, within 2% of its optimum moisture content with each layer compacted using a
vibratory smooth drum roller, to achieve a dry density ratio of not less than 95% relative to modified
compaction.
Compaction control of sand could be carried out using a Perth Sand Penetrometer in accordance with
test method AS 1289.6.3.3, as described in Section 7.3.4 above.
It is recommended that verification of the compaction works be undertaken by an experienced
geotechnical engineer.
Page 11 of 15
Report on Geotechnical Investigation Project 82426.01 Lot 3 and Lot 15597 Wilkins Street, Bellevue, WA March 2015
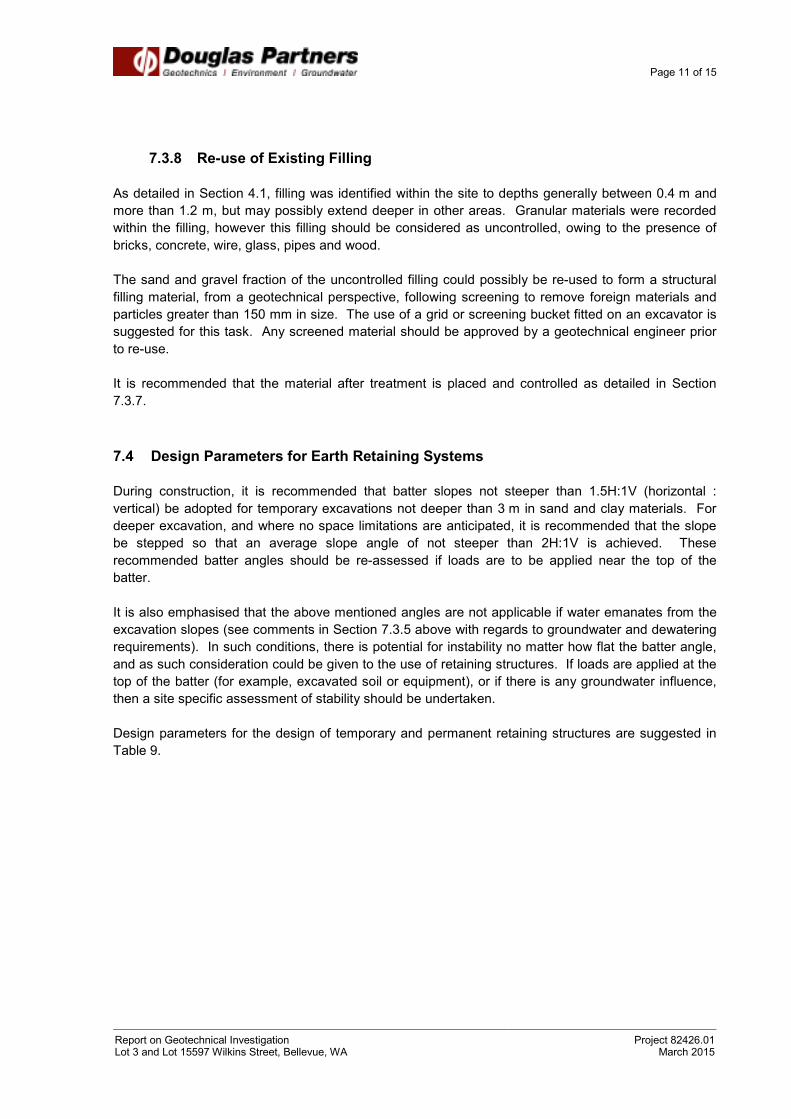
7.3.8 Re-use of Existing Filling
As detailed in Section 4.1, filling was identified within the site to depths generally between 0.4 m and
more than 1.2 m, but may possibly extend deeper in other areas. Granular materials were recorded
within the filling, however this filling should be considered as uncontrolled, owing to the presence of
bricks, concrete, wire, glass, pipes and wood.
The sand and gravel fraction of the uncontrolled filling could possibly be re-used to form a structural
filling material, from a geotechnical perspective, following screening to remove foreign materials and
particles greater than 150 mm in size. The use of a grid or screening bucket fitted on an excavator is
suggested for this task. Any screened material should be approved by a geotechnical engineer prior
to re-use.
It is recommended that the material after treatment is placed and controlled as detailed in Section
7.3.7.
7.4 Design Parameters for Earth Retaining Systems
During construction, it is recommended that batter slopes not steeper than 1.5H:1V (horizontal :
vertical) be adopted for temporary excavations not deeper than 3 m in sand and clay materials. For
deeper excavation, and where no space limitations are anticipated, it is recommended that the slope
be stepped so that an average slope angle of not steeper than 2H:1V is achieved. These
recommended batter angles should be re-assessed if loads are to be applied near the top of the
batter.
It is also emphasised that the above mentioned angles are not applicable if water emanates from the
excavation slopes (see comments in Section 7.3.5 above with regards to groundwater and dewatering
requirements). In such conditions, there is potential for instability no matter how flat the batter angle,
and as such consideration could be given to the use of retaining structures. If loads are applied at the
top of the batter (for example, excavated soil or equipment), or if there is any groundwater influence,
then a site specific assessment of stability should be undertaken.
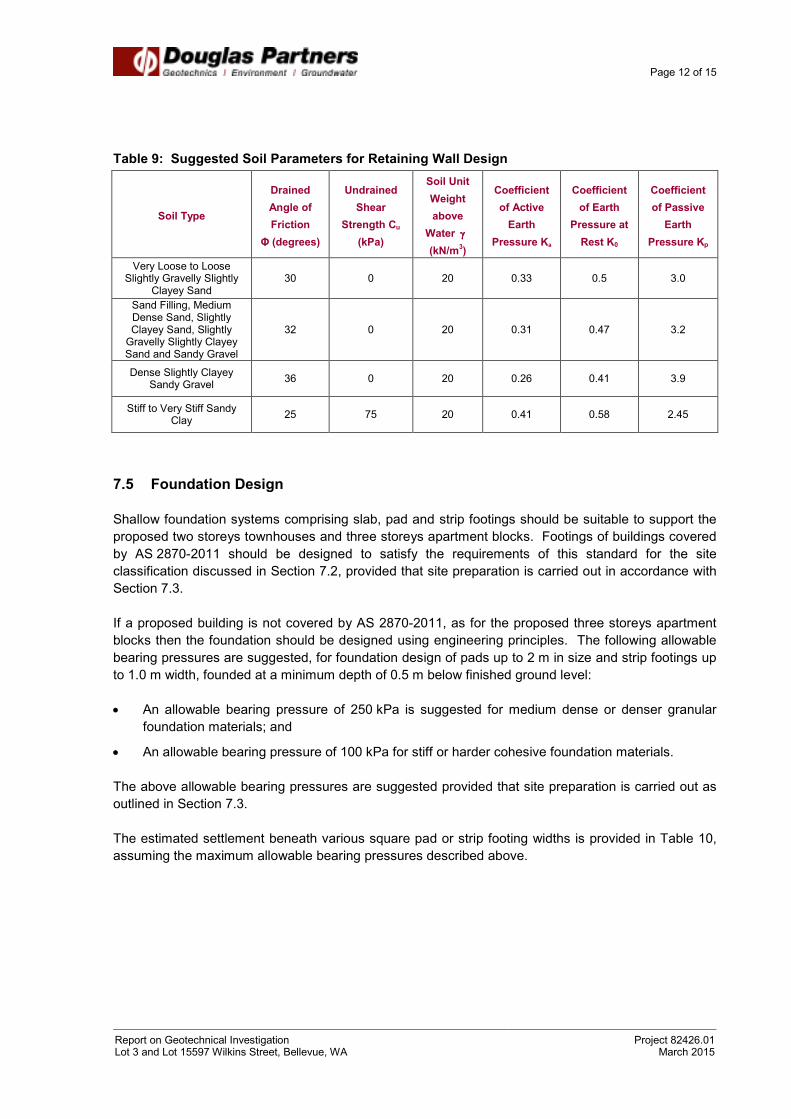
Design parameters for the design of temporary and permanent retaining structures are suggested in
Table 9.
Page 12 of 15
Report on Geotechnical Investigation Project 82426.01 Lot 3 and Lot 15597 Wilkins Street, Bellevue, WA March 2015
Table 9: Suggested Soil Parameters for Retaining Wall Design
Soil Type
Drained
Angle of
Friction
Φ (degrees)
Undrained
Shear
Strength Cu
(kPa)
Soil Unit
Weight
above
Water γ γ γ γ
(kN/m3)
Coefficient
of Active
Earth
Pressure Ka
Coefficient
of Earth
Pressure at
Rest K0
Coefficient
of Passive
Earth
Pressure Kp
Very Loose to Loose Slightly Gravelly Slightly
Clayey Sand 30 0 20 0.33 0.5 3.0
Sand Filling, Medium Dense Sand, Slightly Clayey Sand, Slightly Gravelly Slightly Clayey Sand and Sandy Gravel
32 0 20 0.31 0.47 3.2
Dense Slightly Clayey Sandy Gravel
36 0 20 0.26 0.41 3.9
Stiff to Very Stiff Sandy Clay
25 75 20 0.41 0.58 2.45
7.5 Foundation Design
Shallow foundation systems comprising slab, pad and strip footings should be suitable to support the
proposed two storeys townhouses and three storeys apartment blocks. Footings of buildings covered
by AS 2870-2011 should be designed to satisfy the requirements of this standard for the site
classification discussed in Section 7.2, provided that site preparation is carried out in accordance with
Section 7.3.
If a proposed building is not covered by AS 2870-2011, as for the proposed three storeys apartment
blocks then the foundation should be designed using engineering principles. The following allowable
bearing pressures are suggested, for foundation design of pads up to 2 m in size and strip footings up
to 1.0 m width, founded at a minimum depth of 0.5 m below finished ground level:
• An allowable bearing pressure of 250 kPa is suggested for medium dense or denser granular
foundation materials; and
• An allowable bearing pressure of 100 kPa for stiff or harder cohesive foundation materials.
The above allowable bearing pressures are suggested provided that site preparation is carried out as
outlined in Section 7.3.
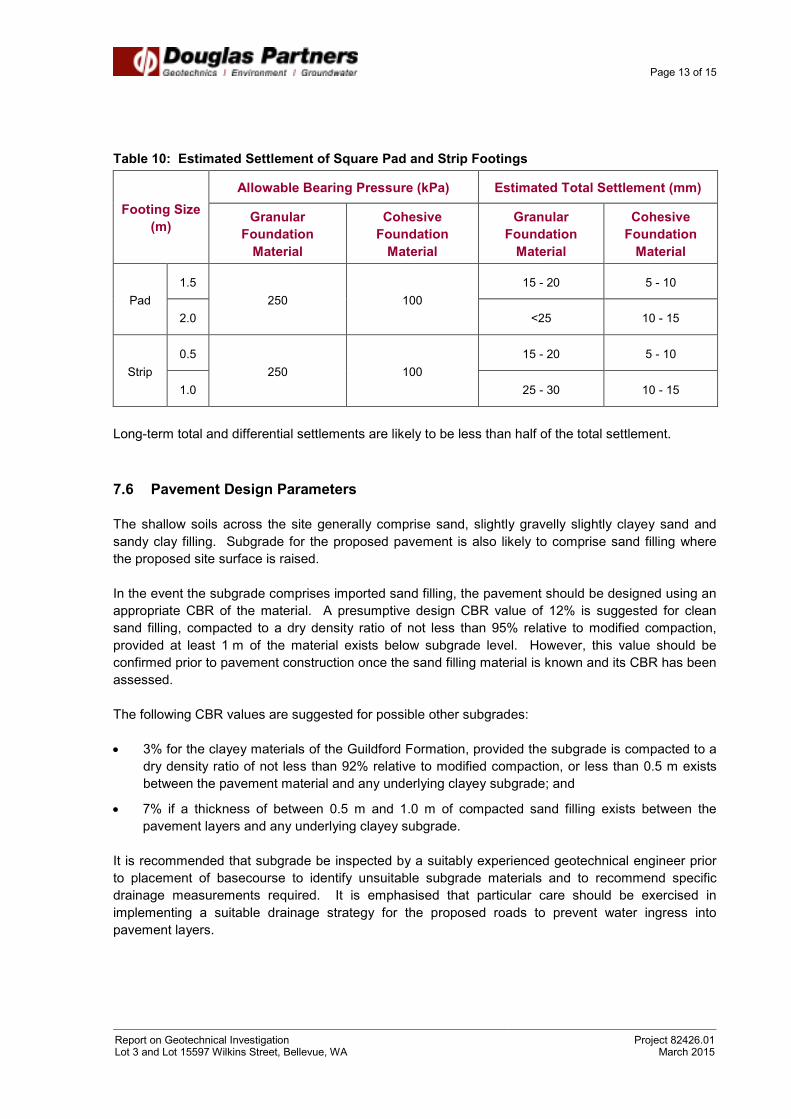
The estimated settlement beneath various square pad or strip footing widths is provided in Table 10,
assuming the maximum allowable bearing pressures described above.
Page 13 of 15
Report on Geotechnical Investigation Project 82426.01 Lot 3 and Lot 15597 Wilkins Street, Bellevue, WA March 2015
Table 10: Estimated Settlement of Square Pad and Strip Footings
Footing Size
(m)
Allowable Bearing Pressure (kPa) Estimated Total Settlement (mm)
Granular
Foundation
Material
Cohesive
Foundation
Material
Granular
Foundation
Material
Cohesive
Foundation
Material
Pad
1.5
250 100
15 - 20 5 - 10
2.0 <25 10 - 15
Strip
0.5
250
100
15 - 20 5 - 10
1.0 25 - 30 10 - 15
Long-term total and differential settlements are likely to be less than half of the total settlement.
7.6 Pavement Design Parameters
The shallow soils across the site generally comprise sand, slightly gravelly slightly clayey sand and
sandy clay filling. Subgrade for the proposed pavement is also likely to comprise sand filling where
the proposed site surface is raised.
In the event the subgrade comprises imported sand filling, the pavement should be designed using an
appropriate CBR of the material. A presumptive design CBR value of 12% is suggested for clean
sand filling, compacted to a dry density ratio of not less than 95% relative to modified compaction,
provided at least 1 m of the material exists below subgrade level. However, this value should be
confirmed prior to pavement construction once the sand filling material is known and its CBR has been
assessed.
The following CBR values are suggested for possible other subgrades:
• 3% for the clayey materials of the Guildford Formation, provided the subgrade is compacted to a
dry density ratio of not less than 92% relative to modified compaction, or less than 0.5 m exists
between the pavement material and any underlying clayey subgrade; and
• 7% if a thickness of between 0.5 m and 1.0 m of compacted sand filling exists between the
pavement layers and any underlying clayey subgrade.
It is recommended that subgrade be inspected by a suitably experienced geotechnical engineer prior
to placement of basecourse to identify unsuitable subgrade materials and to recommend specific
drainage measurements required. It is emphasised that particular care should be exercised in
implementing a suitable drainage strategy for the proposed roads to prevent water ingress into
pavement layers.
Page 14 of 15
Report on Geotechnical Investigation Project 82426.01 Lot 3 and Lot 15597 Wilkins Street, Bellevue, WA March 2015
7.7 Soil Permeability
The shallow soil conditions within the site generally comprise materials of variable nature and of low
permeability of the Guildford Formation, with shallow groundwater levels (as shallow as 1.3 m below
surface level) being recorded. Therefore, it is considered that stormwater disposal using soakwells
and sumps is not feasible at the site, where such clayey materials and groundwater occur at shallow
depth.
Soakwells could be considered if a notable thickness of free-draining sand filling is placed or is present
between the base of any proposed soakwells and any clayey subgrade materials (typically a clearance
of approximately 0.5 m is recommended). The impact of using this type of stormwater disposal on
adjacent developments should be considered, prior to implementation at the site, because lateral
movement of the infiltrated water is anticipated on the surface of clayey materials.
8. References
1. Australian Standard AS 1289-2000, Methods of Testing Soils for Engineering Purposes.
2. Australian Standard AS 1289.6.3.2-1999, Soil Strength and Consolidation Tests-Determination
of the Penetration Resistance of a Soil – Dynamic Cone Penetrometer Test.
3. Australian Standard AS 1726-1996, Geotechnical Site Investigation.
4. Australian Standard AS 2870-2011, Residential Slabs and Footings
5. Australian Standard AS 3798-1996, Guidelines on Earthworks for Commercial and Residential
Developments.
6. Department of Environment, Perth Groundwater Atlas, Second Edition, December 2004.
9. Limitations
The investigation was commissioned on 21 January 2015, by Mr Burditt Krost of Strategic Planning
Institute P/L, and was undertaken in accordance with DP’s proposal dated 18 December 2014.
Douglas Partners Pty Ltd (DP) has prepared this report for a proposed residential development at
Lot 3 and Lot 15597 Wilkins Street in Bellevue, WA in accordance with DP's proposal dated
18 December 2014 and acceptance from Mr Burditt Krost of Strategic Planning Institute P/L on
21 January 2015. The work was carried out under DP’s Conditions of Engagement. This report is
provided for the exclusive use of Morefield Holdings for this project only and for the purposes
described in the report. It should not be used for other projects or by a third party. In preparing this
report DP has necessarily relied upon information provided by the client and/or their agents.
The results provided in the report are indicative of the sub-surface conditions only at the specific
sampling or testing locations, and then only to the depths investigated and at the time the work was
carried out. Subsurface conditions can change abruptly due to variable geological processes and also

Page 15 of 15
Report on Geotechnical Investigation Project 82426.01 Lot 3 and Lot 15597 Wilkins Street, Bellevue, WA March 2015
as a result of anthropogenic influences. Such changes may occur after DP's field testing has been
completed.
DP's advice is based upon the conditions encountered during this investigation. The accuracy of the
advice provided by DP in this report may be limited by undetected variations in ground conditions
between sampling locations. The advice may also be limited by budget constraints imposed by others
or by site accessibility.
This report must be read in conjunction with all of the attached notes and should be kept in its entirety
without separation of individual pages or sections. DP cannot be held responsible for interpretations
or conclusions made by others unless they are supported by an expressed statement, interpretation,
outcome or conclusion given in this report.
This report, or sections from this report, should not be used as part of a specification for a project,
without review and agreement by DP. This is because this report has been written as advice and
opinion rather than instructions for construction.
The contents of this report do not constitute formal design components such as are required, by the
Health and Safety Legislation and Regulations, to be included in a Safety Report specifying the
hazards likely to be encountered during construction and the controls required to mitigate risk. This
design process requires risk assessment to be undertaken, with such assessment being dependent
upon factors relating to likelihood of occurrence and consequences of damage to property and to life.
This, in turn, requires project data and analysis presently beyond the knowledge and project role
respectively of DP. DP may be able, however, to assist the client in carrying out a risk assessment of
potential hazards contained in the Comments section of this report, as an extension to the current
scope of works, if so requested, and provided that suitable additional information is made available to
DP. Any such risk assessment would, however, be necessarily restricted to the geotechnical
components set out in this report and to their application by the project designers to project design,
construction, maintenance and demolition.
Douglas Partners Pty Ltd

Appendix A
About this Report
July 2010
Introduction These notes have been provided to amplify DP's report in regard to classification methods, field procedures and the comments section. Not all are necessarily relevant to all reports. DP's reports are based on information gained from limited subsurface excavations and sampling, supplemented by knowledge of local geology and experience. For this reason, they must be regarded as interpretive rather than factual documents, limited to some extent by the scope of information on which they rely. Copyright This report is the property of Douglas Partners Pty Ltd. The report may only be used for the purpose for which it was commissioned and in accordance with the Conditions of Engagement for the commission supplied at the time of proposal. Unauthorised use of this report in any form whatsoever is prohibited. Borehole and Test Pit Logs The borehole and test pit logs presented in this report are an engineering and/or geological interpretation of the subsurface conditions, and their reliability will depend to some extent on frequency of sampling and the method of drilling or excavation. Ideally, continuous undisturbed sampling or core drilling will provide the most reliable assessment, but this is not always practicable or possible to justify on economic grounds. In any case the boreholes and test pits represent only a very small sample of the total subsurface profile. Interpretation of the information and its application to design and construction should therefore take into account the spacing of boreholes or pits, the frequency of sampling, and the possibility of other than 'straight line' variations between the test locations. Groundwater Where groundwater levels are measured in boreholes there are several potential problems, namely: • In low permeability soils groundwater may
enter the hole very slowly or perhaps not at all during the time the hole is left open;
• A localised, perched water table may lead to an erroneous indication of the true water table;
• Water table levels will vary from time to time with seasons or recent weather changes. They may not be the same at the time of construction as are indicated in the report; and
• The use of water or mud as a drilling fluid will mask any groundwater inflow. Water has to be blown out of the hole and drilling mud must first be washed out of the hole if water measurements are to be made.
More reliable measurements can be made by installing standpipes which are read at intervals over several days, or perhaps weeks for low permeability soils. Piezometers, sealed in a particular stratum, may be advisable in low permeability soils or where there may be interference from a perched water table. Reports The report has been prepared by qualified personnel, is based on the information obtained from field and laboratory testing, and has been undertaken to current engineering standards of interpretation and analysis. Where the report has been prepared for a specific design proposal, the information and interpretation may not be relevant if the design proposal is changed. If this happens, DP will be pleased to review the report and the sufficiency of the investigation work. Every care is taken with the report as it relates to interpretation of subsurface conditions, discussion of geotechnical and environmental aspects, and recommendations or suggestions for design and construction. However, DP cannot always anticipate or assume responsibility for: • Unexpected variations in ground conditions.
The potential for this will depend partly on borehole or pit spacing and sampling frequency;
• Changes in policy or interpretations of policy by statutory authorities; or
• The actions of contractors responding to commercial pressures.
If these occur, DP will be pleased to assist with investigations or advice to resolve the matter.
July 2010
Site Anomalies In the event that conditions encountered on site during construction appear to vary from those which were expected from the information contained in the report, DP requests that it be immediately notified. Most problems are much more readily resolved when conditions are exposed rather than at some later stage, well after the event. Information for Contractual Purposes Where information obtained from this report is provided for tendering purposes, it is recommended that all information, including the written report and discussion, be made available. In circumstances where the discussion or comments section is not relevant to the contractual situation, it may be appropriate to prepare a specially edited document. DP would be pleased to assist in this regard and/or to make additional report copies available for contract purposes at a nominal charge. Site Inspection The company will always be pleased to provide engineering inspection services for geotechnical and environmental aspects of work to which this report is related. This could range from a site visit to confirm that conditions exposed are as expected, to full time engineering presence on site.
July 2010
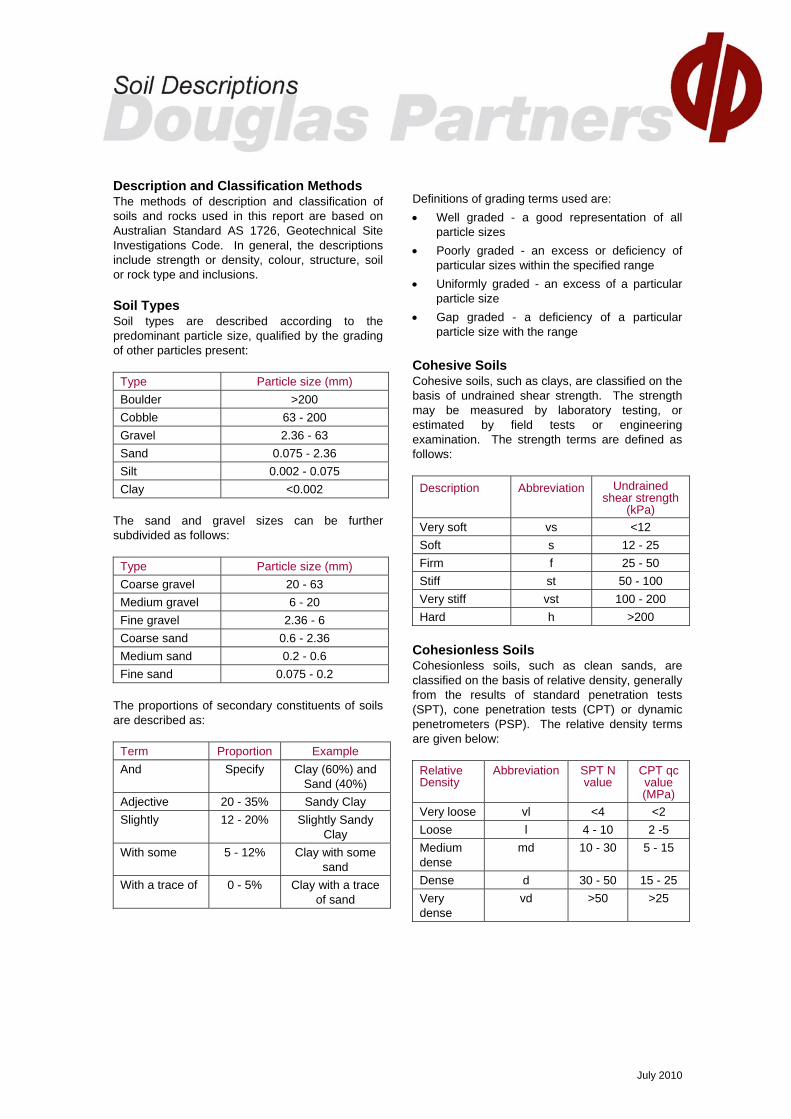
Description and Classification Methods The methods of description and classification of soils and rocks used in this report are based on Australian Standard AS 1726, Geotechnical Site Investigations Code. In general, the descriptions include strength or density, colour, structure, soil or rock type and inclusions. Soil Types Soil types are described according to the predominant particle size, qualified by the grading of other particles present:
Type Particle size (mm) Boulder >200 Cobble 63 - 200 Gravel 2.36 - 63 Sand 0.075 - 2.36 Silt 0.002 - 0.075 Clay <0.002
The sand and gravel sizes can be further subdivided as follows:
Type Particle size (mm) Coarse gravel 20 - 63 Medium gravel 6 - 20 Fine gravel 2.36 - 6 Coarse sand 0.6 - 2.36 Medium sand 0.2 - 0.6 Fine sand 0.075 - 0.2
The proportions of secondary constituents of soils are described as:
Term Proportion Example And Specify Clay (60%) and
Sand (40%) Adjective 20 - 35% Sandy Clay Slightly 12 - 20% Slightly Sandy
Clay With some 5 - 12% Clay with some
sand With a trace of 0 - 5% Clay with a trace
of sand
Definitions of grading terms used are: • Well graded - a good representation of all
particle sizes • Poorly graded - an excess or deficiency of
particular sizes within the specified range • Uniformly graded - an excess of a particular
particle size • Gap graded - a deficiency of a particular
particle size with the range Cohesive Soils Cohesive soils, such as clays, are classified on the basis of undrained shear strength. The strength may be measured by laboratory testing, or estimated by field tests or engineering examination. The strength terms are defined as follows:
Description Abbreviation Undrained shear strength
(kPa) Very soft vs <12 Soft s 12 - 25 Firm f 25 - 50 Stiff st 50 - 100 Very stiff vst 100 - 200 Hard h >200
Cohesionless Soils Cohesionless soils, such as clean sands, are classified on the basis of relative density, generally from the results of standard penetration tests (SPT), cone penetration tests (CPT) or dynamic penetrometers (PSP). The relative density terms are given below:
Relative Density
Abbreviation SPT N value
CPT qc value (MPa)
Very loose vl <4 <2 Loose l 4 - 10 2 -5 Medium dense
md 10 - 30 5 - 15
Dense d 30 - 50 15 - 25 Very dense
vd >50 >25

July 2010
Soil Origin It is often difficult to accurately determine the origin of a soil. Soils can generally be classified as: • Residual soil - derived from in-situ weathering
of the underlying rock; • Transported soils - formed somewhere else
and transported by nature to the site; or • Filling - moved by man. Transported soils may be further subdivided into: • Alluvium - river deposits • Lacustrine - lake deposits • Aeolian - wind deposits • Littoral - beach deposits • Estuarine - tidal river deposits • Talus - scree or coarse colluvium • Slopewash or Colluvium - transported
downslope by gravity assisted by water. Often includes angular rock fragments and boulders.

July 2010
Sampling Sampling is carried out during drilling or test pitting to allow engineering examination (and laboratory testing where required) of the soil or rock. Disturbed samples taken during drilling provide information on colour, type, inclusions and, depending upon the degree of disturbance, some information on strength and structure. Undisturbed samples are taken by pushing a thin-walled sample tube into the soil and withdrawing it to obtain a sample of the soil in a relatively undisturbed state. Such samples yield information on structure and strength, and are necessary for laboratory determination of shear strength and compressibility. Undisturbed sampling is generally effective only in cohesive soils. Test Pits Test pits are usually excavated with a backhoe or an excavator, allowing close examination of the in-situ soil if it is safe to enter into the pit. The depth of excavation is limited to about 3 m for a backhoe and up to 6 m for a large excavator. A potential disadvantage of this investigation method is the larger area of disturbance to the site. Large Diameter Augers Boreholes can be drilled using a rotating plate or short spiral auger, generally 300 mm or larger in diameter commonly mounted on a standard piling rig. The cuttings are returned to the surface at intervals (generally not more than 0.5 m) and are disturbed but usually unchanged in moisture content. Identification of soil strata is generally much more reliable than with continuous spiral flight augers, and is usually supplemented by occasional undisturbed tube samples. Continuous Spiral Flight Augers The borehole is advanced using 90-115 mm diameter continuous spiral flight augers which are withdrawn at intervals to allow sampling or in-situ testing. This is a relatively economical means of drilling in clays and sands above the water table. Samples are returned to the surface, or may be collected after withdrawal of the auger flights, but they are disturbed and may be mixed with soils from the sides of the hole. Information from the drilling (as distinct from specific sampling by SPTs or undisturbed samples) is of relatively low
reliability, due to the remoulding, possible mixing or softening of samples by groundwater. Non-core Rotary Drilling The borehole is advanced using a rotary bit, with water or drilling mud being pumped down the drill rods and returned up the annulus, carrying the drill cuttings. Only major changes in stratification can be determined from the cuttings, together with some information from the rate of penetration. Where drilling mud is used this can mask the cuttings and reliable identification is only possible from separate sampling such as SPTs. Continuous Core Drilling A continuous core sample can be obtained using a diamond tipped core barrel, usually with a 50 mm internal diameter. Provided full core recovery is achieved (which is not always possible in weak rocks and granular soils), this technique provides a very reliable method of investigation. Standard Penetration Tests Standard penetration tests (SPT) are used as a means of estimating the density or strength of soils and also of obtaining a relatively undisturbed sample. The test procedure is described in Australian Standard 1289, Methods of Testing Soils for Engineering Purposes - Test 6.3.1. The test is carried out in a borehole by driving a 50 mm diameter split sample tube under the impact of a 63 kg hammer with a free fall of 760 mm. It is normal for the tube to be driven in three successive 150 mm increments and the 'N' value is taken as the number of blows for the last 300 mm. In dense sands, very hard clays or weak rock, the full 450 mm penetration may not be practicable and the test is discontinued. The test results are reported in the following form. • In the case where full penetration is obtained
with successive blow counts for each 150 mm of, say, 4, 6 and 7 as:
4,6,7 N=13
• In the case where the test is discontinued before the full penetration depth, say after 15 blows for the first 150 mm and 30 blows for the next 40 mm as:
15, 30/40 mm
July 2010
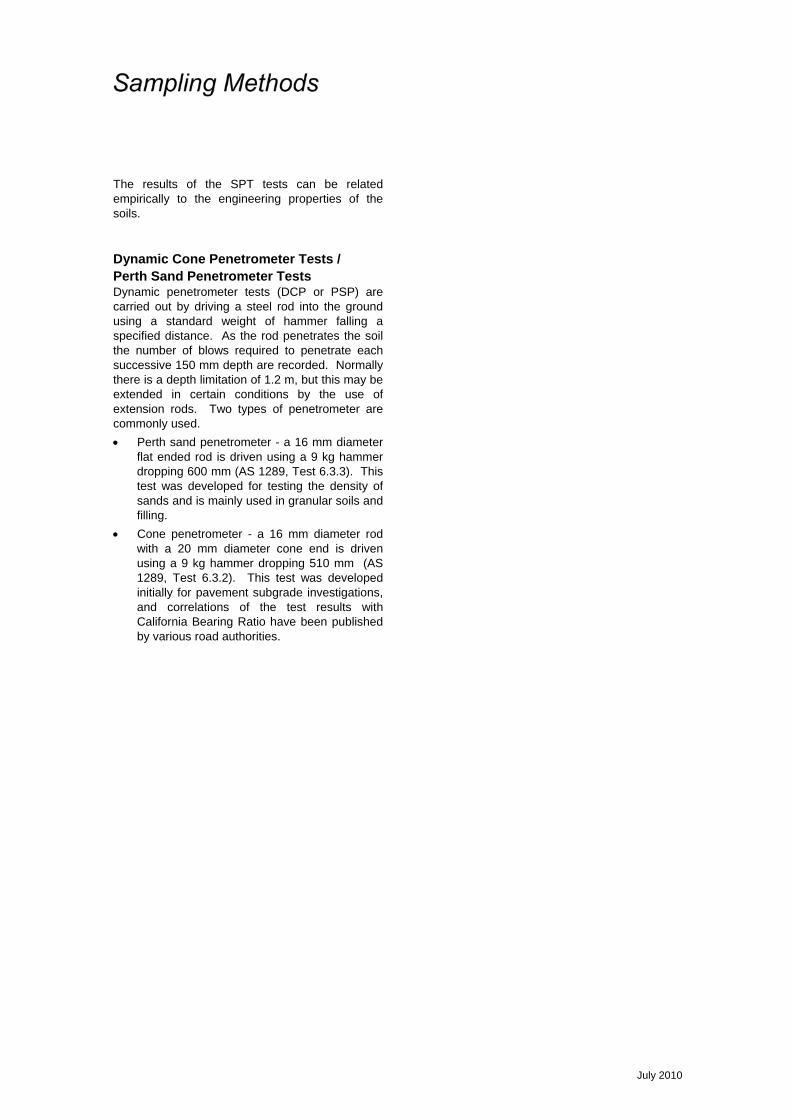
The results of the SPT tests can be related empirically to the engineering properties of the soils. Dynamic Cone Penetrometer Tests / Perth Sand Penetrometer Tests Dynamic penetrometer tests (DCP or PSP) are carried out by driving a steel rod into the ground using a standard weight of hammer falling a specified distance. As the rod penetrates the soil the number of blows required to penetrate each successive 150 mm depth are recorded. Normally there is a depth limitation of 1.2 m, but this may be extended in certain conditions by the use of extension rods. Two types of penetrometer are commonly used. • Perth sand penetrometer - a 16 mm diameter
flat ended rod is driven using a 9 kg hammer dropping 600 mm (AS 1289, Test 6.3.3). This test was developed for testing the density of sands and is mainly used in granular soils and filling.
• Cone penetrometer - a 16 mm diameter rod with a 20 mm diameter cone end is driven using a 9 kg hammer dropping 510 mm (AS 1289, Test 6.3.2). This test was developed initially for pavement subgrade investigations, and correlations of the test results with California Bearing Ratio have been published by various road authorities.

July 2010
Introduction These notes summarise abbreviations commonly used on borehole logs and test pit reports. Drilling or Excavation Methods C Core Drilling R Rotary drilling SFA Spiral flight augers NMLC Diamond core - 52 mm dia NQ Diamond core - 47 mm dia HQ Diamond core - 63 mm dia PQ Diamond core - 81 mm dia Water
Water seep Water level
Sampling and Testing A Auger sample B Bulk sample D Disturbed sample E Environmental sample U50 Undisturbed tube sample (50mm) W Water sample pp pocket penetrometer (kPa) PID Photo ionisation detector PL Point load strength Is(50) MPa S Standard Penetration Test V Shear vane (kPa) Description of Defects in Rock The abbreviated descriptions of the defects should be in the following order: Depth, Type, Orientation, Coating, Shape, Roughness and Other. Drilling and handling breaks are not usually included on the logs. Defect Type B Bedding plane Cs Clay seam Cv Cleavage Cz Crushed zone Ds Decomposed seam F Fault J Joint Lam lamination Pt Parting Sz Sheared Zone V Vein
Orientation The inclination of defects is always measured from the perpendicular to the core axis. h horizontal v vertical sh sub-horizontal sv sub-vertical Coating or Infilling Term cln clean co coating he healed inf infilled stn stained ti tight vn veneer Coating Descriptor ca calcite cbs carbonaceous cly clay fe iron oxide mn manganese slt silty Shape cu curved ir irregular pl planar st stepped un undulating Roughness po polished ro rough sl slickensided sm smooth vr very rough Other fg fragmented bnd band qtz quartz
July 2010
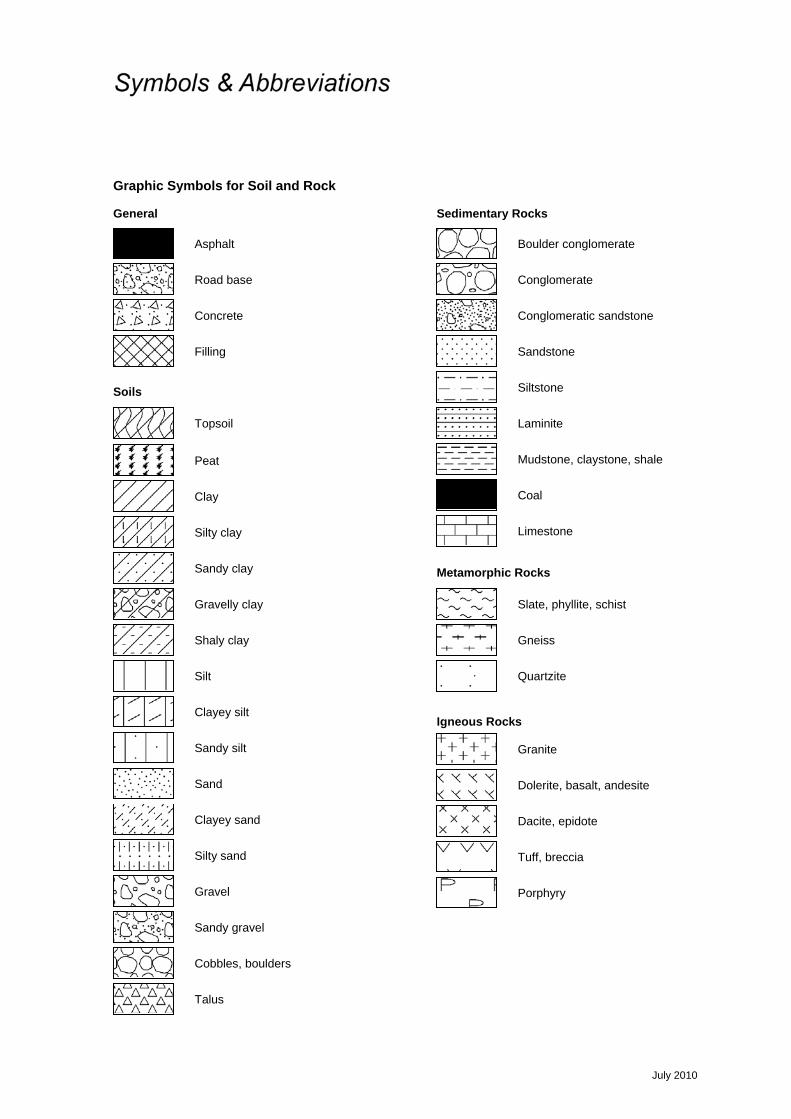
Graphic Symbols for Soil and Rock General
Soils
Sedimentary Rocks
Metamorphic Rocks
Igneous Rocks
Road base
Filling
Concrete
Asphalt
Topsoil
Peat
Clay
Conglomeratic sandstone
Conglomerate
Boulder conglomerate
Sandstone
Slate, phyllite, schist
Siltstone
Mudstone, claystone, shale
Coal
Limestone
Porphyry
Cobbles, boulders
Sandy gravel
Laminite
Silty sand
Clayey sand
Silty clay
Sandy clay
Gravelly clay
Shaly clay
Silt
Clayey silt
Sandy silt
Sand
Gravel
Talus
Gneiss
Quartzite
Dolerite, basalt, andesite
Granite
Tuff, breccia
Dacite, epidote

Appendix B
Drawings
139
11
143143
800800
7070
1515
72
142142
6868
1313
6969
4646
1414
1616
4949
7171
1212
6767144144
Lot 3Lot 3
Lot 15597Lot 15597
8008003333
Legend
Douglas PartnersGeotechnics Environment Groundwater
PROJECT No.:
DRAWING No.: 1
REVISION: ADATE:
CLIENT:
OFFICE: Perth
8242
6-01
-d01
.dgn
PIN
PO
INT
CA
RTO
GR
AP
HIC
S (
08) 9
562
7136
0 10 20 30 40 50m
SCALE 1 : 1 000 at A4
N
MGA
27 Feb 2015
CADASTRAL SOURCE: Landgate, February 2015.AERIAL PHOTOGRAPH SOURCE: NearMap, flown February 2015.
CLAYTON STREET
CLAYTON STREET
Morefield Holdings Test LocationsLot 15597 and Lot 3 Wilkins StreetBellevue, WA
82426.01
Site Boundary
Cadastral Boundary
Easement Boundary
Test Pit Location
WILKINS STREET
WILKINS STREET
PA
SC
OE
S
TR
EE
T
PA
SC
OE
S
TR
EE
T
TP82TP82
TP81TP81
TP79TP79
TP80TP80 TP78TP78
TP77TP77TP76TP76
407
700m
E40
7 70
0mE
407
800m
E40
7 80
0mE
407
900m
E40
7 90
0mE
6 470 100mN6 470 100mN

Legend
Douglas PartnersGeotechnics Environment Groundwater
PROJECT No.:
DRAWING No.: 2
REVISION: ADATE:
CLIENT:
OFFICE: Perth
8242
6-01
-d02
.dgn
PIN
PO
INT
CA
RTO
GR
AP
HIC
S (
08) 9
562
7136
0 10 20 30 40 50m
SCALE 1 : 1 000 at A4
N
MGA
27 Feb 2015
Morefield Holdings 82426.01
TP82TP82
TP81TP81
TP79TP79
TP80TP80 TP78TP78
TP77TP77TP76TP76
Site Boundary
Test Pit Location
Test Locations and Concept PlanLot 15597 and Lot 3 Wilkins StreetBellevue, WA
CONCEPT PLAN SOURCE: Mackay Urban Design, March 2014.
Proposed 3 StoreyProposed 3 StoreyApartment BlocksApartment Blocks
Proposed 3 StoreyProposed 3 StoreyApartment BlocksApartment Blocks
Proposed 3 StoreyProposed 3 StoreyApartment BlocksApartment Blocks
Proposed 3 StoreyProposed 3 StoreyApartment BlocksApartment Blocks
Existing BellevueExisting BellevuePrimary SchoolPrimary School
Proposed 2 StoreyProposed 2 StoreyTownhousesTownhouses
Proposed 2 StoreyProposed 2 StoreyTownhousesTownhouses

Appendix C
Results of Field Work

0.15
0.5
1.9
2.3
FILLING (SANDY GRAVEL) - poorly compacted, brown,fine gravel to cobble sized, fine to medium grainedsandy gravel filling, containing brick and concrete, withoccasional whole bricks, dry to moist.
FILLING (SAND) - poorly compacted, yellow-brown, fineto medium grained sand filling, with some gravel sizedbrick, moist.
- 25mm water pipe at 0.3 m.
Slightly GRAVELLY CLAYEY SAND - loose to mediumdense, yellow and grey, fine to medium grained, slighlygravelly clayey sand, moist to wet.
- becoming medium dense from 1.05 m depth.
SANDY CLAY - stiff to very stiff, grey, high plasticity,sandy clay, with a trace of gravel, moist.
Pit discontinued at 2.3m (Slow Digging)
SAMPLING & IN SITU TESTING LEGEND
1
2
3
RL
TEST PIT LOG
Depth(m)
Wilkins Street, Bellevue, WA
A Auger sample G Gas sample PID Photo ionisation detector (ppm)B Bulk sample P Piston sample PL(A) Point load axial test Is(50) (MPa)BLK Block sample Ux Tube sample (x mm dia.) PL(D) Point load diametral test Is(50) (MPa)C Core drilling W Water sample pp Pocket penetrometer (kPa)D Disturbed sample Water seep S Standard penetration testE Environmental sample Water level V Shear vane (kPa)
Morefield Holdings
Lot 15597 and Lot 3
Results &Comments
LOGGED: D Rubenis SURVEY DATUM: MGA94
CLIENT:
PROJECT:
LOCATION:
PIT No: TP76
PROJECT No: 82426.01
DATE: 11/2/2015
SHEET 1 OF 1
Sampling & In Situ Testing
1
2
3
Wa
ter
De
pth
Sa
mp
le
Description
of
Strata Gra
ph
icL
og
Typ
e
REMARKS: *Surface level interpolated from survey plan provided by the client.
RIG: Case 8 tonne excavator with a 600 mm toothed bucket
WATER OBSERVATIONS:No free groundwater observed.
SURFACE LEVEL: 16.5 m AHD*
EASTING: 407823
NORTHING: 6470119
Dynamic Penetrometer Test(blows per 150mm)
5 10 15 20
Cone Penetrometer AS1289.6.3.2 Sand Penetrometer AS1289.6.3.3
D
D
1.8
2.1 pp = 310-350 kPa
0.1
0.7
0.9
1.8
2.4
FILLING (SANDY GRAVEL) - apparently compacted,brown, fine to coarse sized, fine to medium grainedsandy gravel filling, containing bricks and concreterubble, dry.
FILLING (SAND) - apparently compacted, yellow-brown,fine to medium grained sand filling, with some gravelsize brick and concrete pieces, dry to moist.
CLAYEY SAND - medium dense, yellow and grey, fineto medium grained, clayey sand with some gravel,moist.
CLAYEY SANDY GRAVEL - dense, yellow and grey,fine to coarse sized, fine to medium grained, clayeysandy gravel, moist.
CLAYEY SAND - yellow and grey, fine to mediumgrained, clayey sand, moist.
Pit discontinued at 2.4m (Slow Digging)
SAMPLING & IN SITU TESTING LEGEND
1
2
3
RL
TEST PIT LOG
Depth(m)
Wilkins Street, Bellevue, WA
A Auger sample G Gas sample PID Photo ionisation detector (ppm)B Bulk sample P Piston sample PL(A) Point load axial test Is(50) (MPa)BLK Block sample Ux Tube sample (x mm dia.) PL(D) Point load diametral test Is(50) (MPa)C Core drilling W Water sample pp Pocket penetrometer (kPa)D Disturbed sample Water seep S Standard penetration testE Environmental sample Water level V Shear vane (kPa)
Morefield Holdings
Lot 15597 and Lot 3
Results &Comments
LOGGED: D Rubenis SURVEY DATUM: MGA94
CLIENT:
PROJECT:
LOCATION:
PIT No: TP77
PROJECT No: 82426.01
DATE: 11/2/2015
SHEET 1 OF 1
Sampling & In Situ Testing
1
2
3
Wa
ter
De
pth
Sa
mp
le
Description
of
Strata Gra
ph
icL
og
Typ
e
REMARKS: *Surface level interpolated from survey plan provided by the client.
RIG: Case 8 tonne excavator with a 600 mm toothed bucket
WATER OBSERVATIONS:No free groundwater observed.
SURFACE LEVEL: 16.2 m AHD*
EASTING: 407793
NORTHING: 6470124
Dynamic Penetrometer Test(blows per 150mm)
5 10 15 20
Cone Penetrometer AS1289.6.3.2 Sand Penetrometer AS1289.6.3.3
D
D
0.6
1.3

0.3
0.45
0.6
3.0
FILLING (SAND) - poorly compacted, yellow and grey,fine to medium grained sand filling, dry to moist.
FILLING (GRAVELLY SAND) - poorly compacted,orange, fine to medium grained, fine to medium sizedgravelly sand filling, with a trace of clay, dry to moist.
FILLING (SAND) - poorly compacted, grey, fine tomedium grained sand filling, with some gravel, moist.
- 32 mm pipe observed at 0.6 m depth.
Slightly GRAVELLY CLAYEY SAND - very loose toloose, yellow and grey, fine to medium grained, slightlygravelly clayey sand, moist to wet.
- becoming loose from 1.05 m depth.
- becoming wet from 1.2 m depth.
- becoming medium dense from 1.95 m depth.
Pit discontinued at 3.0m (Target)
SAMPLING & IN SITU TESTING LEGEND
1
2
3
RL
TEST PIT LOG
Depth(m)
Wilkins Street, Bellevue, WA
A Auger sample G Gas sample PID Photo ionisation detector (ppm)B Bulk sample P Piston sample PL(A) Point load axial test Is(50) (MPa)BLK Block sample Ux Tube sample (x mm dia.) PL(D) Point load diametral test Is(50) (MPa)C Core drilling W Water sample pp Pocket penetrometer (kPa)D Disturbed sample Water seep S Standard penetration testE Environmental sample Water level V Shear vane (kPa)
Morefield Holdings
Lot 15597 and Lot 3
Results &Comments
LOGGED: D Rubenis SURVEY DATUM: MGA94
CLIENT:
PROJECT:
LOCATION:
PIT No: TP78
PROJECT No: 82426.01
DATE: 11/2/2015
SHEET 1 OF 1
Sampling & In Situ Testing
1
2
3
Wa
ter
De
pth
Sa
mp
le
Description
of
Strata Gra
ph
icL
og
Typ
e
REMARKS: *Surface level interpolated from survey plan provided by the client.
RIG: Case 8 tonne excavator with a 600 mm toothed bucket
WATER OBSERVATIONS:Groundwater seepage observed from 1.3 m.
SURFACE LEVEL: 16.4 m AHD*
EASTING: 407781
NORTHING: 6470145
Dynamic Penetrometer Test(blows per 150mm)
5 10 15 20
Cone Penetrometer AS1289.6.3.2 Sand Penetrometer AS1289.6.3.3
D
D
0.3
1.4
0.2
0.4
1.1
2.6
FILLING (SANDY GRAVEL) - apparently compacted,brown, fine gravel to cobble sized, fine to mediumgrained sandy gravel filling, containing bricks, concreteand wood, dry.
FILLING (SAND) - apparently compacted, grey andbrown, fine to medium grained sand filling, moist.
SAND - medium dense, grey, fine to medium grainedsand, with a trace of silt, moist.
CLAYEY SANDY GRAVEL - medium dense, grey andyellow, fine to coarse sized, fine to medium grained,clayey sandy gravel, moist.
Pit discontinued at 2.6m (Slow Digging)
SAMPLING & IN SITU TESTING LEGEND
1
2
3
RL
TEST PIT LOG
Depth(m)
Wilkins Street, Bellevue, WA
A Auger sample G Gas sample PID Photo ionisation detector (ppm)B Bulk sample P Piston sample PL(A) Point load axial test Is(50) (MPa)BLK Block sample Ux Tube sample (x mm dia.) PL(D) Point load diametral test Is(50) (MPa)C Core drilling W Water sample pp Pocket penetrometer (kPa)D Disturbed sample Water seep S Standard penetration testE Environmental sample Water level V Shear vane (kPa)
Morefield Holdings
Lot 15597 and Lot 3
Results &Comments
LOGGED: D Rubenis SURVEY DATUM: MGA94
CLIENT:
PROJECT:
LOCATION:
PIT No: TP79
PROJECT No: 82426.01
DATE: 11/2/2015
SHEET 1 OF 1
Sampling & In Situ Testing
1
2
3
Wa
ter
De
pth
Sa
mp
le
Description
of
Strata Gra
ph
icL
og
Typ
e
REMARKS: *Surface level interpolated from survey plan provided by the client.
RIG: Case 8 tonne excavator with a 600 mm toothed bucket
WATER OBSERVATIONS:Groundwater seepage observed from 1.4 m.
SURFACE LEVEL: 16.2 m AHD*
EASTING: 407753
NORTHING: 6470186
Dynamic Penetrometer Test(blows per 150mm)
5 10 15 20
Cone Penetrometer AS1289.6.3.2 Sand Penetrometer AS1289.6.3.3
D
E
E
E
D
U
E
E
0.1
0.5
1.0
1.5
1.6
1.85
2.0
2.5
0.6
0.95
1.2
2.5
FILLING (SANDY GRAVEL) - apparently compacted,brown, fine gravel to cobble sized, fine to mediumgrained sandy gravel filling, containing bricks, concrete,wire and pipes, dry.
- becoming grey roadbase type material from 0.45 mdepth.
- becoming orange from 0.5 m depth.
SAND - yellow, fine to medium grained sand, with atrace of clay, dry to moist.
Slightly GRAVELLY SAND - yellow, fine to mediumgrained, slightly gravelly sand, with some clay, moist.
Slightly GRAVELLY CLAYEY SAND - yellow, fine tomedium grained, slightly gravelly clayey sand, moist.
- becoming moist to wet from 2.0 m depth.
Pit discontinued at 2.5m (Slow Digging/Limited Access)
SAMPLING & IN SITU TESTING LEGEND
1
2
3
RL
TEST PIT LOG
Depth(m)
Wilkins Street, Bellevue, WA
A Auger sample G Gas sample PID Photo ionisation detector (ppm)B Bulk sample P Piston sample PL(A) Point load axial test Is(50) (MPa)BLK Block sample Ux Tube sample (x mm dia.) PL(D) Point load diametral test Is(50) (MPa)C Core drilling W Water sample pp Pocket penetrometer (kPa)D Disturbed sample Water seep S Standard penetration testE Environmental sample Water level V Shear vane (kPa)
Morefield Holdings
Lot 15597 and Lot 3
Results &Comments
LOGGED: D Rubenis SURVEY DATUM: MGA94
CLIENT:
PROJECT:
LOCATION:
PIT No: TP80
PROJECT No: 82426.01
DATE: 11/2/2015
SHEET 1 OF 1
Sampling & In Situ Testing
1
2
3
Wa
ter
De
pth
Sa
mp
le
Description
of
Strata Gra
ph
icL
og
Typ
e
REMARKS: *Surface level interpolated from survey plan provided by the client.
RIG: Case 8 tonne excavator with a 600 mm toothed bucket
WATER OBSERVATIONS:Groundwater seepage observed from 2.1 m.
SURFACE LEVEL: 16.1 m AHD*
EASTING: 407727
NORTHING: 6470143
Dynamic Penetrometer Test(blows per 150mm)
5 10 15 20
Cone Penetrometer AS1289.6.3.2 Sand Penetrometer AS1289.6.3.3
E
DE
E
E
E
0.5
1.0
1.5
2.0
2.5
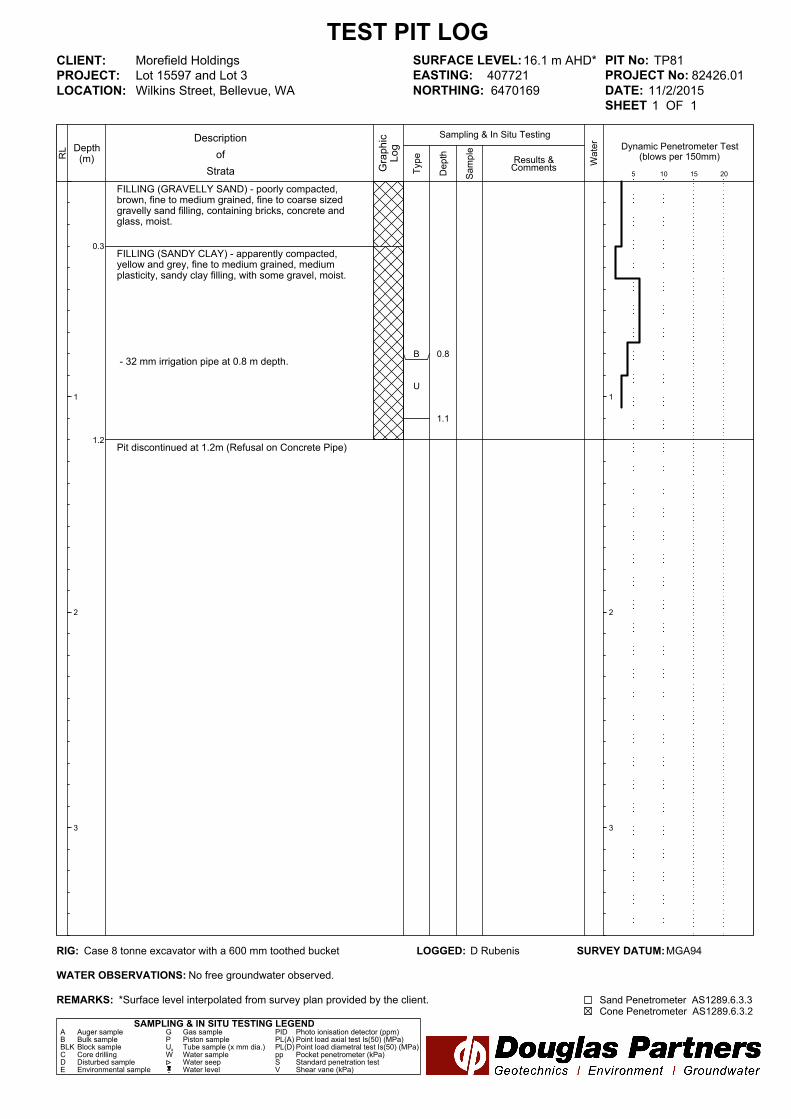
0.3
1.2
FILLING (GRAVELLY SAND) - poorly compacted,brown, fine to medium grained, fine to coarse sizedgravelly sand filling, containing bricks, concrete andglass, moist.
FILLING (SANDY CLAY) - apparently compacted,yellow and grey, fine to medium grained, mediumplasticity, sandy clay filling, with some gravel, moist.
- 32 mm irrigation pipe at 0.8 m depth.
Pit discontinued at 1.2m (Refusal on Concrete Pipe)
SAMPLING & IN SITU TESTING LEGEND
1
2
3
RL
TEST PIT LOG
Depth(m)
Wilkins Street, Bellevue, WA
A Auger sample G Gas sample PID Photo ionisation detector (ppm)B Bulk sample P Piston sample PL(A) Point load axial test Is(50) (MPa)BLK Block sample Ux Tube sample (x mm dia.) PL(D) Point load diametral test Is(50) (MPa)C Core drilling W Water sample pp Pocket penetrometer (kPa)D Disturbed sample Water seep S Standard penetration testE Environmental sample Water level V Shear vane (kPa)
Morefield Holdings
Lot 15597 and Lot 3
Results &Comments
LOGGED: D Rubenis SURVEY DATUM: MGA94
CLIENT:
PROJECT:
LOCATION:
PIT No: TP81
PROJECT No: 82426.01
DATE: 11/2/2015
SHEET 1 OF 1
Sampling & In Situ Testing
1
2
3
Wa
ter
De
pth
Sa
mp
le
Description
of
Strata Gra
ph
icL
og
Typ
e
REMARKS: *Surface level interpolated from survey plan provided by the client.
RIG: Case 8 tonne excavator with a 600 mm toothed bucket
WATER OBSERVATIONS:No free groundwater observed.
SURFACE LEVEL: 16.1 m AHD*
EASTING: 407721
NORTHING: 6470169
Dynamic Penetrometer Test(blows per 150mm)
5 10 15 20
Cone Penetrometer AS1289.6.3.2 Sand Penetrometer AS1289.6.3.3
B
U
0.8
1.1

0.12
0.3
0.6
1.3
TOPSOIL - brown, sandy topsoil, with some rootlets.
SAND - loose, grey, fine to medium grained sand, with atrace of silt, dry.
SANDY GRAVEL - medium dense, yellow-grey, fine tomedium sized, fine to medium grained sandy gravel,dry.
Slightly CLAYEY GRAVELLY SAND - dense, yellow,fine to medium sized, fine to medium grained slightlyclayey gravelly sand, dry.
Pit discontinued at 1.3m (Slow Digging)
SAMPLING & IN SITU TESTING LEGEND
1
2
3
RL
TEST PIT LOG
Depth(m)
Wilkins Street, Bellevue, WA
A Auger sample G Gas sample PID Photo ionisation detector (ppm)B Bulk sample P Piston sample PL(A) Point load axial test Is(50) (MPa)BLK Block sample Ux Tube sample (x mm dia.) PL(D) Point load diametral test Is(50) (MPa)C Core drilling W Water sample pp Pocket penetrometer (kPa)D Disturbed sample Water seep S Standard penetration testE Environmental sample Water level V Shear vane (kPa)
Morefield Holdings
Lot 15597 and Lot 3
Results &Comments
LOGGED: D Rubenis SURVEY DATUM: MGA94
CLIENT:
PROJECT:
LOCATION:
PIT No: TP82
PROJECT No: 82426.01
DATE: 11/2/2015
SHEET 1 OF 1
Sampling & In Situ Testing
1
2
3
Wa
ter
De
pth
Sa
mp
le
Description
of
Strata Gra
ph
icL
og
Typ
e
REMARKS: *Surface level interpolated from survey plan provided by the client.
RIG: Case 8 tonne excavator with a 600 mm toothed bucket
WATER OBSERVATIONS:No free groundwater observed.
SURFACE LEVEL: 16.1 m AHD*
EASTING: 407693
NORTHING: 6470144
Dynamic Penetrometer Test(blows per 150mm)
5 10 15 20
Cone Penetrometer AS1289.6.3.2 Sand Penetrometer AS1289.6.3.3
B 0.8

Appendix D
Geotechnical Laboratory Testing

Particle Size Distribution &Plasticity Index tests
Mining &CivilGeotest Pty Ltd Job No:unit1/1 Pusey Road, Jandakot, WA 6164 Report No: 60017-P15/798Ph (08) 9414 8022 Fax (08) 9414 8011 Sample No: P15/798Email: [email protected] Issue Date: 25 February 2015Client: Morefield Holdings (118662) Sample location: TP 76Project: Bellevue Estate Sample Depth(m): 2.1Location: Bellevue WA
SIEVE ANALYSIS WA 115.1 Plasticity index testsSieve Size (mm) % Passing AS 1289
75.0 Liquid limit 3.1.1 59 %37.5 Plastic limit 3.2.1 17 %19.0 Plasticity index 3.3.1 42 %
9.5 100 Linear shrinkage 3.4.1 11.0 %4.75 1002.36 991.18 96 Cracked
0.600 880.425 83 Curled0.300 780.150 730.075 68
0.0135 56
Client Address: 36 O'Malley Street, Osborne Park Sampling Procedure: Tested as received
Approved signatureMatthew van Herk
AS PSDPI May 2009
60017
Sheet No: 1 of 1
0
10
20
30
40
50
60
70
80
90
100
0.001 0.01 0.1 1 10 100
% P
assi
ng
Particle Size (mm)
Accreditation for compliance with ISO/IEC 17025.This document may not be reproduced except in full.Accreditation No 15545.
Particle Size Distribution &Plasticity Index tests
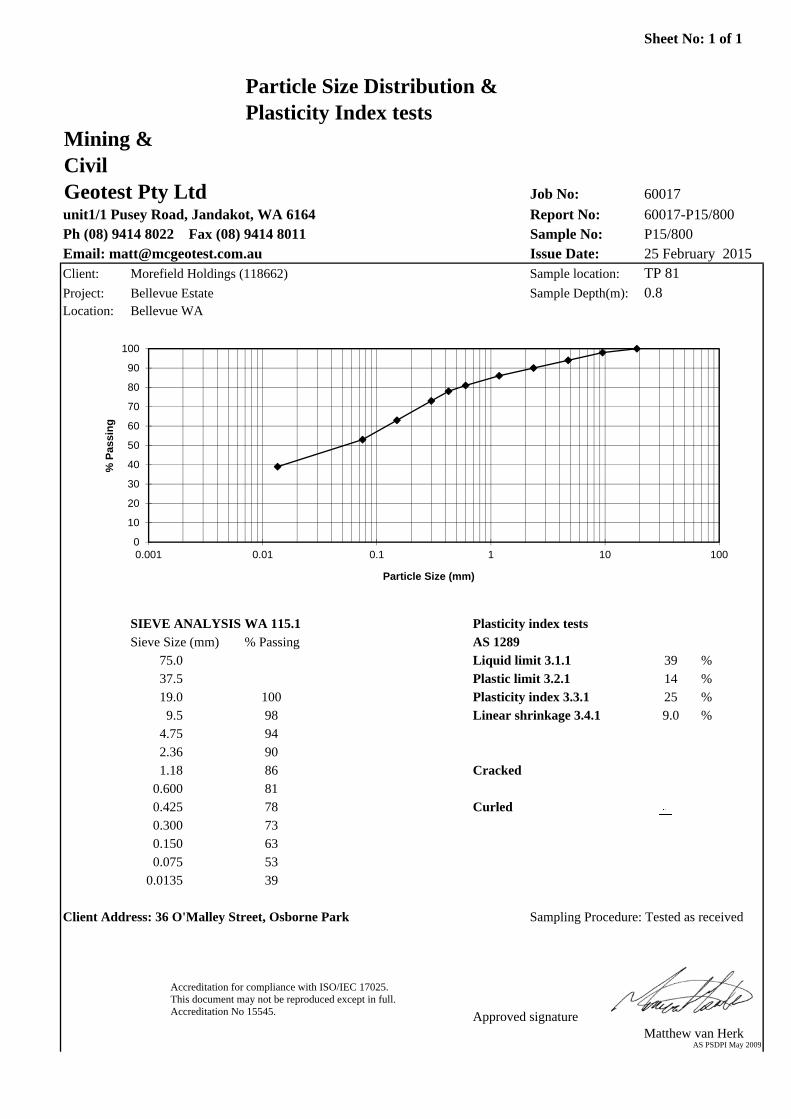
Mining &CivilGeotest Pty Ltd Job No:unit1/1 Pusey Road, Jandakot, WA 6164 Report No: 60017-P15/800Ph (08) 9414 8022 Fax (08) 9414 8011 Sample No: P15/800Email: [email protected] Issue Date: 25 February 2015Client: Morefield Holdings (118662) Sample location: TP 81Project: Bellevue Estate Sample Depth(m): 0.8Location: Bellevue WA
SIEVE ANALYSIS WA 115.1 Plasticity index testsSieve Size (mm) % Passing AS 1289
75.0 Liquid limit 3.1.1 39 %37.5 Plastic limit 3.2.1 14 %19.0 100 Plasticity index 3.3.1 25 %
9.5 98 Linear shrinkage 3.4.1 9.0 %4.75 942.36 901.18 86 Cracked
0.600 810.425 78 Curled0.300 730.150 630.075 53
0.0135 39
Client Address: 36 O'Malley Street, Osborne Park Sampling Procedure: Tested as received
Approved signatureMatthew van Herk
AS PSDPI May 2009
60017
Sheet No: 1 of 1
0
10
20
30
40
50
60
70
80
90
100
0.001 0.01 0.1 1 10 100
% P
assi
ng
Particle Size (mm)
Accreditation for compliance with ISO/IEC 17025.This document may not be reproduced except in full.Accreditation No 15545.
Mining &Civil Geotest Pty LtdPh (08) 9414 8022 Fax (08) 9414 8011
Email [email protected]
Unit 1/1 Pusey Road, JANDAKOT WA 6164
Client: Morefield Holding (118662) Date tested:
Project: Bellevue Heights Tested by:
Location: Bellevue WA Checked by:
Sample: Sample No: P15/799
Sample description : Black/Grey Sandy Clay
Sample Type : 48 mm Ø tube sample
Swell Specimen Shrinkage Specimen
Dry Density - Initial (t/m3) 2.09 14.2
Moisture Content - Initial (%) 15.4 Length/Diameter Ratio 2.3
Moisture Content - Final (%) 17.6 Extent of Crumbling Nil
Overburden Pressure (kPa) 25 Extent of Cracking Nil
Significant Inert Inclusions (%) 5
Shrink-Swell Index
Iss = 0.9 % Vertical strain per pF change in Total suction
Client address: 36 O'Malley Street, Osborne Park Tested as received
Approved Signature
13 February 2015
Report No:Date of issue:
Moisture Content Initial (%)
Sample details
P Shettigar
K M Jones
Determination of the Shrinkage Index of a SoilShrink Swell Index
AS 1289.7.1.1
TP 81, 0.8 - 1.1m
Job No:
Matthew van Herk
Shrink-Swell Index September 2010
60017
60017-P15/799
25 February 2015

Particle Size Distribution &Plasticity Index tests
Mining &CivilGeotest Pty Ltd Job No:unit1/1 Pusey Road, Jandakot, WA 6164 Report No: 60017-P15/801Ph (08) 9414 8022 Fax (08) 9414 8011 Sample No: P15/801Email: [email protected] Issue Date: 25 February 2015Client: Morefield Holdings (118662) Sample location: TP 82Project: Bellevue Estate Sample Depth(m): 0.8Location: Bellevue WA
SIEVE ANALYSIS WA 115.1 Plasticity index testsSieve Size (mm) % Passing AS 1289
75.0 Liquid limit 3.1.1 na %37.5 Plastic limit 3.2.1 %19.0 100 Plasticity index 3.3.1 %
9.5 92 Linear shrinkage 3.4.1 %4.75 722.36 611.18 56 Cracked
0.600 500.425 45 Curled0.300 390.150 270.075 19
0.0135 15
Client Address: 36 O'Malley Street, Osborne Park Sampling Procedure: Tested as received
Approved signatureMatthew van Herk
AS PSDPI May 2009
60017
Sheet No: 1 of 2
0
10
20
30
40
50
60
70
80
90
100
0.001 0.01 0.1 1 10 100
% P
assi
ng
Particle Size (mm)
Accreditation for compliance with ISO/IEC 17025.This document may not be reproduced except in full.Accreditation No 15545.
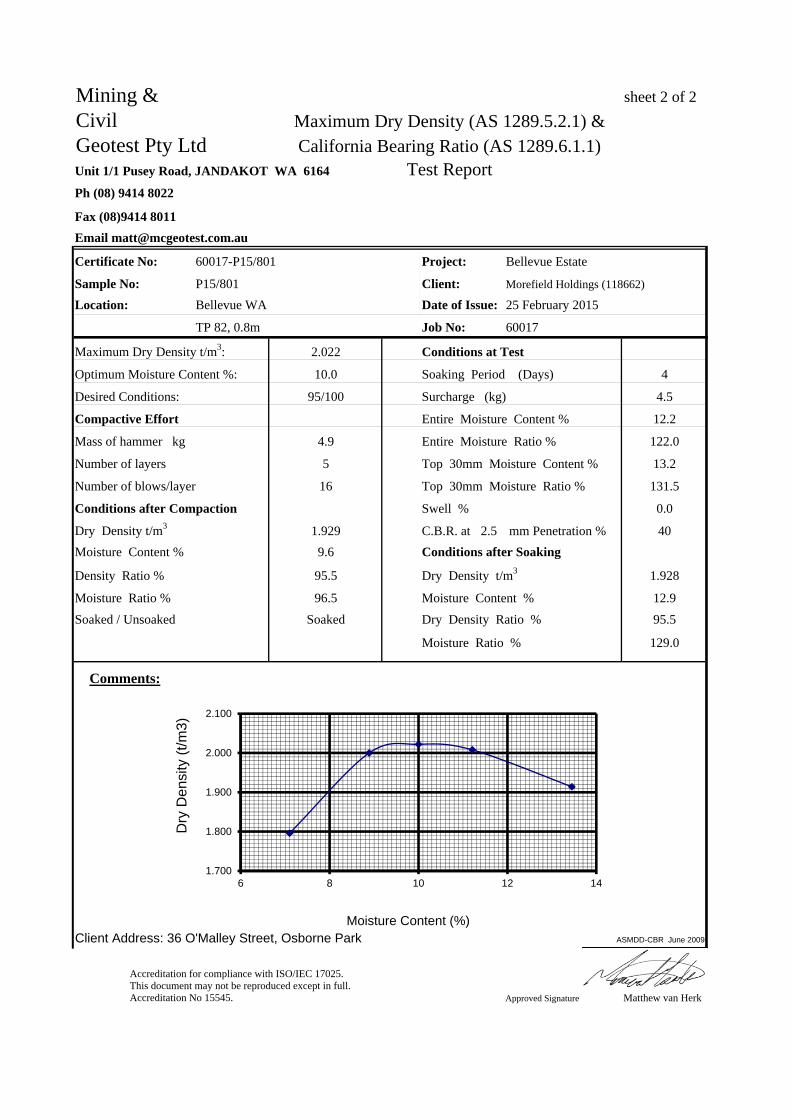
Mining & sheet 2 of 2
Civil Maximum Dry Density (AS 1289.5.2.1) &Geotest Pty Ltd California Bearing Ratio (AS 1289.6.1.1)Unit 1/1 Pusey Road, JANDAKOT WA 6164 Test ReportPh (08) 9414 8022
Fax (08)9414 8011
Certificate No: Project:
Sample No: Client:
Location: Date of Issue:
TP 82, 0.8m Job No: 60017
Maximum Dry Density t/m3:
Optimum Moisture Content %: 4
Desired Conditions: 4.5
Compactive Effort 12.2
Mass of hammer kg 122.0
Number of layers 13.2
Number of blows/layer 131.5
Conditions after Compaction 0.0
Dry Density t/m3 C.B.R. at 2.5 mm Penetration % 40
Moisture Content %
Density Ratio % 1.928
Moisture Ratio % 12.9
Soaked / Unsoaked 95.5
129.0
Comments:
Moisture Content (%)Client Address: 36 O'Malley Street, Osborne Park
Approved Signature Matthew van Herk
Email [email protected]
60017-P15/801 Bellevue Estate
Morefield Holdings (118662)
25 February 2015
P15/801
Bellevue WA
2.022 Conditions at Test
10.0 Soaking Period (Days)
95/100 Surcharge (kg)
Dry Density t/m3
Entire Moisture Content %
4.9 Entire Moisture Ratio %
5 Top 30mm Moisture Content %
Soaked
16 Top 30mm Moisture Ratio %
Swell %
Dry Density Ratio %
1.929
9.6 Conditions after Soaking
95.5
ASMDD-CBR June 2009
Dry
Den
sity
(t/m
3)
Moisture Ratio %
96.5 Moisture Content %
Accreditation for compliance with ISO/IEC 17025. This document may not be reproduced except in full.Accreditation No 15545.
1.700
1.800
1.900
2.000
2.100
6 8 10 12 14
Related Documents