51-1-10052-021 APPENDIX G GEOTECHNICAL LABORATORY TESTING PROCEDURES AND RESULTS

Welcome message from author
This document is posted to help you gain knowledge. Please leave a comment to let me know what you think about it! Share it to your friends and learn new things together.
Transcript
51-1-10052-021
APPENDIX G
GEOTECHNICAL LABORATORY TESTING PROCEDURES AND RESULTS

51-1-10052-021 R1-AG/wp/ADY 51-1-10052-021 G-i
APPENDIX G
GEOTECHNICAL LABORATORY TESTING PROCEDURES AND RESULTS
TABLE OF CONTENTS
Page
G.1. GENERAL ...................................................................................................................... G-1
G.2. VISUAL CLASSIFICATION ........................................................................................ G-1
G.3. WATER CONTENT ....................................................................................................... G-1
G.4. GRAIN SIZE ANALYSIS .............................................................................................. G-1
G.5. ATTERBERG LIMITS ................................................................................................... G-2
G.6. UNIAXIAL COMPRESSIVE STRENGTH.................................................................. G-2
G.7. CORROSIVITY TESTING ............................................................................................ G-3
G.8. REFERENCES ............................................................................................................... G-3
FIGURES
G-1 Grain Size Analysis and Hydrometer (2 sheets)
G-2 Atterberg Limits (2 sheets)
G-3 Uniaxial Compressive Strength B-10 and B-11 (1 sheet)
G-4 Corrosivity Testing (1 sheet)

51-1-10052-021 R1-AG/wp/ADY 51-1-10052-021 G-1
APPENDIX G
GEOTECHNICAL LABORATORY TESTING PROCEDURES AND RESULTS
G.1. GENERAL
This appendix contains descriptions of the procedures and the results of the geotechnical
laboratory tests for the project. Samples recovered from the borings were tested to evaluate the
basic index and engineering properties and strength of the subsurface soils and bedrock.
Geotechnical laboratory testing of recovered soils included visual classifications, water content
determinations, grain size and hydrometer analyses, compressive strength, Atterberg limits, and
corrosion. The laboratory testing was performed in general accordance with ASTM International
(ASTM) standard test procedures.
G.2. VISUAL CLASSIFICATION
Each soil and bedrock sample recovered from the borings was visually classified in our
laboratory. The soil samples were classified using a system based on the ASTM Designation:
D 2487-98, Standard Test Method for Classification of Soil for Engineering Purposes, and/or
ASTM Designation: D 2488-00, Standard Recommended Practice for Description of Soils
(Visual-Manual Procedure) (ASTM, 2007). These ASTM standards generally use the Unified
Soil Classification System. Sample classifications have been incorporated into the soil and
bedrock descriptions on the boring logs presented in Appendix C.
G.3. WATER CONTENT
The natural water content of selected soil and bedrock samples recovered from the borings was
determined in general accordance with ASTM D 2216-98, Standard Method of Laboratory
Determination of water (Moisture) Content of Soil, Rock, and Soil-Aggregate Mixtures (ASTM,
2007). Comparison of natural water content of a soil with its index properties can be useful in
characterizing soil unit weight, consistency, compressibility, and strength. Water contents are
presented on the boring logs in Appendix C.
G.4. GRAIN SIZE ANALYSIS
The grain size distribution of selected samples was tested using sieves and a hydrometer in
general accordance with the ASTM D 422, Standard Test Method for Particle-Size Analysis of
Soils (ASTM, 2007). This test is useful for classifying soil, for providing correlation with soil
properties, and for evaluating liquefaction potential.
51-1-10052-021 R1-AG/wp/ADY 51-1-10052-021 G-2
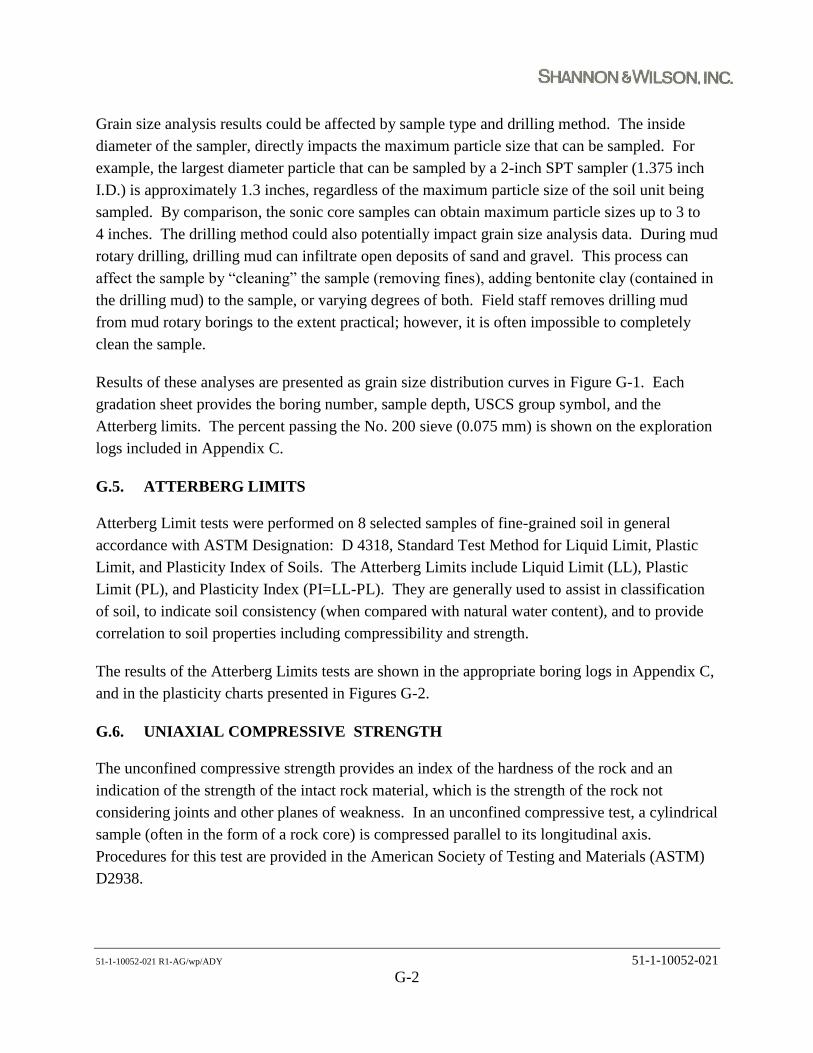
Grain size analysis results could be affected by sample type and drilling method. The inside
diameter of the sampler, directly impacts the maximum particle size that can be sampled. For
example, the largest diameter particle that can be sampled by a 2-inch SPT sampler (1.375 inch
I.D.) is approximately 1.3 inches, regardless of the maximum particle size of the soil unit being
sampled. By comparison, the sonic core samples can obtain maximum particle sizes up to 3 to
4 inches. The drilling method could also potentially impact grain size analysis data. During mud
rotary drilling, drilling mud can infiltrate open deposits of sand and gravel. This process can
affect the sample by “cleaning” the sample (removing fines), adding bentonite clay (contained in
the drilling mud) to the sample, or varying degrees of both. Field staff removes drilling mud
from mud rotary borings to the extent practical; however, it is often impossible to completely
clean the sample.
Results of these analyses are presented as grain size distribution curves in Figure G-1. Each
gradation sheet provides the boring number, sample depth, USCS group symbol, and the
Atterberg limits. The percent passing the No. 200 sieve (0.075 mm) is shown on the exploration
logs included in Appendix C.
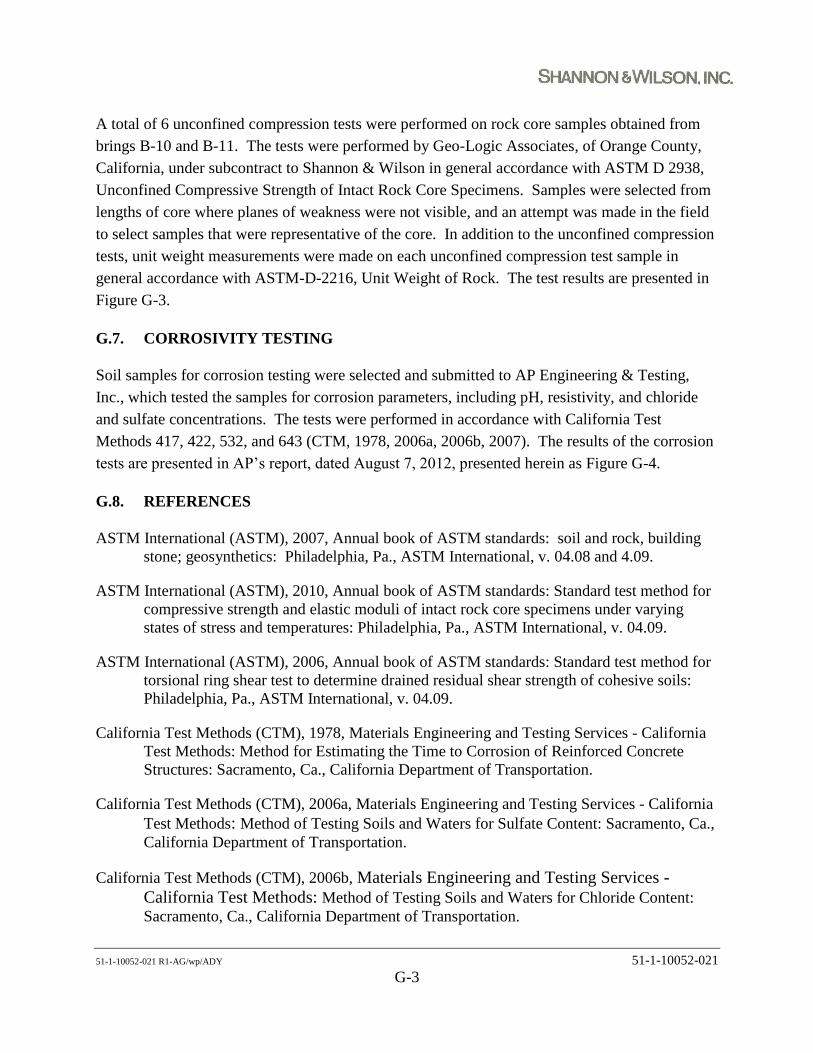
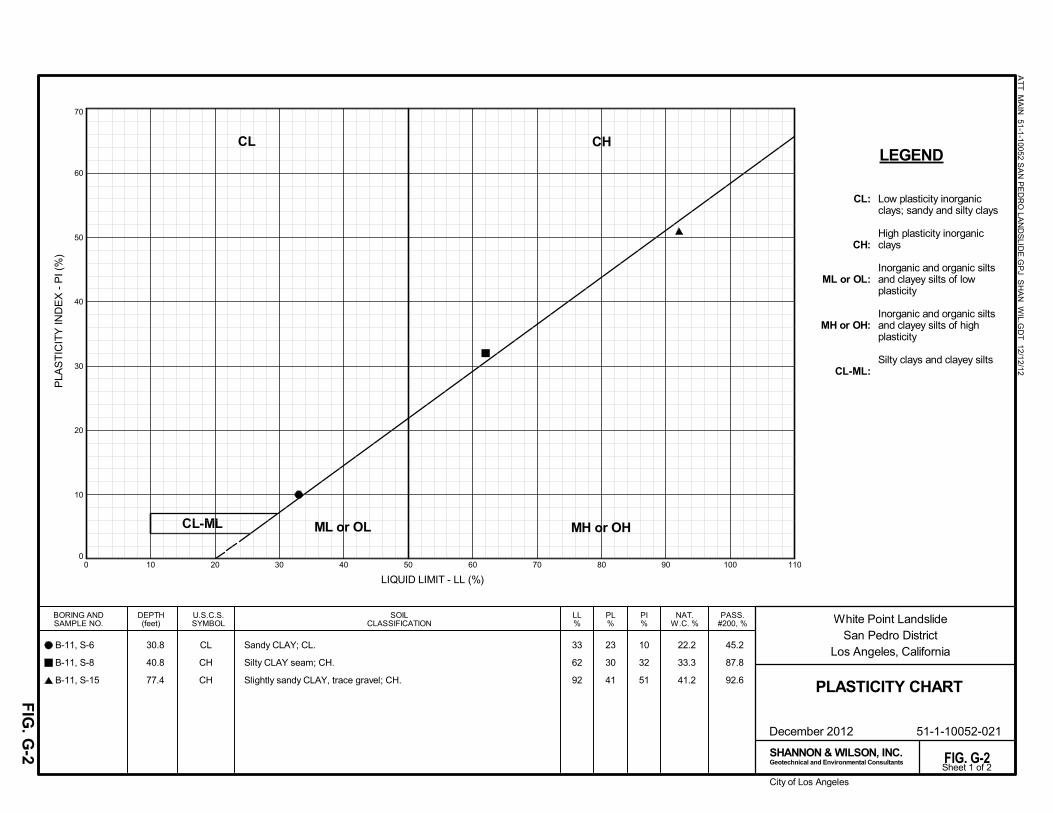
G.5. ATTERBERG LIMITS
Atterberg Limit tests were performed on 8 selected samples of fine-grained soil in general
accordance with ASTM Designation: D 4318, Standard Test Method for Liquid Limit, Plastic
Limit, and Plasticity Index of Soils. The Atterberg Limits include Liquid Limit (LL), Plastic
Limit (PL), and Plasticity Index (PI=LL-PL). They are generally used to assist in classification
of soil, to indicate soil consistency (when compared with natural water content), and to provide
correlation to soil properties including compressibility and strength.
The results of the Atterberg Limits tests are shown in the appropriate boring logs in Appendix C,
and in the plasticity charts presented in Figures G-2.
G.6. UNIAXIAL COMPRESSIVE STRENGTH
The unconfined compressive strength provides an index of the hardness of the rock and an
indication of the strength of the intact rock material, which is the strength of the rock not
considering joints and other planes of weakness. In an unconfined compressive test, a cylindrical
sample (often in the form of a rock core) is compressed parallel to its longitudinal axis.
Procedures for this test are provided in the American Society of Testing and Materials (ASTM)
D2938.
51-1-10052-021 R1-AG/wp/ADY 51-1-10052-021 G-3
A total of 6 unconfined compression tests were performed on rock core samples obtained from
brings B-10 and B-11. The tests were performed by Geo-Logic Associates, of Orange County,
California, under subcontract to Shannon & Wilson in general accordance with ASTM D 2938,
Unconfined Compressive Strength of Intact Rock Core Specimens. Samples were selected from
lengths of core where planes of weakness were not visible, and an attempt was made in the field
to select samples that were representative of the core. In addition to the unconfined compression
tests, unit weight measurements were made on each unconfined compression test sample in
general accordance with ASTM-D-2216, Unit Weight of Rock. The test results are presented in
Figure G-3.
G.7. CORROSIVITY TESTING
Soil samples for corrosion testing were selected and submitted to AP Engineering & Testing,
Inc., which tested the samples for corrosion parameters, including pH, resistivity, and chloride
and sulfate concentrations. The tests were performed in accordance with California Test
Methods 417, 422, 532, and 643 (CTM, 1978, 2006a, 2006b, 2007). The results of the corrosion
tests are presented in AP’s report, dated August 7, 2012, presented herein as Figure G-4.
G.8. REFERENCES
ASTM International (ASTM), 2007, Annual book of ASTM standards: soil and rock, building
stone; geosynthetics: Philadelphia, Pa., ASTM International, v. 04.08 and 4.09.
ASTM International (ASTM), 2010, Annual book of ASTM standards: Standard test method for
compressive strength and elastic moduli of intact rock core specimens under varying
states of stress and temperatures: Philadelphia, Pa., ASTM International, v. 04.09.
ASTM International (ASTM), 2006, Annual book of ASTM standards: Standard test method for
torsional ring shear test to determine drained residual shear strength of cohesive soils:
Philadelphia, Pa., ASTM International, v. 04.09.
California Test Methods (CTM), 1978, Materials Engineering and Testing Services - California
Test Methods: Method for Estimating the Time to Corrosion of Reinforced Concrete
Structures: Sacramento, Ca., California Department of Transportation.
California Test Methods (CTM), 2006a, Materials Engineering and Testing Services - California
Test Methods: Method of Testing Soils and Waters for Sulfate Content: Sacramento, Ca.,
California Department of Transportation.
California Test Methods (CTM), 2006b, Materials Engineering and Testing Services -
California Test Methods: Method of Testing Soils and Waters for Chloride Content:
Sacramento, Ca., California Department of Transportation.

51-1-10052-021 R1-AG/wp/ADY 51-1-10052-021 G-4
California Test Methods (CTM), 2007, Materials Engineering and Testing Services -
California Test Methods: Method for Determining Field and Laboratory Resistivity and
pH Measurements for Soil and Water: Sacramento, Ca., California Department of
Transportation.

0
10
20
30
40
50
60
70
80
90
100
NAT.W.C. %
34
36
33
32
35
B-10, S-10
B-10, S-11
B-10, S-12
B-10, S-18
B-10, S-19
66
67
59
55
59
.004
PI%
.08
4
PE
RC
EN
T C
OA
RS
ER
BY
WE
IGH
T
.002
8
10
FIG
. G-1
.06.8
.06
FINE
.03
40
40
LL%
.01
.008
.008
6 100
.4
1 1/
2
.04
1
.3
102 1
5/8
HYDROMETER ANALYSIS
3/8
DEPTH(feet)
U.S.C.S.SYMBOL
December 2012
80
.01
2
.1
.00660
.003
COBBLES
200
GRAVEL
30.6
29.2
27.9
12.9
12.9
32
31
26
23
24
BORING ANDSAMPLE NO.
COARSE MEDIUM
12 20
90.2
78.1
77.0
49.4
53.0
.001
GRAIN SIZE DISTRIBUTION
50.7
60.2
60.7
93.0
99.5
1/4
4
.004
SAND
FINES%
3
SIZE OF MESH OPENING IN INCHES
.04
.03
.003
6
FINE
GRAIN SIZE IN MILLIMETERS
300
.006
SAMPLEDESCRIPTION White Point Landslide
San Pedro DistrictLos Angeles, California
100
90
80
70
60
50
40
30
20
10
0
20
SIEVE ANALYSIS
.001
.2
.02
60
GRAIN SIZE IN MILLIMETERS
100
GS
A_M
AIN
51-1-10052 SA
N P
ED
RO
LAN
DS
LIDE
.GP
J SH
AN
_WIL.G
DT
12/12/12
.002
.0230
FINES: SILT OR CLAY
NO. OF MESH OPENINGS PER INCH, U.S. STANDARD
FIG. G-1
51-1-10052-021
COARSE
200
1/2
4
PE
RC
EN
T F
INE
R B
Y W
EIG
HT
PL%
3/4
3
Geotechnical and Environmental Consultants
.6
SHANNON & WILSON, INC.
Slightly sandy CLAY; CH.
Soft silty CLAY; CH.
Soft silty CLAY; CH.
Sandy CLAY; CH.
Sandy CLAY, trace gravel; CH.
CH
CH
CH
CH
CH
Sheet 1 of 2

0
10
20
30
40
50
60
70
80
90
100
NAT.W.C. %
10
32
51
B-11, S-6
B-11, S-8
B-11, S-15
33
62
92
.004
PI%
.08
4
PE
RC
EN
T C
OA
RS
ER
BY
WE
IGH
T
.002
8
10
FIG
. G-2
.06.8
.06
FINE
.03
40
40
LL%
.01
.008
.008
6 100
.4
1 1/
2
.04
1
.3
102 1
5/8
HYDROMETER ANALYSIS
3/8
DEPTH(feet)
U.S.C.S.SYMBOL
December 2012
80
.01
2
.1
.00660
.003
COBBLES
200
GRAVEL
22.2
33.3
41.2
23
30
41
BORING ANDSAMPLE NO.
COARSE MEDIUM
12 20
45.2
87.8
92.6
.001
GRAIN SIZE DISTRIBUTION
30.8
40.8
77.4
1/4
4
.004
SAND
FINES%
3
SIZE OF MESH OPENING IN INCHES
.04
.03
.003
6
FINE
GRAIN SIZE IN MILLIMETERS
300
.006
SAMPLEDESCRIPTION White Point Landslide
San Pedro DistrictLos Angeles, California
100
90
80
70
60
50
40
30
20
10
0
20
SIEVE ANALYSIS
.001
.2
.02
60
GRAIN SIZE IN MILLIMETERS
100
GS
A_M
AIN
51-1-10052 SA
N P
ED
RO
LAN
DS
LIDE
.GP
J SH
AN
_WIL.G
DT
12/12/12
.002
.0230
FINES: SILT OR CLAY
NO. OF MESH OPENINGS PER INCH, U.S. STANDARD
FIG. G-2
51-1-10052-021
COARSE
200
1/2
4
PE
RC
EN
T F
INE
R B
Y W
EIG
HT
PL%
3/4
3
Geotechnical and Environmental Consultants
.6
SHANNON & WILSON, INC.
Sandy CLAY; CL.
Silty CLAY seam; CH.
Slightly sandy CLAY, trace gravel; CH.
CL
CH
CH
Sheet 2 of 2
0
10
20
30
40
50
60
70
0 10 20 30 40 50 60 70 80 90 100 110
LIQUID LIMIT - LL (%)
PI%
AT
T_M
AIN
51-1-10052 SA
N P
ED
RO
LAN
DS
LIDE
.GP
J SH
AN
_WIL.G
DT
12/12/12
30.6
29.2
27.9
12.9
12.9
DEPTH(feet)
December 2012
PASS.#200, %
BORING ANDSAMPLE NO.
CL:
CH:
ML or OL:
MH or OH:
CL-ML:
CHCL
ML or OL
32
31
26
23
24
PLA
ST
ICIT
Y IN
DE
X -
PI (
%)
SHANNON & WILSON, INC.
66
67
59
55
59
PLASTICITY CHART
LEGEND
34
36
33
32
35
FIG
. G-2
PL%
Geotechnical and Environmental Consultants
Low plasticity inorganicclays; sandy and silty clays
High plasticity inorganicclays
Inorganic and organic siltsand clayey silts of lowplasticity
Inorganic and organic siltsand clayey silts of highplasticity
Silty clays and clayey silts
LL%
City of Los Angeles
FIG. G-2
CL-ML
90.2
78.1
77.0
49.4
53.0
MH or OH
NAT.W.C. %
SOILCLASSIFICATION White Point Landslide
San Pedro DistrictLos Angeles, California
B-10, S-10
B-10, S-11
B-10, S-12
B-10, S-18
B-10, S-19
50.7
60.2
60.7
93.0
99.5
51-1-10052-021
CH
CH
CH
CH
CH
U.S.C.S.SYMBOL
Slightly sandy CLAY; CH.
Soft silty CLAY; CH.
Soft silty CLAY; CH.
Sandy CLAY; CH.
Sandy CLAY, trace gravel; CH.
Sheet 1 of 2
0
10
20
30
40
50
60
70
0 10 20 30 40 50 60 70 80 90 100 110
LIQUID LIMIT - LL (%)
PI%
AT
T_M
AIN
51-1-10052 SA
N P
ED
RO
LAN
DS
LIDE
.GP
J SH
AN
_WIL.G
DT
12/12/12
22.2
33.3
41.2
DEPTH(feet)
December 2012
PASS.#200, %
BORING ANDSAMPLE NO.
CL:
CH:
ML or OL:
MH or OH:
CL-ML:
CHCL
ML or OL
23
30
41
PLA
ST
ICIT
Y IN
DE
X -
PI (
%)
SHANNON & WILSON, INC.
33
62
92 PLASTICITY CHART
LEGEND
10
32
51
FIG
. G-2
PL%
Geotechnical and Environmental Consultants
Low plasticity inorganicclays; sandy and silty clays
High plasticity inorganicclays
Inorganic and organic siltsand clayey silts of lowplasticity
Inorganic and organic siltsand clayey silts of highplasticity
Silty clays and clayey silts
LL%
City of Los Angeles
FIG. G-2
CL-ML
45.2
87.8
92.6
MH or OH
NAT.W.C. %
SOILCLASSIFICATION White Point Landslide
San Pedro DistrictLos Angeles, California
B-11, S-6
B-11, S-8
B-11, S-15
30.8
40.8
77.4
51-1-10052-021
CL
CH
CH
U.S.C.S.SYMBOL
Sandy CLAY; CL.
Silty CLAY seam; CH.
Slightly sandy CLAY, trace gravel; CH.
Sheet 1 of 2


Related Documents