Appendix 5: Multi-Attribute Utility Analysis Choosing among decommissioning alternatives is complicated by the fact that each option involves multiple characteristics, or attributes, that are important to decision makers. Some attributes, such as cost, can more readily be quantified. For others, such as impacts on marine mammals or on the broader regional economy, data gaps and/or inherent uncertainty means they can only be described and evaluated qualitatively. Focusing only or primarily on quantitative attributes can undermine the quality of decisions because qualitative attributes can be as important as, or more important than, those that can be quantified. Attributes discussed in the preceding subsections ranged from those that can be quantified relatively reliably (decommissioning costs) to ones with quantitative but uncertain estimates (biological production) to those that can only be addressed in qualitative terms (impacts on marine mammals). Because both quantitative and qualitative attributes are important to consider in decisions about decommissioning, we have included both types of attributes within a single integrated decision framework based on multi-attribute utility theory (MAUT). The MAUT approach, involving additive utility functions and preference modeling, has been researched and studied in great detail over a period of decades. Fishburn (1970) and Keeney and Raiffa (1976) provide excellent summaries of the background and history of MAUT. The historical development of the MAUT approach can be traced through the work of Debreu (1960), Luce and Tukey (1964), Krantz (1964), Pollak (1967), Keeney (1968), and others. We use a framework sometimes referred to as the Analytica Hierarchy Process (AHP) (Saaty 1980), which supports the ability to assign relative values to qualitative attributes so they can be included in the quantitative multi-attribute scoring of decision options. This is a key aspect of the approach we apply because it allows users to integrate the entire range of attributes into a single analysis. The approach allows attribute weights (smart values that reflect relative importance to users, or values) to be set explicitly and adjusted by users. This permits users to systematically explore the effects on the choice of decommissioning option of different perceptions of the relative value, importance, or weighting of each attribute. This method is highly effective in enabling users to conduct their own sensitivity analysis to identify breakeven points and evaluate preference trade-offs between conflicting objectives or choices. Applying this approach involves the following steps, which are described below and then applied to illustrative decommissioning scenarios: • Define a utility function that scales the importance or impact of each attribute from 0 to 1 • Define and rate each attribute on a five-point scale scored from best (100) to worst (0) that reflects the range of conditions that might occur as a result of decommissioning • Scale and normalize attribute scores for a given decommissioning scenario in terms of each attribute’s Best-to-Worst range; this will result in a proportion somewhere between 0 and 1 for each attribute • Weight the attributes to reflect user preferences about the relative importance of each attribute • Calculate the overall multi-attribute score A5-1

Welcome message from author
This document is posted to help you gain knowledge. Please leave a comment to let me know what you think about it! Share it to your friends and learn new things together.
Transcript

Appendix 5: Multi-Attribute Utility Analysis Choosing among decommissioning alternatives is complicated by the fact that each option involves multiple characteristics, or attributes, that are important to decision makers. Some attributes, such as cost, can more readily be quantified. For others, such as impacts on marine mammals or on the broader regional economy, data gaps and/or inherent uncertainty means they can only be described and evaluated qualitatively. Focusing only or primarily on quantitative attributes can undermine the quality of decisions because qualitative attributes can be as important as, or more important than, those that can be quantified. Attributes discussed in the preceding subsections ranged from those that can be quantified relatively reliably (decommissioning costs) to ones with quantitative but uncertain estimates (biological production) to those that can only be addressed in qualitative terms (impacts on marine mammals). Because both quantitative and qualitative attributes are important to consider in decisions about decommissioning, we have included both types of attributes within a single integrated decision framework based on multi-attribute utility theory (MAUT). The MAUT approach, involving additive utility functions and preference modeling, has been researched and studied in great detail over a period of decades. Fishburn (1970) and Keeney and Raiffa (1976) provide excellent summaries of the background and history of MAUT. The historical development of the MAUT approach can be traced through the work of Debreu (1960), Luce and Tukey (1964), Krantz (1964), Pollak (1967), Keeney (1968), and others. We use a framework sometimes referred to as the Analytica Hierarchy Process (AHP) (Saaty 1980), which supports the ability to assign relative values to qualitative attributes so they can be included in the quantitative multi-attribute scoring of decision options. This is a key aspect of the approach we apply because it allows users to integrate the entire range of attributes into a single analysis. The approach allows attribute weights (smart values that reflect relative importance to users, or values) to be set explicitly and adjusted by users. This permits users to systematically explore the effects on the choice of decommissioning option of different perceptions of the relative value, importance, or weighting of each attribute. This method is highly effective in enabling users to conduct their own sensitivity analysis to identify breakeven points and evaluate preference trade-offs between conflicting objectives or choices. Applying this approach involves the following steps, which are described below and then applied to illustrative decommissioning scenarios: • Define a utility function that scales the importance or impact of each attribute from 0 to 1
• Define and rate each attribute on a five-point scale scored from best (100) to worst (0) that reflects the range of conditions that might occur as a result of decommissioning
• Scale and normalize attribute scores for a given decommissioning scenario in terms of each attribute’s Best-to-Worst range; this will result in a proportion somewhere between 0 and 1 for each attribute
• Weight the attributes to reflect user preferences about the relative importance of each attribute
• Calculate the overall multi-attribute score
A5-1
Define the utility function The brief description provided here is for those interested in the basic structure of the underlying utility function. The utility function describes how the scores of the weighted attributes are added to arrive at an overall integrated score for a particular choice, using the weights applied to each attribute to take account of the user’s judgments about the relative importance of each attribute. The general form of the utility function that has m attributes is:
(1) )(),...,(1
1 iii
m
im xUwxxU
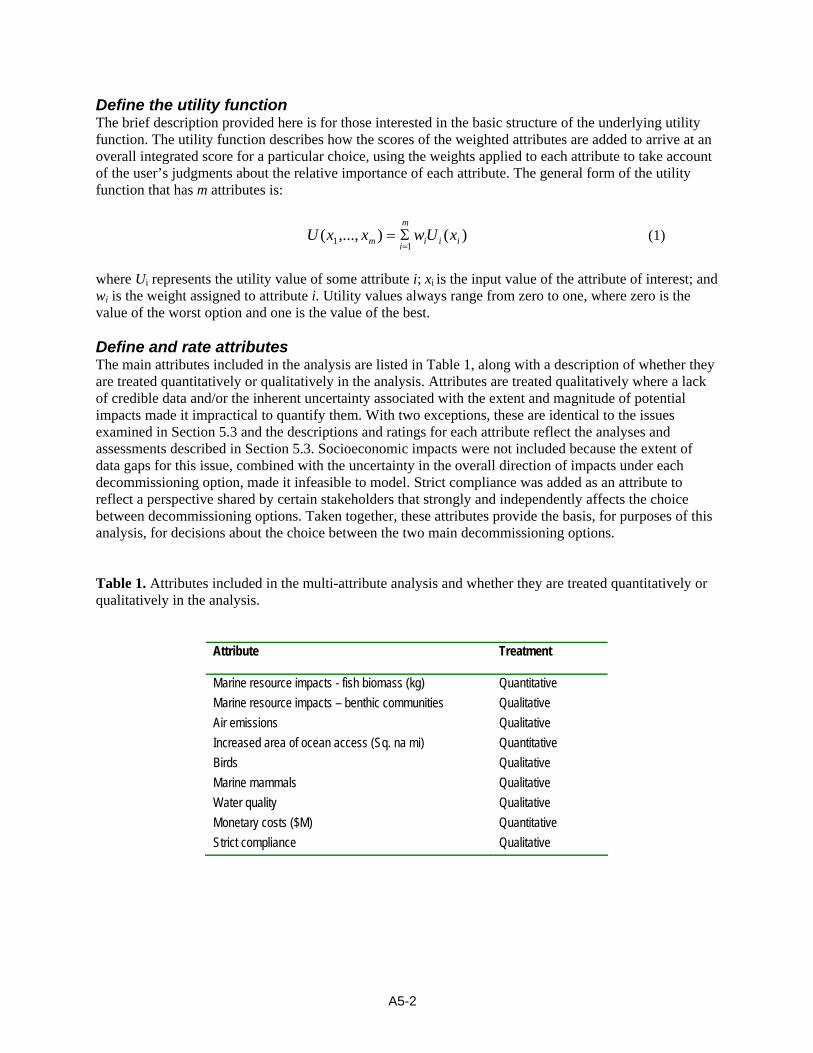
where Ui represents the utility value of some attribute i; xi is the input value of the attribute of interest; and wi is the weight assigned to attribute i. Utility values always range from zero to one, where zero is the value of the worst option and one is the value of the best. Define and rate attributes The main attributes included in the analysis are listed in Table 1, along with a description of whether they are treated quantitatively or qualitatively in the analysis. Attributes are treated qualitatively where a lack of credible data and/or the inherent uncertainty associated with the extent and magnitude of potential impacts made it impractical to quantify them. With two exceptions, these are identical to the issues examined in Section 5.3 and the descriptions and ratings for each attribute reflect the analyses and assessments described in Section 5.3. Socioeconomic impacts were not included because the extent of data gaps for this issue, combined with the uncertainty in the overall direction of impacts under each decommissioning option, made it infeasible to model. Strict compliance was added as an attribute to reflect a perspective shared by certain stakeholders that strongly and independently affects the choice between decommissioning options. Taken together, these attributes provide the basis, for purposes of this analysis, for decisions about the choice between the two main decommissioning options. Table 1. Attributes included in the multi-attribute analysis and whether they are treated quantitatively or qualitatively in the analysis.
Attribute
Treatment
Marine resource impacts - fish biomass (kg) Quantitative
Marine resource impacts – benthic communities Qualitative
Air emissions Qualitative
Increased area of ocean access (Sq. na mi) Quantitative
Birds Qualitative
Marine mammals Qualitative
Water quality Qualitative
Monetary costs ($M) Quantitative
Strict compliance Qualitative
A5-2
In order to enable the qualitative attributes to be included in the quantitative multi-attribute scoring of decision options, we adopted a five-point scale, ranging from best (100) to worst (0). Thus, each attribute level is associated with a corresponding numeric score (Table 2). This approach allows all qualitative attributes to be placed on the same scale and removes the problems associated with attempting to compare attributes with inherently different scales (e.g., water quality and marine mammals). For this step in the attribute rating process, each attribute is rated on the five-point scale without reference to other attributes. For example, the Worst potential water quality impact is identified and assigned a score of 100 without reference to what the Worst marine mammal impact might be. Some scores are not relevant to some attributes, where, for example, there might realistically be only three likely types of outcome (e.g., Best, Poor, Worst. While applying this scaling approach necessarily requires making judgments about what constitutes Best or Medium, for example, we make this process as transparent as possible in the following subsections by describing explicitly the meaning of each condition for each attribute. Although this particular five-point scoring method is subjective, it is an accepted approach within the MAUT school of thought.
Table 2: Attribute scores associated with each attribute level for those attributes evaluated qualitatively.
Attribute level
Attribute score
Best 100
Good 75
Medium 50
Poor 25
Worst 0
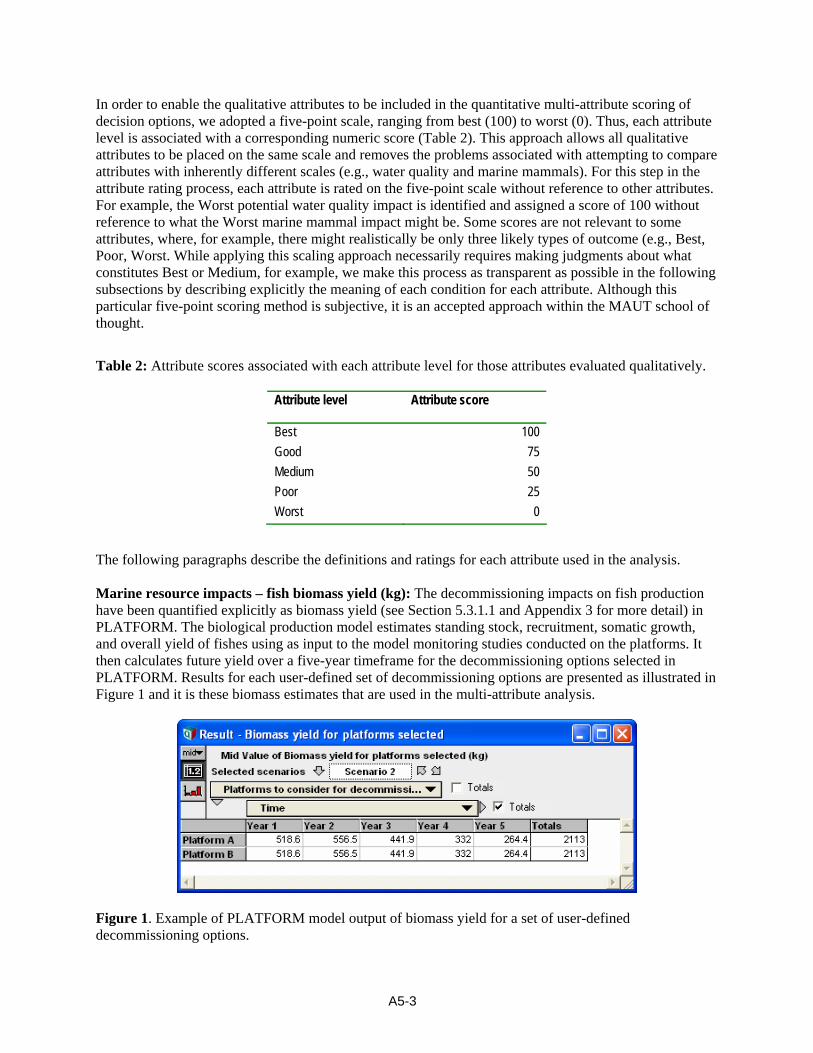
The following paragraphs describe the definitions and ratings for each attribute used in the analysis. Marine resource impacts – fish biomass yield (kg): The decommissioning impacts on fish production have been quantified explicitly as biomass yield (see Section 5.3.1.1 and Appendix 3 for more detail) in PLATFORM. The biological production model estimates standing stock, recruitment, somatic growth, and overall yield of fishes using as input to the model monitoring studies conducted on the platforms. It then calculates future yield over a five-year timeframe for the decommissioning options selected in PLATFORM. Results for each user-defined set of decommissioning options are presented as illustrated in Figure 1 and it is these biomass estimates that are used in the multi-attribute analysis.
Figure 1. Example of PLATFORM model output of biomass yield for a set of user-defined decommissioning options.
A5-3
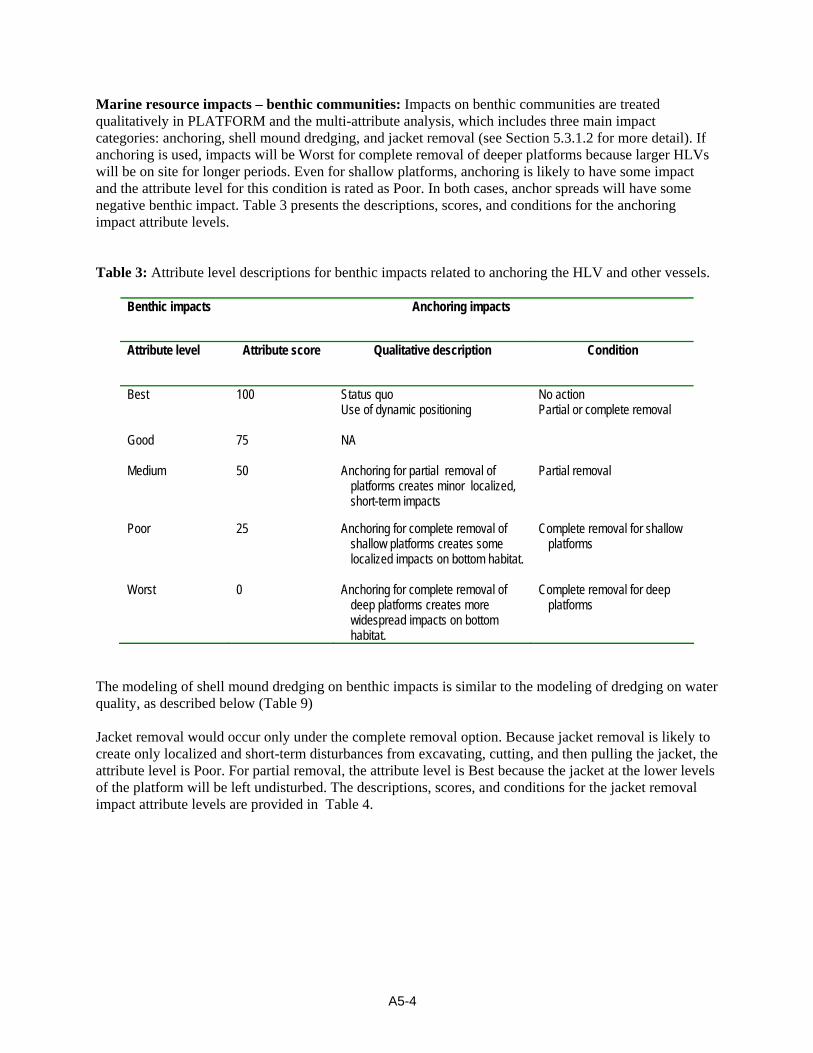
Marine resource impacts – benthic communities: Impacts on benthic communities are treated qualitatively in PLATFORM and the multi-attribute analysis, which includes three main impact categories: anchoring, shell mound dredging, and jacket removal (see Section 5.3.1.2 for more detail). If anchoring is used, impacts will be Worst for complete removal of deeper platforms because larger HLVs will be on site for longer periods. Even for shallow platforms, anchoring is likely to have some impact and the attribute level for this condition is rated as Poor. In both cases, anchor spreads will have some negative benthic impact. Table 3 presents the descriptions, scores, and conditions for the anchoring impact attribute levels. Table 3: Attribute level descriptions for benthic impacts related to anchoring the HLV and other vessels.
Benthic impacts Anchoring impacts
Attribute level Attribute score Qualitative description Condition
Best 100 Status quo Use of dynamic positioning
No action Partial or complete removal
Good
75 NA
Medium 50 Anchoring for partial removal of platforms creates minor localized, short-term impacts
Partial removal
Poor 25 Anchoring for complete removal of shallow platforms creates some localized impacts on bottom habitat.
Complete removal for shallow platforms
Worst 0 Anchoring for complete removal of deep platforms creates more widespread impacts on bottom habitat.
Complete removal for deep platforms
The modeling of shell mound dredging on benthic impacts is similar to the modeling of dredging on water quality, as described below (Table 9) Jacket removal would occur only under the complete removal option. Because jacket removal is likely to create only localized and short-term disturbances from excavating, cutting, and then pulling the jacket, the attribute level is Poor. For partial removal, the attribute level is Best because the jacket at the lower levels of the platform will be left undisturbed. The descriptions, scores, and conditions for the jacket removal impact attribute levels are provided in Table 4.
A5-4

Table 4: Attribute level descriptions for benthic impacts related to jacket removal, which occurs at depth only in the complete removal option.
Benthic impacts Jacket removal impacts
Attribute level Attribute score Qualitative description Condition
Best 100 Status quo Jacket left undisturbed at lower levels
of platform
No action Partial removal
Good
75 NA
Medium 50 NA
Poor 25 Jacket removal and site clearance create localized and short-term disturbances from cutting and pulling the jacket
Complete removal
Worst 0 NA
The attribute scores for each of the three impact categories are combined into a single score for benthic impacts by taking the lowest score (worst attribute level) for a given platform. For example, if a platform's score for anchoring impact is 50 (Medium), 25 (Poor) for shell mound dredging, and 25 (Poor) for jacket removal, the net score for benthic impacts would be 25 (Poor). This overall score is subsequently used as part of the multi-attribute analysis. Air emissions: Air emissions are treated qualitatively in the multi-attribute analysis (see Section 5.3.2 for more detail on data gaps). We assume the air emissions from the decommissioning operation are roughly correlated with the overall level of effort required for the project and the time on station of large equipment such as HLVs. Based on these assumptions, we calculate an air emissions impact factor as the product of the number of service days the HLVs must be on site for a particular project and the size of the HLV (tons) selected for the project, using information from Proserv Offshore (2010) that has been input into PLATFORM. We use the highest and lowest calculated impact factors as the upper and lower bounds on air emissions and divide them into five threshold levels to create a five-point scale. The air emissions impact factors, scaled according to five thresholds, are shown in Figure 2.
A5-5
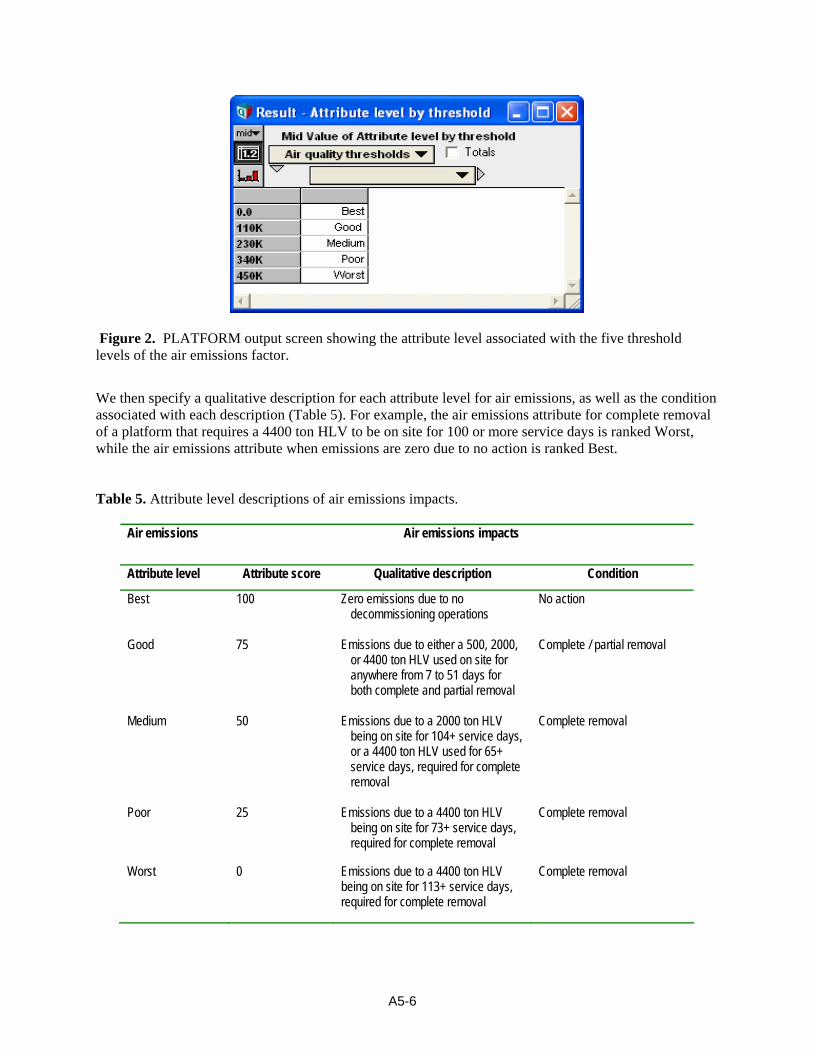
Figure 2. PLATFORM output screen showing the attribute level associated with the five threshold levels of the air emissions factor.
We then specify a qualitative description for each attribute level for air emissions, as well as the condition associated with each description (Table 5). For example, the air emissions attribute for complete removal of a platform that requires a 4400 ton HLV to be on site for 100 or more service days is ranked Worst, while the air emissions attribute when emissions are zero due to no action is ranked Best. Table 5. Attribute level descriptions of air emissions impacts.
Air emissions Air emissions impacts
Attribute level Attribute score Qualitative description Condition
Best 100 Zero emissions due to no decommissioning operations
No action
Good 75 Emissions due to either a 500, 2000, or 4400 ton HLV used on site for anywhere from 7 to 51 days for both complete and partial removal
Complete / partial removal
Medium 50 Emissions due to a 2000 ton HLV being on site for 104+ service days, or a 4400 ton HLV used for 65+ service days, required for complete removal
Complete removal
Poor 25 Emissions due to a 4400 ton HLV being on site for 73+ service days, required for complete removal
Complete removal
Worst 0 Emissions due to a 4400 ton HLV being on site for 113+ service days, required for complete removal
Complete removal
A5-6

PLATFORM determines the required HLV size based upon the decommissioning option selected by the user and the size of platform(s) to be decommissioned. This HLV requirement, along with the number of service days on site for each decommissioning project, provides the basis for the thresholds described in Table 5.21. This in turn provides the rationale for determining the attribute score for a specific project. These attribute scores are then used in calculating the computing a multi-attribute score. Ocean access (sq. nautical miles): This attribute is treated quantitatively in PLATFORM and the method of estimating changes in ocean access under each decommissioning option is described in Section 5.3.6. The model allows users to select whether decommissioned sites will be open to consumptive uses, which is reflected in the designation of each platform as a “take” or “no-take” area. PLATFORM calculates the increase in accessible ocean area for platforms selected by the user and this estimate of surface area is used as part of the multi-attribute analysis. Birds: Potential impacts on birds are treated qualitatively in PLATFORM and the multi-attribute analysis (see Section 5.3.5 for more detail). Both complete and partial platform removal will likely result in reduced mortality due to elimination of collisions with platforms. However, there is a chance that loss of offshore roosting locations will lead to increased energy requirements and a slight reduction in survival and/or fitness. Thus, the model assumes the net attribute level for both removal options to be Medium. Table 6 presents the descriptions, scores, and conditions for impacts, both short- and long-term, on attribute level for birds. Table 6. Attribute level descriptions of short- and long-term impacts on birds. Only three levels are used for this attribute because of the lack of more specific information on decommissioning impacts on bird populations.
Birds Impacts (short- and long-term) on birds
Attribute level Attribute score Qualitative description Condition
Best 100 Reduced mortality due to platform removal and elimination of collisions with platforms; loss of offshore roosting locations compensated by onshore locations
Complete or partial removal
Good
75 NA
Medium 50 Reduced mortality from platform removal and the loss of offshore roosting locations are balanced out causing a medium impact on birds
Complete or partial removal
Poor
25 NA
Worst 0 Loss of offshore roosting locations leads to increased energy requirements and slight reduction in survival and/or fitness, which could contribute to significant increase in mortality, although extremely unlikely. Platform has special status species and sound impacts are high from explosive use
Complete or partial removal
A5-7
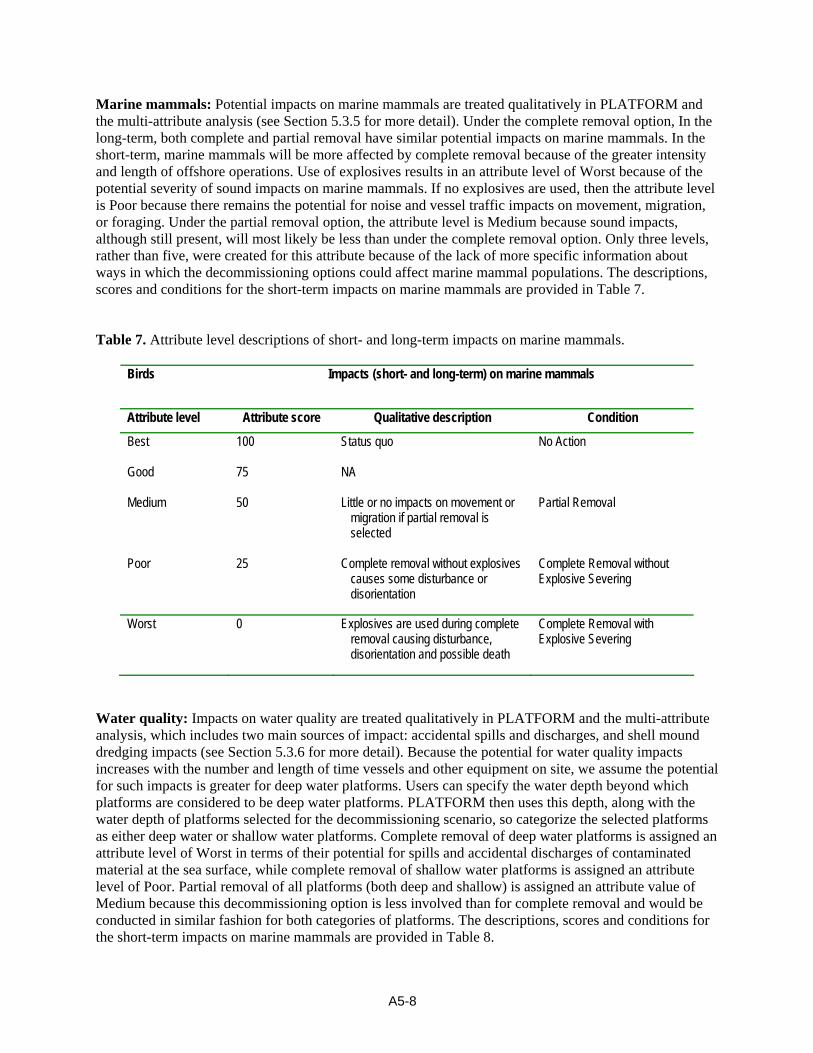
Marine mammals: Potential impacts on marine mammals are treated qualitatively in PLATFORM and the multi-attribute analysis (see Section 5.3.5 for more detail). Under the complete removal option, In the long-term, both complete and partial removal have similar potential impacts on marine mammals. In the short-term, marine mammals will be more affected by complete removal because of the greater intensity and length of offshore operations. Use of explosives results in an attribute level of Worst because of the potential severity of sound impacts on marine mammals. If no explosives are used, then the attribute level is Poor because there remains the potential for noise and vessel traffic impacts on movement, migration, or foraging. Under the partial removal option, the attribute level is Medium because sound impacts, although still present, will most likely be less than under the complete removal option. Only three levels, rather than five, were created for this attribute because of the lack of more specific information about ways in which the decommissioning options could affect marine mammal populations. The descriptions, scores and conditions for the short-term impacts on marine mammals are provided in Table 7. Table 7. Attribute level descriptions of short- and long-term impacts on marine mammals.
Birds Impacts (short- and long-term) on marine mammals
Attribute level Attribute score Qualitative description Condition
Best
100 Status quo No Action
Good
75 NA
Medium 50 Little or no impacts on movement or migration if partial removal is selected
Partial Removal
Poor 25 Complete removal without explosives causes some disturbance or disorientation
Complete Removal without Explosive Severing
Worst 0 Explosives are used during complete removal causing disturbance, disorientation and possible death
Complete Removal with Explosive Severing
Water quality: Impacts on water quality are treated qualitatively in PLATFORM and the multi-attribute analysis, which includes two main sources of impact: accidental spills and discharges, and shell mound dredging impacts (see Section 5.3.6 for more detail). Because the potential for water quality impacts increases with the number and length of time vessels and other equipment on site, we assume the potential for such impacts is greater for deep water platforms. Users can specify the water depth beyond which platforms are considered to be deep water platforms. PLATFORM then uses this depth, along with the water depth of platforms selected for the decommissioning scenario, so categorize the selected platforms as either deep water or shallow water platforms. Complete removal of deep water platforms is assigned an attribute level of Worst in terms of their potential for spills and accidental discharges of contaminated material at the sea surface, while complete removal of shallow water platforms is assigned an attribute level of Poor. Partial removal of all platforms (both deep and shallow) is assigned an attribute value of Medium because this decommissioning option is less involved than for complete removal and would be conducted in similar fashion for both categories of platforms. The descriptions, scores and conditions for the short-term impacts on marine mammals are provided in Table 8.
A5-8
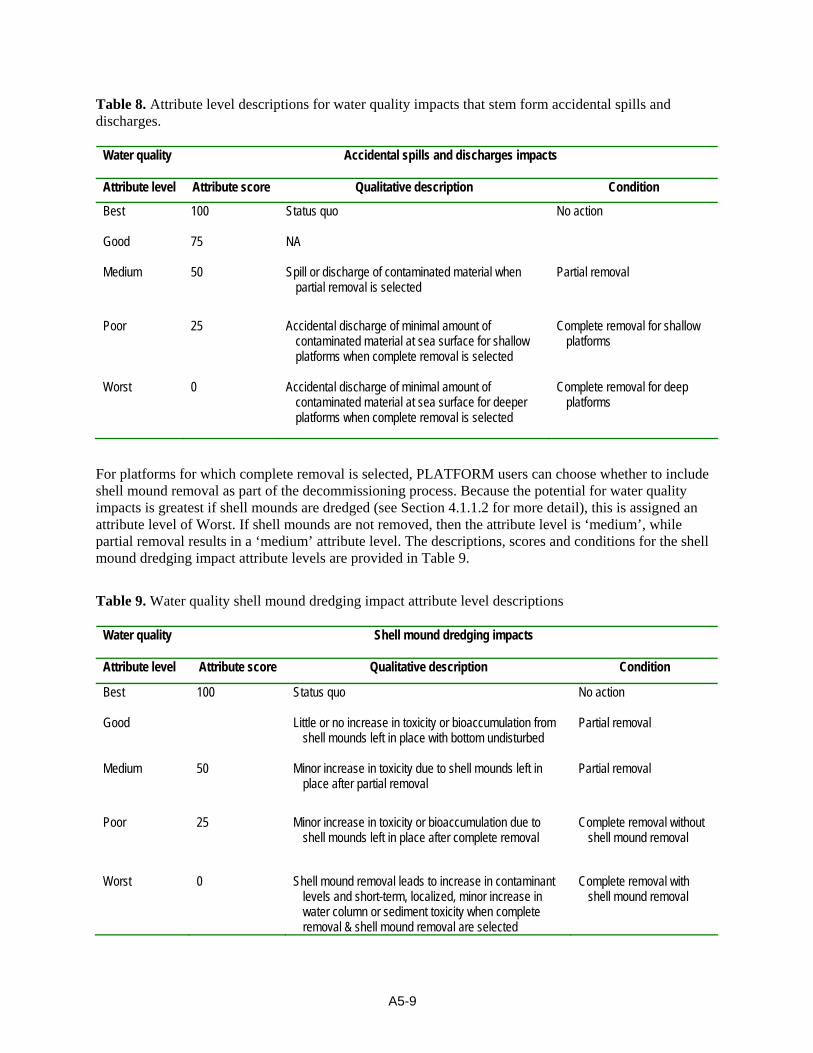
Table 8. Attribute level descriptions for water quality impacts that stem form accidental spills and discharges.
Water quality Accidental spills and discharges impacts
Attribute level Attribute score Qualitative description Condition
Best
100 Status quo No action
Good
75 NA
Medium 50 Spill or discharge of contaminated material when partial removal is selected
Partial removal
Poor 25 Accidental discharge of minimal amount of contaminated material at sea surface for shallow platforms when complete removal is selected
Complete removal for shallow platforms
Worst 0 Accidental discharge of minimal amount of contaminated material at sea surface for deeper platforms when complete removal is selected
Complete removal for deep platforms
For platforms for which complete removal is selected, PLATFORM users can choose whether to include shell mound removal as part of the decommissioning process. Because the potential for water quality impacts is greatest if shell mounds are dredged (see Section 4.1.1.2 for more detail), this is assigned an attribute level of Worst. If shell mounds are not removed, then the attribute level is ‘medium’, while partial removal results in a ‘medium’ attribute level. The descriptions, scores and conditions for the shell mound dredging impact attribute levels are provided in Table 9.
Table 9. Water quality shell mound dredging impact attribute level descriptions
Water quality Shell mound dredging impacts
Attribute level Attribute score Qualitative description Condition
Best
100 Status quo No action
Good
Little or no increase in toxicity or bioaccumulation from shell mounds left in place with bottom undisturbed
Partial removal
Medium 50 Minor increase in toxicity due to shell mounds left in place after partial removal
Partial removal
Poor 25 Minor increase in toxicity or bioaccumulation due to shell mounds left in place after complete removal
Complete removal without shell mound removal
Worst 0 Shell mound removal leads to increase in contaminant levels and short-term, localized, minor increase in water column or sediment toxicity when complete removal & shell mound removal are selected
Complete removal with shell mound removal
A5-9

The attribute scores for spills and discharges are combined with those for shell mound dredging into a single attribute score for water quality by taking the lowest score (worst attribute level) for a given platform. For example, if a platform’s score for accidental spills and discharges is 50 (Medium) and 25 (Poor) for shell mound dredging impacts, the net score for water quality is 25 (Poor). These attribute scores are then used in the multi-attribute analysis. Costs (2009$): Decommissioning costs for both complete and partial removal options are quantified as described in Section 5.3.7. PLATFORM includes two modules related to decommissioning cost. The first module, programmatic costs or indirect costs, is associated with program staffing, operations and administration, and liability insurance coverage. PLATFORM calculates the net present value of estimated indirect costs over a discrete, five-year time frame, using a discount rate selected by users from a range of possible choices. Because future programmatic costs have not been estimated and are highly uncertain, PLATFORM allows users to input their assumptions about potential programmatic costs of a long-term rigs-to-reefs program. These costs are then used as a quantitative input to the multi-attribute analysis. PLATFORM also calculates the direct costs of decommissioning itself, including the complete and partial removal options, and suboptions such as shell mound dredging and reef enhancement. PLATFORM also calculates the avoided cost as the difference between the costs of complete and partial removal. The key outputs from the direct cost analysis, which are used in the multi-attribute analysis, are the total decommissioning and avoided costs for the selected platforms. Strict Compliance: An important subset of stakeholders firmly holds a set of opinions or judgments that combine to create strong support for the complete removal option. One important element in this overall perspective is that human activity in the oceans is likely to create negative impacts and that the ocean environment is at risk from such impacts. A corollary of this judgment is that the residue of human activities, particularly substantial ones such as offshore platforms, should be completely removed from the ocean as soon as such activities are completed. A major intent of this ethic is to reduce any remaining risks of such activities to the greatest extent possible. Closely tied to this set of judgments is another that holds that industry, particularly large industry, should be held to its commitments. In the context of offshore oil and gas production in southern California, this means that oil companies should be required to fulfill the terms of their leases which require complete removal of platforms when production ends. This judgment is strengthened by the long-term memories of the 1969 Santa Barbara oil spill, as a result of which many local stakeholders are disinclined to enable oil companies to achieve cost savings through a partial removal option. The descriptions, scores and conditions for strict compliance impact attribute levels are provided in Table 10.
Table 10: Strict Compliance impacts attribute level descriptions
Water quality Shell mound dredging impacts
Attribute level Attribute score Qualitative description Condition
Best
100 Oil companies fulfill the terms of their leases which require complete removal of platforms when production ends
Complete removal
Good
75 NA
Medium 50 NA
Poor 25 NA
Worst 0 Oil companies do not fulfill the terms of their leases which require complete removal of platforms when production ends
Partial removal
A5-10

Scale the attributes In our analysis, the multi-attribute utility function is used to compute a weighted sum of the scores on each attribute, as shown in equation (1). Each qualitative attribute has an assigned score on the aforementioned five-point numeric scale. The quantitative attribute values, such as cost and increased area of ocean access, are scaled using interpolation to obtain their normalized scores. A general formula to normalize the attributes is:
WorstBest
WorstxU i
(2)
Where “Worst” refers to the criterion with the least favorable score and “Best” refers to the criterion with the most favorable score. Once individual utility values for each attribute are normalized using equation (2), those values are multiplied by their respective weights. Weight the attributes to reflect preferences The tool offers two methods for assigning weights to the attributes to combine them into an overall score for each platform. Attribute range weights can be used to assign a number from 0 – 5 to express the relative importance of each attribute range. The weights specify the relative importance of changing that attribute from its worst to best level. A key point to remember is that you are not setting the importance of the attributes in the abstract — is effect on air quality more or less important than the effect on cost? You are setting range weights. After setting the ratings and weightings, you can view the overall score for each platform. You can then change the decision option for one or more platforms and see how the score changes. In this way, it may help you see the implications of your preferences for the relative scores of different decision options. The equivalent costs method allows the user to specify the relative importance of each attribute as the dollar cost society should be willing to pay to move the attribute from its worst to best value, or equivalently, the dollar value society should accept in compensation if the attribute were moved from its best to worst value. After assigning these cost weights, you can again view the overall score for each option for each platform. The equivalent cost method requires users to monetize each attribute while the range weighting method appears to avoid the necessity of converting all attributes into dollars. However, they are mathematically equivalent. Both result in assigning weights that allow apparently incommensurable attributes to be converted into a common scale, so that we can multiply the levels by the weights and add them together. The f example scenarios below walk through illustrative examples illustrating how users might choose to weight attributes to reflect their preference. Calculate the multi-attribute score If attribute range weights are used, then the relevant result is the multi-attribute score (across all attributes) computed for each decommissioning scenario selected. A scenario can comprise a single platform selected for decommissioning or multiple platforms. If multiple platforms are selected for each scenario, then PLATFORM computes a multi-attribute score for each scenario, based on the weighted sum of scores on each attribute, averaged over all the platforms selected for decommissioning within each scenario. The platform or scenario with the highest score is considered to have the highest utility across all criteria. Alternatively, if equivalent costs are preferred, then PLATFORM will provide the total equivalent cost ($M) as an output.
A5-11
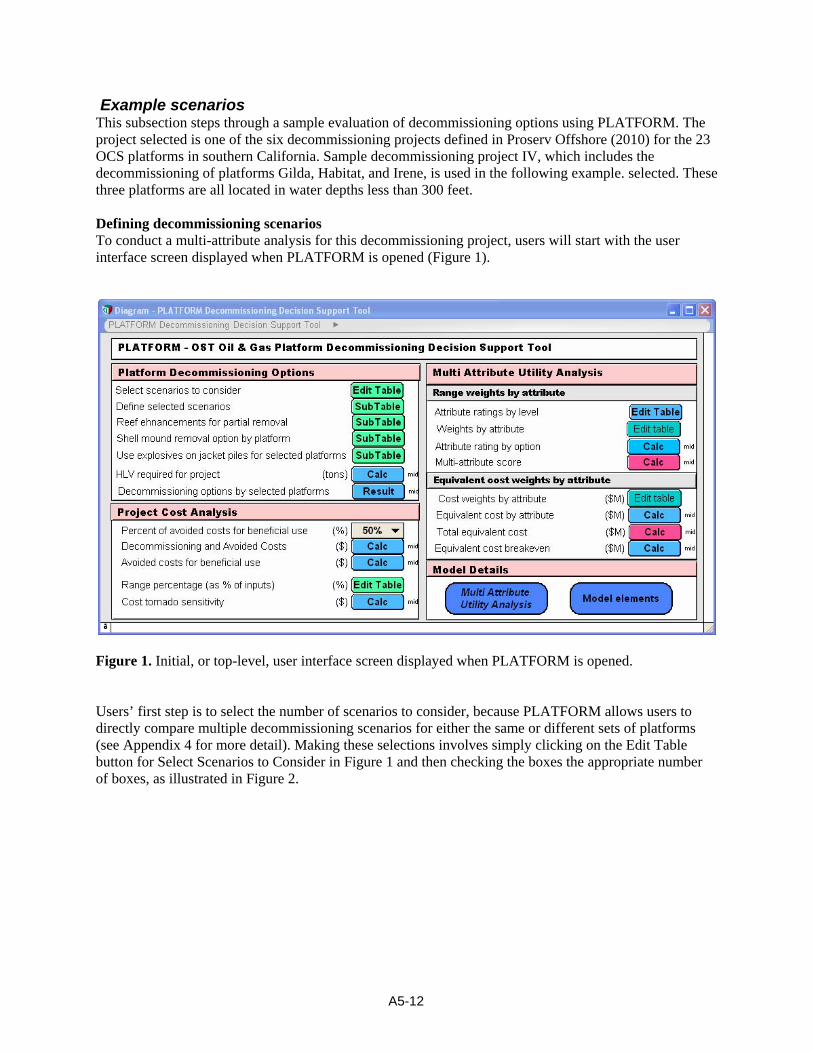
Example scenarios This subsection steps through a sample evaluation of decommissioning options using PLATFORM. The project selected is one of the six decommissioning projects defined in Proserv Offshore (2010) for the 23 OCS platforms in southern California. Sample decommissioning project IV, which includes the decommissioning of platforms Gilda, Habitat, and Irene, is used in the following example. selected. These three platforms are all located in water depths less than 300 feet. Defining decommissioning scenarios To conduct a multi-attribute analysis for this decommissioning project, users will start with the user interface screen displayed when PLATFORM is opened (Figure 1).
Figure 1. Initial, or top-level, user interface screen displayed when PLATFORM is opened. Users’ first step is to select the number of scenarios to consider, because PLATFORM allows users to directly compare multiple decommissioning scenarios for either the same or different sets of platforms (see Appendix 4 for more detail). Making these selections involves simply clicking on the Edit Table button for Select Scenarios to Consider in Figure 1 and then checking the boxes the appropriate number of boxes, as illustrated in Figure 2.
A5-12

Figure 2. Selecting multiple scenarios to consider requires checking the appropriate number of boxes. The next step is to define these scenarios by clicking on the Edit Table button for Define Selected Scenarios in Figure 1.
A5-13
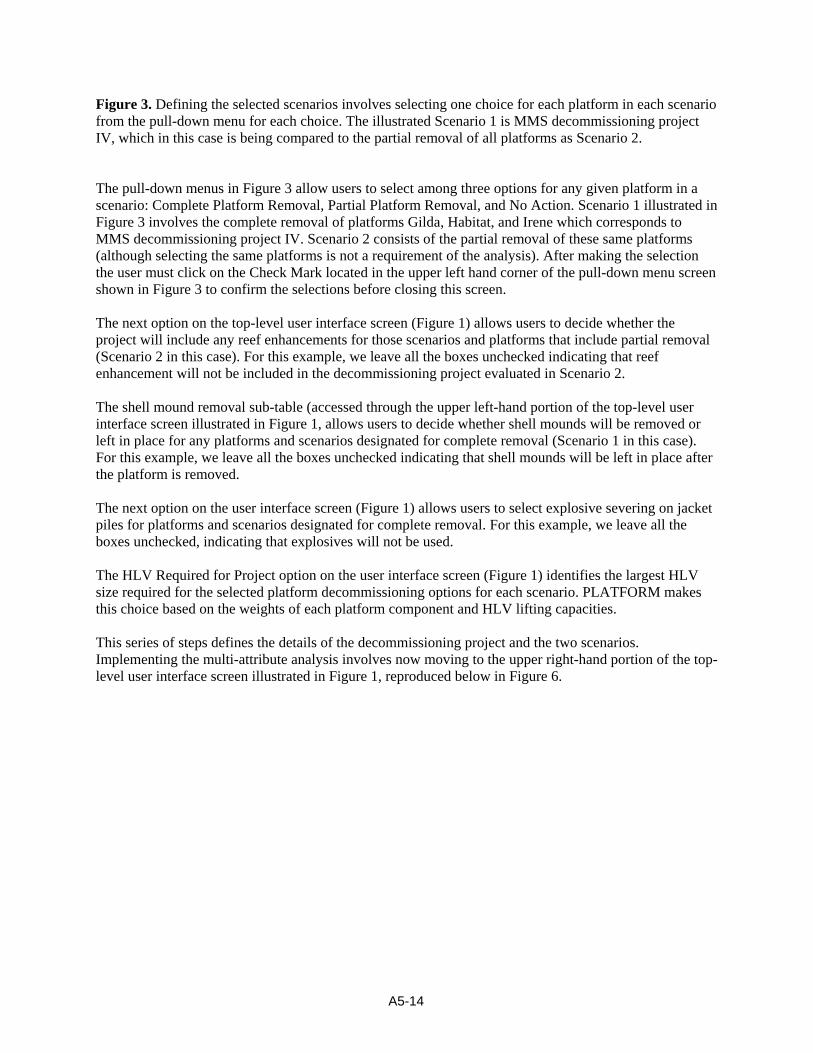
Figure 3. Defining the selected scenarios involves selecting one choice for each platform in each scenario from the pull-down menu for each choice. The illustrated Scenario 1 is MMS decommissioning project IV, which in this case is being compared to the partial removal of all platforms as Scenario 2. The pull-down menus in Figure 3 allow users to select among three options for any given platform in a scenario: Complete Platform Removal, Partial Platform Removal, and No Action. Scenario 1 illustrated in Figure 3 involves the complete removal of platforms Gilda, Habitat, and Irene which corresponds to MMS decommissioning project IV. Scenario 2 consists of the partial removal of these same platforms (although selecting the same platforms is not a requirement of the analysis). After making the selection the user must click on the Check Mark located in the upper left hand corner of the pull-down menu screen shown in Figure 3 to confirm the selections before closing this screen. The next option on the top-level user interface screen (Figure 1) allows users to decide whether the project will include any reef enhancements for those scenarios and platforms that include partial removal (Scenario 2 in this case). For this example, we leave all the boxes unchecked indicating that reef enhancement will not be included in the decommissioning project evaluated in Scenario 2. The shell mound removal sub-table (accessed through the upper left-hand portion of the top-level user interface screen illustrated in Figure 1, allows users to decide whether shell mounds will be removed or left in place for any platforms and scenarios designated for complete removal (Scenario 1 in this case). For this example, we leave all the boxes unchecked indicating that shell mounds will be left in place after the platform is removed. The next option on the user interface screen (Figure 1) allows users to select explosive severing on jacket piles for platforms and scenarios designated for complete removal. For this example, we leave all the boxes unchecked, indicating that explosives will not be used. The HLV Required for Project option on the user interface screen (Figure 1) identifies the largest HLV size required for the selected platform decommissioning options for each scenario. PLATFORM makes this choice based on the weights of each platform component and HLV lifting capacities. This series of steps defines the details of the decommissioning project and the two scenarios. Implementing the multi-attribute analysis involves now moving to the upper right-hand portion of the top-level user interface screen illustrated in Figure 1, reproduced below in Figure 6.
A5-14

Figure 6. The multi-attribute analysis options, taken from the upper right-hand portion of the top-level user interface screen illustrated in Figure 1. Rating attributes individually There are two main ways to use the multi-attribute analysis features of PLATFORM to view and select methods for comparing decision options on all eight attributes: First, users can simply view the selected decision option for each platform and its effect on each attribute, using the Attribute Ratings by Option selection in Figure 6, as illustrated below in Figure 7, which shows the level of each qualitative attribute on the qualitative five-point scale of Best to Worst. Note that these ratings are taken from the set of possible ratings or scores for each option defined in Tables 3 – 10. For example, because Scenario 1 involves complete removal of all three platforms, the rating for Strict Compliance is necessarily Best, while the rating for Benthic impacts is necessarily Poor. Figure 7 also shows the quantified estimate of impact for the l three quantified attributes: fish biomass in kilograms, increased ocean access in square nautical miles, for cost in millions of dollars (2009$).
A5-15

Figure 7. The attribute ratings, or scores, associated with each attribute for the Scenario 1 project involving the complete removal of the three platforms. The second way users can compare the scenarios’ effects on the attributes is to use scaling and weighting to convert the individual attribute levels into an overall score for each platform decision option selected. This allows users to make a direct global comparison between scenarios. The first Edit Table choice in Figure 6 enables users to select Attribute Ratings by Level. The ratings for the qualitative attributes shown in Figure 7 are mapped onto numeric ratings that range from 0 (Worst) to 100 (Best), using as a starting point the default values shown in Table 2. Note that these default values reflect a linear scale and PLATFORM allows users to adjust the ratings for the intermediate attribute levels to reflect their own views (although the endpoints must remain anchored at 0 for Worst and 100 for Best). For example, a user might decide that Poor should be rated as 10 on the 100-point scale rather than 25 (the default rating in Table 2). For purposes of this example, we will use the default values. This simply changes the output table shown in Figure 7 to one that contains numeric ratings rather than the qualitative ones shown. Combining attribute scores into an overall score PLATFORM then offers two methods for assigning weights to the attributes in order to combine them into an overall score for each platform: Range Weights by Attribute and Cost Weight by Attribute. Figure 8 illustrates the former.
A5-16

Figure 8. PLATFORM menu screen that allows users to assign weights to individual attributes to reflect their preferences. The drop-down menu in the second column titled Weights allows users to assign relative weights for attributes that reflect their perception of the relative importance of each attribute’s range from worst to best [5: Best, 1: Worst]. Each weight specifies the relative importance of changing that attribute from its Worst to Best level. Users should begin this process by considering which attribute range they consider has the largest impact. For example, if a user considers the range for the Cost attribute from $0 to $400 million is as or more significant than the effect of changing any other attribute from its Best to Worst level, then the weight of the Cost attribute should be set to 5. Users then identify the attribute they consider the next most important. For example, a user might decide that the impact on marine mammals is more (or as) important as any other attribute except cost. They would then evaluate the question: What is the relative importance to me of changing the impact on marine mammals from Worst (Explosives are used during complete removal causing disturbance, disorientation and possible death) to Best (status quo) and changing costs from $0 to $400 million? If the answer is that this change in impacts on marine mammals is a bit more than half as important as the change in costs, the user might set the weight for the marine mammals attribute to 3. This exercise is then repeated with each attribute until weights have been set for all eight attributes. Clicking on the Calc button for the Multi-Attribute Score on the screen illustrated in Figure 6 causes PLATFORM to calculate a weighted sum of scores over all attributes, averaged over all selected platforms for each scenario, as illustrated in Figure 9. This overall score allows for a global comparison between the two decommissioning scenarios. Figure 9 shows that, for the scenarios defined above for
A5-17
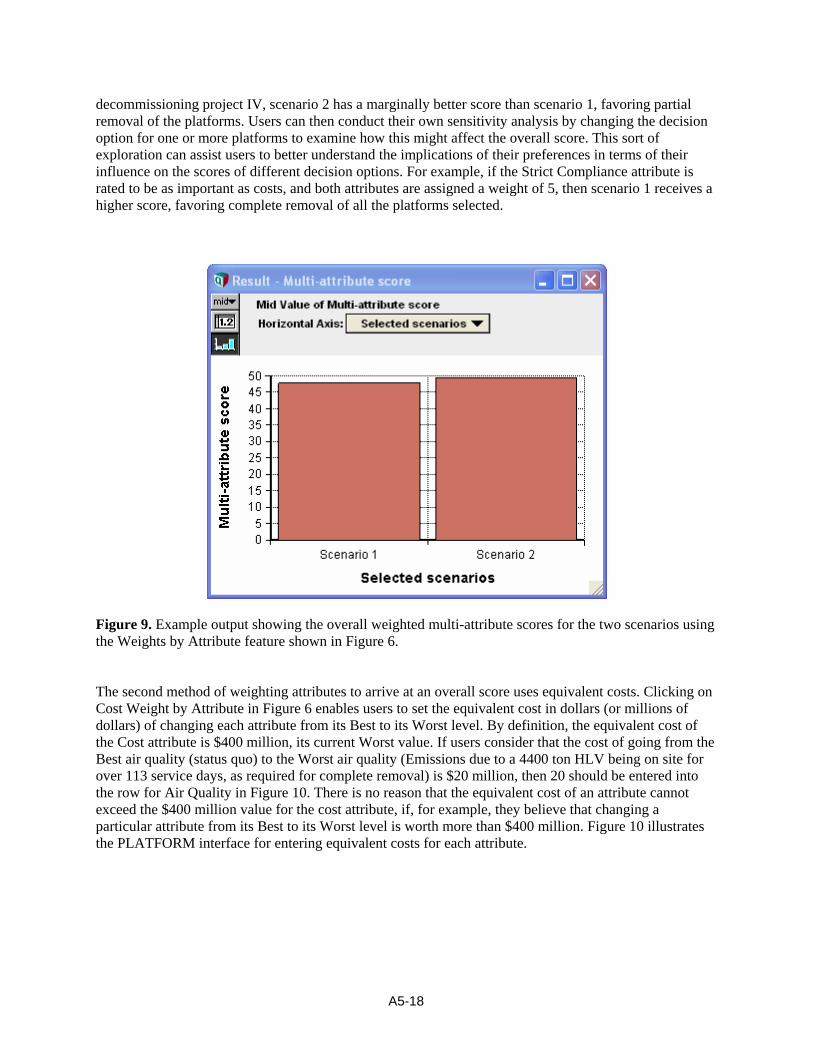
decommissioning project IV, scenario 2 has a marginally better score than scenario 1, favoring partial removal of the platforms. Users can then conduct their own sensitivity analysis by changing the decision option for one or more platforms to examine how this might affect the overall score. This sort of exploration can assist users to better understand the implications of their preferences in terms of their influence on the scores of different decision options. For example, if the Strict Compliance attribute is rated to be as important as costs, and both attributes are assigned a weight of 5, then scenario 1 receives a higher score, favoring complete removal of all the platforms selected.
Figure 9. Example output showing the overall weighted multi-attribute scores for the two scenarios using the Weights by Attribute feature shown in Figure 6. The second method of weighting attributes to arrive at an overall score uses equivalent costs. Clicking on Cost Weight by Attribute in Figure 6 enables users to set the equivalent cost in dollars (or millions of dollars) of changing each attribute from its Best to its Worst level. By definition, the equivalent cost of the Cost attribute is $400 million, its current Worst value. If users consider that the cost of going from the Best air quality (status quo) to the Worst air quality (Emissions due to a 4400 ton HLV being on site for over 113 service days, as required for complete removal) is $20 million, then 20 should be entered into the row for Air Quality in Figure 10. There is no reason that the equivalent cost of an attribute cannot exceed the $400 million value for the cost attribute, if, for example, they believe that changing a particular attribute from its Best to its Worst level is worth more than $400 million. Figure 10 illustrates the PLATFORM interface for entering equivalent costs for each attribute.
A5-18

Figure 10. The PLATFORM interface for entering equivalent costs for each attribute. Clicking the Calc button for Total Equivalent Cost on the screen illustrated in Figure 6 causes PLATFORM to calculate the equivalent costs for all attributes, averaged over all selected platforms for each scenario (Figure 11). For the defined scenarios, Figure 11 shows that the complete and partial removal options are essentially equivalent.
A5-19
A5-20
Figure 11. Example output showing the overall equivalent costs for the two scenarios using the Equivalent Cost feature shown in Figure 6. As we described for the Range Weights by Attribute example, we can adjust the equivalent cost weight by attribute for the strict compliance attribute so that it is at least as important as the monetary cost. This causes the outcome to favor complete removal for the platforms selected. In addition, making adjustments to the platform-specific decisions on explosive use, shell mound removal, and reef enhancements will also cause corresponding changes in the total equivalent cost comparison between the two scenarios. Clicking the Calc button for Equivalent Cost Breakeven on the screen illustrated in Figure 6 will display the breakeven or switchover cost weight for a given attribute that would cause the ranking of the scenarios (based on estimated equivalent cost) to change. For example, if the equivalent cost for scenario 1 is higher than that of scenario 2 for platform Gilda, the switchover cost weight computed for a given attribute for platform Gilda is the modified cost weight which if used in place of the original cost weight of that attribute will equalize the equivalent costs for scenarios 1 and 2 for Platform Gilda. This PLATFORM feature is a useful tool for identifying and examining switchover or breakeven points that could influence a change in decision. Note that if the breakeven cost weight for a given attribute is INF that only means both scenarios were ranked equally for that attribute and platform. This result provides a useful way to analyze the sensitivities of the cost weights to the overall equivalent cost. Some users may find both of the weighting methods require making judgments they perceive as too difficult or unreliable. Such users can focus on the first method shown, which simply displays attribute scores without attempting to combine them mathematically. On the other hand, arriving at a decision with this method will still require users to find some way to combine all attributes intuitively. We do not make any claims here about which approach is better. PLATFORM provides these options so that users can choose the method they find most useful.
Related Documents