Water Resour Manage (2007) 21:717–728 DOI 10.1007/s11269-006-9060-0 ORIGINAL ARTICLE Multi attribute utility theory for irrigation system evaluation Komaragiri Srinivasa Raju · A. Vasan Received: 16 September 2005 / Accepted: 29 May 2006 C Springer Science + Business Media B.V. 2006 Abstract Multi Attribute Utility Theory (MAUT) is employed to rank the irrigation subsys- tems of Mahi Bajaj Sagar Project, Rajasthan, India. Seven performance evaluation criteria, namely, land development works, timely supply of inputs, conjunctive use of water resources, participation of farmers, economic impact, crop productivity and environmental conserva- tion are employed. Kohonen Artificial Neural Networks (KANN) is employed to classify the irrigation subsystems that can be utilized for further ranking by MAUT. Spearman rank correlation technique is employed to compute correlation coefficient values between the ob- tained ranking pattern. Sensitivity analysis studies are also made to check the robustness in ranking. The proposed methodology can be applied for similar situations. Keywords Kohonen artificial neural networks . Multi attribute utility theory . Multicriterion decision making . Performance evaluation 1. Introduction Agriculture is the back bone of Indian economy. Good irrigation management, efficient operation and maintenance of irrigation systems are essential for the sustainability of irrigated agriculture. This may result in better performance, better crop yields and sustained production. In this regard, performance of irrigation systems can be evaluated to choose the best one for formulating guidelines to improve the performance and efficiency of other existing ones (Raju and Pillai, 1999; Raju and Duckstein, 2002). In the present study, combined application of Kohonen Artificial Neural Networks (KANN) and Multi Attribute Utility Theory (MAUT) methodology is employed to rank the irrigation subsystems of Mahi Bajaj Sagar Project, Rajasthan, India. These are evaluated on performance criteria such as land development works, timely supply of inputs, conjunc- tive use of water resources, participation of farmers, economic impact, crop productivity and K.S. Raju () · A. Vasan Department of Civil Engineering, Birla Institute of Technology and Science, Pilani, Rajasthan, India e-mail: [email protected] Springer

Welcome message from author
This document is posted to help you gain knowledge. Please leave a comment to let me know what you think about it! Share it to your friends and learn new things together.
Transcript
Water Resour Manage (2007) 21:717–728
DOI 10.1007/s11269-006-9060-0
ORIGINAL ART ICLE
Multi attribute utility theory for irrigationsystem evaluation
Komaragiri Srinivasa Raju · A. Vasan
Received: 16 September 2005 / Accepted: 29 May 2006C© Springer Science + Business Media B.V. 2006
Abstract Multi Attribute Utility Theory (MAUT) is employed to rank the irrigation subsys-
tems of Mahi Bajaj Sagar Project, Rajasthan, India. Seven performance evaluation criteria,
namely, land development works, timely supply of inputs, conjunctive use of water resources,
participation of farmers, economic impact, crop productivity and environmental conserva-
tion are employed. Kohonen Artificial Neural Networks (KANN) is employed to classify
the irrigation subsystems that can be utilized for further ranking by MAUT. Spearman rank
correlation technique is employed to compute correlation coefficient values between the ob-
tained ranking pattern. Sensitivity analysis studies are also made to check the robustness in
ranking. The proposed methodology can be applied for similar situations.
Keywords Kohonen artificial neural networks . Multi attribute utility theory .
Multicriterion decision making . Performance evaluation
1. Introduction
Agriculture is the back bone of Indian economy. Good irrigation management, efficient
operation and maintenance of irrigation systems are essential for the sustainability of irrigated
agriculture. This may result in better performance, better crop yields and sustained production.
In this regard, performance of irrigation systems can be evaluated to choose the best one for
formulating guidelines to improve the performance and efficiency of other existing ones
(Raju and Pillai, 1999; Raju and Duckstein, 2002).
In the present study, combined application of Kohonen Artificial Neural Networks
(KANN) and Multi Attribute Utility Theory (MAUT) methodology is employed to rank
the irrigation subsystems of Mahi Bajaj Sagar Project, Rajasthan, India. These are evaluated
on performance criteria such as land development works, timely supply of inputs, conjunc-
tive use of water resources, participation of farmers, economic impact, crop productivity and
K.S. Raju (�) · A. VasanDepartment of Civil Engineering, Birla Institute of Technology and Science, Pilani, Rajasthan, Indiae-mail: [email protected]
Springer

718 Water Resour Manage (2007) 21:717–728
environmental conservation. The study is an extension of the methodology reported by Raju
and Pillai (1999) with application of KANN for classification of the irrigation subsystems.
The present study is divided into description of MAUT, case study, application of KANN
and MAUT and sensitivity analysis. The findings are summarized in the conclusions section
of the paper.
Literature relevant to the present study is discussed here. Burt et al. (1997) discussed the
need to standardize the definitions and approaches to quantify various irrigation performance
measures such as irrigation efficiency and uniformity. They proposed the techniques whereby
the accuracy of numerical values of the performance indicators can be assessed. Brito et al.(2003) analyzed performance assessment of the Paracatu/Entre-Ribeiros irrigation project in
Southeastern Brazil. Seven indicators, namely, delivery performance, overall consumptive
ratio, sustainability of irrigated area, power and energy consumption, operation and mainte-
nance fraction, unit gross economic return, and global revenue/cost ratio were used to assess
the performance of the project from 1997 through 2000. They suggested the need for im-
provement of the current situation of the scheme. Similar studies are reported by Bos (1997)
and Yildirim and Cakmak (2004).
Keeney and Wood (1977) employed MAUT to evaluate overall utility of five alternative
water resources development plans for the Tisza river basin, Hungary. Twelve criteria, con-
sisting seven of qualitative nature and five of quantitative nature, were used to evaluate the
alternative plans. The utility function was of the multiplicative form. Ranking was based
on the overall utility value of each alternative plan. Gershon and Duckstein (1983) used
MAUT in addition to other methods for Santa Cruz river basin planning problem. Hayashi
(1998) presented a methodology for aiding agricultural decisions using multi-attribute value
models with interval numbers for a case study in Japan. He concluded that the proposed
methodology provided a systematic framework for those farmers who are considering the
introduction of new technologies. Raju and Pillai (1999) applied MAUT and stochastic ex-
tension of PROMETHEE to rank irrigation subsystems of Sri Ram Sagar Project, Andhra
Pradesh, India and selected one subsystem as the best. They had considered group decision
making analysis in their study. Limon et al. (2003) presented MAUT methodology for a case
study located in Northern Spain, Los Canales del Bajo Carrion, in the county of Palencia.
They estimated the risk aversion coefficients.
Raju et al. (2006) employed three phase methodology in multiobjective framework involv-
ing formulation of payoff matrix, classification and ranking of irrigation planning strategies
for a case study of Jayakwadi Irrigation Project, Maharashtra, India. Classification of the
strategies is done by Kohonen Artificial Neural Networks whereas ranking is performed by
Compromise Programming. However, no study is reported on classification of irrigation sub-
systems for a real world performance evaluation problem using Kohonen Artificial Neural
Networks with qualitative payoff matrix.
2. Description of multi attribute utility theory (MAUT)
Multi Attribute Utility Theory is a Multicriterion Decision Making (MCDM) technique based
on utility theory (Goicoechea et al., 1982). The following are the steps involved in MAUT
for ranking alternatives.
1. Verification of preferential and utility independence conditions
2. Ranking of scaling constants of the criteria
3. Determination of indifference points
Springer

Water Resour Manage (2007) 21:717–728 719
4. Derivation of single and multi attribute utility functions
5. Determination of values of scaling constants
6. Ascertaining the attitude of the decision maker based on overall scaling constant.
7. Ranking of the alternatives based on the utility values. Highest utility alternative is best.
An interactive computer program is developed in visual basic environment (Perry, 1998) to
determine the ranking of irrigation subsystem based on MAUT methodology. Inputs such as
number of irrigation subsystems and criteria, payoff matrix, subjective ranking of the scaling
constants for criteria, indifference values between the scaling constants and probability value
are to be provided in a sequential manner. Payoff matrix can be either given through an input
file or can be entered directly through keyboard. A provision for changing the input values
is also incorporated in the program. Output includes the utility values for each element in
the payoff matrix, scaling constants, overall scaling constant and final utility values based
on which ranking is made. The program has the capability of displaying the ranking pattern
in the form of a bar chart. More details on MAUT are available in Keeney and Wood (1977)
and Keeney and Nair (1977).
3. Case study
Mahi Bajaj Sagar Project (MBSP) is located in Banswara district in southern part of Rajasthan
state bordering the states of Madhya Pradesh and Gujarat. Gross storage and live storage
capacity of the reservoir is 2180.39 Mm3 and 1829.27 Mm3. Culturable Command Area
(CCA) of the project is 80,000 ha out of which 57,531 ha has been opened for irrigation. The
MBSP has three main canal systems namely, Left Main Canal (LMC), Right Main Canal
(RMC) and Bhungra Canal (BC). The principal crops grown in the command area in Kharif
and Rabi seasons are Paddy, Cotton, Wheat, Gram, Pulses. The area is classified as semi-arid.
There are sixteen irrigation subsystems, namely, Banka (S1, 952 ha), Chhich (S2, 9130 ha),
Gopinath Ka Gara (S3, 3150 ha), Parsoliya (S4, 7855 ha), Arthuna (S5, 5881 ha), Badliya (S6,
1619 ha), Udpura (S7, 2327 ha), Bhawarwad (S8, 2139 ha), Narwali (S9, 10722 ha), Jagpura
(S10, 1312 ha), Karan Pur (S11, 2095 ha), Ganoda (S12, 1977 ha), Loharia (S13, 1562 ha),
Badi Saderi (S14, 2302.31 ha), Asoda (S15, 3328 ha) and Khodan (S16, 3944.41 ha). S1
to S16 represent the irrigation subsystems where as value in braces indicate the CCA under
each irrigation subsystem totaling to 60,295.72 ha. Out of this, 11 are falling into LMC where
as remaining to RMC (MBSP Report on Status June 2002 at a Glance, 2002). Index map
of Mahi Bajaj Sagar Project and 16 irrigation subsystems are presented in Figures 1 and 2
respectively.
3.1. Ranking of irrigation subsystems
This section consists of data analysis, classification of irrigation subsystems using Kohonen
Artificial Neural Networks and application of MAUT with detailed steps.
3.1.1. Data analysis
Sixteen irrigation subsystems of the Mahi Bajaj Sagar Project are evaluated in the present
analysis with reference to seven criteria (Raju and Pillai, 1999; Raju and Duckstein, 2002),
namely, Land Development Works (LDW), Timely Supply of Inputs (TSI), Conjunctive
Use of Water resources (CUW), Participation of Farmers (PF), Economic Impact (EI), Crop
Springer
720 Water Resour Manage (2007) 21:717–728
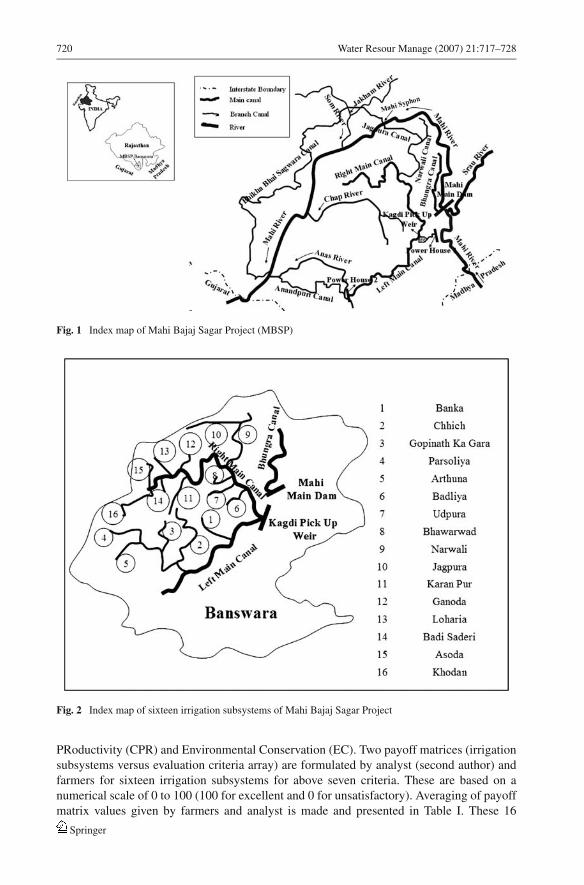
Fig. 1 Index map of Mahi Bajaj Sagar Project (MBSP)
Fig. 2 Index map of sixteen irrigation subsystems of Mahi Bajaj Sagar Project
PRoductivity (CPR) and Environmental Conservation (EC). Two payoff matrices (irrigation
subsystems versus evaluation criteria array) are formulated by analyst (second author) and
farmers for sixteen irrigation subsystems for above seven criteria. These are based on a
numerical scale of 0 to 100 (100 for excellent and 0 for unsatisfactory). Averaging of payoff
matrix values given by farmers and analyst is made and presented in Table I. These 16
Springer
Water Resour Manage (2007) 21:717–728 721
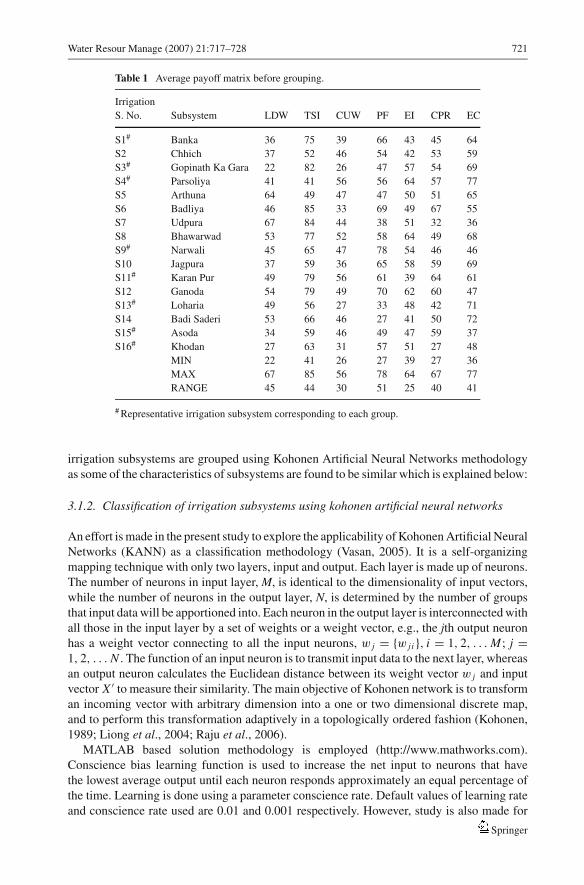
Table 1 Average payoff matrix before grouping.
Irrigation
S. No. Subsystem LDW TSI CUW PF EI CPR EC
S1# Banka 36 75 39 66 43 45 64
S2 Chhich 37 52 46 54 42 53 59
S3# Gopinath Ka Gara 22 82 26 47 57 54 69
S4# Parsoliya 41 41 56 56 64 57 77
S5 Arthuna 64 49 47 47 50 51 65
S6 Badliya 46 85 33 69 49 67 55
S7 Udpura 67 84 44 38 51 32 36
S8 Bhawarwad 53 77 52 58 64 49 68
S9# Narwali 45 65 47 78 54 46 46
S10 Jagpura 37 59 36 65 58 59 69
S11# Karan Pur 49 79 56 61 39 64 61
S12 Ganoda 54 79 49 70 62 60 47
S13# Loharia 49 56 27 33 48 42 71
S14 Badi Saderi 53 66 46 27 41 50 72
S15# Asoda 34 59 46 49 47 59 37
S16# Khodan 27 63 31 57 51 27 48
MIN 22 41 26 27 39 27 36
MAX 67 85 56 78 64 67 77
RANGE 45 44 30 51 25 40 41
# Representative irrigation subsystem corresponding to each group.
irrigation subsystems are grouped using Kohonen Artificial Neural Networks methodology
as some of the characteristics of subsystems are found to be similar which is explained below:
3.1.2. Classification of irrigation subsystems using kohonen artificial neural networks
An effort is made in the present study to explore the applicability of Kohonen Artificial Neural
Networks (KANN) as a classification methodology (Vasan, 2005). It is a self-organizing
mapping technique with only two layers, input and output. Each layer is made up of neurons.
The number of neurons in input layer, M, is identical to the dimensionality of input vectors,
while the number of neurons in the output layer, N, is determined by the number of groups
that input data will be apportioned into. Each neuron in the output layer is interconnected with
all those in the input layer by a set of weights or a weight vector, e.g., the jth output neuron
has a weight vector connecting to all the input neurons, w j = {w j i }, i = 1, 2, . . . M ; j =1, 2, . . . N . The function of an input neuron is to transmit input data to the next layer, whereas
an output neuron calculates the Euclidean distance between its weight vector w j and input
vector X ′ to measure their similarity. The main objective of Kohonen network is to transform
an incoming vector with arbitrary dimension into a one or two dimensional discrete map,
and to perform this transformation adaptively in a topologically ordered fashion (Kohonen,
1989; Liong et al., 2004; Raju et al., 2006).
MATLAB based solution methodology is employed (http://www.mathworks.com).
Conscience bias learning function is used to increase the net input to neurons that have
the lowest average output until each neuron responds approximately an equal percentage of
the time. Learning is done using a parameter conscience rate. Default values of learning rate
and conscience rate used are 0.01 and 0.001 respectively. However, study is also made for
Springer

722 Water Resour Manage (2007) 21:717–728
Fig. 3 Variation of square error value for various groups and epochs. (Learning rate = 0.01 and Consciencerate = 0.001)
various values of learning rates. The parameters used for the study are number of groups
(4, 5, 6, 7, 8), different epochs (5000, 10000, 20000, 30000, 40000, 50000). Here group 4
indicates that the input data are classified into 4 groups. Figure 3 presents the variation of
square error values for various groups and different epochs for a learning rate of 0.01 and
conscience rate of 0.001. It is observed from Figure 3 that square error value is decreasing
from group 4 (123.8332 for 20000 and 50000 epochs, 126.3457 for 30000 epochs) to group
8 (58.1055 for 30000 epochs, 68.2792 for 40000 epochs). It is also observed that maximum
and minimum square error values are reducing simultaneously with the increase in number
of groups from 4 to 8.
It is inferred from the above analysis that groups and epochs are having significant effect on
square error values. Above analysis also enables to determine the appropriate parameters for
the present problem. The maximum number of groups is fixed as 8, as proper classification did
not occur for groups more than 8. Thus, instead of considering sixteen irrigation subsystems,
representative subsystem from each group is used further for effective decision making.
The groups are represented by G1, G2, G3, G4, G5, G6, G7 and G8 for further analysis.
Irrigation subsystem which has the minimum square error value in that group is chosen as
group representative. These groups consist of irrigation subsystems (S7, S16), (S5, S15),
(S3, S10), (S9, S12), (S4, S8), (S13, S14), (S6, S11), (S1, S2) respectively. Representative
irrigation subsystems corresponding to each group are S16, S15, S3, S9, S4, S13, S11, S1
(marked with # in Table I). These representative groups G1 to G8 are further used in MAUT
methodology.
3.1.3. Application of MAUT
It is assumed that the conditions of preferential and utility independence are satisfied
(Duckstein et al., 1994). The seven performance criteria LDW, TSI, CUW, PF, EI, CPR
and EC used in this study are denoted as C1 to C7 for representing in equations.
Springer
Water Resour Manage (2007) 21:717–728 723
3.1.3.1 Ranking of scaling constant (K j ) for the criteria The scaling constants of the criteria
are to be ranked based on their priority. The question is posed as “given that all the seven crite-
ria are at their worst levels, which criterion is preferred to be slightly at a better level, leaving
all the other six at their worst levels?” Suppose the response is “economic impact” then, value
of k5 is greater than k1 to k4 and k6, k7 where k1 to k7 are scaling constants corresponding to
seven criteria C1 to C7. The procedure is repeated to rank the remaining criteria. The rank-
ing of criteria based on the response from decision maker is k5 > k6 > k3 > k4 > k7 > k2
> k1.
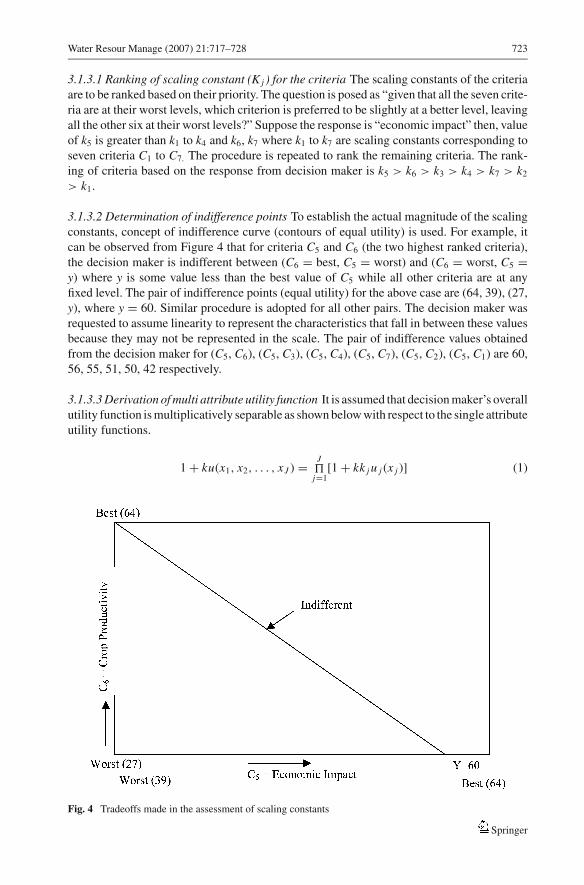
3.1.3.2 Determination of indifference points To establish the actual magnitude of the scaling
constants, concept of indifference curve (contours of equal utility) is used. For example, it
can be observed from Figure 4 that for criteria C5 and C6 (the two highest ranked criteria),
the decision maker is indifferent between (C6 = best, C5 = worst) and (C6 = worst, C5 =y) where y is some value less than the best value of C5 while all other criteria are at any
fixed level. The pair of indifference points (equal utility) for the above case are (64, 39), (27,
y), where y = 60. Similar procedure is adopted for all other pairs. The decision maker was
requested to assume linearity to represent the characteristics that fall in between these values
because they may not be represented in the scale. The pair of indifference values obtained
from the decision maker for (C5, C6), (C5, C3), (C5, C4), (C5, C7), (C5, C2), (C5, C1) are 60,
56, 55, 51, 50, 42 respectively.
3.1.3.3 Derivation of multi attribute utility function It is assumed that decision maker’s overall
utility function is multiplicatively separable as shown below with respect to the single attribute
utility functions.
1 + ku(x1, x2, . . . , xJ ) = J�j=1
[1 + kk j u j (x j )] (1)
Fig. 4 Tradeoffs made in the assessment of scaling constants
Springer
724 Water Resour Manage (2007) 21:717–728
where k, k j , u(.), u j (.) are overall scaling constant, scaling constant for criterion j , over-
all utility function operator, utility function operator for each criterion j. Substituting in
Equation 1, the multiplicative form of equation for the seven criteria case becomes as:
1 + ku(C1, C2, . . . , C7) = 7
�j=1
[1 + kk j u j (C j )] (2)
Equating the utility values of two indifference points (C5, C6), the multiplicative form of
Equation 2 (for pair of highly ranked criteria C5 and C6) transforms into
(worst) (best) (y) (worst)
[1 + kk5.u5(C5)] [1 + kk6.u6(C6)] = [1 + kk5.u5(C ′
5)] [
1 + kk6.u6(C ′6)
] (3)
where C ′5 and C ′
6 are indifference points for criteria C5 and C6 respectively.
(C6 = best, C5 = worst) (C6 = worst, C5 = y)
(64, 39) (27, 60)
u6(best) = 1 u5(worst) = 0 u6(worst) = 0 u5(y) =?
The values of utilities vary between zero and one. In the present study, these are assumed as
linear. By fixing utility of best value (highest values in the payoff matrix for that criterion)
Ubest as 1 and worst value (lowest values in the payoff matrix for that criterion) Uworst as 0, the
utility value varies linearly between 0 to 1 for intermediate values in the payoff matrix. These
intermediate values give points on the utility curve. Assuming linear utility function for inter-
mediate values between best and worst combinations, for criteria C5, u5(best) = u5(64) = 1,
u5(worst) = u5(39) = 0, and for 60 it is linearly interpolated as 0.84 i.e., u5(60) = 0.84. For
pairs C5 and C6 the Equation 3 reduces to
(1 + kk5 × 0)(1 + kk6 × 1) = [1 + kk5 × u5(60)][1 + kk6 × 0] i.e., k6 = 0.84k5 (4)
A similar procedure is adopted for other pairs and the following relationships are obtained.
For pairs C5 and C3, k3 = 0.68k5; for pairs C5 and C4, k4 = 0.64k5; for pairs C5 and C7,
k7 = 0.48k5; for pairs C5 and C2, k2 = 0.44k5 and for pairs C5 and C1, k1 = 0.12k5.
A total of six equations are formulated based on indifference tradeoff relationship between
the two criteria. In the above equations, the total number of unknowns is eight including seven
scaling constants (k1 to k7) and one overall scaling constant k. One more equation is introduced
to assess the overall scaling constant k, by estimating the probability p′ for which the decision
maker is indifferent between lottery A∗ over the best and worst combinations of two highly
ranked criteria i.e., (C5 best, C6 best), (C5 worst, C6 worst) versus lottery B∗, i.e., (C5 best, C6 worst)
for certain (Keeney and Wood, 1977). The multiplicative form of equation for two criteria
case becomes
1 + ku(C5, C6) = (1 + kk5u5(C5))(1 + kk6u6(C6)) (5)
u(C5, C6) =[
(1 + kk5u5(C5))(1 + kk6u6(C6)) − 1
k
](6)
Springer
Water Resour Manage (2007) 21:717–728 725
Equating the utility values of lottery A∗ and B∗ for two highly ranked criterion C5, C6
results in
p′.u(C5 best, C6 best) + (1 − p′).u(C5 worst, C6 worst) = u(C5 best, C6 worst) (7)
where,
u(C5 best, C6 best) =[
(1 + kk5 × 1)(1 + kk6 × 1) − 1
k
]= k5 + k6 + kk5k6 (8)
u(C5 worst, C6 worst) =[
(1 + kk5 × 0)(1 + kk6 × 0) − 1
k
]= 0 (9)
u(C5 best, C6 worst) =[
(1 + kk5 × 1)(1 + kk6 × 0) − 1
k
]= k5 (10)
Substituting the values, Equation 7 results in
k5 = p′(k5 + k6 + kk5k6) (11)
A probability value (p′) of 0.65 is given by the decision maker. Then the above equation
is reduced to
k5 = −0.36
k(12)
If all the criteria are set at their best levels, Equation 2 then becomes
1 + k = (1 + kk1)(1 + kk2)(1 + kk3)(1 + kk4)(1 + kk5)(1 + kk6)(1 + kk7) (13)
substituting the relationships and simplifying yields the value of k as -0.7288 and corre-
sponding scaling constants for the criteria 1 to 7 are 0.0591, 0.2167, 0.3350, 0.3153, 0.4926,
0.4138 and 0.2364 respectively. It is observed that summation of scaling constants for all the
criteria are 2.0689. Since this value is greater than 1, usage of multiplicative form of equation
is taken as valid (Kidd and Prabhu, 1990). Utility values of the groups G1 to G8 are 0.5477,
0.7431, 0.8387, 0.8839, 1.0000, 0.5734, 0.9191, 0.7560 and corresponding ranking pattern
is 8, 6, 4, 3, 1, 7, 2 and 5. The irrigation subsystem which provides the highest degree of
utility with respect to all the criteria is taken as the best irrigation subsystem. It is observed
that group G5 is found to be the best with a utility value of 1 followed by group G7 with a
utility value of 0.9191. It is observed that the negative value of k represents the risk aversive
nature of the decision maker with reference to the present planning problem (Goicoechea
et al., 1982). However, a study is also made to assess the impact of variation of scaling
constants and p′ values on ranking pattern which is presented in the sensitivity analysis
section.
4. Sensitivity analysis
A number of parameters are required in each technique to determine the final ranking. A
careful selection of these parameters is important because the final ranking is based on
Springer

726 Water Resour Manage (2007) 21:717–728
the values of these parameters. Spearman rank correlation technique is employed in the
sensitivity analysis to determine the measure of association between the ranks obtained by
different scenarios (Gibbons, 1971; Vasan, 2005).
4.1. Effect of probability values p′ on ranking pattern
In the sensitivity analysis, the probability value of p′ is varied from 0.5 to 1.0 with an
increment of 0.05 (i.e., 0.50, 0.55, 0.60, 0.65, 0.70, 0.75, 0.80, 0.85, 0.90, 0.95, 1.0). A
total of 11 combinations are evaluated resulting in five groups of ranking. Either group G7
or group G5 remains in the first or the second place. Spearman rank correlation coefficient
values are determined between the ranks obtained due to change in p′ values. It is observed
that the correlation values range from 0.7143 to 0.9762 (excluding the diagonals).
4.2. Effect of scaling constants for varying probability values p′ on ranking pattern
The value of each scaling constant is changed (increased and then decreased) as much
as possible without changing the priority of the criteria. Therefore, two sensitivity runs are
performed for all criterion except highest and worst criterion in which case these are one each
resulting in 12 sensitivity runs for each probability value p′. Priority values of the criteria
for sensitivity analysis are 0.4139, (0.3351, 0.4925), (0.3154, 0.4137), (0.2365, 0.3349),
(0.2168, 0.3152), (0.0592, 0.2363), 0.2166 for C5, C6, C3, C4, C7, C2, C1. Above analysis
is performed for different probability values p′ (varying from 0.5 to 1.0 with an increment
of 0.05) resulting in 132 combinations (11 probability combinations × 12 scaling constant
combinations). Seven groups of ranking are observed and G5 occupies the first position. It is
observed that the correlation coefficient values are high between the combinations ranging
from 0.8333 to 0.9762.
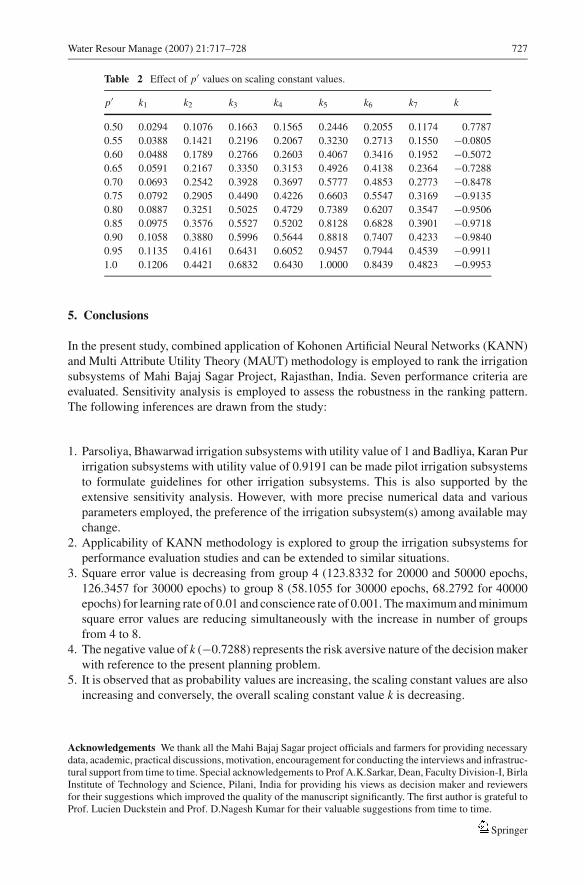
4.3. Effect of probability value p′ on scaling constants and overall scaling constant
values
Effect of probability value p′ on scaling constants and overall scaling constant values are also
studied. It is observed from Table 2 that as probability p′ values are increasing, the scaling
constant values (k1 to k7) are also increasing keeping the order same. Conversely, the overall
scaling constant value k is decreasing. It is also observed that for a probability p′ = 0.5,
it shows the risk seeking nature of the decision maker as k = 0.7787. As probability p′ is
increasing from 0.55 to 1.0, it shows the risk aversive nature of the decision maker with
variation of k values from −0.0805 to −0.9953 (Goicoechea et al., 1982).
It is inferred from extensive sensitive analysis that G5 (representing Parsoliya (S4),
Bhawarwad (S8) irrigation subsystems) and G7 (representing Badliya (S6), Karan Pur (S11)
irrigation subsystems) can be made pilot irrigation subsystems to formulate guidelines for
other irrigation subsystems. The inference is based on the available data, formulated payoff
matrix based on subjective data, views of decision maker. The inferences emanated from the
study can be utilized by the project officials for further in depth investigations. Efforts are
already in progress to collect more precise numerical data which may change the preference
of the irrigation subsystem(s). However, the proposed methodology remains same which is
the main objective of the present study.
Springer
Water Resour Manage (2007) 21:717–728 727
Table 2 Effect of p′ values on scaling constant values.
p′ k1 k2 k3 k4 k5 k6 k7 k
0.50 0.0294 0.1076 0.1663 0.1565 0.2446 0.2055 0.1174 0.7787
0.55 0.0388 0.1421 0.2196 0.2067 0.3230 0.2713 0.1550 −0.0805
0.60 0.0488 0.1789 0.2766 0.2603 0.4067 0.3416 0.1952 −0.5072
0.65 0.0591 0.2167 0.3350 0.3153 0.4926 0.4138 0.2364 −0.7288
0.70 0.0693 0.2542 0.3928 0.3697 0.5777 0.4853 0.2773 −0.8478
0.75 0.0792 0.2905 0.4490 0.4226 0.6603 0.5547 0.3169 −0.9135
0.80 0.0887 0.3251 0.5025 0.4729 0.7389 0.6207 0.3547 −0.9506
0.85 0.0975 0.3576 0.5527 0.5202 0.8128 0.6828 0.3901 −0.9718
0.90 0.1058 0.3880 0.5996 0.5644 0.8818 0.7407 0.4233 −0.9840
0.95 0.1135 0.4161 0.6431 0.6052 0.9457 0.7944 0.4539 −0.9911
1.0 0.1206 0.4421 0.6832 0.6430 1.0000 0.8439 0.4823 −0.9953
5. Conclusions
In the present study, combined application of Kohonen Artificial Neural Networks (KANN)
and Multi Attribute Utility Theory (MAUT) methodology is employed to rank the irrigation
subsystems of Mahi Bajaj Sagar Project, Rajasthan, India. Seven performance criteria are
evaluated. Sensitivity analysis is employed to assess the robustness in the ranking pattern.
The following inferences are drawn from the study:
1. Parsoliya, Bhawarwad irrigation subsystems with utility value of 1 and Badliya, Karan Pur
irrigation subsystems with utility value of 0.9191 can be made pilot irrigation subsystems
to formulate guidelines for other irrigation subsystems. This is also supported by the
extensive sensitivity analysis. However, with more precise numerical data and various
parameters employed, the preference of the irrigation subsystem(s) among available may
change.
2. Applicability of KANN methodology is explored to group the irrigation subsystems for
performance evaluation studies and can be extended to similar situations.
3. Square error value is decreasing from group 4 (123.8332 for 20000 and 50000 epochs,
126.3457 for 30000 epochs) to group 8 (58.1055 for 30000 epochs, 68.2792 for 40000
epochs) for learning rate of 0.01 and conscience rate of 0.001. The maximum and minimum
square error values are reducing simultaneously with the increase in number of groups
from 4 to 8.
4. The negative value of k (−0.7288) represents the risk aversive nature of the decision maker
with reference to the present planning problem.
5. It is observed that as probability values are increasing, the scaling constant values are also
increasing and conversely, the overall scaling constant value k is decreasing.
Acknowledgements We thank all the Mahi Bajaj Sagar project officials and farmers for providing necessarydata, academic, practical discussions, motivation, encouragement for conducting the interviews and infrastruc-tural support from time to time. Special acknowledgements to Prof A.K.Sarkar, Dean, Faculty Division-I, BirlaInstitute of Technology and Science, Pilani, India for providing his views as decision maker and reviewersfor their suggestions which improved the quality of the manuscript significantly. The first author is grateful toProf. Lucien Duckstein and Prof. D.Nagesh Kumar for their valuable suggestions from time to time.
Springer
728 Water Resour Manage (2007) 21:717–728
References
Bos MG (1997) Performance indicators for irrigation and drainage. Irrigat Drainage Syst 11(2):119–137Brito RAL, Bastings IWA, Bortolozzo AR (2003) The Paracatu/Entre-Ribeiros irrigation scheme in south-
eastern Brazil - Features and challenges in performance assessment. Irrigat Drainage Syst 17(4):285–303Burt CM, Clemmens AJ, Strelkoff TS, Solomon KH, Bliesner RD, Hardy LA, Howell TA, Eisenhauer
DE (1997) Irrigation performance measures: Efficiency and uniformity. J Irrigat Drainage Eng ASCE123(6):423–442
Duckstein L, Treichel, W, Magnouni SE (1994) Ranking ground water management alternatives by multicri-terion analysis. J Water Resour Plann Manag ASCE 120(4):546–565
Gershon M, Duckstein L (1983) Multiobjective approaches to river basin planning. J Water Resour PlannManag ASCE 109(1):13–28
Gibbons JD (1971) Nonparametric statistical inference. McGraw-Hill, New YorkGoicoechea A, Hansen D, Duckstein L (1982) Introduction to multiobjective analysis with engineering and
business applications. John Wiley, New YorkHayashi K (1998) Multicriteria aid for agricultural decisions using preference relations: methodology and
application. Agric Syst 58(4):483–503Keeney RL, Wood EF (1977) An illustrative example of the use of multi attribute utility theory for water
resource planning. Water Resour Res 13(4):705–712Keeney RL, Nair K (1977) Selecting nuclear power plant sites in the pacific north west using decision analysis.
In: Bell et al. (eds) Conflicting objectives in decisions. John Wiley, New York, pp 298–322Kidd JB, Prabhu SP (1990) A practical example of multi attribute decision aiding technique. Omega 18(2):139–
149Kohonen T (1989) Self organization and associative memory. Springer- Verlag, BerlinLiong SY, Tariq AAF, Lee KS (2004) Application of evolutionary algorithm in reservoir operations. J Inst Eng
Singapore 44:39–54Limon JAG, Arriaza M, Riesgo L (2003) An MCDM analysis of agricultural risk aversion. Eur J Oper Res
151:569–585MBSP Report on Status June 2002 at a Glance, 2002, Government of Rajasthan, Banswara, Rajasthan, IndiaPerry G (1998) SAMS Teach Yourself Visual Basic 6 in 21 Days, Techmedia, New DelhiRaju KS, Pillai CRS (1999) Multicriterion decision making in performance evaluation of an irrigation system.
Eur J Oper Res 112(3):479–488Raju KS, Duckstein L (2002) Multicriterion analysis for ranking an irrigation system: An Indian case study.
J Decis Syst 11(3–4):499–511Raju KS, Nagesh Kumar D, Duckstein L (2006) Artificial neural networks and multicriterion analysis for
sustainable irrigation planning, Computers and Operations Research, Special issue: Part Special issue:Optimization Days 2003 - Edited by A Hertz and O. Marcotte, 33(4):1138–1153
Vasan A (2005) Studies on Advanced Modeling Techniques for Optimal Reservoir Operation and PerformanceEvaluation of an Irrigation System, PhD thesis, Birla Institute of Technology and Science, Pilani, India
Yildirim EY, Cakmak B (2004) Participatory irrigation management in Turkey. Int J Water Resour Dev20(2):219–228
http://www.mathworks.com(March 30, 2006)
Springer
Related Documents